Assessment of the Level of Compliance of Petroleum Filling ...
11
Civil and Environmental Research www.iiste.org ISSN 2224-5790 (Paper) ISSN 2225-0514 (Online) Vol.12, No.2, 2020 77 Assessment of the Level of Compliance of Petroleum Filling Stations to Development Control Standards on Land Space/Size and Setbacks in Anambra State. Ulasi, J. O. 1 Uwadiegwu, B. O 2 .and C.O.Okoye 2 1 National Population Commission, Anambra State. 2 Department of Environmental Management, Nnamdi AzikiweUniversity, Awka Corresponding Authors’s Email: [email protected]. Phone:+2348033331992 ABSTRACT Sequel to the loss of lives and properties with other attendant negative socio-economic effects of non-compliance to development control standards, this study was conceived with the aim of assessing the level of compliance of petroleum filling stations to development control standards on land space/size and setbacks in Anambra State. The study adopted the survey research design and field measurement. There were actual field measurements of the filling stations under study as well as the use of imageries of the study areas to identify these filling stations and measure their level of compliance to set standards for distances and location. 270 filling stations which is about 31% of the total number of filling stations were sampled. Arc GIS 10.1 software was utilized to measure the distances between the sited Petroleum Filling Stations and the roads with the help of a computer system. The imagery used was Quickbird (0.5m resolution) and Ikonos (1m resolution). The age ranges between 2015 and 2018. The Software used was ESRI ArcGIS 10.3, GIS Software. It has a measuring tool which was used to measure the distance. The Imagery were added using the ‘Add’ tool. It was then displayed (re-projected) on Projected Coordinate System (UTM, WGS 1984, Zone 32) for accuracy. It was found that the overall level of compliance to land space/size and setback standards is 44.1 percent across the filling stations in Anambra State. That is to say that only 44.1 percent of the PFSs in Anambra State complied with the land space/size and setback standards of building filling stations. Also that there is significant difference between the distances of the filling stations sampled from the road and the set standards for setback. The study thus recommends that: the law should empower the planning officer(s) to prosecute all cases of illegal developments and plans by non-planners without the planners approval should be subjected to prosecution as well. There is great need for public participation as the owners of these lands can join hands to say that a wrongly sited structure cannot be. Campaign should be mounted to conscientize the filling station owners and other developers of the dangers of non-compliance to set standards. Open punishment should be given to all defaulters to the set standards and corrupt officials of the enforcement agencies/bodies for others to learn their lessons. Finally, there should be proper planning to accommodate future expansion of roads. KEYWORDS: Development Control Standards, Compliance, Land Space/Size, Setbacks, Petroleum Filling Stations. DOI: 10.7176/CER/12-2-10 Publication date: February 29 th 2020 1.0 INTRODUCTION 1.1 BACKGROUND TO THE STUDY The deplorable state of the physical environment particularly in the urban centers, today is a major global issue, with greater concern in the developing countries like Nigeria (Ogundele, Ayo, Odewumi, and Aigbe, 2011), making development control a necessity. The regulatory authorities have turned a blind eye to the numerous contraventions of town planning laws or development control standards being committed by some developers in their precinct. In major cities within the country, state capitals and business centres, similar abuses are common (Oduwaye, 2009).The entire land-use is fast changing in character and landscape precipitated by incompatible development (Aluko, 2000; 2011).
-
Upload
khangminh22 -
Category
Documents
-
view
5 -
download
0
Transcript of Assessment of the Level of Compliance of Petroleum Filling ...
Civil and Environmental Research www.iiste.org
ISSN 2224-5790 (Paper) ISSN 2225-0514 (Online)
Vol.12, No.2, 2020
77
Assessment of the Level of Compliance of Petroleum Filling
Stations to Development Control Standards on Land Space/Size
and Setbacks in Anambra State.
Ulasi, J. O.1 Uwadiegwu, B. O 2.and C.O.Okoye 2
1 National Population Commission, Anambra State.
2 Department of Environmental Management, Nnamdi AzikiweUniversity, Awka
Corresponding Authors’s Email: [email protected]. Phone:+2348033331992
ABSTRACT
Sequel to the loss of lives and properties with other attendant negative socio-economic effects of non-compliance
to development control standards, this study was conceived with the aim of assessing the level of compliance of
petroleum filling stations to development control standards on land space/size and setbacks in Anambra State. The
study adopted the survey research design and field measurement. There were actual field measurements of the
filling stations under study as well as the use of imageries of the study areas to identify these filling stations and
measure their level of compliance to set standards for distances and location. 270 filling stations which is about
31% of the total number of filling stations were sampled. Arc GIS 10.1 software was utilized to measure the
distances between the sited Petroleum Filling Stations and the roads with the help of a computer system. The
imagery used was Quickbird (0.5m resolution) and Ikonos (1m resolution). The age ranges between 2015 and
2018. The Software used was ESRI ArcGIS 10.3, GIS Software. It has a measuring tool which was used to measure
the distance. The Imagery were added using the ‘Add’ tool. It was then displayed (re-projected) on Projected
Coordinate System (UTM, WGS 1984, Zone 32) for accuracy. It was found that the overall level of compliance to
land space/size and setback standards is 44.1 percent across the filling stations in Anambra State. That is to say
that only 44.1 percent of the PFSs in Anambra State complied with the land space/size and setback standards of
building filling stations. Also that there is significant difference between the distances of the filling stations
sampled from the road and the set standards for setback. The study thus recommends that: the law should empower
the planning officer(s) to prosecute all cases of illegal developments and plans by non-planners without the
planners approval should be subjected to prosecution as well. There is great need for public participation as the
owners of these lands can join hands to say that a wrongly sited structure cannot be. Campaign should be mounted
to conscientize the filling station owners and other developers of the dangers of non-compliance to set standards.
Open punishment should be given to all defaulters to the set standards and corrupt officials of the enforcement
agencies/bodies for others to learn their lessons. Finally, there should be proper planning to accommodate future
expansion of roads.
KEYWORDS: Development Control Standards, Compliance, Land Space/Size, Setbacks, Petroleum Filling
Stations.
DOI: 10.7176/CER/12-2-10
Publication date: February 29th 2020
1.0 INTRODUCTION
1.1 BACKGROUND TO THE STUDY
The deplorable state of the physical environment particularly in the urban centers, today is a major global issue,
with greater concern in the developing countries like Nigeria (Ogundele, Ayo, Odewumi, and Aigbe, 2011),
making development control a necessity. The regulatory authorities have turned a blind eye to the numerous
contraventions of town planning laws or development control standards being committed by some developers in
their precinct. In major cities within the country, state capitals and business centres, similar abuses are common
(Oduwaye, 2009).The entire land-use is fast changing in character and landscape precipitated by incompatible
development (Aluko, 2000; 2011).

Civil and Environmental Research www.iiste.org
ISSN 2224-5790 (Paper) ISSN 2225-0514 (Online)
Vol.12, No.2, 2020
78
The challenges of non-compliance is staring in the face.Lekwotet al (2013) revealed the lawlessness unplanned
physical development and haphazard implementation of developmental projects in many places like in Port
Harcourt as reported by Kio-Lawson, Duru, John and Eebee (2016); Zaria as highlighted by Kawu, Ahmed, and
Usman (2012); Lagos as stated by Oduwaye (2009); the case of Anambra State is glaring with a lot of structures
like Petroleum Filling Stations being sited where they cause obstructions to traffic and endanger peoples life. The
case of indiscriminate siting of filing stations without complying to standards set by the regulatory agencies
mentioned earlier is pronounced and increasing by the day. The environmental implications and dangers posed to
man by these actions are imminent. The solution to this problem becomes expedient to be sought by research in
order to actualize positive results in the course of enforcement and to ensure that laws satisfying both private and
public needs are harmonized into the present conditions in development control. To achieve a formidable solution
one needs to establish level non-compliance, hence this study.
1.2 STATEMENT OF THE PROBLEM
It has been the practice for the Government(s) to wake up one day and start demolishing houses/structures as a
solution to a problem they created (we created ourselves) and or a problem which could have been avoided by
heeding to development control standards. For instance, Kio-Lawson et al (2016) reported that in the city of Port
Harcourt while the Ministry of Urban Development had succeeded in demolishing over 4,000 make shift shops
that had defaced the city between 2011 and 2013, more than 1,000 new ones had sprang up in the last twelve
months having the approval of the local government councils. For the local government councils, it was another
source of revenue generation. The local government councils believed that it is within their statutory power to
manage the cities; therefore they have the power to approve the erection of make-shift shops for residents. Some
members of the public interviewed in the four sample cities by Kio-Lawson et al (2016), claimed that “the location
of fuel stations indiscriminately in the heart of residential areas, the sitting of electricity transformers and refuse
dumps in our cities without any regard for the safety of residence, goes a long way to question the existence and
effectiveness of the town planning laws or agencies.
The loss of lives and properties with their attendant negative socio-economic effects of non-compliance to
development control standards cannot be over emphasized. The recent fire incident on Wednesday 15th of
February 2017 at DMGS junction Onitsha with great cost being a clear example as the fire outbreak ravaged more
than would have been if development control standards had been observed in such area. The situation in Onitsha
is also evident in other major cities of Anambra State like Awka and Nnewi with constant population increase. On
Friday the 24th of February 2017, a filling station sited adjacent to the tipper park in Eke Nibo Market in Awka
South Local Government Area of Anambra State, due to lack of space had an offloading tanker filled with petrol
got inflamed while trying to turn and enter the filling station. Thanks to God Almighty for the emergency
intervention of the State Fire service, otherwise the entire village and houses around would have been consumed
in the flame. It only resulted in the burnt tanker blocking the road for about two days before its removal. The
attendant externality was delay in travel time by the road users due to the absence of a major alternative route.
This issue of delay in travel time is now normal in our cities within and outside Anambra State as some of these
filling stations are sited at locations with limited space such that for them to offload their products the traffic has
to be delayed sometimes for hours. The indiscriminate sitting of filling stations and other commercial structures
without considering the set standards is the order of the day as some of the enforcement agencies now take bribe
for approvals and allow the filling stations to do whatever they wish leaving defaulters to carry on with their
activities without any punishment. The implementation of development control standards is thus haphazardly done
and only in some cases within the state. Although there has not been concrete empirical work to prove this, but
reconnaissance survey of some of the filling stations supports this speculation.
Upon all the dangers of indiscriminate citing of petroleum filling stations without compliance to set standards and
the loss of lives and properties evident in Anambra State, some of which were highlighted above, the earlier
researchers were unable to tackle this issue within the state. Earlier researchers did a lot of work on the issue of
compliance to set standards by petroleum filling stations, like the works of Olusegun et al (2011); Mohammed et
al (2014); Njoku&Alagbe (2015); Murtala (2015); Thomas et al (2016); Odipeet al (2018); Lekwortet al (2013);
Bogoro and Nghalmi (2014); Philip (2007); and Kio-Lawson et al, (2016) among others,but they were unable to
evaluate the level of compliance of these petroleum filling stations to the set standards by ANSPPB, NESREA and
DPR being the main regulatory bodies for Petroleum Filling Station establishment within the state. This tried to
handle this from the side of land space size and setbacks.

Civil and Environmental Research www.iiste.org
ISSN 2224-5790 (Paper) ISSN 2225-0514 (Online)
Vol.12, No.2, 2020
79
1.3 AIM AND OBJECTIVES
The aim of this study is to assess the level of compliance of petroleum filling stations to development control
standards on land space/size and setbacks in Anambra State.
To achieve this aim the following objectives were pursued:
1. to ascertain the set standards on land space/size and setbacks in Anambra State.
2. to ascertain the level of compliance of petroleum filling stations with land space/size and setback
standards,
3. to make recommendations on what needs to be done to improve compliance to these set standards.
Hypothesis
Ho: There is no significant difference between the distances of the filling stations sampled from the road and the
set standards for setback.
2.0 LITERATURE REVIEW
In line with the aim of this study, the following literature were reviewed:
Ujjwal and Sokhi (2006) applied GIS for petrol station vulnerability assessment in New Delhi, India. In their study
land uses within the 200m radius from each filling station were identified using high resolution Ikonos image and
coordinate of the station were obtained using GPS. Stations were categorized into vulnerability classes on the bases
of the use, density and population with 200 meter buffers. Nwanjo and Ojiako (2007) investigate the potential
health hazards of petrol stations on attendants in Owerri, Nigeria. Attendants from twenty filling stations were
assessed in the area and another twenty that were not exposed to its vapour were used as control. The result show
a significant increase in the activities of alkaline phosphatase, analine and aspartate amino transfer asses for those
exposed to petrol vapour from 6-10 years. Also the concentrations of serum urea, creatinine and urinary protein
for those exposed to petrol vapour were significant based on the study. The study concluded that these effects are
directly related to the duration of the exposure. However the study did not look at the role of distance in
determining the concentration those chemical which may give another interesting picture, since not only attendants
are exposed to petrol vapour, but also the stations‟ neighbor.
Ioj and Tudor (2011) examined the temporal changes in proximity of residential land use to filling stations in
Bucharest suburban, Romania. Coordinates of the stations were obtained using GPS, aerial photographs and google
earth imageries were used to digitize the residential areas. Buffer zones were created in map to see the
encroachments of the residential areas. The results of the study revealed that 21 gas stations are located in
residential areas and 39 gas stations are located in non-residential area. There are 10 gas stations (half of the total
of 21) located in residential areas. The study thus concluded that there is high congestion of the gas stations in the
residential area, although distance of filling stations to other conflicting land-use like public buildings, hospitals
and the likes were not analyze by the study.
Olusegun, Folakemi, Omotayo&Afolabi (2011), conducted an assessment of Safety Practices in Filling Stations
in Ile-Ife, South Western Nigeria. In order to determine the level of awareness of hazards and safety measures
among filling station attendants and assess the prevailing safety practices in filling stations in Ile-Ife, they adopted
a descriptive cross-sectional study in which data was collected using an interviewer-administered questionnaire
and an observational checklist. The collated data was analyzed using the SPSS version 16 software and discrete
variables presented using tables and charts. Fisher's exact test was used to test association with level of significance
set at 5%. It was found that 94% of the respondents were aware of safety measures with fire extinguisher being
the most common safety measure known (54%). Fire hazard was the most common hazard known (94%). Setbacks
from the road and residential areas were less than 30 metres in 90% of the filling stations and stations owned by
conglomerates had better safety measures compared to those owned by independent private marketers. They
therefore called for the governmental and non-governmental agencies in-charge of regulations to ensure that proper
measures are taken to enforce better compliance.
Khahro,Abd Nassir Matorib, Imtiaz&Talpurb (2013), conducted a study in Ipoh, Perak, Malaysia with attention
focused on analyzing the viable land parcels for installing new Petroleum Filling Stations. The geospatial data was
collected from Mapping and Surveying Department of Ipoh. The standards used in practice for the site selection
for Petroleum Filling Station were collected from City Planning Department, Ipoh. A set of questionnaire was also
designed to get the stakeholders opinion regarding the site selection of the Petroleum Filling Stations. Analytic

Civil and Environmental Research www.iiste.org
ISSN 2224-5790 (Paper) ISSN 2225-0514 (Online)
Vol.12, No.2, 2020
80
Hierarchy Process (AHP) was used as a Multi-Criteria Decision Making (MCDM) technique. Expert Choice (EC)
was used to analyze the qualitative results. At the end, to achieve the main objective of the research, the spatial
data was used to identify the suitable land parcels for installing new Petroleum Filling Stations using GIS. The
responses from the public were analyzed to generate the land suitability map for Petroleum Filling Stations location
and to validate the final land suitability map for Petroleum Filling Station, the overlay technique was adopted. The
data layer of existing Petroleum Filling Stations was generated by using the coordinates. The coordinates were
collected from the online available source provided by the Malaysian Geospatial Data Infrastructure. The
coordinates were validated by using the hand Global Positioning System (GPS). It was found that majority of the
Petroleum Filling Stations did not comply with the set standards on location and distances from residential houses
which were the criteria for establishing new Petroleum Filling Stations.
A similar GIS based Analysis of the location of Petroleum Filling Stations in Kano Metropolitan Area in northern
Nigeria was conducted by Mohammed, Musa & Jeb (2014), to establish the compliance of Petroleum Filling
Station entrepreneurs to the Physical Planning Standards set by the Department of Petroleum Resources (DPR)
(2007). The results produced some unique and significant revelation on the non-compliance of some of the
Petroleum Filling Stations to the standards. For instance, it was revealed that, only eight (8) stations (4%) out of
192 stations did not meet the criteria of 15 meters minimum distance from road. Njoku and Alagbe (2015) also
highlighted on some of the illegal location of Petroleum Filling Stations in Oyo State using GIS to assess suitability
of Petroleum Filling Stations.
Njoku&Alagbe (2015) Site Suitability Assessment of Petroleum Filling Stations (PFSs) in Oyo Town, Oyo State,
Nigeria: a Geographic Information Systems (GIS) Approach. In this study, a GIS was developed for PFS site
suitability assessment. The standard criteria set for PFS siting by Oyo State Urban and Regional Planning Board
(OSURPB) and the Nigerian Department of Petroleum Resources (DPR) were considered. The DPR criteria were
incorporated to assess possible lapses in the local standards. The study is multi-dimensional, incorporating
suitability, proximity and spatial statistical techniques. The results showed that, out of the 113 PFSs in the area,
only 3, representing just 2.654 percent are in high suitability zone, 6 PFSs (5.309 percent) in in medium as well
low and 98 stations (86.725 percent) in very low suitability zone. Considering the OSURPB criterion, 76 PFSs are
at unacceptable distances to residential land use and as much as 102 PFSs considering the DPR criterion. Also,
assessing the size of PFSs, 41 stations (39 percent) have the standard land area while 69 PFSs (61 percent) were
deficient. Furthermore, only 6 stations, representing 5 percent of PFSs in the area have their dispensing pumps at
least 15m off the road. More so, the assessment of the spatial pattern of PFSs in the area showed that the distribution
of petrol stations are very clustered with less than 1 percent likelihood that the clustered pattern could be a result
of random chance. It was concluded that most PFSs in Oyo town, considering both local and national siting
standards were not suitably sited and also contravene planning standards. Also, the substandard requirements
proliferated by the local planning authorities, who are defiant of the national standards undoubtedly increases the
threats on the health and safety of users and residents in the vicinity of these PFSs.
Arokoyu, Ogoro, and Jochebed (2015) did an investigation on the location of Petroleum Filling Stations and
compliance to minimum environmental standard requirements in Obio-Akpor Local Government, Rivers State of
Nigeria. The study examined the proliferation of Petroleum Filling Stations in relation to the minimum
environmental safety requirements by the Department of Petroleum Resources (DPR) that distance from the edge
of the road to the nearest pump and from the next Petroleum Filling Station should not be less than 15 and 400
meters respectively. The Global Positioning System (GPS) was used to acquire the coordinates of each filling
station in the study area and then imported to the Arc-GIS 9.3 software environment. Distances between filling
stations from the road and from each other were determined using the Arc-GIS 9.3 measurement tool alongside
buffering analysis in respect to their coordinates. The Z ratio analytical technique was used to examine the
conformity of Petroleum Filling Stations to the required distance of 400m and 15m from each other and from the
road respectively as stipulated by DPR amendment decree 37 of 1997. Findings from the Z ratio analysis at 152
degree of freedom and 95% confidence level reveals that the Petroleum Filling Stations in the study area neither
complied with the required distance of 400m apart nor complied with the required distance of 15m from the road.
Thus, the study recommends, among others, the need for the regulatory agencies like DPR, to improve their
capacity in enforcing the compliance of Petroleum Filling Stations with laid down regulations.
Murtala (2015) analysed the location of filling stations in Kano Metropolis and their compliance to the physical
planning standards set by Department of Petroleum Resource (DPR) and Kano Urban Planning and Development
Agency (KNUPDA) using GIS. Names and street addresses of the filling stations were obtained from the
Department Petroleum Resource (DPR) Kano. Global positioning System Garmin 76X GPS was used to capture
the locations of the filling stations. The Quickbird imagery, street map, and boundary map were obtained from the

Civil and Environmental Research www.iiste.org
ISSN 2224-5790 (Paper) ISSN 2225-0514 (Online)
Vol.12, No.2, 2020
81
Kano State Ministry of Land and Physical planning and then imported to Arc-map environment of Arc-GIS 10,
integrated and geo-referenced to the same coordinate system. The findings revealed that there are 214 filling
stations located along the 43 roads in the study area, of which 69% are owned by independent marketers, 26%
owned by Major Marketers and 5% owned by the NNPC. There is significant correlation between the number of
filling stations and the road hierarchy. While Zaria, Maiduguri and Katsina roads (all major roads) have the highest
number of filling stations, the access roads like Sabo BakinZuwo and Zungeru roads have highest density of filling
station per km. The overall pattern of the location of the filling stations in the area is clustered, and there is
significant difference between the pattern and random pattern at both 95 and 99% level of significance. The major
factors governing the location of filling stations are the traffic flow, exit site from the city and closeness to motor-
park. Most of the filling stations satisfied the minimum requirement of 15 metres distance from the road (96%).
Equally 98% of the filling stations met the minimum distance of 100 meter from the health care facilities. However
many stations had not meet the criteria of 400 meter minimum distance to other stations where located on same
road side and when not separated by any road or street. The research recommends that the regulatory agencies
should take appropriate which ensure that filling stations operators comply with the standards.
A study carried out in Maiduguri and Jere, Borno State, Nigeria, on the dangers facing the workers in the petrol
stations and the residents living nearby the petrol stations as they have in one time or the other suffered various
health effects as a result of working in petrol stations or being close to them by Mshelia, Abdullahi&Dawha (2015)
showed that, respiratory problems (diseases) had the highest percent of 38.05%. This by implication means, it was
the most prevalent health problems affecting both the workers and some of the residents as a result of the inhalation
of fuel contaminated air. However, skin and sight problems alongside other health complications were also issues
of concern. If the situations continue thereafter, such could lead to narcotics effects with symptoms including
headache, nausea, dizziness and mental confusion (Mshelia, et al, 2015). From the result obtained, only 26% were
located in conformity with the standards and guidelines. The study also revealed that some of the petrol stations
were separated by a wall or narrow path. One significant revelation from the study was that, some of the petrol
stations were located much earlier before environmental guidelines and regulations were formulated. Similarly,
some of the residential houses were later developed close to Petroleum Filling Stations. In other words, urban
planners also fail to implement physical development control measures to restrain potential landlords from building
living houses close to Petroleum Filling Stations. This was in accordance to the position of Afolabi,
Olajide&Omotayo (2011).
Another study by Hamid, Iman, Suriatini& Martin (2009) studied site potentiality for petrol station business based
on traffic volume counts using a regression and Geographic Information System (GIS) based spatial system. The
authors stressed that, site potentiality is an important factor that influences business success of a petrol station
which relies on customer visits. A very important note on this issue by Kearny (1998) cited in Thomas et al (2016)
disclosed that, it was empirically found in the United States of America that, site location was the primary factor
for drivers to choose a petrol station but this is not the case here in Nigeria being capitalist to an extreme.
Motivated by the sporadic emergence of Petroleum Filling Stations within the City of Kitwe in Zambia which
raised a lot of questions like: “What are the locational determinants for filling stations in urban areas in Zambia?”
What is the public’s perception on location of filling stations in the City of Kitwe? What are the possible factors
that influence filling stations’ locations in Kitwe? Are filling stations located according to established planning
standards, guidelines and regulations in the City of Kitwe? These are questions that require empirical investigations
in view of the possible inflammatory consequences of the service. Thomas, Chanda& Blessings (2016) conducted
an investigation on the Perceptions of the Public on Location of Filling Stations in the City of Kitwe in Zambia.
This exploratory study applied a cross-sectional descriptive research design to find answers to the research
questions and to validate the following hypotheses: Environmental Impact Assessment (EIA) Criteria is positively
related to the location of filling stations in Kitwe; Entrepreneurs preferential location choices is positively related
to location of filling stations; and Planning principles, standards and regulations positively influence locations of
filling stations in the City of Kitwe. The t-test statistics was used to validate the hypotheses. The main finding was
that, many of the Petroleum Filling Stations were wrongly located and their location are influenced by choices
made by service station entrepreneurs who are more interested in areas of market flow not considering the
environmental implications.
Odipe, Lawal, Adio, Karani, &Sawyerr (2018), conducted a GIS-based location analyses of Retail Petrol Stations
in Ilorin, Kwara State, Nigeria. The data for this study were obtained through field surveys; with the coordinates
of the stations acquired using handheld Global Positioning System (GPS) device, and other information gotten
through administration of questionnaire to owners and workers in each petrol station. Spatial analysis was done
using the Arc-GIS 10.4 by ESRI on an Open Street Map database, while simple descriptive analysis used Excel

Civil and Environmental Research www.iiste.org
ISSN 2224-5790 (Paper) ISSN 2225-0514 (Online)
Vol.12, No.2, 2020
82
2016 package. It was found that 297 retail petrol stations were in Ilorin, of which 112 (38%) of these stations were
above 15 years of age, 224 (75%) of the stations were functioning as at the time of this study while 73 (25%) were
either abandoned or under construction. The number of dispensing pumps per station varies but 215 (72%) stations
has 4-6 operating pumps. Most of the stations were found at close proximities to public premises such that 10 (3%)
were in close proximities to school, 226 (76%) to shops, 192 (65 %) to residential houses and 11 (4%) were close
to hospitals. The research concludes that retail petrol stations are highly congested within the metropolis forming
cluster pattern which poses a great threat to the densely populated region of the town and is not in conformity with
the set standards for establishing these Petroleum Filling Stations.
3.0 STUDY AREA
Anambra State is one of the states in Nigeria within latitudes 50 40 N and 60 48 N and longitudes 60 35 E and 70
30 E. it is bounded by seven states in Nigeria which includes: Enugu, Kogi, Edo, Delta, Rivers, Imo and Abia
States. Figure 1 is the map of Nigeria showing Anambra State.
Fig 1.1: Nigeria Showing Anambra State (Source: Excel Research Centre, Awka)
Anambra is the eight most populated state in the Federal Republic of Nigeria and the second most densely
populated state in Nigeria after Lagos state (N.P.C, 2006). The stretch of more than 45km between Oba and
Amorka contains a cluster of numerous thickly populated villages and small towns giving the area an estimated
average density of 1,500 – 2,000 persons per square kilometer (UN- Habitat.2009).
4.0 METHODOLOGY
This study adopted the survey research design and field measurement. There were actual field measurements of
the filling stations under study as well as the use of imageries of the study areas to identify these filling stations
and measure their level of compliance to set standards for distances and location of PFSs.

Civil and Environmental Research www.iiste.org
ISSN 2224-5790 (Paper) ISSN 2225-0514 (Online)
Vol.12, No.2, 2020
83
The population of the filling stations in Anambra State as obtained from ANSPPB is 855, but the number of filling
stations per local government area; vary widely. Here, purposive and stratified random sampling techniques were
adopted. Purposively Petroleum Filling Stations were selected for sampling from each of the local government
areas for the reason of ensuring wide coverage across the Study Area. The stratified random sampling technique
is applied in separating the filling stations in each LGA into those on the local roads, state roads and federal roads
and ensuring that a percentage of the sample size for each LGA is taken from each stratum.
Applying the Taro Yamaine’s formula, the number of filling station selected across the Study Area was 269.3 that
is approximately 270 filling stations which is about 31% of the total number of filling stations. For the purpose of
proper representation, 31% of the number of filling stations in each LGA were sampled.
The instruments of data collection for this study includes: field observation-measurements and Arc-GIS
measurements. Arc GIS 10.1 software was utilized to measure the distances between the sited Petroleum Filling
Stations and the roads with the help of a computer system. Also after the digital measurement which utilizes
imageries from remote sensing, there was proper field measurements with meter tapes and GPS (ground-truthing)
and this was juxtaposed with what was gotten from the Arc GIS measurement and finally compared with the set
standards established for the establishment of PFSs.
The imagery used was Quickbird (0.5m resolution) and Ikonos (1m resolution). The age ranges between 2015 and
2018. The Software used was ESRI ArcGIS 10.3, GIS Software. It has a measuring tool which was used to measure
the distance. The Imagery were added using the ‘Add’ tool. It was then displayed (re-projected) on Projected
Coordinate System (UTM, WGS 1984, Zone 32) for accuracy. The measuring tool was then used to measure the
distance. The measurement was done using planar option (plane), and Meters as the unit.
The Imagery were of Very High Resolution (VHR), and as such the Filling Stations were well displayed. The
better option is Aerial Photograph which has a resolution of 0.25m, which is not available and will be very
expensive to obtain considering the budget of this study. The Software (ArcGIS) is very robust and has various
GIS capabilities. It has an array of Co-ordinate systems, and projects can be re-projected on-the-fly to any of the
Co-ordinate systems.
5.0 DISCUSSION OF RESULTS/FINDINGS
To ascertain the level of compliance to land space/size and setback standards the percentage compliance was
calculated as contained in table 1.
Table 1: Land Space/Size and Setback Standard Measurements
S/N Compliance with Land Space/Size and Setback Standard NO.
Complied
%
Complied
1 Minimum plot size of fuel station shall be 35m x35m 76 28.1
2 Maximum plot coverage is 60% 136 50.4
3 Mini vehicle manoeuvring area is 1100m2 with a minimum frontage of
9m facing the primary street
72 26.7
4 Buildings inside the station must be at a minimum of 12m from the road
property boundary.
109 40.4
5 Petrol pumps must be located at a minimum of 30m from residential
buildings.
161 59.7
6 There should be a minimum distance of 10m UST and dispensing pumps 110 40.7
7 There shall be a minimum of 3 dispensing pumps (one for each of the
petrol, diesel and kerosene)
105 38.9
8 Minimum set back of Petroleum Filling Stations to a 330kv line is 32m 193 71.5
9 Minimum set back of Petroleum Filling Stations to a 66kv power line is
8m
127 40.0
10 Minimum set back of Petroleum Filling Stations to a 132kv line is 16m 119 44.1
Average Percentage 44.1
Source: Author’s Computation (2019).
Table 1 contains the information about the land space/size and setback standards measures which are to be
observed before a filling station is to be built. The requirement has it that the minimum plot size should be 35m
Civil and Environmental Research www.iiste.org
ISSN 2224-5790 (Paper) ISSN 2225-0514 (Online)
Vol.12, No.2, 2020
84
by 35m, but the result shows that only 28.1 percent of the filling station owners observed this minimum
requirement. Another requirement is that the maximum plot coverage should be 60%, but only 50.4 percent of the
filling stations were able to meet up with this; the rest didn’t meet up. Coming to the standard of mini vehicle
maneuvering area, according to the standard, this should be 1100m2, but only 26.7 percent of the filling stations
observed this; this shows a low level of compliance. Another standard is that buildings inside the station must be
at a minimum of 12m from the road property boundary, to this, only 40.4 percent of the filling stations complied.
Only 59.7 percent of the filling stations were able to comply to the requirement of the petrol pumps being located
at a minimum of 30m from residential buildings; the rest didn’t meet this requirement. The standard has it that
there should be a minimum of 10m UST and the dispensing pumps; it was only 40.7 percent of the respondents
that observed this, the rest could not meet up with this expectation. 38.9 percent of the filling have a minimum of
3 dispensing pumps (one for each of petrol, diesel and kerosene), while 71.5 percent have their minimum setback
of Petroleum Filling Stations to a 330kv line to be 32m and 40 percent have their minimum setback of Petroleum
Filling Stations to a 66kv power line to be 8m. Finally, 44.1 percent of the filling stations met the standard of
minimum set back of Petroleum Filling Stations to a 132kv line being 16m.
The overall level of compliance to land space/size and setback standards is 44.1 percent across the filling stations
in Anambra State. That is to say that only 44.1 percent of the PFSs in Anambra State complied with the land
space/size and setback standards of building filling stations.
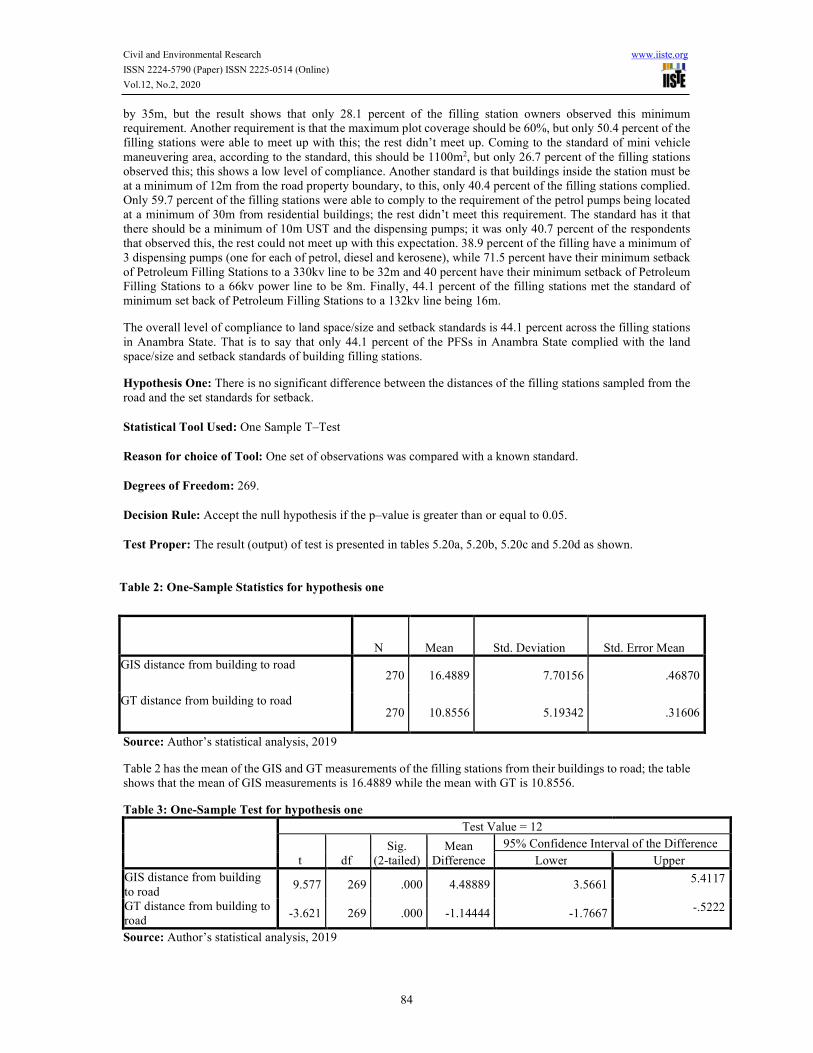
Hypothesis One: There is no significant difference between the distances of the filling stations sampled from the
road and the set standards for setback.
Statistical Tool Used: One Sample T–Test
Reason for choice of Tool: One set of observations was compared with a known standard.
Degrees of Freedom: 269.
Decision Rule: Accept the null hypothesis if the p–value is greater than or equal to 0.05.
Test Proper: The result (output) of test is presented in tables 5.20a, 5.20b, 5.20c and 5.20d as shown.
Table 2: One-Sample Statistics for hypothesis one
N Mean Std. Deviation Std. Error Mean
GIS distance from building to road 270 16.4889 7.70156 .46870
GT distance from building to road 270 10.8556 5.19342 .31606
Source: Author’s statistical analysis, 2019
Table 2 has the mean of the GIS and GT measurements of the filling stations from their buildings to road; the table
shows that the mean of GIS measurements is 16.4889 while the mean with GT is 10.8556.
Table 3: One-Sample Test for hypothesis one
Test Value = 12
t df
Sig.
(2-tailed)
Mean
Difference
95% Confidence Interval of the Difference
Lower Upper
GIS distance from building
to road 9.577 269 .000 4.48889 3.5661
5.4117
GT distance from building to
road -3.621 269 .000 -1.14444 -1.7667
-.5222
Source: Author’s statistical analysis, 2019

Civil and Environmental Research www.iiste.org
ISSN 2224-5790 (Paper) ISSN 2225-0514 (Online)
Vol.12, No.2, 2020
85
From table 3, it can be seen that the p – values of the test for GIS distance from building to road is 0.000 and also
GT distance from building to road is 0.000; these values are lower than 0.05. This implies that there is significant
difference between distances of the filling stations sampled from the road and the set standards for setback. In the
case of measurements with GIS, the distances are significantly above the minimum standard for setback (buildings
inside the station must be at a minimum of 12m), but it is still within range. Then in the case of GT measurements,
the distances are below the standard.
Table 4: One-Sample T-test Statistics for hypothesis one
N Mean Std. Deviation Std. Error Mean
GIS distance from last pump to road 270 11.6778 4.44920 .27077
GT distance from last pump to road 270 10.3667 4.38089 .26661
Source: Author’s statistical analysis, 2019
Table 4 has the mean of the measurements with GIS and GT from the last pump to the road, the table shows that
the mean when GIS was used is 11.6778, while the mean with GT is 10.3667. we then move to table 19d to find
out if these mean measurements are within standard or not.
Table 5: One-Sample Test for hypothesis one
Test Value = 15
t df
Sig.
(2-tailed)
Mean
Difference
95% Confidence Interval of the Difference
Lower Upper
GIS distance from last pump
to road -12.270 269 .000 -3.32222 -3.8553
-2.7891
GT distance from last pump
to road -17.379 269 .000 -4.63333 -5.1582
-4.1084
Source: Author’s statistical analysis, 2019
Table 5 contains the one sample t–test for checking whether the measurements of the distances from the last pump
to the road are significantly the same with minimum setback standard, when GIS was used and when GT was done.
The table shows that the p–values for the tests are all 0.000, less than 0.05. The implication is that the averages of
the measurements are significantly below the standard for setbacks (the distance from the road to the nearest pump
must not be less than 15m); this means that the distance from the road to the nearest pump is significantly less than
15m.
Decision and Conclusion: Having gone through the various tables and the interpretations given in each, we
therefore conclude that there is significant difference between the distances of the filling stations sampled from
the road and the set standards for setback, thus rejecting the null hypothesis and accepting the alternative
hypothesis.
5.1 CONCLUSION AND RECOMMENDATION
The overall level of compliance to land space/size and setback standards is about 44.1 percent across the filling
stations in Anambra State. That is to say that only about 44.1 percent of the filling stations in Anambra State
complied the land space/size and setback standards of building filling stations.
In line with the conclusion of this study, the following recommendations were made:
1. The law should empower the planning officer(s) to prosecute all cases of illegal developments and plans
by non-planners without the planners approval should be subjected to prosecution as well.
2. There is great need for public participation as the owners of these lands can join hands to say that a
wrongly sited structure cannot be.
3. Campaign should be mounted to conscientize the filling station owners and other developers of the
dangers of non-compliance to set standards.
4. Open punishment should be given to all defaulters to the set standards for others to learn their lessons.

Civil and Environmental Research www.iiste.org
ISSN 2224-5790 (Paper) ISSN 2225-0514 (Online)
Vol.12, No.2, 2020
86
5. There should be severe punishment of corrupt officials of the enforcement agencies/bodies.
6. There should be strict monitoring of the development control practices and agencies by the government.
7. There should be proper planning to accommodate future expansion of roads.
REFERENCES
Afolabi, O. T.; Olajide, F. O. &Omotayo, S. K. (2011), Assessment of Safety Practices in Filling Stations in Ile-
Ife, South Western Nigeria, Journal of Community Medicine and Primary Health Care, vol. 23. Nos.
1&2, Mar/Sept, pp. 9-15.
Aluko, O. (2011). Development Control in Lagos State: an Assessment of Public Compliance to Space Standards
for Urban Development. International Multidisciplinary Journal, Ethiopia. 5 (5), 169-184. Serial No.
22.
Aluko, O. (2000). Development Control and Nigeria's New Civil Rule Programme.NITP Journal, 7, 79-88.
Arokoyu, S.; Ogoro, M. &Jochebed, A. (2015).Petroleum Filling Stations' Location and Minimum
Environmental Safety Requirements in ObioAkpor LGA, Nigeria.International Journal of Scientific
Research and Innovative Technology. 2, 21-39.
https://www.ijsrit.com/uploaded_all_files/3340225758_m4.pdf
Bogoro, A. G. &Nghalmi, S. M. (2014). Knowledge, Attitude and Practices of Development Control
InMellennium Quarters Yelwa, Bauchi, Nigeria. Quest Journal of Research in Environmental and
Earth Sciences. 1 (1), 1-11. ISSN(Online) : 2348-2532 www.questjournals.org
Department of Petroleum Resource (DPR) (2007).Procedure Guide for Grant of and Approval to Construct and
Operate Petroleum Products Retail Outlets. Issued by Department of Petroleum Resources,- Ministry
of Petroleum Resources Nigeria.
Hamid, A. b., Iman. M. H., Suriatini, b. I. and Martin, R. bt., (2009), site Potentiality of petrol Stations Based on
Traffic Counts, Malaysia Journal of Real Estate, vol. 4, No.1
Ioj, C.I., & Tudor, C. A. (2011). Temporal analysis of incompatible land-use and land-cover: the proximity
between residential areas and gas stations in Bucharest suburban area
Kawu, A. M., Ahmed, A. &Usman, A. S. (2012).Learning from Tradition: Elements and Practice of Urban
Development Control in Zaria City, Nigeria.American International Journal of Contemporary
Research.2 (7), 205-213.
Khahro, S. H., Abd Nassir Matorib, A. N., Imtiaz, A. C, I, A., &Talpurb. M. A. H. T. (2013), Land suitability
analysis for installing new Petroleum Filling Stations using GIS. Fourth International Symposium on
Infrastructure Engineering in Developing Countries, IEDC 2013, Vol. 77, pp. 28-36
Kio-Lawson, D.; Duru, M. N.; John, B. D. &Eebee, A. L. (2016): The Challenge of Development Control in
Nigerian Capital Cities- A Case of Some Selected Cities in the Niger Delta. Developing Country Studies.
6(2), 148-156.
Lekwot, V. E.; Kyom, B. C. &Balasom, M. K. (2013). The Nature, Scope and Dimensions Of Development
Control, Tools And Machineries In Urban Planning In Nigeria. International Journal of Innovative
Environmental Studies Research 1 (1):48-54.
Mohammed, M. U., Musa, I. J., & Jeb, D.N., (2014), GIS-Based Analysis of the Location of Filling Stations in
Metropolitan Kano against the Physical Planning Standards. American Journal of Engineering
Research, vol. 3, No.9, pp. 147-158
Mshelia, M., Abdullahi, J. &Dawha, E. (2015), Environmental Effects of Petrol Stations at Close Proximities to
Residential Buildings in Maiduguri and Jere, Borno State, Nigeria, Vol. 20, No. 4, pp. 1-8.
Murtala, M. U. (2015). Location Analysis of Filling Stations in Kano Metropolis, Nigeria. A Dissertation
Submitted to the School of Post Graduate Studies, Ahmadu Bello University, Zaria Nigeria. In Partial
Fulfillment for the Award of Masters Degree in Remote Sensing and GIS Department of Geography
Faculty of Science Ahmadu Bello University, Zaria Nigeria.
Njoku, C. &Alagbe, A. O. (2015). Site Suitability Assessment of Petroleum Filling Stations (PFSs) in Oyo
Town, Oyo State, Nigeria: a Geographic Information Systems (GIS) Approach..Journal of
Environmental Science, Toxicology and Food Technology (IOSR-JESTFT). 9. 08-19. DOI:
10.9790/2402-091230819

Civil and Environmental Research www.iiste.org
ISSN 2224-5790 (Paper) ISSN 2225-0514 (Online)
Vol.12, No.2, 2020
87
Nwanjo, H.U. &Ojiako, O.A. (2007).Investigating the potential health hazards of the petrol station attendants in
Owerri, Nigeria.Journal of Applied Science and Environmental Management.11 (2).
Odipe, O.; Lawal, A.; Adio, Z.; Karani, G. &Sawyerr, H. (2018).GIS-Based Location Analyses of Retail Petrol
Stations in Ilorin, Kwara State, Nigeria.International Journal of Scientific and Engineering
Research.9, 790-794. https://www.researchgate.net/publication/330242228_GIS-
Based_Location_Analyses_of_Retail_Petrol_Stations_in_Ilorin_Kwara_State_Nigeria
Oduwaye, L. (2009). "Challenges of Sustainable Physical Planning and Development in Metropolitan Lagos"
Journal of Sustainable Development, 2(1), 159-171.
Ogundele, F. O., Ayo, O., Odewumi, S. G. &Aigbe, G. O. (2011). Challenges and prospects of physical
development control: A case study of Festac Town, Lagos, Nigeria. African Journal of Political
Science and International Relations 5(4), 174-178.
Olusegun, A.; Folakemi, O.; Omotayo, S. &Afolabi, O. (2011).Assessment of Safety Practices in Filling Stations
in Ile-Ife, South Western Nigeria.Journal of Community Medicine and Primary Health Care.23, 9-15.
https://www.researchgate.net/publication/271501044_Assessment_of_Safety_Practices_in_Filling_Sta
tions_in_Ile-Ife_South_Western_Nigeria
Philip E (2007). Urban Planning and Development Control Regulations; Case study Kerala, ITPI Journal 4, 13-
16 www.Itp:org.in
Thomas, K. T.; Chanda, S.; Blessings, C. (2016).Public Perceptions on Location of Filling Stations in the City of
Kitwe in Zambia. Developing Country Studieswww.iiste.orgISSN 2224-607X (Paper) ISSN
2225-0565 (Online) Vol.6, No.6, 2016.
Ujjwal, S. &Sokhi, B. S. (2006).GIS City Hazard Petrol Station Vicinity Vulnerability Assesment.GIM
International 20 (8).
United Nations Human Settlements Programme UN-HABITAT; (2009): “Structure Plan for Awka and Satellite
Towns”. Nairobi, Kenya. Website: http://www.unhabitat.org (UN-HABITAT, 2009).