High Temperature Fatigue Behaviour of Austenitic Stainless ...
Upload
khangminh22Category
view
0download
0
Dipl.-Ing. Stojan Vujić
Microstructural investigation of
25Cr-20Ni-Nb-N austenitic steel for
USC and A-USC coal power plants
DISSERTATION
Submitted for the Degree of
Doctor of Technical Science
Graz University of Technology
Supervisor
Univ.-Prof. Dipl.-Ing. Dr. techn. Christof Sommitsch
Institute of Material Science and Welding
Faculty of Mechanical Engineering and Economic Sciences
Graz, November 2015


AFFIDAVIT
I declare that I have authored this thesis independently, that I have not used other than the
declared sources/resources, and that I have explicitly indicated all material which has been
quoted either literally or by content from the sources used. The text document uploaded to
TUGRAZonline is identical to the present doctoral dissertation.
__________________________ _____________________________
Datum / Date Signature


PREFACE
This dissertation has been carried out at the Institute of Material Science and Welding and
has been submitted for the degree of Doctor of Technical Science at the Faculty of Mechanical
Engineering at the Graz University of Technology. The research described in this thesis has
been conducted under the supervision of Prof. Christof Sommitsch and Dr. Coline Béal from
the Institute of Material Science and Welding, Graz University of Technology, between March
2011 and November 2015.
The financial support for this thesis is provided by the European Union within the project
MACPLUS (Material-Component Performance-driven Solutions for Long-Term Efficiency
Increase in Ultra Supercritical Power Plants) in the framework of the Clean Coal Technologies.
A part of this dissertation is carried out at the Department of Materials Science and
Engineering at the Royal Institute of Technology (KTH) in Stockholm.
Results obtained during this PhD in the field of austenitic steels and nickel-based alloys
have been published in journals and conference proceedings. The references of these
publications are shown below.
1) S. Vujic, R. Sandström, and C. Sommitsch, “Precipitation evolution and creep
strength modelling of 25Cr20NiNbN austenitic steel,” Mater. High Temp., DOI:
10.1179/1878641315Y.0000000007, pp. 1–12, 2015, in print.
2) E. Plesiutschnig, S. Vujic, and C. Sommitsch, “Investigations on the precipitation
evolution of MarBN steels for microstructure based Life-Time assessments,”
Sapporo, Japan, in Proc.: Advanced High-Temperature Materials Technology for
Sustainable and Reliable Power Engineering (123HIMAT), 2015.
3) S. Vujic, F. Di Martino, S. Matera, O. Tassa, S. C. Hogg, J. Zurek, C. Beal, and C.
Sommitsch, “Microstructure Evolution and Precipitation Modeling in Ni-Based Alloy
C-263,” Las Vegas, USA, in Proc.: Processing & Manufacturing of Advanced Materials
(THERMEC), 2013, vol. 783–786.

4) S. F. Di Martino, R. G. Faulkner, S. C. Hogg, S. Vujic, and O. Tassa, “Characterisation
of microstructure and creep properties of alloy 617 for high-temperature
applications,” Mater. Sci. Eng. A, vol. 619, pp. 77–86, 2014.
5) S. Vujic, C. Beal, C. Sommitsch, F. Muhammad, R. Sandström, and J. Zurek,
“Modelling and optimizing precipitation in creep resistant austenitic steel 25Cr-
20Ni-Nb-N,” Waikoloa, Hawaii, in Proc.: Advances in Materials Technology for Fossil
Power Plants, 2013.
6) E. Povoden-Karadeniz, S. Vujic, and E. Kozeschnik, “Thermodynamic modeling and
simulation of time-temperature-precipitation diagrams in stainless steel,” San
Sebastian, Spain, in Proc.: CALPHAD XLII, 2013.
7) S. Vujic, M. Farooq, B. Sonderegger, R. Sandström, and C. Sommitsch, “Numerical
Modelling and Validation of Precipitation Kinetics in Advanced Creep Resistant
Austenitic Steel,” Comput. METHODS Mater. Sci., vol. 12, no. 3, pp. 175–182, 2012.
Stojan Vujić
November 2015

ACKNOWLEDGEMENTS
This thesis has been carried out within the EU-project MACPLUS. Therefore, many thanks to
the European Union which provided the financial support.
I would like to thank Prof. Christof Sommitsch for acting as reviewer of this dissertation, for
supervising this thesis and who gave me the chance to visit numerous of conferences and
project meetings around the world. It was a great experience for me! Vielen Dank! I want to
express many thanks to Dr. Coline Béal who supervised this thesis. Merci beaucoup! Further
thanks goes to my colleagues from the Institute of Material Science and Welding at the TU
Graz. Special thanks to Christian, Johannes, Ozan, Ernst, Claudia, and Coline from the Material
Development group. Vielen Dank!
Many thanks are owned to Prof. Rolf Sandström who performs the creep strength calculations
in the present thesis and for the invitation to the KTH Stockholm as well as for the grateful
work which is done at the KTH. It was an interesting time in Sweden. Tack så mycket! I would
like to thank Forschungszentrum Jülich and KTH Stockholm for providing the samples and for
performing the SEM and TEM investigations.
I would like to thank Prof. Ernst Kozeschnik from TU Vienna for acting as reviewer of this
dissertation and for the grateful support of MatCalc. Vielen Dank! A special thanks goes to
Dr. Erwin Povoden Karadeniz from TU Vienna who spent a lot of time for numerous interesting
discussions, MatCalc support and database development. Vielen Dank!
Last but not least, I would like to thank my spouse Jelena, my parents Ljiljana and Dragoljub
as well as my friends for their huge support during my time as a PhD student. Mnogo vam
hvala!

ABSTRACT
Advanced austenitic steels, such as 25Cr-20Ni-Nb-N are complex systems which have more
than eight alloying elements. They provide high corrosion resistance and have high creep
strength, which make them suitable for superheater applications in power plants.
The present thesis deals with the investigation of microstructure, especially precipitation
evolution in an advanced 25Cr-20Ni-Nb-N austenitic steel after solution annealing and thermal
ageing. The investigations are carried out by light optical microscopy, scanning electron
microscopy, as well as transmission electron microscopy. The investigations reveal the
presence of five different precipitates: σ-phase, M23C6, Nb(C,N), η (Cr3Ni2Si(C,N)), and Z-phase.
The fraction of σ-phase is found to increase rapidly with increasing ageing time.
The investigations are expanded by additional equilibrium-, Scheil- and precipitation-
kinetics-calculations using the software MatCalc. Thereby, the amount and evolution of
primary as well as secondary precipitates during a solution annealing and isothermal ageing
for 100,000h at 650 and 750°C have been calculated. Good agreement with experimental
investigation has been achieved.
Further on, the results of the precipitation evolution calculations are used for the modelling
of the creep strength. In total, three main contributions to the creep strength are considered:
from dislocations, from precipitates and from elements in solid solution. The contribution
from the dislocation is found to be the highest one.
Using the results of precipitation evolution calculation and creep strength modelling, a
modified chemical composition has been proposed, with the purpose of suppressing the σ-
phase precipitation.
Superheater tubes out of the modified composition are manufactured and short-term
creep tests as well as ageing treatments are performed. As expected, analyses of tested
specimens reveal no σ-phase precipitates.
Finally, this thesis presents a whole material development process, which contains an
investigation of a conventional 25Cr-20Ni-Nb-N austenitic steel, calculation of precipitation
evolution and creep strength, modification of chemical composition and manufacturing of
modified superheater tubes for power plants.


Symbols and Units
a m Lattice parameter A m2 Area surrounding the dislocation b m Burger’s vector (=2.58E-10) ci
0 m-3 Concentration of solute i in solid solution ci
dyn m-3 Concentration of solute i around moving dislocations ci
stat m-3 Concentration of solute i around non-moving (static) dislocations cki mol m-3 Concentration of component i
Disol m2 s-1 Diffusion coefficient for the solute i
Dki m2 s-1 Diffusion coefficient DS0 m2 s-1 Coefficient for self diffusion dsub m Subgrain diameter
F N Force fsol - Creep rate factor fvol - Volume fraction of particles G N m-2 Shear modulus
G* J Critical nucleation energy I(z0) - Drag stress function Jki mol m-2 s-1 Flux coefficient J s-1 Transient nucleation rate K - Constant (=20 for austenitic steels) kB kg m2 s-2 K-1 Boltzmann’s constant (=1.3806488 × 10⁻²³) L m Spurt distance
Lpart m Average distance between the particles Lpart tot m Total interparticle spacing
Lrcrit m Interparticle spacing of particles larger than critical radius m - Taylor factor (=3.06) M m2 N-1 s-1 Dislocation mobility
Mclimb m2 N-1 s-1 Dislocation mobility for dislocation climb Mk m3 N-1 s-1 Interface mobility NA m-2 Total number of particles per unit area No - Number of potential nucleation sites Noi mol Number of moles of component i
nA(r) m-2 Number of particles larger than radius r nA(rcrit) m-2 Number of particles larger than critical radius
Q J Activation energy Q1 J s-1 Dissipation rate by interface movement Q2 J s-1 Dissipation rate by diffusion inside the precipitate Q3 J s-1 Dissipation rate by diffusion inside the matrix R J K-1 mol-1 Gas constant (=8.31) r m Particle radius
rcrit m Critical particle radius for dislocation climb rsol m Distance from the solute to the centre of the dislocation T K Temperature t s Time
tclimb s Time for climb

Ui J Interaction energy between a solute and an edge dislocation Ui
max J mol-1 Maximum interaction energy between a solute and an edge dislocation
y m y-coordinate of solute relative to an edge dislocation z0 - Drag stress parameter Z - Zeldovich factor α - Constant (α=(1-ν/2)/2π(1-ν) where Poisson’s ratio ν=0.3) β J m Drag stress parameter (=2/3*Umax*b)
β* s-1 Atomic attachment rate γk J m-2 Precipitate/matrix interface energy ε % Strain εi - Linear atomic size misfit parameter of solute i 𝜀̇ s-1 Creep rate
𝜀�̇�𝑖𝑛 s-1 Creep rate during stationary creep λk J m-3 Contribution of the elastic energy and plastic work μ0i J mol-1 Chemical potential ν - Poisson’s ratio (=0.3)
νdisl m s-1 Climb velocity ρ m-2 Dislocation density
ρ K m Radius of the precipitate with index k 𝜌�̇� m s-1 Growth rate of precipitate k σ N m-2 Stress
σbreak N m-2 Break stress σdisl N m-2 Dislocation stress σdisl N m-2 Dislocation hardening σi
drag N m-2 Drag stress from solute i σmax N m-2 Maximum strength (tensile strength) σpart N m-2 Orowan strength
σpart tot N m-2 Total orowan strength of all particles σph N m-2 Particle hardening σsol N m-2 Solid solution hardening σsolN N m-2 Solid solution hardening by N
τL N Dislocation line tension τi s Incubation time υ m s-1 Velocity of the dislocation
Ω0 m3 mol-1 Atomic volume in the host alloy

Abbreviations
USC Ultra-Supercritical
A-USC Advanced Ultra-Supercritical
TCP Topologically Closed Packed
LOM Light Optical Microscopy
SEM Scanning Electron Microscopy
TEM Transmission Electron Microscopy
EDS Energy Dispersive Spectroscopy
TED Transmission Electron diffraction
SAED Selected Area Electron Diffraction
AISI American Iron and Steel Institute
VIM Vacuum Induction Melting
BSD Back-Scatter Detector
ASTM American Society for Testing and Materials
METI Ministry of Economy, Trade and Industry


Content
1 Introduction ..................................................................................................................... 1
2 Objectives ........................................................................................................................ 3
3 Literature Review ............................................................................................................ 5
3.1 Superheater and Reheater in Power Plants ............................................................. 5
3.2 Austenitic steels for Superheater and Reheater...................................................... 6
3.2.1 Precipitates in 25Cr-20Ni-Nb-N austenitic steel ............................................... 9
3.2.2 Creep strength of austenitic steels ................................................................. 17
4 Material and Experimental ............................................................................................ 27
4.1 The 25Cr-20Ni-Nb-N austenitic steel ..................................................................... 27
4.2 Microstructure Investigation Methods .................................................................. 27
4.2.1 Scanning Electron Microscope (SEM) ............................................................. 27
4.2.2 Transmission Electron Microscope (TEM) ...................................................... 28
4.3 Thermodynamic and Thermokinetic Calculations ................................................. 28
4.3.1 Setup for Equilibrium and Scheil Calculations ................................................ 29
4.3.2 Setup for Precipitation Calculations ............................................................... 30
4.4 Creep strength modelling ...................................................................................... 32
5 Results and Discussion .................................................................................................. 35
5.1 Microstructure ....................................................................................................... 35
5.1.1 Microstructure at 650°C ................................................................................. 35
5.1.2 Microstructure at 750°C ................................................................................. 37
5.1.3 Precipitates composition ................................................................................ 38
5.1.4 Discussion ....................................................................................................... 41
5.1.5 Summary ......................................................................................................... 45
5.2 Thermodynamic and Thermokinetic Calculations ................................................. 46
5.2.1 Equilibrium and Scheil Calculations ................................................................ 46

5.2.2 Precipitation Evolution at 650 and 750°C....................................................... 50
5.3 Creep Strength Calculations ................................................................................... 62
5.3.1 Precipitation Hardening .................................................................................. 62
5.3.2 Solid Solution Hardening ................................................................................ 64
5.3.3 Dislocation Hardening .................................................................................... 66
5.3.4 Creep Strength ................................................................................................ 67
5.3.5 Discussion ....................................................................................................... 68
5.3.6 Summary ......................................................................................................... 71
6 Modification of 25Cr-20Ni-Nb-N Austenitic Steel ......................................................... 73
6.1 Objectives ............................................................................................................... 74
6.2 Thermodynamic and Thermokinetic Calculations ................................................. 76
6.2.1 Results ............................................................................................................. 76
6.3 Material and Experimental .................................................................................... 85
6.3.1 The Modified 25Cr-20Ni-Nb-N Steel ............................................................... 85
6.3.2 Creep Exposure Test ....................................................................................... 86
6.3.3 Isothermal Exposure Tests (Ageing) ............................................................... 87
6.4 Results and Discussion ........................................................................................... 87
6.4.1 Microstructure in As-received Condition ....................................................... 87
6.4.2 Creep Strength and Microstructure at 650°C ................................................. 88
6.4.3 Creep Strength and Microstructure at 750°C ................................................. 90
6.4.4 Discussion ....................................................................................................... 93
6.4.5 Summary ......................................................................................................... 98
7 Summary ....................................................................................................................... 99
8 Outlook ........................................................................................................................ 101
9 References ................................................................................................................... 105
Appendix ............................................................................................................................ 113

1
The primary energy sources for world electricity generation are coal (41%), gas (22%),
hydro (16%), nuclear (12%), oil (5%), and renewable (4%)[1]. The world electricity demand has
doubled between 1990 and 2011 and it is expected to increase up to the year 2035 between
1.7 and 2.5% per year[1]. One possible way to meet this increasing demand is to increase the
efficiency of the present and future coal power plants.
The coal power plants are generally classified into three categories: Supercritical (SC), Ultra-
supercritical (USC) and advanced ultra-supercritical (A-USC). SC power plants operate with
steam temperature up to 590°C and steam pressure of 250 bar, the USC with 590-620°C and
250 bar, and the A-USC with 700-760°C and 345bar [2]. The world mean efficiency of coal
power plants is approximately 36% [1]. This efficiency is achieved by steam temperature lower
than 600°C. An increase of the steam temperature to 700-750°C would increase the efficiency
up to 50% or more and correspondingly lead to a drop in CO2 emissions that is of utmost
importance to reduce global warming [3]. Such conditions require materials with enhanced
toughness, creep strength and corrosion resistance. Potential materials for these conditions
are ferritic-, austenitic-steels and nickel-base alloys. Considering the fireside corrosion, the
ferritic steels are used up to 620°C and it is expected that in the future these steels will be
used up to 650°C [4]. Above these temperatures, the austenitic steels and nickel base alloys
have to be used. The main brake in the use of the nickel-base alloys is, that they are three
times more expensive compared to the austenitic steels. Therefore, the austenitic steels are
an optional choice for power plant applications above 650°C.
In general, the austenitic steels for power plant applications can be split up into four
categories according to their chromium content: <18% Cr, 18% Cr, 20-25% Cr and >25% Cr. For
USC and A-USC power plants, the high chromium (20-25% Cr and >25% Cr) austenitic steels
are more suitable because of their higher corrosion resistance. However, they are more
1 Introduction

Stojan Vujić Introduction
2
sensitive to sigma phase precipitation [5], [6], which can cause a loss of toughness [7]–[9] and
further on to material failure.
The challenge in developing advanced austenitic steels is to provide high corrosion
resistance (by high chromium content) and high creep strength but to avoid undesirable
phases such as sigma phase. This thesis deals with the microstructure evolution under
manufacturing route and service conditions of a high chromium (25%Cr) austenitic steel.
Experimental investigations as well as modelling of precipitation and evaluation of hardening
mechanisms have been carried out. Finally, superheater tubes with modified composition are
produced where σ-phase formation is suppressed.

3
The main goal of this thesis is to investigate and describe the microstructure evolution of a
25Cr-20Ni-Nb-N austenitic steel at 650 and 750°C in order to develop a new steel with
optimised microstructure. Therefore, the thesis has been divided into three sections: (i)
experimental microstructure investigations, (ii) modelling of microstructure evolution and
hardening mechanisms and (iii) evaluation as well as investigation of the modified
composition.
The main objective of the first section (i) is to experimentally investigate the precipitation
evolution at 650 and 750°C in the 25Cr-20Ni-Nb-N austenitic steel. For the investigation, LOM,
SEM, TEM and EDS techniques should be used. The microstructure and especially the
precipitation evolution (e.g. precipitates -size, -fraction, -shape etc.) should be investigated
and compared with the literature.
The main objective of the second part (ii) is the modelling of the precipitation evolution in
the 25Cr-20Ni-Nb-N austenitic steel at 650 and 750°C. In this section, the phase fraction and
mean radius evolution of the different precipitates at 650 and 750°C should be predicted by
using the thermo-kinetic software MatCalc [10]–[12]. Using the results of the thermo-kinetic
simulations by MatCalc and the creep strength modelling approach of Sandström et al. [13]–
[18] the hardening mechanisms should be evaluated. The terms and objectives for the
modification of the chemical composition of the 25Cr-20Ni-Nb-N steel should be defined in
order to obtain the best mechanical properties. Afterwards additional thermo-kinetic
calculation should be applied to define a modified composition for the 25Cr-20Ni-Nb-N
austenitic steel.
The main objective of the third part (iii) is the microstructure investigation by LOM and SEM
of the modified composition of the 25Cr-20Ni-Nb-N austenitic steel. Finally, the results should
be discussed in regards to the defined objectives.
2 Objectives


5
This chapter will give an overview of the application of austenitic steels for USC and A-USC
power plants. After a short introduction about superheater operation and materials for
superheater/reheater in power plants, the microstructure of the 25Cr-20Ni-Nb-N austenitic
steel with emphasis on the precipitation evolution as well as creep strength will be discussed.
3.1 Superheater and Reheater in Power Plants
Thermal power station are mainly steam driven: the steam turns into a steam turbine which
drives a generator, which then produces electrical energy.
The water in the power plant has to pass several stages until the steam is generated. A
general overview of the steam flow and selected materials in an A-USC power plant is shown
in Figure 1. First, the water is heated up in the feed heaters, by extracting small amounts of
hot steam out of the turbine. Afterwards, the heated water passes the economizer and
evaporator where the water is brought to the temperature of boiling and evaporation. Before
the steam is brought to the turbine, it is heated up by the superheater, where the moisture
content of the steam is removed [19] and the final steam service temperature is achieved.
After the steam is leaving the turbine, it is reheated by the reheater and fed back to the
turbine. A double reheating process in an A-USC power plant increases the efficiency by +0.7%
[20]. The last stages of the steam flow are the condenser and boiler feed where the steam is
condensed and pumped back to the boiler.
The superheater and reheater are located in the flue gas duct, after the furnace, and are
made of a set of tubes (placed across the duct) to pick up the heat. The diameter of the
seamless tubes is about 45mm and the thickness is about 10mm. Starr [21] reports that the
superheater “coil” is not continuous, it consists of several banks which varies from plant to
plant. Generally, a typical superheater consists of three banks: the primary, secondary and
final superheaters. For advanced power plants more than three superheater banks are
3 Literature Review

Stojan Vujić Literature Review
6
necessary. A-USC power plant which operates at a steam temperature of ≈700°C contains four
superheater banks, as can be seen in Figure 1 (superheaters are marked with “SH”). The steam
temperature of the primary superheater (1SH) is quite low, around 350-450°C. This primary
superheater is made of ferritic steels. The secondary superheater (2SH, 3SH) takes the steam
from the primary one which is located close to the exit of the furnace, directly receiving the
hot flue gases which are in the range of 1250-1550°C. These secondary superheaters are made
of austenitic and nickel-base alloys. The final superheater (4SH) brings the steam to the
turbine inlet steam condition, which is for the A-USC, 700°C and 35MPa, see Figure 1. This final
superheater is made of nickel-base alloys. The steam pressure in the reheater is clearly lower
compared to the superheater: for SC power plant the relationship superheater/reheater is
250/45 bar, for USC 250/50 and for A-USC it is 345/76 bar [2].
Figure 1: Main stages of the steam flow of a A-USC power plant and selected materials [22]. VHPT: Very high pressure turbine; HP-IPT: High pressure-intermediate pressure turbine; LPT:
Low pressure turbine; SH: Super heater; RH: Reheater; GT: Gas turbine; ECO: Economizer.
3.2 Austenitic steels for Superheater and Reheater
During the last decades many materials for superheater and reheater in coal power plants
have been developed. In general the materials can be split up into three groups: ferritic-,
austenitic-steels and nickel-base alloys, as shown in Figure 1. Superheater materials for USC

Stojan Vujić Literature Review
7
and A-USC power plants require a high creep strength, high thermal fatigue strength, good
weldability, high resistance to fireside corrosion and steam side oxidation. Viswanathan et al.
[4] mention that from creep strength point of view the ferritic steels can be used up to a metal
temperature of 620°C (corresponds to a steam temperature of 592°C). Furthermore,
considering the fireside corrosion, the metal temperature is still limited to 593°C. However, it
is expected that the ferritic steels in future will be used up to 650°C [23]. Above these
temperatures, in the finishing stage of superheater and reheater tubing, austenitic steels and
nickel-base alloys have to be used.
Wheeldon et al. [2] mention that the current advanced austenitic steels have the required
creep strength for more than 650°C, but they have two physical challenges:
Low conductivity and high thermal expansion may lead to high thermal stresses and
fatigue cracking in the thick-walled pipe sections.
Iron-alkali sulfates, which are present in the coal-ash deposits, promote the fireside
corrosion. The corrosion attack increases with increasing temperature (up to 700°C)
and increasing coal chlorine content. Above of 540°C the alkali sulfate becomes
molten and attacks the tube. The corrosion attack reaches a maximum at 700°C and
decreases for higher temperatures [9]. Since the austenitic steels are operating in
this temperature range, a strong corrosion attack is expected.
In general the austenitic steels can be split up into four categories according to their Cr
content: <18% Cr, 18% Cr, 20-25% Cr and >25% Cr. The 25Cr-20Ni-Nb-N steel (also known as
TP310HNbN, HR3C, DMV310N), which is investigated in this thesis, is an advancement of the
20Cr-20Ni (AISI 310) steel with additional amount of Nb and N, as can be seen in Figure 2.
The chemical composition of the 25Cr-20Ni-Nb-N austenitic steel is presented in Table 1.
The high chromium-content of 25% gives an excellent fireside corrosion resistance, while the
addition of niobium and nitrogen promotes both, the formation of fine NbCrN (Z-phase)
precipitates and solid solution hardening improving the creep strength. The nickel content of
20% provides a full austenite matrix within the whole temperature range. The carbon is an
important carbide former. Silicon improves the oxidation resistance. Manganese acts as
deoxidation element and absorbs the sulphur during manufacturing.

Stojan Vujić Literature Review
8
Figure 2: Development progress of austenitic steels for boiler [23].
Table 1: Chemical composition (wt.%) of 25Cr-20Ni-Nb-N by the standards [24].
Designation C Cr Si P Ni Nb Mn N S
METI KASUS310J1TB
≤ 0.10
23.0 27.0
≤ 1.50
≤ 0.03
17.0 23.0
0.20 0.60
≤ 2.00
0.15 0.35
≤ 0.03
ASTM TP310HCbN
0.04 0.10
24.0 26.0
≤ 0.75
≤ 0.03
17.0 23.0
0.20 0.60
≤ 2.00
0.15 0.35
≤ 0.03
EN TP310HCbN
≤ 0.10
23.0 27.0
≤ 1.50
≤ 0.03
17.0 23.0
0.20 0.60
≤ 2.00
0.15 0.35
≤ 0.03
Generally the tubes can be produced by mill-rolling or by extrusion. The last one is applied
for stainless steels and special metal tubes [25]. The ingot for the extrusion process is usually
produced by vacuum induction melting (VIM). The VIM produced ingot is then hot forged at a
temperature above 1000°C, whereas the temperature is decreasing during the forging to 800-
900°C. Afterwards, the semi-finished product is machined to the desired dimensions for
further extrusion process. Before extrusion, the semi-finished product is heated up by
induction heating and piercing is applied, where a hole in the part is created, as presented in
Figure 3. After that the tube is manufactured by extruding, followed by straightening, cold
pilgering (or cold drawing) and final heat treatment (usually a solution treatment at around
1200°C for the 25Cr-20Ni-Nb-N steel). Before the tubes are shipped to the customer, a non-
destructive testing (NDT) of the tubes is performed.

Stojan Vujić Literature Review
9
Figure 3: Manufactoring process of cold finished superheater tubes [26].
3.2.1 Precipitates in 25Cr-20Ni-Nb-N austenitic steel
Newest austenitic steels e.g. HR3C or Sanicro25 contain usually a lot of alloying elements
(as shown in Table 1) in order to get the required properties. Since these properties are
dependent on the microstructure stability, such as formation, dissolution and coarsening of
precipitates, it is important to properly describe the evolution of the microstructure during
thermo-mechanical processes and subsequent in service condition.
Different input parameters and experimental values are necessary for precipitation
evolution simulations. Typical input parameters are precipitation nucleation-sites and shape-
factors. Experimentally observed values are precipitates phase fractions and mean diameters.
In order to obtain these parameters and values, extensive experimental investigations are
necessary which are cost and time consuming. Thus, a literature review about the precipitates
forming in the 25Cr-20Ni-Nb-N steel (mainly based on [27]) is described here. The present
chapter explains the main precipitates characteristics such as precipitates structure,
composition, shape, nucleation-site, stability and precipitates effects on the mechanical
properties in austenitic steels. At the end of each chapter a table is presented which
summarizes the main precipitates characteristics related to the 25Cr-20Ni-Nb-N austenitic
steel.

Stojan Vujić Literature Review
10
3.2.1.1 MX
In [27] it is reported that MX precipitates form when carbide/nitride formers (Ti, Nb, V, Zr,
Ta etc.) are added to the alloy. Further on, MX precipitates have two purposes. The first one
is to stabilize the alloy against intergranular corrosion: MC precipitates bind the carbon and
therefore supress the precipitation of chromium-rich precipitates such M23C6 leading to local
depletion of chromium. The second one is to enhance the creep resistance, after a solution
treatment of 30-60min between 1100 and 1250°C, MX will precipitate during creep and act as
obstacles against movement of dislocations.
Generally the MX precipitates form during high temperature exposure (heat treatment as
well as service conditions) on twin and grain boundaries, dislocations within the matrix and
on stacking faults [27]. Formation of MX during the solidification is also possible, as reported
in [28] where TiN, NbN and (Nb,Ti)C precipitates with a size between 1 and 5µm in a 20Cr-
20Ni austenitic steel are found. It is assumed that these several micrometer large MX
precipitates are detrimental. In [29], [30] it is reported that MX precipitates having a size of
≈3µm act as void initiation and can decrease significantly the fracture resistance in type 347
austenitic steel with 18%Cr.
The dissolution of the MX precipitates is partially controlled by the M23C6 precipitates. In
[31] it is assumed that the MC to M23C6 transformation can take place in several austenitic
steels after long time exposure. From the literature alone, it is not possible to clarify if M23C6
or MC is more stable during long-term exposure. More studies are required to explain the
interactions between MC and M23C6 precipitates.
Table 2 presents the main characteristics of the MX precipitates in the 25Cr-20Ni-Nb-N
steel analysed after solution annealing at 1200-1250°C and after 500h at 750°C as well as after
long term exposure at 650°C for 72,075h. The shape of the MX is typically round or cubic. The
nucleation sites are grain interior. The main chemical element in MX is niobium and the size
is found to be up to ≈300nm.
Table 2: MX precipitates in 25Cr-20Ni-Nb-N austenitic steel.
Temp. [°C]
Time [h]
Shape Nucleation sites
Main chem. elements
Size [nm]
Investigation method
Reference
≈650 72,075 - GI Nb - TEM, EDS [32]
750 500 RD GI Nb - TEM, SAED [33]
1200-1250 - CU GI Nb ≈300 TEM, EDS [34]
GI: Grain interior; RD: Round; CU: Cubic

Stojan Vujić Literature Review
11
3.2.1.2 Z-phase
Sourmail [27] reports that Z-phase has a tetragonal unit cell and comprises chromium,
niobium, nitrogen; the formula being Cr2Nb2N2. Furthermore, the requirement for Z-phase
(=complex carbonitride) precipitation are niobium-stabilizing steels with high nitrogen level.
During thermal exposure, Z-Phase appears basically on grain boundaries, twin boundaries and
within the matrix [27]. In [28] a NF709R austenitic steel with (wt.%) 22Cr and 25Ni is
investigated. Two different kinds of Z-phase populations could be found: a large one with a
size of ≈1µm and a small one with a size of up to 100nm. The larger one is assumed to form
during solidification, whereas the smaller one is formed on dislocations during the thermal
exposure. The small fine dispersed Z-phase is assumed to be important for the creep strength
[27], acting as obstacles against movement of dislocations. The coarse Z-phase accelerates the
initiation of fatigue and especially corrosion-fatigue cracks in ISO 5832-9 austenitic steel with
22%Cr [35]. As reported in [27], [28], the Z-phase grows at the expense of MX precipitates in
20-25Cr austenitic steels. This indicates that the Z-phase is a stable niobium containing phase
in 20-25Cr austenitic steels.
In Table 3 the main properties of the Z-phase precipitates in the 25Cr-20Ni-Nb-N are
presented. The Z-phase is already found after 500h at 650 and 750°C and is even stable after
88,363h at 700°C. The shape is most whiskers-like, but also a cubic shape is reported. The
nucleation sites are grain interior and partially on grain boundaries. The main chemical
elements in Z-phase are niobium and chromium. An investigation of long term creep samples
(700°C/69MPa/88,363h) of 25Cr-20Ni-Nb-N steel reveals Z-phase inside grains having a
chemical composition (wt%) of 54.7Cr-42Nb-1.8Ni-1.5Fe [36].
Table 3: Z-phase precipitates in 25Cr-20Ni-Nb-N austenitic steel.
Temp. [°C]
Time [h]
Shape Nucleation sites
Main chem. elements
Investigation method
Reference
605 5,400 - GB, GI Nb, Cr TEM, EDS [37]
605 25,000 - GB, GI Nb, Cr TEM, EDS [37]
650 500 - GI Nb, Cr TEM, EDS [34]
650 3,000 - GI Nb, Cr TEM, EDS [34]
≈650 72,075 WH GI Nb, Cr TEM, EDS [32], [38]
700 88,363 WH GI Nb, Cr TEM, EDS [36]
750 500 CU, WH GI Nb, Cr TEM, SAED, EDS [33]
GI: Grain interior; GB: Grain boundary; CU: Cubic; WH: Whiskers

Stojan Vujić Literature Review
12
3.2.1.3 M23C6
According to Sourmail [27], the M23C6 is the most found carbide in the austenitic steels.
M23C6 is a general notation for Cr23C6, instead of chromium, there can be nickel, molybdenum
and iron. The M23C6 precipitates firstly form at grain boundaries, with increasing time on
incoherent twin boundaries, coherent twin boundaries and intragranular (e.g. undissolved
NbCN, dislocations) sites. After long ageing times, an interlocked structure of M23C6
precipitates is observed.
The influence of M23C6 on the mechanical properties seems to be dependent on the type
of nucleation. M23C6, which form on serrated grain boundaries, tend to be planar and lower in
quantity, whereas M23C6 that form on planar grain boundaries tend to be triangular in shape
[39]. The triangular ones are more likely to lead to cavity nucleation and further on to failure
in austenitic steel AISI304 with 18%Cr [29].
The formation of the M23C6 can be particularly controlled by the steel chemistry. The
molybdenum accelerates the formation of the M23C6 whereas the nitrogen retards both the
formation and coarsening [27]. A higher content of nitrogen accelerates the formation of Cr2N
and as a consequence the M23C6 formation is retarded [40].
In Table 4 the main properties of the M23C6 precipitates in the 25Cr-20Ni-Nb-N are
presented. It shows that the M23C6 are already found after 500h at 650 and 750°C and are
even stable after 75,075h at 650°C. The shape is mostly cubic- and rod-like. The nucleation
sites are mostly grain boundaries and also intragranular at longer exposure time. The main
chemical elements in M23C6 are chromium and particularly nickel. An investigation of 25Cr-
20Ni-Nb-N creep samples (650°C/149MPa/17,237.4h) reveal M23C6 precipitates on grain
boundaries and inside grains having a chemical composition (wt%) of 74.5Cr-16.5Ni-6.5-Fe-
1.8Nb [36].
Table 4: M23C6 precipitates in 25Cr-20Ni-Nb-N austenitic steel.
Temp. [°C]
Time [h]
Shape Nucleation sites
Main chem. elements
Investigation method
Reference
605 5,400 - GB Cr TEM, EDS [37]
605 25,000 - GB Cr TEM, EDS [37]
650 500 - GB Cr TEM, EDS [34]
650 3,000 CU GB, GI Cr TEM, EDS [34]
650 17,237 - GB, GI Cr, Ni TEM, EDS [36]
≈650 75,075 - GB, GI - TEM, EDS [32], [38]
750 500 CU, RO GI, GB Cr TEM, SAED, EDS [33]
GI: Grain interior; GB: Grain boundary; Shape: CU: Cubic; RO: Rod

Stojan Vujić Literature Review
13
3.2.1.4 σ-phase
The σ-phase has a tetragonal unit cell and its main chemical elements are iron and
chromium [27]. Additional compositions are Fe(Cr, Mo) or (Fe, Ni, Co)x(Cr, Mo, W)y with x ≈ y
[7]. In chromium-nickel austenitic steels, the σ-phase forms at first on triple points then on
grain boundaries and afterwards, after long term ageing on incoherent twin boundaries and
intragranular inclusions [27]. Barcik [41] reports that σ-phase in unstabilised 25Cr-20Ni steels
forms at the expense of M23C6, but also independently (directly from the austenite matrix).
Unstabilised refers to austenitic steels without carbide former elements such as niobium and
titanium which prevents intergranular corrosion. In the case of an independent σ-phase
formation, a chromium content in solid solution higher than 18% is necessary. In extra-low-
carbon 25Cr-20Ni steels such as 310L, σ-phase forms on the M23C6/austenite surface, with
increased free energy. A further investigation of Barcik [42] reveals that the solution
conditions influence the kinetics of σ-phase: In fine-grained austenitic steel (AISI 314) the
precipitation of σ is faster than in coarse-grained. This effect is also supported by Farooq et al.
in [43].
The σ-phase precipitates have very slow kinetics and the precipitate formation can take
several hundreds or thousands of hours. There are at least three reasons for the slow kinetics
[31]: (i) σ-phase starts to form after the carbides and nitrides are formed; (ii) the complex
crystal structure (TCP) which is very different from the parent austenite matrix; (iii) σ-phase
contains a lot of substitutional elements which have a slow diffusion. Furthermore, it is
reported in [31] that cold forming accelerates the σ-phase formation if there is
recrystallization during annealing treatment.
Typical chemical elements which promote the σ-phase are chromium, molybdenum and
silicon, while elements such as carbon and nitrogen suppress the σ-phase formation by
formation of carbides and nitrides [7].
The influence of σ-phase on the creep strength depends on the σ-phase distribution. Li et
al. [44] present that finely dispersed σ-phase mainly along grain boundaries and partially
inside grains increases the creep strength of a 25Cr-20Ni austenitic steel, whereas it is
expected that σ-phase in lumpy form, for example in commercial stainless steels, does not
increase the creep strength. The influence of σ-phase to the toughness is expected to be
detrimental. Minami et al. [45] reveal that a formation of σ-phase leads to reduction of
toughness. It is assumed that the precipitation of σ in 304H steel contributes mostly to a

Stojan Vujić Literature Review
14
reduction of impact value after ageing at 700°C up to 50,000h. Similar effects are obtained by
Sandström et al. [8] for a 310 austenitic steel. In [31] it is reported that σ-phase precipitation
depletes the parent matrix in chromium and molybdenum and thereby causes a dissolution
of carbides in this region. Since the chromium is most important for the corrosion resistance,
it is assumed that the depletion of chromium in the matrix (caused by σ-phase formation) has
a detrimental effect on the corrosion resistance.
In Table 5 the main properties of the σ-phase precipitates in the 25Cr-20Ni-Nb-N are
presented. An investigation of creep sample (700°C/69MPa/88,362.7h) reveals σ precipitates
on grain boundaries having a chemical composition (wt%) of 47.5Cr-42.7Fe-9.5Ni.
Table 5: σ-phase precipitates in 25Cr-20Ni-Nb-N austenitic steel.
Temp. [°C]
Time [h]
Shape Nucleation sites
Main chem. elements
Investigation method
Reference
700 88,363 - GB Cr, Fe TEM, EDS [36]
GB: Grain boundary
3.2.1.5 η-phase
In the literature less information is available about the η-phase. A detailed study about the
η-phase in 20Cr-25Ni-4.5Mo austenitic steel is done by Jargelius-Pettersson [46]. After ageing
at 850°C for 5 and 3,000h intra as well as intergranular η-phase (fcc structure) could be found.
The composition (wt%), is found to be 25-28Cr, 25-35Ni, 25-31Mo, 6-8Fe, 4.2-7.4Si. For η-
phase it is often given a composition of Cr3Ni2SiN or Cr3Ni2SiC. If the nickel content in η-phase
is larger than the chromium content, it is better to give the composition as M5SiN [46]. The
high silicon-content, fcc structure and lattice spacing of η-phase are similar to G-phase. These
makes it difficult to distinguish between η- and G-phase. However, the silicon-content (14
wt%) in G-phase is higher compared to η-phase and distinguishes the η-phase from the G-
phase [46].
3.2.1.6 G-Phase
The general notation of G-phase (fcc structure) is A16B6C7, where A and B are transition
elements and C a Group IV element such as silicon or germanium [47]. A detailed study about
the G-phase is done by Powell et al. [48]. They showed that in 20Cr-25Ni stabilized austenitic
steels component A is nickel, component B is mostly niobium with small amounts of iron and
chromium, and component C is silicon. Carbon is found to be not present in the G-phase.
Powell et al. [48] showed that the G-phase forms between 500 and 850°C, initially on grain

Stojan Vujić Literature Review
15
boundary Nb(C,N) and after longer ageing at Nb(C,N) inside the grains. This investigation
suggests that the presence of Nb(C,N) is required for formation of G-phase. It is reported that
the transformation from Nb(C,N) to G-phase is faster when the Nb(C,N) are located on the
grain boundaries, as a consequence of a higher diffusion along the grain boundaries.
In Table 6 the main properties of the G-phase precipitates in the 25Cr-20Ni-Nb-N are
presented. The G-phase is found after 17,237h and even after 75,075h at 650°C. This indicates
that G-phase is a very stable phase in the 25Cr-20Ni-Nb-N steel. The G-phase nucleates mainly
on grain boundaries and it consists mainly of chromium, nickel and silicon. The exact chemical
composition (wt%) of G-phase at ≈650°C/75,075h is found to be 58Cr-28Ni-5Si-4Fe-5others
[38] and at 650°C/149MPa/17,237h it is 54.9Cr-38.5Ni-3.1Si-2.2Fe [36].
Table 6: G-phase precipitates in 25Cr-20Ni-Nb-N austenitic steel.
Temp. [°C]
Time [h]
Shape Nucleation sites
Main chem. elements
Investigation method
Reference
650 17,237 - GB Cr, Ni, Si TEM, EDS [36]
≈650 75,075 - GB Cr, Ni, Si TEM, EDS [32], [38]
GB: Grain boundary
3.2.1.7 Precipitation kinetics model in MatCalc
MatCalc [10]–[12] has been used to model the nucleation, growth and coarsening of
precipitates in a multi-component and multi-phase system. The nucleation process in MatCalc
is based on the Classical Nucleation Theory (CNT) where the input quantities are given from
experiments or from theoretical models. The number of newly formed precipitates in MatCalc
is defined as the transient nucleation rate [10]:
𝐽 = 𝑁𝑜𝑍𝛽∗𝑒𝑥𝑝 (−𝐺∗
𝑘𝐵𝑇) 𝑒𝑥𝑝 (−
𝜏𝑖
𝑡) (1)
where the No is the number of potential nucleation sites, Z is the Zeldovich factor, β* is the
atomic attachment, G* is the critical nucleation energy, kB is the Boltzmann constant, T is the
absolute temperature, τi is the incubation time and t is the time.
The growth and coarsening process is treated separately for randomly distributed [10] and
grain boundary arranged [49] precipitates in MatCalc. For randomly distributed precipitates it
is assumed that the spherical precipitates are surrounded by spherical diffusion fields and the
Gibbs free energy for this system with n components and m precipitates can be written as
[10]:

Stojan Vujić Literature Review
16
𝐺 = ∑ 𝑁0𝑖𝜇0𝑖
𝑛
𝑖=1
+ ∑4𝜋𝜌𝑘
3
3(𝜆𝑘 + ∑ 𝑐𝑘𝑖𝜇𝑘𝑖
𝑛
𝑖=1
) + ∑ 4𝜋𝜌𝑘2𝛾𝑘
𝑚
𝑘=1
𝑚
𝑘=1
(2)
where N0i is the number of moles of component i in the matrix phase, μ0i is the
corresponding chemical potential, ρk is the radius of the precipitate with index k, λk is the
contribution of the elastic energy and plastic work due to the volume expansion of
precipitates, cki is the concentration of component i, μki the corresponding chemical potential
and γk is the precipitate/matrix interface energy. The Gibbs energy is well known to be
minimum at thermodynamic equilibrium. A real system is often in a non-equilibrated state;
driving forces for precipitation evolution exist which leads to a system where G is gradually
reduced. Each change of the microstructure process leads to a dissipation of free energy. In
MatCalc, three types of dissipations are considered [10]: dissipation by interface movement
Q1, dissipation by diffusion inside the precipitate Q2 and dissipation by diffusion inside the
matrix Q3. The dissipation due to interface movement can be written as:
𝑄1 = ∑4𝜋𝜌𝑘
2
𝑀𝑘�̇�𝑘
2
𝑚
𝑘=1
(3)
where Mk is the interface mobility and 𝜌�̇� is the growth rate of the precipitate k. The
dissipation by diffusion inside the precipitate can be expressed as:
𝑄2 = ∑ ∑ ∫𝑅𝑇
𝑐𝑘𝑖𝐷𝑘𝑖4𝜋𝑟2𝑗𝑘𝑖
2 𝑑𝑟𝜌𝑘
0
𝑛
𝑖=1
𝑚
𝑘=1
(4)
where R is the universal gas constant, cki the concentration, r is the particle radius (0 < r <
ρk), jki is the flux- and Dki is the diffusion- coefficient of component i in the precipitate k. The
dissipation by diffusion inside the matrix Q3 can be written as:
𝑄3 = ∑ ∑ ∫𝑅𝑇
𝑐0𝑖𝐷0𝑖4𝜋𝑟2𝐽𝑘𝑖
2 𝑑𝑟𝑍
𝜌𝑘
𝑛
𝑖=1
𝑚
𝑘=1
(5)
where Z is the mean distance between two precipitates, c0i is the concentration and D0i is
the diffusivity of element i in the matrix. Finally, the total dissipation is defined as Q =
Q1+Q2+Q3. According to the thermodynamic extremum principle [10], the growth rate and the
rate of change of chemical composition 𝑐𝑘𝑖̇ of the precipitate can be obtained.
In case that precipitates nucleate on the grain boundaries, the assumption with the
spherical diffusion field is not valid anymore. For the grain boundaries precipitates, two
different dissipation mechanisms are considered: dissipation due to diffusion in the grain

Stojan Vujić Literature Review
17
boundary Qg and dissipation due to diffusion in the grain Qb. The corresponding equations can
be found in [49].
3.2.2 Creep strength of austenitic steels
The creep rupture time of the 25Cr-20Ni-Nb-N steel (HR3C) is shown in Figure 4. The
temperatures of 650 and 750°C which are relevant for the present thesis are marked with
blue- and red-colour. The average creep rupture strength after 1,000h at 650°C is ≈250MPa
and at 750°C it is ≈110MPa.
Figure 4: Creep rupture times of HR3C austenitic steel (25Cr-20Ni-Nb-N) [24].
Figure 5 shows the influence of nickel, niobium and nitrogen on the creep strength of 25Cr-
20Ni-Nb-N. As it can be seen, the rupture strength is significantly increased with higher
nitrogen content. Niobium has the same effect. Samples without niobium have the lowest
rupture strength, when adding niobium the rupture strength is increased. The influence of
nickel on the rupture strength seems to be low compared to nitrogen and niobium.

Stojan Vujić Literature Review
18
Figure 5: Influence of nickel, niobium and nitrogen on the 1000 h creep rupture strength of 25Cr-20Ni-Nb-N (HR3C) [50].
Creep means a plastic deformation of material, at constant load and as a function of time.
Depending on the material, creep can take place at low and high temperature. Generally for
steels, temperatures higher than 0.4 solvus temperature are relevant for creep [7].
Creep strength means resistance against plastic deformation. Several hardening
mechanisms exist in the steels which contribute to the creep strength. It is reported by Bürgel
et al. [7] that at low temperature (below 0.4 solvus temperature) four hardening mechanisms
contribute to the strength: dislocation, fine grain, solid solution and precipitation
strengthening. At high temperature during creep (above of 0.4 solvus temperature) these
hardening mechanisms are particularly promised: the contribution from dislocation is
decreasing for long time exposure due to the recovery; contribution from fine grains is not
promising, a coarse grain is desirable; contribution from solid solution is decreasing with
increasing temperature; contribution from precipitates is most promising.
For the 25Cr-20Ni-Nb-N steel three main contributions to the creep strength are expected:
from dislocations, from precipitates and from elements in solid solution. These three
contributions are analysed by the creep strength modelling approach of Sandström et al. [13]–
[18] and are summarized in this chapter.
3.2.2.1 Dislocation hardening
Dislocations represent an effective barrier to the motion of other dislocations. To represent
this contribution to the strength, the development of the dislocation density have to be
understood. New dislocations are generated during work hardening at the same time as other

Stojan Vujić Literature Review
19
dislocations are annihilated due to recovery. According to the classical recovery model for
creep, there is a balance between work hardening and recovery during secondary creep. The
work hardening and the recovery can be modelled by the following equation for the strain
dependence of dislocation density ρ [14]:
𝑑𝜌
𝑑𝜀=
𝑚
𝑏𝐿− 2𝜏𝐿𝑀(𝑇, 𝜎)𝜌2/𝜀̇ (6)
where ε is the strain, b is Burger's vector, L is the "spurt" distance, which the dislocation
moves when it is released during deformation. m is the Taylor factor (3.06 for fcc materials),
τL the dislocation line tension, M the dislocation mobility, and �̇� the strain rate. The two terms
on the right hand side of the equation are the Orowan expression for the work hardening, and
the static recovery term. The spurt distance L can be assumed to be of the order of the
subgrain size, i.e. after a dislocation link has been released, it is primarily stopped by the
subgrain boundaries. In fact, for single crystals it has been demonstrated that the spurt
distance is controlled by the subgrain size [51], [52]. The subgrain diameter (dsub) can in turn
be related to the stress and dislocation density [14].
𝐿 = 𝑑𝑠𝑢𝑏 =𝐾𝐺𝑏
𝜎=
𝐾
𝛼𝑚𝜌1/2 (7)
where α is a constant and G the shear modulus. The constant K is about 20 for austenitic
stainless steels [53]. In deriving eq. (7), the Taylor equation is used.
𝜎𝑑𝑖𝑠𝑙 = 𝑚𝛼𝐺𝑏√𝜌 (8)
In the relation for the subgrain size in eq. (7), it is usually assumed that the total creep
stress should be applied. However, as it will be seen below, the total and the dislocation
stresses are of the same order of magnitude, so no distinction is made between them in the
expression for the spurt distance.
For stationary conditions where dρ/dε=0, eq. (6)-(8) gives
𝜀�̇�𝑖𝑛 =2𝑏𝐾𝜏𝐿
𝛼𝑚2𝑀(𝑇, 𝜎𝑑𝑖𝑠𝑙) (
𝜎𝑑𝑖𝑠𝑙
𝛼𝑚𝐺𝑏)
3
(9)
If the stress dependence of the mobility M is not considered, eq. (9) is a Norton equation
with a creep exponent of 3. At very high temperatures this might be a satisfactory
approximation. If only climb is considered, Hirth and Lothe give the following expression for
the mobility [54]
𝑀𝑐𝑙𝑖𝑚𝑏(𝑇, 𝜎) =𝐷𝑠0𝑏
𝑘𝐵𝑇𝑒𝑥𝑝 (
𝜎𝑏3
𝑘𝐵𝑇) 𝑒𝑥𝑝 (−
𝑄
𝑅𝑇) (10)

Stojan Vujić Literature Review
20
where T is the temperature, Ds0 the pre-exponential coefficient for self diffusion, Q the
activation energy for self diffusion, b the Burgers vector, kB the Boltzmann’s constant, and R
the gas constant. The lattice diffusion coefficient is used. It has been shown that pipe diffusion
is negligible for 20Cr-25Ni-Nb-N at investigated temperatures [55]. The stress dependence in
(10) is small. It is well established that the creep exponent can be much higher than three to
five at lower temperatures, which is referred to as the power-law break down regime. By
taking glide into account a strongly stress dependent dislocation mobility is obtained that is
applicable also in the power-law break down regime [16], [18]:
𝑀(𝑇, 𝜎) =𝐷𝑠0𝑏
𝑘𝐵𝑇𝑒𝑥𝑝 (
𝜎𝑏3
𝑘𝐵𝑇) 𝑒𝑥𝑝 (−
𝑄
𝑅𝑇[1 − (
𝜎
𝜎𝑚𝑎𝑥)
2
]) /𝑓𝑠𝑜𝑙 (11)
σmax is taken as the tensile strength at ambient temperatures and fsol a constant that takes
the influence of elements in solid solution into account. All the other parameters are readily
available. By combining eq. (9) and (11) an expression for the secondary creep rate as a
function of stress is obtained. By solving this expression for the stress at a given strain rate by
iteration, the dislocation contribution to the creep strength is obtained.
3.2.2.2 Precipitation hardening
Traditionally, the contribution from precipitation hardening to the creep strength is
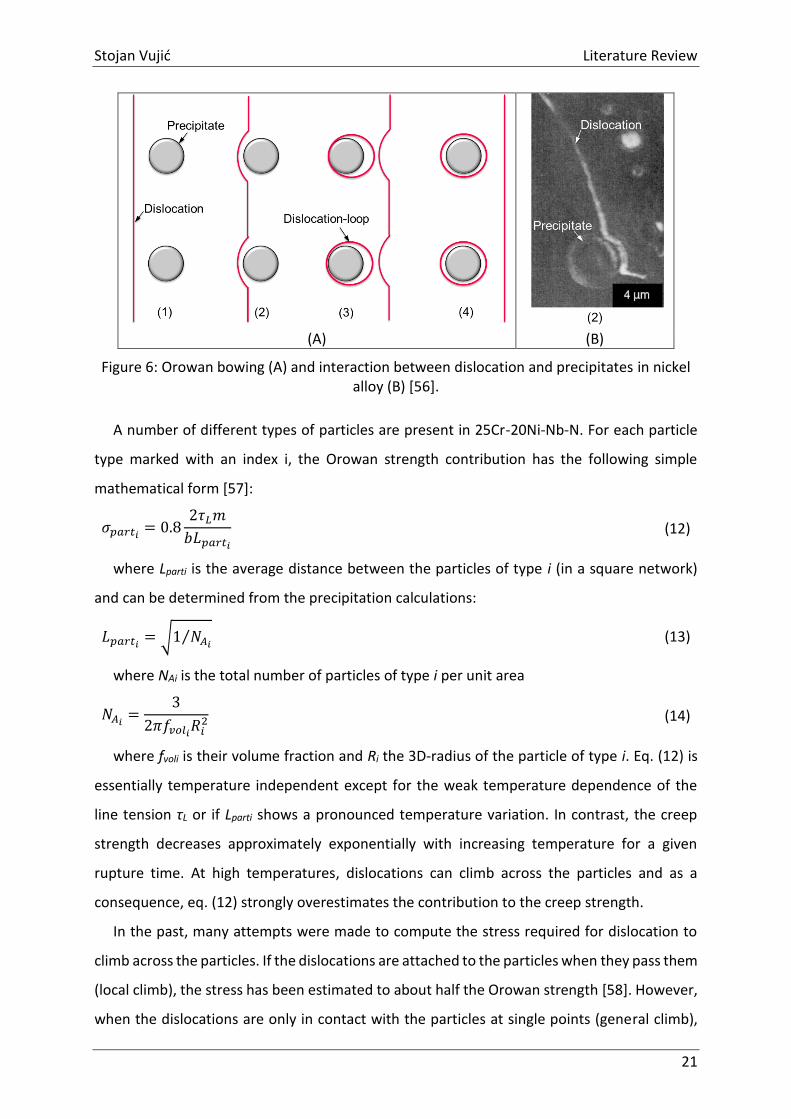
estimated based on Orowan bowing of dislocations around the particles. In Figure 6(A) a
schematic dislocation bypassing of non-scherable precipitate is shown. Driven by shear stress
the dislocation moves against two precipitates (1). The bowing of dislocation starts after the
contact between dislocation and precipitates (2), see also Figure 6(B). This bowing is present
until the dislocation loops around the precipitates (3). After bypassing, dislocation loops
remain around the precipitates (4).
Stojan Vujić Literature Review
21
(A) (B)
Figure 6: Orowan bowing (A) and interaction between dislocation and precipitates in nickel alloy (B) [56].
A number of different types of particles are present in 25Cr-20Ni-Nb-N. For each particle
type marked with an index i, the Orowan strength contribution has the following simple
mathematical form [57]:
𝜎𝑝𝑎𝑟𝑡𝑖= 0.8
2𝜏𝐿𝑚
𝑏𝐿𝑝𝑎𝑟𝑡𝑖
(12)
where Lparti is the average distance between the particles of type i (in a square network)
and can be determined from the precipitation calculations:
𝐿𝑝𝑎𝑟𝑡𝑖= √1 𝑁𝐴𝑖
⁄ (13)
where NAi is the total number of particles of type i per unit area
𝑁𝐴𝑖=
3
2𝜋𝑓𝑣𝑜𝑙𝑖𝑅𝑖
2 (14)
where fvoli is their volume fraction and Ri the 3D-radius of the particle of type i. Eq. (12) is
essentially temperature independent except for the weak temperature dependence of the
line tension τL or if Lparti shows a pronounced temperature variation. In contrast, the creep
strength decreases approximately exponentially with increasing temperature for a given
rupture time. At high temperatures, dislocations can climb across the particles and as a
consequence, eq. (12) strongly overestimates the contribution to the creep strength.
In the past, many attempts were made to compute the stress required for dislocation to
climb across the particles. If the dislocations are attached to the particles when they pass them
(local climb), the stress has been estimated to about half the Orowan strength [58]. However,
when the dislocations are only in contact with the particles at single points (general climb),

Stojan Vujić Literature Review
22
the stress is negligibly small [59]. It has been convincingly shown that general climb is the
energetically favourable case [60]. It can be concluded that there is no stress barrier for
dislocations to climb across particles.
The solution to this dilemma is to assume that it is the time it takes for the dislocation to
climb across the particles that decides whether a particle will be climbed or not. More
specifically the following assumptions have to be made [61], [62]:
The controlling mechanism is the time it takes for a dislocation to climb across a
particle.
A critical radius rcrit is introduced, which is the maximum particle size where there
is sufficient time for dislocations to climb across particles during the design life.
For smaller particles (r< rcrit) there is sufficient time for the dislocation to climb
across them. These particles will not contribute to the strength.
Larger particles have to be passed by Orowan bowing.
Figure 7 shows a schematic illustration of particle passing mechanisms at high temperature.
Most of the particles in the present austenitic steel are incoherent (due to large size and/or
different crystal structure compared to the austenite matrix) and will be therefore passed by
climbing and Orowan bowing. In the present creep strength modelling approach it is assumed
that precipitates smaller than the critical radius rcrit do not contribute to the creep strength,
whereas precipitates larger than rcrit contribute to the creep strength by Orowan bowing. The
critical radius rcrit increases with decreasing applied stress, increasing temperature and
increasing creep time.

Stojan Vujić Literature Review
23
Figure 7: Particles passing mechanisms at high temperature for (A) coherent and incoherent particles, (B) only incoherent particles and (C) incoherent particles with radius smaller/larger
than critical radius rcrit. Compiled by author and based on [61], [62].
The contribution of larger particles (larger than rcrit) to the strength is obtained with the
Orowan mechanism
𝜎𝑝𝑎𝑟𝑡𝑖= 0.8
2𝜏𝐿𝑚
𝑏𝐿𝑟𝑐𝑟𝑖𝑡𝑖
(15)
where Lrcriti is the average interparticle distance for particles larger than rcriti for particle
type i. For 25Cr-20Ni-Nb-N and other materials, the size distributions often have an
exponential form [13].
𝑛𝐴𝑖(𝑟) = 𝑁𝐴𝑖
𝑒𝑥𝑝(−𝛽𝑖(𝑟 − 𝑟0𝑖)) (16)
where NAi is the total number of particles of type i per unit area, and nAi(r) the number of
particles larger than r. r is the particle size, r0 the smallest accurately recorded particle size,
and βi a constant, that is taken as the inverse (average) particle radius.
The critical radius can be computed as the available time for climb tclimb multiplied by the
climb velocity νdisl of the dislocations, which can in turn be expressed with the help of the climb
mobility.
2𝑟𝑐𝑟𝑖𝑡 = 𝑡𝑐𝑙𝑖𝑚𝑏𝜐𝑑𝑖𝑠𝑙 = 𝑡𝑐𝑙𝑖𝑚𝑏𝑏𝑀𝑐𝑙𝑖𝑚𝑏𝜎 (17)
The available climb time can be taken as half the design life. The interparticle spacing Lrcriti
can then be determined with the help of eqs. (16) and (17). For a square network of particles
we find that

Stojan Vujić Literature Review
24
𝐿𝑟𝑐𝑟𝑖𝑡𝑖= √1 𝑛𝐴𝑖
(𝑟𝑐𝑟𝑖𝑡𝑖)⁄ (18)
To sum the strength contributions from different particles types, σparti, the squares of the
individual contributions are added [63]. The total contribution is then given by
𝐿𝑝𝑎𝑟𝑡𝑡𝑜𝑡= 1 √∑ 1 𝐿𝑝𝑎𝑟𝑡𝑖
2⁄
𝑖
⁄ 𝜎𝑝𝑎𝑟𝑡𝑡𝑜𝑡= √∑ 𝜎𝑝𝑎𝑟𝑡𝑖
2
𝑖
(19)
3.2.2.3 Solid solution hardening
3.2.2.3.1 Substitutional elements
Due to lattice misfit, elements in solid solution give rise to a hardening effect that increases
the creep strength. This section gives a summary of models that are presented in detail
elsewhere [13], [15]. The maximum interaction energy between a solute and an edge
dislocation can be expressed as
𝑈𝑖𝑚𝑎𝑥 =
1
𝜋
(1 + 𝜈)
(1 − 𝜈)𝐺Ω0𝜀𝑖
𝑏
𝑟𝑠𝑜𝑙 (20)
where G is the shear modulus, is the Poisson’s ratio, b is Burgers' vector,0 is the atomic
volume in the host alloy, rsol is the distance from the solute to the centre of the dislocation,
and i is the linear atomic size misfit parameter of solute i
𝜀𝑖 =𝜕𝑎
𝑎𝜕𝑐𝑖 (21)
a is the lattice parameter, and ci the concentration of the solute element i. For the
austenitic stainless steel 23Cr-25Ni-W-Cu-Co, the lattice misfit parameters i have been
computed with first-principles methods [15]. The solute is believed to be quite close to the
centre of the dislocation and a value of rsol = 2b/3 has been assumed. This might somewhat
overestimate the interaction energy, since this distance is smaller than what is typically found
for the core radius of the dislocations in first-principles calculations [64]. The resulting value
for the misfit parameter for Nb is i =0.253. With a Poisson's ratio = 0.3, the shear modulus
G = 52.5 MPa, and the atomic volume 0 = 1.21 ×10⁻²⁹ m3, we find that
𝑈𝑖𝑚𝑎𝑥 = 339𝜀𝑖(𝑘𝐽 𝑚𝑜𝑙⁄ ) (22)
This gives an interaction energy of 85.8 kJ/mol. The concentration of solutes around non-
moving (static) dislocations cistat can be formulated as [54].
𝑐𝑖𝑠𝑡𝑎𝑡 = 𝑐𝑖
0𝑒𝑥𝑝(−𝑈𝑖(𝑥, 𝑦) 𝑘𝐵𝑇⁄ ) (23)

Stojan Vujić Literature Review
25
where ci0
is the concentration of solute i in solid solution, kB Boltzmann’s constant and T
the absolute temperature. (x,y) are the Cartesian coordinates of the position of the solute
relative to an edge dislocation, which is climbing in the y-direction. The concentration of
solutes around a moving dislocation cidyn gives a slightly more complicated formula [54]
𝑐𝑖𝑑𝑦𝑛
=𝜐𝑑𝑖𝑠𝑙𝑐𝑖
0
𝐷𝑖𝑠𝑜𝑙 𝑒𝑥𝑝 (−
𝑈𝑖(𝑥, 𝑦)
𝑘𝑇−
𝜐𝑑𝑖𝑠𝑙𝑦
𝐷𝑖𝑠𝑜𝑙 ) ∫ 𝑒𝑥𝑝 (
𝑈𝑖(𝑥, 𝑦′)
𝑘𝑇+
𝜐𝑑𝑖𝑠𝑙𝑦′
𝐷𝑖𝑠𝑜𝑙 ) 𝑑𝑦′
𝑦
−∞
(24)
where vdisl is the velocity of the dislocation, and Disol the diffusion coefficient for the solute
i. vdisl is given by eq. (17). The presence of solutes gives rise to a drag stress on the dislocations,
which reduces the climb rate and increases the creep strength. The drag stress can be
expressed as [54]
𝜎𝑖𝑑𝑟𝑎𝑔
=𝐹
𝑏𝐿=
𝑘𝑇𝜐
𝑏𝐷𝑖∫
(𝑐𝑖 − 𝑐𝑖0)2
𝑐𝑖𝑑𝐴
𝐴
(25)
where σidrag is the drag stress from solute i, F the force per unit length L of the dislocation
and A the area surrounding the dislocation. It has been shown that the static solution in eq.
(23) can be used to compute the integral in (25) [15], [54]. The solution is
𝜎𝑖𝑑𝑟𝑎𝑔
=𝜐𝑐𝑜𝛽2
𝑏𝐷𝑖𝑘𝐵𝑇𝐼(𝑧0) (26)
where z0=/r0kBT and the integral I(z0) is
𝐼(𝑧0) = ∫2√2𝜋
3
𝑧0
1
𝑧−5 2⁄ 𝑒𝑧𝑑𝑧 (27)
I(z0) can be computed numerically.
It is evident from Figure 30 on page 64 that the distribution of solutes is sharply peaked
around the dislocations. When the dislocations move, the solutes have to jump in and out of
the cloud. This requires an activation energy in addition to that for the self-diffusion during
climb. As an effect, the creep rate is lowered by the factor
𝑓𝑠𝑜𝑙 = exp (− 𝑄𝑠𝑜𝑙 𝑘𝑇)⁄ (28)
Consequently, solid solution hardening raises the activation energy for creep. This explains
why the activation energy for creep of austenitic stainless steels is considerably larger than
that for self-diffusion. Qsol is chosen as the maximum interaction energy Uimax from eq. (20).

Stojan Vujić Literature Review
26
3.2.2.3.2 Interstitial elements
It is well-known that nitrogen raises the creep strength, see for example [65]. As it will be
demonstrated in section 5.3.1, nitrogen-containing precipitates significantly contribute to the
creep strength. However, a contribution from solid solution hardening from nitrogen can also
be expected. In this case, eq. (26) cannot be applied. In fact, it gives a negligible contribution
for interstitial elements due to their fast diffusion. In spite of this, fast diffusion elements can
give a significant contribution to the creep strength. This has been demonstrated for
phosphorus in copper, where only 50 wt. ppm P gives a large increase in the creep strength
[15], [18]. It appears that the small elements are locked to the dislocation, and that a break
stress is needed to make the dislocations move, which gives the solid solution hardening. The
break stress break was derived in ref. [18]
𝜎𝑏𝑟𝑒𝑎𝑘 =𝑈𝑖
𝑚𝑎𝑥
𝑏3∫ 𝑐𝑖
𝑑𝑦𝑛
𝑦𝑟
𝑦𝑙
𝑑𝑦 (29)
The integral in (29) (L and R stand for left and right) is performed over the solute
distribution such as the one in Figure 30 on page 64. It is the dynamic content according to eq.
(24) that should be applied in eq. (29). For nitrogen, it is possible to estimate the lattice misfit
parameter from how the element affects the lattice parameter. Data for very large nitrogen
contents [66] have been used. The resulting value for the linear misfit parameter is i = 0.025.
3.2.2.4 Total creep strength
The total creep strength of 25Cr-20Ni-Nb-N steel is obtained by adding the contributions
from the different mechanisms. The predicted total creep strength is called appl
𝜎𝑎𝑝𝑝𝑙 = 𝜎𝑑𝑖𝑠𝑙 + 𝜎𝑃𝐻 + 𝜎𝑠𝑜𝑙 + 𝜎𝑠𝑜𝑙𝑁 (30)
where the σdisl is the contribution from dislocation, σPH from precipitates, σsol solid solution
and σsolN solid solution from N. The appl should be directly comparable with the measured
creep rupture strength σexp.

27
4.1 The 25Cr-20Ni-Nb-N austenitic steel
For the investigations six samples are used. The samples (10x10x2mm) were extracted from
a solution treated (at 1230°C) and cold finished seamless tube produced by extrusion. An
ageing treatment at 650 and 750°C for 1,000, 3,000 and 10,000h is applied by
Forschungszentrum Jülich. A grain size of 22µm is measured by the KTH Stockholm. The
chemical composition is presented in Table 7.
Table 7: Chemical composition (wt%) of 25Cr-20Ni-Nb-N steel.
Fe C Cr Si P Ni Nb Mn N S O
51.9 0.062 24.7 0.38 0.017 20.6 0.44 1.2 0.1819 <0.0005 0.0162
4.2 Microstructure Investigation Methods
4.2.1 Scanning Electron Microscope (SEM)
The scanning electron microscope (SEM) is mainly used for the investigation of the
precipitates composition, distribution as well as nucleation sites of large precipitates like
M23C6 and σ-phase. The samples for the SEM investigations are mechanically grinded, polished
and electrolytically etched. The electrolytic etching is performed with a 10% solution of oxalic
acid in distilled water at 3 volts for 10 to 60s. The chemical composition of the precipitates is
measured by EDS. In order to compare the precipitation evolution calculation with
experimental data, the experimental mean radii and phase fractions of the precipitates are
the most convenient data. For the comparison it is necessary to convert the measured area
fraction of the precipitates into phase fractions. This is done by the standard method
4 Material and Experimental

Stojan Vujić Material and Experimental
28
described in [67]. The SEM investigations are performed by the KTH Stockholm with a JEOL
7000F SEM equipped with EDS system.
The investigation of the modified 25Cr-20Ni-Nb-N steel (see chapter 6.4 on page 87) is
performed at the Institute of Material Science and Welding (IWS). The samples of the modified
steel are mechanically grinded and afterwards vibration polished using Bühler Vibromet 2 with
an OP-AA (Acidic Alumina) suspension for high-alloy steels. Furthermore, the samples are
investigated using a LEO 1450 VP scanning electron microscope. Due to the low resolution of
this SEM, the observation was restricted to the phase fraction and radius of primary Z-phase
precipitates and the presence of grain boundary precipitates.
4.2.2 Transmission Electron Microscope (TEM)
The transmission electron microscope (TEM) is mainly used for the investigation of the
precipitates composition of smaller precipitates such as secondary Z-phase and MX
precipitates. The TEM investigations are performed with carbon replicas. The TEM samples
are mechanically grinded, polished and chemically etched in a solution of 40% HCl, 20% HNO3
in distilled water at 60°C for 10s. The carbon replicas are evaporated with carbon onto
chemically etched specimens followed by the dissolution of the metallic matrix in a solution
of 40% HCl, 20% HNO3 in distilled water at 60°C. The chemical composition of the precipitates
is measured by EDS. The TEM investigations are performed by the KTH Stockholm with a JEOL-
TEM (200kV) equipped with EDS system. It has to be mentioned that the phases have been
identified with the help of the SEM- and TEM- EDS system. No electron diffraction has been
performed. The uncertainties with EDS for smaller precipitates are particularly significant,
therefore the results should be interpreted with some caution.
4.3 Thermodynamic and Thermokinetic Calculations
The calculation of the precipitation evolution is a quite complex process with several steps.
A general overview of a procedure for a precipitation calculation is given in Figure 8. The first
step is an equilibrium calculation where the thermodynamic equilibrium phase fractions
versus temperature, solvus temperatures and transformation points are calculated. The
second step is a Scheil-calculation [68]–[70] where the effect of the segregation processes
during solidification on the formation of the precipitates is calculated. The main output of the
Scheil calculation is the phase fraction of primary precipitate phases versus temperature
during cooling down after melting. The third step is the precipitation kinetic calculation. Since

Stojan Vujić Material and Experimental
29
precipitation kinetic simulations are generally restricted to the formation of particles due to
diffusional processes in solid materials, primarily formed precipitates have to be considered
separately. For this reason, the calculated data on the primary precipitates (from Scheil
calculation) have to be used as input data for the precipitation calculation. Additionally to the
primarily formed precipitates, the heat treatment, grain size, nucleation sites, dislocations
density and precipitates shape factor have to be known. These additional input data can be
obtained by experimental investigation or literature research.
Figure 8: General procedure for precipitation calculation (input parameters are marked in blue and evaluation parameters in purple).
4.3.1 Setup for Equilibrium and Scheil Calculations
The equilibrium and Scheil [68]–[70] calculations are performed with the MatCalc version
5.52 (rel 1.010) and the thermodynamic database mc_fe_v2.016. The N(bC,N) and Cr2N phases
are not defined as a separate phase in the MatCalc database, only their parent phase can be
selected. As consequence, the elements for Nb(C,N) and Cr2N have to be defined by the
command “composition set”. Niobium, carbon and nitrogen are defined for Nb(C,N), whereas
chromium and nitrogen are defined for Cr2N.
For the Scheil calculation, only back diffusion of carbon and nitrogen was allowed, all other
elements were assumed not diffusing during cooling. These conditions meet the situation for
a broad bandwidth of medium cooling rates.

Stojan Vujić Material and Experimental
30
4.3.2 Setup for Precipitation Calculations
The precipitation kinetics calculations are performed with the MatCalc version 5.52 (rel
1.010), the thermodynamic database mc_fe_v2.016 and the diffusion database
mc_fe_v2.005. The precipitation evolution calculation is performed by MatCalc script which is
shown in the Appendix on page 113.
For the precipitation kinetics calculations, eight precipitates are considered: M23C6, σ-
phase, primary Z-phase, secondary Z-phase, primary Nb(C,N), secondary Nb(C,N), η (Cr3Ni2SiN)
and G-phase. Since precipitation kinetic simulations are generally restricted to the formation
of particles due to diffusional processes in solid materials, primarily formed precipitates have
to be considered separately. For this reason, the calculated data on the primarily formed
precipitates (from Scheil calculation) have to be used as input data for the precipitation
calculation. By analysing micrographs, the nucleation sites for different types of precipitates
are partly identified as described in Table 8 on page 42. Grain boundaries are defined as
nucleation sites for M23C6, Cr3Ni2SiN and G-phase, see Figure 9. It has to be mentioned that G-
phase was not found experimentally, but it was reported in [32], [38] to nucleate on grain
boundaries. The nucleation of M23C6 at grain-, twin-boundaries and slip bands is taken into
account in the following way: since twin boundaries and slip bands as nucleation sites are not
available in MatCalc, subgrain boundary corners which are expected to have a similar density,
are selected as a substitute. σ-phase is considered to nucleate at grain boundary corners which
is in agreement with the observations. The nucleation sites of secondary Nb(C,N) and Z-phase
are defined to be at dislocations.
It is reported in [32], [38] that the Z phase has an elongated shape, so that a shape factor
(relation length/width) of 3 is defined for Z phase. The same applies to M23C6 where also a
shape factor of 3 is used.

Stojan Vujić Material and Experimental
31
Figure 9: Nucleation sites of precipitates. GB: Grain boundary; D: Dislocation; GC: Grain corner; SBC: Subgrain boundary corner. Compiled by author and based on [71].
The interfacial energies for the particles are calculated automatically by the GBB (General
Broken-Bond) model [72]. Since the ageing temperatures of 750°C is close to the σ-phase
solution temperature (800°C according to equilibrium calculation), it is assumed that the σ-
phase interface becomes diffuse [73] and therefore an interface energy correction of 0.45 for
750°C was applied. No correction of σ-phase interface energy for 650°C is applied.
The experimentally measured value of 22μm is used for the grain size. Since the extrusion
process causes a strong plastic deformation, a dislocation density for the austenite matrix is
set to 1x10¹²m-2.
The investigated austenitic steel passed several different temperature cycles during the
manufacturing process of the tube. When the precipitation evolution is simulated, only the
solution annealing is considered, but not the previous applied temperature cycles from the
manufacturing process. There are several reasons why the manufacturing process is not
considered, some of them are (i) process parameters such as heating-, cooling-rates and
holding times are not given by the manufacturer, (ii) no records of temperature profile were
found. Only the solution annealing heat treatment is known, and thus is considered for the
precipitation evolution. However, by discussion with some manufacturers it was tried to
estimate the temperature profile during the manufacturing route. When this estimated
temperature cycle was applied, no significant differences in precipitation evolution during
service were observed. The main reason for that was that most of the precipitates (except
Nb(C,N) and primary precipitates) are dissolved during the solution annealing and thus the
previous applied temperature cycle becomes unimportant. Only the Nb(C,N) precipitates
became a bit larger, but this was not significant. Due to the low influence of the estimated
σGC
Z
Primary
Nb(C,N)D
ZD
Secondary
Nb(C,N)
Primary
M23C6SBC
M23C6GB
GGB
ηGB
(Cr3Ni2SiN)

Stojan Vujić Material and Experimental
32
temperature cycle and significant higher calculation time it was decided to not consider the
manufacturing process.
The studied heat treatment is shown in Figure 10 and consists of five segments: heating to
solution temperature, solution annealing at 1230°C for 10min, quenching, heating to service
temperature and ageing at 650 and 750°C for 100,000h.
Figure 10: Applied heat- and service- treatment for the precipitation calculation.
4.4 Creep strength modelling
A basic overview of the applied creep strength modelling procedure for austenitic steels at
e.g. 650°C is shown in Figure 11. Three main contributions to the creep strength are expected:
from dislocations, from precipitates and from elements in solid solution. The rupture
elongation has to be known in order to calculate the dislocation hardening. In the case of the
HR3C a rupture elongation of εr=20% is assumed, which is a typical value for austenitic
stainless steels. This value does not have a large influence on the results as long as the stress
exponent is high. So a typical εr can be assumed and kept constant for different stresses and
temperatures such as 650 and 750°C. The precipitation and solid solution hardening were
calculated using the results from the precipitation and equilibrium calculations.

Stojan Vujić Material and Experimental
33
Figure 11: Overview of creep strength modelling procedure for austenitic steels at e.g. 650°C. εR refers to the rupture elongation of austenitic steels and tr to the creep rupture
time.


35
5.1 Microstructure
5.1.1 Microstructure at 650°C
Samples aged at 650°C for 1,000, 3,000 and 10,000h reveal five different precipitates: Z-
phase, M23C6, Nb(C,N), η (Cr3Ni2Si(C,N)) and σ-phase. Additionally, two different oxides are
found: Al- and Si-oxide.
Considering the Z-phase, two different populations of Z-phase are observed: a primary one
with a mean diameter of up to 3.5µm, see Figure 12(A), and a secondary one with a diameter
of several nanometres. The shape of the primary one is irregular, it varies between round- and
square-shape. An elongated cluster of primary Z-phase precipitates is often observed. The
Nb(C,N) precipitates are mainly round shaped. Its diameter varies from several nanometres
up to ≈380nm, see Figure 12(B). The M23C6 are mainly observed at grain boundaries, but at
longer ageing times also at twin boundaries and slip bands. The shape of the M23C6 is
sometimes found to be cubic, but mainly elongated as can be seen in Figure 13(Spectrum1,
2).
The nucleation sites and shape of the η-phase is found to be similar to M23C6. Significant
amounts of σ-phase are only found after longer ageing times (after 5,000h). The σ-phase is
found mainly on triple points of grain boundaries having a mean diameter of ≈2.8µm after
10,000h at 650°C. Only fiew oxides are found, in Figure 12(A) an Al-oxide (1) and in Figure
12(B) two Si-oxides (Spectrum 1, 3) are shown.
5 Results and Discussion

Stojan Vujić Results and Discussion
36
Figure 12: SEM image of 650°C/1,000h (A) and TEM image of 650°C/3,000h (B) aged sample. A-1: Al-oxide; A-2: primary Z-phase; Spectrum 1, 3: Si-oxide; Spectrum: 2, 4: Nb(C,N).
Figure 13: TEM replica of 650°C/10,000h aged sample. Spectrum 1-2: M23C6; Spectrum 3: Nb(C,N).
The phase fractions and mean radii of precipitates are the most convenient data to evaluate
the precipitation calculation. The SEM investigations are used to obtain these parameters for
the M23C6 and σ-phase precipitates. Unfortunately, due to time constraints and resolution
limit of the SEM, other precipitates could not be evaluated. As shown in Figure 14, the phase
fractions and mean radii of M23C6 and σ-phase precipitates are increasing with increasing
ageing time.

Stojan Vujić Results and Discussion
37
Figure 14: Measured phase fractions (A) and mean radii (B) of M23C6 and σ-phase at 650°C.
5.1.2 Microstructure at 750°C
Samples aged at 750°C for 1,000, 3,000 and 10,000h reveal five different precipitates: Z-
phase, M23C6, Nb(C,N), η (Cr3Ni2Si(C,N)), σ-phase. Additionally, two different oxides are found:
Al- and Si-oxide.
The nucleation sites and shapes of the precipitates at 750°C are found to be similar to
650°C. Only a difference in the precipitates size is found, which is significantly larger at 750°C
compared to 650°C. Especially the presence of σ-phase is more significant at 750°C compared
to 650°C. In Figure 15 (A) a significant amount of σ-phase is observed in steel aged at 750°C
for 1,000h. Its mean size is 1.73µm. Similar to the 650°C aged samples, also in 750°C samples
an elongated cluster of primary Z-phase precipitates is often observed, as shown in Figure
15(A-2). A TEM micrograph of the specimen aged for 1000h at 750°C taken from a carbon
extraction replica is shown in Figure 15 (B). The large precipitates in Figure 15(B-1) are Nb(C,N)
with a diameter of 145nm.
Figure 15: SEM image of 750°C/1,000h (A) and TEM image of 750°C/1,000h (B) aged sample. A-1: σ; A-2: primary Z-phase; B-1: Nb(C,N).
M23C6(exp)
σ(exp)
0
0.2
0.4
0.6
0.8
1
1.2
1.4
1.6
1.8
2
1000 3000 5000 7000 9000 11000
Ph
ase
fra
ctio
n /
%
Time / hA
M23C6(exp)
σ(exp)
0
200
400
600
800
1000
1200
1400
1600
1800
2000
1000 3000 5000 7000 9000 11000
Me
an r
adii
/ n
m
Time / hB

Stojan Vujić Results and Discussion
38
After 10,000h at 750°C, a M23C6 film along the grain boundaries is observed, as it can be
seen in Figure 16.
The evolution of the phase fraction and mean radii of the M23C6 and σ-phase precipitates
is shown in Figure 17. Both precipitates show an increase of phase fraction with increasing
ageing time until 10,000h. Similar observations are made for the evolution of the mean radii
of σ-phase, but not for M23C6 where the mean radii remain constant between 3,000 and
10,000h.
Figure 16: M23C6 (1) precipitates at grain boundaries at 750°C after 10,000h.
Figure 17: Phase fraction (A) and mean radii (B) of M23C6 and σ-phase at 750°C.
5.1.3 Precipitates composition
The chemical compositions of the precipitates are investigated by TEM-EDS and SEM-EDS.
It has to be mentioned that the TEM-EDS measurements are performed on carbon replicas
where the accuracy is higher compared to SEM-EDS. The SEM-EDS technique is more suitable
for larger precipitates like primary Z-Phase and σ-phase where the influence of the
M23C6(exp)
σ(exp)
0.6
0.8
1
1.2
1.4
1.6
1.8
2
2.2
2.4
1000 3000 5000 7000 9000 11000
Ph
ase
fra
ctio
n /
%
Time / hA
M23C6(exp)
σ(exp)
0
500
1000
1500
2000
2500
3000
3500
4000
4500
5000
1000 3000 5000 7000 9000 11000
Me
an r
adii
/ n
m
Time / hB

Stojan Vujić Results and Discussion
39
surrounding matrix is lower. The SEM-EDS investigation of smaller precipitates like M23C6 and
η-phase have to be treated with caution.
The TEM-EDS and SEM-EDS analyses, as shown in Figure 18 and Figure 19 respectively,
depict a strong scattering of the precipitates composition as well as differences in the
composition between 650°C and 750°C aging temperatures. However, some observations can
be made. Looking at the TEM-EDS results of M23C6 in Figure 18, it can be seen that chromium
(≈80%) is the main element and that niobium content decrease (from ≈15% to almost 0%) with
increasing ageing time. When Nb(C,N) is analysed, it can be seen that niobium (≈60%) is the
main element and that chromium content is decreasing (from ≈30% to smaller than 10%) with
increasing ageing time. The main elements of the Z-phase (secondary) are niobium (50 – 60%)
and nickel (20-30%). The main elements of the η-phase are chromium (40-50%) and nickel (30-
40%).

Stojan Vujić Results and Discussion
40
Figure 18: Chemical composition (wt.%) of precipitates measured by TEM-EDS.
Looking at the SEM-EDS results of the Z-phase (primary) in Figure 19, it can be seen that
the main elements are niobium (up to 65%), chromium (10-30%) and nickel (5-15%). The
composition of the σ-phase seems to be constant during the whole ageing time, it is ≈40-45%
chromium and ≈10% nickel. The SEM-EDS analysis of the M23C6 and η-phase has to be treated
with caution, since these precipitates are small and the influence of the surrounding matrix
becomes large.
Cr 650°C
Cr 750°C
Nb 650°C
Nb 750°C
Ni 650°C
Ni 750°C
0
10
20
30
40
50
60
70
80
90
100
0 2000 4000 6000 8000 10000
Co
mp
osi
tio
n /
wt%
Time / hM23C6
650°C750°C
Cr 650°C
Cr 750°C
Nb 650°C
Nb 750°C
Ni 650°CNi 750°C0
10
20
30
40
50
60
70
80
90
100
0 2000 4000 6000 8000 10000
Co
mp
osi
tio
n /
wt%
Time / hNb(C,N)
650°C750°C
Cr 650°CCr 750°C
Nb 750°C
Ni 750°C
Nb 650°C
Ni 650°C
0
10
20
30
40
50
60
70
80
90
100
0 2000 4000 6000 8000 10000
Co
mp
osi
tio
n /
wt%
Time / hZ-phase
650°C750°C
Cr 650°CCr 750°C
Nb 650°C Nb 750°C
Ni 650°CNi 750°C
0
10
20
30
40
50
60
70
80
90
100
0 2000 4000 6000 8000 10000
Co
mp
osi
tio
n /
wt%
Time / hη-phase
650°C750°C

Stojan Vujić Results and Discussion
41
Figure 19: Chemical composition (wt%) of precipitates measured by SEM-EDS.
5.1.4 Discussion
Samples aged at 650 and 750°C for 1,000, 3,000 and 10,000h reveal five different
precipitates: Z-phase, M23C6, Nb(C,N), η (Cr3Ni2Si(C,N)), σ-phase. Additionally to that, two
different oxides are found: Al- and Si-oxide. A summary of all observed precipitates is
presented in Table 8. Most of these precipitates, except η (Cr3Ni2Si(C,N)), are found in previous
published investigations [32]–[34], [36]–[38]. A summary of these published investigations can
be found in the literature review in chapter 3.2.1 on page 10 - 14.
Cr 650°C
Cr 750°C
Nb 650°C Nb 750°C
Ni 650°C
Ni 750°C
0
10
20
30
40
50
60
70
80
90
100
0 2000 4000 6000 8000 10000
Co
mp
osi
tio
n /
wt%
Time / hM23C6
650°C750°C
Cr 650°CCr 750°C
Nb 650°CNb 750°C
Ni 650°CNi 750°C
0
10
20
30
40
50
60
70
80
90
100
0 2000 4000 6000 8000 10000
Co
mp
osi
tio
n /
wt%
Time / hσ-phase
650°C750°C
Cr 650°C
Cr 750°C
Nb 650°C
Nb 750°C
Ni 650°C
Ni 750°C
0
10
20
30
40
50
60
70
80
90
100
0 2000 4000 6000 8000 10000
Co
mp
osi
tio
n /
wt%
Time / hZ-phase (primary)
650°C750°C
Cr 750°C
Nb 750°C
Ni 750°C
Si 750°C0
10
20
30
40
50
60
70
80
90
100
0 2000 4000 6000 8000 10000
Co
mp
osi
tio
n /
wt%
Time / hη-phase
750°C

Stojan Vujić Results and Discussion
42
Table 8: Summary of different observed precipitates over the ageing treatment at 750°C.
Phase 1,000h 3,000h 10,000h Shape Nucleation Main chem.
elements
Primary Z-phase
(≈) (≈) (≈) IR GI, GB Nb, Cr, Ni
Secondary Z-phase
(+) (++) (+++) EL GI Nb, Ni, Cr
M23C6 (+) (++) (+++) EL, CU GB, GI Cr
Nb(C,N) (+) (++) (+++) RD, CU GI Nb, Cr, Ni
η-phase (+) (++) (+++) EL, RD GB, GI Cr, Ni, Nb
σ-phase (+) (++) (+++) IR GB Cr, Ni, Nb
(+) indicates an increasing precipitate diameter during ageing and (≈) diameter remains constant. IR: Irregular; EL: Elongated; CU: Cubic; RD: Round; GI: Grain interior; GB: Grain boundary. Similar results are observed at 650°C, whereas the diameters of most precipitates were smaller, especially of the σ-phase.
The η-phase requires a more detailed discussion. The chromium- and silicon-rich η-phase
is identified in [37] as M6C and in [32], [36], [38] as G-phase. The high silicon-content, fcc
structure and lattice spacing makes it difficult to distinguish between η-phase, M6C and G-
phase. However, in [46] it is reported that the silicon-content of 14 wt% in G-phase is larger
than in η-phase and separates the η-phase from the G-phase. Figure 19 shows that the silicon-
content of the η-phase is smaller than 10wt%. This confirms the suspicion that the chromium-
, nickel- and silicon-rich phase in this thesis is more likely a η-phase and not a G-phase.
Furthermore, both phases, M23C6 and η-phase contain carbon, as a result the contrast of M23C6
and η-phase in the BSD micrographs is similar. In the case of the G-phase, which does not
contain carbon, the BSD contrast should be brighter, which is not observed in the
investigations. Considering all these findings, it is assumed, that the chromium-, nickel- and
silicon-rich phase in this thesis is a η-phase and not a G-phase. Pettersson [46] studied a 20Cr-
25Ni-4.5Mo steel. After ageing at 850°C for 5 and 3,000h the η-phase composition (wt%) was
25-28Cr, 25-35Ni, 25-31Mo, 6-8Fe, 4.2-7.4Si. Except the molybdenum content, the results are
in good agreement with the present observations. Since the molybdenum is not present in the
investigated steel, there is no surprise that no molybdenum is present in the η-phase
precipitates.
The presence of Z-phase is natural due to the high stability of this phase when niobium is
present in the steel. Several micrometre large primary Z-phase particles are found in all
investigated samples. These primary Z-phase particles are randomly distributed (no specific
nucleation sites) and have an irregular shape. Often primary Z-phase particles are found to
form an elongated cluster, as can be seen in Figure 15(A-2) on page 37. It is assumed that the

Stojan Vujić Results and Discussion
43
large primary Z-phase have a detrimental effect on the material properties, it accelerates the
initiation of fatigue and especially corrosion-fatigue cracks [35]. Furthermore, the Z-phase
contains a lot of niobium as can be seen in Figure 18 and Figure 19. Since niobium is an
important solid solution hardening element [7], it is assumed that high phase fraction of Z-
phase have a detrimental effect on the solid solution hardening. Additionally to the large
primary Z-phase, small Z-phase precipitates of a diameter of several nanometre are found
inside the grains. These small Z-phase precipitates are secondary precipitates, which form
during the thermal exposure and are assumed to positively contribute to the creep strength,
acting as obstacles against movement of dislocations. Figure 18 on page 40 shows that the Z-
phase contains significant amounts of nickel (up to 30%Ni). This is not common for the Z-
phase. However, less data about EDS analysis of Z-phase in the present steel is found in the
literature which supports this high amount of nickel.
The σ-phase precipitates are found to nucleate mostly on the grain boundary triple points.
This is in agreement with [27] where it is reported that the σ-phase initially nucleates on grain
boundary triple points, then on grain faces and afterwards on incoherent twin boundaries and
intragranular inclusions. A higher presence of σ-phase at 750°C compared to 650°C is
observed. This is easily explained by a higher diffusion at 750°C than at 650°C. Compared to
all other precipitates, the σ-phase was observed at late ageing times. There are at least three
reasons for the slow kinetics of the σ-phase [31]: (i) σ-phase does not contain carbon and
nitrogen, as a consequence the σ-phase starts to form after the carbides and nitrides are
formed; (ii) the complex crystal structure (TCP) which is very different from the parent
austenite matrix; (iii) σ-phase contains a lot of substitutional elements which have a slow
diffusion. Considering the composition of the σ-phase, a chromium content of 40-45(wt.%)
and a nickel content of 10-15% is observed, see Figure 19. This is in good agreement with
investigations in [36] where a similar composition is observed.
The M23C6 precipitates are one of the most dominant precipitates in the investigated steel.
At early ageing times they become visible on grain boundaries and afterwards at twin
boundaries and slip bands. At 750°C a film of M23C6 precipitates along grain boundaries is
observed, which is assumed to be detrimental for the creep properties (can cause grain
boundary sliding).

Stojan Vujić Results and Discussion
44
Similarly to Z-phase, the presence of Nb(C,N) precipitates is natural due to the high niobium
content. According to previous studies [27], [28] it is believed that Nb(C,N) at 650°C and 750°C
is a transient phase which gradually transforms to Z-phase.
When the chemical composition of the precipitates in Figure 18 is analysed, a strong
scattering of the precipitates composition (especially of Nb(C,N)) can be observed. In the case
of Nb(C,N) the niobium content varies between 20 and 95%. One possible explanation for this
scatter may be caused by a particularly swapping of Nb(C,N) and Z-phase precipitates. The
analysed Nb(C,N) with high amount of niobium is probably a Nb(C,N), whereas the analysed
Nb(C,N) with low amount of niobium is probably a Z-phase. However, both precipitates,
Nb(C,N) and Z-phase, have often a similar shape, contain high amount of niobium and
chromium, that makes it difficult to distinguish between them. Therefore, the precipitation
calculation is an helpful tool to study the evolution of Z-phase and Nb(C,N) precipitates.

Stojan Vujić Results and Discussion
45
5.1.5 Summary
Microstructure investigations of austenitic steel 25Cr-20Nr-Nb-N are carried out for
thermally aged samples at 650 and 750°C for 1,000h, 3,000h and 10,000h. For the
investigations, LOM, SEM and TEM techniques are used. The investigations (LOM, SEM and
TEM) are carried out at the KTH Stockholm, whereas the evaluations of the experimental
results is done by the author himself and partially also in collaboration with the KTH
Stockholm. The experimental results are summarized as follows:
Five different precipitates Z-phase, M23C6, Nb(C,N), η (Cr3Ni2Si(C,N)), σ-phase and
two different oxides Al- and Si-oxide are experimentally found.
The M23C6 precipitates are found at early ageing times at grain boundaries and after
longer ageing times additionally at twin boundaries and slip bands. At 750°C the
grain boundaries are particularly covered by a film of M23C6 precipitates.
Two different types of Z-phase are found. The larger one, having a diameter of
several micrometre, is assumed to be a primary one formed during solidification.
The smaller one, having a diameter of several nanometre, is assumed to be a
secondary one formed during thermal exposure.
The σ-phase precipitates are found mostly on grain boundary triple points. Samples
aged at 750°C have a higher amount of σ-phase than samples aged at 650°C.
The results of microstructure investigations can be used to setup and evaluate the
precipitation calculation in order to understand the precipitation kinetics in the austenitic
steel. Especially, the experimental findings about the precipitation kinetics of the η-phase are
used to implement a new phase “Cr3Ni2SiN” in the MatCalc thermodynamic database [74].

Stojan Vujić Results and Discussion
46
5.2 Thermodynamic and Thermokinetic Calculations
5.2.1 Equilibrium and Scheil Calculations
A thermodynamic equilibrium calculation predicts the equilibrium phase fractions versus
temperature after infinite long exposure time.
When all existing phases are considered for the MatCalc equilibrium calculation, the Cr2N
phase becomes stable at the expense of η-phase. This condition represents in a wrong way
the equilibrium phase condition in the present austenitic steel. In order to show the influence
of Cr2N on the residual equilibrium phases, two kinds of equilibrium calculations are
performed, one with and another one without Cr2N phase, as illustrated in Figure 20. When
Cr2N is considered (Figure 20(A)), MatCalc predicts eight different equilibrium phases in the
temperature range between 400 and 1600°C: liquid, austenite as matrix phase, Nb(C,N), Z-
phase, M23C6, Cr2N, σ-phase and G-phase. Nb(C,N) is stable between 1000 and 1300°C, Z-phase
up to 1240°C, M23C6 up to 1000°C, Cr2N up to 870°C, σ-phase up to 820°C, G-phase up to 480°C.
When Cr2N is suspended, then the η-phase becomes stable (up to 780°C) and G-phase
unstable, see Figure 20(B).
Figure 20: Equilibrium phases with Cr2N (A) and without Cr2N (B).
In Table 9 the phase fractions of equilibrium phases (when Cr2N is suspended) at the
relevant temperatures of 650°C and 750°C are presented. It can be seen that the most
dominant phase at 650°C is the σ-phase having a phase fraction of 19.1%, whereas at 750°C it
is 7.2%. The η-phase shows also a strong decrease of phase fraction between 650 and 750°C.
The phase fractions of Z-phase and M23C6 do not change significantly between 650 and 750°C.
Liquid
Austenite
NbCNCr2N
G
σ
M23C6
Z
0.01
0.1
1
10
100
400 600 800 1000 1200 1400 1600
Phas
e fr
acti
on /
%
Temperature / °CA
Liquid
Austenite
NbCN
σ
M23C6
η
Z
0.01
0.1
1
10
100
400 600 800 1000 1200 1400 1600
Ph
ase
fra
ctio
n /
%
Temperature / °CB

Stojan Vujić Results and Discussion
47
Table 9: Equilibrium phase fractions (%) at 650°C and 750°C.
Z M23C6 σ η
650°C 0.8 1.4 19.1 2.3
750°C 0.8 1.3 7.2 0.6
Scheil-calculations [68]–[70] are performed to investigate the effect of segregation
processes during solidification on the formation of the precipitates. Compared to the
equilibrium calculation, the Scheil-calculation is a series of separate equilibrium calculations
at different temperatures. As a result, the Scheil phase consists of many layers (each layer is
calculated by equilibrium calculation) which have different compositions. The diffusion of
substitutional elements between the layers is frozen (due to Scheil-Guliver assumption of very
slow and therefore negligible diffusion in solid phase), whereas the diffusion of interstitial
elements like carbon and nitrogen is assumed to be highly mobile in liquid phase as well as in
solid phase.
The Scheil-calculation predicts four phases (primary phases) during the solidification:
liquid, austenite, Nb(C,N) and Z-phase, see Figure 21. Liquid is stable down to 1236°C (3%
liquid phase fraction) which is more than 50°C lower compared to equilibrium. This
phenomenon is caused by segregation in the liquid phase during solidification. The calculated
chemical composition and phase fraction of the primary Nb(C,N) and Z-phase at 3% liquid
phase fraction (1236°C) is presented in Table 10. The phase fraction of the primary Z-phase is
almost ten-times larger than the phase fraction of primary Nb(C,N), which indicates that the
primary Z-phase is the most dominant primary phase.
Figure 21: Primary phases according to Scheil calculation.
Liquid
Austenite
NbCN
Z
0.001
0.01
0.1
1
10
100
1230 1280 1330 1380 1430
Ph
ase
fra
ctio
n /
%
Temperature / °C

Stojan Vujić Results and Discussion
48
Table 10: Calculated chemical composition (wt%) and phase fraction (%) of primary Z-phase and Nb(C,N) at 3% liquid phase fraction.
Phase Temp. °C Phase fraction Nb C N Cr Fe
Nb(C,N) 1236 0.02 88.95 8.57 2.47 - -
Z 1236 0.22 58.67 - 8.17 28.57 4.58
5.2.1.1 Discussion
In thermodynamic equilibrium, six different precipitate phases are predicted by MatCalc in
the temperature range between 400 and 1600°C: Nb(C,N), Z-phase, M23C6, Cr2N, σ-phase and
G-phase. Most of the phases, except Cr2N, are experimentally found in the 25Cr-20Ni-Nb-N
steel [32]–[34], [36]–[38]. In [36], creep exposed sample after 88,363h is investigated. In this
long time creep exposed sample, which is assumed to be close to an equilibrium condition, no
Cr2N phase is found. Similar results are reported by Sourmail [27], who describes that Cr2N is
unlikely when Z-phase is present in austenitic steels. Therefore it is assumed that the Cr2N
phase is not a common phase in the 25Cr-20Ni-Nb-N steel. Based on that, equilibrium
calculations without Cr2N phase are carried out. When the Cr2N is suspended, the η-phase
becomes stable and G-phase unstable, see Figure 20(B). Suspending Cr2N causes a higher
chromium and nitrogen contents in the matrix, which in turn stabilizes the η-phase
(=Cr3Ni2SiN). Since G-phase cannot take up the nitrogen, it is destabilized at the expense of η-
phase. The system without the Cr2N shown in Figure 20(B), is the most reasonable system to
describe the equilibrium condition in the 25Cr-20Ni-Nb-N austenitic steel. All equilibrium
phases shown in Figure 20(B) are also found experimentally.
The Scheil calculation predicts Nb(C,N) and Z-phase as primary precipitates phases during
the solidification, as illustrated in Figure 21. The calculated chemical composition (wt.%) of
the primary Z-phase is 58.67Nb-28.57Cr-4.58Fe-8.17N. This is in good agreement with the SEM
measurements of the large Z-phase precipitates in Figure 19 on page 41. This observations
supports the findings that the large Z-phase precipitates (bright precipitates in Figure 12 on
page 36 and Figure 15 on page 37) are primary one which forms during the solidification.

Stojan Vujić Results and Discussion
49
5.2.1.2 Summary
Equilibrium and Scheil calculations of austenitic steel 25Cr-20Nr-Nb-N are carried out by
the author. The experimental investigations are summarized as follows.
The equilibrium system without the Cr2N, is the most reasonable system which
describes the equilibrium condition in the 25Cr-20Ni-Nb-N austenitic steel.
When Cr2N is suspended, five different precipitates phases in the temperature
range between 400 and 1600°C are predicted: Nb(C,N), Z-phase, M23C6, σ-phase and
η-phase. All these phases are also found experimentally.
The Scheil calculation predicts Nb(C,N) and Z-phase as primary precipitates phases
during the solidification. Primary Z-phase is also found experimentally.
With these equilibrium and Scheil calculations, a basis is created for a better understanding
of the stability- and transformation- of phases in the 25Cr-20Ni-Nb-N austenitic steel.
Especially, the results of the Scheil calculation can be used as input data for the precipitation
calculation.
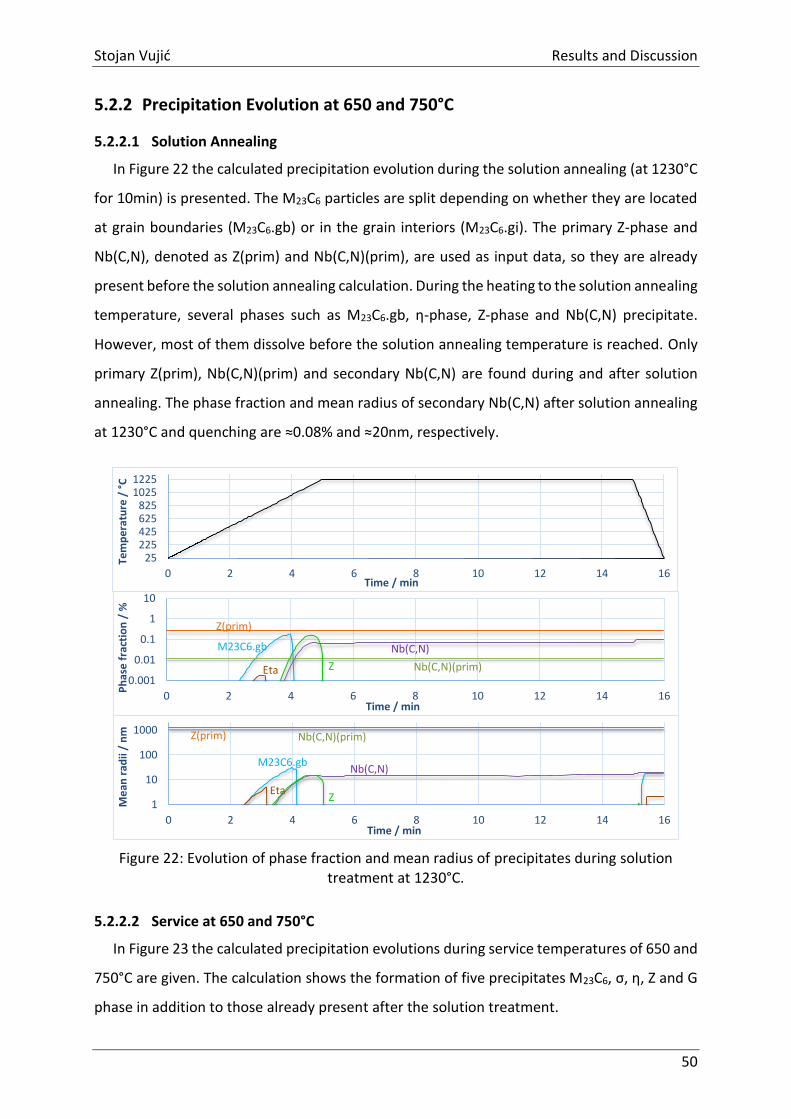
Stojan Vujić Results and Discussion
50
5.2.2 Precipitation Evolution at 650 and 750°C
5.2.2.1 Solution Annealing
In Figure 22 the calculated precipitation evolution during the solution annealing (at 1230°C
for 10min) is presented. The M23C6 particles are split depending on whether they are located
at grain boundaries (M23C6.gb) or in the grain interiors (M23C6.gi). The primary Z-phase and
Nb(C,N), denoted as Z(prim) and Nb(C,N)(prim), are used as input data, so they are already
present before the solution annealing calculation. During the heating to the solution annealing
temperature, several phases such as M23C6.gb, η-phase, Z-phase and Nb(C,N) precipitate.
However, most of them dissolve before the solution annealing temperature is reached. Only
primary Z(prim), Nb(C,N)(prim) and secondary Nb(C,N) are found during and after solution
annealing. The phase fraction and mean radius of secondary Nb(C,N) after solution annealing
at 1230°C and quenching are ≈0.08% and ≈20nm, respectively.
Figure 22: Evolution of phase fraction and mean radius of precipitates during solution treatment at 1230°C.
5.2.2.2 Service at 650 and 750°C
In Figure 23 the calculated precipitation evolutions during service temperatures of 650 and
750°C are given. The calculation shows the formation of five precipitates M23C6, σ, η, Z and G
phase in addition to those already present after the solution treatment.
25225425625825
10251225
0 2 4 6 8 10 12 14 16
Tem
pe
ratu
re /
°C
Time / min
M23C6.gb
Nb(C,N)(prim)
Nb(C,N)
Z(prim)
ZEta0.001
0.01
0.1
1
10
0 2 4 6 8 10 12 14 16
Ph
ase
fra
ctio
n /
%
Time / min
M23C6.gb
Nb(C,N)(prim)
Nb(C,N)
Z(prim)
ZEta
1
10
100
1000
0 2 4 6 8 10 12 14 16
Me
an r
adii
/ n
m
Time / min

Stojan Vujić Results and Discussion
51
All precipitates (except Z(prim), Nb(C,N)(prim)) show an increase of phase fraction and
mean radius with increasing ageing time. The phase fraction and mean radius of primary
precipitates is constant during the ageing. The secondary Nb(C,N) which nucleate during the
solution annealing starts to dissolve earlier at 750°C (<10,000h) than at 650°C (≈100,000h). A
small fraction (≈0.003%) of G phase appears at 650°C but not at 750°C. The phase fraction and
mean radius of M23C6.gb are higher than those of M23C6.gi. Considering the grain boundary
precipitates, the most dominant phase is σ. The secondary Z phase fraction is increased in two
stages. The first increase takes place during the first 100h of ageing and the second one during
the dissolution of secondary Nb(C,N). Experimental mean radii and phase fractions of -phase
and M23C6 are also displayed. When the number density of precipitates (Figure 23 (E, F)) is
analysed, M23C6.gb and η-phase shows a gradual decrease in number density with increase of
ageing time, indicating that coarsening is present. The secondary Nb(C,N) and G-phase shows
an abrupt drop in number density, which means that dissolution is present.

Stojan Vujić Results and Discussion
52
650°C
750°C
Figure 23: Precipitation evolution at 650°C (A, C, E) and 750°C (B, D, F) for 100,000h. gb: grain boundary; gi: grain interior.
σ
Nb(C,N)(prim)
Nb(C,N)
Z(prim)
Z
η
G
M23C6(exp)
σ(exp)
0.0001
0.001
0.01
0.1
1
10
0.01 0.1 1 10 100 1000 10000100000
Ph
ase
fra
ctio
n /
%
Time / hA
σ
Nb(C,N)(prim)
Nb(C,N)
Z(prim)
Z
η
G
M23C6(exp)
σ(exp)
10
20
40
80
160
320
640
1280
2560
5120
0.01 0.1 1 10 100 1000 10000 100000
Me
an r
adii
/ n
m
Time / hC
M23C6.gb
M23C6.gi
σ
Nb(C,N)(prim)
Nb(C,N)
Z(prim)
Z
η
G
1E+12
1E+14
1E+16
1E+18
1E+20
1E+22
0.01 0.1 1 10 100 1000 10000 100000
Nu
mb
er
de
nsi
ty /
m-3
Time / hE
M23C6.gb
σ
Nb(C,N)(prim)
Nb(C,N)
Z(prim)
Z
η
M23C6(exp)
σ(exp)
0.0001
0.001
0.01
0.1
1
10
0.01 0.1 1 10 100 1000 10000100000
Ph
ase
fra
ctio
n /
%
Time / hB
σ
Nb(C,N)(prim)
Nb(C,N)
Z(prim)
Z
η
M23C6(exp)σ(exp)
10
20
40
80
160
320
640
1280
2560
5120
0.01 0.1 1 10 100 1000 10000 100000
Me
an r
adii
/ n
m
Time / hD
M23C6.gb
M23C6.gi
σ
Nb(C,N)(prim)
Nb(C,N)
Z(prim)
Z
η
1E+12
1E+14
1E+16
1E+18
1E+20
1E+22
0.01 0.1 1 10 100 1000 10000 100000
Nu
mb
er
de
nsi
ty /
m-3
Time / hF

Stojan Vujić Results and Discussion
53
Table 11 shows the calculated precipitates compositions at 650°C after 10,000h. At 750°C
the precipitates compositions are similar.
Table 11: Precipitates compositions (wt%) at 650°C after 10,000h.
Fe C Cr Si Ni Nb Mn N
M23C6.gb 9.29 5.64 83.80 - 0.64 - 0.62 -
M23C6.gi 7.15 5.65 86.24 - 0.36 - 0.61 -
σ-phase 44.34 - 47.97 0.50 6.74 - 0.45 -
Nb(C,N)(prim) - 8.82 - - - 88.65 - 2.53
Nb(C,N) - 0.79 - - - 87.11 - 12.10
Z(prim) 5.56 - 27.50 - - 58.39 - 8.55
Z-phase 6.57 - 26.46 - - 58.21 - 8.75
η-phase 1.14 0.03 49.48 8.91 36.03 - - 4.41
In Figure 24 the evolution of total carbon content in the matrix and the precipitates as a
function of ageing time is presented. No significant differences in carbon content between
650°C and 750°C is observed; transformations are shifted to shorter times at 750°C. As can be
seen, at the beginning most of the carbon is stored in the matrix. When M23C6.gb, M23C6.gi
and Nb(C,N) starts to form (characterized by increasing carbon content), the matrix is depleted
by carbon (from 0.05% to <0.01%C). Afterwards, when Nb(C,N) starts to dissolve (after1,000h
at 650°C and 40h at 750°C), carbon is released which is used for further formation of M23C6.gb
and M23C6.gi.
Figure 24: Total content (wt%) of carbon in matrix and precipitates during aging at (A) 650°C and (B) 750°C.
The obtained experimental data of η-phase, Z-phase and Nb(C,N) were not enough to verify
the simulated precipitation evolution of these precipitates. Therefore, the verifications of
Matrix
M23C6.gb
M23C6.gi
NbCN(prim)
NbCN
0
0.01
0.02
0.03
0.04
0.05
0.06
1 10 100 1000 10000 100000
Car
bo
n c
on
ten
t /
wt.
%
Time / hA
Matrix M23C6.gb
M23C6.gi
NbCN(prim)
NbCN
0
0.01
0.02
0.03
0.04
0.05
0.06
1 10 100 1000 10000 100000
Car
bo
n c
on
ten
t /
wt.
%
Time / hB

Stojan Vujić Results and Discussion
54
these precipitates are made by the experimental data of Iseda et al. [36]. They measured the
content of chemical elements in precipitates of a 25Cr-20Ni-Nb-N austenitic steel (HR3C)
having a grain size of ≈60µm and exposed at 650°C for 10,000h. The results of their
investigations, which are marked as “exp.”, are presented in Figure 25. In order to compare
their results with the present calculation, a precipitation calculation with a grain size of 60µm
has been performed. The results are also shown in Figure 25. The curve marked as “Total”
represents the calculated total content of nickel, chromium, iron or niobium in all precipitates.
As can be seen in Figure 25(A) the calculated total content of nickel in the precipitates is in
very good agreement with the experimental values. It can be seen that almost the whole nickel
is stored in the η-phase, only negligible amount is stored in the M23C6.gb precipitates. Similar
to the nickel content, the calculated total chromium content shows also a very good
agreement with the experimental values, see Figure 25(B). As expected, most of chromium is
stored into the M23C6.gb, M23C6.gi and η-phase. Smaller amounts of chromium are stored in
the secondary and primary Z-phase. The total content of iron in the precipitates is presented
in Figure 25(C). The most iron is stored in M23C6.gb, M23C6.gi. Close to the 10,000h, when σ-
phase significantly starts to form, iron becomes stored in σ-phase. The total content of
niobium in the precipitates is presented in Figure 25(D). The solid line represents the niobium
content in the present austenitic steel with a dislocation density of 1x10¹² m-2 and the dashed
line with a dislocation density of 1x10¹⁰ m-2. Initially, most of the niobium is stored in the
primary Z-phase and secondary Nb(C,N). At later times, when the Z-phase starts to form, a
significant amount of niobium becomes stored in the secondary Z-phase. The calculation with
a dislocation density of 1x10¹⁰ m-2 shows very good agreement with the experimental results.

Stojan Vujić Results and Discussion
55
Figure 25: Total content (wt.%) of (A) nickel, (B) chrom, (C) iron and (D) niobium at 650°C and 60µm grain size; dd: dislocation density.
5.2.2.3 Discussion
The microstructure of the 25Cr-20Ni-Nb-N austenitic steel has been investigated by many
workers over the last years. The disagreements about the identification of the Si-rich phase
(η-, G- and M6C) are still present. In order to understand the precipitation evolution as well as
the interactions between the precipitates, a simulation of the precipitates evolution is
necessary. In this chapter the precipitation evolution during long term ageing at 650 and 750°C
is explained and discussed in detail. The precipitation process (nucleation, growth and
coarsening), interactions between the precipitates, as well as the influence of some
microstructure parameters such as dislocation density are explained.
By analysing the micrographs and experimental results from the literature, it was found
that the M23C6 precipitates are mostly present at the grain boundaries, only at long ageing
M23C6.gb
η
G
Total
Ni(exp.)
0
0.05
0.1
0.15
0.01 0.1 1 10 100 1000 10000
Ni c
on
ten
t /
wp
%
Time / hA
M23C6.gb
M23C6.gi
ηZ(prim)
Z
Total
Cr(exp.)
0
0.2
0.4
0.6
0.8
1
1.2
1.4
0.01 0.1 1 10 100 1000 10000
Cr
con
ten
t /
wp
%
Time / hB
M23C6.gb
M23C6.gi
σ η
Z(prim)
Z
Total
Fe(exp.)
0
0.025
0.05
0.075
0.1
0.125
0.15
0.01 0.1 1 10 100 1000 10000
Fe c
on
ten
t /
wp
%
Time / hC
Z(prim)
ZNbCN(prim)
NbCN
Total
Nb(exp.)
G0
0.1
0.2
0.3
0.4
0.5
0.01 0.1 1 10 100 1000 10000
Nb
co
nte
nt
/ w
p%
Time / hD
─ dd=1x10¹²m-2
- - dd=1x10¹⁰m-2

Stojan Vujić Results and Discussion
56
times they start to nucleate inside grains on the twin boundaries and slip bands. Since the twin
boundaries and slip bands as nucleation sites are not available in MatCalc, a decision must be
taken as whether or not to consider the M23C6 inside grains. In order to find a M23C6 setup for
the MatCalc, which describes the evolution of M23C6 in most reasonable way, it was decided
to create two populations of M23C6 in MatCalc: M23C6.gb (“gb” refers to grain boundary) and
M23C6.gi (refers to grain interior). As nucleation sites for the M23C6.gi, the subgrain boundary
corners are chosen. As a consequence, the phase fraction and mean radius of M23C6.gb are
higher than those of M23C6.gi, shown in Figure 23(A, B). A similarity is qualitatively observed
in the experimental investigation. So this approach of using the subgrain boundary corners as
substitution for twin boundaries and slip bands is the most reasonable way to simulate
correctly the M23C6 evolution. When comparing the simulated results of the M23C6.gb and
M23C6.gi with experimental one in Figure 23, the results are satisfying. It seems that the
simulations predict an earlier formation of M23C6.gb and M23C6.gi precipitates compared to
the experiments. This deviation is probably caused by the measurement technique. The
fraction of the M23C6 precipitates is measured by SEM, which is more suitable for large
particles than for smaller particles. Accordingly, the small precipitates, which are present at
earlier stages of ageing, are not detected by SEM. To verify this assumption, an additional
calculation is performed and compared with the experimental results of Iseda et al. [36], see
Figure 25(B). As can be seen, the simulation of the M23C6 evolution shows very good
agreement with the experimental results. The increase of chromium content is directly related
to the increase of phase fraction of M23C6. From this point of view, it seems that the simulation
of M23C6.gb and M23C6.gi precipitates is correct. By analysing the evolution of M23C6.gb and
M23C6.gi in Figure 23 it can be seen, that both precipitates show similar evolution in phase
fraction and mean radius. At the beginning the phase fraction and mean radius increase at a
constant number density for M23C6.gb and an increasing number density for M23C6.gi, meaning
that precipitates are growing. After ≈1,000h at 650°C and ≈40h at 750°C the carbon content
in the matrix reaches a minimum, see Figure 24. As a result, the growth of the M23C6.gb and
M23C6.gi is stopped and a first plateau of phase fraction and mean radius is created, see Figure
23. Immediately when the Nb(C,N) starts to dissolve and further carbon is released. As a
consequence, the phase fraction and mean radius of M23C6.gb and M23C6.gi start to increase.
Close to an ageing time of 100,000h a further increase of mean radius of M23C6.gb at a
constant phase fraction is observed, which means that precipitates coarsen. Since the

Stojan Vujić Results and Discussion
57
diffusion in the grain interior is lower compared to the grain boundary, no coarsening of
M23C6.gi after 100,000h is observed.
The simulation of the evolution of σ-phase shows good agreement with experimental
results, see Figure 23. The σ-phase shows a very slow kinetics, it is the last precipitate to
nucleate. This is also reported in [31]. Due to the faster diffusion, the formation of σ-phase
starts earlier at 750°C compared to 650°C. This is also found experimentally, where less σ-
phase is found at 650°C, whereas significant σ-phase formation is found after 1,000h at 750°C.
The phase fraction after 100,000h at 650°C is higher compared to the same time at 750°C. This
can be explained by the equilibrium phase fraction which decreases rapidly with higher
temperature, see Figure 20 on page 46. In Figure 23 at 650°C the σ-phase shows a constant
increase of phase fraction and mean radius, so growing is present. At 750°C the phase fraction
and mean radius increase until ≈10,000h where a plateau is observed (equilibrium condition).
The secondary Nb(C,N) precipitates are the only one, except the primary precipitates,
which are stable during the solution treatment at 1230°C, see Figure 22 on page 50. During
the subsequent ageing the phase fraction and mean radius remain almost constant until the
dissolution of the Nb(C,N) starts, see Figure 23 on page 52. Since the diffusion is higher at
750°C than at 650°C, the Nb(C,N) dissolve earlier at 750°C than at 650°C. The dissolution of
Nb(C,N) may not be a surprise when the equilibrium plot in Figure 20 on page 46 is analysed.
As can be seen, the Nb(C,N) is only stable at high temperature from ≈1000°C to 1300°C, this is
more than 250°C higher than the ageing temperature of 750°C. When the Nb(C,N) starts to
dissolve, a small amount of niobium, carbon and nitrogen is released. Niobium and nitrogen
are used for the formation of the secondary Z-phase and carbon is used for the M23C6
formation. This can be seen in Figure 23 on page 52, where the phase fraction of the Z-phase
and M23C6 increases when Nb(C,N) starts to dissolve. This is in agreement with findings in [27],
[28], where it is reported that the Z-phase grows at the expense of MX (Nb(C,N)) precipitates
in 20-25Cr austenitic steels. Furthermore, the present calculation confirms the assumption in
[31] where it is assumed that the MC to M23C6 transformation can take place in several
austenitic steels after long time exposure. In addition to the secondary Nb(C,N) precipitates,
also primary Nb(C,N) are present. It is shown that the secondary Nb(C,N) precipitates dissolve
in the present steel, therefore it would be expected that the primary Nb(C,N) also dissolve.
However, no dissolution of primary Nb(C,N) during the ageing is observed, see Figure 23 on
page 52. There are at least two reasons for the non-dissolution of the primary Nb(C,N): (i) it is

Stojan Vujić Results and Discussion
58
well known that the diffusion along the dislocation (pipe diffusion) is higher compared to the
matrix diffusion; the secondary Nb(C,N) are located on dislocation and the primary Nb(C,N)
are randomly distributed inside the matrix; as consequence, the dissolution of the secondary
Nb(C,N) occurs faster compared to the primary one; (ii) large precipitates dissolve more slowly
compared to small precipitates; since the primary Nb(C,N) have a diameter of several
micrometres and the secondary Nb(C,N) of several nanometres, the dissolution of secondary
Nb(C,N) is faster.
An additional niobium-rich phase is the secondary Z-phase. Similar to all other secondary
precipitates (except Nb(C,N)), it dissolves during the solution treatment, see Figure 22 on page
50. Afterwards, when the ageing is applied, the Z-phase starts to form and grow on
dislocations using chromium, niobium and nitrogen from the supersaturated matrix, see
Figure 23 on page 52. When the matrix is depleted by niobium, the growth of the Z-phase
stops. This happens after ≈100 and ≈10h at 650 and 750°C, respectively, see Figure 23 on page
52. Afterwards a plateau of phase fraction and mean radius appears. Close to 10,000h when
the Nb(C,N) significantly starts to dissolve, niobium is released and the Z-phase starts to grow
again. No coarsening of Z-phase up to 100,000h is predicted. Additional to the secondary Z-
phase, the primary Z-phase is also present. As can be seen in Figure 23 on page 52, the phase
fraction and mean radius of the primary Z-phase remains unchanged during the whole ageing
treatment.
According to the experimental investigations, the nickel-rich G-phase is discussed to be
more likely a η-phase than a G-phase, see chapter 5.1.4 on page 41. However, to clarify this
assumption, the G-phase is taken into account for the precipitation calculation. The evolution
of the G-phase is presented in Figure 23 on page 52. At 650°C ageing, a small fraction of G-
phase appears, and immediately afterwards it dissolves, whereas at 750°C no significant G-
phase fraction is predicted. The calculation supports the assumption that the nickel-rich phase
is more likely to be a η-phase than a G-phase.
Additional to the M23C6.gb and σ-phase, a further dominant grain boundary precipitate is
the η-phase. The nucleation of the η-phase starts during the quenching from the solution
annealing temperature. After quenching, the number of η-phase precipitates is about
3x10¹⁹m-3, which is by far the highest amount compared to other grain boundary precipitates
such as M23C6.gb (2 x10¹⁶m-3) and σ-phase (2.5 x10¹¹m-3). As a result of this high number
density, the interparticle spacing between the η-phase precipitates is low. When service is

Stojan Vujić Results and Discussion
59
applied, the η-phase starts to grow, which causes a further decrease of η-phase interparticle
spacing. Once the interparticle spacing is small enough that η-phase cannot grow anymore
due to mutual obstruction, the η-phase precipitates simultaneously start to coarsen
(characterized by decreasing number density) and grow (characterized by increasing phase
fraction). This happens at 650°C close to 100h service time and at 750°C between 1 and 10h,
see Figure 23 E and (F). In order to explain more in detail this simultaneously growing and
coarsening of η-phase, a additional precipitation calculation is performed considering only the
η-phase (all other precipitates were suspended). For the calculations, four different nucleation
constants (NC) are applied: 1, 1x10⁻², 1x10⁻⁴ and 1x10⁻⁶. These constants are used to decrease
the number density of the η-phase. The results of the calculations are shown in Figure 26(A-
C). As can be seen in Figure 26(A, B), the phase fractions and mean radii of η-phase is similar
for all four nucleation constants. This is not the case for the number densities, as can be seen
in Figure 26(C), where a lower nucleation constant causes a lower number density. This lower
number density leads to a larger interparticle spacing and further on to a delayed start of
coarsening (decrease of number density): the coarsening for NC=1 starts between 1 and 10h,
for NC=1x10⁻² between 10 and 100h, for NC=1x10⁻⁴ close to 1000h and for NC=1x10⁻⁶ close to
10,000h. A schematic illustration of simultaneous growth and coarsening is shown in Figure
26(D). This kind of growth and coarsening at same time is not often present, but under specific
conditions, like high number density of grain boundary precipitates. A further effect which
causes simultaneous growth and coarsening is the increasing ratio between diffusion at grain
boundary and inside grain, as shown in the thesis of Radis [75] by calculation of AlN
precipitates evolution at 1000°C. This diffusion ratio may also contribute to the simultaneous
growth and coarsening, but for the present case, the main reason is the high number density.
The simultaneous growth and coarsening of η-phase is still present even after 100,000h
exposure. The evolution of the η-phase seems to be very good predicted, see Figure 25(A) on
page 55.
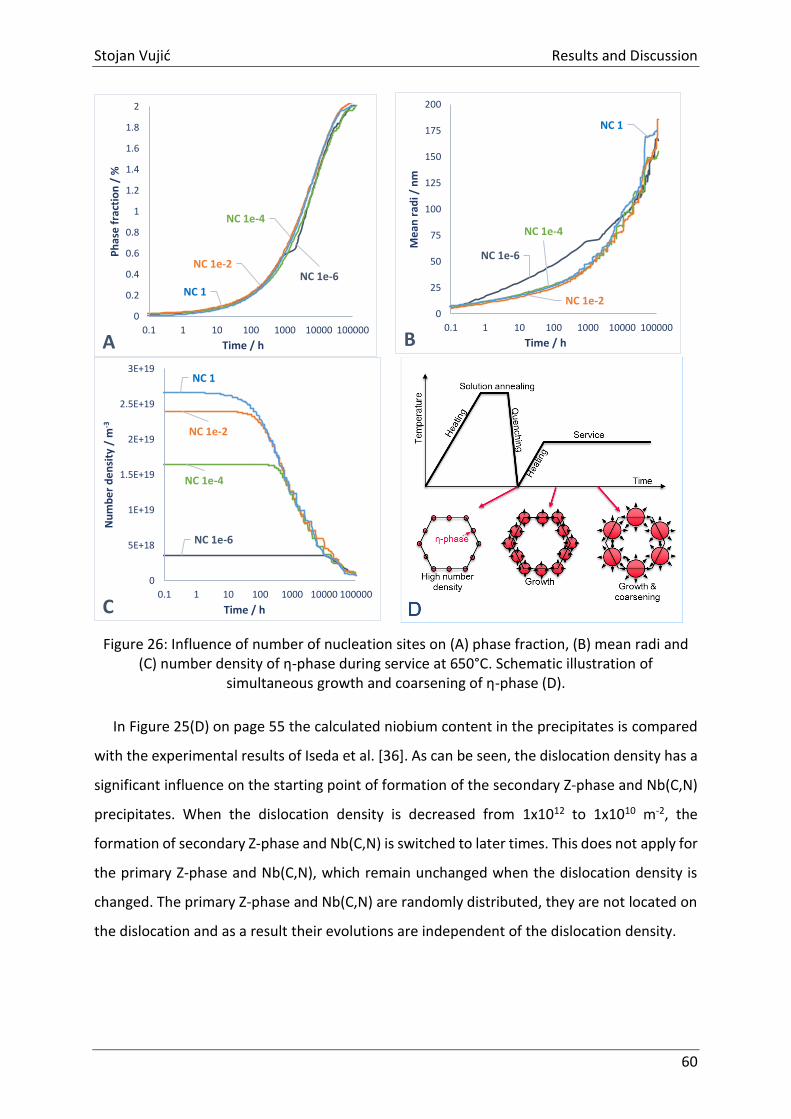
Stojan Vujić Results and Discussion
60
Figure 26: Influence of number of nucleation sites on (A) phase fraction, (B) mean radi and (C) number density of η-phase during service at 650°C. Schematic illustration of
simultaneous growth and coarsening of η-phase (D).
In Figure 25(D) on page 55 the calculated niobium content in the precipitates is compared
with the experimental results of Iseda et al. [36]. As can be seen, the dislocation density has a
significant influence on the starting point of formation of the secondary Z-phase and Nb(C,N)
precipitates. When the dislocation density is decreased from 1x10¹² to 1x10¹⁰ m-2, the
formation of secondary Z-phase and Nb(C,N) is switched to later times. This does not apply for
the primary Z-phase and Nb(C,N), which remain unchanged when the dislocation density is
changed. The primary Z-phase and Nb(C,N) are randomly distributed, they are not located on
the dislocation and as a result their evolutions are independent of the dislocation density.
NC 1e-6
0
0.2
0.4
0.6
0.8
1
1.2
1.4
1.6
1.8
2
0.1 1 10 100 1000 10000 100000
NC 1e-4
0
0.2
0.4
0.6
0.8
1
1.2
1.4
1.6
1.8
2
0.1 1 10 100 1000 10000 100000
NC 1e-2
0
0.2
0.4
0.6
0.8
1
1.2
1.4
1.6
1.8
2
0.1 1 10 100 1000 10000 100000
NC 1
0
0.2
0.4
0.6
0.8
1
1.2
1.4
1.6
1.8
2
0.1 1 10 100 1000 10000 100000
Ph
ase
fra
ctio
n /
%
Time / hA
NC 1e-6
0
25
50
75
100
125
150
175
200
0.1 1 10 100 1000 10000 100000
Me
an r
adii
/ n
m
Time / h
NC 1e-4
0
25
50
75
100
125
150
175
200
0.1 1 10 100 1000 10000 100000
Me
an r
adii
/ n
m
Time / h
NC 1e-20
25
50
75
100
125
150
175
200
0.1 1 10 100 1000 10000 100000
Me
an r
adii
/ n
m
Time / h
NC 1
0
25
50
75
100
125
150
175
200
0.1 1 10 100 1000 10000 100000
Me
an r
adi /
nm
Time / hB
NC 1e-6
0
5E+18
1E+19
1.5E+19
2E+19
2.5E+19
3E+19
0.1 1 10 100 1000 10000 100000
Nu
mb
er
de
nsi
tie
s /
m-3
Time / h
NC 1e-4
0
5E+18
1E+19
1.5E+19
2E+19
2.5E+19
3E+19
0.1 1 10 100 1000 10000 100000
Nu
mb
er
de
nsi
tie
s /
m-3
Time / h
NC 1e-2
0
5E+18
1E+19
1.5E+19
2E+19
2.5E+19
3E+19
0.1 1 10 100 1000 10000 100000
Nu
mb
er
de
nsi
tie
s /
m-3
Time / h
NC 1
0
5E+18
1E+19
1.5E+19
2E+19
2.5E+19
3E+19
0.1 1 10 100 1000 10000 100000
Nu
mb
er
de
nsi
ty /
m-3
Time / hC

Stojan Vujić Results and Discussion
61
5.2.2.4 Summary
Thermo-kinetic calculations of the precipitation evolution in the austenitic stainless steel
25Cr-20Ni-Nb-N are performed by the author with the help of the software MatCalc. The
results are summarized as follows:
For the precipitation calculations, eight precipitates are considered: M23C6, σ,
primary Z, secondary Z, primary Nb(C,N), secondary Nb(C,N), η (Cr3Ni2SiN) and G.
Furthermore, a multistage heat treatment of solution annealing and ageing at 650
and 750°C is applied.
The precipitation calculation shows a good agreement with experimental results.
The phase fraction of the M23C6 at the grain boundaries (M23C6.gb) is higher
compared to the M23C6 inside grains (M23C6.gi).
The σ-phase is found to be the most dominant phase on the grain boundaries.
The secondary Nb(C,N) precipitates are found to dissolve during the ageing at 650
and 750°C. The released niobium, carbon and nitrogen is used for the formation of
secondary Z-phase and M23C6 precipitates.
The results of the precipitation calculation contribute to a better understanding of the
evolution and transformation of precipitates in a 25Cr-20Ni-Nb-N austenitic steel. With this
calculation, a basis was created for the precipitation strength calculation in order to optimize
the 25Cr-20Ni-Nb-N by modifying the chemical composition and heat treatment.

Stojan Vujić Results and Discussion
62
5.3 Creep Strength Calculations
For the 25Cr-20Ni-Nb-N steel, three main contributions to creep strength are assumed:
from precipitates, from solid solution and from dislocations. These three contributions are
analysed separately using the creep strength modelling approach of Sandström et al. [13]–
[18], that is summarized in chapter 3.2.2 on page 17. Results from precipitation kinetics
simulations (from chapter 5.2.2.2 on page 50) are used as input for calculating the
precipitation hardening contribution. All results shown in this chapter, are obtained in
collaboration with Prof. Sandström (KTH Stockholm) and further on published in [76].
5.3.1 Precipitation Hardening
The interparticle distances according to eq. (13), on page 21, are illustrated in Figure 27(A)-
(B) and Figure 28(A)-(B) as a function of the ageing time at 650°C and 750°C, respectively. Eq.
(13) does not take into account the influence of climb. The smallest interparticle spacing is
observed for the secondary Z-phase (primary Z-phase is not considered). Small spacing is also
found for secondary Nb(C,N) (primary Nb(C,N) is not considered) and at 650°C for Cr3Ni2SiN
(η). However, at longer times, Nb(C,N) is transformed to Z-phase and disappears. In spite of
the increase in volume fraction of η with ageing time, see Figure 23, its interparticle spacing
increases at longer times due to the increase in particle radius and dissolution of small η
particles. For Z-phase and Nb(C,N) on the other hand there is no increase in the interparticle
spacing until Nb(C,N) starts to dissolve.
A
B
Figure 27: (A) Interparticle spacing, eq. (13) and (B) Orowan strength, eq. (12) versus time for 25Cr-20Ni-Nb-N at 650°C.

Stojan Vujić Results and Discussion
63
A
B
Figure 28: (A) Interparticle spacing, eq. (13) and (B) Orowan strength, eq. (12) versus time for 25Cr-20Ni-Nb-N at 750°C.
Figure 27(B) and Figure 28(B) show that the main contribution to the Orowan strength
according to eq. (12), on page 21, comes from the Z-phase. In [77] it is reported that the
elongated shape of precipitates decreases the interparticle spacing and further on increases
the creep strength. To remind once again, for the simulation of secondary Z-phase and
M23C6.gb precipitates a shape factor (relationship length/width of precipitate) of 3 is applied.
The effect of this particle shape factor on the resulting creep strength turned out to be quite
small following the procedure by Sonderegger et al. [78].
The interparticle spacing Lpart tot when all particles types are considered is shown in Figure
27(A), Figure 28(A) and marked as total. The total contribution to the Orowan strength σpart tot
is illustrated in Figure 27(B), Figure 28(B) and marked as total. Again, it can be seen that the
dominant contribution comes from the Z-phase at long times. At 100,000h the predicted
Orowan strength is 56 MPa at 650°C and 50 MPa at 750°C.
When climbing is taken into account, the particle strength is reduced with increasing
temperature and time, as illustrated in Figure 29. At times up to 10,000h at 650°C, the effect
of climbing is small. However, at longer times at 650°C and particularly at 750°C, climbing
strongly reduces the strength contribution. The reason is that at longer times, there is more
time available for climbing and at a higher temperature the climbing is faster.

Stojan Vujić Results and Discussion
64
Figure 29: Particle strengthening for the material 25Cr20NiNbN versus creep time. The Orowan strength, eq. (12) is compared to the particle hardening (PH) when climb is taken
into account, eq. (15).
5.3.2 Solid Solution Hardening
The modelling for the solid solution is shown in chapter 3.2.2.3 on page 24. There are two
main elements contributing to the solid solution hardening: from niobium and from nitrogen.
The concentration of niobium solutes around an edge dislocation is presented in Figure 30.
The distribution of Nb-solutes around a dislocation is highly localised. The maximum
concentration can be more than a factor of 100 higher than the average solute content in the
matrix. The maximum content decreases somewhat with increasing temperature. Fermi-Dirac
statistics means that one atom can only be placed in one atomic position, which is not the
case for Boltzmann statistics. However, there is only a small difference between the two types
of statistics.
A
B
Figure 30: Concentration of niobium solutes around an edge dislocation A) at 650°C and B) at 750°C. The dislocation is either non-moving (static, eq. (23)) or climbing in the y-direction,
eq. (24).

Stojan Vujić Results and Discussion
65
The maximum absolute solute concentration is given in Figure 31. In spite of the fact that
the solute concentration in the matrix increases with temperature, the maximum
concentration is reduced, since the drop in c/c0 at the dislocation is faster.
Figure 31: Maximum Nb-solute concentration solute at dislocation versus temperature for a creep time of 100 kh according to eq. (24).
The result for the solid solution hardening of niobium is shown in Figure 32(A). According
to the precipitation computations, 0.0001 Nb at 650°C and 0.0008 Nb (wt.%) at 750°C remain
in solid solution after 100,000h. The low amount of Nb in solid solution is the main reason for
the small solid solution hardening effect, less than 1MPa. The solid solution hardening
decreases when increasing temperature and time. In Figure 32, the equilibrium content of Nb
in solid solution has been used. If the amount from the precipitation calculations is used
instead, the magnitude of the solid solution hardening would be even smaller. Chromium,
nickel and manganese have very small lattice misfit parameters (ε≈1% or less) [15] and the
resulting solid solution hardening is negligible. It should be recalled that it varies exponentially
with the misfit parameter.

Stojan Vujić Results and Discussion
66
A
B
Figure 32: Solid solution hardening due to (A) Nb according to eq. (26) and (B) N according to eq. (29) versus creep time at different temperatures.
The result for the solid solution hardening of nitrogen is shown in Figure 32(B). The solid
solution hardening effect from nitrogen is between 5 and 10MPa, and it is only weakly
temperature and time dependent. In principle, carbon could also give a contribution to solid
solution hardening, but the amount of carbon in solid solution is very small and the
contribution to the creep strength is negligible.
5.3.3 Dislocation Hardening
The contribution from the dislocations to the creep strength disl is derived from the
minimum creep rate min according to eq. (9) on page 19. The minimum creep rate is in turn
derived from the Monkman-Grant relation
𝜀�̇�𝑖𝑛 =𝐶𝜀𝑅
𝑡𝑅 (31)
where C is a constant of the order of unity, R is the creep elongation at rupture and tR the
rupture time. Unfortunately, data for the creep elongation at rupture is not available. One
approach is then to take the rupture elongation from a related steel. For example, 25Cr-20Ni
(TP310) has a typical rupture elongation of a little less than 0.05 (5%) [79]. Since some creep
rate data exist for 25Cr-20Ni-Nb-N [24], the product CR can be computed. The resulting values
for the product vary between 0.02 and 0.07 in an essentially non-systematic way. The average
value 0.04 has been used in the computations.
Alternatively, the creep rupture can be predicted taking creep cavitation into account. This
has been done for other austenitic steels such 18Cr-10Ni (304), 17Cr-12Ni-Ti (321) and 17Cr-
12Ni-2Mo (316) [80]. The analysis demonstrates that the Monkman-Grant and the cavitation
give quite similar results. In the present the cavitation approach has not been chosen since
25Cr20NiNbN
N
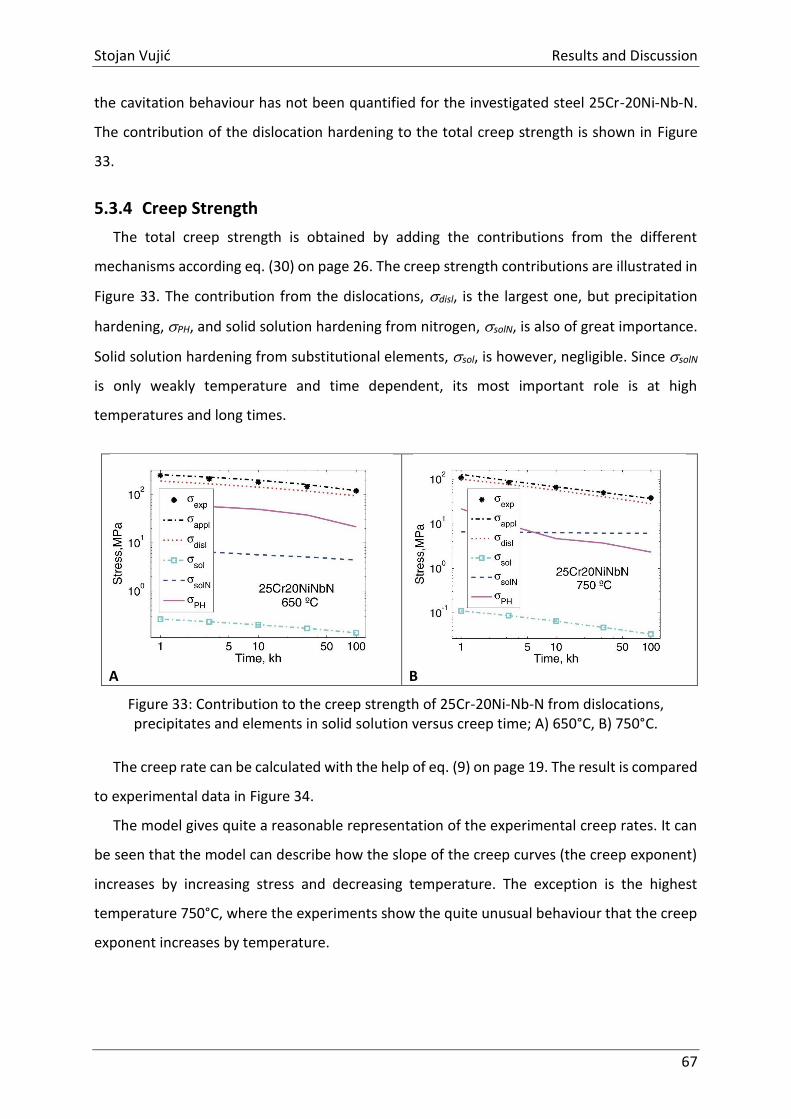
Stojan Vujić Results and Discussion
67
the cavitation behaviour has not been quantified for the investigated steel 25Cr-20Ni-Nb-N.
The contribution of the dislocation hardening to the total creep strength is shown in Figure
33.
5.3.4 Creep Strength
The total creep strength is obtained by adding the contributions from the different
mechanisms according eq. (30) on page 26. The creep strength contributions are illustrated in
Figure 33. The contribution from the dislocations, disl, is the largest one, but precipitation
hardening, PH, and solid solution hardening from nitrogen, solN, is also of great importance.
Solid solution hardening from substitutional elements, sol, is however, negligible. Since solN
is only weakly temperature and time dependent, its most important role is at high
temperatures and long times.
A
B
Figure 33: Contribution to the creep strength of 25Cr-20Ni-Nb-N from dislocations, precipitates and elements in solid solution versus creep time; A) 650°C, B) 750°C.
The creep rate can be calculated with the help of eq. (9) on page 19. The result is compared
to experimental data in Figure 34.
The model gives quite a reasonable representation of the experimental creep rates. It can
be seen that the model can describe how the slope of the creep curves (the creep exponent)
increases by increasing stress and decreasing temperature. The exception is the highest
temperature 750°C, where the experiments show the quite unusual behaviour that the creep
exponent increases by temperature.

Stojan Vujić Results and Discussion
68
Figure 34: Stationary creep rate of 25Cr-20-Ni-Nb-N compared with experimental data from [24] at 600 to 750°C.
5.3.5 Discussion
In spite of the increase in radius of the Z phase during the ageing, Figure 23 on page 52, the
increase in volume fraction gives a net reduction in the interparticle spacing and an increase
in the Orowan strength, Figure 27 and Figure 28 on page 62. For the phase the increase in
particle radius is faster than the increase in phase fraction. Consequently, its Orowan strength
contribution is reduced with ageing times, Figure 27 and Figure 28. The radius and fraction of
M23C6.gi particles are constant at long ageing times, and as a result the Orowan strength
contribution is unchanged. The same applies to M23C6.gb except at very long times where
coarsening of the particles appears and the Orowan strength contribution drops. The strength
contribution from is quite small. Due to the rapid increase in phase fractions at long times,
no drop in strength contribution is found.
According to Figure 33 on page 67, the dominant contribution to the creep strength comes
from the dislocations. Due to the combination of climb and glide in the eq. (11) on page 20,
the variation of the creep exponent can be represented. The inverse slope m is 10.5 at short
times and 3.9 at long times at 650°C. At the higher temperature 750°C, the corresponding
values are m = 3.3 and m = 3.1, respectively. If glide had not been taken into account the
inverse slope would have been constant, m = 3.
Figure 27 and Figure 28 on page 62 show that the total Orowan strength is fairly
independent of ageing time except for an initial rise at short times. When climb is taken into
account, the precipitation hardening drops with increasing creep time, see Figure 29 on page
64 and Figure 33 on page 67. The drop is much higher at the higher temperature due to a

Stojan Vujić Results and Discussion
69
faster climb rate. Consequently, fewer particles will contribute to the creep strength, since the
dislocations will be able to climb across also somewhat larger particles.
Two types of solid solution hardening have been analysed for substitutional and interstitial
elements, respectively. Both types of solutes slow down the movement of the dislocations
due to the lattice misfit to the host atoms. The substitutional elements give rise to a drag force
on moving dislocations. The model for substitutional elements has been verified against
experiments for Ni-20Cr-(6W) [15]. This alloy has the advantage that practically all W is in solid
solution. This means that the complication for austenitic stainless steels where the
substitutional element contribute to both particle and solid solution hardening is avoided. In
spite of the fact that Nb has a large lattice misfit parameter, the solid solution hardening is
small for the investigated steel. The reason is that the concentration of niobium in solution is
quite small. The temperature and time dependence for this type of solid solution hardening is
about the same as that of the dislocation hardening. The main effect of Nb in solution is that
it increases the activation energy by the interaction of solutes and dislocations. When the
dislocations climb, the cloud of solutes is quite narrow and the solutes will jump in and out of
the cloud, which requires thermal activation. The additional activation energy explains why
the activation energy for creep is considerably higher than that for self-diffusion for austenitic
stainless steels.
The effect of interstitial elements on the solid solution hardening has also been analysed.
From experiments and modelling of creep in copper doped with phosphorus, the influence of
fast diffusing elements in solid solution has been studied. 50 wt. ppm P, all in solid solution,
gives a large increase in the creep strength [18] as well as a large improvement in the creep
ductility [17]. The assumption is that the P solutes are locked to the dislocations and that a
break stress is needed to make the dislocations move [18]. The magnitude of the break stress
gives the solid solution hardening. The model utilised in the present paper reproduces the
influence of P on creep in copper [15]. Thus, this provides experimental verification of the
model. The same mechanism is assumed to apply to nitrogen in solid solution in the
investigated austenitic stainless steel. The break stress is proportional to the amount of
nitrogen in the solute cloud around a dislocation. The resulting break stress is only weakly
temperature and time dependent, which means that this strength contribution is important
also at long times.

Stojan Vujić Results and Discussion
70
Diffusion creep has not been considered in the analysis. The reason is that the applied
stress must be below about 5 MPa to give a creep exponent of unity, which is associated with
the diffusion creep. This can be seen by considering a paper by Nilsson and Dunlop on a 20Cr
30NiTi steel [81], which is a steel with somewhat similar properties to 310NbN. They observed
a creep exponent of unity below 5 MPa at 800°C. In another study on 20Cr25NiNb at 750°C
creep was investigated at low stresses [82]. The shear stresses were 2.5 to 12.5 MPa
corresponding to tensile stresses of 7.5 to 38 MPa taking the Taylor factor into account. In the
paper they suggested that creep was controlled by Coble creep, but that is not realistic since
the creep exponent was about three. If the creep rate is estimated with help of the dislocation
model in the present paper it gives a creep exponent of three and a creep rate that is only a
factor of three lower than the observed value. It can be concluded that the model gives a
reasonable representation of the creep behaviour also at low stresses. Only at very low
stresses diffusion creep is of importance. Unfortunately, there are considerable uncertainties
in applying creep diffusion models [83]. For example for the results in [81] the creep rate
computed with Nabarro-Herring’s and Coble’s formulae is an order of magnitude lower and
an order of magnitude higher than the observed value, respectively. For these reasons
diffusion creep has not been considered in the present model.
Another mechanism that could influence the creep strength is the climb of extended
dislocations. With decreasing stacking fault energy the distance between the partial
dislocations is increased, which would be expected to give a reduced creep rate for a given
applied stress. Argon and Moffatt [84] derived an expression for the influence of the stacking
fault energy on the creep rate. They obtained an expression where the creep rate was
proportional to the square of the stacking fault energy. However, this does not seem to be
consistent with creep data for austenitic stainless steels. We can take 304 (18Cr-10Ni) and 316
(17Cr-12Ni-2Mo) as an example. Their creep strength is essentially controlled by recovery of
dislocations and the creep strength of 316 is only slightly higher than that of 304: However,
304 has a lower stacking fault energy than 316, which would suggest that the former material
should have the largest creep strength in contrast to the observations. Similar results are
obtained when the creep strength of other austenitic stainless steels are compared. It must
be concluded that the effect of the stacking fault on the creep strength is limited. To sum up,
the three dominating contributions to the creep strength of austenitic stainless steels come
from the dislocations, precipitates and elements in solid solution.

Stojan Vujić Results and Discussion
71
5.3.6 Summary
In corporation with Prof. Sandström (KTH Stockholm) a creep strength modelling of the
austenitic stainless steels 25Cr-20Ni-Nb-N is performed. The results can be summarized as
follows:
There are three main contributions to the creep strength from dislocations,
precipitates and elements in solid solution.
Hardening due to forest dislocations gives the largest contribution to the creep
strength. A model originally developed for copper in the power-law break down
regime was applied. The model could reproduce the observed variation in the slope
of the creep rupture curve with temperature.
When predicting the precipitation hardening, the particle distributions obtained
from the modelling of the ageing of the alloy were used. Climb across the particles
reduces the creep strength. After long time exposure at high temperatures more
particles are climbed, thus the creep strength is reduced. It is assumed that only
particles that are large enough and cannot be passed by climbing dislocations
contribute to the creep strength as suggested by a number of previously performed
studies.
Nb in solid solution gives rise to a drag stress by forming solute clouds around the
dislocations. However, this strength contribution is negligibly small. N in solid
solution is assumed to be locked to the dislocations to a large extent. Thus a break
stress is needed in order to move the dislocations. This contribution to the creep
strength is fairly independent of creep time and temperature.
The model for the creep rate can in a reasonable way describe how the creep
exponent is increasing with increasing stress and decreasing temperature.
Taking into account the different contributions to the creep strength, the total creep
strength can be predicted. It is in agreement with the experimental value.


73
The procedure for the modification of the 25Cr-20Ni-Nb-N austenitic steel is shown in
Figure 35. The process can be split up into seven sections: (1) Start condition; (2) Objectives;
(3) Calculation; (4) Manufacturing; (5) Testing; (6) Investigation; and (7) Evaluation. With the
help of (1) already performed precipitation evolution (see chapter 5.2.2 on page 50) and the
(2) objectives, additional (3) precipitation calculations are performed where the modified
composition for the 25Cr-20Ni-Nb-N austenitic steel is defined.
Figure 35: Applied modification process for 25Cr-20Ni-Nb-N austenitic steel.
6 Modification of 25Cr-20Ni-Nb-N Austenitic Steel

Stojan Vujić Modification of 25Cr-20Ni-Nb-N Austenitic Steel
74
Using the modified composition, (4) seamless tubes for superheater application are
produced. Afterwards, creep samples are manufactured in order to perform (5) creep and
thermal exposure tests. The isothermal exposure tests are performed with the head section
of the premature fractured creep samples. When the tests are completed, the microstructure
is (6) investigated by LOM and SEM technique. Finally, the microstructure results of the
modified steel are (7) evaluated with respect to the objectives.
6.1 Objectives
The chemical composition of the 25Cr-20Ni-Nb-N steel is changed in order to modify the
precipitation evolution. To avoid a completely new material standardisation process, which is
very time- and cost-intensive, the modification of the microstructure is performed within the
ASTM standard of the 25Cr-20Ni-Nb-N steel. The upper and lower limits of the ASTM standard
are presented in Table 12.
Table 12: Limits for the modification of the chemical composition in wt.%.
C Si Mn Cr Ni Nb N
MAX 0.100 0.75 2.0 26.0 23.0 0.60 0.350
25Cr-20Ni-Nb-N (Non-modified)
0.062 0.38 1.2 24.7 20.6 0.44 0.182
MIN 0.040 0.0 0.0 24.0 17.0 0.20 0.150
The modification process contains several objectives. These objectives are defined by the
MACPLUS project partners and are listed below:
1. In order to avoid a new material standardisation process, the modified composition
must be within the ASTM standard of 25Cr-20Ni-Nb-N steel.
2. The corrosion attacks by Iron-alkali sulfate increase to a maximum at 700°C [9].
Since the austenitic steels are operating in this temperature range, a strong
corrosion attack is expected. A high chromium content is an effective way to
increase the corrosion resistance. Therefore, the chromium content in the modified
steel must be at least 25wt.% to guarantee sufficient corrosion resistance at high
temperature.
3. The intermetallic σ-phase in lumpy form is expected to have detrimental effect on
the mechanical behaviour of stainless steels. In [9] it is reported that the σ-phase is
very brittle, and therefore its formation reduces the ductility and fracture
toughness. In addition, its formation causes a depletion of chromium in the matrix

Stojan Vujić Modification of 25Cr-20Ni-Nb-N Austenitic Steel
75
which in turn decreases the corrosion resistance. Calculations show that σ-phase in
the 25Cr-20Ni-Nb-N steel shows a very fast growth, a high phase fraction (≈10%)
and a mean radius of more than 2,500nm after 100,000h ageing at 650°C. This high
σ-phase fraction causes a depletion of chromium (from 25 to 20%) in the matrix, as
can be seen in Figure 36(A). In order to demonstrate the importance of chromium,
the total corrosion (scale thickness plus penetration) of several austenitic steels
exposure at 650°C in environment of coal ash and 10% alkali sulfate and
with/without 5% NaCl is shown in Figure 36(B). For service in superheater
applications, the corrosion rate should be smaller than <0.5mm/y [85]. The
chromium content of each steel is noted on the top of the bars. When the total
corrosion in NaCl rich environment (black bars) is analysed, it can be seen, that
steels with low chromium content such as 347HFG (18%Cr), have several times
higher total corrosion rate per year than high chromium steels such as HR3C
(25%Cr). This in turn means that the depletion of chromium (by formation of σ-
phase, see Figure 36(A)) can drastically increase the total corrosion of investigated
25Cr-20Ni-Nb-N austenitic steel. Summarizing all these findings, the major objective
of the modification process is to supress the formation of σ-phase.
Figure 36: Depletion of chromium in matrix of investigated 25Cr-20Ni-Nb-N steel (A) and scaling rate plus penetration rate for several austenitic steels after exposure in presence of
various deposits (5 wt% NaCl) [85] (B) at 650°C.
4. In addition to corrosion resistance, the creep strength of austenitic steels is of great
importance for superheater applications. Therefore, one additional objective is to
avoid a loss of creep strength in the modified austenitic steel. It is shown in Figure
27(B) and Figure 28(B) on page 63 that fine precipitates such as secondary Nb(C,N)
20
21
22
23
24
25
0.01 0.1 1 10 100 1000 10000100000
Cr
con
ten
t in
mat
rix
/ w
t%
Time / hA
Depletion of chromium
in the matrix
B
25%
18%Cr
25%
25%
20%21%23%
20%

Stojan Vujić Modification of 25Cr-20Ni-Nb-N Austenitic Steel
76
and Z-phase contribute significantly to the creep strength. In order to avoid a loss,
and/or to increase the creep strength, the Z-phase and Nb(C,N) phase fractions
should be increased and mean radii decreased.
5. In [7] it is reported that at high stresses the fracture mainly occurs along grain
boundaries, by grain boundary sliding. Small grain boundary precipitates, such as a
M23C6-film in Figure 16 on page 38, are expected to promote grain boundary sliding.
According to [7], large grain boundary precipitates with low interparticle spacing
are promising against grain boundary sliding. Therefore, one additional objective is
to increase the size and decrease the interparticle spacing of grain boundary
precipitates.
The modification process is performed by equilibrium-, Scheil- and kinetic-calculations
using the software MatCalc. The calculations are performed with the same setup mode as
described in chapter 4.3 on page 28.
6.2 Thermodynamic and Thermokinetic Calculations
6.2.1 Results
Several equilibrium calculations are performed to demonstrate the influence of the main
chemical elements such as chromium, carbon, nitrogen and niobium on the phase fractions in
the 25Cr-20Ni-Nb-N steel. The results of these calculations for 650°C are presented in Figure
37. On the horizontal axis a lower and higher content (compared to the non-modified
composition) of chromium, carbon, nitrogen and niobium is shown. On the vertical axis the
change of phase fraction relative to the non-modified composition is shown. As can be seen,
the chromium content has a significant influence on the σ-phase. A higher chromium content
(26% Cr) increases the fraction of the σ-phase whereas a lower content (22% Cr) decreases it.
The carbon content mostly influences the phase fraction of M23C6. A higher amount of carbon
(0.08% C) increases the fraction of M23C6 whereas a lower amount (0.05% C) decreases it. The
nitrogen content has an effect on both σ- and η-phase. A lower content of nitrogen (0.14% N)
increases the fraction of σ-phase and decreases the fraction of η-phase. The opposite is
observed when higher nitrogen content (0.25% N) is used. The niobium content has a major
influence on the Z-phase but also, to a lesser extent, on the η- and σ-phase. A higher content
of niobium (0.6% Nb) increases the fraction of the Z-phase and σ-phase, whereas the η-phase
fraction is decreased. The opposite happens when a lower niobium content (0.3% Nb) is used.

Stojan Vujić Modification of 25Cr-20Ni-Nb-N Austenitic Steel
77
Since the results for 750°C equilibrium temperature are similar to the 650°C, they are not
presented in the figure.
Figure 37: Influence of Cr, C, N, Nb on equilibrium phase fractions at 650°C.
The equilibrium calculations are restricted to a condition with infinite exposure time at
constant temperature. No influence of heat treatment and microstructure such as grain size
and primary precipitates can be considered in the equilibrium calculations. Therefore, it is not
useful to modify the chemical composition only on the base of equilibrium calculations.
Considering that, precipitation kinetics calculations are performed. In total many precipitation
calculations with different compositions are performed. Using the results from equilibrium
calculations as well as precipitation calculations by MatCalc a modified (most promising)
composition is defined, as shown in Table 13.
Table 13: Modified chemical composition (wt%) of 25Cr-20Ni-Nb-N steel.
C Cr Si Ni Nb Mn N W Cu
25Cr-20Ni-Nb-N (Non-modified)
0.062 24.7 0.38 20.6 0.44 1.2 0.1819 - -
Modified 0.062 25.0 0.38 20.6 0.60 1.2 0.3500 0.5 0.5
Table 13 shows that the carbon, silicon, nickel and manganese contents remain unchanged.
The chromium content is slightly increased to provide high corrosion resistance. The niobium
content is increased to the maximum allowed amount of 0.6% to promote the formation of
fine Z-phase. The nitrogen content is increased to the maximum allowed amount of 0.35% to
promote the Z-phase formation and to avoid σ-phase formation. A higher content of nitrogen
and niobium is expected to increase the creep strength, as shown in Figure 5 on page 18.
Tungsten is added to the maximum allowable amount of 0.5% to increase the solid solution
-60%
-50%
-40%
-30%
-20%
-10%
0%
10%
20%
30%
40%
22Cr 26Cr 0.05C 0.08C 0.14N 0.25N 0.3Nb 0.6Nb
Ph
ae f
ract
ion
s re
lati
on
ship
be
twe
en
m
od
ifie
d a
nd
de
fau
lt c
om
po
siti
on
s
σ M23C6 η Z

Stojan Vujić Modification of 25Cr-20Ni-Nb-N Austenitic Steel
78
hardening [7]. Sanicro 25 is a newly developed austenitic steel for USC/A-USC power plant
applications. Its chemical composition is similar to the steel investigated in this thesis with one
difference: Sanicro 25 contains 3% copper, which promotes the precipitation of fine Cu-rich
precipitates and which are expected to be important for the creep strength. In order to
achieve a similar effect, the copper content in the modified austenitic steel is increased to the
maximum allowable amount of 0.5%.
Figure 38 shows a comparison between the modified and non-modified composition at 650
and 750°C after 100,000h. On the horizontal axis the precipitates are presented. On the
vertical axis the change of phase fraction and mean radii relative to the non-modified
composition is shown. As can be seen, the fraction of M23C6.gb is lower, whereas the fraction
of M23C6.gi is higher. The detrimental σ-phase is completely suspended at 650 and 750°C. No
Nb(C,N)(prim) are present. The phase fraction of secondary Nb(C,N) and Z(prim) is higher. The
fraction of secondary Z-phase is lower. A higher η-phase fraction is predicted for both 650 and
750°C.
Figure 38: Precipitates phase fractions and mean radii of modified composition (related to non-modified composition) at (A) 650°C and (B) 750°C after 100,000h exposure time.
6.2.1.1 Discussion
The modified composition is in the ASTM standard of the 25Cr-20Ni-Nb-N steel, that means
that the first objective is achieved. Considering the second objective, the chromium content
is slightly increased (from 24.7 to 25%Cr), therefore a sufficient high corrosion resistance is
expected. The third and major objective was to supress the formation of σ-phase. Figure 38
shows that almost no σ-phase is present at 650 and 750°C. It is expected that the absence of
-100%
-75%
-50%
-25%
0%
25%
50%
75%
100%
125%
150%
175%
Re
lati
on
ship
be
twe
en
mo
dif
ied
an
d n
on
-m
od
ifie
d c
om
po
siti
on
A
Phase fractions Mean radii
-100%
-75%
-50%
-25%
0%
25%
50%
75%
100%
125%
150%
175%
Re
lati
on
ship
be
twe
en
mo
dif
ied
an
d n
on
-m
od
ifie
d c
om
po
siti
on
B
Phase fractions Mean radii

Stojan Vujić Modification of 25Cr-20Ni-Nb-N Austenitic Steel
79
σ-phase should increase the ductility and fracture toughness of modified steel. Additionally,
the solute chromium in modified steel (≈24%Cr after 100,000h) is significantly higher
compared to the non-modified steel (≈20%Cr after 100,000h), as shown in Figure 39. As a
result, a higher corrosion resistance of the modified composition is expected.
Figure 39: Chromium content in the matrix of non-modifeid and modified steel.
It is shown in Figure 27(B) and Figure 28(B) on page 63 that fine Z-phase and Nb(C,N)
precipitates are most important for the creep strength of the 25C5-20Ni-Nb-N steel. In order
to achieve a high creep strength by precipitation hardening, a high precipitates phase fraction
and small radius is necessary. Figure 40 shows the evolution of Z-phase and Nb(C,N)
precipitates in the non-modified and modified steel at 650 and 750°C exposure. When the Z-
phase is analysed, it can be seen that at beginning of the exposure the phase fraction of Z-
phase is higher in modified composition compared to the non-modified. At later exposure
times the Z-phase fraction in non-modified composition becomes higher. The mean radius of
the Z-phase is higher within whole exposure time in modified composition compared to non-
modified. As a result, the interparticle spacing of Z-phase (see Figure 40(E, F)) is lower in non-
modified composition. Summarizing these observations about Z-phase, it can be expected that
the contribution of Z-phase to the creep strength is lower (due to the higher interparticle
spacing) in modified composition than in non-modified. This is not the case for Nb(C,N)
precipitates, where the interparticle spacing is lower in modified composition, and therefore
a higher contribution to the creep strength of Nb(C,N) is expected.
Non-modified
Modified
20
21
22
23
24
25
0.01 0.1 1 10 100 1000 10000 100000
Cr
con
ten
t in
mat
rix
/ w
t%
Time / h

Stojan Vujić Modification of 25Cr-20Ni-Nb-N Austenitic Steel
80
650°C 750°C
Figure 40: Evolution of phase fractions (A, B), mean radii (C, D) and interparticle spacing (E, F)) of secondary Z-phase and Nb(C,N) in modified and non-modified composition.
Additional to the Z-phase and Nb(C,N) precipitates, the contribution of nitrogen to the
creep strength by solid solution is also of great importance, as presented in Figure 32(B) on
Nb(C,N)
Nb(C,N)
Z
Z
0
0.1
0.2
0.3
0.4
0.5
1 10 100 1000 10000 100000
Ph
ase
fra
ctio
n /
%
Time / hA
Non-modifiedModified
Nb(C,N)
Nb(C,N)
Z
Z
0
0.1
0.2
0.3
0.4
0.5
1 10 100 1000 10000 100000
Ph
ase
fra
ctio
n /
%
Time / hB
Non-modifiedModified
Nb(C,N)
Nb(C,N)Z
Z
0
5
10
15
20
25
30
1 10 100 1000 10000 100000
Me
an r
adiu
s /
nm
Time / hC
Non-modifiedModified
Nb(C,N)
Nb(C,N)
Z
Z
0
5
10
15
20
25
30
1 10 100 1000 10000 100000
Me
an r
adiu
s /
nm
Time / hD
Non-modifiedModified
Nb(C,N)
Nb(C,N)
ZZ
0
200
400
600
800
1000
1200
1400
1600
1 10 100 1000 10000 100000
Inte
rpar
tice
l sp
acin
g /
nm
Time / hE
Non-modifiedModified
Nb(C,N)
Nb(C,N)
Z
Z0
200
400
600
800
1000
1200
1400
1600
1 10 100 1000 10000 100000
Inte
rpar
tice
l sp
acin
g /
nm
Time / hF
Non-modifiedModified

Stojan Vujić Modification of 25Cr-20Ni-Nb-N Austenitic Steel
81
page 66. It is expected that a higher nitrogen content increase the creep strength (see Figure
5 on page 18). The evolution of nitrogen content in solid solution of non-modified and
modified composition is shown in Figure 41. As can be seen, the nitrogen content is two times
higher in modified composition compared to non-modified. Therefore, a higher contribution
from solid solution hardening by nitrogen in modified composition is expected.
Figure 41: Evolution of nitrogen content in solid solution in modified and non-modified composition at 650 and 750°C.
Summarizing the observations about precipitation hardening by Z-phase, Nb(C,N) and solid
solution hardening by nitrogen in modified composition, it can be concluded that on the one
hand the precipitation hardening by Z-phase is lower, but on the other hand the precipitation
hardening by Nb(C,N) and solid solution hardening by nitrogen is higher. Furthermore, the
modified composition contains 0.5% tungsten, which in turn increases the solid solution
hardening. Additional to that, creep strength calculations (not presented in this thesis) by Prof.
Sandström (KTH Stockholm) of modified composition are performed where no loss of creep
strength is predicted. Finally, no loss of creep strength in modified composition is expected
and therefore the fourth objective is achieved.
Small precipitates such as Z-phase and Nb(C,N) are obstacles against moving of dislocations
and are therefore of great importance for the matrix strength. This in turn avoid a
transgranular material failure. Additional to that, intergranular failure, by grain boundary
sliding can occur. An effective way to avoid grain boundary sliding are large grain boundary
precipitates with small interparticle spacing [7]. Figure 42 shows the evolution of the phase
fraction, mean radius and interparticle spacing of grain boundary precipitates such as
N_650°C
N_650°C
N_750°C
N_750°C
0.05
0.1
0.15
0.2
0.25
0.3
0.35
0.4
1 10 100 1000 10000 100000
Mat
rix
com
po
siti
on
/ w
t.%
Time / h
Non-modifiedModified

Stojan Vujić Modification of 25Cr-20Ni-Nb-N Austenitic Steel
82
M23C6.gb and η-phase in modified and non-modified composition. As can be seen, the size and
interparticle spacing of M23C6.gb is significantly lower in modified composition compared to
non-modified. When the η-phase radius is analysed, it is similar in both, modified and non-
modified composition. The η-phase interparticle spacing, at late ageing time, is lower in
modified composition. To sum up the observations about grain boundary precipitates, it is to
mention that on the one hand the grain boundary precipitates are smaller which promote
grain boundary sliding in modified composition, but on the other hand the interparticle
spacing is lower that prevents grain boundary sliding. However, no higher resistance against
grain boundary sliding in modified composition is expected, and therefore the fifth objective
is not successfully achieved.
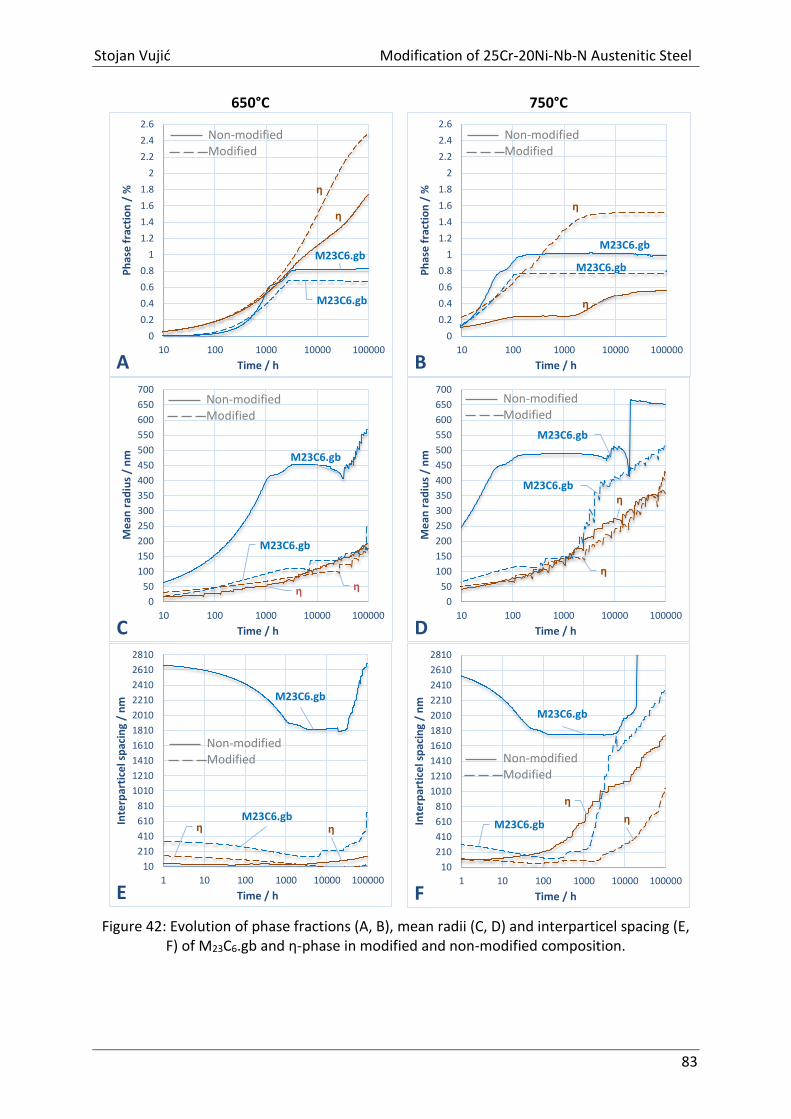
Stojan Vujić Modification of 25Cr-20Ni-Nb-N Austenitic Steel
83
650°C 750°C
Figure 42: Evolution of phase fractions (A, B), mean radii (C, D) and interparticel spacing (E, F) of M23C6.gb and η-phase in modified and non-modified composition.
M23C6.gb
M23C6.gb
η
η
0
0.2
0.4
0.6
0.8
1
1.2
1.4
1.6
1.8
2
2.2
2.4
2.6
10 100 1000 10000 100000
Ph
ase
fra
ctio
n /
%
Time / hA
Non-modifiedModified
M23C6.gb
M23C6.gb
η
η
0
0.2
0.4
0.6
0.8
1
1.2
1.4
1.6
1.8
2
2.2
2.4
2.6
10 100 1000 10000 100000
Ph
ase
fra
ctio
n /
%
Time / hB
Non-modifiedModified
M23C6.gb
M23C6.gb
η η0
50
100
150
200
250
300
350
400
450
500
550
600
650
700
10 100 1000 10000 100000
Me
an r
adiu
s /
nm
Time / hC
Non-modifiedModified
M23C6.gb
M23C6.gb
η
η
0
50
100
150
200
250
300
350
400
450
500
550
600
650
700
10 100 1000 10000 100000
Me
an r
adiu
s /
nm
Time / hD
Non-modifiedModified
M23C6.gb
M23C6.gb
η η
10
210
410
610
810
1010
1210
1410
1610
1810
2010
2210
2410
2610
2810
1 10 100 1000 10000 100000
Inte
rpar
tice
l sp
acin
g /
nm
Time / hE
Non-modifiedModified
M23C6.gb
M23C6.gb
η
η
10
210
410
610
810
1010
1210
1410
1610
1810
2010
2210
2410
2610
2810
1 10 100 1000 10000 100000
Inte
rpar
tice
l sp
acin
g /
nm
Time / hF
Non-modifiedModified
Stojan Vujić Modification of 25Cr-20Ni-Nb-N Austenitic Steel
84
6.2.1.2 Summary
Modification of chemical composition of the 25Cr-20Ni-Nb-N steel is performed. For the
modification process, equilibrium, Scheil and precipitation calculations by MatCalc are
applied. These calculations are carried out by the author at the Institute of Materials Science
and Welding. The results are summarized as follows:
Influence of chromium, carbon, nitrogen and niobium on the equilibrium phases in
the 25Cr-20Ni-Nb-N steel is shown.
The modified composition is within the standard of 25Cr-20Ni-Nb-N steel.
The chromium content in the modified composition is slightly increased to increase
the corrosion resistance.
The σ-phase is almost not present in the modified composition. Therefore a higher
toughness of modified composition is expected.
No loss of creep strength in modified composition is expected.
Finally a modified composition is suggested which can be used for manufacturing of
seamless tubes for superheater applications.

Stojan Vujić Modification of 25Cr-20Ni-Nb-N Austenitic Steel
85
6.3 Material and Experimental
6.3.1 The Modified 25Cr-20Ni-Nb-N Steel
The whole manufacturing process of the modified steel can be classified into production of
the ingot, forging and extruding of the tubes. When the semi ingot was produced, a hot forging
is applied. The chemical analysis of the ingot (heat) as well as the target composition (marked
in red) can be seen in Table 14. Almost all elements are within the modified composition
except carbon which is ≈20% higher than the defined one.
Table 14: Chemical composition (wt%) of modified 25Cr-20Ni-Nb-N ingot.
C Cr Si P Ni Nb Mn N S W Cu
Target 0.062 25.00 0.38 - 20.6 0.60 1.20 0.35 - 0.50 0.50
Heat 0.075 25.27 0.39 0.023 20.3 0.61 1.17 0.34 <0.003 0.46 0.47
After the hot forging is applied, the ingot becomes a polygon like shape, where the outer
surface contains a certain amount of defects and cracks. In order to remove these, a grinding
was applied. Afterwards the polygon like shaped sample is rotary forged to be able to prepare
the sample for the manufacturing of tubes. The tube manufacturing process is shown in Figure
3 on page 9. Some pictures taken during the extrusion process are shown in Figure 43.
Billet being extruded As-extruded tube Hot finished tubes
Figure 43: Modified 25Cr-20Ni-Nb-N austenitic steel during extrusion [26].
The tube parameters such as tube diameter, length, amount, determines what forming
process, cold pilgering or drawing, has to be applied. In the case of the present steel the cold
drawing came out to be more suitable. Both processes have the same effect: (i) to increase
the strength by work hardening and/or (ii) to increase the degree of deformation in order to
adjust the grain size during solution annealing by recrystallization.

Stojan Vujić Modification of 25Cr-20Ni-Nb-N Austenitic Steel
86
Two types of extruded tubes are manufactured. One tube is cold drawn and solution
annealed (at 1230°C for 15min in order to adjust the grain size and to dissolve the precipitates
which have formed during the manufacturing of the tubes) whereas the other one is only
quenched immediately after extrusion.
6.3.2 Creep Exposure Test
In the chapter above, the manufacturing processes of the as-received tubes are explained.
Out of these as-received tubes, creep samples are manufactured. For the creep tests both
type of tubes are used, the first one was cold drawn and solution annealed, whereas the
second one was only quenched immediately after extrusion. The tubes are noted as:
Tube condition ECS (Extruded cold drawn and solution annealed)
Tube condition EQ (Extruded and quenched immediately after extrusion)
The dimension of the ECS tube is 54mm in outer diameter and 7mm in thickness, whereas
the dimension of the EQ tube is 60mm in outer diameter and 8mm in thickness. Creep samples
are manufactured out of the tubes in order to evaluate the creep rupture strength of modified
composition with the creep rupture data of 25Cr-20Ni-Nb-N (HR3C) steel. Since long-term
creep tests are too time consuming, a creep rupture time up to ≈1,000h is chosen, this
corresponds to a stress of ≈250MPa at 650°C and ≈110MPa at 750°C, see Figure 4 on page 17.
In total six creep samples are manufactured. For each tube type (ECS, EQ) three stresses are
chosen:
At 650°C: 250, 300 and 325MPa
At 750°C: 110, 132 and 143MPa.
It is expected that the above mentioned stresses cause a creep rupture up to 1,000h creep
exposure. The creep samples are prepared according the DIN50125 and the location of the
creep samples can be seen in Figure 44. One half of the tubes is used to investigate the tubes
in as-received condition and the other half is used for creep samples preparation.

Stojan Vujić Modification of 25Cr-20Ni-Nb-N Austenitic Steel
87
Figure 44: Location and notation of creep samples.
6.3.3 Isothermal Exposure Tests (Ageing)
The following chapter will show that all creep samples with the modified composition are
ruptured before 1,000h exposure time (longest creep rupture time 682h). These rupture times
are not representative to compare the microstructure with the non-modified steel (shortest
ageing time 1,000h). For a suitable comparison with the non-modified composition, the head
sections of the fractured modified creep samples, which have not been creep-loaded (only
aged), are cut down and subsequently aged at 650 and 750°C until a total time of 1,000h has
been reached.
6.4 Results and Discussion
6.4.1 Microstructure in As-received Condition
The dominant precipitates in the as-received condition are the primary Z-phase
precipitates. They are randomly distributed on grain boundaries and grain interior. In Figure
45(A) a SEM micrograph of an as-received ECS sample is shown. The bright precipitates are
primary Z-phase particles. They contain most niobium, chromium and iron, as shown in the
EDS analysis in Figure 45(B).

Stojan Vujić Modification of 25Cr-20Ni-Nb-N Austenitic Steel
88
Figure 45: Primary Z-phase precipitates in as-received ECS condition (A) and EDS analysis of primary Z-phase (B). A-1: primary Z-phase; A-2: Pores.
More than 560 primary precipitates are analysed. The area fraction varies between 0.3%
and 0.58%. The size distribution is shown in Figure 46. As can be seen, most of the primary
precipitates have a diameter of ≈2µm.
Figure 46: Distribution of primary precipitates in (A) ECS and (B) EQ sample.
6.4.2 Creep Strength and Microstructure at 650°C
EQ and ECS samples are creep exposed at 650°C for 250, 300 and 325MPa. All creep
samples including their rupture times are shown in Figure 47. As can be seen, samples tested
at low stress like 250MPa are ruptured in the head section of the creep sample, whereas
samples tested at high stresses like 300 and 325MPa are ruptured in the load (gauge) section.
There are no significant differences in creep strength between EQ and ECS samples can be
observed. All creep samples do not show any significant reduction of area. When rupture
times of modified composition are compared with HR3C (reference material), see Table 15, it
1
A
2
B Nb
Cr
Fe
NiCr
0
5
10
15
20
25
30
35
40
45
50
2 2.5 3 3.5 4 4.5 5 5.5 6 6.5 7 7.5 > 8
Freq
uen
cy /
%
Diameter / µm A
0
5
10
15
20
25
30
35
40
45
50
1.5 2 2.5 3 3.5 4 4.5 > 5
Freq
uen
cy /
%
Diameter / µm B
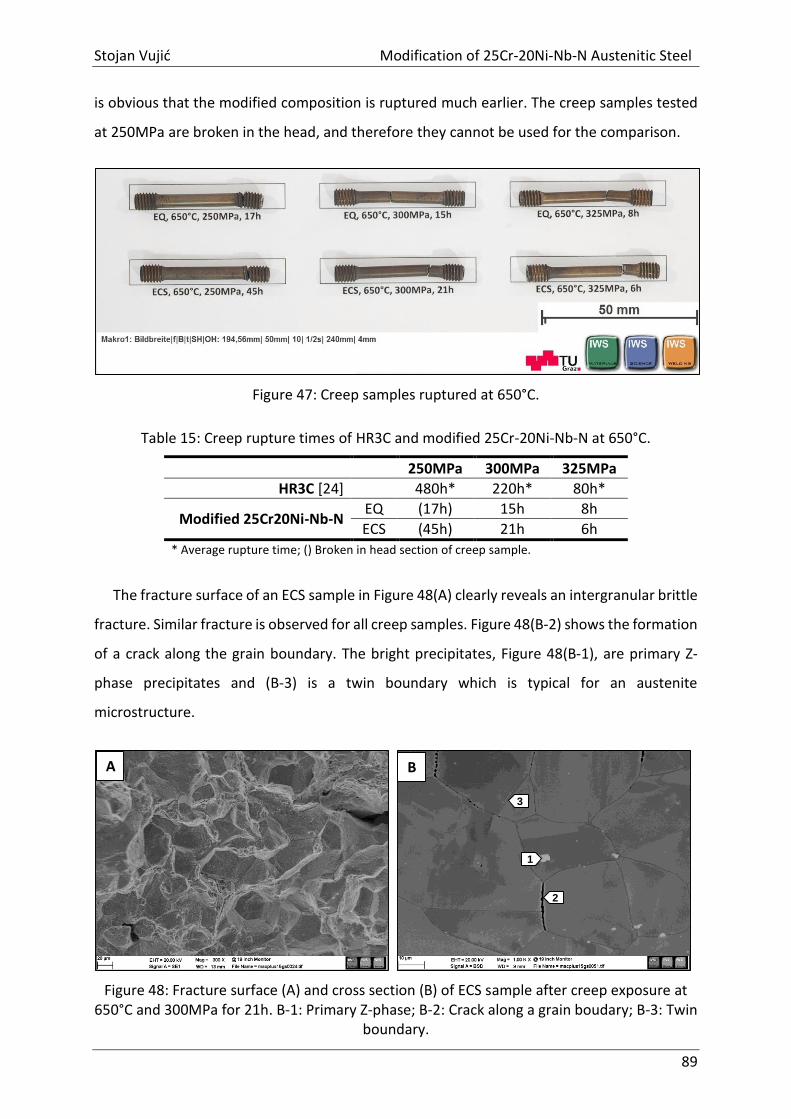
Stojan Vujić Modification of 25Cr-20Ni-Nb-N Austenitic Steel
89
is obvious that the modified composition is ruptured much earlier. The creep samples tested
at 250MPa are broken in the head, and therefore they cannot be used for the comparison.
Figure 47: Creep samples ruptured at 650°C.
Table 15: Creep rupture times of HR3C and modified 25Cr-20Ni-Nb-N at 650°C.
250MPa 300MPa 325MPa
HR3C [24] 480h* 220h* 80h*
Modified 25Cr20Ni-Nb-N EQ (17h) 15h 8h
ECS (45h) 21h 6h * Average rupture time; () Broken in head section of creep sample.
The fracture surface of an ECS sample in Figure 48(A) clearly reveals an intergranular brittle
fracture. Similar fracture is observed for all creep samples. Figure 48(B-2) shows the formation
of a crack along the grain boundary. The bright precipitates, Figure 48(B-1), are primary Z-
phase precipitates and (B-3) is a twin boundary which is typical for an austenite
microstructure.
Figure 48: Fracture surface (A) and cross section (B) of ECS sample after creep exposure at 650°C and 300MPa for 21h. B-1: Primary Z-phase; B-2: Crack along a grain boudary; B-3: Twin
boundary.
A B
1
2
3

Stojan Vujić Modification of 25Cr-20Ni-Nb-N Austenitic Steel
90
In order to compare the microstructure of the modified composition with the non-modified
composition (see chapter 5.1.1 on page 35) in addition to the creep tests an ageing treatment
(up to a total time of 1,000h) is applied. For ageing the head section of an ECS creep sample is
used. Figure 49(A) shows a low magnification and (B) a high magnification of a grain boundary
triple point of an ECS sample aged at 650°C for 1,000h. Besides primary Z-phase precipitates,
no other precipitates such as σ-phase are detected.
Figure 49: Low magnification (A) and high magnification of grain boundary triple point (B) of ECS sample aged at 650°C for 1,000h. A-1: Inclusion; B-1: Primary Z-phase.
6.4.3 Creep Strength and Microstructure at 750°C
EQ and ECS samples are creep exposed at 750°C for 110, 132 and 143MPa. All creep
samples including their rupture times are shown in Figure 50. As can be seen, EQ sample
tested at low stress such as 110MPa is ruptured in the head section of the creep sample,
whereas all other samples are ruptured in the load (gauge) section. All creep samples do not
show any significant reduction of area. When rupture times of modified composition are
compared with HR3C (reference material), see Table 16, it can be seen that the modified
composition is ruptured earlier. The creep sample EQ tested at 110MPa is broken in the head
section, and therefore it cannot be used for the comparison.
A
1
B

Stojan Vujić Modification of 25Cr-20Ni-Nb-N Austenitic Steel
91
Figure 50: Creep samples ruptured at 750°C.
Table 16: Creep rupture times of HR3C and modified 25Cr-20Ni-Nb-N at 750°C.
110MPa 132MPa 143MPa
HR3C [24] 700h* 220h* 180h*
Modified 25Cr20Ni-Nb-N EQ (141h) 211h 119h
ECS 682h 169h 88h * Average rupture time; () Broken in head section of creep sample.
Figure 51(A) shows the fracture surface of an ECS creep sample exposed at 750°C and
110MPa for 682h. The individual grains indicate that fracture occurs along the grain
boundaries. This is also shown in Figure 51(B-2), where cracks formed along grain boundaries.
The bright precipitates, see Figure 51(B-1), are randomly distributed primary Z-phase
precipitates.
Figure 51: Fracture surface (A) and cross section (B) of ECS sample after creep exposure at 750°C and 110MPa for 682h. B-1: Primary Z-phase; B-2: Crack along a grain boundary.
A B

Stojan Vujić Modification of 25Cr-20Ni-Nb-N Austenitic Steel
92
In order to compare the microstructure of the modified composition with the non-modified
composition (see chapter 5.1.2 on page 37), the head of the ECS creep sample
(750°C/110MPa) is cut down and afterwards heat treated up to a total times of 1,000h at
750°C. The microstructure of the aged ECS sample is shown in Figure 52. The primary Z-phase
precipitates are randomly distributed, see Figure 52(A-1). The grain boundaries are
surrounded by η-phase precipitates, see Figure 52(B-2). The EDS analysis of the η-phase and
primary Z-phase is shown in Figure 53(B). As can be seen, when EDS line scan cross the grain
boundary precipitate (see Figure 53(B-1)), the silicon-, nickel- and chromium-intensity
increase, which is an indication for η-phase. No σ-phase precipitate could be observed along
grain boundaries and on grain boundary triple points.
Figure 52: Low magnification (A) and high magnification of grain boundary triple point (B) of ECS sample aged at 750°C for 1,000h. A-1, B-1: Primary Z-phase; B-2: η-Phase.
Figure 53: Grain boundary (A) and EDS analysis of η-phase and primary Z-phase (B) in ECS sample aged at 750°C for 1,000h. A-1, B-1: η-phase; A-2, B-2: Primary Z-phase.
A
1
B
1
A BFe
Si
Ni
Cr
Nb
1 2

Stojan Vujić Modification of 25Cr-20Ni-Nb-N Austenitic Steel
93
6.4.4 Discussion
Results of the creep strength and microstructure evolution of modified austenitic steel are
shown above. In this chapter, the failure of the modified steel, using the results from
microstructure and precipitation calculation evolution will be discussed. Finally, the objectives
of the modification process will be evaluated.
Limited short term creep tests at 650 and 750°C of modified 25Cr-20Ni-Nb-N are
performed. The creep tests are performed for EQ and ECS samples. The rupture times of the
modified composition and the reference material HR3C [24] are shown in Figure 54. When the
rupture times at 650°C is analysed, it can be seen that the modified steel (marked in blue) is
ruptured significantly earlier, compared to the average rupture time of HR3C. The reason for
that will be discussed later. At 750°C (marked in red) the rupture times are close to the average
and particularly within the scatter of HR3C. Further on, it can be seen that the rupture times
of modified composition (ECS samples) are closer to HR3C with increasing exposure time and
decreasing load at 750°C: ΔtR (tR_HR3C – tR_ECS) = 92h for 143MPa, ΔtR=51h for 132MPa and
ΔtR=18h for 110MPa.
Figure 54: Creep rupture time of HR3C and modified 25Cr-20Ni-Nb-N austenitic steel.
750°C
700°C
650°C
600°C
EQ 750°C
ECS 750°C
EQ 650°C
ECS 650°C
32
64
128
256
512
1 10 100 1000 10000 100000
Stre
ss /
MP
a
Rupture time / h
700°C
600°C
750°C
650°C
average curve

Stojan Vujić Modification of 25Cr-20Ni-Nb-N Austenitic Steel
94
SEM investigations are performed to investigate the microstructure of the modified steel.
Due to the low resolution of the SEM, only large precipitates, and fracture surface could be
investigated. Considering the fracture surface, the grain boundaries could be clearly seen,
which indicates that all creep samples are fractured along the grain boundaries. No significant
reduction of area was observed, therefore a low ductility for the modified steel is expected.
Considering the precipitates evolution in the modified steel, primary Z-phase precipitates are
present in all samples. In addition to that, η-phase, having a high Cr-, Ni- and Si-content, is
found along the grain boundaries at 750°C after 1,000h ageing. It is expected that η-phase is
also present at 650°C after 1,000h, but due to the low resolution of the SEM, it could not be
detected. No M23C6 precipitates are found at 650 and 750°C up to 1,000h, this is either due to
the high presence of the η-phase shifting the formation of M23C6 to later times or due to the
low size of M23C6 which could not be detected by the SEM. No σ-phase precipitates are found
at 650 and 750°C after 1,000h. In comparison to that, a high presence of σ-phase precipitates
at grain boundary triple points is found in the non-modified composition, see chapter 5.1.2 on
page 37.
Due to the limited findings out of the experimental investigations, less statements about
the failure mechanism in the modified composition can be done. It is observed that the failure
always occurs along grain boundaries, this indicates that the grain boundaries are weaker than
the matrix. The primary Z-phase precipitates are randomly distributed (most of them are
inside grains), and, if primary Z-phase precipitates would cause the failure, cracks inside grains
should occur, but this was not observed.
The intergranular failure occurs even after short exposure times, this is an indication that
embrittlement has taken place. This is also supported by the low reduction of area. There are
many possible reasons for the low ductility, one of them are coarse particles like primary Z-
phase which would cause a dimple rupture, but this is not observed. However, only a limited
number of investigations were performed where no statement about the cause of low ductility
can be done.
It is shown above that the modified steel is ruptured significant earlier at 650°C compared
to the average rupture time of HR3C. That was not the case for 750°C creep exposure, where
a longer rupture time is observed. In order to discuss the early failure at 650°C, additional
precipitation calculations are performed, using the composition from the chemical analysis of
the modified steel in Table 14 on page 85. Two different calculations at 650°C for 8h and 750°C

Stojan Vujić Modification of 25Cr-20Ni-Nb-N Austenitic Steel
95
for 682h are performed. These calculations should represent the precipitation distribution of
ECS creep exposed samples at 650°C/6h and 750°C/682h. The precipitates phase fractions are
shown in Figure 55. As shown, the phase fractions of the grain boundary precipitate such as
M23C6.gb (0.0008% at 650°C and 0.70% at 750°C) and η-phase (0.03% at 650°C and 1,63% at
750°C) are much lower at 650°C compared to 750°C. This low phase fractions of M23C6.gb and
η-phase may contribute to a low grain boundary strength and further on to preliminary failure
at 650°C. In Figure 27 and Figure 28 on page 63 it is shown that the secondary Z-phase
precipitates are of great importance for the creep strength. The phase fraction of the
secondary Z-phase (0.21% at 650°C and 0,37% at 750°C), which form inside the matrix, is high
at 650 and 750°C. As a consequence, the matrix strength is high. The high matrix strength,
together with low grain boundary strength is probably the reason why the material failure
always occurs along the grain boundaries.
Figure 55: Phase fractions of precipitates at 650°C after 6h (A) and at 750°C after 682h (B) of modified austenitic steel.
As mentioned above, it is assumed that the low phase fraction of grain boundary
precipitates may contribute to the low creep strength. In order to investigate this assumption,
a heat treatment (before creep loading) should be applied to form a sufficient amount of grain
boundary precipitates. According to MatCalc calculations, an isothermal ageing at 850°C for
20h would form a total phase fraction of grain boundary precipitates of 1.9% (=1.3% M23C6.gb
+ 0.6% η-phase). This is significantly higher compared to ruptured ECS sample at 650°C/6h and
it is expected to be sufficient to investigate the effect of grain boundary precipitates on the
creep rupture time.
0.0
00
8
0.0
00
2
0.0
01
0.2
1
0.0
3
0.0001
0.0005
0.0025
0.0125
0.0625
0.3125
1.5625
Ph
ase
fra
ctio
n /
%
A
0.7
0
0.8
6
0.0
3
0.3
7
1.6
3
0.0001
0.0005
0.0025
0.0125
0.0625
0.3125
1.5625
Ph
ase
fra
ctio
n /
%
B

Stojan Vujić Modification of 25Cr-20Ni-Nb-N Austenitic Steel
96
The creep strength, microstructure and failure of modified steel is discussed above. When
the objectives (see chapter 6.1 on page 74) are analysed, following statements can be made:
Related to 1st objective: All chemical elements (except niobium) of modified composition
are within the ASTM standard of 25Cr-20Ni-Nb-N steel, see Table 17. Niobium amount (0.61%)
is slightly higher than allowed (0.6%). Tungsten and copper is not defined in the standard, but
amounts up to 0.5% are allowed.
Table 17: ASTM standard and heat composition of modified 25Cr-20Ni-Nb-N in wt.%.
C Si Mn Cr Ni Nb N W Cu
MAX 0.100 0.75 2.0 26.0 23.0 0.60 0.350 - -
Heat 0.075 0.39 1.17 25.27 20.3 0.61 0.34 0.50 0.50
MIN 0.040 0.0 0.0 24.0 17.0 0.20 0.150 - -
Related to 2nd objective: The chromium content is higher than 25wt%, this should guarantee
a sufficient corrosion resistance at high temperature.
Related to 3rd objective: The rapidly growing σ-phase in the non-modified steel was not
experimentally observed in the modified steel. The formation of σ-phase in modified steel is
successfully suppressed by high nitrogen content, as explained and predicted by the
precipitation calculation in chapter 6.2 on page 76.
Related to 4th objective: As mentioned at the beginning of this chapter, the creep rupture
time of modified composition at 650°C is significantly lower compared to the HR3C, whereas
at 750°C the creep rupture time is within the scatter of HR3C. The loss in creep strength is
quite alarming since the modified composition is within the ASTM standard. Furthermore,
creep strength calculations of modified composition did not predict any loss in creep strength.
The present creep modelling approach can be used when creep cavitation is the main
mechanism for failure. For stainless steels like 304, 316, 321 and 347 it is assumed that the
embrittlement is due to creep cavitation. The results for these steels are in good agreement
with observations and the creep model results are not very different if it is assumed ductile or
brittle rupture. For the modified austenitic steel the embrittlement mechanism is not known,
which makes it difficult to predict the rupture time. It is unlikely that cavitation on its own
would cause the observed embrittlement in the modified steel. However, further
investigations have to be done in turn of the embrittlement of modified steel. Finally, it can
be said that the 4th objective is not achieved.
Related to 5th objective: The performed ageing treatment of 1,000h and low resolution of
SEM were not sufficient to analyse the grain boundary precipitates in a reasonable way.

Stojan Vujić Modification of 25Cr-20Ni-Nb-N Austenitic Steel
97
Therefore, no statement about grain boundary precipitates can be done. Longer ageing
treatments have to be applied in order to evaluate the grain boundary precipitates.
A high corrosion resistance and high creep strength are one of the most important
properties of advanced austenitic steels for applications in USC and A-USC power plants. A
high corrosion resistance is successfully achieved by high chromium content and absence of
σ-phase, but the creep strength is lost. Taking this into consideration, it is expected that this
modified composition is not suitable for USC and A-USC power plant applications.

Stojan Vujić Modification of 25Cr-20Ni-Nb-N Austenitic Steel
98
6.4.5 Summary
Microstructure investigations of modified composition of an austenitic steel 25Cr-20Ni-Nb-
N are carried out for creep exposed and thermally aged samples at 650 and 750°C. For the
investigations LOM and SEM are used. The investigations are carried out by the author at the
Institute of Material Science and Welding. The experimental results are summarized as
follows:
The creep rupture time of modified composition at 650°C is significantly lower
compared to HR3C steel, whereas at 750°C it is within the scatter of HR3C.
All creep samples show intergranular rupture and low reduction of area, indicating
that embrittlement has taken place.
Primary Z-phase precipitates are observed in as-received and all thermally exposed
samples.
At 650°C after 1,000h ageing no secondary precipitates are observed. At 750°C after
1,000h, η-phase precipitates on grain boundaries are found.
In all investigated samples, no σ-phase precipitates are observed. This finding
confirms the accuracy of the precipitation calculations where the σ-phase is
suppressed by high nitrogen content.
Finally, it can be summarized that the σ-phase in the modified composition is supressed
but creep strength is significantly lost.

99
The present thesis deals with the microstructure investigation and calculation of
precipitation evolution in an advanced 25Cr-20Ni-Nb-N austenitic steel for USC and A-USC
power plant applications. Additionally, the hardening mechanisms during creep are evaluated
and a modified composition of a 25Cr-20Ni-Nb-N steel is developed which suppress the
formation of σ-phase. The main findings can be summarized as follows:
Microstructure investigations are carried out for thermally aged samples at 650 and
750°C for 1,000h, 3,000h and 10,000h. Five different precipitates Z-phase, M23C6,
Nb(C,N), η (Cr3Ni2Si(C,N)), σ-phase and two different oxides Al- and Si-oxide are
experimentally found. After long ageing times, the brittle acting σ-phase is found to
be a dominant phase on the grain boundaries. Furthermore, the findings about the
η-phase are used to implement this phase into the thermodynamic database of
MatCalc.
Equilibrium-calculations by MatCalc are carried out where it is shown when Cr2N is
suspended, five different precipitates phases in the temperature range between
400 and 1600°C are predicted: Nb(C,N), Z-phase, M23C6, σ-phase and η-phase. All
these phases are also found experimentally.
Scheil-calculations by MatCalc are carried out to evaluate the amount of primary
precipitates in the 25Cr-20Ni-Nb-N austenitic steel. It is found that the primary Z-
phase is the most prominent primary phase.
Precipitation calculations by MatCalc are carried out considering a solution- and
service-treatment at 650 and 750°C for 100,000h. The precipitation evolutions are
compared with experimental results and analysed in detail. The main findings can
be summarized as follows:
7 Summary

Stojan Vujić Summary
100
o For the precipitation calculations, eight precipitates are considered: M23C6,
σ, primary Z, secondary Z, primary Nb(C,N), secondary Nb(C,N), η (Cr3Ni2SiN)
and G.
o The σ-phase is found to be the most dominant phase on the grain
boundaries at long ageing time.
o With the help of the precipitation calculations and experimental
investigations it is found that the silicon-rich phase in the 25Cr-20Ni-Nb-N
steel is more likely a η-phase and not a G-phase.
o The interactions between the precipitates are studied and compared with
literature. Assumptions from the literature such as the interaction between
MX precipitates with M23C6 and Z-phase are analysed and explained in
detail.
The creep strength is calculated in collaboration with Prof. Sandström (KTH
Stockholm). There are three main contributions to the creep strength from
dislocations, precipitates and elements in solid solution. The contribution from the
dislocations is found to be the highest one.
A modification of the 25Cr-20Ni-Nb-N chemical composition within the ASTM
standard is performed. By the help of the precipitation calculation a modified
composition is defined where the σ-phase formation is suppressed. The chromium
content of the modified composition is kept high to increase the corrosion
resistance.
Superheater tubes using the modified chemical composition are extruded and
creep samples are manufactured. A limited amount of short term creep test at 650
and 750°C are performed to analyse the creep rupture time and the presence of σ-
phase precipitates.
Finally, it can be summarized, that a significant amount of coarse σ-phase precipitates in
an advanced 25Cr-20Ni-Nb-N are observed. With the help of the precipitation calculation with
MatCalc and creep strength modelling by Prof. Sandström (KTH), a modified composition
within the ASTM standard is defined. Using this modified composition, superheater tubes are
produced, where on the one hand no σ-phase is observed, but on the other hand a significant
lower creep strength is measured.

101
Extensive investigations and calculation of the precipitation evolution of an advanced 25Cr-
20Ni-Nb-N austenitic steel are carried out. Therefore, findings and compromises have been
made, which have to be analysed more in detail:
The TEM-EDS analysis of the secondary Z-phase reveal a significant high amount of
nickel (up to 30%). Such high amounts of nickel are not common for this type of
precipitate. Further structure analysis of Z-phase in austenitic steels would be
necessary to analyse the Z-phase in detail.
In [36] creep exposed sample of 25Cr-20Ni-Nb-N steel after 88,363h is investigated.
In this long time creep exposed sample, which is assumed to be close to an
equilibrium condition, no Cr2N phase is found. Similar results are reported by
Sourmail [27], who writes that Cr2N is unlikely when Z-phase is present in austenitic
steels. These findings are not in agreement with MatCalc where Cr2N is predicted
as an equilibrium phase. Further investigations and improvement of Cr2N have to
be done in order to predict Cr2N phase correctly.
It is experimentally shown that the σ-phase is present at 750°C in the 25Cr-20Ni-
Nb-N austenitic steel. In order to stabilize the σ-phase at 750°C an interface energy
correction is applied, which is not a reasonable solution. Further improvement of
thermo-kinetic modelling of σ-phase at high temperature is necessary to avoid the
interface energy correction.
The twin boundaries in austenitic steels are important nucleation sites for many
precipitates such as M23C6 or η-phase. Especially at longer ageing times, when the
precipitates starts to form in grain interior, the twin boundaries as nucleation sites
becomes very important. Therefore, it is necessary to develop a twin boundary
nucleation site model in MatCalc.
8 Outlook

Stojan Vujić Outlook
102
For the non-modified composition it was found by simulation that the temperature
cycle of the manufacturing process does not have a significant influence on the
precipitation evolution during service. Such simulations were not applied to the
modified composition. Therefore, one further task for the outlook is to collect the
data (heating-, cooling-rates and holding times) of the temperature cycle during of
the manufacturing process and to apply it to the precipitation calculation of
modified steel.
The modified composition is investigated by a limited number of short-term creep tests.
Further test and investigations are necessary in order to investigate the modified composition
more in detail:
Further long-term creep tests at 650, 700 and 750°C are necessary to evaluate the
creep strength of modified 25Cr-20Ni-Nb-N austenitic steel.
The formation of σ-phase is analysed by a short-term ageing up to 1,000h. Longer
ageing tests are necessary to evaluate the presence of σ-phase in the modified
steel.
It was shown that the σ-phase formation cause a depletion of chromium in the
matrix. Since no σ-phase was observed in the modified composition, a higher
corrosion resistance is expected. Therefore, corrosion tests of modified
composition should be applied and the results should be compared with the non-
modified composition.
The intergranular failure after short exposure times and low reduction of area is an
indication that embrittlement has taken place in the modified composition. The
reasons for that embrittlement could not be clarified and further investigations
have to be done in order to analyse this phenomenon.
Significant low short-term creep strength of the modified composition is measured.
This was not predicted by the creep strength calculations. One possible explanation
for the different prediction of creep strength could be the embrittlement. The
applied creep strength model is suitable for austenitic steels where the
embrittlement is caused by creep cavitation, which is probably not the only cause
for the degradation in the modified steel. The cause of embrittlement has to be
investigated in order to evaluate the applicability of the present creep model on the
modified austenitic steel.

Stojan Vujić Outlook
103
A further opportunity to calculate the creep strength is to apply another creep
strength model. Recently a new creep strength model for the martensitic steels has
been developed by Yadav et. al [86] at the Institute of Material Science and Welding.
Some input parameters such as dislocation density have to be investigated in order
to adapt the model to the present austenitic steel.


105
[1] World Energy Outlook 2013. Paris: Organisation for Economic Co-operation and Development OECD, 2004.
[2] J. M. Wheeldon and J. P. Shingledecker, “Materials for boilers operating under supercritical steam conditions,” in Ultra-supercritical coal power plants : Materials, technologies and optimisation, D. Zhang, Ed. Woodhead, 2013, pp. 81–103.
[3] G. Booras and N. Holt, “Pulverized coal and igcc plant cost and performance estimates,” Gasif. Technol. Washingt. DC, Oct. 3-6, 2004.
[4] R. Viswanathan, J. F. Henry, J. Tanzosh, G. Stanko, J. Shingledecker, B. Vitalis, and R. Purgert, “U.S. Program on Materials Technology for Ultra-Supercritical Coal Power Plants,” J. Mater. Eng. Perform., vol. 14, no. 3, pp. 281–292, Jun. 2005.
[5] O. Tassa, S. Matera, R. Sandström, J. Zurek, and M. Farooq, “Microstructure Evolution After Long Term High Temperature Exposure of Austenitic 22-25Cr Austenitic Stainless Steels,” Liège, Belgium, in Proc.: 10th Liège Conference on Materials for Advanced Power Engineering, 2014.
[6] S. Vujic, C. Beal, C. Sommitsch, F. Muhammad, R. Sandström, and J. Zurek, “Modelling and optimizing precipitation in creep resistant austenitic steel 25Cr-20Ni-Nb-N,” Waikoloa, Hawaii, in Proc.: Advances in Materials Technology for Fossil Power Plants, 2013.
[7] R. Bürgel, H. J. Maier, and N. Thomas, Handbuch Hochtemperatur-Werkstofftechnik, 4th ed. Vieweg+Teubner, 1998.
[8] R. Sandström, M. Farooq, and B. Ivarsson, “Influence of particle formation during long time ageing on mechanical properties in the austenitic stainless steel 310,” Mater. High
9 References

Stojan Vujić References
106
Temp., vol. 29, no. 1, pp. 1–7, Mar. 2012.
[9] Y. Yin, R. Faulkner, and F. Starr, “Austenitic steels and alloys for power plants,” in Structural Alloys for Power Plants, A. Shirzadi and S. Jackson, Eds. Elsevier, 2014, pp. 105–152.
[10] J. Svoboda, F. D. Fischer, P. Fratzl, and E. Kozeschnik, “Modelling of kinetics in multi-component multi-phase systems with spherical precipitates,” Mater. Sci. Eng. A, vol. 385, no. 1–2, pp. 166–174, Nov. 2004.
[11] E. Kozeschnik, J. Svoboda, P. Fratzl, and F. D. Fischer, “Modelling of kinetics in multi-component multi-phase systems with spherical precipitates,” Mater. Sci. Eng. A, vol. 385, no. 1–2, pp. 157–165, Nov. 2004.
[12] E. Kozeschnik, J. Svoboda, and F. D. Fischer, “Modified evolution equations for the precipitation kinetics of complex phases in multi-component systems,” Calphad, vol. 28, no. 4, pp. 379–382, Dec. 2004.
[13] R. Sandström, M. Farooq, and J. Zurek, “Basic creep models for 25Cr20NiNbN austenitic stainless steels,” Mater. Res. Innov., vol. 17, no. 5, pp. 355–359, 2013.
[14] R. Sandström and J. Hallgren, “The role of creep in stress strain curves for copper,” J. Nucl. Mater., vol. 422, no. 1–3, pp. 51–57, Mar. 2012.
[15] P. A. Korzhavyi and R. Sandström, “First-principles evaluation of the effect of alloying elements on the lattice parameter of a 23Cr25NiWCuCo austenitic stainless steel to model solid solution hardening contribution to the creep strength,” Mater. Sci. Eng. A, vol. 626, pp. 213–219, 2015.
[16] R. Sandström, “Basic model for primary and secondary creep in copper,” Acta Mater., vol. 60, no. 1, pp. 314–322, Jan. 2012.
[17] R. Sandström and R. Wu, “Influence of phosphorus on the creep ductility of copper,” J. Nucl. Mater., vol. 441, no. 1–3, pp. 364–371, Oct. 2013.
[18] R. Sandström and H. C. M. Andersson, “Creep in phosphorus alloyed copper during power-law breakdown,” J. Nucl. Mater., vol. 372, no. 1, pp. 76–88, Jan. 2008.
[19] D. Kothari and P. M. V. Subbarao, “Power Generation,” in Handbook of Mechanical Engineering, K.-H. Grote and E. K. Antonsson, Eds. Springer, 2009, pp. 1361–1419.
Stojan Vujić References
107
[20] J. M. Wheeldon and J. N. Phillips, “An economic and engineering analysis of a 700 ° C advanced ultra-supercritical pulverized coal power plant,” in Ultra-supercritical coal power plants : Materials, technologies and optimisation, Elsevier, 2013, pp. 229–243.
[21] F. Starr, “High temperature materials issues in the design and operation of coal-fired steam turbines and plant,” in Structural Alloys for Power Plants, A. Shirzadi and S. Jackson, Eds. Elsevier, 2014, pp. 36–68.
[22] M. Fukuda, E. Saito, and H. Semba, “Advanced USC technology development in Japan,” Liège, Belgium, in Proc.: Materials for Advanced Power Engineering, 2010.
[23] F. Masuyama, “Alloy development and material issues with increasing steam temperature,” Hilton Head Island, South Carolina, USA, in Proc.: Advances in Materials Technology for Fossil Power Plants, 2004.
[24] M. Igarashi, “25Cr-20Ni-Nb-N steel,” in Landolt Börnstein, vol. 2B, K. Yagi, G. Merckling, T.-U. Kern, H. Irie, and H. Warlimont, Eds. Springer, 2004, pp. 292–296.
[25] Nippon Steel & Sumitomo Metal, “Seamless Steel Tubes and Pipes for Boilers,” Tokyo, Japan, 2013.
[26] TUBACEX, “Manufactoring process,” 2014. [Online]. Available: http://www.tubacex.es/en/.
[27] T. Sourmail, “Literature review Precipitation in creep resistant austenitic stainless steels,” Mater. Sci. Technol., vol. 17, no. 1, pp. 1–14, 2001.
[28] T. Sourmail and H. Bhadeshia, “Microstructural Evolution in Two Variants of NF709 at 1023 and 1073 K,” Metall. Mater. Trans. A, 2005.
[29] J. H. Yoon, E. P. Yoon, and B. S. Lee, “Correlation of chemistry, microstructure and ductile fracture behaviours of niobium-stabilized austenitic stainless steel at elevated temperature,” Scr. Mater., vol. 57, no. 1, pp. 25–28, 2007.
[30] O. Yoo, Y.-J. Oh, B.-S. Lee, and S. W. Nam, “The effect of the carbon and nitrogen contents on the fracture toughness of Type 347 austenitic stainless steels,” Mater. Sci. Eng. A, vol. 405, no. 1–2, pp. 147–157, 2005.
[31] A. F. Padilha and P. R. Rios, “Decomposition of Austenite in Austenitic Stainless Steels,” ISIJ Int., vol. 42, no. 4, pp. 325–327, 2002.

Stojan Vujić References
108
[32] K. Nobuyoshi, M. Igarashi, Y. Minami, H. Mimura, F. Masuyama, M. Prager, and P. R. Boyles, “Field Test Results of Newly Developed Austenitic Steels in the Eddystone Unit No.1 Boiler,” San Antonio, Texas, USA, in Proc.: Creep and Fatigue at Elevated Temperatures (CREEP), 2007, no. 1.
[33] F. Yuanyuan, Z. Jie, and L. Xiaona, “PRECIPITATES IN HR3C STEEL AGED AT HIGH TEMPERATURE,” ACTA Metall. Sin., vol. 46, no. 7, pp. 844–849, 2010.
[34] C. Chi, H. Yu, and X. Xie, Advanced Austenitic Heat-Resistant Steels for Ultra-Super-Critical (USC) Fossil Power Plants. InTech, 2011.
[35] E. J. Giordani, V. a. Guimarães, T. B. Pinto, and I. Ferreira, “Effect of precipitates on the corrosion-fatigue crack initiation of ISO 5832-9 stainless steel biomaterial,” Int. J. Fatigue, vol. 26, no. 10, pp. 1129–1136, 2004.
[36] A. Iseda, H. Okada, H. Semba, and M. Igarashi, “LONG-TERM CREEP PROPERTIES AND MICROSTRUCTURE OF SUPER304H , TP347HFG AND HR3C FOR ADVANCED USC BOILERS,” Energy Mater., vol. 2, no. 4, pp. 199–206, 2007.
[37] Y. Zun, C. Hui, and L. Hongguo, “Performance on New Heat-resistant Steel HR3C in the Ultra-supercritical Units After Service at High Temperature for 25 000 Hours,” Wuhan, China, in Proc.: Chinese Society for Electrical Engineering, 2011, vol. 8013.
[38] H. Okada, M. Igarashi, S. Yamamoto, O. Miyahara, A. Iseda, N. Komai, and F. Masuyama, “Long-Term Service Experience With Advanced Austenitic Alloys in Eddystone Power Station,” San Antonio, Texas, USA, in Proc.: Creep and Fatigue at Elevated Temperatures (CREEP), 2007.
[39] H. U. Hong and S. W. Nam, “The occurrence of grain boundary serration and its effect on the M23C6 carbide characteristics in an AISI 316 stainless steel,” Mater. Sci. Eng. A, vol. 332, no. 1–2, pp. 255–261, 2002.
[40] U. K. Mudali, P. Shankar, D. Sundararaman, and R. K. Dayal, “Microstructural and electrochemical studies in thermally aged type 316LN stainless steels,” Mater. Sci. Technol., vol. 15, no. 12, pp. 1451–1453, 1999.
[41] J. Barcik, “Mechanism of Sigma - phase precipitation in Cr-Ni austenitic steels,” Mater. Sci. Technol., vol. 4, pp. 5–15, 1988.
[42] J. Barcik, “The kinetics of σ-phase precipitation in AISI310 and AISI316 steels,” Metall. Trans. A, vol. 14, no. 3, pp. 635–641, 1983.

Stojan Vujić References
109
[43] M. Farooq, R. Sandström, and M. a Lundberg, “Precipitation during long time ageing in the austenitic stainless steel 310,” Mater. High Temp., vol. 29, no. 1, pp. 8–16, Mar. 2012.
[44] D. Li, Y. Gao, J. Tan, F. Wang, and J. Zhang, “Effect of σ-Phase on the creep properties of Cr25Ni20 stainless steel,” Scr. Metall., vol. 23, pp. 1319–1321, 1989.
[45] Y. Minami, H. Kimura, and Y. Ihara, “Microstructural changes in austenitic stainless steels during long-term aging,” Mater. Sci. Technol., vol. 2, pp. 795–806, 1986.
[46] R. F. A. Jargelius-Pettersson, “Precipitation in a nitrogen-alloyed stainless steel at 850°C,” Scr. Metall. Mater., vol. 28, pp. 1399–1403, 1993.
[47] R. C. Ecob, R. C. Lobb, and V. L. Kohler, “The formation of G-phase in 20/25 Nb stainless steel AGR fuel cladding alloy and its effect on creep properties,” J. Mater. Sci., vol. 22, no. 8, pp. 2867–2880, 1987.
[48] D. J. Powell, I. R. Pilkington, and D. A. Miller, “THE PRECIPITATION CHARACTERISTICS OF 20 % Cr / 25 % Ni-Nb STABILISED STAINLESS STEEL,” vol. 36, no. 3, pp. 713–724, 1988.
[49] E. Kozeschnik, J. Svoboda, R. Radis, and F. D. Fischer, “Mean-field model for the growth and coarsening of stoichiometric precipitates at grain boundaries,” Model. Simul. Mater. Sci. Eng., vol. 18, pp. 1–19, Jan. 2010.
[50] R. Sandström, “Creep strength of austenitic stainless steels for boiler applications,” in Coal Power Plant Materials and Life Assessment: Developments and Applications, A. Shibli, Ed. Elsevier, 2014, pp. 127–146.
[51] P. Ambrosi and C. Schwink, “Slip line length of copper single crystals oriented along [100] and [111],” Scr. Metall., vol. 12, no. 3, pp. 303–308, 1978.
[52] Y. Kawasaki and T. Takeuchi, “Cell structures in copper single crystals deformed in the [001] and [111] axes,” Scr. Metall., vol. 14, no. 2, pp. 183–188, 1980.
[53] N. D. Ryan, H. J. McQueen, and E. Evangelista, “Dynamic recovery and strain hardening in the hot deformation of type 317 stainless steel,” Mater. Sci. Eng., vol. 81, pp. 259–272, 1986.
[54] J. Hirth and J. Lothe, Theory of dislocations, 2nd ed. New York: Wiley, 1982.

Stojan Vujić References
110
[55] A. F. Smith, “Low-Temperature Diffusion of Chromium in a Fine-Grained Austenitic Stainless Steel with Varying Dislocation Densities,” Met. Sci., vol. 9, no. 1, pp. 425–429, 1975.
[56] M. Kassner, “Creep Behavior of Particle-Strengthened Alloys,” in Fundamentals of Creep in Metals and Alloys, 3rd ed., Butterworth-Heinemann, 2015, pp. 163–181.
[57] L. M. Brown and R. K. Ham, “Strengthening Method in Crystals,” in Elsevier, A. Kelly and R. B. Nicholson, Eds. Amsterdam: Elsevier, 1971, pp. 22–28.
[58] R. Lagneborg, “Bypassing of dislocations past particles by a climb mechanism,” Scr. Metall., vol. 7, pp. 605–613, 1973.
[59] W. Blum and B. Reppich, Creep Behaoiour of Crystalline Solids. Swansea, U.K.: Pineridge Press, 1985.
[60] J. Rösler and E. Arzt, “The kinetics of dislocation climb over hard particles—I. Climb without attractive particle-dislocation interaction,” Acta Metall., vol. 36, no. 4, pp. 1043–1051, 1988.
[61] J. Eliasson, Å. Gustafson, and R. Sandström, “Kinetic modelling of the influence of particles on creep strength,” Key Eng. Mater., vol. 171/174, pp. 277–284, 2000.
[62] H. Magnusson and R. Sandström, “The role of dislocation climb across particles at creep conditions in 9 to 12 pct Cr steel,” Metall. Mater. Trans. A, vol. 38, no. 10, pp. 2428–2434, 2007.
[63] J. W. Martin, Precipitation Hardening. Butterworth-Heinemann, 1998.
[64] R. Wang, S. Wang, and X. Wu, “Edge dislocation core structures in FCC metals determined from ab initio calculations combined with the improved Peierls–Nabarro equation,” Phys. Scr., vol. 83, no. 4, pp. 1–7, 2011.
[65] M. D. Mathew, K. Laha, and V. Ganesan, “Improving creep strength of 316L stainless steel by alloying with nitrogen,” Mater. Sci. Eng. A, vol. 535, pp. 76–83, Feb. 2012.
[66] C. Templier, J. C. Stinville, P. Villechaise, P. O. Renault, G. Abrasonis, J. P. Rivière, A. Martinavičius, and M. Drouet, “On lattice plane rotation and crystallographic structure of the expanded austenite in plasma nitrided AISI 316L steel,” Surf. Coatings Technol.,

Stojan Vujić References
111
vol. 204, no. 16–17, pp. 2551–2558, May 2010.
[67] S. Vujic, M. Farooq, B. Sonderegger, R. Sandström, and C. Sommitsch, “Numerical Modelling and Validation of Precipitation Kinetics in Advanced Creep Resistant Austenitic Steel,” Comput. METHODS Mater. Sci., vol. 12, no. 3, pp. 175–182, 2012.
[68] E. Kozeschnik, E. Rindler, and B. Buchmayr, “Scheil-Gulliver simulation with partial redistribution of fast diffusers and simultaneous solid-solid phase transformations,” Int. J. Mater. Res., vol. 98, no. 9, pp. 826–831, 2009.
[69] W. Rindler, E. Kozeschnik, and B. Buchmayr, “Computer simulation of the brittle-temperature-range (BTR) for hot cracking in steels,” Steel Res., vol. 71, no. 11, pp. 460–465, 2000.
[70] E. Kozeschnik, “A scheil-gulliver model with back-diffusion applied to the microsegregation of chromium in Fe-Cr-C alloys,” Metallurgical and Materials Transactions A, vol. 31, no. 6. pp. 1682–1684, 2000.
[71] E. Kozeschnik, “Treatment of heterogeneous nucleation,” 2011. [Online]. Available: http://matcalc.tuwien.ac.at.
[72] B. Sonderegger and E. Kozeschnik, “Generalized nearest-neighbor broken-bond analysis of randomly oriented coherent interfaces in multicomponent Fcc and Bcc structures,” Metall. Mater. Trans. A Phys. Metall. Mater. Sci., vol. 40, no. 3, pp. 499–510, 2009.
[73] B. Sonderegger and E. Kozeschnik, “Interfacial Energy of Diffuse Phase Boundaries in the Generalized Broken-Bond Approach,” Metall. Mater. Trans. A, vol. 41, no. 12, pp. 3262–3269, Jul. 2010.
[74] E. Povoden-Karadeniz, S. Vujic, and E. Kozeschnik, “Thermodynamic modeling and simulation of time-temperature-precipitation diagrams in stainless steel,” San Sebastian, Spain, in Proc.: CALPHAD XLII, 2013.
[75] R. Radis, “Numerical simulation of the precipitation kinetics of nitrides and carbides in microalloyed steel,” 2010.
[76] S. Vujic, R. Sandström, and C. Sommitsch, “Precipitation evolution and creep strength modelling of 25Cr20NiNbN austenitic steel,” Mater. High Temp., no. 0, pp. 1–12, 2015.
[77] B. Sonderegger and E. Kozeschnik, “Particle strengthening in fcc crystals with prolate and oblate precipitates,” Scr. Mater., vol. 66, no. 1, pp. 52–55, 2012.

Stojan Vujić References
112
[78] B. Sonderegger, I. Holzer, E. Kozeschnik, and C. Sommitsch, “Particle distance distributions and their effect on precipitation strengthening,” Comput. Methods Mater. Sci., vol. 11, no. 1, pp. 148–153, 2011.
[79] S. Kihara, “25Cr-20Ni steel,” in Landolt Börnstein, vol. 2B, K. Yagi, G. Merckling, T.-U. Kern, H. Irie, and H. Warlimont, Eds. Heidelberg: Springer-Verlag GmbH, 2004, pp. 286–291.
[80] R. Sandström, “Creep strength in austenitic stainless steels,” Rome, Italy, in Proc.: Creep and Fracture in High Temperature Components: Design & Life Assessment Issues (ECCC), 2014.
[81] J. O. Nilsson, P. R. Howell, and G. L. Dunlop, “Interfacial microstructure and low stress, high temperature creep of an austenitic stainless steel,” Acta Metall., vol. 27, no. 2, pp. 179–186, 1979.
[82] I. . Crossland and B. . Clay, “Diffusion creep and its inhibition in a stainless steel,” Acta Metall., vol. 25, no. 8, pp. 929–937, 1977.
[83] B. Wilshire, “Observations, theories, and predictions of high-temperature creep behavior,” Metall. Mater. Trans. A, vol. 33, no. 2, pp. 241–248, 2002.
[84] A. S. Argon and W. C. Moffatt, “Climb of extended edge dislocations,” Acta Metallurgica, vol. 29, no. 2. pp. 293–299, 1981.
[85] K. Natesan and J. H. Park, “Fireside and steamside corrosion of alloys for USC plants,” Int. J. Hydrogen Energy, vol. 32, no. 16, pp. 3689–3697, 2007.
[86] S. D. Yadav, M. Schuler, C. Sommitsch, and C. Poletti, “Physical Based Creep Strain Modelling of 9Cr,” Rome, Italy, in Proc.: Creep and Fracture in High Temperature Components: Design & Life Assessment Issues (ECCC), 2014.

113
A script is a text file which contain a lot of specific MatCalc commands. Especially when a
lot of precipitation evolution calculations have to be done, then the scripts are a useful
approach to speed up routine or repetitive operations. After a script file is created, it can be
easily modified in order to perform new calculations with for example modified composition
and new heat treatment.
On the next eleven pages a script for the calculations of precipitation evolution in the
present austenitic steel is presented. The results in chapter 5.2.2 and chapter 6 are obtained
with this script.
Appendix

Stojan Vujić Appendix
114

Stojan Vujić Appendix
115

Stojan Vujić Appendix
116

Stojan Vujić Appendix
117

Stojan Vujić Appendix
118

Stojan Vujić Appendix
119

Stojan Vujić Appendix
120

Stojan Vujić Appendix
121

Stojan Vujić Appendix
122

Stojan Vujić Appendix
123

Stojan Vujić Appendix
124

Stojan Vujić Appendix
125
Copyright © 2022 FDOKUMEN