Microstructural Investigation of Tablet Compaction ... - CORE
213
Microstructural Investigation of Tablet Compaction and Tablet Pharmacological Properties by MASSACHUSE Kangyi Mao OF TECH SEP 1 B.E. Chemical Engineering LIBRA Tsinghua University, 2003 M.S. Chemical Engineering Practice Massachusetts Institute of Technology, 2006 SUBMITTED TO THE DEPARTMENT OF CHEMICAL ENGINEERING IN PARTIAL FULFILLMENT OF THE REQUIREMENTS FOR THE DEGREE OF DOCTOR IN PHYLOSOPHY IN CHEMICAL ENGINEERING AT THE MASSACHUSETTS INSTITUTE OF TECHNOLOGY JULY 2010 © 2010 Massachusetts Institute of Technology. All Rights Reserved rTS INSTITUTE NOLOGY 6 2010 RIES HVES Author: ................. _______........................ Kangyi Mao Department of Chemical Engineering July, 2010 C e rtifie d b y : ........... . .............. ..................................... Charles L. Cooney Professor of Chemical and Biochemical Engineering Thesis supervisor A cce pted by : ............................ .......................... William Deen Chairman, Committee for Graduate Students
-
Upload
khangminh22 -
Category
Documents
-
view
2 -
download
0
Transcript of Microstructural Investigation of Tablet Compaction ... - CORE

Microstructural Investigation of Tablet Compaction
and Tablet Pharmacological Properties
byMASSACHUSE
Kangyi Mao OF TECH
SEP 1
B.E. Chemical Engineering LIBRATsinghua University, 2003
M.S. Chemical Engineering PracticeMassachusetts Institute of Technology, 2006
SUBMITTED TO THE DEPARTMENT OF CHEMICAL ENGINEERINGIN PARTIAL FULFILLMENT OF THE REQUIREMENTS FOR THE DEGREE OF
DOCTOR IN PHYLOSOPHY IN CHEMICAL ENGINEERINGAT THE
MASSACHUSETTS INSTITUTE OF TECHNOLOGY
JULY 2010
© 2010 Massachusetts Institute of Technology. All Rights Reserved
rTS INSTITUTENOLOGY
6 2010
RIES
HVES
Author: ................. _______........................
Kangyi MaoDepartment of Chemical Engineering
July, 2010C e rtifie d b y : ........... . .............. .....................................
Charles L. CooneyProfessor of Chemical and Biochemical Engineering
Thesis supervisorA cce pted by : ............................ ..........................
William DeenChairman, Committee for Graduate Students


Microstructural Investigation of Tablet Compactionand Tablet Pharmacological Properties
byKangyi Mao
Submitted to the Department of Chemical Engineeringon July 29th, 2010 in Partial Fulfillment of the
Requirements for the Degree of Doctor of Philosophy inChemical Engineering
ABSTRACT
In current tablet manufacturing processes, there is a knowledge gap concerning materialtransformation and the subsequent impact on tablet properties; this gap presents a barrier torational formulation / process design. In this study, it was hypothesized that the understandingof tablet microstructure is pivotal in bridging our knowledge about the materials, themanufacturing process, and the tablet properties.
A series of X-ray micro computed tomography (microCT) characterization methods weredeveloped to untangle material interactions during tablet manufacturing process, leading to aninterpretation of tablet compaction mechanisms through 3-D representation of microstructuralfeatures. Numerical simulation of liquid intrusion based on microCT data was utilized incalculating tablet microstructure permeability, introducing a novel parameter for characterizationof tablet dissolution properties.
A tablet holder was designed and used in combination with paddle dissolution test to investigatetablet dissolution process, enabling the classification of dissolution mechanisms andidentification of correspondent formulation design strategies. When incorporated withpermeability results, a quantitative dissolution model capable of separating the contributionsfrom disintegration and surface dissolution was derived. The dissection of the dissolutionprocess provides a scientific framework supporting the Quality by Design paradigm for productand process development. .
This work provides a strategy for building an integrated formulation design and characterizationsystem incorporating microstructural analysis. It opens up an approach in which microstructurebecomes a critical target for design and optimization.
Thesis Supervisor: Charles L. CooneyTitle: Professor of Chemical and Biochemical Engineering

4

Acknowledgement
My time at MIT has been the longest and most dramatic journey in my life. In these years, Ievolved from a single young man to a husband and father; I explored the endless opportunitiesMIT provided with me, stumbled, and stood up against the odds; I met numerous splendid peoplealong the way, learned from them, and strived to become one of them. Without the help andinspiration from these people, I could not have completed what is documented in this thesis.
Professor Charles L. Cooney, my thesis advisor, has been an extraordinary guide on this journeyof mine. His clear vision of the big picture keeps me on the right track; his rigorous requirementon scientific writing trains the precision of my mind; his deep knowledge about thepharmaceutical industry gives me unique insights in linking scientific exploration with real worldapplications. I would also like to show my appreciation for Professor Bernhardt L. Trout andProfessor T. Alan Hatton, my thesis committee members. They have always been supporting mystudy with clear-cut critiques and generous guidance.
Dr. Shawn Zhang and Dr. Mike Marsh from Visualization Sciences Group have provided criticaltechnical support in microstructure image analysis. Dr Doug Wei from Zeiss U.S.A. helpedcarry out the preliminary experiments with FIB-SEM. Professor Whitey Hagadorn fromAmherst College generously offered free usage of microCT instrument as well as technicaladvice.
My UROP students Kellie Courtney and Kavita Chandra have contributed a lot of their time indissolution studies of the thesis. They are both competent and candid researchers with a brilliantfuture. My colleagues in the Cooney lab have been great sources of intellectual inspiration aswell as friendship. I can't image there is a better lab to work in. Special acknowledge goes toErin Bell (and her fish Neil), who as the safety officer, has kept the whole lab clean like home!
I would like to acknowledge the generous financial and technical support from the Novartis-MITCenter for Continuous Manufacturing. I learned a lot about scientific and industrial practicesfrom my interaction with the downstream and redline teams.
Finally, I would like to dedicate this thesis to my wife Jie and my daughter Joanna, for all thesupport and understanding they have given me, and all the fun they had at home without me.

6
TABLE OF CONTENTS
A B STR A C T ................................................................................................................................................. 3
ACKNOWLEDGEMENT..........................................................................................................................5
TABL E OF CONTENTS ........................................................................................................................... 7
TABLE OF FIGURES..............................................................................................................................11
TABLE OF TABLES................................................................................................................................17
CHAPTER 1 INTRODUCTION.............................................................................................................19
1.1 M O TIV A TIO N ............................................................................................................................. 20
1.2 STRATEGY AND SPECIFIC AiM S.............................................................................................. 22
1.3 B A C K G R O U N D ............................................................................................................................ 24
1.3.1 Tablet Compaction in Pharmaceutical Manufacturing ........ ......................... 24
1.3.2 Tablet Properties and Analytical Methods......................................................................... 30
1.3.3 Tablet M icrostructure ........................................................................................................ 38
1.4 C HAPTER B IBLIOGRAPHY .......................................................................................................... 4 1
CHAPTER 2 CHARACTERIZATION OF CAFFEINE-LACTOSE TABLET COMPACTION
AND TABLET PROPERTIES ................................................................................................................ 45
2.1 MANUFACTURING OF CAFFEINE-LACTOSE TABLETS............................................................. 45
2.1.1 Powder properties of spray-dried lactose and caffeine .................................................... 45
2.1.2 Manufacturing setup and formulations ............................. ....... 47
2.2 TABLET MECHANICAL STRENGTH......................................................................................... 48
2.3 TABLET D ISSOLUTION PROFILES ............................................................................................ 53
2 .4 SU M M A R Y .................................................................................................................................. 60
2.5 C HAPTER B IBLIOGRAPHY .......................................................................................................... 62
CHAPTER 3 RATIONAL FORMULATION DEVELOPMENT OF COMPOUND-A TABLETS 65
3.1 CoMPoUND-A FORMULATION BY DIRECT COMPRESSION ................................................ ....... 65
6.2.1 Direct compression with reference formulations ............................................................. 66
3.1.2 Direct compression with lactose-basedformulation......................................................... 69
3.2 CoMPouND-A FORMULATION BY ROLLER COMPACTION............................................................. 71
3.2.1 Roller compaction simulated with pre-compaction.. .............................................. 72
3.2.2 Roller compaction with bench-top compactor .................................................................. 74
3.3 CHARACTERIZATION OF M-SERIES FORMULATIONS .................................................................... 81
3.3.1 Flowability of M50/M70 Powders.................................................................................... 81
3.3.2 Particle Size Distribution of M50/M70 Powders ............................... 83
3.4 STABILITY TESTING OF M-SERIES FORMULATIONS ......................................................... 85
3.4.1 P hysical S tability ................................................................................................................... 853.4.2 C hem ical Stability ................................................................................................................. 86
3.5 SUM M A RY .................................................................................................................................. 87
CHAPTER 4 MICROCT IMAGING AND ANALYSIS OF TABLET MICROSTRUCTURE ....... 91
4.1 APPLICATIONS OF MICROCT IN PHARMACEUTICAL SCIENCES.............................................. 91
4.2 DEVELOPMENT OF MICROCT IMAGING METHOD .................................................................. 94
4.2.1 Setup of MicroCT Scanning Configuration ..................... ......................... ........ 94
4.2.2 Digital Workflow for Data Manipulation ....... . ..................................... 964.3 MICROCT IMAGING STUDIES OF CAFFEINE-LACTOSE TABLETS............................................ 99
4.4 MICROCT IMAGING STUDIES OF COMPOuND-A TABLETS...................................................... 105
4 .5 SU M M A R Y ................................................................................................................................ 1 12
4.6 C HAPTER B IBLIOGRAPHY ........................................................................................................ 114
CHAPTER 5 DISSOLUTION MECHANISM STUDY WITH NOVEL TABLET HOLDER ....... 117
5.1 THE MODELS OF PHARMACEUTICAL DISSOLUTION TESTS............................................................. 117
5.2 DESIGN OF TABLET HOLDER FOR MECHANISM STUDY OF PADDLE DISSOLUTION........................ 119
5.2.1 P revious Efforts................................................................................................................... 120
5.2.2 Design of the Novel Tablet Holder................................. ..... 1235.2.3 Physical/Mathematical Model of Holder Dissolution.. ......................... 1255.2.4 Testing of the Novel Tablet Holder ................ ...................................... 127
5.3 HOLDER DISSOLUTION STUDY OF CAFFEINE-LACTOSE TABLETS.................................................. 132
5.4 HOLDER DISSOLUTION STUDY OF COMPOUND-A ROLLER-COMPACTED TABLETS....................... 136
5 .5 SU M M A R Y ....................................................................................................................................... 14 4
5.6 C HAPTER B IBLIOGRAPHY ............................................................................................................... 146
CHAPTER 6 MICROSTRUCTURE CHARACTERIZATION AND NUMERICAL SIMULATIONOF LIQUID INTRUSION ...................................................................................................................... 149
6.1 CHARACTERIZATION OF THROATS AND PORES IN A TABLET POROSITY NETWORK ............... 149
6.2 NUMERICAL SIMULATION OF LIQUID INTRUSION INTO TABLET ............................................. 153
6.2.1 Methodology of Liquid Penetration Simulation ................................................ 1536.2.2 Permeability and Dissolution Speed ............................................ 1566.2.2 Comparison with Permeability by Mercury Porosimetry ........ ............................ 160
6 .3 SU M M A R Y ................................................................................................................................ 163
6.4 C HAPTER B IBLIOGRAPHY ........................................................................................................ 165
CHAPTER 7 PRELIMINARY AND FUTURE WORK.....................................................................167
7.1 MICROCT INVESTIGATION OF TABLET COATING.................................................................... 167
7.2 FIB-SEM INVESTIGATION OF TABLET MICROSTRUCTURE ..................................................... 171
7.3 FUTURE WORK IN TABLET MICROSTRUCTURE INVESTIGATION ............................................. 176
7.4 FUTURE WORK IN DISSOLUTION MECHANISM INVESTIGATION.............................................. 178
7.5 OUTLOOK OF THE TECHNOLOGIES........................................................................................... 179

7.6 SELECTION OF TECHNOLOGIES FOR MICROSTRUCTURAL ANALYSIS...................................... 181
7.7 C HAPTER B IBIOGRAPHY .......................................................................................................... 183
CHAPTER 8 APPLICATIONS AND BENEFITS OF THE MICROCT-DISSOLUTIONHOLDER
T O O LB O X .............................................................................................................................................. 185
8.1 APPLICATIONS AND BENEFITS IN RESEARCH & DEVELOPMENT ............................................. 185
8.1.1 Development of Excipient Microstructure Library ................... ......................... 185
8.1.2 Rational Formulation / Manufacturing Process Design............................ 187
8.1.3 Development of New Dosage Forms / Manufacturing Processes ....................................... 189
8.2 APPLICATIONS AND BENEFITS IN MANUFACTURING............................................................... 190
8.2.1 Establishment of New Quality Assurance Criteria........................... 190
8.2.2 Application as a Investigation Toolkit ............................................................................. 191
8.2.3 Exam ination Toolfor SUPA C ............................................................................................. 191
8 .3 SU M M A R Y ................................................................................................................................ 1 92
CHAPTER 9 CONCLUSION AND IMPACT ..................................................................................... 195
9 .1 C O N C LU SIO N ............................................................................................................................ 196
9 .2 IM PA C T .................................................................................................................................... 1 9 8
APPENDIX A PROCEDURES FOR NUMERICAL SIMULATION...................201
APPENDIX B PROCEDURES FOR 3-D PORE STRUCTURE REPRESENTATION .......... 205

10

TABLE OF FIGURES
FIGURE 1-1 RELATIONSHIP AMONG DIFFERENT COMPONENTS IN FORMULATION DEVELOPMENT... 19FIGURE 1-2 ILLUSTRATION OF TRADITIONAL ROUTE FOR FORMULATION DEVELOPMENT AND THE
INCORPORATION OF NEW TOOLS.......................................................................................... 22FIGURE 1-3 ILLUSTRATION OF COMMON ROUTES FOR SECONDARY PHARMACEUTICAL
M A N UFA CTU RIN G ................................................................................................................... 26
FIGURE 1-4 THE BASIC STEPS OF TABLET COMPACTION. ADAPTED FROM ABPI RESOURCES FOR
SC H O O L S. .............................................................................................................................. 2 8FIGURE 1-5 TABLET FAILURE MODE IN HARDNESS TESTING. (A) SIMPLE TENSILE FAILURE, (B)
TRIPLE CLEFT (TEN SILE ....................................................................................................... 32FIGURE 1-6 USP STANDARD TABLET FRIABILITY APPARATUS. ADOPTED FROM USP 31 CHAPTER
< 12 16 > .................................................................................................................................. 3 3FIGURE 1-7 ILLUSTRATION OF PADDLE AND BASKET DISSOLUTION SETUP. ADAPTED FROM
JA SCOFRAN CE, INC ............................................................................................................... 35FIGURE 1-8 CFD SIMULATION OF HYDRODYNAMICS IN USP BASKET DISSOLUTION. ADAPTED FROM
D 'A RCY , ET A L., 2006 ........................................................................................................... 36
FIGURE 1-9 CFD SIMULATION OF HYDRODYNAMICS IN USP PADDLE DISSOLUTION TEST, 50 RPM,ADAPTED FROM M CCARTHY, ET AL., 2003 ........................................................................ 37
FIGURE 1-10 THE CENTRAL POSITION OF DISSOLUTION TEST IN PHARMACEUTICAL INDUSTRY
FU N CTION A LITIES................................................................................................................... 38FIGURE 1-11 ILLUSTRATION AND THEORY OF MERCURY POROSIMETRY..................................... 39FIGURE 2-1 ENVIRONMENTAL SCANNING ELECTRON MICROSCOPIC IMAGES OF DCL1 1 (LEFT) AND
DCL14 (RIGHT). (DM V INTERNATIONAL, 2005)................................................................ 46
FIGURE 2-2 ESEM IMAGE OF CAFFEINE PARTICLE. S. NGAI 2005 ................................................. 46FIGURE 2-3 PHOTO AND PARAMETERS OF KORSCH EK-0 TABLET PRESS..................................... 47
FIGURE 2-4 ILLUSTRATION OF THE TABLET COMPACTION STATION.............................................. 48FIGURE 2-5 MECHANICAL STRENGTH OF TIGHTLY COMPACTED CAFFEINE-LACTOSE TABLETS....... 50FIGURE 2-6 MECHANICAL STRENGTH OF LOOSELY COMPACTED CAFFEINE-LACTOSE TABLETS...... 50FIGURE 2-7 HARDNESS PROFILE FOR CAFFEINE-DCL 11 TABLETS OF DIFFERENT STRENGTHS IN
SEA LED BA G S. ...................................................................................................................... 52
FIGURE 2-8 HARDNESS PROFILE FOR CAFFEINE-DCL 11 TABLETS OF DIFFERENT STRENGTHS IN 55%
R H ......................................................................................................................................... 5 2FIGURE 2-9 HARDNESS GAIN FOR CAFFEINE-DCL 11 TABLETS IN 55% RH COMPARED WITH SEALED
C O N D ITIO N ............................................................................................................................. 5 3FIGURE 2-10 MUTAROTATION REACTION OF LACTOSE. MODIFIED FROM LACTOSE.COM............... 54FIGURE 2-11 INITIAL SOLUBILITY PROFILE OF DIFFERENT CRYSTALLINE LACTOSE POWDERS IN 37 0 C
W ATER. K AM P ET AL. 1986. ............................................................................................... 54
FIGURE 2-12 DISSOLUTION PROFILES OF CAFFEINE-DCL1 1 TABLETS AT 1 DAY AFTER COMPACTION.
............................................................................................................................................... 5 6

FIGURE 2-13 DISSOLUTION PROFILES OF CAFFEINE-DCL 11 TABLETS AT 1 WEEK AFTER
C O M PA CTIO N .......................................................................................................................... 57
FIGURE 2-14 DISSOLUTION PROFILES OF CAFFEINE-DCL 11 TABLETS AT 2 WEEKS AFTER
C O M PA C TIO N .......................................................................................................................... 57
FIGURE 2-15 SUMMARY OF CAFFEINE-DCL1 1 TABLET DISSOLUTION PROFILES WITHIN 2 WEEKS
AFTER COM PA CTION ............................................................................................................... 58
FIGURE 2-16 60% DISSOLUTION TIME FOR CAFFEINE-DCL1 1 TABLETS IN SEALED CONDTION....... 59FIGURE 2-17 60% DISSOLUTION TIME FOR CAFFEINE-DCL1 1 TABLETS STORED IN 54% RH.......... 59FIGURE 2-18 COMPARISON OF DISSOLUTION TIME FOR CAFFEINE-DCL 11 TABLETS IN SEALED BAGS
A N D 54 % R H . ........................................................................................................................ 60FIGURE 3-3 VOLUMETRIC DOMINANCE OF COMPOUND-A (LEFT) IN A 50% FORMULATION. ........... 67FIGURE 3-4 HARDNESS AND WEIGHT DATA OF F1/F2 COMPOUND-A TABLETS, N=1. ................. 68FIGURE 3-5 THICKNESS AND WEIGHT DATA OF F1/F2 COMPOUND-A TABLETS, N=1.................. 69FIGURE 3-6 HARDNESS/WEIGHT DATA OF COMPOUND-A TABLETS MADE FROM DIRECT
COM PRESSION , N = 1. .............................................................................................................. 70FIGURE 3-7 DISSOLUTION PROFILE OF 40% COMPOUND-A TABLETS VIA SIMULATED ROLLER
C O M PA C TIO N .......................................................................................................................... 73FIGURE 3-8 DISSOLUTION PROFILE OF M60 TABLETS WITH 300MG DRUG LOADING. N=6.......... 79
FIGURE 3-9 DISSOLUTION PROFILE OF M50 TABLETS, N=6......................................................... 79FIGURE 3-10 DISSOLUTION PROFILE OF M60 TABLETS, N=6...................................................... 80FIGURE 3-11 DISSOLUTION PROFILE OF M70 TABLETS, N=6...................................................... 80FIGURE 3-12 DISSOLUTION PROFILE OF N50 TABLETS, N=3. ..................................................... 80FIGURE 3-13 DISSOLUTION PROFILE OF N68 TABLETS, N=4. ..................................................... 81FIGURE 3-14 ILLUSTRATION OF ANGLE OF REPOSE TEST. ............................................................. 82FIGURE 3-15 SCALES FOR CHARACTERIZATION OF FLOWABILITY. SOURCE: USP 32, CHAPTER 1174
............................................................................................................................................... 8 2FIGURE 3-16 MECHANISM OF FBRM. ADOPTED FROM KOUGOULOS ET AL., 2004..................... 83FIGURE 3-17 PARTICLE SIZE DISTRIBUTION MEASUREMENT OF M50 / M70 FORMULATIONS.......... 84FIGURE 3-18 XRPD DATA OF M70 TABLETS UNDER DIFFERENT STORAGE CONDITIONS. ............ 86FIGURE 3-19 HPLC DATA FOR M70 TABLETS UNDER DIFFERENT STORAGE CONDITIONS............ 87FIGURE 4-1 ILLUSTRATION OF MICROCT WORKING MECHANISM. SOURCE: SKYSCAN 2007..... 92FIGURE 4-2 ILLUSTRATION OF SAMPLE STATION SETUP.............................................................. 94FIGURE 4-3 HIGH RESOLUTION SCANS EXHIBIT ARTIFACT THAT IS ABSENT IN MEDIUM RESOLUTION
SC A N S. ................................................................................................................................... 9 5
FIGURE 4-4 DIGITAL POST-PROCESSING WORKFLOW FOR TABLET MICROCT DATA. CONV.:
CONVERSION; ROI: REGION OF INTEREST. .......................................................................... 96FIGURE 4-5 ILLUSTRATION OF CROSS SECTION HISTOGRAM AND THE SELECTION OF
TH RESH O LD/R O I.................................................................................................................... 98
FIGURE 4-6 AVIZO WORKFLOW FOR BASIC MICROCT DATA MANIPULATION.............................. 99FIGURE 4-7 MICROCT CROSS SECTION IMAGES OF CAFFEINE-LACTOSE TABLETS. 500UMX500UM.
............................................................................................................................................. 10 0

FIGURE 4-8 COMPARISON OF MICROCT POROSITY DATA WITH THOSE OBTAINED VIA HELIUM
PYCNOMETRY AND MERCURY POROSIMETRY. ...................................................................... 101FIGURE 4-9 REPRESENTATIVE POROSITY PROFILES OF CAFFEINE-LACTOSE TABLETS BY MERCURY
PO R O SIM ETR Y . ..................................................................................................................... 10 1FIGURE 4-10 MICROCT CROSS SECTION IMAGES SHOW ABUNDANT AMOUNT OF PORES LARGER
THAN 1 UM IN DIAM ETER ...................................................................................................... 103FIGURE 4-11 ILLUSTRATION OF PORE DIAMETER MEASUREMENT IN A TYPICAL PORE STRUCTURE OF
LA CTO SE TA BLETS................................................................................................................ 104FIGURE 4-12 EXPONENTIAL RELATIONSHIP BETWEEN TABLET TENSILE STRENGTH AND MICROCT
PO R O SITY . ............................................................................................................................ 10 4FIGURE 4-13 RELATIONSHIP AMONG COMPRESSION PRESSURE, TABLET STRENGTH, AND POROSITY.
............................................................................................................................................. 1 0 5
FIGURE 4-14 CROSS SECTIONS AND ILLUSTRATION OF WHOLE-TABLET MICROCT SCANS FOR
COM POUND-A TABLETS. ...................................................................................................... 106FIGURE 4-15 CROSS SECTION MICROCT IMAGES OF M70 COMPOUND-A TABLETS. 500UMX500UM.
............................................................................................................................................. 1 0 7
FIGURE 4-16 CROSS SECTION MICROCT IMAGES OF M1O/M30/M50 COMPOUND-A TABLETS.
500 U M X 500U M . .................................................................................................................. 108
FIGURE 4-17 COMPACTION RESPONSE CURVES FOR M1O/M30/M50/M70 COMPOUND-A TABLETS.
............................................................................................................................................. 10 9
FIGURE 4-18 PROPOSED TABLET COMPACTION MECHANISMS FOR COMPOUND-A TABLETS......... 110
FIGURE 4-19 TOTAL POROSITY MEASUREMENTS OF M70 TABLETS. ............................................. 110
FIGURE 4-20 POROSITY PROFILE OF 1OON M70 TABLET AS MEASURED BY MICROCT.................. I11FIGURE 5-1 COMPUTATIONAL FLUID DYNAMICS SIMULATION OF PADDLE DISSOLUTION TEST, 50
RPM , ADAPTED FROM M CCARTHY, ET AL., 2003 ................................................................ 120FIGURE 5-2 TABLET HOLDER DESIGNED TO FIX DISSOLUTION SURFACE. ADAPTED FROM WU, ET AL.,
2 0 0 4 ..................................................................................................................................... 12 1FIGURE 5-3 CHANNEL FLOW METHOD FOR UNDERSTANDING DISSOLUTION. ADAPTED FROM
PELTON EN , ET A L., 2003 ...................................................................................................... 12 1FIGURE 5-4 ILLUSTRATION OF FLOW-CELL APPARATUS IN PACKED/LAMINAR FLOW MODE. RED
OBJECT IS TABLET. MODIFIED FROM SOTAX CORP., HORSHAM, PA, USA ........................ 122
FIGURE 5-5 DESIGN OF THE TABLET HOLDER FOR USAGE IN COMBINATION WITH PADDLE TEST... 124FIGURE 5-6 SIMPLIFIED PHYSICAL MODEL OF TABLET HOLDER DISSOLUTION. ............................. 125FIGURE 5-7 DISSOLUTION MODEL AS CONTROLLED BY RATE-LIMITING STEPS. ............................ 127FIGURE 5-8 PADDLE DISSOLUTION WITH AND WITHOUT TABLET HOLDER. (A) EXPERIMENTAL
SETUP; (B) DISSOLUTION PROFILE COMPARISON FOR 48N 10% CAFFEINE-90% LACTOSE
TA B L ET S............................................................................................................................... 12 8FIGURE 5-9 INCONSISTENT DISSOLUTION RESULTS WITH ORIGINAL TABLET HOLDER................... 129FIGURE 5-10 DRAMATICALLY ENHANCED CONSISTENCY IN HOLDER DISSOLUTION WITH WAXING.
............................................................................................................................................. 12 9

FIGURE 5-11 CONSISTENT DISSOLUTION PROFILES IN M50 HOLDER TEST WITH PARAFILM WRAPPING.
............................................................................................................................................ 13 0
FIGURE 5-12 ILLUSTRATION OF TABLET HOLDER POSITION WITH 900ML MEDIUM IN DISSOLUTION
V E SSE L ................................................................................................................................. 13 1
FIGURE 5-13 HOLDER DISSOLUTION TEST AT DIFFERENT HOLDER POSITION WITH 1OON CAFFEINE
TA B LETS. N = 6 ..................................................................................................................... 132FIGURE 5-14 MICROCT RECONSTRUCTURED CROSS SECTION IMAGES OF CAFFEINE-LACTOSE
TABLETS. 500UM X 500UM .................................................................................................... 133FIGURE 5-15 HOLDER DISSOLUTION TEST RESULTS OF CAFFEINE-LACTOSE TABLETS. N=6......... 134FIGURE 5-16 COMPARISON OF CAFFEINE-LACTOSE HOLDER DISSOLUTION SPEEDS AT VARIOUS
SETT IN G S.............................................................................................................................. 13 5FIGURE 5-17 HOLDER AND PADDLE DISSOLUTION RESULTS OF M1O/M30 COMPOUND-A TABLETS.
900M L 0.0iN H CL, 50RPM . N =12.................................................................................... 137FIGURE 5-18 HOLDER AND PADDLE DISSOLUTION RESULTS OF M50/M70 COMPOUND-A TABLETS.
900M L 0.01N H CL, 50RPM . N =12..................................................................................... 138FIGURE 5-19 DISSOLUTION SURFACE MAP OF COMPOUND-A TABLETS IN HOLDER DISSOLUTION (A)
AND PADDLE DISSOLUTION (B) TESTS. ................................................................................. 139FIGURE 5-20 ILLUSTRATION OF DIFFERENT DISSOLUTION SCENARIOS AND CORRESPONDENT DATA
CONVERSION M ETHODS. ....................................................................................................... 141FIGURE 5-21 THRESHOLDING OF COMPOUND-A TABLETS INTO SINK OR FLOATING DISSOLUTION
SC EN A R IO S........................................................................................................................... 14 3FIGURE 5-22 DIFFERENTIAL DISSOLUTION SPEED SURFACE MAP OF PADDLE TEST AND CONVERTED
H O LD ER TEST . ...................................................................................................................... 14 3FIGURE 6-1 UPSAMPLING BY 4X SMOOTHS OUT INTERNAL PORE STRUCTURE. ............................. 150
FIGURE 6-2 SKELETONIZATION REVEALS THE BACKBONE STRUCTURE AND CONNECTIVITY
PATTERNS OF THE PORE SPACE. ............................................................................................ 150FIGURE 6-3 DISTANCE MAP ALLOWS EXTRACTION OF PORE NETWORK THICKNESS INFORMATION.
............................................................................................................................................. 1 5 1
FIGURE 6-4 REPRESENTATION OF TABLET MICROSTRUCTURE WITH BALL-SHAPED CLUSTERS.
GREEN: THROATS; RED: PORES; SAMPLE SIZE: 50 M CUBIC. ................................................ 151FIGURE 6-5 SEPARATION OF THROATS AND PORES REVEALS STRUCTURAL FEATURES.................. 152FIGURE 6-6 VIEWS OF MICROSTRUCTURAL ORGANIZATION FROM TWO DIFFERENT ANGLES. ....... 152FIGURE 6-7 ILLUSTRATION OF MESH-AND-CELL ARRANGEMENT FOR SIMULATION. ADAPTED FROM
B EN TZ ET A L. 2007. ............................................................................................................. 155FIGURE 6-8 ILLUSTRATION OF SIMULATION SETUP....................................................................... 155FIGURE 6-9 PERMEABILITY RESULTS FOR CAFFEINE-LACTOSE TABLETS AND M70 TABLETS........ 156FIGURE 6-10 RELATIONSHIP BETWEEN PERMEABILITY AND POROSITY......................................... 157FIGURE 6-11 PORTIONS OF PADDLE DISSOLUTION SPEED AS DRIVEN BY DISINTEGRATION FOR M-
SERIES TA BLETS. .................................................................................................................. 158FIGURE 6-12 RELATIONSHIP BETWEEN PADDLE DISSOLUTION SPEED AND PERMEABILITY. .......... 159

FIGURE 6-13 COMPARISON OF CAFFEINE-LACTOSE TABLET PERMEABILITY BY HG POROSIMETRY
A N D M ICR OC T . .................................................................................................................... 16 1FIGURE 6-14 COMPARISON OF M70 TABLET PERMEABILITY BY HG POROSIMETRY AMD MICROCT.
............................................................................................................................................. 1 6 1
FIGURE 6-15 DIFFICULTY IN DETERMING INFLECTION POINT FOR PERMEABILITY STUDY IN MERCURY
PO R O SIM ETR Y . ..................................................................................................................... 162FIGURE 7-1 CROSS SECTION MICROCT IMAGE OF COATED TABLET. ............................................. 168FIGURE 7-2 MICROCT 3-D MODEL OF TABLET COATING.............................................................. 169FIGURE 7-3 COATING THICKNESS DISTRIBUTION ON DIFFERENT TABLET SURFACES. 1 UNIT = 3 UM.
............................................................................................................................................. 1 6 9FIGURE 7-4 QUANTITATIVE ANALYSIS OF TABLET COATING THICKNESS. ..................................... 170FIGURE 7-5 ILLUSTRATION OF FIB-SEM WORKING MECHANISM ................................................ 171
FIGURE 7-6 FIB-SEM IMAGE OF M70 TABLET CROSS SECTION WITH EXPERIMENTAL PARAMETERS.
............................................................................................................................................. 1 7 2
FIGURE 7-7 IMAGE PROCESSING PROCEDURE OF FIB-SEM DATA. ............................................... 173FIGURE 7-8 INCREMENTAL PORE SIZE DISTRIBUTION OF FIB-SEM DATA FOR 1OON M70 TABLET.
............................................................................................................................................. 1 7 4
FIGURE 7-9 CULULATIVE PORE VOLUME DISTRIBUTION OF FIB-SEM DATA FOR lOON M70 TABLET.
............................................................................................................................................. 1 7 4
FIGURE 8-1 PROCEDURE FOR BUILDING EXCIPIENT MICROSTRUCTURAL LIBRARY (EML)............ 187FIGURE 8-2 EXAMPLE PROCEDURE FOR RATIONAL FORMULATION DESIGN. ................................. 187FIGURE 8-3 PRELIMINARY MICROCT SCANS OF MELT-EXTRUDED TABLETS................................. 190
FIGURE 8-4 APPLICATIONS AND BENEFITS OF THE MICROCT DISSOLUTION-HOLDER TOOLBOX. . 192
FIGURE 9-1 WORKFLOW FOR TABLET MICROSTRUCTURE CHARACTERIZATION AND DESIGN........ 196

16

TABLE OF TABLES
TABLE 1-1 IN VITRO ANALYTICAL TESTS FOR QUALITY ASSESSMENT OF PHARMACEUTICAL TABLETS.
............................................................................................................................................... 2 1
TABLE 3-1 INITIAL SELECTION OF DIRECT COMPRESSION FORMULATIONS.................................. 66TABLE 3-2 INTERPARTICLE FRICTION COEFFICIENT OF LACTOSE AND MCC BY AFM. ADAPTED
FROM D O M IKE 2003............................................................................................................... 69TABLE 3-3 DIRECT COMPRESSION FORMULATIONS OF COMPOUND-A TABLETS (WT%)................ 70TABLE 3-4 SUMMARY OF DIRECT COMPRESSION TRIALS FOR COMPOUND-A TABLETS. (AVERAGE + -
S TD EV )................................................................................................................................ 7 1
TABLE 3-5 SIMULATED ROLLER COMPACTION PRODUCES SATISFACTORY TABLETS.................... 73
TABLE 3-6 COMPOUND-A FORMULATIONS FOR ROLLER COMPACTION....................................... 74
TABLE 3-7 OPERATIONAL CONDITIONS FOR ROLLER COMPACTION. ............................................... 75TABLE 3-8 COMPOUND-A TABLET DATA OF ROLLER COMPACTION FORMULATIONS. .................... 76
TABLE 3-9 PROLONGED TABLETTING TEST OF M50 FORMULATION. .............................................. 77
TABLE 3-10 TABLETTING SPEED TEST FOR M50 FORMULATION................................................... 78
TABLE 3-11 TABLETTING PRODUCTION OF COMMERCIAL SCALE TABLETS FOR M60 FORMULATION.
............................................................................................................................................... 7 8
TABLE 3-12 FLOWABILITY TEST RESULTS FOR M50 / M70 FORMULATIONS. N=3....................... 83
TABLE 4-1 SCANNING PARAMETERS FOR TABLET FRAGMENTS. ................................................... 95TABLE 4-2 COMPOSITION OF M1O/M30/M50/M70 FORMULATIONS............................................ 106
TABLE 5-1 COMPARISON BETWEEN DISSOLUTION SPEEDS OF STANDARD PADDLE TEST AND
CONVERTED HOLDER TEST. .................................................................................................. 142TABLE 7-1 COMPARISON OF TECHNOLOGIES FOR MICROSTRUCTURAL ANALYSIS......................... 181
TABLE 8-1 TUNABLE FORMULATIONS. ......................................................................................... 188

18

Chapter 1 Introduction
On a retail package of pharmaceutical tablets, one can often find a long list of inactive
ingredients, including fillers/binders, disintegrants, lubricants, glidants, coating materials, etc.
These materials, called excipients, facilitate the manufacturing process and provide the tablets
with adequate properties. The selection of excipients and subsequent processing designs has
been studied extensively in the pharmaceutical industry for the last several decades. Currently,
major excipients are picked to match the active pharmaceutical ingredient (API) based on their
physicochemical properties, with the overall formulation and manufacturing process improved
via statistical design of experiments (DOE). In order to achieve rational formulation
development, we hypothesize that an in-depth understanding about the tablet itself, especially the
microstructure, is required to bridge our knowledge about the other components of
pharmaceutical manufacturing (Figure 1-1).
Formulation Process Characeistics
Figure 1-1 Relationship among different components in formulation development.
Tablet microstructure refers to the arrangement of materials within a tablet as a direct result of
material interactions through the manufacturing process. It includes not only the arrangement of
materials and void space, but also the distribution of different materials. Due to limitations in
technological and analytical capability, no detailed 3-D characterization of tablet microstructure
has been described in literature to date.
In this study, tablet microstructure analysis via micro-computed tomography (microCT) is
coupled with analysis of dissolution mechanism using a built for purpose tablet holder, leading to
comprehensive insights of the material interactions during the manufacturing process, the
........ ......... ....................................................................................................................................................................................... . ........ .... ................ .. ..........................
resulting microstructure, and the impact on pharmacological properties like dissolution. The
analytical toolbox compiled and evaluated in this work facilitates rational microstructure design,
providing scientific rationale in the selection of ingredients and manufacturing process.
1.1 Motivation
In order to be administered successfully, medication needs to be in a certain physical format, or a
dosage form. A dosage form can be liquid, aerosol or gas, but more often solid. Tablet is the
most popular solid dosage form due to its stability, transportability, and ease of manufacturing.
It is the single largest dosage form of final drug products, accounting for 48% of all the drugs
available in U.S.A according to drugs@FDA database as of 03/2009. A huge number of
publications on tablet exist today in the pharmaceutical literature. One category of publications
deals with the design and performance of specific formulations, another focuses on the
elucidation of general processing behaviors and their implications for pharmacological properties,
with a specific emphasis on commonly used ingredients.
To obtain satisfactory tablet production, consistency in a few analytical test categories needs to
be achieved (Table 1-1). In physical properties, content uniformity in terms of API loading per
tablet, API distribution within the tablet, and crystalline form stability are important quality
attributes to control; in chemical properties, the formulation or manufacturing process should
lead to a tablet that can endure stability testing at elevated temperature/moisture conditions, with
no API degradation or API-excipient reactions; in mechanical properties, the hardness and
friability determines a tablet's ability to survive handling and transportation; in pharmacological
properties, dissolution test (and sometimes disintegration test), often acting as in vitro surrogate
test for bioavailability, need to yield consistent and satisfactory dissolution behaviors conforming
to the desired in vivo pharmacokinetics (PK) and pharmacodynamics (PD) profiles. We believe
that a wide range of the properties are directly impacted by tablet microstructure, e.g., content

uniformity, hardness, friability, and dissolution/disintegration. Therefore, a quantitative
understanding of tablet microstructure could lead to new insights into the tablet properties.
Table 1-1 In vitro analytical tests for quality assessment of pharmaceutical tablets.
In Vitro Quality Matrix for Tablets
Properties Analytical Tests
Physical Uniformity, Stability
Chemical Stability
Mechanical Hardness, Friability
Pharmacological Dissolution, Disintegration
The key hurdle in understanding tablet microstructure stems from the limitations of technologies
and methodologies currently applied in formulation development. Microscopic methods provide
high resolution but can not go beyond the surface layer of the materials; some also require
surface treatment which might mask structural characteristics. Spectroscopic methods have the
penetration power to resolve 3-D structure of the formulation dosages, but do not provide enough
resolution until the emergence of microCT. Other physical methods, especially mercury
porosimetry, have been adapted to probe into tablet microstructure. However, as will be
demonstrated in this study, mercury porosimetry is intrinsically limited by the problematic
assumptions it made in theory. The collaborative lack of quantitative 3-D characterization of
tablet microstructure prohibits clear understanding of the interactions among materials during
manufacturing process, which further prohibits a rational formulation design leading to
predictable tablet properties.
On the other hand, the current analytical methods for characterizing tablet properties often do not
facilitate mechanistic investigation of the testing process. Paddle dissolution test, a critical
..... ........ .................... ................................................................................................................ ........................... c .......... ............ - - ... .............................................................................................................. .. ........................................... .............. ......

analytical test for in vitro bioavailability evaluation and many other purposes, allows a tablet to
dissolve freely in a complex hydrodynamics condition. The uncontrolled hydrodynamics and
tablet morphology makes it difficult to identify the key drivers to dissolution process, deterring
rational formulation designs specifically promoting these key drivers.
The lack of mechanistic knowledge for tablet microstructure and tablet properties creates a
knowledge gap within pharmaceutical manufacturing process, preventing a thorough
understanding and rational design of the system.
1.2 Strategy and Specific Aims
In this Ph.D. study, a systematic approach was adopted in designing and testing a toolbox to
bridge a knowledge gap concerning material transformation in manufacturing process and the
subsequent impact on tablet properties. The goals of the study are to develop a tomography
imaging method for quantitative description and 3-D visualization of tablet microstructure, to
develop a novel tablet holder to be used in combination with paddle dissolution test for
dissolution mechanism investigation, and to develop a quantitative analysis tool for
understanding the relationship between microstructure and dissolution process (Figure 1-2).
Formulation Property Library
-inwMicrostructure
Excipients A Prope YesM Feck Good Pass
APIAdd more ingredientsAdjust comp. process
Figure 1-2 Illustration of traditional route for formulation development and the incorporation of new tools.

This toolkit would be applied to both a caffeine-lactose direct compressed tablet formulation as
well as a roller compacted tablet formulation that is developed in this study for Novartis
compound-A. The case studies should pave the way for the establishment of a novel tablet
characterization system, providing scientific guidance in both development and manufacturing
settings. The specific aims of the study are listed as follows:
Specific Aims #1: Develop a microCT imaging method with 3-D analysis toolkit for
visualization and quantitative characterization of tablet microstructure.
First, a proper microCT scanning configuration for pharmaceutical tablets would be tested and
established; a digital post-processing workflow would then be developed to prepare the raw data
for further quantitative analysis; lastly, sophisticated algorithms will be prepared to regenerate
tablet pore space with structural modules, illustrating the arrangement patterns of the
microstructure and providing guidance for quantitative analysis.
Specific Aims #2: Develop a novel tablet holder for dissecting dissolution mechanism.
A novel tablet holder would be developed and used in combination with standard paddle
dissolution test for understanding the dissolution mechanisms of pharmaceutical tablets.
Correspondent physical/mathematical models would be used to establish dissolution mechanisms
and interpret the dissolution results. Comparison between the paddle test and the holder test
would be used to evaluate the contribution of tablet disintegration to overall dissolution speed.
Specific Aims #3: Develop a roller compaction formulation for Novartis compound-A that
is amenable for continuous manufacturing using QbD methodology.
A compound-A tablet formulation would be developed based on the understanding of material
properties rather than the empirical evidences for ingredient selection. The formulation is
targeted to minimize the number of ingredients and manufacturing steps, facilitating continuous
manufacturing while maintaining superior tablet properties.

Specific Aims #4: Understand the relationship between microstructure and compaction /
dissolution mechanism of compound-A/caffeine-lactose tablets with microCT/holder
toolbox.
The microCT/holder toolbox will be tested on the tablet formulations developed in this study.
Microstructure models derived from microCT scans would be used in 3-D computerized
simulation of liquid intrusion, generating reliable permeability information. A quantitative
interpretation of dissolution behaviors based on dissolution mechanism and tablet microstructure
would be established, providing valuable insight in microstructure design for fine-tuning tablet
properties.
1.3 Background
This section gives an overview of tablet compaction, pharmacological properties and tablet
microstructure, providing the basic knowledge important for understanding the discussions in the
following chapters.
1.3.1 Tablet Compaction in Pharmaceutical Manufacturing
The major forming method for pharmaceutical tablets is compaction, realized via a pressurizing
process for powder mixtures conducted on a tablet press. As simple as it looks, tablet
compaction remains a process that is based more on empirical knowledge than on scientific
theory (1). The use of basic physicochemical data in formulation work for prediction of
tabletting properties, for example compressibility (ability to reduce in volume) and
compactibility (ability to form compacts), is relatively limited due to insufficient understanding
of the underlying physical interactions of the materials in use (1).

Secondary Pharmaceutical Manufacturing
There are two phases of pharmaceutical manufacturing. Primary pharmaceutical manufacturing
refers to the process during which active pharmaceutical ingredient (API) is produced, while
secondary pharmaceutical manufacturing refers to the process that API is mixed with excipients
and produced into a final dosage form, e.g. a tablet. As tablet compaction is a critical step for
shaping the pharmacological properties, a series of other unit operations ahead of it are used to
prepare the materials for the tabletting process.
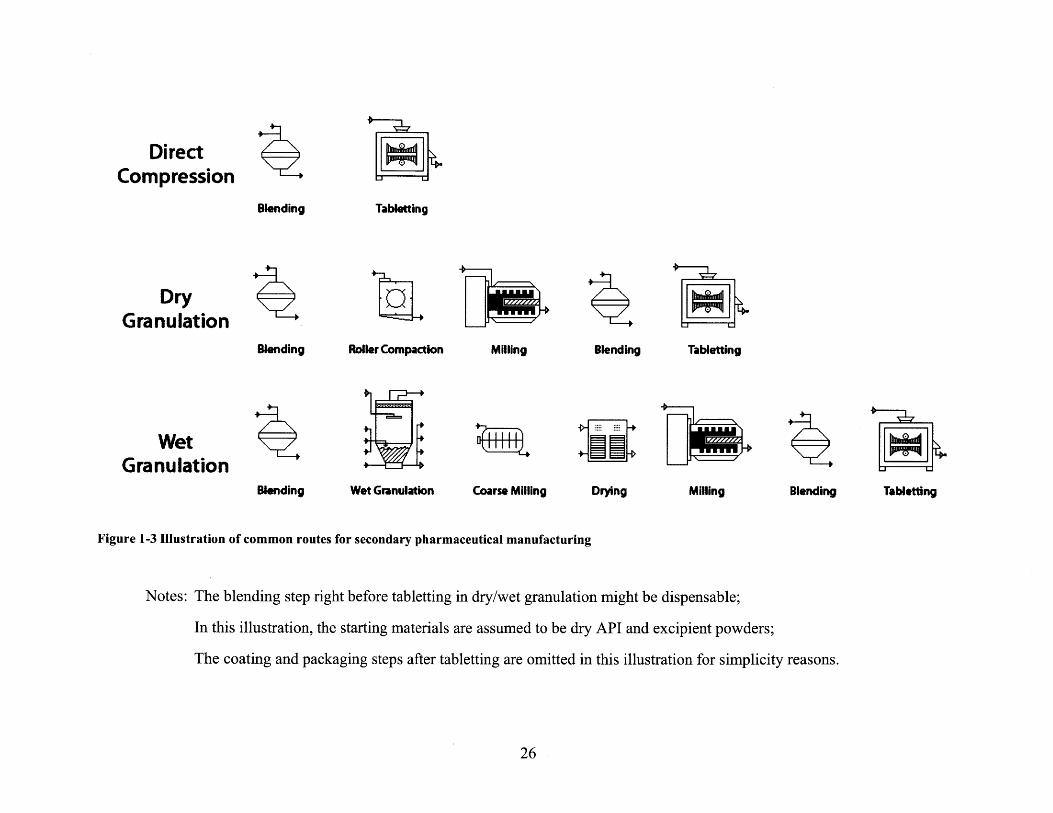
In order to achieve good performance for the quality matrix listed in Table 1-1, multiple routes
of secondary pharmaceutical manufacturing have been devised; the most popular three routes are
direct compression, dry granulation, and wet granulation (Figure 1-3):
Direct compression is the most desired manufacturing route, in which dry API powder is blended
with appropriate excipients and fed directly to the tablet press. It is theoretically straightforward,
easy to control, and bears low cost. However, it also imposes high requirement on material
consistency and on the proper interaction between the API and excipients in blending and
compaction. No segregation should happen in the blending process, which could lead to
heterogeneous mixtures. The powders should be free flowing and of sufficient density, ensuring
consistent feeding to the press to obtain adequate tablet weight. The excipients should yield
proper binding to the API and form tablets with good mechanical and physical strengths. Direct
compression is a top choice upon satisfaction of the criteria listed above, but often requires
longer development time due to insufficient understanding of material interactions. It also bears
a much higher risk in scale up, as there is less room for adjustment of particle size or moisture
level when compared with the other two routes. This prolonged development time coupled with
higher potential variation in scale-up / production dramatically reduces the utilization of direct
compression.
1.3.1.1
DirectCompression
DryGranulation
Blending
WetGranulation
Blending
Roller Compaction
Wet Granulation
Milling
Coarse Milling
Figure 1-3 Illustration of common routes for secondary pharmaceutical manufacturing
Notes: The blending step right before tabletting in dry/wet granulation might be dispensable;
In this illustration, the starting materials are assumed to be dry API and excipient powders;
The coating and packaging steps after tabletting are omitted in this illustration for simplicity reasons.
Blending Tabletting
Blending
Drying
Tabletting
Milling Blending Taletting

More commonly seen in new drug applications (NDA) is wet granulation, which is
relatively established but requires additional manufacturing steps. The powder blend is
thoroughly mixed with a liquid binder/adhesive in a high shear mixer, e.g. aqueous
preparation of cellulose derivatives, and passed through coarse screens. The materials are
then dried and subjected to further milling, resulting in granules of desired size for
tabletting (typically a few hundred microns). After a final blending step, the powder is
fed to the tablet press. The wet granulation procedure is considerably more complicated
than direct compression, with seven unit operations vs. ideally two for the latter. The
operational cost is higher and due to the additional steps, there is a need for additional
process control. However, because wet granulation better accommodates material
variability, it is a more universal process.
Sitting right between direct compression and wet granulation is dry granulation (roller
compaction), where the powder blend goes through light compression under relatively
low pressure to enhance cohesiveness and density. The compressed material, often called
ribbon, is then passed through a mill to generate granules, which are typically further
blended with lubricants/free-flowing agents/excipients before tabletting. Dry granulation
does not introduce a liquid phase into the process, and thus spares the need for wet
milling and drying. This is especially important for an API that is sensitive to water or
heat. But the number of unit operations is still more than twice that for direct
compression. Plus, dry granulation is more prone to produce fine powders before
tabletting, potentially reducing the yield and generating uncertainties in tabletting
behaviors. Powder flowability prior to dry granulation should also be excellent.
It is obvious that direct compression is the most desirable route for secondary
pharmaceutical manufacturing. In reality, the semi-empirical nature of the current
formulation development practice and the insufficient understanding of material
interactions make direct compression a time-consuming target to reach. For candidates
that are being prepared for New Drug Application (NDA), time-to-market is critical to
maximize patent-protected sales period. As a result, a majority of NDA drugs end up
with wet granulation. The cost of goods sold (COGS) for brand name drugs has been

around 25% of revenues, while that for generic drugs is around 50% (2). According to
Ruey-Ching (Richard) Hwang, a senior director of pharmaceutical sciences at Pfizer
Global Research and Development (Kalamazoo, MI), "more than 50% of the generic
formulations I've worked on use direct compression. About 30%-40% wind up using wet
granulation and 10% or less use roller compaction."(3) With an adequate knowledge
about material interaction and the subsequent impact on tablet microstructure / properties,
there is a much better chance (and confidence) to promote direct compression for NDA
drugs.
1.3.1.2 Mechanism of Tablet CompactionThe process of tablet compaction involves a few basic steps (Figure 1-4). The powder is
first filled into the die with excessive portion removed, after which the upper punch of the
press travels down in coordination with lower punch to compress the powder into a tablet,
and then the lower punch travels up to eject the tablet.
top punch
powderrmonved
bottomn punch
Ill: IV
tabletpressed tablet
Figure 1-4 The basic steps of tablet compaction. Adapted from ABPI resources for schools.
The powder goes through two stages in this process. First, the particles rearrange
themselves and are subjected to (reversible) elastic deformation, after which they undergo
(irreversible) plastic deformation and/or fragmentation and develop strong inter-particle
...... ... ...... . ....... .............................. ... .: ................ ...... .. .......................... ........ " I'll ...... .. .. .. .......... ...... ...... .. .......... ................................ ....................... .. ...... .. .................... .. ..

solid bonding. In manufacturing processes, in order to allow displacement of air and the
material to relax and form greater solid bonds, there may be a pre-compaction step that is
performed at lower pressure than the main compaction. The terminology compaction and
compression are often used interchangeably in the industry, causing unnecessary
confusions. In this study we define that compression is the reduction in volume of a
powder bed due to the application of a pressure, while compaction is the transformation
of a powder into a coherent specimen of defined shape by powder compression.
Multiple factors could influence the quality of tablet production. Moisture-powder
interaction is a major factor in formulation, processing, and performance of solid dosage
forms (4). Appropriate control of material moisture level and relative humidity (RH) of
manufacturing facility could be critical in achieving desired and consistent final product
quality. Particle size/shape distribution could potentially affect both the particle
rearrangement and elastic/plastic consolidation of the powders. Typically, at the same
compaction pressure, tablet hardness increases with decreasing particle size due to larger
numbers of contact points(5), although the flowability of the powder could decrease
simultaneously. Other important properties of the API and excipients include
crystallinity(6), polymorphism(7, 8) / amorphism(9), salt form(10). On the process side,
the manufacturing steps prior to tablet compaction have direct impact on material
properties and interactions, as discussed above. The speed of compaction can have
significant impact on tablet properties, as materials response differently when subjected
to the same pressure at various speeds, which often presents a big challenge for scale-up
and technology transfer when tabletting speed increases significantly (11). The force of
the main compaction, the existence of pre-compaction, and their relative magnitude
might impact the mechanical strength and defect rates of the tablets (12).
Tablet manufacturing is a multi-step process that involves a lot of different factors.
Through deciphering tablet microstructure, this study aims to rationalize the development
process.

1.3.2 Tablet Properties and Analytical MethodsDue to the desired efficacy and potential toxicity of the pharmaceutical tablets, the tablet
properties as listed in Table 1-1 are measured with correspondent analytical methods to
ensure quality compliance. In this section we discuss the physical/chemical, mechanical,
and pharmacological properties of the tablets, as well as the associated analytical
methods.
1.3.2.1 Physical/Chemical Properties
The shape and size of a tablet is mainly determined by the shape of the tooling,
operational setups, and material loading. Thickness plays an important role for the
mechanical stability of the tablets during transport and packaging (especially when
tablets are blistered). For the same level of die filling, tablet thickness is determined by
the compressive load and material elasticity. Tablet thickness is typically measured with
a micrometer and is controlled within 5% deviation from a standard value. The tablet
should look generally appealing and free of defects, with coating applied to enhance
surface texture if necessary.
Content uniformity or weight variation is used to determine dosing consistency. Content
uniformity test is required by US Pharmacopeia (USP) for most tablets that have less than
50mg or 50% of API by weight'. Ten units of tablets are assayed for accurate API
content, all of which should stay within +/- 15% from the standard value, with a standard
deviation of less than 6%. Should either criterion not be met, additional testing would be
needed and the batch might fail. For tablets that content uniformity test is not required,
weight variation test might be adopted instead. Weight is controlled via die filling
volume. To have consistent tablet weight, the powder should have uniform density as
well as good flowability.
Physical and chemical stability are usually tested under temperature and moisture levels
specified by pharmacopeias. Long term stability test is typically done at 25 *C and 60%
1 USP 29 - NF 24, General Chapters <905>, Uniformity of Dosage Units.

RH for up to three years. An accelerated condition of 40'C and 75% RH allows
examination of stability in a much shorter time frame (max 6 months). Physical stability
mainly refers to the capability of maintaining hardness and dimensions as well as original
crystalline forms, with the latter typically assessed by X-ray powder diffraction (XRPD).
Chemical stability examines the self-degradation of API or its reaction with other
ingredients in the formulation, which is typically assessed with high performance liquid
chromatography (HPLC).
1.3.2.2 Mechanical PropertiesThe mechanical strength of a tablet indicates the degree of bonding among the materials
after the manufacturing process. The bonding should neither be so strong that
disintegration/dissolution of tablet is impeded, nor so weak that the tablet can not endure
normal handling, packaging, or transportation. There are mainly two types of USP
compendial tests for mechanical strength. Tablet hardness/tensile strength test focuses on
the strength while friability test focuses on the weakness.
The hardness test measures the breaking force, the force required to cause tablet to fail in
a specific plane. The tablets are generally placed between two plates, one of which
moves and applies sufficient force to the tablet to cause fracture. For round tablets,
diametral loading is adopted. The case of point-loading of a homogeneous disk at
diametrically opposite points can be solved analytically using continuum mechanics
equations, which indicates that tension is induced in the direction perpendicular to
loading(13). In reality, three modes of failure have been observed (Figure 1-5). Tensile
failure is characterized by a clean split into halves along the loaded diameter (parallel to
the direction of loading) or by a triple cleft failure. Shear failure is characterized by
crushing at the contacts and the progression of failure zones until the tablet collapses. It
has been shown that to obtain reproducible results for the strength of tablets prepared at a
given compression force, the tablet must break in such a manner that the tensile stress is
the major stress(14). As a result, hardness is not exactly a good description of the test,
while breaking force is really measuring the tensile strength.

Load Load Load
(a) (b) (c)
Figure 1-5 Tablet failure mode in hardness testing. (a) simple tensile failure, (b) triple cleft (tensilefailure) (c) shear-induced failure (illustration was adapted from Davies and Newton, PharmaceuticalPowder Compaction Technology, 1996, pg 165).
Tensile strength is a more accurate measurement of mechanical strength as it also takes
into account the geometry of the tablet. Based on elastic theory and a few assumptions,
the tensile strength of cylindrical tablets has been derived as follows(1 5):
2Fa-= (1.1)7cDH
Where F is the breaking force/hardness, D is the diameter and H is the tablet thickness.
In daily practice of pharmaceutical formulation development, hardness in unit of N is
often adopted. Oral round tablets normally have a hardness value of 40-1OON, some
chewable or hypodermic tablets could have hardness less than 30N, while some extended
release tablets or larger ovaloid tablets could carry hardness values of 100-200N (16).
A friability test is complementary to the hardness test, evaluating the ability of tablets to
withhold abrasions resulting from coating, packaging, shipping, and handling. A number
of tablets adding up to 6.5g (or 10 tablets if single weight more than 650mg) are placed in
a Roche friabilator, which rotates and subjects the tablets to repeated rolling and falling
shocks from 6 inch height (Figure 1-6). After 100 rotations (or 500 if the tablets will later
be coated), the weight loss of the tablets is recorded and should not exceed 1%. If a
tablet cracks, the test automatically fails.
................ ......... ....... ................

2870 * 4 0 mminside dameter
156.0 * 2.0 mm
diameter
2&.0 tOS mmdiameter
302,5 i4.0 mmdameter 38 0t 2.0
Figure 1-6 USP Standard tablet friability apparatus. Adopted from USP 31 Chapter <1216>
1.3.2.3 Pharmacological PropertiesPharmacology refers to the study of interactions between a living organism and chemicals,
and the consequently altered biological functions. It mainly includes pharmacokinetics
(PK) and pharmacodynamics (PD). PK refers to the impact of body on the drug, e.g., the
plasma drug concentration vs. time, while PD refers to the impact of drug on the body,
e.g., efficacy and toxicity profile. Both PK and PD are in vivo studies. In order to
develop an in vitro tool to mirror the in vivo activities, the pharmaceutical industry started
with disintegration test and settled with dissolution test. It is worth clarifying that
disintegration test and dissolution test are different from the disintegration and
dissolution of tablets. The former are tests and the latter are processes.
As early as 1950, disintegration test was adopted in US Pharmacopeia 14 as an in vitro
method for assessing bioavailability. It combines mechanical shear force and
hydrodynamics penetration to expedite the disintegration of the tablet and record the time
it takes to complete. The disintegration apparatus consists of a basket rack holding six
plastic tubes open at the top and bottom. The bottom is covered with a 10 mesh screen.
The tubes are immersed in a suitable liquid (often water) at 370C and moves up and down

at 30 RPM. One tablet is placed into each tube and the time for the tablet to disintegrate
and fall through the screen is taken as the disintegration time. Disintegration time does
not necessarily indicate complete dissolution of the tablet, neither does it have good
correlation with in vivo PK. It was found out that gastric movement creates a much
milder mechanical stress than the disintegration test( 17). Disintegration test is currently
used in quality control for batch-to-batch variation, but is not used to provide too much
additional information about tablet properties.
The shortfalls of disintegration test were soon realized by the industry. Dissolution test,
in which the concentration of dissolved active ingredient in a preset agitation regime is
tracked against time, emerged as a closer resemblance of the in vivo activities. In 1957,
Nelson demonstrated that the blood level of orally administered theophylline salts was
directly related with their in vitro dissolution rates (18). In 1960s and 70s, studies started
to emerge demonstrating the impact of dissolution rate on bioavailability (19-2 1). A
study of digoxin bioavailability demonstrated that different formulations of digoxin
yielded up to sevenfold of difference in serum digoxin level (22). After years of
experiments with different setups, a rotating basket dissolution test was first adopted as a
standard test method (USP #1) by USP 18 in 1970. As early as 1976, USP essentially
requires most of tablets and capsules to have dissolution requirement. In another two
years, a rotating paddle dissolution test was adopted as USP #2 test by USP and soon
gained popularity partially due to its simple design. There are 7 compendial dissolution
tests currently in USP, but the basket test and paddle test remain the dominant tests used
by the industry.

Paddle Method Basket MethodUSP Apparatus #2 USP Apparatus #1
Figure 1-7 Illustration of paddle and basket dissolution setup. Adapted from Jascofrance, Inc.
An illustration of the basket and paddle dissolution apparatus is shown in Figure 1-7.
Both tests are utilizing the same dissolution vessels, typically with a IL volume. The
vessels are immersed in a water bath or bathless heating jacket, with a typical
temperature of 37-37.5 C. The difference is in the mechanism of agitation. Basket
method utilizes a rotating basket, with tablet placed inside. The basket is made from
stainless steels and has an inner diameter/height of 20mm/27mm. The basket is
positioned so that the bottom is 25mm away from the vessel bottom. The side wall and
bottom wall are screens with welded seam of specified diameter and openings. The tablet
goes through dissolution when in contact with the medium agitated by the rotating basket.
Basket dissolution has a series of drawbacks, where the complexity of hydrodynamics
inside the basket is to be blamed. There is a high shear region near the side wall, ejecting
disintegrated tablet fragments out of the mesh, while at the bottom region of the basket
the agitation is relatively mild, where the fragments are often deposited until dissolved
(23, 24). Simulation of basket hydrodynamics with Computational Fluid Dynamics
(CFD) suggests that when a tablet lays flat at the bottom of the basket, free convection
contributes significantly to the dissolution process (24) (Figure 1-8). Unfortunately, the
. ..... ...... ........

position of the tablet inside of the basket is not consistent. It was often observed that a
tablet could flow atop the basket, lean against the side wall, or lay flat on the bottom.
The very complex nature of the hydrodynamics in this small basket makes it difficult to
understand how dissolution is impacted by the surrounding flow patterns.
0.500-025.8422
.67 9-02 Z
5.524025.20-02
42e-02
et al.,0200
6.5702
325eJ-o2 Y-
The paddle dissolution method utilizes agitation of a center-shafted paddle to drive
medium flow. The tablet typically sits in the hemispherical bottom region of the vessel,
but could be floating if density is low. The paddle has an upper width of 75mm and a
lower width of 42mm, with a height of 19mm. The paddle is positioned so that the lower
edge is 25mm away from the vessel bottom. Paddle dissolution is currently the most
widely used method, due to its simplicity of design and the ambient amount of data on In-
Vitro-In-Vivo Correlation (IVIVC). The hydrodynamics situation of paddle dissolution
is also relatively complex. From CFD simulation .(25) and experimental results, it is
observed that right under the paddle there is a region with highly unpredictable swirling
flows (Figure 1-9). This region, nicknamed the "dead zone", is often the region that
tablet sits in during most of the dissolution period. The flow speed at lecm away from the
bottom center could be three times as high as that at the bottom center, so the positioning
of the tablet could potentially have a big impact on the dissolution results (26). Tablet

could also collapse into a pile of debris, further complicating the understanding of the
dissolution mechanism and impede IVIVC studies.
A t120.-o1IAV
9.600-02
7.20e-02
6.006-02
4 800-02
3.60e-02
2.400-02
1200-0210- Secondary recirculation
0~ patterns
Velocity Vectors Colored By Velocity Maanitude Im/s) ADr25. 2002
Figure 1-9 CFD simulation of hydrodynamics in USP paddle dissolution test, 50 RPM, adapted fromMcCarthy, et al., 2003
In spite of the difficulty in hydrodynamics investigation and thus mechanistic
understanding, dissolution has been widely adopted by the pharmaceutical industry in
multiple functionalities (Figure 1-10). It is being used extensively in formulation
development as an in vitro bioavailability test, establishing IVIVC. Dissolution is a
routine quality assurance test in examining batch-to-batch reproducibility and influences
the decision of product release. Failed dissolution tests resulted in 14 product recalls in
1999, which is 18% of non-manufacturing recalls for oral solid dosages of the year (27).
The numbers climbed to 20 and 24% for the year of 2000 (28). More recently,
dissolution is used in approval of scale-up / post-approval changes (SUPAC) (29, 30),
which allows the pharmaceutical companies to optimize the manufacturing procedures
after the approval of the initial manufacturing setup. The most notable recent
development lies in the central role of dissolution test in determining biowaiver eligibility
of certain immediate-release dosage forms (31). Since in vivo bioavailability and
.... . ....................................................................... .................................................... ............................

bioequivalence study is costly to conduct, this development represents a powerful
cost-saving functionality provided by the dissolution test.
Biowaiverfor Generics
Formut jpApproval forDovel SUR
Dissolution
Batch-to-batch ProductReproducibility
Figure 1-10 The central position of dissolution test in pharmaceutical industry functionalities.
1.3.3 Tablet MicrostructurePharmaceutical tablets are typically produced from powders of active ingredients and
excipients via the process of compaction. The internal microstructure of tablets often
takes a porous configuration that depends on the nature of the raw materials and the
compaction process itself. Such a microstructure has a direct impact on the quality of the
pharmaceutical tablets. Tablet bulk porosity was demonstrated to have an exponential
relationship with tablet tensile strength (32), while increasing pore size within a tablet has
a negative impact on tensile strength (33). Porosity can also directly impact dissolution.
When diffusion through the outer layer is the rate limiting step of the process, high
porosity leads to fast dissolution in both pharmaceutical granules (34) and tablets (35)
due to a larger surface area. Quantitative characterization of the microstructure will help

understand tablet properties and thus facilitate rational formulation design based on
material properties and processing conditions.
In pharmaceutical science, common experimental techniques to study porosity are helium
pycnometry, gas adsorption and mercury porosimetry. Helium pycnometry is used to
measure the "true density" of the powders, based on which a theoretical bulk porosity of
the tablet can be calculated (36). Gas adsorption has been adopted to measure tablet
internal surface area (37). Mercury porosimetry is the only method capable of measuring
a pore size distribution of the tablet and has been widely utilized in the pharmaceutical
industry for this purpose (38). It involves the intrusion of mercury at high pressure into a
material. The pore size can be determined based on the external pressure needed to force
the liquid into a pore against the opposing force of the liquid's surface tension (Figure
1-11). However, it was indicated that in pharmaceutical granules, the pore diameter it
measures is the diameter of the necks connecting the pores, and it can not reach the pores
that are isolated from external connections (39). It records the total volume of pores at a
certain indicated diameter but does not contain individual pore information. It also does
not contain any location-dependant information, while it is known that uni-axially
compacted tablets have anisotropic density and porosity distribution (40, 41).
Furthermore, it is destructive and environmentally hazardous.
Based on a capillary law for non-wetting liquid,the Washburn Equation:
D=-4 y cos(O)/PWhere:
* y: surface tension of pure mercury (480 dyne/cm)
* : contact angle between mercury and the solid- P: mercury penetration equilibrated pressure
- D: pore diameter
Figure 1-11 Illustration and theory of mercury porosimetry.
The current standard methods fail to provide adequate and accurate information of tablet
microstructure. With the recent advancement in microscopic and tomographic sciences,
new approaches have become available to characterize tablet microstructure. Donoso et
. .... .............................................................................................. ....... ...........
Merur

al. used near-infrared (NIR) diffuse reflectance spectroscopy to predict porosity of
theophylline tablets and obtained generally good agreement with results from helium
pycnometry (42). Similar tests were conducted on Metoprololtartrate tablets not only
with NIR but also with Raman spectroscopy (43). These studies indicate an opportunity
for on-line porosity monitoring, but no detailed porosity profile information is obtained.
Wu et al. analyzed scanning electronic microscopic (SEM) images of different
mechanically-cut sections of sodium chloride tablets with a binarization method and
showed an increase in porosity toward the bottom of a tablet and a preferred orientation
of the pores in the direction of compaction (40). In a follow-up study, they further
adopted a digital processing method called a morphological sieve (44). A porosity profile
was obtained after filtration of floating grains and small pores in SEM images. The
degree of filtration is determined so that bulk porosity is in good agreement with data
obtained from traditional methods. As a result, this method does not provide an
independent characterization of porosity profile.
Micro computed tomography (microCT) is a promising technology that has emerged in
the last decade with potentially sufficient resolution power to probe tablet microstructure.
In Chapter 4 & 6, we will discuss novel methods in applying microCT toward tablet
microstructure study, revealing microstructure information that has never been accessible
in the past. The new information is critical in aiding our understanding of the formation
and impact of microstructure, bringing us one step closer toward rational formulation
design.
The development of microCT technology also leads to a similar technology with higher
resolution, the nanoCT. MicroCT currently has a maximum resolution of 1 - 10 pim /
pixel, while nanoCT can reach 50 - 150 nm / pixel. Another promising technology with
a maximum resolution of 5 - 20 nm / pixel is focused ion beam scanning electron
microscopy (FIB-SEM). It transforms the traditional SEM from 2-D into 3-D by utilizing
an ion beam to cut off sample slides between SEM scans. A preliminary study using
FIB-SEM is described in Chapter 7, demonstrating its potential as well as problems.

1.4 Chapter Bibliography1. G. Alderbornand C. Nystrom. Pharmaceutical Powder Compaction Technology,
Marcel Dekker, Inc, 1996.2. G.J. Prabir Basu, Saket Rai, Pradeep Suresh and John Vernon. Analysis of
Manufacturing Costs in Pharmaceutical Companies Journal of PharmaceuticalInnovation. 3:30-40 (2008).
3. D. McCormick. Evolutions in Direct Compression. Pharmaceutical Technology.29:52-63 (2005).
4. G. Schepky. Preformulation - the Role of Moisture in Solid Dosage Forms. DrugDevelopment and Industrial Pharmacy. 15:1715-1741 (1989).
5. C.Q. Sunand D.J.W. Grant. Effects of initial particle size on the tabletingproperties of L-lysine monohydrochloride dihydrate powder. International Journalof Pharmaceutics. 215:221-228 (2001).
6. N.E.F. J. Jaffe. Compression of crystalline substances. J Amer Pharm Ass Sci Ed.48:9 (1959).
7. Y.S. Feng, D.J.W. Grant, and C.C. Sun. Influence of crystal structure on thetableting properties of n-alkyl 4-hydroxybenzoate esters (Parabens). Journal ofPharmaceutical Sciences. 96:3324-3333 (2007).
8. C.Q. Sunand D.J.W. Grant. Influence of crystal structure on the tabletingproperties of sulfamerazine polymorphs. Pharmaceutical Research. 18:274-280(2001).
9. T. Sebhatu, A.A. Elamin, and C. Ahlneck. Effect of Moisture Sorption onTabletting Characteristics of Spray-Dried (15-Percent Amorphous) Lactose.Pharmaceutical Research. 11:1233-1238 (1994).
10. C.Q. Sunand D.J.W. Grant. Compaction properties of L-lysine salts.Pharmaceutical Research. 18:281-286 (2001).
11. C.K. Tye, C.C. Sun, and G.E. Amidon. Evaluation of the effects of tabletingspeed on the relationships between compaction pressure, tablet tensile strength,and tablet solid fraction. Journal of Pharmaceutical Sciences. 94:465-472 (2005).
12. C.E. Rueggerand M. Celik. The influence of varying precompaction and maincompaction profile parameters on the mechanical strength of compacts.Pharmaceutical Development and Technology. 5:495-505 (2000).
13. J.P.D. Hartog. Advanced Strength of Materials, McGraw-Hill, New York, 1952.14. J.T. Felland J.M. Newton. Determination of Tablet Strength by Diametral-
Compression Test. Journal of Pharmaceutical Sciences. 59:688-& (1970).15. S. Tomoshenko. Theory of Elasticity, McGraw-Hill, New York, 1934.16. E. Rudnicand J.B. Schwartz. Remington's Pharmaceutical Sciences, A. R. Mack
Publishing Company, Easton, Pennsylvania, 1990, pp. 1633-1665.17. A. Guyot-Herman. Tablet disintegration and disintegrating agents. STP Pharma
Sci. 2:445-462 (1992).18. E. Nelson. Solution rate of theophylline salts and effects from oral administration.
J Am Pharm Assoc. 46:607-614 (1957).19. G. Levy. Effect of dosage form properties on therapeutic efficacy of tolbutamide
tablets. Can Med Assoc J. 90:978-979 (1964).20. A.B. Varley. The generic inequivalence of drugs. Journal of American Medical
Association. 206:1745-1748 (1968).

21. C. MacLeod, Rabin, H., Ruedy, J., Caron, M., Zarowny, D., Davies, R.,.Comparative bioavailability of three brands of ampicillin. Can Med Assoc J.107:203-209 (1972).
22. J. Lindenbaum, Mellow, M.H., Blackstone, M.O., Butler Jr., V.P.,. Variation inbiologic availability of digoxin from four preparations. N Engl J Med. 285:1344-1347 (1971).
23. M. Morihara, N. Aoyagi, N. Kaniwa, N. Katori, and S. Kojim. Hydrodynamicflows around tablets in different pharmacopeial dissolution tests. DrugDevelopment and Industrial Pharmacy. 28:655-662 (2002).
24. D.M. D'Arcy, 0.1. Corrigan, and A.M. Healy. Evaluation of hydrodynamics in thebasket dissolution apparatus using computational fluid dynamics - Dissolutionrate implications. European Journal of Pharmaceutical Sciences. 27:259-267(2006).
25. L.G. McCarthy, C. Kosiol, A.M. Healy, G. Bradley, J.C. Sexton, and 0.1.Corrigan. Simulating the hydrodynamic conditions in the United StatesPharmacopeia paddle dissolution apparatus. AAPS PharmSciTech. 4:E22 (2003).
26. D.M. D'Arcy, 0.1. Corrigan, and A.M. Healy. Hydrodynamic simulation(computational fluid dynamics) of asymmetrically positioned tablets in the paddledissolution apparatus: impact on dissolution rate and variability. Journal ofPharmacy and Pharmacology. 57:1243-1250 (2005).
27. The Gold Sheet, FDC Reports, 34 (2), 2000, pp. 1-15.28. The Gold Sheet, FDC Reports, 35 (3), 2001, pp. 1-19.29. FDA. Guidance for Industry: SUPAC IR, 1995.30. FDA. Guidance for Industry: SUPAC MR, 1997.31. FDA. Guidance for Industry: Waiver of In Vivo Bioavailability and
Bioequivalence Studies for Immediate-Release Solid Oral Dosage Forms Basedon a Biopharmaceutics Classification System, 2000.
32. E. Ryshkewitch. Compresssion strength of porous sintered alumina and zirconia.Journal of American Ceramics Society. 36:65-68 (1953).
33. A.M. Juppo. Relationship between breaking force and pore structure of lactose,glucose and mannitol tablets. International Journal of Pharmaceutics. 127:95-102(1996).
34. M.A. Ansariand F. Stepanek. The effect of granule microstructure on dissolutionrate. Powder Technology. 181:104-114 (2008).
35. M. Delalondeand T. Ruiz. Dissolution of pharmaceutical tablets: The influence ofpenetration and drainage of interstitial fluids. Chem Eng Process. 47:370-376(2008).
36. C.Q. Sun. A novel method for deriving true density of pharmaceutical solidsincluding hydrates and water-containing powders. Journal of PharmaceuticalSciences. 93:646-653 (2004).
37. C. Gustafsson, H. Lennholm, T. Iversen, and C. Nystrom. Evaluation of surfaceand bulk characteristics of cellulose I powders in relation to compaction behaviorand tablet properties. Drug Development and Industrial Pharmacy. 29:1095-1107(2003).
38. A.M. Juppo. Porosity parameters of lactose, glucose and mannitol tablets obtainedby mercury porosimetry. International Journal of Pharmaceutics. 129:1-12 (1996).

39. L. Farber, G. Tardos, and J.N. Michaels. Use of X-ray tomography to study theporosity and morphology of granules. Powder Technology. 132:57-63 (2003).
40. Y.S. Wu, H.W. Frijlink, L.J. van Vliet, I. Stokroos, and K.V.V. Maarschalk.Location-dependent analysis of porosity and pore direction in tablets.Pharmaceutical Research. 22:1399-1405 (2005).
41. A. Djemaiand I.C. Sinka. NMR imaging of density distributions in tablets.International Journal of Pharmaceutics. 319:55-62 (2006).
42. M. Donoso, D.O. Kildsig, and E.S. Ghaly. Prediction of tablet hardness andporosity using near-infrared diffuse reflectance spectroscopy as a nondestructivemethod. Pharmaceutical Development and Technology. 8:357-366 (2003).
43. R.B. Shah, M.A. Tawakkul, and M.A. Khan. Process analytical technology:Chemometric analysis of Raman and near infra-red spectroscopic data forpredicting physical properties of extended release matrix tablets. Journal ofPharmaceutical Sciences. 96:1356-1365 (2007).
44. Y.S. Wu, L.J. van Vliet, H.W. Frijlink, and K.V. Maarschalk. Pore sizedistribution in tablets measured with a morphological sieve. International Journalof Pharmaceutics. 342:176-183 (2007).

44

Chapter 2 Characterization of Caffeine-Lactose TabletCompaction and Tablet Properties
Lactose has been used as a common excipient in the pharmaceutical industry for more
than 50 years (1), while caffeine is often a model drug for development and
characterization of formulations (2, 3). In previous Ph.D. theses of the Cooney lab, the
micro and macro properties of the materials and case studies in pharmaceutical
manufacturing were thoroughly investigated. Inter-particle forces were characterized
with atomic force microscopy measurements (4, 5). Performance of spray-dried lactose
and caffeine in various continuous blending scenarios was investigated experimentally (4,
6) and modeled with discrete element method (DEM) simulation (4, 7). Physical and
mechanical properties of the powder granules as well as tablets were evaluated (8). In
this chapter, we describe the manufacturing and characterization of caffeine-lactose
directly compressed tablets, which are used as a model system to explore the relationship
between tablet microstructure and properties.
2.1 Manufacturing of Caffeine-Lactose Tablets
2.1.1 Powder properties of spray-dried lactose and caffeine
Since its introduction in 1960s, spray dried lactose has demonstrated superior
performance in pharmaceutical solid dosage formation, especially in direct compression
(1, 9). Spray-dried lactose is manufactured by spray-drying a suspension of a-lactose
monohydrate crystals in a saturated aqueous solution of lactose. The final composition
for the DCL 11 and DCL14 materials (now called SuperTab SD 11 and SD 14, DMV
International) used in this study is 85% a-lactose monohydrate with 15% amorphous
lactose, the dried portion of the sprayed lactose solution. The primary material a-lactose
monohydrate undergoes fragmentation during compaction process, supplemented with a
strong binding capability of the amorphous lactose. The only difference between DCL1 1
and DCL14 is that DCL14 has slightly smaller primary particle size. The granules are
spherical in shape and are generally uniform in size, resulting in superior flowability
(Figure 2-1).

Figure 2-1 Environmental scanning electron microscopic images of DCL11 (left) and DCL14 (right).(DMV International, 2005)
Anhydrous Caffeine (1,3,7-trimethyl Xanthine) is a central nervous system stimulant.
The material used in this study is USP grade caffeine powder (Sigma Inc., St. Louis, MO.)
It has an irregular particle shape with an average particle size of 196 jim and a standard
deviation of about 100 ptm. Caffeine is not a free flowing powder and usually
agglomerates in the presence of atmospheric moisture. Therefore, proper moisture
barrier is critical to maintain original particle size of caffeine powders.
Figure 2-2 ESEM image of caffeine particle. S. Ngai 2005
A third material used in the formulation is magnesium stearate, a commonly used
lubricant in pharmaceutical solid dosage forms. In tabletting, lubricant is used for two
purposes: one is to enhance the flowability of the powder itself, two is to reduce the
friction between the powder and the tooling. Magnesium stearate forms thin layers with
very low friction on the surface of the particles in the final mixture, facilitating the
relative flowing of the powder.

2.1.2 Manufacturing setup and formulations
Material Preparation
In order to ensure adequate flowability, lactose and caffeine powders were sieved with a
standard sieve tester SS-15 (Gilson Company Inc., Ohio) for 5 minutes. Particles in the
range of 106-212 pm were collected and equilibrated at 25*C and 20% relative humidity
(RH) for 2 days. The powders were then blended at 10 rpm for 15 minutes with a 42ml
V-shaped blender at the following composition: 10% Caffeine, 0.5% Magnesium
Stearate, and the rest 89.5% in DCL 11, DCL14, or half/half. The mixture was stored in
air-tight jars before compaction.
Tablet Compaction
Tablet compaction in this study is done with a Korsch EK-0 single station tablet press
(Korsch AG, Berlin, Germany) (Figure 2-3). The press is not instrumented, meaning no
force data is collected.
- Maximum compression force: 30kN
- Single punch eccentric press
- Maximum speed: 3600 tablets/hr
- Known: fill depth
- Unknown: compression forcedwell time
- Measurable: weightthickness
Figure 2-3 Photo and parameters of Korsch EK-0 tablet press.
............................................... _44 - - - - -:::: - - -_ I -..... ......... . ................... .... . ....

Fill Depth Thickness
Figure 2-4 Illustration of the tablet compaction station.
In order to obtain a relatively consistent way to manufacture the tablets, three parameters
are tracked for the tablet products: weight, thickness, and hardness. Tablet weight is
controlled via adjustment of the powder fill depth in the die (Figure 2-4). Tablet
thickness is controlled via the insertion depth of the upper punch, while the lower punch
remain fixed during compaction. The hardness of the tablet is a direct result of the
compaction process and is discussed in detail later. The diameter of the tablet is fixed at
9mm and tabletting speed is fixed at 20 tablets per minute. The weight of the tablet is
controlled at 200mg +- 10mg, for which an initial fill depth of 4.8mm is required. Final
tablet thickness range from 2.3mm to 3.2mm, representing the hardest and softest tablet
that could be produced by the press for the conditions specified.
After compaction, tablets are either placed in glass jars sealed with parafilm m or in
closed containers above over-saturated magnesium nitrite solution, where a relative
humidity of 55% is maintained under ambient temperature.
2.2 Tablet Mechanical Strength
The mechanical strength of a tablet is evaluated with a diametrical compression test,
which records the minimum force necessary for tablet tensile failure. (For more
background information about the test, please refer to section 1.3.2.) The recorded force

is regarded as the "hardness" of the tablet. Tablet hardness is mainly a result of material
interaction during the compaction process. In a head-to-head comparison of a-lactose
monohydrate, anhydrous a-lactose, roller-dried P lactose and crystalline p lactose, it was
revealed that tablet strength is simply a function of tablet internal surface area and does
not depend on the crystalline form (10). This suggests that the same binding mechanism
applies to all forms of crystalline lactose. For amorphous lactose this is a different story.
Increasing amount of amorphous lactose in spray-dried lactose was found to enhance
tablet strength without generating a larger internal surface area (11). Moisture could also
change the mechanical strength of lactose-dominant tablets. Sebhatu et al. investigated
the impact of storage at 55% RH environment pre- and post- compaction for lactose
tablet strength (12). It was shown that exposure to high RH for the tablets resulted in
higher tablet strength due to crystallization of the amorphous lactose. The amorphous
lactose selectively absorbs moisture, reducing glass transition temperature below the
operation temperature and facilitating crystallization toward a-lactose. Once the
crystallization is completed, most of the absorbed moisture would be released again.
In this study, we first examined the impact of moisture on tablets of different hardness
and lactose composition. The formulations tested were 10% Caffeine, 0.5% Magnesium
Stearate, and the rest 89.5% in DCL1 1, DCL14, or half/half. The tablets made had initial
powder fill depth of 4.8mm and final tablet thickness of 3.2 mm (soft) or 2.4 mm (hard).
The tablets were subjected to 55% RH after compaction. Tablet strength is tracked at
various time points until 2 weeks after compaction (Figure 2-5 and Figure 2-6). In
general, higher composition of DCL14 leads to slightly higher tablet strength. The
smaller size of primary particles in DCL 14 could lead to higher surface area for binding,
which in turn results in stronger tablets. For tightly compacted caffeine-lactose tablets,
all the formulations registered a 15%-20% strength decrease within the first two minutes
after compaction. This is due to the elasticity of the materials, which caused the tablet to
increase in volume immediately following ejection and breaking some of the bonds
established during tabletting (13). No significant change in hardness is observed
afterwards, indicating that the low porosity of tightly compacted tablets permits a low
level of moisture penetration, reducing the potential impact by moisture.

Mechanical Strength of Tightly Compacted Tablets
i-TIT I
I90:0
4.50
4.00
3.503.00
2.50
2.00
1.501.00
0.50
0.00
0O Min02 Min* 1 Day
1 Wk02 Wk
0:90
Figure 2-5 Mechanical strength of tightly compacted caffeine-lactose tablets.
Mechanical Strength of Loosely Compacted Tablets
O Min02 Min* 1 Day
1 WkN2Wk
90:0 45:45 0:90
Composition of DCL11:DCL14
Figure 2-6 Mechanical strength of loosely compacted caffeine-lactose tablets.
45:45
Composition of DCLII:DCL14
0.90
0.80
0.70
0.60
0.50
0.40
0.30
0.20
0.100.00
... ...... .... ............

The scenario of mechanical strength for loosely compacted tablets is different from that
for tightly compacted tablets. The initial strength drop is much smaller when compared
with that for tightly compacted tablets, as much less extensive deformation happens in a
loose compaction. The impact of high moisture, however, is significant. One day after
storage in 55% RH, the tensile strength doubles and remains at the same level throughout
the two weeks of testing period. The much more porous tablet structure allows the
invasion of moisture into the tablet and probably facilitates crystallization and the
establishment of much stronger solid bonds (12).
In a next step, caffeine-DCL 11 tablets subjected to various degrees of compaction were
further examined for patterns in tensile strength. This time direct readings of crushing
force are used instead of the tensile strength. The two are presenting the same
mechanical property from slightly different perspectives. Crushing force (or hardness)
describes the absolute strength of the tablet, while tensile strength describes the relative
strength of the tablet when dimension is taken into consideration. Description of
hardness is more common in daily practice of the pharmaceutical industry.
In this new test, tablets were compacted from an original loading powder of 200mg
(~4.8mm fill depth) to a range of final tablet thickness from 2.3 to 3.2mm. Hardness at
Day 0 (DO) was measured 2 min after compaction. For tablets of all strengths, hardness
value does not change significantly across a 4-week storage period within sealed
moisture-barrier bags made with alternative layers of aluminum and polyethylene glycol
(PEG) (Figure 2-7). When stored in 55% RH, the tablets demonstrated higher hardness
after 1 day and maintained the levels thereafter (Figure 2-8). It is also observed that the
strength of the tablets in 55% RH had much higher variation when compared with those
in moisture bags. It is likely that the penetration of moisture depends on the local
microstructure. The lower porosity in hard tablets leads to less accessible internal space
and thus a more case-specific impact of moisture. A higher porosity in soft tablets
allowed extensive penetration of moisture, leading to much higher impact on tablet
strength. The relative strength gain from sealed condition to 54% RH for 3.2mm tablet is
300%, compared with 20% for 2.3mm tablets (Figure 2-9).
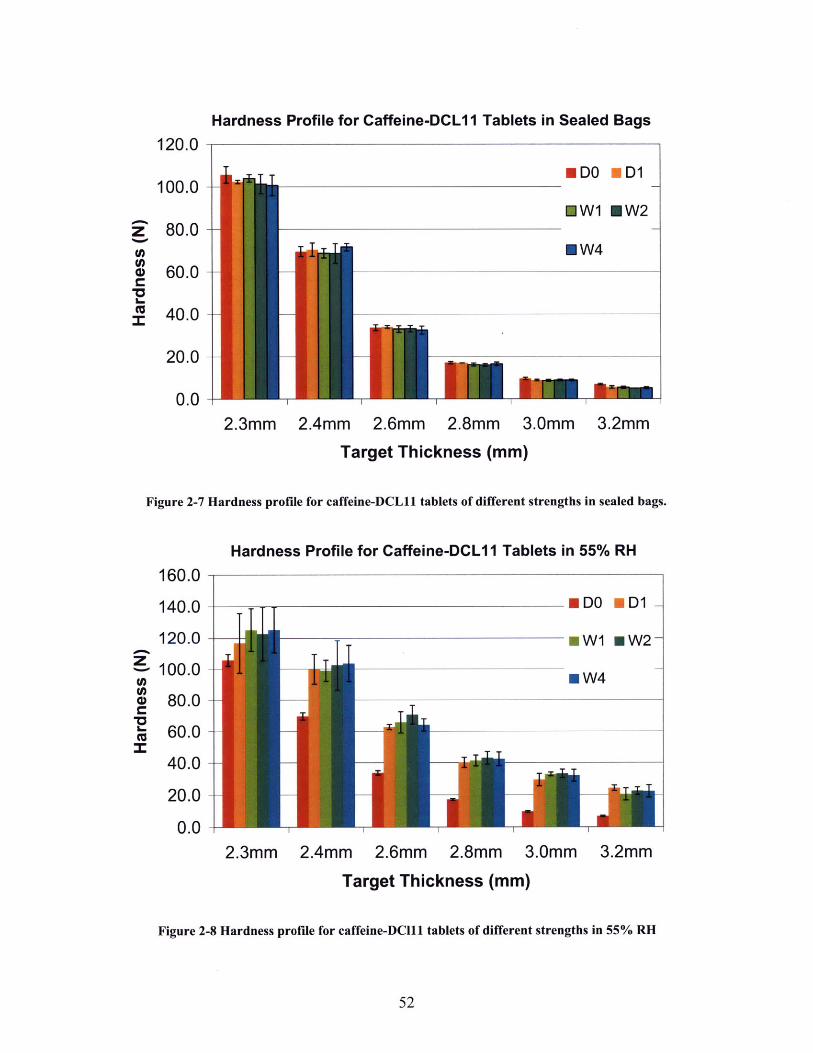
Hardness Profile for Caffeine-DCL1 1 Tablets in Sealed Bags
EDO MD1
MW1 MW2
MW4
2.3mm 2.4mm 2.6mm 2.8mm 3.0mm 3.2mm
Target Thickness (mm)
Figure 2-7 Hardness profile for caffeine-DCL11 tablets of different strengths in sealed bags.
Hardness Profile for Caffeine-DCL11 Tablets in 55% RH
160.0-
140.0 lEDO ED1 -
120.0- W1 mW2-
100.0
80.0
60.0
40.0
20.0
0.02.3mm 2.4mm 2.6mm 2.8mm 3.0mm 3.2mm
Target Thickness (mm)
Figure 2-8 Hardness profile for caffeine-DC111 tablets of different strengths in 55% RH
120.0
100.0
80.0
60.0 -
40.0 -
20.0 -
0.0 -

Gains of Tablet Hardness in High Moisture Environment
350%
300%
250%-0)
c 200%-
2 150%
L100%-
50%
0%2.3mm 2.4mm 2.6mm 2.8mm 3.0mm 3.2mm
Target Thickness (mm)
Figure 2-9 Hardness gain for caffeine-DCL11 tablets in 55% RH compared with sealed condition.
2.3 Tablet Dissolution Profiles
As discussed in section 1.3.2.3, dissolution test holds a key position in the analytical tests
for pharmaceutical tablets. Dissolution speed was found to have a direct relationship
with tablet porosity, but detailed correlation between porosity profile and dissolution
speed was not established (14). In another study, it was proposed that the porosity of the
tablet could switch the dissolution mechanism between surface dissolution and
penetration-induced disintegration (15). The dissolution of lactose has been extensively
studied. It was found out that a-lactose goes through a mutarotation reaction and
converts to p-lactose (16) (Figure 2-10). The initial solubility of several different formats
of lactose powder was measured by Kamp et al. (17). a-lactose was shown to have a
much lower solubility than p-lactose (Figure 2-11). Specifically, a-lactose monohydrate
has the lowest solubility. The final solubility would be the same due to mutarotation
reaction in favor of the p-lactose with higher solubility.
1.1111" :: I - w ::::::::::::::::: ::.:: I I .. ....................................................................................... . .... ..... w ............................. - A - ..................... W- w ........ . ......................................................................................................... ... ....... . ............... . ... .... .............. ............ I --- -. ................... -

ON
HONO O
140
ON
0MO'00
No0
Figure 2-10 Mutarotation reaction of lactose. Modified from lactose.com.
60-
40,
20
0 20 40 60 80time(s)
100 120
Figure 2-11 Initial solubility profile of different crystalline lactose powders in 37 *C water. Kampet al. 1986.
In disintegration testing, tablets made of a-lactose monohydrate had very short
disintegration time, while tablets made of amorphous a-lactose dissolved gradually
instead of disintegration. The lack of disintegration was attributed to both a small pore
size and the precipitation of a-lactose monohydrate in pore space due to lower initial
solubility (17).
In the current study, dissolution testing was conducted with a Varian VK70 10 dissolution
apparatus (Varian Inc, Palo Alto, CA) coupled with a C-Technologies JO® fiber-optic

system (C-Technologies, Bridgewater, NJ), which directly transmits the light signal
acquired in the dissolution medium to a Varian Cary50 spectrophotometer (Varian Inc,
Palo Alto, CA). The specific UV absorbance of the API is compared with a calibration
curve, based on which the concentration of API in the dissolution medium is calculated.
During the calibration stage, no signal interference from lactose or magnesium stearate
was observed at the 273nm characteristic wavelength adopted for caffeine measurement.
The whole caffeine concentration range during dissolution fell into the linear response
zone of the 10mm fiber-optic heads used for signal collection. Paddle dissolution test
was adopted with 50 RPM agitation and 900ml water dissolution medium at 37'C.
During agitation, the air dissolved in the dissolution medium might form bubbles on the
surface of tablets, altering the dissolution behavior. A degassing procedure was
performed on dissolution medium immediately before testing. The steps are as follows:
Heat the medium up to 410C with gentle agitation, then filter the medium through 0.47um
filtration system under vacuum with strong agitation. Keep the vacuum and agitation on
for 5 min, with proper heating to keep medium temperature at 37 C. Using a funnel,
carefully pour 900ml medium along the wall of the vessel without generating a lot of
bubbles. Wait 15 minutes for temperature equilibration before conducting experiments.
Paddle dissolution profiles were collected for caffeine-DCL 11 tablets of various strengths
at different time points up to 2 weeks post compaction. The tablets were stored in closed
glass jars in ambient condition and sealed with parafilm TM. At one day after compaction,
most of the dissolution profiles were well separated from each other, with the exception
of the two softest tablets (Figure 2-12). The situation changed dramatically by one week
of storage, when all the dissolution profiles converge toward a narrow region (Figure
2-13). It is also clear that the dissolution speed for all the tablets slowed down. By two
weeks of storage, all the dissolution profiles, except that for the softest tablet, continue to
slow down and converge (Figure 2-14). The dissolution profiles seemed to approach a
set of limit profile as storage time goes longer (Figure 2-15). As will become clear in
chapter 5, the limit profile represents pure surface dissolution whose rate is controlled by
convective diffusion.

The next step is to identify the physical/chemical changes that affected the dissolution
profiles of the tablets. Caffeine is not considered a factor here, because (a) lactose forms
the dominant structure and is thus mainly responsible for the dissolution or disintegration
of the tablet matrix, (b) after release from tablet, caffeine dissolution should not be a rate
limiting factor, as final concentration of caffeine in dissolution medium is less than 0.1%
of its saturated concentration. The solubility of caffeine in water at 37"C is 37 g/L (18),
the volume of the dissolution medium is 0.9L, while the total amount of caffeine present
in a tablet is 0.02 g. For lactose, a possible interaction with moisture is considered, as
parafilmTM was found to be a poor moisture barrier (internal communication with
Novartis expert) and the set of experiments was conducted in hot and humid summer time.
Dissolution of Caffeine Tablets - 1 day, n=6120.0% -
100.00/ ---------------------
C80.00/ - -- ---- - -------------------------------------------
60.0% -U)+2.4 mm
40.0% ---- --- --- ---- ------------------------------------. + 2.6 m m--2.8 mm
20.0% -- -- + ------------------------ w 3.0 m m+3.2m
0.0%0/0
0 5 10 15 20 25 30
Time (min)
Figure 2-12 Dissolution profiles of caffeine-DCL11 tablets at 1 day after compaction.

Dissolution of Caffeine Tablets - 1 week, n=6120.00/
100.00/0 -
80.00/0 -
60.0% -
40.0% -
20.0% -
0.00/0
10 15
Time (min)
20 25 30
Figure 2-13 Dissolution profiles of caffeine-DCL11 tablets at 1 week after compaction.
Dissolution of Caffeine Tablets - 2 weeks, n=6
120.0%
100.0%/ ------
80.00/
60.0%
40.0%
20.0% - -
0.00/ '0 5
Figure 2-14 Dissolution profiles
10 15 20 25
Time (min)of caffeine-DCL11 tablets at 2 weeks after compaction.
30
.. ........................ ................ .... .......... .......... .... ........... . . .............
-- -- -- -- -- - -------- - -- -II - ----- --- - - - - - --
+2.3 m m-------------------- -- -- - --- --- --- -- = 2.4 m m
+2.6 mm--- -- --- --- -- -- --- -- --- -- --- -- -- -- x + 2 .8 m m
+3.2 m m

120.0%
100.00/0CNo28.0/040
w60.00/-
40.0%- 1 day - 1 week
20.0%- 2 weeks .------ Limit
0.00/0
0 10 20 30
Time (min)
Figure 2-15 Summary of caffeine-DCL11 tablet dissolution profiles within 2 weeks after compaction
In order to verify the impact of moisture, the above experiments were repeated with two
sets of storage conditions: in sealed moisture barrier bags and in 55% RH humidity
chamber at ambient temperature. Dissolution tests were run at 1 day, 1 week, 2 weeks,
and 4 weeks after compaction. The time required for the completion of 60% dissolution
T60 is calculated from the dissolution profiles. In sealed condition, no obvious shift in
60% dissolution time is observed (Figure 2-16). This is in agreement with our
assumption that moisture caused the shift of dissolution profiles. In 54% RH condition,
except for the hardest tablets, all other tablets experienced moderate slow-down of
dissolution speed from 1 day to 1 week post compaction (Figure 2-17). After 1 week,
dissolution time remain at the same level. A further examination of T60 was done by
combining all the sealed tablet data and comparing that with the 54% RH tablet data after
1 day (Figure 2-18). Higher environmental moisture level leads to apparent slow-down
for caffeine-DCL 11 tablets with medium to low strength. This may be due to the
conversion of amorphous lactose toward a-lactose monohydrate, with the latter having a

lower solubility. The conversion also seemed to lead to a structure that is less susceptible
to disintegration, potentially due to the formation of moisture-mediated
interparticle-bonding when a higher molecular mobility is incurred (19).
T60 Dissolution Time for Caffeine-DCL1 I Tablets in Sealed Condition
14-
12 -
10 -
8-
6-
4-
2-
0 -2.2
Figure
I II11
2.4 2.6 2.8 3 3.2Tablet Thickness (MM)
2-16 60% dissolution time for caffeine-DCL11 tablets in sealed condtion.
3.4
T60 Dissolution Time for Caffeine-DCL1 1 Tablets in 54% RH Condition
I
I 1I
2.6 2.8 3Tablet Thickness (MM)
* 1 Day
* 1 WeekA 2 Weeks - -
* 1 Month
-
-I--
3.2 3.4
Figure 2-17 60% dissolution time for caffeine-DCL11 tablets stored in 54% RH.
0 . 1 Day.5 m 1 Week
-- - - - - - - - - - - - - - - - - - - - - A 2 Weeks - -
* 1 Month
- -- +-_-- - -
- -0A
A
12 --
10 --
-
S 6 -
--4
2--
0-2.2 2.4
.. ........ ....... . ............ .... ....

Comparions of Dissolution Time for caffeine-DCL1 1 tablets, N=8
14M Sealed
12 -- - - - - -054 RH%
0.2 6 - -- - - --*
0~44
(0
2.3 2.4 2.6 2.8 3 3.2Tablet Thickness (MM)
Figure 2-18 Comparison of dissolution time for caffeine-DCL11 tablets in sealed bags and 54% RH.
2.4 Summary
In this chapter we have discussed the manufacturing and testing of caffeine-lactose
directly compressed tablets, which are to be used in subsequent studies of microstructure
and dissolution mechanism. The impact of composition, compaction degree, and storage
moisture level was investigated in terms of tablet mechanical strength and dissolution
profiles.
It is demonstrated that tablet hardness drops within the first two minutes post compaction,
which we believe is due to tablet elastic expansion and the breakage of inter-particle
bonds. The drop is most obvious with the harder tablets, which were subjected to a
higher compaction force and thus incurred a higher degree of elastic recovery. Exposure
to high level moisture led to an increase in tablet hardness, especially that for the tablets
with medium to low strength to start with. A much higher porosity in soft tablets would
be expected to allow extensive penetration of moisture, leading to much higher impact on
tablet strength. The higher tablet strength under moisture exposure is probably a

combined result of crystallization of amorphous lactose and the establishment of
moisture-mediated solid bonds. Usage of DCL14 leads to a slightly higher tablet
strength than that of DCL 11, with the former having a smaller primary particle size and
thus generating a higher surface area for inter-particle bond formation.
A detailed dissolution study was conducted for caffeine-DCL1 1 tablets. Tablets of
various compaction degrees demonstrated distinctive dissolution profiles. Paddle
dissolution of harder tablets takes longer to complete than that for softer tablets.
However, moisture exposure could lead to conversion of amorphous lactose toward a-
lactose monohydrate with lower solubility. The establishment of moisture-mediated solid
bonds also seems to deter the disintegration of the caffeine-DCL1 1 tablets. Combined
effect of the two leads to slower dissolution for tablets exposed to high moisture,
especially for softer tablets with a much more porous structure to allow effective
moisture penetration. The general convergence toward a common dissolution profile
limit represents a pure surface dissolution scenario with no disintegration taking place,
which we will discuss in detail in Chapter 5.
2.5 Chapter Bibliography1. W.C. Gunseland L. Lachman. Comparative Evaluation of Tablet Formulations
Prepared from Conventionally-Processed and Spray-Dried Lactose. Journal ofPharmaceutical Sciences. 52:178-& (1963).
2. D. Brachteland E. Richter. Absolute Bioavailability of Caffeine from a TabletFormulation. Journal of Hepatology. 16:385-385 (1992).
3. D. Tan, B. Zhao, S. Moochhala, and Y.Y. Yang. Sustained-release of caffeinefrom a polymeric tablet matrix: An in vitro and pharmacokinetic study. MaterialsScience and Engineering B-Solid State Materials for Advanced Technology.132:143-146 (2006).
4. S.S. Ngai. Multi-Scale Analysis and Simulation of Powder Blending inPharmaceutical Manufacturing, Chemical Engineering, Vol. Ph.D., MIT,Cambridge, MA, 2005.
5. Y. Pu. Theoretical and Experimental Investigation of Particle Interactions inPharmaceutical Powder Blending, Chemical Engineering, Vol. Ph.D., MIT,Cambridge, MA, 2007.
6. L. Pernenkil. Continuous Blending of Dry Pharmaceutical Powders, ChemicalEngineering, Vol. Ph.D., MIT, Cambridge, MA, 2006.
7. M.J. Abel. Process Systems Engineering of Continuous PharmaceuticalManufacturing, Chemical Engineering, Vol. Ph.D., MIT, Cambridge, MA, 2009.
8. M. Pore. Pharmaceutical Tablet Compaction: Product and Process Design,Chemical Engineering, Vol. Ph.D., MIT, Cambridge, MA, 2007.
9. G. Bolhuis, K. Kussendrager, and J. Langridge. New Developments in Spray-Dried Lactose. Pharmaceutical Technology Supplimental Issue EXCIPIENTS &SOLID DOSAGE FORMS:26-31 (2004).
10. A.H. Deboer, H. Vromans, C.F. Lerk, G.K. Bolhuis, K.D. Kussendrager, and H.Bosch. Studies on Tableting Properties of Lactose .3. The Consolidation Behaviorof Sieve Fractions of Crystalline Alpha-Lactose Monohydrate. PharmaceutischWeekblad-Scientific Edition. 8:145-150 (1986).
11. H. Vromans, G.K. Bolhuis, C.F. Lerk, K.D. Kussendrager, and H. Bosch. Studieson Tableting Properties of Lactose .6. Consolidation and Compaction of Spray-Dried Amorphous Lactose. Acta Pharmaceutica Suecica. 23:231-240 (1986).
12. T. Sebhatu, A.A. Elamin, and C. Ahlneck. Effect of Moisture Sorption onTabletting Characteristics of Spray-Dried (15-Percent Amorphous) Lactose.Pharmaceutical Research. 11:1233-1238 (1994).
13. A. Adolfssonand C. Nystrom. Tablet strength, porosity, elasticity and solid statestructure of tablets compressed at high loads. International Journal ofPharmaceutics. 132:95-106 (1996).
14. M. Riippi, J. Yliruusi, T. Niskanen, and J. Kiesvaara. Dependence betweendissolution rate and porosity of compressed erythromycin acistrate tablets.European Journal of Pharmaceutics and Biopharmaceutics. 46:169-175 (1998).
15. M. Delalondeand T. Ruiz. Dissolution of pharmaceutical tablets: The influence ofpenetration and drainage of interstitial fluids. Chemical Engineering andProcessing. 47:370-376 (2008).
16. G. Haaseand Nickerso.Ta. Kinetic Reactions of Alpha and Beta Lactose .1.Mutarotation. Journal of Dairy Science. 49:127-& (1966).
17. H.V. Vankamp, G.K. Bolhuis, K.D. Kussendrager, and C.F. Lerk. Studies onTableting Properties of Lactose .4. Dissolution and Disintegration Properties ofDifferent Types of Crystalline Lactose. International Journal of Pharmaceutics.28:229-238 (1986).
18. S. sumathiand A.R. Ray. Role of Modulating Factors on Release of Caffeine fromTamarind Seed Polysaccharide Tablets. Trends Biomater Artif Organs. 17:41-46(2003).
19. G. Alderbornand C. Nystrom. Pharmaceutical Powder Compaction Technology,1995.

64

Chapter 3 Rational Formulation Development ofCompound-A Tablets
In pharmaceutical manufacturing, formulation development largely determines the
complexity of material composition and manufacturing process. The knowledge derived
from the development process is also directly utilized in manufacturing control.
However, as introduced in Chapter 1, the current formulation development process is
often a combination of empirical property matching and design of experiments. The
development of formulations with high drug load is particularly difficult, as the
properties of the API might become equally important or even dominant when compared
with those of the excipients. For such a formulation, it is also critical to minimize the
addition of excipients so that tablet size remains manageable.
In this chapter we describe the development of a high-loading compound-A tablet
formulation, focusing on the material properties and the impact of manufacturing process
on these properties. Compared to rather "tradional" formulations, the new MIT
composition features fewer manufacturing steps and ingredients, is continuous-
manufacturing friendly, and exhibits comparable or better dissolution properties.
3.1 Compound-A Formulation by Direct Compression
Compound-A powder has very low bulk density and poor flowability. The desired dose
would usually require a final tablet weight of > 600 mg leading to unfavourable size of
the tablet. In order to develop a simple formulation and manufacturing process while
achieving high drug load and excellent tablet quality, formulation development was
carried out utilizing our understanding of material properties and interactions.
Based on our discussion in section 1.3.1.1, it is apparent that direct compression would be
the best choice if feasible, requiring minimal manufacturing steps and materials.
However, we also understand that direct compression has stringent criteria in material
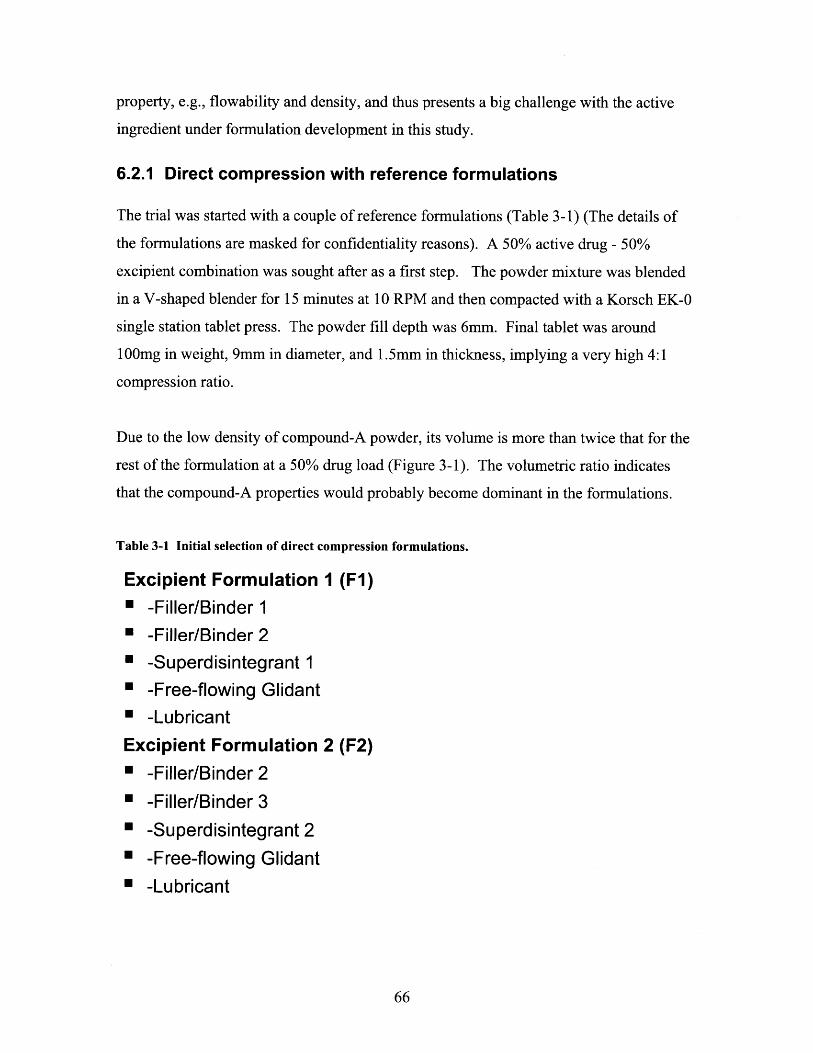
property, e.g., flowability and density, and thus presents a big challenge with the active
ingredient under formulation development in this study.
6.2.1 Direct compression with reference formulations
The trial was started with a couple of reference formulations (Table 3-1) (The details of
the formulations are masked for confidentiality reasons). A 50% active drug - 50%
excipient combination was sought after as a first step. The powder mixture was blended
in a V-shaped blender for 15 minutes at 10 RPM and then compacted with a Korsch EK-0
single station tablet press. The powder fill depth was 6mm. Final tablet was around
100mg in weight, 9mm in diameter, and 1.5mm in thickness, implying a very high 4:1
compression ratio.
Due to the low density of compound-A powder, its volume is more than twice that for the
rest of the formulation at a 50% drug load (Figure 3-1). The volumetric ratio indicates
that the compound-A properties would probably become dominant in the formulations.
Table 3-1 Initial selection of direct compression formulations.
Excipient Formulation 1 (Fl)" -Filler/Binder 1" -Filler/Binder 2" -Superdisintegrant 1" -Free-flowing Glidant" -LubricantExcipient Formulation 2 (F2)" -Filler/Binder 2" -Filler/Binder 3" -Superdisinteg rant 2" -Free-flowing Glidant" -Lubricant

Figure 3-1 Volumetric dominance of compound-A (left) in a 50% formulation.
During the manufacturing process, the following observations were made: a
- The final blends are still of relatively poor flowability. At a 50g material load in
the feeding hopper, the die can not be fully filled at first try. Hopper needs to be
manually moved back and forth 3-5 times to achieve good fill, which indicated
the non- processability of the mixture at bigger scale with a high- speed tabletting
machine. Only -100 tablets could be made manually per batch.
- Re-lubrication of the upper punch and lower punch with magnesium stearate
(Mg St) was necessary for every 15 tablets manufactured, otherwise the tablets
become sticky to the lower punch and chipping happens when ejection takes place.
- F 1 and F2 formulations share the problems stated above, but filler/binder 3 in F2
seems to accumulate electrostatic charge easily, resulting in further stickiness.
- In the formulation of 50% Fl with double amount of lubricant, there is no need to
re-lubricate punches. Die fill is slightly more consistent but still not satisfactory.
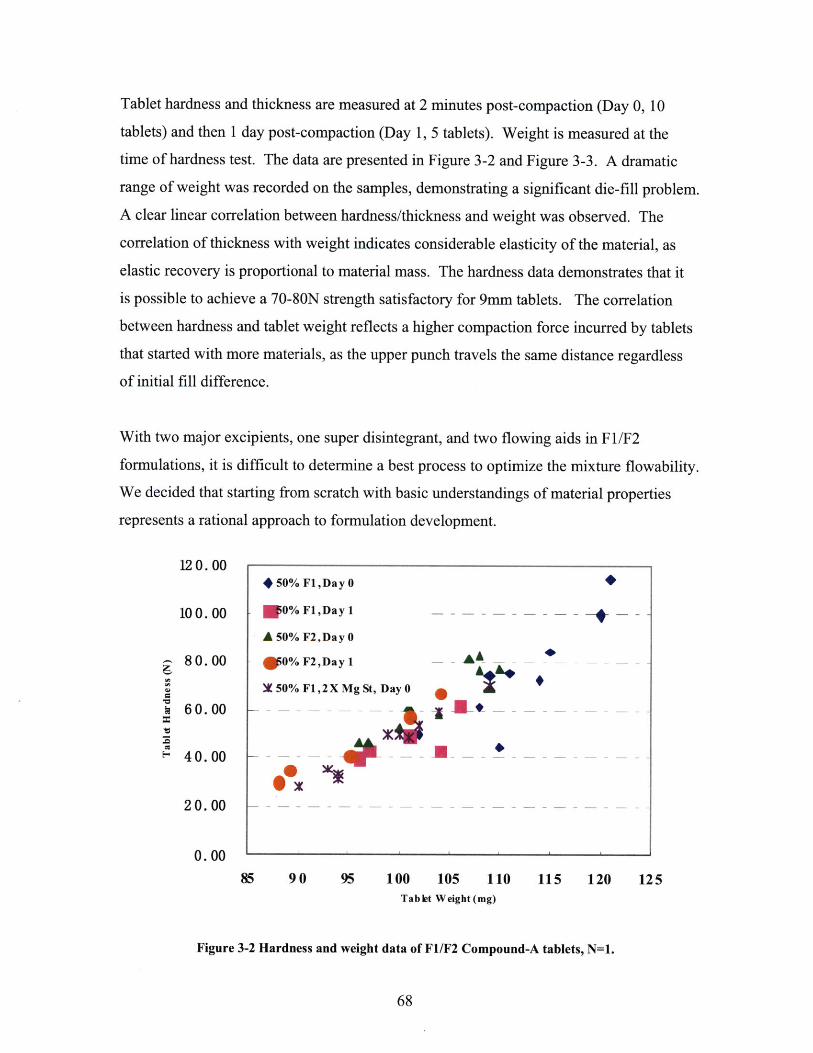
Tablet hardness and thickness are measured at 2 minutes post-compaction (Day 0, 10
tablets) and then 1 day post-compaction (Day 1, 5 tablets). Weight is measured at the
time of hardness test. The data are presented in Figure 3-2 and Figure 3-3. A dramatic
range of weight was recorded on the samples, demonstrating a significant die-fill problem.
A clear linear correlation between hardness/thickness and weight was observed. The
correlation of thickness with weight indicates considerable elasticity of the material, as
elastic recovery is proportional to material mass. The hardness data demonstrates that it
is possible to achieve a 70-80N strength satisfactory for 9mm tablets. The correlation
between hardness and tablet weight reflects a higher compaction force incurred by tablets
that started with more materials, as the upper punch travels the same distance regardless
of initial fill difference.
With two major excipients, one super disintegrant, and two flowing aids in F1/F2
formulations, it is difficult to determine a best process to optimize the mixture flowability.
We decided that starting from scratch with basic understandings of material properties
represents a rational approach to formulation development.
* 50% F1,Day 0
NO% F1,Day 1
A 50% F2,Day 0
*0% F2,Day 1
X 50% F1,2 X Mg St, Day 0
- -- - - -
-- - -- - - - - - -
g E* -- --- - -
85 90 95 100 105 110Tab lt Weight (mg)
115
Figure 3-2 Hardness and weight data of F1/F2 Compound-A tablets, N=1.
120.00
100. 00
80. 00
60.00
40.00
20.00
0.00
120 125
- - - = = - Mn I- - - - -

*50%F1,Day0
*50%F1,Day 1
A50%F2,Day0
*50%F2,Day 1
X 50% F1,2XMgSt, Day0
- -I
A -
85 90 95 100 105 110T a blet W eig ht (mg)
115 120 125
Figure 3-3 Thickness and weight data of F1/F2 Compound-A tablets, N=1.
3.1.2 Direct compression with lactose-based formulationIn a previous study in the lab, Domike investigated the interparticle friction coefficient of
common pharmaceutical materials via atomic force microscopy (AFM) study (1). It was
found out that lactose particles lose asperity quickly upon abrasion against each other.
The lactose particles exhibit a friction level close to that of glass beads, much lower than
that of MCC.
Table 3-2 Interparticle friction coefficient of lactose and MCC by AFM. Adapted from Domike 2003.
Material Spray-dried Lactose Micro Crystalline GlassI _ _ DCL14 Cellulose PH102 Beads
InterparticleFriction 0.26 0.44 0.224
Coefficient I I
Based on the microscopic friction level, an important indicator of powder flowability,
spray dried lactose DCL14 was chosen as the primary excipient. We further picked
magnesium stearate, the most widely used lubricant in the pharmaceutical industry, and
1. 50
1.48
1.46 I I I I I I _ _ ____ -I

Aerosil 200*, an excellent free flowing agent of amorphous fumed silica, to enhance the
flowability of the powder mixture. The formulations in Table 3-3 were tested following
the manufacturing procedure described above.
Table 3-3 Direct compression formulations of compound-A tablets (wt%)
Formulation Compound-A DCL14 Mg St Aerosil
D30 30 67.5 2 0.5
D40 40 56.5 3 0.5
D50 50 45 4 1
In spite of a very high lubricant loading, the D50 powder was not flowing well in the
tablet press and was not further pursued. The hardness/weight data of D30 at target
hardness levels of 60N/90N and D40 at target hardness level of 60N is shown in Figure
3-4. When compared with Fl/F2 formulations, the weight variation in D30/D40 has seen
improvement but is still not satisfactory. Tablet hardness for both D30/D40 at 60N is not
very sensitive to weight variation, demonstrating a similar slope. However, strength of
D30 tablets at 90N exhibits significant reliance on weight. A 5% weight increase could
double the tablet hardness.
120
100--
80--
60--
40-
20--
0--150 152 154 156 158 160 162 164
Weight (mg)
-1
166
Figure 3-4 Hardness/weight data of Compound-A tablets made from direct compression, N=1.
* 30%+ 90N
* 30% + 60N
A 40%+60N
-0- ----

Table 3-4 Summary of direct compression trials for compound-A tablets. (Average + - Stdev)
Formulation Weight (mg) Thickness (mm) Hardness (N)I
F1/F2 100+-6 1.50 + - 0.03 55 + - 15
D30 160+-3 2.23/2.12+ -0.02 65/95 + -8
D40 154+-2.5 2.22 + - 0.01 58 + - 9
D50 Not flowing
The results of direct compression trials are summarized in Table 3-4. From the trials, it
becomes clear that a drastically simplified formulation is capable of producing tablets
with sufficient strength. However, inconsistent die fill is a major issue due to the poor
flowability of the dominant compound-A powder in the mixture. Multiple factors
contribute to the poor flowability, e.g., the needle shaped crystals have a very high
surface to volume ratio, magnifying the impact of intermolecular forces and increasing
cohesion/adhesion activities. However, low density is also a primary concern because of
the following reasons: (1). A low density alleviates the interaction between compound-A
and lactose, reducing the binding power of the latter; (2). A low density renders the
necessity of deep die fill to reach target weight, making it more difficult to achieve
consistent loading especially under high-speed manufacturing scenario; (3). A low
density of compound-A is not beneficial for the smoothing of lactose particle surfaces,
which requires certain level of abrasion to happen. In order to address the low density
problem while maintaining the advantage of the current formulation, a modified
manufacturing process utilizing roller compaction is tested.
3.2 Compound-A Formulation by Roller Compaction
Roller compaction seems to be a perfect solution for the low density issue incurred in the
direct compression trials. It could dramatically increase the powder density and improve
flowability. Although spray-dried lactose is not a most common excipient used in roller
compaction and exhibits a tendency for fragmentation, the roller compaction trial was

deemed worthwhile due to the high drug loading of the formulation. The dominant
compound-A powder is a material that is prone to plastic densification and could thus
potentially act as a cushion for the lactose particles.
A typical roller compaction process is described in section 1.3.1.1. Depending on the
specific roller compaction formulation tested, there might be a final blending step with
addition of extra lubricants/excipients before the tabletting. The granulates obtained from
compacting the original mixture fed to the roller compactor is called the "internal phase",
while the additional material added at the final blending step is called the "external
phase". External phase could be comprised of lubricants and other excipients, which are
often necessary to enhance the flowability of the final blend. However, it reduces drug
loading and adds an extra manufacturing step. For continuous pharmaceutical
manufacturing where ingredients are added at a constant rate, external phase could also
present a feeding accuracy problem if it only comprises of lubricants in small amount.
3.2.1 Roller compaction simulated with pre-compaction
In order to evaluate the effectiveness of density reduction on flowability improvement, a
two-step compaction process is designed to simulate the roller compaction process.
" First Blending: 40% compound-A + 56% DCL14 Lactose + 1.5% Mg St + 0.5%
Aerosil, V-shaped blender, 50g batch, 20 RPM for 10 min
e Pre-compaction to simulate roller compaction: material compacted into large, soft
tablets with an average strength of 3N
* Milling: 1mm mesh, 3000 RPM
* Final Blending: Milled powder + 1.5% Mg St + 0.5% Aerosil 200, V-shaped
blender, 20 RPM for 5 min
e Tabletting: target weight 150mg, strength 60N, diameter 9mm
" Final composition: 40% compound-A + 56% DCL14 + 3% Mg St + 1% Aerosil

Blending was done in a 100ml V-shaped blender made in house. Milling was done with
a hammer mill (GlenMills, Inc., Glifton, NJ). Pre-compaction and tabletting was
conducted with a Korsch EK-0 single punch eccentric tablet press (Korsch AG, Berlin,
Germany).
With the simulated roller compaction process, powder flow problem was totally
eliminated. Tablets produced were consistent in shape, appearance, weight, thickness, as
well as mechanical strength (Table 3-5).
Table 3-5 Simulated roller compaction produces satisfactory tablets.
Sample (n=12) Weight (mg) Thickness (mm) Hardness (N)
Average 155 2.243 63
StandardDev 0.7% 0.5% 9.1%
Dissolution profile of the produced tablets was tested using 0.0iN HCl solution. The
tablet dissolution was very rapid, with 95% dissolution completed by 8 minutes. As an
instant-release formulation, the performance is at least twice faster than a reference
formulation, which already contain super disintegrant to expedite dissolution process.
The fast dissolution of the tablets can most probably be attributed to the superb
dissolution behavior of spray-dried lactose.
120%
100% - -
' 80% - - - - - -
40%------- - - - - - - - - - - - - - - - - - -
20% -0"/
0 5 10 15 20 25 30
Time (min)
Figure 3-5 Dissolution profile of 40% compound-A tablets via simulated roller compaction.
- - - - - _ _ ;:::::: ............ :::..::._::._:::_:_ :::- . .................................. ...........................

3.2.2 Roller compaction with bench-top compactor
After the successful proof-of-concept tests with simulated roller compaction, we then
moved on to a roller compactor for formulation development. The performance of a
series of lactose-based formulations (M50/M60/M70) was compared with that for two
reference formulations, N68 and N50. Only N68 has an external phase, which is
eliminated in all the other formulations to facilitate continuous manufacturing. The
formulations are presented in Table 3-6. Roller compaction trials were carried out with a
TFC-Micro roller compactor (Vector Corp, Marion, IA). The operational condition of
roller compaction is presented in Table 3-7.
Table 3-6 Compound-A formulations for roller compaction.
MIT (M50/M60/M70) wt%Compound-A 50/60/70Spray-dried Lactose DCL14 (DMV) 45/35/25Colloidale silicon anhydrous (Aerosil 200) 1Magnesium stearate (Faci) 4
N68 - Internal Phase wt%
Compound-A N/AFiller/Binder-1 N/AFiller/Bin der-2 N/ASuperdisintegrant N/AFree-flowing Glidant N/ALubricant N/AN68 - External Phase wt%Free-flowing Glidant N/ALubricant N/A
N50 wt%Compound-A N/AFiller/Binder-1 N/AFiller/Binder-2 N/A
Superdisintegrant N/AFree-flowing Glidant N/ALubricant N/A

Table 3-7 Operational conditions for roller compaction.
TFC-LAB Micro Roller Compactor SettingRoll Speed 2 RPMRoll Current 0.25-0.3 A
Feeding Screw Speed 6.8 RPM
Feeding Screw Current 0.075 ARoll Pressure 600 PSI
In the process of roller compaction, N68 and N50 exhibited excellent flowing properties,
with adequate ribbons produced. However, after milling and blending with external
phase, the final powder mixture of N68 had poor flowability and was not capable of
adequate die-fill in the tabletting process. M50/M60/M70 had static charge build-up in
the roller compaction process, increasing with drug load, but all the formulations were
capable of producing ribbons with adequate shape and strength. There was also an
tendency of material sticking to feeding hopper wall. Considering the simple single
screw feeding mechanism adopted in the bench-top roller compactor used, this might not
be a major concern for commercial scale instrument, where multiple screw feeding with
vacuum aid is the standard.
Without an external phase, all the M-series formulation exhibited superb tabletting
behavior. Die fill was very consistent and the tablets produced were of excellent quality.
The data of the tablets is presented in Table 3-8. Twelve samples were measured at the
beginning of the automatic tabletting process (20 tablets/minute) and after 100 tablets
were produced. (For N50 tablets, data was also collected at 200 tablets.) M50/M60/M70
all produced consistent and high quality tablets, with an average hardness level of 1 OON,
a satisfactory strength for commercial tablets of 9mm diameter. There is a slight upward
shift of weight (<2%) as tabletting progresses. This is due to the small size of the batch
and the potential segregation of smaller particles to the bottom of the hopper. In the case
of M70, a final mild blending of 5 min at 10 RPM was capable of eliminating the density
difference. In commercial scale high speed tabletting with force feeding of the dies, this
density variation might not be present due to the large batch size.

N50 had very consistent tabletting behavior, matching the performance of the M-series
formulations. N68, however, was not capable of automatic tabletting even with fresh
addition of lubricant, manual agitation of feeding hopper, or additional blending before
tabletting. Manual tabletting was conducted to produce some tablets for further
comparison tests.
Table 3-8 Compound-A tablet data of roller compaction formulations.
M50 n=12 Weight (mg) Hardness (N) Thickness (mm)
0 tablet Average 225 96 3.157Stdev 0.7% 4.6% 0.2%
100 tablets Average 229 95 3.200Stdev 1.2% 7.2% 0.2%
M60 n=12 Weight (mg) Hardness (N) Thickness (mm)
0 tablet Average 231 99 3.201Stdev 1.1% 5.7% 0.4%
100 tablets Average 235 101 3.241Stdev 0.9% 7.1% 0.3%
M70 N=12 Weight (mg) Hardness (N) Thickness (mm)
0 tablet Average 224 101 3.215Stdev 0.7% 3.9% 0.3%
100 tablets Average 225 103 3.210Stdev 0.9% 9.6% 0.3%
N50 n=12 Weight (mg) Hardness (N) Thickness (mm)
0 tablet Average 230 100 3.106Stdev 0.7% 4.7% 0.2%
100 tablets Average 233 103 3.145Stdev 0.8% 5.8% 0.3%
200 tablets Average 239 99 3.226Stdev 0.6% 4.7% 0.2%

When compared with N series formulation, M series requires fewer ingredients and is
capable of tabletting at a higher drug load. Additional characterization tests were carried
out to further test its robustness. A prolonged tabletting run of M50 was conducted to
probe the lower limit of materials required in the hopper for normal tabletting. It was
demonstrated that tabletting was very consistent even when there were only 40g materials
left in the hopper (after 200 tablets made) (Table 3-9). When the amount of powder
drops to 18g, the tablets produced were no longer consistent in weight and hardness as it
is shown in the results of the 300 tablets with increased standard deviations for all
parameters tested.
Table 3-9 Prolonged tabletting test of M50 formulation.
M50 n=12 Weight (mg) Hardness (N) Thickness (mm)
0 tablet Average 229 100 3.157Stdev 0.5% 8.0% 0.2%
100 tablets Average 231 97 3.180Stdev 0.5% 10.5% 0.2%
200 tablets Average 232 99 3.182Stdev 0.4% 9.2% 0.1%
300 tablets Average 212 53 3.108Stdev 2.2% 15.2% 0.5%
The impact of tabletting speed was also evaluated on the M50 formulation (Table 3-10).
The speeds tested were 10 / 20 / 40 strokes per minute. The tabletting process went fine
at all the three speeds. However, the standard deviation of hardness increased with
tabletting speed. There is also a tendency of higher tablet weight at higher tabletting
speed. This is due to the feeding mechanism of the tablet press used, in which a hopper
moves over onto the die hole and fills it under gravity. A faster tabletting speed
corresponds to a more forceful stop of the hopper over the die, creating a higher pressure
within the hopper. As a result, slightly more materials might be pushed into the die. As
the punch movement pattern and feeding mechanism of eccentric single station tablet
press are different from those of commercial scale multi-station tablet press, the actual
impact of tabletting speed needs to be evaluated in a larger scale production setup.
. .. ..... .......... .............................................. .............. .... ... . . ........................

Table 3-10 Tabletting speed test for M50 formulation.
M50 n=12 Weight (mg) Hardness (N) Thickness (mm)
10 RPM Average 229 97 3.165Stdev 1.0% 7.2% 0.2%
20 RPM Average 231 97 3.180Stdev 0.5% 10.3% 0.2%
40 RPM Average 236 107 3.211Stdev 1.4% 15.9% 0.6%
Next, the capability of M-series formulation in generating commercial scale products was
tested. M60 formulation was adopted to produce a tablet with a diameter of 11mm and a
drug load of 300mg (Table 3-11). The tabletting process was very smooth and consistent,
with no additional lubrication of the instrumentation necessary. A steady state operation
was reached within 2 minutes. The hardness of the tablets was comparable to that of
benchmark formulations, and the thickness was within an acceptable range.
Table 3-11 Tabletting production of commercial scale tablets for M60 formulation.
M60 n=12 Weight (mg) Hardness (N) Thickness (mm)
0 tablet Average 496 167 4.559Stdev 0.6% 12.9% 0.2%
50 tablets Average 489 152 4.543Stdev 0.6% 7.9% 0.2%
100 tablets Average 490 154 4.548Stdev 0.6% 6.2% 0.2%
The dissolution profile of the M60 11mm tablets indicates a comparable or better
dissolution speed than benchmark formulations, with 90% dissolution completed in 20
minutes (Figure 3-6). Dissolution setup was as described in section 3.2.1. The variation
observed beyond 80% dissolution is due to sample absorbance signal exceeding the linear
transmission range of the fiber-optic probes.

The dissolution profiles of M50 / M60 / M70 / N50 / N68 tablets with a total weight of
200mg and a diameter of 9mm were also examined. M50 / M60 / M70 had very
consistent dissolution profiles, with 90% dissolution by 11.5 - 13 minutes (Figure 3-7,
Figure 3-8, and Figure 3-9). N50 / N68 dissolution profiles exhibited much higher
variation (Figure 3-10 and Figure 3-11), caused by a large amount of white debris
released interfering with fiber-optic signals. They also underwent slower dissolution,
with 90% dissolution finished by 14 minutes and 16 minutes, respectively.
120%
100%
80%
60%
40%
20%
0%0 5 10 15 20 25 30
Time (min)
Figure 3-6 Dissolution profile of M60 tablets with 300mg drug loading. N=6.
120%
100%
80%
60%
40%
20%
0%
0 5 10 15
Time (min)
20 25 30
Figure 3-7 Dissolution profile of M50 tablets, N=6.

120%
100%
80%
60%
40%
20%
0%
0 5 10 15 20 25
Time (min)
Figure 3-8 Dissolution profile of M60 tablets, N=6.
120%
100%
80%
60%
40%
20%
0%
0 5 10 15 20 25
Time (min)
Figure 3-9 Dissolution profile of M70 tablets, N=6.
120%
100%
80%
60%
40%
20%
0%
0 5 10 15 20 25
Time (min)
Figure 3-10 Dissolution profile of N50 tablets, N=3.
80

120%
100%
80% - - -
60%
3 40% -
20%-- - - -
0% < 1 | | |
0 5 10 15 20 25 30
Time (min)
Figure 3-11 Dissolution profile of N68 tablets, N=4.
3.3 Characterization of M-Series Formulations
In order to evaluate the benefit of roller compaction, the flowability and particle size
distribution of M50 and M70 powders were characterized.
3.3.1 Flowability of M50/M70 Powders
Flowability refers to the capability of a material, e.g. a powder, to move in a certain
geometrical environment under certain driving forces, e.g. gravity. Flowability is a key
property for pharmaceutical powders. A good flowability is essential to the consistency
of a manufacturing process and its final products. In the tabletting step, improper
flowability could lead to variations in die fill or powder segregation, which in turn leads
to inconsistent tablet weight, content uniformity, and mechanical strength.
Two techniques as specified in U.S. Pharmacopeia, angle of repose and compressibility
index, were used to evaluate the flowability of M50/M70 powder mixtures before and
after roller compaction. Angle of repose is related with multiple aspects of powder flow
properties like inter-particulate friction and powder density. Experiments were set up
according to USP 32 Chapter 1174, where a powder feeder is placed at 4 cm above a flat
round plate with a 2 cm diameter (Figure 3-12). Powder is tapped slowly through the
....... ........... ::..:: ............... K ........... ............ ::..::..::::::::::..:: ..................................... .......... - ..................... . .. .... -

funnel and fell onto the plate. A maximum angle formed is recorded and measured with
ImageJ* software developed by National Institute of Health (NIH).
Powder Feeder
4cm
2cm
Figure 3-12 Illustration of angle of repose test.
Compressibility index uses a simple formulation to quantify complex powder interactions.
It is defined as a function of tapped density and bulk density:
Compressibility Index = 100 x Ptapped - Pbulk
_ Ptapped
The scales of flowability test results and correspondent flow properties are presented in
Figure 3-13. The smaller the angle of repose or compressibility index, the better flow
property a powder has. It is worth mentioning that for both methods, especially angle of
repose, the final result is dependent upon the actual measurement setup. Therefore, data
should be interpreted with caution.
L Ew PcrTabe 2. Scale of ElowabwMy4; 1 1 NOWCompressbility
j io; -10 Excellebt4 e411-15 Good
16-20Fairup 44021-25 PaRab"
26-31 poor32-37 Very poo
Figure 3-13 Scales for characterization of flowability. Source: USP 32, Chapter 1174

Table 3-12 Flowability test results for M50 / M70 formulations. N=3.
Powder Angle of Repose Bulk Density Tapped Density CompressibilityStatus (degree) (g/ml) (g/ml) Index
Before RC 56.3 + - 1.4 0.30 0.39 23M50
After RC 42.8 + - 0.3 0.42 0.46 9
Before RC 58.7 + - 1.5 0.26 0.33 21M70
After RC 43.4 + - 0.8 0.38 0.41 7
The testing results for M50 / M70 powder mixtures before and after roller compaction are
summarized in Table 3-12. According to both methods, flowability is improved in M50 /
M70 formulations after roller compaction. For angle of repose test, it is indicated that
flowability advanced one level from "poor" to "passable", while for compressibility
index, flowability advanced three levels from "passable" to "excellent". According to the
observations made in tabletting experiments, compressibility index was more accurately
reflecting the actual dramatic improvement in powder flowability.
3.3.2 Particle Size Distribution of M50/M70 Powders
In addition to compressibility index and angle of repose, particle size distribution of the
powders was examined for changes after roller compaction. A coarser particle size in
general leads to better flowability, as less surface area is available for inter-particle
adhesion / cohesion interactions. The particle size distributions of the M50 / M70
powders were measured with a technique called focused beam reflectance measurement
(FBRM).
Detector Laser diode
: - Beam splitter
Optics rotatingat fixed velocity Duration of reflectance = chord length
Sapphire window
Figure 3-14 Mechanism of FBRM. Adopted from Kougoulos et al., 2004.
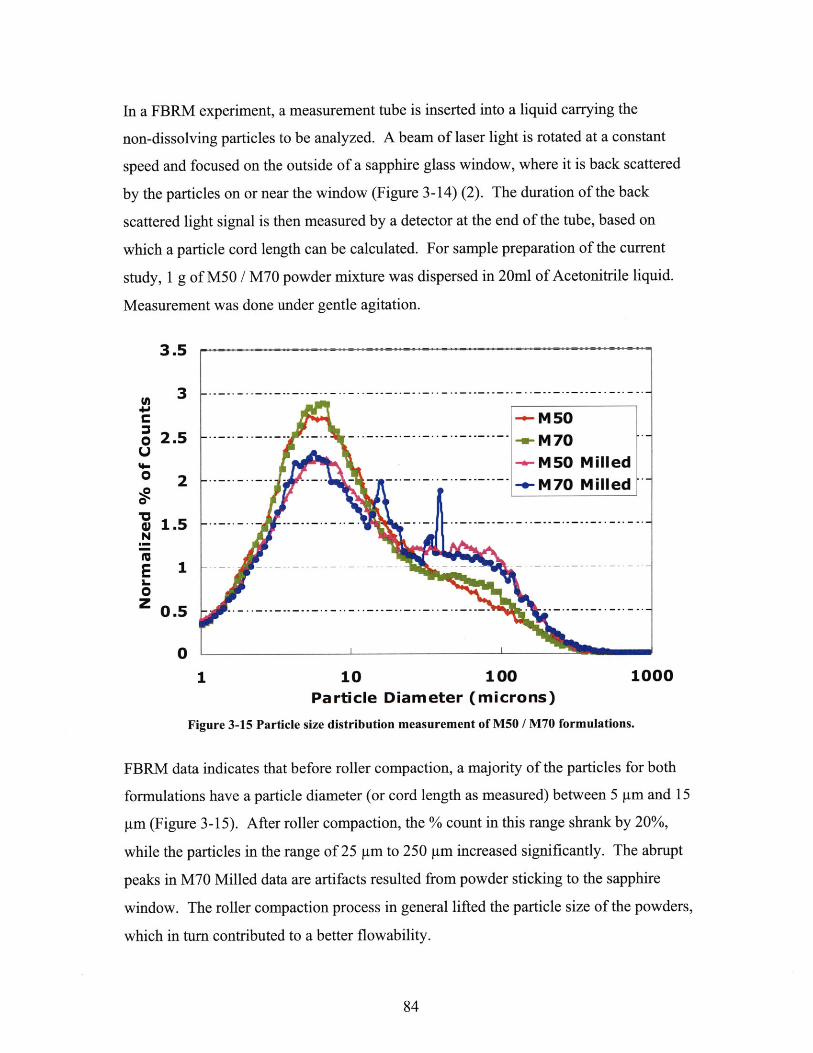
In a FBRM experiment, a measurement tube is inserted into a liquid carrying the
non-dissolving particles to be analyzed. A beam of laser light is rotated at a constant
speed and focused on the outside of a sapphire glass window, where it is back scattered
by the particles on or near the window (Figure 3-14) (2). The duration of the back
scattered light signal is then measured by a detector at the end of the tube, based on
which a particle cord length can be calculated. For sample preparation of the current
study, 1 g of M50 / M70 powder mixture was dispersed in 20ml of Acetonitrile liquid.
Measurement was done under gentle agitation.
3.5
C -- M500 2.5U%I. -a-M50 Milled0 2 ----- - -- - - ------- --- -- -M 70 M illedo 2
N
0ZOE
0
1 10 100 1000Particle Diameter (microns)
Figure 3-15 Particle size distribution measurement of M50 / M70 formulations.
FBRM data indicates that before roller compaction, a majority of the particles for both
formulations have a particle diameter (or cord length as measured) between 5 pm and 15
gm (Figure 3-15). After roller compaction, the % count in this range shrank by 20%,
while the particles in the range of 25 gm to 250 pm increased significantly. The abrupt
peaks in M70 Milled data are artifacts resulted from powder sticking to the sapphire
window. The roller compaction process in general lifted the particle size of the powders,
which in turn contributed to a better flowability.
.. ... ......... . ................... . ...........

3.4 Stability Testing of M-Series Formulations
For pharmaceutical dosage forms, physical and chemical stability are critical to
maintaining adequate shelf-life in various potential storage environments. The outcome
of stability tests not only depends on the dosage form itself, but also the way it is
packaged. As descbribed in section 1.3.2.1, we adopted an accelerated stability testing
condition in order to obtain a proper evaluation of both physical and chemical stabilities
within a short period of time. M70 tablets of 1OON strength are placed inside plastic
bottles induction sealed with aluminum foil. The bottles are then stored inside humidity
chambers at 40"C and 75% RH for 1.5 months. After the storage period, tablet samples
are analyzed and compared with standards that have been stored in moisture-barrier bags
at room temperature.
3.4.1 Physical Stability
Physical stability was assessed with x-ray powder diffraction technique (XRPD), which
obtains information about crystalline structures and their relative abundance by analyzing
the x-ray diffraction pattern of a powder sample (3). The XRPD data for M70 samples
are presented in Figure 3-16. The position, shape, and size of the diffraction peaks for
M70 tablets under two storage conditions match each other very well, indicating identical
crystalline compositions. No visual evidence, e.g., the change of tablet shape or color,
was observed to suggest any physical deterioration of tablets under accelerated stability
testing condition.

M70 lOON Tablet 6-wk Stability Test
25000 -
20000 --M70 40-75-M70 sealed
. .15 00 0 -- - - - - - - - - -- - - - - - -
0
1000
0 -0 10 20 30 40
Position [2Theta]
Figure 3-16 XRPD data of M70 tablets under different storage conditions.
3.4.2 Chemical Stability
The chemical stability of the tablets was evaluated via high performance liquid
chromatography (HPLC), a technique that separates and identifies compounds based on
their interaction duration / strength with the stationary phase of a column (4). The HPLC
data for M70 samples are presented in Figure 3-17. Three samples were tested for M70
tablets from each condition. All the sample files overlay with each other very well. No
additional peaks or shift of peak positions were detected with samples in accelerated
stability testing condition, indicating the absence of product degradation.
..... ............

120-
100-
80-
60-
40-
20-
0-
DAflI F, Sig280.15 Re=3el.100 (C-XCEM321lATA'ERINERN 2010-05-17 1830O7KANGYIAM~fD)DADI F. Sig=280.1e Reft360t00 ?,C HEM32WflATA.ERIWER N MlD0-05-17 16-30-07-At4GYl AMB2_01DAMi F. Sg=280,l6 Re-360.100 jC:ICHEM32MD0ATAMERINER.N 2010-06-17 16-3D-07Y1ANGY1 AMB3 0-DAD1 F, Sog=260,16 Ref=380 1()0C -CHEM32-. lDATAI.ER N'ER N 291D-05-17 10-30-OTIYANGY] 40-751, 0'DA01 7. Sig=1S0.1 Fef-OS0.100 :C:'CHEM321fl'ATA'ERINIER N 2010-05-17 16-30-DTKANGYI 40-752.0DAWi F. Sig-Z96.le Ref=W6.100 IC:)CHEM32\1DATAOERIN)ER N 010D-05-17 10-30-07JANGYI 40-753-
i5 1 0:i i 115 210 25 3W
Figure 3-17 HPLC data for M70 tablets under different storage conditions.
3.5 Summary
In this chapter we described the development of an M-series compound-A tablet
formulation based on roller compaction. The development started with fundamental
understanding of material flowability and was adjusted according to specific problems
discovered through the process. The data indicates that it is possible to develop a well
processable formulation with a considerable high drug load of 60% of compound A
despite its unfavourable physical properties. When compared with a benchmark
formulation, the M-series formulation features fewer manufacturing steps and ingredients,
is continuous-manufacturing friendly, and exhibits comparable or better dissolution
properties. However, further trials on commercial scale production are required to
confirm its viability in manufacturing settings.
.......... . . .... ... . ......... .. ....

Characterization of M-series powder reveals the positive impact of roller compaction on
powder flowability, evidenced by the smaller angle of repose, lower compressibility
index, and larger particle size after roller compaction.
Accelerated stability test of 1.5-month storage at 40"C and 75% RH did not result in any
detectable changes in crystalline forms or chemical composition of M70 tablets,
indicating an acceptable stability of the formulation.
The M-series compound-A formulation represents an effort moving toward rational
formulation development, in which fundamental understandings of material properties are
utilized to guide the selection of ingredients and optimization of manufacturing processes.
Such a design process can lead to leaner formulation and manufacturing process, as well
as a much better understanding and control of them.

1. R.D. Domike. Pharmaceutical Powders in Experiment and Simulation: Towards AFundamental Understanding, Chemical Engineering, Vol. Ph.D. in ChemicalEngineering, MIT, Cambridge, MA, 2003.
2. E. Kougoulos, A.G. Jones, K.H. Jennings, and M.W. Wood-Kaczmar. Use offocused beam reflectance measurement (FBRM) and process video imaging (PVI)in a modified mixed suspension mixed product removal (MSMPR) coolingcrystallizer. Journal of Crystal Growth. 273:529-534 (2005).
3. R. Jenkinsand R. Snyder. Introduction to X-Ray Powder Diffractometry, Wiley-Interscience, 1996.
4. Y. Kazakevichand R. loBrutto. HPLC for Pharmaceutical Scientists Wiley-Interscience, 2007.

90

Chapter 4 MicroCT Imaging and Analysis of TabletMicrostructure
Tablet microstructure is created by the interactions among raw materials and
manufacturing process. It directly affects the properties of the final dosage form. A
fundamental understanding of the structure is a pivotal step toward rational formulation
design, as it bridges our knowledge about the manufacturing process and tablet properties.
In this chapter we present a microCT data acquisition method coupled with a digital
workflow for tablet porosity characterization. The method would be applied toward the
characterization of caffeine-lactose directly compressed tablets and compound-A roller
compacted tablets, providing insight into material interactions during the manufacturing
process. MicroCT imaging of tablet microstructure enables 3-D characterization with
direct visualization, bringing us one step closer to Quality by Design of pharmaceutical
solid dosage formulations.
4.1 Applications of MicroCT in Pharmaceutical Sciences
X-ray micro computed tomography (microCT) is a technique capable of
non-destructively resolving three-dimensional internal structures. X-ray transmission
profiles of the target are collected from multiple angles and subsequently reconstructed
into two-dimensional cross-section images, which can be stacked into a
three-dimensional representation of the target (Figure 4-1). When compared with typical
CT scanners in hospitals, microCT machines provide much higher resolutions at
micrometer level. Since its introduction in 1982 (1), microCT has been widely used in
fields like material and biomedical sciences (2, 3).

Figure 4-1 Illustration of microCT working mechanism. Source: Skyscan 2007.
The first application of microCT in pharmaceutical science was a study of porosity and
morphology of mannitol-lactose-microcrystalline cellulose-based granules (4).
Tomographic images showed that the pore network of individual granules comprises
mainly of relatively large cavities connected by narrow pore necks. It was indicated that
mercury porosimetry recorded pore neck size distribution, while microCT measured true
size distribution of pores larger than 4 pm, the resolution limit of the instrument used.
The authors concluded that microCT was less precise than mercury porosimetry in total
porosity measurement but provided additional morphological information.
MicroCT has helped understand density distribution in pharmaceutical tablets. Sinka
et al. demonstrated with microCT study that in microcrystalline cellulose (MCC) tablets,
the shape of the tablet could affect density distribution (5). Busignies et al. used
microCT to illustrate a higher density in the peripheral region of a cylindrical tablet.
They then argued that it is important to distinguish between the mechanical properties
representative of the total tablet volume, e.g. tablet hardness, and the mechanical
properties representative of the tablet surface, e.g., indentation strength (6). In a more
.. .... .. .... .... . . ..... .

recent study, microCT was utilized to map the density distribution of NaCl tablets, which
exhibited good agreement with results from computer simulations (7).
MicroCT was used to study compaction and mixing process (8). Microcrystalline
cellulose particles were labeled via lead impregnation, resulting in higher contrast in
microCT scans. Co-processing of unlabeled and labeled powder allowed investigation of
blending and compaction behaviors. For V-shaped blending, it was found out that large
particles and layer-filling configuration of powders led to better mixing than smaller
particles and column-filling configuration. In tablet compaction, significant particle
rearrangement at initial stage of compaction was demonstrated. MicroCT images also
revealed tablet structural differences from production with different tablet presses, which
were in turn linked to varying breakage patterns (7).
In proof-of-concept microCT studies of granule packing (9, 10), Fu et al. demonstrated a
good agreement of microCT measurement of particle shape and size with results from
scanning electron microscopy (SEM). The measurement data was confirmed by
prediction with discrete element method (DEM). MicroCT was also utilized in
characterization of tablet fracture (11), demonstrating the role of die wall friction in
capping of multi-layer tablets.
MicroCT is often used in combination with other techniques to obtain multi-dimensional
information. One field for such application is drug release and dissolution (12, 13). A
combination of magnetic resonance imaging and microCT was used to visualize the
development of the internal microstructure within compressed tablets during dissolution
in water (12). The tablets were made from a combination of insoluble particles
(Eudragit@, a polymer) and soluble particles (diltiazem hydrochloride).
In spite of the increasing examples of microCT study in pharmaceutical science, there is
currently no published investigation of pharmaceutical solid dosage forms in a
quantitative manner. In the next section we introduce a microCT method enabling 3-D
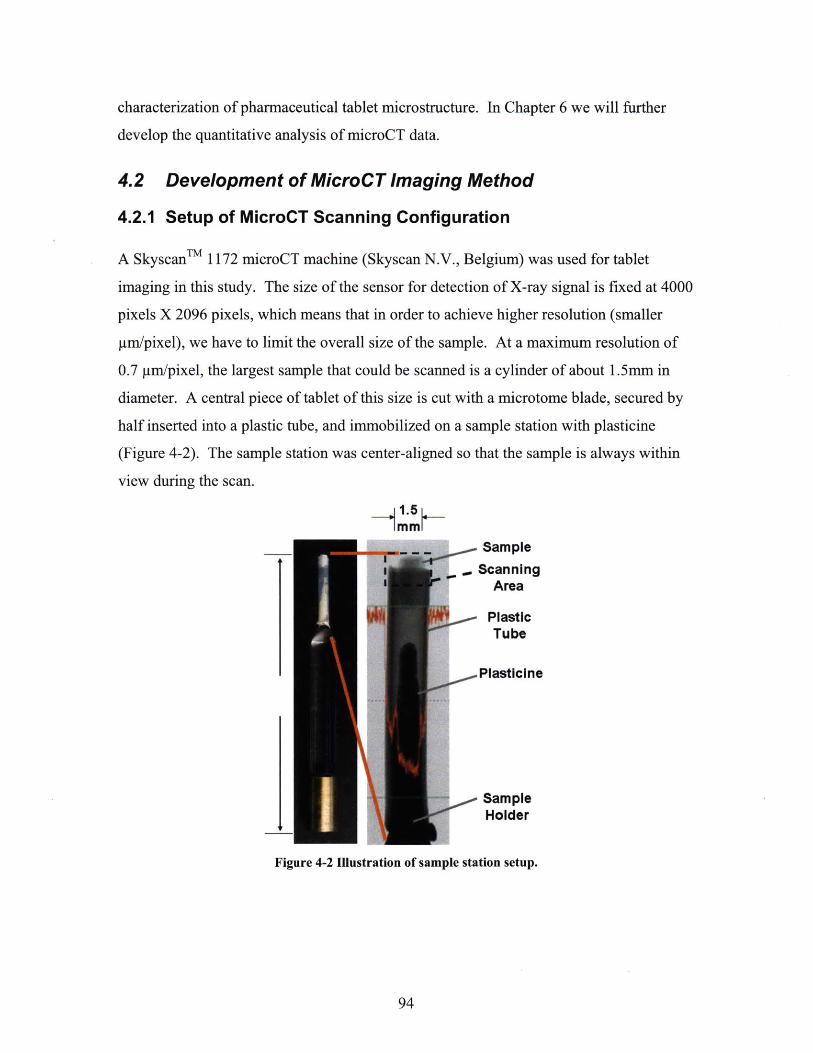
characterization of pharmaceutical tablet microstructure. In Chapter 6 we will further
develop the quantitative analysis of microCT data.
4.2 Development of MicroCT Imaging Method
4.2.1 Setup of MicroCT Scanning Configuration
A Skyscani" 1172 microCT machine (Skyscan N.V., Belgium) was used for tablet
imaging in this study. The size of the sensor for detection of X-ray signal is fixed at 4000
pixels X 2096 pixels, which means that in order to achieve higher resolution (smaller
pm/pixel), we have to limit the overall size of the sample. At a maximum resolution of
0.7 pm/pixel, the largest sample that could be scanned is a cylinder of about 1.5mm in
diameter. A central piece of tablet of this size is cut with a microtome blade, secured by
half inserted into a plastic tube, and immobilized on a sample station with plasticine
(Figure 4-2). The sample station was center-aligned so that the sample is always within
view during the scan.
Sample
,ScanningArea
PlasticTube
Plasticine
SampleHolder
Figure 4-2 Illustration of sample station setup.

Table 4-1 Scanning parameters for tablet fragments.
Scanning ParametersBeam Voltage 40 kVBeam Current 250 gA
Sample Total Rotation 180Rotation Step 0.3*
Exposure Time 1180 msFrame Average 4
Random Movement Correction 10Pixel Linear Dimension 1.4 gm
Camera Make and Model Hamamatsu lOmp CCDScanning Resolution 2000 x 1048 (native: 4000 x 2096)
Filter No FilterFlat Field Gathered prior to first scan each day
Median Filter On
Scanning was done with the configuration as shown in Table 4-1. The actual scanning
resolution used was 1.4 pm at medium resolution, effectively grouping the signal strength
within 4 adjacent sensor dots into one. This was chosen because at the highest natural
resolution, the reconstructed cross sections exhibited floating grain artifacts in the pore
spaces. These artifacts do not go away even after resizing the high resolution scans into
medium resolution ones. On the other side, scans of the same sample directly done with
medium resolution and then reconstructured do not have this problem (Figure 4-3).
0.7um high resolution scan 1.4um med resolution scan400*400 resized to 200*200 Original 200*200
- Lots of floatinggrains in highresolution scans
- Less details butmuch betterpore definition
Figure 4-3 High resolution scans exhibit artifact that is absent in medium resolution scans.
................ .... .... .. ................. ... ....
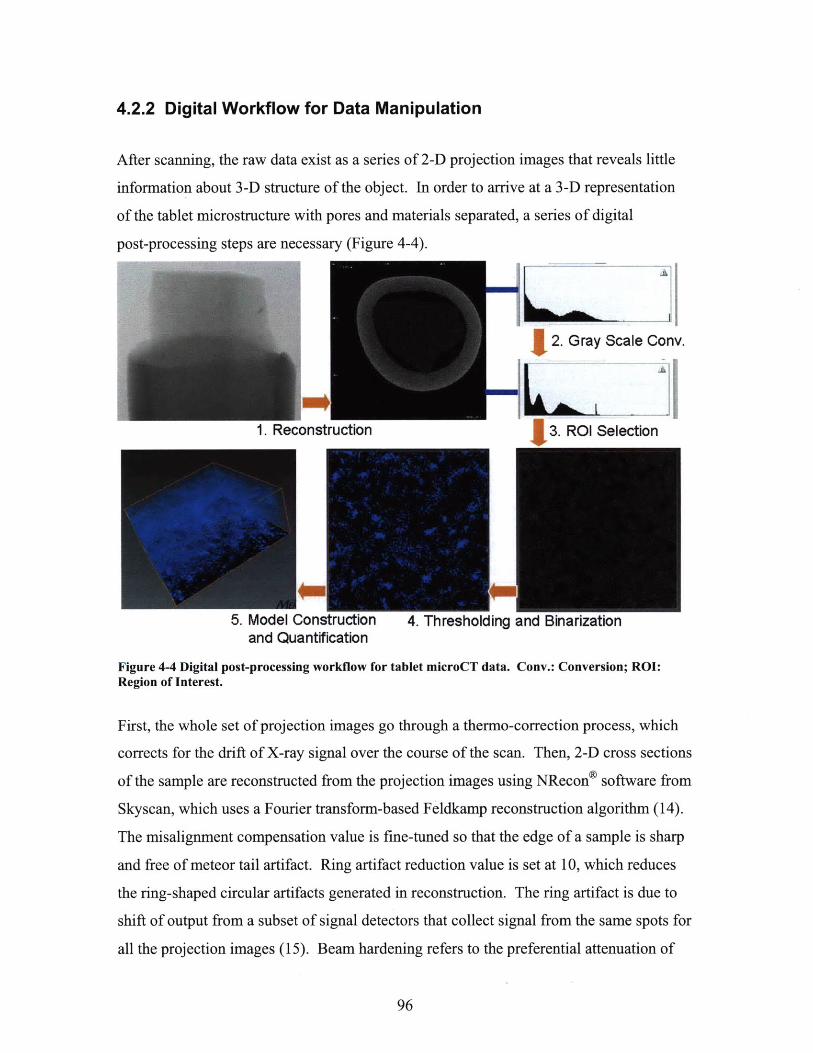
4.2.2 Digital Workflow for Data Manipulation
After scanning, the raw data exist as a series of 2-D projection images that reveals little
information about 3-D structure of the object. In order to arrive at a 3-D representation
of the tablet microstructure with pores and materials separated, a series of digital
post-processing steps are necessary (Figure 4-4).
2. Gray Scale Conv.
1. Reconstruction 3. ROI Selection
5. Model Construction 4. Thresholding and Binarizationand Quantification
Figure 4-4 Digital post-processing workflow for tablet microCT data. Conv.: Conversion; ROI:Region of Interest.
First, the whole set of projection images go through a thermo-correction process, which
corrects for the drift of X-ray signal over the course of the scan. Then, 2-D cross sections
of the sample are reconstructed from the projection images using NRecon* software from
Skyscan, which uses a Fourier transform-based Feldkamp reconstruction algorithm (14).
The misalignment compensation value is fine-tuned so that the edge of a sample is sharp
and free of meteor tail artifact. Ring artifact reduction value is set at 10, which reduces
the ring-shaped circular artifacts generated in reconstruction. The ring artifact is due to
shift of output from a subset of signal detectors that collect signal from the same spots for
all the projection images (15). Beam hardening refers to the preferential attenuation of

X-ray signals of lower energy, causing the peripheral of an object to appear brighter in
microCT scans (15). Since our sample is very small, beam hardening has not been a
problem. Imaging of whole tablet could require special attention to beam hardening.
The 2-D cross section images are then converted into gray-scale images with a Photoshop
CS3* script. The initial Bitmap (.BMP) images occupy an indexed colorspace, which
does not yield high enough contrast for separating the signal peaks. Conversion to gray-
scale JPEG format solves this problem. For tablet structure analysis involving digital
imaging, a critical step is to determine the interface between two phases: solid and
air-filled pores. Since the images are presented in gray scale with a level between 0 and
255, a threshold value of the materials and pores must be determined, followed by
binarization of the two divided sections. In the microCT study of pharmaceutical
granules, no information is explicitly given about how this value is determined and
whether it differs among various scans (4). The study employing a morphological sieve
(16) used an iterative threshold selection method developed by Ridler et. al. in 1978 (17).
This method reaches at a threshold midway between the mean luminosity values of the
two divided sections. However, this might not represent the best segmentation in the case
of tablet microstructure measurement. The luminosity distribution of the pores and
materials differ significantly in shape and magnitude, which might introduce bias with
the algorithm. In this study, we realized that the converted JPEG image yields clear
dividing points for the peaks of pores and materials, and thus represents the most
practical way of determining the thresholds. The peaks of material, air, and plastic tube
can be distinguished in the histogram of the cross section images (Figure 4-5). A
threshold between material and air is determined to be the crossing point of the two peaks.
Depending on the stability of the X-ray generator for different scans, this threshold may
or may not apply to all the dataset collected with the same scanning configuration.
Histogram analysis for individual scans is the best way to arrive at optimal threshold for
that specific data set.

j t-stograrn x
011 45 1280: Air and poresA: Excipient and API0: Plastic tube
3 mm .|: Region of interest
Figure 4-5 Illustration of cross section histogram and the selection of threshold/ROI.
Data visualization and analysis software, Avizo 6* of Visualization Sciences Group, is
adopted for further processing of the microCT data. In Avizo software, the Pool contains
icons representing data objects and modules currently in use as well as lines connecting
icons indicating dependencies between objects and modules. Icon colors are used to
indicate different types of objects. Data objects are shown in green and are the only
objects which can be saved to disk using File/Save. Computational modules are shown in
red, visualization modules are in yellow, and visualization modules of slicing type are in
orange. Such modules may be used to clip the graphical output of any other module.
Lastly, the light green items are colormaps that are used for visual presentation.
Connections between data objects and processing modules, shown as blue lines, represent
the flow of data. For display modules, these connections show the data used to generate
the display. You may connect or disconnect objects by picking and dragging a blue line
between object icons.
A stack of reconstructured cross section images are loaded into the software in luminance
mode, with voxel size specified as the actual resolution of the images. A series of
manipulations are then performed on the loaded data as shown in Figure 4-6. Orthoslice

module is connected to display cross section images, while bounding box is used to
define the physical boundary of the object. Binarization is conducted with I_threshold
module at the threshold value determined as discussed above. The result is a set of
thresholded images, presented with pores in blue and other materials in black. The pore
clusters could be visualized via surfacegen module, providing an opportunity for direct
examination of the porosity structure. At this point, total porosity can be calculated as
the percentage of blue voxels in total voxels with the volume3d module.
Figure 4-6 Avizo workflow for basic microCT data manipulation.
4.3 MicroCT Imaging Studies of Caffeine-Lactose Tablets
The caffeine-lactose tablets as described in Chapter 2 were first studied with the microCT
toolbox. The tablets were made from the same amount of initial materials but were
compacted into different final thickness. The highest compaction force was applied to
2.3mm tablets, while the lowest was applied to 3.2mm ones. Scanning and
reconstruction were conducted as described above. A set of cross sections of the tablets
are shown in Figure 4-7. As discussed in Chapter 2, spray-dried lactose mainly
undergoes fragmentation during compaction process. The microCT images illustrate the
various degrees of fragmentation and the resulted microstructure. The hard tablets show
a much more homogeneous appearance, probably due to extensive breakdown of the
powder granules during compression process. The pore sizes are small and relatively
uniform. As the tablets become softer, there are significantly more large pores. The
.................................................................... ::::::::: ............ .. .. .. ...... ..... .... . ... . ................

brighter aggregates are powder granules that have not fragmented during the compaction
process.
2.3 mm 2.4mm6 m m
Figure 4-7 MicroCT cross section images of caffeine-lactose tablets. 500umX500um.
Next, the total porosity of the microCT 3-D models were determined and compared with
those obtained via two other techniques (Figure 4-8). Helium pycnometry was adopted
to measure the absolute density of the powder mixture used for tablet production. With
the knowledge of tablet's physical dimension and weight, it is now possible to calculate a
theoretical porosity value for each tablet:
e7r 2 Hpr -WP=( )2 HpT
Where pT is the material true density, H is tablet thickness, W is tablet weight, r is tablet
radius. A polynomial fitting curve across the theoretical porosity values represents the
theoretical porosity curve. Both MicroCT and mercury porosimetry measurements have
good agreement with theoretical values in hard and medium-strength tablets, but
microCT is more accurate in measuring soft tablets. It is possible that in mercury
porosimetry tests, the walls of soft tablet might not withstand the pressure of initial
100
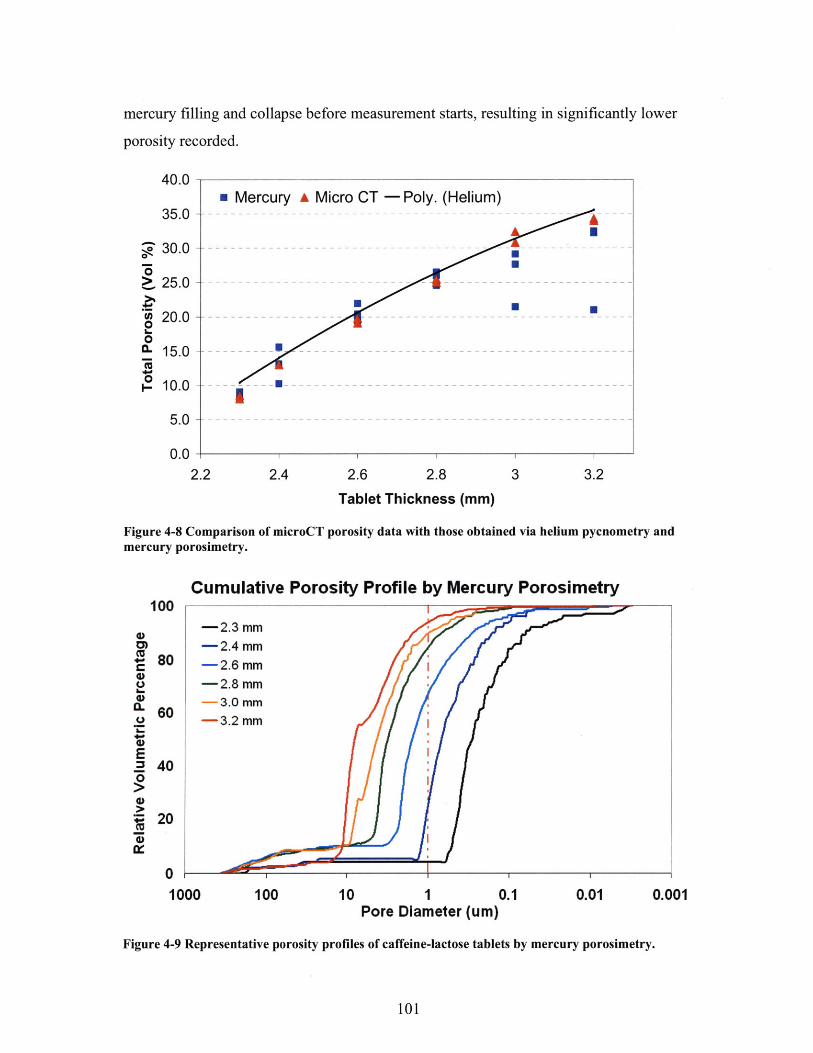
mercury filling and collapse before measurement starts, resulting in significantly lower
porosity recorded.
m Mercury A Micro CT - Poly. (Helium)
-- - --------
0 N
2.4 2.6 2.8 3 3.2
Tablet Thickness (mm)
Figure 4-8 Comparison of microCT porosity data with those obtained via helium pycnometry andmercury porosimetry.
Cumulative Porosity Profile by Mercury Porosimetry100
80
60
40
20
1000 0.001100 10 1 0.1 0.01Pore Diameter (um)
Figure 4-9 Representative porosity profiles of caffeine-lactose tablets by mercury porosimetry.
101
40.0 -
35.0 -
30.0 -
> 25.0-
20.0 -0I-.0C- 15.0 -
0P- 10.0 -
0.0 11
2.2
.................................. .... .. .................... .. . . .... ...... . ............ _ _ _ _ .... ........ ......... .................. ...............

Figure 4-9 displays a series of representative porosity profiles obtained with mercury
porosimetry. The mercury porosimetry profiles show that there are two groups of pore
sizes in all tablets, with one group in the range of 10-500 gm in diameter and another in
the range of 0.01-10 gm. The diameters of the smaller pores, the majority of the
population, increase as tablet goes softer. The relative volumetric percentage of large
pores in hard tablets (2.3mm and 2.4mm) is ~5%, which jumps to 10% in medium-
strength to soft tablets (2.6mm, 2.8mm and 3.0mm). In the softest tablet (3.2mm),
contrary to expectation, this percentage drops to 5%. This further indicates that some of
the largest pores in the soft tablets could have been taken up during the initial mercury
filling stage, leading to inaccurate measurement. On the other hand, microCT cross
section images seem to indicate that large pores occupy a higher volumetric percentage
than what is recorded by mercury porosimetry.
The resolution used in the microCT measurement is 1.39 pm/pixel. Taking
partial-volume effect into consideration, 1 gm is probably the smallest pore diameter that
can be detected with microCT measurement. According to the porosity profile by
mercury porosimetry, the majority of pores in hardest tablet (2.3mm) would be under 1
gm in diameter. If this were true, the porosity measured with microCT would be 95%
lower than the results of mercury porosimetry. However, the reconstructed microCT
images of the 2.3mm tablets clearly show a significant group of pores larger than 1 pm in
diameter (Figure 4-10). Since the two methods yield very similar results in total porosity,
they are possibly measuring the same pore volumes but giving different readings of pore
diameter.
The discrepancy in pore size measurement can be explained by the theoretical bases of
the two methods. Mercury porosimetry was developed on the principles of capillary
hydrostatics, which state that for a cylindrically shaped pore, the pressure needed to push
mercury into the pore is inversely related with the diameter of the pore (18). In
pharmaceutical tablets, however, the pores take irregular shapes and might be
interconnected with each other via smaller channels. As a result, both methods would
102

measure the volume of the pores, but mercury porosimetry reports the equivalent
diameter of the channels instead of the pores, as illustrated in Figure 4-11.
500pm 7p
- Pores of sizes largerthan 1 micron areclearly presented inmicroCT images of2.3mm tablets.
Figure 4-10 MicroCT cross section images show abundant amount of pores larger than 1 um indiameter.
If a string of pores are interconnected, the diameter reading for the pore spaces will be
reported as the smallest pore neck encountered during the mercury intrusion process. This
systematic bias is absent in microCT measurement, in which the 3-D dimension of the
actual pores is directly visualized and quantified. MicroCT measurement coupled with
digital post-processing holds the promise of precise description of tablet microstructure,
which is not possible with current standard methods. The combined data suggests that
the hard lactose tablets have pores of > 1 jim diameter connected with channels of 0.1-
1p jm in diameter. Method for detailed characterization of porosity profiles will be
discussed in Chapter 6.
103
... ........ . . ..........

Mercu Porosimetry
Figure 4-11 Illustration of pore diameter measurement in a typical pore structure of lactose tablets.
Next, the relationship between total porosity and tablet properties are evaluated. An
exponential relationship is observed when tablet tensile strength is plotted against
microCT derived porosity (Figure 4-12). This exponential relationship was first observed
in sintered metals(19), and is then realized to be applicable to a range of pharmaceutical
powders (20, 21).
0.8
0.6
0.4
0.2
0
-0.2
-0.4
-0.6
-0.8
-120 25 30
Average 3D Porosity by MicroCT (%)40
Figure 4-12 Exponential relationship between tablet tensile strength and microCT porosity.
The relationship between tensile strength and porosity is termed compactibility, the
ability of a material to produce a tablet with sufficient strength under certain degree of
104

densification. Another two terms that used frequently in characterizing tabletting
properties are tabletability and compressibility. Tabletability is the ability of the powder
to be transformed into a tablet of specified strength under the effect of compression
pressure, while compressibility is the ability of a material to reduce in volume as a result
of applied pressure (20). The three properties assess relationships among volume
reduction, strength, and external pressure of the tablets (Figure 4-13). Since the tablet
press used in the study is not instrumented, compression pressure could not be recorded
in this case. This study demonstrated the capability of microCT analysis in evaluating
important tabletting properties of pharmaceutical powders.
Pressure
Tabletability Compressibility
Strength Porosity
CompactibilityFigure 4-13 Relationship among compression pressure, tablet strength, and porosity.
4.4 MicroCT Imaging Studies of Compound-A Tablets
After experimentation with the caffeine-lactose tablets, a more extensive formulation
system would be explored. A natural extension in this study is to bridge the
caffeine-lactose direct compression system and the compound-A roller compaction
system. Compound-A roller compaction formulations are expanded to also include 10%
and 30% drug load, where lactose becomes the dominant material in the formulation.
The formulations are listed in Table 4-2 and the manufacturing process is the same as that
for the previous compound-A roller compaction formulations. Lubrication levels are kept
the same so that the impact of the additional excipients remains similar.
105
.............. . ............................................................................................ ......"I'll" .11,111,111,111,1111, ............... ...

Table 4-2 Composition of M1O/M30/M50/M70 formulations.
MIT (Ml/M30/M50/M70) wt%Compound A 10/30/50/70Spray-dried Lactose DCL14 (DMV) 85/65/45/25Colloidale silicon anhydrous (Aerosil 200) 1Magnesium stearate (Faci) 4All the formulations performed well during the roller compaction and tablet compaction
stages. Tablets with target hardness of 100N/75N/50N/25N are produced for each of the
formulations. For microCT analysis, whole tablets were placed inside of a plastic tube
and scanned at 3pm resolution with 2.3s scanning time, while tablet fragments were
scanned at 1.4pm resolution with 1.18s scanning time.
W |W: Lactose u : Compound-A
Lactose and compound-A donot form homogenous mixture intablets; M70 dominated bycompound-A matrix, M10 bylactose matrix, M30/M50 inbetween. Reconstructured slices, 12mm*12mm, 3pm/pixel
Figure 4-14 Cross sections and illustration of whole-tablet microCT scans for compound-A tablets.
A set of reconstructed microCT cross-section images are displayed in Figure 4-14.
Because of the much higher density of lactose, it manifests itself as the brighter areas.
The darker areas are compound-A. From the cross sections it is immediately apparent
that lactose and compound-A do not form homogenous mixture. The distribution pattern
106
- TV- - - - - - -

is illustrated with the figures on the left, where yellow dots represent lactose and black
dots represent compound-A. In M10, lactose forms the dominant structure, with sparing
compound-A regions spotted randomly throughout the tablet. In M70, compound-A
forms the supporting structure. The scenarios for M30/M50 are mid-way between those
for M10 and M70.
Figure 4-15 Cross section microCT images of M70 compound-A tablets. 500umX500um.
A closer look at the reconstructed microCT images for tablet fragments reveals more
striking features of the microstructure. The lactose granules are largely intact within the
M70 tablets, surviving the roller compaction, milling, and tablet compression stages.
Even the intra-granular pores of the lactose particles have been well preserved, albeit
squeezed to smaller sizes in harder tablets. It seems that compound-A goes through
plastic densification during the manufacturing process, providing a cushion for the
lactose granules.
107
M_: ' : . _: 'w::::::::::::::: - --........... . ....
100ON

75N 50N
M50
M30
M10
Figure 4-16 Cross section MicroCT images of M10IM30/M50 compound-A tablets. 500umX500um.
The cross-section images of the other formulations are demonstrated in Figure 4-16. The
M50 microstructure looks very similar to that of M70, but with a larger number of lactose
granules embedded. In M30 tablets, the lactose granules start to go through deformation,
losing the original spherical shapes and forming dense clusters. For M10 tablets, lactose
assumes dominant role and undergoes extensive fragmentation, forming structures very
similar to those of 10% caffeine-lactose tablets.
It is clear that the transition of material composition first imposes incremental changes
but eventually induced dramatic alteration of tablet microstructure. In order to evaluate
the impact on mechanical properties of the tablets, compaction response curves, where
tablet strength is plotted against tablet bulk density, are prepared for the compound-A
formulations (Figure 4-17).
108
25Nil100N

120-.- M10 -- M30 Plastic Deformation
10 --- M50 -e-M7000
IAIA 60ragMentationCM 60 ---- -- ---- - ..--- -- -- - - - - --- e -nt t-o -L
20cle Rearrangement
0 & Elastip/Plastic Deformation
0.8 1 1.2 1.4Bulk Density (g/ml)
Figure 4-17 Compaction response curves for M1O/M30/M50/M70 compound-A tablets.
The initial compaction stage reaching a hardness of 50N assumes the same slope for
different compound-A loadings, suggesting similar strength gains during the particle
rearrangement and initial deformation process. For M50/M70, it takes much more
density gain than that for M 1/M30 to reach the same strength level. The results indicate
that lactose fragmentation develops stronger solid bonding than compound-A plastic
deformation, potentially via the formation of solid bridges with mechanical interlocking.
Based on the microCT and mechanical strength data, the following compaction
mechanisms could be summarized ( Figure 4-18). For compound-A dominated
compaction process, compound-A provides a cushion for lactose granules and preserves
their shapes, while compound-A itself first fills up the large voids and then undergoes
plastic densification, eventually forming a densely packed solid form. In lactose
dominated compaction process, without the cushion layer of compound-A, lactose
undergoes extensive fragmentation to form the tablet matrix, squeezing compound-A into
small segments.
109
--- -. ................

Compound-A DominatedCompaction Process
* LactoseCompound-A
Lactose DominatedCompaction Process
E44I.#~U
Figure 4-18 Proposed tablet compaction mechanisms for compound-A tablets.
MicroCT measurement of total porosity for M70 tablets are shown in Figure 4-19.
Except for the data of 1OON tablets, all the other microCT data points are lower than
expected. This is counter-intuitive as microCT is supposed to be more accurate for softer
tablets.
Porosity Measurement for M70 Tablets
10
0
0
35%-
30%-
25%-
20%-
15%-
10%-
5%-
0%
20 40 60
Hardness
80 100 120
(N)
Figure 4-19 Total porosity measurements of M70 tablets.
110
* MicroCTN EHelium
- -A Mercury
N ------- - - - - - - -
*
- --- - -- -

The microCT porosity profile of 1 OON M70 tablet (Figure 4-20) provides important
information to explain the data. According to microCT, most of the pores are single
voxel (equivalent diameter = 1.72 ptm) or 2-3 voxels in size. There are some larger pores
representing pore space within the embedded lactose granules. With the focused ion
beam scanning electron microscopy (FIB-SEM) study described in Chapter 7, we would
identify a typical pore diameter of 0.2 pm - 0.4 pm for 10ON M70 tablets. Therefore, a
large number of microCT single voxel pores are incorrect identifications probably due to
partial volume effect. They will add to total pore volume quickly as a single-voxel pore
is equal to 60-100 pores in volume at the average pore size given by FIB-SEM. This
resulted in the coincidentally "correct" total porosity values by microCT for 10ON M70
tablets. With a softer M70 tablet, the compound-A matrix relaxes and the pores become
larger in size. However, before the pore sizes catch up with microCT resolution,
microCT identified pore volume would not grow as fast as actual pore volume would.
This led to the lower total porosity values by microCT for softer M70 tablets. The data
suggests that microCT resolution must be smaller than the typical pore size in order to
obtain adequate microstructural characterization.
Porosity Profile for a M70 1OON Tablet by microCT40%-
35% -
5 30%0O 25%
0* 20% -
4 - 1 5 % - - - - - - - - - - - - - - - - -120%
p5%
0%
0 5 10 15 20 25Equivalent Pore Diameter (um)
Figure 4-20 Porosity profile of 10ON M70 tablet as measured by microCT.
111
.:.-... .... ............................. :::::::: ....................... .. .. ..... ..... .... .. --- --------------------- -------- .. .... - -- ... ........... .............. ........ . .... ................................ .. ..... .M - - - ........ ........ ... ........................ :..::::::::.. - 41-::::: .. .. - 11 -

4.5 Summary
In this chapter we have described the establishment of a microCT data acquisition
method for pharmaceutical tablets and the development of a digital post-processing
workflow. The internal pore space of tablets could be separated from the other materials
and visualized in a 3-D model, facilitating the characterization of the internal structure.
The total porosity could be calculated based on the model.
In microCT study of 10% caffeine-lactose direct compression tablets, various degrees of
lactose granule fragmentation were observed in tablets of different strength. The total
porosity measurement of microCT is in excellent agreement with theoretical values
predicted from true density measurements. When compared with mercury porosimetry,
microCT is more reliable for soft tablets, while the measurements for hard tablets are
slightly lower than predicted due to the inability to capture pores smaller than resolution
power. The orders of magnitude of pore sizes as measured by the two techniques are
different. This could be explained by the discrepancy in theoretical bases of the two
methods. Mercury porosimetry measures the diameter of the pore necks while microCT
allows direct characterization of the pores. The combined data suggests that the hard
lactose tablets measured have pores of> 1 gm diameter connected with channels of 0.1-
1 pm in diameter.
The microCT study of the M-series compound-A roller compaction formulations
illustrate that transition of material composition first imposes incremental changes but
eventually induces dramatic alteration of tablet microstructure. In M70 tablets,
compound-A forms the supporting structure while acting as a cushion for lactose granules,
preserving the latter throughout the manufacturing process. In M10 tablets, lactose forms
the majority of the tablet matrix and undergoes fragmentation similar to that in 10%
caffeine-lactose tablets. M30/M50 formulations are in-between of the two extreme
scenarios. The compaction response curves of the formulations further point out that the
fragmentation of lactose represents a more effective binding power than the densification
of compound-A in creating a tablet of higher strength. Scenarios for tablet compaction
were proposed based on the information revealed by microCT measurements. MicroCT
112

resolution was not sufficient for quantitative study of M70 tablet microstructure,
indicating a technical barrier to be addressed by technology advancement.
113

4.6 Chapter Bibliography1. J.D. Elliott, SD. X-ray microtomography. Journal of Microscopy:211-213 (1982).2. S.R. Stock. Recent advances in X-ray microtomography applied to materials.
International Materials Reviews. 53:129-181 (2008).3. S.R. Stock. X-ray microtomography of materials. International Materials Reviews.
44:141-164 (1999).4. L. Farber, G. Tardos, and J.N. Michaels. Use of X-ray tomography to study the
porosity and morphology of granules. Powder Technology. 132:57-63 (2003).5. I.C. Sinka, S.F. Burch, J.H. Tweed, and J.C. Cunningham. Measurement of
density variations in tablets using X-ray computed tomography. Int J Pharm.271:215-224 (2004).
6. V. Busignies, B. Leclerc, P. Porion, P. Evesque, G. Couarraze, and P. Tchoreloff.Quantitative measurements of localized density variations in cylindrical tabletsusing X-ray microtomography. Eur J Pharm Biopharm. 64:38-50 (2006).
7. T. Sovany, P. Kasa, K. Vakli, and K. Pintye-Hodi. X-ray computedmicrotomography for determination of relationships between structure andbreaking of scored tablets. X-Ray Spectrometry. 38:505-509 (2009).
8. C.Y. Yangand X.Y. Fu. Development and validation of a material-labelingmethod for powder process characterization using X-ray computed tomography.Powder Technology. 146:10-19 (2004).
9. X.W. Fu, J.A. Elliott, A.C. Bentham, B.C. Hancock, and R.E. Cameron.Application of X-ray microtomography and image processing to the investigationof a compacted granular system. Particle & Particle Systems Characterization.23:229-236 (2006).
10. X.W. Fu, M. Dutt, A.C. Bentham, B.C. Hancock, R.E. Cameron, and J.A. Elliott.Investigation of particle packing in model pharmaceutical powders using X-raymicrotomography and discrete element method. Powder Technology. 167:134-140 (2006).
11. S.J. Inman, B.J. Briscoe, and K.G. Pitt. Topographic characterization of cellulosebilayered tablets interfaces. Chemical Engineering Research & Design. 85:1005-1012 (2007).
12. E. Karakosta, P.M. Jenneson, R.P. Sear, and P.J. McDonald. Observations ofcoarsening of air voids in a polymer-highly-soluble crystalline matrix duringdissolution. Phys Rev E Stat Nonlin Soft Matter Phys. 74:011504 (2006).
13. G. Chauve, F. Raverielle, and R.H. Marchessault. Comparative imaging of aslow-release starch exciplent tablet: Evidence of membrane formation.Carbohydrate Polymers. 70:61-67 (2007).
14. L.A. Feldkamp, L.C. Davis, and J.W. Kress. Practical Cone-Beam Algorithm.Journal of the Optical Society of America a-Optics Image Science and Vision.1:612-619 (1984).
15. G.R. Davisand J.C. Elliott. Artefacts in X-ray microtomography of materials.Materials Science and Technology. 22:1011-1018 (2006).
16. Y.S. Wu, L.J. van Vliet, H.W. Frijlink, and K.V. Maarschalk. Pore sizedistribution in tablets measured with a morphological sieve. International Journalof Pharmaceutics. 342:176-183 (2007).
114

17. T.W. Ridlerand S. Calvard. Picture Thresholding Using an Iterative SelectionMethod. Ieee T Syst Man Cyb. 8:630-632 (1978).
18. E.W. Washburn. The dynamics of capillary flow. The Physical Review. 17:273-283 (1921).
19. E. Ryshkewitch. Compresssion strength of porous sintered alumina and zirconia.Journal of American Ceramics Society. 36:65-68 (1953).
20. E. Joins, P. Di Martino, C. Berneron, A.M. Guyot-Hermann, and J.C. Guyot.Compression behavior of orthorhombic paracetamol. Pharm Res. 15:1122-1130(1998).
21. C.Q. Sunand D.J.W. Grant. Influence of crystal structure on the tabletingproperties of sulfamerazine polymorphs. Pharm Res. 18:274-280 (2001).
115

116
Chapter 5 Dissolution Mechanism Study with NovelTablet Holder
Dissolution is a central test that is widely utilized by the pharmaceutical industry in
multiple aspects. In Chapter 2, a detailed dissolution study of lactose-caffeine tablets
with the standard paddle dissolution method was described. An empirical relationship
between tablet mechanical strength, storage condition, and dissolution speed was
developed. However, the test did not give further information about the mechanism of
dissolution. The complex hydrodynamics situation and changing dosage form
morphology in standard dissolution methods make it difficult to describe the process with
analytical models, preventing our understanding of the rate-limiting steps of dissolution.
In this chapter, a novel tablet holder designed for probing dissolution mechanism of USP
#2 paddle method is presented. Its applications in dissolution mechanism study of tablets
made from direct compression as well as roller compaction are described. Combined
with standard paddle dissolution, the tablet holder is shown to help identify the intrinsic
drivers of dissolution process, bringing us one step closer to rational formulation design.
5.1 The Models of Pharmaceutical Dissolution Tests
Dissolution in general is defined as "the process by which a solid substance enters the
solvent phase to yield a solution" (1). Study of dissolution was initiated by physical
chemists at the end of the 19th century. The dissolution rate of a solid substance was
described by the Noyes-Whitney equation (2) shown below,
dC= k(C, -C,)dt
where the proportionality constant k is addressed as the "apparent dissolution rate
constant", Cs is the saturated concentration, Ct is the bulk concentration of the dissolved
drug at time t. The driving force for dissolution is the concentration gradient between the
saturated concentration and bulk concentration. This physical model became the basis
for thinking about solid-liquid mass transfer and has been widely used.
117

A few years later, Erich Brunner further developed dissolution theory in collaboration
with Nernst based on diffusion layer theory and Fick's second law (3). In this
Brunner-Nernst equation, the dissolution rate constant is expressed as:
k= A-DSHL -V
where D is the effective diffusion coefficient of the drug molecule, A is the surface area
available for dissolution, 3HL is the thickness of the diffusion layer, and V is the media
volume employed in the test.
Higuchi analyzed the dissolution kinetics from an ointment assuming homogenous
distribution of drug and sink condition in the medium (4). He arrived at the following
expression of dissolution rate:
q(t) K
q(oo)
This was further developed by Peppas into a power-law equation for generalized
description of dissolution from polymeric dosage forms (5):
q(t) = K t"
q(oo)
Where Ki is a constant reflecting the structural and geometric characteristics of the
delivery system expressed in time" units and n is a release exponent the value of which is
related to the underlying mechanism(s) of drug release (6). Both equations are only
applicable to the first 60% of the dissolution for a tablet, the period of which a tablet
typically still holds its shape.
These models are based on the assumption that diffusion through a stagnant film layer is
the rate limiting step. An alternative model is called the interfacial barrier model, where
the interfacial solid-liquid mass transfer is the rate limiting step due to a relatively high
activation energy barrier (7). This model has not seen full development and does not
have an explicit mathematical description. Another model worth mentioning maps
dissolution data to a Weibull equation, a cumulative function of a continuous probability
distribution. The relationship was first discovered by Langenbucher (8) and then
118

confirmed by other studies utilizing Monte Carlo simulations (9, 10). The cumulative
fraction of dissolved material is expressed as:
x =1exp L(t - T)bI a
Where t is time, T is lag time, a is a scale constant and b is a shape constant. For a
thorough review of the physical / mathematical models developed for pharmaceutical
dissolution tests, please refer to Dokoumetzidis and Macheras (11).
The models described above have two common points. They all consider dissolution as a
single process that can be described with one set of equations, and none of them
considered the impact of tablet microstructure, which could be very important for
dissolution speed as we will demonstrate in this Chapter.
5.2 Design of Tablet Holder for Mechanism Study of Paddle Dissolution
Paddle dissolution (USP #2) method has remained the most popular method in
dissolution testing during the last a few decades. However, the simple setup of the
paddle dissolution method is accompanied by a complex hydrodynamics condition. From
CFD simulation (12) and experimental results, it is observed that right under the paddle
there is a region with highly unpredictable swirling flows (Figure 5-1). This region,
nicknamed the "dead zone", is often the region that tablet sits in during most of the
dissolution period. The flow speed at 1cm from the bottom center could be three times as
high as that at the bottom center, so the positioning of the tablet could potentially have a
big impact on the dissolution results (13). A tablet can also collapse into a pile of debris,
further complicating the understanding of the dissolution mechanism and impede
in vitro-in vivo correlation (IVIVC) studies.
119

A v0o.-o1
9.60e-02
8.406-02
7.20e-02
6.00&-02
4.80&-02
3.60e-02
2.406-02
1.20&-02
0.000+00
A
Secondary recirculationpatterns
I Veloiv Vectors Colored By Velocitv Maanitude Im/sW Aor 25. 2002 IFigure 5-1 Computational fluid dynamics simulation of paddle dissolution test, 50 RPM, adaptedfrom McCarthy, et al., 2003
5.2.1 Previous Efforts
The major problems outlined above are unpredictable hydrodynamics condition and
constantly changing tablet morphology. In order to better understand the dissolution
process, multiple studies have targeted these two problems. Wu, et al. designed a
cylinder-shaped tablet holder (Figure 5-2) to be placed at the bottom center of dissolution
vessels (14). The holder was shown to help differentiate dissolution profiles of
Theophylline and Naproxen tablets subjected to paddle dissolution with various paddle
designs, but no detailed analysis was conducted on the new hydrodynamics conditions.
Elevated platform with distinctive edges could result in turbulent flow pattern close by
and thus further complicate the dissolution process.
120
NN
...... . .. .... ... .......... ... . ........ -........... .. ....

T
Figure 5-2 Tablet holder designed to fix dissolution surface. Adapted from Wu, et al., 2004
Peltonen et al. designed a channel flow method to both define exposure area and generate
a consistent laminar flow hydrodynamics condition (15, 16). The tablet is placed inside a
holder, with only one surface exposed to a laminar flow controlled via a peristaltic pump
(Figure 5-3).
(a) adjusting tablet holderscrew \
z~~7 siicone
rubber seal
low inIflow out
Figure 5-3 Channel flow method for understanding dissolution. Adapted from Peltonen, et al., 2003
The author concluded that the channel flow cell allows a smooth initial dissolution, and
the mass transfer process can be modeled. However, at a later stage the dissolution data
can fluctuate quite significantly. It also needs the establishment of an integrated system,
including coupled UV system, pump, and a thermo-stating bath.
121

Figure 5-4 Illustration of flow-cell apparatus in packed/laminar flow mode. Red object is tablet.Modified from SOTAX Corp., Horsham, PA, USA
Within USP compendial dissolution methods, flow-cell dissolution (USP #4) is the most
amenable method for studying dissolution mechanism. Flow cell dissolution has
relatively mild agitation and mathematically definable medium flow patterns, where a
tablet is placed on a supporter and subjected to a laminar flow in packed bed scenario
(Figure 5-4). Flow-through cell dissolution is often configured as an open system, in
which the medium flows through without being recycled. This generates a perfect "sink"
condition for poorly soluble drugs, where concentration in the medium is close to zero.
Flow-through cell dissolution has not gained massive popularity in the last a few decades.
Instead, paddle method and basket method with proper agitation rate (50-100 RPM for
paddle, 50-150 RPM for basket) have been suggested by FDA to be the most suitable for
routine dissolution testing (17) and bioavailability / bioequivalence studies (18).
The flow-through cell apparatus is not an ideal tool to mimic and understand the
dissolution mechanism in paddle apparatus. The flow speed in this USP #4 test is
typically at least an order of magnitude slower than that in paddle test (19) and thus can
not accurately reflect the actual mass transportation process in paddle test; Instead of a
steady flow, the flow in USP #4 test has a sinusoidal profile with a pulsation of 120
122
........ . . ............................ .......... .. .. .............. . . ..........................................

pulses per minute; the tablet is also subjected to a continuously changing morphology and
collapses at a certain stage of the dissolution.
5.2.2 Design of the Novel Tablet Holder
The lack of appropriate tools for probing dissolution mechanism is impeding Quality by
Design (QbD) in formulation development. Without a good understanding of the
intrinsic drivers of dissolution process, it is difficult to fine-tune formulation design to
specifically promote these drivers. In this study, we present a novel tablet holder to be
used with paddle dissolution that is (1) simple to use, (2) directly comparable to the
standard paddle method, (3) capable of simplifying the hydrodynamics condition so that
the dissolution process can be described with physical/mathematical models, and (4)
capable of suppressing disintegration induced by liquid penetration or tablet swelling to a
large degree.
In order to understand the paddle dissolution test, it is logical to start from examining the
hydrodynamics situation within the vessel. Renolds number is a dimensionless number
that gives a relative ratio of inertial forces to viscous forces. It can be used to
characterize different flow regimes, e.g., laminar flow vs. turbulent flow. Laminar flow
occurs at low Renolds number and features smooth and consistant flow patterns, while
turbulent flow occurs at high Renold number and tends to generate random flow
instabilities, such as eddies and vortices. This is important in dissolution as the flow
pattern could dramatically affect mass transfer mechanism, speed, and variability. In a
cylindrical vessel stirred by a center-rotating paddle, as is the case of paddle dissolution
test, the Renold number can be expressed as:
Re= pND2
Where,
p is the density of the medium, 0.99370 g/ml for water at 37'C;
p is the viscosity of the medium, 0.006915 g/(cm*sec) for water at 37'C;
N is the rotational speed (rotations per second), 0.83/sec for 50 RPM
D, characteristic dimension of the apparatus, is the diameter of the paddle, 7.5cm.
123

The Renold number in the paddle apparatus is around 5000, below the 10000 level
required to develop a turbulent flow regime (20). The flow is turbulent behind the path
of the paddle tips, while there is a relatively steady region of laminar flow near the wall
between the paddle and the upper surface of the medium.
After multiple iterations, a tablet holder, built to be a simple accessory to study
dissolution mechanism, was designed to utilize this relatively steady flow regime with
minimal disturbance and consistent tablet exposure area. The holder is made from
DuPontTM Delrin@ acetal resin, a material that is abrasion and solvent resistant. The
holder surface in contact with medium is comprised of two arcs interconnected at an
inflection point, where the curvature changes sign (Figure 5-5). Such a design ensures a
smooth flow pattern along the holder surface with minimized development of eddy flow.
In the setup, a constant tablet surface area is exposed to a relatively steady flow,
facilitating the establishment of mathematic models for the dissolution process. This
could in turn allow quantitative exploration of the role of microstructure in dissolution.
2 9.2mm * 3.5mm
Figure 5-5 Design of the tablet holder for usage in combination with paddle test.
124
. . .. . ........ ........ ............................. .... .... .......... ...

For many formulations, the process of dissolution includes surface dissolution and tablet
disintegration. In the case of surface dissolution, solid material first dissolves in the
liquid and then is transported away; in tablet disintegration, solid material first detaches
from the bulk solid and then dissolves. For dissolution with a tablet holder, tablet
disintegration due to medium penetration and tablet swelling can often be suppressed,
with only surface dissolution left to be characterized. The tablet physical structure
exposed to the medium could be derived fully or partially from the microCT
measurement/analysis. The use of this tablet holder in combination with standard paddle
test would not only help understand the dissolution mechanism but also facilitate
mathematical modeling of the dissolution process, with tablet microstructure incorporated.
5.2.3 Physical/Mathematical Model of Holder DissolutionA simplified two-step surface dissolution model for
holder dissolution is illustrated in Figure 5-6. The Layer
first step is dissolving of the solid into the liquid C!
phase, for which the available area is the nominal
exposed surface area A=tr2 and additional pore
surface area Ap. The second step is convective
diffusion of the dissolved material from the surface
into the bulk flow, for which the available area is©
the nominal surface area. A linear flow velocity Concentratior
profile is assumed within the boundary layer, which x
allows an analytical solution to the problem while '
achieving similar accuracy as the actual parabolic
flow scenario (2T1). The flow near the tablet surface
/! d
is assumed to be a parallel laminar flow (x-axis), C octyti
while the diffusion process is assumed to be the b
perpendicular to the tablet surface (z-axis).
y
Bulk Flow
Cb
Profile
zrofile
Figure 5-6 Simplified physical model of tablet holder dissolution.
125
.................................................................................. _ _ .... ..... ..... ........ ......... ............ ................

The rate of dissolution can be expressed as:
Where, R =kA,,,(C, -C,
A,0 = A + A,
As for convective diffusion, we have,
Da~c acD =V
az2 x
where the left term corresponds to the diffusion speed, the right term to the convective
transport speed. We can also write a few boundary conditions,
C =C 0<x<2r
C=Cb z-_m0
C=O x=0Combining which we can solve (Eq-3) and integrate over the surface of tablet, arriving at
the rate of convective diffusion,
R = 0.687AD213 (L )113(C, - Cb)Jr
Where D is the diffusivity, Vb is the bulk flow speed, 6 is the boundary layer thickness, r
is the radius of the tablet. The rate-limiting step determines the dissolution mechanism of
the tablet, which in turn determines the impact of tablet microstructure in holder
dissolution (Figure 5-7). In surface-dissolving-limited holder dissolution, porosity profile
contributes to the dissolution speed by providing additional surface area, while in a
convective-diffusion-limited holder dissolution, porosity profile has little to no impact on
dissolution speed.
126

Concentration DissolutionProfile Profile
CEO % (1 Dissolving Limited, C, --+ Cb z 0
R =kdC (A +AP)Acan be obtained from microCT
Cmeasurement and analysis.C
Ct
C %CConvective Diffusion Limited, C, -- C,
C
IR = BCA
In this case tablet microstructure hasmuch less impact on dissolution rate.
6 t*Color Indicates tablets of different strength
Figure 5-7 Dissolution model as controlled by rate-limiting steps.
5.2.4 Testing of the Novel Tablet Holder
Paddle dissolution with tablet holder (holder dissolution) is fine-tuned with
10% caffeine - lactose tablets. Initial testing in a prototype tablet holder demonstrated
linear dissolution of the retained tablet through 90% completion. In a standard paddle
dissolution testing, a three-stage dissolution process was observed, with initial linear
dissolution (0-10 min) followed by collapse-induced rapid dissolution (10-13 min) and
then a final stage leveling off (14-20min) (Figure 5-8). It appears that the holder test
successfully achieved more consistent dissolution speed by controlling the
hydrodynamics near the tablet surface and exposure area of the tablet enclosed.
However, when the holders are manufactured and tested in larger numbers, significant
inconsistency in dissolution profile was observed (Figure 5-9). During dissolution,
bubbles could be seen leaking out of tablet sidewalls from behind the tablet. Total
collapse of tablet happens at various time points of the dissolution process. It was
concluded that a hydrodynamic pressure induced by paddle agitation is pushing air
bubbles trapped behind the holder to squeeze through the interface between tablet
127

sidewall and holder, weakening the tablet structure as well as changing hydrodynamics
surrounding the tablets.
(A)
120.0%
1 100.0% ---- I!i
80.0%
60.0%0
0j 40.0%2. -- With Holder
-*-No Holder0.0%
0 10 20 30 40 50Time (MIN)
(B)
Figure 5-8 Paddle dissolution with and without tablet holder. (A) Experimental setup; (B)Dissolution profile comparison for 48N 10% Caffeine-90% Lactose tablets.
Waxing of Holder Sidewall/ Parafilm Wrapping of Tablet for Leakage Prevention
In order to generate a tight seal between the tablet and the holder wall, multiple methods
have been attempted, with wax sealing and partial parafilmTM (Pechiney Plastic
Packaging, Menasha, WI) wrapping being the most efficient ones. For wax sealing, bees
wax (Sigma-Aldrich), Carnauba wax (Sigma-Aldrich), or a combination of the two are
melted on a hot plate at 1 00C and applied to tablet hole sidewall with a cotton Q-tip.
128

The tablet is quickly pushed into the hole from the inner side of the holder. Multiple
trials identified bees wax as the best candidate amongst those tried, providing adequate
softness and cooling speed. Only the side wall and partial back of the tablet are waxed,
so the impact on dissolution of the tablet's exposed front side is minimal to none.
Dissolution of Caffeine Tablets with Holder - 120N, 1 week120% -
100%
80 0/
60%-
40% -
20 0/c
0 /C
120%
100%
80%
60%
40%
20%
0%
0 10 20 30 40 50 Time (min)
Figure 5-9 Inconsistent dissolution results with original tablet holder.
Caffeine Tablets with Waxed Holder - 120N, 1 week
......... .. ...... .....- ----.. .. . .. .. .
0 10 20 30
Time (min)
Figure 5-10 Dramatically enhanced consistency in holder dissolution with waxing.
129
-+-Tablet1-------- - - --------------------------------------- -=-Tablet2 - -
,-- Tablet3
-x- Tablet4
-*-Tablet6
-4-Tablet1-- Tablet2-+-Tablet3
-------------- ----- -x-Tablet4 ~-+-Tablet5
.............................................................................. - -- I --- --- -- ............................................................................. ................ .... .. .. .. ...................

Holder dissolution of the same caffeine tablets with wax sealing yields much more
consistent dissolution profiles with an average standard deviation of <5%, as shown in
Figure 5-10. No bubble leakage is observed. Dissolution is consistent and steady
through majority of the process. The tablet flat surface gradually retreated as dissolution
goes on, demonstrating a surface erosion dissolution process.
ParafilmTM wrapping is another effective method in preventing sidewall leakage. In this
case, tablet's curved sidewall is carefully wrapped with a parafilmTM strip, leaving only
the flat surfaces exposed. The tablet is then inserted into the tablet hole of the holder for
dissolution testing. In the holder dissolution of 50% compound-A tablets, parafilm m
wrapped tablets demonstrated consistent and reproducible dissolution patterns with an
average standard deviation of 1.6% (Figure 5-11). When compared with holder sidewall
waxing, parafilmTM wrapping of tablet is a lot more tedious and error-prone. In
subsequent tests where waxing technique was optimized, standard deviation was
controlled to be within 2%. As a result, most of the holder tests conducted in this study
were done with the use of a wax seal.
120.0%-
100.0% ----------------------------------------------
0 80.0%
0 .0 -- - - - - - - - - - - - ---------------------------------------
-+-Tablet1
40.0% ----------------------------..- -- Tablet0 'i-- Tablet3
-*-Tablet420.0% -------..--------------------------------- - --- - T a b let5
-+-Tablet60.0%
0 20 40 60 80
Time (min)
Figure 5-11 Consistent dissolution profiles in M50 holder test with parafilm wrapping.
130

Location of Holder in Dissolution Vessel
3.4cm
T -8.2cm
Holder Position: 8cm
4.4cm
Figure 5-12 Illustration of tablet holder position with 900ml medium in dissolution vessel.
As can be seen in Figure 1-9, only certain regions along the dissolution vessel sidewall
have a steady flow pattern. Therefore, the positioning of the tablet holder is very
important to achieve consistent hydrodynamics condition at the exposed surface of the
tablet. A position too close to the rotating paddle would be impacted by the turbulent
flow adjacent to the paddle, while a position too close to the dissolution medium upper
surface will be subjected to a surface effect of the flow.
Figure 5-12 illustrates the position of the holder in a 1-liter dissolution vessel filled with
900ml medium. The total height of the vessel is roughly 16 cm. Holder positions with
tablet center at 7, 8, and 10 cm away from the vessel bottom were tested with 10%
caffeine-lactose tablets (LOON strength, N=6) (Figure 5-13). The results showed that
dissolution at holder position of 8cm has the smallest average standard deviation of
1.11%. At holder position of 7cm, average standard deviation is slightly higher at 1.23%
but still very satisfactory. At holder position of 10cm, average standard deviation of
131
... .. ....... ................. w ................ .........................................................................

dissolution profiles is considerably higher at 1.64%. Overall speaking, 8cm from the
vessel bottom is the optimal position for tablet center and is used in the subsequent tests.
Holder Dissolution Test at Different Holder Positions
120%
100%
80%
60%
40%
20%
0%0 10 20 30 40
Time (min)50 60 70
Figure 5-13 Holder dissolution test at different holder position with 10ON caffeine tablets. N=6.
5.3 Holder Dissolution Study of Caffeine-Lactose Tablets
Holder dissolution was first utilized in understanding the dissolution mechanism of
caffeine-lactose tablets, starting with a typical dissolution setting of 900ml water, 37*C
water bath temperature, and 50 RPM paddle rotation speed. The 200mg tablets were
made from 10% caffeine (Sigma-Aldrich), 89.5% spray-dried lactose SuperTab@ 1 ISD
(DMV-Fonterra), and 0.5% magnesium stearate (Sigma-Aldrich). Tablets of six hardness
levels were tested, ranging from the softest 9N tablets to the hardest 120N ones.
132

..... ...c ..... uc........................c ........ ............
At 50 RPM, most tablets share the same120N 72N
dissolution profile in holder test, with only the
softest tablets exhibiting faster dissolution due to
disintegration (Figure 5-15 A). MicroCT analysis
shows that tablets with various hardness levels
have distinctive internal microstructure, with "N 24N
softer tablets possessing a higher number of larger
pores (Figure 5-14). Combined with the
theoretical model for holder dissolution described
in section 5.2.3, it is hypothesized that holder 12N 9N
dissolution speed of caffeine-lactose tablets at 50
RPM was limited by convective-diffusion.
Figure 5-14 MicroCT reconstructured cross sectionimages of caffeine-lactose tablets. 500umX500um.
In order to test the impact of hydrodynamics on dissolution profiles, paddle rotation
speed was increased to 100RPM (Figure 5-15 B). There is a general shift of dissolution
profiles toward left, indicating a higher dissolution speed under the more intensive
agitation condition. However, the profiles of tablets with different strength still do not
differentiate from each other, demonstrating convective-diffusion-limited dissolution at
100 RPM.
Although the dissolution medium was degassed right before dissolution tests (degassing
procedure described in section 2.3), there is still a risk of pre-existing air bubbles within
tablet microstructure to deter liquid penetration into the pores. In subsequent
experiments, 0.2% (w/v) sodium dodecyl sulfate (SDS, Sigma-Aldrich) was added as a
surfactant to dissolution medium, which should reduce the surface tension at the
solid-liquid interface and facilitate the wetting process (22). The addition of surfactant
did not help isolate the dissolution profiles, further confirming the convective-diffusion-
limited scenario for dissolution of lactose-caffeine tablets (Figure 5-15 C).
133

120.0% -
100.00/0 -
80.0%-
60.0%-
40.0%-
20.0%
0.0/
0
(A)120.0% -
100.0% -
80.0%-
60.0%-
40.0%-
20.0%-
0.0% '
(B) 0
120.0% r
100.00/a
80.00/
60.0%
40.0%
20.0%
Caffeine Tablets w/ Waxed Holder - 1 Month, 50RPM
10 20 30Time (min)
40 50 60
10 20 30 40 50 64Time (min)
Caffeine Tablets w/ Waxed Holder & 0.2% SDS, 100 RPM
-120N+72N
-- 48N+24N
-*-12N-9-9N
0.00/ V"0 10 20 30 40 50 60
(C) Time (m )
Figure 5-15 Holder dissolution test results of caffeine-lactose tablets. N=6.
134

A more quantitative analysis of the dissolution speeds further confirms the hypothesis
about dissolution mechanism. From the theoretical model for convective-diffusion-
limited dissolution, we have,
R = 0.687ADm3 r)'3(C, -G )
According to Blasius solution to a unidirectional flow parallel to the tablet surface, the
boundary layer thickness is proportional to the inverted square root of bulk flow speed
(23). Integrating the relationship back to the dissolution rate expression above, we find
that the dissolution rate is proportional to the square root of the bulk flow speed.
Assuming that the bulk flow speed at 100RPM is twice the flow speed at 50RPM, we
reach at the conclusion that dissolution speed at 100RPM should be 1.44 times the speed
at 50RPM, which is true for tablets from hardness levels of 120N to 12N (Figure 5-16).
In this case we are defining dissolution speed as the average % of dissolution progress
per minute for the first 60% of the whole process. The softest 9N tablets had higher
dissolution speed at 100 RPM due to a larger impact of mechanical stress applied on the
tablet. The addition of surfactant accelerated the dissolution process of softer tablets,
possibly by enhancing the wetting process and thus expediting disintegration.
Holder Dissolution Speed of 10% Caffeine Tablets, N=6
12
-4-50RPM-u-IOORPM
- 8 -,.-1OORPM w/ SDS - - --+ 5ORPM *1.440.
c*60
40
120 72 48 24 12 9Tablet Strength (N)
Figure 5-16 Comparison of caffeine-lactose holder dissolution speeds at various settings.
135
.............................. ........................................................... ...... --_ _ ........ ... ..... ...... ...................... ........................................ .................... ..... ......... .... ............................... ......... ............

Based on the experiments and analyses shown above, we can conclude that 10%
caffeine-lactose tablets go through convective-diffusion-limited dissolution in holder
dissolution test. As demonstrated in Chapter 2, caffeine-lactose tablets of different
strengths show distinctive dissolution profiles in standard paddle dissolution test. Based
on the design of the holder and observation of the dissolution processes, it is
hypothesized that disintegration induced by medium penetration leads to the differential
dissolution speeds in standard paddle test. In Chapter 6, numerical simulations with
microCT-acquired tablet microstructure would help confirm this hypothesis.
5.4 Holder Dissolution Study of Compound-A Roller-Compacted Tablets
In holder dissolution study of compound-A roller-compacted tablets, one additional
dimension, the loading percentage of compound-A in the formulation, is considered and
evaluated. Standard paddle dissolution and holder dissolution were performed for 200mg
M-series formulation roller-compacted tablets M1O/M30/M50/M70, as described in
Chapter 4. The tests were conducted with 900ml 0.0iN HCl solution as dissolution
medium, a 37"C water bath and 50RPM paddle rotation speed.
The findings are presented in Figure 5-17 and Figure 5-18. The M10 tablet dissolution
profiles resemble those of 10% caffeine tablets, with similar profiles in holder dissolution
but very different profiles in standard paddle dissolution. It confirms the convective-
diffusion-limited dissolution for lactose dominant tablets. In M30 tablets, holder
dissolution profiles show a small sign of divergence, while paddle dissolution profiles
converge slightly. As demonstrated in Chapter 4, the dominant structure in M30 is still
lactose, but the presence of more compound-A could partially deter medium access to
some of the pore space, resulting in smaller dissolution speed differences (brought by
disintegration). In M50 and M70 tablets, holder dissolution profiles continue to diverge,
indicating a surface-dissolving-limited scenario for tablets with compound-A dominant
structure. The paddle dissolution profiles for M50 and M70 are similar, with 1OON
tablets dissolving considerably slower than the others.
136

Holder Test M10
0 20 40 60Time (min)
M10
.204..
80 100
Paddle Test M10
120.0%
100.0%
80.0%
60.0%
40.0%
20.0%
0.0%0 20 40
Time (min)
Holder Test M30 M30 Paddle Test
120.0%
100.0%
80.0%
60.0%
40.0%
20.0%
0.0%
M30
0 50 100 150 200 0 20 40Time (min) Time (min)
Figure 5-17 Holder and paddle dissolution results of M1O/M30 compound-A tablets. 900ml O.O1N HCl, 50RPM. N=12.
137
120.0%
100.0%
80.0%
60.0%
40.0%
20.0%
0.0%
120.0%
100.0%
80.0%
60.0%
40.0%
20.0%
0.0%

Holder Test M50 M50120.0%
100.0%
80.0%
60.0%
40.0%
20.0%
0.0%0 20 40 60
Time (min)80 100
Paddle Test N50
0 20 40Time (min)
Holder Test M70 M70 Paddle Test
120.0%
100.0%
80.0%
60.0%
40.0%
20.0%
0.0%
M70
0 20 40 60 80 100 0 20 40Time (min) Time (min)
Figure 5-18 Holder and paddle dissolution results of M50/M70 compound-A tablets. 900ml 0.01N HCl, 50RPM. N=12
138
120.0%
100.0%
80.0%
60.0%
40.0%
20.0%
0.0%
120.0%
100.0%
80.0%
60.0%
40.0%
20.0%
0.0%
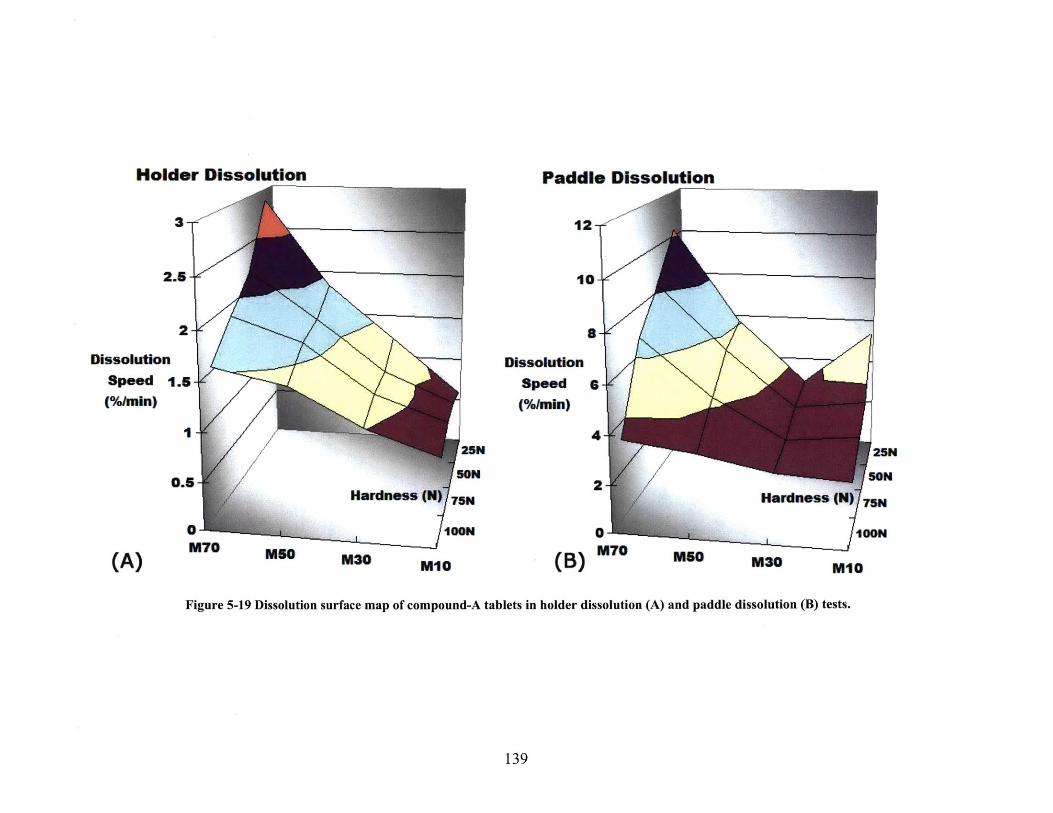
Holder Dissolution
3-
2.5 -
DissolutionSpeed I.s
(%lnin)
0.6H
0M70 M50 M
I 25NSON
gOON
M10
Paddle Dissolution
12
10
Dissolution
Speed 6
(%/min)
2Ho
(B) M70 M50 M3
Figure 5-19 Dissolution surface map of compound-A tablets in holder dissolution (A) and paddle dissolution (B) tests.
139
f25N
SON
looN
M10

In this study, we define a dissolution surface map as dissolution speed plotted against
tablet composition and tablet strength. The dissolution surface maps for paddle test and
holder test of compound-A tablets give us a thorough overview of the dissolution
characteristics (Figure 5-19). In general, the more compound-A, the faster the dissolution
is. However, M10 dissolution is faster than M30 in paddle test. A logical explanation
from the microCT data is that the compound-A in M30 deters liquid access to the pore
network of the lactose, delaying disintegration from happening. The M10 paddle
dissolution speed curve is upward, compared with the flat curve in holder dissolution,
indicating that the impact of medium-penetration-induced disintegration is an important
driver in standard paddle dissolution. We can also see that the more compound-A, the
steeper the dissolution speed curve, again indicating a surface-dissolving-limited scenario
for compound-A dominant tablets. Useful leamings can be drawn from the data. For
lactose dominant formulation, the most important measure to enhance dissolution rate is
to promote disintegration. When used in combination with other excipients that undergo
plastic densification, lactose pore network interconnectivity could be reduced, resulting in
less disintegration and slower dissolution. For compound-A dominant formulation,
maximizing the surface area available for dissolution is crucial to achieving faster
dissolution speed. At high compound-A loadings, a compromise between hardness and
dissolution rate needs to be made. An adequate hardness level should be the lowest to
allow enough strength for the tablet to sustain packaging, handling, and transportation
induced stress.
As mentioned above, paddle dissolution of 1 OON M70 tablets is considerably slower than
that for M70 tablets of other strengths. During the dissolution process, it was observed
that 1 OON tablets tended to sink at the vessel bottom without changing position
significantly, 75N tablets swung around the bottom within a circle of -4 cm in diameter,
50N/25N tablets first floated in the medium, but then sank and swung around the bottom.
The hypothesis is that 1 OON tablet dissolution is much slower because it mainly happens
from the curved side wall and the upper flat surface, in which case we define the
dissolution process to be in sink scenario (we are not using "sink condition" as it has
140

different meaning in dissolution). We also define the dissolution of floating or swinging
tablets to be in floating scenario, where dissolution happens from all the surfaces.
Since dissolution only happens from one flat tablet surface in the holder test, we can first
calculate the effective dissolution rate per unit surface area and then derive the equivalent
dissolution rate in sink or floating scenarios (Figure 5-20). The converted dissolution
rates can then be compared with the standard paddle dissolution rates. For the same
dissolution scenario, this is effectively comparing dissolution speeds under two sets of
hydrodynamics condition.
Dissolution Data Con
Holder Scenario Original data
Sink Scenario Holder to I flat + side
Floating Scenario Holder to 2 flats + side
Figure 5-20 Illustration of different dissolution scenarios and correspondent data conversionmethods.
As shown in Table 5-1, dissolution speed of 100N tablet in holder-converted sink
scenario (green) agrees very well with that in standard paddle test condition (yellow),
while dissolution speeds of tablets with other hardness in holder-converted floating
scenario (green) agree well with those in standard paddle test condition (yellow). This
observation confirms our hypothesis about the dissolution scenarios. It also further
illuminates the surface-dissolving-limited nature of compound-A dominant tablets in the
current dissolution settings, as the dissolution speeds per unit surface area under different
hydrodynamics conditions are the same. Tablet density was hypothesized to be the
primary driver for different dissolution scenarios. The bulk density of M70 1OON tablets,
1.15 g/ml, is 15% higher than the 1 g/ml density of the dissolution medium, while the bulk
141
.... ...... ...... ........... . ....... .... .......... . .......

density of 75N tablets, 1.04 g/ml and 4% higher than that of medium, was not sufficient
to withstand the agitation of a dissolution paddle rotating at 50 RPM.
Table 5-1 Comparison between dissolution speeds of standard paddle test and converted holder test.
M70 Standard Holder Holder to Holder to DensityTablets Test Speed 1 flat + 2 flats +Target Speed (%/min) side side (g/ml)
Hardness (%/min) (%/min) (%/min)
1OON 3.33 1.54
75N 6.67 1.88 4.50
50N 8.22 2.18 5.45
30N 10.34 2.86 7.36
1.15
1.04
0.99
0.92
In order to test the hypothesis about density in a broader setting, a value between the bulk
density of 1 OON and 75N M70 tablets, 1.1 Og/ml at 10% higher than dissolution medium
density, is adopted as a threshold for determining dissolution scenarios. Any tablet with
bulk density below this value is assumed to be in floating scenario, and any tablet above
this is assumed to be in sink scenario. All the compound-A tablets with different drug
loadings can be classified into the two categories based on the threshold (Figure 5-21).
In order to compare equivalent dissolution speeds under two different hydrodynamics
conditions, i.e., in the tablet holder and at the vessel bottom, holder dissolution speeds for
all the tablets are converted to speeds of correspondent dissolution scenarios. A
comparison between the standard paddle dissolution speeds and the converted holder
dissolution speeds is done by subtracting the latter from the former and plotting the
differential dissolution surface map (Figure 5-22). For M50/M70, the differential speeds
are mostly near the zero point, indicating that both tablets are surface-dissolving-limited
in the tests. For M10, the differential speeds are higher than zero and goes up with
decreasing strength, indicating the impact of disintegration via medium penetration. For
M30, even though lactose is assuming a relatively large volumetric portion of the tablet,
the presence of significant amount of compound-A is deterring pore access and
preventing massive disintegration.
142

120-
100-
80 -
60 -
40--
20-
0-
+-M1O -+-M30
+M50 -+ M70- -- - - - --- - -- -- --
-o-a-i---- r
Floating Scenario
------------------------------------
Sink Scenario
0.8 1 1.2 1.4Bulk Density (g/ml)
Figure 5-21 Thresholding of compound-A tablets into sink or floating dissolution scenarios.
PaddleSpeed
HolderConverted
Speed(%/min)
50N
M30M10
10ON
Figure 5-22 Differential dissolution speed surface map of paddle test and converted holder test.
143
z
0C
M
. ......... ............................................................... -

5.5 Summary
A novel tablet holder was designed as a piece of simple accessory for paddle dissolution
test in aiding dissolution mechanism investigation. After a series of alterations in holder
design and testing method, the holder helped establish a consistent dissolution scenario
within the paddle dissolution settings, where disintegration due to medium penetration
and tablet swelling is suppressed. The surface dissolution process with the holder was
described with a physical/mathematical model. Two surface dissolution mechanisms,
surface-dissolving-limited dissolution and convective-diffusion-limited dissolution, were
identified and characterized.
In holder dissolution study of 10% caffeine-lactose tablets, it was demonstrated that
convective diffusion is the rate limiting step in the typical dissolution settings tested. The
tablets exhibited similar dissolution profiles, except for the softest tablets with significant
disintegration. In contrast, caffeine-lactose tablets of different strengths exhibited
distinctive dissolution profiles in regular paddle tests, indicating that disintegration
induced by medium penetration and tablet swelling played important roles in expediting
paddle dissolution of these tablets.
The dimension of holder dissolution study was then expanded to include compound-A
roller compacted tablets with various drug loadings and mechanical strengths. Unlike
that for caffeine-lactose tablets, paddle dissolution for compound-A dominant tablets
(M50/M70) is limited by the surface dissolving process, to which the available surface
area at solid-liquid interface is key to a faster dissolution process. The dissolution speed
per unit surface area for those tablets is the same under different hydrodynamics
conditions within the paddle dissolution setup. A compromise between hardness and
dissolution rate must be made for compound-A dominant tablets. An adequate hardness
level should be the lowest to allow enough strength for the tablet to sustain packaging,
handling, and transportation induced stress.
144

It was also discovered that dissolution could happen in sink scenario or floating scenario,
with a threshold of tablet bulk density at 110% of dissolution medium density. This is
easily overlooked during formulation development and could lead to inconsistent
dissolution profiles should tablet density be set near the threshold and shift from batch to
batch. The differential dissolution speed surface map is a powerful tool in understanding
the critical role of disintegration for lactose dominant tablets (M10). In addition, it
demonstrates that the porosity network connectivity is probably essential to disintegration
induced by medium penetration, as M30 paddle dissolution is slower than that of M10
potentially due to the blockage of pore network access by the significant presence of
compound-A.
Through the case studies described in this chapter, we have demonstrated that the novel
tablet holder is a great addition to the toolbox of pharmaceutical scientists. When used
appropriately, it could help dissect dissolution mechanism of pharmaceutical tablets,
yielding critical information for guidance of rational formulation development.
145
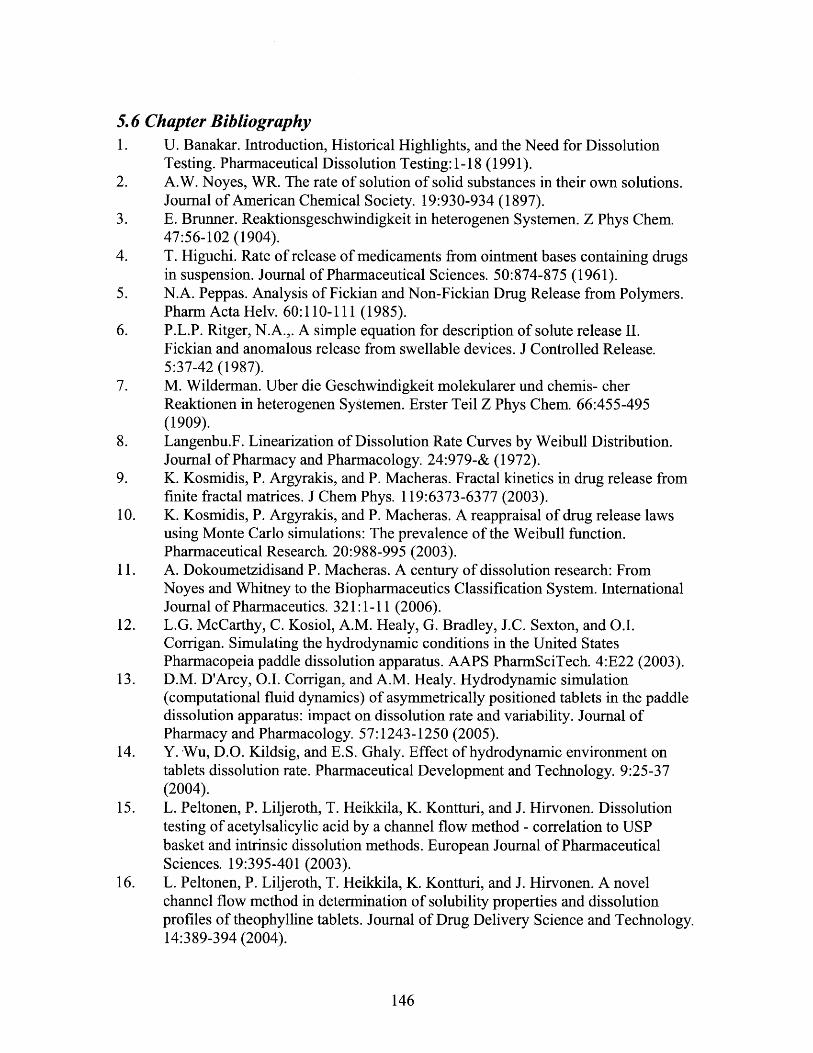
5.6 Chapter Bibliography1. U. Banakar. Introduction, Historical Highlights, and the Need for Dissolution
Testing. Pharmaceutical Dissolution Testing:1-18 (1991).2. A.W. Noyes, WR. The rate of solution of solid substances in their own solutions.
Journal of American Chemical Society. 19:930-934 (1897).3. E. Brunner. Reaktionsgeschwindigkeit in heterogenen Systemen. Z Phys Chem.
47:56-102 (1904).4. T. Higuchi. Rate of release of medicaments from ointment bases containing drugs
in suspension. Journal of Pharmaceutical Sciences. 50:874-875 (1961).5. N.A. Peppas. Analysis of Fickian and Non-Fickian Drug Release from Polymers.
Pharm Acta Helv. 60:110-111 (1985).6. P.L.P. Ritger, N.A.,. A simple equation for description of solute release II.
Fickian and anomalous release from swellable devices. J Controlled Release.5:37-42 (1987).
7. M. Wilderman. Uber die Geschwindigkeit molekularer und chemis- cherReaktionen in heterogenen Systemen. Erster Teil Z Phys Chem. 66:455-495(1909).
8. Langenbu.F. Linearization of Dissolution Rate Curves by Weibull Distribution.Journal of Pharmacy and Pharmacology. 24:979-& (1972).
9. K. Kosmidis, P. Argyrakis, and P. Macheras. Fractal kinetics in drug release fromfinite fractal matrices. J Chem Phys. 119:6373-6377 (2003).
10. K. Kosmidis, P. Argyrakis, and P. Macheras. A reappraisal of drug release lawsusing Monte Carlo simulations: The prevalence of the Weibull function.Pharmaceutical Research. 20:988-995 (2003).
11. A. Dokoumetzidisand P. Macheras. A century of dissolution research: FromNoyes and Whitney to the Biopharmaceutics Classification System. InternationalJournal of Pharmaceutics. 321:1-11 (2006).
12. L.G. McCarthy, C. Kosiol, A.M. Healy, G. Bradley, J.C. Sexton, and 0.1.Corrigan. Simulating the hydrodynamic conditions in the United StatesPharmacopeia paddle dissolution apparatus. AAPS PharmSciTech. 4:E22 (2003).
13. D.M. D'Arcy, 0.1. Corrigan, and A.M. Healy. Hydrodynamic simulation(computational fluid dynamics) of asymmetrically positioned tablets in the paddledissolution apparatus: impact on dissolution rate and variability. Journal ofPharmacy and Pharmacology. 57:1243-1250 (2005).
14. Y. Wu, D.O. Kildsig, and E.S. Ghaly. Effect of hydrodynamic environment ontablets dissolution rate. Pharmaceutical Development and Technology. 9:25-37(2004).
15. L. Peltonen, P. Liljeroth, T. Heikkila, K. Kontturi, and J. Hirvonen. Dissolutiontesting of acetylsalicylic acid by a channel flow method - correlation to USPbasket and intrinsic dissolution methods. European Journal of PharmaceuticalSciences. 19:395-401 (2003).
16. L. Peltonen, P. Liljeroth, T. Heikkila, K. Kontturi, and J. Hirvonen. A novelchannel flow method in determination of solubility properties and dissolutionprofiles of theophylline tablets. Journal of Drug Delivery Science and Technology.14:389-394 (2004).
146

17. F.a.D. Administration. Guidance for industry: Dissolution testing of immediaterelease solid oral dosage forms, 1997.
18. FDA. Guidance for Industry: Bioavailability and bioequivalence studies for orallyadministered drug products-General Considerations. (2003).
19. D.M. D'Arcy, B. Liu, G. Bradley, A.M. Healy, and 0.1. Corrigan. Hydrodynamicand Species Transfer Simulations in the USP 4 Dissolution Apparatus:Considerations for Dissolution in a Low Velocity Pulsing Flow. PharmaceuticalResearch. 27:246-258 (2010).
20. R.K. Sinnott. Coulson & Richardson's Chemical Engineering. Vol. 6: ChemicalEngineering Design, Butterworth-Heinemann, p. 473.
21. S. Neervannan, J.D. Reinert, V.J. Stella, and M.Z. Southard. A NumericalConvective-Diffusion Model for Dissolution of Neutral Compounds underLaminar-Flow Conditions. International Journal of Pharmaceutics. 96:167-174(1993).
22. W. Sun, C.K. Larive, and M.Z. Southard. A mechanistic study of danazoldissolution in ionic surfactant solutions. Journal of Pharmaceutical Sciences.92:424-435 (2003).
23. H. Blasius. Grenzschichten in Flussigkeiten mit kleiner Reibung. Z Math Phys.56:1-37 (1908).
147

148

Chapter 6 Microstructure Characterization andNumerical Simulation of Liquid Intrusion
In Chapter 4 we have introduced a microCT scanning method and procedures for general
characterization of tablet microstructure. In this chapter, we describe detailed
examination of microstructural features for a caffeine-lactose tablet. Based on the results,
numerical simulation was adopted to understand liquid penetration into tablet
microstructure. Permeability for microstructure could be derived from the simulation
results, which greatly enhances our understanding of the dissolution process.
6.1 Characterization of Throats and Pores in a Tablet PorosityNetwork
Tablet microstructure contains abundant information about the way a tablet is formed and
how that would affect tablet properties. The difficult part is extracting and organizing the
information so that it could be used as guidance for rational formulation / process design
and operations management. In this session we describe a detailed procedure to
reproduce tablet internal structure with representative structural modules, unveiling the
characteristics for reference of further quantitative analysis. For detailed steps and codes,
please refer to Appendix B.
The sample studied is a 100 ptm cubic of 96N 10% caffeine-lactose tablet microstructure.
The original microCT scan was done at 1.4 ptm/pixel. A 4X upsampling procedure is
conducted to smooth the internal structure and gain a certain level of additional resolution
(Figure 6-1). This is done by inserting 3 extra voxels between each pair of neighboring
voxels, with the gray scale values set at equal distance. In the next step, pore spaces are
separated from the materials through the same binarization procedure as described in
Chapter 4. After obtaining the pore space, a procedure called skeletonization is carried
out by eroding the pore structure until only a single-pixel-wide backbone line is left for
each pore. This creates a network demonstrating the connectivity patterns of the pore
structure (Figure 6-2). The pores in this lactose dominant tablet are highly
inter-connected according to the pattern shown.
149

Original, 100 pm cubic, 1.4 pm/pixel
Upsampling of luminosity value 35 30 2Figure 6-1 Upsampling by 4X smooths out internal pore structure.
Figure 6-2 Skeletonization reveals the backbone structure and connectivity patterns of the pore space.
150
Upsampled, 0.35 pm/pixel

A distance map is then computed for the pore space, with the value assigned to a voxel
equal to its minimum distance from an edge of the pore space (Figure 6-3). This
procedure combined with skeletonization allows the extraction of thickness information
for the pore network, as the backbone voxels on the distance map have the highest
distance values relative to neighboring voxels. Ball-shape clusters with diameters
proportional to the distance value can be built on the backbones, forming a 3-D
representation of the internal microstructure (Figure 6-4).
Figure 6-3 Distance map allows extraction of pore network thickness information.
Figure 6-4 Representation of tablet microstructure with ball-shaped clusters. Green: throats; red:pores; sample size: 50 sm cubic.
151
............................................................................ . ................................................ ............................................................................ .... .......... .. .......... .. .. . .. .... .. ...................... .. .. ................. ........................ ......... ...... ... ........ .
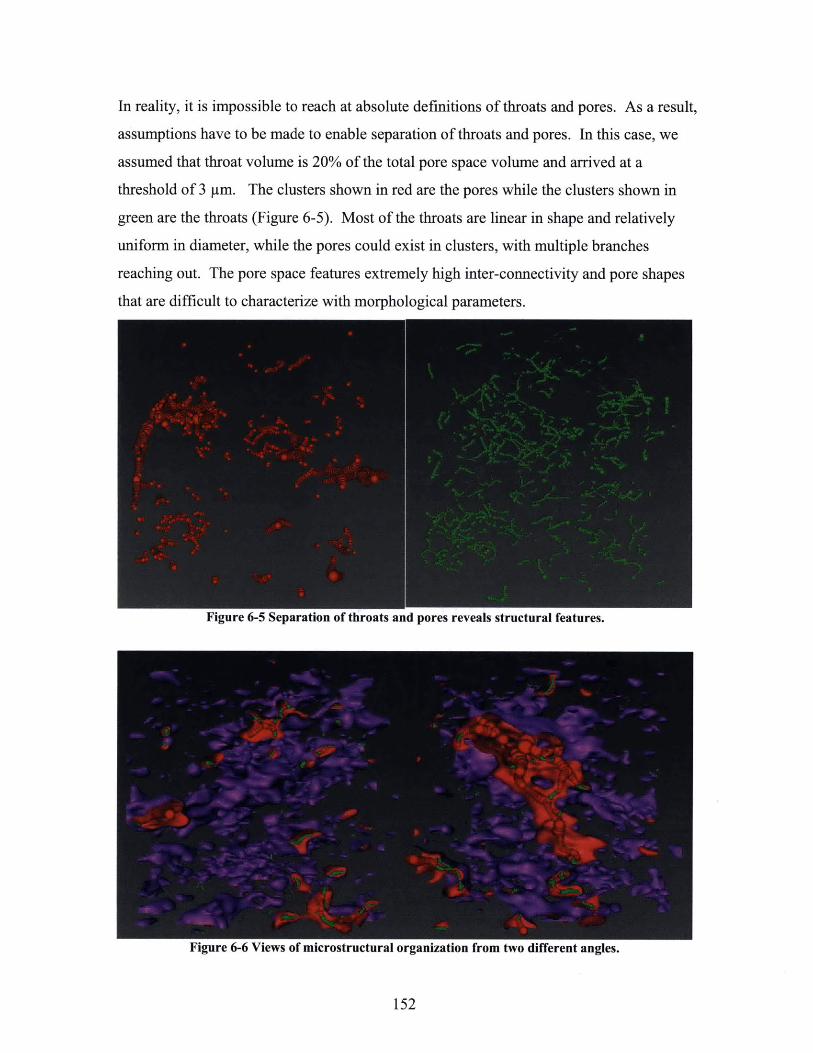
In reality, it is impossible to reach at absolute definitions of throats and pores. As a result,
assumptions have to be made to enable separation of throats and pores. In this case, we
assumed that throat volume is 20% of the total pore space volume and arrived at a
threshold of 3 pm. The clusters shown in red are the pores while the clusters shown in
green are the throats (Figure 6-5). Most of the throats are linear in shape and relatively
uniform in diameter, while the pores could exist in clusters, with multiple branches
reaching out. The pore space features extremely high inter-connectivity and pore shapes
that are difficult to characterize with morphological parameters.
Figure 6-5 Separation of throats and pores reveals structural features.
Figure 6-6 Views of microstructural organization from two different angles.
152

A surface view can be generated for the pore space and overlapped with the internal
structure, which allows direct examination of the arrangement of throats and pores. It
also reveals a generally flattened pore shape. As tablet compaction was done from the
top, this data suggests a perpendicular relationship between compaction direction and
pore orientation.
6.2 Numerical Simulation of Liquid Intrusion into Tablet
With microCT-captured tablet microstructure, there are in general two ways to utilize it
for quantitative analysis. First, a microstructure can be converted into a binarized 3-D
dataset representing the allocation of pores and materials, which is then used in numerical
simulations to understand tablet properties. Potential applications include the study of
dissolution process, e.g. penetration of dissolution medium into tablet internal structure,
and the study of tablet hardness, e.g. propagation of force within the material matrix.
Second, characteristics of the microstructure can be defined, quantitatively described, and
incorporated into theoretical / empirical models to understand and predict tablet
properties.
The microstructure of caffeine-lactose tablet reveals a pore shape with multiple branches
and interconnections, making proper definition of pore morphology parameters a difficult
task. On the other side, numerical simulation of liquid penetration and calculation of
permeability, an intrinsic material property, becomes an attractive option to understand
dissolution.
6.2.1 Methodology of Liquid Penetration Simulation
Numerical simulation of liquid penetration found its earliest applications in geosciences,
where it was used to explore transport properties of fluid-saturated rocks (1). A number
of studies have been conducted to solve linear-Stokes or Navier-Stokes equations of fluid
flow in rock microstructures (2-6). In this study, we present for the first time an
153

application of the methodology in understanding tablet microstructure permeability and
dissolution properties.
Navier-Stokes equation has been widely used in describing fluid flow based on the
assumption that it is always a continuum (7). For a slow incompressible laminar flow,
the equation has a linear format:
V V(F) =0
Where 17 and p are local velocity vector and pressure field at position F. The first
equation describes that the flow is driven by pressure gradient and is related with the
viscosity of the fluid; the second equation refers to the incompressible nature of the flow.
For the purpose of simulation on tablet microCT structure, we modified a Stokes solver
developed by National Institute of Standards and Technology (NIST) based on finite
difference scheme (8). The solver was developed in conjunction with the artificial
compressibility relaxation algorithm (9) and was originally applied to understand
permeability and microstructure of cement (5). For details of the modification and
execution steps, please refer to Appendix A.
In brief, microCT gray-scale structure is first binarized via thresholding, with materials
taking value 1 and pores taking value 0. The binarized structure is then converted with a
set of C language code into a marker-and-cell mesh, where pressures are defined at the
nodes (center of each voxel) and fluid velocity components are defined at the midpoint of
the bonds connecting nearest neighbor nodes (Figure 6-7). The simulation is set up as
shown in Figure 6-8. Two boundary conditions are utilized in the simulation. A pressure
gradient is applied on two sides of the sample, providing a driving force for liquid flow.
A zero velocity is further assumed at solid-pore interfaces. All the pores are assumed to
be filled up with liquid, and the flow speeds at four planes of the sample are calculated.
When the four speeds converge, steady state is considered to be reached.
154

Figure 6-7 Illustration of mesh-and-cell arrangement for simulation. Adapted from Bentz et al. 2007.
a 0 a I
Boundary conditions:
(1) Pressure gradient P0=0 P1 Liquid
(2) Zero velocity at 4-solid-pore interface
V1 V2 V3 V4Figure 6-8 Illustration of simulation setup.
According to Darcy's law that describes fluid flow through a porous material (10), we
have,
k APU -
r7 L
Where u is the average liquid velocity in the direction of pressure gradient, k is the
permeability of the materials, q is the viscosity of the liquid, AP is the pressure gradient,
and L is the length of the material in the direction of pressure gradient. A specific way to
write the equation in the context of this simulation is,
k = -- (PixelResolution)2Re
155
-- A ............ ..
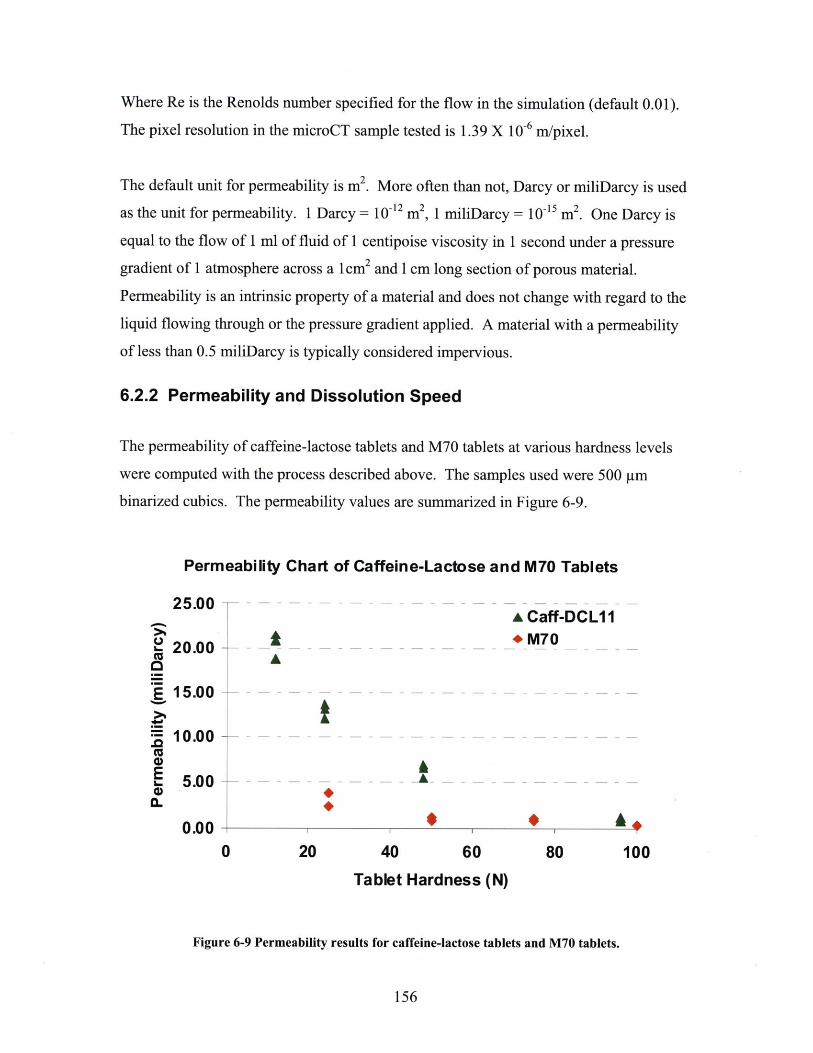
Where Re is the Renolds number specified for the flow in the simulation (default 0.01).
The pixel resolution in the microCT sample tested is 1.39 X 10~6 r/pixel.
2
The default unit for permeability is m . More often than not, Darcy or miliDarcy is used
as the unit for permeability. 1 Darcy = 10~42 M2 , 1 miliDarcy = 10-15 M2 . One Darcy is
equal to the flow of 1 ml of fluid of 1 centipoise viscosity in 1 second under a pressure
gradient of 1 atmosphere across a 1cm2 and I cm long section of porous material.
Permeability is an intrinsic property of a material and does not change with regard to the
liquid flowing through or the pressure gradient applied. A material with a permeability
of less than 0.5 miliDarcy is typically considered impervious.
6.2.2 Permeability and Dissolution Speed
The permeability of caffeine-lactose tablets and M70 tablets at various hardness levels
were computed with the process described above. The samples used were 500 pm
binarized cubics. The permeability values are summarized in Figure 6-9.
Permeability Chart of Caffeine-Lactose and M70 Tablets
25.00 -
20.00 -
E 15.00 -
10.00 -.0
E 5.00-0.
0.00
A Caff-DCLI 1* M70
0 20 40
Tablet60
Hardness
80 100
(N)
Figure 6-9 Permeability results for caffeine-lactose tablets and M70 tablets.
156
A
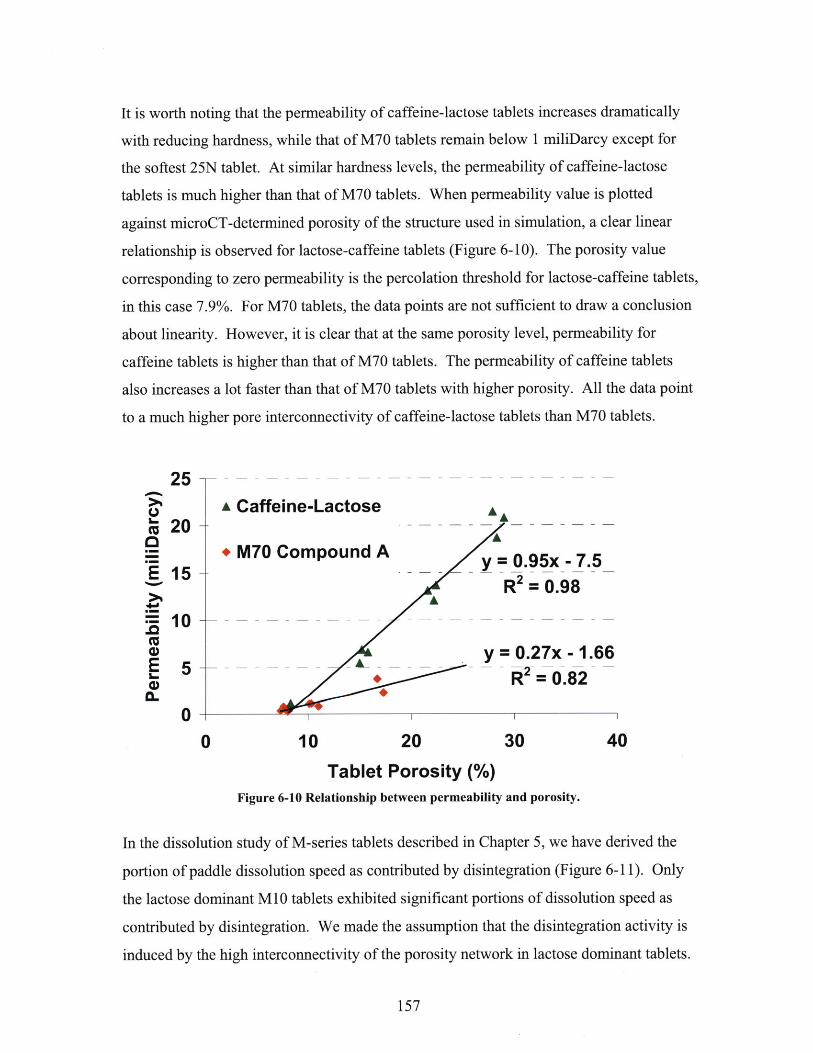
It is worth noting that the permeability of caffeine-lactose tablets increases dramatically
with reducing hardness, while that of M70 tablets remain below 1 miliDarcy except for
the softest 25N tablet. At similar hardness levels, the permeability of caffeine-lactose
tablets is much higher than that of M70 tablets. When permeability value is plotted
against microCT-determined porosity of the structure used in simulation, a clear linear
relationship is observed for lactose-caffeine tablets (Figure 6-10). The porosity value
corresponding to zero permeability is the percolation threshold for lactose-caffeine tablets,
in this case 7.9%. For M70 tablets, the data points are not sufficient to draw a conclusion
about linearity. However, it is clear that at the same porosity level, permeability for
caffeine tablets is higher than that of M70 tablets. The permeability of caffeine tablets
also increases a lot faster than that of M70 tablets with higher porosity. All the data point
to a much higher pore interconnectivity of caffeine-lactose tablets than M70 tablets.
25 -A Caffeine-Lactose A
L20 - - - - -
2 * M70 Compound Auy = 0.95x - 7.5
E 15- -R2 = 0.98
I. A
10 -.0
4 y 0.27x - 1.66E 5 -- - - - - - - -- - - - - --L+ R = 0.82
0
0 10 20 30 40
Tablet Porosity (%)Figure 6-10 Relationship between permeability and porosity.
In the dissolution study of M-series tablets described in Chapter 5, we have derived the
portion of paddle dissolution speed as contributed by disintegration (Figure 6-11). Only
the lactose dominant M10 tablets exhibited significant portions of dissolution speed as
contributed by disintegration. We made the assumption that the disintegration activity is
induced by the high interconnectivity of the porosity network in lactose dominant tablets.
157
................................ . ............ ..... ..........

5.00*4.00 -5.00
3.00 -4.oo 4.0002.00 -3.00
01.oo -2.oo 3.0000.00 -1.00
0-1.oo -0.001-2.00 --1.00
1.00
0.00Dissolution
Speed -1.00(/Ilmin) -2.00 Hardness (N) 5ON
M70OM70 M50 M30 100I ON
Figure 6-11 Portions of paddle dissolution speed as driven by disintegration for M-series tablets.
According to our assumptions, the paddle dissolution speed of caffeine-lactose tablets
should be divided into two portions, disintegration speed and surface dissolution speed.
The disintegration portion is related with permeability and material physical properties.
When the paddle dissolution speed for caffeine-lactose tablets is plotted against the
square of permeability, a linear relationship is observed within the normal 9mm tablet
hardness range of 24N - 96N (Figure 6-12). The 12N data point was not adopted for two
reasons. Firstly, for a tablet as soft as 12N, the mechanical stress induced by local
hydrodynamics would contribute significantly to the dissolution speed. This effect is
neither common for a tablet with normal strength nor considered in our model. From the
data the mechanical stress is seemingly contributing to one-third of the overall dissolution
speed. Secondly, the variation of both dissolution speed and permeability measurement
in 12N tablets is very high, rendering the data point unreliable.
158
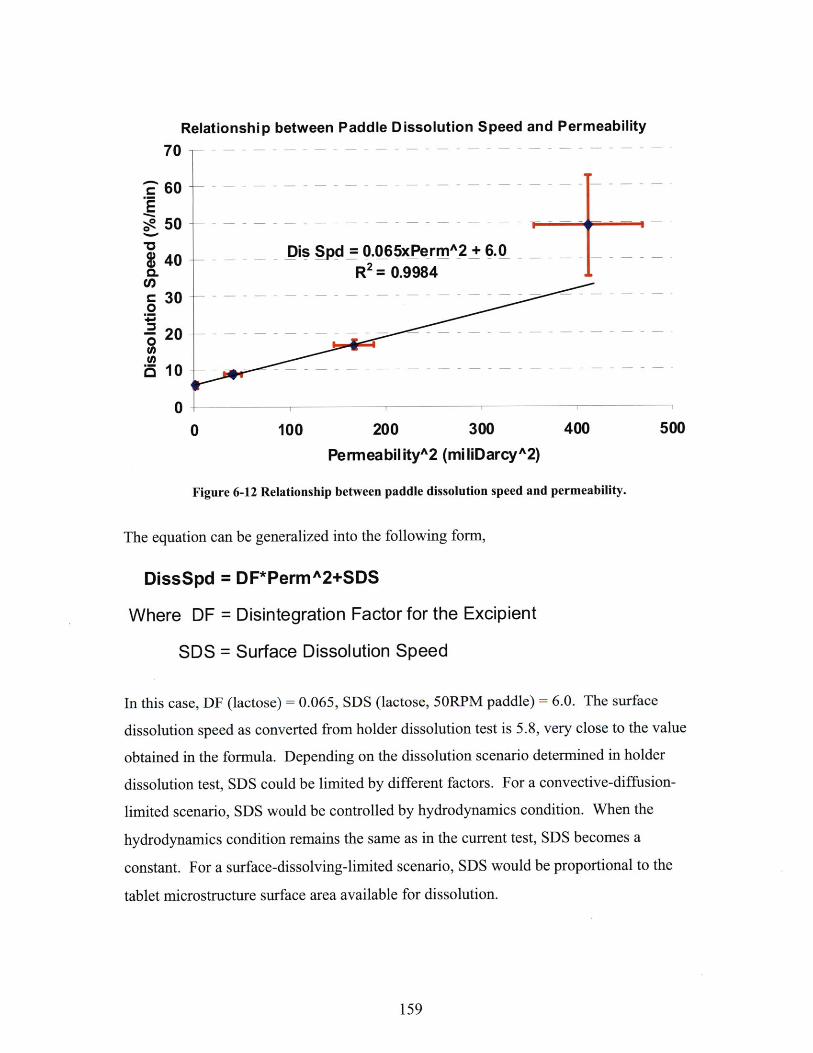
Relationship between Paddle Dissolution Speed and Permeability70 -
'Z 60
~50
4 Dis Spd = 0.065xPermA2 + 6.0S4 R2 = 0.9984
Cl)r 300
0
00 100 200 300 400 500
PermeabilityA2 (miliDarcyA2)
Figure 6-12 Relationship between paddle dissolution speed and permeability.
The equation can be generalized into the following form,
DissSpd = DF*PermA2+SDS
Where DF = Disintegration Factor for the Excipient
SDS = Surface Dissolution Speed
In this case, DF (lactose) = 0.065, SDS (lactose, 50RPM paddle) = 6.0. The surface
dissolution speed as converted from holder dissolution test is 5.8, very close to the value
obtained in the formula. Depending on the dissolution scenario determined in holder
dissolution test, SDS could be limited by different factors. For a convective-diffusion-
limited scenario, SDS would be controlled by hydrodynamics condition. When the
hydrodynamics condition remains the same as in the current test, SDS becomes a
constant. For a surface-dissolving-limited scenario, SDS would be proportional to the
tablet microstructure surface area available for dissolution.
159
.. .. ......... ............................ .. .... ... ... . ................. .... ..... ...... ................

It is worth noting that although the formula was found to be applicable to caffeine-lactose
tablets, the validity for general application will need to be determined by studying more
formulation systems. Nevertheless, it provides a novel framework for quantitatively
dissecting the dissolution mechanism and understanding the drivers, paving the way for
rational formulation design.
6.2.2 Comparison with Permeability by Mercury Porosimetry
In order to evaluate the accuracy of permeability calculation via microCT numerical
simulation, we measured the permeability of tablets from the same batches using mercury
porosimetry.
For caffeine-lactose tablets, mercury porosimetry derived permeability is lower than
simulation derived permeability except for the softest 12N tablet (Figure 6-13). We
believe that mercury porosimetry systematically underestimates the permeability levels
for caffeine-lactose tablets, as at the levels indicated for 48N and 96N tablets there should
be no disintegration happening. In actual paddle dissolution process, disintegration was
observed for tablets of both strengths, especially the 48N ones. The underestimation in
permeability by mercury porosimetry could be related to the underestimation of pore
diameter, which is used in the calculation of permeability.
For M70 tablets, the advantage of permeability calculation via numerical simulation
becomes obvious. The values obtained are not only consistent in trend (with higher
permeability for softer tablets), but also agree well with experimental observation. The
permeability values obtained by mercury porosimetry are not convincing, with erroneous
readings for 25N and 50N tablets. Mercury porosimetry was inadequate to characterize
permeability for M70 tablets, whose pore space is much less interconnected than that for
caffeine-lactose tablets.
160

Permeability Chart of Caffeine-Lactose Tablets
A Mercury Porosimetry* MicroCT
A -
0 1 1 1 1
0 20 40 60 80 100
Tablet Hardness (N)
Figure 6-13 Comparison of caffeine-lactose tablet permeability by Hg porosimetry and microCT.
Permeability Chart of M70 Tablets
----------------A
- - - - - - - - - - - - - - - -
- - - - - - - - - - - - - - - -
- - - - - - - - - - - - - - - -
- - - - - - - - - - - - - - - -
- - - - - - - - - - - - - - - -
- - - - - - - - - - - - - - - -
- - - - - - - - - -- - - - - - - - - -
A 0
A Mercury _* MicroCT
-A
0 20 40 60 80 100Tablet Hardness (N)
Figure 6-14 Comparison of M70 tablet permeability by Hg porosimetry amd microCT.
161
25 -
20 -
E15 -
10 -cu
5-0.
.. .. .. .......... .. ...... ...... ........ _,w.. .. .... .. .. ..

We believe that the root cause for inaccuracy in mercury permeability measurement lies
in its calculation method. The calculation of permeability in the Autopore IV 9200
mercury porosimeter system used in this study requires identification of an inflection
point on the curve of cumulative intrusion volume vs. pore diameter (11) (Figure 6-15).
The precise selection of the point is critical to a fair estimation of permeability, but this is
often difficult for two reasons. First, the infection point sits in an area that intrusion
volume changes most rapidly, making the identification relatively inaccurate; second, in
the scenarios where multiple S shapes appear in the curve, it might become impossible to
select the inflection point.
--+- Intrusion for Cycle ICumulativ Intrusion vs Pore sli
- Extrusion for Cycle 1
0.074------------- ------------------ ------------------- ------------------- ----
I I 1+
I+ +
0.06 ---------------------------------- --------------- -------
+ - -I +0.05- - - - - - -- - - - - - - - - - - - - - - - -- - --
I+
0.04------ r ---------- i--------- --- - ------- ---
0.M ----- - - -L- - - - - - - - - -I- - - - - - - - - -J- - - - - - --- - - - -
I +
0.01 - - - ----- -- - - - - - - - - - - - - - - - - - - - - - - - - - --- - -- - -
I +
10
Pore Size Diameter0.01
Figure 6-15 Difficulty in determing inflection point for permeability study in mercury porosimetry.
When compared with mercury porosimetry, numerical simulation based on microCT
structure was proved to be more reliable and accurate in determining the permeability of
pharmaceutical tablets.
162
.............

6.3 Summary
In this chapter we first introduced a series of imaging analysis techniques transforming
the original pore space into a 3-D model illustrating the interconnection and relative size
of the pores and throats. This model helps understand the arrangement patterns of the
pore space and thus guide the next steps of quantitative analysis. Caffeine-lactose tablets
were discovered to have a pore network that is highly interconnected. The throats are
mainly linear in shape and relatively uniform in diameter. However, the pores could exist
in aggregation with multiple branches reaching out.
Next, numerical simulation of liquid intrusion was adopted to understand the relationship
between tablet microstructure and dissolution process. The results demonstrated that
permeability of caffeine-lactose tablets increases quickly with decreasing tablet hardness,
while the permeability of M70 tablets remains at impervious levels for tablets between
50N and 1OON. For tablets at the same hardness and porosity level, the permeability for
caffeine-lactose tablets is much higher than that for M70 tablets. When permeability
value is plotted against microCT-determined porosity of the structure used in simulation,
a clear linear relationship is observed for lactose-caffeine tablets, indicating that
permeability can be estimated just based on the total porosity of the tablets.
With the calculation of permeability levels, the dissolution speed for caffeine-lactose
tablets was separated into two portions representing the contributions from disintegration
and surface dissolution, respectively. The disintegration speed is proportional to a
disintegration factor and the square of permeability values. The surface dissolution speed
is dependant upon the dissolution mechanism identified in holder dissolution test. In a
convective-diffusion-limited scenario, it is controlled by the hydrodynamic conditions
around the tablet; in a surface-dissolving-limited scenario, it is controlled by the tablet
surface area in contact with dissolution medium.
Tablet permeability calculation via microCT-based numerical simulation was
demonstrated to be a superior choice when compared with that via mercury porosimetry.
163

An intrinsic defect in calculation method by mercury porosimetry makes it an unreliable
technique for determination of tablet permeability.
Permeability derived from microstructural numerical simulation was established as a new
parameter for describing tablet dissolution properties. It provides novel insights into the
dissolution process and a mechanistic linkage between two common parameters: tablet
porosity and dissolution speed.
164

6.4 Chapter Bibliography1. I. Chatzisand F.A.L. Dullien. Application of the Percolation Theory for the
Simulation of Penetration into Porous-Media of a Non-Wetting Fluid and thePrediction of the Relative Permeability Curve. Revue De L Institut Francais DuPetrole. 37:183-205 (1982).
2. C.H. Arns, Bauget, F., Ghous, A., Sakellariou, A., Senden, T.J., Sheppard, A.P.,Sok, R.M., Pinczewski,W.V., Kelly, J.C. and Knackstedt, M.A. Digital CoreLaboratory: Petrophysical Analysis from 3D Imaging of Reservoir CoreFragments. Petrophysics. 46:260-277 (2005).
3. A. Kameda. Permeability evolution in sandstone: digital rock approach, Vol.Ph.D., Stanford University, 2004.
4. Y.M. KEEHM, T; NUR,A. Computational rock physics at the pore scale:transport properties and diagnosis in realistic pore geometries. The LeadingEdge:180-183 (2001).
5. N. Martysand E.J. Garboczi. Length Scales Relating the Fluid Permeability andElectrical-Conductivity in Random 2-Dimensional Model Porous-Media. PhysicalReview B. 46:6080-6090 (1992).
6. L.M. Schwartz, N. Martys, D.P. Bentz, E.J. Garboczi, and S. Torquato. Cross-Property Relations and Permeability Estimation in Model Porous-Media. PhysicalReview E. 48:4584-4591 (1993).
7. G.K. Batchelor. An Introduction to Fluid Dynamics, Cambridge University Press,1967.
8. D.P. Bentzand N.S. Marty. A Stokes Permeability Solver for Three-DimensionalPorous Media, NIST, 2007.
9. N.S. Martys, S. Torquato, and D.P. Bentz. Universal Scaling of FluidPermeability for Sphere Packings. Physical Review E. 50:403-408 (1994).
10. H. Darcy. Les Fontaines Publiques de la Ville de Dijon. (1856).11. P.A. Webb. An Introduction To The Physical Characterization of Materials by
Mercury Intrusion Porosimetry with Emphasis On Reduction And Presentation ofExperimental Data, Micromeritics Instrument Corp., Norcross, Georgia, 2001.
165

166

Chapter 7 Preliminary and Future Work
The development of the microCTdissolution-holder toolbox in this study provides a
systematic approach for microstructural characterization of pharmaceutical tablets.
Equally importantly, it paves the way for further utilization of the techniques in different
aspects of pharmaceutical manufacturing, e.g. tablet coating quality examination. The
resolution limitation revealed also inspires exploration of another novel technology, the
focused ion beam scanning electron microscopy (FIB-SEM). Abundant opportunities
exist for future work in tablet microstructure and dissolution mechanism. The direction
and speed of technological innovation in this space are critical factors in the adaptation of
the toolbox in the industry.
7.1 MicroCT Investigation of Tablet Coating
Coating is often an important step in tablet manufacturing process, as it can be used to
improve appearance/flavor or strengthen the tablet to endure handling and transportation.
Coating could also be utilized to alter the pharmacological properties of the tablets. The
dissolution time of coated tablets is typically longer than that of uncoated tablets. Enteric
coatings can be applied to tablets so that they can resist the strong acid of stomach fluid
and dissolve in less-acidic intestines (1). Several coating materials could provide a
moisture barrier for the tablets coated, rendering essential protection for ingredients that
are highly sensitive to moisture (2).
Because of coating's critical functionalities, tablet coating quality has been studied
extensively. Visual inspection is a most basic and straightforward method, but a better
understanding requires going below the surface layer. Two technologies currently under
development for coating characterization are near-infrared (NIR) spectroscopy (3-5) and
terahertz pulsed imaging (TPI) (6-8). Both technologies depend on the correlation of
collected sample spectrum with tablet physical structure to derive information about the
coatings. Only a general thickness might be calculated, with no detailed information
167

about local coating structure. Nevertheless, both technologies can be operated on a
real-time basis, so they are well suited for online monitoring of coating process (3, 9).
MicroCT represents a novel technology that might achieve 3-D location-dependant
characterization of tablet coatings. In this preliminary study, a placebo tablet coated with
Opadry@ AMB is scanned with Skyscan 1172@ microCT instrument at a resolution of
3 pim/pixel and a scanning time of 2340ms. A reconstructured cross section of the tablet
is shown in Figure 7-1, where coating layer is manifesting itself as a white circle around
the tablet. A thresholding procedure was then performed to separate the coating layer
from the bulk material, resulting in the extraction of a 3-d coating shell (Figure 7-2).
Figure 7-1 Cross section microCT image of coated tablet.
The thickness of the coating can be extracted by calculating a distance map of the coating
and obtaining the distance values on the skeleton layer. A new 3-D model comprised of
thickness information can be built, allowing direct visualization and examination of
coating patterns (Figure 7-3). Thinner and uneven coating is observed on the embossed
side of the tablet, especially at the locations of the numbers. On the side wall there are
strips of thin coating, most probably formed due to the local physical structure. On the
other flat side there is a circular ring of thin coating, potentially formed due to tablet
contact during the coating process.
168

Figure 7-2 MicroCT 3-D model of tablet coating.
Figure 7-3 Coating thickness distribution on different tablet surfaces. 1 unit = 3 um.
169
................................. . .. ......... . .............. . .... .. ......

The visualized presentation of coating thickness distribution allows direct examination of
coating patterns, providing abundant information for improvement of coating techniques.
On the other hand, quantitative analysis of the coating thickness creates a new dimension
in quality measures. In the histogram of coating thickness, it was shown that a
representative coating thickness for the tablet is 82 pm, with most of the tablet surface
spots having coating thickness between 50 pLm and 100 pLm (Figure 7-4). However, it is
also worth noting that about 15% of the surface spots have a coating thickness lower than
50 ptm. This represents the region that improvements in coating technique need to be
geared toward.
Coating Thickness Analysis with MicroCT35%-
30%<nd 25% - - - ---- - -------
0 20% -- - - - - - - - - - - - - - - - --- - - - -- -- -
,2 15%-0%'4-
5% -
0% - -
0 50 100 150 200 250 300Coating Thickness (micron)
Figure 7-4 Quantitative analysis of tablet coating thickness.
This preliminary study of tablet coating demonstrates the power of microCT as a tool for
pharmaceutical manufacturing R&D. However, it also reveals certain current limitations.
The scanning of a sample takes 2.5 hours, reconstructing a sample takes 16 hours on a
4-processor desktop computer, while the analysis with Avizo@ 6.2 software had to be
conducted on a powerful workstation with 8GB memory. These limitations will certainly
be addressed with the rapid technology development in the near future.
170

7.2 FIB-SEM Investigation of Tablet Microstructure
MicroCT has been demonstrated to be a powerful tool in characterizing pharmaceutical
tablets. In comparison with the current standard method mercury porosimetry, the most
significant drawback of microCT is the relatively low resolution. When studying lOON
M70 compound-A tablets, insufficient microCT resolution was observed. In order to
address the resolution limitation of microCT, alternative technologies were evaluated.
Focused ion beam scanning electron microscopy (FIB-SEM) emerged as a great
candidate for 3-D microstructure characterization with super high resolution.
Scanning electron microscopy (SEM) is a method of producing images of a surface by
scanning a finely focused electron beam over the sample and mapping the electron
interactions produced. With a resolution as high as 5-20 nm, SEM is a 2-D technology
and only characterizes material surfaces. Recently, a novel platform combining the
traditional resolution power of SEM with a sample manipulation capability of focused ion
beam (FIB) brings the promise of 3-D SEM characterization of material structures.
SEM
SEM image
Figure 7-5 Illustration of FIB-SEM working mechanism.
171
..................... .... .......... ...... ............. ...... -- 11 ....... .. ........................ ...... ............................. ...... .... ... .. ...... .. ..

In a FIB-SEM scanning experiment, a focused ion beam is used to cut off a thin slice of
the object, with a SEM scan done after each cut (Figure 7-5). The thinnest slice that
could be cut is -10 nm with current technology, representing a 10 nm resolution power in
all the three dimensions when combined with SEM. The series of SEM scans can then be
aligned and constructed into a 3-D model of the sample internal structure.
In this preliminary study, a fragment of a lOON M70 compound-A tablet was scanned
with a piece of Zeiss FIB-SEM instrument. A SEM image with scanning parameters is
shown in Figure 7-6. The SEM scanning was done with 41 nm resolution, the FIB
cutting was done at 50 nm intervals. A low electron current was selected so that
electrostatic charge on material surface is minimized. The image demonstrates that the
pores in 1 OON M70 tablet are mostly smaller than 1 pm in diameter and are much less
inter-connected than the pores in 96N caffeine-lactose tablets.
kigure 7-6 lls-SEM image of M7U tablet cross section with experimental parameters.
172

Figure 7-7 Image processing procedure of FIB-SEM data.
173

In order to extract 3-D structural information from the FIB-SEM data set, a series of
image processing was conducted in Avizo@ 6.2 software. First, a Noise Reduction
Minimum Filter was applied to remove noise signals embedded in the scans (Figure
7-7 A); A gray-scale microstructure model is obtained (Figure 7-7 B). Next, pore space
segmentation of the dataset was conducted with a combination of Thresholding and
Magic Wand selection (Figure 7-7 C). Island Removal was applied to remove the single
voxel noises from the selection. Finally, Smoothing was applied to the pore spaces and
pores were labeled as individuals (Figure 7-7 D). At this stage, quantitative
characterization can be conducted on the pores.
Porosity Profile for a M70 1 OON Tablet10%9% - -
S 8% -- - - - - - - - - --- - - - - - - -
=o 7%/ - - - - - -
-6% - -- - - - - - - -
?L 5% -- - - - - -- - - - - - - - - -
m 4%/ - - - - - - - - - - - - -
- 3% - - - - - - - - - - - - - -
2% - - - - - - --- - - - - - - - - - - -
1% - -- - - - - - - - - - - -
0% -o
0 0.5 1 1.5 2
Equivalent Pore Diameter (um)
Figure 7-8 Incremental pore size distribution of FIB-SEM data for 100N M70 tablet.
Porosity Profile for a M70 1 OON Tablet120%
100%
80%
60%
40%
20%
0% 4 10 0.5 1 1.5 2
Equivalent Pore Diameter (um)
Figure 7-9 Cululative pore volume distribution of FIB-SEM data for 10ON M70 tablet.
174

It was shown that most of the pores in 1 OON M70 tablets are around 0.3 pim in diameter,
compared with mercury porosimetry's 0.016 pm. The multiple peaks are due to arbitrary
allocation of histogram bins rather than actual discontinuity in pore size. According to
FIB-SEM, 90% of the total pore volume belongs to pores with a diameter between 0.2
pm and 1 ptm. This is one to two orders-of-magnitude larger than mercury porosimetry's
estimation of 0.006-0.2 im for 90% pore volume of 1OON M70 tablets. The total
porosity measured by FIB-SEM is 5.6%, a lower value than the theoretical porosity of
7.0%. Two reasons might explain the discrepancy. First, the sample studied was very
small and did not contain any lactose granules at much higher porosity; second, it is
possible that there are a group of pores smaller than 40ptm in size that were not captured
by FIB-SEM.
The application of FIB-SEM in this preliminary study complimented microCT with data
at high resolution, providing more detailed quantitative information about tablet
microstructure. The more accurate FIB-SEM structure is used for permeability
simulation. Resulted permeability is 0.25 miliDarcy, compared with 0.29 and 0.35
miliDarcy from microCT structure. It demonstrates that a lack of interconnectivity of the
pore space in both dataset contributed to very low permeability values. The FIB-SEM
permeability is slightly lower probably due to the absence of lactose structure in the
sample tested.
FIB-SEM is a promising technology for potential applications in understanding
pharmaceutical materials. It provides ultra high resolution in 3-D characterization of
microstructure, enabling a head-to-head comparison with mercury porosimetry. However,
being a 2-D technology in its core, a series of drawbacks were also revealed during the
preliminary trial.
A lot of pharmaceutical ingredients are prone to electrostatic charge buildup. In a regular
SEM experiment, a thin coating like 5nm platinum can be applied to the surface of the
sample to eliminate the electrostatic problem. In real-time FIB cutting, coating is
impossible. As a result, data could be easily impacted by the electrostatic charge buildup.
175

FIB cutting is destructive and has a potential to skew the material structure. Since the
slice is milled away, there is no record of the transition structure, causing occasional
discontinuity in consecutive SEM images. Being a 2-D technique, it is also not suitable
to study highly porous materials due to the complications introduced by the shadow of
the pores.
With careful experimental design and data processing, FIB-SEM could bring valuable
microstructure information at ultra-high resolution. Further study is suggested to better
explore its utilization in the pharmaceutical industry.
7.3 Future Work in Tablet Microstructure Investigation
The tablet microstructure characterization described in this thesis lays a solid foundation
for further exploration. Thorough investigation of tablet microstructure and its
relationship with the materials, manufacturing process, and tablet properties could
provide significant guidance for pharmaceutical manufacturing. This would enable more
efficient formulation and process design, better operational control, and more stringent
quality assurance.
. New excipients could be studied with the toolbox developed in this study.
Although spray-dried lactose is a very common excipient for pharmaceutical
tablets, it is not representative of all the common excipients. Other ingredients,
e.g. microcrystalline cellulose (MCC), polyethylene glycol (PEG), and the
inorganic calcium phosphate dibasic, might exhibit completely different material
behaviors and form distinctive microstructure in tablet manufacturing process.
0 New aspects of a tablet might be investigated with microCT. The analysis of
coating quality is a good example. Heterogeneity of tablet microstructure can be
assessed by examining fragments cut from different locations of a tablet.
Chemical mapping is possible when the contrast between the API and the
excipients in microCT scan is high enough.
176

" Dynamic microCT study could be carried out to understand the evolution of
microstructure during manufacturing or analytical testing processes. Whole tablet
scan coupled with step-wise compaction of the same tablet could reveal particle
reorganization and deformation patterns during tablet compaction. Analyzing
freeze-dried tablet matrix before and after dissolution could help understand
microstructural changes induced by liquid penetration.
" MicroCT study of novel dosage forms could provide in-depth information about
the products and associated manufacturing processes. Innovative drug products,
like extruded and molded tablets or thin-film compacted tablets, are produced via
manufacturing processes completely different from traditional ones. The
capability to characterize 3-D microstructure of these novel products would
provide much better understanding of the material transformation processes and
their impact on tablet qualities.
" More advanced quantitative analysis can be developed for tablet microstructures.
Pore shape and orientation can be characterized by calculating the momentum
vector of the individual pores. Throat diameter can be extracted from a distance
map, while the throat length can be obtained by measuring the throat skeleton
length. Pore interconnectivity can be determined by counting the number of
throats connected to a pore. These parameters could potentially be built into
realistic physical / mathematical models describing tablet properties like
dissolution profiles, leading to better understanding and control of tablet
manufacturing. On the numerical simulation side, liquid penetration study from
different side of a sample should be conducted to investigate anisotropic
properties of permeability. Force propagation within a tablet microstructure
matrix can be simulated, which could yield constructive information about
obtaining proper tablet strength via microstructural designs.
177
e Further exploration of FIB-SEM in pharmaceutical applications should be
continued, as the ultra high resolution and superb phase contrast of FIB-SEM
might prove to be valuable addition to the 3-D characterization capability of
microCT.
7.4 Future Work in Dissolution Mechanism Investigation
The exploration of tablet dissolution mechanism in this study leads to the dissection of
dissolution into surface dissolution and disintegration. Within surface dissolution, two
extreme scenarios were identified, i.e. surface-dissolving-limited dissolution and
convective-diffusion-limited dissolution. An equation for calculating dissolution speed is
suggested. However, only two formulation systems were studied due to time limitation.
More work is needed to confirm and further polish the theory.
" More formulation systems need to be tested with the tablet holder for evaluation
of dissolution mechanism, e.g. immediate release formulations featuring other
common excipients. Dissolution medium mimicking in vivo conditions, such as
fast and fed status, should be utilized to understand the potential dissolution
mechanisms in vivo. The impact of disintegrants on dissolution mechanism can
be evaluated as well.
" Extended-release formulations featuring insoluble excipient matrix could be
tested with the tablet holder, creating a uni-directional material transport process
with little tablet swelling. This combined with microCT study could help
understand the diffusion process happening within the tablet matrix and guide
extended-release formulation design.
" Representative formulations need to be identified for each category of dissolution
mechanisms suggested in this study. Dissolution theory proposed can be further
refined based on these additional studies. Incorporation of microstructural
178

analysis and dissolution mechanism theory should be attempted to reach at a
sophisticated theoretical system describing dissolution activity on a
microstructural level. This would enable ultimate Quality by Design in
pharmaceutical tablet manufacturing.
7.5 Outlook of the Technologies
This study explored the utilization of several novel technologies/designs in understanding
tablet microstructure and pharmacological properties. Meanwhile, it also reveals the
shortcomings in what is currently available. Some of the issues might be resolved as
technology advances in the next 5-10 years.
The technology of microCT has been developed rapidly within the last decade. Current
generation of desktop microCT scanners enjoy a highest resolution of 1-10 ptm / pixel.
When a special synchrotron x-ray source is connected from a few facilities, resolution
can reach sub 60 nm level, enabling whole cells microstructure imaging (10-12). The
advancement in desktop microCT technology has yielded a new class of CT scanners
called nanoCT, referring to a maximum resolution at nm level. The Skyscan@ 2011
nano-CT has a maximum resolution of 150 nm, while Xradia@ nano-XCT 100 is capable
of producing a maximum resolution of 50 nm. The continuing improvement in scanning
resolution will enable affordable bench-top units with adequate resolution for the
majority of pharmaceutical materials utilized in the industry.
Another direction of improvement has been geared toward speed, which involves both
scanning speed and post processing speed. Currently, a scanning session for a tablet
fragment at 1.4 pm / pixel resolution with Skyscan@ 1172 scanner takes about 1-1.5 hrs,
the reconstruction of the 3-D structure at 360X360X1024 size takes 0.5 hr on a
4-processor 32-bit workstation with 4GB memory. With the new high-throughput
Skyscan@ 1178 scanner, comparable scanning and reconstruction would take a total of
less than 5 minutes. Although the 1178 scanner is designed for small animal live
imaging and thus has a rather low resolution of 80 pm / pixel, a higher resolution scanner
with similar speed can be expected in the near future.
179
Innovative approaches are under development for better scanning capability. Dr. Ge
Wang of Virginia Tech is leading an effort to design the next generation nano-CT
combining interior tomography capability. This would allow examination of local
portions of a sample object without cutting the portions off, realizing non-destructive
location-dependent high-resolution characterization of pharmaceutical dosage forms.
In currently available commercial software products, the capability of 3-D imaging
analysis has been mainly developed for applications in fields such as geosciences,
material sciences, and biomechanical sciences. Avizo@ from Visualization Sciences
Group has the most powerful quantitative package and is the software used in this study.
It combines impressive visualization capability with quantitative analysis and is
developer friendly. The downside of Avizo@ is that it provides so many functionalities
and options that the user interface becomes relatively difficult to manipulate.
Voxblast@ 3D from Vaytek Inc is less powerful and is mainly geared toward biochemical
and biomaterial applications. Another major 3D imaging visualization and analysis
software is VGStudio@ Max from Volume Graphics GmbH, which is used extensively in
industrial designs but less so in scientific research.
A promising option is to develop customized application modules for pharmaceutical
dosage form microstructure characterization based on the platform of Avizo@. After
identification of key parameters and design of workflows to characterize them,
application packages featuring simple and interactive graphical user interface (GUI) can
be tailor-made for microstructure analysis in pharmaceutical R&D and manufacturing
settings. This could enable the full integration of microstructure control into current
practices, the details of which are discussed in Chapter 8.
A wide-spread usage of the tablet holder designed in this study would require a viable
commercial production plan. The biggest issue incurred when the holders were
manufactured to a standard size was the variation in dissolution vessel dimensions. The
Varian@ 1-liter dissolution vessels had varying internal diameters, causing significant fit
180

problem for the holders. In a commercial scale production, there are two ways to
overcome the difficulty. One is to incorporate an elastic session at the connection line of
the holder, allowing a certain degree of variation in vessel size; the other is to build new
dissolution vessels with tablet holder incorporated in the design. In both approaches,
exchangeable tablet holder modules fitting tablets of different size and shape can be
designed.
The successful integration of the microCT-dissolution holder toolbox in the
pharmaceutical manufacturing industry could provide a wide range of benefits, as will be
detailed in the next chapter. The technology advance in the foreseeable future would
certainly accelerate the adaptation process, leading us to an era of microstructure analysis
in pharmaceutical dosage form characterization.
7.6 Selection of Technologies for Microstructural Analysis
In this study, multiple technologies for microstructural acquisition have been discussed,
including microCT, nanoCT, and FIB-SEM (Table 7-1). Selection of adequate
technology is an important step in microstructural analysis. The discussion within this
session is based on the assumption that all the three pieces of instrument are readily
available.
Table 7-1 Comparison of technologies for microstructural analysis.Technology Resolution Sample Size Note
@ Max Resolution
microCT 0.7-10 pm 1.5-20 mm Insufficient for densificated structure
nanoCT 50-150 nm 0.07-0.2 mm Might not be representative
FIB-SEM 5-20 nm 5-20 pm Might not be representativeInadequate for highly porous material
In oil industry, companies adopt a step-wise methodology with rock microstructure
analysis (personal communication with Dr. Shawn Zhang of Visualization Sciences
Group). They start with CT scans at resolutions of cm level, and then move toward
microCT, nanoCT, and maybe finally FIB-SEM. At each step, the significance of the
181

additional microstructure information provided at higher resolution is evaluated. The
process is stopped when a higher resolution is not adding significant value.
This methodology is equally applicable to pharmaceutical tablets, with the exception that
we start with microCT. A two-tier microCT/nanoCT analysis is recommended, with
FIB-SEM adopted only if truly necessary. The technology with which the final data
acquisition and analysis will be performed is dependant on two factors. First, resolution
should be sufficient to characterize the microstructure studied; second, when the
resolution requirement is met, the sample size should be large enough to be representative
of the tablet microstructure. Eventually, data might come from multiple levels, with
qualitative learning obtained at a lower resolution level and quantitative characterization
done at a higher resolution level.
182

7.7 Chapter Bibiography1. F. Liu, R. Lizio, C. Meier, H.U. Petereit, P. Blakey, and A.W. Basit. A novel
concept in enteric coating: A double-coating system providing rapid drug releasein the proximal small intestine. Journal of Controlled Release. 133:119-124(2009).
2. E. Mwesigwa, G. Buckton, and A.W. Basit. The hygroscopicity of moisturebarrier film coatings. Drug Development and Industrial Pharmacy. 31:959-968(2005).
3. J.J. Moes, M.M. Ruijken, E. Gout, H.W. Frijlink, and M.I. Ugwoke. Applicationof process analytical technology in tablet process development using NIRspectroscopy: Blend uniformity, content uniformity and coating thicknessmeasurements. International Journal of Pharmaceutics. 357:108-118 (2008).
4. J. Muselik, K. Krejcova, M. Rabiskova, A. Bartosikova, M. Drackova, and L.Vorlova. Determination of the Thickness of Tablet Coating by Near-InfraredSpectroscopy. Chemicke Listy. 104:41-45 (2010).
5. M. Romer, J. Heinamaki, C. Strachan, N. Sandler, and J. Yliruusi. Prediction ofTablet Film-coating Thickness Using a Rotating Plate Coating System and NIRSpectroscopy. Aaps Pharmscitech. 9:1047-1053 (2008).
6. A.J. Fitzgerald, B.E. Cole, and P.F. Taday. Nondestructive analysis of tabletcoating thicknesses usign terahertz pulsed imaging. Journal of PharmaceuticalSciences. 94:177-183 (2005).
7. L. Ho, F. Muller, M. Romer, K.C. Gordon, J. Heinamaki, P. Kleinebudde, M.Pepper, T. Rades, Y.C. Shen, C.J. Strachan, P.F. Taday, and J.A. Zeitler. Analysisof tablet film coating quality using terahertz pulsed imaging. Journal of Pharmacyand Pharmacology. 59:A20-A21 (2007).
8. L. Ho, R. Muller, K.C. Gordon, P. Kleinebudde, M. Pepper, T. Rades, Y.C. Shen,P.F. Taday, and J.A. Zeitler. Terahertz pulsed imaging as an analytical tool forsustained-release tablet film coating. European Journal of Pharmaceutics andBiopharmaceutics. 71:117-123 (2009).
9. L. Ho, R. Mueller, K.C. Gordon, P. Kleinebudde, M. Pepper, T. Rades, Y.C. Shen,P.F. Taday, and J.A. Zeitler. Terahertz-pulsed imaging as an analytical techniquefor tablet film coating: monitoring the unit operation and process scale-up. Journalof Pharmacy and Pharmacology. 60:A8-A9 (2008).
10. C.A. Larabelland M.A. Le Gros. X-ray tomography generates 3-D reconstructionsof the yeast, Saccharomyces cerevisiae, at 60-nm resolution. Molecular Biologyof the Cell. 15:957-962 (2004).
11. M.A. Le Gros, G. McDermott, and C.A. Larabell. X-ray tomography of wholecells. Current Opinion in Structural Biology. 15:593-600 (2005).
12. D.Y. Parkinson, G. McDermott, L.D. Etkin, M.A. Le Gros, and C.A. Larabell.Quantitative 3-D imaging of eukaryotic cells using soft X-ray tomography.Journal of Structural Biology. 162:380-386 (2008).
183

184

Chapter 8 Applications and Benefits of theMicroCT-DissolutionHolder Toolbox
The development of the microCT-dissolution holder toolbox provides a piece of
magnifying glass to track the material changes during a manufacturing process. It allows
detailed examination of the interactions among materials, the microstructure, and the
resulting tablet properties. This new capability enables pharmaceutical scientists to
obtain significant insight into the pharmaceutical manufacturing process, potentially
leading to more efficient formulation and process designs. The toolbox can also be
introduced into the quality control and troubleshooting of commercial scale production,
providing additional dimensions of quality assurance and better informed diagnosis
procedures. In this chapter we discuss in details the applications and benefits of the
microCT-dissolutionholder toolbox in the pharmaceutical industry.
8.1 Applications and Benefits in Research & Development
Scientists working on research & development (R&D) of pharmaceutical manufacturing
are often the early adopters of novel tools in the industry. They are eager to utilize new
technologies to further their scientific understandings and are thus the best candidates to
fully integrate the microCT-dissolutionholder toolbox with the current R&D procedures.
8.1.1 Development of Excipient Microstructure Library
Excipients are inactive substances that are used as carriers for active ingredients in
medications. In a pharmaceutical tablet, excipients include fillers/binders, disintegrant,
lubricant, glidants, preservatives, coating materials, etc. As drug discovery advances, the
active ingredients are becoming increasingly potent, especially for medications in
therapeutic areas like cancer. Often a tablet would contain <10% wt of active
ingredient(s), with all the rest made up in excipients. Among the excipients,
fillers/binders typically make up a majority of the volume. The implication of such an
185
arrangement is that one or two fillers/binders could form the supporting matrix of a tablet
and have a dominant influence on its properties.
Fillers are materials used to fill up the volume of a tablet so that it becomes convenient to
manufacture and to be consumed by customers. Binders are materials used to hold the
ingredients together and form a tablet with required mechanical strength. About a dozen
of excipients often take a dual role of filler/binder, e.g., lactose, microcrystalline cellulose,
mannitol, polyvinylpyrrolidone (PVP), and polyethylene glycol (PEG). For each material,
there are typically several popular grades / trade names that are widely used in
formulations of pharmaceutical tablets.
Since the selection is very limited, it is viable to conduct detailed microstructure and
dissolution mechanism analysis for the individual excipients. A potential procedure is
shown in Figure 8-1. First, formulation scientists need to identify the few common
fillers/binders that are used most widely in formulations of their products. Next, an
experimental design space needs to be established around the typical manufacturing
procedures used for correspondent materials. Impacts of different operational parameters
on microstructure and dissolution mechanism could be examined via careful experimental
design, e.g., maximum compaction force in tablet compaction or amount of liquid binder
in wet granulation. If necessary, a model API like caffeine could be added to the
formulation to better understand material interactions.
Various aspects of tablet microstructure could be examined. Qualitatively, the
homogeneity of the materials and the deformation mechanism (fragmentation or
densification) could be revealed. Detailed quantitative study of pore structure could be
carried out, including but not limited to the pore size and shape, pore/throat relationship,
interconnectivity and permeability. Holder dissolution study of the tablets would help
identify the rate-limiting steps and intrinsic drivers of the dissolution process.
Investigation of the relationship between microstructure features and dissolution process
would provide information about the characteristics of the material that could be utilized
in rational formulation design. For example, we learned that the fragmentation of spray-
186

dried lactose leads to a tablet microstructure with high connectivity and permeability,
which in turn facilitates the disintegration of the tablet and promotes high dissolution
speed. Therefore, lactose is a great candidate for formulation with high potency
immediate release drug formulations.
Identify Design Study SummarizeCommon I Experimental N Microstructure O PropertiesExcipients Space & Dissolution & Drivers
Figure 8-1 Procedure for building excipient microstructural library (EML).
8.1.2 Rational Formulation / Manufacturing Process Design
With guidance from the excipient microstructure library (EML), a rational formulation
design process could be pursued (Figure 8-2). It starts with the identification of the
dosages of the API(s) and desired tablet properties (immediate release or extended release,
target hardness level, etc.). This stage is typically done concurrently with early clinical
development, where a matrix of tablet quality could be deduced from the clinical
investigation and scientific understanding of the drug action mechanism. Then the EML
can be screened for best matches in property profiles. Here the microstructural
characteristics would be taken into consideration, e.g. whether the co-processing of an
API with lactose would reduce the permeability of the tablet and thus hinder tablet
disintegration. Physicochemical compatibility study would further narrow down the
excipient list.
Identification of Library Search for Optimization of AchievingAPI and Desired M Physicochemical-m Process and m Desired TabletTablet Properties & Property Match Formulation Property Profile
Figure 8-2 Example procedure for rational formulation design.
By this stage, the major excipient(s) and the general microstructure features are known,
the tablet performance can be anticipated, and the venue to optimize the formulation
should be clear. The optimization of the process and the formulation should be done to
facilitate the manufacturing process while maximizing positive (minimizing negative)
impact on microstructural features important for superb tablet performance.
187
.......... .V-V. ... . .. ............... .......... ..

The addition of microstructure and dissolution mechanism information leads to clear
design strategies of formulations with certain major excipients (Table 8-1). Dissolution
speed for formulations with significant disintegration can be tuned via microstructure
permeability design. Dissolution speed for formulations with dissolving-limited surface
dissolution can be tuned via microstructure surface area design.
Table 8-1 Tunable formulations.
Disintegration Surface Dissolution
Rate-limiting Medium Surface ConvectiveStep? Penetration Dissolving Diffusion
Fine tune? Yes Yes NoIf yes, via Microstructure Microstructure
what design? Permeability Surface Area
Two key features enabled by the toolbox make the new formulation development a
rational process. First, the big picture becomes clear once the selection of the main
excipient(s) is made, as we have sophisticated understanding of the final tablet
microstructure and the resulted property profiles. Second, with the knowledge of
structural drivers for tablet properties, microstructural analysis can be used as guidance to
fine tune the formulation and manufacturing process. Fewer experiments would be
necessary in order to arrive at a satisfactory final dosage form.
With extensive application of the toolbox in formulation development, formulations with
less ingredients and manufacturing steps might be designed in a shorter period of time,
leading to potential cost savings and significant process understanding.
It is important to emphasize that although the microstructure and dissolution mechanism
analysis would bring valuable insights into formulation development, they are not meant
to replace the criteria or parameters that are used in current development process, e.g.
particle size distribution and powder flowability. The proposed excipient microstructural
library should be fully integrated with the current physicochemical library, providing
188

multi-dimensional information for rational decision making in pharmaceutical
formulation development.
8.1.3 Development of New Dosage Forms / Manufacturing Processes
In pharmaceutical industry, innovation in new dosage forms has been an important
strategy to attract consumers, conduct product life-cycle management, or achieve novel
properties. Examples include Mucinex@ bi-layer tablets featuring different release
mechanisms in the layers, Claritin@ RediTab orally disintegrating tablets and liquid gels,
etc. Another motivation for dosage form innovation comes from the need to reinvent the
pharmaceutical manufacturing processes with more efficient or sophisticated unit
operations. Examples include extrusion coupled with injection molding and thin-film
compaction. The former dramatically reduces the downstream manufacturing procedure
into two unit operations, while the latter allows novel mixing techniques for API and
excipients such as electro-spraying.
The standard evaluation methods, e.g. paddle dissolution and hardness tests, can only
provide superficial comparison between the new dosage forms and traditional tablets.
The microCT dissolution-holder toolbox would enable much deeper understanding of the
new manufacturing processes and the dosage forms resulted. In a preliminary microCT
scanning of a tablet of 90% API 10% PEG 8000 produced by melt extrusion, it was
demonstrated that air bubbles trapped or formed during the extrusion process would lead
to cavities in final tablets, potentially reducing their mechanical strength (Figure 8-3 C).
This bubbling phenomenon was absent in another batch of production. It was also
demonstrated that a tablet with 50% API 50% PEG (Figure 8-3 A) had the same
homogeneous microstructure as that of a tablet with 100% pure API (Figure 8-3 B).
Similar techniques could be applied to tablets compressed from thin-film to understand
the microstructural patterns and their impact on tablet properties.
189

(C) 90% API 10% PEG 8000
Figure 8-3 Preliminary microCT scans of melt-extruded tablets.
8.2 Applications and Benefits in Manufacturing
The toolbox developed in this study can also find useful applications in commercial scale
pharmaceutical manufacturing, as the microstructure of a tablet provides abundant
information about what happens in a manufacturing process. The capability of
quantitative and qualitative description of microstructure renders us new dimensions in
understanding and controlling the manufacturing processes.
8.2.1 Establishment of New Quality Assurance Criteria
Due to the desired clinical efficacy and potential toxicity of the pharmaceutical products,
quality assurance (QA) has always been a critical component of the manufacturing
process. Most of the currently available QA methods directly test the properties of final
dosage forms, e.g. mechanical strength and in vitro bioavailability. The tests give
relatively superficial presentation of the tablet properties. Tablets could potentially have
similar dissolution profiles but drastically different microstructure and in vivo behaviors.
MicroCT characterization enables tracing the properties backward to the internal
structure of the tablets, potentially allowing a more fundamental control of tablet quality.
Depending on the key microstructural characteristics identified during formulation
development, adequate parameters can be adopted as new quality assurance criteria for
190
....... .... w ............................. .................
(A) 50% API 50% PEG 8000 (B) 100% API

tablet manufacturing, e.g. homogeneity, total porosity, average pore size, surface area,
permeability and interconnectivity. Sample tablets from each batch can be scanned with
microCT and characterized with quantitative analysis, ensuring batch-to-batch
consistency on a microstructural level.
8.2.2 Application as a Investigation Toolkit
The microCT dissolution-holder toolbox helps bridge our knowledge of the raw
materials and the tablets by revealing the interactions among materials during the
manufacturing process. The 3-D quantitative characterization and visualization of the
microstructure provide unsurpassed information for guidance of manufacturing process.
Meanwhile, it also represents a powerful tool for troubleshooting of manufacturing
problems, which could stem from the materials, the manufacturing process, or a
combination of both.
The examination of tablet coating quality, as described in Chapter 7, is an excellent
example of troubleshooting capability by microCT characterization. The 3-D revelation
of coating thickness distribution on a tablet surface directly exhibited the potential
coating defect patterns on correspondent regions of a tablet, providing invaluable
guidance for improvement of the coating process.
In a troubleshooting scenario where tablet quality is off the mark, a detailed examination
of the tablet microstructure could potentially lead to a quick diagnosis of the problem,
minimizing the loss of production power. If the problem is dissolution related, holder
dissolution can be used to dissect the different segments of dissolution and understand
where the changes happened.
8.2.3 Examination Tool for SUPAC
In pharmaceutical manufacturing and development, one of the most difficult tasks is to
scale up or alter the manufacturing process while producing identical products. In
scale-up or post-approval changes (SUPAC), the same tablet property profile needs to be
191
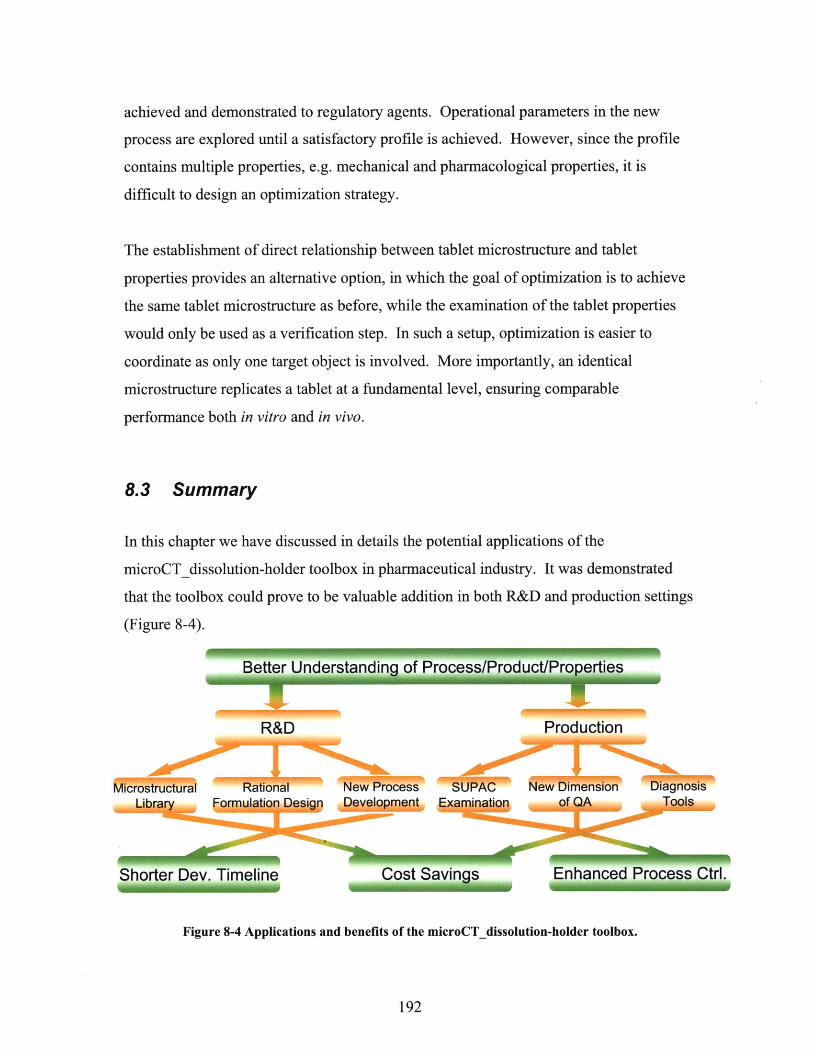
achieved and demonstrated to regulatory agents. Operational parameters in the new
process are explored until a satisfactory profile is achieved. However, since the profile
contains multiple properties, e.g. mechanical and pharmacological properties, it is
difficult to design an optimization strategy.
The establishment of direct relationship between tablet microstructure and tablet
properties provides an alternative option, in which the goal of optimization is to achieve
the same tablet microstructure as before, while the examination of the tablet properties
would only be used as a verification step. In such a setup, optimization is easier to
coordinate as only one target object is involved. More importantly, an identical
microstructure replicates a tablet at a fundamental level, ensuring comparable
performance both in vitro and in vivo.
8.3 Summary
In this chapter we have discussed in details the potential applications of the
microCTdissolution-holder toolbox in pharmaceutical industry. It was demonstrated
that the toolbox could prove to be valuable addition in both R&D and production settings
(Figure 8-4).
Better Understanding of Process/Product/Properties
R&D Production
M Rationa New Dmension osis
Shorter Dev. Timeline Cost Savings Enhanced Process Ctrl.
Figure 8-4 Applications and benefits of the microCTdissolution-holder toolbox.
192
......................... .. ....... ....................................... ........................................ ............... --- -- - w - -- --- - - . ......... ..... ..

In R&D, an excipient microstructure library (EML) can be built for the common
excipients used, providing guidance for rational formulation and process design. In
actual design, optimization of the formulation and process could be done to facilitate the
manufacturing process while maximizing positive (minimizing negative) impact on
microstructural features important for superb tablet performance. The toolbox can also
be utilized in understanding innovative manufacturing processes and products, providing
in-depth characterization for promising new product/process designs.
The addition of microstructural and dissolution mechanism information allows fine
tuning of formulations containing certain major excipients. Dissolution speed for
formulations with significant disintegration can be fine-tuned via microstructure
permeability design. Dissolution speed for formulations with dissolving-limited surface
dissolution can be fine-tuned via microstructure surface area design.
With extensive application of the toolbox in formulation R&D, simpler formulations with
less complex manufacturing processes might be designed in a shorter period of time,
leading to potential cost savings and significant process understanding.
The capability of quantitative and qualitative description of the microstructure renders us
new dimensions in understanding and controlling the manufacturing processes. MicroCT
characterization enables tracing tablet properties backward to the internal structure of the
tablets, potentially allowing a more fundamental control of tablet quality.
Depending on the key microstructural characteristics identified during formulation
development, adequate parameters can be adopted as new quality assurance criteria for
tablet manufacturing. In a troubleshooting scenario where tablet quality is off the mark, a
detailed examination of the tablet microstructure could potentially lead to a quick
diagnosis of the problem, maximizing the saving of production powers. If the problem is
dissolution related, holder dissolution can be used to dissect the different segments of
dissolution and understand where the changes happened. In a SUPAC situation,
193

optimization of new process can be geared toward reproducing the original tablet
microstructure, ensuring comparable performance both in vitro and in vivo.
A wide-spread adoption and further development of the microCT dissolution-holder
toolbox in the pharmaceutical industry holds the promise of delivering shorter
development time, better process control, as well as significant cost savings.
194
Chapter 9 Conclusion and Impact
In the current design and operational activities for secondary pharmaceutical
manufacturing, a knowledge gap exists concerning material transformation and the
subsequent impact on tablet properties. This gap presents a barrier to rational
formulation / process design, where the selection of materials and manufacturing process
is based on scientific understanding of the physicochemical transformation and the
resulting tablet properties. In this study, it was hypothesized that the understanding of
tablet microstructure is pivotal in bridging our knowledge about the materials, the
manufacturing process, and the tablet properties.
A series of studies were carried out to characterize tablet microstructure and its
relationship with the different aspects of pharmaceutical manufacturing, leading to a
workflow as shown in Figure 9-1. The microstructure of a tablet is acquired via
micro/nanoCT or FIB-SEM. Qualitative analysis of the microstructure leads to
understanding of material interactions during manufacturing process, e.g. compaction
mechanism. It also leads to identification of microstructural features, e.g.,
interconnectivity, which could be further characterized in quantitative analysis, e.g.
permeability analysis via numerical simulation. The dissolution mechanism of a tablet
could be studied via a combination of holder and paddle dissolution tests. When
combined with results of quantitative microstructure analysis, this could lead to
establishment of dissolution models providing mechanistic and quantitative description of
the dissolution process. The understanding of material interactions, microstructural
features, and dissolution models can then be used in designing the tablet by optimizing its
microstructure, starting another round of characterization (if necessary).
The study opens up an approach in building an integrated formulation design and
characterization system incorporating microstructural analysis. In this chapter we
summarize the conclusions and impact generated.
195

Microstructure Qualitative MaterialAcquisition Analysis Interactions
Micro & NanoCTFIB-SEM
Quantitative MicrostructuralAnalysis Features
Holder & PaddleDissolution Tests
Dissolution Dissolution MicrostructureMechanism Model Design
Figure 9-1 Workflow for tablet microstructure characterization and design.
9.1 Conclusion
Firstly, microCT imaging and analysis were shown to provide novel information of tablet
microstructure, bridging our knowledge about the different components of
pharmaceutical manufacturing and enabling a thorough understanding of the process.
e Qualitative microCT analysis could untangle the material interactions during
manufacturing process, leading to clear pictures of unit operation mechanism. It
could also describe the microstructure with representative structural modules,
which helps understand arrangement patterns of the porosity network and
provides guidance for quantitative analysis.
e Quantitative microCT analysis via numerical simulation of liquid intrusion is a
reliable method for calculating the permeability of pharmaceutical tablets. It
establishes permeability as a new parameter in quantitative description of tablet
dissolution properties. Mercury porosimetry calculation of permeability is
error-prone due to an intrinsic defect in the methodology adopted. At the same
tablet hardness/porosity level, lactose dominant tablets have much higher
permeability values than compound-A dominant tablets.
196

* Quantitative microCT analysis of tablet coating enables visualized inspection of
location-dependent tablet coating quality, providing specific guidance for
improvements in coating procedures.
" Resolution and speed are two major limitations for wide-spread adoption of
microstructure analysis utilizing microCT. The resolution issue is being solved
with the development nanoCT or alternative technologies like FIB-SEM. The
speed issue is being addressed via the development of hardware and software.
Secondly, the design and application of tablet holder for paddle dissolution brings a
convenient tool for probing dissolution mechanism, enabling the classification of
dissolution mechanisms and identification of correspondent formulation design strategies.
" Paddle dissolution with tablet holder establishes a dissolution scenario with
consistent hydrodynamics and exposed tablet surface area. In addition,
disintegration due to medium penetration and tablet swelling is suppressed. This
leads to a surface dissolution process that can be described with a physical /
mathematical model.
* Two dissolution scenarios are identified for the surface dissolution process in
holder test: surface-dissolving-limited scenario and convective-diffusion-limited
scenario. In a typical paddle dissolution setup, lactose dominant tablets belong to
the former while compound-A dominant tablets belong to the latter.
" Combining holder dissolution and paddle dissolution tests reveals an important
contribution of disintegration to the paddle dissolution speed of lactose dominant
tablets. It also helps identify a tablet density threshold between sink scenario and
floating scenario in paddle dissolution test. The density threshold is 110% of the
dissolution medium density in paddle dissolution test with 50 RPM agitation
speed.
197

Thirdly, when the permeability simulation results are integrated with dissolution
investigation, we identified a new way to dissect paddle dissolution speed of lactose
dominant tablets into disintegration speed and surface dissolution speed. The
disintegration speed is proportional to a disintegration factor and the square of
permeability values. The surface dissolution speed is dependant upon the dissolution
mechanism identified in holder dissolution test. In a convective-diffusion-limited
scenario, it is controlled by the hydrodynamic conditions around the tablet; in a surface-
dissolving-limited scenario, it is controlled by the tablet surface area in contact with
dissolution medium.
In this study we also developed a compound-A roller compaction formulation from
scratch. The development started with fundamental understanding of material properties
and was adjusted according to specific problems discovered through the process. When
compared with a benchmark formulation, the M-series formulation features fewer
manufacturing steps and ingredients, is continuous-manufacturing friendly, and exhibits
superior dissolution properties.
Lastly, in the investigation of hardness and dissolution of caffeine-lactose tablets, we
demonstrated that moisture in storage environment could have a clear impact on these
tablet properties. High moisture level tends to increase the tablet hardness and slow
down the dissolution process. The extent of the impact is related with tablet
microstructure. High porosity and interconnectivity would facilitate the intrusion of
moisture and thus results in a larger impact on the tablet properties.
9.2 Impact
The study presents a fully integrated tablet characterization system that clearly reveals
material interactions during the manufacturing process, the tablet microstructure formed,
and the tablet properties resulted. Establishment of an excipient microstructural library
(EML) and the rational formulation / process development procedures incorporating
198
EML could dramatically increase the efficiency of the development process, potentially
leading to simpler formulations with less manufacturing steps and better tablet properties.
The characterization system could also be used in manufacture settings, establishing new
quality assurance dimensions and helping investigate manufacturing problems or changes.
The characterization of tablet microstructure and the numerical simulation represent a
novel approach in quantitative investigation and application of tablet microstructure. It
provides a practical example in how microstructure could be utilized to derive critical
information for understanding tablet properties. The numerical simulation introduces a
new parameter, tablet permeability, as an indicator of tablet dissolution properties. This
leads to the proposal of a mathematical approach to separate the contributions to general
dissolution from disintegration and surface dissolution, enhancing our understanding of
the dissolution process and facilitating Quality by Design.
The design and application of the tablet holder in paddle dissolution help classify
formulations into categories of different dissolution mechanisms. With distinctive
drivers of dissolution process identified for each mechanism, tunable formulations can be
developed with specific microstructure design strategy.
This work provides a strategy for building an integrated formulation design and
characterization system incorporating microstructural analysis. It opens up an approach
in which microstructure becomes a critical target for design and optimization.
199

200

Appendix A Procedures for Numerical Simulation
The numerical simulation is conducted via a modified set of C and Fortran computerprograms originally developed by NIST for geosciences research. The original codescould be downloaded at ftp://ftp.nist.gov/pub/bfrl/bentz/permsolver.
I. Preparation of Simulation Environment
The codes are designed to be run on Linux or UNIX platforms. In order to create aLinux-like platform on a Windows-based system with proper compilers, the followingprocedure is recommended.
1. Download Cygwin software installer from www.cygwin.com. Cygwin createsa Linux-like environment in Windows.
2. Install Cygwin. When asked to select packages, expand Devel subcategoryand choose the following items: gcc-core, gcc-g77, gdb. Proceed withinstallation as instructed.
II. Modification of Codes
The codes need to be modified in order to run successfully in the Cygwin environmentwith microCT-derived microstructure. Please refer to NISTIR7416.pdf for more detailedinformation.
1. In the following files, replace jishft and jiand commands with ishft and iand:readp.f, readvx.f, readvy.f, readvz.f. For the files to be displayed correctly,a code text editer might be needed.
2. The file Inpuf256 contains a list of input parameters. The ones need to bechanged are pl and pr, which are the pressures applied at the left and right sideof the microstructure, respectively. Typically a pressure drop of one unit pervoxel is used. For example, for a 300X300X300 microstructure, pl would be301 and pr would be 1.
3. The file befeed256 contains the common variable list and sets the dimensionsof the system and the number of expected porosity (pressure) nodes. Thedefault dimension is 300X300X300. The correspondent statement isparameter (ix=304,iy=304,iz=304). The values of ix, iy, and iz are 4 greaterthan 300 to allow for a two-voxel rim surrounding the microstructure for theimplementation of the periodic boundary conditions. The statement should bechanged to reflect the dimension of your microstructure to be tested. Anotherimportant parameter to change in this file is the expected maximum number of
201

porosity nodes, which is a one-dimensional array used to store the information.The current statements are like:common/tabs1/lvxi(7500000),1vyi(7500000),lvzi(7500000)indicating an expected maximum porosity on the order of7,500,000/300/300/300 = 27.8 %. If the system porosity is greater than this,all arrays dimensioned at 7,500,000 should be increased accordingly. Whenthe befeed256 file is modified, the perm3d3.f program has to be recompiledfor these changes to be implemented into the executable version (perm3d3).
III. Compilation of Codes
The two sets of codes need to be compiled into executable files within the Cygwinenvironment using the compilers that we installed earlier on.
1. Open a Cygwin window, use CD command to change directory to the folder/permsolver.
2. Use the following command to compile the pre-processor C code:cc microperm.c -o microperm -m
3. Use the following command to compile the permeability solver Fortran code:177 perm3d3.f -o perm3d3 -1m
4. Step 2 and 3 should lead to two new executable files in the same folder.
IV. Preparation of Microstructure Data
The microCT data needs to be converted into a binary data set with material shown as 1and pores shown as 0, in order for it to be recognized by the programs.
1. Load a set of consecutive microCT 2-D reconstructured images in Avizo 6software in Luminosity mode.
2. Crop the images into a cubic with the size specified in the programs.
3. Apply thresholding to the data. Pores should be assigned value 0 instead of 1in this case. For example, if in the previous procedure a threshold window of0-11 is used, in this case we should use 12-255.
4. Save data in 3-D raw data format.
V. Generating Data Structure for Simulation
The pre-processor microperm is used to convert the 3-D microCT raw data into astructure that could be recognized by the permeability solver.
202

1. Copy the 3-D raw data file to the folder of /permsolver and rename it toimage3d.
2. Start a Cygwin window and CD to the folder, start the pre-processor bytyping ./microperm
3. When asked, put in a random number and press Enter.
4. Choose option 13 to read in the microstructure data, then choose 9, 10, 11, and12 to generate the data structure files needed for simulation.
5. Choose 15 to exit the program.
VI. Simulation of Liquid Intrusion and Calculation of Permeability
The permeability solver is finally used to simulate the process of liquid intrusion andcalculate the permeability of the materials.
1. Use the following command to start the simulation./perm3d3 >perm3d3.out &
2. When the simulation is finished, two files are generated: perm256 for velocityand press256 for pressure. They record the correspondent values at fourdifferent depths of the microstructure. Average the four values in perm256 toobtain the average velocity of the fluid.
3. Permeability (m2) = LiquidVelocity/RenoldsNumber*Resolution 2, whereRenoldsNum is preset as 0.1 in Inpuf256 file, Resolution is the scanningresolution of microCT. A better unit of permeability is Darcy or miliDarcy.One Darcy is equal to the flow of 1 ml of fluid of 1 centipoise viscosity in 1second under a pressure gradient of 1 atmosphere across a lcm2 and 1 cm longsection of porous material. 1 miliDarcy = 0.001 Darcy =1X1O' 5 m2
4. The data files generated during the simulation should now be removed fromthe original file folder and stored separately.
203

204

Appendix B Procedures for 3-D Pore StructureRepresentation
The detailed workflow for 3-D pore structure representation is listed below, with codesattached. The workflow is the result of collaboration with Marsh Mike and Shawn Zhangfrom Visualization Sciences Group. Marsh Mike provided significant technical supporton programming, while Shawn offered constructive suggestions in workflow design.
Workflow step-by-step:1. Load data.2. Crop data. (CropEditor)3. Upsample data by 4x (Resample module)4. Threshold data on interval [O,a] (Quantification-Threshold)5. Autoskeleton with Distance Map6. SpatialGraphToLineSet Generate lineset7. linesetToCluster.hx Generate cluster8. ThroatFraction.scro Determination of Pore or Throat9. SurfaceGen Generate surface10. DemoMaker Create Animation
Steps 2-5 are handled by distanceHistogram.scroStep 7 is handled by linesetToCluster.hxStep 8 is handled ThroatFraction.scro
Detailed file names within the codes might need to be adjusted according to the namingin actual processing. The codes are listed below.
205

distanceHistogram.scro
#Amira-Script-Object V3.0
$this proc createUl {} {
$this newPortlntTextN xCrop 2$this newPortlntTextN yCrop 2$this newPortlntTextN zCrop 2
$this newPortlntTextN resampleFactor 1$this resampleFactor setValue 4
$this newPortlntSlider lowerBound$this newPortlntSlider upperBound$this upperBound setMinMax 0 11$this upperBound setValue 11
}
$this proc connectDataUpdateUl {newData} {set dims [$newData getDims]$this xCrop setValue 1 [expr [lindex $dims 0] - 1]$this yCrop setValue 1 [expr [lindex $dims 1] - 1]$this zCrop setValue 1 [expr [lindex $dims 2] - 1]
set min [lindex [$newData getRange] 0]set max [lindex [$newData getRange] 1]$this lowerBound setMinMax $min $max$this lowerBound setValue $min$this upperBound setMinMax $min $max$this upperBound setValue 11
}
########################################################################
$this proc constructor {} {$this createUl$this newPortDolt action
}
206

$this proc apply {} {
#Crop the input data$this setVar cropEditor [create HxImageCrop][$this getVar cropEditor][$this getVar cropEditor][$this getVar cropEditor][$this getVar cropEditor][$this getVar cropEditor][$this getVar cropEditor][$this getVar cropEditor][$this getVar cropEditor]
attach [$this data source]setMinX [$this xCrop getValue 0]setMaxX [$this xCrop getValue 1]setMinY [$this yCrop getValue 0]setMaxY [$this yCrop getValue 1]setMinZ [$this zCrop getValue 0]setMaxZ [$this zCrop getValue 1]dolt
#Resample the cropped data$this setVar resample [create HxResample][$this getVar resample] data connect [$this data source][$this getVar resample] mode setValue 0set dims [[$this data source] getDims][$this getVar resample] resolution setValue 0 [expr [lindex
resampleFactor getValue]][$this getVar resample] resolution setValue 1 [expr [lindex
resampleFactor getValue]][$this getVar resample] resolution setValue 2 [expr [lindex
resampleFactor getValue]][$this getVar resample] action setValue 0[$this getVar resample] fire$this setVar resampled [[$this getVar resample] getResult]remove [$this getVar resample]
#Threshold the resampled dataset thresholded [create HxAnnaScalarField3 [$this data source].bin]remove $thresholded$this setVar quant [create HxVisilog][$this getVar quant] exeCommand "cmd=threshold input=[$this getVar
resampled] param={[$this lowerBound getValue],[$this upperBound getValue]}output=$thresholded"
$this setVar thresholded $thresholded
#Skeltonize the thresholded data$this setVar autoSkeleton [create HxExtAutoSkeleton][$this getVar autoSkeleton] data connect $thresholded[$this getVar autoSkeleton] Options setValue 0 1[$this getVar autoSkeleton] Options setValue 1 0[$this getVar autoSkeleton] ExposeObjects setValue 0 1
207
$dims 0] * [$this
$dims 1] * [$this
$dims 2] * [$this

[$this getVar autoSkeleton] Threshold setValue 0.4[$this getVar autoSkeleton] dolt setValue 0[$this getVar autoSkeleton] fire[$this getVar autoSkeleton] Threshold setValue 0.4[$this getVar autoSkeleton] dolt setValue 0[$this getVar autoSkeleton] fire#remove [$this getVar autoSkeleton]
#Display histogram$this setVar histogram [create HxHistogram]foreach object [all] {
if { [string match *DistField $object] } {$this setVar distMap $object
}if { [string match *SptGraph $object] } {
$this setVar graph $object}
}[$this getVar histogram] data connect [$this getVar distMap][$this getVar histogram] action hit[$this getVar histogram] fire[$this getVar histogram] data disconnect
#Cast pores binary map as labelfield$this setVar cf [create HxCastField][$this getVar ef] data connect [$this getVar thresholded][$this getVar cf] outputType setValue 6[$this getVar cf] action hit[$this getVar ef] fireset porosityLabelfield [[$this getVar cf] getResult]remove [$this getVar thresholded]remove [$this getVar cf]
#Use Material Statistics to make spreadsheetset matStat [create HxTissueStatistics]$matStat data connect $porosityLabelfield$matStat dolt hit$matStat fireset sheet [$matStat getResult]remove $matStatremove $porosityLabelfield
#Compute and display Porosityset matrix [$sheet getValue 2 0]set pores [$sheet getValue 2 1]
208

set porosity [expr $pores / ( $pores + $matrix)]$this newPortInfo porosityInfo$this porosityInfo setLabel Porosity$this porositylnfo setValue $porosityremove $sheet
remove [$this getVar resampled]remove [$this getVar graph]remove [$this getVar quant][$this getVar distMap] setLabel distanceMap[$this getVar histogram] setLabel Histogram. [$this data source]
remove *DistFieldremove *SptGraph
}
$this proc destructor {} {#remove [$this getVar histogram]remove [$this getVar distMap]
}
########################################################################$this proc compute {} {
set data [$this data source]if {$data == ""} {
return}
#if { [$this isFirstCall] } {#return
#}
#update for new Dataif { [$this data isNew] } {
$this connectDataUpdateUl [$this data source]
}
if { [$this action wasHit] } {$this apply
}}
209

LineSetToCluster.hx# Avizo Script
proc makeCluster { LineSet distanceMap } {#initialize PointProbeset probe [create HxPointProbe]$probe data connect $distanceMap$probe lineOptions setValue 0 1$probe lineOptions setValue 11
#initialize Clusterset cluster [create HxCluster]$cluster setNumDataColumns 1$cluster setDataColumnName 0 "Distance"
#Add LineSet points to clusterset numPoints [$LineSet getNumPoints]for { set pointIndex 0} {$pointIndex < $numPoints} {set pointIndex [expr
$pointIndex+1]} {set position [LineSet getPoint $pointIndex]set x [format %f [lindex $position 0]]set y [format %f [lindex $position 1]]set z [format %f [lindex $position 2]]$probe controlpoint setValue $x $y $z$probe fireset distance [$probe currentValue]
$cluster addPoint $x $y $z#$cluster setld $pointlndex $pointlndex$cluster setDataValue 0 $pointIndex $distance
}remove $probereturn $cluster
}
#makeCluster LineSet image l.DistFieldmakeCluster LineSet imagel1.DistField
210

Throatfraction.scro
#Amira-Script-Object
$this proc constructor {} {$this script show$this newPortConnection cluster HxCluster$this newPortFloatSlider pointDisplaySize$this pointDisplaySize setMinMax 0 .5$this pointDisplaySize setValue 0.1$this newPortFloatSlider distanceThreshold$this distanceThreshold setMinMax 1 50$this newPortFloatSlider k$this k setMinMax 0 100$this k setValue 1$this newPortInfo throatVolume$this newPortInfo poreVolume$this newPortInfo throatFraction
}
$this proc computeVolume { k } {set throatVolume 0set poreVolume 0
set numPoints [[$this cluster source] getNumPoints]for { set index 0 } { [expr $index < $numPoints] } { set index [expr $index + 1] }
{set distance [[$this cluster source] getDataValue 0 $index]set additionalVolume [expr $distance * $distance * $distance * $k]
if { [expr $distance < [$this distanceThreshold getValue] ] } {set throatVolume [expr $throatVolume + $additionalVolume]
} else {set poreVolume [expr $poreVolume + $additionalVolume]
}}$this throatVolume setValue $throatVolume$this poreVolume setValue $poreVolume
$this throatFraction setValue [expr $throatVolume / ($throatVolume +$poreVolume)]
}
211

$this proc destructor {} {remove [$this getVar throatView]remove [$this getVar poreView]
}
$this proc compute {} {if {[$this cluster isNew]} {
if {[$this cluster source] != "" } {$this newCluster
}}if {[$this distanceThreshold isNew]|| [$this k isNew] } {
echo updatingDistanceThresholdset threshold [$this distanceThreshold getValue]
[$this getVar throatView] filter setValue "(D<$threshold)"[$this getVar throatView] fire
[$this getVar poreView] filter setValue "(D>=$threshold)"[$this getVar poreView] fire
$this computeVolume [ expr [$this k getValue] * [$this k getValue]]}
if {[$this pointDisplaySize isNew]} {[$this getVar throatView] sphereScale setValue [$this pointDisplaySize
getValue][$this getVar throatView] fire
[$this getVar poreView] sphereScale setValue [$this pointDisplaySizegetValue]
[$this getVar poreView] fire}
}
$this proc newCluster {} {echo attaching newCluster$this setVar throatView [create HxClusterView][$this getVar throatView] data connect [$this cluster source][$this getVar throatView] options setValue 0 1[$this getVar throatView] options setValue 11[$this getVar throatView] options setValue 4 1[$this getVar throatView] sphereScale setValue 0.10[$this getVar throatView] colormap setDefaultColor 0 0 1[$this getVar throatView] filter setValue "(D<5)"[$this getVar throatView] fire
212

$this setVar poreView [create HxClusterView][$this getVar poreView] data connect [$this cluster source][$this getVar poreView] options setValue 0 1[$this getVar poreView] options setValue 11[$this getVar poreView] options setValue 4 1[$this getVar poreView] sphereScale setValue 0.10[$this getVar poreView] filter setValue "(D>=6)"[$this getVar poreView] fire
}
213