Tire rating based on soil compaction capacity
16
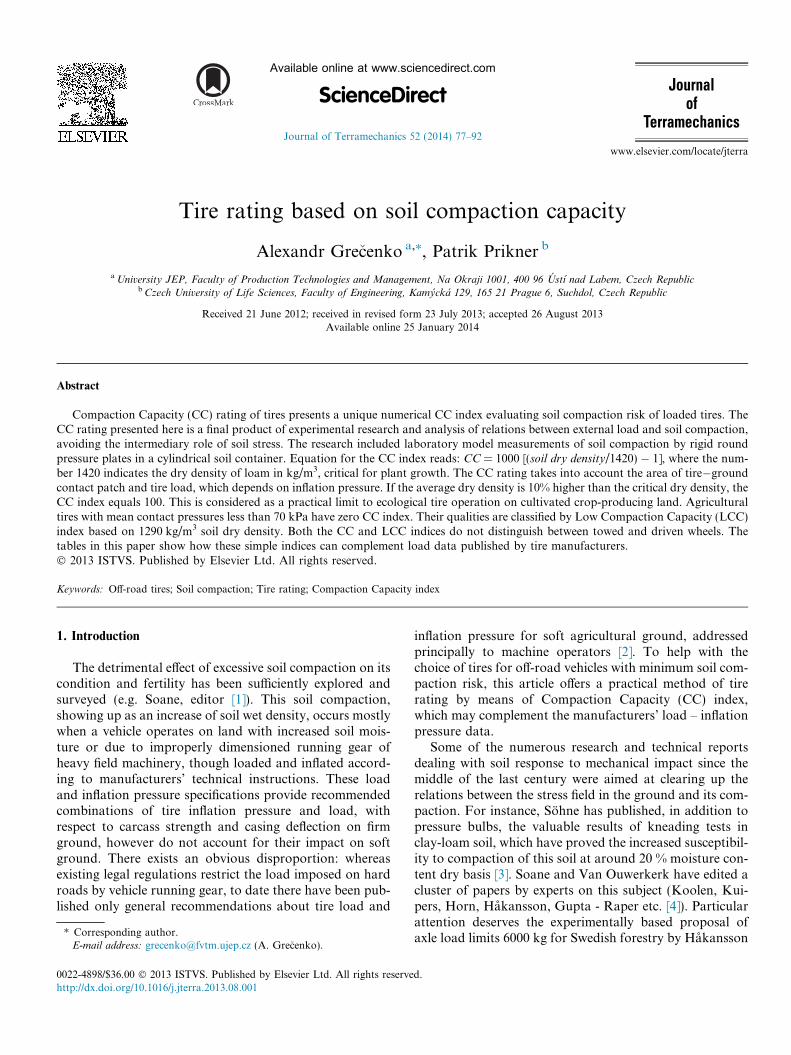
Tire rating based on soil compaction capacity Alexandr Grec ˇenko a,⇑ , Patrik Prikner b a University JEP, Faculty of Production Technologies and Management, Na Okraji 1001, 400 96 U ´ stı ´ nad Labem, Czech Republic b Czech University of Life Sciences, Faculty of Engineering, Kamy ´ cka ´ 129, 165 21 Prague 6, Suchdol, Czech Republic Received 21 June 2012; received in revised form 23 July 2013; accepted 26 August 2013 Available online 25 January 2014 Abstract Compaction Capacity (CC) rating of tires presents a unique numerical CC index evaluating soil compaction risk of loaded tires. The CC rating presented here is a final product of experimental research and analysis of relations between external load and soil compaction, avoiding the intermediary role of soil stress. The research included laboratory model measurements of soil compaction by rigid round pressure plates in a cylindrical soil container. Equation for the CC index reads: CC = 1000 [(soil dry density/1420) 1], where the num- ber 1420 indicates the dry density of loam in kg/m 3 , critical for plant growth. The CC rating takes into account the area of tireground contact patch and tire load, which depends on inflation pressure. If the average dry density is 10% higher than the critical dry density, the CC index equals 100. This is considered as a practical limit to ecological tire operation on cultivated crop-producing land. Agricultural tires with mean contact pressures less than 70 kPa have zero CC index. Their qualities are classified by Low Compaction Capacity (LCC) index based on 1290 kg/m 3 soil dry density. Both the CC and LCC indices do not distinguish between towed and driven wheels. The tables in this paper show how these simple indices can complement load data published by tire manufacturers. Ó 2013 ISTVS. Published by Elsevier Ltd. All rights reserved. Keywords: Off-road tires; Soil compaction; Tire rating; Compaction Capacity index 1. Introduction The detrimental effect of excessive soil compaction on its condition and fertility has been sufficiently explored and surveyed (e.g. Soane, editor [1]). This soil compaction, showing up as an increase of soil wet density, occurs mostly when a vehicle operates on land with increased soil mois- ture or due to improperly dimensioned running gear of heavy field machinery, though loaded and inflated accord- ing to manufacturers’ technical instructions. These load and inflation pressure specifications provide recommended combinations of tire inflation pressure and load, with respect to carcass strength and casing deflection on firm ground, however do not account for their impact on soft ground. There exists an obvious disproportion: whereas existing legal regulations restrict the load imposed on hard roads by vehicle running gear, to date there have been pub- lished only general recommendations about tire load and inflation pressure for soft agricultural ground, addressed principally to machine operators [2]. To help with the choice of tires for off-road vehicles with minimum soil com- paction risk, this article offers a practical method of tire rating by means of Compaction Capacity (CC) index, which may complement the manufacturers’ load – inflation pressure data. Some of the numerous research and technical reports dealing with soil response to mechanical impact since the middle of the last century were aimed at clearing up the relations between the stress field in the ground and its com- paction. For instance, So ¨ hne has published, in addition to pressure bulbs, the valuable results of kneading tests in clay-loam soil, which have proved the increased susceptibil- ity to compaction of this soil at around 20 % moisture con- tent dry basis [3]. Soane and Van Ouwerkerk have edited a cluster of papers by experts on this subject (Koolen, Kui- pers, Horn, Ha ˚kansson, Gupta - Raper etc. [4]). Particular attention deserves the experimentally based proposal of axle load limits 6000 kg for Swedish forestry by Ha ˚kansson 0022-4898/$36.00 Ó 2013 ISTVS. Published by Elsevier Ltd. All rights reserved. http://dx.doi.org/10.1016/j.jterra.2013.08.001 ⇑ Corresponding author. E-mail address: [email protected] (A. Grec ˇenko). www.elsevier.com/locate/jterra Available online at www.sciencedirect.com ScienceDirect Journal of Terramechanics 52 (2014) 77–92 Journal of Terramechanics
Transcript of Tire rating based on soil compaction capacity
Available online at www.sciencedirect.com
Journal
www.elsevier.com/locate/jterra
ScienceDirect
Journal of Terramechanics 52 (2014) 77–92
ofTerramechanics
Tire rating based on soil compaction capacity
Alexandr Grecenko a,⇑, Patrik Prikner b
a University JEP, Faculty of Production Technologies and Management, Na Okraji 1001, 400 96 Ustı nad Labem, Czech Republicb Czech University of Life Sciences, Faculty of Engineering, Kamycka 129, 165 21 Prague 6, Suchdol, Czech Republic
Received 21 June 2012; received in revised form 23 July 2013; accepted 26 August 2013Available online 25 January 2014
Abstract
Compaction Capacity (CC) rating of tires presents a unique numerical CC index evaluating soil compaction risk of loaded tires. TheCC rating presented here is a final product of experimental research and analysis of relations between external load and soil compaction,avoiding the intermediary role of soil stress. The research included laboratory model measurements of soil compaction by rigid roundpressure plates in a cylindrical soil container. Equation for the CC index reads: CC = 1000 [(soil dry density/1420) � 1], where the num-ber 1420 indicates the dry density of loam in kg/m3, critical for plant growth. The CC rating takes into account the area of tire�groundcontact patch and tire load, which depends on inflation pressure. If the average dry density is 10% higher than the critical dry density, theCC index equals 100. This is considered as a practical limit to ecological tire operation on cultivated crop-producing land. Agriculturaltires with mean contact pressures less than 70 kPa have zero CC index. Their qualities are classified by Low Compaction Capacity (LCC)index based on 1290 kg/m3 soil dry density. Both the CC and LCC indices do not distinguish between towed and driven wheels. Thetables in this paper show how these simple indices can complement load data published by tire manufacturers.� 2013 ISTVS. Published by Elsevier Ltd. All rights reserved.
Keywords: Off-road tires; Soil compaction; Tire rating; Compaction Capacity index
1. Introduction
The detrimental effect of excessive soil compaction on itscondition and fertility has been sufficiently explored andsurveyed (e.g. Soane, editor [1]). This soil compaction,showing up as an increase of soil wet density, occurs mostlywhen a vehicle operates on land with increased soil mois-ture or due to improperly dimensioned running gear ofheavy field machinery, though loaded and inflated accord-ing to manufacturers’ technical instructions. These loadand inflation pressure specifications provide recommendedcombinations of tire inflation pressure and load, withrespect to carcass strength and casing deflection on firmground, however do not account for their impact on softground. There exists an obvious disproportion: whereasexisting legal regulations restrict the load imposed on hardroads by vehicle running gear, to date there have been pub-lished only general recommendations about tire load and
0022-4898/$36.00 � 2013 ISTVS. Published by Elsevier Ltd. All rights reserve
http://dx.doi.org/10.1016/j.jterra.2013.08.001
⇑ Corresponding author.E-mail address: [email protected] (A. Grecenko).
inflation pressure for soft agricultural ground, addressedprincipally to machine operators [2]. To help with thechoice of tires for off-road vehicles with minimum soil com-paction risk, this article offers a practical method of tirerating by means of Compaction Capacity (CC) index,which may complement the manufacturers’ load – inflationpressure data.
Some of the numerous research and technical reportsdealing with soil response to mechanical impact since themiddle of the last century were aimed at clearing up therelations between the stress field in the ground and its com-paction. For instance, Sohne has published, in addition topressure bulbs, the valuable results of kneading tests inclay-loam soil, which have proved the increased susceptibil-ity to compaction of this soil at around 20 % moisture con-tent dry basis [3]. Soane and Van Ouwerkerk have edited acluster of papers by experts on this subject (Koolen, Kui-pers, Horn, Hakansson, Gupta - Raper etc. [4]). Particularattention deserves the experimentally based proposal ofaxle load limits 6000 kg for Swedish forestry by Hakansson
d.
Nomenclature
Abbreviations and definitions
AR aspect ratio of tire section ht/bt
C as subscript: referring to pressureplate C
CC or LCC index numerical value of CC ratingCC rating tire Compaction Capacity rating
(qs P 70 kPa)CF compaction function qd = f (zp, qs)conversion change of CFC into CFX or CPX
explained in part 4.2CP compaction profile qd = f (zt, qs)LCC rating tire Low Compaction Capacity
rating (35 kPa 6 qs 6 70 kPa)modeling imprint imprint of loaded pressure plate C
into standard soil in the soil con-tainer
p as subscript referring to laboratorysoil container
SGP equation equation for calculating tirefootprint area ST on firm ground(cm2)
standard soil clay loam with status defined inSection 2.1
t as subscript referring to a tire orterrain
Symbols
b tire footprint width on firmground, Eq. (8) (cm)
bt tire section width (cm)dr rim diameter (cm or inches)dt tire outer diameter (cm)ht tire section height, Eq. (7a) (cm)l tire footprint length on firm
ground, Eq. (8) (cm)rs tire static loaded radius (cm)
q effective contact pressure for a tirefootprint area, Eqs. (C3) and (B3)(kPa)
qs mean contact pressure for a roundor square plate (kPa)
tp depth of the modeling imprint (cm)tt average depth of the rut pressed by
a tire (cm)zd depth below the ground surface (cm)zp depth below the modeling imprint
(cm)zt depth below the tire footprint in
standard soil (cm)SC area of the standard pressure plate
C (cm2)SP area of an arbitrary pressure plate
(cm2)ST footprint (contact) area of a tire
(cm2)qd soil dry density (the weight of sol-
ids per unit of total volume of soilmass, kg/m3)
qdl standard soil dry density 1420 kg/m3 for the CC rating
qdL reference soil dry density 1290 kg/m3 for the LCC rating
qdm maximum dry density of standardsoil at 93% saturation with water(kg/m3)
qdo dry density at zero depth zp or zt
(kg/m3)qds average dry density in the depth
range zd = 20 to 50 cm (kg/m3)qr relative dry density equal to
(qd � qdl or qd � qdL) (kg/m3)
78 A. Grecenko, P. Prikner / Journal of Terramechanics 52 (2014) 77–92
[5]. The specialized VDI guidelines [6] brought practical,scientifically founded advices to machine operators howto dispose of soft ground.
Terramechanics is a technical branch developed particu-larly to study the interaction of a moving body with softground. Typically, the research in this field requires exper-iments in soft soil and their analysis to get conclusiveresults. The theoretical soil mechanics, originally developedfor purposes of civil engineering (e.g. design of founda-tions, dams, etc.), has particularly been available as a toolfor this research. This explains why the mechanical impactof running gear on soft ground was studied and expressedin terms of soil stresses in hope that it will be possible todefine the link between the stress field as cause and soilcompaction (three-dimensional strain) as the consequence.A sophisticated attempt of compaction modeling in thissense was for example reported by Bailey et al. [7]. Con-
cerning the stresses, Sohne succeeded to visualize theexpected isobaric lines in ideal soil under the tire footprintfor three levels of soil moisture content [3,8] by applyingthe Frohlich’s civil engineering stress concept [9]. Theselines became popular as pressure bulbs and due to theircomprehensiveness found good use at least in education.Up to the present day, the development of the envisagedsoil stress – compaction theory has proved unfeasible dueto extreme complexity of the case and uncertain correlationbetween the stress state and compaction of different soiltextures [[10, Section 19.29].
At present we observe a rapid development of computertechnologies and methods including the generally applica-ble finite element modeling. Promising contributions in thisrespect exist also in the discussed field, for example the arti-cle by Xia [11], which demonstrates the form and someeffects of a virtual tire on soft virtual ground. In general,
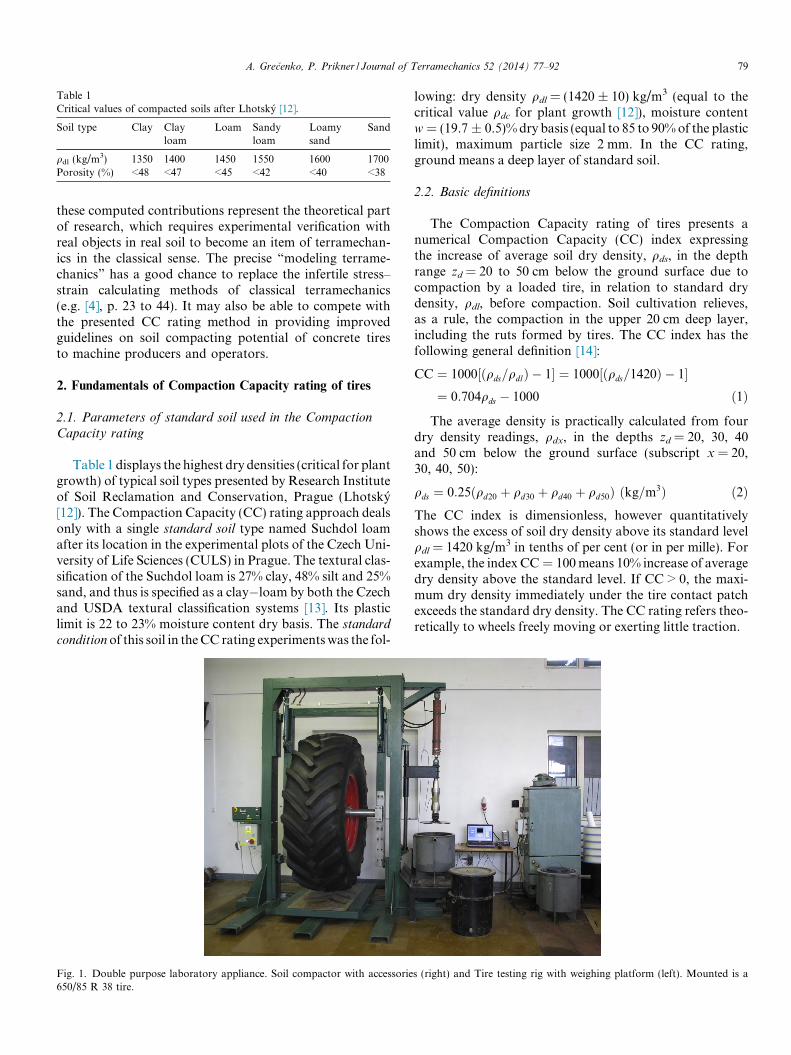
Table 1Critical values of compacted soils after Lhotsky [12].
Soil type Clay Clayloam
Loam Sandyloam
Loamysand
Sand
qdl (kg/m3) 1350 1400 1450 1550 1600 1700Porosity (%) <48 <47 <45 <42 <40 <38
A. Grecenko, P. Prikner / Journal of Terramechanics 52 (2014) 77–92 79
these computed contributions represent the theoretical partof research, which requires experimental verification withreal objects in real soil to become an item of terramechan-ics in the classical sense. The precise “modeling terrame-chanics” has a good chance to replace the infertile stress–strain calculating methods of classical terramechanics(e.g. [4], p. 23 to 44). It may also be able to compete withthe presented CC rating method in providing improvedguidelines on soil compacting potential of concrete tiresto machine producers and operators.
2. Fundamentals of Compaction Capacity rating of tires
2.1. Parameters of standard soil used in the Compaction
Capacity rating
Table 1 displays the highest dry densities (critical for plantgrowth) of typical soil types presented by Research Instituteof Soil Reclamation and Conservation, Prague (Lhotsky[12]). The Compaction Capacity (CC) rating approach dealsonly with a single standard soil type named Suchdol loamafter its location in the experimental plots of the Czech Uni-versity of Life Sciences (CULS) in Prague. The textural clas-sification of the Suchdol loam is 27% clay, 48% silt and 25%sand, and thus is specified as a clay�loam by both the Czechand USDA textural classification systems [13]. Its plasticlimit is 22 to 23% moisture content dry basis. The standard
condition of this soil in the CC rating experiments was the fol-
Fig. 1. Double purpose laboratory appliance. Soil compactor with accessorie650/85 R 38 tire.
lowing: dry density qdl = (1420 ± 10) kg/m3 (equal to thecritical value qdc for plant growth [12]), moisture contentw = (19.7 ± 0.5)% dry basis (equal to 85 to 90% of the plasticlimit), maximum particle size 2 mm. In the CC rating,ground means a deep layer of standard soil.
2.2. Basic definitions
The Compaction Capacity rating of tires presents anumerical Compaction Capacity (CC) index expressingthe increase of average soil dry density, qds, in the depthrange zd = 20 to 50 cm below the ground surface due tocompaction by a loaded tire, in relation to standard drydensity, qdl, before compaction. Soil cultivation relieves,as a rule, the compaction in the upper 20 cm deep layer,including the ruts formed by tires. The CC index has thefollowing general definition [14]:
CC ¼ 1000½ðqds=qdlÞ � 1� ¼ 1000½ðqds=1420Þ � 1�¼ 0:704qds � 1000 ð1Þ
The average density is practically calculated from fourdry density readings, qdx, in the depths zd = 20, 30, 40and 50 cm below the ground surface (subscript x = 20,30, 40, 50):
qds ¼ 0:25ðqd20 þ qd30 þ qd40 þ qd50Þ ðkg=m3Þ ð2ÞThe CC index is dimensionless, however quantitativelyshows the excess of soil dry density above its standard levelqdl = 1420 kg/m3 in tenths of per cent (or in per mille). Forexample, the index CC = 100 means 10% increase of averagedry density above the standard level. If CC > 0, the maxi-mum dry density immediately under the tire contact patchexceeds the standard dry density. The CC rating refers theo-retically to wheels freely moving or exerting little traction.
s (right) and Tire testing rig with weighing platform (left). Mounted is a
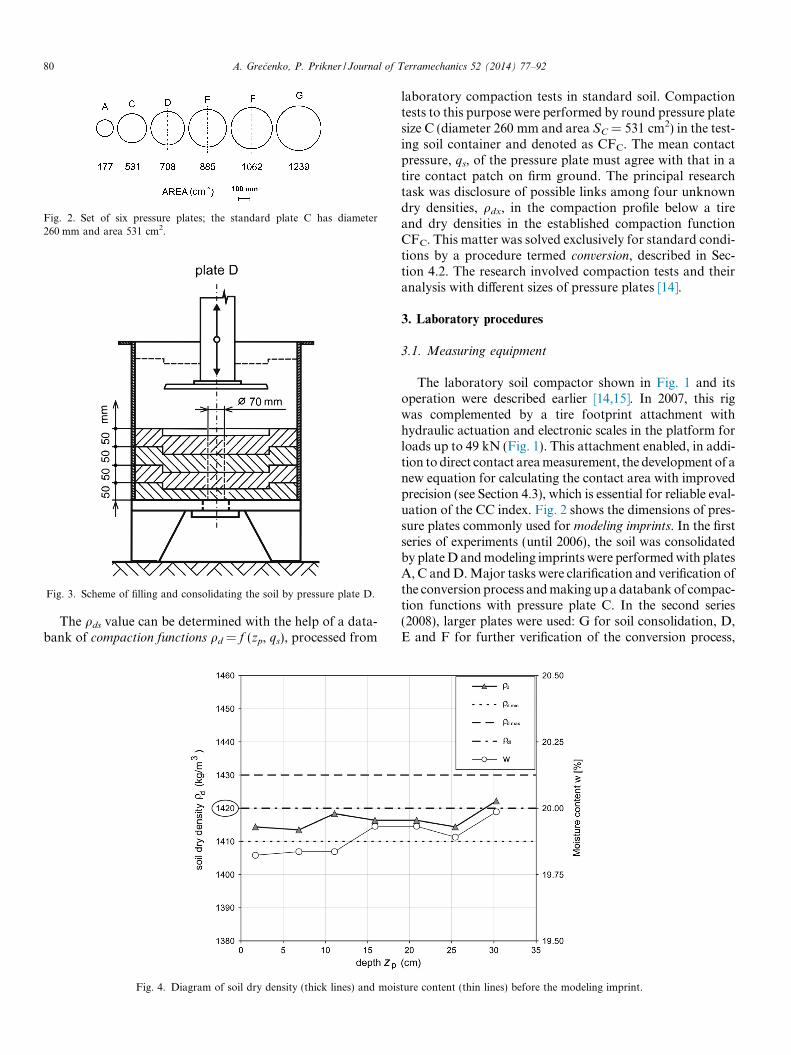
Fig. 2. Set of six pressure plates; the standard plate C has diameter260 mm and area 531 cm2.
Fig. 3. Scheme of filling and consolidating the soil by pressure plate D.
80 A. Grecenko, P. Prikner / Journal of Terramechanics 52 (2014) 77–92
The qds value can be determined with the help of a data-bank of compaction functions qd = f (zp, qs), processed from
Fig. 4. Diagram of soil dry density (thick lines) and mois
laboratory compaction tests in standard soil. Compactiontests to this purpose were performed by round pressure platesize C (diameter 260 mm and area SC = 531 cm2) in the test-ing soil container and denoted as CFC. The mean contactpressure, qs, of the pressure plate must agree with that in atire contact patch on firm ground. The principal researchtask was disclosure of possible links among four unknowndry densities, qdx, in the compaction profile below a tireand dry densities in the established compaction functionCFC. This matter was solved exclusively for standard condi-tions by a procedure termed conversion, described in Sec-tion 4.2. The research involved compaction tests and theiranalysis with different sizes of pressure plates [14].
3. Laboratory procedures
3.1. Measuring equipment
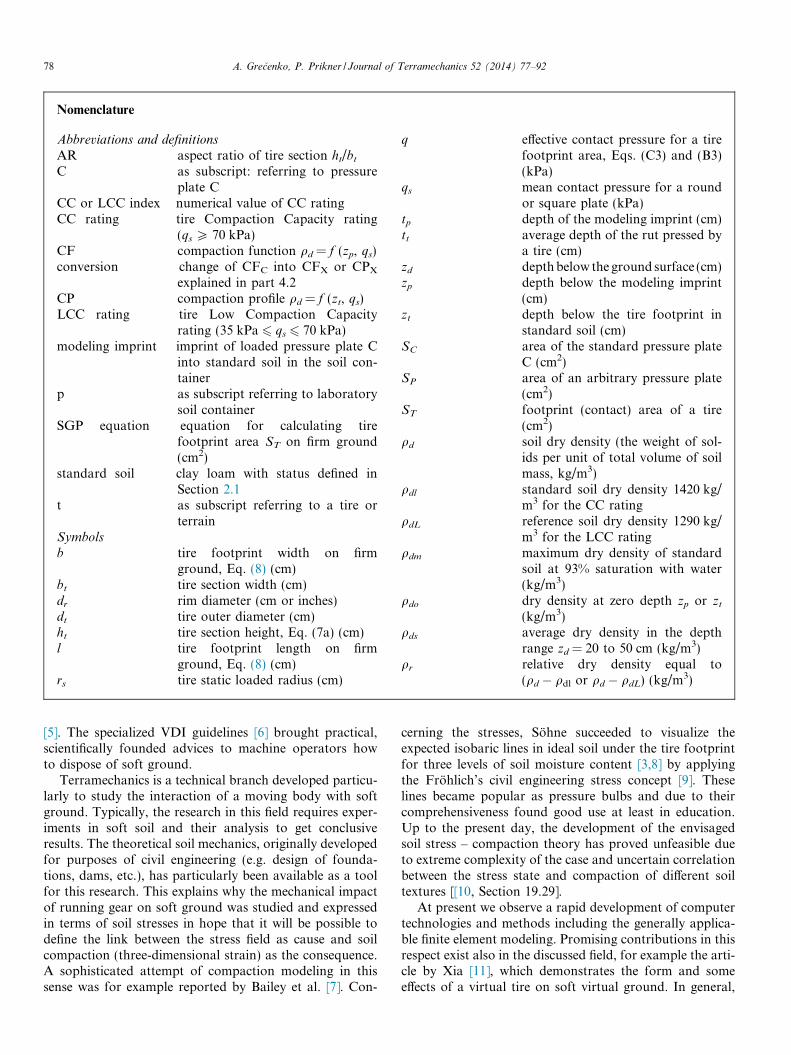
The laboratory soil compactor shown in Fig. 1 and itsoperation were described earlier [14,15]. In 2007, this rigwas complemented by a tire footprint attachment withhydraulic actuation and electronic scales in the platform forloads up to 49 kN (Fig. 1). This attachment enabled, in addi-tion to direct contact area measurement, the development of anew equation for calculating the contact area with improvedprecision (see Section 4.3), which is essential for reliable eval-uation of the CC index. Fig. 2 shows the dimensions of pres-sure plates commonly used for modeling imprints. In the firstseries of experiments (until 2006), the soil was consolidatedby plate D and modeling imprints were performed with platesA, C and D. Major tasks were clarification and verification ofthe conversion process and making up a databank of compac-tion functions with pressure plate C. In the second series(2008), larger plates were used: G for soil consolidation, D,E and F for further verification of the conversion process,
ture content (thin lines) before the modeling imprint.
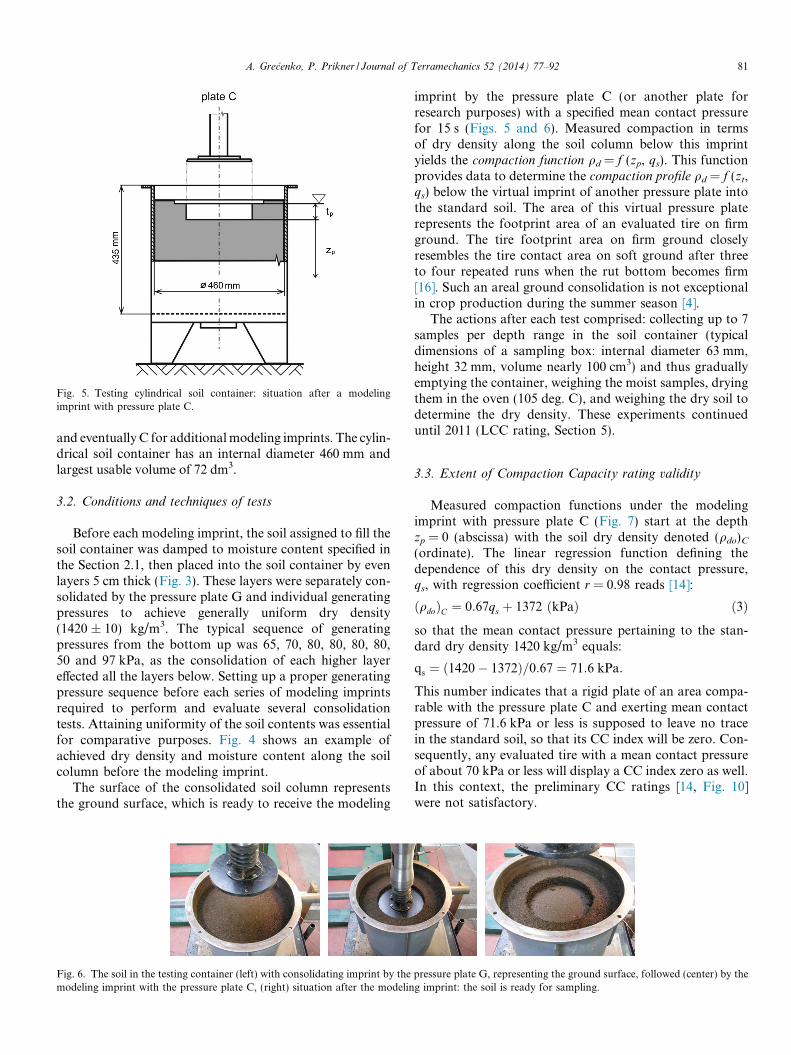
Fig. 5. Testing cylindrical soil container: situation after a modelingimprint with pressure plate C.
A. Grecenko, P. Prikner / Journal of Terramechanics 52 (2014) 77–92 81
and eventually C for additional modeling imprints. The cylin-drical soil container has an internal diameter 460 mm andlargest usable volume of 72 dm3.
3.2. Conditions and techniques of tests
Before each modeling imprint, the soil assigned to fill thesoil container was damped to moisture content specified inthe Section 2.1, then placed into the soil container by evenlayers 5 cm thick (Fig. 3). These layers were separately con-solidated by the pressure plate G and individual generatingpressures to achieve generally uniform dry density(1420 ± 10) kg/m3. The typical sequence of generatingpressures from the bottom up was 65, 70, 80, 80, 80, 80,50 and 97 kPa, as the consolidation of each higher layereffected all the layers below. Setting up a proper generatingpressure sequence before each series of modeling imprintsrequired to perform and evaluate several consolidationtests. Attaining uniformity of the soil contents was essentialfor comparative purposes. Fig. 4 shows an example ofachieved dry density and moisture content along the soilcolumn before the modeling imprint.
The surface of the consolidated soil column representsthe ground surface, which is ready to receive the modeling
Fig. 6. The soil in the testing container (left) with consolidating imprint by themodeling imprint with the pressure plate C, (right) situation after the modelin
imprint by the pressure plate C (or another plate forresearch purposes) with a specified mean contact pressurefor 15 s (Figs. 5 and 6). Measured compaction in termsof dry density along the soil column below this imprintyields the compaction function qd = f (zp, qs). This functionprovides data to determine the compaction profile qd = f (zt,qs) below the virtual imprint of another pressure plate intothe standard soil. The area of this virtual pressure platerepresents the footprint area of an evaluated tire on firmground. The tire footprint area on firm ground closelyresembles the tire contact area on soft ground after threeto four repeated runs when the rut bottom becomes firm[16]. Such an areal ground consolidation is not exceptionalin crop production during the summer season [4].
The actions after each test comprised: collecting up to 7samples per depth range in the soil container (typicaldimensions of a sampling box: internal diameter 63 mm,height 32 mm, volume nearly 100 cm3) and thus graduallyemptying the container, weighing the moist samples, dryingthem in the oven (105 deg. C), and weighing the dry soil todetermine the dry density. These experiments continueduntil 2011 (LCC rating, Section 5).
3.3. Extent of Compaction Capacity rating validity
Measured compaction functions under the modelingimprint with pressure plate C (Fig. 7) start at the depthzp = 0 (abscissa) with the soil dry density denoted (qdo)C
(ordinate). The linear regression function defining thedependence of this dry density on the contact pressure,qs, with regression coefficient r = 0.98 reads [14]:
ðqdoÞC ¼ 0:67qs þ 1372 ðkPaÞ ð3Þ
so that the mean contact pressure pertaining to the stan-dard dry density 1420 kg/m3 equals:
qs ¼ ð1420� 1372Þ=0:67 ¼ 71:6 kPa:
This number indicates that a rigid plate of an area compa-rable with the pressure plate C and exerting mean contactpressure of 71.6 kPa or less is supposed to leave no tracein the standard soil, so that its CC index will be zero. Con-sequently, any evaluated tire with a mean contact pressureof about 70 kPa or less will display a CC index zero as well.In this context, the preliminary CC ratings [14, Fig. 10]were not satisfactory.
pressure plate G, representing the ground surface, followed (center) by theg imprint: the soil is ready for sampling.
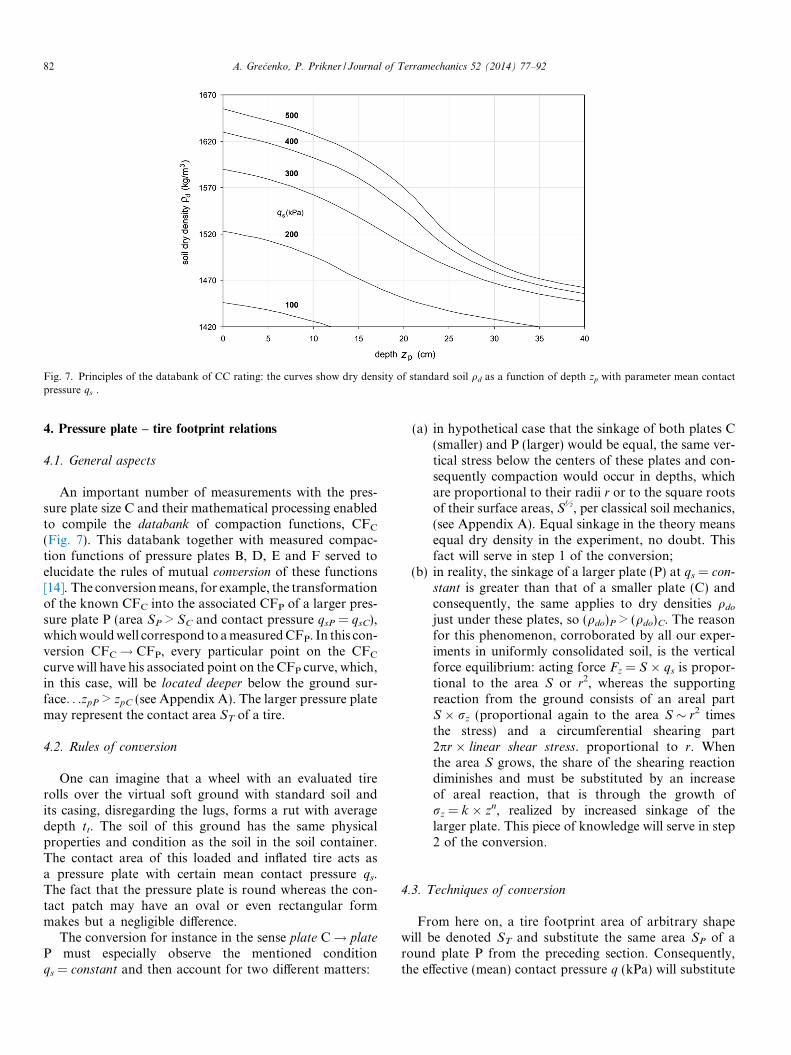
Fig. 7. Principles of the databank of CC rating: the curves show dry density of standard soil qd as a function of depth zp with parameter mean contactpressure qs .
82 A. Grecenko, P. Prikner / Journal of Terramechanics 52 (2014) 77–92
4. Pressure plate – tire footprint relations
4.1. General aspects
An important number of measurements with the pres-sure plate size C and their mathematical processing enabledto compile the databank of compaction functions, CFC
(Fig. 7). This databank together with measured compac-tion functions of pressure plates B, D, E and F served toelucidate the rules of mutual conversion of these functions[14]. The conversion means, for example, the transformationof the known CFC into the associated CFP of a larger pres-sure plate P (area SP > SC and contact pressure qsP = qsC),which would well correspond to a measured CFP. In this con-version CFC! CFP, every particular point on the CFC
curve will have his associated point on the CFP curve, which,in this case, will be located deeper below the ground sur-face. . .zpP > zpC (see Appendix A). The larger pressure platemay represent the contact area ST of a tire.
4.2. Rules of conversion
One can imagine that a wheel with an evaluated tirerolls over the virtual soft ground with standard soil andits casing, disregarding the lugs, forms a rut with averagedepth tt. The soil of this ground has the same physicalproperties and condition as the soil in the soil container.The contact area of this loaded and inflated tire acts asa pressure plate with certain mean contact pressure qs.The fact that the pressure plate is round whereas the con-tact patch may have an oval or even rectangular formmakes but a negligible difference.
The conversion for instance in the sense plate C! plate
P must especially observe the mentioned conditionqs = constant and then account for two different matters:
(a) in hypothetical case that the sinkage of both plates C(smaller) and P (larger) would be equal, the same ver-tical stress below the centers of these plates and con-sequently compaction would occur in depths, whichare proportional to their radii r or to the square rootsof their surface areas, S½, per classical soil mechanics,(see Appendix A). Equal sinkage in the theory meansequal dry density in the experiment, no doubt. Thisfact will serve in step 1 of the conversion;
(b) in reality, the sinkage of a larger plate (P) at qs = con-
stant is greater than that of a smaller plate (C) andconsequently, the same applies to dry densities qdo
just under these plates, so (qdo)P > (qdo)C. The reasonfor this phenomenon, corroborated by all our exper-iments in uniformly consolidated soil, is the verticalforce equilibrium: acting force Fz = S � qs is propor-tional to the area S or r2, whereas the supportingreaction from the ground consists of an areal partS � rz (proportional again to the area S � r2 timesthe stress) and a circumferential shearing part2pr � linear shear stress. proportional to r. Whenthe area S grows, the share of the shearing reactiondiminishes and must be substituted by an increaseof areal reaction, that is through the growth ofrz = k � zn, realized by increased sinkage of thelarger plate. This piece of knowledge will serve in step2 of the conversion.
4.3. Techniques of conversion
From here on, a tire footprint area of arbitrary shapewill be denoted ST and substitute the same area SP of around plate P from the preceding section. Consequently,the effective (mean) contact pressure q (kPa) will substitute
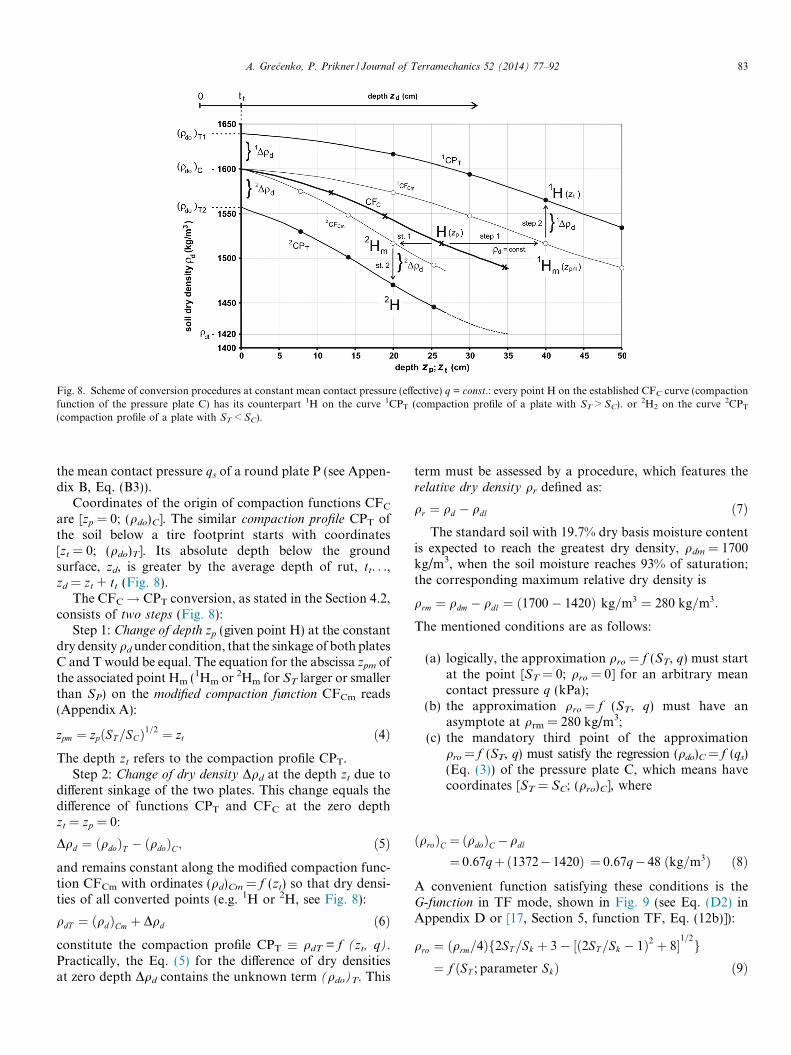
Fig. 8. Scheme of conversion procedures at constant mean contact pressure (effective) q = const.: every point H on the established CFC curve (compactionfunction of the pressure plate C) has its counterpart 1H on the curve 1CPT (compaction profile of a plate with ST > SC). or 2H2 on the curve 2CPT
(compaction profile of a plate with ST < SC).
A. Grecenko, P. Prikner / Journal of Terramechanics 52 (2014) 77–92 83
the mean contact pressure qs of a round plate P (see Appen-dix B, Eq. (B3)).
Coordinates of the origin of compaction functions CFC
are [zp = 0; (qdo)C]. The similar compaction profile CPT ofthe soil below a tire footprint starts with coordinates[zt = 0; (qdo)T]. Its absolute depth below the groundsurface, zd, is greater by the average depth of rut, tt. . .,zd = zt + tt (Fig. 8).
The CFC! CPT conversion, as stated in the Section 4.2,consists of two steps (Fig. 8):
Step 1: Change of depth zp (given point H) at the constantdry density qd under condition, that the sinkage of both platesC and T would be equal. The equation for the abscissa zpm ofthe associated point Hm (1Hm or 2Hm for ST larger or smallerthan SP) on the modified compaction function CFCm reads(Appendix A):
zpm ¼ zpðST=SCÞ1=2 ¼ zt ð4ÞThe depth zt refers to the compaction profile CPT.
Step 2: Change of dry density Dqd at the depth zt due todifferent sinkage of the two plates. This change equals thedifference of functions CPT and CFC at the zero depthzt = zp = 0:
Dqd ¼ ðqdoÞT � ðqdoÞC; ð5Þ
and remains constant along the modified compaction func-tion CFCm with ordinates (qd)Cm = f (zt) so that dry densi-ties of all converted points (e.g. 1H or 2H, see Fig. 8):
qdT ¼ ðqdÞCm þ Dqd ð6Þconstitute the compaction profile CPT � qdT = f (zt, q).Practically, the Eq. (5) for the difference of dry densitiesat zero depth Dqd contains the unknown term (qdo)T. This
term must be assessed by a procedure, which features therelative dry density qr defined as:
qr ¼ qd � qdl ð7ÞThe standard soil with 19.7% dry basis moisture content
is expected to reach the greatest dry density, qdm = 1700kg/m3, when the soil moisture reaches 93% of saturation;the corresponding maximum relative dry density is
qrm ¼ qdm � qdl ¼ ð1700� 1420Þ kg=m3 ¼ 280 kg=m3:
The mentioned conditions are as follows:
(a) logically, the approximation qro = f (ST, q) must startat the point [ST = 0; qro = 0] for an arbitrary meancontact pressure q (kPa);
(b) the approximation qro = f (ST, q) must have anasymptote at qrm = 280 kg/m3;
(c) the mandatory third point of the approximationqro = f (ST, q) must satisfy the regression (qdo)C = f (qs)(Eq. (3)) of the pressure plate C, which means havecoordinates [ST = SC; (qro)C], where
ðqroÞC ¼ ðqdoÞC �qdl
¼ 0:67qþð1372� 1420Þ ¼ 0:67q� 48 ðkg=m3Þ ð8Þ
A convenient function satisfying these conditions is theG-function in TF mode, shown in Fig. 9 (see Eq. (D2) inAppendix D or [17, Section 5, function TF, Eq. (12b)]):
qro ¼ ðqrm=4Þf2ST=Sk þ 3� ½ð2ST=Sk � 1Þ2 þ 8�1=2g¼ f ðST ; parameter SkÞ ð9Þ
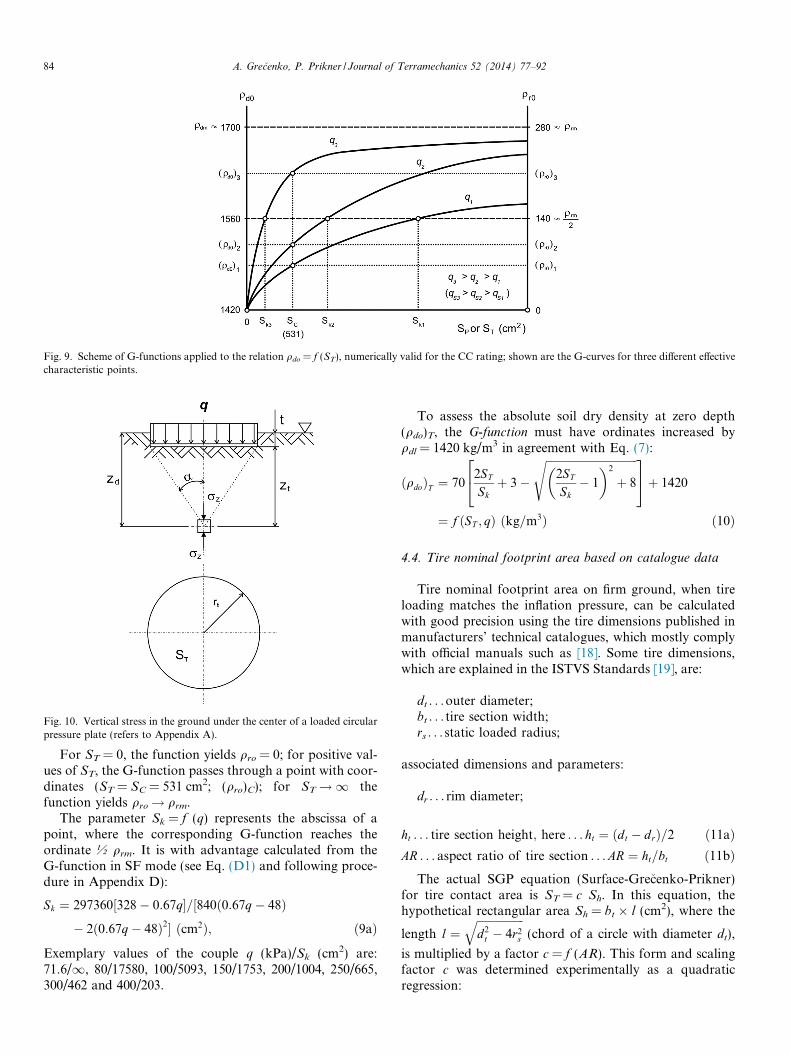
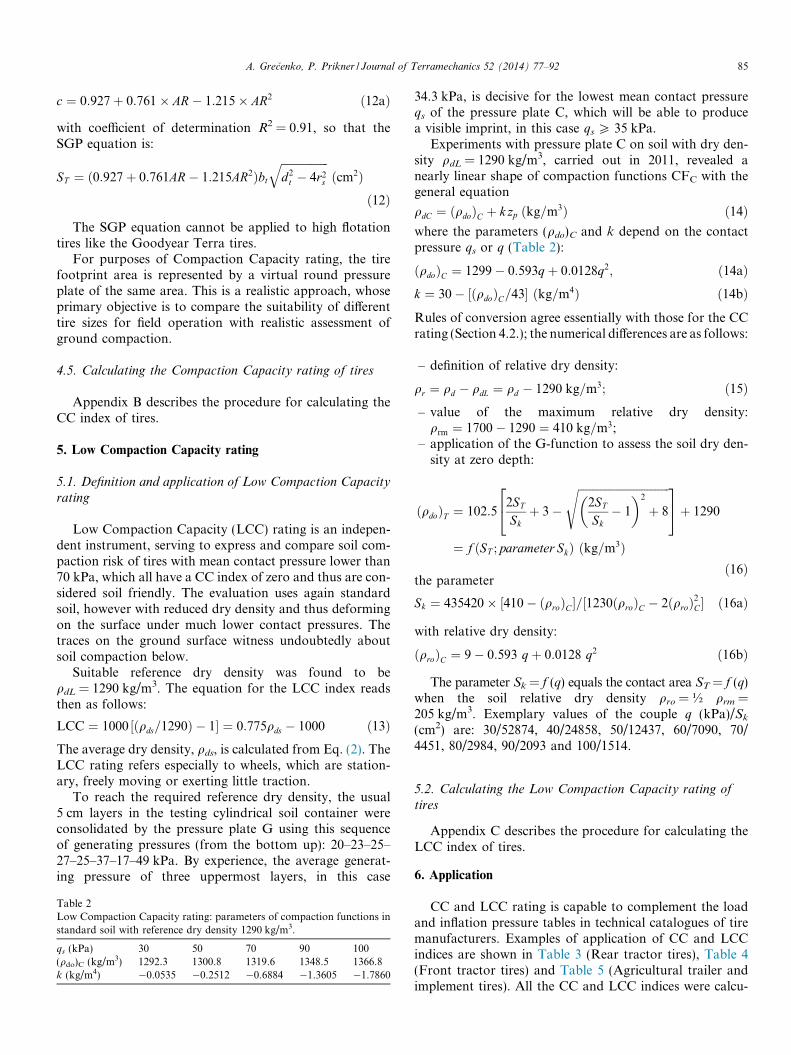
Fig. 10. Vertical stress in the ground under the center of a loaded circularpressure plate (refers to Appendix A).
Fig. 9. Scheme of G-functions applied to the relation qdo = f (ST), numerically valid for the CC rating; shown are the G-curves for three different effectivecharacteristic points.
84 A. Grecenko, P. Prikner / Journal of Terramechanics 52 (2014) 77–92
For ST = 0, the function yields qro = 0; for positive val-ues of ST, the G-function passes through a point with coor-dinates (ST = SC = 531 cm2; (qro)C); for ST!1 thefunction yields qro! qrm.
The parameter Sk = f (q) represents the abscissa of apoint, where the corresponding G-function reaches theordinate ½ qrm. It is with advantage calculated from theG-function in SF mode (see Eq. (D1) and following proce-dure in Appendix D):
Sk ¼ 297360½328� 0:67q�=½840ð0:67q� 48Þ
� 2ð0:67q� 48Þ2� ðcm2Þ; ð9aÞ
Exemplary values of the couple q (kPa)/Sk (cm2) are:71.6/1, 80/17580, 100/5093, 150/1753, 200/1004, 250/665,300/462 and 400/203.
To assess the absolute soil dry density at zero depth(qdo)T, the G-function must have ordinates increased byqdl = 1420 kg/m3 in agreement with Eq. (7):
ðqdoÞT ¼ 702ST
Skþ 3�
ffiffiffiffiffiffiffiffiffiffiffiffiffiffiffiffiffiffiffiffiffiffiffiffiffiffiffiffiffiffiffiffiffi2ST
Sk� 1
� �2
þ 8
s24
35þ 1420
¼ f ðST ; qÞ ðkg=m3Þ ð10Þ
4.4. Tire nominal footprint area based on catalogue data
Tire nominal footprint area on firm ground, when tireloading matches the inflation pressure, can be calculatedwith good precision using the tire dimensions published inmanufacturers’ technical catalogues, which mostly complywith official manuals such as [18]. Some tire dimensions,which are explained in the ISTVS Standards [19], are:
dt . . .outer diameter;bt . . . tire section width;rs . . . static loaded radius;
associated dimensions and parameters:
dr . . . rim diameter;
ht . . . tire section height; here . . . ht ¼ ðdt � drÞ=2 ð11aÞAR . . . aspect ratio of tire section . . . AR ¼ ht=bt ð11bÞ
The actual SGP equation (Surface-Grecenko-Prikner)for tire contact area is ST = c Sh. In this equation, thehypothetical rectangular area Sh = bt � l (cm2), where the
length l ¼ffiffiffiffiffiffiffiffiffiffiffiffiffiffiffiffiffid2
t � 4r2s
q(chord of a circle with diameter dt),
is multiplied by a factor c = f (AR). This form and scalingfactor c was determined experimentally as a quadraticregression:
A. Grecenko, P. Prikner / Journal of Terramechanics 52 (2014) 77–92 85
c ¼ 0:927þ 0:761� AR� 1:215� AR2 ð12aÞ
with coefficient of determination R2 = 0.91, so that theSGP equation is:
ST ¼ ð0:927þ 0:761AR� 1:215AR2Þbt
ffiffiffiffiffiffiffiffiffiffiffiffiffiffiffiffiffid2
t � 4r2s
qðcm2Þ
ð12Þ
The SGP equation cannot be applied to high flotationtires like the Goodyear Terra tires.
For purposes of Compaction Capacity rating, the tirefootprint area is represented by a virtual round pressureplate of the same area. This is a realistic approach, whoseprimary objective is to compare the suitability of differenttire sizes for field operation with realistic assessment ofground compaction.
4.5. Calculating the Compaction Capacity rating of tires
Appendix B describes the procedure for calculating theCC index of tires.
5. Low Compaction Capacity rating
5.1. Definition and application of Low Compaction Capacity
rating
Low Compaction Capacity (LCC) rating is an indepen-dent instrument, serving to express and compare soil com-paction risk of tires with mean contact pressure lower than70 kPa, which all have a CC index of zero and thus are con-sidered soil friendly. The evaluation uses again standardsoil, however with reduced dry density and thus deformingon the surface under much lower contact pressures. Thetraces on the ground surface witness undoubtedly aboutsoil compaction below.
Suitable reference dry density was found to beqdL = 1290 kg/m3. The equation for the LCC index readsthen as follows:
LCC ¼ 1000 ½ðqds=1290Þ � 1� ¼ 0:775qds � 1000 ð13ÞThe average dry density, qds, is calculated from Eq. (2). TheLCC rating refers especially to wheels, which are station-ary, freely moving or exerting little traction.
To reach the required reference dry density, the usual5 cm layers in the testing cylindrical soil container wereconsolidated by the pressure plate G using this sequenceof generating pressures (from the bottom up): 20–23–25–27–25–37–17–49 kPa. By experience, the average generat-ing pressure of three uppermost layers, in this case
Table 2Low Compaction Capacity rating: parameters of compaction functions instandard soil with reference dry density 1290 kg/m3.
qs (kPa) 30 50 70 90 100(qdo)C (kg/m3) 1292.3 1300.8 1319.6 1348.5 1366.8k (kg/m4) �0.0535 �0.2512 �0.6884 �1.3605 �1.7860
34.3 kPa, is decisive for the lowest mean contact pressureqs of the pressure plate C, which will be able to producea visible imprint, in this case qs P 35 kPa.
Experiments with pressure plate C on soil with dry den-sity qdL = 1290 kg/m3, carried out in 2011, revealed anearly linear shape of compaction functions CFC with thegeneral equation
qdC ¼ ðqdoÞC þ k zp ðkg=m3Þ ð14Þwhere the parameters (qdo)C and k depend on the contactpressure qs or q (Table 2):
ðqdoÞC ¼ 1299� 0:593qþ 0:0128q2; ð14aÞk ¼ 30� ½ðqdoÞC=43� ðkg=m4Þ ð14bÞRules of conversion agree essentially with those for the CCrating (Section 4.2.); the numerical differences are as follows:
– definition of relative dry density:
qr ¼ qd � qdL ¼ qd � 1290 kg=m3; ð15Þ– value of the maximum relative dry density:
qrm ¼ 1700� 1290 ¼ 410 kg=m3;– application of the G-function to assess the soil dry den-
sity at zero depth:
2ST
ffiffiffiffiffiffiffiffiffiffiffiffiffiffiffiffiffiffiffiffiffiffiffiffiffiffiffiffiffiffiffiffiffi2ST� �2
s2 3
ðqdoÞT ¼ 102:5Skþ 3�
Sk� 1 þ 84 5þ 1290
¼ f ðST ; parameter SkÞ ðkg=m3Þð16Þ
the parameter
Sk ¼ 435420� ½410� ðqroÞC�=½1230ðqroÞC � 2ðqroÞ2C� ð16aÞ
with relative dry density:
ðqroÞC ¼ 9� 0:593 qþ 0:0128 q2 ð16bÞ
The parameter Sk = f (q) equals the contact area ST = f (q)when the soil relative dry density qro = ½ qrm =205 kg/m3. Exemplary values of the couple q (kPa)/Sk
(cm2) are: 30/52874, 40/24858, 50/12437, 60/7090, 70/4451, 80/2984, 90/2093 and 100/1514.
5.2. Calculating the Low Compaction Capacity rating of
tires
Appendix C describes the procedure for calculating theLCC index of tires.
6. Application
CC and LCC rating is capable to complement the loadand inflation pressure tables in technical catalogues of tiremanufacturers. Examples of application of CC and LCCindices are shown in Table 3 (Rear tractor tires), Table 4(Front tractor tires) and Table 5 (Agricultural trailer andimplement tires). All the CC and LCC indices were calcu-
86 A. Grecenko, P. Prikner / Journal of Terramechanics 52 (2014) 77–92
lated in a way presented in Appendices B and C. The effec-tive contact pressure denoted as q is identical with qse. TheCC (and LCC) index obviously grows with rising inflationpressure and load capacity.
Tire designation, for instance 650/85 R 38, has the fol-lowing meaning: “650” is the section width bt (mm), “85”is 100 times the aspect ratio, AR, where AR = tire sectionheight/section width, “R” indicates radial-ply carcass and“38” the rim diameter, dr (inches). This designation enablesto assess the outer diameter of a tire dt using this equation:dt = 0.2 bt � AR + 2.54 dr (cm), which, in this case, givesdt = 207 cm in agreement with the catalogue value.
The CC (LCC) rating, if available in load tables, wouldhelp to select a tire with the lowest CC index for anintended Nominal Load Capacity NLCx, which would lieinside the load limits. Selection can be done either directly(NLCx = NLC from a table) or with use of two neighbor-ing columns, which encompass the NLCx data from eitherside (lower value – subscript 1, higher value – subscript 2).The respective linear interpolation equation is:
CC ¼ CC2 � CC1
NLC2 �NLC1
� ðNLCx �NLC1Þ þ CC1 ð17Þ
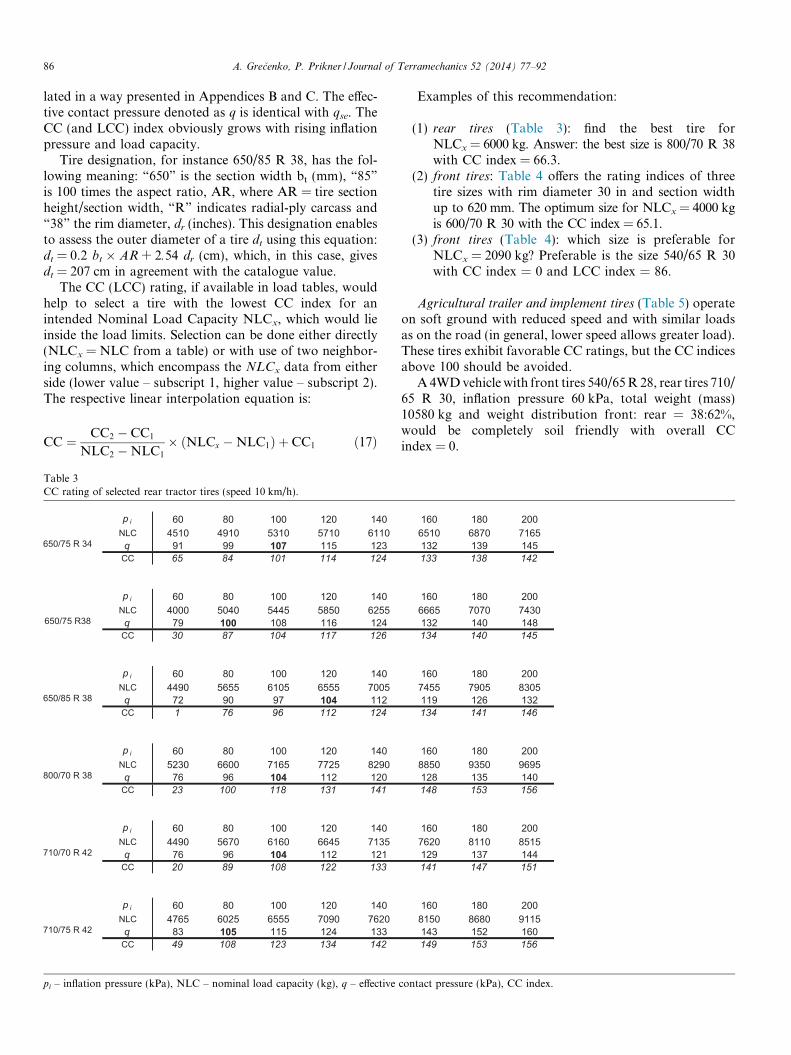
Table 3CC rating of selected rear tractor tires (speed 10 km/h).
pi – inflation pressure (kPa), NLC – nominal load capacity (kg), q – effective
Examples of this recommendation:
(1) rear tires (Table 3): find the best tire forNLCx = 6000 kg. Answer: the best size is 800/70 R 38with CC index = 66.3.
(2) front tires: Table 4 offers the rating indices of threetire sizes with rim diameter 30 in and section widthup to 620 mm. The optimum size for NLCx = 4000 kgis 600/70 R 30 with the CC index = 65.1.
(3) front tires (Table 4): which size is preferable forNLCx = 2090 kg? Preferable is the size 540/65 R 30with CC index = 0 and LCC index = 86.
Agricultural trailer and implement tires (Table 5) operateon soft ground with reduced speed and with similar loadsas on the road (in general, lower speed allows greater load).These tires exhibit favorable CC ratings, but the CC indicesabove 100 should be avoided.
A 4WD vehicle with front tires 540/65 R 28, rear tires 710/65 R 30, inflation pressure 60 kPa, total weight (mass)10580 kg and weight distribution front: rear = 38:62%,would be completely soil friendly with overall CCindex = 0.
contact pressure (kPa), CC index.
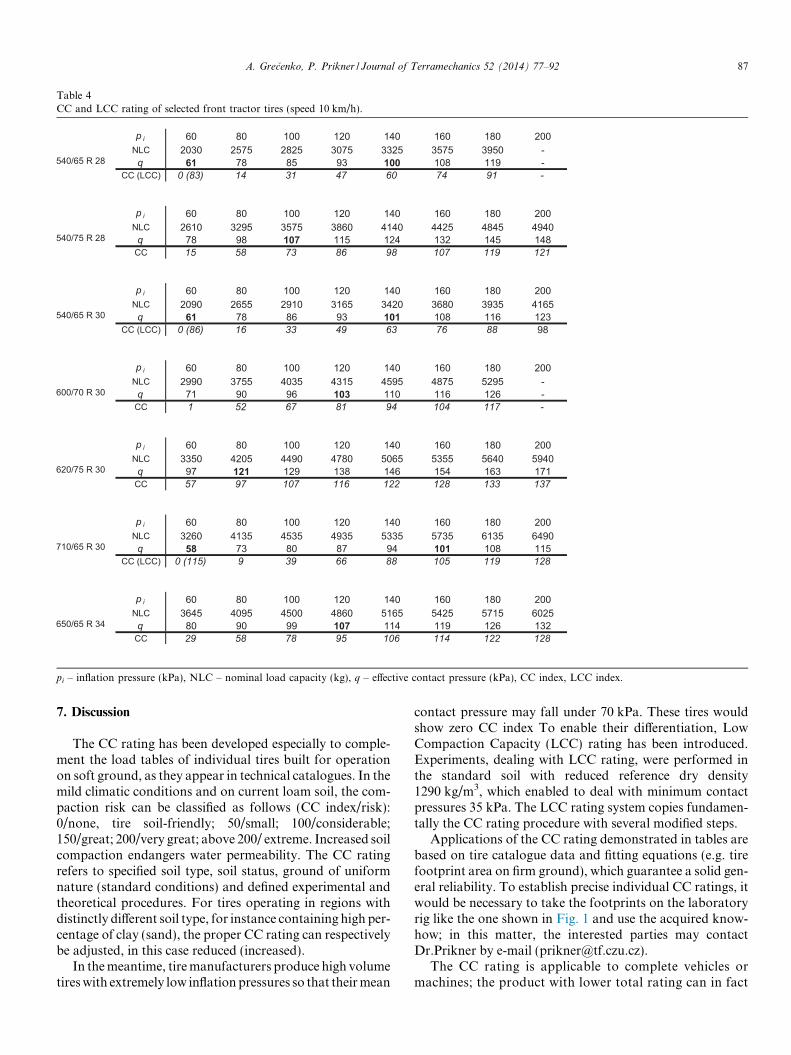
Table 4CC and LCC rating of selected front tractor tires (speed 10 km/h).
pi – inflation pressure (kPa), NLC – nominal load capacity (kg), q – effective contact pressure (kPa), CC index, LCC index.
A. Grecenko, P. Prikner / Journal of Terramechanics 52 (2014) 77–92 87
7. Discussion
The CC rating has been developed especially to comple-ment the load tables of individual tires built for operationon soft ground, as they appear in technical catalogues. In themild climatic conditions and on current loam soil, the com-paction risk can be classified as follows (CC index/risk):0/none, tire soil-friendly; 50/small; 100/considerable;150/great; 200/very great; above 200/ extreme. Increased soilcompaction endangers water permeability. The CC ratingrefers to specified soil type, soil status, ground of uniformnature (standard conditions) and defined experimental andtheoretical procedures. For tires operating in regions withdistinctly different soil type, for instance containing high per-centage of clay (sand), the proper CC rating can respectivelybe adjusted, in this case reduced (increased).
In the meantime, tire manufacturers produce high volumetires with extremely low inflation pressures so that their mean
contact pressure may fall under 70 kPa. These tires wouldshow zero CC index To enable their differentiation, LowCompaction Capacity (LCC) rating has been introduced.Experiments, dealing with LCC rating, were performed inthe standard soil with reduced reference dry density1290 kg/m3, which enabled to deal with minimum contactpressures 35 kPa. The LCC rating system copies fundamen-tally the CC rating procedure with several modified steps.
Applications of the CC rating demonstrated in tables arebased on tire catalogue data and fitting equations (e.g. tirefootprint area on firm ground), which guarantee a solid gen-eral reliability. To establish precise individual CC ratings, itwould be necessary to take the footprints on the laboratoryrig like the one shown in Fig. 1 and use the acquired know-how; in this matter, the interested parties may contactDr.Prikner by e-mail ([email protected]).
The CC rating is applicable to complete vehicles ormachines; the product with lower total rating can in fact
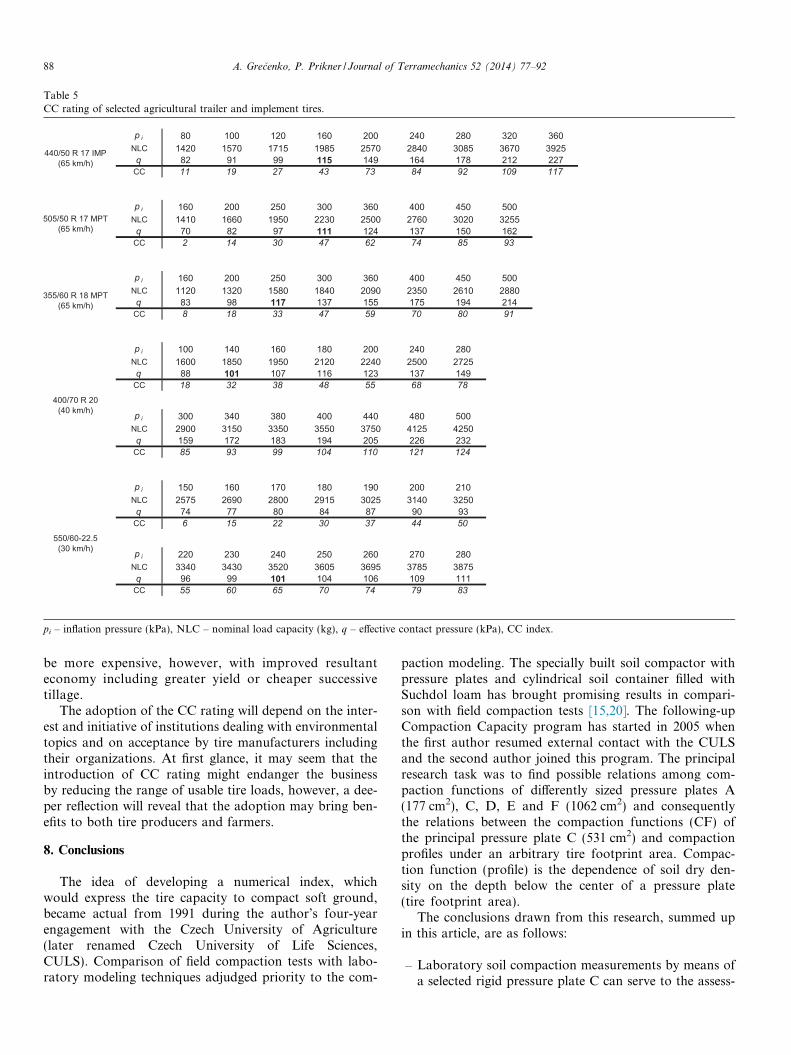
Table 5CC rating of selected agricultural trailer and implement tires.
pi – inflation pressure (kPa), NLC – nominal load capacity (kg), q – effective contact pressure (kPa), CC index.
88 A. Grecenko, P. Prikner / Journal of Terramechanics 52 (2014) 77–92
be more expensive, however, with improved resultanteconomy including greater yield or cheaper successivetillage.
The adoption of the CC rating will depend on the inter-est and initiative of institutions dealing with environmentaltopics and on acceptance by tire manufacturers includingtheir organizations. At first glance, it may seem that theintroduction of CC rating might endanger the businessby reducing the range of usable tire loads, however, a dee-per reflection will reveal that the adoption may bring ben-efits to both tire producers and farmers.
8. Conclusions
The idea of developing a numerical index, whichwould express the tire capacity to compact soft ground,became actual from 1991 during the author’s four-yearengagement with the Czech University of Agriculture(later renamed Czech University of Life Sciences,CULS). Comparison of field compaction tests with labo-ratory modeling techniques adjudged priority to the com-
paction modeling. The specially built soil compactor withpressure plates and cylindrical soil container filled withSuchdol loam has brought promising results in compari-son with field compaction tests [15,20]. The following-upCompaction Capacity program has started in 2005 whenthe first author resumed external contact with the CULSand the second author joined this program. The principalresearch task was to find possible relations among com-paction functions of differently sized pressure plates A(177 cm2), C, D, E and F (1062 cm2) and consequentlythe relations between the compaction functions (CF) ofthe principal pressure plate C (531 cm2) and compactionprofiles under an arbitrary tire footprint area. Compac-tion function (profile) is the dependence of soil dry den-sity on the depth below the center of a pressure plate(tire footprint area).
The conclusions drawn from this research, summed upin this article, are as follows:
– Laboratory soil compaction measurements by means ofa selected rigid pressure plate C can serve to the assess-
A. Grecenko, P. Prikner / Journal of Terramechanics 52 (2014) 77–92 89
ment of soil compaction below tire footprints under cer-tain conditions. These conditions are:
– The laboratory measurements and its applications mustdeal with a specified soil type, Suchdol loam, denoted asstandard soil. The standard soil in the laboratory cylin-drical container must show a uniform dry density, suit-able moisture content below the plastic limit and smallsize of particles.
– The compaction function CF1 under a certain pressureplate P1 can be point by point converted into compactionfunction under a different pressure plate P2 if the meancontact pressures of both plates are equal. The conver-sion comprises two steps. Step No.1 formulates for everypoint on the CF1 the depth of an associated point on theCF2 with the same interim soil compaction. Step No.2defines the change of soil dry density versus the interimdensity, which equals the difference of dry densities atzero depths under the plates P2 and P1 (can be plus orminus depending on the areas of both plates P27P1).
– Thesoildrydensitiesunderatire footprint in thedepths20,30, 40 and 50 cm below the ground surface are determined,using this conversion, by means of databank of measuredcompaction functions CFC of the pressure plate C.
– The auxiliary items entering this conversion are:(a) the tire footprint area, which is calculated from a
proper equation or measured using the tire foot-print attachment;
(b) the depth of rut pressed by a tire, which is calcu-lated from an empirical equation based on thedepths of modeling imprints by pressure platesand field measurements with loaded tires and
(c) the relationship between the soil dry density atzero depth under a tire footprint and the tirefootprint area with mean contact pressure as aparameter, expressed by the G-function, whichsatisfies boundary conditions for a footprint areaequaling zero or infinity and complies with theregression of the soil dry density at zero depthas a function of mean contact pressure for thepressure plate C.
Appendix B
Calculating the CC rating of a tire (qdl = 1420 kg/m3).
This calculation requires catalogue data of the evaluated tirespeed around 10 km/hr in the field) and data of the respective
Preliminary calculations:
a1 Assessment of tire nominal contact area ST (see p
ST ¼ cðblÞ ¼ cbt
ffiffiffiffiffiffiffiffiffiffiffiffiffiffiffiffiffid2
t � 4r2s
qðcm2Þ
where bt, dt, rs = tire width, diameter, static radiuc ¼ 0:927þ 0:761AR� 1:215AR2
whereAR ¼ ðdt � drÞ=2bt
a2 Mean contact pressure qs:qs ¼ 98:1m=ST ðkPaÞwhere m (kg) is the supported mass (load).
Acknowledgement
The Compaction Capacity rating project was a part ofthe Grant MSM 6046070905, financed by the Ministry ofEducation of the Czech Republic and directed by Prof.M.Kavka.
Appendix A
Depth of equal stress and compaction below the centerof a loaded round plate.
The consolidated soil under the modeling imprint in thetesting soil container can be considered an elasto-plasticmedium. Hence the predominant stress under the centerof a contact area is the vertical (principal) stress rz (kPa)which, in case of a uniformly loaded circular area, can beapproximated by the equation:
rz ¼ q ð1� cosmaÞ ðA1Þwhere q (kPa) is the contact pressure, a is half of the coneapex angle (Fig. 8) and m is an exponent (concentration fac-tor) referring mainly to the condition of the ground.
With q and m given, the magnitude of the vertical stressrz depends only on the angle a with the tangent
tana ¼ rt=zt ¼ ðST=pÞ1=2=zt ðA2Þ
which means that a certain stress under a large contact area(large radius rt) occurs at greater depth zt than under asmall contact area (small radius rt). As the stress and strainare associated quantities, the rule of depths can be ex-tended to compaction in this way: the same compactionthat exists in the testing container under a loaded pressureplate with area SP, radius rp at the depth zp is expected toexist under the tire contact area ST with a virtual radius
rt = (ST/p)1/2 at the depth zt, satisfying the conditiontan a = constant = rt/zt = rp/zp, so that:
zt=zp ¼ rt=rp and zt ¼ zp
ffiffiffiffiffiST
SP
rðA3Þ
(dimensions, inflation pressure and corresponding load forcompaction function from the databank CFC (Fig. 9).
art 4.3):
(B1 � 12)s (cm) and
(B1a � 12a)(B1b � 11b)
(B2)
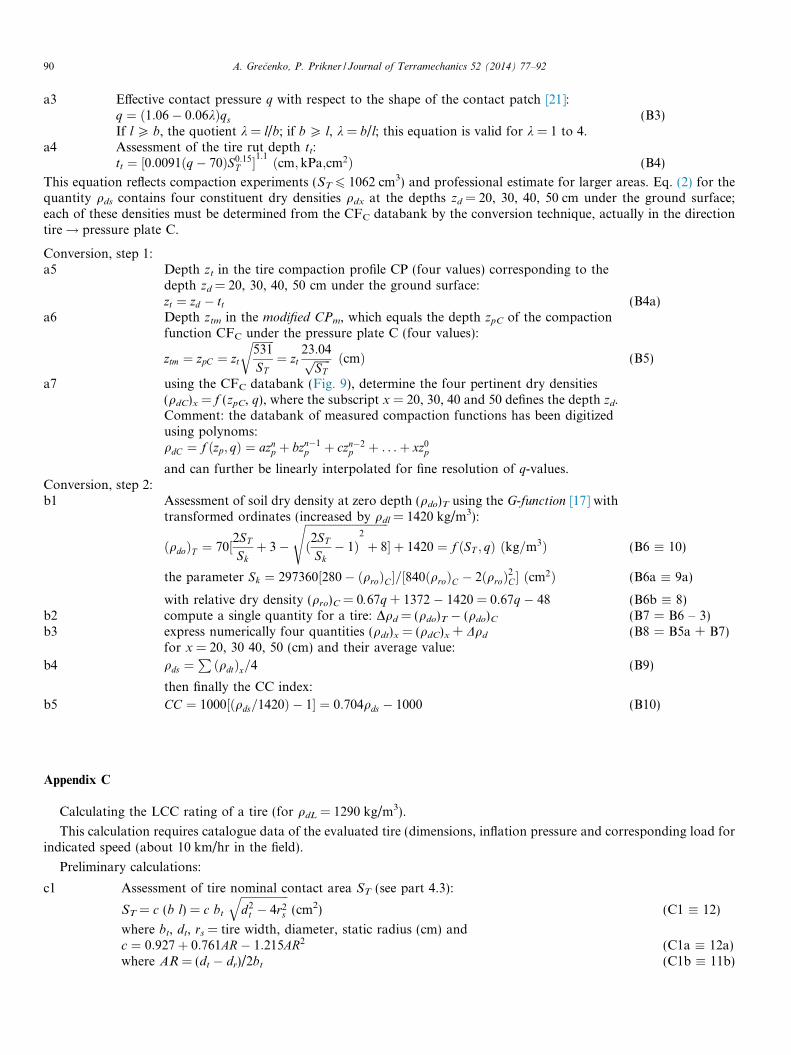
a3 Effective contact pressure q with respect to the shape of the contact patch [21]:q ¼ ð1:06� 0:06kÞqs (B3)If l P b, the quotient k = l/b; if b P l, k = b/l; this equation is valid for k = 1 to 4.
a4 Assessment of the tire rut depth tt:tt ¼ ½0:0091ðq� 70ÞS0:15
T �1:1 ðcm; kPa;cm2Þ (B4)
This equation reflects compaction experiments (ST 6 1062 cm3) and professional estimate for larger areas. Eq. (2) for thequantity qds contains four constituent dry densities qdx at the depths zd = 20, 30, 40, 50 cm under the ground surface;each of these densities must be determined from the CFC databank by the conversion technique, actually in the directiontire! pressure plate C.
Conversion, step 1:a5 Depth zt in the tire compaction profile CP (four values) corresponding to the
depth zd = 20, 30, 40, 50 cm under the ground surface:zt ¼ zd � tt (B4a)
a6 Depth ztm in the modified CPm, which equals the depth zpC of the compactionfunction CFC under the pressure plate C (four values):
ztm ¼ zpC ¼ zt
ffiffiffiffiffiffiffiffi531
ST
r¼ zt
23:04ffiffiffiffiffiffiSTp ðcmÞ (B5)
a7 using the CFC databank (Fig. 9), determine the four pertinent dry densities(qdC)x = f (zpC, q), where the subscript x = 20, 30, 40 and 50 defines the depth zd.Comment: the databank of measured compaction functions has been digitizedusing polynoms:qdC ¼ f ðzp; qÞ ¼ azn
p þ bzn�1p þ czn�2
p þ . . .þ xz0p
and can further be linearly interpolated for fine resolution of q-values.Conversion, step 2:b1 Assessment of soil dry density at zero depth (qdo)T using the G-function [17] with
transformed ordinates (increased by qdl = 1420 kg/m3):
ðqdoÞT ¼ 70½2ST
Skþ 3�
ffiffiffiffiffiffiffiffiffiffiffiffiffiffiffiffiffiffiffiffiffiffiffiffiffiffiffiffiffiffið2ST
Sk� 1Þ
2
þ 8
s� þ 1420 ¼ f ðST ; qÞ ðkg=m3Þ (B6 � 10)
the parameter Sk ¼ 297360½280� ðqroÞC�=½840ðqroÞC � 2ðqroÞ2C� ðcm2Þ (B6a � 9a)
with relative dry density (qro)C = 0.67q + 1372 � 1420 = 0.67q � 48 (B6b � 8)b2 compute a single quantity for a tire: Dqd = (qdo)T � (qdo)C (B7 = B6 – 3)b3 express numerically four quantities (qdt)x = (qdC)x + Dqd (B8 = B5a + B7)
for x = 20, 30 40, 50 (cm) and their average value:
b4 qds ¼PðqdtÞx=4 (B9)
then finally the CC index:
b5 CC ¼ 1000½ðqds=1420Þ � 1� ¼ 0:704qds � 1000 (B10)
Appendix C
Calculating the LCC rating of a tire (for qdL = 1290 kg/m3).
This calculation requires catalogue data of the evaluated tire (dimensions, inflation pressure and corresponding load forindicated speed (about 10 km/hr in the field).
Preliminary calculations:
c1 Assessment of tire nominal contact area ST (see part 4.3):
ST = c (b l) = c bt
ffiffiffiffiffiffiffiffiffiffiffiffiffiffiffiffiffid2
t � 4r2s
q(cm2) (C1 � 12)
where bt, dt, rs = tire width, diameter, static radius (cm) andc ¼ 0:927þ 0:761AR� 1:215AR2 (C1a � 12a)where AR = (dt � dr)/2bt (C1b � 11b)
90 A. Grecenko, P. Prikner / Journal of Terramechanics 52 (2014) 77–92
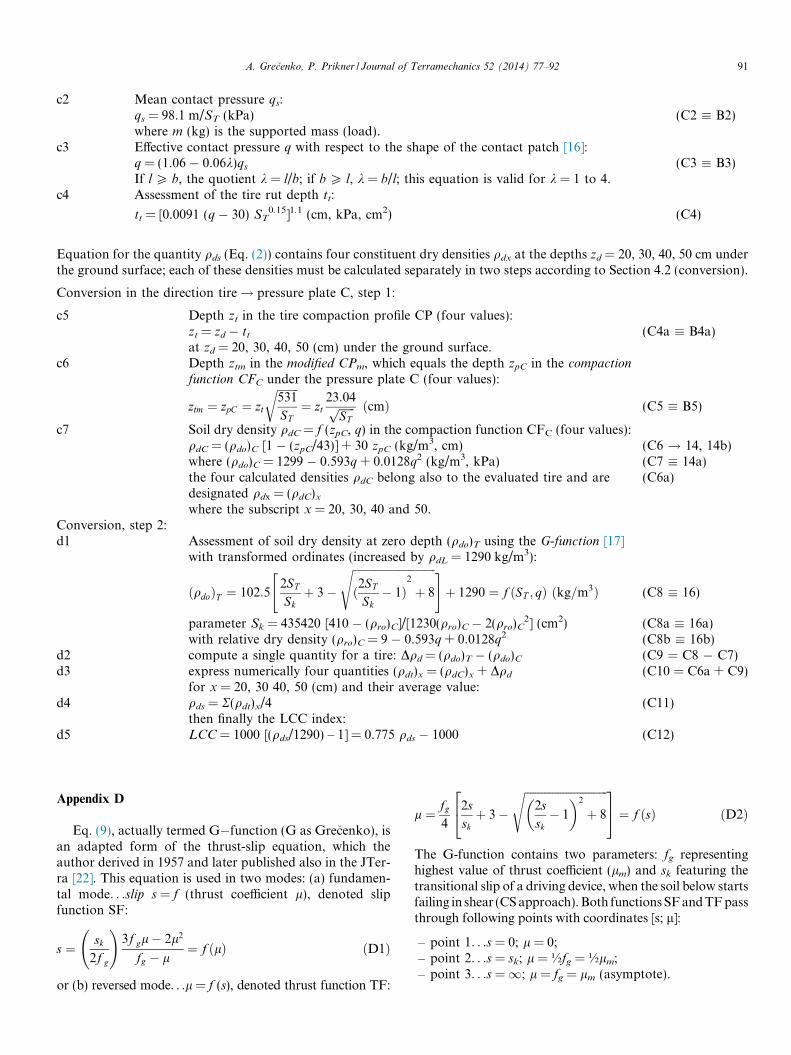
c2 Mean contact pressure qs:qs = 98.1 m/ST (kPa) (C2 � B2)where m (kg) is the supported mass (load).
c3 Effective contact pressure q with respect to the shape of the contact patch [16]:q = (1.06 � 0.06k)qs (C3 � B3)If l P b, the quotient k = l/b; if b P l, k = b/l; this equation is valid for k = 1 to 4.
c4 Assessment of the tire rut depth tt:
tt = [0.0091 (q � 30) ST0.15]1.1 (cm, kPa, cm2) (C4)
Equation for the quantity qds (Eq. (2)) contains four constituent dry densities qdx at the depths zd = 20, 30, 40, 50 cm underthe ground surface; each of these densities must be calculated separately in two steps according to Section 4.2 (conversion).
Conversion in the direction tire! pressure plate C, step 1:
c5 Depth zt in the tire compaction profile CP (four values):zt = zd � tt (C4a � B4a)at zd = 20, 30, 40, 50 (cm) under the ground surface.
c6 Depth ztm in the modified CPm, which equals the depth zpC in the compaction
function CFC under the pressure plate C (four values):
ztm ¼ zpC ¼ zt
ffiffiffiffiffiffiffiffi531
ST
r¼ zt
23:04ffiffiffiffiffiffiSTp ðcmÞ (C5 � B5)
c7 Soil dry density qdC = f (zpC, q) in the compaction function CFC (four values):qdC = (qdo)C [1 � (zpC/43)] + 30 zpC (kg/m3, cm) (C6 ! 14, 14b)where (qdo)C = 1299 � 0.593q + 0.0128q2 (kg/m3, kPa) (C7 � 14a)the four calculated densities qdC belong also to the evaluated tire and aredesignated qdx = (qdC)x
(C6a)
where the subscript x = 20, 30, 40 and 50.Conversion, step 2:d1 Assessment of soil dry density at zero depth (qdo)T using the G-function [17]
with transformed ordinates (increased by qdL = 1290 kg/m3):
ðqdoÞT ¼ 102:5
"2ST
Skþ 3�
ffiffiffiffiffiffiffiffiffiffiffiffiffiffiffiffiffiffiffiffiffiffiffiffiffiffiffiffiffiffið2ST
Sk� 1Þ
2
þ 8
s #þ 1290 ¼ f ðST ; qÞ ðkg=m3Þ (C8 � 16)
parameter Sk = 435420 [410 � (qro)C]/[1230(qro)C � 2(qro)C2] (cm2) (C8a � 16a)
with relative dry density (qro)C = 9 � 0.593q + 0.0128q2 (C8b � 16b)d2 compute a single quantity for a tire: Dqd = (qdo)T � (qdo)C (C9 = C8 � C7)d3 express numerically four quantities (qdt)x = (qdC)x + Dqd (C10 = C6a + C9)
for x = 20, 30 40, 50 (cm) and their average value:d4 qds = R(qdt)x/4 (C11)
then finally the LCC index:d5 LCC = 1000 [(qds/1290) – 1] = 0.775 qds � 1000 (C12)
A. Grecenko, P. Prikner / Journal of Terramechanics 52 (2014) 77–92 91
Appendix D
Eq. (9), actually termed G�function (G as Grecenko), isan adapted form of the thrust-slip equation, which theauthor derived in 1957 and later published also in the JTer-ra [22]. This equation is used in two modes: (a) fundamen-tal mode. . .slip s = f (thrust coefficient l), denoted slipfunction SF:
s ¼ sk
2f g
!3f gl� 2l2
fg � l¼ f ðlÞ ðD1Þ
or (b) reversed mode. . .l = f (s), denoted thrust function TF:
l ¼ fg
4
2sskþ 3�
ffiffiffiffiffiffiffiffiffiffiffiffiffiffiffiffiffiffiffiffiffiffiffiffiffiffiffiffiffiffi2ssk� 1
� �2
þ 8
s24
35 ¼ f ðsÞ ðD2Þ
The G-function contains two parameters: fg representinghighest value of thrust coefficient (lm) and sk featuring thetransitional slip of a driving device, when the soil below startsfailing in shear (CS approach). Both functions SF and TF passthrough following points with coordinates [s; l]:
– point 1. . .s = 0; l = 0;– point 2. . .s = sk; l = ½fg = ½lm;– point 3. . .s =1; l = fg = lm (asymptote).
92 A. Grecenko, P. Prikner / Journal of Terramechanics 52 (2014) 77–92
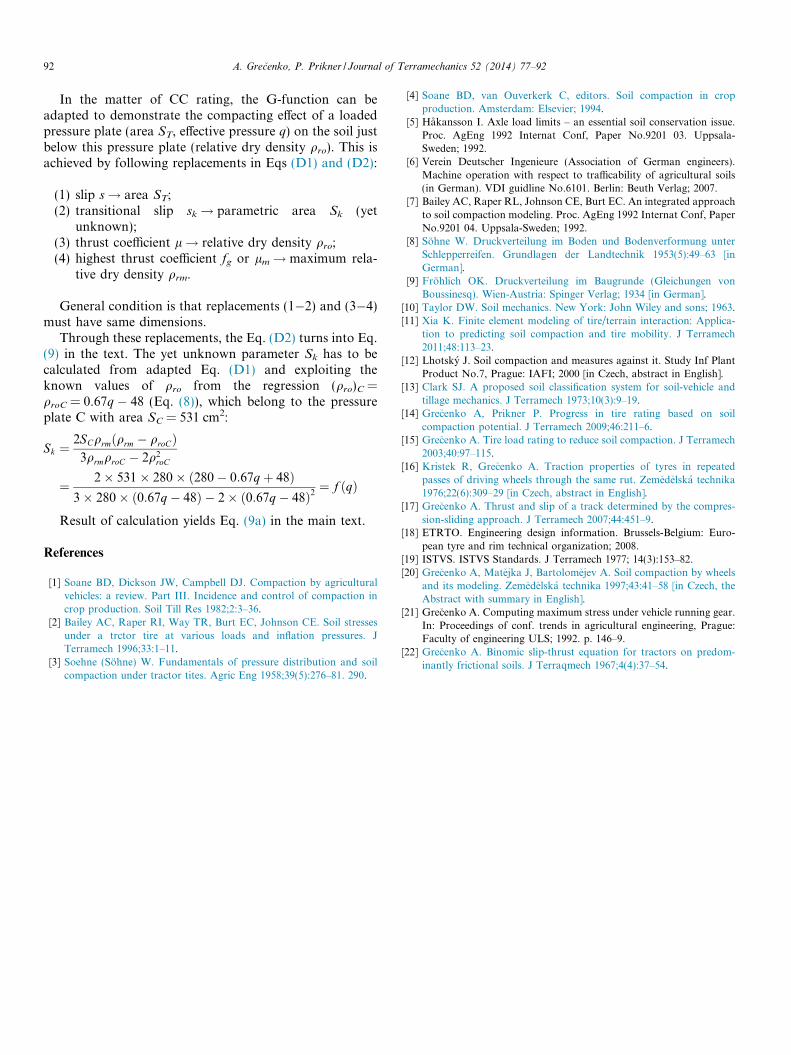
In the matter of CC rating, the G-function can beadapted to demonstrate the compacting effect of a loadedpressure plate (area ST, effective pressure q) on the soil justbelow this pressure plate (relative dry density qro). This isachieved by following replacements in Eqs (D1) and (D2):
(1) slip s! area ST;(2) transitional slip sk! parametric area Sk (yet
unknown);(3) thrust coefficient l! relative dry density qro;(4) highest thrust coefficient fg or lm! maximum rela-
tive dry density qrm.
General condition is that replacements (1�2) and (3�4)must have same dimensions.
Through these replacements, the Eq. (D2) turns into Eq.(9) in the text. The yet unknown parameter Sk has to becalculated from adapted Eq. (D1) and exploiting theknown values of qro from the regression (qro)C =qroC = 0.67q � 48 (Eq. (8)), which belong to the pressureplate C with area SC = 531 cm2:
Sk ¼2SCqrmðqrm � qroCÞ
3qrmqroC � 2q2roC
¼ 2� 531� 280� ð280� 0:67qþ 48Þ3� 280� ð0:67q� 48Þ � 2� ð0:67q� 48Þ2
¼ f ðqÞ
Result of calculation yields Eq. (9a) in the main text.
References
[1] Soane BD, Dickson JW, Campbell DJ. Compaction by agriculturalvehicles: a review. Part III. Incidence and control of compaction incrop production. Soil Till Res 1982;2:3–36.
[2] Bailey AC, Raper RI, Way TR, Burt EC, Johnson CE. Soil stressesunder a trctor tire at various loads and inflation pressures. JTerramech 1996;33:1–11.
[3] Soehne (Sohne) W. Fundamentals of pressure distribution and soilcompaction under tractor tites. Agric Eng 1958;39(5):276–81. 290.
[4] Soane BD, van Ouverkerk C, editors. Soil compaction in cropproduction. Amsterdam: Elsevier; 1994.
[5] Hakansson I. Axle load limits – an essential soil conservation issue.Proc. AgEng 1992 Internat Conf, Paper No.9201 03. Uppsala-Sweden; 1992.
[6] Verein Deutscher Ingenieure (Association of German engineers).Machine operation with respect to trafficability of agricultural soils(in German). VDI guidline No.6101. Berlin: Beuth Verlag; 2007.
[7] Bailey AC, Raper RL, Johnson CE, Burt EC. An integrated approachto soil compaction modeling. Proc. AgEng 1992 Internat Conf, PaperNo.9201 04. Uppsala-Sweden; 1992.
[8] Sohne W. Druckverteilung im Boden und Bodenverformung unterSchlepperreifen. Grundlagen der Landtechnik 1953(5):49–63 [inGerman].
[9] Frohlich OK. Druckverteilung im Baugrunde (Gleichungen vonBoussinesq). Wien-Austria: Spinger Verlag; 1934 [in German].
[10] Taylor DW. Soil mechanics. New York: John Wiley and sons; 1963.[11] Xia K. Finite element modeling of tire/terrain interaction: Applica-
tion to predicting soil compaction and tire mobility. J Terramech2011;48:113–23.
[12] Lhotsky J. Soil compaction and measures against it. Study Inf PlantProduct No.7, Prague: IAFI; 2000 [in Czech, abstract in English].
[13] Clark SJ. A proposed soil classification system for soil-vehicle andtillage mechanics. J Terramech 1973;10(3):9–19.
[14] Grecenko A, Prikner P. Progress in tire rating based on soilcompaction potential. J Terramech 2009;46:211–6.
[15] Grecenko A. Tire load rating to reduce soil compaction. J Terramech2003;40:97–115.
[16] Kristek R, Grecenko A. Traction properties of tyres in repeatedpasses of driving wheels through the same rut. Zemedelska technika1976;22(6):309–29 [in Czech, abstract in English].
[17] Grecenko A. Thrust and slip of a track determined by the compres-sion-sliding approach. J Terramech 2007;44:451–9.
[18] ETRTO. Engineering design information. Brussels-Belgium: Euro-pean tyre and rim technical organization; 2008.
[19] ISTVS. ISTVS Standards. J Terramech 1977; 14(3):153–82.[20] Grecenko A, Matejka J, Bartolomejev A. Soil compaction by wheels
and its modeling. Zemedelska technika 1997;43:41–58 [in Czech, theAbstract with summary in English].
[21] Grecenko A. Computing maximum stress under vehicle running gear.In: Proceedings of conf. trends in agricultural engineering, Prague:Faculty of engineering ULS; 1992. p. 146–9.
[22] Grecenko A. Binomic slip-thrust equation for tractors on predom-inantly frictional soils. J Terraqmech 1967;4(4):37–54.