
The Issuer-Pay Rating Model and Rating Inflation - CORE
58
The Issuer-Pay Rating Model and Rating Inflation: Evidence from Corporate Credit Ratings Han Xia A dissertation submitted to the faculty of the University of North Carolina at Chapel Hill in partial fulfillment of the requirements for the degree of Doctor of Philosophy in the Kenan-Flagler Business School (Finance). Chapel Hill 2011 Approved by: Paolo Fulghieri G¨ unter Strobl Anil Shivdasani Paige Ouimet Wayne Landsman brought to you by CORE View metadata, citation and similar papers at core.ac.uk provided by Carolina Digital Repository
-
Upload
khangminh22 -
Category
Documents
-
view
0 -
download
0
Transcript of The Issuer-Pay Rating Model and Rating Inflation - CORE
The Issuer-Pay Rating Model and Rating Inflation: Evidencefrom Corporate Credit Ratings
Han Xia
A dissertation submitted to the faculty of the University of North Carolina at ChapelHill in partial fulfillment of the requirements for the degree of Doctor of Philosophyin the Kenan-Flagler Business School (Finance).
Chapel Hill2011
Approved by:
Paolo Fulghieri
Gunter Strobl
Anil Shivdasani
Paige Ouimet
Wayne Landsman
brought to you by COREView metadata, citation and similar papers at core.ac.uk
provided by Carolina Digital Repository

c© 2011Han Xia
ALL RIGHTS RESERVED
ii
ABSTRACT
HAN XIA: The Issuer-Pay Rating Model and Rating Inflation: Evidence fromCorporate Credit Ratings.
(Under the direction of Paolo Fulghieri.)
I demonstrate that the issuer-pay rating model adopted by major credit rating agencies
contributes to their incentives to issue inflated ratings. Employing a unique dataset, I
compare credit ratings based on the issuer-pay rating model to those based on the investor-
pay model. I find that when the expected payoff is high, the issuer-pay based rating agencies
assign a more favorable rating to the issuer. Additionally, I present evidence that neither
regulators nor investors seem to adjust for this rating bias. These findings raise questions
about the effectiveness of credit ratings as a gauge of issuers’ credit quality. They also
indicate that regulators’ efforts to promote a more transparent rating process will increase
information production in the credit rating industry and benefit investors who use ratings
to guide their investment decisions.
iii

ACKNOWLEDGMENTS
I would like to gratefully and sincerely thank Paolo Fulghieri and Gunter Strobl for their
guidance, understanding, patience, and most importantly, their support during my graduate
studies in the Ph.D. program at the Kenan-Flagler Business School, the University of North
Carolina at Chapel Hill. I’m also indebted to Anil Shivdasani and Paige Ouimet for their
valuable comments and suggestions.
I would also like to thank my parents, Yingwei Xia and Yan Yang for their encourage-
ment and faith in me. I could not have come this far without their love and support.
iv
TABLE OF CONTENTS
LIST OF TABLES . . . . . . . . . . . . . . . . . . . . . . . . . . . . . . . . . . vii
LIST OF FIGURES . . . . . . . . . . . . . . . . . . . . . . . . . . . . . . . . . viii
1 Introduction . . . . . . . . . . . . . . . . . . . . . . . . . . . . . . . . . . . . 1
2 Institutional Background . . . . . . . . . . . . . . . . . . . . . . . . . . . . 8
3 Hypothesis Development . . . . . . . . . . . . . . . . . . . . . . . . . . . . 10
3.1 The Rating Agency’s Future Business . . . . . . . . . . . . . . . . . . . . . 10
3.2 The Rating Agency’s Revenue Share . . . . . . . . . . . . . . . . . . . . . . 11
3.3 Issuers’ Management Turnover . . . . . . . . . . . . . . . . . . . . . . . . . 12
3.4 The Information Value of Credit Ratings . . . . . . . . . . . . . . . . . . . . 13
3.5 Empirical Methodology . . . . . . . . . . . . . . . . . . . . . . . . . . . . . 14
4 Data and Empirical Analysis . . . . . . . . . . . . . . . . . . . . . . . . . . 17
4.1 Data and Sample Selection . . . . . . . . . . . . . . . . . . . . . . . . . . . 17
4.2 Comparison of the Quality of Credit Ratings . . . . . . . . . . . . . . . . . 20
4.3 The Rating Agency’s Future Business . . . . . . . . . . . . . . . . . . . . . 21
4.4 The Rating Agency’s Revenue Share . . . . . . . . . . . . . . . . . . . . . . 23
4.5 Issuers’ Management Turnover . . . . . . . . . . . . . . . . . . . . . . . . . 25
4.6 The Information Value of Credit Ratings . . . . . . . . . . . . . . . . . . . . 25
4.7 The Economic Significance of Rating Inflation . . . . . . . . . . . . . . . . . 26
5 Robustness Analysis . . . . . . . . . . . . . . . . . . . . . . . . . . . . . . . 27
v
5.1 Adjusted and Broader Rating Categories . . . . . . . . . . . . . . . . . . . . 27
5.2 Endogeneity Concern Tests . . . . . . . . . . . . . . . . . . . . . . . . . . . 28
5.3 Selection Bias from Rating Shopping . . . . . . . . . . . . . . . . . . . . . . 28
5.4 Rating Inflation Tendency . . . . . . . . . . . . . . . . . . . . . . . . . . . . 30
6 Conclusion . . . . . . . . . . . . . . . . . . . . . . . . . . . . . . . . . . . . . 31
REFERENCES . . . . . . . . . . . . . . . . . . . . . . . . . . . . . . . . . . . . 49
vi

LIST OF TABLES
1 Rating Sample Summary Statistics . . . . . . . . . . . . . . . . . . . . . . . . . . 35
2 Rating Inflation and the Rating Agency’s Future Business . . . . . . . . . . . . . 36
3 Rating Inflation and the Rating Agency’s Revenue Share . . . . . . . . . . . . . . 37
4 Rating Inflation and Issuers’ Management Turnover . . . . . . . . . . . . . . . . 38
5 Do Investors Adjust for Rating Bias? . . . . . . . . . . . . . . . . . . . . . . . . . 39
6 Test for Rating Inflation using Adjusted S&P Ratings . . . . . . . . . . . . . . . 40
7 Test for Rating Inflation on Letter-Based Rating Categories . . . . . . . . . . . . 42
8 Endogeneity Robustness Test for Rating Inflation . . . . . . . . . . . . . . . . . . 44
9 Test for Selection Bias . . . . . . . . . . . . . . . . . . . . . . . . . . . . . . . . . 45
10 Test for Inflation Tendency . . . . . . . . . . . . . . . . . . . . . . . . . . . . . . 47
vii

LIST OF FIGURES
1 Five-Year Default Rates for S&P’s and EJR’s Credit Ratings . . . . . . . . . . . 32
2 S&P’s Revenue Share . . . . . . . . . . . . . . . . . . . . . . . . . . . . . . . . . 34
viii

Chapter 1
Introduction
Credit rating agencies play a key role in the infrastructure of the modern financial
system. Their influence has gone beyond that of an information provider and a passive
observer in the credit market, but further into management’s decision and policy making.
As concluded in a 2005 issue of The Economist, credit rating agencies “are among the most
powerful voices in today’s capital markets.” Despite their central role, credit rating agencies
have been confronted with continuing criticism, at the heart of which is the issuer-pay rating
model. The issuer-pay rating model refers to the practice of rating agencies collecting fees
from issuers they rate, rather than the end users of credit ratings such as investors, as
their principal source of revenue. This rating model has been adopted by major rating
agencies since the 1970s and has raised concerns since then. Investors claim that such a
payment model gives the rating agencies distorted incentives to issue inflated ratings as a
way to promote business with their clients. Such concerns were heightened in the wake of
high-profile bankruptcies such as Enron and WorldCom at the beginning of 2000s. The
major rating agencies’ failure to predict distress at those companies, and their large-scale
downgrades on structured financial products in the more recent subprime financial crisis
have motivated a series of investigations and subsequent regulatory proposals to promote
transparency and integrity in the rating industry.1
1For example, in 2008, the SEC conducted an investigation into the three main agencies that involved a10-month review in which more than two million e-mails and instant messages, as well as other documentsincluding deal files, were examined. Christopher Cox, the SEC chairman, said: “We’ve uncovered seriousshortcomings at these firms, including a lack of disclosure to investors and the public, a lack of policies andprocedures to manage the rating process and insufficient attention to conflicts of interest.” (Securities andExchange Commission, 2008). On June 16, 2008, the SEC proposed rule amendments that would impose
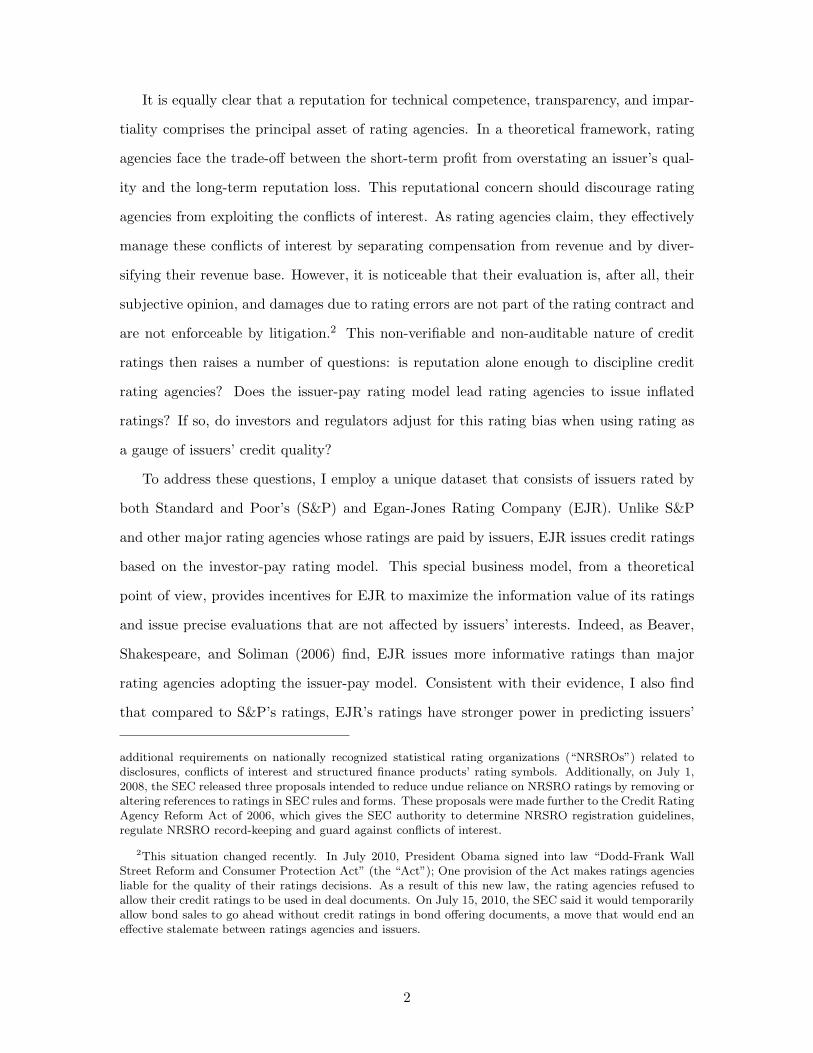
It is equally clear that a reputation for technical competence, transparency, and impar-
tiality comprises the principal asset of rating agencies. In a theoretical framework, rating
agencies face the trade-off between the short-term profit from overstating an issuer’s qual-
ity and the long-term reputation loss. This reputational concern should discourage rating
agencies from exploiting the conflicts of interest. As rating agencies claim, they effectively
manage these conflicts of interest by separating compensation from revenue and by diver-
sifying their revenue base. However, it is noticeable that their evaluation is, after all, their
subjective opinion, and damages due to rating errors are not part of the rating contract and
are not enforceable by litigation.2 This non-verifiable and non-auditable nature of credit
ratings then raises a number of questions: is reputation alone enough to discipline credit
rating agencies? Does the issuer-pay rating model lead rating agencies to issue inflated
ratings? If so, do investors and regulators adjust for this rating bias when using rating as
a gauge of issuers’ credit quality?
To address these questions, I employ a unique dataset that consists of issuers rated by
both Standard and Poor’s (S&P) and Egan-Jones Rating Company (EJR). Unlike S&P
and other major rating agencies whose ratings are paid by issuers, EJR issues credit ratings
based on the investor-pay rating model. This special business model, from a theoretical
point of view, provides incentives for EJR to maximize the information value of its ratings
and issue precise evaluations that are not affected by issuers’ interests. Indeed, as Beaver,
Shakespeare, and Soliman (2006) find, EJR issues more informative ratings than major
rating agencies adopting the issuer-pay model. Consistent with their evidence, I also find
that compared to S&P’s ratings, EJR’s ratings have stronger power in predicting issuers’
additional requirements on nationally recognized statistical rating organizations (“NRSROs”) related todisclosures, conflicts of interest and structured finance products’ rating symbols. Additionally, on July 1,2008, the SEC released three proposals intended to reduce undue reliance on NRSRO ratings by removing oraltering references to ratings in SEC rules and forms. These proposals were made further to the Credit RatingAgency Reform Act of 2006, which gives the SEC authority to determine NRSRO registration guidelines,regulate NRSRO record-keeping and guard against conflicts of interest.
2This situation changed recently. In July 2010, President Obama signed into law “Dodd-Frank WallStreet Reform and Consumer Protection Act” (the “Act”); One provision of the Act makes ratings agenciesliable for the quality of their ratings decisions. As a result of this new law, the rating agencies refused toallow their credit ratings to be used in deal documents. On July 15, 2010, the SEC said it would temporarilyallow bond sales to go ahead without credit ratings in bond offering documents, a move that would end aneffective stalemate between ratings agencies and issuers.
2
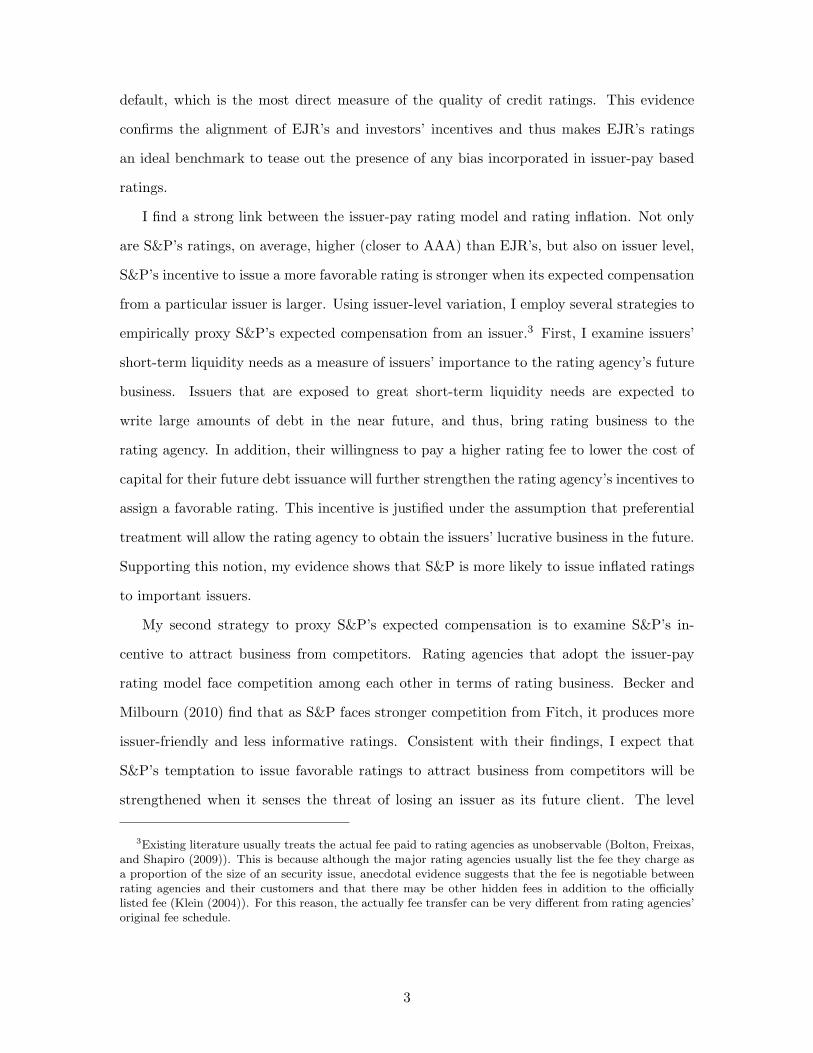
default, which is the most direct measure of the quality of credit ratings. This evidence
confirms the alignment of EJR’s and investors’ incentives and thus makes EJR’s ratings
an ideal benchmark to tease out the presence of any bias incorporated in issuer-pay based
ratings.
I find a strong link between the issuer-pay rating model and rating inflation. Not only
are S&P’s ratings, on average, higher (closer to AAA) than EJR’s, but also on issuer level,
S&P’s incentive to issue a more favorable rating is stronger when its expected compensation
from a particular issuer is larger. Using issuer-level variation, I employ several strategies to
empirically proxy S&P’s expected compensation from an issuer.3 First, I examine issuers’
short-term liquidity needs as a measure of issuers’ importance to the rating agency’s future
business. Issuers that are exposed to great short-term liquidity needs are expected to
write large amounts of debt in the near future, and thus, bring rating business to the
rating agency. In addition, their willingness to pay a higher rating fee to lower the cost of
capital for their future debt issuance will further strengthen the rating agency’s incentives to
assign a favorable rating. This incentive is justified under the assumption that preferential
treatment will allow the rating agency to obtain the issuers’ lucrative business in the future.
Supporting this notion, my evidence shows that S&P is more likely to issue inflated ratings
to important issuers.
My second strategy to proxy S&P’s expected compensation is to examine S&P’s in-
centive to attract business from competitors. Rating agencies that adopt the issuer-pay
rating model face competition among each other in terms of rating business. Becker and
Milbourn (2010) find that as S&P faces stronger competition from Fitch, it produces more
issuer-friendly and less informative ratings. Consistent with their findings, I expect that
S&P’s temptation to issue favorable ratings to attract business from competitors will be
strengthened when it senses the threat of losing an issuer as its future client. The level
3Existing literature usually treats the actual fee paid to rating agencies as unobservable (Bolton, Freixas,and Shapiro (2009)). This is because although the major rating agencies usually list the fee they charge asa proportion of the size of an security issue, anecdotal evidence suggests that the fee is negotiable betweenrating agencies and their customers and that there may be other hidden fees in addition to the officiallylisted fee (Klein (2004)). For this reason, the actually fee transfer can be very different from rating agencies’original fee schedule.
3
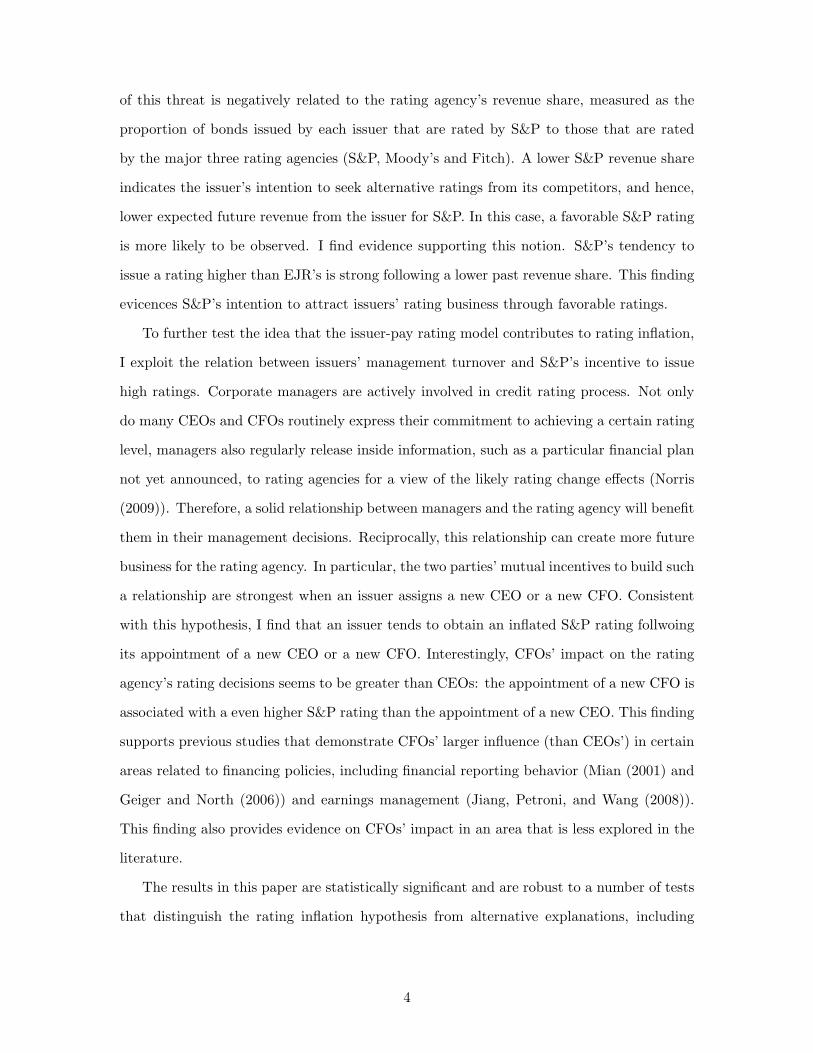
of this threat is negatively related to the rating agency’s revenue share, measured as the
proportion of bonds issued by each issuer that are rated by S&P to those that are rated
by the major three rating agencies (S&P, Moody’s and Fitch). A lower S&P revenue share
indicates the issuer’s intention to seek alternative ratings from its competitors, and hence,
lower expected future revenue from the issuer for S&P. In this case, a favorable S&P rating
is more likely to be observed. I find evidence supporting this notion. S&P’s tendency to
issue a rating higher than EJR’s is strong following a lower past revenue share. This finding
evicences S&P’s intention to attract issuers’ rating business through favorable ratings.
To further test the idea that the issuer-pay rating model contributes to rating inflation,
I exploit the relation between issuers’ management turnover and S&P’s incentive to issue
high ratings. Corporate managers are actively involved in credit rating process. Not only
do many CEOs and CFOs routinely express their commitment to achieving a certain rating
level, managers also regularly release inside information, such as a particular financial plan
not yet announced, to rating agencies for a view of the likely rating change effects (Norris
(2009)). Therefore, a solid relationship between managers and the rating agency will benefit
them in their management decisions. Reciprocally, this relationship can create more future
business for the rating agency. In particular, the two parties’ mutual incentives to build such
a relationship are strongest when an issuer assigns a new CEO or a new CFO. Consistent
with this hypothesis, I find that an issuer tends to obtain an inflated S&P rating follwoing
its appointment of a new CEO or a new CFO. Interestingly, CFOs’ impact on the rating
agency’s rating decisions seems to be greater than CEOs: the appointment of a new CFO is
associated with a even higher S&P rating than the appointment of a new CEO. This finding
supports previous studies that demonstrate CFOs’ larger influence (than CEOs’) in certain
areas related to financing policies, including financial reporting behavior (Mian (2001) and
Geiger and North (2006)) and earnings management (Jiang, Petroni, and Wang (2008)).
This finding also provides evidence on CFOs’ impact in an area that is less explored in the
literature.
The results in this paper are statistically significant and are robust to a number of tests
that distinguish the rating inflation hypothesis from alternative explanations, including
4
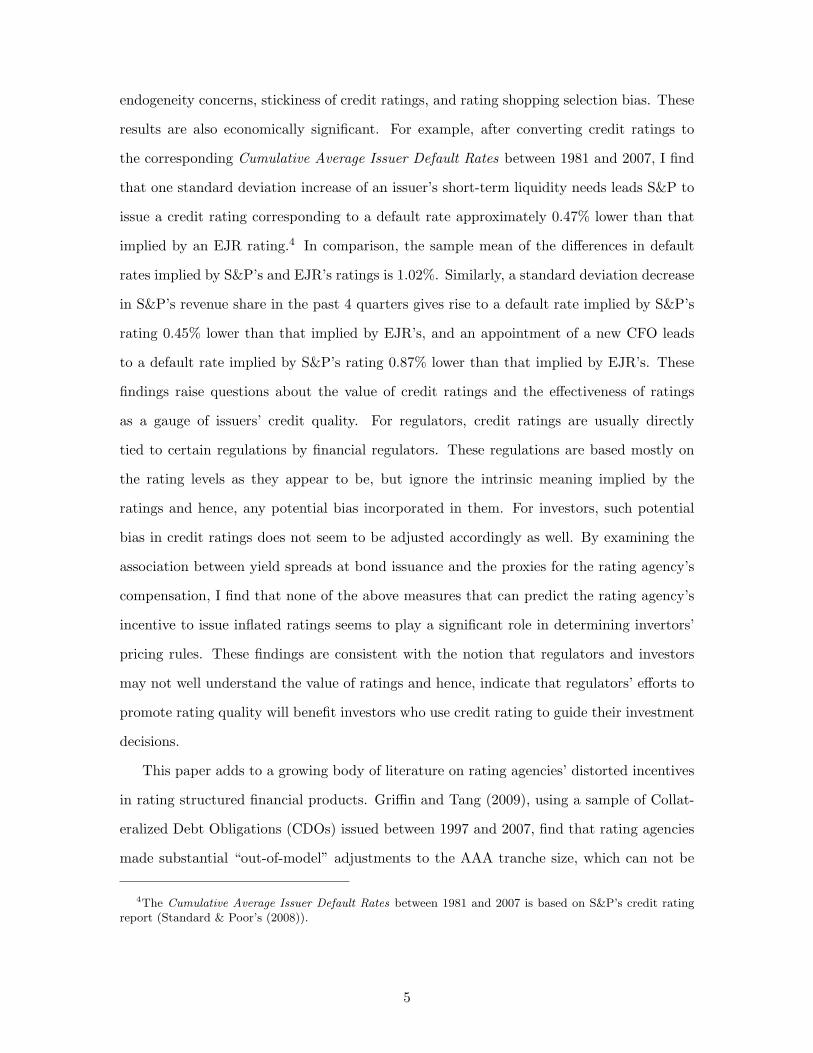
endogeneity concerns, stickiness of credit ratings, and rating shopping selection bias. These
results are also economically significant. For example, after converting credit ratings to
the corresponding Cumulative Average Issuer Default Rates between 1981 and 2007, I find
that one standard deviation increase of an issuer’s short-term liquidity needs leads S&P to
issue a credit rating corresponding to a default rate approximately 0.47% lower than that
implied by an EJR rating.4 In comparison, the sample mean of the differences in default
rates implied by S&P’s and EJR’s ratings is 1.02%. Similarly, a standard deviation decrease
in S&P’s revenue share in the past 4 quarters gives rise to a default rate implied by S&P’s
rating 0.45% lower than that implied by EJR’s, and an appointment of a new CFO leads
to a default rate implied by S&P’s rating 0.87% lower than that implied by EJR’s. These
findings raise questions about the value of credit ratings and the effectiveness of ratings
as a gauge of issuers’ credit quality. For regulators, credit ratings are usually directly
tied to certain regulations by financial regulators. These regulations are based mostly on
the rating levels as they appear to be, but ignore the intrinsic meaning implied by the
ratings and hence, any potential bias incorporated in them. For investors, such potential
bias in credit ratings does not seem to be adjusted accordingly as well. By examining the
association between yield spreads at bond issuance and the proxies for the rating agency’s
compensation, I find that none of the above measures that can predict the rating agency’s
incentive to issue inflated ratings seems to play a significant role in determining invertors’
pricing rules. These findings are consistent with the notion that regulators and investors
may not well understand the value of ratings and hence, indicate that regulators’ efforts to
promote rating quality will benefit investors who use credit rating to guide their investment
decisions.
This paper adds to a growing body of literature on rating agencies’ distorted incentives
in rating structured financial products. Griffin and Tang (2009), using a sample of Collat-
eralized Debt Obligations (CDOs) issued between 1997 and 2007, find that rating agencies
made substantial “out-of-model” adjustments to the AAA tranche size, which can not be
4The Cumulative Average Issuer Default Rates between 1981 and 2007 is based on S&P’s credit ratingreport (Standard & Poor’s (2008)).
5
well explained by the underlying characteristics of CDOs. Ahcraft, Goldsmith-Pinkham,
and Vickery (2010) study credit ratings on mortgage-backed securities (MBS) deals between
2001 and 2007. They find evidence of rating criterion deviation during the MBS market
expansion, with ratings becoming less conservative in this period. Nadauld and Sherlund
(2009) analyze the structure and attributes of subprime MBS deals between 1997 and 2007.
They find that deals comprised of loans concentrated in areas with high rates of home price
appreciation receive better credit ratings on average.
This paper makes two important contributions to this literature. First, while existing
studies suggest that the issuer-pay rating model may have resulted in inflated ratings that do
not truly reflect financial products’ default risk, this evidence relies on time-varying rating
criteria and assumes that rating agencies’ incentives to issue inflated ratings are linked to
the overall market conditions and business cycles. My analysis, on the other hand, provides
direct evidence of this problem by comparing ratings issued by the issuer-pay based rating
agency and the investor-pay based rating agency. Second, my results indicate that inflated
ratings arising from the issuer-pay rating model are not confined to ratings of structured
financial products. Rather, they occur to corporate (bond) ratings as well, which comprise
a large segment of financial markets and go beyond the scope of the recent market boom
for the structured financial products.
This paper also contributes to recent theoretical work on rating agencies’ rating strate-
gies and rating process, including Bolton, Freixas, and Shapiro (2009), Mathis, McAndrews,
and Rochet (2009), Fulghieri, Strobl, and Xia (2011), among others. These studies analyze
implications of the issuer-pay rating model and incorporate the rating agencies’ trade-off
between the short-term profit from overstating an issuer’s credit quality and the long-term
payoff reduction from potential reputation loss. They find that rating inflation can exist
in equilibrium, when reputational cost is outweighed by the marginal benefits of “selling”
favorable ratings to issuers. This paper provides empirical evidence supporting this theo-
retical finding, and further implies that reputational concerns in the current rating industry
may not be sufficient to prevent rating agencies from exploiting the conflicts of interest.
6
Finally, this paper adds to the literature on the information value of credit ratings. Pre-
vious studies have shown that rating events such as rating changes convey new information
to the market (see, e.g. Holthausen and Leftwich (1986), Hand, Holthausen, and Leftwich
(1992), Goh and Ederington (1993) and Hull, Predescu, and White (2004)). These papers
look at how stock and bond prices react to rating event announcements and infer the in-
formation value of ratings from these reactions. This study, on the other hand, highlights
a potential bias in credit ratings by directly examining the rating levels rather than any
rating events, and hence, raises questions about the information value of ratings from a
dimension not adequately taken into account in existing literature.
The paper proceeds as follows. Chapter 2 describes the institutional background of
the credit rating industry. Chapter 3 outlines the hypotheses and the empirical methodol-
ogy. Chapter 4 describes the data, sample selection and empirical results. The results of
robustness tests are presented in Chapter 5. Chapter 6 concludes.
7
Chapter 2
Institutional Background
The credit rating industry has long been dominated by a handful of companies des-
ignated as “Nationally Recognized Statistical Ratings Organizations” (“NRSROs”) by the
Securities and Exchange Commission (SEC). As of 2002, Standard and Poor’s, Moody’s and
Fitch were the only rating agencies that were granted the “NRSRO” status. Credit ratings
issued by the major three rating agencies play a central role in financial markets, not only
because they convey information to the market about the quality of a company, but also
because many regulations of financial institutions are directly tied to these credit ratings
from “NROSROs”. Recently, the SEC, arguably as a result of political pressure and/or
concern about concentration in the industry, added another seven rating agencies to this
group. Dominion Bond Rating Service (a Canadian CRA) and A.M. Best (highly regarded
in particular for its ratings of insurance firms) were designated as “NROSROs” in 2003 and
2005, respectively. In 2007, the SEC added two Japanese rating agencies (Japan Credit Rat-
ing Agency, Ltd. and Ratings and Investment Information, Inc.) and a Philadelphia area
based firm Egan-Jones Rating Company (EJR). More recently, two other rating agencies
LACE Financial and Realpoint LLC joined this group as the ninth and tenth organizations
designated as “NROSROs”.
Despite the importance of credit ratings to financial market participants, the larger
NRSROs have been criticized for their reliance on an “issuer-pays” business model, in which
the bulk of their revenue comes from the issuers of the bonds being rated. One exception is
Egan-Jones Rating Company (EJR). EJR is an independent rating agency founded by Sean
Egan and Bruce Jones and first issued ratings in December 1995. Since its foundation, EJR
has been following and rating more than 1,300 companies in industrial, financial, and service
sectors. Its active role in participating in both rating agency hearings in Congress and at the
SEC has attracted extensive coverage in the media and financial press, including The Wall
Street Journal and Fortune, among others. Relying on revenue from investor subscribers as
opposed to the traditional issuer-pay business model, EJR claims that it “delivers highly
accurate ratings with predictive value for equity, debt, and money market portfolios and
has no conflicts of interest.” With this aim, it successfully predicted the pitfalls of Enron,
WorldCom, and more recently, Lehman Brothers through its credit ratings. The SEC’s
approval to grant EJR the “NRSRO” status further strengthens its position in the credit
industry.
Based on EJR’s disclosure documents to the SEC, “an Egan-Jones’s credit rating is a
current opinion of the credit worthiness of an obligor with respect to a specific financial
obligation, a specific class of financial obligations, or a specific financial program (including
ratings on medium-term note programs and commercial paper programs).” EJR uses the
same credit rating scales as S&P, namely from AAA to D (including modifiers “plus (+)”
and “minus (-)”) for long-term ratings, and from A-1 to D for short-term ratings. EJR
“selects an issuer for a credit analysis generally based on developments within issuers and
industries, market developments and requests of subscribers,” and makes their credit ratings
available via subscription service on Bloomberg.
Because of EJR’s investor-pay rating model and its broad rating coverage, EJR’s credit
ratings provide an ideal benchmark to study the impact of the issuer-pay model on credit
ratings.
9

Chapter 3
Hypothesis Development
I posit that the issuer-pay rating model contributes to credit rating inflation. More
specifically, I argue that compared to an EJR’s credit rating to an issuer, a rating agency
that adopts the issuer-pay model tends to assign a more favorable rating to the same issuer if
doing so will be compensated by a higher expected revenue. Ideally, I would like to associate
the rating agency’s incentives to issue inflated ratings with the compensation it receives from
an issuer. In practice, however, rating fees (including the fee for an initial issue and the
subsequent maintenance fee for monitoring the issue) is not directly observable.1 Therefore,
I employ three empirical strategies to proxy the rating agency’s expected compensation from
an issuer.
3.1 The Rating Agency’s Future Business
The rating agency’s expected compensation from an issuer is directly related to its
prospective revenue. An important client who is likely to bring lucrative business in the
future will generate a strong incentive for the rating agency (adopting the issuer-pay model)
to issue a favorable rating. This incentive is justified under the assumption that preferential
treatment today will allow the rating agency to obtain the issuer’s business in the future.
An issuer’s importance to the rating agency’s future business can be measured by its its
short-term debt volume (short-term liquidity needs). First, by definition, short-term debt is
due within the next year. Therefore, if issuers are exposed to a large amount of short-term
1Although the major rating agencies usually list their fee schedules as a proportion of the size of ansecurity issue, anecdotal evidence suggests that the fee is negotiable between rating agencies and theircustomers and that there may be other hidden fees in addition to the officially listed fee.

debt, it is likely that they need to replace it through new debt issuance in the future and
hence, bring new rating business to the rating agency. Second, these issuers may find a
low rating costly for their future issuance, either because of high risk premium required
by investors, or because regulatory restrictions on certain investors’ portfolio composition.
This makes them willing to pay a higher rating fee in exchange for a more favorable rating to
lower the cost of capital. In this case, the rating agency is tempted to assign issuer-friendly
ratings today to attract future business from these customers. Formally, I present the first
hypothesis as:
H1: A rating agency that adopts the issuer-pay rating model will issue a rating more
favorable than EJR’s, if the issuer has high short-term liquidity needs.
3.2 The Rating Agency’s Revenue Share
While many issuers obtain more than one credit rating from major rating agencies, only
fewer than ten percent of investors are required to hold securities from issuers with two or
more ratings (Baker and Mansi (2001)). Therefore, major rating agencies face competition
from each other in terms of rating business. Issuers can end a business relationship with
a rating agency and request ratings from alternative ones if doing so will result in more
favorable ratings. Becker and Milbourn (2010) find that as S&P and Moody’s face strong
competition from Fitch, they produce more issuer-friendly and less informative ratings.
In similar spirit with this study, I expect that when the rating agency senses the threat
of losing an issuer as its future client, it will be tempted to issue favorable ratings to
solidify its business relationship with the issuer. Similar to Becker and Milbourn (2010), I
measure competition facing the rating agency as its revenue share on issuer level, namely
the proportion of the issuer’s bonds that are rated by S&P to those that are rated by the
major three rating agencies (S&P, Moody’s and Fitch). Formally, I hypothesize that:
H2: A rating agency that adopts the issuer-pay rating model will issue a rating more
favorable than EJR’s, if its past revenue share with an issuer is low.
11
3.3 Issuers’ Management Turnover
Corporate managers are actively involved in the credit rating process. Many CEOs and
CFOs routinely express their commitment to achieving a certain rating level; managers also
regularly release inside information, such as a particular financial plan not yet announced,
to rating agencies for a view of the likely rating change effects (see Norris (2009)); and
agencies sometimes negotiate with executives from large companies on a potential rating
change. Managers’ involvement with rating agencies can be justified not only by the role of
credit ratings on CEOs’ and CFOs’ current financial decisions, including capital structure
(see Graham and Harvey (2001), Kisgen (2006) and Kisgen (2009)), but also in terms of
potential impact credit ratings can have on firms’ future business (see Kisgen (2007)).2
Because of the important role credit ratings play in a firm’s management, I expect that
CEOs and CFOs are motivated to build a relationship with rating agencies, possibly by
paying a higher rating fee. Indeed, in wake of high-profile bankruptcies in early 2000, news
reports reveals that major rating agencies had been lobbied by executives from big financial
companies in behind-the-scenes meeting to hold off negative rating moves. Reciprocally,
rating agencies’ willingness in participating in the relationship can generate more future
business from the issuers and hence, generate higher expected compensation. In particular,
I expect that the two parties’ mutual incentives to build such a relationship are strongest
when a firm assigns a new CEO or a new CFO. Therefore, I hypothesize that:
H3a: A rating agency that adopts the issuer-pay rating model will issue a rating more
favorable than EJR’s following an issuer’s appointment of a new CEO or a new CFO.
However, whether a new CEO or a new CFO has a bigger impact on rating agencies’
rating decisions is an open question. On one hand, given CFOs are CEOs’ agents (Graham
and Harvey (2001)) and hence, may respond only to the wishes of their CEOs, a CEO may
2For example, after major rating agencies publicized a potential downgrade on Electronic Data Systems(“EDS”), an IT services company, Michael H. Jordan, the CEO, expressed concerns that it may causethe company to lose a couple of big contracts. As analysts argued, “a rating drop could make signingnew customers more difficult, stalling turnaround effects.” (Wall Street Journal (2004)) Mr. Jordan thenundertook several steps to improve the balance sheet, including an announcement of potential sale of asubsidiary and dividend cut.
12

be more influential in a firm’s overall financial decisions. On the other hand, previous studies
have shown that CFOs wield significant influence in certain areas. For example, Geiger and
North (2006) show that discretionary accruals, part of firms’ financial reporting, decrease
significantly surrounding the appointment of a new CFO, but not associated with concurrent
CEO appointments. Other areas include financial reporting behavior (Mian (2001) and
earnings management (Jiang, Petroni, and Wang (2008)). Based on Fight (2001), it is the
issuers’ CFOs who are mostly involved in the day-to-day contact with the rating agencies
and in attending the rating agency meetings. Given this evidence, I expect that CFOs have
more impact than CEOs. Therefore, my next hypothesis is:
H3b: A rating agency that adopts the issuer-pay rating model has a stronger incentive
to issue a favorable credit rating surrounding an issuer’s appointment of a new CFO than
surrounding the appointment of a new CEO.
3.4 The Information Value of Credit Ratings
Fair and accurate credit ratings play an important role in the financial system. Several
regulations of financial institutions are directly tied to credit rating issued by major rating
agencies. For example, the U.S. Treasury Department prohibits banks from investing in
non-investment grade bonds. Other institutions that are affected by regulations based on
ratings include U.S. savings and loans, insurance companies and broker-dealers, among
others. However, these regulations are based only on the rating levels as they appear to
be but ignore the intrinsic meaning implied by these levels and hence, any potential bias
incorporated in the ratings. This raises the question of how efficient these regulations are
in ratings are indeed biased. On the other hand, investors price an issuer’s securities using
information conveyed through credit ratings. Since rating strategies are not observable
to outsiders, investors (and regulators) who use ratings may not be able to verify their
quality. In other words, it is an open question whether investors can anticipate rating
agencies’ tendency to issue inflated rating predicted in previous hypotheses and adjust
their evaluation of issuers (and their securities) accordingly. Therefore, my hypothesis is:
13

H4: Investors can not accurately anticipate rating agencies’ tendency to issue biased
credit ratings and hence, do not fully adjust their pricing of issuers’ securities accordingly.
3.5 Empirical Methodology
To test the hypotheses above, I construct a panel dataset and compare the credit ratings
issued by a rating agency using the issuer-pay model to that issued by EJR. Following prior
studies, I view existing major rating agencies as relatively homogenous (see, e.g. Holthausen
and Leftwich (1986) and Hand, Holthausen, and Leftwich (1992)). I choose S&P as the
representative rating agency based on the issuer-pay rating model because of the same
rating scales it employs as EJR. I generate two variables, Inflation Tendency and Inflation
Magnitude, to capture the rating differences between the two types of rating agencies. First,
I define Inflation Tendency as:
Inflation Tendencyi,t =
1, if RSPi,t is more favorable than REJR
i,t
0, Otherwise(3.1)
where RSPi,t stands for the credit rating of issuer i at time t that is issued by S&P and REJR
i,t
stands for the credit rating of issuer i at time t that is issued by EJR. The comparison
of credit ratings from the two rating agencies is based on different rating notches that
takes into account rating modifiers (“plus (+)” and “minus (-)”). For example, a rating of
“BB+” is more favorable (or higher) than a rating of “BB”.3 A higher value of Inflation
Tendency means that compared to EJR, S&P is more likely to issue a more favorable rating
to an issuer. Second, I convert each credit rating to the corresponding “Cumulative Average
Issuer Default Rates” between 1981 and 2007 based on S&P’ credit rating report and define
3To check the robustness of my results, I also suppress the rating modifiers and compare ratings fromthe two rating agencies based on rating letters. For example, on letter basis, “BB+” falls into the samecategory as a rating of “BB” or “BB-”, but is different than “BBB+”, “BBB” and “BBB-”, which fall intothe category of “BBB”. The results based on rating letters are reported in the Robustness section.
14
Inflation Magnitude as :
Inflation Magnitudei,t = DREJRi,t −DRSP
i,t (3.2)
Where DREJRi,t and DRSP
i,t stand for the default rates corresponding to the credit ratings
of issuer i at time t that are issued by EJR and by S&P, respectively. A positive value of
Inflation Magnitude indicates that compared to EJR, S&P issues a more favorable rating
to an issuer because it predicts the issuer to have a lower default risk. The higher the value
of Inflation Magnitude is, the more favorable S&P’s rating is than EJR’s. The empirical
analysis in this paper utilizes a logit model using Inflation Tendency as the dependent
variable and an OLS model using Inflation Magnitude as the dependent variable. If the
issuer-pay rating model contributes to credit rating inflation, I expect to find that the
proxies for the rating agency’s expected revenue from an issuer will have a positive effect
in determining the dependent variables in both models.4
To test Hypothesis H1, I measure an issuer’s importance to the rating agency’s future
business needs at time t as the natural logarithm of its total short-term debt (denoted as
Ln(Short-term Debt)). To test Hypothesis H2 and measure S&P’s revenue share (which is
negatively related to the intensity of competition S&P faces from other rating agencies), I
trace each issuer’s debt-issuance activity on quarterly basis back to the past two years at
each time point. For each issuer i, I define Fraction of Bond Issue Volume Rated by S&P
in the Past n Quarters as the offering amount of bonds issued by issuer i during the past
n quarters that are rated by S&P as a fraction of those that are issued by the major three
rating agencies (S&P, Moody’s and Fitch) in total. This measure is similar to the revenue
share defined in Becker and Milbourn (2010), which is the number of bonds issued by issuer i
during the past n quarters that are rated by S&P as a fraction of those that are issued by the
major three rating agencies (S&P, Moody’s and Fitch) in total. An advantage of using issue
volume is that it provides a more precise measure of the rating agency’s revenue since rating
4In the Results section, I present the main results only using the OLS model. I check the robustness ofmy results using the logit model in the Robustness section.
15
fees are usually proportional to the offering amount of an issue. I examine this revenue share
measure using different time windows including past 2 quarters, 4 quarters, 6 quarters, and
8 quarters. To test H3a and H3b, I construct the variable new CFO (CEO) that equals 1
in the fiscal year when a new CFO (CEO) is appointed, and equals 0 otherwise. Finally, to
explore investors’ knowledge of potential bias in credit ratings, I examine the association
between issuers’ bond yield spreads and the proxies for the rating agencies’ compensation
from an issuer. To avoid noise from secondary-market trading activities, I examine the
Treasury Spread for new bond issuance. This is defined as the difference between the issue’s
offering yield and the yield on a benchmark treasury security (a U.S. treasury bond) with
similar duration and maturity. I apply an OLS regression with Treasury Spread as the
dependent variable and include S&P’s issuer’s rating fixed effects. If investors can not
accurately anticipate rating agencies’ tendency to issue biased credit ratings, I expect to
see an insignificant relation between Treasury Spread and the variables that can predict
S&P’s incentive to issue inflated ratings.
16
Chapter 4
Data and Empirical Analysis
4.1 Data and Sample Selection
The rating sample is constructed by combining two rating datasets. EJR’s issuer credit
ratings are hand-collected from Bloomberg and EJR’s database via website. EJR keeps its
historical rating records back to July 1999. This database contains EJR’s issuer ratings in
a time series. Each observation is a credit rating (and the related identification and date
information) corresponding to a certain rating action, including new rating assignment,
affirmation, upgrade and downgrade. The dataset covers the period from July 1999 to
July 2009, with 23,223 observations representing 2,033 issuers. I eliminate issuers that only
obtain a newly assigned rating but have not been followed since then, probably due to insuf-
ficient information after EJR’s initial evaluation. I also delete observations corresponding
to an “NR” rating because this indicates that EJR withdraws ratings to the issuer. These
two steps reduce the EJR rating sample to 22,816 observations with 1,642 issuers. I obtain
S&P’s issuer credit ratings from S&P’s rating Xpress data services. This database contains
detailed information on S&P’s credit ratings in a time series back to 1920s, including is-
suer’s long-term credit ratings, short-term credit ratings and rating Watchlist and Outlook
provision. Similar to EJR’s rating database, each observation in S&P’s rating database is
a credit rating corresponding to a certain rating action. In the initial database, there are
127,849 observations representing 17,298 private and public issuers globally. I restrict my
analysis to U.S. issuers, which leaves us with 72,641 observations from 9,100 private and
public issuers.
I construct two quarterly panel datasets, starting from the third quarter of 1999 to the
third quarter of 2009, for EJR’s and S&P’s rating database respectively. Following prior
literature, I assigned a numerical value to each rating as follows on notch basis: AAA=1,
AA+=2, AA=3, AA-=4, A+=5, A=6, A-=7, BBB+=8, BBB=9, BBB-=10, BB+=11,
BB=12, BB-=13, B+=14, B=15, B-=16, CCC+=17, CCC=18, CCC-=19, CC=20, C=21,
and D=22. Since both rating databases treat a credit rating with an rating action (rather
than a credit rating itself) as an observation, I assign a rating in the current quarter equal to
the issuer’s rating in the past quarter if no rating action happens. In addition, if two rating
actions happen in the same quarter (which means that there are two observations in the same
quarter), I take the mean of the ratings based on the above numerical conversion. I then
merge these two panel datasets by manually matching company names and year-quarter
information. I successfully merged 1,574 out of 1,642 issuers from EJR’s rating dataset.
Since I am interested in issuer’s financial activities, I restrict my sample to non-financial
and non-utility issuers. This criterion resulted in 1,271 issuers in my rating sample.
The tests of the hypotheses above require issuers’ financial information. I obtained
financial statement data from the COMPUSTAT quarterly database. My tests are based
on the comparison of S&P’s ratings to EJR’s and therefore require that ratings from both
rating agencies are available at a certain time point. This resulted in 26,952 observations
representing 966 issuers in the primary sample with issuers’ financial information available.
The financial variables I need in the analysis include: Total Assets, Sales, Leverage as
the ratio of total debt from the balance sheet to total assets, Market-to-Book as the ratio
of the market value of assets to total assets, where the numerator is defined as the sum of
market equity and total debt, ROA as the ratio of operating income before depreciation to
total assets, Tangibility as the ratio of net property, plant, and equipment to total assets,
R&D/Sales as the ratio of R&D expense to sales, where R&D expense is replaced by 0
if missing, R&D Missing Dummy that equals 1 if R&D expense is missing, and finally,
Altman’s Z-Score as the sum of 3.3 times pre-tax income, sales, 1.4 times retained earnings,
and 1.2 times net working capital all divided by total assets.
Panel A of Table 1 presents descriptive statistics for the primary sample consisting of
18
issuers rated by both S&P and EJR in Column (2). As a comparison, Column (1) presents
summary statistics for the Issuers Rated by S&P sample containing all non-financial and
non-utility public U.S. issuers that are rated by S&P in the sample period. From Panel
A, we can see that issuers that are rated by both S&P and EJR are, on average, larger
than all issuers rated by S&P, measure by capitalization, total assets and sales. In addition,
issuers rated by both rating agencies have lower leverage, higher Altman’s Z-Score and
higher ROA. This evidence suggests that these issuers appear to be less risky and more
productive than their counterparts. However, their higher Market-to-Book, lower Tangibility
and higher R&D/Sales indicate that these issuers tend to invest more heavily on R&D to
accommodate the higher growth opportunity and are possibly more difficult to evaluate due
to low proportion of fixed assets. These characteristics are consistent with the fact that
EJR rates issuers that are requested by its client base, and investors are likely to have a
high demand for ratings on issuers that are larger but harder to evaluate.
Panel B summarizes the two variables Inflation Tendency and Inflation Magnitude as
defined in Equation (1) and Equation (2). It is worth noting that Inflation Tendency is
significantly different from 0. This lends support to the hypothesis that on average, the
rating agency that adopts issuer-pay model assigns more favorable ratings than EJR. The
magnitude of the difference is also economically significant. For example, the mean of
Inflation Magnitude is 1.02%. This indicates that for an average issuer, the default rates
implied by an S&P rating is 1.02% lower than that implied by EJR’s. As a comparison,
based on S&P’s credit rating report, the average 10-year default rates of all issuers rated
by S&P is 8.22% (Standard & Poor’s (2008)).
To examine the association between rating inflation and the relationship between man-
agers and the rating agency, I obtain CEO and CFO information from COMPUSTAT EXE-
CUCOMP annual database. I identify CEOs following EXECUCOMP’s classification using
data item CEOANN where a CEO is identified if CEOANN=CEO. Following Gopalan,
Song, and Yerramilli (2010), I identify CFOs based on managers’ titles from data item
TITLEANN. A CFO is identified if a manager’s title contains: CFO, chief financial officer,
finance, treasurer, VP-finance or a combination of two or more of them. I identify that a
19
new CFO (CEO) if assigned in the current fiscal year if an issuer’s current CFO (CEO) is
different from the past fiscal year. To be consistent with the EXECUCOMP annual-based
data, I aggregate Inflation Tendency and Inflation Magnitude to annual level by taking the
mean of their values in the four quarters during each fiscal year, and do my analysis on
the annual basis. I restrict my analysis to issuer-year where information on both CEO and
CFO is available.
The tests on the relation between rating inflation and S&P’s revenue share and on
whether investors anticipate S&P’s rating bias require data from The Fixed Investment Se-
curities Database (FISD). This database provides key characteristics on almost all publicly
traded bond issuances and is merged using issuer’s 6-digit CUSIP to the primary sample.
In the investors’ anticipation test, I restrict my sample to each issuer’s issuance of senior
unsecured bonds during the sample period, in order to match the major rating agencies’
definition of issuer’s credit rating. In addition, I exclude any issuance of bonds that are
callable, puttable, convertible, exchangeable, with sinking fund or with refund protection.
I need the following financial variables for each issuance: Treasury Spread, Enhancement
as a dummy variable that equals 1 if the issue has credit enhancements, Covenants as a
dummy variable that equals 1 if the debt issue contains covenants in the contract, Ln(Bond
Issue Amount) as the logarithm of the par value of the debt issue in millions of dollars and
Maturity in Years as the number of years to maturity of debt. These criteria resulted in a
sample with 1,861 observations.
4.2 Comparison of the Quality of Credit Ratings
In the following analysis, I use EJR’s ratings as the benchmark to assess the bias of
S&P’s ratings. Therefore, it is essential to understand the informativeness of EJR’s ratings
compared to S&P’s, and to examine empirically whether EJR’s ratings qualifies a good
benchmark. As the first of of my analysis, I compare the ability of S&P’s and EJR’s ratings
to predict defaults–the most important credit events. Following existing literature (e.g.
Becker and Milbourn (2010)), this is the most straightforward measure of the quality of
20
credit ratings. The results are shown in Figure 1. In Panel A, I sort issuers based on their
credit ratings from S&P. Within each rating category on the X-axis, all the issuers have
the same S&P ratings. Furthermore, I divide issuers in each category into two subgroups:
(1) issuers whose EJR ratings are less favorable than S&P’s, and (2) issuers whose EJR
ratings are equal to or more favorable than S&P’s. Panel A shows that conditional on
S&P’s rating categories, issuers that obtain a lower rating from EJR have significantly high
default rates at five year horizon. For example, in the “BB” category, issuers with an EJR
rating more favorable than or equal to S&P’s have an average default rate of 0.71%. In
contrast, this number for issuers with an EJR rating less favorable than S&P’s is 10.3%,
more than ten times larger than the other group. In comparison, the average default rates
of issuers with S&P’s rating “B” is 8.8% in the sample. This evidence is consistent with
Beaver, Shakespeare, and Soliman (2006) who find that EJR issues more informative ratings
than major rating agencies adopting the issuer-pay model. In Panel B, I sort firms based
on their EJR ratings. Two observations are shown in Panel B. First, within each EJR
rating category, all the firms have very similar default rates, which is consistent with the
expectation that firms with the same rating should observe similar credit quality. Second,
supposed S&P’s rating is more informative. Then within each rating category, issuers whose
S&P ratings are lower than EJR’s should have a higher default rates than the other group.
However, we see the opposite from the plot. This, again, confirmed the implications in Panel
A and indicate that EJR’s credit ratings seems to have a higher quality and are more likely
to reveal the true credit quality of issuers. This evidence justifies the use of EJR’s rating
as a benchmark, and directly suggest that when we observe S&P’s ratings more favorable
than EJR’s, the S&P rating is more likely to be an inflated rating.
4.3 The Rating Agency’s Future Business
Having established the quality of EJR’s ratings as a benchmark, I next begin to examine
the link between rating inflation and the issuer-pay model. I start by studying the associ-
ation between rating inflation and issuers’ importance to S&P’s future business, measured
21
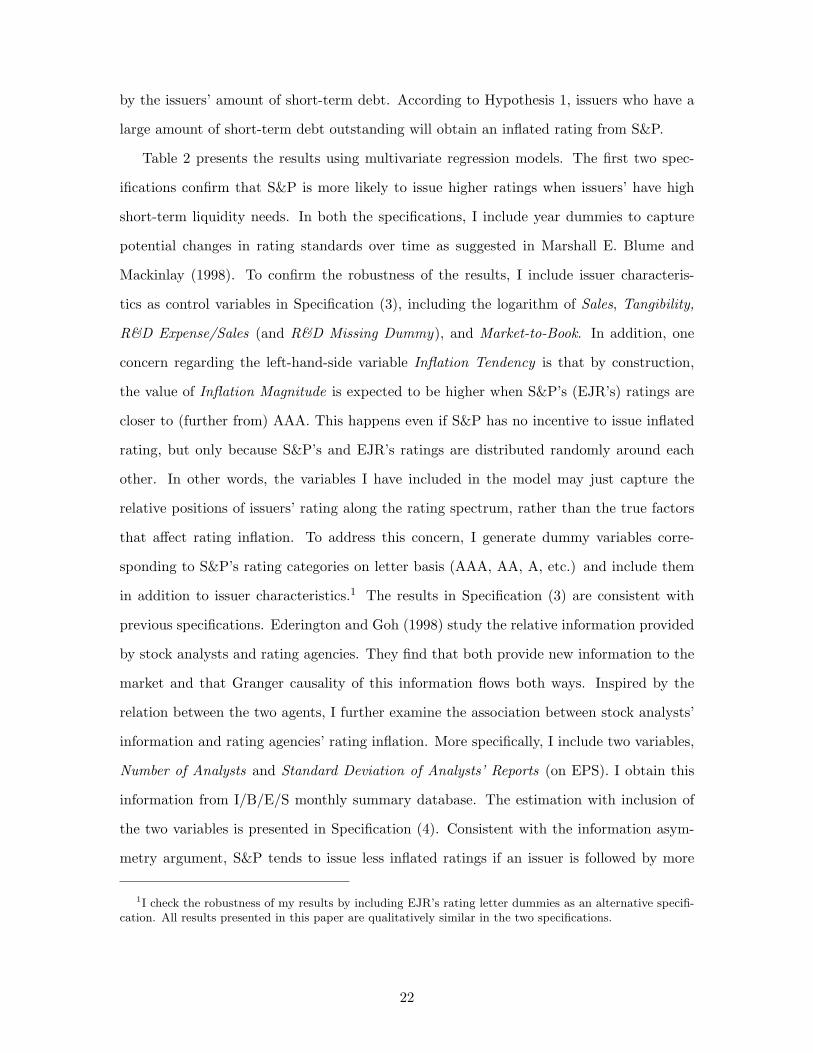
by the issuers’ amount of short-term debt. According to Hypothesis 1, issuers who have a
large amount of short-term debt outstanding will obtain an inflated rating from S&P.
Table 2 presents the results using multivariate regression models. The first two spec-
ifications confirm that S&P is more likely to issue higher ratings when issuers’ have high
short-term liquidity needs. In both the specifications, I include year dummies to capture
potential changes in rating standards over time as suggested in Marshall E. Blume and
Mackinlay (1998). To confirm the robustness of the results, I include issuer characteris-
tics as control variables in Specification (3), including the logarithm of Sales, Tangibility,
R&D Expense/Sales (and R&D Missing Dummy), and Market-to-Book. In addition, one
concern regarding the left-hand-side variable Inflation Tendency is that by construction,
the value of Inflation Magnitude is expected to be higher when S&P’s (EJR’s) ratings are
closer to (further from) AAA. This happens even if S&P has no incentive to issue inflated
rating, but only because S&P’s and EJR’s ratings are distributed randomly around each
other. In other words, the variables I have included in the model may just capture the
relative positions of issuers’ rating along the rating spectrum, rather than the true factors
that affect rating inflation. To address this concern, I generate dummy variables corre-
sponding to S&P’s rating categories on letter basis (AAA, AA, A, etc.) and include them
in addition to issuer characteristics.1 The results in Specification (3) are consistent with
previous specifications. Ederington and Goh (1998) study the relative information provided
by stock analysts and rating agencies. They find that both provide new information to the
market and that Granger causality of this information flows both ways. Inspired by the
relation between the two agents, I further examine the association between stock analysts’
information and rating agencies’ rating inflation. More specifically, I include two variables,
Number of Analysts and Standard Deviation of Analysts’ Reports (on EPS). I obtain this
information from I/B/E/S monthly summary database. The estimation with inclusion of
the two variables is presented in Specification (4). Consistent with the information asym-
metry argument, S&P tends to issue less inflated ratings if an issuer is followed by more
1I check the robustness of my results by including EJR’s rating letter dummies as an alternative specifi-cation. All results presented in this paper are qualitatively similar in the two specifications.
22
stock analysts and more likely to do so if the analysts’ opinions are more dispersed. This
finding implies rating agencies’ tendency to issue inflated rating may be constrained by
other information providers. It also indicates that stock analysts can have a disciplinary
role on the agents in credit market.
One limitation of the model so far is that it does not control for unobservable charac-
teristics of issuers that may be correlated with their motivation to obtain high ratings. To
address the concern on this potential omitted variable bias, I estimate a modified model
where I include issuer fixed effects. This model is estimated in Specification (5) and Specifi-
cation (6). Both measures remain significant. This further confirms the positive relationship
between rating inflation and the importance of issuers, thus the expected compensation S&P
can obtain.
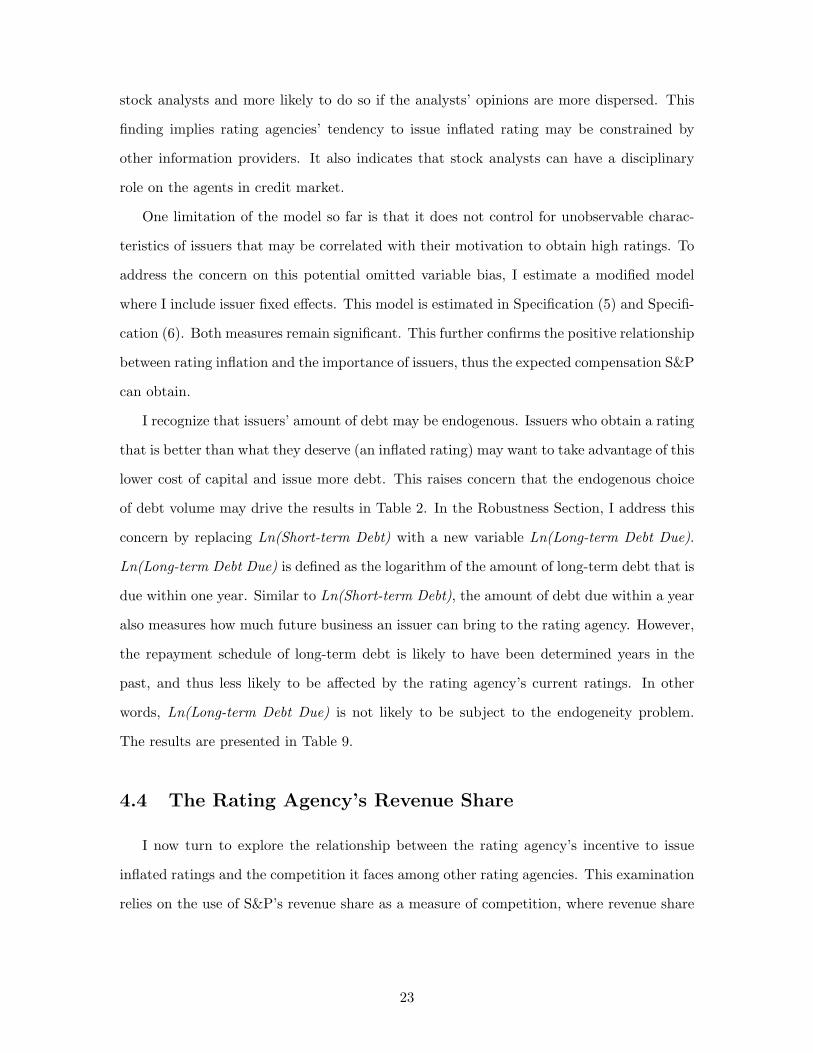
I recognize that issuers’ amount of debt may be endogenous. Issuers who obtain a rating
that is better than what they deserve (an inflated rating) may want to take advantage of this
lower cost of capital and issue more debt. This raises concern that the endogenous choice
of debt volume may drive the results in Table 2. In the Robustness Section, I address this
concern by replacing Ln(Short-term Debt) with a new variable Ln(Long-term Debt Due).
Ln(Long-term Debt Due) is defined as the logarithm of the amount of long-term debt that is
due within one year. Similar to Ln(Short-term Debt), the amount of debt due within a year
also measures how much future business an issuer can bring to the rating agency. However,
the repayment schedule of long-term debt is likely to have been determined years in the
past, and thus less likely to be affected by the rating agency’s current ratings. In other
words, Ln(Long-term Debt Due) is not likely to be subject to the endogeneity problem.
The results are presented in Table 9.
4.4 The Rating Agency’s Revenue Share
I now turn to explore the relationship between the rating agency’s incentive to issue
inflated ratings and the competition it faces among other rating agencies. This examination
relies on the use of S&P’s revenue share as a measure of competition, where revenue share
23
is defined by Fraction of Bond Issue Volume Rated by S&P in the Past n Quarters as the
offering amount of bonds issued by issuer i during the past n quarters that are rated by
S&P as a fraction of those that are rated by the major three rating agencies (S&P, Moody’s
and Fitch) in total. This measure is similar to the one used in Becker and Milbourn (2010),
where they define revenue share as the Fraction of Bond Issues Rated by S&P in the Past n
Quarters, namely the number of bonds issued by issuer i during the past n quarters that are
rated by S&P as a fraction of those that are rated by the major three rating agencies (S&P,
Moody’s and Fitch) in total. An advantage of using issue volume is that it provides a more
precise measure of the rating agency’s revenue since rating fees are usually proportional to
the offering amount of an issue.
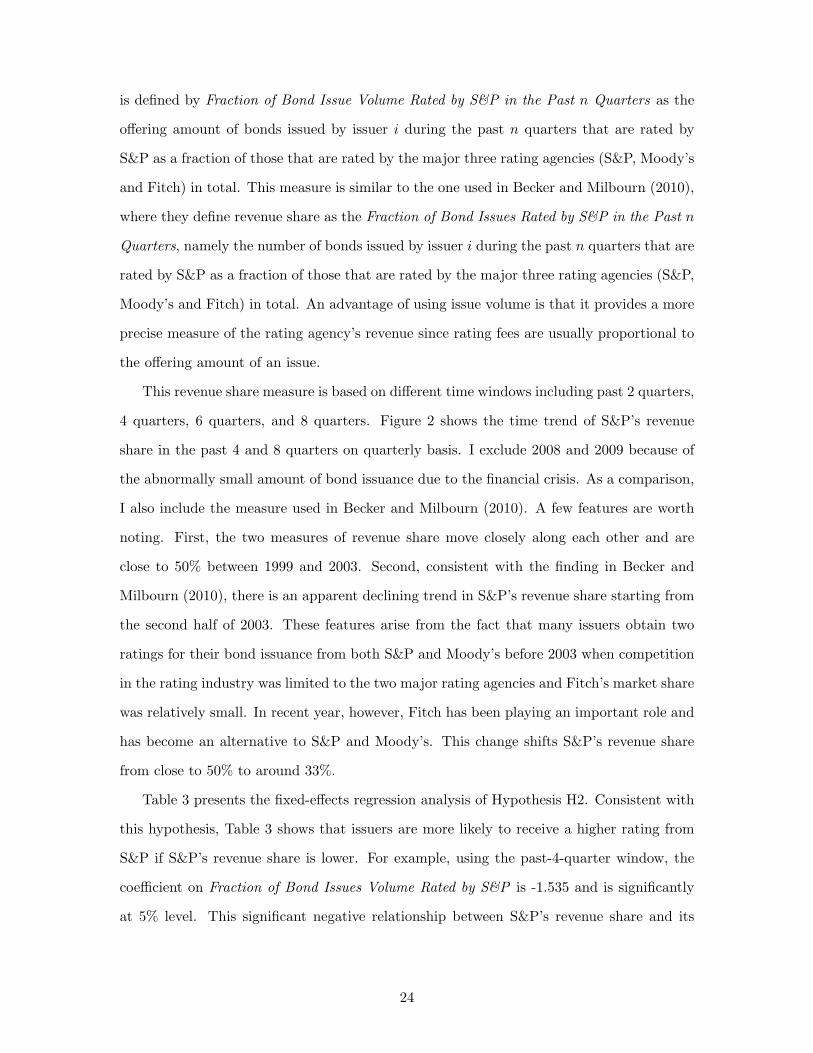
This revenue share measure is based on different time windows including past 2 quarters,
4 quarters, 6 quarters, and 8 quarters. Figure 2 shows the time trend of S&P’s revenue
share in the past 4 and 8 quarters on quarterly basis. I exclude 2008 and 2009 because of
the abnormally small amount of bond issuance due to the financial crisis. As a comparison,
I also include the measure used in Becker and Milbourn (2010). A few features are worth
noting. First, the two measures of revenue share move closely along each other and are
close to 50% between 1999 and 2003. Second, consistent with the finding in Becker and
Milbourn (2010), there is an apparent declining trend in S&P’s revenue share starting from
the second half of 2003. These features arise from the fact that many issuers obtain two
ratings for their bond issuance from both S&P and Moody’s before 2003 when competition
in the rating industry was limited to the two major rating agencies and Fitch’s market share
was relatively small. In recent year, however, Fitch has been playing an important role and
has become an alternative to S&P and Moody’s. This change shifts S&P’s revenue share
from close to 50% to around 33%.
Table 3 presents the fixed-effects regression analysis of Hypothesis H2. Consistent with
this hypothesis, Table 3 shows that issuers are more likely to receive a higher rating from
S&P if S&P’s revenue share is lower. For example, using the past-4-quarter window, the
coefficient on Fraction of Bond Issues Volume Rated by S&P is -1.535 and is significantly
at 5% level. This significant negative relationship between S&P’s revenue share and its
24
tendency to issue an inflated rating holds in all specifications with revenue shares measured
up to the past 8 quarters.
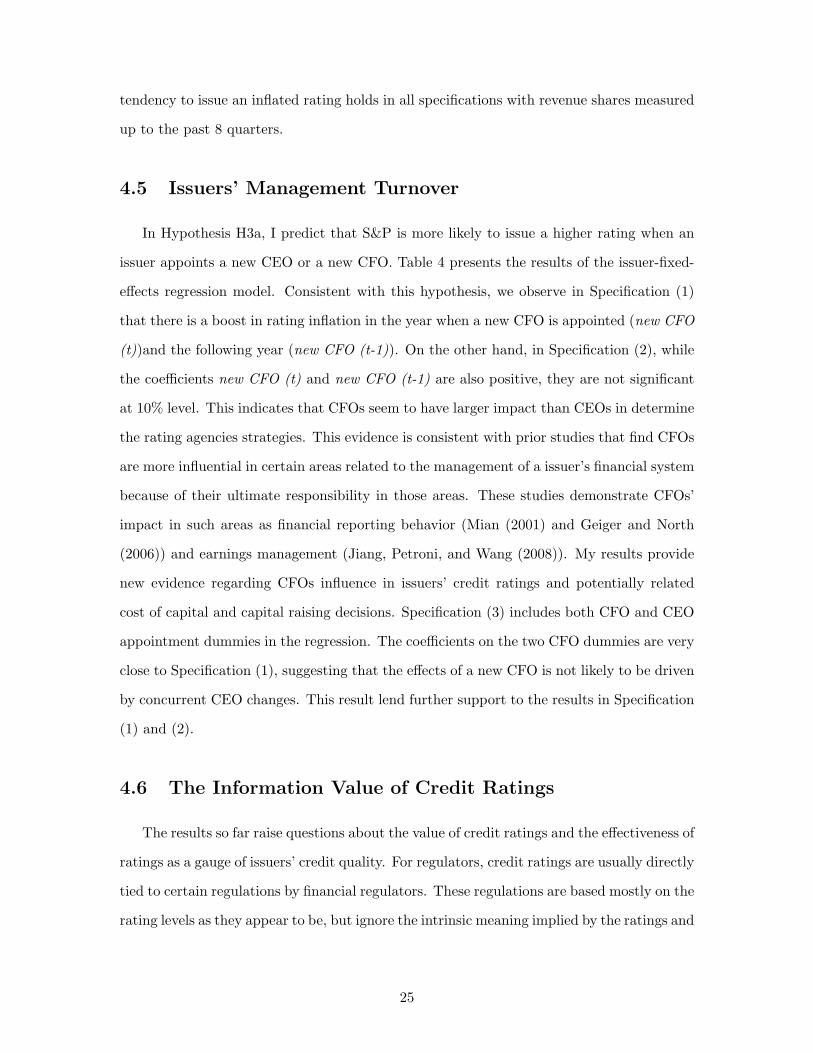
4.5 Issuers’ Management Turnover
In Hypothesis H3a, I predict that S&P is more likely to issue a higher rating when an
issuer appoints a new CEO or a new CFO. Table 4 presents the results of the issuer-fixed-
effects regression model. Consistent with this hypothesis, we observe in Specification (1)
that there is a boost in rating inflation in the year when a new CFO is appointed (new CFO
(t))and the following year (new CFO (t-1)). On the other hand, in Specification (2), while
the coefficients new CFO (t) and new CFO (t-1) are also positive, they are not significant
at 10% level. This indicates that CFOs seem to have larger impact than CEOs in determine
the rating agencies strategies. This evidence is consistent with prior studies that find CFOs
are more influential in certain areas related to the management of a issuer’s financial system
because of their ultimate responsibility in those areas. These studies demonstrate CFOs’
impact in such areas as financial reporting behavior (Mian (2001) and Geiger and North
(2006)) and earnings management (Jiang, Petroni, and Wang (2008)). My results provide
new evidence regarding CFOs influence in issuers’ credit ratings and potentially related
cost of capital and capital raising decisions. Specification (3) includes both CFO and CEO
appointment dummies in the regression. The coefficients on the two CFO dummies are very
close to Specification (1), suggesting that the effects of a new CFO is not likely to be driven
by concurrent CEO changes. This result lend further support to the results in Specification
(1) and (2).
4.6 The Information Value of Credit Ratings
The results so far raise questions about the value of credit ratings and the effectiveness of
ratings as a gauge of issuers’ credit quality. For regulators, credit ratings are usually directly
tied to certain regulations by financial regulators. These regulations are based mostly on the
rating levels as they appear to be, but ignore the intrinsic meaning implied by the ratings and
25

hence, any potential bias incorporated in them. For investors, if investors can accurately
anticipate rating agency’s tendency to issue inflated ratings to certain issuers, they are
expected to adjust for such bias when pricing the issuers’ securities. More specifically, the
variables that are related to rating inflation are expect to play a role in investors’ pricing
rule, after controlling for S&P’s issuer ratings. To test this hypothesis, I regress treasure
spreads of issuers’ senior unsecured bond issuance on the compensation measures presented
in previous sections, and include S&P’s issuer rating fixed effects. The results are presented
in Table 5. Notice that none of the variables (except Ln(Short-term Debt) in Specification
(1))that have been shown to be correlated with S&P’s tendency to issue higher ratings shows
up significantly in the 8 specifications (certain variables show the wrong sign). Therefore,
we can not reject the null hypothesis that investors do not adjust for any potential rating
bias. These results are consistent with the notion that regulators as well as investors may
not well understand the information value of credit ratings. My results on investors’ lack of
knowledge about the value of credit ratings provide justification for regulators’ intervention
in the credit rating industry, which would be beneficial to investors who use credit ratings
to guide their investment decisions.
4.7 The Economic Significance of Rating Inflation
These results so far are not only statistically significant, but also economically significant.
For example, based on Table 2, I find that one standard deviation increase of an issuer’s
short-term liquidity needs leads S&P to issue a credit rating corresponding to a default
rate approximately 0.47% lower than that implied by an EJR rating. In comparison, the
sample mean of the differences in default rates implied by S&P’s and EJR’s ratings is 1.02%.
Similarly, based on Table 3 and Table 4, a standard deviation decrease in S&P’s revenue
share in the past 4 quarters gives rise to a default rate implied by S&P’s rating 0.45% lower
than that implied by EJR’s, and an appointment of a new CFO leads to a default rate
implied by S&P’s rating 0.87% lower than that implied by EJR’s.
26
Chapter 5
Robustness Analysis
5.1 Adjusted and Broader Rating Categories
One concern on the tests so far is that S&P’s ratings are usually based on the “through-
the-cycle” system. This feature implies that compared to EJR’s ratings, S&P’s ratings tend
to be more forward-looking and more stable. Therefore, my previous results may capture
the difference in the nature of the two rating agencies and in the information the two types
of ratings are based on. To resolve this concern, I take into account S&P’s watchlist and
outlook provisions. These two rating actions, by definition, reflect information in a more
timely manner and can therefore be thought as a refinement of long-term credit ratings.
Following existing literature, I adjust S&P’s long-term ratings downwards (closer to default)
by one notch if S&P have put the rating on negative outlook (watchlist), and upwards (closer
to “AAA”) by one notch if S&P have put the rating on positive outlook (watchlist). The
results are presented in Table 7, including different specifications from Table 2, Table 3,
and Table 4.
In addition, previous tests utilize rating categories on notch basis that takes into account
rating modifiers (“plus (+)” and “minus (-)”). As a robustness check, I suppress rating
modifiers and define rating differences on letter basis. More specifically, on letter basis,
a rating of “AA+” is considered as the same as a rating of “AA” or “AA-”, and is more
favorable than a rating of “A+”, “A” or “A-”, where the later three are considered the
same. In this way, I redefine the variable Inflation Tendency. Based on this new definition,
I re-estimated specifications from Table 2, Table 3, and Table 4. The estimation results are
presented in Table 7. We can see that the coefficients on most of the key variables used
in previous estimation remain significant in both tables, and all of them are of the correct
sign. This evidence suggests that rating inflation does exists and is positively correlated
with the rating agency’s expected compensation from issuers.
5.2 Endogeneity Concern Tests
Issuers’ amount of debt may be endogenous. Issuers who obtain a rating that is better
than what they deserve (an inflated rating) may want to take advantage of this lower cost of
capital and issue more debt. This raises concern that the endogenous choice of debt volume
may drive the results in Table 2. To control for This potential endogeneity problem, I
replace Ln(Short-term Debt)) with the new variable Ln(Long-term Debt Due). Ln(Long-
term Debt Due) is defined as the logarithm of the amount of long-term debt that is due
within one year. Similar to Ln(Short-term Debt), the amount of debt due within a year also
measures how much future business an issuer can get to the rating agency. However, the
repayment schedule of long-term debt is likely to have been determined years in the past,
and thus less likely to be affected by the rating agency’s current ratings. In other words,
Ln(Long-term Debt Due) is not likely to be subject to the endogeneity problem.
I repeat the estimations in Table 2 with Ln(Long-term Debt Due) as the main indepen-
dent variable. Table 8 represents the results. The results indicate that the coefficient on
Ln(Long-term Debt Due) is positive and significant, suggesting that issuers that are likely
to bring more future business to the rating agency obtain higher ratings from S&P. This
evidence confirms that the endogenous choice of debt is not likely to drive the results in
Table 2.
5.3 Selection Bias from Rating Shopping
One concern about the previous results is that some issuer characteristics such as the
amount of long-term debt outstand and short-term liquidity needs may also capture is-
suers’ engagement in rating shopping. Rating shopping refers to the practice that an issuer
28
approaches different rating agencies and receives preliminary ratings on its credit quality.
The issuer then chooses the highest rating from a certain rating agency and publishes that
rating as a credit rating, while discards the rest lower ones without disclosing them publicly.
Therefore, if an issuer has shopped ratings before it publishes one, the observed rating of
this issuer, by definition, will be higher than the average of the preliminary ratings from
all the rating agencies it has approached. The higher rating I observe can just be a result
of the fact that rating agencies receive noisy signals on the issuer’s credit quality, and one
rating agency’s ratings are randomly distributed around another rating agency’s ratings. In
this case, the observed rating is high even though neither rating agencies has overstated the
issuer’s credit quality. If issuer characteristics I used before happened to capture issuer’s
involvement of rating shopping, which in turn, leads to a high rating, my results are biased.
To address this concern, I employ a Heckman selection model. More specifically, I run
a two-stage estimation, where the first stage utilizes a probit model to estimate what issuer
characteristics contribute to issuers’ engagement in rating shopping. The second stage test
regresses Inflation Magnitute on proxies for rating agencies’ compensation use in previous
sections. The coefficients of the second stage estimation is adjusted for the selection bias (if
any) based on the first stage regression and are therefore unbiased. Following the definition
of rating shopping, I define a Rating Shopping Dummy (that will be used in the first stage
estimation) equal to 0 if an issuer has three published ratings from S&P, Moody’s and Fitch,
and equal to 1 if it only has one published rating from S&P. This definition requires issuer
credit rating data from Moody’s and Fitch. Due to data availability, I use the bond-rating
information from FISD database, and assume an issuer has a published rating from Moody’s
(Fitch) at a certain time point if one of the issuer’s outstanding senior unsecured bonds are
rated by Moody’s (Fitch) at the same time. This assumption is based on the fact major
rating agencies provide an issuer credit rating for every borrower for which it rates any
security. This approach generates comparable results as previous studies. For example, in
my sample, over 95% of issuers obtains ratings from both S&P and Moody’s, and about
60% of issuers obtains a third rating from Fitch, consistent with Bongaerts, Cremers, and
Goetzmann (2010). The results of the Heckman selection model are presented in Table 9.
29
After controlling for the first-stage selection effects, the coefficients on the key variables
remain significant and of correct sign. These results resolve the selection effect concerns
and lend further evidence that the higher ratings issued S&P arise from potentially higher
compensation, and hence the issuer-pay rating model.
5.4 Rating Inflation Tendency
To further check the robustness of my results, I estimate logit regression models using
Inflation Tendency as the dependent variable. The variable Inflation Tendency is defined
in Equation (1). Similar to Inflation Magnitude, a higher value of this measure indicates
that S&P is more likely to issue a rating higher than EJR’s. The specifications I estimated
using Inflation Magnitude include specifications from Table 2, Table 3, and Table 4. Table
10 presents the results and confirms the findings in my previous tests.
30
Chapter 6
Conclusion
In this paper, I test if the issuer-pay rating model adopted by major rating agencies
contributes to rating agencies’ incentives to issue inflated ratings. I employ a unique dataset
that combines credit ratings issued by rating agencies that adopt two types of rating models:
issuer-pay based model and investor-pay based model. I find a strong link between the the
rating agency’s incentive to issue inflated rating and its expected compensation. Compared
to a rating agency that adopts the investor-pay rating model, the rating agency that uses
the issuer-pay model tends to assign a more favorable rating to an issuer if doing so will
be compensated by a higher expected revenue. I employ a number of measures to proxy
the rating agency’s expected compensation from an issuer, including (1) issuers’ short-term
liquidity needs, (2) the rating agency’s revenue share and (3) issuers’ management turnover.
I find evidence of rating inflation using different proxies. These findings raise question about
the value of credit ratings.
My findings shed light on the continuing debate over rating agencies’ incentives in face
of the issuer-pay rating model and justifies recent regulatory proposals aiming to prevent
rating agencies’ from exploiting the conflicts of interest. My analysis also provides policy
implications that regulators’ intervention and effort to promote a more transparent rating
industry will benefit investors and can lead to improvement in social welfare. This study
raises a further question of how rating inflation could affect firms’ capital structure decision.
Will firms have incentives to take advantage of a current inflated rating and thus issue more
debt? If they do, how will they utilize this cheap capital? Answers to these questions will
provide insight into the real effects of rating inflation on firms’ operation decisions.
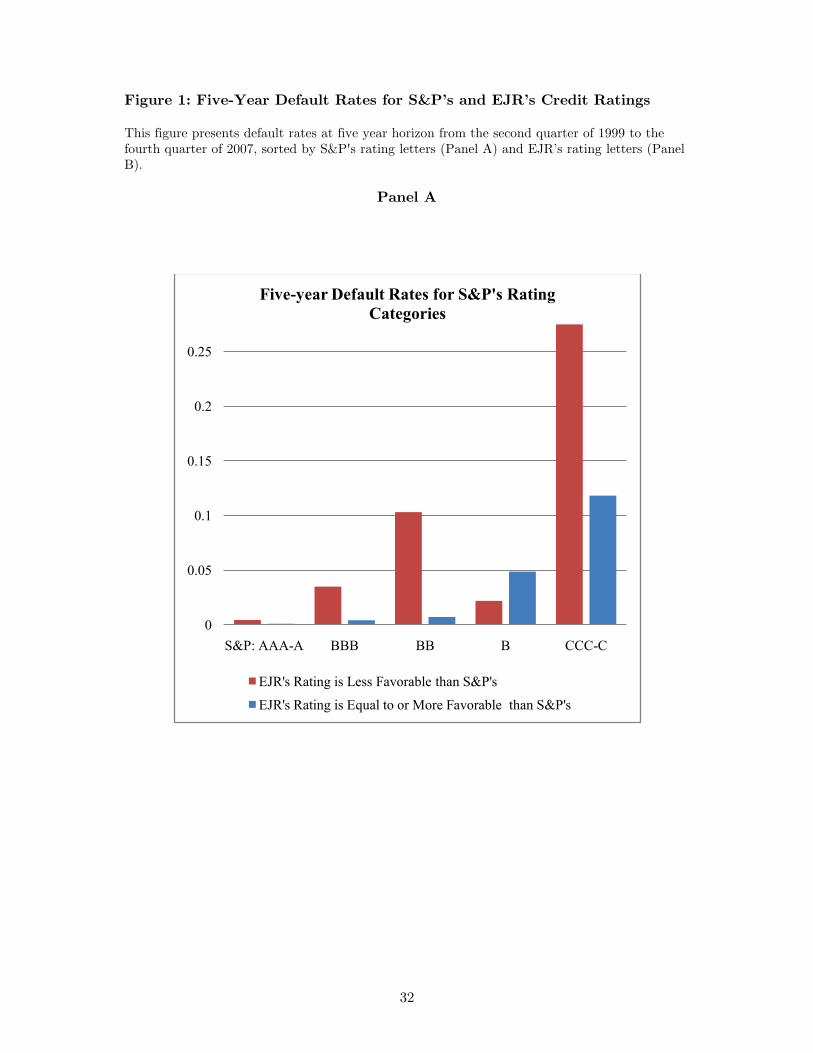
Figure 1: Five-Year Default Rates for S&P’s and EJR’s Credit Ratings This figure presents default rates at five year horizon from the second quarter of 1999 to the fourth quarter of 2007, sorted by S&P's rating letters (Panel A) and EJR’s rating letters (Panel B).
Panel A
0
0.05
0.1
0.15
0.2
0.25
S&P: AAA-A BBB BB B CCC-C
Five-year Default Rates for S&P's Rating Categories
EJR's Rating is Less Favorable than S&P's
EJR's Rating is Equal to or More Favorable than S&P's
32
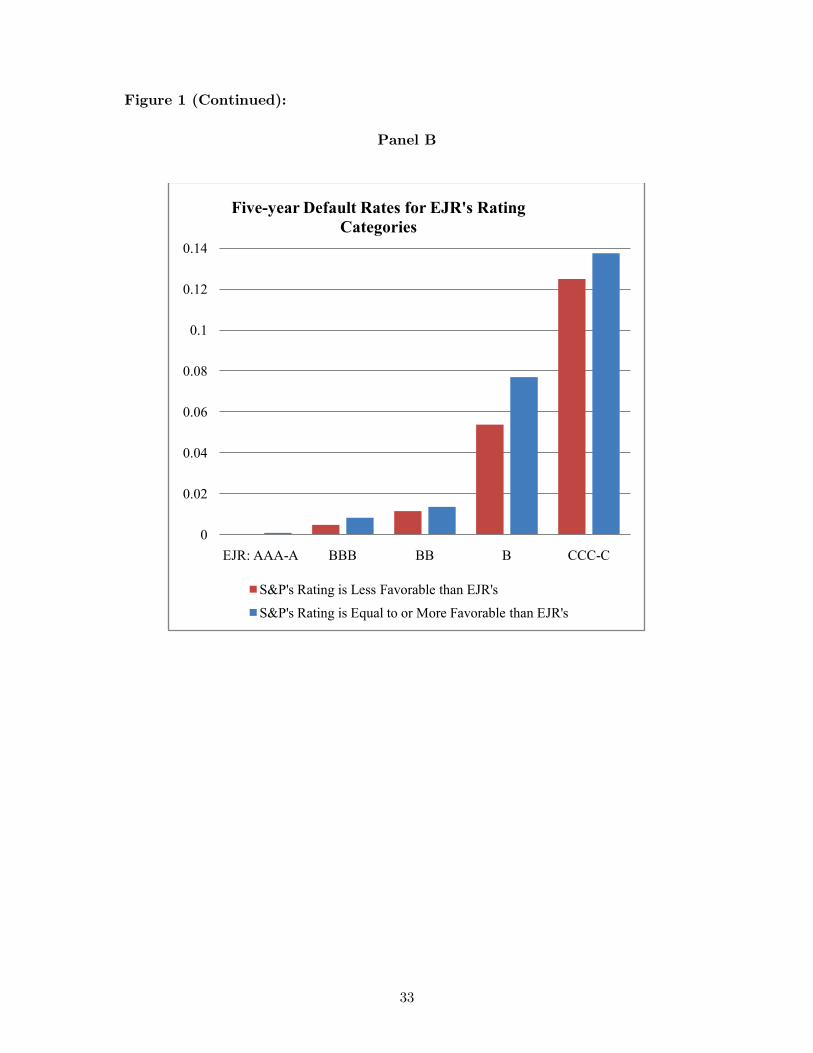
Figure 1 (Continued): Panel B
0
0.02
0.04
0.06
0.08
0.1
0.12
0.14
EJR: AAA-A BBB BB B CCC-C
Five-year Default Rates for EJR's Rating Categories
S&P's Rating is Less Favorable than EJR's
S&P's Rating is Equal to or More Favorable than EJR's
33
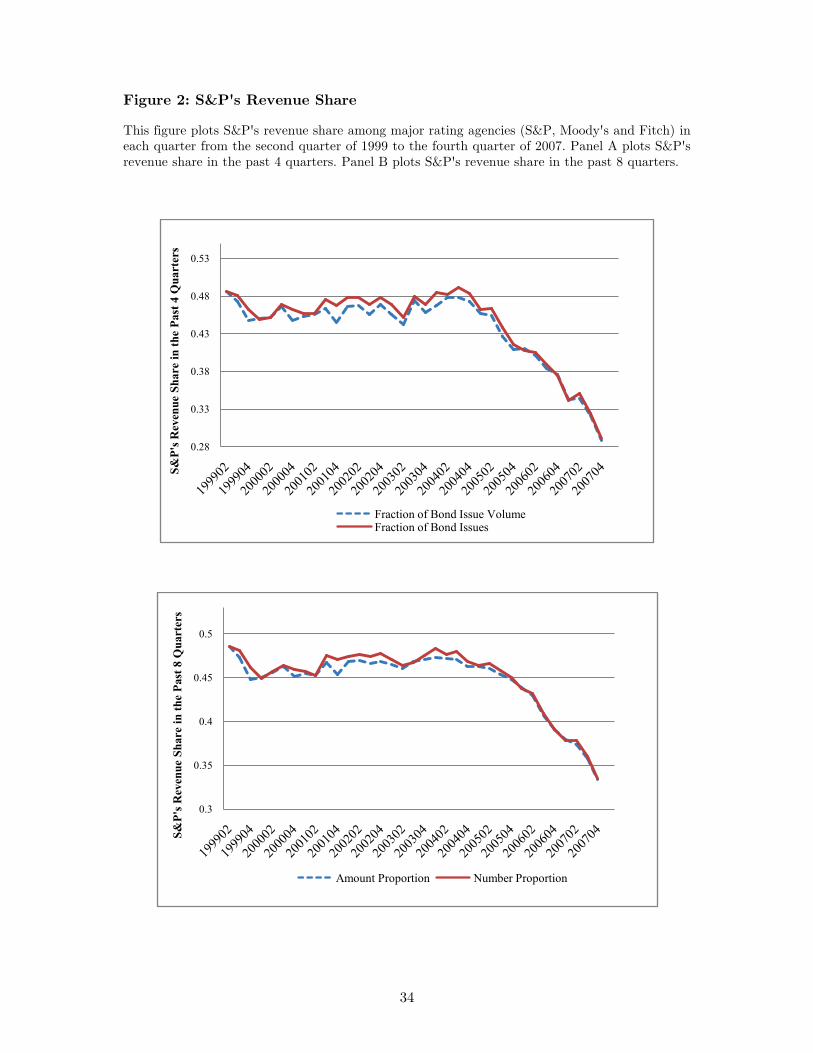
Figure 2: S&P's Revenue Share
This figure plots S&P's revenue share among major rating agencies (S&P, Moody's and Fitch) in each quarter from the second quarter of 1999 to the fourth quarter of 2007. Panel A plots S&P's revenue share in the past 4 quarters. Panel B plots S&P's revenue share in the past 8 quarters.
0.28
0.33
0.38
0.43
0.48
0.53
S&P'
s Rev
enue
Sha
re in
the
Past
4 Q
uart
ers
Fraction of Bond Issue VolumeFraction of Bond Issues
0.3
0.35
0.4
0.45
0.5
S&P'
s Rev
enue
Sha
re in
the
Past
8 Q
uart
ers
Amount Proportion Number Proportion
34
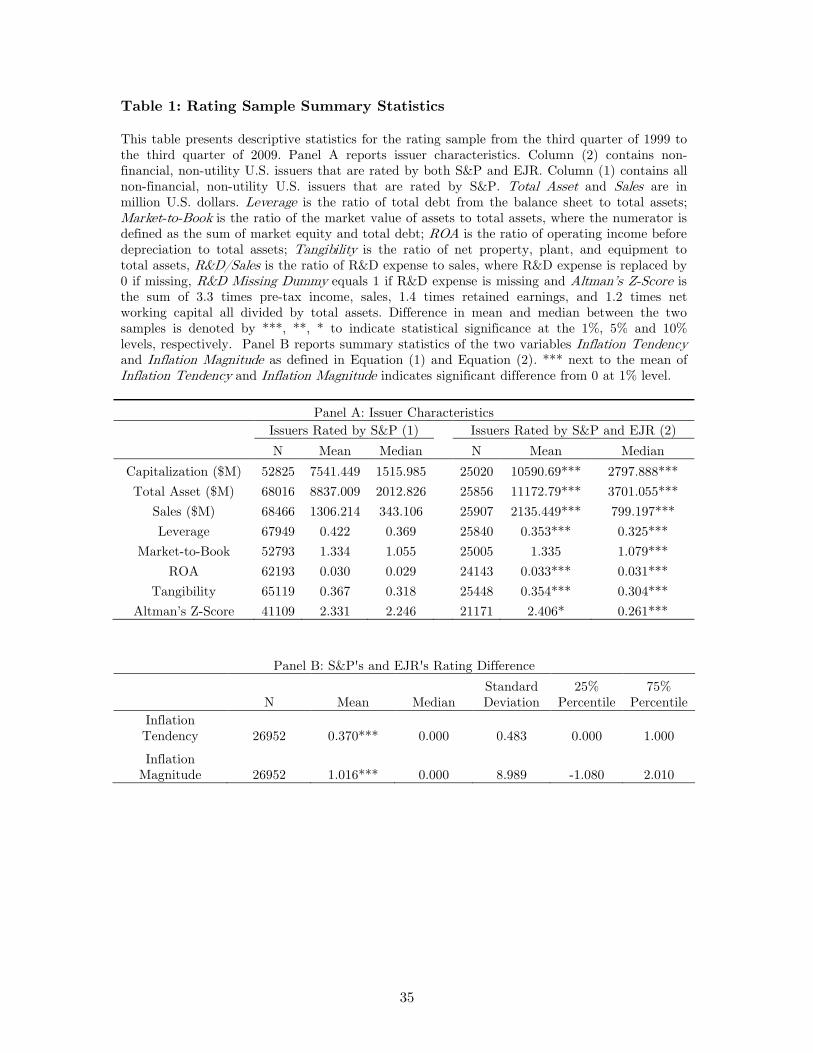
Table 1: Rating Sample Summary Statistics This table presents descriptive statistics for the rating sample from the third quarter of 1999 to the third quarter of 2009. Panel A reports issuer characteristics. Column (2) contains non-financial, non-utility U.S. issuers that are rated by both S&P and EJR. Column (1) contains all non-financial, non-utility U.S. issuers that are rated by S&P. Total Asset and Sales are in million U.S. dollars. Leverage is the ratio of total debt from the balance sheet to total assets; Market-to-Book is the ratio of the market value of assets to total assets, where the numerator is defined as the sum of market equity and total debt; ROA is the ratio of operating income before depreciation to total assets; Tangibility is the ratio of net property, plant, and equipment to total assets, R&D/Sales is the ratio of R&D expense to sales, where R&D expense is replaced by 0 if missing, R&D Missing Dummy equals 1 if R&D expense is missing and Altman’s Z-Score is the sum of 3.3 times pre-tax income, sales, 1.4 times retained earnings, and 1.2 times net working capital all divided by total assets. Difference in mean and median between the two samples is denoted by ***, **, * to indicate statistical significance at the 1%, 5% and 10% levels, respectively. Panel B reports summary statistics of the two variables Inflation Tendency and Inflation Magnitude as defined in Equation (1) and Equation (2). *** next to the mean of Inflation Tendency and Inflation Magnitude indicates significant difference from 0 at 1% level.
Panel A: Issuer Characteristics
Issuers Rated by S&P (1)
Issuers Rated by S&P and EJR (2)
N Mean Median N Mean Median Capitalization ($M) 52825 7541.449 1515.985
25020 10590.69*** 2797.888***
Total Asset ($M) 68016 8837.009 2012.826
25856 11172.79*** 3701.055*** Sales ($M) 68466 1306.214 343.106
25907 2135.449*** 799.197***
Leverage 67949 0.422 0.369
25840 0.353*** 0.325*** Market-to-Book 52793 1.334 1.055
25005 1.335 1.079***
ROA 62193 0.030 0.029
24143 0.033*** 0.031*** Tangibility 65119 0.367 0.318
25448 0.354*** 0.304***
Altman’s Z-Score 41109 2.331 2.246 21171 2.406* 0.261***
Panel B: S&P's and EJR's Rating Difference
N Mean Median Standard Deviation
25% Percentile
75% Percentile
Inflation Tendency 26952 0.370*** 0.000 0.483 0.000 1.000
Inflation Magnitude 26952 1.016*** 0.000 8.989 -1.080 2.010
35
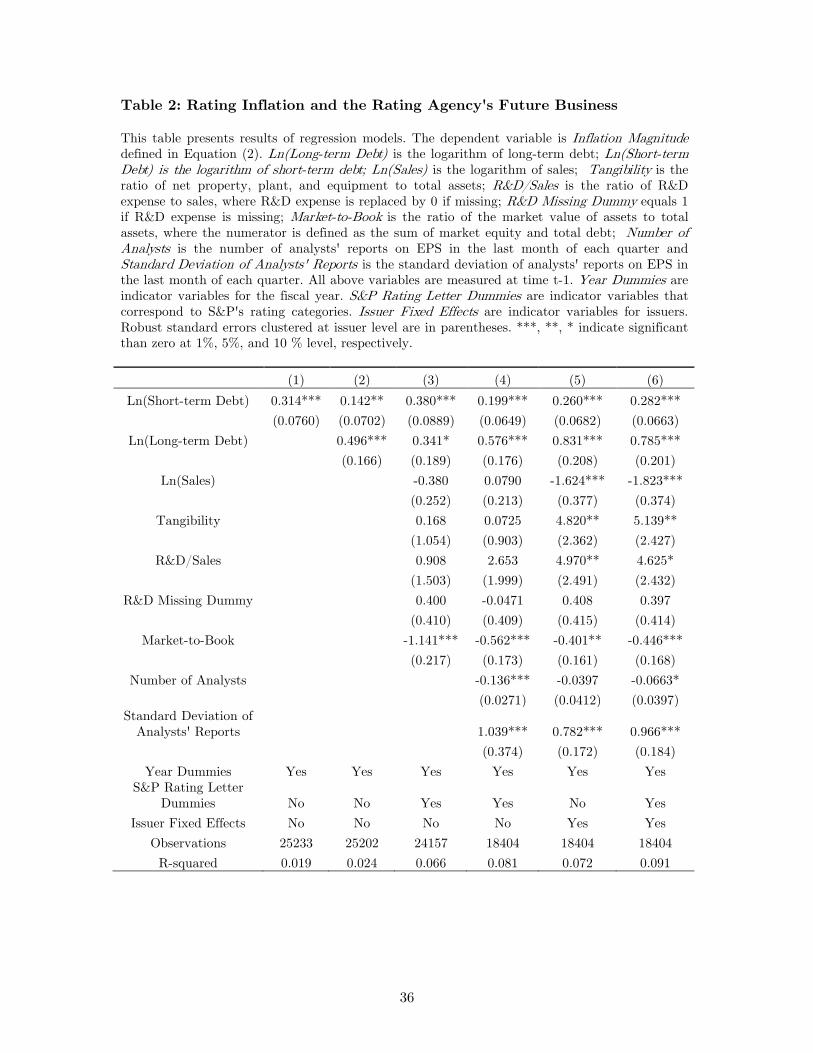
Table 2: Rating Inflation and the Rating Agency's Future Business This table presents results of regression models. The dependent variable is Inflation Magnitude defined in Equation (2). Ln(Long-term Debt) is the logarithm of long-term debt; Ln(Short-term Debt) is the logarithm of short-term debt; Ln(Sales) is the logarithm of sales; Tangibility is the ratio of net property, plant, and equipment to total assets; R&D/Sales is the ratio of R&D expense to sales, where R&D expense is replaced by 0 if missing; R&D Missing Dummy equals 1 if R&D expense is missing; Market-to-Book is the ratio of the market value of assets to total assets, where the numerator is defined as the sum of market equity and total debt; Number of Analysts is the number of analysts' reports on EPS in the last month of each quarter and Standard Deviation of Analysts' Reports is the standard deviation of analysts' reports on EPS in the last month of each quarter. All above variables are measured at time t-1. Year Dummies are indicator variables for the fiscal year. S&P Rating Letter Dummies are indicator variables that correspond to S&P's rating categories. Issuer Fixed Effects are indicator variables for issuers. Robust standard errors clustered at issuer level are in parentheses. ***, **, * indicate significant than zero at 1%, 5%, and 10 % level, respectively.
(1) (2) (3) (4) (5) (6) Ln(Short-term Debt) 0.314*** 0.142** 0.380*** 0.199*** 0.260*** 0.282***
(0.0760) (0.0702) (0.0889) (0.0649) (0.0682) (0.0663)
Ln(Long-term Debt)
0.496*** 0.341* 0.576*** 0.831*** 0.785***
(0.166) (0.189) (0.176) (0.208) (0.201)
Ln(Sales)
-0.380 0.0790 -1.624*** -1.823***
(0.252) (0.213) (0.377) (0.374)
Tangibility
0.168 0.0725 4.820** 5.139**
(1.054) (0.903) (2.362) (2.427)
R&D/Sales
0.908 2.653 4.970** 4.625*
(1.503) (1.999) (2.491) (2.432)
R&D Missing Dummy
0.400 -0.0471 0.408 0.397
(0.410) (0.409) (0.415) (0.414)
Market-to-Book
-1.141*** -0.562*** -0.401** -0.446***
(0.217) (0.173) (0.161) (0.168)
Number of Analysts
-0.136*** -0.0397 -0.0663*
(0.0271) (0.0412) (0.0397)
Standard Deviation of Analysts' Reports
1.039*** 0.782*** 0.966***
(0.374) (0.172) (0.184)
Year Dummies Yes Yes Yes Yes Yes Yes S&P Rating Letter
Dummies No No Yes Yes No Yes Issuer Fixed Effects No No No No Yes Yes
Observations 25233 25202 24157 18404 18404 18404 R-squared 0.019 0.024 0.066 0.081 0.072 0.091
36
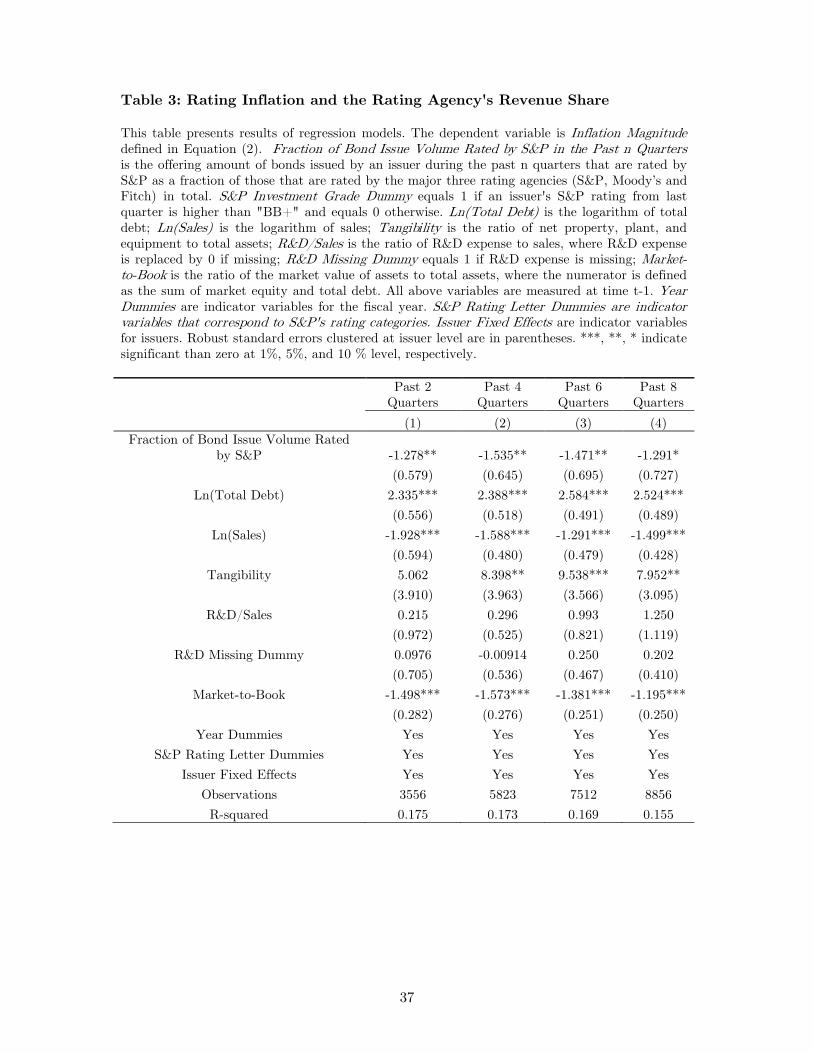
Table 3: Rating Inflation and the Rating Agency's Revenue Share This table presents results of regression models. The dependent variable is Inflation Magnitude defined in Equation (2). Fraction of Bond Issue Volume Rated by S&P in the Past n Quarters is the offering amount of bonds issued by an issuer during the past n quarters that are rated by S&P as a fraction of those that are rated by the major three rating agencies (S&P, Moody’s and Fitch) in total. S&P Investment Grade Dummy equals 1 if an issuer's S&P rating from last quarter is higher than "BB+" and equals 0 otherwise. Ln(Total Debt) is the logarithm of total debt; Ln(Sales) is the logarithm of sales; Tangibility is the ratio of net property, plant, and equipment to total assets; R&D/Sales is the ratio of R&D expense to sales, where R&D expense is replaced by 0 if missing; R&D Missing Dummy equals 1 if R&D expense is missing; Market-to-Book is the ratio of the market value of assets to total assets, where the numerator is defined as the sum of market equity and total debt. All above variables are measured at time t-1. Year Dummies are indicator variables for the fiscal year. S&P Rating Letter Dummies are indicator variables that correspond to S&P's rating categories. Issuer Fixed Effects are indicator variables for issuers. Robust standard errors clustered at issuer level are in parentheses. ***, **, * indicate significant than zero at 1%, 5%, and 10 % level, respectively.
Past 2 Quarters
Past 4 Quarters
Past 6 Quarters
Past 8 Quarters
(1) (2) (3) (4) Fraction of Bond Issue Volume Rated
by S&P -1.278** -1.535** -1.471** -1.291*
(0.579) (0.645) (0.695) (0.727)
Ln(Total Debt) 2.335*** 2.388*** 2.584*** 2.524***
(0.556) (0.518) (0.491) (0.489)
Ln(Sales) -1.928*** -1.588*** -1.291*** -1.499***
(0.594) (0.480) (0.479) (0.428)
Tangibility 5.062 8.398** 9.538*** 7.952**
(3.910) (3.963) (3.566) (3.095)
R&D/Sales 0.215 0.296 0.993 1.250
(0.972) (0.525) (0.821) (1.119)
R&D Missing Dummy 0.0976 -0.00914 0.250 0.202
(0.705) (0.536) (0.467) (0.410)
Market-to-Book -1.498*** -1.573*** -1.381*** -1.195***
(0.282) (0.276) (0.251) (0.250)
Year Dummies Yes Yes Yes Yes S&P Rating Letter Dummies Yes Yes Yes Yes
Issuer Fixed Effects Yes Yes Yes Yes Observations 3556 5823 7512 8856 R-squared 0.175 0.173 0.169 0.155
37
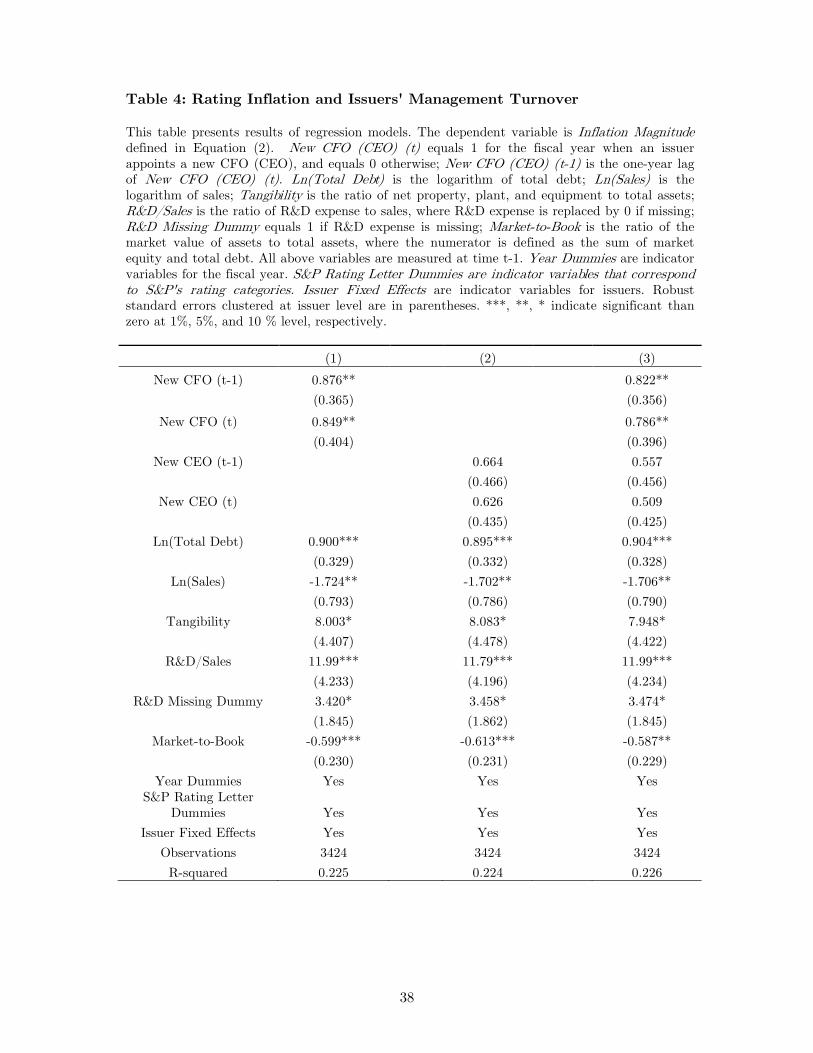
Table 4: Rating Inflation and Issuers' Management Turnover This table presents results of regression models. The dependent variable is Inflation Magnitude defined in Equation (2). New CFO (CEO) (t) equals 1 for the fiscal year when an issuer appoints a new CFO (CEO), and equals 0 otherwise; New CFO (CEO) (t-1) is the one-year lag of New CFO (CEO) (t). Ln(Total Debt) is the logarithm of total debt; Ln(Sales) is the logarithm of sales; Tangibility is the ratio of net property, plant, and equipment to total assets; R&D/Sales is the ratio of R&D expense to sales, where R&D expense is replaced by 0 if missing; R&D Missing Dummy equals 1 if R&D expense is missing; Market-to-Book is the ratio of the market value of assets to total assets, where the numerator is defined as the sum of market equity and total debt. All above variables are measured at time t-1. Year Dummies are indicator variables for the fiscal year. S&P Rating Letter Dummies are indicator variables that correspond to S&P's rating categories. Issuer Fixed Effects are indicator variables for issuers. Robust standard errors clustered at issuer level are in parentheses. ***, **, * indicate significant than zero at 1%, 5%, and 10 % level, respectively.
(1) (2) (3) New CFO (t-1) 0.876**
0.822**
(0.365)
(0.356)
New CFO (t) 0.849**
0.786**
(0.404)
(0.396)
New CEO (t-1)
0.664
0.557
(0.466)
(0.456)
New CEO (t)
0.626
0.509
(0.435)
(0.425)
Ln(Total Debt) 0.900***
0.895***
0.904***
(0.329)
(0.332)
(0.328)
Ln(Sales) -1.724**
-1.702**
-1.706**
(0.793)
(0.786)
(0.790)
Tangibility 8.003*
8.083*
7.948*
(4.407)
(4.478)
(4.422)
R&D/Sales 11.99***
11.79***
11.99***
(4.233)
(4.196)
(4.234)
R&D Missing Dummy 3.420*
3.458*
3.474*
(1.845)
(1.862)
(1.845)
Market-to-Book -0.599***
-0.613***
-0.587**
(0.230)
(0.231)
(0.229)
Year Dummies Yes
Yes
Yes S&P Rating Letter
Dummies Yes
Yes
Yes Issuer Fixed Effects Yes
Yes
Yes
Observations 3424
3424
3424 R-squared 0.225 0.224 0.226
38
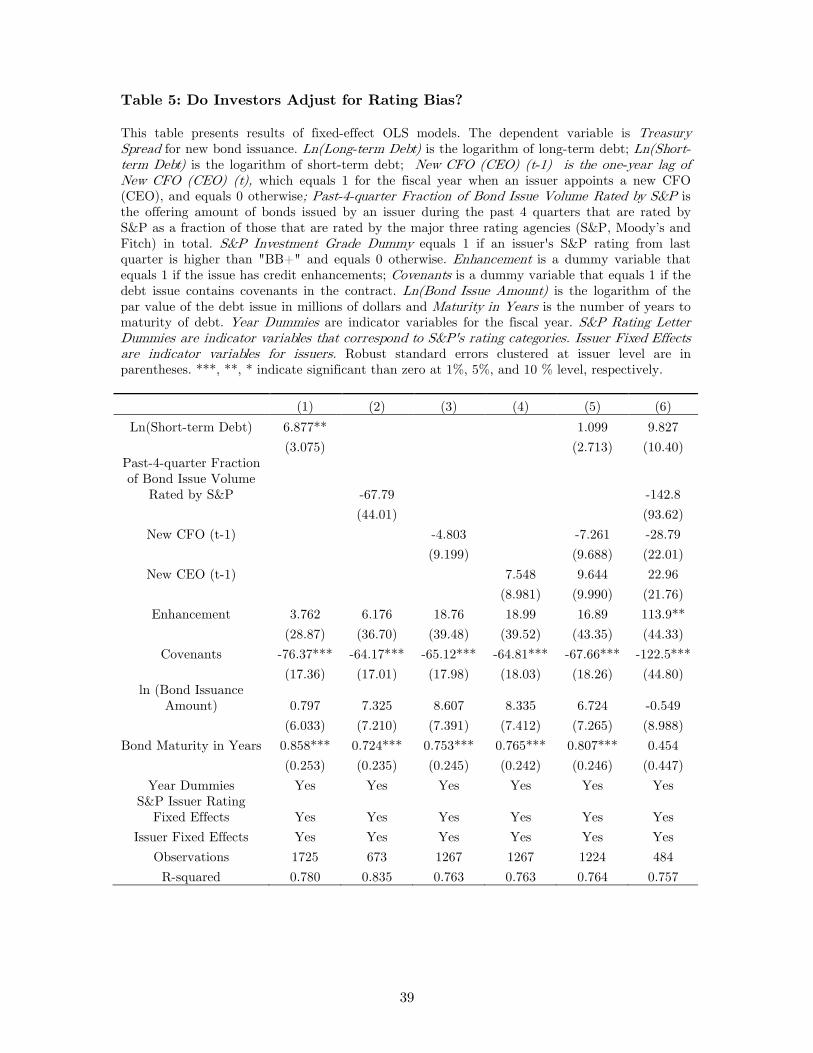
Table 5: Do Investors Adjust for Rating Bias? This table presents results of fixed-effect OLS models. The dependent variable is Treasury Spread for new bond issuance. Ln(Long-term Debt) is the logarithm of long-term debt; Ln(Short-term Debt) is the logarithm of short-term debt; New CFO (CEO) (t-1) is the one-year lag of New CFO (CEO) (t), which equals 1 for the fiscal year when an issuer appoints a new CFO (CEO), and equals 0 otherwise; Past-4-quarter Fraction of Bond Issue Volume Rated by S&P is the offering amount of bonds issued by an issuer during the past 4 quarters that are rated by S&P as a fraction of those that are rated by the major three rating agencies (S&P, Moody’s and Fitch) in total. S&P Investment Grade Dummy equals 1 if an issuer's S&P rating from last quarter is higher than "BB+" and equals 0 otherwise. Enhancement is a dummy variable that equals 1 if the issue has credit enhancements; Covenants is a dummy variable that equals 1 if the debt issue contains covenants in the contract. Ln(Bond Issue Amount) is the logarithm of the par value of the debt issue in millions of dollars and Maturity in Years is the number of years to maturity of debt. Year Dummies are indicator variables for the fiscal year. S&P Rating Letter Dummies are indicator variables that correspond to S&P's rating categories. Issuer Fixed Effects are indicator variables for issuers. Robust standard errors clustered at issuer level are in parentheses. ***, **, * indicate significant than zero at 1%, 5%, and 10 % level, respectively.
(1) (2) (3) (4) (5) (6) Ln(Short-term Debt) 6.877**
1.099 9.827
(3.075)
(2.713) (10.40)
Past-4-quarter Fraction of Bond Issue Volume
Rated by S&P
-67.79
-142.8
(44.01)
(93.62)
New CFO (t-1)
-4.803
-7.261 -28.79
(9.199)
(9.688) (22.01)
New CEO (t-1)
7.548 9.644 22.96
(8.981) (9.990) (21.76)
Enhancement 3.762 6.176 18.76 18.99 16.89 113.9**
(28.87) (36.70) (39.48) (39.52) (43.35) (44.33)
Covenants -76.37*** -64.17*** -65.12*** -64.81*** -67.66*** -122.5***
(17.36) (17.01) (17.98) (18.03) (18.26) (44.80)
ln (Bond Issuance Amount) 0.797 7.325 8.607 8.335 6.724 -0.549
(6.033) (7.210) (7.391) (7.412) (7.265) (8.988)
Bond Maturity in Years 0.858*** 0.724*** 0.753*** 0.765*** 0.807*** 0.454
(0.253) (0.235) (0.245) (0.242) (0.246) (0.447)
Year Dummies Yes Yes Yes Yes Yes Yes S&P Issuer Rating
Fixed Effects Yes Yes Yes Yes Yes Yes Issuer Fixed Effects Yes Yes Yes Yes Yes Yes
Observations 1725 673 1267 1267 1224 484 R-squared 0.780 0.835 0.763 0.763 0.764 0.757
39
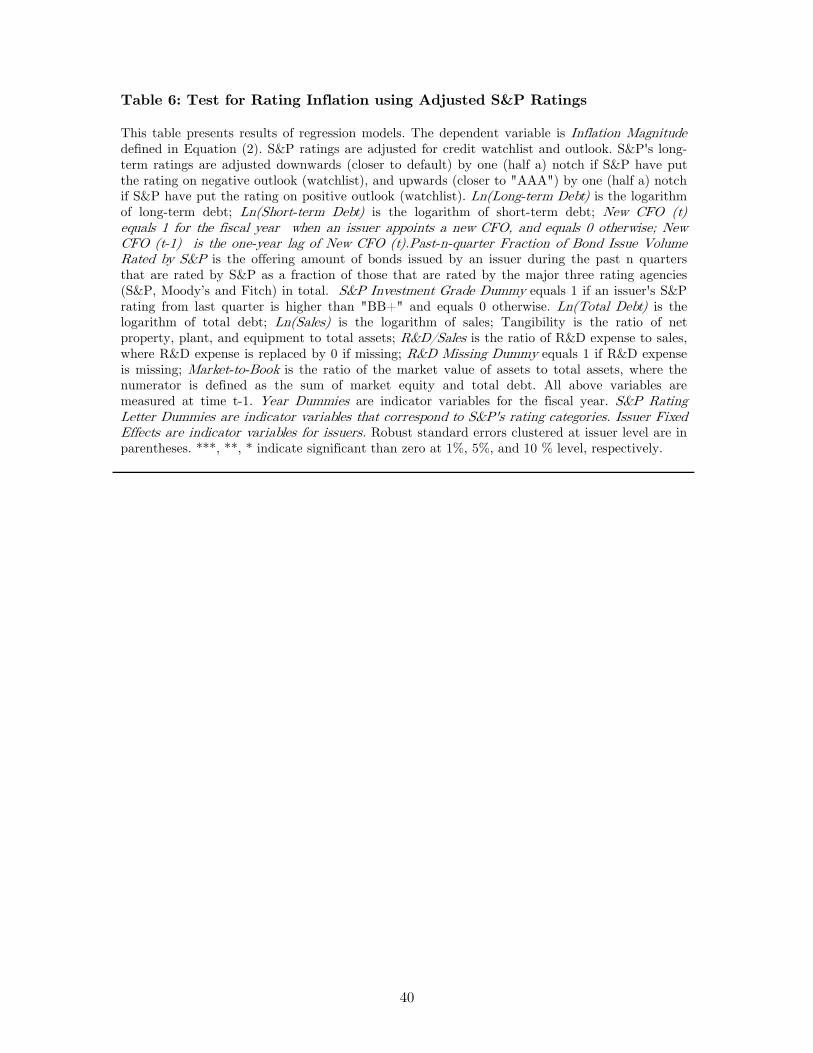
Table 6: Test for Rating Inflation using Adjusted S&P Ratings This table presents results of regression models. The dependent variable is Inflation Magnitude defined in Equation (2). S&P ratings are adjusted for credit watchlist and outlook. S&P's long-term ratings are adjusted downwards (closer to default) by one (half a) notch if S&P have put the rating on negative outlook (watchlist), and upwards (closer to "AAA") by one (half a) notch if S&P have put the rating on positive outlook (watchlist). Ln(Long-term Debt) is the logarithm of long-term debt; Ln(Short-term Debt) is the logarithm of short-term debt; New CFO (t) equals 1 for the fiscal year when an issuer appoints a new CFO, and equals 0 otherwise; New CFO (t-1) is the one-year lag of New CFO (t).Past-n-quarter Fraction of Bond Issue Volume Rated by S&P is the offering amount of bonds issued by an issuer during the past n quarters that are rated by S&P as a fraction of those that are rated by the major three rating agencies (S&P, Moody’s and Fitch) in total. S&P Investment Grade Dummy equals 1 if an issuer's S&P rating from last quarter is higher than "BB+" and equals 0 otherwise. Ln(Total Debt) is the logarithm of total debt; Ln(Sales) is the logarithm of sales; Tangibility is the ratio of net property, plant, and equipment to total assets; R&D/Sales is the ratio of R&D expense to sales, where R&D expense is replaced by 0 if missing; R&D Missing Dummy equals 1 if R&D expense is missing; Market-to-Book is the ratio of the market value of assets to total assets, where the numerator is defined as the sum of market equity and total debt. All above variables are measured at time t-1. Year Dummies are indicator variables for the fiscal year. S&P Rating Letter Dummies are indicator variables that correspond to S&P's rating categories. Issuer Fixed Effects are indicator variables for issuers. Robust standard errors clustered at issuer level are in parentheses. ***, **, * indicate significant than zero at 1%, 5%, and 10 % level, respectively.
40
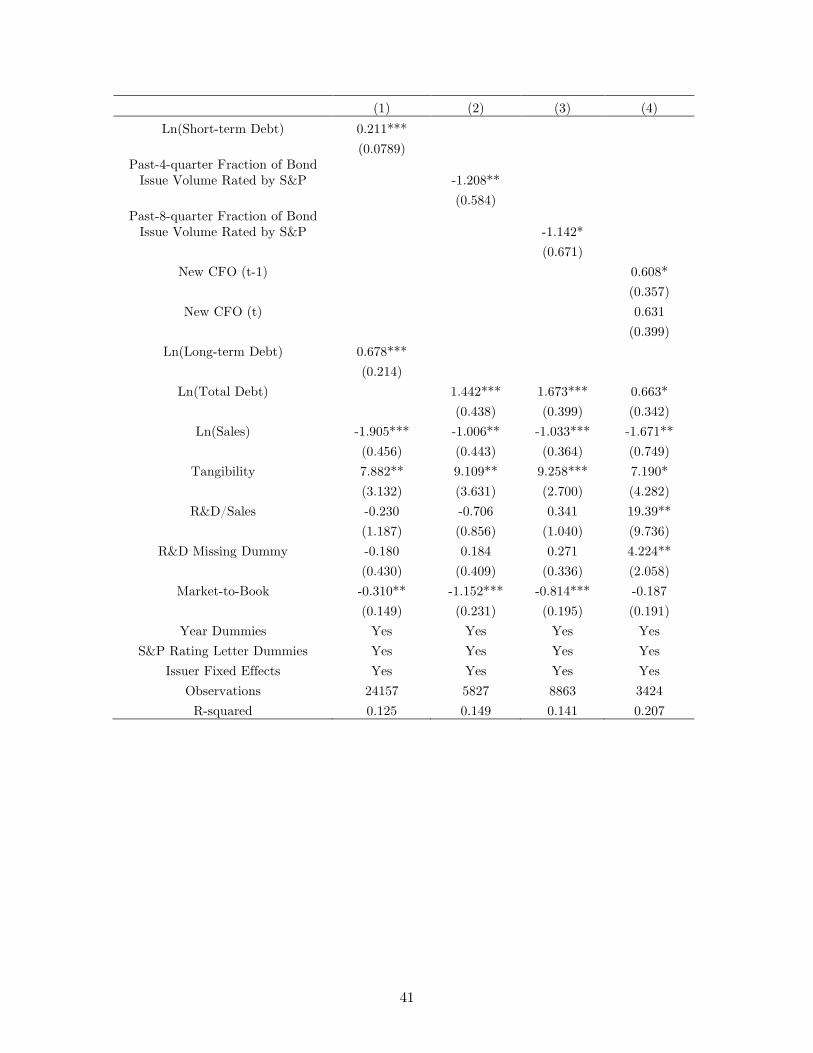
(1) (2) (3) (4) Ln(Short-term Debt) 0.211***
(0.0789) Past-4-quarter Fraction of Bond
Issue Volume Rated by S&P
-1.208**
(0.584)
Past-8-quarter Fraction of Bond Issue Volume Rated by S&P
-1.142*
(0.671) New CFO (t-1)
0.608*
(0.357)
New CFO (t)
0.631
(0.399)
Ln(Long-term Debt) 0.678***
(0.214)
Ln(Total Debt)
1.442*** 1.673*** 0.663*
(0.438) (0.399) (0.342)
Ln(Sales) -1.905*** -1.006** -1.033*** -1.671**
(0.456) (0.443) (0.364) (0.749)
Tangibility 7.882** 9.109** 9.258*** 7.190*
(3.132) (3.631) (2.700) (4.282)
R&D/Sales -0.230 -0.706 0.341 19.39**
(1.187) (0.856) (1.040) (9.736)
R&D Missing Dummy -0.180 0.184 0.271 4.224**
(0.430) (0.409) (0.336) (2.058)
Market-to-Book -0.310** -1.152*** -0.814*** -0.187
(0.149) (0.231) (0.195) (0.191)
Year Dummies Yes Yes Yes Yes S&P Rating Letter Dummies Yes Yes Yes Yes
Issuer Fixed Effects Yes Yes Yes Yes Observations 24157 5827 8863 3424 R-squared 0.125 0.149 0.141 0.207
41
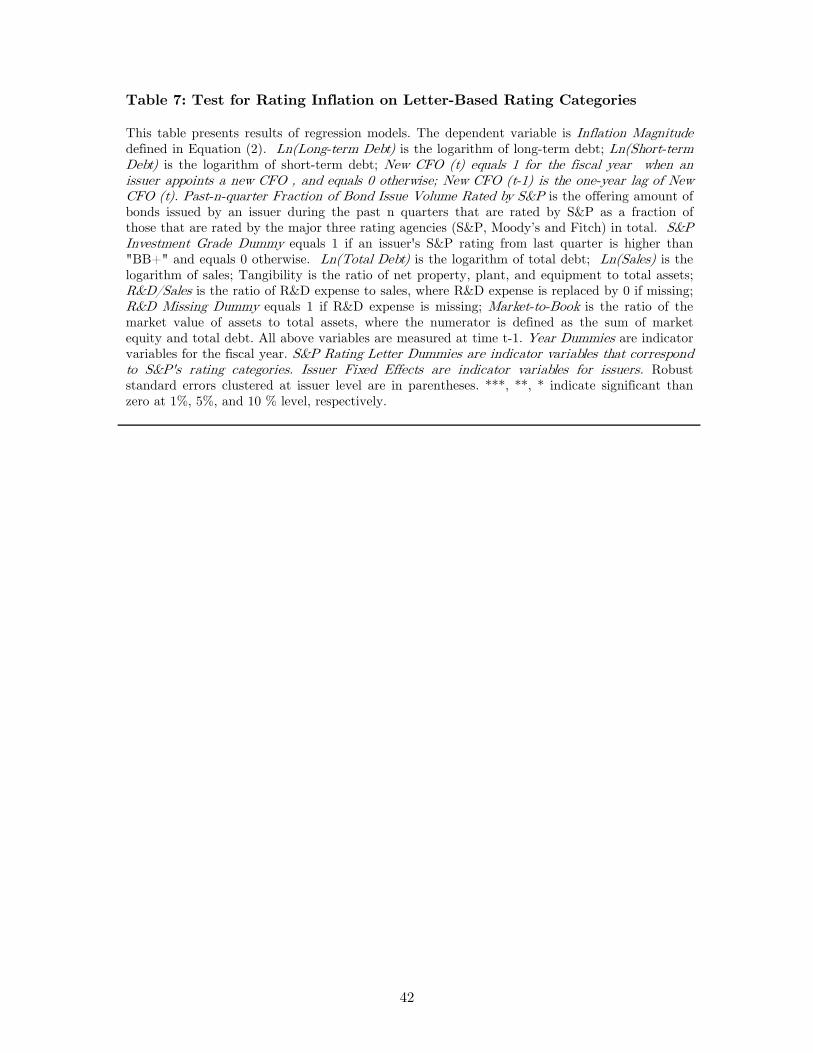
Table 7: Test for Rating Inflation on Letter-Based Rating Categories This table presents results of regression models. The dependent variable is Inflation Magnitude defined in Equation (2). Ln(Long-term Debt) is the logarithm of long-term debt; Ln(Short-term Debt) is the logarithm of short-term debt; New CFO (t) equals 1 for the fiscal year when an issuer appoints a new CFO , and equals 0 otherwise; New CFO (t-1) is the one-year lag of New CFO (t). Past-n-quarter Fraction of Bond Issue Volume Rated by S&P is the offering amount of bonds issued by an issuer during the past n quarters that are rated by S&P as a fraction of those that are rated by the major three rating agencies (S&P, Moody’s and Fitch) in total. S&P Investment Grade Dummy equals 1 if an issuer's S&P rating from last quarter is higher than "BB+" and equals 0 otherwise. Ln(Total Debt) is the logarithm of total debt; Ln(Sales) is the logarithm of sales; Tangibility is the ratio of net property, plant, and equipment to total assets; R&D/Sales is the ratio of R&D expense to sales, where R&D expense is replaced by 0 if missing; R&D Missing Dummy equals 1 if R&D expense is missing; Market-to-Book is the ratio of the market value of assets to total assets, where the numerator is defined as the sum of market equity and total debt. All above variables are measured at time t-1. Year Dummies are indicator variables for the fiscal year. S&P Rating Letter Dummies are indicator variables that correspond to S&P's rating categories. Issuer Fixed Effects are indicator variables for issuers. Robust standard errors clustered at issuer level are in parentheses. ***, **, * indicate significant than zero at 1%, 5%, and 10 % level, respectively.
42

(1) (2) (3) (4) Ln(Short-term Debt) 0.254***
(0.0844) Past-4-quarter Fraction of Bond
Issue Volume Rated by S&P
-1.535**
(0.775)
Past-8-quarter Fraction of Bond Issue Volume Rated by S&P
-1.390
(0.884) New CFO (t-1)
0.980**
(0.382)
New CFO (t)
0.849**
(0.428)
Ln(Long-term Debt) 0.838***
(0.214)
Ln(Total Debt)
3.215*** 3.120*** 1.066***
(0.641) (0.575) (0.312)
Ln(Sales) -2.515*** -2.127*** -1.804*** -1.764**
(0.500) (0.563) (0.498) (0.825)
Tangibility 8.175** 13.11*** 11.73*** 9.971**
(3.323) (4.044) (3.280) (4.833)
R&D/Sales 0.0975 0.269 0.495 12.68***
(1.285) (0.794) (1.000) (4.673)
R&D Missing Dummy -0.218 -0.0614 0.0736 3.080
(0.436) (0.562) (0.445) (1.979)
Market-to-Book -0.689*** -1.591*** -1.234*** -0.660**
(0.222) (0.301) (0.282) (0.274)
Year Dummies Yes Yes Yes Yes S&P Rating Letter Dummies Yes Yes Yes Yes
Issuer Fixed Effects Yes Yes Yes Yes Observations 24157 2880 4869 3424 R-squared 0.152 0.237 0.211 0.211
43

Table 8: Endogeneity Robustness Test for Rating Inflation This table presents results of regression models. The dependent variable is Inflation Magnitude defined in Equation (2). Ln(Long-term Debt Due) is the logarithm of long-term debt that is due in one year; Ln(Other Long-term Debt) is the logarithm of total long-term debt minus long-term debt due in one year ; Ln(Sales) is the logarithm of sales; Tangibility is the ratio of net property, plant, and equipment to total assets; R&D/Sales is the ratio of R&D expense to sales, where R&D expense is replaced by 0 if missing; R&D Missing Dummy equals 1 if R&D expense is missing; Market-to-Book is the ratio of the market value of assets to total assets, where the numerator is defined as the sum of market equity and total debt; Number of Analysts is the number of analysts' reports on EPS in the last month of each quarter and Standard Deviation of Analysts' Reports is the standard deviation of analysts' reports on EPS in the last month of each quarter. All above variables are measured at time t-1. Year Dummies are indicator variables for the fiscal year. S&P Rating Letter Dummies are indicator variables that correspond to S&P's rating categories. Issuer Fixed Effects are indicator variables for issuers. Robust standard errors clustered at issuer level are in parentheses. ***, **, * indicate significant than zero at 1%, 5%, and 10 % level, respectively.
(1) (2) Ln(Long-term Debt Due) 0.166***
0.225***
(0.0629)
(0.0564)
Ln(Other Long-term Debt) 0.724***
0.906***
(0.171)
(0.217)
Ln(Sales) 0.0538
-2.001***
(0.209)
(0.410)
Tangibility -0.299
4.782*
(0.913)
(2.482)
R&D/Sale 2.863
4.417*
(1.988)
(2.481)
R&D Missing Dummy -0.0657
0.382
(0.396)
(0.422)
Market-to-Book -0.579***
-0.455**
(0.183)
(0.183)
Number of Analysts -0.142***
-0.0578
(0.0278)
(0.0417)
Standard Deviation of Analysts' Reports 1.031***
0.948***
(0.388)
(0.220)
Year Dummies Yes
Yes S&P Rating Letter Dummies Yes
Yes
Issuer Fixed Effects No
Yes Observations 17833
17833
R-squared 0.077 0.081
44
Table 9: Test for Selection Bias This table presents results of test for selection bias. The first four columns present results for the Heckman selection models. The dependent variable in the first-stage regression is Rating Shopping Dummy that equals 0 if an issuer has three published ratings from S&P, Moody’s and Fitch, and equals 1 if it only has a published rating from S&P. The dependent variable in the second-stage regression is Inflation Magnitude. Ln(Long-term Debt) is the logarithm of long-term debt; Ln(Short-term Debt) is the logarithm of short-term debt; New CFO (t) equals 1 for the fiscal year when an issuer appoints a new CFO, and equals 0 otherwise; New CFO (t-1) is the one-year lag of New CFO (t). Ln(Sales) is the logarithm of sales; Ln(Asset) is the logarithm of total asset; Tangibility is the ratio of net property, plant, and equipment to total assets; R&D/Sales is the ratio of R&D expense to sales, where R&D expense is replaced by 0 if missing; R&D Missing Dummy equals 1 if R&D expense is missing; Market-to-Book is the ratio of the market value of assets to total assets, where the numerator is defined as the sum of market equity and total debt; All above variables are measured at time t-1. Fitch Push is a dummy variable that equals 1 if one of S&P and Moody's ratings is or is below "BB+" and the other is above "BB+", but Fitch's rating is above "BB+". ROA is the ratio of operating income before depreciation to total assets; Past 5-year ROA Volatility is the volatility of ROA in the past 5 years. Column (5) and (6) represent results for estimation in the subsample where Rating Shopping Dummy equals 1. Year Dummies are indicator variables for the fiscal year. S&P Investment Grade Dummy equals 1 if S&P's issuer rating is above "BB+". Robust standard errors clustered at issuer level are in parentheses. ***, **, * indicate significant than zero at 1%, 5%, and 10 % level, respectively.
45

(1) (2) (3) (4)
2nd 1st 2nd 1st
Ln(Short-term Debt) 0.557*** -0.0477***
(0.0760) (0.00609)
New CFO (t-1)
1.176* -0.0212
(0.643) (0.0696)
New CFO (t)
2.129*** -0.0537
(0.664) (0.0726)
Ln(Long-term Debt) 1.573*** -0.146***
(0.152) (0.0130)
Ln(Total Debt)
2.243*** -0.282***
(0.418) (0.0454)
Ln(Sales) -0.555*** -0.122*** -1.567*** -0.132***
(0.203) (0.0192) (0.392) (0.0477)
Tangibility 2.029*** -0.327*** -1.435 -0.201
(0.690) (0.0571) (1.338) (0.145)
R&D/Sale 3.832* -0.152 -0.0400 0.183
(2.200) (0.210) (3.189) (0.397)
R&D Missing Dummy 0.106 0.0340 0.399 0.0638
(0.303) (0.0274) (0.561) (0.0637)
M-B Ratio -1.227*** 0.211*** -0.614** 0.183***
(0.137) (0.0163) (0.277) (0.0410)
Ln(Asset)
-0.202***
-0.0853
(0.0251)
(0.0702)
Fitch Push
0.135***
0.137
(0.0410)
(0.0916)
ROA
-1.775***
1.322
(0.546)
(1.747)
Past 5-year ROA Volatility
-4.965***
-4.346
(1.083)
(2.915)
Year Dummies Yes Yes Yes Yes S&P Investment Grade
(Letter) Dummies Yes Yes Yes Yes Issuer Fixed Effects No No No No
Lambda -6.189***
-1.625
(1.137)
(2.348)
Observations 14341 14341 2567 2567
46
Table 10: Test for Inflation Tendency This table presents results of logit models. The dependent variable is Inflation Tendency defined in Equation (1). Ln(Long-term Debt) is the logarithm of long-term debt; Ln(Short-term Debt) is the logarithm of short-term debt; New CFO (t) equals 1 for the fiscal year when an issuer appoints a new CFO , and equals 0 otherwise; New CFO (t-1) is the one-year lag of New CFO (t). Past-n-quarter Fraction of Bond Issue Volume Rated by S&P is the offering amount of bonds issued by an issuer during the past n quarters that are rated by S&P as a fraction of those that are rated by the major three rating agencies (S&P, Moody’s and Fitch) in total. Ln(Total Debt) is the logarithm of total debt; Ln(Sales) is the logarithm of sales; Tangibility is the ratio of net property, plant, and equipment to total assets; R&D/Sales is the ratio of R&D expense to sales, where R&D expense is replaced by 0 if missing; R&D Missing Dummy equals 1 if R&D expense is missing; Market-to-Book is the ratio of the market value of assets to total assets, where the numerator is defined as the sum of market equity and total debt. All above variables are measured at time t-1. Year Dummies are indicator variables for the fiscal year. S&P Rating Letter Dummies are indicator variables that correspond to S&P's rating categories. Issuer Fixed Effects are indicator variables for issuers. Standard errors are in parentheses. ***, **, * indicate significant than zero at 1%, 5%, and 10 % level, respectively.
47
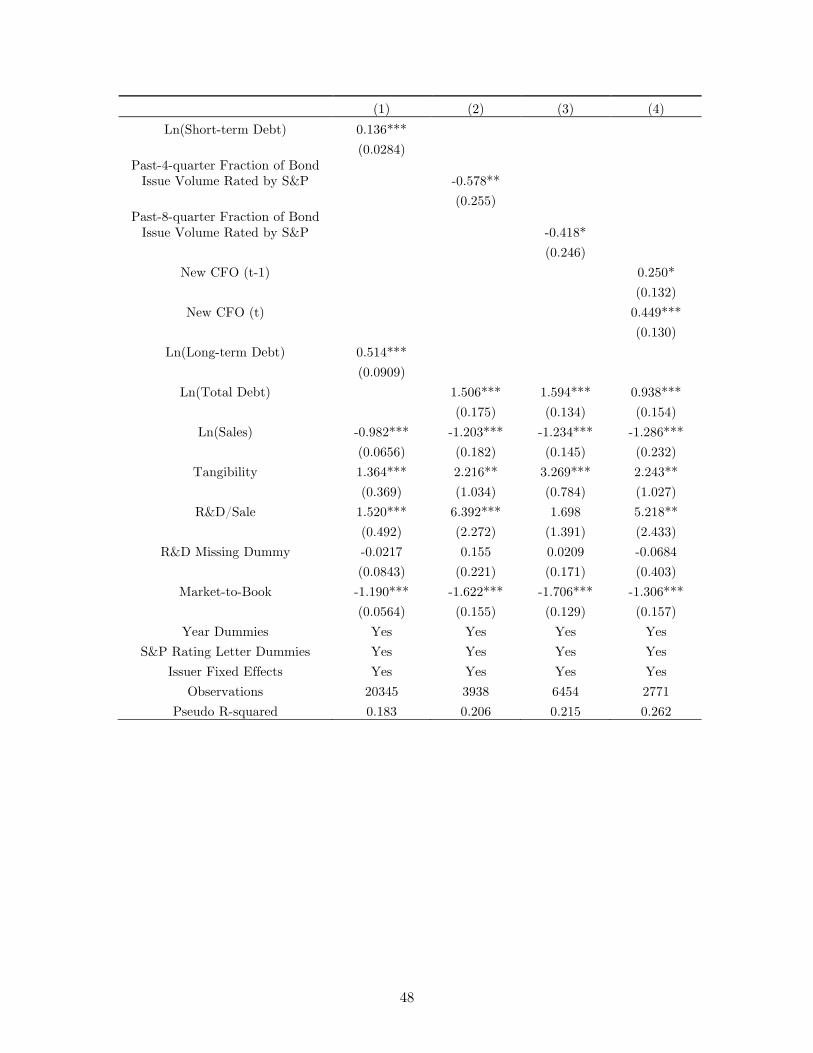
(1) (2) (3) (4) Ln(Short-term Debt) 0.136***
(0.0284) Past-4-quarter Fraction of Bond
Issue Volume Rated by S&P
-0.578**
(0.255)
Past-8-quarter Fraction of Bond Issue Volume Rated by S&P
-0.418*
(0.246) New CFO (t-1)
0.250*
(0.132)
New CFO (t)
0.449***
(0.130)
Ln(Long-term Debt) 0.514***
(0.0909)
Ln(Total Debt)
1.506*** 1.594*** 0.938***
(0.175) (0.134) (0.154)
Ln(Sales) -0.982*** -1.203*** -1.234*** -1.286***
(0.0656) (0.182) (0.145) (0.232)
Tangibility 1.364*** 2.216** 3.269*** 2.243**
(0.369) (1.034) (0.784) (1.027)
R&D/Sale 1.520*** 6.392*** 1.698 5.218**
(0.492) (2.272) (1.391) (2.433)
R&D Missing Dummy -0.0217 0.155 0.0209 -0.0684
(0.0843) (0.221) (0.171) (0.403)
Market-to-Book -1.190*** -1.622*** -1.706*** -1.306***
(0.0564) (0.155) (0.129) (0.157)
Year Dummies Yes Yes Yes Yes S&P Rating Letter Dummies Yes Yes Yes Yes
Issuer Fixed Effects Yes Yes Yes Yes Observations 20345 3938 6454 2771
Pseudo R-squared 0.183 0.206 0.215 0.262
48
REFERENCES
Ahcraft, A., P. Goldsmith-Pinkham, and J. Vickery, 2010, “MBS Ratings and the MortgageCredit Boom,” Federal Reserve Bank of New York Staff Reports.
Baker, H., and S. A. Mansi, 2001, “Assessing Credit Rating Agencies by Bond Issuers andInstitutional Investors,” Working Paper, American University and Texas Tech University.
Beaver, W. H., C. Shakespeare, and M. T. Soliman, 2006, “Differential Properties in theRating of Certified Versus Non-certified Bond-rating Agencies,” Journal of Accountingand Economics, 42, 303–334.
Becker, B., and T. Milbourn, 2010, “How did Increased Competition Affect Credit Ratings,”forthcoming at the Journal of Financial Economics.
Bolton, P., X. Freixas, and J. Shapiro, 2009, “The Credit Rating Game,” NBER WorkingPaper.
Bongaerts, D., K. M. Cremers, and W. N. Goetzmann, 2010, “Tiebreaker: Certificationand Multiple Credit Ratings,” Working Paper, Yale University.
Ederington, L. H., and J. C. Goh, 1998, “Bond Rating Agencies and Stock Analysts: WhoKnows What When?,” Journal of Financial and Quantitative Analysis, 33, 569–585.
Fight, A., 2001, The Ratings Game, John Wiley & Sons, New York.
Fulghieri, P., G. Strobl, and H. Xia, 2011, “The Economics of Solicited and UnsolicitedCredit Ratings,” Working Paper, University of North Carolina at Chapel Hill.
Geiger, M. A., and D. S. North, 2006, “Does Hiring a New CFO Change Things? AnInvestigation of Changes in Discretionary Accruals,” The Accounting Review, 81, 781–809.
Goh, J. C., and L. H. Ederington, 1993, “Is a Bond Rating Downgrade Bad News, GoodNews, or No News for Stockholders?,” Journal of Finance, 48, 2001–2008.
Gopalan, R., F. Song, and V. Yerramilli, 2010, “Debt Maturity Structure and Credit Qual-ity,” Working Paper, Washington University in St. Lous, Pennsylvania State Universityand University of Houston.
Graham, J. R., and C. R. Harvey, 2001, “The Theory and Practice of Corporate Finance:Evidence from the Field,” Journal of Financial Economics, 60, 187–243.
Griffin, J. M., and D. Y. Tang, 2009, “Did Subjectivity Play a Role in CDO Credit Rat-ings?,” Working Paper, University of Texas at Austin and University of Hong Kong.
Hand, J. R. M., R. W. Holthausen, and R. W. Leftwich, 1992, “The Effect of Bond RatingAgency Announcements on Bond and Stock Prices,” Journal of Finance, 47, 733–752.
49

Holthausen, R. W., and R. W. Leftwich, 1986, “The Effect of Bond Rating Changes onCommon Stock Prices,” Journal of Financial Economics, 17, 57–89.
Hull, J., M. Predescu, and A. White, 2004, “The Relationship Between Credit DefaultSwap Spreads, Bond Yields, and Credit Rating Announcements,” Journal of Bankingand Finance, 28, 2789–2811.
Jiang, J., K. R. Petroni, and I. Y. Wang, 2008, “CFOs and CEOs: Who Has the MostInfluence on Earnings Management?,” Working Paper, Michigan State University.
Kisgen, D., 2007, “The Influence of Credit Ratings on Corporate Capital Structure Deci-sion,” Journal of Applied Corporate Finance, 19, 56–64.
Kisgen, D. J., 2006, “Credit Ratings and Capital Structure,” Journal of Finance, 61, 1035–1072.
Kisgen, D. J., 2009, “Do Firms Target Credit Ratings or Leverage Levels?,” Journal ofFinancial and Quantitative Analysis, Forthcoming.
Klein, A., 2004, “Credit Raters’ Power Leads to Abuses, Some Borrowers Say,” The Wash-ington Post, November 24, 2004.
Marshall E. Blume, F. L., and A. C. Mackinlay, 1998, “The Declining Credit Quality ofU.S. Corporate Debt: Myth or Reality?,” Journal of Finance, 53, 1389–1413.
Mathis, J., J. McAndrews, and J.-C. Rochet, 2009, “Rating the Raters: Are ReputationConcerns Powerful Enough to Discipline Rating Agencies?,” Journal of Monetary Eco-nomics, 56, 657–674.
Mian, S., 2001, “On the Choice and Replacement of Chief Financial Officers,” Journal ofFinancial Economics, 60, 143–175.
Nadauld, T. D., and S. M. Sherlund, 2009, “The Role of the Securitization Process in theExpansion of Subprime Credit,” Working Paper, Brigham Young University and FederalReserve Board of Governors.
Norris, F., 2009, “New SEC Rule Hightens Risk of Insider Trading,” The New York Times,September 24, 2009.
Securities and Exchange Commission, 2008, Summary Report of Issues Identified in theCommission Staff’s Examinations of Select Credit Rating Agencies, Commission StaffReport.
Standard & Poor’s, 2008, 2007 Annual Global Corporate Default Study and Rating Transi-tions, Februray 5, 2008.
Wall Street Journal, 2004, EDS Aims to Save Debt Rating, Februray 11, 2004.
50