Audit Firm Rotation, Audit Firm Tenure and Earnings Conservatism
Upload
uni-mysoreCategory
view
1download
0
Does accounting conservatism pay?
Raghavan J. Iyengara, Ernest M. Zampellib
aSchool of Business, North Carolina Central University, Durham, NC, USAbDepartment of Business and Economics, The Catholic University of America, Washington, DC,
USA
Abstract
We investigate whether or not there is a link between conservative accountingpractices and the sensitivity of executive pay to accounting performance. Usingseveral accrual-based measures of accounting conservatism as well as alternativemeasures of accounting performance, we estimate an econometric model of CEOcompensation that incorporates the interaction of accounting conservatism andaccounting performance. Consistent with optimal contracting theory, we findthat the sensitivity of executive pay to accounting performance is higher for firmsthat report conservative accounting earnings. These results support the hypothe-sis that accounting conservatism, by limiting earnings management opportunitiesand improving the reliability of accounting performance measures, allows firmsto formulate contracts that tie executive compensation more closely to account-ing performance.
Key words: Executive compensation; Accounting conservatism; Firm performance
JEL classification: C21, J33, M41
doi: 10.1111/j.1467-629X.2009.00325.x
1. Introduction
According to Watts (2003a), conservative accounting is the ‘asymmetricalverification requirements for gains and losses’ that leads to the ‘persistent
The authors gratefully acknowledge the helpful comments from Augustine Duru, KevinForbes, Samuel Kotz and Robert Moffie. We also thank participants at North CarolinaCentral University’s Statistical Modeling Seminar for their comments and suggestions.Research assistance of Julius Bradshaw and Sarika Ramakrishnan are sincerely appreci-ated. Raghavan Iyengar acknowledges summer research grants received from North Car-olina Central University.
Received 10 January 2009; accepted 8 July 2009 by Ian Zimmer (Deputy Editor).
� The AuthorsJournal compilation � 2009 AFAANZ
Accounting and Finance 50 (2010) 121–142

understatement of net asset values’. This definition is consistent with the notionof accounting conservatism used by a number of researchers including Felthamand Ohlson (1995), Basu (1997), Gjesdal (1999), Zhang (2000), Beaver and Ryan(2000), Ahmed et al. (2002), Penman and Zhang (2002) and Ryan (2006). Itfollows from such a definition that conservative accounting practices areaccounting choices that tend to impart a downward bias to earnings and thebook value of net assets. Relatively speaking, therefore, last-in first-out (LIFO)is a more conservative inventory accounting method than first-in first-out(FIFO), the expensing of R&D is more conservative than capitalising and amor-tising R&D, and accelerated depreciation methods are more conservative thanstraight line depreciation.One explanation of why firms might choose to implement conservative
accounting practices lies in efficient contracting theory, i.e. conservative account-ing can be used as part of a firm’s strategy to mitigate the conflicts that ariseamong the many claimants of a firm’s net assets. This is due to the fact that con-servative accounting methods place constraints on the distribution of those netassets thereby limiting the scope for self-serving opportunistic behaviour. Forexample, Ahmed et al. (2002) look at the role of accounting conservatism in mit-igating the conflict between bondholders and shareholders. Specifically, becauseconservative accounting lowers earnings and retained earnings, dividend policy isnecessarily restricted, reducing the probability of excessive dividend payouts.Consequently, one hypothesis they put forth is that firms using more conserva-tive accounting practices incur lower costs of debt.Similarly, conservative accounting may help in aligning the interests of manag-
ers and shareholders through its impact on accounting earnings measures that arefrequently used in management compensation contracts. As Watts (2003a) pointsout, by reducing current earnings and understating cumulative earnings and netassets, conservative accounting restricts ‘managements’ opportunistic paymentsto themselves…’. Similarly, Chen et al. (2007), in a theoretical model whichallows for the presence of both conservative accounting and earnings manage-ment biases, demonstrates that conservative accounting practices reduce the noiseand improve the informativeness of accounting performance measures and reducethe marginal benefits from earnings management. Kwon (2005) also shows thataccounting earnings become more useful in controlling the costs of suboptimalmanagerial decisions when those earnings are measured conservatively ratherthan neutrally or liberally. Such results suggest that a portion of the cross-firmvariation in the parameters of compensation contracts may be explained by thedifferences among firms in their use of conservative accounting methods. In par-ticular, because conservatism limits the compensation-based incentives for earn-ings management and improves the reliability and usefulness of accountingperformance measures, one would expect to observe higher pay-performance sen-sitivities in firms that are more conservative in their accounting practices.An alternative, albeit not mutually exclusive, explanation of the impact of
accounting conservatism on managerial compensation relates to the fact that
122 R. J. Iyengar, E. M. Zampelli/Accounting and Finance 50 (2010) 121–142
� The AuthorsJournal compilation � 2009 AFAANZ

conservatism implies the persistence of earnings increases. If compensationcommittees reward managers not only for current earnings increases, but alsofor the persistence of those earnings increases, then one would expect this to bereflected in the relationship between conservatism and managerial compensation.A possible reason for rewarding the persistence of earnings is that it may help tocounter the negative impacts of what is known as the ‘horizon problem’, i.e. theproblem of aligning the managerial interests with shareholder interests when theexpected tenure of the manager is shorter than the optimal investment horizonof the firm (Smith and Watts 1982). In a cross-sectional analysis of chief execu-tive officer (CEO) compensation, Baber et al. (1998) provide evidence of suchintervention by compensation committees. In particular, the authors’ results sup-port their hypothesis that the sensitivity of executive cash compensation (salaryplus bonuses) to earnings is positively related to the persistence of earnings.1 In arecent Australian study, Lai and Taylor (2008) document the positive associationof conservatism with stock-return volatility, investment cycle length and priorperiod conservatism. They also report a negative association between conser-vatism on the one hand and firm age, firm size and leverage. Conservatismthus extends the manager’s investment cycle length and counteracts against the‘horizon problem’.In the spirit of Baber et al. (1998), this paper intends to examine the relation-
ship between accounting conservatism and executive compensation. Specifically,it seeks to test whether or not there is a link between conservative accountingpractices and the sensitivity of executive pay to accounting performance. Theempirical analysis is based on a sample of 4508 firm-year observations over theperiod of 1994–2003 from the ExecuComp/Compustat databases. Using severalaccrual-based measures of accounting conservatism as well as alternative mea-sures of accounting performance, we estimate an econometric model of CEOcash compensation that incorporates the interaction of accounting conservatismand accounting performance. The paper’s main result strongly supports thehypothesis that the sensitivity of executive pay to accounting performance ishigher for firms that engage in more conservative accounting practices. Theresult survives a battery of robustness tests.
1 This result is consistent with a number of other studies, including Abdel-khalik (1985),Abdel-khalik et al. (1987), Dechow et al. (1994), Gaver and Gaver (1998), and Duru et al.(2002), which offer evidence that executive compensation is effectively shielded by com-pensation committees, whereby GAAP earnings are adjusted to account for the income-decreasing effects of otherwise valuable activities, such as investing in R&D, restructuringprofitable operations, and discontinuing unprofitable operations. In contrast, research byHealy et al. (1987) examining the compensation effects of changes in inventory valuationand depreciation methods and Defeo et al. (1989) examining the compensation effects ofequity-for-debt swaps provide evidence that executive cash compensation (salary plusbonus) is largely determined by reported earnings with no evidence of active interventionby compensation committees to account for possible managerial manipulation ofearnings.
R. J. Iyengar, E. M. Zampelli/Accounting and Finance 50 (2010) 121–142 123
� The AuthorsJournal compilation � 2009 AFAANZ
The remainder of the paper is organised as follows. Section 2 provides an ana-lytical framework and a platform for testable hypothesis. A detailed discussionof the conservatism variables and their construction is undertaken in Section 3.The econometric model is developed in Section 4. A detailed description of thesample and the data is provided in Section 5. Section 6 presents and discussesthe major empirical results. A summary and some concluding remarks areoffered in Section 7.
2. The analytical model
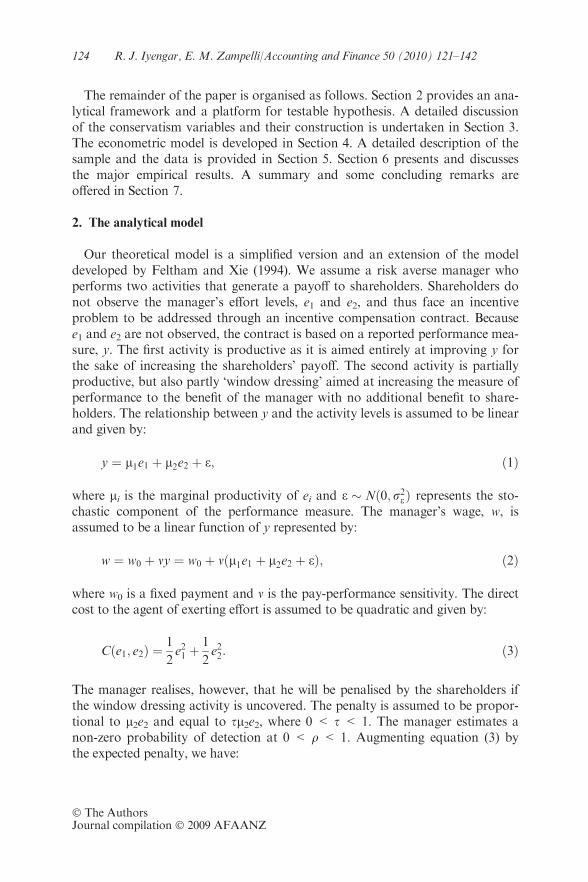
Our theoretical model is a simplified version and an extension of the modeldeveloped by Feltham and Xie (1994). We assume a risk averse manager whoperforms two activities that generate a payoff to shareholders. Shareholders donot observe the manager’s effort levels, e1 and e2, and thus face an incentiveproblem to be addressed through an incentive compensation contract. Becausee1 and e2 are not observed, the contract is based on a reported performance mea-sure, y. The first activity is productive as it is aimed entirely at improving y forthe sake of increasing the shareholders’ payoff. The second activity is partiallyproductive, but also partly ‘window dressing’ aimed at increasing the measure ofperformance to the benefit of the manager with no additional benefit to share-holders. The relationship between y and the activity levels is assumed to be linearand given by:
y ¼ l1e1 þ l2e2 þ e; ð1Þ
where li is the marginal productivity of ei and e � Nð0;r2eÞ represents the sto-
chastic component of the performance measure. The manager’s wage, w, isassumed to be a linear function of y represented by:
w ¼ w0 þ my ¼ w0 þ mðl1e1 þ l2e2 þ eÞ; ð2Þ
where w0 is a fixed payment and m is the pay-performance sensitivity. The directcost to the agent of exerting effort is assumed to be quadratic and given by:
Cðe1; e2Þ ¼1
2e21 þ
1
2e22: ð3Þ
The manager realises, however, that he will be penalised by the shareholders ifthe window dressing activity is uncovered. The penalty is assumed to be propor-tional to l2e2 and equal to sl2e2, where 0 < s < 1. The manager estimates anon-zero probability of detection at 0 < q < 1. Augmenting equation (3) bythe expected penalty, we have:
124 R. J. Iyengar, E. M. Zampelli/Accounting and Finance 50 (2010) 121–142
� The AuthorsJournal compilation � 2009 AFAANZ

Cðe1; e2Þ ¼1
2e21 þ
1
2e22 þ qsl2e2: ð4Þ
The manager is assumed to choose e1 and e2 to maximise the objective functionw ) C (e1, e2). The solutions to the first-order conditions are:
e�1 ¼ ml1;
e�2 ¼ ðm� qsÞl2:ð5Þ
From equation (5), we see that the comparative statics for e�2 are sensible.Optimal effort is increasing with the pay-performance sensitivity, i.e.
@e�2
@m >0 andwith the marginal productivity of effort, i.e.
@e�2
@l2>0, as long as (m ) qs) > 0.
Predictably, the optimal level of e�2 declines with the probability of detectionand the penalty proportion, i.e.
@e�2
@q <0 and@e�
2
@s <0:Shareholders (the ‘principal’) are assumed to maximise expected surplus,
defined as the difference between the gross payoff, B(e1, e2), and expectedcosts, where expected costs include expected compensation costs plus thecosts the principal expects to bear due to managerial manipulation of theperformance measure y, subject to the incentive constraints given by equa-tion (5). The expected compensation costs include a premium that must bepaid to compensate for the risk associated with the incentive programmeequal to 1
2 m2rr2. The expected costs of manipulation to the principal areproportional to l2e2 and equal to gl2e2. The principal assigns a non-zeroprobability of manipulation given by h. The expected surplus can be writtenas:
S ¼ b1e1 þ b2e2 �1
2e21 þ
1
2e22
� �� 1
2m2rr2 � hgl 2e2; ð6Þ
where the bi are the marginal contributions of the manager’s efforts to the grosspayoff of the principal. Substituting equation (5) into equation (6), the expectedsurplus can be written as:
S ¼ b1ml1 þ b2ml2 �1
2m2l2
1 þ1
2m2l2
2
� �� 1
2m2rr2 � hgl2
2ðm� qsÞ: ð7Þ
Choosing m to maximise S yields the first-order condition:
m� ¼ b1l1 þ b2l2 þ qsl22 � hgl2
l21 þ l2
2 þ rr2: ð8Þ
Note that the optimal pay-performance sensitivity is increasing in themanager’s assessment of the probability of detection, decreasing in the
R. J. Iyengar, E. M. Zampelli/Accounting and Finance 50 (2010) 121–142 125
� The AuthorsJournal compilation � 2009 AFAANZ

principal’s assessment of the probability of manipulation and decreasing in thevariance (noise) associated with the performance measure y, i.e. @m�
@q >0; @m
�
@h <0 and @m�
@r2 <0:The linkages between conservative accounting practices as defined by Watts
and managerial compensation can be established by the comparative staticsreported above. In particular, conservatism in accounting may: (i) reduce thenoise associated with accounting performance measures; (ii) reduce the probabil-ity of manipulation, thereby lowering the expected marginal cost of manipula-tion to the principal; and/or (iii) increase the probability that manipulation isdetected, thereby increasing the expected marginal penalty cost of manipulationto the manager-agent.2 The reported comparative statics suggest that the optimalpay-performance sensitivity will be lower for all three of these possibilities andhence, generate the paper’s main testable hypothesis stated in its alternativeform:
Ha: Conservative accounting practices lead to an increase in the optimal pay-performance sensitivity or equivalently, to an increase in the optimal weight onaccounting performance measures used for incentive compensation.
3. Measuring accounting conservatism
Givoly and Hayn (2000) offer a descriptive definition of accounting con-servatism that provides a basis for our choice of conservatism measures.Specifically, the authors define conservatism as ‘a selection criterion betweenaccounting principles that leads to the minimisation of cumulative reportedearnings by slower revenue recognition, faster expense recognition, lowerasset valuation and higher liability valuation.’3 This characterisation, in high-lighting the multi-period aspect of conservatism, suggests that accountingaccruals can be used to determine the extent to which conservative account-ing practices are chosen over more aggressive ones. In particular, the defini-tion suggests that firms choosing more conservative accounting practicesshould, over time, exhibit a pattern of negative accruals, i.e. a predominanceof periods when reported earnings are less than operating cash flows. Thisis reinforced by Watts (2003b) who writes:
Conservatism’s asymmetrical treatment of gains and losses produces an asymmetry inaccruals. Because losses tend to be fully accrued while gains do not, periodic accrualstend to be negative and cumulative accruals to be understated. (p. 289)
2 These are consistent with the work of LaFond and Watts (2008) and Khan and Watts(2007) who argue and provide evidence that accounting conservatism is a governanceresponse to the information asymmetry between investors and managers that reducesmanagers’ abilities to manipulate and overstate financial performance.
3 Givoly and Hayn (2000), p. 292.
126 R. J. Iyengar, E. M. Zampelli/Accounting and Finance 50 (2010) 121–142
� The AuthorsJournal compilation � 2009 AFAANZ
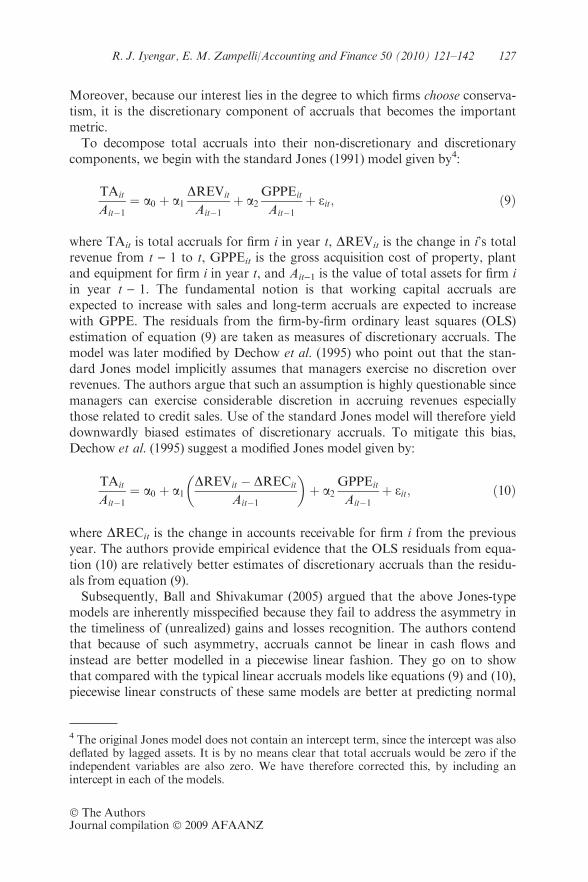
Moreover, because our interest lies in the degree to which firms choose conserva-tism, it is the discretionary component of accruals that becomes the importantmetric.To decompose total accruals into their non-discretionary and discretionary
components, we begin with the standard Jones (1991) model given by4:
TAit
Ait�1¼ a0 þ a1
DREVit
Ait�1þ a2
GPPEit
Ait�1þ eit; ð9Þ
where TAit is total accruals for firm i in year t, DREVit is the change in i’s totalrevenue from t ) 1 to t, GPPEit is the gross acquisition cost of property, plantand equipment for firm i in year t, and Ait)1 is the value of total assets for firm iin year t ) 1. The fundamental notion is that working capital accruals areexpected to increase with sales and long-term accruals are expected to increasewith GPPE. The residuals from the firm-by-firm ordinary least squares (OLS)estimation of equation (9) are taken as measures of discretionary accruals. Themodel was later modified by Dechow et al. (1995) who point out that the stan-dard Jones model implicitly assumes that managers exercise no discretion overrevenues. The authors argue that such an assumption is highly questionable sincemanagers can exercise considerable discretion in accruing revenues especiallythose related to credit sales. Use of the standard Jones model will therefore yielddownwardly biased estimates of discretionary accruals. To mitigate this bias,Dechow et al. (1995) suggest a modified Jones model given by:
TAit
Ait�1¼ a0 þ a1
DREVit � DRECit
Ait�1
� �þ a2
GPPEit
Ait�1þ eit; ð10Þ
where DRECit is the change in accounts receivable for firm i from the previousyear. The authors provide empirical evidence that the OLS residuals from equa-tion (10) are relatively better estimates of discretionary accruals than the residu-als from equation (9).Subsequently, Ball and Shivakumar (2005) argued that the above Jones-type
models are inherently misspecified because they fail to address the asymmetry inthe timeliness of (unrealized) gains and losses recognition. The authors contendthat because of such asymmetry, accruals cannot be linear in cash flows andinstead are better modelled in a piecewise linear fashion. They go on to showthat compared with the typical linear accruals models like equations (9) and (10),piecewise linear constructs of these same models are better at predicting normal
4 The original Jones model does not contain an intercept term, since the intercept was alsodeflated by lagged assets. It is by no means clear that total accruals would be zero if theindependent variables are also zero. We have therefore corrected this, by including anintercept in each of the models.
R. J. Iyengar, E. M. Zampelli/Accounting and Finance 50 (2010) 121–142 127
� The AuthorsJournal compilation � 2009 AFAANZ
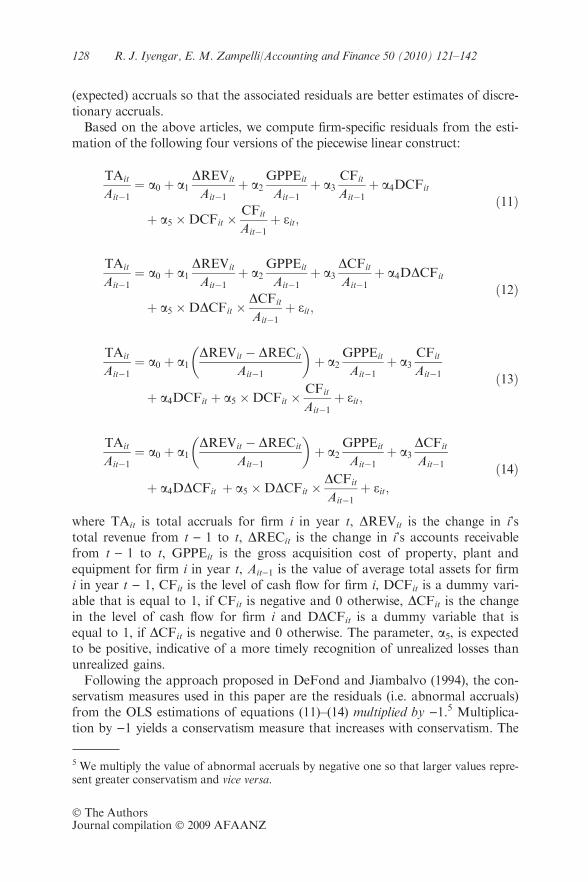
(expected) accruals so that the associated residuals are better estimates of discre-tionary accruals.Based on the above articles, we compute firm-specific residuals from the esti-
mation of the following four versions of the piecewise linear construct:
TAit
Ait�1¼ a0 þ a1
DREVit
Ait�1þ a2
GPPEit
Ait�1þ a3
CFit
Ait�1þ a4DCFit
þ a5 �DCFit �CFit
Ait�1þ eit;
ð11Þ
TAit
Ait�1¼ a0 þ a1
DREVit
Ait�1þ a2
GPPEit
Ait�1þ a3
DCFit
Ait�1þ a4DDCFit
þ a5 �DDCFit �DCFit
Ait�1þ eit;
ð12Þ
TAit
Ait�1¼ a0 þ a1
DREVit � DRECit
Ait�1
� �þ a2
GPPEit
Ait�1þ a3
CFit
Ait�1
þ a4DCFit þ a5 �DCFit �CFit
Ait�1þ eit;
ð13Þ
TAit
Ait�1¼ a0 þ a1
DREVit � DRECit
Ait�1
� �þ a2
GPPEit
Ait�1þ a3
DCFit
Ait�1
þ a4DDCFit þ a5 �DDCFit �DCFit
Ait�1þ eit;
ð14Þ
where TAit is total accruals for firm i in year t, DREVit is the change in i’stotal revenue from t ) 1 to t, DRECit is the change in i’s accounts receivablefrom t ) 1 to t, GPPEit is the gross acquisition cost of property, plant andequipment for firm i in year t, Ait)1 is the value of average total assets for firmi in year t ) 1, CFit is the level of cash flow for firm i, DCFit is a dummy vari-able that is equal to 1, if CFit is negative and 0 otherwise, DCFit is the changein the level of cash flow for firm i and DDCFit is a dummy variable that isequal to 1, if DCFit is negative and 0 otherwise. The parameter, a5, is expectedto be positive, indicative of a more timely recognition of unrealized losses thanunrealized gains.Following the approach proposed in DeFond and Jiambalvo (1994), the con-
servatism measures used in this paper are the residuals (i.e. abnormal accruals)from the OLS estimations of equations (11)–(14) multiplied by )1.5 Multiplica-tion by )1 yields a conservatism measure that increases with conservatism. The
5 We multiply the value of abnormal accruals by negative one so that larger values repre-sent greater conservatism and vice versa.
128 R. J. Iyengar, E. M. Zampelli/Accounting and Finance 50 (2010) 121–142
� The AuthorsJournal compilation � 2009 AFAANZ

measures are labelled as CNSV1, CNSV2, CNSV3 and CNSV4, respectively. Asexplained in a following section, we recognise that the abnormal accruals models(equations (11)–(14)) measure conservatism with an error. Consequently, we alsoemploy errors-in-variables regression in our tests.
4. A model of executive compensation
It has been long established in the literature that managerial compensationcontracts are based both on accounting and stock price measures of perfor-mance.6 Consistent with this literature, our basic model of executive compensa-tion is given by:
D ln COMPit ¼ b0 þ b1DAcctPerfit þ b2DMKRTNit þ eit; ð15Þ
where Dln COMPit is the one-period change in the natural log of executive com-pensation, DAcctPerfit and DMKRETit are the one-period change in accountingperformance (as measured by return on assets (ROA)) and market performance,respectively.7 DROA is the change in ROA defined as the sum of after-taxinterest expense and earnings before extraordinary income and discontinuedoperations, less tax expense divided by total assets.8 Equation (15) or variantsthereof have been employed in a number of empirical studies examining the sen-sitivity of executive pay to accounting performance and stock price measures,including Lambert and Larcker (1987), Sloan (1993), Baber et al. (1998), Coreet al. (2003) and Leone et al. (2009). The natural log specification for the depen-dent variable helps in mitigating the adverse impact of any outliers, while the‘changes’ specification controls for a number of firm-specific factors that havebeen shown to influence compensation but which exhibit very little if any varia-tion over time.9
The coefficients, b1 and b2, represent the sensitivities of pay to accounting andstock performance, respectively. To examine whether these parameters areaffected by the degree of accounting conservatism, we extend equation (15) toinclude the interactions of the performance variables with our conservatism mea-sures. Specifically, the primary model is given by:
6 The theoretical basis for this can be found in papers by Holmstrom (1979) and Bankerand Datar (1989).
7 In robustness tests, we use an alternate accounting performance measure, namely, returnon equity (ROE).
8 This definition of ROA was originally proposed by Fama.
9 Such factors include firm size, board composition and a number of other governanceand stock ownership related characteristics.
R. J. Iyengar, E. M. Zampelli/Accounting and Finance 50 (2010) 121–142 129
� The AuthorsJournal compilation � 2009 AFAANZ

D lnCOMPit ¼ b0 þ b1DAcctPerfit þ b2DMKRTNit þ b3ðCNSVj
� DAcctPerfitÞ þ b4ðCNSVj � DMKRTNitÞ þ eit;ð16Þ
where CNSVj is one of the four measures of conservatism as defined in the previ-ous section for j = 1–4.Equation (16) is estimated for both CEO cash (salary plus bonus) and total
compensation (in our robustness tests). DMKRET represents the change instockholders’ return, including reinvestment of dividends. A complete descrip-tion of how the models’ variables are measured is provided in the Appendix.Consistent with prior research, we expect the signs of b1 and b2 to be positive
indicating that improvements in a firm’s accounting and market performance arepositively related to the changes in executive compensation. A positive value forb3 is expected suggesting that the responsiveness of executive pay to changes inaccounting performance increases with increases in conservatism. This wouldsupport the hypothesis that conservatism, by limiting earnings managementopportunities and improving the reliability of performance measures, allowsfirms to formulate contracts that tie executive compensation more closely toaccounting performance. Additionally, this would support the hypothesis byBaber et al. (1998) that compensation committees reward managers for the per-sistence of earnings as a way to mitigate the horizon problem. Finally, theparameter b4 is expected to be either zero or negative. If stock prices efficientlyincorporate earnings persistence, good news and bad news, then the interactionterm between the market return and the conservatism measure adds no informa-tion not already reflected by the market return itself. Hence, one would expect b4to be equal to zero. Alternatively, if increases in accounting conservatism causegreater reliance and weight to be put on accounting earnings in compensationdecisions, then b4 would be expected to be negative.
5. Research design
5.1. Sample
To compile the sample of firms, we began with the population of non-finan-cial, non-utility firms from the ExecuComp database for the period 1994–2003which consisted of 6642 firm-year observations. From this population, wedeleted 1651 observations with insufficient financial data in the Compustat data-base and eliminated another 202 observations for firms with insufficient compen-sation data in ExecuComp database. Another 63 observations were deletedbecause of insufficient time-series data with which to calculate firm-specific resid-uals.10 Finally, the winsorizing of extreme outliers in the top and bottom 0.5 per
10 A minimum of eight time-series observations were required for each firm to run firm-specific regressions.
130 R. J. Iyengar, E. M. Zampelli/Accounting and Finance 50 (2010) 121–142
� The AuthorsJournal compilation � 2009 AFAANZ

cent of each of the variables’ distributions resulted in the elimination of 218observations and a final sample of 4508 firm-year observations. Table 1 providesdetails of the sample selection process.
5.2. Descriptive statistics
Table 2 presents the distribution of our sample by industry and mean valuesof the study’s main variables. The industry distribution of our sample is similarto prior studies using comparable data, e.g. Frankel et al. (2002) and Whisenantet al. (2003). Table 2 also reports the mean of the four conservatism measuresnamely, CNSV1, CNSV2, CNSV3 and CNSV4 for all firms by industry. The dataindicate that companies in the computer industry, on average, have the largestmean decrease in accounting returns (0.89 per cent decrease in ROA) and marketreturns (22.21 per cent); they also report the most conservative measure ofaccounting income as evidenced by CNSV1 (0.0169), CNSV2 (0.0159), CNSV3
(0.0178), CNSV4 (0.0167). On average, companies in the chemical and pharma-ceutical industries have the largest discretionary accruals and concomitantly theleast conservative accounting earnings measure.Other descriptive statistics are also interesting. For example, companies in the
food industry had the highest CEO cash and total compensation of $1 887 000and $5 542 000, respectively. It is also worth noting that, firms in the extractiveindustry, on average had the lowest CEO cash compensation ($958 000) andlowest CEO total compensation ($2 047 000) while reporting the largest meanincrease in accounting and market returns of 0.76 and 4.48 per cent, respectively.
Table 1
Selection of sample of firm-years 1994–2003
Number of firm-years
Number of non-financial, non-utility,
firm-year observations from ExecuComp
database for the sample period
6642
Less: firm-years
With insufficient financial data in
the Compustat database
(1651)
With insufficient CEO compensation
data in ExecuComp database
(202)
With insufficient observations to obtain
firm-specific residuals (minimum eight
observations required for each firm to
run firm-specific regression)
(63)
With extreme outliers (i.e. observations in the
top and bottom 0.5 per cent of each of the variables)
(218)
Number of firm-year observations in the final sample 4508
R. J. Iyengar, E. M. Zampelli/Accounting and Finance 50 (2010) 121–142 131
� The AuthorsJournal compilation � 2009 AFAANZ

Tab
le2
Descriptive
statistics:meansofvariables
Industry
aNo.
Cashcompensation
Totalcompensation
DROA
DMKRET
CNSV1
CNSV2
CNSV3
CNSV4
Miningan
dconstruction
41962
2101
)0.28
)18.42
0.0135
0.0017
0.0150
0.0028
Food
293
1887
5542
)0.06
)1.99
)0.0106
0.0007
)0.0111
0.0004
Textiles,print/publishing
686
1101
2675
)0.19
)0.66
)0.0037
)0.0026
)0.0043
)0.0032
Chem
icals
365
1302
3692
0.17
1.21
)0.0161
)0.0153
)0.0171
)0.0164
Pharmaceuticals
363
1211
5127
)0.17
)4.07
)0.0208
)0.0103
)0.0212
)0.0105
Extractive
130
958
2047
0.76
4.48
0.0045
)0.0041
0.0074
)0.0013
Durable
2062
1090
3110
)0.50
)15.04
)0.0083
)0.0106
)0.0084
)0.0110
Computers
568
986
4935
)0.89
)22.21
0.0169
0.0159
0.0178
0.0167
Overall
4508
1152
3601
)0.36
)10.17
)0.0056
)0.0054
)0.0057
)0.0056
aIndustry
mem
bership
isdetermined
bySIC
codeas
follows:miningan
dconstruction(1000–1999,excluding1300–1399),food(2000–2111),textiles
&print-
ing/publishing(2200–2799),chem
icals(2800–2824,
2840–2899),
pharmaceuticals
(2830–2836),extractive(2900–2999,1300–1399),durable
man
ufacturers
(3000–3999,excluding3570–3579and3670–3679),computers
(7370–7379,3570–3579,
3670–3679).Transportation(4000–4799),retail(5000–5999),services
(7000–8999),excluding7370–7379)
andfinancial
services
(6000–6999)
firm
san
dutilities
(4900–4999)areexcluded
from
thesample.Thisclassificationisfol-
lowed
intheprioraccountingliterature
(see
Whisenan
tet
al.2003).
DROA,changesin
return
onasset;
DMKRET,chan
gesin
totalreturn
toshareholders,
includingreinvestmentofdividends.
132 R. J. Iyengar, E. M. Zampelli/Accounting and Finance 50 (2010) 121–142
� The AuthorsJournal compilation � 2009 AFAANZ

6. Results
6.1. Ordinary least squares results
We begin the analysis by presenting OLS results ignoring potential measure-ment errors in the conservatism variable. Table 3 presents the results of the OLSestimation of equation (16) where the conservatism measure is based on residualsobtained from equations (11) through (14), respectively. Parameter estimates aregiven along with the corresponding p-values. In all four models, we use thechange in cash compensation (Dln COMP) as the dependent variable.Table 3, Model 1, shows that the changes in cash compensation are signifi-
cantly associated with DMKRET and DROA indicating that improvements in afirm’s market and accounting performance are positively related to the changesin executive compensation. The positive and significant estimated coefficient on
Table 3
Results of pooled OLS regressions with D in CEO cash compensation as the dependent variablea
(n = 4508)
DlnCOMP = b0 + b1 CNSVj + b2 DROA + b2 DMKRET + b3 (CNSVj · DROA) + b4 (CNSVj ·DMKRET) + e1
Details Model 1 Model 2 Model 3 Model 4
Intercept 0.1073 (0.000)*** 0.1079 (0.000)*** 0.1080 (0.000)*** 0.1088 (0.000)***
CNSV1 0.0975 (0.264)
CNSV2 0.1033 (0.245)
CNSV3 0.2050 (0.024)**
CNSV4 0.2191 (0.016)**
DROA 0.0006 (0.000)*** 0.0010 (0.000)*** 0.0007 (0.000)*** 0.0011 (0.000)***
DMKRET 0.0001 (0.013)** 0.0001 (0.041)** 0.0001 (0.016)** 0.0001 (0.045)**
CNSV1 · DROA 0.0150 (0.000)***
CNSV2 · DROA 0.0156 (0.000)***
CNSV3 · DROA 0.0165 (0.000)***
CNSV4 · DROA 0.0175 (0.000)***
CNSV1 · DMKRET )0.0000 (0.772)
CNSV2 · DMKRET 0.0001 (0.352)
CNSV3 · DMKRET )0.0000 (0.922)CNSV4 · DMKRET 0.0002 (0.160)
Adjusted R2 0.0126 0.0140 0.0132 0.0150
F-statistic 7.46 (0.000)*** 9.08 (0.000)*** 7.60 (0.000)*** 9.63 (0.000)***
ap-Values in parentheses; **, *** indicates two-tailed significance at the 0.10, 0.05 levels, respectively.
CNSV1, CNSV2, CNSV3 and CNSV4 are residuals obtained by running firm-specific regressions
from equations (11) through (14) multiplied by )1. DlnCOMP, changes in natural log of CEO cash
compensation, where cash compensation is the sum of CEO salary and bonus; DROA, changes
in return on asset; DMKRET, changes in total return to shareholders, including reinvestment of
dividends. All changes are from 1 year to the next.
R. J. Iyengar, E. M. Zampelli/Accounting and Finance 50 (2010) 121–142 133
� The AuthorsJournal compilation � 2009 AFAANZ
the interaction term CNSV1 · DROA (i.e. b3) provides support for the hypothe-sis that executive compensation is more sensitive to the changes in accountingperformance with increases in conservatism. A similar result holds for theremaining three models where we employ the alternative measures of conserva-tism; the estimated coefficients of CNSVj · DROA are positive and significant atstandard levels for all of the models.Table 2 illustrates that changes in accounting performance and market perfor-
mance vary widely across industries. Hence, we perform the analysis again usingindustry-adjusted accounting and market performance variables.11 Table 4reports the results. We find that coefficients of ADJMKRET and ADJROAare positively associated with CEO compensation as predicted with p-valuesof <0.05. The coefficient on CNSVj is statistically insignificant, suggesting thatCEOs are not penalised for using a conservative measure. Once again, asexpected, the coefficients of CNSVj · ADJROA are positive and significant,indicating that the responsiveness of executive pay to the changes in accountingperformance increases with accounting conservatism.
6.2. Errors-in-variables regression
It is well-known that measurement error in one or more of the independentvariables in a linear regression can result in biased OLS slope estimators, evenasymptotically. Because accounting conservatism is proxied by abnormalaccruals from different models, constrained as they are by the availability ofdata over an 8 year period to compute firm-specific residuals, it would berather naı̈ve to ignore measurement errors in the conservatism variable. Specifi-cally, we are interested in ascertaining whether the results reported in Tables 3and 4 are mere artefacts of measurement error bias, rather than signals of realassociation. We therefore run all four models by explicitly stipulating the reli-ability of the conservatism variable, as well as its interactions with otherexplanatory variables, at 0.90.12 Table 5 reports the results from the errors-in-variables (EIV) specification. We find that taking into account measurementerror in conservatism variable leads to similar inferences about the associationbetween executive pay and accounting conservatism. The estimation of errors-in-variables regression yields statistically significant and positive coefficients forthe interaction terms CNSVj · DROA in all four models. Thus, potentialmeasurement error bias does not appear to be the cause of the documented
11 We compute this by taking the difference between firms’ accounting (market) returnsand the mean accounting (market) returns for all companies in the firm’s three-digitstandard industrial code (SIC) classification.
12 Using a lower reliability of 0.85 produced markedly similar results. These results areavailable upon request.
134 R. J. Iyengar, E. M. Zampelli/Accounting and Finance 50 (2010) 121–142
� The AuthorsJournal compilation � 2009 AFAANZ

positive sensitivity of executive compensation to accounting performance in thepresence of conservatism.We also replicate Table 4 by using the EIV specification with the industry-
adjusted variables and report the results in Table 6. The estimated coefficients onADJMKRET and ADJROA are both generally positive and significant, suggest-ing that improvements in stock performance or industry-adjusted accountingperformance are associated with increases in CEO compensation. Crucially, inall four cases, the estimated coefficients on the interaction terms (CNSVj ·ADJROA) are positive and significant at conventional levels. These resultsalso lend support to our hypothesis that the sensitivity of executive pay toindustry-adjusted accounting performance is higher for firms that engage in moreconservative accounting practices.
Table 4
Results of pooled OLS regressions with D in CEO cash compensation as the dependent variablea
(n = 4508)
DlnCOMP = b0 + b1 CNSVj + b2 ADJROA + b2 ADJMKRET + b3 (CNSVj · ADJROA)
+ b4 (CNSVj · ADJMKRET) + e1
Details Model 1 Model 2 Model 3 Model 4
Intercept 0.1000 (0.000)*** 0.0977 (0.000)*** 0.0996 (0.000)*** 0.0974 (0.000)***
CNSV1 )0.0591 (0.458)CNSV2 )0.1036 (0.208)
CNSV3 0.0024 (0.976)
CNSV4 )0.0388 (0.639)
ADJROA 0.0003 (0.002)*** 0.0004 (0.001)*** 0.0004 (0.001)*** 0.0004 (0.000)***
ADJMKRET 0.0014 (0.000)*** 0.0014 (0.000)*** 0.0014 (0.000)*** 0.0014 (0.000)***
CNSV1 · ADJROA 0.0080 (0.003)***
CNSV2 · ADJROA 0.0087 (0.000)***
CNSV3 · ADJROA 0.0093 (0.001)***
CNSV4 · ADJROA 0.0096 (0.000)***
CNSV1 · ADJMKRET 0.0029 (0.002)***
CNSV2 · ADJMKRET 0.0013 (0.175)
CNSV3 · ADJMKRET 0.0027 (0.005)***
CNSV4 · ADJMKRET 0.0010 (0.321)
Adjusted R2 0.0496 0.0486 0.0500 0.0490
F-statistic 44.35 (0.000)*** 44.28 (0.000)*** 44.64 (0.000)*** 44.78 (0.000)***
ap-Values in parentheses; *** indicates two-tailed significance at 0.01 level, respectively. CNSV1,
CNSV2, CNSV3 and CNSV4 are residuals obtained by running firm-specific regressions from
equations (11) through (14) multiplied by )1. DlnCOMP, changes in natural log of CEO cash
compensation, where cash compensation is the sum of CEO salary and bonus; ADJROA, indus-
try-adjusted (three-digit SIC) return on asset; ADJMKRET, industry-adjusted (three-digit SIC)
1 year total return to shareholders, including reinvestment of dividends. All changes are from
1 year to the next.
R. J. Iyengar, E. M. Zampelli/Accounting and Finance 50 (2010) 121–142 135
� The AuthorsJournal compilation � 2009 AFAANZ

6.3. Robustness tests
In this section, we explore whether the main findings are robust to alternativespecifications.13 Prior research suggests that CEO compensation is sensitive tofirm size. For instance, Jensen and Meckling (1976) contend that the largest firmshire the better performing executives to maximise firm productivity. Using meta-analysis, Tosi et al. (2000) conclude that firm size accounts for over 40 per centof the variance in executive pay. Conyon and Murphy (2000) using USA andUK data and Kaplan (1994) using Japanese data provide strong evidence infavour of the size hypothesis. First, since firms are not of a uniform size in oursample, we perform our analysis by considering the size-adjusted ROA, SZROA.
Table 5
Results of errors-in-variables regressions with D in CEO cash compensation as the dependent vari-
ablea (n = 4508)
DlnCOMP = b0 + b1 CNSVj + b2 DROA + b2 DMKRET + b3 (CNSVj · DROA) + b4 (CNSVj
· DMKRET) + e1
Details Model 1 Model 2 Model 3 Model 4
Intercept 0.1085 (0.000)*** 0.1106 (0.000)*** 0.1093 (0.000)*** 0.1120 (0.000)***
CNSV1 0.1560 (0.133)
CNSV2 0.2172 (0.045)**
CNSV3 0.2823 (0.007)***
CNSV4 0.3689 (0.001)*
DROA 0.0007 (0.000)*** 0.0014 (0.000)*** 0.0008 (0.000)*** 0.0016 (0.000)***
DMKRET 0.0001 (0.000)*** 0.0001 (0.000)*** 0.0001 (0.000)*** 0.0001 (0.000)***
CNSV1 · DROA 0.0187 (0.000)***
CNSV2 · DROA 0.0234 (0.000)***
CNSV3 · DROA 0.0208 (0.000)***
CNSV4 · DROA 0.0273 (0.000)***
CNSV1 · DMKRET )0.0001 (0.693)CNSV2 · DMKRET 0.0001 (0.477)
CNSV3 · DMKRET )0.0000 (0.905)
CNSV4 · DMKRET 0.0002 (0.298)
Adjusted R2 0.0139 0.0172 0.0149 0.0194
F-statistic 11.53 (0.000)*** 12.83 (0.000)*** 12.09 (0.000)*** 13.80 (0.000)***
ap-Values in parentheses; *, **, *** indicates two-tailed significance at the 0.10, 0.05 and 0.01 levels,
respectively. CNSV1, CNSV2, CNSV3 and CNSV4 are residuals obtained by running firm-specific
regressions from equations (11) through (14) multiplied by )1. DlnCOMP, changes in natural log of
CEO cash compensation, where cash compensation is the sum of CEO salary and bonus; DROA,
changes in return on asset; DMKRET, changes in total return to shareholders, including reinvest-
ment of dividends. All changes are from 1 year to the next.
13 Although we estimated coefficients for all four models in Tables 5 and 6, we only reportthe untabulated results of our sensitivity tests corresponding to model 4 of Table 6 due tospace considerations. All of our sensitivity results are available upon request.
136 R. J. Iyengar, E. M. Zampelli/Accounting and Finance 50 (2010) 121–142
� The AuthorsJournal compilation � 2009 AFAANZ

We find that our main result of a pay-performance sensitivity that increases withconservatism holds in all four cases. Specifically, we find that the estimated coef-ficient on CNSV4 · SZROA is positive and highly significant (coefficient esti-mate = 0.0103; p-value = 0.006).14 We find qualitatively similar evidence usingOLS and EIV estimations.Second, we consider an alternative accounting performance measure to ROA.
Subramaniam (2000) investigates the choice of accounting performance measure(specifically ROA versus ROE) for executive incentive pay. He argues that whilemanagerial opportunism may play a part in choosing ROE for incentive pay, anefficient contracting rationale for choosing ROE method cannot be ruled out.
Table 6
Results of errors-in-variables regressions with D in CEO cash compensation as the dependent
variablea (n = 4508)
DlnCOMP = b0 + b1 CNSVj + b2 ADJROA + b2 ADJMKRET + b3 (CNSVj · ADJROA)
+ b4 (CNSVj · ADJMKRET) + e1
Details Model 1 Model 2 Model 3 Model 4
Intercept 0.0998 (0.000)*** 0.0971 (0.000)*** 0.0994 (0.000)*** 0.0967 (0.000)***
CNSV1 )0.0750 (0.417)
CNSV2 )0.1325 (0.162)
CNSV3 )0.0082 (0.930)
CNSV4 )0.0621 (0.517)
ADJROA 0.003 (0.016)** 0.0004 (0.003)*** 0.0004 (0.007)*** 0.0005 (0.001)***
ADJMKRET 0.0014 (0.000)*** 0.0014 (0.000)*** 0.0014 (0.000)*** 0.0014 (0.000)***
CNSV1 · ADJROA 0.0092 (0.004)***
CNSV2 · ADJROA 0.0103 (0.001)***
CNSV3 · ADJROA 0.0106 (0.001)***
CNSV4 · ADJROA 0.0114 (0.000)***
CNSV1 · ADJMKRET 0.0032 (0.009)
CNSV2 · ADJMKRET 0.0013 (0.294)
CNSV3 · ADJMKRET 0.0028 (0.020)**
CNSV4 · ADJMKRET 0.0009 (0.468)
Adjusted R2 0.0501 0.0491 0.0505 0.0495
F-statistic 47.04 (0.000)*** 46.01 (0.000)*** 47.44 (0.000)*** 46.38 (0.000)***
ap-Values in parentheses; **, *** indicates two-tailed significance at the 0.05 and 0.01 levels, res-
pectively. CNSV1, CNSV2, CNSV3 and CNSV4 are residuals obtained by running firm-specific
regressions from equations (11) through (14) multiplied by )1. DlnCOMP, changes in natural log of
CEO cash compensation, where cash compensation is the sum of CEO salary and bonus; ADJROA,
industry-adjusted (three-digit SIC) return on asset; ADJMKRET, industry-adjusted (three-digit SIC)
1 year total return to shareholders, including reinvestment of dividends. All changes are from 1 year
to the next.
14 We calculate SZROA as the difference between firms’ accounting (market) returns andthe mean accounting (market) returns for all companies within ±20 per cent of the exper-imental firm’s sales for the corresponding year.
R. J. Iyengar, E. M. Zampelli/Accounting and Finance 50 (2010) 121–142 137
� The AuthorsJournal compilation � 2009 AFAANZ

We therefore specifically replace ROA by ROE to investigate whether the sensi-tivity of executive pay to accounting conservatism is affected by the choice ofaccounting performance measure. We find that when firms use ROE, the resultsare no different to those reported in Tables 5 and 6. The estimated coefficienton CNSV4 · DROE is positive and significant (coefficient estimate = 0.0041;p-value = 0.005).Finally, we replace changes in CEO cash compensation by changes in CEO
total compensation. We find markedly similar evidence using OLS and EIV esti-mations. The estimated coefficient on CNSV4 · DROA is positive and significant(coefficient = 0.0371; p-value < 0.001).The hypothesis parameters remain positive and significant throughout all of
these robustness tests thereby supporting our main hypothesis that the sensitivityof executive pay to accounting performance increases in accounting conserva-tism.
7. Summary and discussion
Prior literature has extensively examined the design of executive bonus andperformance plans. Given the importance of conservatism in accounting theoryand literature, it seems critical to examine the relationship between accountingconservatism and executive compensation. Specifically, we test whether or notthere is a link between conservative accounting practices and the sensitivity ofexecutive pay to accounting performance. Our study is based on a large sampleof 4508 observations during the period from 1994 to 2003. Using several accrual-based measures of accounting conservatism as well as alternative measures ofaccounting performance, we estimate econometric models of both cash and totalCEO compensation that incorporate the interaction of accounting conservatismand accounting performance. We report two important findings. First, ourresults indicate that the sensitivity of executive pay to accounting performance ishigher for firms that engage in more conservative accounting practices. Second,the results are robust to a number of alternative specifications and estimationtechniques. These findings strongly support the hypothesis that conservatism, bylimiting earnings management opportunities and improving the reliability ofaccounting performance measures, allows firms to formulate contracts that tieexecutive compensation more closely to accounting performance. Alternatively,these results may be construed as reinforcing the argument that compensationcommittees reward managers for reporting conservative earnings as a way tomitigate the horizon problem.Accounting conservatism, from our perspective, is critical to the alignment of
the interests of managers and shareholders. Conservative accounting practicescan afford firms an opportunity to use incentive pay effectively to increase firmvalue while lowering the probability of managerial opportunism. In its absence,the use of performance incentives in managerial and executive compensation con-tracts is fraught with the risks of managerial opportunism, aggressive accounting,
138 R. J. Iyengar, E. M. Zampelli/Accounting and Finance 50 (2010) 121–142
� The AuthorsJournal compilation � 2009 AFAANZ

the overstatement of the financial performance of firms, and the diminishment ofthe integrity and information content of financial reporting. The results of thispaper together with recent research on the information role of conservatism, e.g.Khan and Watts (2007) and LaFond and Watts (2008), holds an important les-son for the accounting profession especially in light of the current financial crisisthat will no doubt engender an intense scrutiny of accounting methods and prac-tices. The message, especially to the Financial Accounting Standards Board(FASB), is that conservative accounting is an effective response to the informa-tion asymmetry between managers and shareholders, and the subsequent agencycosts. Recent FASB proposal (FAS 157-e) to relax mark-to-market rules forbanks sitting on billions of dollars in toxic assets would allow banks to set theirown values for certain troubled mortgages, corporate loans and consumer loans.This rule change will afford banks greater leeway in determining the market valueof loans and provide them with a powerful incentive to keep the assets directly ontheir books at values far in excess of the fair values. The FASB proposal wouldthus forestall efforts by the United States Department of the Treasury to rid thebanks of those toxic assets and record the loss in the income statement. Suchattempts by the FASB to eliminate accounting conservatism from financialreporting may very well be misguided and in need of re-evaluation.
References
Abdel-khalik, A. R., 1985, The effect of LIFO-switching and firm ownership on execu-tives’ pay, Journal of Accounting Research 23(Autumn), 427–447.
Abdel-khalik, A. R., C. Chi, and D. Ghicas, 1987, Rationality of executive compensationschemes and real accounting changes, Contemporary Accounting Research 4(Fall),32–60.
Ahmed, A. S., B. S. Billings, R. M. Morton, and M. Stanford-Harris, 2002,The role of accounting conservatism in mitigating bondholder-shareholder conflictsover dividend policy and in reducing debt costs, The Accounting Review 77(4),867–890.
Baber, W. R., S. H. Kang, and K. R. Kumar, 1998, Accounting earnings and executivecompensation: the role of earnings persistence, Journal of Accounting and Economics25, 169–193.
Ball, R., and L. Shivakumar, 2005, Earnings quality in UK private firms: comparativeloss recognition timeliness, Journal of Accounting and Economics 39(1), 83–128.
Banker, R. D., and S. M. Datar, 1989, Sensitivity, precision and linear aggregation ofsignals for performance evaluation, Journal of Accounting Research 27(1), 21–39.
Basu, S., 1997, The conservatism principle and asymmetric timeliness of earnings, Journalof Accounting and Economics 24, 3–37.
Beaver, W. H., and S. G. Ryan, 2000, Biases and lags in book value and their effects onthe ability of the book-to-market ratio to predict book return on equity, Journal ofAccounting Research 38(1), 127–148.
Chen, Q., T. Hemmer, and Y. Zhang, 2007, On the relation between conservatism inaccounting standards and incentives for earnings management, Journal of AccountingResearch 45(3), 541–565.
Conyon, M. J., and K. J. Murphy, 2000, The prince and the pauper? CEO pay in the Uni-ted States and United Kingdom, The Economic Journal 110, 640–671.
R. J. Iyengar, E. M. Zampelli/Accounting and Finance 50 (2010) 121–142 139
� The AuthorsJournal compilation � 2009 AFAANZ
Core, J. E., W. R. Guay, and R. E. Verrechia, 2003, Price versus non-price performancemeasures in optimal CEO compensation contracts, The Accounting Review 78(4),957–981.
Dechow, P., M. R. Huson, and R. G. Sloan, 1994, The effect of restructuring charges onexecutives’ cash compensation, The Accounting Review 69(1), 138–56.
Dechow, P., R. G. Sloan, and A. Sweeney, 1995, Detecting earnings management, TheAccounting Review 70(2), 193–225.
Defeo, V. J., R. A. Lambert, and D. F. Larcker, 1989, Executive compensation effects ofequity-for-debt swaps, The Accounting Review 64(2), 210–27.
DeFond, M. I., and J. Jiambalvo, 1994, Debt covenant violation and manipulation ofaccruals, Journal of Accounting and Economics 17, 145–176.
Duru, A. I., R. J. Iyengar, and A. Thevaranjan, 2002, The shielding of CEO compensa-tion from the effects of strategic expenditures, Contemporary Accounting Research19(2), 175–193.
Feltham, G. E., and J. A. Ohlson, 1995, Valuation of clean surplus accounting for operat-ing and financial activities, Contemporary Accounting Research 11(Spring), 689–731.
Feltham, G. E., and J. Xie, 1994, Performance measure congruity and diversity in multi-task principal/agent relations, The Accounting Review 69(3), 429–453.
Frankel, R., M. Johnson, and K. Nelson, 2002, The relation between auditors’ fees fornonaudit services and earnings management, The Accounting Review 71, 106.
Gaver, J. J., and K. M. Gaver, 1998, The relation between nonrecurring accounting trans-actions and CEO cash compensation, The Accounting Review 73(2), 235–253.
Givoly, D., and C. Hayn, 2000, The changing time-series properties of earnings, cashflows, and accruals: has financial reporting become more conservative? Journal ofAccounting and Economics 29, 287–320.
Gjesdal, F., 1999. A steady state growth valuation model: a note on accounting and valu-ation, working paper (Norwegian School of Economics, Bergen, Norway).
Healy, P. M., K. Sok-Hyan, and K. Palepu, 1987, The effect of accounting procedurechanges on CEOs’ cash salary and bonus, Journal of Accounting and Economics 9,7–35.
Holmstrom, B., 1979, Moral Hazard and observability, The Bell Journal of Economics 10,74–91.
Jensen, M. C., and W. Meckling, 1976, Theory of the firm: managerial behavior, agencycosts, and ownership structure, Journal of Financial Economics 3, 305–360.
Jones, J., 1991, Earnings management during import relief investigations, Journal ofAccounting Research 29, 193–228.
Kaplan, S. N., 1994, Top executive rewards and firm performance: a comparison of Japanand the United States, The Political Economy 102, 510–546.
Khan, M., and R. L. Watts, 2009. Estimation and empirical properties of a firm-yearmeasure of accounting conservatism, Journal of Accounting and Economics doi: 10.1016/j.jacceco.2009.08.002.
Kwon, Y. K., 2005, Accounting conservatism and managerial incentives, ManagementScience 51(11), 1626–1632.
LaFond, R., and R. L. Watts, 2008, The information role of conservatism, The Account-ing Review 83(2), 447–478.
Lai, C., and S. L. Taylor, 2008, Estimating and validating a firm-year-specific measure ofconservatism: Australian evidence, Accounting and Finance 48(4), 673–695.
Lambert, R., and D. F. Larcker, 1987, An analysis of the use of accounting and marketmeasures of performance in executive compensation contracts, Journal of AccountingResearch 25 (Supplement), 85–125.
Leone, A. J., J. S. Wu, and J. L. Zimmerman, 2009. Asymmetric sensitivity of CEO cashcompensation to stock returns, Journal of Accounting and Economics (forthcoming).
140 R. J. Iyengar, E. M. Zampelli/Accounting and Finance 50 (2010) 121–142
� The AuthorsJournal compilation � 2009 AFAANZ

Penman, S. H., and X. Zhang, 2002, Accounting conservatism, the quality of earningsand stock returns, The Accounting Review 77(2), 237–264.
Ryan, S. G., 2006, Identifying conditional conservatism, European Accounting Review15(4), 511–525.
Sloan, R. G., 1993, Accounting earnings and top executive compensation, Journal ofAccounting and Economics 16, 55–100.
Smith, C. W., and R. L. Watts, 1982, Incentive and tax effects of executive compensationplans, Australian Journal of Management 7, 139–157.
Subramaniam, C., 2000, Choice of performance measure in a bonus plan: managerialopportunism or efficient contracting? Academy of Accounting and Financial StudiesJournal 4, 19–37.
Tosi, H. L., S. Werner, J. P. Katz, and L. R. Gomez-Mejia, 2000, How much does perfor-mance matter? A meta-analysis of CEO pay studies, Journal of Management 26,301–339.
Watts, R., 2003a, Conservatism in accounting part I: explanations and implications,Accounting Horizons 17, 207–221.
Watts, R., 2003b, Conservatism in accounting part II: evidence and research opportuni-ties, Accounting Horizons 17, 287–301.
Whisenant, S., S. Sankaraguruswamy, and K. Raghunandan, 2003, Evidence on the jointdetermination of audit and non-audit fees, Journal of Accounting Research 41(4),721–744.
Zhang, X., 2000, Conservative accounting and equity valuation, Journal of Accountingand Economics 29, 125–149.
Appendix
Definition of variables
CNSV1, CNSV2, CNSV3, CNSV4 are residuals obtained from the following(respective) firm-specific regressions multiplied by )1.
TAit
Ait�1¼ a0 þ a1
DREVit
Ait�1þ a2
GPPEit
Ait�1þ a3
CFit
Ait�1þ a4DCFit
þ a5 �DCFit �CFit
Ait�1þ eit;
ð11Þ
TAit
Ait�1¼ a0 þ a1
DREVit
Ait�1þ a2
GPPEit
Ait�1þ a3
DCFit
Ait�1þ a4DDCFit
þ a5 �DDCFit �DCFit
Ait�1þ eit;
ð12Þ
TAit
Ait�1¼ a0 þ a1
DREVit � DRECit
Ait�1
� �þ a2
GPPEit
Ait�1þ a3
CFit
Ait�1
þ a4DCFit þ a5 �DCFit �CFit
Ait�1þ eit;
ð13Þ
R. J. Iyengar, E. M. Zampelli/Accounting and Finance 50 (2010) 121–142 141
� The AuthorsJournal compilation � 2009 AFAANZ

TAit
Ait�1¼ a0 þ a1
DREVit � DRECit
Ait�1
� �þ a2
GPPEit
Ait�1þ a3
DCFit
Ait�1
þ a4DDCFit þ a5 �DDCFit �DCFit
Ait�1þ eit;
ð14Þ
where TAit is total accruals for firm i in year t, DREVit is the change in i’s totalrevenue from t ) 1 to t, DRECit is the change in i’s accounts receivable fromt ) 1 to t, GPPEit is the gross acquisition cost of property, plant and equipmentfor firm i in year t, Ait)1 is the value of average total assets for firm i in yeart ) 1, CFit is the level of cash flow for firm i, DCFit is a dummy variable that isequal to 1, if CFit is negative and 0 otherwise, DCFit is the change in the level ofcash flow for firm i and DDCFit is a dummy variable that is equal to 1, if DCFit
is negative and 0 otherwise.DlnCOMP is the changes in natural log of CEO cash compensation, where
cash compensation is the sum of CEO salary and bonus. Changes are from yearto year. DROA is the changes in return on assets where changes are from year toyear. ROA = 100 (IB + XINT (1 ) TR/100) ) TXT)/AT, where IB is Incomebefore extraordinary items and discontinued operations, XINT is interestexpense, TR is the tax rate, TXT is total income tax and AT is total assets.DMKRET is the change in total return to shareholders, including reinvestmentof dividends. ADJROA is the firm’s ROA – industry (three-digit SIC) averageROA. ADJMKRET is the firm’s MKRET – industry (three-digit SIC) averageMKRET.
142 R. J. Iyengar, E. M. Zampelli/Accounting and Finance 50 (2010) 121–142
� The AuthorsJournal compilation � 2009 AFAANZ
Copyright © 2022 FDOKUMEN