ACCOUNTING - tcvscpa
228
Analyzing Financial Statements (AFS4) ACCOUNTING CONTINUING EDUCATION
-
Upload
khangminh22 -
Category
Documents
-
view
1 -
download
0
Transcript of ACCOUNTING - tcvscpa

Analyzing Financial Statements(AFS4)
ACCOUNTINGCONTINUING EDUCATION


Analyzing Financial Statements
(AFS4)
Mark Mishler, CPA, CMA

ANALYZING FINANCIAL STATEMENTS (AFS4) ©2020 Kaplan, Inc. Published in 2020 by Kaplan Financial Education. Printed in the United States of America. All rights reserved. The text of this publication, or any part thereof, may not be translated, reprinted or reproduced in any manner whatsoever, including photocopying and recording, or in any information storage and retrieval system without written permission from the publisher.
ISBN: 978-1-07-880591-9

iii
TABLE OF CONTENTS SECTION 1
Overview ........................................................................................................................................................ 1
Learning Objectives ................................................................................................................................................................................... 1
Objective of Financial Reporting ............................................................................................................................................................. 1
Financial Statement Analysis ................................................................................................................................................................... 5
Users ............................................................................................................................................................................................................. 7
Case 1 – Industry Ratios .......................................................................................................................................................................... 13
Case 1 Solution ......................................................................................................................................................................................... 15
Case 2 – Lowe’s and Home Depot ........................................................................................................................................................ 16
Course Outline .......................................................................................................................................................................................... 18
SECTION 2
Financial Reporting and Financial Statements .............................................................................................. 19
Learning Objectives ................................................................................................................................................................................. 19
Introduction .............................................................................................................................................................................................. 19
Financial Reporting and Financial Statements .................................................................................................................................. 20
Public Company Reporting .................................................................................................................................................................... 25
Non-Public Company Reporting ........................................................................................................................................................... 27
Critical Accounting Policies .................................................................................................................................................................... 28
Note Disclosures....................................................................................................................................................................................... 53
SEC Disclosure Comment Letters ......................................................................................................................................................... 54
SECTION 3
A Closer Look at Financial Statements ......................................................................................................... 59
Learning Objectives ................................................................................................................................................................................. 59
Introduction .............................................................................................................................................................................................. 59
Management Judgment and Its Implications on Financial Reporting .......................................................................................... 62
Accounting Basis ...................................................................................................................................................................................... 67
The Nature of Financial Statements ..................................................................................................................................................... 75
Revenue – New Revenue Recognition Standard .............................................................................................................................. 101
Statement of Cash Flows ...................................................................................................................................................................... 106
SECTION 4
Financial Statement Analysis – Part 1 ......................................................................................................... 119
Learning Objectives ............................................................................................................................................................................... 119
Introduction ............................................................................................................................................................................................ 119
Earnings Quality ..................................................................................................................................................................................... 125
Conventional Analytical Tools ............................................................................................................................................................. 126

iv
Accounting Profit Versus Economic Profit – EVA .............................................................................................................................. 132
Case 3 – Economic Value Added ......................................................................................................................................................... 134
Dashboards – Analytic Tool to Impact Positive Organizational Change ..................................................................................... 136
SECTION 5
Financial Statement Analysis – Part 2 ......................................................................................................... 141
Learning Objectives ............................................................................................................................................................................... 141
Introduction ............................................................................................................................................................................................ 141
Liquidity Ratios ....................................................................................................................................................................................... 143
Efficiency Ratios ..................................................................................................................................................................................... 144
Leverage Ratios ...................................................................................................................................................................................... 148
Profitability Ratios .................................................................................................................................................................................. 150
Cash Flow Ratios .................................................................................................................................................................................... 155
Case 4 – Cash Flows Tell the Real Story ............................................................................................................................................. 157
Case 5 – Reviewing a Small Business Cash Flow Statement.......................................................................................................... 161
Questions for Discussion ...................................................................................................................................................................... 163
Quality of Earnings ................................................................................................................................................................................. 165
Case 6 – Reading a Statement of Cash Flows ................................................................................................................................... 168
Questions for Discussion ...................................................................................................................................................................... 169
Case 7 – Finding the Truth in the Cash Flow Statement ................................................................................................................. 170
Questions for Discussion ...................................................................................................................................................................... 175
Flexibility Ratios ...................................................................................................................................................................................... 176
Use of Industry Data or Peer Group Comparisons ........................................................................................................................... 189
Altman Z-Score – Bankruptcy Prediction .......................................................................................................................................... 191
Case 8 – Financial Statement Analysis ............................................................................................................................................... 194
Appendix ................................................................................................................................................... 209
Case 8: Financial Statement Analysis – Ratio Analysis .................................................................................................................... 209
Case Solutions ............................................................................................................................................ 211
Solution to Case 1 – Industry Ratios ................................................................................................................................................... 211
Solution to Case 3 – Economic Value Added .................................................................................................................................... 213
Solution to Case 5 – Reviewing a Small Business Cash Flow Statement .................................................................................... 214
Solution to Case 6 – Reading a Statement of Cash Flows .............................................................................................................. 216
Solution to Case 7 – Finding the Truth in the Cash Flow Statement ............................................................................................ 217
Solution to Case 8 – Financial Statement Analysis .......................................................................................................................... 218

1
Section
1 Overview
LEARNING OBJECTIVES
After completing this section, participants will be able to accomplish the following:
Describe the different financial statement users and their information needs
For each financial statement, balance sheet, income statement, and cash flow statement, identify characteristics, alternatives, and risks associated with specific financial statement elements
Describe the importance of developing expectations prior to performing financial statement analysis
OBJECTIVE OF FINANCIAL REPORTING
The objective of financial reporting is to provide useful measures and disclosures about an entity’s financial performance and financial condition. Users of financial reports employ financial analytical techniques to assess management’s performance in creating value historically and to forecast future value. From this financial analysis, users of financial reports make operating, investing, and financing decisions.
The Financial Accounting Standards Board (FASB) formally addressed financial reporting as early as 1978 when it published the first of a series of eight concepts statements. Statements of Financial Accounting Concepts’ (SFACs) main purpose is to establish the foundation for the FASB’s financial accounting and reporting guidance development. SFACs are not codified and, thus, are not authoritative GAAP.
A secondary purpose of SFACs is to also enable financial statement users to understand the content and limitations of accounting and financial information they use in performing financial analysis. Together with information from other sources, SFACs serve financial information users by facilitating efficient functioning of capital and other markets which promotes efficient allocation of scarce resources based on users’ financial analysis.

2
Underlying this section is the following Statements of Financial Accounting Concepts as they apply to users of financial reporting.
SFAC No. 8, Conceptual Framework for Financial Reporting, issued in 2010:
Superseded SFAC No. 1, Objectives of Financial Reporting by Business Enterprises, issued in 1978
Superseded SFAC No. 2, Qualitative Characteristics of Accounting Information, issued in 1980
SFAC No. 6, Elements of Financial Statements, issued in 1985:
Superseded SFAC No. 3, Elements of Financial Statements of Business Enterprises, issued in 1980. It expanded the scope to encompass not-for-profit organizations.
Financial statements communicate historical data, which is most useful for current-state compliance purposes, such as filing with providers of debt and equity financing, tax authorities, and other regulatory agencies. It is also useful for assessing management’s performance and compensation awards. While financial reporting tells us “where we’ve been,” users must apply financial analytical techniques to tell us “where we’re going.” As a result, five themes underlie financial statement analysis:
1. The types and uses of financial analysis depend on the user and the decisions the user is making.
2. In most cases, financial statement analysis involves using historical data to assess past performance and to make judgments about future potential performance. SFAC No. 2, Qualitative Characteristics of Accounting Information, shows a decision usefulness diagram and specifies qualitative ingredients that financial and accounting information should possess to be useful for making decisions.

3
Decision usefulness is based on primary qualities of relevance and reliability as well as secondary qualities of comparability and consistency. Financial statement users must assess both these qualities. Following are decision usefulness quality definitions.
Relevance is the capacity of information to make a difference in a decision by helping users to form predictions about the outcomes of past, present and future events or to confirm or correct prior expectations.
Predictive value is the quality of information that helps users to increase the likelihood of correctly forecasting the outcome of past or present events.
Feedback value is the quality of information that enables users to confirm or correct prior expectations.
Timeliness is having information available to a decision maker before it loses its capacity to influence decisions.
A HIERARCHY OF ACCOUNTING QUALITIES
for users (decision makers) of financial information
Pervasive
constraintBenefits > Costs
User‐specific
qualitiesUnderstandability
Decision Usefullness
Primary qualities
Predictive Value Verifiability
Ingredients Feedback Value Neutrality
Timliness Representational
Faithfulness
Secondary qualities Comparability Consistency
Recognition
thresholdMateriality
Relevance Reliability

4
Reliability is the quality of information that assures that information is reasonably free from error and bias and faithfully represents what it purports to represent.
Verifiability is the ability through consensus among measurers to ensure that information represents what it purports to represent or that the chosen method of measurement has been used without error or bias.
Neutrality is the absence in reported information of bias intended to attain a predetermined result or to induce a particular mode of behavior.
Representational faithfulness is correspondence or agreement between a measure or description and the phenomenon that it purports to represent. This is also referred to as validity.
Comparability is the quality of information that enables users to identify similarities in and differences between two sets of economic phenomena.
Consistency is conformity from period to period with unchanging policies and procedures.
CON Statement No. 2 also states that financial reporting should be practical and should show a pervasive constraint that the financial reporting costs should not exceed their benefits. As an example, materiality is shown as a recognition threshold; meaning that if the transaction’s monetary value is too small to impact a decision, then the entity should account for the transaction in the most efficient manner.
3. Financial analysis should incorporate broad sources of financial and non-financial information about an entity. This includes entity-specific financial statements including note disclosures. It also includes non-entity-specific industry, economic, and political environmental information. This information can be critical to understanding an entity’s financial status, business and financial performance, and future prospects.
4. GAAP-(accrual)-based analysis can be prone to distortion due to the uncertainty of estimates and judgments made by management, or changes in accounting standards.
5. As a result of #4, cash-flow-based analysis may be better suited for evaluating a reporting entity’s earnings quality and financial flexibility in dealing with changing business, competitive, and economic conditions or with pursuing new opportunities. While earnings can be manipulated through biased estimates or alternative GAAP applications, cash flow measurements are more difficult for management manipulation.
Users of financial statement information are presumed to have a reasonable understanding of business and economic principles. To effectively analyze financial statement information, users must gain knowledge concerning the company’s industry, past experience, competitors, and financial trends. Financial statement users must also become knowledgeable about changing business, economic, and regulatory conditions or operational changes affecting the entity.

5
External (owners and creditors) and internal (management) financial statement users generally make three types of decisions from their financial analysis:
1. Operating:
Effective asset utilization
Business performance
Profitability
Operating leverage
Liquidity
2. Investing:
Capital budgeting for committing funds to working capital, new plant and equipment, and major strategic initiatives
Disinvestment by disposing of significant assets or withdrawing from markets
3. Financing:
Capital structure
Returns on capital
Types of equity and debt
Risk tolerance
Dividend policy
FINANCIAL STATEMENT ANALYSIS
Financial statement analysis is the method of using analytical techniques applied to an entity’s financial statements – balance sheet, income statement, cash flow statement, and note disclosures. Specifically, these analytical techniques include selecting, evaluating, predicting, and interpreting financial statement data to form a conclusion concerning the entity’s current and future status and performance. These analytical techniques may include the following:
Perform an overall risk assessment (external and internal) of the industry and the entity you are interested in analyzing
Common size analysis (horizontal and vertical)

6
Trend analysis
Comparative or benchmarking analysis (entities and industry)
Ratio analysis (accrual and cash flow)
Forecasting results
Valuation
These analytical techniques permit the analyst to understand the elements of the financial statements and how they relate to each other; recognize the economic strength and weaknesses the entity and/or the industry operates in; and the competitive strength the entity has as it relates to the marketplace. Process steps an analyst may use include the following:
1. Develop an understanding of the industry by reviewing an industry analysis report from a brokerage firm
2. Read recent articles in business publications concerning the industry or entities operating in the industry
3. Identify the entity you are interested in analyzing
4. If a public company, read its Management’s Discussion and Analysis section of its 10K where management provides its explanation of the company’s financial performance, financial condition, and future expectations or strategies
5. Perform common size analysis, trend analysis, comparative analysis, and ratio analysis
6. When performing the analysis above, focus on quality of the entity’s financial statements, profitability, and risk
7. Reach conclusions based on the financial statement analysis performed
8. Prepare forecasted financial statements for at least one year
9. Perform a valuation of the entity
Challenges with Financial Statement Analysis
There are several challenges underlying financial statement analysis that may impact user expectations, conclusions, and decisions:
First, no established methodologies exist that stipulate which ratios, accounting standards, figures, trend length of time, industry or peer comparisons, or benchmarks to use in performing financial statement analysis. Thus, the analyst must exercise significant judgment in determining which ratios/trends matter most and what a high or low metric value may be.
Second, comparability between companies being analyzed and with benchmarks can be muddled because many entities are conglomerates that operate unrelated businesses.

7
Third, additional challenges include companies that are clearly in the same industry and using the same accounting framework may adopt different GAAP accounting principles within that framework. Examples are different inventory methods (LIFO or FIFO), contract accounting (percentage of completion or completed contract), or depreciation methods (straight line or double declining balance).
Lastly, globalization produces other challenges. Financial statements may be prepared under different accounting frameworks, such as GAAP or IFRS that inhibit comparability. Foreign currency exchange rates also may impact comparability both from a revenue and cost perspective and also from a currency translation impact. A multi-national company’s risk management strategy will influence currency hedging which makes comparisons among companies and industries even more difficult.
The remainder of this section identifies users of financial information and includes two cases designed to illustrate the use of expectations when performing financial statement analysis.
USERS
Investors and creditors are the obvious users of financial information. Other stakeholders include employees, the supply chain, competitors, the general public, and governments. Each uses different information and different analytical approaches to meet its decision-making objectives.
Creditors perform financial statement analysis to evaluate new or continuing lending relationships. Emphasis is placed on:
Assess financial risk, or the ability to repay principal and interest as debt becomes due over the loan term
Reliability and stability of cash flows and earnings quality
Monitoring the value of the collateral
Document lending decisions for internal policies and external regulatory compliance
Investors evaluate the attractiveness of investing in equity securities. Emphasis is placed on:
Earnings quality and variability as well as cash flows relative to risk
Dividend payment growth and the potential for stock buy-backs
Equity appreciation potential
Rates of return relative to risk over time
Ownership structures and possible ownership transfers (private companies)
Fair value of the enterprise, assets, and liabilities
Equity metrics, such as earnings multiples

8
Employees broadly include the board of directors, management, non-exempt workers, and unions. Management uses financial data to make short-term and long-term decisions to manage operations and to maximize shareholder value. Employees evaluate job security, potential compensation increases, and whether to remain at a company. Potential employees evaluate whether to join a company. Unions use financial data in their wage and benefits negotiations. Emphasis is placed on:
Providing appropriate strategic, financial, and risk oversight
Analyzing investment proposals’ impact on earnings, cash flows, and business resources
Assessing performance trends and monitoring performance by comparing reported information against budgets or forecasts
Determine strategy and assess strategic performance
The supply chain consists of suppliers and customers. Suppliers assess customer financial health and credit worthiness to determine whether or not to extend credit and, if so, the credit terms. Customers assess whether a supplier will be able to supply products and services reliably so that the entity will be able to serve its customers. This is especially important for purchasing specialized components.
Competitors will assess financial health of other market rivals as a part of its strategic planning and operating tactics and develop strategies to improve their competitiveness.
The general public may be interested in the impact of the entity on the local community for employment, purchasing from other local companies, and civic participation.
Governments are interested in regulatory compliance and tax receipts.
Outside accountants perform analytical procedures to assess risk of financial misstatements and plan the audit. In conducting the audit, auditors evaluate the reasonableness of management assertions, such as historical recorded amounts. This involves analyzing predictive trends and financial data to develop independent expectations for recorded amounts and investigate variances from those expectations.
These areas of emphasis are not mutually exclusive, however. Ultimately, various measures of an entity’s financial history and outlook for the future intertwine over time.
EXAMPLE
A creditor is most concerned with the adequacy of a company’s cash flows to service debt, usually through measures of liquidity and solvency. But the creditor will also analyze profitability, because ultimately, profitability impacts the ability to generate cash. This is why the financial covenants contained in loan agreements often include minimum net income amounts.

9
Expectations
When comparing two entities (companies) in the same industry, analysts will develop certain expectations for financial results and operational outcomes (for those entities) since they are operating in the same economic environment with similar customer bases. Valid comparative examples would include companies such as United Airlines and American Airlines (airline industry) and Verizon Communications, Inc. and Sprint Nextel Corporation (telecommunications industry). These expectations then allow the analyst to more clearly identify differences between the companies and ask appropriate questions concerning unusual or unexpected results.
It is possible that the analyst could develop invalid and/or incorrect expectations if he or she does not fully understand the business or operational activities of the companies being analyzed. For example, it would appear that a comparable company to Coca-Cola would be PepsiCo, but this would not be correct.
Coca-Cola and PepsiCo
Comparing The Coca-Cola Company and PepsiCo, Inc. is imperfect because Coca-Cola is a pure beverage company; whereas, PepsiCo is a beverage and snack food company. Some comparisons may exist with segment reporting (ASC 280); however, segment reporting has many limitations regarding costs, allocations, assets, and liabilities.
EXAMPLE
Source: The Coca Cola Company 2018 10K
General
The Coca-Cola Company is the world’s largest nonalcoholic beverage company. We own or license and market more than 500 nonalcoholic beverage brands, which we group into the following category clusters: sparkling soft drinks; water, enhanced water and sports drinks; juice, dairy and plant-based beverages; tea and coffee; and energy drinks. We own and market four of the world’s top five nonalcoholic sparkling soft drink brands: Coca-Cola, Diet Coke, Fanta and Sprite. Finished beverage products bearing our trademarks, sold in the United States since 1886, are now sold in more than 200 countries and territories.
We make our branded beverage products available to consumers throughout the world through our network of independent bottling partners, distributors, wholesalers and retailers as well as Company-owned or -controlled bottling and distribution operations — the world’s largest beverage distribution system. Beverages bearing trademarks owned by or licensed to us account for more than 1.9 billion of the approximately 61 billion servings of all beverages consumed worldwide every day.
We believe our success depends on our ability to connect with consumers by providing them with a wide variety of beverage options to meet their desires, needs and lifestyles. Our success further depends on the ability of our people to execute effectively, every day.
Our objective is to use our Company’s assets — our brands, financial strength, unrivaled distribution system, global reach, and the talent and strong commitment of our management and associates — to become more competitive and to accelerate growth in a manner that creates value for our shareowners.
We were incorporated in September 1919 under the laws of the State of Delaware and succeeded to the business of a Georgia corporation with the same name that had been organized in 1892.

10
Operating Segments
The Company’s operating structure is the basis for our internal financial reporting. As of December 31, 2018, our operating structure included the following operating segments, which are sometimes referred to as “operating groups” or “groups”:
Europe, Middle East and Africa
Latin America
North America
Asia Pacific
Bottling Investments
Our operating structure as of December 31, 2018 also included Corporate, which consists of two components: (1) a center focused on strategic initiatives, policy and governance and (2) an enabling services organization focused on both simplifying and standardizing key transactional processes and providing support to business units through global centers of excellence.
In January 2019, we established a new operating segment, Global Ventures, which includes the results of Costa Limited (“Costa”), which we acquired on January 3, 2019, and the results of our innocent and Doğadan businesses as well as fees earned pursuant to distribution coordination agreements between the Company and Monster Beverage Corporation (“Monster”). Refer to Note 22 of Notes to Consolidated Financial Statements set forth in Part II, “Item 8. Financial Statements and Supplementary Data” of this report for information regarding the Costa acquisition.
Except to the extent that differences among operating segments are material to an understanding of our business taken as a whole, the description of our business in this report is presented on a consolidated basis.
EXAMPLE
Source: PepsiCo 2018 10K
Company Overview
We were incorporated in Delaware in 1919 and reincorporated in North Carolina in 1986. We are a leading global food and beverage company with a complementary portfolio of brands, including Frito-Lay, Gatorade, Pepsi-Cola, Quaker and Tropicana. Through our operations, authorized bottlers, contract manufacturers and other third parties, we make, market, distribute and sell a wide variety of convenient beverages, foods and snacks, serving customers and consumers in more than 200 countries and territories.
Our Operations
We are organized into six reportable segments (also referred to as divisions), as follows:
1) Frito-Lay North America (FLNA), which includes our branded food and snack businesses in the United States and Canada;
2) Quaker Foods North America (QFNA), which includes our cereal, rice, pasta and other branded food businesses in the United States and Canada;
3) North America Beverages (NAB), which includes our beverage businesses in the United States and Canada;
11
4) Latin America, which includes all of our beverage, food and snack businesses in Latin America;
5) Europe Sub-Saharan Africa (ESSA), which includes all of our beverage, food and snack businesses in Europe and Sub-Saharan Africa; and
6) Asia, Middle East and North Africa (AMENA), which includes all of our beverage, food and snack
As a result of the above examples, it is obvious that comparing two companies that operate unrelated businesses is difficult and in some cases, due to the availability of meaningful comparable data, impossible. While Coca-Cola and Pepsi appear to be comparable entities because they compete against each other in the beverage marketplace, the existence of Pepsi’s food and snack business makes Pepsi a much different company than Coca-Cola.
So the challenge when performing financial statement analysis is to identify comparable entities, of about the same size and operations, in order to compare “apples and oranges.” The use of available objective industry data is also helpful for the analyst when performing financial statement analysis.
As we shall see later in this section, we believe that the development of expectations prior to performing analysis is critical to developing an overall understanding of the status and performance of an entity. At times though, the analyst can develop expectations that are not supported by the facts (similar to Coca-Cola vs. Pepsi being comparable). For example, the expectation that McDonald’s is a fast food restaurant chain.
EXAMPLE
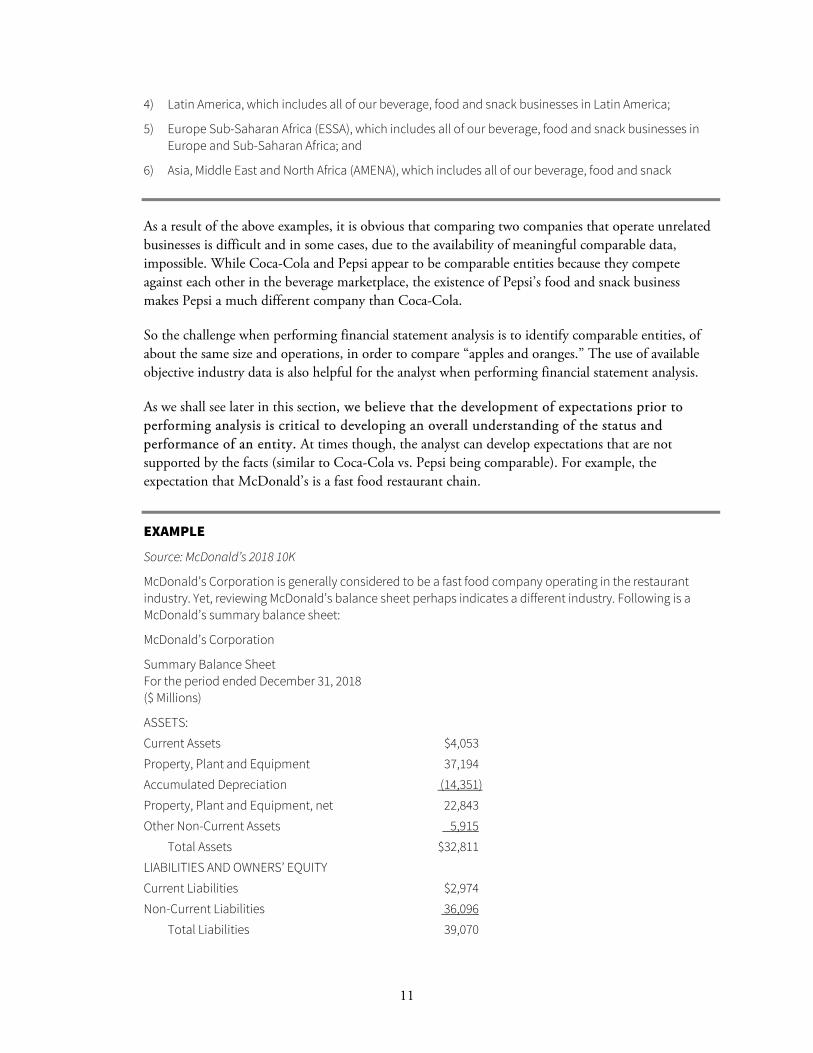
Source: McDonald’s 2018 10K
McDonald’s Corporation is generally considered to be a fast food company operating in the restaurant industry. Yet, reviewing McDonald’s balance sheet perhaps indicates a different industry. Following is a McDonald’s summary balance sheet:
McDonald’s Corporation
Summary Balance Sheet For the period ended December 31, 2018 ($ Millions)
ASSETS:
Current Assets $4,053
Property, Plant and Equipment 37,194
Accumulated Depreciation (14,351)
Property, Plant and Equipment, net 22,843
Other Non-Current Assets 5,915
Total Assets $32,811
LIABILITIES AND OWNERS’ EQUITY
Current Liabilities $2,974
Non-Current Liabilities 36,096
Total Liabilities 39,070

12
Total Stockholders’ Equity ( 6,259)
Total Liabilities and Shareholders’ Equity $32,811
Analyzing McDonald’s balance sheet shows that its largest asset is property, plant, & equipment. PP&E comprises 70% of total assets on a net basis and over 100% of total assets on a gross basis. Thus, McDonald’s balance sheet may indicate it is primarily a real estate company that happens to serve fast food!

13
CASE 1 – INDUSTRY RATIOS
This case extends our discussion of expectations. Entities in certain industries will have financial statement amounts and related ratios that represent the operating characteristics of the industry. For example, a school system or municipal government would not expect to have much inventory and would not present net income as a performance metric. This case presents selected financial statement line items and their amounts and selected related ratios for 10 different industries, all publicly-held information.
Your goal is to review these amounts and ratios and identify which column represents which industry. The purpose of the case is to demonstrate that you can begin your investigation of an entity with certain financial statement expectations in many cases. The industries represented by the columns below, in alphabetical order, are as follows:
Airlines
Auto manufacturer
Banking
Department store
Hyper market
Hotel management company
Oil and gas
Pharmaceutical
Restaurant chain
Telecom

14
1 2 3 4 5 6 7 8 9 10
Balances (millions)
Current Assets 11,990$ 5,247$ 361,164$ 115,902$ 7,844$ 2,747$ 24,766$ 79,146$ 47,134$ 2,507$
Receivables ‐$ 378$ 956,185$ 10,599$ 2,377$ 1,991$ 6,873$ 16,522$ 25,597$ 400$
Inventories 8,309$ 3,795$ ‐$ 10,277$ 1,330$ ‐$ 5,096$ ‐ 17,000$ 13$
Current Liabilities 12,708$ 2,974$ 1,474,541$ 94,600$ 18,573$ 6,010$ 18,614$ 81,389$ 57,771$ 1,512$
P,P&E 24,658$ 8,103$ 8,333$ 35,327$ 26,563$ 1,793$ 12,439$ 125,222$ 252,630$ 1,697$
Total Assets 37,431$ 13,574$ 1,930,115$ 99,000$ 38,641$ 5,936$ 87,872$ 444,097$ 348,691$ 5,311$
Long‐Term Debt 11,031$ 2,795$ 255,077$ 15,931$ 6,592$ 7,840$ 21,353$ 125,972$ 24,406$ 9,429$
Other Non‐Current Lia 1,860$ 2,628$ ‐$ 128,192$ 14,200$ 6,400$ 13,400$ 94,729$ 72,014$ 704$
Revenue 69,495$ 18,686$ 84,000$ 145,653$ 41,244$ 5,029$ 40,122$ 160,546$ 237,162$ 5,878$
Cost of Sales 48,872$ 11,944$ ‐$ 131,332$ 16,647$ ‐$ 12,775$ 77,379$ 162,000$ 3,300$
S,G & A Exp 13,356$ 4,435$ 41,000$ 11,527$ 17,067$ 894$ 9,830$ 34,917$ 10,956$ 999$
R&D ‐$ ‐$ ‐$ ‐$ ‐$ ‐$ 10,208$ ‐ ‐ ‐
Gross Profit 20,623$ 6,742$ ‐$ 14,321$ 24,597$ ‐$ 27,347$ 83,167$ 75,162$ 2,578$
Net Income 2,737$ 556$ 20,373$ 7,259$ 3,577$ 1,372$ 2,418$ 29,847$ 19,710$ 1,340$
Ratios
Current Ratio 94% 176% 24% 123% 42% 46% 133% 97% 82% 166%
AR Turnover ‐ 53 0.09 13.49 18.75 2.74 5.77 9.67 10.09 15.27
Num Days Sales in AR ‐ 7 4,029 27 19 132 63 37 36 24
Inventory Turnover 5.78 3 ‐ 13.68 14.93 ‐ 2.56 ‐ 10.13 132
Num Days Sales in Inv 62.24 118 ‐ 26.31 24.11 ‐ 142.31 ‐ 35.56 3
AP Turnover 6.66 9 ‐ 6.05 5.33 ‐ 4.32 2.34 4.70 3.51
Num Days Sales in AP 54.07 42 ‐ 59.48 67.54 ‐ 84.41 153.53 76.67 102.55
LT Debt to Total Assets 37% 21% 13% 16% 17% 132% 24% 28% 7% 178%
LT Debt to Equity 126% 54% 127% 46% 47% 210% 23% 89% 13% ‐149%
Cos to Revenue 70% 64% ‐ 90% 40% ‐ 32% 48% 68% 56%
Gross Profit Margin 30% 36% ‐ 10% 60% ‐ 68% 52% 32% 44%
Net Profit Margin 4% 3% 24% 5% 9% 27% 6% 19% 8% 23%
Oper Exp to Revenue 19% 24% 62% 14% 41% 18% 25% 22% 5% 17%
Return on Assets 10% 4% 1% 3% 9% 21% 3% 7% 6% 25%
**** Schedule excludes from total/average assets ‐ intangibles.

15
CASE 1 SOLUTION

16
CASE 2 – LOWE’S AND HOME DEPOT
In this case, we are again focusing on expectations. Since Home Depot and Lowe’s compete directly for customers and sales against each other, the expectation should be that their financial relationships and ratios are very similar. As you can see from the information below, though, Home Depot’s and Lowe’s performance measurements are not all that consistent. For example, looking at comparable valuations from Morningstar as of 9/24/2019, we find the following:
Home Depot Lowe’s
Price/Earnings 22.45 34.06
Price/Book Value 162.63 32.16
Price/Sales 2.29 1.22
Price/Cash Flow 18.48 21.97
Divided Yield Market Cap
2.27 247,811B
1.81 85.31B
So the question is, why are Home Depot’s and Lowe’s performance so inconsistent as compared with each other?
The answer has to do with information other than accounting outcomes. For example:
40% of Home Depot’s sales are to professional contractors while Lowe’s are 30%. Professional contractors are a greater income source than do-it-yourself homeowners.
Home Depot and Lowe’s cater to a different type of customer – HD overwhelming male/Lowe’s majority female.
Home Depot has opened stores in China; Lowe’s has not.
Home Depot is much larger than Lowe’s – better market penetration.
Sales per square foot of space is considerably higher for Home Depot.
Home Depot does a much better job managing its inventory than Lowe’s.
Investment in online operations – Home Depot sales online are about 7% of sales while Lowe’s is at 3.5%.
The above, and the performance metrics below, might conclude that Home Depot has superior management over Lowe’s. This case demonstrates the importance of understanding the industry and the operating characteristics of companies being analyzed in addition to the financial analysis results. In other words, why are the performance metrics of one company better than another company?

17
Balances (Millions) Home Depot Lowe's
2/3/2019 1/18/2018 2/1/2019 2/2/2018
Current Assets $ 18,529 $ 18,933 $ 14,228 $ 12,772
Receivables $ 1,936 $ 1,952 $ 938 $ 689
Inventories $ 13,925 $ 12,748 $ 12,561 $ 11,393
Accounts Payable $ 7,755 $ 7,244 $ 8,279 $ 6,590
Current Liabilities $ 16,716 $ 16,194 $ 14,497 $ 12,096
P, P & E $ 22,375 $ 22,075 $ 18,432 $ 19,721
Total Assets $ 44,003 $ 44,529 $ 34,508 $ 35,291
Long‐Term Debt $ 26,807 $ 24,267 $ 14,391 $ 15,564
Other Non‐Current Liabilities $ 2,358 $ 2,614 $ 1,976 $ 1,758
Treasury Stock $ 58,196 $ (48,196) ‐ ‐
Stockholders' Equity $ (1,878) $ 1,454 $ 3,644 $ 5,873
Revenue $ 108,203 $ 100,904 $ 71,309 $ 68,619
Cost of Sales $ 71,043 $ 66,548 $ 48,401 $ 46,185
Gross Profit $ 37,160 $ 34,356 $ 22,908 $ 22,434
Depreciation & Amort $ 1,870 $ 1,811 $ 1,477 $ 1,404
S, G & A Exp $ 19,513 $ 17,864 $ 17,413 $ 14,444
Net income $ 11,121 $ 8,630 $ 2,314 $ 3,447
Operating Cash Flow $ 13,038 $ 12,031 $ 6,193 $ 5,065
Ratios Home Depot Lowe's
2/3/2019 1/18/2018 2/1/2019 2/2/2018
Current Ratio 1.11 1.17 0.98 1.06
AR Turnover 55.7 50.7 88 87
Number of Days Sales in AR 6.5 7.1 4 4.1
Inventory Turnover 5.3 5.3 3.94 3.9
Number of Days Sales in Inv 68 68 91 92
AP Turnover 9.47 9.34 6.51 6.97
Number of Days Sales in AP 38.01 38.5 55 52
LT Debt to Total Assets 0.61 0.54 0.42 0.44
LT Debt to Equity ~~~ 16.69 3.94 2.65
COS to Revenue 0.66 0.66 0.68 0.67
Gross Profit Margin 0.34 0.34 0.32 0.33
Net Profit Margin 0.10 0.09 0.032 0.05
Oper Exp to Sales 0.18 0.18 0.24 0.21
Return on Assets 0.25 0.20 0.067 0.10
Quality of Earnings 1.03 1.13 1.63 1.03
Comparable Store Sales 5.20% 6.80% 2.40% 4%
Sales per Square Foot 447 417 336 320
Market Cap @ 9/30/2019 247.89B 202B 85.31B 71B

18
COURSE OUTLINE
Section 1 – Overview
Section 2 – Financial Reporting and Financial Statements
Section 3 – A Closer Look at Financial Statements
Section 4 – Financial Statement Analysis – Part 1
Section 5 – Financial Statement Analysis – Part 2

19
Section
2 Financial Reporting and
Financial Statements LEARNING OBJECTIVES
After completing this section, participants will be able to accomplish the following:
Describe the reporting differences between public company and non-public company financial reporting processes
INTRODUCTION
The purpose of this section is to emphasize the importance of understanding financial reporting and financial statements in order to perform effective financial statement analysis. Many investors and analysts apply certain ratios or trends to financial information without a thorough understanding of the company, its products or services, its corporate strategies, its competition or the industry it operates in.
We believe that by understanding the financial reporting processes and the financial statements and notes within the financial reporting processes, investors and analysts can obtain a more complete evaluation of a company and can better predict the future outcomes of the organization.
This section is organized as follows:
Financial Reporting and Financial Statements
Public Company Reporting Including MD&A
Non-Public Company Reporting
Critical Accounting Policies

20
Note Disclosures
SEC Disclosure Comment Letters
FINANCIAL REPORTING AND FINANCIAL STATEMENTS
Financial reporting is a broad concept including public communications to investors, owners, management, third parties, and regulatory agencies. These communications can take many forms but generally they consist of the following:
Annual and quarterly reports to shareholders including Management’s Discussion and Analysis (MD&A)
Press releases including 8-K filings
Management conference calls to interested parties
Non-GAAP performance measurements and key performance indicators (KPIs)
Reports to regulatory agencies such as the Department of Labor or the Securities and Exchange Commission
Reports to third parties such as banks or not-for-profit funding organizations such as the United Way
Financial information placed on the company’s website
Financial statements including the balance sheet, income statement, cash flow statement, and for public entities, a statement of stockholders’ equity
This program will focus primarily on annual reports to shareholders, MD&A, and financial statements.
Financial statements as indicated above consist of the following:
Statement of financial condition or balance sheet
Income or comprehensive income statement
Statement of cash flows
Statement of stockholders’ equity (deficit) for public companies
These financial statements are normally presented with note disclosures, including accounting policy notes, providing additional information concerning the elements of the financial statements. These note disclosures are integral to understanding the financial statements and should be considered by any investor or analyst when performing financial statement analysis.

21
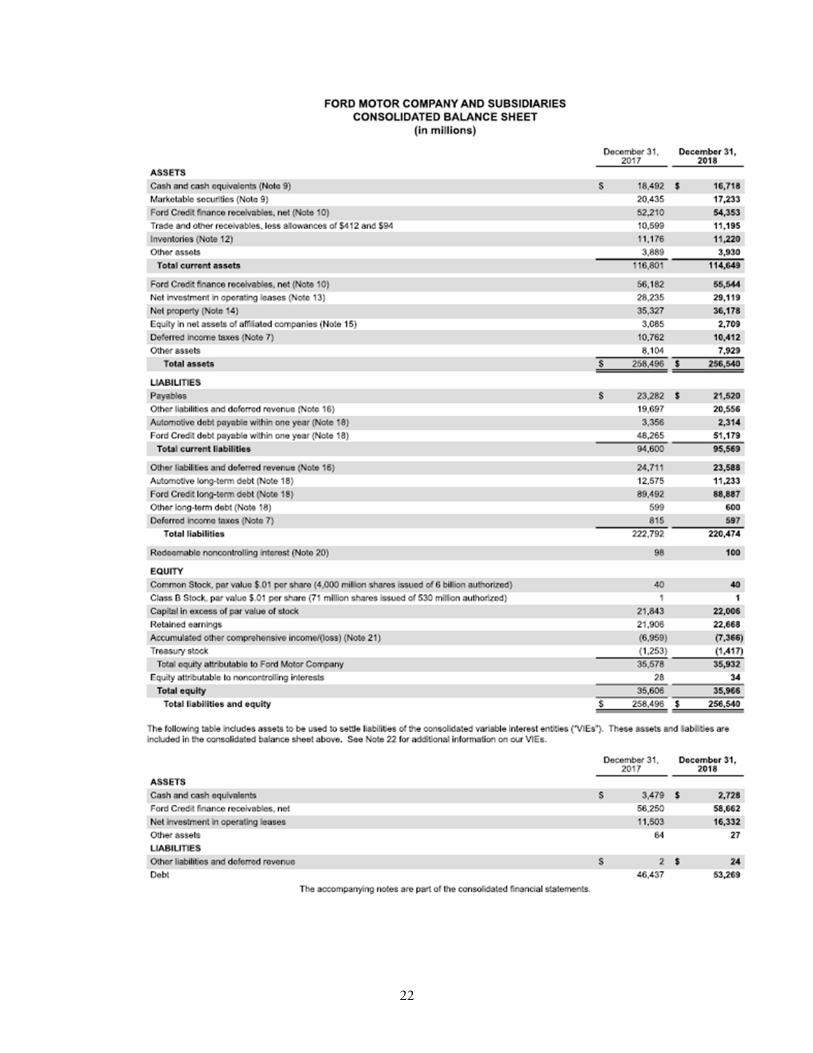
Below are the published financial statements of Ford Motor Company. Note the detailed information provided in the five financial statements.
EXAMPLES
22

23

24

25
PUBLIC COMPANY REPORTING
Periodic Reporting Requirements
Once securities are registered with the SEC, the issuer is required to comply with the reporting requirements of The Securities Exchange Act of 1934. One of these reporting requirements is that a domestic public corporation must prepare its financial statements based on Generally Accepted Accounting Principles (GAAP) as established by the Financial Accounting Standards Board (FASB). Complying with the SEC’s periodic reporting requirements are accomplished by filing the following forms with the SEC:
Form 8-K – Current Report
Form 10-K – Annual Report
Form 10-Q – Quarterly Report
Form 8-K is required to be filed upon the occurrence of an unscheduled material event or change at a company that is important to the stockholders and the SEC. The form is required to be filed within 4 business days after the occurrence of the event. The list of events required to be reported is extensive. Below are some examples of these events:
Filing for bankruptcy or receivership
Completion of the acquisition or disposition of significant amounts of assets
Any creation of a material direct financial obligation or a material obligation under an off-balance sheet arrangement
Triggering events that accelerate or increase a direct financial obligation or an obligation under an off-balance sheet arrangement
Material impairment of assets discovered during the fiscal year
Non-reliance on previously issued financial statements or a related audit report or completed interim review due to a material error
Change in control of the registrant
Financial statements necessary to comply with the above events
Form 10-K represents the annual report to shareholders and the SEC. Form 10-K is a comprehensive summary report of both financial and non-financial performance of a public company including its audited financial statements. Form 10-K must be filed with the SEC within 60 days of a company’s year-end. These annual reports are required to also be posted on the company’s website.

26
Form 10-K’s content is specified by SEC Regulations S-K and S-X. Regulation S-K includes requirements for filing Form 10-K including information related to the entity’s business, securities, management and financial information. Regulation S-X provides requirements for the form and content of financial reports such as audited financial statements included in the Form 10-K filing. Information required by Form S-X includes qualifications and reports of accountants, general instructions as to financial statements, financial statements of smaller reporting companies, and pro forma financial information.
As required by Forms S-K and S-X, Form 10-K includes the following information:
1. Business, risk factors and any unresolved SEC staff comments
2. Properties
3. Legal proceedings
4. Mine safety disclosures
5. Market for registrant’s common equity, related stockholder matters and issuer purchases ofequity securities
6. Selected financial data
7. Management’s discussion and analysis of financial condition and results of operations andquantitative and qualitative disclosures about market risk
8. Financial statements and supplemental data
9. Changes in and disagreements with accountants on accounting and financial disclosure, controlsand procedures, and other Form 8-K information not previously reported
10. Directors, executive officers, and corporate governance
11. Executive compensation
12. Security ownership of certain beneficial owners and management and related stockholder matters
13. Certain relationships and related transactions, and director independence
14. Principal accounting fees and services
Exhibits, other financial statement schedules
Form 10-Q represents quarterly financial reports to shareholders and the SEC. Filings are made for the first, second, and third quarters of the year with the fourth quarter included in the annual Form 10-K filing. Form 10-Q provides unaudited financial information and related disclosures. As with Form 10-K filings, Form 10-Q’s content is specified by SEC Regulations S-K and S-X.
15.

27
As required by Forms S-K and S-X, Form 10-Q includes the following information:
Part 1 – Financial Information:
1. Financial statements
2. Management’s discussion and analysis of financial condition and results of operations
3. Quantitative and qualitative disclosures about market risk
4. Controls and procedures
Part 2 – Other Information:
1. Legal proceedings and risk factors
2. Unregistered sales of equity securities and use of proceeds
3. Defaults upon senior securities
4. Mine safety disclosures
5. Other Form 8-K information not previously reported
6. Exhibits
As you can see, filings with the SEC include a significant amount of both financial and non-financial information that can be useful when analyzing financial information of a public company.
NON-PUBLIC COMPANY REPORTING
A non-public or private company’s reporting requirements are determined by the needs of management, requirements of a third party, and/or the basis of accounting followed by the company to prepare its financial statements. Bases of accounting acceptable for a non-public company to use to prepare its financial statements include:
GAAP
Income tax basis
Cash basis
Contractual basis
Financial reporting framework for small- and medium-sized businesses (FRF for SMEs)
IFRS for Small- and Medium-Sized Businesses

28
These bases of accounting would require full disclosure financial statements if the financial statements are audited or reviewed. Non-disclosure financial statements are permitted if the financial statements are compiled or if management had no need for full disclosure financial statements used for internal purposes only.
As you might expect, the financial statement outcomes of these various bases of accounting will be different for assets, liabilities, revenue and expense accounts and the investor or analyst will need to determine the reporting basis of the company being analyzed, and for comparative purposes, make sure the comparable entities are following the same bases of accounting.
CRITICAL ACCOUNTING POLICIES
Many bases of accounting require that an accounting policy note be included as the first note disclosure in full disclosure financial statements. Using U.S. GAAP as the example, ASC 235, Notes to Financial Statements, requires a company’s significant accounting policies to be disclosed. This disclosure should be labeled “Summary of Significant Accounting Policies” and it should identify and describe the accounting principles followed by the reporting entity and the methods of applying those principles that materially affect the determination of financial position, cash flows, and the results of operations.
As noted in ASC 235, in general, the policy disclosure should encompass important judgments as to appropriateness of principles relating to recognition of revenue and allocation of asset costs to current and future periods. In particular, the policy note should include those accounting principles and methods that involve any of the following:
A selection from existing GAAP alternatives (LIFO/FIFO for example)
Principles and methods particular to the industry in which the reporting entity operates
Unusual or innovative applications of GAAP
While this policy note guidance is important to determine what information to include in a policy note, FASB in recent years has required additional information to be included in a policy note based on the issuance of an Accounting Standards Update. As a result, there are now over 120 possible topics that may be included in an accounting policy note and it is important for an investor or analyst to be familiar with the information contained in a reporting entity’s policy note in order to perform an effective financial statement analysis.
The following is a list of significant accounting policies, with selected examples, that are frequently included in a public company’s accounting policy note:
Principles of Consolidation and Basis of Presentation

29
EXAMPLE
Where we hold current or potential rights that give us the power to direct the activities of a VIE that most significantly impact the VIE’s economic performance, combined with a variable interest that gives us the right to receive potentially significant benefits or the obligation to absorb potentially significant losses, we have a controlling financial interest in that VIE. Rights held by others to remove the party with power over the VIE are not considered unless one party can exercise those rights unilaterally. When changes occur to the design of an entity, we reconsider whether it is subject to the VIE model. We continuously evaluate whether we have a controlling financial interest in a VIE.
We hold a controlling financial interest in other entities where we currently hold, directly or indirectly, more than 50% of the voting rights or where we exercise control through substantive participating rights or as a general partner. Where we are a general partner, we consider substantive removal rights held by other partners in determining if we hold a controlling financial interest. We reevaluate whether we have a controlling financial interest in these entities when our voting or substantive participating rights change.
Associated companies are unconsolidated VIEs and other entities in which we do not have a controlling financial interest, but over which we have significant influence, most often because we hold a voting interest of 20% to 50%. Associated companies are accounted for as equity method investments. Our share of the results of associated companies are presented on a one-line basis. Investments in, and advances to, associated companies are presented on a one-line basis in the caption “All other assets” in our Statement of Financial Position, net of allowance for losses, which represents our best estimate of probable losses inherent in such assets.
Acquisitions or Dispositions
Estimates and Assumptions
EXAMPLE
Preparing financial statements requires management to make estimates and assumptions that affect the reported amounts of assets, liabilities, revenue, and expenses. Examples of estimates include: loss contingencies; product warranties; the fair value of and/or potential impairment of goodwill and intangible assets for our reporting units; product life cycles; useful lives of our tangible and intangible assets; allowances for doubtful accounts; allowances for product returns; the market value of, and demand for, our inventory; and stock-based compensation forfeiture rates. Examples of assumptions include: the elements comprising a software arrangement, including the distinction between upgrades or enhancements and new products; when technological feasibility is achieved for our products; the potential outcome of future tax consequences of events that have been recognized on our consolidated financial statements or tax returns; and determining when investment impairments are other-than-temporary. Actual results and outcomes may differ from management’s estimates and assumptions.
Businesses and Assets Held for Sale

30
EXAMPLE
Businesses and assets held for sale represent components that meet accounting requirements to be classified as held for sale and are presented as single asset and liability amounts in our financial statements with a valuation allowance, if necessary, to recognize the net carrying amount at the lower of cost or fair value, less cost to sell. Financing receivables that no longer qualify to be presented as held for investment must be classified as assets held for sale and recognized in our financial statements at the lower of cost or fair value, less cost to sell, with that amount representing a new cost basis at the date of transfer.
The determination of fair value for businesses and assets held for sale involves significant judgments and assumptions. Development of estimates of fair values in this circumstance is complex and is dependent upon, among other factors, the nature of the potential sales transaction (for example, asset sale versus sale of legal entity), composition of assets and/or businesses in the disposal group, the comparability of the disposal group to market transactions, negotiations with third party purchasers, etc. Such factors bear directly on the range of potential fair values and the selection of the best estimates. Key assumptions were developed based on market observable data and, in the absence of such data, internal information that is consistent with what market participants would use in a hypothetical transaction.
We review all businesses and assets held for sale each reporting period to determine whether the existing carrying amounts are fully recoverable in comparison to estimated fair values.
Revenue Recognition
EXAMPLE
NOTE 5. REVENUE RECOGNITION
As of January 1, 2018, we adopted ASC 606. With our adoption of ASC 606, we made a policy election to record certain regulatory fees, primarily Universal Service Fund (USF) fees, on a net basis. We report our revenues net of sales taxes.
When implementing ASC 606, we utilized the practical expedient allowing us to reflect the aggregate effect of all contract modifications occurring before the beginning of the earliest period presented when allocating the transaction price to performance obligations.
Wireless, Advanced Data, Legacy Voice & Data Services and Equipment Revenue
We offer service-only contracts and contracts that bundle equipment used to access the services and/or with other service offerings. Some contracts have fixed terms and others are cancellable on a short-term basis (i.e., month-to-month arrangements).
Examples of service revenues include wireless, video entertainment (e.g., AT&T U-verse and DIRECTV), strategic voice and data (e.g., traditional local and long-distance). These services represent a series of distinct services that is considered a separate performance obligation. Service revenue is recognized when services are provided, based upon either usage (e.g., minutes of traffic/bytes of data processed) or period of time (e.g., monthly service fees).
Some of our services require customer premises equipment that, when combined and integrated with AT&T's specific network infrastructure, facilitate the delivery of service to the customer. In evaluating whether the equipment is a separate performance obligation, we consider the customer's ability to benefit from the equipment on its own or together with other readily available resources and if so, whether the service and equipment are separately identifiable (i.e., is the service highly dependent on, or highly
31
interrelated with the equipment). When the equipment does not meet the criteria to be a distinct performance obligation (e.g., equipment associated with certain video services), we allocate the total transaction price to the related service. When equipment is a distinct performance obligation, we record the sale of equipment when title has passed and the products are accepted by the customer. For devices sold through indirect channels (e.g., national dealers), revenue is recognized when the dealer accepts the device, not upon activation.
Our equipment and service revenues are predominantly recognized on a gross basis, as most of our services do not involve a third party and we typically control the equipment that is sold to our customers.
Revenue recognized from fixed term contracts that bundle services and/or equipment is allocated based on the standalone selling price of all required performance obligations of the contract (i.e., each item included in the bundle). Promotional discounts are attributed to each required component of the arrangement, resulting in recognition over the contract term. Standalone selling prices are determined by assessing prices paid for service only contracts (e.g., arrangements where customers bring their own devices) and standalone device pricing.
We offer the majority of our customers the option to purchase certain wireless devices in installments over a specified period of time, and, in many cases, they may be eligible to trade in the original equipment for a new device and have the remaining unpaid balance paid or settled. For customers that elect these equipment installment payment programs, at the point of sale, we recognize revenue for the entire amount of revenue allocated to the customer receivable net of fair value of the trade-in right guarantee . The difference between the revenue recognized and the consideration received is recorded as a note receivable when the devices are not discounted and our right to consideration is unconditional. When installment sales include promotional discounts (e.g., "buy one get one free"), the difference between revenue recognized and consideration received is recorded as a contract asset to be amortized over the contract term.
Less commonly, we offer certain customers highly discounted devices when they enter into a minimum service agreement term. For these contracts, we recognize equipment revenue at the point of sale based on a standalone selling price allocation. The difference between the revenue recognized and the cash received is recorded as a contract asset that will amortize over the contract term.
Our contracts allow for customers to frequently modify their arrangement, without incurring penalties in many cases. When a contract is modified, we evaluate the change in scope or price of the contract to determine if the modification should be treated as a new contract or if it should be considered a change of the existing contract. We generally do not have significant impacts from contract modifications.
Revenues from transactions between us and our customers are recorded net of revenue-based regulatory fees and taxes. Cash incentives given to customers are recorded as a reduction of revenue. Nonrefundable, upfront service activation and setup fees associated with service arrangements are deferred and recognized over the associated service contract period or customer life.
Subscription Revenue
Subscription revenues from cable networks and premium pay and basic-tier television services are recognized over the license period as programming is provided to affiliates or digital distributors based on negotiated contractual programming rates. When a distribution contract with an affiliate has expired and a new distribution contract has not been executed, revenues are based on estimated rates, giving consideration to factors including the previous contractual rates, inflation, current payments by the affiliate and the status of the negotiations on a new contract. When the new distribution contract terms are finalized, an adjustment to revenue is recorded, if necessary, to reflect the new terms.
Subscription revenues from end-user subscribers are recognized when services are provided, based upon either usage or period of time. Subscription revenues from OTT services are recognized as programming services are provided to customers.

32
Content Revenue
Feature films typically are produced or acquired for initial exhibition in theaters, followed by distribution, generally commencing within three years of such initial exhibition. Revenues from film rentals by theaters are recognized as the films are exhibited.
Television programs and series are initially produced for broadcast and may be subsequently licensed or sold in physical format and/or electronic delivery. Revenues from the distribution of television programming through broadcast networks, cable networks, first-run syndication and OTT services are recognized when the programs or series are available to the licensee. In certain circumstances, pursuant to the terms of the applicable contractual arrangements, the availability dates granted to customers may precede the date in which the customer can be billed for these sales.
Revenues from sales of feature films and television programming in physical format are recognized at the later of the delivery date or the date when made widely available for sale or rental by retailers based on gross sales less a provision for estimated returns, rebates and pricing allowances. Revenues from the licensing of television programs and series for electronic sell-through or video-on demand are recognized when the product has been purchased by and made available to the consumer to either download or stream.
Upfront or guaranteed payments for the licensing of intellectual property are recognized as revenue at either the inception of the license term if the intellectual property has significant standalone functionality or over the corresponding license term if the licensee's ability to derive utility is dependent on our continued support of the intellectual property throughout the license term.
Revenues from the sales of console games are recognized at the later of the delivery date or the date that the product is made widely available for sale or rental by retailers based on gross sales less a provision for estimated returns, rebates and pricing allowances.
Advertising Revenue
Advertising revenues are recognized, net of agency commissions, in the period that the advertisements are aired. If there is a targeted audience guarantee, revenues are recognized for the actual audience delivery and revenues are deferred for any shortfall until the guaranteed audience delivery is met, typically by providing additional advertisements. Advertising revenues from digital properties are recognized as impressions are delivered or the services are performed.

33
Revenue Categories
The following table sets forth reported revenue by category:
No customer accounted for more than 10% of consolidated revenues in 2018, 2017 or 2016.
Deferred Customer Contract Acquisition and Fulfillment Costs
Costs to acquire customer contracts, including commissions on service activations, for our wireless, business wireline and video entertainment services, are deferred and amortized over the contract period or expected customer relationship life, which typically ranges from two to five years. Costs to fulfill customer contracts are deferred and amortized over periods ranging generally from four to five years, reflecting the estimated economic lives of the respective customer relationships, subject to an assessment of the recoverability of such costs. For contracts with an estimated amortization period of less than one year, we expense incremental costs immediately.
Our deferred customer contract acquisition costs and deferred customer contract fulfillment costs balances were $3,974 and $11,540 as of December 31, 2018, respectively, of which $1,901 and $4,090 were included in "Other current assets" on our consolidated balance sheets. For the year ended December 31, 2018, we amortized $1,433 and $4,039 of these costs, respectively.
Contract Assets and Liabilities
A contract asset is recorded when revenue is recognized in advance of our right to bill and receive consideration (i.e., we must perform additional services or satisfy another performance obligation in order to bill and receive consideration). The contract asset will decrease as services are provided and billed. When consideration is received in advance of the delivery of goods or services, a contract liability is recorded. Reductions in the contract liability will be recorded as we satisfy the performance obligations.
The following table presents contract assets and liabilities and revenue recorded at or for the year ended December 31, 2018:
Our beginning of period contract liability recorded as customer contract revenue during 2018 was $5,677.

34
Our consolidated balance sheet at December 31, 2018 included approximately $1,244 for the current portion of our contract asset in "Other current assets" and $5,752 for the current portion of our contract liability in "Advanced billings and customer deposits.”
Remaining Performance Obligations
Remaining performance obligations represent services we are required to provide to customers under bundled or discounted arrangements, which are satisfied as services are provided over the contract term. In determining the transaction price allocated, we do not include nonrecurring charges and estimates for usage, nor do we consider arrangements with an original expected duration of less than one year, which are primarily prepaid wireless, video and residential internet agreements in our Communications segment and advertising and fixed-fee subscription arrangements in our WarnerMedia segment.
Remaining performance obligations are associated with 1) business contracts that reflect recurring charges billed, adjusted for our estimates of sales incentives and other revenue adjustments, 2) wireless contracts, which are estimated using a portfolio approach where we review all relevant promotional activities, calculating the remaining performance obligation using the average service component for the portfolio and the average device price, 3) the licensing of theatrical and television content that will be made available to customers at some point in the future, and 4) upfront or guaranteed payments for licenses of intellectual property that will be recognized over the corresponding license term.
As of December 31, 2018, the aggregate amount of the transaction price allocated to remaining performance obligations was $39,871 of which we expect to recognize approximately 55% next year and 80% over the next two years, with the balance recognized thereafter.
Comparative Results
Prior to 2018, revenue recognized from contracts that bundle services and equipment was limited to the lesser of the amount allocated based on the relative selling price of the equipment and service already delivered or the consideration received from the customer for the equipment and service already delivered. Our prior accounting also separately recognized regulatory fees as operating revenue when received and as an expense when incurred. Sales commissions were previously expensed as incurred.
The following table presents our reported results under ASC 606 and our pro forma results using the historical accounting method:

35
Costs of Revenue
Financing Receivables
Stock-Based Compensation
Income Taxes
EXAMPLE
Income tax expense includes U.S. and international income taxes, the provision for U.S. taxes on undistributed earnings of international subsidiaries not deemed to be permanently reinvested, and interest and penalties on uncertain tax positions. Certain income and expenses are not reported in tax returns and financial statements in the same year. The tax effect of such temporary differences is reported as deferred income taxes. Deferred tax assets are reported net of a valuation allowance when it is more likely than not that a tax benefit will not be realized. All deferred income taxes are classified as long-term on our consolidated balance sheets.

36
Fair Value Measurements
Financial Instruments
Cash and Cash Equivalents
Accounts Receivable
Inventories
EXAMPLE
Inventories are stated at average cost, subject to the lower of cost or market. Cost includes materials, labor, and manufacturing overhead related to the purchase and production of inventories. We regularly review inventory quantities on hand, future purchase commitments with our suppliers, and the estimated utility of our inventory. If our review indicates a reduction in utility below carrying value, we reduce our inventory to a new cost basis through a charge to cost of revenue.
Property and Equipment
Foreign Currency Transactions and Translations
Goodwill and Other Intangibles
EXAMPLE
We do not amortize goodwill, but test it at least annually for impairment at the reporting unit level. A reporting unit is the operating segment, or one level below that operating segment (the component level) if discrete financial information is prepared and regularly reviewed by segment management. However, components are aggregated as a single reporting unit if they have similar economic characteristics. We recognize an impairment charge if the carrying amount of a reporting unit exceeds its fair value and the carrying amount of the reporting unit’s goodwill exceeds the implied fair value of that goodwill. We use a market approach, when available and appropriate, or the income approach, or a combination of both, to establish fair values. When a portion of a reporting unit is disposed, goodwill is allocated to the gain or loss on disposition based on the relative fair values of the business or businesses disposed and the portion of the reporting unit that will be retained.
We amortize the cost of other intangibles over their estimated useful lives unless such lives are deemed indefinite. The cost of intangible assets is generally amortized on a straight-line basis over the asset’s estimated economic life, except that individually-significant, customer-related intangible assets are amortized in relation to total related sales. Amortizable intangible assets are reviewed for impairment whenever events or changes in circumstances indicate that the related carrying amounts may not be recoverable. In these circumstances, they are tested for impairment based on undiscounted cash flows and, if impaired, written down to fair value based on either discounted cash flows or appraised values. Intangible assets with indefinite lives are tested annually for impairment and written down to fair value as required.

37
Impairments of Long-Lived Assets
Leases
Loss Contingencies
Subsequent Events
New Accounting Pronouncements
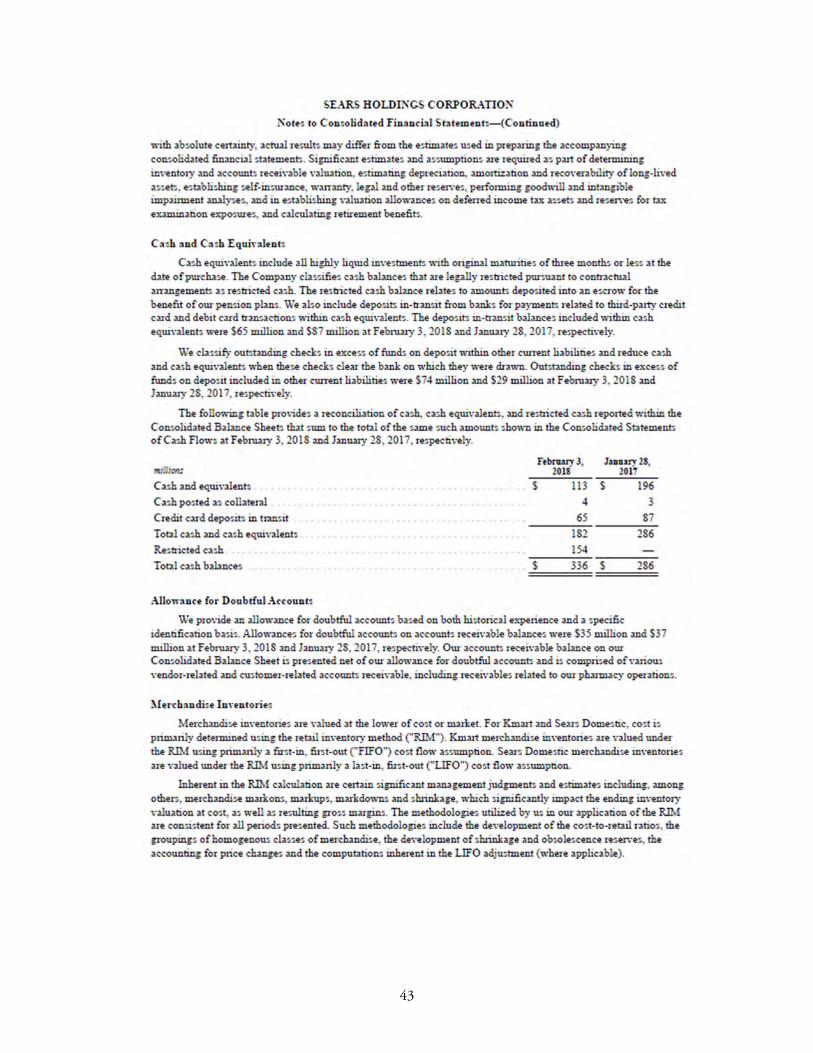
Following is a Sears Holdings Corporation’s accounting policy note:

38

39

40

41

42
43

44

45

46

47

48

49

50

51

52
The following is an example of significant accounting policies note for a non-public company:
EXAMPLE
NOTE 1: SUMMARY OF SIGNIFICANT ACCOUNTING POLICIES
Nature of Operations – The Company is engaged primarily in the production and sale of medical device components sold to manufacturers of imaging equipment. Approximately 10% of revenues are derived from contract design services performed under long-term contracts.
Consolidation – The consolidated financial statements include the accounts of the Company and its majority-owned subsidiary. All material intercompany accounts and transactions have been eliminated.
Investment in Affiliate – The Company’s investment in an unconsolidated affiliate is accounted for under the equity method.
Use of Estimates – The preparation of financial statements in conformity with generally accepted accounting principles requires management to make estimates and assumptions that affect the reported amounts of assets and liabilities and disclosure of contingent assets and liabilities at the date of the financial statements and the reported amounts of revenues and expenses during the reporting period. Actual results could differ from those estimates.
Revenue Recognition – Revenues from sales are generally recognized when delivered and accepted by the customer; under some contracts, revenue is partially deferred to the extent the functionality of delivered components are dependent on future delivery of product and recognized when the orders are complete. Fees under long-term design contracts are accounted for under the percentage-of-completion method, based on level of effort.
Accounts Receivable – The Company carries its accounts receivable at cost less an allowance for doubtful accounts. Periodically, the Company evaluates its accounts receivable and establishes an allowance for doubtful accounts based on historical experience with bad debts and collections, as well as current credit conditions.
Interest is accrued on receivables considered past due at the rate of 1% per month, starting 30 days after the payment due date. Accounts on which payments have not been received by the company for 90 days are turned over for collection. Accounts are written off as uncollectible if no payments are received 90 days after they have been turned over for collection.
Property and Equipment – Property and equipment are carried at cost. Depreciation is determined using accelerated and straight-line methods over the estimated useful lives of the property.
Intangibles and Other Assets – The acquisition cost of customer lists is amortized over five years on a straight-line basis. Deferred financing costs are amortized using the interest method over the terms of the related debt.
Inventories – Inventories are valued at the lower of cost or market, with cost determined on the first-in, first-out method.
Income Taxes – Deferred taxes are provided for temporary differences in the bases of assets and liabilities for financial and tax purposes, and arise principally from methods used for depreciation, capitalization of costs in inventory, and certain accrued expenses.
The Company classifies interest accrued on unrecognized tax benefits with interest expense and penalties thereon with operating expenses. The Company’s tax returns since 201X generally remain open to possible examination.

53
Cash Equivalents – The Company considers all highly-liquid debt instruments with an original maturity of three months or less to be cash equivalents.
Advertising – The Company expenses advertising costs when the advertising first takes place, except for direct-response advertising.
Direct-response advertising consists primarily of print advertisements with coupons for the company’s products. The cost of these ads is capitalized and amortized over a six-month period following publication, based on expiration of the coupons.
Shipping and Handling Costs – Shipping costs billed to customers are included in sales. Shipping and handling costs are included in cost of goods sold.
Sales Tax – Sales tax collected from customers is recorded as a liability, pending remittance to the taxing jurisdiction. Consequently, sales taxes have been excluded from revenues and costs (“net method”).
Subsequent Events – The Company has evaluated subsequent events through March 11, 20X5, the date the financial statements were available to be issued.
Reclassifications – Certain reclassifications have been made to 20X3 amounts in the accompanying financial statements to conform to the 20X4 presentation.
NOTE DISCLOSURES
Again, using U.S. GAAP as the example, the FASB Codification is organized in the following topics:
ASC 100 – General Principles
ASC 200 – Presentation
ASC 300 – Assets
ASC 400 - Liabilities
ASC 500 – Equity
ASC 600 – Revenue
ASC 700 – Expenses
ASC 800 – Broad Transactions
ASC 900 – Industry
These topics include 59 subtopics in topics 100 through 800 that each have disclosure requirements. It is important that these disclosures be reviewed by the investor or analyst in order to obtain a full understanding of the company and its accounting practices and outcomes.

54
SEC DISCLOSURE COMMENT LETTERS
Overview
As noted on the SEC’s website, comment letters between SEC staff and SEC filers are contained in the SEC’s EDGAR database. The SEC began publicly releasing this correspondence in 2005 for filings made after August 1, 2004 that were reviewed by the SEC staff. SEC staff from the Divisions of Corporation Finance and Investment Management issues this type of comment letter in connection with their review of disclosure filings. The staff’s comments are in response to a company’s disclosure and other public information and are based on the staff’s understanding of that company’s facts and circumstances.
In issuing comments to a company, the staff may request that a company provide additional supplemental information so the staff can better understand the company’s disclosure, revise disclosure in a document on file with the SEC, provide additional disclosure in a document on file with the SEC, or provide additional or different disclosures in a future filing with the SEC. There may be several rounds of letters from the SEC staff and responses from the filer until the issues identified in the review are resolved. These letters set forth staff positions and do not constitute an official expression of the SEC’s views. The letters are limited to the specific facts of the filing in question and do not apply to other filings.
We provide this information to you to assist in identifying areas in company disclosures where additional scrutiny may be necessary when performing financial statement analysis.
Specific Areas of Focus
Non-GAAP Performance Measurements – This topic was the most frequently commented on topic by the SEC during 2017. The comments have addressed both 10-K and 10-Q filings as well as comment letters discussing company press releases on Form 8-K.
1. Comments addressing 10-K and 10-Q filings:
Non-GAAP performance and liquidity measurements presented more prominently than GAAP measurements
Non-GAAP performance and liquidity measurements not quantitatively reconciled with the most comparable GAAP measurements (net income or cash flows) – this reconciliation should begin with the GAAP measurement
Lack of appropriate disclosures concerning the purpose and use of non-GAAP measurements
Not distinguishing between non-GAAP performance and liquidity measurements
Inconsistent presentations when including unusual gains in a non-GAAP presentation but excluding unusual losses or excluding cash operating expenses from non-GAAP performance measures

55
2. Comments addressing press releases included in 8-K filings:
Adjustments to reported net income that eliminate normal recurring operating expenses in the non-GAAP measurement
Not properly describing the reasons for certain adjustments to a GAAP measurement when presenting a non-GAAP measurement
Fair Value Measurements – The comments for this topic are primarily addressing fair value disclosures as required by ASC 820-10-50-2 in Topic Fair Value Measurements. These comments are as follows:
Lack of adequate disclosure concerning valuation techniques and inputs used to determine the fair value measurement
For Level 3 inputs, lack of specific disclosure concerning valuation techniques and inputs for significant unobservable inputs used in measuring fair value
Lack of disclosure of the valuation techniques used by third parties (pricing services) to determine the fair value of items in Level 2 of the fair value hierarchy
Lack of or incomplete disclosure (narrative description) of the sensitivity of Level 3 measurements to changes in unobservable inputs as required by ASC 820-10-50-g if those changes result in a significantly higher or lower fair value measurement
Income Taxes – The SEC comment letters in the income tax area primarily address the realizability of deferred tax assets and changes in the valuation allowance. Deferred tax assets are presented when it is more likely than not that all or a portion of the deferred tax asset will be realized as required in ASC 740-10-30-18 in Topic Income Taxes. Specific comments are as follows:
Why does a deferred tax asset continue to be presented when there has been past and current losses recognized (realizability)
How was positive and negative evidence weighed when assessing realizability of a deferred tax asset (future taxable income)
Were the assumptions used to determine future taxable income for determining the realizability of deferred tax assets consistent with the cash flow assumptions associated with impairment analysis, useful lives of property, plant & equipment and other related predictions
Calculation of the valuation allowance when evidence suggests it should be increased or decreased
Lack of support for the reversal of an existing valuation allowance

56
What is the basis for recognizing unrecognized tax benefits
Disclosures required by ASC 740-10-50-15 concerning unrecognized tax benefits including the nature of the uncertainty, and the nature of any event that could occur in the next 12 months that could cause a change in the liability
Revenue Recognition – While ASU 2014-09, Revenue from Contracts with Customers, has only been effective for a short period of time, the comments from the SEC in the future are likely to address past recurring issues as well as issues associated with the new revenue ASU. The comments below address both issues:
1. Comments addressing past recurring issues:
Principal vs. agent, how did the company make the determination that they are the principal or agent leading to a gross vs. net revenue recognition
What are the company’s accounting policies related to accounting for sales incentives – reduction of revenue or an operating expense
How does the company account for sales returns – policies and disclosures
Recognizing revenue for long-term contracts using percent complete – how is the decision made to determine the stage of completion for revenue recognition purposes
Accounting policy disclosures related to the company’s revenue recognition policy, specifically addressing consistency of recognition and completeness
2. Comments addressing the new revenue standard – Based on current public statements made by the SEC, the following are expected to be areas of concern:
Identifying performance obligations (promises)
Considering variable consideration in the determination of the transaction price
Determining the transaction price and allocating it to the performance obligations
Determining when control has transferred to the customer, permitting the selling entity to recognize revenue
Adequacy of revenue disclosures
Goodwill – SEC comments related to goodwill can be found in MD&A disclosures more than financial statement disclosures. The principal comments include the following:
Lack of disclosure of any early warning information as required in Regulation S-K – Item 303(a)(3)(ii) – Describe any known trends or uncertainties that have had or that the registrant reasonably expects will have a material favorable or unfavorable impact on net sales or revenues

57
or income from continuing operations. If the registrant knows of events that will cause a material change in the relationship between costs and revenue, the change in the relationship shall be disclosed
How are reporting units identified for goodwill impairment testing purposes
Information concerning the company’s goodwill impairment testing policies
The nature of sensitivity analysis performed including the assumptions used in testing goodwill for impairment and how changes in these assumptions could affect the goodwill impairment results
What future events could lead to future goodwill impairments
Loss Contingencies – Accounting and disclosure guidance for loss contingencies is found in ASC Topic 450, Contingencies. In that guidance, contingent losses are evaluated to be probable, reasonably possible, or remote. Probable must be recorded and disclosed and reasonably possible must be disclosed (including an estimate of the loss or range of loss if that estimate can be made. The primary area of SEC comments is with reasonably possible loss contingencies. The principal comments include the following:
Lack of adequate disclosures concerning reasonably possible losses including the timeliness of the loss contingency disclosures (nature and estimate of the possible loss or range of loss or a statement that such an estimate cannot be made)
When a company indicates that an estimate of a reasonably possible loss or range of loss cannot be made, the SEC has asked why this is the case
When historical contingent losses have been settled, the SEC wants to know why these settlements cannot be used to arrive at an estimate of a current loss contingency
Acquisitions, Mergers and Business Combinations – The comments for this topic are primarily discussing business combination disclosures. ASC Topic 805, Business Combinations, includes the disclosures required for an acquisition, merger, and business combination. These comments are as follows:
Present a schedule identifying the components of the consideration transferred for the acquisition
When goodwill is a significant portion of the consideration transferred, the SEC will often ask for a qualitative discussion of the factors that make up the amount of goodwill recognized
How was the acquisition price allocated to the net assets acquired
What are the primary reasons for the business combination and a description of how the acquirer obtained control of the acquired (ASC 805-10-50-2)
What is the nature of any contingent consideration and the basis for estimating the amount of any future payments

58
Pro forma information is required assuming the business acquisition occurred at the beginning of the reporting period. Pro forma disclosures are at times not provided and when this occurs the SEC requires its disclosure
SEC often comments as to how the company determined that the acquisition was that of a business and not simply an asset acquisition
Related Party Transactions – Regulation S-K – Item 404, Transactions with Related Persons, Promoters, and Certain Control Persons, is the principal guidance in the related party area. This item requires disclosure of any transaction, since the beginning of the registrant’s last fiscal year, or any currently proposed transaction, in which the registrant was or is to be a participant and the amount involved exceeds $120,000, and in which any related person had or will have a direct or indirect material interest. The principal comments in this area include the following:
Asking the company to provide a description of the transaction or proposed transaction including the nature of the transaction both in qualitative and quantitative terms
Based on a review of other note disclosures, the SEC may ask for information of any new contracts or other agreements that could include related party activity
Internal Control over Financial Reporting – SEC comments concerning internal control over financial reporting and disclosures include the following:
Failure to disclose material changes to internal controls
Implications for internal controls when a company discloses immaterial error corrections
Inadequate descriptions of internal control failures
Failure to disclose the nature and timely identification of material weaknesses
Lack of disclosure about the status of remediation of a previously-identified material weakness
The lack of disclosure concerning changes in internal controls after a significant event takes place that should impact internal controls

59
Section
3 A Closer Look at Financial
Statements LEARNING OBJECTIVES
After completing this section, participants will be able to accomplish the following:
Describe external financial reporting trends and characteristics.
Explain how management’s judgment can have an impact on financial reporting.
Describe the result of applying different bases of accounting on financial reporting outcomes.
INTRODUCTION
For more than a decade, accounting standard-setters such as the FASB and AICPA have been emphasizing specific external financial reporting trends and characteristics in their authoritative literature that can influence the financial analysis approaches used by many users. These characteristics include:
Increased balance sheet emphasis when addressing emerging accounting issues. The FASB for example, has been placing greater focus on asset realization and liability recognition than on the matching of revenues and expenses. Examples are: ASC Topics such as ASC 320, Investments – Debt and Equity Securities, ASC 350, Intangibles – Goodwill and Other, ASC 360, Property, Plant, and Equipment, ASC 740, Income Taxes, and ASC 820, Fair Value Measurement and Disclosures.
Increased use of fair value for measuring assets and liabilities. Fair value is replacing historical cost as the measurement method for many assets and liabilities. The FASB believes that changes in asset and liability values not only occur from operational activities but also from changes in economic value. Examples are: ASC Topics such as ASC 805, Business Combinations, ASC 815, Derivatives and Hedging, ASC 820, Fair Value Measurement and Disclosures, and ASC 825,

60
Financial Instruments. To take this further, in ASC 820 the FASB stated its intention to issue future standards utilizing the fair value methodology illustrated in ASC 820.
Increased consistency with international accounting standards. The SEC and FASB are generally working to converge GAAP in the United States with international accounting standards. The goal is to improve overall financial reporting and create accounting consistencies by reducing many differences that currently exist in accounting standards spanning nearly 165 different countries. Examples are: re-defining the basis for consolidation, accounting for financial instruments, presenting comprehensive income, establishing a new conceptual framework for developing future accounting standards, and revamping the accounting for leases and revenue recognition.
Increased financial statement disclosures. With Topics such as ASC 275, Risks and Uncertainties, and ASC 820, Fair Value Measurement and Disclosures, the FASB requires additional disclosures to identify a reporting entity’s business risks (concentrations of risk, significant estimates, etc.), and identify the sources of changes in asset and liability fair values.
Increased principles-based and decreased rules-based new guidance. The Sarbanes-Oxley Act required that the SEC conduct a feasibility study of implementing a principles-based approach to accounting. In addition, IFRS is primarily principle-based, and the FASB/IASB convergence initiative is also driving the change from rules-based principles.
Principles-based accounting results in significantly greater judgment by preparers of financial statements. Because of this greater judgment, disclosures need to increase substantially so that the decision inputs of preparers are available to financial statement users. Examples are ASC 606, Revenue from Contracts with Customers, and ASC 842, Leases.
Increased financial accounting and reporting complexity. In spite of well-publicized FASB and SEC financial accounting and reporting simplification initiatives, it should be no surprise that accounting standards continue to become more complex. A Wall Street Journal article a few years ago reported that the average 10K contained 42,000 words in 2013 which was a 40% increase from 30,000 words in 2000.
There are several drivers behind the increasing complexity which, despite the Financial Accounting Foundation’s (FAF) Private Company Counsel (PCC), also impacts non-public entity financial reporting. Transactions are becoming more complex as new products and services emerge and financial instruments become more sophisticated. Many entities are developing new transaction structures for asset sales or purchases, derivative transactions, and operating agreements. Institutional investors’ demand more information has resulted in greater disclosure requirements to provide more transparency.
The impact on users is that overly-complex financial reports may obscure important financial information needed to properly analyze financial statements and reach appropriate decisions.

61
These trends and characteristics illustrate the belief of many in the marketplace that users have become less interested in historical cost information, and are more interested in having financial statement information that provides more assistance with future decision making as well as for measuring past performance.
FASB Financial Statement Presentation Project
Since 2010 when the FASB posted its “Staff Draft” Financial Statement Presentation Project, not much has happened due to other priorities. The “Staff Draft” is not as significant as an Exposure Draft; however, it signals the FASB’s thinking about financial statement presentation which may underpin future pronouncements.
The Project significantly alters the existing balance sheet, income statement, and statement of cash flows structures. Financial information would be categorized between financing activities and business (operating and investing) activities, which is similar to our current indirect method statement of cash flows presentation.
Financing activities are the assets and liabilities related to obtaining or repaying debt and equity capital. Business activities are the assets and liabilities related to its day-to-day business functions (operating) and related to generating a return (investing).
Following is a summary of the proposed impact on each of the financial statements:
Statement of financial position – Based on how an entity uses its assets and liabilities, the assets and liabilities would be presented by major activity within operating investing, and financing categories. Unlike our existing presentation format where all assets and all liabilities are presented together, assets and liabilities would be divided among the three categories. There is a further “by-nature” (segment) and by-function separate presentation requirement.
The proposal retains the existing current and non-current distinction as well as ordering line items by liquidity.
Statement of comprehensive income – The reporting entity would present revenue, expenses, and income in a consistent presentation of the corresponding assets and liabilities that produced to the revenue, expenses, and income. Also consistent with the statement of financial position, there is a “by-nature” (segment) and by-function separate presentation requirement.
Statement of cash flows – The proposal requires the direct method.
Disclosures – The proposal requires additional disclosure because of the judgment in determining the operating, investing, and financing categorization. There would be additional disclosure of certain asset and liability balance roll forwards. In addition, changes in assets and liabilities would be split between cash and non-cash changes.
We mention this Project because it would make fundamental changes to financial statements and would impact the user’s analysis of these financial statements.

62
MANAGEMENT JUDGMENT AND ITS IMPLICATIONS ON FINANCIAL REPORTING
As an insider, management has greater access than outsiders to information about an entity’s present financial condition and operating performance as well as future strategy and outlook. Thus, management has broad discretion to the degree of financial reporting and disclosure transparency. Management can enhance its financial reporting transparency or make it more difficult for users to understand the true financial condition and operating performance and more difficult for users to assess the amount, timing, and uncertainty of future cash flows.
Management judgment can influence financial reporting through 1) earnings management, 2) management bias, and 3) opaque footnote disclosure. Management must use significant judgment in estimating, measuring, classifying, reporting, and disclosing economic events such as transactions, accruals, reserves, impairments, and contingencies, to name a few. Management actions that affect the numbers also affect financial statement analysis.
Earnings management – “Earnings management” is defined as situations when management uses its accounting judgment and disclosure discretion to produce financial statements that position entity performance in a predetermined viewpoint. The earnings management spectrum extends from aggressive accounting that still complies with GAAP to “bending the rules” to extreme cases of financial fraud. The sheer magnitude of earnings restatements beginning during the 2000s highlights the vulnerability of financial statements to manipulation.
Earnings management is broader than the income statement. It actually includes the three major financial statements. In fact, most earnings management also includes the balance sheet management – examples are capitalizing expenses or reserve management. An example of managing the statement of cash flows is reclassifying cash inflows from investing or financing activities into operating activities.
Large public companies are especially motivated to overstate assets and earnings in order to increase EPS and present a favorable picture to shareholders. Selfishly, this also favorably impacts incentive compensation. Private companies, on the other hand, are typically motivated to understate assets and earnings in order to reduce tax payments. In other cases, recurring financial trends and ratios will appear more consistent than they really are. Consistency tends to create misplaced complacency among financial statement users.
It is of great concern to users when financial gymnastics minimizes bad news which, in turn, results in management complacency in denying or understating true operational problems that truly exist. The outcome is that management neither acknowledges nor fixes fundamental business problems until it is too late.
Companies that report strong profits in some industries may receive unfavorable media coverage or government regulatory attention about unfair profits. Examples are banking, electric and gas utilities, pharmaceuticals, and oil companies. These companies have an incentive to dampen reported profits to avoid costly public backlash or government pressures.

63
Management may have selfish reasons for making reported earnings look less favorable. In a management leverage buy out (LBO), management would acquire all of the outstanding stock of the company. By making the company appear less profitable, management would lower the valuation and be able to buyout the entity at a lower price.
EXAMPLE
When Dell instituted a management buyout of all publicly-traded stock, many in the market believed the buyout price set by management was under-valued. Below is media coverage at one stage in the buyout process. The point is not the legal process and subsequent appeals, but that management, due to its insider status, has better information than outsiders in the equity market.
By REUTERS
May 31, 2016
Michael Dell and Silver Lake Partners underpriced their 2013 $24.9 billion buyout of Dell by about 22% and may have to pay tens of millions to investors who opposed the deal for the computer maker, a Delaware judge ruled on Tuesday.
The fair value of Dell’s stock at the time of the buyout was $17.62 per share, not the original price of $13.75 per share, according to Delaware Vice Chancellor Travis Laster.
The 114-page ruling stems from one of the most hotly contested appraisal cases, a legal strategy that has become a popular way for specialized investment funds to squeeze added cash out of merger deals.
Scores of investors who voted against the deal filed a lawsuit in Delaware’s Court of Chancery, asking the court to determine the fair value of the stock.
The investors originally sought appraisal on nearly 40 million shares and some claimed a fair value was as high as $25 per share.
Monday’s ruling, which can be appealed, could add tens of millions of dollars to the final cost of the deal for the buyers. Based on court documents filed in September, about 5.2 million shares were still eligible for appraisal. The investors are also eligible for interest that began accruing when the deal closed.
The damage could have been far worse for Dell.
During the litigation, Dell’s legal team knocked out the bulk of the stock seeking appraisal, which had been beneficially owned by T Rowe Price.
The money manager could have collected more than $100 million from Monday’s ruling, if all of its Dell stock had qualified for appraisal.
Dell and a lawyer for the stockholders, Stuart Grant, did not immediately respond to a request for comment.
When most financial statement users hear about earnings management, they typically think of overstated earnings. Most earnings management, however, extend well beyond the income statement. Following are some frequent earnings management schemes and their detectability using financial analytical techniques:
“When it rains, it pours” – is a form of earnings management where in a year with poor financial and operating performance, the entity “drains the swamp” and understates earnings

64
further. Using judgment, management defers revenues, makes more conservative liability estimates, accelerates expense accruals, increases reserves, or over impairs assets. In future years, the deferred revenues will naturally flow into the income statement or the newly-lower-valued assets will naturally flow through expense at reduced amounts and boost profitability.
“Cookie jar accounting” – is a form of the above example. The difference is that the conservative judgments used to justify balances when filling the cookie jar are deliberately changed in future periods which empties the accounting reserve cookie jar.
EXAMPLE
During a good year with higher sales volume than prior year and budget, a company increased its warranty reserve liability. This increased warranty expense and reduced reported income. A few years later when the overall economy was in a recession causing sales volume and profits to fall, the company “discovered” that its warranty reserve liability was too high and decided to correct it. This produced lower net warranty expense and higher income than operations would normally generate.
The effect was to smooth earnings over a longer period giving the false impression to financial statement users that the company had lower volatility and, thus, was less risky. A less risky company will have a higher valuation.
A good financial analyst could detect this earnings manipulation by reading the notes to the financial statements. ASC 460, Guarantees, requires disclosing a roll forward of the warranty reserve liability.
“Banking next year’s bonus” – is a form of the above two schemes. The difference is that it often occurs when financial and operating performance is very favorable. The reasons are management selfishness and incentive compensation plan design. These plans often have a ceiling; thus, any performance above the ceiling is “wasted” according to management because bonuses are capped. In addition, incentive compensation plans for the next year generally have a floor that is set by the prior-year performance. By purposely delaying sales and profit, next year’s floor is lower which means next year’s bonus is already partly achieved.
Conservatism has long been part of accounting and financial reporting practices. There is a big difference, however, between conservatism and deliberate understatement. Delaying income recognition due to uncertainty is conservative; fabricating a liability that does not exist or overstating an existing liability is not conservative and is wrong. It is also wrong in subsequent periods when reversing the overstated liability to boost income without also fully disclosing the impact of liability changes so that financial statement users can assess true operating performance.
By improperly using accounting to smooth operating performance over time also impacts entity valuation. This misleads financial statement users to assess incorrectly that the entity’s business and underlying industry economics are less risky than they are in reality.
A good financial analyst can detect these income statement schemes through financial statement horizontal analysis and vertical analysis for individual line items. For example, trending the allowance for doubtful accounts as a percent of accounts receivable and as a percent of sales over several years. As long as the reporting entity provides “full and fair” disclosure, it is up to the financial statement

65
user to perform their reasonable diligence and research business, economic, financial, and accounting that they do not understand.
The hidden downside of the income statement schemes above is that they reduce net worth. Many debt agreements have a minimum net worth covenant which may become endangered. Also on the balance sheet, asset turnover is boosted which inaccurately indicates greater operating efficiency.
The FASB has addressed off balance sheet financing through two recent pronouncements. ASC 860, Transfers and Servicing, covers new guidance on accounting, presentation, and disclosure of repurchase agreements. ASC 842, Leases, is ending most off-balance-sheet-financing through operating leases.
Management bias. FASB Concepts Statement No. 2, Qualitative Characteristics of Accounting Information, covers relevance, reliability, neutrality, and comparability of accounting information as these qualitatively relate to decision usefulness. FASB defines reliability as “information that is reasonably free from error and bias and faithfully represents what it purports to represent.” Although many people refer to bias as being intentional, FASB’s reliability definition includes the possibility that accounting information may be affected by bias that is “not necessarily intended.”
AU-C Section 540, Auditing Accounting Estimates, Including Fair Value Accounting Estimates, and Related Disclosures, is consistent with FASB CON Statement No. 2. This auditing guidance mentions the imprecise nature of accounting estimates and management judgment may be intentional or unintentional.
COSO, in March 2012, published Enhancing Board Oversight – Avoiding Judgment Traps and Biases. In this report, COSO focused on four mental-shortcut tendencies that can lead to bias:
1. Overconfidence bias – especially relevant to the C-Suite is that confidence grows more rapidly with experience than competence does. This means the most confident people have the most experience. The impact on bias is that management may overestimate future growth and profitability as well as may underestimate risk and thus neglect to plan for adverse scenarios.
2. Confirmation bias – putting more weight on information that aligns with their initial beliefs to the detriment of objectivity by looking for information that may be inconsistent with their beliefs.
3. Anchoring bias – making judgments by starting from an initial numerical value and adjusting insufficiently away from that initial value in assessing the situation. Generally, the initial numerical value is unsubstantiated or comes from historical precedent or past experience.
4. Availability tendency bias – relying more on information that is easily obtainable in making a decision. This may be from memory or from immediately accessible sources and influence estimates or probability assessments.
Opaque note disclosures – Significant matters “buried” in the footnotes must be considered in performing meaningful financial analysis. An interesting example of this is Enron’s incomprehensible year 2000 related-party disclosure footnote.

66
EXAMPLE
ENRON’S RELATED PARTY FOOTNOTE – 2000
RELATED PARTY TRANSACTIONS
In 2000 and 1999, Enron entered into transactions with limited partnerships (the Related Party) whose general partner’s managing member is a senior officer of Enron. The limited partners of the Related Party are unrelated to Enron. Management believes that the terms of the transactions with the Related Party were reasonable compared to those which could have been negotiated with unrelated third parties.
In 2000, Enron entered into transactions with the Related Party to hedge certain merchant investments and other assets. As part of the transactions, Enron (i) contributed to newly-formed entities (the Entities) assets valued at approximately $1.2 billion, including $150 million in Enron notes payable, 3.7 million restricted shares of outstanding Enron common stock and the right to receive up to 18.0 million shares of outstanding Enron common stock in March 2003 (subject to certain conditions) and (ii) transferred to the Entities assets valued at approximately $309 million, including a $50 million note payable and an investment in an entity that indirectly holds warrants convertible into common stock of an Enron equity method investee. In return, Enron received economic interest for the Entities, $309 million in notes receivable, of which $259 million is recorded at Enron’s carryover basis of zero, and a special distribution from the Entities in the form of $1.2 billion in notes receivable, subject to changes in the principal for amounts payable by Enron in connection with the execution of additional derivative instruments. Cash in these Entities of $172.6 million is invested in Enron demand notes. In addition, Enron paid $123 million to purchase share-settled options from the Entities on 21.7 million shares of Enron common stock. The Entities paid Enron $10.7 million to terminate the share-settled options on 14.6 million shares of Enron common stock outstanding.
In late 2000, Enron entered into share-settled collar arrangements with the Entities on 15.4 million shares of Enron common stock. Such arrangements will be accounted for as equity transactions when settled.
In 2000, Enron entered into derivative transactions with the Entities with a combined notional amount of approximately $2.1 billion to hedge certain merchant investment and other assets. Enron’s notes receivable balance was reduced by $36 million as a result of premiums owed on derivative transactions. Enron recognized revenues of approximately $500 million related to the subsequent change in the market value of these derivatives, which offset market value changes of certain merchant investments and price risk management activities. In addition, Enron recognized $44.5 million and $14.1 million of interest income and interest expense, respectively, on the notes receivable from and payable to the Entities.
In 1999, Enron entered into a series of transactions involving a third party and the Related Party. The effect of the transactions was (i) Enron and the third party amended certain forward contracts to purchase shares of Enron common stock, resulting in Enron having forward contracts to purchase Enron common shares at the market price on that day, (ii) the Related Party received 6.8 million shares of Enron common stock subject to certain restrictions and (iii) Enron received a note receivable, which was repaid in December 1999, and certain financial instruments hedging an investment held by Enron.
Enron recorded the assets received and equity issued at estimated fair value. In connection with the transactions, the Related Party agreed that the senior officer of Enron would have no pecuniary interest in such Enron common shares and would be restricted from voting on matters related to such shares. In 2000, Enron and the Related Party entered into an agreement to terminate certain financial instruments that had been entered into during 1999. In connection with this agreement, Enron received approximately 3.1 million shares of Enron common stock held by the Related Party. A put option, which was originally entered into in the first quarter of 2000 and gave the Related Party the right to sell shares of Enron common stock to

67
Enron at a strike price of $71.31 per share, was terminated under this agreement. In return, Enron paid approximately $26.8 million to the Related Party.
In 2000, Enron sold a portion of its dark fiber inventory to the Related Party in exchange for $30 million cash and a $70 million note receivable that was subsequently repaid. Enron recognized gross margin of $67 million on the sale.
In 2000, the Related Party acquired, through securitizations, approximately $35 million of merchant investments from Enron. In addition, Enron and the Related Party formed partnerships in which Enron contributed cash and assets and the Related Party contributed $17.5 million in cash. Subsequently, Enron sold a portion of its interest in the partnership through securitizations. See Note 3. Also, Enron contributed a put option to a trust in which the Related Party and Whitewing hold equity and debt interests. At December 31, 2000, the fair value of the put option was a $36 million loss to Enron.
In 1999, the Related Party acquired approximately $371 million of merchant assets and investments and other assets from Enron. Enron recognized pre-tax gains of approximately $16 million related to these transactions. The Related Party also entered into an agreement to acquire Enron’s interests in an unconsolidated equity affiliate for approximately $34 million.
We publish the older Enron story because it is such a classic example of financial reporting abuse. ASC 810, Consolidation (subtopic – Variable Interest Entities), is the profession’s response to the accounting standards’ “loophole” that was exploited by Enron to avoid consolidating related entities that held underperforming assets and debt.
ACCOUNTING BASIS
This section covers the GAAP accounting framework in FASB CON No. 6 and non-GAAP special purpose frameworks.
Elements of Financial Statements
Elements of financial statements are the building blocks that construct financial statements which are the classes of items that comprise financial statements. The items in financial statements represent the entity resources, claims to those resources, and the effects of transactions, other events, and circumstances that produce changes in those resources and claims.
FASB CON No. 6 defines the following ten most commonly-identified financial statement elements that are directly related to measuring performance and status of an entity. These elements have broad characteristics as the FASB does not define particular assets, liabilities, and etc.
1. Assets 6. Comprehensive Income
2. Liabilities 7. Revenues
3. Equity 8. Expenses
4. Investments by Owners 9. Gains
5. Distributions to Owners 10. Losses

68
These financial statement elements consist of two types, analogous to a photograph and a motion picture. Assets, liabilities, and equity are the photograph at a moment in time comprising the statement of financial position or balance sheet. The other seven are the motion picture that affect an entity during intervals of time comprising changes in financial position or income statement and statement of cash flows.
Following are definitions and characteristics of each financial statement element listed above.
1. Assets are probable future economic benefits obtained or controlled by an entity as a result of past transactions or events. An asset has three essential characteristics:
a. It embodies a probable future benefit that involves a capacity, singly or in combination with other assets, to contribute directly or indirectly to future net cash inflows
b. An entity can obtain the benefit of and control others’ access to it
c. The transaction or other event giving rise to the entity’s right to or control of the benefit has already occurred
From an economics perspective, assets are commonly called economic resources because they are the scarce means for carrying out economic activities of consumption, production, and exchange.
The resulting “future economic benefit” is the scarce capacity to provide services or benefits, which, in a for-profit business, is eventual net cash inflows.
Asset values change both from transactions and from events that happen to the entity. Transactions are 1) obtaining cash or other assets from other entities or 2) transferring cash and other assets to other entities.
Events are operations adding value to noncash assets by directly using, combining, or transforming goods and services to make other goods or services. Events may also be indirectly non-controllable such as a value change caused by market conditions, technology changes, natural disaster, or government regulatory actions.
Uncertainty about business and economic activity is common and may make it unclear about the measurement of an asset. Thus, management judgment is frequently required. Uncertainty about the future economic benefits of an asset requires management judgment. Examples are an asset’s residual value, estimated economic useful life, impairment, realization, or collectability. Other examples are the requirement to expense advertising and research & development costs.
Once acquired, an asset continues to exist until the entity collects it, transfers it to another entity, uses it up, or an event destroys the future benefit or removes the entity’s ability to obtain the future benefit.

69
2. Liabilities are probable future sacrifices of economic benefits arising from present obligations of an entity to transfer assets or provide services to other entities in the future as a result of past transactions or events. A liability has three essential characteristics:
a. It embodies a present duty or responsibility to another entity that entails settlement by probable future transfer or use of assets at a specified or determinable date, on occurrence of a specified event, or on demand
b. The duty or responsibility obligates the entity, leaving it little or no discretion to avoid the future sacrifice
c. The transaction or other event obligating the entity has already happened
Most liabilities result from human inventions such as financial instruments, contracts, and laws. Liabilities are claims to the entity’s assets by other entities, and, once incurred, create nondiscretionary future sacrifices of assets that must be satisfied on demand, at a specified or determinable date, or on occurrence of an event. From an economic perspective, liabilities facilitate the functioning economy by permitting delays in payment or delivery.
Entities incur most liabilities from agreed-upon exchange transactions to obtain needed resources. These are legally-enforceable, contractual liabilities based on written or oral agreements to pay cash or provide goods or services. Other non-transactional liabilities may be imposed by governments or courts.
Liability values change both from transactions and from events that happen to the entity as described in the previous paragraph. Events may also be indirectly non-controllable such as a value change caused by market conditions such as interest rate changes, government regulatory actions, or court actions.
Uncertainty about business and economic activity is common and may make it unclear whether an event qualifies as a liability. Both the existence and the amount of a liability can be probable but not certain. An example is a contingent liability governed by ASC 450, Contingencies.
Once incurred, a liability continues to exist until the entity settles it or an event discharges it.
3. Equity is the residual interest in the assets of an entity that remains after deducting its liabilities. In a for-profit business enterprise, the equity is the ownership interest. (In a not-for-profit organization, which has no ownership interest in the same sense as a business enterprise, net assets is defined differently.)
Assets are funded by both liabilities and equity, but their claims on the assets are mutually exclusive. Liabilities are claims against the entity’s assets while equity is a residual interest of what remains after liabilities are deducted from assets. Since in liquidation, equity ranks after liabilities as a claim to or interest in the entity’s assets, equity is a residual interest.

70
Although the difference between equity and liabilities may be conceptually clear, in practice it may be obscured. Financial instruments may have characteristics of both liabilities and equity to varying degrees depending on the terms. In addition, naming of financial instruments may not accurately describe its true characteristics. Examples are convertible debt, preferred stock, and warrants.
Equity values may change through 1) operations generating a profit or a loss or 2) through owners’ asset investments or distributions to owners. Liabilities have required payments or settlements, such as debt interest. Owner distributions, such as dividends, however, are discretionary or may be restricted by law, regulation, or agreement.
4. Investments by owners are increases in equity of a business enterprise resulting from transfers from other entities of something valuable to obtain or increase ownership interests (or equity). Assets are most commonly received as investments by owners, but investments may also include services or liability conversion.
5. Distributions to owners are decreases in equity of a business enterprise resulting from transferring assets, rendering services, or the entity incurring liabilities to owners. Distributions to owners decrease ownership interest (or equity) in an entity.
6. Comprehensive income is the periodic change in equity of a business enterprise from transactions and other non-owner events. It includes all changes in equity during a period except those resulting from investments by owners and distributions to owners.
ASC 220, Comprehensive Income, provides guidance on this topic.
7. Revenues are inflows, other asset enhancements, or liability settlements from delivering or producing goods, rendering services, or conducting other activities constituting the entity’s operations.
Revenues represent actual or expected cash inflows that have occurred or will occur as a result of the entity’s operations. Revenues increase assets in various forms, such as cash, claims against customers (accounts receivable), or non-cash goods or services received.
8. Expenses are outflows, using up assets, or incurring liabilities from delivering or producing goods, rendering services, or conducting other activities constituting the entity’s operations.
Expenses are actual or expected cash outflows that have occurred or will eventually occur as a result of the entity’s operations. The assets that flow out are used up, or the liabilities incurred may be different types. Examples are units of product produced and delivered, employee services used, equipment used, electric kilowatt hours consumed, or income taxes, etc. Similarly, the transactions or events producing expenses are called cost of goods sold, cost of services provided, depreciation expense, utility expense, rent expense, income tax expense, etc.
9. Gains are equity increases from peripheral or incidental transactions and from all other transactions and other events affecting the entity except those that result from revenues or investments by owners.

71
10. Losses are equity decreases from peripheral or incidental transactions and from all other transactions and other events affecting the entity except those that result from expenses or distributions to owners.
Gains and losses classification as operating or non-operating depends on their relation to the entity’s operations. Operating classification examples are asset impairment or writing down inventory to lower of cost or market. Non-operating classification depends on peripheral transactions to operations. Examples of peripheral transactions are sales of marketable security investments, dispositions of used equipment, or settling a liability at less than its carrying value.
Revenues and gains are similar, as are expenses and losses. There are, however, differences in the information conveyed. Revenues and expenses result from ongoing operations and are displayed as gross inflows or outflows. In contrast, gains and losses generally result from incidental or peripheral transactions and are displayed as net inflows or outflows, primarily classified as non-operating.
The nature of ongoing operations establishes operating versus non-operating classification. Items that are revenues and expenses for one entity may be gains or losses for another entity.
EXAMPLE
Transactions from investments in financial instruments will produce operating revenues and expenses for financial institutions but non-operating gains and losses for a manufacturer.
EXAMPLE
Technological changes will be operating revenue and expense for high technology and research & development entities but non-operating gains and losses for most other entity types.
EXAMPLE
Commodity price changes and foreign currency exchange rate changes occurring during periods of asset production or liabilities owned may directly or indirectly affect the amounts of revenues or expenses. However, these items are only sources of revenues and expenses for entities whose operations trade in foreign currencies or commodities.
Special Purpose Frameworks
This section introduces the accounting concept of special purpose frameworks and the types of special purpose frameworks (SPF).
Special purpose frameworks (SPFs) are designed to be alternatives to U.S. GAAP primarily for non-public or private entities. Special purpose frameworks have an accounting or financial reporting

72
foundation based on concepts different than generally accepted accounting principles (GAAP). These foundations include:
Tax basis – foundation is tax law
Financial Reporting Framework for SMEs – simplified system jointly developed by The AICPA and the Canadian Institute of Chartered Accountants
Cash and modified cash basis – foundation is cash receipts and cash disbursements
Contractual basis – foundation is the related contract
Regulatory basis – foundation is the related regulation
The Tax Basis (often referred to as “Income Tax Basis”) of accounting is a basis of accounting that the reporting entity uses to file its U.S. federal income tax return for the period covered by the financial statements. Accordingly, the framework for recognition and measurement of amounts and results are defined in the United States Internal Revenue Code (IRC). Prescribed disclosures, thus, are set forth as to providing meaningful and informative context while defining and describing the specific bases for income tax accounting recognition and measurement.
The practitioner must first consider whether utilization of the Tax Basis might be misleading to the users of financial statements. We will look at the applicable attributes of tax basis reporting and disclosure, attest and non-attest engagement considerations, and other aspects that represent compliance with the framework, and which must be considered in assessing the appropriateness of the reporting framework.
Since tax law may vary from year to year based on economic and political goals of the federal administration, proper knowledge and application of, and related disclosure of changes impacting comparability is also crucial (such as expiring special accelerating depreciation provisions, tax credits, or re-codified capitalization and expense guidance as provided in the 2014 Tangible Property Regulations).
FRF for SMEs is an AICPA initiative to create an additional special purpose framework as an alternative to U.S. GAAP.
The FRF for SMEs document is designed to be a self-contained and standalone framework, providing comprehensive guidance pertaining to the accounting principles intended to be the most appropriate for the preparation of smaller businesses’ financial statements, and based on the needs of bankers and other users, and focuses on the performance of the company and its assets, liabilities and cash flows.
The AICPA constructed the framework as a blend of traditional accounting principles combined with accrual income tax accounting so as to provide a familiar and intuitive reporting that should be easier understood by lenders, insurers, and other users of financial statements.
FRF for SMEs was developed as a special purpose framework (SPF) intended for small- to medium-sized entities that require reliable and comparable financial statements for internal and external use,

73
and such financial statements are not required to be prepared in accordance with U.S. GAAP. While there is not a definitive measure of whether an entity is an SME, the framework does identify specific characteristic indicators of an entity that would meet the guidance associated with an SME, and thus provide a basis for consideration for management the option to adopt FRF for SMEs as the accounting and reporting framework. Some of these characteristics include:
The entity does not have regulatory reporting requirements that would essentially require GAAP financial statements.
The majority of the owners and management do not intend to take the company “public.”
The entity is for-profit.
The entity is generally owner-managed (a closely-held enterprise in which the people who own a controlling interest are substantially the same people who manage/run the business).
Management/owners rely on financial statements to assess performance, cash flows, and managing assets and obligations (liabilities).
The entity is not in an industry involved in transactions requiring highly specialized accounting guidance (such as financial institutions or governmental entities).
Does not engage in overly complicated transactions.
Does not have significant foreign operations.
The key users of the entity’s financial statements have direct access to management and additional, supplemental financial data.
The users of the entity’s financial statements have a greater interest in cash flows, liquidity, financial position strength, and interest coverage.
The financial statements support applications for bank financing when the banker does not base a lending decision solely on the financial statements but also on available collateral, guarantees, and/or other evaluative mechanisms not directly related to the financial statements.
The Cash Basis of accounting is a basis of accounting that the reporting entity uses to record cash receipts and cash disbursements, along with modifications of the cash basis having substantial support by practitioners. Prescribed disclosures, thus, are set forth as providing meaningful and informative context while defining and describing the specific bases for recognition and measurement within the parameters of “cash” transactions.
The practitioner must first consider whether utilization of the Cash Basis is misleading to the users of financial statements. We will look at the applicable attributes of cash basis reporting and disclosure, attest and non-attest engagement considerations, and other aspects that represent compliance with the framework, and which must be considered in assessing the appropriateness of the reporting framework.
74
A strong working knowledge of GAAP is important when preparing cash basis financial statements. Understanding the differences between cash basis and GAAP, along with evaluating their impact on users requires a thorough knowledge of GAAP. The foundation of disclosure requirements under SPF are based on GAAP.
As few entities utilize a “pure” cash basis, the elected modifications must (1) have substantial support (the modification is a method equivalent to the accrual basis of accounting), and (2) must not be illogical (such as recording revenues under accrual method, but not recognizing trade/accrued payables). Inclusion of such measurement or recognition would constitute a reportable departure from the cash basis of reporting framework which must be evaluated the same as a practitioner would evaluate a GAAP departure from GAAP financial statements.
The Contractual Basis of accounting, previously called special purpose financial statements, is a basis of accounting that the reporting entity uses to comply with an agreement between the reporting entity and one or more third parties other than the auditor/accountant. The prescribed disclosures are set forth by the specific contract agreement along with many areas that would “default” to guidance under GAAP.
The practitioner must determine that the entity is required to report using a framework or measurement and recognition set forth in a contract of agreement rather than what might be a supplemental or special purpose report such as an incomplete information, specified elements, accounts or items report that may or may not require a contractual accounting framework. Reports issued using a contractual accounting basis must be a restricted use/limited distribution report.
While the parties to the contract or agreement determine the requirement for the contractual reporting framework requirement, a strong working knowledge of GAAP is essential in understanding the differences and the inherent implications of certain differences. Audited, reviewed or compiled financial reports/statements using the contractual basis of accounting, like other SPF bases, require knowledge of GAAP and can distinguish and assess the implications of those differences.
Generally, an entity reporting on the contractual basis as an SPF reporting framework is used primarily by the restricted-use third party relative to assessing compliance with the guiding contract or agreement. AU-C 800 for SPF reporting and two SSARS Interpretations (Special Purpose Financial Statements to Comply with Contractual Agreements or Regulatory Provision) provide some performance context in these SPF engagements.
The Regulatory Basis of accounting is a basis of accounting that the reporting entity uses to comply with the requirements or financial reporting provisions of a regulatory agency to whose jurisdiction the entity is subject. The prescribed disclosures are set forth by the specific regulatory or governmental agency along with many areas that would “default” to guidance under GAAP.
The practitioner must determine that the entity is in fact a regulated company required to report financial information to the federal, state, or local government agencies that regulate them. Usually, the regulating agency requires unique reporting requirements and information related to the specific regulated process. Some entities that may be called upon to report using the regulatory basis include

75
insurance companies, credit unions, construction contractors, certain state and local governmental entities, and even some nonprofits.
While the financial statements of most regulated companies may differ from GAAP, some regulated operations are covered by GAAP. ASC 980, Accounting for the Effects of Certain Types of Regulation, has applied to many public utilities. However, many of these utilities were moved off of GAAP under GASB 62 effective after December 15, 2011. Accordingly, the practitioner must know all prevailing standards for compliance.
Generally, an entity reporting on the regulatory basis as an SPF reporting framework used solely for filing with a governmental regulatory agency should include a separate paragraph at the end of the audit report (per AU-C 800 for SPF reporting), or specifically identify the reporting framework in the accountant’s compilation or review reports. Most often the report utilizing the regulatory basis of accounting will be a restricted use report, and thus state that the report is intended solely for the purpose for the information and use of those within the entity and the regulatory agencies to whose jurisdiction the entity is subject, and is not intended to be and should not be used by anyone other than the named specific parties.
THE NATURE OF FINANCIAL STATEMENTS
Financial statements are backward looking and explain what occurred in the past. Financial statement users interpret this historical operating performance and current financial condition to form the basis of assessing the nature, timing, and extent of future cash flows which determines entity value. This financial statement analysis requires obtaining an understanding of economics, finance, and accounting principles. Nevertheless, financial statements contain significant ambiguity resulting from management judgment, different accounting principle alternatives, and management’s position on financial reporting disclosure and transparency.
Thus far, this section has presented a conceptual understanding of the purposes of financial reporting and the financial reporting framework. This section discusses the three basic financial statements in detail and identifies techniques financial statement users can employ to analyze operations and financial condition.
Balance sheet – cumulative as of a specified date
Income statement – covers a specified period or range of dates
Cash flows – covers a specified period or range of dates concurrent with the income statement period and balance sheet date
Balance Sheet
The balance sheet is cumulative because it captures all transactions and management decisions since the entity was founded. It presents at a point in time the resources, or assets, that a reporting entity has to operate the business. The balance sheet also presents how these assets are funded among liabilities and equity. Furthermore, the order of the individual line items in the balance sheet is from highest liquidity at the top to lowest liquidity at the bottom.

76
Assets are measured at historical cost, with the exception of investments in marketable securities or assets that become impaired. Liabilities are generally measured at their present value.
The balance sheet portrays the accounting equation which is:
Assets = Liabilities + Owners’ Equity
Both sides of the equation can be grouped into three broad categories.
Assets or Uses of Funds Liabilities & Owners’ Equity or Sources of Funds
Current assets Current liabilities
Non-current (long-term) fixed assets Non-current (long-term) liabilities
Non-current (long-term) other assets Owners’ equity
Asset and liability classification as current or non-current provides important information to financial statement users for assessing liquidity as well as debt covenant compliance and debt availability.
Current assets and current liabilities are components of working capital. Net working capital is an important metric for analyzing financial condition, and its equation is:
Net Working Capital = Current Assets – Current Liabilities
Current assets are resources an entity needs (to be converted into cash) for its operating requirements in the short term which is one operating cycle or one year, whichever is longer. An operating cycle starts and ends with cash and is the amount of time it takes to complete the procurement and sales process in cash. Current liabilities are obligations expected to require the use of cash from current assets in the same short-term period.
Current assets consist primarily of: cash and cash equivalents, accounts receivable, inventory, prepaid expenses, and short-term marketable securities. The nature of each item and focus financial statement users should consider follow:
Cash appears on the balance sheet at face value and consists of currency, checks received, and bank deposits with no restrictions on daily withdraws. Cash equivalents are short-term investments with original maturity dates of 90 days or less. Investments with maturity dates between 91 days and 365 days are short-term marketable securities.
There are two important concerns a financial statement user should analyze about cash.
1. Restrictions are placed by creditors on the entity’s access to its cash. This is typical of debt covenants in loan agreements. The lender’s goal is to make sure the borrower has sufficient cash for its short-term needs and to make principal and interest payments.
Lending institutions generally require borrowers to dedicate all cash management activities with the lender, which generates fee income. Lenders may also require a minimum cash amount, which is called a compensating balance. Lenders benefit from the interest rate spread between

77
the very-low interest rate paid to the borrower and the higher rate received on loans. Thus, compensating balances increase the reporting entity’s effective interest rate for borrowing.
Restricted cash must be shown on a separate line in the balance sheet if the amount is material. The location would depend on the terms of the cash restriction because the balance sheet is ordered from highest to lowest liquidity. If the amount is not material, it would be disclosed parenthetically on the balance sheet or in the financial statement notes.
An additional restriction with consolidated financial statements is that not all of the cash may be available. For example, cash from one subsidiary legal entity may not be used to pay the obligations of another subsidiary legal entity. These situations would need disclosure in the financial statement notes.
EXAMPLE
We often receive questions from equity analysts or shareholders regarding the combination of high cash balances and high short-term revolver debt. Prudent cash management would suggest minimizing revolver debt by paying unused cash. Revolver debt has a measurable interest cost while cash balances for bank business accounts pay little or no interest income.
The explanation is due to cash restrictions, such as because cash in one subsidiary may not be used to pay obligations of a different subsidiary.
2. Prudent cash management can be a double-edged sword for reporting entities fortunate enough to have cash balances greater than their short-term operating needs. Cash earns little or no interest on deposits at a financial institution which makes it prudent to invest this cash in higher interest bearing financial instruments. In addition to the restrictions discussed above, companies need to adhere to their investment policy which is set by the board of directors or private owners as a part of their risk tolerance.
Prudent financial instruments that pay higher financial returns of interest, dividends, or capital gains may not fit within the company’s risk tolerance due to the risk of losing cash principal. Reporting entities that make these investments need to disclose its investment policy in the financial statement notes.
In addition, investment income should be classified as non-operating in the income statement as to not be misleading about true operating performance.
Trade accounts receivable results from granting delayed payment terms for customer sales. Users need to analyze revenue recognition when analyzing accounts receivable because accounts receivable result from credit sales. Accounts receivable are short-term credit extended to customers with no interest. Industry practice typically determines the credit period, which in general ranges between 30 and 60 days.
Financial statement users analyze a reporting entity’s accounts receivable as a part of assessing liquidity and working capital management. The most often accounts receivable metrics are turnover and days sales outstanding (DSO). These metrics measure how quickly the reporting entity’s

78
customers pay their invoices. Because accounts receivable typically have large balances, they also impact higher-level important indicators of entity valuation, such as asset turnover which is a component of return on assets. It is also a part of the cash cycle.
Important analytical approaches are to look at DSO trends and compare DSO with industry levels. This is only the starting point that may lead to secondary causal interpretation and insight that typically requires industry contact outside the reporting entity. For example:
DSO trend is getting shorter or has fewer days than the industry may be assessed as:
Favorable – generally true when it indicates reporting entity focuses on accounts receivable management or the entity has industry selling power
Unfavorable – may indicate an underlying liquidity problem because the reporting entity is offering expensive high early-payment discounts or needs to factor accounts receivable to get cash sooner. Terms of “2/10, net 30” mean the customer may take a 2% discount if it pays within ten days.
It may also indicate that the reporting entity is factoring accounts receivable. Factoring is where an entity sells, at a discount, its accounts receivable to a financial institution.
Short payment terms may be reducing sales because the reporting entity is not offering competitive terms within its industry.
DSO trend is getting longer or has more days than the industry may be assessed as:
Unfavorable – may indicate an undesirable industry competitive position, such as a lower-quality or obsolete product, poor distribution network, delivery delays, or lack of post-sale service capabilities. As a result of these weaknesses, the reporting entity needs to grant longer terms.
The entity may be reporting sales growth, which is favorable, but at the expense of reducing the credit-quality of customers. The expense comes from a higher allowance for doubtful account collections as well as from increased sales commission and management incentive compensation that resulted from increased risk and not better operational performance.
Accounts receivable must be reported on the balance sheet at net realizable value which is the amount expected to be ultimately collected. Accordingly, deductions from gross accounts receivable are expected discounts, allowances, and returns. Thus, the balance sheet reflects net accounts receivable.
Financial statement users must analyze the allowance for doubtful accounts. Important analytical approaches are to look at the allowance as a percent of accounts receivable and as a percent of sales. Next, evaluate the resulting trends and compare the result with industry levels.
An accounts receivable aging analysis provides a more sophisticated and accurate estimation of uncollectible accounts. Instead of applying a single bad debts percentage across all accounts which is used to accrue for the monthly allowance for doubtful accounts, an aging analysis stratifies accounts

79
receivable by the length of time it has gone unpaid and applies different collection percentages to each stratum. The older unpaid accounts receivable receive a lower collectability percentage.
Inventory is product held for sale in the ordinary course of business, and is pivotal for both retail and distribution companies that both acquire inventory for resale and manufacturing companies that make product. Entities capitalize inventory costs because they have future economic benefit. Inventory management is a balancing act of having enough to meet customer needs versus too much which has costs of storage, tracking, moving, insurance, financing, shrink, damage, and obsolescence.
Financial statement users analyze a reporting entity’s inventory levels as part of assessing liquidity and working capital management. The most frequent inventory metrics are turnover and days on hand (DOH). These metrics measure how efficiently the reporting entity can deliver product to customers. Because inventory typically has large balances, it also impacts higher-level important indicators of entity valuation, such as asset turnover which is a component of return on assets. It is also a part of the cash cycle.
Important analytical approaches are to look at DOH trends and compare DOH with industry levels. This is only the starting point as inventory analysis requires secondary analysis for financial statement users to conclude about a company’s inventory. For example:
Inventory costs – there are three product costs and standard cost variances that may be capitalized into inventory. Product costs are direct materials, direct labor, and manufacturing overhead. Direct materials and direct labor are fairly straightforward.
Manufacturing overhead and standard cost variances, however, require significant management judgment about amounts that are capitalized into inventory and amounts that are expensed in cost of goods sold as a period cost. Manufacturing overhead includes indirect costs of materials (supplies), labor (fringe benefits and factory supervisors and management), utilities, plant and equipment depreciation, property taxes, insurance, etc. Management judgment determines how to allocate these costs to products by a systematic and rational basis.
If a company has a standard cost system that determines inventory values, management provides significant judgment not only in establishing standard product cost for direct material, direct labor, and manufacturing overhead but also accounting for manufacturing variances. The conservative approach is to expense manufacturing variances as a period cost; however, many companies capitalize these costs into inventory as a product cost.
There is a trade-off between cost of goods sold on the income statement and inventory on the balance sheet. Thus, management judgment about manufacturing overhead classification and manufacturing variance capitalization into inventory or expensing into cost of goods sold impacts financial statement analysis of profitability and efficiency in opposite ways. Unfortunately, financial statement users need access to inside information to complete this analysis.
One sign of aggressive inventory cost and manufacturing variance capitalization is a lower of cost or net realizable value (LCNRV) adjustment at year end. ASC 330, Inventory, requires inventory be valued at lower of cost or net realizable value. ASU 2015-11, simplified inventory costing and defined “market” as net realizable value (recall above that accounts receivable are also valued at

80
net realizable value). Prior to ASU 2015-11, inventory costing was a complex calculation requiring three potential values of market.
When inventory cost is higher than market, it must be written down to net realizable value. Generally, unless there are interim-period indicators that inventory cost is greater than market, this LCNRV write down occurs at year-end. Thus, aggressive inventory cost capitalization can be misleading during interim periods because it delays expense recognition until the year-end LCNRV adjustment.
EXAMPLE
A company has a factory that is running at 75% of manufacturing capacity. The fixed manufacturing overhead costs are $600,000 per year comprised of the following:
How should the company allocate its fixed manufacturing overhead costs to inventory product costs?
Idle capacity costs should be period expenses in cost of goods sold. The company should expense $150,000 ($600,000 X (1-0.75)) in idle capacity costs each year.
If the inventory market value (net realizable value) exceeds the inventory carrying cost, no LCM adjustment occurs. The inventory continues to be valued at cost. On the other hand, if cost exceeds market, then the reporting entity establishes a LCM reserve which reduces the net inventory value with an offset to cost of goods sold. This is conservative because reporting entities immediately recognize an expense for inventory value decreases, but defers recognizing inventory value increases until future periods when the inventory is sold.
Determining market value (net realizable value) is subjective which requires significant management judgment.
Inventory cost flows – GAAP provides entities with different inventory cost flow method alternatives that impacts both ending inventory and cost of goods sold. The three alternatives are Average Cost, Last-In First-Out (LIFO), and First-In First-Out (FIFO).
Because the inventory cost flow method impacts cost allocation between both ending inventory and cost of goods sold, the method that management chooses impacts working capital, gross profit (and net income), and efficiency such as inventory turnover. Over the life of the entity, aggregate cost of goods sold will be the same with any inventory cost flow method; thus, the inventory cost flow method is a timing difference in cost recognition.

81
Cash flows are the same regardless of the inventory cost flow method chosen. On a secondary basis, there is a favorable cash flow impact from lower income taxes using LIFO during period of rising prices as long as inventory levels do not decrease.
Under FIFO, the oldest inventory flows first to cost of goods sold. Thus, during periods of rising prices, FIFO produces the highest profitability because the older inventory is carried at the lowest cost.
Under LIFO, the newest inventory flows first to cost of goods sold. Thus, during periods of rising prices, LIFO produces the lowest profitability because the newest inventory is carried at the highest cost.
Management judgment about inventory cost flow also impacts efficiency measurements in financial statement analysis. This is because inventory cost flow methodology has a trade-off between cost of goods sold on the income statement and inventory on the balance sheet.
ASC 340, Other Assets and Deferred Costs, provides guidance on prepaid expenses. Prepaid expenses have future economic value because they are amounts paid to secure the use of assets or the receipt of services at a future date or continuously over one or more future periods. Prepaid expenses will not be converted to cash, but are still classified as current assets because, if they were not prepaid, they would have required the use of current assets during the next twelve months.
Examples of prepaid expenses are insurance paid in advance, advertising paid in advance, rent paid in advance, and deposits on purchase orders issued to suppliers. Prepaid expenses must be consumed within twelve months to be classified as current assets. Prepayments that will be consumed in more than twelve months must be classified in other long-term assets.
Short-term marketable securities are investments in financial instrument investments that will mature in less than twelve months. This maturity may be the stated term of the financial instrument, such as a money market mutual fund or certificate of deposit, or where the reporting entity has both the intent and ability to convert the financial instrument into cash, such as publicly-traded marketable securities.
ASU 2016-01, Recognition and Measurement of Financial Assets and Financial Liabilities, updated ASC 825, Financial Instruments, provides guidance for accounting for short-term investments. The ASU became effective in 2018 for public companies and will be effective for non-public entities in 2020.
Furthermore, the ASU also separated GAAP for investments in debt and equity securities into separate topics. It amended ASC 320 to cover only investments in debt securities, and created a new topic, ASC 321, only for investments in equity securities.
Current liabilities are obligations an entity incurs (to be paid in cash or from other current assets) for its operating requirements in the short term which is one operating cycle or one year, whichever is longer. They include both operating and financing activities; however, classification depends on timing of satisfying the liability instead of their nature.

82
Current liabilities may have significantly greater management judgment than current assets because many current liabilities are future obligations. Examples of judgment are the liability’s future value, discount rate to arrive at its present value, or estimating contingent liabilities.
Current liabilities consist primarily of: accounts payable, accrued expenses, deferred revenues, short-term debt as well as the current portion of long-term debt. The nature of each item and focus financial statement users should consider follow.
Trade accounts payable result from suppliers granting deferred payment for purchases of products, such as inventory, or services, such as legal fees. Accounts payable are short-term credit extended by suppliers with no interest, and often with no written contract.
Financial statement users need to analyze cost of goods sold when analyzing accounts payable because inventory purchases is generally the predominant component in accounts payable. “Predominant” means that non-trade items may comprise accounts payable, making this an imperfect measure of trade activity. Examples of non-trade items are corporate or operating expense items such as dividends payable, taxes payable, legal or office items, and amounts owed for investing activities such as building construction or equipment purchases.
The most often accounts payable metrics are turnover and days payable outstanding (DPO). These metrics measure how quickly the reporting entity pays its suppliers. Accounts payable are also a part of the cash cycle.
Important analytical approaches are to look at DPO trends and compare DPO with industry levels. This is only the starting point that may lead to secondary causal interpretation and insight that typically requires industry contact outside the reporting entity. For example:
DPO trend is getting shorter or has fewer days than the industry may be assessed as:
Favorable – generally true when it indicates the reporting entity has strong cash flow or excess cash and is taking advantage of its suppliers’ early-payment discounts. Terms of “2/10, net 30” mean the reporting entity may take a 2% discount if it pays within ten days.
Unfavorable – may indicate an underlying liquidity problem because the suppliers have reduced their credit terms because the reporting entity’s financial risk.
It may also indicate that the company has suppliers with increasing financial risk that need to be paid sooner to survive. This situation may indicate operating risk at the reporting entity if its suppliers cannot fulfill their obligations which, in turn, may impede the reporting entity’s ability to fulfill their customer needs.
DPO trend is getting longer or has more days than the industry may be assessed as:
Favorable – generally true when it indicated reporting entity focus on accounts payable management or the entity has industry buying power. Furthermore, it may be receiving free financing from its suppliers.

83
Unfavorable – may indicate an undesirable industry competitive position, weak financial condition, or deteriorating cash flows. As a result, the reporting entity needs to rely on its suppliers as a source of financing to maintain liquidity or solvency.
Slowing payments to suppliers can increase operational risk if it damages supplier business relationships. Suppliers may retaliate with price increases or delivery delays because of giving priority to better customers.
The operating cycle is an important indicator of a reporting entity’s working capital management and liquidity. The operating cycle is the amount of time to convert inventory into cash and is shown as:
DPO DOH
cash inventory accounts receivable DSO
Operating Cycle = DSO + DOH – DPO
EXAMPLE
Mark Company has the following working capital efficiency metrics:
Inventory days of 110, days sales in accounts receivable of 75, and days cost of goods sold in accounts payable of 60.
What is Mark’s operating cycle in days?
Operating cycle = DOH + DSO + DPO = 110 + 75 – 60 = 125 day
Reporting entities create accrued expenses as a result of the matching principal, which is one of the basic underlying guidelines in accounting. The matching principle directs a company to report an expense on its income statement in the same period as the related revenues.
This is the foundation for accrual accounting that recognizes expenses when they are incurred instead of when paid. Examples are accruing for utilities costs at month end even though no invoice has been received or accruing for salaries at month end that are not paid until the next payroll date.
Customer advance payments are classified as deferred revenue (whose nomenclature will change to “contract liability” under ASC 606, Revenue from Contracts with Customers, the new revenue recognition standard). These receipts are liabilities and not revenues because the sales-entity performance obligations have not been completed. If the sales-entity will perform this future obligation in less than twelve months, then the customer advance payment is a current liability.

84
Examples of deferred revenue is security deposits, gift certificates, airline tickets, and magazine subscriptions. The conceptual equivalent in current assets of the liability-deferred revenue is prepaid expense.
There are other types of short-term liabilities that may be combined within accrued expenses or other current liabilities. Examples are amounts collected for other entities, such as sales taxes and payroll taxes collected for governments; income taxes that are remitted quarterly; and incentive compensation such as profit sharing and bonus payments that will be paid after determining year-end financial performance.
Warranty liability is a part of short-term liabilities, and may need to be allocated between current and non-current liabilities if the warranty period extends beyond year after the sale. Product warranty is a selling entity’s obligation to correct product quality or performance deficiencies.
Warranty liability requires management judgment to estimate due to its future and uncertain nature. This warranty cost judgment is similar to the bad debt expense and allowance for doubtful account judgments introduced earlier in this section in that management bias can influence the accounting. Reporting entities introducing a substantial number of new products may need to accelerate the warranty accrual basis because newly introduced products generally have higher warranty costs than mature products.
Thus, the financial statement user analyzing warranty performance needs to perform a trend analysis by comparing actual warranty costs accrued and incurred as a percent of sales (sales should be lagged to match timing). Not only does this analysis analyze product profitability but it also indicates future sales potential because poor product quality generally impacts future sales volume.
ASC 460, Guarantees, provides guidance for warranty accounting. It requires guarantee disclosure even if performance may be a remote possibility. A reporting entity’s obligation to stand ready to perform is not a contingency (ASC 450), and thus meets the liability definition.
For product warranties, ASC 460 requires disclosing the warranty policy and method used to calculate the warranty liability. It also requires warranty liability roll-forward disclosure. This roll-forward shows increases to the warranty reserve and decreases from actual warranty costs incurred.
A selling-entity estimates and accrues warranty expense in the same period that it recognizes revenue under the matching principle. This reduces net income in the sale period. Subsequent warranty costs actually incurred are charged against this warranty liability and not current earnings.
Short-term debt includes bank lines of credit, commercial paper, and short-term bank loans. These are important items for financial statement user analysis to indicate reporting entity liquidity and solvency. Analyzing short-term debt trend increases or decreases may indicate either favorable or unfavorable situations. For example, a decreasing trend may favorably indicate improving cash flow or it may unfavorably indicate banks have reduced the entity’s credit lines due to increased financial risk at the reporting entity.

85
Important disclosure in the notes to the financial statements are credit availability which indicates liquidity and solvency. Entities typically establish short-term revolving debt with financial institutions, and the amount of debt available may be based on a formula that indicates asset strength, liquidity, or cash flows. Credit availability is reduced by current short-term borrowing so financial statement users need to assess unused borrowing capacity which is calculated as follows:
Unused borrowing capacity = maximum amount of credit available – current borrowing
A balance sheet vertical, or common size, analysis is also a tool for financial statement users analyzing short-term borrowings. The vertical analysis removes absolute size from the analysis and focuses on relative size. Looking at short-term debt as a percent of total assets over time shows whether the reporting entity is funding more or less of its assets from short-term debt.
Similar to short-term debt is the current portion of long-term debt. This means the amount of long-term borrowings that must be paid back over the next twelve months. Long-term debt principal is generally paid back as a part of debt amortization, such as with a mortgage, or through periodic balloon payments.
A shortcoming of users performing a liquidity analysis on the current portion of long-term debt is that it is a cliff amount. A sizeable debt balloon payment due in thirteen months is still reflected in long-term debt which may falsely make near-term liquidity look acceptable. A user financial statement analysis of near-term liquidity should be corroborated by reading the note to the financial statements disclosing payment obligations over the future five years to check for required cliff debt payment obligations.
Non-current assets include property, plant, & equipment which comprises a significant portion of total assets for manufacturing companies. Thus, it is prudent to analyze changes in fixed assets. In addition to the significant initial cost, the total cost flows through the income statement as depreciation expense over a long period of time.
ASC 360, Property, Plant, & Equipment, provides guidance for fixed assets and requires the following disclosures.
Balances of major classes of depreciable assets, such as property, buildings, machinery & equipment, and vehicles
Depreciation expense for each period presented in the financial statements
Accumulated depreciation by major asset class or in total
The methods used to calculate depreciation expense
This information provides the financial statement user analyzing operating performance and projecting future cash flows. For example, one can understand new fixed asset investments to support volume growth, and determine the impact of fixed asset divestitures or retirements.
Analyzing changes in fixed assets, without having inside information, is not straightforward due to depreciation, disposals, and non-recurring write-offs that affect the account balances.

86
EXAMPLE
Mark Company reports the following fixed asset information for the year and does not provide cash flow statements. Full-year depreciation expense was $349K. Analyze Mark’s fixed assets changes, determine the amount of new fixed asset investments and whether there were any divestitures or retirements.
Stage 1 Analysis
Calculate the horizontal and vertical changes
The horizontal analysis shows $394K in fixed asset additions, is this truly the amount of new fixed assets acquired?
The relative amount of accumulated depreciation increased by 6% points over the year which is much higher than expected. This may indicate a non-recurring fixed asset write-down.
On the other hand, the $233K absolute increase in accumulated depreciation was less than the $349K depreciation expense. One would expect these two figures to be the same in the absence of dispositions, which must have occurred.
Assumption: in the absence of disclosure, assume that the unexplained difference in accumulated depreciation was due to disposing of a fully-depreciated asset.
There are two alternative assumptions. First is an asset sale, but a sale would be complicated by a gain or loss. Second is a business combination, which has its own complexities. Thus, our asset disposal assumption provides a clearer analysis.
The estimate of the asset disposal is calculated by:
$233 Increase in accumulated depreciation
(349) Depreciation expense, or the expected increase in accumulated depreciation
(116) Unexplained difference assumed to be a fully-depreciated asset disposal
$000 20x7 20x6
Gross Fixed Assets 4,127$ 3,733$
Less: Accumulated Depreciation (2,173) (1,940)
Net Fixed Assets 1,954 1,793
$000 20x7 20x6 Gross Fixed Assets 4,127$ 3,733$ 394$
Less: Accumulated Depreciation (2,173) (1,940) (233)
Net Fixed Assets 1,954 1,793 161
As a % of Gross Fixed Assets
Gross Fixed Assets 100% 100% 100%
Less: Accumulated Depreciation ‐53% ‐52% ‐59%
Net Fixed Assets 47% 48% 41%

87
Using the relationships above, we calculate that new fixed assets purchased were $510K. We also corroborate our answer by reconciling accumulated depreciation with depreciation expense at $349K and by reconciling our change in net fixed assets.
We conclude that Mark Company needs significantly greater investment in fixed assets to support growth than originally appeared on the face of the balance sheet.
Other long-term assets can include many different types of assets. This section focused on the most common types of:
Goodwill
Other intangible assets such as patents and trademarks
Investments
ASC 350, Intangibles – Goodwill and Other, provides guidance for goodwill and other intangible assets. In addition, ASC 805, Business Combinations, provides guidance to identify and measure intangible assets acquired in a business combination.
There are two intangible assets categories based on the assets’ life:
1. Indefinite life – goodwill and other intangible assets are not amortized and, thus, must be tested annually for impairment.
The FASB endorsed two Private Company Council (PCC) recommendations for private companies that allowed amortizing goodwill for up to ten years, simplifying goodwill impairment
Gross Fixed Assets
Beginning balance 31‐Dec‐x6 3,733$
+ Purchases <= solve for one unknown = 510$
‐ Disposals (116)
= Ending balance 31‐Dec‐x7 4,127
Accumulated Depreciation
Beginning balance 31‐Dec‐x6 1,940$
+ Depreciation Expense <= solve for one unknown = 349$
‐ Disposals (116)
= Ending balance 31‐Dec‐x7 2,173
Net Fixed Assets
Beginning balance 31‐Dec‐x6 1,793$
+ Purchases 510
‐ Depreciation Expense (349)
= Ending balance 31‐Dec‐x7 1,954

88
testing from a two-step test to a one-step test, and simplifying intangible asset recognition and measurement from business combinations. Private companies may elect these two GAAP alternatives:
ASU 2014-02 – Intangibles – Goodwill and Other (Topic 350): Accounting for Goodwill (a consensus of the Private Company Council)
ASU 2014-18 – Business Combinations (Topic 805): Accounting for Identifiable Intangible Assets in a Business Combination (a consensus of the Private Company Council)
ASU 2017-04 (Topic 350): Simplifying the Test for Goodwill Impairment, followed the PCC and simplified goodwill impairment testing from a two-step test to a one-step test. Unlike the PCC (ASU 2014-02) which created an accounting election, ASU 2017-04 makes the one-step test mandatory. The effective date is 2020 for public entities, 2021 for public entities that do not file with the SEC, and 2022 for all other entities. Early adoption was permitted as early as January 1, 2017 as long as financial statements were not previously filed.
2. Definite life – other intangible assets are amortized and, thus, only tested for impairment when there is an impairment indicator (trigger). This is similar to guidance for tangible assets.
Goodwill is defined as “an asset representing the future economic benefits arising from other assets acquired in a business combination that are not individually identified and separately recognized.” It results from paying more than the fair value of the identifiable net assets in a business combination.
ASC 805, Business Combinations, guides goodwill recognition and measurement for acquisitions of less than 100% of the target business. Reporting entities measure the resulting non-controlling interest at fair value which means the reporting entity does not reduce the goodwill measurement for the non-controlling interest.
Intangible asset disclosures help the financial statement user analyze the origination and economic justification for these intangible assets. Disclosures also indicate the facts and circumstances that created intangible asset impairment and the financial statement lines impacted which can be important indicators for the financial statement user to assess future cash flows.
Intangible asset presentation on the balance sheet must separate goodwill on its own line and a separate intangible assets other than goodwill on an aggregate line or separate lines, depending on materiality. The notes to the financial statements provide further disclosure detail for indefinite life and definite life intangible assets.
Intangible asset amortization for goodwill and intangible assets other than goodwill must be shown separately. The amortizable life by asset class is disclosed as well. In the year of the business combination, the intangible asset additions need to be disclosed separately for each acquisition.
Investments. Entities with idle cash, and a board-approved investment policy, may make investments in other entities’ financial instruments, generally marketable securities such as stocks and bonds. Investments are generally presented at their fair market value.

89
Investments are important indicators of liquidity and solvency; however, they are not directly a determinant in financial ratios. Because of this, financial statement users may consider investments as a secondary step in profitability and efficiency ratio analysis.
Non-current liabilities follow the guidance in ASC 470, Debt, provides guidance for liability measurement and classification. The general classification rule between current and non-current liabilities is straightforward as current liabilities are due within one year. ASC 470 does not distinguish between substantive and non-substantive issues, especially with debt classification. For example, tripping a minor debt covenant such as a deadline for submitting financial statements or a debt compliance certificate triggers the due-on-demand clause in a loan agreement just as would occur with major violations. In practice, however, diversity exists.
Auditor peer reviewers have found many cases where reporting entities continued to classify debt as current even though its maturity date was less than twelve months or there was a violated debt covenant which caused the debt to become due on demand. Private company financial statement users need insider information to fully analyze this debt status.
ASC 470 requires current classification for liabilities under any of the following circumstances.
1. Due on demand
2. Due on demand within one year, even if liquidation is not expected within the year
3. Long-term debt that is callable because of a debt agreement violation unless the creditor has waived or subsequently lost the right to demand payment.
Long-term debt should be classified as noncurrent unless both of the following two conditions exist:
a. There is a debt covenant violation at the balance sheet date or a violation would have occurred if the loan was not modified
b. It is probable that the default would not be cured or a covenant breach would not be cured at measurement dates within the next twelve months
If a debt violation is cured after the balance sheet date and the debt is not callable at the time the financial statements are issued, then the debt can be classified as noncurrent, provided the debt instrument does not give the creditor a call privilege after the violation has been cured.
4. Long-term debt that will be callable by the creditor if a violation is not cured within a specified grace period. In this situation, the debt should be classified as current unless it is probable that the ovulation will be cured during the grace period. If the debt is classified as noncurrent, then the reporting entity needs to disclose the facts and circumstances determining the classification.
If a loan agreement has a “lock-box” provision, the provision’s terms may impact debt classification. If the provision automatically applies a reporting entity’s cash collections against its debt, then the debt must be classified as current. However, if the provision is a springing arrangement, then the debt remains as noncurrent. A springing arrangement is one where cash

90
collections are deposited in the reporting entity’s bank account and do not automatically pay down the debt unless the creditor exercises its subjective acceleration clause or another triggering event takes place.
If the debt agreement includes a subjective acceleration clause, then the reporting entity must assess the probability of the creditor invoking the clause. If the probability is remote, then the debt classification remains noncurrent.
ASC 450, Contingencies, provides guidance for contingency recording, measurement, and disclosure. Loss contingency accounting and disclosure are based on whether a loss is assessed as probable, possible, or remote.
Contingent losses are accrued and disclosed if both of the following conditions exist:
1. The future confirming event is probable.
2. The loss amount can be reasonably estimated. If the estimate is a range, then accrue the best estimate. If all outcomes in the range are equally likely, then accrue the minimum amount in the range and disclose the range.
Contingent losses are disclosed but not accrued if either of the following conditions exist:
1. A loss is probable but cannot be estimated. Disclose the nature of the loss and that the reporting entity cannot make an estimate.
2. A loss is assessed to be reasonably possible. Disclose the nature of the loss and an estimate of the amount or a range of amounts. Also disclose if it is not possible to make an estimate.
Gain contingencies are normally not recorded. Rarely, if collection is assured soon after year end, a receivable may be recorded. Disclosure should be made of unrecorded contingencies that may result in gains. The disclosure, however, should not imply that the gain will be realized.
Restructuring reserves, by their nature, create opportunity for management financial reporting abuse, and financial statement users analyzing operating performance need to pay close attention to these liabilities. One abuse is when reporting entities frequently report “one-time” restructuring charges which create restructuring liability reserves. Furthermore, reporting entity press releases often include non-GAAP financial reporting outcomes that excludes restructuring charges from operating performance.
ASC 420, Exit or Disposal Cost Obligations, provides guidance for restructuring reserve liabilities. It defines exit or disposal costs as:
Involuntary termination benefits under an arrangement that did not exist previously and does not constitute a deferred compensation arrangement

91
Costs to terminate contracts other than capital leases (ASC 840, soon to be superseded by ASC 842, provides lease guidance)
Costs to consolidate facilities or relocate employees
Public reporting entities have included items in restructuring charges such as: special warranty accruals, inventory write-downs, asset write-downs, impaired investments, and idled or closed facilities.
ASC 505, Equity, codifies disclosure requirements for capital structure and applies to all entities, public and non-public, that have issued equity securities.
Equity disclosures reflect two overriding objectives:
1. Disclose for each account within stockholders’ equity all changes in amounts and number of shares
2. Describe all special features of each equity account, such as rights, privileges, special features, restrictions, etc.
Equity disclosures may be presented on the face of the basic financial statements, in the financial statement notes, or in a separate financial statement such as the statement of retained earnings or statement of changes in stockholders’ equity. Most reporting entities use a combination of these presentations.
Each class of common stock and preferred stock requires separate disclosure for the par value per share and the number of shares authorized, issued, and outstanding. It also requires special feature descriptions such as dividend and liquidation preferences, participation rights, call provision terms, conversion provision terms, sinking fund requirements, contract terms for issuing additional shares, unusual voting rights, and redemption requirements for each of the next five years.
Additional preferred stock disclosures are liquidation preference, especially if there are more than one class of preferred stock; aggregate or per-share amounts if the reporting entity can call or redeem the shares; aggregate and per-share amounts of cumulative preferred dividends in arrears, if any.
Disclosures for unretired treasury stock are the number of shares, valuation basis, and any treasury stock restrictions such as restrictions imposed by state laws. Some state laws prohibit treasury stock. Treasury stock is presented as a deduction from shareholders’ equity and never as an asset.
Disclosures for retained earnings include any restrictions on dividends, such as imposed by debt covenants, or appropriations which must be disclosed separately on the face of the balance sheet.

92
Income Statement
The income statement should present all significant items of revenues and expenses. Specific disclosure requirements exist for certain earnings and expense categories. The basic income statement format separates operating from non-operating items and is shown below:
Sales or Revenues
- Cost of Goods Sold
= Gross Profit
- Selling, General, & Administrative Expenses
- Unusual or Infrequent Items
= Operating Income
+- Interest (Income)/Expense
+- (Gains)/Losses
+- Net Income (Loss) in Equity Method Investments
Income Before Taxes
- Income Taxes
= Net Income (Loss) from Continuing Operations
+- Net Income (Loss) from Discontinued Operations
= Net Income
Statement of Financial Accounting Concepts No. 5, Recognition and Measurement in Financial Statements of a Business Enterprise, discusses categories of earnings. Special categories of earnings include:
1. Unusual or Infrequent Gains and Losses – They should be presented as separate line items within income from continuing operations, and may also be included in disclosures required for sales of investments, contingencies, etc., covered in previous sections.
2. Discontinued Operations – ASC 205, Presentation of Financial Statements, provides accounting guidance for discontinued operations. ASU 2014-08, Discontinued Operations, significantly changed previous guidance by redefining what constituted a discontinued operation and revised discontinued operations disclosures. The update made it more difficult for transactions to qualify for discontinued operations treatment. Some important points about discontinued operations are:
a. Assets held for sale, whether or not they are part of discontinued operations, are carried at the lower of net carrying amounts or fair value less costs to sell (rather than net realizable value). Assets and related liabilities held for sale must be separately disclosed on the face of the balance sheet or in the notes. Depreciation ceases for assets classified as held for sale.

93
b. Estimated future operating losses from discontinued operations are not recognized before they occur. Rather, the discontinued operations section of the income statement reflects only the results of operations for the period and realized losses on asset disposal.
c. A significant change with ASU 2014-08 is that entities with discontinued operations may now have 1) significant continuing involvement and 2) continuing cash flows with the discontinued operation.
FASB income statement guidance is in ASC 205, Presentation of Financial Statements. For discontinued operations, this guidance requires:
a. Discontinued operations, net of applicable income taxes, be shown separately from continuing operations
b. Discontinued operations are generally shown as a single amount that includes:
Income/(loss) from operations, net of tax, including changes in carrying amounts
Gain or loss on disposals – this amount must be disclosed on the face of the statements or in the notes
c. Any adjustments to amounts previously reported in discontinued operations (due to changes in estimates) must be shown separately in current period discontinued operations.
d. Discontinued operations disclosures for periods when a discontinued operation either has been disposed of or is classified as held for sale:
The facts and circumstances leading to the disposal or expected disposal
The expected manner and timing of that disposal
If not separately presented on the face of the income statement (or statement of activities for a not-for-profit entity) as part of discontinued operations, the gain or loss recognized on the disposal
If applicable, the segment(s) in which the discontinued operation is reported

94
EXAMPLE
Income Statement (in part) Discontinued Operations
NOTE X: DISCOUNTED OPERATIONS
In 20X1, the Company closed its Virginia operations due to reduced sales and continued operating losses. In 20X1, the Virginia operations generated gross revenue of $1,000,000 and pre-tax losses of $900,000. All assets have been sold for a loss of $400,000.
3. Changes in Accounting Principle – ASC 250, Accounting Changes and Error Corrections, provides guidance requiring retrospective adjustment of all periods presented. In effect, ASC 250 accounts for these changes as if the new accounting treatment was always in effect, which is mechanically equivalent to a restatement.
ASC 250 applies to voluntary accounting changes; it does not apply to transition rules in new standards. Each new accounting pronouncement includes specific guidance on transition, often involving a simplification of retrospective treatment and/or disclosures that would otherwise apply to changes in accounting principle.
The guidance also does not apply to changes from one acceptable depreciation method to another for assets placed in service in prior years. A change in depreciation method is a change in estimate, with the effects handled prospectively.
In practice, voluntary changes from one acceptable method to another are rare, as examples where GAAP allows such latitude are dwindling. When a reporting entity incurs this change, the guidance requires:
The “cumulative effect” on all periods prior to those presented adjusts the book value of assets and liabilities as of the beginning of the earliest period presented. For example, if the

95
entity changes its method of valuing inventory in 20X1 but also presents 20X0 comparative statements. The cumulative effect would restate inventory as of the beginning of 20X0.
Beginning retained earnings is adjusted for the change made to assets and liabilities as of the beginning of the earliest period presented.
Statements for each prior period presented are “restated” to show the effect of the change on that specific period.
EXAMPLE
NOTE 6: CHANGE IN INVENTORY VALUATION METHODS
Inventories are stated at the lower of cost or market. Cost, which includes material, labor, and factory overhead, is determined on a FIFO basis.
Prior to January 1, 20X9, we valued certain inventories under the LIFO cost method. As of January 1, 20X9, we changed our method of accounting for these inventories from the LIFO method to the FIFO method. As of December 31, 20X8, the inventories for which the LIFO method of accounting was applied represented approximately 85% of total net inventories. We believe that this change is to a preferable method which better reflects the current cost of inventory on our consolidated balance sheets. Additionally, this change conforms all of our worldwide inventories to a consistent inventory costing method and provides better comparability to our peers.
We applied this change in accounting principle retrospectively to all prior periods presented herein in accordance with ASC 250 “Accounting Changes and Error Corrections.” As a result of this accounting change, our retained earnings as of December 31, 20X6 decreased to $621.2 million using the FIFO method from $638.6 million as originally reported using the LIFO method. The following tables summarize the effect of the accounting change on our consolidated financial statements.

96

97

98
EXAMPLE

99

100

101
REVENUE – NEW REVENUE RECOGNITION STANDARD
This section covers only the basics of the new revenue recognition (ASC 606, Revenue from Contracts with Customers) standard and applying the new standard to financial statement analysis.
ASC 606 applies to any entity that enters into contracts with customers. In this context, the definitions are:
A contract is any agreement (written, verbal, or implied) between two or more parties that creates enforceable rights and obligations.
A customer is “a party that has contracted with an entity to obtain goods and services that are an output of the entity’s ordinary activities.”
ASC 606 defines a new core principle for recognizing revenue:
“[A]n entity shall recognize revenue to depict the transfer of promised goods or services to customers in an amount that reflects the consideration to which the entity expects to be entitled in exchange for those goods or services.”
This core principle differs significantly from the prior core principle of revenue recognition under U.S. GAAP. Specifically eliminated from prior guidance are:
The concept of an earning process
The concepts of realization and realizability
Instead, the core principle is based on concepts that do not have as much significance in current revenue-accounting standards. Going forward:
The concept of transferring promised goods or services to customers would be essential to the timing of revenue recognition (i.e., when to recognize revenue)
The concept of consideration to which the entity expects to be entitled would be essential to the measurement of recognized revenue (i.e., how much revenue to recognize)
A reporting entity should consider the terms of the contract and all relevant facts and circumstances. In addition, application of this guidance, including the use of any available practical expedients, should be followed consistently to contracts with similar characteristics and similar circumstances.
Although the guidance specifies the accounting for an individual contract, as a practical expedient, the guidance may be applied to a portfolio of contracts (or performance obligations) with similar characteristics as long as the application to a portfolio vs. individual contracts would not result in a material difference on the financial statements.

102
A reporting entity recognizes revenue in accordance with the core principle by applying the following five steps to the revenue recognition process:
1. Identify the contracts
2. Identify the performance obligations in the contract
3. Determine the transaction price
4. Allocate the transaction price to the performance obligations in the contract
5. Recognize revenue when (or as) the entity satisfies a performance obligation – transfer of control
Several of the words and phrases used in the above description of five-step procedure have been defined very specifically within the context of the standard. Those words and phrases and their definitions will be explained throughout this section of the program.
Business implications – how will ASC 606 impact current financial reporting practices and financial statement user analysis?
For many customer sales contracts, such as the typical retail transaction, ASC 606 will have little, if any, effect on the amounts and timing of revenue recognition. This is not true for all sales transactions because the “how” of revenue recognition and reporting will change profoundly. This will have significant implications for financial statement preparation and, naturally, for user financial statement analysis.
This section discusses selected transaction-specific or entity-specific impacts as well as broader implications. Specific impacts immediately follow:
In determining a contract transaction price and allocating it to the contract’s separate performance obligations, reporting entity management must use more judgment than with prior revenue recognition guidance. An example is determining stand-alone selling prices for each contract performance obligation. The most judgment will apply to customer contracts with variable-consideration provisions.
A greater number of reporting entities will become eligible for a proportional-performance revenue recognition model. This is similar to the ASC 605 percentage-of-completion method; however, the new guidance does not have the unique assets and liabilities currently associated with the percentage-of-completion method.
The reason for the greater proportional-performance revenue recognition is there will become more ways to measure progress toward a performance obligation’s complete satisfaction over time than under the percentage-of-completion method.
More contract-acquisition costs would be capitalized and expensed over time, rather than expensed as incurred under the prior guidance. Other contract-acquisition costs would be expensed as incurred rather than capitalized and expensed over time under the prior guidance.

103
Under prior guidance, selling reporting entities could elect to include in revenue sales taxes and excise taxes that it collects from customers and remits to governments. New guidance requires excluding these taxes from revenues.
For contracts with customers denominated in a foreign currency, the selling entity’s accounting for foreign-currency transactions may become more complex depending on the timing patterns of contract performance and consideration received.
There are also broader new revenue recognition implications on user financial statement analysis. Following are key areas that may impact user financial statement analysis.
Key performance indicators (KPIs) and other performance-evaluation metrics. Revenue is a widely-used KPI. Financial statement users need to determine the financial statement impact from changing accounting standards versus from operational performance.
Incentive compensation plans. Revenue impacts, directly or indirectly, many incentive compensation plans, for executives, employee profit-sharing, and sales commissions. Financial statement users need to assess the appropriateness of compensation expense changes with revenue and profit growth.
Business combinations contingent consideration. Revenue impacts many contingent consideration arrangements either directly or indirectly. Acquirers and acquires may need to adjust their contingent consideration projections.
Loan covenants and other contractual credit arrangements. Borrowers are usually bound by covenants based on financial ratios. Financial statement users need to assess the impact of changing accounting standards on financial ratios not only to differentiate operating performance from accounting standards changes, but also to assess the potential for debt covenant compliance impacting liquidity and solvency.
General contractual agreements. Some customer and government contracts contain revenue provisions that may be impacted by new revenue recognition guidance. Examples are pricing based on volume, sales rebates, or take-or-pay minimums.
Dividend policy and statutory limits on dividend-paying ability based on capital structure. The impact of changing accounting standards on a reporting entity’s income statement and balance sheet could change retained earnings and net worth. In turn, these may move the reporting entity from in-compliance to out-of-compliance.
Note disclosures about new accounting pronouncements’ impact on financial statements. GAAP and the SEC require reporting entities to disclose anticipated impacts from accounting guidance changes. Financial statement users need to assess the future financial impacts beyond management estimates.

104
Governance, risk, and compliance (GRC) issues. In addition to external financial statement users, internal owners and boards of directors also need to understand the impact of new accounting guidance on financial statements. All GRC participants need to be aware and understand financial changes and the causes behind these changes.
Tax impacts. Changes in financial accounting for revenue and related costs can create different timing differences versus tax rules. This may impact a reporting entity’s recognition and measurement of deferred tax assets and liabilities.
Statutory reporting. New accounting guidance also impacts financial reporting entities in regulated industries. Specifically, it may impact rate-setting and expense recovery. Financial statement users need to assess the magnitude of these impacts.
Operating Expenses. Financial statement users need to analyze operating expenses horizontally and vertically. Financial statement notes provide important disclosures of dollar amounts and descriptions about the reporting entity’s policies and expense classification on the income statement.
One caveat is that expense disclosures that appear only in schedules or information labeled “supplemental” are not in accordance with GAAP. This is because supplemental data is identified as information not required by GAAP and, unlike the notes, are not an integral part of the financial statements.
Some specific operating expense accounting that is relevant to financial statement users follows:
1. Shipping and handling costs – Prior revenue recognition guidance in ASC 605 requires shipping and handling to be reported “gross”, with charges to customers in revenue and related costs classified as expenses. The costs may be included in either Cost of Sales or another category of expense; if material and not included in Cost of Sales, disclosure must be made of the amount of these costs and where they are reflected in the income statement.
2. Expense amounts of depreciation and amortization, pension, rent, and interest are required disclosures if they are not listed separately on the face of the income statement. The amounts shown on the income statement may not represent the total amount incurred. Examples are when some of these items are capitalized, such as capitalized interest, product costs in inventory, and discontinued operations.
3. Advertising expense – This expense not only includes traditional advertising (such as print and media ads), but also catalogs, point-of-sale materials, sponsorship of special events, etc. ASC 720-35 permits advertising costs to be expensed either as incurred, or the first time the advertising takes place.
This distinction may appear trivial, but can be significant if prolonged production predates the publication or dissemination of advertising, or costs are incurred near year end. For example, assume a calendar year company produces a costly annual January catalog; as a result, the timing of expenses incurred near year end could fall in December in some years and January in others. If the company’s accounting policy is to expense costs as incurred, there is a potential doubling up in some years, with no expense in others. (Arbitrary deferral to avoid doubling up would smooth
105
out expenses, but violate the policy.) Choosing instead to expense the costs when the advertising first appears would ensure that the related costs are expensed each January, when the catalog is distributed. Any costs incurred before year end would be deferred.
Therefore, in addition to disclosing the amount of advertising expense, the accounting policy must also be disclosed.
EXAMPLE
NOTE 1: SUMMARY OF SIGNIFICANT ACCOUNTING POLICIES (IN PART)
Advertising expense includes costs for production and distribution of catalogs, print ads, and internet advertising. The Company expenses these costs when the advertising first appears. Advertising expense was approximately $215,000 and $205,000 for the years ended December 31, 20X2 and 20X1, respectively.
(This disclosure could also be presented in a separate note for advertising.)
4. Income Taxes and Deferred Taxes – ASU 2015-17, Balance Sheet Classification of Deferred Taxes, simplified deferred tax presentation because it eliminated the deferred taxes allocation between current and non-current classifications. All deferred taxes are now reported as non-current assets and liabilities. The ASU became effective in 2016 for public companies and 2017 for private companies.
ASC 740, Income Taxes, requires the liability method for measuring deferred taxes. This method accrues the future tax effect of all temporary differences, using the applicable tax rates expected to be in effect at that time.
Deferred tax liabilities represent future taxable amounts. Deferred tax assets represent future deductible amounts, as well as operating loss and tax credit carryforwards. Like with any asset, deferred tax assets are reduced by a valuation allowance if it is more likely than not that the reporting entity will not realize all, or a portion, of the future tax benefits.
In calculating deferred taxes, the liability method follows:
1. Identify future taxable items (deferred tax liability)
2. Identify future deductible items (deferred tax asset)
3. Tax effect of all future taxable/deductible items
4. Compare the beginning balances of deferred tax asset to the ending balance
5. Compare the beginning and ending balances of deferred tax assets and liabilities to derive the deferred tax provision
6. Determine the need for a deferred tax asset valuation allowance
7. Derive income tax expense

106
ASC 740 requires financial statement recognition of the possibility that certain tax positions that avoid or defer income taxes may not be sustainable upon examination of returns by taxing authorities. In applying this provision, an entity must presume that any and all tax positions on its returns will be examined, regardless of the likelihood that this will occur.
“Tax positions” can relate to previous returns filed or taxes for the current period. They can involve a permanent reduction of taxes or a deferral of tax, and also include matters such as:
The entity’s tax status (e.g., pass-through entity or not-for-profit)
A decision not to file returns in certain jurisdictions
Allocations of income and tax among jurisdictions (including issues such as transfer pricing)
Characterization or exclusion of certain taxable income on returns
Classification of income as exempt from tax
ASC 740 applies to all entities that are potentially subject to income taxes, including not-for-profits, pass-through entities, and entities whose tax liability is subject to 100% credit for dividends, such as REITs and registered investment companies, but the disclosure requirements are more onerous for public companies.
ASC 740 only applies to taxes based on income. Therefore, it is not applicable to payroll taxes, sales and use tax, or taxes based on gross receipts, revenue, capital, or property. ASC 450 guidance for contingent losses applies to these taxes.
STATEMENT OF CASH FLOWS
ASC 230, Statement of Cash Flows, requires that whenever a business entity or not-for-profit organization reports financial position and results of operations, a cash flow statement is to be presented for each period for which results of operations are presented. However, ASC 230 exempts most pension plans from presenting a Statement of Cash Flows.
Note: FASB’s current technical project on financial statement presentation would result in major changes to the basic financial statements, including requiring that the Statement of Cash Flows be prepared using the direct method. This project has been deferred while the FASB devotes its resources to other projects considered more important.
The Statement of Cash Flows includes the following categories of cash flows:
1. Investing activities, such as:
Making and collecting loans, including related party loans
Acquiring and disposing of debt and equity securities which are held to maturity or available for sale

107
Acquiring and disposing of property, plant, and equipment and other productive assets
Deposits or deferred costs that relate to investing assets or liabilities
Cash paid to increase the cash surrender value of life insurance
2. Financing activities, such as:
Borrowing money and repaying amounts borrowed, including related party loans
Issuing and reacquiring the entity’s own equity instruments
Dividends or other distributions to owners
Capitalized debt issue costs are financing activities. Fees and other costs deducted from the proceeds of borrowing should be offset against the face amount of the debt so that only the net proceeds are reflected on the cash flows statement.
3. Operating activities include all activities other than financing or investing, such as:
Receipts from the sale of goods and services and the collection of accounts and notes receivable
Receipts and payments of interest, even for a not-for-profit
Receipts of dividends, even for a not-for-profit
Distributions to equity method investors
Receipts or payments from the sale or purchase of trading securities
Payments to acquire goods for resale or materials for the manufacture of goods and principal payments on accounts or notes payable
Payments to suppliers and employees for other goods and services
Payments to governmental units for taxes, fines, duties, penalties, and other fees
Payments to settle an asset retirement obligation (ASC 410)
4. The effect of fluctuations in exchange rates on foreign cash balances is reported as a separate item.

108
EXAMPLE
INDIRECT METHOD Taylor Products Company Statement of Cash Flows
Operating Activities:
Net Income $1,762,400
Adjustments to reconcile net income to net cash provided by operating activities:
Depreciation 197,420 Provision for Deferred Income Taxes 37,111 Provision for Bad Debts 6,200 Gain on Sale of Machinery (26,200)
Changes in operating assets and liabilities:
Accounts Receivable (87,400) Inventories 89,174 Prepaid Assets 42,819 Accounts Payable 174,899
Net Cash Provided by Operating Activities 2,196,423
Investing Activities:
Purchase of Machinery (375,472) Proceeds from Sale of Machinery 51,674
Net Cash Used in Investing Activities (323,798)
Financing Activities:
Proceeds from Long-Term Borrowings 1,500,000 Principal Payments on Debt (2,651,900) Dividends Paid (40,000)
Net Cash Used in Financing Activities (1,191,900)
Increase (Decrease) in Cash 680,725
Cash and Cash Equivalents at Beginning of Year 14,271
Cash and Cash Equivalents at End of year $ 694,996
Supplemental Disclosures:
Interest Paid 165,000
Income Taxes Paid 515,000

109
EXAMPLE DIRECT METHOD
Taylor Products Company Statement of Cash Flows
For The Year Ended December 31, 20X7
Cash flows from operating activities:
Cash received from customers $7,680,912 Cash paid to suppliers and employees (4,777,715) Interest paid (165,000) Income taxes paid (515,000) Other operating cash receipts (payments) (26,774)
Net Cash Provided by Operating Activities 2,196,423
Cash flows from investing activities:
Purchase of Machinery (375,472) Proceeds from Sale of Machinery 51,674
Net Cash Used in Investing Activities (323,798)
Cash flows from financing activities:
Proceeds from Long-Term Borrowings 1,500,000 Principal Payments on Debt (2,651,900) Dividends Paid (40,000)
Net Cash Used in Financing Activities (1,191,900)
Increase (Decrease) in Cash 680,725 Cash and Cash Equivalents at Beginning of Year 14,271 Cash and Cash Equivalents at the End of Year $ 694,996
Reconciliation of net income to net cash provided by operating activities:
Net Income $1,762,400
Adjustments to reconcile net income to cash provided by operating activities:
Depreciation 197,420 Provision for Deferred Income Taxes 37,111 Provision for Bad Debts 6,200 Gain on Sale of Machinery (26,200)
Change in operating assets and Liabilities:
Accounts Receivable (87,400) Inventories 89,174
Prepaid Assets 42,819
Accounts Payable 174,899
Net Cash Provided by Operating Activities $2,196,423

110
In addition to presenting the three categories of cash flows (operating, investing, and financing), ASC 230-10-50 requires the following additional cash flow disclosures:
The entity’s accounting policy for determining which items are treated as cash equivalents.
Income taxes paid and interest paid (net of amounts capitalized) when the indirect method is used.
Non-cash investing and financing activities disclosure may be presented as a schedule or in narrative form. Best practice discloses this on the face of the Statement of Cash Flows; this is not required. ASC 230-10-50 actually states that if there are only a few non-cash transactions to disclose, it may be convenient to include the disclosure on the same page. If the information is disclosed in the notes, it should be clearly referenced to the statement.
At a minimum, changes in receivables, inventory, prepaids, and payables must be shown separately when reconciling net income to cash flows from operating activities under the indirect method.
Using the direct method, net income must also be reconciled to net cash provided by operating activities (equivalent to the operating section of the Statement of Cash Flows using the indirect method).
Financial statement examples for General Electric Corporation follow:

111

112

113

114

115

116

117

118
NOTES

119
Section
4 Financial Statement Analysis –
Part 1 LEARNING OBJECTIVES
After completing this section, participants will be able to accomplish the following:
Perform financial statement analysis using best practices and various cases
Compare financial statements of different companies in the same industry and the same company across different time periods
Explain the importance of using a company’s MD&A for effective financial statement analysis
INTRODUCTION
The financial statement analysis process is based on applying analytical tools and techniques to financial statements and operating data with the purpose of producing systematic, rational, and meaningful information as a basis for sound decision making. Rigorously applied, financial analysis reduces reliance on easy default non-financial decision making approaches of hunches, intuition, feelings, and gut reaction.
One of the biggest weaknesses of non-financial, non-quantitative decision making is that these soft approaches make it impossible to document and share knowledge about what went right and wrong. Thus, the financial statement user or organization cannot learn from its decision-making actions. For example, it is important to validate correct analysis made to make investments/projects that performed well so that the process can be repeated with future decisions.
Even more important is to learn from mistakes on decisions made on poorly performing investments/projects so that future decisions will have a better chance of success. Or, as writer and philosopher George Santayana’s famous quotation said, “Those who cannot remember the past are condemned to repeat it.”

120
Lastly, sound financial analysis builds an environment of accountability for investment decisions. It avoids the phenomenon of the “flight from facts” by replacing fantasy and wishful thinking with systematic and rational thinking.
Contrary to the belief of some, rigorous quantitative financial analysis does not reduce judgment but actually increases it. This is because by choosing appropriate rational analytical techniques and the analyst can add insight when interpreting the results before making investment decisions.
There are several objectives to financial analysis:
Screening – used to select a sample of investment choices that meet certain financial and operational criteria. Examples are matching investor strategy with size (under $25 million in sales), growth (growing faster than their industry), profitability (gross profit greater than their industry), efficiency (high accounts receivable turnover more than 10X), etc.
Performance evaluation – evaluate management performance compared with budget or industry benchmarks.
Diagnostic tool – identify problems within an organization or within an industry.
Predictive indicator – forecast the nature, timing, and extent of future cash flows.
The financial analysis tools and techniques deployed depends on the decision maker and the decision to be made. Apart from specific quantitative solutions, the answer to financial questions depends on the perspective of the financial statement user. The qualitative judgments made in reaching conclusions to financial questions are equally important as the technical quantitative answer. Thus, no financial analysis is complete without documenting qualitative judgments.
The financial analysis objective must be clearly enumerated before collecting and analyzing data; otherwise, the process is purely number crunching. The following decision makers have different objectives:
Credit grantor – Will the interest and principal be paid back?
Equity investor – Will the investment achieve an acceptable risk-adjusted return?
Management – A feedback mechanism about whether the entity or operation is performing according to advance expectations (budget) or industry benchmarks.
Supplier – Can I rely on this supplier to provide a critical raw material or subcomponent into my entity’s production process?
Customer – What payment terms should I allow this customer and what is the maximum amount of payment risk I am willing to take?
Mergers & acquisitions – What is the value of the target entity and what is the maximum amount we should pay?

121
Auditors – Risk-based audit planning to determine the nature, timing, and extent of tests to be performed.
Employees – Does this entity have sustainability and longevity and do I want to leave or join the organization?
Stakeholders – Lawyers evaluate the amount of settlement an entity can pay, government tax authorities evaluate financial reasonableness, labor unions evaluate the amount of wage and benefit increases to negotiate, etc.
Financial analysis is both an analytical and judgmental process to provide support for making sound investment and other decisions. Mastering quantitative tools and techniques to arrive at accurate numerical calculations are not the end of the analysis but just the beginning, due to the contribution of judgment.
Industry Differences
It is fairly obvious that industries have their own unique cost structures. Thus, comparing a reporting entity’s financial metric with the industry average provides meaningful analysis. Comparing a reporting entity’s financial metric with an entity in a different industry is not meaningful. One exception is best practice benchmarking which has frequently occurred for efficiency best practices with Japanese automobile manufacturing companies.
Within an industry, however, there can be significant financial and operational differences depending on where the reporting entity operates in the supply chain to reach the end-user customer. The supply chain components are manufacturers, distributors, and retailers.
No matter what the product, the manufacturer must get it to the end-user customer, and there may be several intermediary steps along the way to the market. If the manufacturer sells directly to end-users to a distributor or to a retailer, pricing and profit margins are critical components for each link in the supply chain. This is illustrated in the following chart.
Supply Chain Sales Price and Margin
Retailer's margin Sales price to end‐user (customer)
Distributor's margin
$ Manufacturer's sales price
Profit
Overhead
Direct (material & labor)
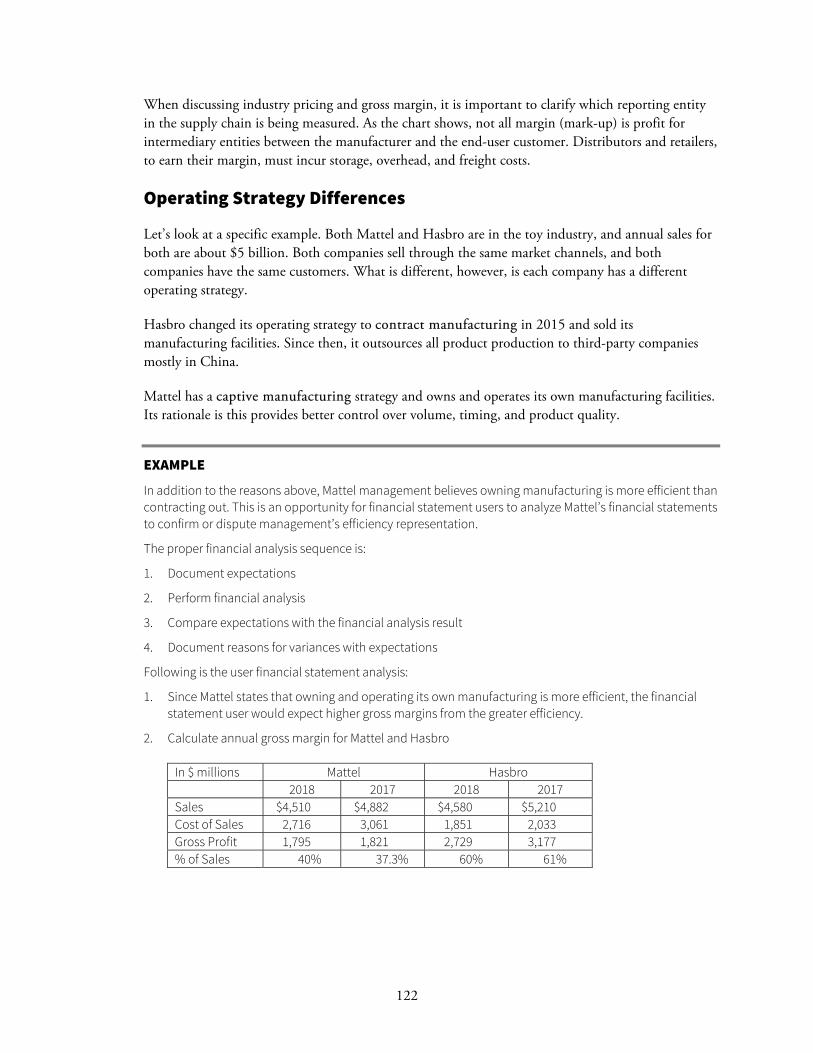
122
When discussing industry pricing and gross margin, it is important to clarify which reporting entity in the supply chain is being measured. As the chart shows, not all margin (mark-up) is profit for intermediary entities between the manufacturer and the end-user customer. Distributors and retailers, to earn their margin, must incur storage, overhead, and freight costs.
Operating Strategy Differences
Let’s look at a specific example. Both Mattel and Hasbro are in the toy industry, and annual sales for both are about $5 billion. Both companies sell through the same market channels, and both companies have the same customers. What is different, however, is each company has a different operating strategy.
Hasbro changed its operating strategy to contract manufacturing in 2015 and sold its manufacturing facilities. Since then, it outsources all product production to third-party companies mostly in China.
Mattel has a captive manufacturing strategy and owns and operates its own manufacturing facilities. Its rationale is this provides better control over volume, timing, and product quality.
EXAMPLE
In addition to the reasons above, Mattel management believes owning manufacturing is more efficient than contracting out. This is an opportunity for financial statement users to analyze Mattel’s financial statements to confirm or dispute management’s efficiency representation.
The proper financial analysis sequence is:
1. Document expectations
2. Perform financial analysis
3. Compare expectations with the financial analysis result
4. Document reasons for variances with expectations
Following is the user financial statement analysis:
1. Since Mattel states that owning and operating its own manufacturing is more efficient, the financial statement user would expect higher gross margins from the greater efficiency.
2. Calculate annual gross margin for Mattel and Hasbro
In $ millions Mattel Hasbro 2018 2017 2018 2017 Sales $4,510 $4,882 $4,580 $5,210 Cost of Sales 2,716 3,061 1,851 2,033 Gross Profit 1,795 1,821 2,729 3,177 % of Sales 40% 37.3% 60% 61%

123
3. Hasbro, a company that outsources 100% of its manufacturing, has higher gross profit margins than Mattel, a company that owns and operates its manufacturing. This refutes Mattel management’s operational strategy of captive manufacturing.
Because gross profit margins in 2018, the most recent year, looked very poor, the financial statement user also included the prior year in the analysis. The conclusion was the same in both years.
4. The reasons are not readily apparent. The next step in the financial statement analysis would be to calculate and analyze efficiency ratios, such as asset turnover and ROA.
Understanding a Reporting Entity’s Goals, Objectives, and Strategy
Financial analysis and forecasting requires knowledge about a reporting entity’s short-term goals and objectives as well as about long-term strategy. For private entity’s, this information needs to be disclosed voluntarily to financial statement users.
For public companies, there are many sources of this information. Examples are SEC requirements in the Form 10-K (MD&A), the annual CEO letter to shareholders (Warren Buffet’s CEO letter for Berkshire Hathaway is highly anticipated each year), annual meeting presentations to shareholders, and equity analyst presentations. In addition to quarterly and annual reporting requirements, the SEC also requires in Regulation FD (Full Disclosure) requires these latter documents be published so that the investor market has equal access to reporting entity’s information.
Strategy is generally disclosed in the SEC Form 10-K under “Business”. Following are Mattel and Hasbro’s strategy.
SOURCE: MATTEL 2018 FORM 10K
Business
Mattel, Inc., designs, manufactures, and markets a broad variety of toy products worldwide through sales to its customers and directly to consumers. Mattel’s vision is “creating the future of play.” Management has set three key company strategies:
1. Deliver consistent growth by continuing the momentum in its core brands, optimizing entertainment partnerships, building new franchises, and working to expand and leverage its international footprint.
2. Build on the progress it has made on improving operating margins through at least sustaining the gross margins and delivering another round of cost savings.
3. Generate significant cash flow and continue its disciplined, opportunistic, and value-enhancing employment.

124
Mattel believes its products are among the most widely recognized toy products in the world. Mattel’s portfolio of brands and products are grouped in the following categories:
Mattel Girls & Boys Brands – Including Barbie fashion dolls and accessories, Polly Pocket, Little Mommy, Disney Classics, and Monster High, Hot Wheels, Matchbox, Battle Force 5, and Tyco R/C vehicles and play sets, and CARS, Radica, Toy Story, Max Steel, WWE Wrestling, and Batman products, and games and puzzles
Fischer-Price Brands – Including Fisher-Price, Little People, Baby Gear, and View-Master, Dora the Explorer, Go Diego Go, Thomas and Friends, Sing-a-ma-jigs, and See N Say, and Power Wheels
American Girl Brands – Including My American Girl, the historical collection, and Bitty Baby
SOURCE: HASBRO 208 FORM 10K
Business
We are a global play and entertainment company committed to Creating the World’s Best Play Experiences. We strive to do this through deep consumer engagement and the application of consumer insights, the use of immersive storytelling to build brands, product innovation and the development of global business reach. We apply these principles to leverage our owned and controlled brands, including Franchise Brands BABY ALIVE, MAGIC: THE GATHERING, MONOPOLY, MY LITTLE PONY, NERF, PLAY-DOH and TRANSFORMERS, as well as brands of our partners included in Partner Brands portfolio. From toys and games to television, movies, digital gaming and other forms of digital entertainment and a comprehensive consumer products licensing program, Hasbro fulfills the fundamental need for play and connection for children and families around the world. Our entertainment labels, Allspark Pictures and Allspark Animation, create entertainment-driven brand storytelling across mediums, including television, film and more.
Each of these principles is executed globally in alignment with our strategic plan, the brands blueprint. At the center of this blueprint, we re-imagine, re-invent and re-ignite our owned and controlled brands and imagine, invent and ignite new brands, through product innovation, immersive entertainment offerings, including television and motion pictures, digital gaming and a broad range of consumer products. As the global consumer landscape, shopping behaviors and the retail environment continue to evolve, we continue to transform and re-imagine our business strategy. This transformation includes changing many of the ways we organize across our brand blueprint, reshaping us to become a better equipped and adaptive, digitally driven organization, including investing in the development of an omni-channel retail presence. In 2018, we also focused on adding new capabilities through the onboarding of new skill sets and talent to lead a converged retail environment based on our understanding of the consumer and how our retailers are going to market.
MD&A
Much of the information an analyst needs to identify industry differences and strategy can be found in a company’s Management’s Discussion and Analysis (MD&A) found in its filed 10K. It is beyond the scope of this program to dive deeply in a company’s published MD&A but below are the topics covered in General Electric’s MD&A (88 pages long):
Introduction and Definition of Terms
Key Performance Indicators

125
Consolidated Results
GE Capital Reorganization (Exit Plan)
Segment Operations
GE Corporate Items and Eliminations
Discontinued Operations
Other Consolidated Information (Interest, Postretirement Benefit Plans, Pension Costs, Income Taxes, Geographic Data, Revenues, and Foreign Currency Exposure)
Statement of Financial Position
Financial Resources and Liquidity
Critical Accounting estimates
Other Items (New Accounting Standards, GE Digital, Iran Threat reduction and Syria Human Rights Act of 2012, Environmental Matters, and Research and Development)
Supplemental Information
EARNINGS QUALITY
Net income is high quality if it is earned in the ordinary course of business, which means it represents the underlying economics of the business, and it is sustainable over time. If instead, net income was financially engineered, then it was not earned in the ordinary course of business and is low quality.
Significant related-party transactions are not considered to be in the ordinary course of business because these transactions are not “arm’s length.” Any party (entity) that controls or can significantly influence another company’s management or operations can result in non-economic events occurring. Related-party transactions are often difficult to detect and measure. Although ASC 850, Related-Party Disclosures, requires specific disclosures on related-party transactions, even those without cash transfers, these disclosures are frequently lacking.
Unsustainable earnings can result from unfilled executive positions, reductions in research & development investment spending, reductions in advertising spending, and deferring plant and equipment maintenance.
An ideal (but not perfect due to the potential for related-party transactions) approach to assess earnings quality is by comparing net income with cash flow from operating activities, commonly referred to as CFFO. Over several periods if CFFO is negative while net income is positive or if net income constantly is greater than CFFO, then a reporting entity’s earnings may be of lower quality.

126
Financial statement users can validate earnings quality with the ‘earnings quality ratio.’ This ratio is best used as an indicator of problems in reported earnings and not as an absolute measure of earnings quality. The earnings quality ratio, which should be near 1 over time is:
Cash Flow from Operating Activities Net Income + Depreciation + Amortization
When this ratio is consistently below 1, it is an indicator of lower earnings quality. If it is consistently above 1, then it may suggest accelerated receivables collections, inventory reductions, or management intentionally understating earnings.
The earnings quality ratio is most applicable to mature companies whose sales, costs, and working capital are more consistent over time. The ratio is less applicable to early-stage high-growth profitable companies that must fund growing working capital to support its high growth.
CONVENTIONAL ANALYTICAL TOOLS To effectively analyze financial statement information, financial statement users must develop knowledge about the reporting entity’s industry, historical experience, competitors, and financial trends. In effect, financial statement users must develop expectations regarding a reporting entity’s performance prior to analyzing a company’s financial information. Expectations are critical to financial analysis, as they form the basis for establishing benchmarks used when comparing actual to expected results, and when further analyzing financial and operating data.
Most financial statement users are familiar with common analytical approaches for comparing and analyzing historical financial data: horizontal (trend) analysis and vertical (common size) analysis. This section will review these analytical approaches.
SEC requirements for public companies include a five-year trend disclosure of selected financial information. This disclosure for Mattel and Hasbro is shown below.

127
MATTEL

128
HASBRO
Horizontal (Trend) Analysis
Horizontal analysis involves the review and analysis of a particular piece of data over time – for instance, reviewing a trend of sales performance (growth/deterioration) over, say, three years. Horizontal analysis provides important information regarding historical performance, and, given a sufficiently long history of accurate seasonal information, can be of great assistance as a planning and forecasting tool for management and analysts. It is typically conducted by calculating year-to-year percentage changes, or by selecting a base year upon which to compare with (often the earliest year presented), assigning that base year a value of “100,” and then expressing comparative amounts as a percentage of that base year amount (as illustrated above):
Graphical Presentation
The analysis may be clearer when shown in graphical form, keeping with the adage “a picture paints a thousand words.”
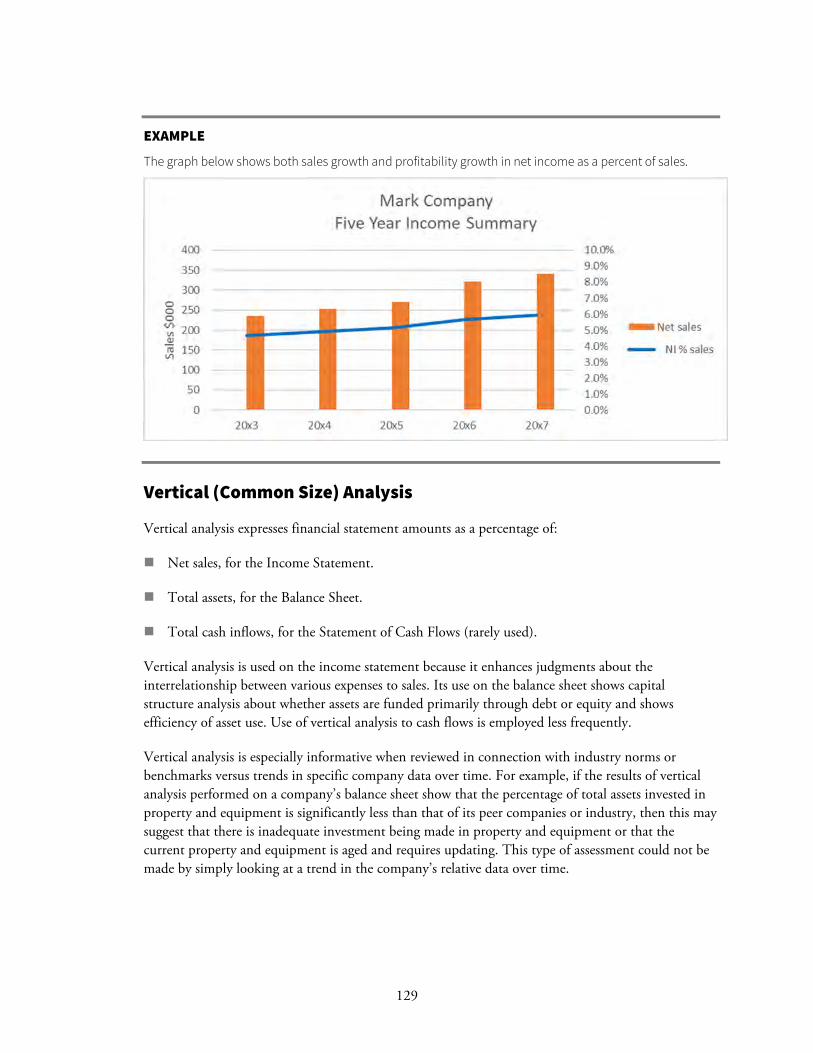
129
EXAMPLE
The graph below shows both sales growth and profitability growth in net income as a percent of sales.
Vertical (Common Size) Analysis
Vertical analysis expresses financial statement amounts as a percentage of:
Net sales, for the Income Statement.
Total assets, for the Balance Sheet.
Total cash inflows, for the Statement of Cash Flows (rarely used).
Vertical analysis is used on the income statement because it enhances judgments about the interrelationship between various expenses to sales. Its use on the balance sheet shows capital structure analysis about whether assets are funded primarily through debt or equity and shows efficiency of asset use. Use of vertical analysis to cash flows is employed less frequently.
Vertical analysis is especially informative when reviewed in connection with industry norms or benchmarks versus trends in specific company data over time. For example, if the results of vertical analysis performed on a company’s balance sheet show that the percentage of total assets invested in property and equipment is significantly less than that of its peer companies or industry, then this may suggest that there is inadequate investment being made in property and equipment or that the current property and equipment is aged and requires updating. This type of assessment could not be made by simply looking at a trend in the company’s relative data over time.

130
An example of a five-year horizontal (trend) analysis and a vertical (common size) analysis follows:
EXAMPLE
Mark Company
Income Statement Summary
($000)
20x3 20x4 20x5 20x6 20x7 .
Net sales 235$ 253$ 270$ 321$ 341$ Cost of goods sold 113 120 127 149 157 Gross profit 122 133 143 172 184Operating expenses 94 101 108 128 136 Operating income 28 32 35 43 48Other (income)/expense 10 11 12 13 14 Income before taxes 18 21 23 30 34Income taxes 7 8 9 12 13 Net income 11 12 14 18 20
As a % of sales (vertical analysis)Net sales 100.0% 100.0% 100.0% 100.0% 100.0%
Cost of goods sold 48.0% 47.5% 47.0% 46.5% 46.0%
Gross profit 52.0% 52.5% 53.0% 53.5% 54.0%
Operating expenses 40.0% 40.0% 40.0% 40.0% 40.0%
Operating income 12.0% 12.5% 13.0% 13.5% 14.0%
Other (income)/expense 4.3% 4.3% 4.4% 4.0% 4.1%
Income before taxes 7.7% 8.2% 8.6% 9.5% 9.9%
Income taxes 3.1% 3.3% 3.4% 3.8% 4.0%
NI % sales 4.6% 4.9% 5.1% 5.7% 5.9%
Trend index (horizontal analysis)Net sales 100.0 107.7 114.9 136.6 145.1Cost of goods sold 100.0 106.5 112.5 132.3 139.1 Gross profit 100.0 108.7 117.1 140.5 150.7Operating expenses 100.0 107.7 114.9 136.6 145.1 Operating income 100.0 112.1 124.5 153.7 169.3Other (income)/expense 100.0 110.0 120.0 130.0 140.0 Income before taxes 100.0 113.3 126.9 166.7 185.4Income taxes 100.0 113.3 126.9 166.7 185.4 Net Income 100.0 113.3 126.9 166.7 185.4

131
Analyzing the index trend from the chart above, sales of $253 in 20x4 were 7.7% above $235 in 20x3. Similarly, sales of $341 in 20x6 are 45.1% higher than sales of $235 in 20x3. Changes from the base year are calculated by subtracting the indices.
For changes from years other than the base year, period-to-period changes are calculated without holding the earliest year presented as the base year.
The year-to-year sales percentage change for 20x6 to 20x7 is 6.2%. The calculation is:
(Current/Base – 1) X 100 = ($341/$321 – 1) X 100 = 6.2%
– Or –
(Current – Base)/Base) X 100 = ($341 – $321)/$321) X 100 = 6.2%
Discussion Points:
1. Horizontal analysis allows us to determine if trends are consistent over time. Trend analysis has better predictive value when a greater number of periods is used, because the real story can be obscured by aberrations in data when too few periods are used. Users rely quite heavily on this – but this analysis during economic recession times can lead to conclusions whereby trends and performance dips are attributed to the economic impacts more heavily than a real assessment of the company’s ability to perform, react, respond, adjust, etc. – it is very hard to separate all these contributing aspects!
2. Horizontal analysis allows us to view interrelationships more clearly. Note that in this example sales are increasing, and so are cost of goods sold, which is to be expected. Comparing the rate of change of both tells an important performance metric. Cost of goods sold increased by 39.1% from 20x3 to 20x7, while sales increased by 45.1% over the same period.
This helps explain how gross profit is up 50.7% from 20x3 to 20x7 and may be due to the entity realizing economies of scale (cost of goods sold is increasing at a lower rate over time than are sales). Similarly, from 20x3 to 20x7, operating expenses grew at the same rate as sales. Because operating expenses are often comprised of many fixed costs, they would not be expected to grow equally to sales during periods of well-managed growth.
3. Some amounts calculated in horizontal analysis may have limited, if any usefulness, such as the other income/expense line in the example. Financial analysis can be more meaningful if extraneous amounts are excluded from the percentage or ratio presentation. An analysis that highlights significant trends and findings is most useful and works best. This point correlates to the accounting concepts of materiality and decision usefulness.
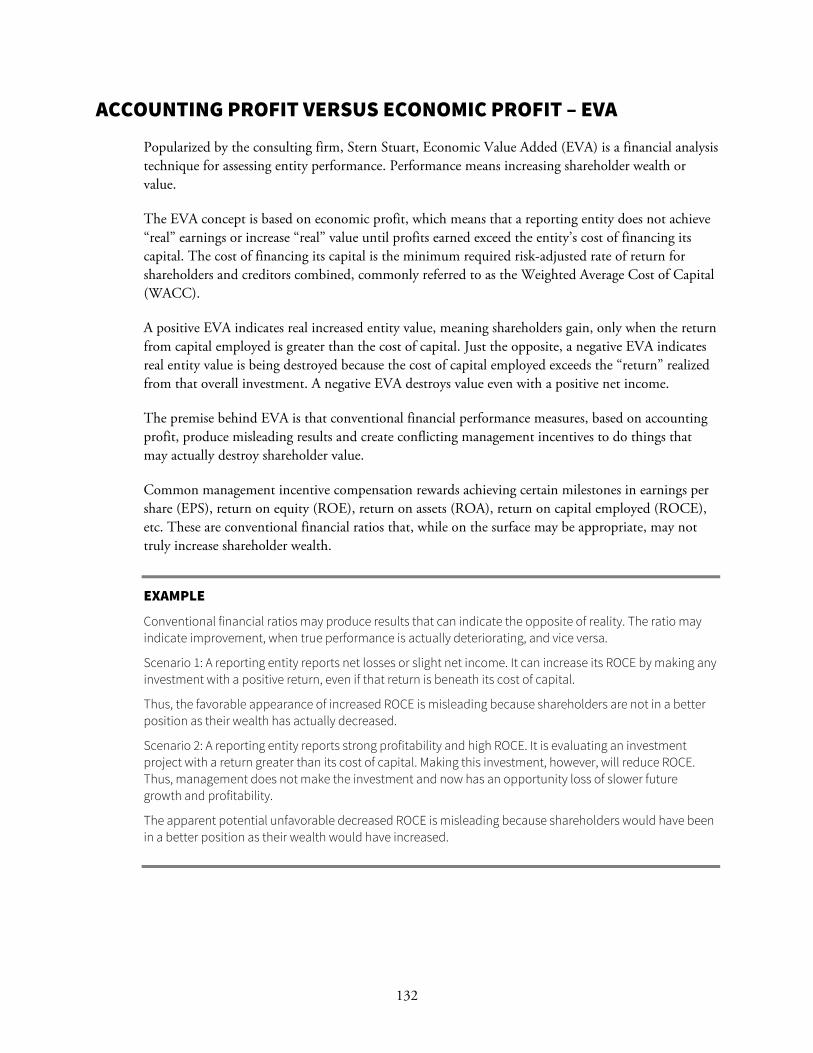
132
ACCOUNTING PROFIT VERSUS ECONOMIC PROFIT – EVA
Popularized by the consulting firm, Stern Stuart, Economic Value Added (EVA) is a financial analysis technique for assessing entity performance. Performance means increasing shareholder wealth or value.
The EVA concept is based on economic profit, which means that a reporting entity does not achieve “real” earnings or increase “real” value until profits earned exceed the entity’s cost of financing its capital. The cost of financing its capital is the minimum required risk-adjusted rate of return for shareholders and creditors combined, commonly referred to as the Weighted Average Cost of Capital (WACC).
A positive EVA indicates real increased entity value, meaning shareholders gain, only when the return from capital employed is greater than the cost of capital. Just the opposite, a negative EVA indicates real entity value is being destroyed because the cost of capital employed exceeds the “return” realized from that overall investment. A negative EVA destroys value even with a positive net income.
The premise behind EVA is that conventional financial performance measures, based on accounting profit, produce misleading results and create conflicting management incentives to do things that may actually destroy shareholder value.
Common management incentive compensation rewards achieving certain milestones in earnings per share (EPS), return on equity (ROE), return on assets (ROA), return on capital employed (ROCE), etc. These are conventional financial ratios that, while on the surface may be appropriate, may not truly increase shareholder wealth.
EXAMPLE
Conventional financial ratios may produce results that can indicate the opposite of reality. The ratio may indicate improvement, when true performance is actually deteriorating, and vice versa.
Scenario 1: A reporting entity reports net losses or slight net income. It can increase its ROCE by making any investment with a positive return, even if that return is beneath its cost of capital.
Thus, the favorable appearance of increased ROCE is misleading because shareholders are not in a better position as their wealth has actually decreased.
Scenario 2: A reporting entity reports strong profitability and high ROCE. It is evaluating an investment project with a return greater than its cost of capital. Making this investment, however, will reduce ROCE. Thus, management does not make the investment and now has an opportunity loss of slower future growth and profitability.
The apparent potential unfavorable decreased ROCE is misleading because shareholders would have been in a better position as their wealth would have increased.

133
EXAMPLE
Conventional financial ratios may produce results that can indicate the opposite of reality. The ratio may indicate improvement, when true performance is actually deteriorating, and vice versa.
Scenario 1: Stock buybacks
EPS and ROE both improve for a profitable reporting entity from stock buybacks, but this “improvement” can be misleading. For a reporting entity with decreased net income, a stock buyback of significant scale will produce just the opposite result of improved EPS and ROA.
Scenario 2: Financing new investment entirely with new borrowings
EPS and ROE both improve after an investment in a new project financed entirely with new debt when the project earns a greater return than the cost of the new debt.
If the new project return is less than the reporting entity’s WACC, then the investment destroys shareholder value. The appearance of EPS and ROE growth is misleading as a favorable outcome.
Scenario 3: EPS and ROE both decline after an investment in a new project financed entirely with new equity when the project earns a lower return than the cost of equity.
If the new project return is greater than the reporting entity’s WACC, then the investment increases shareholder value.
The apparent potential unfavorable decreased EPS and ROE growth is misleading because shareholders would have been in a better position as their wealth would have increased.
Remember that conventional financial ratios are based on GAAP, which includes significant management judgment. The weakness with ratio analysis is that this judgment impacts the financial statements.
The point is not to stop using ratios in financial analysis. The point is that financial statement users performing financial analysis need to dive deeper into the meaning behind the numbers before reaching a conclusion.
Another weakness of GAAP-based ratio analysis is that it ignores the cost of equity capital while including the cost of debt capital. GAAP deducts interest expense as a cost of debt and treats equity as being free. EVA corrects this shortcoming by deducting the opportunity cost of all capital. The basic EVA formula follows:
Accounting Profit (Net Income)
- Capital Charge (Capital Investment X WACC)
= Economic Profit (EVA)
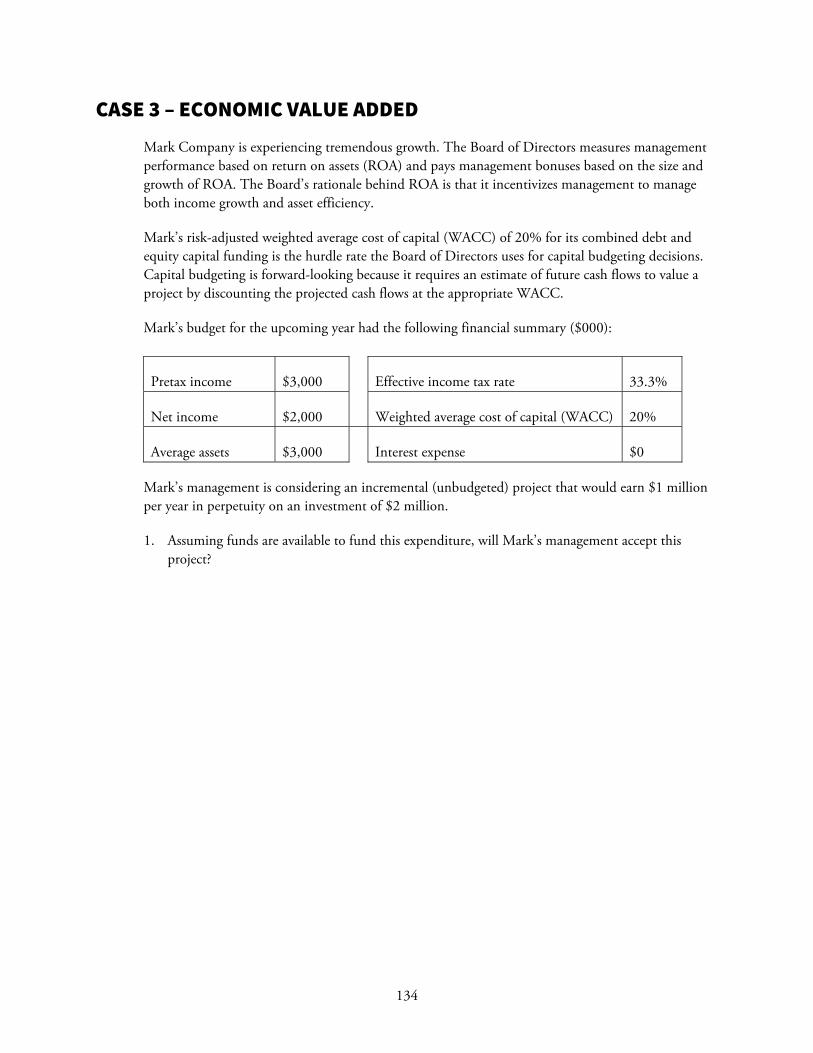
134
CASE 3 – ECONOMIC VALUE ADDED
Mark Company is experiencing tremendous growth. The Board of Directors measures management performance based on return on assets (ROA) and pays management bonuses based on the size and growth of ROA. The Board’s rationale behind ROA is that it incentivizes management to manage both income growth and asset efficiency.
Mark’s risk-adjusted weighted average cost of capital (WACC) of 20% for its combined debt and equity capital funding is the hurdle rate the Board of Directors uses for capital budgeting decisions. Capital budgeting is forward-looking because it requires an estimate of future cash flows to value a project by discounting the projected cash flows at the appropriate WACC.
Mark’s budget for the upcoming year had the following financial summary ($000):
Pretax income $3,000 Effective income tax rate 33.3%
Net income $2,000 Weighted average cost of capital (WACC) 20%
Average assets $3,000 Interest expense $0
Mark’s management is considering an incremental (unbudgeted) project that would earn $1 million per year in perpetuity on an investment of $2 million.
1. Assuming funds are available to fund this expenditure, will Mark’s management accept this project?

135
2. Will the Board support management’s decision?
3. Does this project create entity value?

136
DASHBOARDS – ANALYTIC TOOL TO IMPACT POSITIVE ORGANIZATIONAL CHANGE
Dashboards are a valuable analytic tool that builds accountability in an organization. What makes dashboards so valuable is the fast speed that it communicates performance by translating financial data into insight. Dashboards are a quick way to communicate performance and actionable items by translating financial, operational, and strategic data into meaningful and relevant information.
Dashboards are similar to balanced scorecards, which communicate more than financial performance. Both are frequently interchanged; however, there are subtle differences. A dashboard is a performance monitoring system, and a scorecard management system. Both terms are frequently interchanged, because of the adage that “you manage what you measure.”
Accounting and finance departments generally deliver to the CEO, the Board of Directors, and management thick financial reports including variance analyses. The thickness of the reports and mounds of data often obscure the key issues the reports were intended to communicate. This situation manifests itself and frustrates CFOs when no improvement actions result from the financial reports.
Dashboards have a visual benefit over written reports that speeds up communication. This is illustrated in the following example showing three different methods of communicating financial performance.
EXAMPLE
Refer back to Mark Company’s five-year horizontal and vertical analysis from earlier in this section. Assume one of Mark’s strategic objectives was to grow both sales and profitability. Evaluate the speed that each of the three methods communicates performance of this strategic objective:
Sales increased over the last five years from $235,000 in 20x3 to $341,000 in 20x7, and return on sales increased from 4.6% to 5.9%, respectively over the same time period.
20x3 20x7
Sales $235,000 $341,000
Return on sales 4.6% 5.9%

137
The balanced scorecard, popularized by Robert Kaplan and David Norton and the Harvard Business Review, is a performance management tool encompassing financial and non-financial measures. The scorecard is balanced because it reports both financial and non-financial measures. These measures are collectively called Key Performance Indicators (KPI)s which are quantifiable measures of task progress or attainment.
The balanced scorecard’s heart is the company’s vision and strategy. To achieve its vision and strategy, a company needs to excel in four areas:
1. Financial – To succeed financially, how should we appear to our shareholders?
2. Customer – To achieve our vision, how should we appear to our customers?
3. Internal Business Processes – To satisfy our shareholders and customers, what business processes must we excel at?
4. Learning and Growth – To achieve our vision, how will we sustain our ability to change, improve, and continue to create value?
A balanced scorecard example is shown below. Each bullet-point is an objective that must be assigned to an individual for accountability and measured for effective management and dashboards can be effectively used to measure progress achieving these goals.

138
Dashboards impact positive corporate change because they provide not only the big picture, but also enhance accountability by showing the impact of individual actions on the rest of the organization. The visual graphs and pictures provide immediate status on attaining objectives and set the stage for taking targeted and immediate action. Thus, from a financial perspective, dashboards fulfill FASB CON No. 2 decision usefulness qualities of relevance by providing timely feedback value.
Dashboards build accountability when each executive/manager/employee receives an objective, understands the context of their role through the dashboard, and measures their individual performance from the dashboard. Strategically, dashboards let every person with objectives work toward common organization goals.

139
Following is an example of a patient satisfaction dashboard.
Mechanically implementing the dashboard to work can be challenging because the non-financial data do not come from the general ledger. The data come from multiple systems and is assembled through some type of integration process that generally does not already exist. Automated integration depends upon technologies such as online analytical processing (OLAP), data analytics, or business intelligence systems. Manual integration depends upon query, data mining, ad-hoc analysis, spreadsheets, or flat files.
Transactional systems or applications can include order processing, manufacturing, customer service, warranty, shipping, invoicing, collections, customer relationship management, human resources information systems, etc.

140
Company Website Example
Following is a dashboard example from the Cisco investor relations website for its 2019 financial performance.

141
Section
5 Financial Statement Analysis –
Part 2 LEARNING OBJECTIVES
After completing this section, participants will be able to accomplish the following:
Perform financial statement analysis using best practices and various cases
Compare financial statements of different companies in the same industry and the same company across different tie periods
Apply accrual and cash-based ratios to published financial statements
Describe the limitations of ratio-based analysis
Identify an entity’s quality of earnings and explain the results
INTRODUCTION
The primary purpose of this section is to discuss useful accrual and cash-flow-based ratios with a specific emphasis on cash-flow-based ratios. Ratio analysis is perhaps the best-known and most widely-used tool for conducting financial analysis. At the same time, however, ratios and their meanings are frequently misunderstood and misused.
Ratio analysis deals with assessing relationships between two or more financial statement and/or nonfinancial elements in order to obtain a meaningful measurement of an entity’s liquidity, efficiency, leverage (solvency), and/or profitability. To be useful, ratios must either be analyzed over time to identify trends, compared to corresponding ratios for similar companies, or compared to industry norms or benchmarks.

142
There are some caveats and key points to bear in mind when using ratios in the analysis process:
Ratios are particularly industry dependent. For example, the profit margins for manufacturers are very different from the profit margins for discount retailers. In addition, the collection periods for different businesses such as industrial products versus medical practices vary. Finally, R&D expenses as a percentage of total expenses or sales will differ greatly depending on the industry.
Theoretically, one may derive an infinite number of ratios from any set of financial statements – yet not all of those ratios provide key performance information. Again, the technological ease with which one can crunch numbers often results in information overload, obscuring significant data with trivia.
In order for a ratio to be useful, its numerator has to have some meaningful relationship with its denominator. For example, an item’s cost has some relationship to its sales price; therefore, comparing cost of goods sold to sales is a meaningful comparison. On the other hand, dividing commission expense by temporary investments provides no meaningful analysis because the numerator and denominator have no clear, direct relationship.
Ratios are difficult to interpret when additional outside information is necessary for a complete understanding.
EXAMPLE
Utilities expense is analyzed over time by dividing it by units sold, on the premise that more production drives more sales through more utility consumption. In analyzing the results, one must also factor in (a) how cold the winter was, or how hot the summer which could impact consumption, (b) changes in production methodology, such as automation, that could also impact consumption, (c) changes in utility rates during the period, which could drive an increase in utility expense without additional consumption, and (d) variances between units sold and units produced, particularly when production, which may not necessarily result in sales, is directly responsible for the utility consumption.
EXAMPLE
An analysis of accounts receivable turnover suggests that a company achieved faster collections in the current year. Further investigation reveals that the company has begun to make significant credit card sales, which are really cash sales that should be excluded from an analysis of collections on credit sales.
Interpretation of ratios can also be complicated by the use of different acceptable accounting methods.
EXAMPLE
Consider how inventory turnover would be affected by the use of FIFO versus LIFO cost methodologies, which produce differing amounts of cost of goods sold and inventory.

143
Ratios can be affected by interdependencies between the numerator and denominator.
EXAMPLE
A company achieves cost reductions by reducing spending on advertising. Here, the ratio of operating expenses to sales has been reduced by cutting costs in an area that stimulates sales. The apparent increase in profitability in the short run resulted from an action that will have the opposite effect in the long run.
Ratios based on total assets or total equity should be carefully scrutinized to determine if the results are meaningful. Total assets and total equity are influenced by numerous estimates and judgments as well as past acquisition costs (i.e., historical costs) not adjusted for subsequent fair value or “purchasing power” changes. When comparing performance metrics that provide measurements over a “current” period of time (i.e., net income) to balance sheet amounts or those metrics that provide measurements as of a particular point in time that disregard “current value or purchasing power” (i.e., assets), the result is often skewed because the dollar does not provide the same measuring unit over time.
And lastly, ratios are most useful as diagnostic tools to highlight trends or changes that warrant special attention. They do a better job raising questions than providing answers.
In consideration of these caveats and key points, a list of common ratios used in financial analysis follows with a description of their meaning and use.
LIQUIDITY RATIOS
Liquidity analysis and liquidity ratios, which focus on cash flows, measure a company’s ability to meet and pay off its short-term obligations. Effectively, liquidity measures how quickly assets are converted into cash. Higher ratios of this type typically indicate greater liquidity.
Ratio Formula Meaning
Current Ratio Current Assets
Current Liabilities
The extent that an entity’s current assets can cover (or be used to repay) its current liabilities
Comments: Current assets are either cash or convertible to cash within one business cycle. Current liabilities are obligations that are to be settled in cash within one business cycle. Almost universally, one business cycle is considered a period of one year.

144
Ratio Formula Meaning
Quick Ratio Cash + Cash Equivalents +
Net Receivables Current Liabilities
The extent to which an entity’s more liquid assets can cover (or be used to repay) its current liabilities; the quick ratio is a more conservative view of liquidity, which removes less liquid assets (such as inventory and prepaid expenses) from the ratio formula.
Comments: For purposes of the quick ratio presentation in this course, Cash Equivalents includes Short-Term Marketable Investments. In practice, the quick ratio is often presented as: (Cash + Short-Term Marketable Investments + Net Receivables)/Current Liabilities. For the most part, the difference between the Current Ratio and the Quick Ratio is that the Quick Ratio excludes both Inventory and Prepaid Expenses from its numerator. The same comments provided above with regard to assessing decreasing and increasing trends in the Current Ratio also apply to the Quick Ratio.
EFFICIENCY RATIOS Efficiency ratios (sometimes referred to as “activity ratios”) measure how efficiently an entity utilizes its assets. These ratios (when using working capital accounts in their calculations) also assess the “quality” of a company’s liquidity by evaluating management’s ability to convert current assets into cash and liquidate payables on a timely basis. As indicated previously, liquidity ratios are of limited use without also analyzing a company’s efficiency concurrently. When calculating efficiency ratios, if year-end balances in accounts such as accounts receivable, inventory, or accounts payable are not consistent with their balances throughout the year, monthly rather than annual averages should be used in the denominator of the formula. Higher ratios typically indicate greater efficiency.
Ratio Formula Meaning
Accounts Receivable Turnover
Net Revenue Average Accounts
Receivable
The number of times receivables are converted into cash per year.
Comments: The ratio of net revenue (sales) to average accounts receivable measures an entity’s ability to manage and collect its recorded revenue. Generally, a more rapid turnover is preferable since this might indicate more timely availability of cash, mitigating an entity’s need to borrow or forgo other business opportunities as a result of a lack of cash. However, if an entity’s accounts receivable is turning over too rapidly; this may indicate that the entity’s credit and collections policies are too strict, and that it is losing sales to competitors whose collections policies are more lenient. Negative trends or ratios below that of the industry suggest potential liquidity problems associated with ineffective credit and collection policies. Here corrective actions might include ensuring credit sales are made to customers who will pay (conducting credit checks before issuing credit) and employing stronger collection efforts and offering effective incentives to accelerate payment.

145
Ratio Formula Meaning
Days’ Sales in Accounts Receivable
360 Days Accounts
Receivable Turnover
The average length of time from a sale to cash collection; how fast a company collects cash from customers to whom it offers credit.
Comments: Same as those presented for the accounts receivable turnover ratio. Days’ Sales in Accounts Receivable is often referred to as Days of Sales Outstanding (DSO).
Ratio Formula Meaning
Inventory Turnover
Cost of Goods Sold
Average Inventory
The number of times inventory is liquidated/converted into sales during the period; indicates the resources (cash) tied up in inventory and can pinpoint whether too little or too much inventory is carried.
Comments: The ratio of cost of goods sold to average inventory measures how quickly an entity sells/liquidates its inventory. Generally, a more rapid turnover is preferable because this would (typically) indicate accelerated conversion of inventory to sales and, thus, cash collections, provided there are no issues with the entity’s accounts receivable turnover. However, it should be noted that inventory turning over too rapidly, may signal stock shortages and lost sales. It may also signal the company has insufficient vendor credit preventing the maintaining of more robust inventories. Negative trends or poor experience relative to the industry suggests potential liquidity problems that may be resulting from carrying excess inventory. Analysis of disaggregated data must be performed in order to identify (a) whether overstocks, obsolescence, or both are an issue and (b) the best course of action the company should take to reduce inventory levels. Depending on this analysis, the company may need to make or buy less, sell excess or obsolete goods at reduced prices, or even scrap unsellable goods.
Ratio Formula Meaning
Days’ Sales in Inventory
360 Days Inventory Turnover
The number of days it takes to sell the inventory. Used in conjunction with the accounts receivable collection period to determine the operating cycle.
Comments: Same as those presented for the inventory turnover ratio. Days’ Sales in Inventory is often referred to as Days of Inventory on Hand (DOH).

146
Ratio Formula Meaning
Accounts Payable Turnover
Cost of Goods Sold
Average Accounts Payable
The number of times purchases (typically “inventory purchases”) are paid off during the period.
Comments: The ratio of cost of sales to average accounts payable measures an entity’s ability to manage and pay for its inventory or related expense purchases. For purposes of calculating this ratio, an implicit assumption is that the entity makes all of its purchases using credit. Another very common way of presenting this ratio is to use “Purchases” in the numerator rather than Cost of Goods Sold. However, Cost of Goods Sold is typically used as an approximation of Purchases. Generally, an increasing, or higher ratio relative to the industry would indicate that payables are being paid on time and the entity is taking advantage of early payment discounts being offered by its vendors. If accounts payable are turning over too rapidly, however, it might indicate that the entity is not making full use of available credit facilities and it, therefore, could improve its cash management by delaying vendor payments. An excessively low accounts payable turnover could indicate trouble making payments on time, and/or exploitation of lenient supplier terms. This could ultimately hurt relationships with vendors, which in turn can affect vendor prices and service.
Ratio Formula Meaning
Accounts Payable Days Outstanding
360 Days Accounts Payable
Turnover
Number of days to pay off A/P on average.
Comments: Same as those presented for the accounts payable turnover ratio. This ratio is sometimes referred to as “Number of Days of Payables.”

147
Ratio Formula Meaning
Asset Turnover Net Revenue Average Total
Assets
Measures an entity’s effectiveness in generating revenue from a given level of assets.
Comments: The Asset Turnover ratio (sometimes referred to as “Total Asset Turnover” ratio) measures an entity’s overall ability to generate revenues within a given level of assets. A higher ratio typically indicates greater efficiency. Because this ratio includes both fixed and current assets, inefficient working capital management can distort overall interpretations. It is, therefore, helpful to analyze working capital and fixed-asset turnover ratios separately. A low asset turnover ratio can be an indicator of inefficiency or of relative capital intensity of a business. For instance, if sales are stagnant or declining relative to total assets, then this is an indicator that management may not be maximizing its use of resources to generate sales. There may be “over investment” in assets as it relates to the assets’ current earnings power. Additional analysis (such as vertical “common size” analysis) can help pinpoint underperforming assets. As discussed above, care must be taken in the interpretation of ratios that are based on total assets (or total equity) that contain historical costs not adjusted for current value or purchasing power, particularly when those ratios are making comparisons with performance-type metrics that provide measurements for a “current” period of time (i.e., sales, revenue, net income).
Ratio Formula Meaning
Sales to Fixed Assets
Net Revenue Average PP&E
Measures an entity’s effectiveness in generating revenues from its investment in fixed assets.
Comments: The Sales to Fixed Assets ratio (commonly referred to as “Fixed Asset Turnover,” measures how efficiently an entity generates sales or revenue from its investments in fixed assets. It is most useful in assessing businesses in industries that are very capital-intensive (versus labor-intensive). Generally, a higher sales-to-fixed-asset ratio indicates more efficient use of fixed assets in generating sales/revenues. A low ratio can indicate inefficiency, or alternatively, a new business not yet operating at full capacity, in which case the analyst will not be able to link the ratio directly to efficiency. Additionally, the ratio could be lower for an entity whose fixed assets are newer (higher carrying value), than the ratio for an entity with older assets (lower carrying value). In this type of situation, again, a higher or lower ratio cannot necessarily be linked to efficiency. The Sales to Fixed Assets ratio suffers the same “purchasing power” issues discussed previously.

148
LEVERAGE RATIOS Leverage ratios, commonly referred to as “solvency” ratios, refer to an entity’s ability to fulfill its long-term debt obligations. Assessment of an entity’s ability to pay its long-term obligations – make interest and principal payments – generally includes a deeper analysis of the components of the entity’s financial structure. Leverage ratios provide information about the relative amount of debt in an entity’s capital structure and the adequacy of earnings to cover interest expenses and other fixed charges (lease or rental payments) as they come due.
Ratio Formula Meaning
Debt to Total Assets
Total Debt Total Assets
Measures the percentage of total assets financed with debt. Generally, higher debt means higher financial risk, more use of leverage, and weaker solvency.
Comments: The Debt to Assets ratio provides some indication of the degree of asset protection available for creditors. It provides users with some indication of the extent of an entity’s risk, as well as its ability to sustain losses without impacting the interests of creditors. The ratio is not very useful for comparative company analysis because the asset base typically does not reflect the entity’s current purchasing power or include all of the entity’s assets, for example, its human resources, intellectual capital, management expertise, etc. Note: It is common practice for practitioners and other analysts to use a modified version of this ratio, which captures both current and long-term liabilities (total liabilities) in the numerator of the ratio.
Ratio Formula Meaning
Debt to Equity Total Debt Stockholders’
Equity
A measurement of the amount of debt (creditors’) capital relative to equity (shareholders’) capital in an entity’s capital structure.
Comments: This ratio measures the use of debt to finance operations. A high Debt to Equity ratio may be desirable if the rate of return on assets exceeds the cost of borrowing. In high growth situations, high Debt to Equity relationships are common. In slow or no growth situations, high Debt to Equity relationships may force the entity into bankruptcy. The ratio is not very useful for comparative company analysis because the asset base typically does not reflect the entity’s current purchasing power or include all of the entity’s assets, for example its human resources, intellectual capital, management expertise, etc. Corrective action for solvency problems requires a longer-term approach than that taken to correct liquidity issues. When debt is perilously high compared to equity, and profits are not sufficiently large in relation to interest payments, the entity is considered a credit risk. It is also less able to survive periods of poor or low profits. Corrective action translates to increasing equity through profits or additional investment, or reducing reliance on debt by improving cash flows. Note: It is common practice for practitioners and other analysts to use a modified version of this ratio, which captures both current and long-term liabilities (total liabilities) in the numerator of the ratio.

149
Ratio Formula Meaning
Financial Leverage
Total Assets Stockholders’
Equity
Measures the relationship between total assets and the equity capital that finances the assets.
Comments: As equity finances fewer assets, the Financial Leverage ratio becomes greater. An entity that optimizes its capital structure by using debt responsibly will enhance its return on equity. The Financial Leverage ratio may be disaggregated into common, preferred, and retained earnings leverage to analyze how each tranche finances assets. At the same time the risk inherent in a profitability is also greater as the leverage ratio increases. The primary risk in a highly-leveraged capital structure is the risk of running out of cash during periods of adversity. An entity also loses financing flexibility as financial leverage increases.
Ratio Formula Meaning
Times Interest Earned
Operating Income Interest Expense
An indicator of the number of times an entity’s operating income can cover its interest payments.
Comments: The higher the ratio, the greater protection available to creditors as it relates to an entity’s ability to service its debt payments. A higher ratio is an indicator of stronger solvency. The times interest earned ratio is sometimes referred to as “coverage”: how well an entity is able to “cover” its interest payments. The term “Operating Income” in the numerator of the Times Interest Earned ratio is often interchanged with “EBIT” or “Earnings Before Interest and Taxes.”
Successful leverage occurs by simply using borrowed funds to increase return on equity beyond that of return on assets. Successful leverage will be realized so long as:
Profits are adequate to cover interest on debt with a “reasonable” amount left for the shareholders, and
The cost of borrowed funds after tax is less than the return on assets.
EXAMPLE
A company pays an average of 6% interest on its liabilities, including non-interest bearing payables and accruals. Assuming a 30% tax rate, the company’s after-tax cost of debt is 4.2% [(1 – .30) * 6%]. Accordingly, as long as the company is “reasonably” profitable and its return on assets is greater than 4.2%, successful leverage will be realized and the company’s return on equity will be greater than its return on assets.
Note: The amount of “spread” between return on assets and return on equity is a measure of how successful leverage is. Effective “management” of the Balance Sheet can help maximize this spread.

150
PROFITABILITY RATIOS
Profitability ratios provide a measurement for assessing an entity’s ability to generate earnings for a specified period of time. These ratios provide an indication of just how profitable an entity is (or has been) and are used to compare the relative performance of companies in a given sector. Profitability ratios are typically categorized as either “Profit Margin” metrics, which measure performance in relation to sales or revenue, or “Rate of Return” metrics, which assess performance relative to the size of some investment.
Ratio Formula Meaning
Net Profit Margin Net Income Net Revenue
(Sales)
Measures the percentage of net income generated by each dollar of net revenue or sales.
Comments: Net profit margin indicates how well a company converts net revenues into profits after all expenses are subtracted. Because industries are so different and have different cost structures, Net Profit Margin is most useful when comparing companies in similar industries. Companies that generate a greater amount of profit per dollar of sales are deemed to be more efficient. A higher Net Profit Margin indicates a more profitable company that has better control over its costs compared to its competitors. In essence, the numerator of the ratio (net income) is affected by an entity’s actions to reduce expenses, and the denominator (net revenues or sales) is affected by an entity’s actions to increase net revenues or sales. Both actions will increase the Net Profit Margin. Note that it is common practice for practitioners and other analysts to use variations of the Net Profit Margin formula by substituting “Net Income” in the numerator with “Operating Income” or “Income Before Taxes” when assessing an entity’s profitability.
Ratio Formula Meaning
Gross Profit Margin
Gross Profit Net Revenue
(Sales)
An indication of the percentage of revenue available to cover operating and other expenditures.
Comments: A higher Gross Profit Margin indicates some combination of higher product pricing and lower product costs. Changes in an entity’s gross profit can have a substantial effect on net income for a period. Assuming operating expenses are relatively constant, a small percent change in gross profit could have a much larger percentage impact on net income. Gross profit is highly industry dependent. The ability to charge a higher price is often constrained by competition so Gross Profit Margin is typically affected by competition. If a product has a competitive advantage, a company is better able to charge more for it. From a cost perspective, a higher Gross Profit Margin can also indicate that a company has a competitive advantage in product costs. Both Gross and Net Profit Margins can be effectively managed by either (a) increasing sales to maximize economies of scale on fixed costs or (b) cutting costs. Horizontal and vertical analysis can help pinpoint costs that may need to be re-examined.

151
Ratio Formula Meaning
Operating Profit Margin
Operating Income Net Revenue
(Sales)
An indication of the percentage of revenue remaining after cost of product/service delivered and cost of support.
Comments: A higher Operating Profit Margin indicates some combination of higher product pricing and lower product and support costs. Higher customer support, marketing, and future product development cost may be required for sales, and this is often reflected in high gross profit margins that “pay” for these support services. If a product has a competitive advantage, a company is better able to charge more for it, and this competitive advantage often comes from research & development. From a cost perspective, a higher Operating Profit Margin can also indicate that a company has a competitive advantage in overall cost structure. Gross, Operating, and Net Profit Margins can all be managed effectively by either (a) increasing sales to maximize economies of scale on fixed costs or (b) cutting costs. Horizontal and vertical analysis can help pinpoint costs that may need to be re-examined.
Ratio Formula Meaning
Operating Expenses to Net Revenue
Operating Expenses
Net Revenue (Sales)
A performance measure reflecting an entity’s ability to effectively control its operating costs.
Comments: The Operating Expenses to Net Revenue ratio is often referred to as the “Operating Expense Ratio.” It is typically viewed as a measurement of management efficiency because an entity’s management is typically viewed as having greater control over operating expenses than that of revenues or sales. A lower percentage is desirable. When reviewed over time, the Operating Expenses to Net Revenue ratio can provide information about an entity’s ability to expand operations without dramatically increasing expenses. For instance, if sales were to expand from year-to-year and the ratio of operating expenses to sales were to decline over that same period, then this would mean that sales increased, yet operating expenses declined at an even faster rate. The end result would be a positive impact on net income.
Ratio Formula Meaning
Revenue per Employee
Net Revenue (Sales) Number of Employees
A performance measure reflecting effective utilization and productivity of an entity’s employee base.
Comments: Higher (or increasing) Revenue per Employee contributes to net income by spreading out the amount of revenue dollars available to cover employee-related operating costs, and increases net income as a result. However, analysis must consider whether the company utilizes outsourcing or subcontracting that might over-value the revenue per employee.

152
Ratio Formula Meaning
Net Revenue per Square Foot
Net Revenue Square Feet
A performance measure reflecting an entity’s effectiveness in utilizing available square feet of building/retail space.
Comments: Revenue per Square Foot is an indicator of management’s effectiveness in generating revenue to cover its operating costs. This metric is used primarily in the retail and restaurant industries. Companies with low revenue or sales per square foot have less cushion to cover their expenses, and their business model may not make the best possible use of their retail space. A higher revenue per square foot is most desirable and results in higher net income.
Ratio Formula Meaning
Return on Assets (ROA)
Net Income + After-Tax Interest
Average Total Assets
Measures the return earned by an entity on all of its assets. The second formula removes any “bias” against a company that uses liabilities versus equity to finance its assets.
Comments: Generally, the higher the ratio, the more income generated by a given level of assets. However, as discussed above, care must be taken in the interpretation of ratios that are based on total assets (or total equity) that contain historical costs not adjusted for current value or purchasing power, particularly when those ratios are making comparisons with performance-type metrics that provide measurements for a “current” period of time (i.e., sales, revenue, net income). When purchasing power varies, ROA can overstate returns because net income (numerator of ratio) is representative of a current dollar measure, while average total assets (the denominator) can include various assets purchased in the past and held at historical costs. For ROA to be most meaningful, both net income and average total assets should be restated to reflect current purchasing power. In financial analysis, much emphasis is placed on the ability of management to maximize utilization of an entity’s resources in order to generate returns. These resources may be analyzed in the aggregate (by total assets for instance), or broken down and assessed by significant components (inventory, fixed assets, etc.). It is important to remember that the capital invested by shareholders in an entity could have been committed elsewhere. In efficient markets, investor resources should flow to investments that will provide the highest return relative to the risks assumed. There is a DuPont formula case example at the end of this section.

153
Ratio Formula Meaning
Return on Equity (ROE)
Net Income Average
Stockholders’ Equity
Measures the return earned by an entity on its equity capital, including minority equity, preferred equity, and common equity.
Comments: As with the rate of return on assets, a higher ROE is desirable, but with a similar caution: users must take care in the interpretation of ROE because stockholders’ equity does not represent the market value of the entity. Net income, however, generally, provides a measurement of current purchasing power. When the use of leverage is effective, the Rate of Return on Equity (ROE) will exceed the rate of return on assets (ROA). In complex capital structures, ROE is sometimes calculated using average common stockholders’ equity in its denominator.
Another profitability application:
DuPont Formula
The DuPont Formula is a quick way to understand the drivers of ROA and ROE.
ROA = Return on Sales X Asset Turnover = Net Income X Sales = Net Income Sales Avg Assets Avg Assets
ROE = ROA X Leverage = Net Income X Avg Assets = Net Income Avg Assets Avg Equity Avg Equity
The DuPont Formula shows that ROA can be boosted by improving profitability (ROS) and/or by improving efficiency of asset utilization (asset turnover). ROE is boosted by taking on more debt, up to a certain point.
Note: Analysts should exercise care when using rates of return on assets or equity to develop conclusions about financial information. In many instances, total assets and total equity are based on historical amounts, not current values, and, therefore, may be “analytically” understated as a result. Moreover, many of the “resources” companies rely on for generating revenue (i.e., human resources, intellectual capital, technology advances, etc.) are not reported within the financial statements. These factors can cause rates of return on assets and equity to be overstated, although still useful if analyzed carefully.

154
Ratio Formula Meaning
Economic Value-Added (EVA)
Net Income – Opportunity Cost of
all Capital Employed
Provides an estimate of an entity’s economic profit – the value created in excess of the required return of the entity’s shareholders.
Comments: The premise behind the EVA calculation is that no “real” earnings are achieved, or “real” entity value created, until dollars earned by the entity exceed the entity’s cost of financing its capital (minimum required rate of return for both shareholders and creditors). Opportunity costs are calculated using risk-adjusted desired rate of return on capital employed, using an optimal capital structure. A positive EVA indicates that entity value is being created, or that shareholders gain when the return from capital employed is greater than the cost of capital; a negative EVA indicates just the opposite – that “real” value is not being created because the cost of capital employed in the business exceeds the “return” being realized from that overall investment. A negative EVA destroys value, even with a positive net income.
Ratio Formula Meaning
Dividend Payout Ratio
Dividends Paid Net Income
Measures the percentage of earnings that an entity pays out as dividends to shareholders.
Comments: If stock price appreciation exceeds returns shareholders could obtain elsewhere, low Payout Ratios are generally acceptable. If, on the other hand, stock price appreciation is stagnant, shareholders would expect higher Payout Ratios. It is also important to note that the amount of dividends paid per share tends to be relatively fixed because any reduction in dividends has been shown to result in a disproportionately large reduction in stock price. Additionally, because dividend amounts are relatively fixed, the Payout Ratio tends to fluctuate with earnings. It is, therefore, important to assess the Payout Ratio (and the entity’s payout policy) over a number of periods. More mature companies tend to have higher Payout Ratios. The Payout Ratio is often referred to as the “Dividend Payout Ratio.” The numerator of the ratio is typically associated with “common dividends” paid, and the denominator “net income attributable to common shares,” which means it would exclude preferred dividends.

155
Ratio Formula Meaning
Price-Earnings (P/E) Ratio
Market Price Per Common Share
Diluted Earnings Per Common Share
(DEPS)
Expresses the relationship between the market price per common share and the amount of earnings attributable to a single common share.
Comments: The Price-Earnings (P/E) Ratio measures the market’s assessment of an entity’s future earnings and expected growth potential. A high P/E Ratio indicates the market’s overall confidence in an entity’s future growth and earnings potential. A low P/E Ratio generally indicates uncertainty or a lack of confidence in the entity’s future growth and earnings potential.
CASH FLOW RATIOS
Introduction
This section explores two aspects of cash flow-based analysis:
1. A closer examination of the cash flow statement and the “stories” it tells. Too often, this statement is regarded as an isolated step in the closing process. In many cases, it is not prepared as frequently as the balance sheet and income statement, so it is not routinely used in monitoring operations.
2. An introduction to ratio analysis that incorporates cash flow-based measurements, which can provide additional information improving the reliability, relevance, and predictive qualities of financial information.
Introducing cash flow measurements is useful for several reasons:
They provide tools to evaluate the quality of earnings.
They provide information to help derive operating and cash management recommendations.
They help monitor the adequacy of cash flows to either meet obligations as they become due or achieve planned growth.
They can be used to assess financial flexibility; i.e., the ability of an entity to weather unexpected downturns or pursue opportunities as they arise.
In many respects, cash flow ratios are a better tool for conducting liquidity analysis than are traditional ratios. Traditional ratios rely on amounts from the Balance Sheet, which are “static,” as well as amounts from the Income Statement that are frequently distorted by estimates, arbitrary allocations of non-cash expenses, and accounting methods. Furthermore, liquidity analysis using traditional ratios, relies on working capital metrics that are based on cash available at a prior point in time (i.e., as of the Balance Sheet date). In contrast, cash flow-based ratios incorporate cash amounts

156
generated over a period of time and compare them to the company’s obligations, resulting in a dynamic approach to measuring the resources a company can generate to satisfy its obligations.
EXAMPLE
Traditional ratio analysis relies on the current ratio as a measure of liquidity =
Current Assets Current Liabilities
This static measurement of the ability to meet obligations as they become due within the next year assumes recurring current asset/current liability outcomes throughout the year. Furthermore, this measure is dependent on the entity’s ability to convert noncash current assets to cash.
The actual desired source of funds to pay liabilities is operations. Therefore, a cash flow-based modification of the current ratio might be:
Cash Flows from Operations Current Liabilities
Or, one could go a step further and replace current liabilities with some other measure of annual commitments – such as debt, leases, capital expenditures, dividends and similar obligations.
Cash Flows from Operations Fixed Annual Commitments
This exercise demonstrates that cash flows provide dynamic rather than static measurements that are not affected by accounting methods, etc.
Cash flow-based ratios are normally classified as either quality of earnings or flexibility measurements. Ratios classified as quality of earnings, measure the quality of an entity’s reported earnings, while ratios classified as those that measure flexibility, address whether the entity is in a position to take advantage of changing circumstances or new opportunities.

157
CASE 4 – CASH FLOWS TELL THE REAL STORY
Review the following financial statements, which are accompanied by some financial statement analysis measurements. Then review the comments concerning the Statement of Cash Flows. The Cash Flow Statement Analysis may provide additional insights into a company’s performance.
WINDSIDE CO. BALANCE SHEETS
DECEMBER 31, 20X0 AND 20X9
20X0 20X9Current Assets Cash and Temporary Investment 250,000$ 85,000$ Accounts Receivable (net) 45,000 31,000 Inventories 129,000 96,000 Other Current Assets 40,000 38,000 Total Current Assets 464,000 250,000
Noncurrent Assets Long-term Investments 125,000 175,000 Property, Plant & Equipment (net) 465,000 600,000 Other Noncurrent Assets 32,000 41,000 Total Noncurrent Assets 622,000 816,000
Total Assets 1,086,000$ $1,066,000
Current Liabilities Note Payable 50,000$ 150,000$ Accounts Payable 86,000 72,000 Accrued Liabilities 12,000 15,000 Taxes Payable 8,000 12,000 Total Current Liabilities 156,000 249,000
Noncurrent Liabilities Long-term Debt 200,000 225,000 Deferred Taxes 25,000 30,000
225,000 255,000
Stockholders' Equity Common Stock 100,000 80,000 Additional Paid-in-Capital 300,000 200,000 Retained Earnings 305,000 282,000
705,000 562,000
Total Liabilities & Stockholders' Equity 1,086,000$ 1,066,000$

158
WINDSIDE CO. STATEMENTS OF INCOME AND RETAINED EARNINGS FOR THE YEARS ENDED DECEMBER 31, 20X0 AND 20X9
20X0 20X9Revenues (all sources) 1,250,000$ 1,230,000$
Expenses: Cost of Goods Sold 880,000 845,000 Operating Expenses 275,000 300,000 Interest Expense 24,000 39,000 Income Taxes 21,000 23,000Total Expenses 1,200,000 1,207,000
Net Income 50,000 23,000
Retained Earnings, Beginning 282,000 271,000Dividends Declared (27,000) (12,000)Retained Earnings, Ending 305,000$ 282,000$
WINDSIDE CO.
Balance Sheet and Income Statement analysis provides the following selected comparative information:
20X0 20X9 Trend
Current Ratio 2.97:1 1:0 Favorable
Cash Balance to Long-term Debt 1.25:1 .38 Favorable
Net working Capital $308,000 $1,000 Favorable
Net Income to Sales 4% 1.87% Favorable
Total Liabilities to Stockholders’ Equity 54% 90% Favorable
Times Interest Earned 3.96 times 3.70 times Favorable

159
WINDSIDE CO. STATEMENTS OF CASH FLOWS
FOR THE YEARS ENDED DECEMBER 31, 20X0 AND 20X9
20X0 20X9
Cash Flows From Operating Activities: 50,000$ 23,000$ Net Income Adjustments to reconcile net income to cash provided by operations: Depreciation 40,000 50,000 Deferred Taxes (5,000) 5,000 Gain on Sale of Equipment (130,000) (25,000) Gain on Sale of Other Noncurrent Assets (45,000) - Changes in operating assets and liabilities: Accounts Receivable (14,000) (3,000) Inventories (33,000) (6,000) Other Current Assets (2,000) 1,000 Accounts Payable 14,000 10,000 Accrued Liabilities (3,000) 2,000 Taxes Payable (4,000) (2,000)Net Cash (Used in) Provided by OperatingActivities (132,000) 55,000
Cash Flows from Investing Activities: Sales of Plant and Equipment 225,000 40,000 Sales of Long-term Investments 50,000 10,000 Sales of Other Noncurrent Assets 54,000 -Net Cash Provided by Investing Activities 329,000 50,000
Cash Flows from Financing Activities: Repayments of Notes Payable (100,000) (25,000) Repayments of Long-term Debt (25,000) (25,000) Dividends (27,000) (12,000) Issuance of Common Stock 120,000 -Net Cash Used in Financing Activities (32,000) (62,000)
Net Increase in Cash 165,000 43,000Cash, Beginning of the Year 85,000 42,000Cash, End of the Year 250,000$ 85,000$

160
The favorable results from the analysis performed could be misleading without further cash flow analysis to support or confirm these favorable results. For example, the Windside statement of cash flows identifies the following:
The company enjoyed substantial increases in cash because they are self-liquidating
The company used proceeds from asset sales and the issuance of stock to finance current operations
Without the “one time” gains from the sale of long-term assets, the company would have incurred a substantial loss for 20x0.
Cash flows from operations were negative
Net income was a negative $125,000 ($50,000 net income less $175,000 of one-time gains)

161
CASE 5 – REVIEWING A SMALL BUSINESS CASH FLOW STATEMENT
The Statement of Cash Flows that follows is an actual one from the author’s accounting practice. It is typical of the “small business” issues encountered on a daily basis. The company is an S Corporation.
Review the statement and answer the questions which follow, to the extent you can without the other statements and footnotes.
MORGAN MANUFACTURING CO. INC.
STATEMENT OF CASH FLOWS FOR THE YEARS ENDED DECEMBER 31, 20X5 AND 20X4
20X5 20X4Cash flows from operating activities:Net income (loss) 37,943$ (196,186)$ Adjustments to reconcile net income to net cash provided by operating activities: Depreciation and amortization: Property and equipment 21,954 20,409 Covenants not to compete 96,288 96,288Bad debts 3,002 3,960Gain on sale of equipment (2,045) (6,019)Officers' life insurance (8,991) (4,208)Noncash compensation 324,856 293,068Increase (decrease) in cash arising from changes in assets and liabilities (exclusive of merger of affiliate): Accounts receivable 43,413 (63,875) Inventories 14,275 30,725 Prepaid expenses (10,457) 1,761 Accounts payable (36,004) 31,235 Due to affiliate for rent and interest (74,953) (27,254) Accrued expenses 2,015 536Total adjustments 373,353 376,626Net cash provided by operating activities 411,296 180,440
Cash flows from investing activities: Advances to affiliates and stockholders - (14,752) Repayments from affiliates and stockholders 60,000 79,558 Cash acquired in merger of affiliate - 15,114 Purchase of property and equipment (51,580) (8,593) Proceeds from sale of property and equipment 7,620 6,019 Payments for increase in cash value of officers' life insurance (17,063) (7,041)Net cash provided by (used for) investing activities (1,023) 70,305

162
MORGAN MANUFACTURING CO. INC. STATEMENT OF CASH FLOWS (continued)
FOR THE YEARS ENDED DECEMBER 31, 20X5 AND 20X4 20X5 20X4
Cash flows from financing activities: Advances from affiliates and stockholders 210,000 100,000 Repayments to affiliates and stockholders (249,112) (150,000) Repayment of long-term debt (320,826) (314,176) Dividends paid - -Net cash used for financing activities (359,938) (364,176)
Net increase (decrease) in cash 50,335 (113,431)
Cash, beginning of the year 155,049 268,480
Cash, end of the year 205,384$ 155,049$
Supplemental cash flow information:Cash paid for interest 60,687$ 76,797$

163
QUESTIONS FOR DISCUSSION
1. Summarize the 4 or 5 most significant components of cash inflows/outflows for each year.
2. a. Identify all of the line items which involve, or appear to involve, related party transactions.
b. How has the prevalence of related party transactions impacted the cash balances maintained by Morgan in the last 2 years?
3. What is management’s rationale for taking large bonuses while distributing no dividends?

164
4. Based solely on the limited information in the cash flow statements presented, what can you tell about how proceeds from long-term debt were used?
5. As this company’s banker/loan officer, what specific concerns would you have about this borrower?
6. As this company’s banker/loan officer, where is the “security” in this borrowing relationship?

165
QUALITY OF EARNINGS
Earnings quality is regarded as high when reported income represents, as closely as possible, the operating results of a company during a period of time, using the most representative accounting policies and accounting alternatives. Companies may, at times, manipulate reported earnings, thereby reducing their quality. Earnings management activities often take place to achieve the following goals:
Improve opportunities for incentive compensation rewards (bonuses, stock options);
Obtain additional long-term borrowings;
Maintain compliance with debt covenants;
Reduce taxable income for cash flow or labor negotiating purposes;
Meeting published, announced, or market expectations related to revenues or earnings.
Earnings quality is influenced by the accounting policies employed by a company. The more estimates and judgments associated with reported earnings, the poorer the quality. Reported earnings should reflect operating cash flow results, but frequently do not. In other words, reported revenues and expenses that closely reflect cash collections and cash payments represent higher quality earnings than those that do not.
In some instances, management’s objectives must also be considered when evaluating the quality of reported earnings. For example, many companies attempt to maximize reported earnings to comply with performance debt covenants or influence stock values, while other companies look to minimize reported earnings to reduce their tax liabilities.
In addition, accounting alternatives can impact the accuracy of reported earnings, when the amounts or the nature of reported earnings are influenced by an accounting policy, not operating results. Examples of accounting policies where alternatives are permitted include inventory costing, depreciation, revenue recognition, and customer solicitation costs.
The stability of earnings is another closely watched measure of a company’s quality of earnings; the more earnings from recurring operating transactions, the better the quality of earnings. When nonrecurring gains and losses represent significant components of reported net income, earnings quality declines.
Many users focus on the quality of an entity’s earnings by performing cash flow analysis to validate the amount of reported earnings. For earnings to be “earnings,” operating cash flow must be available to support the amount of reported earnings. That is, net income and net operating cash flow over

166
time should be virtually identical if the quality of earnings is high. Lower quality earnings result when:
Cash flows cannot be sustained by the entity,
OR
An entity uses accounting standards which permit accrual of income that is not supported by net operating cash inflows,
OR
An entity changes its revenue recognition policies to accelerate revenues when operating cash flows will not occur until some future uncertain period.
The above qualitative aspects of earnings (estimates, judgments, objectives, alternatives, stability, recurring, and operating) are frequently assessed through the use of cash flow ratios. For example:
Ratio Formula Meaning
Quality of Earnings
Cash Flow from Operations
Net Income plus Depreciation and
Amortization
Measures how close accrual-based earnings are to reported operating cash flows. Over time, this measure should approximate “1.” When this measure is consistently below “1,” this is an indication of poorer quality earnings.
Comments: Net income is adjusted for significant noncash revenue and expense items, such as depreciation and amortization, in order to provide a consistent measurement of income. The Quality of Earnings ratio should approximate “1” over two to three years, if reported earnings are of a high quality. In any specific year, this ratio may be higher or lower than “1” due to accrual versus cash timing differences which should reverse in the future. If the ratio is significantly above “1” over time, this may suggest accelerated current collections or management intentionally understating net income. While this ratio should not be used as the sole measure of an entity’s quality of earnings, it can provide a significant indication of a problem in the reported earnings of an entity.
Ratio Formula Meaning
Quality of Revenues
Cash Receipts Net Revenue
Measures how close accrual-based revenues are to reported cash revenues.
Comments: A higher percentage is indicative of better earnings quality.

167
These ratios help identify the “biases” caused by accrual-based accounting and choices among GAAP alternatives. The following example illustrates a quality of earnings application:
EXAMPLE
Several years ago Client A was preparing to buy a motel in a beach resort community. The author was asked to visit the motel and perform normal “due diligence” as it relates to the property, management, and current ownership. While performing this work, the author asked the current owners for copies of financial statements they had submitted to the mortgage holder for the prior seven years. Among other procedures performed, the author prepared a trend analysis consisting of quality of earnings ratios for the seven-year period.
The result of that analysis is presented below:
Year 1: 67%
Year 2: 81%
Year 3: 56%
Year 4: 76%
Year 5: 84%
Year 6: 78%
Year 7: 76%
... or an arithmetic average of 74%.
Since this business was primarily a cash business with limited noncash items other than depreciation, this relationship did not make sense. The author discussed these relationships with the current owner and was able to eventually determine that the hotel was overstating revenues by increasing the reported occupancy rate of the hotel to satisfy certain compliance requirements mandated by the lender and the hotel chain managing the hotel. Neither the lender, hotel chain, nor the hotel’s auditor had discovered this overstatement. The hotel owner overstated revenue by debiting fixed asset acquisitions and crediting sales. Apparently, the auditor did not audit fixed assets.
There is an appealing “symmetry” to this scheme. The fictitious revenue would, of course, never be collected in cash. Over time, the fictitious assets will “conceal themselves” through non-cash depreciation charges.

168
CASE 6 – READING A STATEMENT OF CASH FLOWS
The 20X9 Statement of Cash Flows for Lenape Products, Inc. is presented below. Use the statement to answer the following questions:
LENAPE PRODUCTS, INC. STATEMENT OF CASH FLOWS
FOR THE PERIOD ENDED DECEMBER 31, 20X9 Cash Flows from operating activities: Net income $320,240 Adjustments to reconcile net income to cash provided by operations: Depreciation 168,220 Bad debts 11,500 Loss on sale of equipment 17,839 Effect on cash of changes in operating assets and liabilities: Accounts receivable (27,065) Inventories (39,483) Accounts payable 47,060 Accrued expenses 21,956 Income taxes payable (29,275)Cash provided by operating activities $490,992
Cash Flows used in investing activities: Purchases of property and equipment (284,414) Sale of equipment 30,000 Purchases of long-term investments (32,097) Purchase of other assets (21,426)Cash used in investing activities ($307,937)
Cash Flows used for financing activities: Net reduction of line of credit borrowings (5,125) Repayments of long-term debt (75,246) Issuance of common stock 3,292 Dividends paid (61,775)Cash used in financing activities ($138,854)
Net increase in cash $44,201Cash, beginning of year 243,829Cash, end of year $288,030
Disclosures: Property and equipment acquired under capital lease $20,000Cash paid for: Income taxes $238,357 Interest $15,210

169
QUESTIONS FOR DISCUSSION
1. Explain to the CEO of Lenape the primary sources and uses of cash during 20X9. Keep the list short, as he detests discussing financial data.
2. Comment on quality of earnings for 20X9.
Quality of earnings = Cash flows from operations (Net Income + Depreciation + Amortization)
3. a. The biggest cash outflow is for the acquisition of property and equipment. How are these acquisitions being financed?
b. Although the company could clearly afford these additions, what inquiry might you make about them?
4. Can you form any conclusions about this company’s stage of development, i.e., start-up, growth, mature, or decline stage?
170
CASE 7 – FINDING THE TRUTH IN THE CASH FLOW STATEMENT
ENRON CASH FLOW ANALYSIS
To further demonstrate the importance of cash flow analysis, the following financial statements are from the pre-bankruptcy years of Enron Corp. Simple quality of earnings analysis and follow up could have served as a “red flag” for potential liquidity problems at Enron months before the financial markets caught on!

171

172

173

174

175
QUESTIONS FOR DISCUSSION
1. Calculate Enron’s quality of earnings for 1998 and 1999. Given the trend, what would you predict the quality of earnings would be in 2000?
2. Calculate the 2000 quality of earnings. Review all the financial statements to understand what caused this surprising reversal. What was the major item that contributed to this reversal? Do you agree with Enron’s classification of this transaction?

176
Additional Quality of Earnings Considerations – Risk Indicators
Identifying the quality of a company’s reported earnings enables the user to determine if earnings truly represent the operating results of a company. In addition, users can utilize the Statement of Cash Flows to identify or predict financial difficulties a company may have. The following list of cash flow relationships should be useful in determining any possible operational problems:
Net income plus depreciation exceeding cash flow from operations
Net income growing at a rate that exceeds operating cash flow growth
Inventories increasing at a greater percentage than sales
Receivables increasing at a greater percentage than sales
Reductions in capital expenditures over time
Negative operating cash flows over time
Positive investing and financing cash flows with negative operating cash flows
Selling assets to fund current operations or pay down debt
FLEXIBILITY RATIOS
These ratios are particularly helpful in analyzing the ability of an entity to take effective actions to alter amounts and timing of cash flows so it can respond to unexpected needs and opportunities.
Ratio Formula Meaning
Operating Cash Flow to Net Revenue
CFFO Net Revenue
(Sales)
Measures an entity’s net cash flows generated per dollar of revenue.
Comments: When net income is creatively managed by an entity, this ratio would be more meaningful than profit margin on sales. Since payments to employees and third parties must be in cash, not earnings, this ratio provides users with a useful performance measure to analyze operating cash flow performance.
Ratio Formula Meaning
Operating Cash Flow to Number of Employees
CFFO Number of Employees
Measures the performance efficiency of the entity based on a non-financial measure.
Comments: The higher the ratio the better, since a high ratio signifies greater efficiencies being experienced within the entity (i.e., higher amounts of cash flow generated per employee).

177
Ratio Formula Meaning
Operating Cash Flow to Total Assets
CFFO Average Total
Assets
Measures an entity’s net cash flows generated from all resources.
Comments: This measure suffers from the same purchasing power criticisms described in the rate of return on assets and equity measurements.
Ratio Formula Meaning
Debt Coverage CFFO Total Debt
Measures the amount of operating cash flow coverage for total debt at a point in time.
Comments: Greater flexibility is availed to management, and greater protection is provided to creditors as this ratio increases. This ratio expresses an entity’s ability to pay its debts with operating cash flows. The higher the ratio the greater the ability to liquidate those debts.
Ratio Formula Meaning
Times Interest Paid
CFFO Interest Paid
Measures the amount of operating cash flow coverage for interest paid during a period.
Comments: The higher the ratio, the greater protection availed to creditors as it relates to an entity’s ability to service its debt payments. This ratio is superior to the times interest earned ratio previously discussed because it measures the payments made, not the expense incurred.
Ratio Formula Meaning
Operating Cash Flow to Current Liabilities
CFFO Current Liabilities
Measures the amount of operating cash flow coverage for current liabilities at a point in time.
Comments: Same as debt coverage; the higher the ratio, the greater the entity’s ability to liquidate current obligations. A higher ratio indicates greater management flexibility.

178
Ratio Formula Meaning
Self-Liquidation – PP&E
Proceeds from Sale of PP&E Average PP&E
Reflects whether an entity is selling off its asset base to finance other operations.
Comments: An increasing percentage is indicative of self-liquidation.
EXAMPLE
Cash Flow from Investing Activities Sears Holdings Corporation
($ Millions)
Following is from Sears Holding Corporation’s Statement of Cash Flows. This shows the full detail for Cash Flows from Investing Activities and summary information from the rest of the statement.

179
Ratio Formula Meaning
Free Cash Flow CFFO (Adjusted for any non-recurring items)
minus Capital Expenditures and
Debt Payments and Dividends (Owner
Distributions)
Measures the amount of cash flow remaining to deal with changing operating conditions and/or the ability to take advantage of new opportunities.
Comments: In recent years, lenders and other creditors have used a cash flow approach to evaluate credit worthiness of borrowers. Increasingly, covenants in loan agreements include references to debt service coverage that compare cash flows to a definition of fixed commitments. A concept gaining wide acceptance is that of “free cash flow,” or amounts of cash left over once fixed, required payments are satisfied. These relationships help third-parties measure the on-going flexibility of an organization to deal with changing business circumstances or take advantage of emerging opportunities. In ratio format, free cash flow is effectively cash flow from operations (adjusted for any non-recurring items) divided by recurring payments. Increasing amounts (excesses) reflect an entity’s ability to generate sustainable cash flow from operations.
Ratio Formula Meaning
Cash Gap Billing Lag (if available), plus
Days Sales in AR, plus
Days Sales in Inventory, minus
AP Days Outstanding
The cash gap reflects the equivalent number of days, on an annual basis, that an entity has to fund a timing difference between operating cash receipts and cash disbursements.
Comments: Increasing investments in accounts such as receivables and inventory have the effect of increasing interest cost to an entity and reducing the entity’s flexibility in dealing with changing conditions and unexpected circumstances.
Cash gap analysis demonstrates the cost of investing in working capital. It is useful for setting internal objectives as well as industry and competitive benchmarking.
The cash gap analysis is based on the operating cycle and the average interest cost on debt during the period. The operating cycle is calculated as follows:
Operating cycle days = Days receivable + Days inventory – Days payables

180
EXAMPLE
This example calculates the 2017 cash gap for three companies in the pharmaceutical industry – Pfizer, Merck, and Johnson & Johnson. The interest cost to fund the cash gap is also calculated.
For information purposes, the balance sheets and income statements for each company follow the cash gap calculations.
The cost of each company’s cash gap in 2017 is calculated (in $ millions) as follows:

181
Cash Gap Analysis
PfizerAve Rec AR Turn
Number of Days in AR 8,221$ 8,225$ 52,546$ Sales
16,446$ 8,223$ 6.4$ 57.12 Days
Ave Inv Inv TurnNumber of Days in Inv 7,578$
6,783$ 11,240$ COS14,361$ 7,181$ 1.57
233.17 Days
Number of Days in AP Ave AP AP Turn4,656$ 4,536$ 11,240$ 9,192$ 4,596$ 2.45
149.25 Days
Cash Gap 141.05 Days
Johnson & JohnsonAve Rec AR Turn
Number of Days in AR 13,490$ 11,699$ 76,450$ Sales25,189$ 12,595$ 6.1$
60.13 Days
Ave Inv Inv TurnNumber of Days in Inv 8,765$
8,144$ 25,354$ COS16,909$ 8,455$ 3.00
121.71 Days
Number of Days in AP Ave AP AP Turn7,310$ 6,918$ 25,354$
14,228$ 7,114$ 3.56102.41 Days
Cash Gap 79.43 Days

182
MerckAve Rec AR Turn
Number of Days in AR 6,873$ 7,018$ 40,122$ Sales
13,891$ 6,946$ 5.8$ 63.18 Days
Ave Inv Inv TurnNumber of Days in Inv 5,096$
4,866$ 12,775$ COS9,962$ 4,981$ 2.56
142.31 Days
Number of Days in AP Ave AP AP Turn3,102$ 2,807$ 12,775$ 5,909$ 2,955$ 4.32
84.41 Days
Cash Gap 121.08 Days
Cash Gap - 2017
Pfizer 141 days
Merck 79 days
Johnson & Johnson 121 days

183
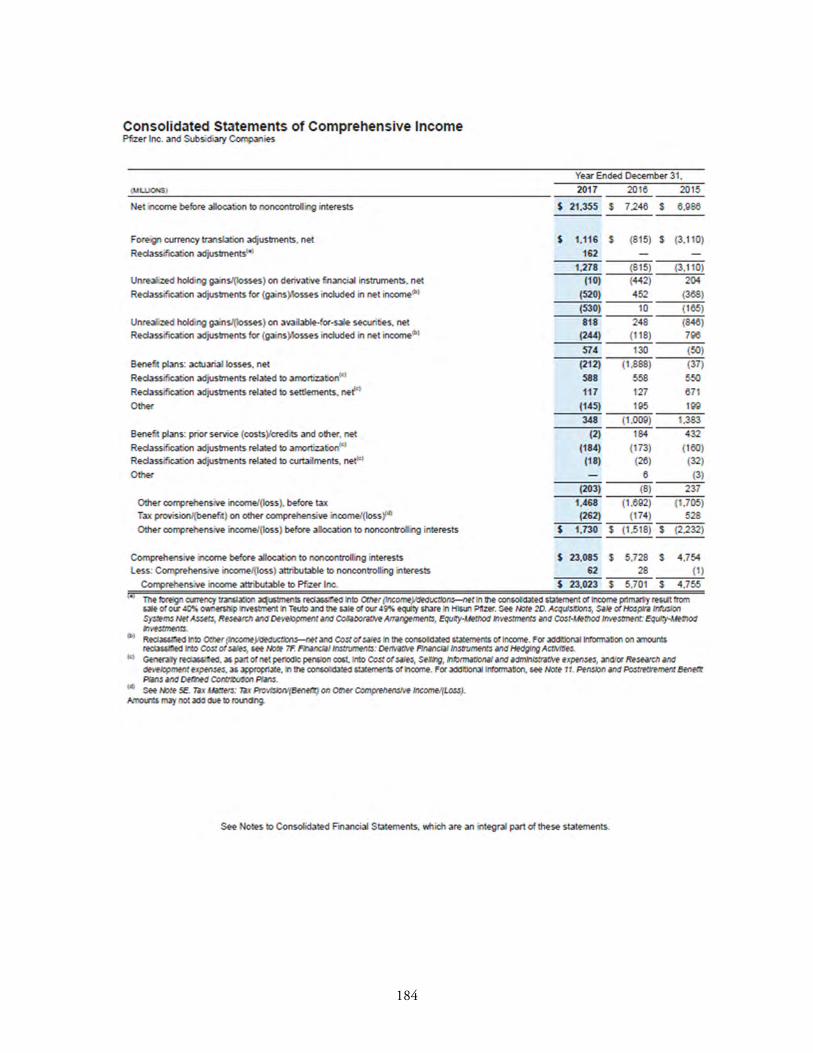
184

185

186

187

188

189
Ratio Formula Meaning
EBITDA Earnings + Interest, Taxes, Depreciation,
and Amortization
Measures the amount of earnings a company generates from operations before non-operational expenses such as interest, taxes, depreciation and amortization. (EBITDA ignores changes in inventory, receivables, and capital acquisitions). This is a pro forma earnings, and many times used as a pro forma cash flow, measure.
Comments: A substitute measure for CFFO by those that believe CFFO does not provide an accurate view of an entity’s ability to create value. EBITDA presents two major problems as an analysis tool: 1) It ignores too many expenses for it to be an effective substitute for GAAP earnings, and 2) it is a poor substitute for cash flow because it does not measure an entity’s actual cash flows – it ignores working capital changes, debt payments, and capital expenditure payments. In other words, EBITDA is not an effective measure of cash flow because it ignores balance sheet changes.
USE OF INDUSTRY DATA OR PEER GROUP COMPARISONS Traditional forms of financial statement analysis – horizontal, vertical, and/or ratio analysis – are applied to a company’s financial data over extended periods in order to identify trends. Trends permit the analyst to assess whether an area of interest is improving or not, and helps predict future performance.
However, reviewing trends alone is not always adequate to fully assess a company’s performance. Additional measurements upon which a company can be compared to its peers or industry group is often necessary to complete the “analytical” picture. Analysts, therefore, use published industry/peer group benchmarks to assist in this analysis.
The availability of information is no longer an issue; rather, locating the most relevant information from the voluminous available sources is. The Internet can provide every imaginable performance measure for any publicly held company; this data is obviously useful in its current form for studying the fundamentals relevant to investment decisions. Many argue, however, that industry data or peer group benchmarks are not as useful when performing analysis on unique or small companies because:
The data is arranged by industry codes and does not necessarily correspond to the company’s central operations; and
Public company measurements reflect different capital structures and long-term objectives.
To a large degree, these arguments are weakened for the following reasons:
First, the explosion of available data in recent years includes information that is useful in virtually any situation; the challenge is finding it. And it may not be free.

190
Second, there are publications and web services geared exclusively toward small businesses. In fact, a case that follows in this course uses data from an outside service that provides common size and ratio measurements by industry only for businesses with $1 million or less in assets.
Third, general economic conditions and information from trade journals provide a good deal of useful information in analyzing operations, financial position, and cash flows.
EXAMPLE
Financial performance for a commercial real estate broker that sells and leases office space in a particular region could be measured against general economic conditions for the region (growth vs. recession, employment levels, and lending climate) and specific industry trends such as vacancy rates, rents per square foot, new construction data, and recent sales figures.
A car dealership is affected by interest rates, widely publicized data on vehicle sales and incentives, fuel costs, consumer buying trends, and the general state of the local economy.
Any analysis of a company that deals with commodity-sensitive goods or services will be significantly affected by changes in commodity prices. A wire and cable manufacturer, for instance, whose product costs are largely comprised of copper materials, can be expected to see proportional increases in its inventory, cost of goods sold, sales, accounts receivable, accounts payable, line of credit borrowings, and interest expense in periods where copper (a commodity) experiences dramatic increases. While a somewhat obvious example, this demonstrates that analysis cannot be performed “in a vacuum”; relevant industry data must be incorporated.
Sources of Industry Information
While there are infinite sources of information to obtain industry data, the following list provides a good starting point for searches:
RMA Annual Statement Studies, RMAHQ.ORG
Almanac of Business and Industrial Financial Ratios, CCHGROUP.COM
Key Business Ratios, KBR.DNB.COM
National Trade and Professional Associations of the U.S. (Through Columbia Books and Information Services: (888) 265-0600)
ProfitCents by Sageworks (PROFITCENTS.COM), (866) 603-7029
Shared Services Benchmarking Association (SSBENCHMARKING.ORG)
The Benchmarking Network, Inc. (WELL.COM)
FINANCE.YAHOO.COM
CFO.COM

191
CEOEXPRESS.COM
HOOVERS.COM
ACCOUNTANTSWORLD.COM
BIZSTATS.COM
BIZMOVE.COM
ACCOUNTINGWEB.COM
Benchmarking Websites:
http://www.apqc.org/benchmarking
http://asq.org/quality-resources/benchmarking
When doing an Internet search using your search engine, we suggest you consider using the following phrases to obtain related web sites:
“Benchmarking”
“Best practices”
“Performance measurements”
“Financial ratios”
“Cash flow ratios”
“Peer group comparisons”
ALTMAN Z-SCORE – BANKRUPTCY PREDICTION
In 1968, Dr. Ed Altman a professor at NYU, created a Z-Score formula for predicting bankruptcy. This formula combines five (four if a private non-manufacturing company) ratios weighted based on his model, that predicts bankruptcy 70% to 80% of the time. This Z-Score uses statistical techniques, developed by Dr. Altman, to predict an entity’s probability of failure.
The formula for a public company is: A EBIT/Total Assets * 3.3 B Net Sales/Total Assets * .999 C Market Value of Equity/Total Liabilities * .6 D Working Capital/Total Assets * 1.2 E Retained Earnings/Total Assets * 1.4 Z-Score = (A*3.3)+(B*.999)+(C*.6)+(D*1.2)+(E*1.4)

192
Z-Score above 2.99 – Bankruptcy not likely Z-Score between 2.7 and 2.99 – Bankruptcy uncertain Z-Score between 1.8 and 2.7 – Bankruptcy likely within 2 years Z-Score less than 1.8 – Bankruptcy is likely within one year
The formula for private manufacturing companies is: A EBIT/Total Assets * 3.107 B Net Sales/Total Assets * .998 C Book Value of Equity/Total Liabilities * .420 D Working Capital/Total Assets * .717 E Retained Earnings/Total Assets * .847 Z-Score = (A*3.107)+(B*.998)+(C*.420)+(D*.717)+(E*.847) Z-Score above 2.9 – Bankruptcy not likely Z-Score between 1.23 and 2.9 – Bankruptcy uncertain Z-Score less than 1.23 – Bankruptcy is likely within one year
The formula for private non-manufacturing companies is: A EBIT/Total Assets * 6.72 B Book Value of Equity/Total Liabilities * 1.05 C Working Capital/Total Assets * 6.56 D Retained Earnings/Total Assets * 3.26 Z-Score = (A*6.72)+(B*1.05)+(C*6.56)+(D*3.26) Z-Score above 2.6 – Bankruptcy not likely Z-Score between 1.1 and 2.6 – Bankruptcy uncertain Z-Score less than 1.1 – Bankruptcy is likely within one year
When potential bankruptcy or significant operational changes are taking place, financial statement users may also want to utilize the Altman Z-Score as part of their analysis.
Note: Auditors and accountants should use the Altman Z-Score as a supplement to other procedures performed when assessing going concern problems.

193
EXAMPLE
Big box retailers seem to be having some difficulty competing with Amazon and other on-line retail businesses. Using 1/31/2017 as a base year for calculations, the following creates the Altman Z-Scores for Sears and Target.
Altman Z-Score Calculations
Sears:
3.3(-442/7,262) + .999(13,409/7,262) + .6(243/10,985) + 1.2(-1,103/7,262) + 1.4(-5,895/7,262) =
-.200 + 1.845 + .013 + -.182 + -1.136 = .339
Target:
3.3(4,312/38,999) + .999(71,879/38,999) + .6(39,800/27,290) + 1.2(-637/38,999) + 1.4(6,553/38,999) =
.364 + 1.841 + .875 + -.0196 + .235 = 3.297
Clearly, Sears is in some difficulty.

194
CASE 8 – FINANCIAL STATEMENT ANALYSIS
Following are the income statement, balance sheet, and summary statement of cash flows for Mattel and Hasbro. Both companies are in the same industry and have closely-equivalent size (by sales); however, their financial and operating performance differs substantially.
From the selected ratios below, evaluate both companies from the perspective of a financial statement user.
To simplify the case, only the current year information is included in the solution. Averages are not calculated.
What conclusions do you reach?

195

196

197

198
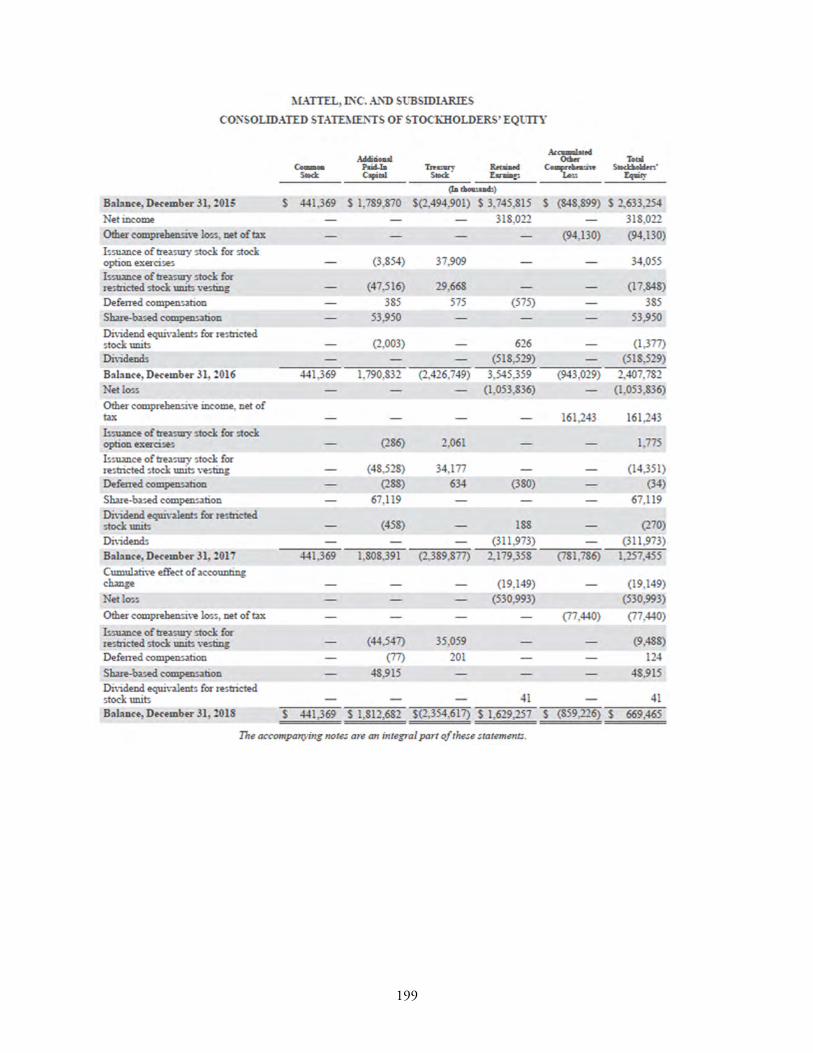
199

200

201

202

203
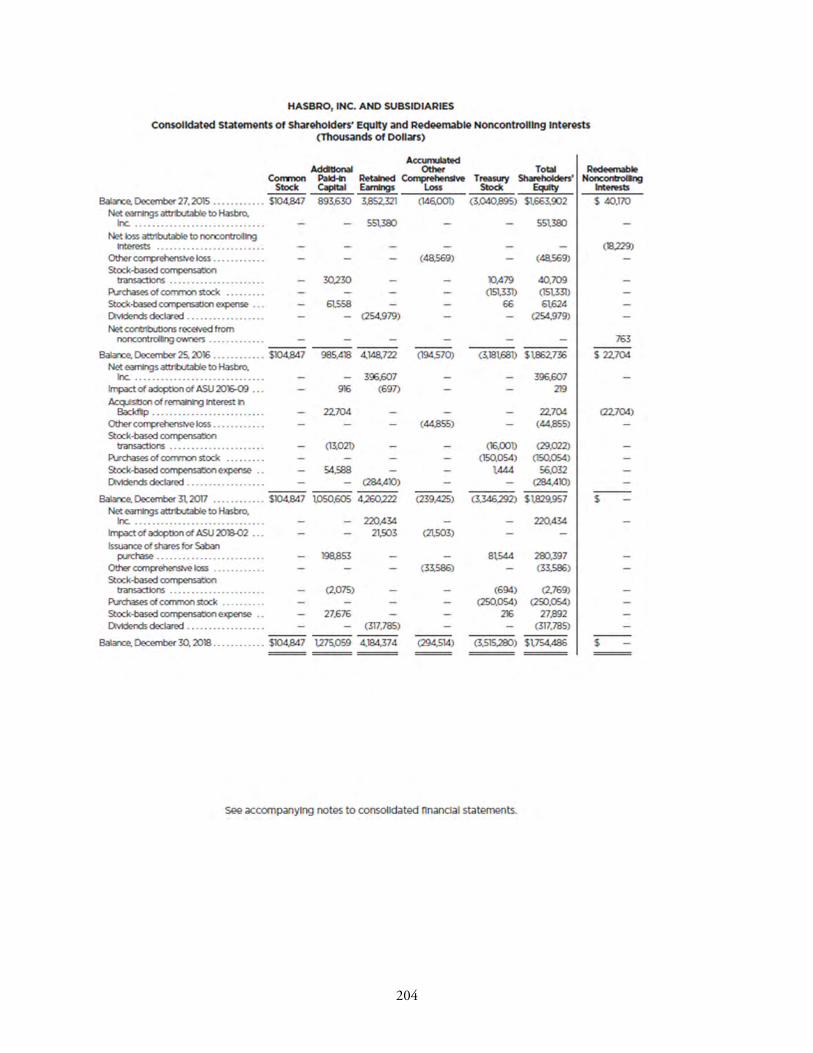
204

205
Additional information as of December 31, 2018:
Mattel Hasbro Earnings per share $ (1.54) $ 1.74 Dividends per share $ 0 $ 2.52 Stock price $ 9.99 $ 79.71 Number of employees 27,000 5,800 Market cap $ 4.4B $ 16.7B
RATIOS ‒ 2018 RATIO ANALYSIS
Mattel Hasbro Short-Term Liquidity:
Current Ratio Current Assets 2,352,440 1.88 3,082,504 2.42
Current Liabilities 1,252,608 1,274,324 Quick Ratio Cash+Cash Eq+AR 1,564,564 1.25 2,370,423 1.86
Current Liabilities 1,252,608 1,274,324
Efficiency:
AR Turnover Sales 4,510,852 4.65 4,579,646 3.85
Accounts Receivable 970,083 1,188,052
Days Sales in AR 360 Days 360 77.4 360 93.4
AR Turnover 4.65 3.85 Inventory Turnover Cost of Goods Sold 2,716,127 5.00 1,850,678 4.17
Inventory 542,889 443,383 Days Sales in Inv 360 Days 360 72.0 360 86.2
Inventory Turnover 5.00 4.17 AP Turnover Cost of Goods Sold 2,716,127 5.05 1,850,678 5.55
Accounts Payable 537,965 333,521 AP Days OS 360 Days 360 71.3 360 64.9
AP Turnover 5.05 5.55 Asset Turnover Sales 4,510,852 0.86 4,579,646 0.87
Total Assets 5,243,465 5,262,988

206
RATIOS ‒ 2018 RATIO ANALYSIS Leverage:
Debt to Total Assets Total Debt 4,574,000 0.87 3,508,502 0.67
Total Assets 5,243,465 5,262,988 Debt to Equity Total Debt 4,574,000 6.8 3,508,502 2.00
Stockholders' Equity 669,465 1,754,486 Financial Leverage Total Assets 5,243,465 7.8 5,262,988 3.00
Stockholders' Equity 669,465 1,754,486 Times Interest End Operating Income ‒236,507 ‒1.30 331,052 3.64
Interest Expense 181,886 90,826 Profitability:
Net Profit Margin Net Income ‒530,993 ‒0.12 220,434 0.048
Sales 4,510,852 4,579,646 Gross Profit Margin Gross Profit 1,794,725 0.40 2,377,308 0.52
Sales 4,510,852 4,579,646
Operating Profit Margin Operating Income ‒236,507 ‒0.05 331,052 0.072
Sales 4,510,852 4,579,646 Operating Exp to Operating Expenses 2,031,232 0.45 2,046,256 0.45 Net Rev (Sales) Sales 4,510,852 4,579,646 Sales per Employee Sales 4,510,852 167 4,579,646 790
Number of Employees 27,000 5,800 Return on Assets NI+After-Tax Interest ‒419,261 ‒0.08 311,260 0.06
Total Assets 5,243,465 5,262,988 Return on Equity Net Income ‒530,993 ‒0.79 220,434 0.13
Total Equity 669,465 1,754,486 Dividend Payout Ratio Dividends 0 0 317,785 1.44 Net Income ‒530,993 220,434 Price-Earnings Ratio Market Price per Sh 9.99 ‒6.5 79.71 45.8
Earnings per Sh ‒1.54 1.74

207
RATIOS ‒ 2018 RATIO ANALYSIS Market Cap 4.4B 16.7B
Cash Flow:
CFFO to Sales CFFO ‒27,317 ‒0.006 645,997 0.14
Sales 4,510,852 4,579,646 CFFO to Number of
Employees CFFO ‒27,317 ‒1.01 645,997 111 Number of Employees 27,000 5,800 CFFO to Total Assets CFFO ‒27,317 ‒0.005 645,997 0.12
Total Assets 5,243,465 5,262,988 Debt Coverage CFFO ‒27,317 ‒0.006 645,997 0.18
Total Debt 4,574,000 3,508,502 Times Interest Paid CFFO ‒27,317 ‒0.16 645,997 7.9
Interest Paid 173,951 82,258
CFFO to Current Liab CFFO ‒27,317 ‒0.022 645,997 0.51
Current Liabilities 1,252,608 1,274,324 Quality of Earnings CFFO ‒27,317 0.105 645,997 1.28
NI+Depr+Amort ‒259,061 505,948 Free Cash Flow CFFO-CAPEX-Debt Pay-Div ‒929,731 196,313
EBITDA Earnings before Int / Taxes/
Depr/Amor ‒15,524 588,504

208
Conclusion

209
Appendix CASE 8: FINANCIAL STATEMENT ANALYSIS – RATIO ANALYSIS
RATIO ANALYSIS
Mattel Hasbro
Short‐term liquidity:
Current ratio Current Assets
Current Liabilities
Acid‐test ratio Cash + Cash Eq + AR
(Quick ratio) Current Liabilities + +
+ +
Efficiency:
Days sales in AR Accounts Receivable days
Credit sales/360
360 360
AR turnover 360 360 times 360
Days sales in AR ‐ ‐
Days sales in Inventory days
inventory Cost of goods sold/360
360 360
Inventory turnover 360 360 times 360
Days sales in inventory ‐ ‐
Days payables Accounts Payable days
outstanding Cost of goods sold/360
360 360
Inventory turnover 360 360 times 360
Days sales in inventory ‐ ‐
Fixed assets Sales times
turnover PP&E

210
RATIO ANALYSIS
Mattel Hasbro
Flexibility:
Operating Cash Flow CFFO
to Net Revenue Net Revenue
Operating Cash Flow CFFO
to No. of Employees Employees
Operating Cash Flow CFFO
to Total Assets Assets
Debt Coverage CFFO
Total Debt
[Current + Long Term]
Times Interest Paid CFFO
Interest Paid
Operating Cash Flow CFFO
to Current Liabilities Current Liabilities
Earnings Quality CFFO
NI + Depr + Amort
Free Cash Flow CFFO
‐ Capital Expenditures +
‐ Debt Payments +
‐ Dividend Payments +
= Free Cash Flow
EBITDA Operating Income
+ Depr + Amort +

211
Case Solutions SOLUTION TO CASE 1 – INDUSTRY RATIOS
Column 1 is a hyper market (Target). Note: small profit margin, little receivables and high inventory.
Column 2 is a department store (Kohl’s). Note: small profit margin, receivables representing its own credit card, and somewhat high operating expense to revenue.
Column 3 is a bank (Wells Fargo). Note: high current assets/current liabilities, high receivables, high total assets, no inventory, no cost of sales and very high operating expense to revenue.
Column 4 is an automobile manufacturer (Ford Motor). Note: high current assets (financial receivables), high PP&E, small gross profit, small profit margin and high other non-current liabilities representing primarily financial services long-term debt.
Column 5 is an airline (Delta Air). Note: high gross profit, moderate profit margin, small inventory, and high other non-current liabilities representing airplane leases, pension liabilities, and frequent flyer deferred revenue.
Column 6 is a hotel management company (Marriott). Note: high profit margin, no inventories, small PP&E, no cost of sales, little receivables.
Column 7 is a pharmaceutical company (Merck). Note: high gross profit, high R&D expenses, and high inventory.
Column 8 is a telecommunications company (AT&T). Note: high total assets, high PP&E, high gross and net profit, high long-term debt, and high other non-current liabilities representing deferred taxes and post-employment benefit obligations.
Column 9 is an oil and gas company (Exxon/Mobil). Note: highest inventory, high PP&E, moderate profit margin, low operating expenses to sales, and high other non-current liabilities representing primarily deferred taxes and postretirement benefits.
Column 10 is a restaurant chain (Yum Brands). Note: limited receivables and inventories, high profit margin representing significant franchise fees, and moderate operating expenses to sales.

212
12
34
56
78
910
Balances (m
illions)
Hyper M
kts
Dept Stores
Banking
Auto M
FG
Airlines
Hotel Man Co
Pharm
Telecom
Oil and Gas
Rest
Current Assets
11,990
$
5,247
$
361,164
$
115,902
$
7,844
$
2,747
$
24,766
$
79,146
$
47,134
$
2,507
$
Receivables
‐$
378
$
956,185
$
10,599
$
2,377
$
1,991
$
6,873
$
16,522
$
25,597
$
400
$
Inventories
8,309
$
3,795
$
‐$
10,277
$
1,330
$
‐$
5,096
$
‐17,000
$
13
$
Current Liabilities
12,708
$
2,974
$
1,474,541
$
94,600
$
18,573
$
6,010
$
18,614
$
81,389
$
57,771
$
1,512
$
P,P&E
24,658
$
8,103
$
8,333
$
35,327
$
26,563
$
1,793
$
12,439
$
125,222
$
252,630
$
1,697
$
Total Assets
37,431
$
13,574
$
1,930,115
$
99,000
$
38,641
$
5,936
$
87,872
$
444,097
$
348,691
$
5,311
$
Long‐Term
Debt
11,031
$
2,795
$
255,077
$
15,931
$
6,592
$
7,840
$
21,353
$
125,972
$
24,406
$
9,429
$
Other Non‐Current Lia
1,860
$
2,628
$
‐$
128,192
$
14,200
$
6,400
$
13,400
$
94,729
$
72,014
$
704
$
Revenue
69,495
$
18,686
$
84,000
$
145,653
$
41,244
$
5,029
$
40,122
$
160,546
$
237,162
$
5,878
$
Cost of Sales
48,872
$
11,944
$
‐$
131,332
$
16,647
$
‐$
12,775
$
77,379
$
162,000
$
3,300
$
S,G & A Exp
13,356
$
4,435
$
41,000
$
11,527
$
17,067
$
894
$
9,830
$
34,917
$
10,956
$
999
$
R&D
‐$
‐$
‐$
‐$
‐$
‐$
10,208
$
‐ ‐
‐
Gross Profit
20,623
$
6,742
$
‐$
14,321
$
24,597
$
‐$
27,347
$
83,167
$
75,162
$
2,578
$
Net Income
2,737
$
556
$
20,373
$
7,259
$
3,577
$
1,372
$
2,418
$
29,847
$
19,710
$
1,340
$
Ratios
Current Ratio
94%
176%
24%
123%
42%
46%
133%
97%
82%
166%
AR Turnover
‐
53
0.09
13.49
18.75
2.74
5.77
9.67
10.09
15.27
Num Days Sales in AR
‐
7
4,029
27
19
132
63
37
36
24
Inventory Turnover
5.78
3
‐
13.68
14.93
‐
2.56
‐10.13
132
Num Days Sales in Inv
62.24
118
‐
26.31
24.11
‐
142.31
‐35.56
3
AP Turnover
6.66
9
‐
6.05
5.33
‐
4.32
2.34
4.70
3.51
Num Days Sales in AP
54.07
42
‐
59.48
67.54
‐
84.41
153.53
76.67
102.55
LT Debt to Total Assets
37%
21%
13%
16%
17%
132%
24%
28%
7%
178%
LT Debt to Equity
126%
54%
127%
46%
47%
210%
23%
89%
13%
‐149%
Cos to Revenue
70%
64%
‐
90%
40%
‐
32%
48%
68%
56%
Gross Profit Margin
30%
36%
‐
10%
60%
‐
68%
52%
32%
44%
Net Profit Margin
4%
3%
24%
5%
9%
27%
6%
19%
8%
23%
Oper Exp to Revenue
19%
24%
62%
14%
41%
18%
25%
22%
5%
17%
Return on Assets
10%
4%
1%
3%
9%
21%
3%
7%
6%
25%
**** Schedule excludes from total/average assets ‐ intangibles.

213
SOLUTION TO CASE 3 – ECONOMIC VALUE ADDED
Calculate return on assets and economic value added to determine whether or not the Company should accept the project and make a $1 million investment.
The Board of Directors measures management performance based on return on assets (ROA) and paysmanagement bonuses based on the size and growth of ROA. The Board’s rationale behind ROA is that itincentivizes management to manage both income growth and asset efficiency.
Mark’s budget for the upcoming year had the following financial summary ($000):
Pretax income 3,000$ Effective income tax rate 33.3%Net income 2,000$ Weighted average cost of capital (WACC) equals 20.0%Average assets 3,000$ Interest expense $0
Project cost 2,000$ Project annual return 1,000$
Mark’s management is considering an incremental (unbudgeted) project that would earn $1 million per year inperpetuity on an investment of $2 million.
1. Assuming funds are available to fund this expenditure, will Mark’s management accept this project?
Management will evaluate the project based on whether or not it increases ROA because that is
Before Project After ProjectROA = Net Income1 2,000$ = 66.7% 2,000$ + 1,000$ = 60.0%
Avg Assets 3,000$ 3,000$ + 2,000$
Disaggregated ROA 66.7% 50.0%
1 Add back after-tax interest
Management will reject the project because it lowers ROA.This is an incorrect decision because this is clearly an attractive project with an ROA of 50.0%It is also an incorrect decision for the reasons explained in #2 and #3 below.
2. Will the Board support management’s decision?
The Board would evaluate the project's Net Present Value (NPV)
NPV = PV cash inflows - PV cash outflows
Perpetual annual cash inflows - initial investmentWACC
1,000$ - 2,000$ 20.0%
5,000$ - 2,000$ = 3,000$
The Board would accept the project because it has a positive net present valueand because the project's ROA is greater than the WACC capital budgeting hurdle rate.
3. Does this project create entity value?
EVA shows a project that returns more than its cost of capital creates economic profit and increases entity value
Before AfterProject Project
Accounting Profit (NI) 2,000$ 3,000$ - Capital Charge (Capital Investment X WACC) 3,000$ X 20.0% = (600)
5,000$ X 20.0% = (1,000)
= Economic Profit (EVA) 1,400$ 2,000$
EVA shows the project increases entity value because the project returns more than the cost of the capital outlay.Thus, the project should be accepted.

214
SOLUTION TO CASE 5 – REVIEWING A SMALL BUSINESS CASH FLOW STATEMENT
Questions for Discussion
1. Summarize the 4 or 5 most significant components of cash inflows/outflows for each year.
20X5: The most significant items are:
Operating activity add-backs for amortization and noncash compensation. Operating assets and liabilities reduced cash somewhat, primarily from paying down amounts to an affiliate for rent and interest.
Investing cash flows are a “wash”, with P&E additions offset by collections from related parties.
The net amount of financing cash flows consists primarily of retirement of long-term debt, plus some net repayment of amounts due to related parties.
20X4: The most significant items are:
Operating cash flows are positive despite a large loss, again due to amortization and noncash compensation add-backs.
Investing cash flows result primarily from related party repayments.
Net cash flows from financing activities are again dominated by large debt repayments.
In short, funds came from operations (only because officers took noncash compensation) and were used to pay down long-term debt.
2. a. Identify all of the line items which involve, or appear to involve, related party transactions.
Covenants (amortization)
Non-cash compensation (officers)
Due to affiliate for rent & interest
Advances/collections on “due from affiliates and officers”
Cash acquired in merger
Advances/repayments to affiliates and stockholders

215
Not immediately apparent is that some of the long-term debt is payable to the former stockholder involved in the non-compete; as is usually the case, the debt term equals the life of the covenant.
b. How has the prevalence of related party transactions impacted the cash balances maintained by Morgan in the last 2 years?
This company maintains adequate cash balances only because it:
Is subsidized by owner/managers who forego salary when cash is tight. (In fact, they took no cash pay during all of 20X5.)
Is collecting on amounts advanced to related parties in prior years.
Is not paying dividends.
3. What is management’s rationale for taking large bonuses while distributing no dividends?
Dividends are usually structured to pay quarterly estimated taxes required because the S Corporation income is reported by the owner/managers. The most probable rationale is that the owners prefer to take a large bonus in December and apply the withholding equally to the four quarters for the year, thereby delaying payment. This is an example where small business tax objectives can impact financial reporting.
4. Based solely on the limited information in the cash flow statements presented, what can you tell about how proceeds from long-term debt were used?
The relatively small amount of depreciation suggests that proceeds were not used to finance the purchase of fixed assets. The only hint is the reference to the non-compete covenant, suggesting that debt was incurred upon the departure of a stockholder.
This means that any additional debt must have been used for purposes where the funds flowed into – and back out of – the company. This is not the best situation from the bank’s point of view, and causes loan officers to monitor the debtor more closely.
Note to instructor: If participants are interested, tell them that the additional debt was used to:
a. Finance part of the purchase of an affiliate. The company borrowed the money and advanced it to the affiliate; repayments show as collections in the investing cash flows section.
b. Buy out a second stockholder who had no noncompete arrangement. His CSV insurance was inadequate to finance the buyout.

216
5. As this company’s banker/loan officer, what specific concerns would you have about this borrower?
As their banker, I would be concerned about the company’s ability to regain and sustain profitable operations, because its reliance on owners and affiliates to bankroll the company in bad times cannot go on forever. This is especially troublesome with the magnitude of long-term debt service relative to the other amounts on the statement, and the fact that loan proceeds were not spent on corporate assets that could serve as collateral.
6. As this company’s banker/loan officer, where is the “security” in this borrowing relationship?
The company’s loan officer loses no sleep over this account because borrowings are secured by the personal guaranties of the stockholders, who have accumulated substantial wealth.
SOLUTION TO CASE 6 – READING A STATEMENT OF CASH FLOWS
Questions for Discussion
1. Explain to the CEO of Lenape the primary sources and uses of cash during 20X9. Keep the list short, as he detests discussing financial data.
Cash came from operations, primarily net income with noncash depreciation added back. Cash was used primarily to buy property and equipment, repay long-term debt and pay dividends. Note also the company had sufficient cash flows to spend – about $53,000 on investments and other assets.
2. Comment on quality of earnings for 20X9.
Quality of earnings = Cash flows from operations (Net Income + Depreciation + Amortization)
Quality of earnings = $490,992 = 1.01 $320,240 + $168,220
This ratio should average 1, if accrual basis earnings corresponds to operating cash flows over time. So for this year at least, quality of earnings is right on the mark.
3. a. The biggest cash outflow is for the acquisition of property and equipment. How are these acquisitions being financed?
As the company reduced its debt in 20X2, these additions are being financed internally from profitable operations. Note that if long-term debt was used to finance these expenditures, the $284,414 would not be an investing cash flow, but rather a disclosure of noncash activities.

217
b. Although the company could clearly afford these additions, what inquiry might you make about them?
These expenditures appear large in relation to other cash flows, although we do not have the other statements to assess their materiality. The obvious question is whether the company has plans in place that justify major capital additions. Committing resources to fixed assets should provide a favorable return, just as any investment should. Consequently, the company should be buying property for a reason – planned expansion, new products, new technology, etc.
4. Can you form any conclusions about this company’s stage of development, i.e., start-up, growth, mature, or decline stage?
Based on the information given, the company appears to be in a growth stage. It is increasing not only its long-term asset base, but every operating asset and liability is increasing. Further, it is liquidating previous debt obligations. Despite the capital additions and debt reductions, it was able to pay dividends at 19.3% of earnings and still increase cash by over $44,000. The company is fortunate to have adequate cash flow during the growth period.
SOLUTION TO CASE 7 – FINDING THE TRUTH IN THE CASH FLOW STATEMENT
Enron Cash Flow Analysis
Questions for Discussion
1. Calculate Enron’s quality of earnings for 1998 and 1999. Given the trend, what would you predict the quality of earnings would be in 2000?
CFFO/(Net Income + Depreciation, depletion and amortization)
1998: 1640/(703+827) = 1.07
1999: 1228/(893+870) = .70
Trend would predict 2000 around .30 – .40.
2. Calculate the 2000 quality of earnings. Review all the financial statements to understand what caused this surprising reversal. What was the major item that contributed to this reversal? Do you agree with Enron’s classification of this transaction?
2000: 4779/(979+855) = 2.6 – What a turnaround! Well, not really.
A review of Enron’s 2000 cash flow statement shows a significant increase in net cash provided by operating activities from $1,228 billion in 1999 to $4,779 billion in 2000. A closer read-through of the current liability section of the balance sheet would show an increase in customer
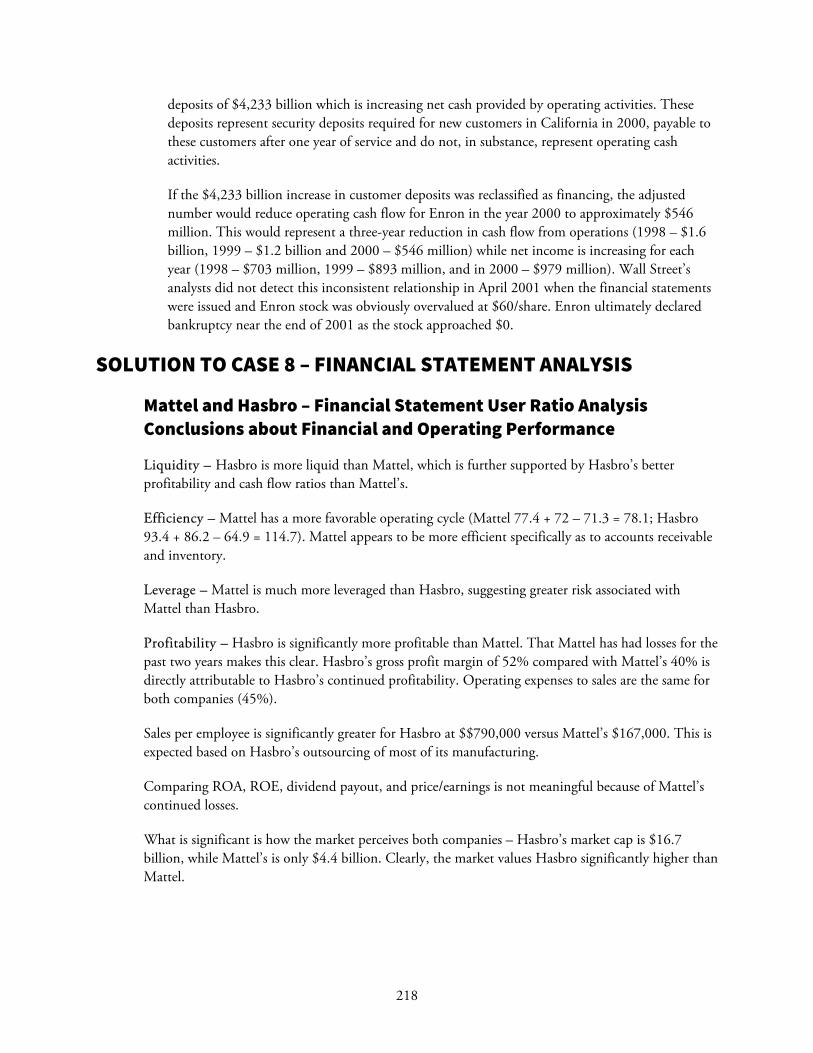
218
deposits of $4,233 billion which is increasing net cash provided by operating activities. These deposits represent security deposits required for new customers in California in 2000, payable to these customers after one year of service and do not, in substance, represent operating cash activities.
If the $4,233 billion increase in customer deposits was reclassified as financing, the adjusted number would reduce operating cash flow for Enron in the year 2000 to approximately $546 million. This would represent a three-year reduction in cash flow from operations (1998 – $1.6 billion, 1999 – $1.2 billion and 2000 – $546 million) while net income is increasing for each year (1998 – $703 million, 1999 – $893 million, and in 2000 – $979 million). Wall Street’s analysts did not detect this inconsistent relationship in April 2001 when the financial statements were issued and Enron stock was obviously overvalued at $60/share. Enron ultimately declared bankruptcy near the end of 2001 as the stock approached $0.
SOLUTION TO CASE 8 – FINANCIAL STATEMENT ANALYSIS
Mattel and Hasbro – Financial Statement User Ratio Analysis Conclusions about Financial and Operating Performance
Liquidity – Hasbro is more liquid than Mattel, which is further supported by Hasbro’s better profitability and cash flow ratios than Mattel’s.
Efficiency – Mattel has a more favorable operating cycle (Mattel 77.4 + 72 – 71.3 = 78.1; Hasbro 93.4 + 86.2 – 64.9 = 114.7). Mattel appears to be more efficient specifically as to accounts receivable and inventory.
Leverage – Mattel is much more leveraged than Hasbro, suggesting greater risk associated with Mattel than Hasbro.
Profitability – Hasbro is significantly more profitable than Mattel. That Mattel has had losses for the past two years makes this clear. Hasbro’s gross profit margin of 52% compared with Mattel’s 40% is directly attributable to Hasbro’s continued profitability. Operating expenses to sales are the same for both companies (45%).
Sales per employee is significantly greater for Hasbro at $$790,000 versus Mattel’s $167,000. This is expected based on Hasbro’s outsourcing of most of its manufacturing.
Comparing ROA, ROE, dividend payout, and price/earnings is not meaningful because of Mattel’s continued losses.
What is significant is how the market perceives both companies – Hasbro’s market cap is $16.7 billion, while Mattel’s is only $4.4 billion. Clearly, the market values Hasbro significantly higher than Mattel.

219
Cash Flow – Many ratio comparisons between the two companies are not meaningful because Mattel has negative operating cash flow. Hasbro’s times interest paid of 7.9 times is consistent with its conservative capital structure (low debt) and indicates its high liquidity and ability to borrow additional monies if needed.
Hasbro has high quality of earnings (1.28). Note that it was also high for 2017 (1.20). Hasbro also has a positive free cash flow and positive EBITDA, while Mattel is a minus for both.
Conclusion – It is fairly clear that Hasbro’s strategy of outsourcing manufacturing has given it a competitive advantage versus Mattel. Mattel, continuing to manufacture its products and incur the related costs of manufacturing, is not able to compete effectively in the toy entertainment business.

220
NOTES


www.kaplanfinancial.com | 332 Front Street South, Suite 501, La Crosse, WI 54601 | 800.824.8742
Take Advantage of Diversified Learning Solutions
We are a leading provider of continuing professional education (CPE) courses to Fortune 500 companies across
the globe, CPA firms of all sizes, and state CPA societies across the country, as well as CPA associations and other
financial organizations. Our efficient and flexible approach offers an array of customized cutting-edge content to
meet your needs and satisfy the priorities of your business. Select from live classes, live webinars, conferences,
or online training, including Nano courses, based on your preferred method of learning.
Meet your CPE requirements, increase productivity, and stay up-to-date with relevant industry trends and
mandatory regulations with collaborative live or online learning.
Live Training Topics Online Training TopicsAccounting and Auditing Accounting and Auditing
Employee Benefit Plans Business Law
Ethics Business Management and Organization
Information Technology Economics
Governmental and Not-For-Profit Ethics
Non-Technical (including Professional Development) Finance
Tax Information Technology
Management Services and Decision Making
Personal and Professional Development
Tax
“We have enjoyed [your] programs and have found the content to be an excellentlearning tool, not only for current accounting and management issues, but also how
these issues apply to our company and affect how our business is managed.”—Debbie Y.
Unauthorized reproduction or resale of this product is in direct violation of global copyright laws.
Reproduced by permission from Kaplan.
© 2020 Kaplan, Inc. All Rights Reserved. ISBN: 978-1-07-880591-9