Literature Review on Internal Evaluation | School Inspections

Accounting Horizons American Accounting AssociationVol. 26, No. 1 DOI: 10.2308/acch-500772012pp. 43–63
PCAOB Inspections and LargeAccounting Firms
Bryan K. Church and Lori B. Shefchik
SYNOPSIS: The purpose of this paper is to analyze the PCAOB’s inspection reports of
large, annually inspected accounting firms. The inspection reports identify audit
deficiencies that have implications for audit quality. By examining the inspection reports
in detail, we can identify the nature and severity of audit deficiencies; we can track the
total number of deficiencies over time; and we can pinpoint common, recurring audit
deficiencies. We focus on large accounting firms because they play a dominant role in
the marketplace (i.e., they audit public companies that comprise approximately 99
percent of U.S.-based issuer market capitalization). We document a significant,
downward linear trend in the number of deficiencies from 2004 to 2009. We also
identify common, recurring audit deficiencies, determine the financial statement
accounts most often impacted by audit deficiencies, and isolate the primary emphasis
of the financial statement impacted. Our findings generally are consistent comparing Big
4 and second-tier accounting firms, though a few differences emerge. In addition, we
make comparisons with findings that have been documented for small, triennially
inspected firms.
Keywords: PCAOB inspections; inspection reports; regulation; audit quality.
Data Availability: The data are available from public sources.
INTRODUCTION
The establishment of the Public Company Accounting Oversight Board’s (PCAOB’s)
inspection process represents a fundamental change in the regulation of public accounting
firms (Kinney 2005). The change is away from a regime of self-regulation, including peer
reviews conducted under the auspices of the American Institute of Certified Public Accountants
(AICPA), to one of statutory regulation. The PCAOB was established to improve audit quality
(PCAOB 2009). With six years of inspections underway, it is unclear whether the PCAOB
Bryan K. Church is a Professor, and Lori B. Shefchik is a Ph.D. student, both at Georgia Institute ofTechnology.
We gratefully acknowledge the helpful comments of Duane Brandon, Jeffrey Hales, Dana Hermanson, Bill Messier, twoanonymous reviewers, our colleagues at Georgia Tech, and participants at the 2010 American Accounting AssociationAnnual Meeting.
Submitted: February 2011Accepted: July 2011
Published Online: December 2011Corresponding author: Bryan K. Church
Email: [email protected]
43

inspection process has benefitted audit quality. The purpose of this paper is to analyze the results in
the PCAOB’s inspection reports of large accounting firms to shed insight on this important matter.
Inspection reports identify audit deficiencies, which have implications for audit quality. The
nature and severity of identified audit deficiencies are very broad, ranging from accounting
restatements and departures from Generally Accepted Accounting Principles (GAAP) to inadequate
documentation and insufficient testing. Obviously, deficiencies that provide direct evidence of
financial statement misstatements have stronger implications for audit quality than other
deficiencies. By examining the results of all of the inspection reports in detail, we can identify
the nature and severity of audit deficiencies; we can track the total number of deficiencies over time;
and we can pinpoint common, recurring audit deficiencies. In addition, we can look for changes
over time and hone in on emerging trends. Such detailed examination provides a systematic means
to gauge the potential implications for audit quality. Our analyses also provide a general
understanding of the overall inspection reports and give readers insight into what to make of the
reports. Such insight may help readers avoid drawing erroneous inferences when reviewing
inspection reports.
We focus our analyses on large accounting firms, defined as those that audit more than 100
issuers per year and, thus, are inspected annually by the PCAOB. Several studies (e.g., Hermanson
et al. 2007; Hermanson and Houston 2008, 2009; Hermanson et al. 2010) have analyzed the
inspection reports of small accounting firms (inspected at least triennially). A focus on large
accounting firms, however, is warranted because such firms have very large, very diverse client
portfolios, which may impact the results of the inspection process.1 With the exception of two
professional reports (AICPA 2006; PCAOB 2008), no academic study to date provides detailed
evidence of the results of the inspection process for large accounting firms. Yet, the role of these
firms in the marketplace is undeniable: these firms audit public companies that make up
approximately 99 percent of U.S.-based issuer market capitalization (PCAOB 2008).
The AICPA’s (2006) report provides a preliminary summary of audit deficiencies included in
inspection reports issued from September 29, 2005, to January 19, 2006, for large accounting firms.
The PCAOB’s (2008) report provides initial observations of certain issues identified in the
inspection years 2004 to 2007 for large accounting firms. Our study, by comparison, offers a
systematic and detailed analysis of the results in the inspection reports and is more comprehensive.
We analyze the inspection reports of large accounting firms for inspection years 2004 to 2009
(issued in years 2005 to 2010). Only eight accounting firms comprise this group for the entire
period: the Big 4 firms (Deloitte & Touche, Ernst & Young, KPMG, and PricewaterhouseCoopers)
and four second-tier firms (BDO Seidman, Crowe Horwath, Grant Thornton, and McGladrey &
Pullen).2 Throughout our analysis, we scrutinize audit deficiencies. We then look for changes in
audit deficiencies over time and for differences between the Big 4 and second-tier firms. We also
compare our results for large firms with the results for small firms as reported in prior studies, which
allows us to highlight noteworthy differences. In addition, we examine the firms’ responses to
PCAOB’s findings, and we document the presence of quality control criticisms in the reports.
We find that the total number of audit deficiencies declines markedly over time, with consistent
rates of decline for Big 4 and second-tier firms. The results hold, looking at misstatement and
non-misstatement deficiencies separately. In addition, we identify common audit deficiencies,
1 In Hermanson et al.’s (2007, 143) analysis of small accounting firms, the average number of issuer clients is 2.60(using the numbers in Table 3). For large accounting firms, on the other hand, the number of issuer clients rangesfrom just over 100 to in excess of 1,700. In addition, small accounting firms typically are unable to tolerate theexposure associated with risky clients.
2 The PCAOB conducted limited inspections of the Big 4 in 2003. We exclude this year from our analyses becausethe inspections were scaled-down and restricted to the voluntary participation of the Big 4 (PCAOB 2004). Giventhat the inspection process has evolved over time, we view the initial inspections as a preliminary, learning phase.
44 Church and Shefchik
Accounting HorizonsMarch 2012

noting they involve testing revenues, fair value measurements, other accounting estimates, and
internal controls. Further, we shed light on the common audit deficiencies that are most likely to
contribute to a misstatement.
Our analyses indicate that the financial statement accounts most often impacted by audit
deficiencies include (in order of frequency) revenues, investments securities and derivatives, loans
and reserve for loan losses, goodwill and intangibles, inventories and cost of sales, and accounts
receivable and allowance for bad debts. Further, for accounts impacted, we provide evidence of
some differences between Big 4 and second-tier firms as well as changes in trends over time.
Looking specifically at the accounts impacted, we note the primary emphasis of identified
deficiencies is on the balance sheet as compared to the income statement.
Regarding firms’ responses to the PCAOB’s findings, we note that Big 4 firms disagree with
the PCAOB more frequently than do the second-tier firms. Finally, we document that every large
accounting firm has criticisms of quality control in every inspection year, but that the criticisms (to
date) either have been remediated in a timely fashion or firms have made reasonable progress in
addressing the criticisms (PCAOB 2008). Our findings should be of interest to academics,
practicing accountants, regulators, and users of the inspection reports.
The remainder of the paper is organized as follows. First, we briefly summarize the PCAOB
inspection process, including how the regulatory system came into place and the perceived benefits
and drawbacks of the current system. Next, we describe how we code the findings of the inspection
reports and then present our results. Last, we offer concluding remarks.
PCAOB INSPECTION PROCESS
Prior to the inception of the PCAOB inspection process, accounting firms that practiced before
the Securities and Exchange Commission (SEC) participated in mandatory peer reviews (every
three years) under the direction of the AICPA. While a handful of empirical studies suggest that the
AICPA’s peer review system was beneficial (e.g., Woodlock and Claypool 2001; Hilary and
Lennox 2005), the system was the target of much criticism. Critics argue that the process was
ineffective mainly because peer reviewers were not independent (i.e., accounting firms could
choose their reviewers) and the system was generally non-punitive (Fogarty 1996; DeFond 2010).
Despite criticism, the AICPA’s peer review program remained in place as the primary means to
monitor audit quality for the accounting profession until 2002. In the midst of the Enron scandal,
the SEC announced plans to overhaul the regulation of public accounting firms, with hopes of
improving the effectiveness of regulation and, ultimately, audit quality (Hilzenrath 2002). The U.S.
Congress passed the Sarbanes-Oxley Act of 2002 (SOX), which established the PCAOB and
mandated that the organization inspect professional accounting firms that audit public companies.
The changes were intended to put stronger reigns on the regulation of accounting firms. Starting in
2003, the PCAOB conducted scaled-down inspections of the Big 4 accounting firms. In later years,
full-fledged annual inspections were conducted on all registered accounting firms with over 100
issuers and triennial inspections on small firms (100 or fewer issuers).
The PCAOB’s inspections are risk-based, targeting the selection of the riskiest engagements
and scrutinizing high-risk areas of the engagements. As a result, issuer-engagements inspected are
likely atypical of large firms’ client portfolios. Following the selection process, inspections include
(1) an evaluation of accounting firms’ quality control and (2) an examination and review of certain
elements of selected issuer engagements (i.e., high-risk areas of high-risk audits). Once the annual
inspections are completed, a report is prepared and shared with the accounting firm. Portions of the
report, which describe identified audit deficiencies (but do not identify issuers), are publicly
disclosed via the PCAOB’s website. Portions related to criticisms of the firms’ quality control
PCAOB Inspections and Large Accounting Firms 45
Accounting HorizonsMarch 2012

systems are not publicly disclosed as long as firms, in good faith, are making reasonable progress to
remediate the criticisms.
The creation of the PCAOB, along with its duty to inspect registered firms, appears to have
addressed the main concerns surrounding the effectiveness of the AICPA’s peer review system.
First, the PCAOB’s inspection staff is independent: inspectors are prohibited from being active
auditing practitioners. Second, the PCAOB has investigative and disciplinary authority over
registered accounting firms that fail to comply with SOX, the rules of the PCAOB and the SEC, and
other rules, laws, and professional standards (PCAOB 2003). For unintentional violations (e.g.,
negligent acts), the PCAOB has the authority to levy fines of up to $100,000 per person and up to
$2,000,000 per firm. For intentional violations, the amounts increase to $750,000 and $15,000,000,
respectively. The PCAOB also has the authority to prohibit accounting firms from conducting
audits of public companies (via suspension or revocation of accounting firms’ registration).
Some critics, however, express concerns over the implementation and structure of the PCAOB’s
inspection process. As with other changes from self-regulation to statutory regulation, the change
prompts debate over a fundamental trade-off of expertise for independence (Stigler 1971; Peltzman
1976; Ogus 1995; DeFond 2010). Glover et al. (2009) argue that PCAOB staff members’ technical
knowledge can become outdated all too quickly, especially when compared to the AICPA’s peer
reviewers. Others have raised similar concerns (e.g., Hodowanitz and Solieri 2005; Kinney 2005).
In spite of the potential drawbacks, we believe the PCAOB’s inspections very likely enhance
auditor performance. The fact that an independent, oversight organization with powerful
sanctioning abilities is scrutinizing audit work creates incentives for auditors to be more diligent
and watchful (e.g., DeFond 2010). A sentiment among practitioners is that inspectors are under
pressure to be overly critical of audit work, imposing stricter standards than peer reviewers (e.g.,
Farrell and Shadab 2005). Indeed, some small accounting firms (local and regional) stopped
auditing public companies due to concerns over the inspection process (Read et al. 2004).
Furthermore, the inspection process, by nature, promotes learning: inspectors discuss issues with
accounting firm representatives and provide formal feedback on audit deficiencies and on the firms’
quality controls (PCAOB 2009). For large, annually inspected firms, the process is ongoing,
recurring on a yearly basis. Thus, the process offers a ready means to identify areas in need of
improvement and subsequent checks to determine whether such improvements have been
effectively carried out in practice.
A detailed examination of the PCAOB’s inspection results sheds insight into audit deficiencies,
which may undermine audit quality. By examining inspection reports over time, we can assess
accounting firms’ responsiveness to the inspection process. Moreover, such analyses provide a
fundamental basis to assess the efficacy of the inspection process and, in turn, the potential
implications for audit quality.
RESEARCH METHOD
We systematically examine the inspection reports of the eight large accounting firms issued
from 2005 to 2010 for inspection years 2004 to 2009, comprising 48 reports. The reports are
available from the PCAOB’s website (http://pcaob.org/Inspections/Public_Reports/index.aspx),
allowing us to analyze the audit deficiencies.
According to the PCAOB (2008, 7), audit deficiencies are those for which sufficient,
competent evidential matter does not appear to have been collected to support the audit opinion on
the issuer’s financial statements. For each audit deficiency included in an inspection report, we code
the following information: the severity of the deficiency, the nature of the deficiency (in order to
identify common audit deficiencies), the specific account(s) impacted, and the primary emphasis as
to the financial statement(s) impacted. In addition to the audit deficiencies, for each report we code
46 Church and Shefchik
Accounting HorizonsMarch 2012

firms’ responses to the PCAOB findings and whether the report indicates quality control criticisms.
Both authors independently coded the data (elaborated below). For each category of coding (e.g.,
severity of the deficiency, account impacted, etc.) the authors had at least a 95 percent agreement
rate. The discrepancies were discussed and easily resolved.
Severity of Deficiencies
For the severity of deficiencies, we first segregate the deficiencies into two broad categories,
those that result in a financial statement misstatement and those that do not. We further partition
deficiencies in each group based on their severity. We code deficiencies as resulting in a
misstatement if the inspection report indicates that (1) the issuer restated financial statements
(RESTATE), (2) the accounting firm failed to identify and appropriately address a departure from
GAAP (NON-GAAP), or (3) the accounting firm failed to identify and appropriately address an
accounting error (ERROR). The subcategories are listed in order of severity (most severe to least
severe). Examples of deficiencies are shown in Table 1.
For deficiencies that do not result in a misstatement, we also identify three subcategories based
on the wording contained in the inspection reports, including (1) the accounting firm failed to test an
account and/or an accounting assertion (NO-TEST), (2) the accounting firm failed to adequately or
properly evaluate an accounting issue and/or whether the accounting treatment was appropriate
TABLE 1
Examples of Audit Deficiencies That Result in a Misstatement
Severity of AuditDeficiency Sample Wording/Phrases Commonly Used
Sample ReportReference
Financial statement
restatement
(RESTATE)
The issuer has restated certain of its financial
statements to make changes relating to the matter
described here.
Deloitte & Touche,
10/06/2005, Issuer
D, Footnote 11
Failure to identify and
appropriately address a
departure from GAAP
(NON-GAAP)
The Firm failed to identify a departure from GAAP
that it should have identified and addressed
before issuing its audit report.
Grant Thornton, 06/
28/2007, Issuer C
The Firm failed to identify that the issuer’s revised
accounting was not in compliance with GAAP.
KPMG, 06/16/2009,
Issuer G
Failure to identify and
appropriately address
an accounting error
(ERROR)
After the inspection field work, the Firm and the
issuer determined that each of these amounts was
incorrect. The issuer later corrected, in a
subsequent filing.
Ernst & Young, 4/29/
2008, Issuer A,
Footnote 9
The Firm, however, failed to recognize the need for
an adjusting entry to correct the misclassification
(between accounts).
BDO Seidman, 11/30/
2006, Issuer B
The issuer failed to disclose the losses . . . Such
disclosure is required . . . The Firm concluded in
its work papers that the magnitude . . . was
material to the annual financial statements;
however, it failed to appropriately address the
issuer’s lack of disclosure . . . in its financial
statements.
Crowe Chizek, 11/30/
2006, Issuer A
The Firm also failed to identify and address that the
modification rendered the issuer’s disclosure of
the agreement inaccurate.
PwC, 06/27/2008,
Issuer B
PCAOB Inspections and Large Accounting Firms 47
Accounting HorizonsMarch 2012

(NO-EVAL), and (3) the accounting firm failed to perform or document sufficient procedures/
analyses when testing (NO-SUFF). The subcategories are similar to those used by Hermanson et al.
(2007) for deficiencies of small accounting firms. Examples of deficiencies in each subcategory are
shown in Table 2. We determine that NO-TEST is the most severe deficiency in this group because it
indicates that the accounting firm did not test an account or an assertion. We determine that NO-
EVAL is the next most severe deficiency because the accounting firm either identified an accounting
issue but did not assess it thoroughly or failed to evaluate whether the accounting treatment was
appropriate (i.e., in compliance with GAAP). The least severe deficiency is NO-SUFF, which is
indicative of inadequate audit support (i.e., not enough evidence was collected and documented).
In coding deficiencies, the subcategories referred to above are mutually exclusive and
exhaustive. Sometimes the inspection reports include wording that is consistent with more than one
subcategory. For example, KPMG’s inspection report dated January 11, 2007, indicated that for
issuer E, the accounting firm failed to evaluate an accounting issue (NO-EVAL) that resulted in a
financial statement restatement (RESTATE). For these instances, we coded the deficiency as the
most severe subcategory, which for this example is RESTATE.
TABLE 2
Examples of Audit Deficiencies That Do Not Result in a Misstatement
Severity of AuditDeficiency Sample Wording/Phrases Commonly Used
Sample ReportReference
Failure to test an account
and/or an assertion
(NO-TEST)
The Firm failed to audit the issuer’s goodwill
impairment analysis.
KPMG, 09/25/2005,
Issuer F
The Firm failed to test all the relevant assertions
regarding cost of goods sold.
Crowe Chizek, 01/19/
2006, Issuer E
There was no evidence . . . that the Firm had
performed audit procedures related to the
income tax provision, deferred tax assets and
liabilities, or related footnote disclosures.
McGladrey & Pullen, 04/
29/2008, Issuer B
Failure to adequately or
properly evaluate an
accounting issue and/or
whether the accounting
treatment was appropriate
(NO-EVAL)
There was no evidence . . . that the Firm had
evaluated whether the issuer complied with
SFAS No. 144.
Grant Thornton, 06/28/
2007, Issuer E
There was no evidence . . . that the Firm had
evaluated whether, in those circumstances, the
issuer’s decision not to consolidate those
licensees was consistent with FIN 46(R).
Ernst & Young, 04/29/
2008, Issuer B
The Firm failed to sufficiently evaluate whether
revenue from . . . was recognized
appropriately.
McGladrey & Pullen, 05/
06/2009, Issuer D
Failure to perform or
document sufficient
procedures/analyses when
testing (NO-SUFF)
The Firm failed to perform sufficient procedures
to test revenue, as the Firm’s calculated
sample size was insufficient.
PwC, 12/14/2006, Issuer
E.
The Firm failed to perform sufficient procedures
to evaluate the issuer’s valuation of these
securities . . . the Firm failed to evaluate the
reasonableness of certain of the assumptions.
Deloitte & Touche, 04/
16/2009, Issuer G
The Firm failed to perform sufficient audit
procedures to test the existence and
completeness of . . .
BDO Seidman, 07/09/
2009, Issuer E
48 Church and Shefchik
Accounting HorizonsMarch 2012
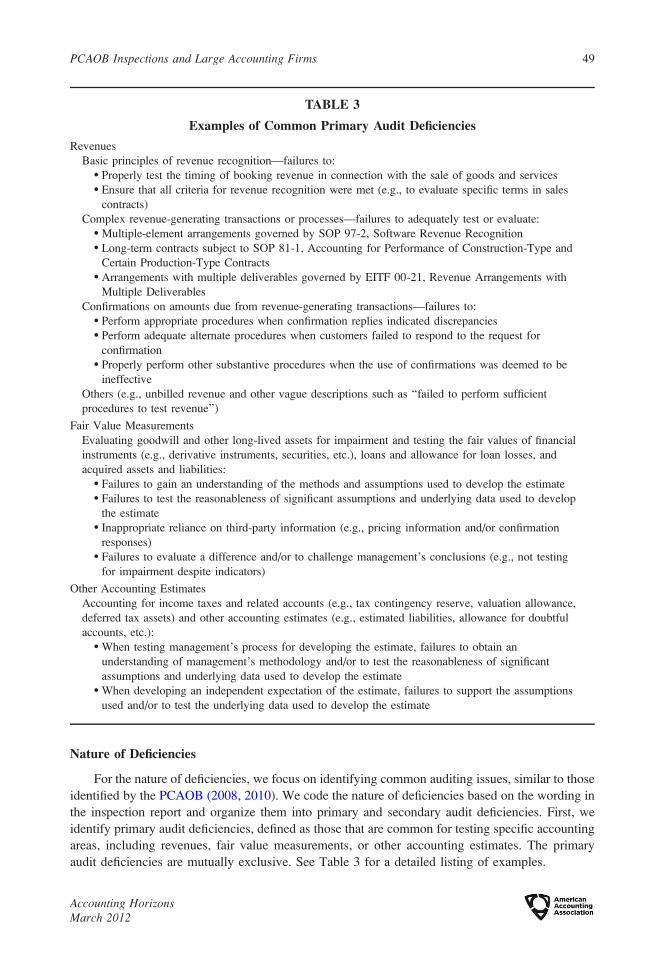
Nature of Deficiencies
For the nature of deficiencies, we focus on identifying common auditing issues, similar to those
identified by the PCAOB (2008, 2010). We code the nature of deficiencies based on the wording in
the inspection report and organize them into primary and secondary audit deficiencies. First, we
identify primary audit deficiencies, defined as those that are common for testing specific accounting
areas, including revenues, fair value measurements, or other accounting estimates. The primary
audit deficiencies are mutually exclusive. See Table 3 for a detailed listing of examples.
TABLE 3
Examples of Common Primary Audit Deficiencies
Revenues
Basic principles of revenue recognition—failures to:� Properly test the timing of booking revenue in connection with the sale of goods and services� Ensure that all criteria for revenue recognition were met (e.g., to evaluate specific terms in sales
contracts)
Complex revenue-generating transactions or processes—failures to adequately test or evaluate:�Multiple-element arrangements governed by SOP 97-2, Software Revenue Recognition� Long-term contracts subject to SOP 81-1, Accounting for Performance of Construction-Type and
Certain Production-Type Contracts� Arrangements with multiple deliverables governed by EITF 00-21, Revenue Arrangements with
Multiple Deliverables
Confirmations on amounts due from revenue-generating transactions—failures to:� Perform appropriate procedures when confirmation replies indicated discrepancies� Perform adequate alternate procedures when customers failed to respond to the request for
confirmation� Properly perform other substantive procedures when the use of confirmations was deemed to be
ineffective
Others (e.g., unbilled revenue and other vague descriptions such as ‘‘failed to perform sufficient
procedures to test revenue’’)
Fair Value Measurements
Evaluating goodwill and other long-lived assets for impairment and testing the fair values of financial
instruments (e.g., derivative instruments, securities, etc.), loans and allowance for loan losses, and
acquired assets and liabilities:� Failures to gain an understanding of the methods and assumptions used to develop the estimate� Failures to test the reasonableness of significant assumptions and underlying data used to develop
the estimate� Inappropriate reliance on third-party information (e.g., pricing information and/or confirmation
responses)� Failures to evaluate a difference and/or to challenge management’s conclusions (e.g., not testing
for impairment despite indicators)
Other Accounting Estimates
Accounting for income taxes and related accounts (e.g., tax contingency reserve, valuation allowance,
deferred tax assets) and other accounting estimates (e.g., estimated liabilities, allowance for doubtful
accounts, etc.):�When testing management’s process for developing the estimate, failures to obtain an
understanding of management’s methodology and/or to test the reasonableness of significant
assumptions and underlying data used to develop the estimate�When developing an independent expectation of the estimate, failures to support the assumptions
used and/or to test the underlying data used to develop the estimate
PCAOB Inspections and Large Accounting Firms 49
Accounting HorizonsMarch 2012

Next, we identify secondary audit deficiencies. These deficiencies are common for specific
auditing procedures and entail testing internal controls, performing analytical procedures, using the
work of specialists, audit sampling, and evaluating adjustments and misstatements. The secondary
audit deficiencies are not mutually exclusive and often coincide with primary audit deficiencies. For
example, audit deficiencies that relate to testing fair value measurements (a primary audit
deficiency) also contain deficiencies that involve using the work of specialists (a secondary audit
deficiency). See Table 4 for a detailed listing of examples.
TABLE 4
Examples of Common Secondary Audit Deficiencies
Internal Controls
Inappropriate reliance on internal controls, thus, failures to properly alter the nature, timing, and
extent of substantive testing:� Failures to test the controls the firms relied on and/or to test the entire time period for which the
firms relied on the controls� Firms relied on controls that they had identified as ineffective during control testing
Inappropriate reliance on information in reports that were generated from the issuer’s computer
system without adequately testing whether the reports were complete and accurate and whether the
underlying systems that generated the reports could be relied on
Inappropriate reliance on internal controls at service organizations—due to the following:� Failures to obtain and evaluate a service auditor’s report (SAR), or to perform other procedures to
be able to rely on the controls at the service organization� Failures to test the issuer’s controls that are necessary to support reliance on controls at the
service organization� Failures to perform appropriate procedures when the SAR did not cover a sufficient amount of
the period subject to the audit
Others (e.g., inappropriate internal control risk assessments, failures to identify a material weakness in
internal controls)
Others
Analytical procedures intended to be substantive tests—failures to:� Develop appropriate expectations and/or to establish appropriate thresholds for differences� Test the data used in the analytical procedures� Investigate and/or to corroborate management’s explanations for significant unexpected
differences
Reliance on the use of others’ work (e.g., specialists, internal audit, etc.)—failures to:� Understand the methods and assumptions used by others and/or to test the data used by others� Evaluate the qualifications or objectivity of others� Evaluate discrepancies between others’ conclusions and those of the issuer
Audit sampling:� Using sample sizes that were too small and/or not appropriately testing all of the items in the
sample� Failures to appropriately project the effect of errors identified in the sample to the entire
population� Failures to select a sample that is representative of the underlying population
Failures to sufficiently evaluate the effects of passed adjustments and/or misstatements (e.g., to
evaluate quantitative and qualitative factors in concluding on the significance to the financial
statements)
50 Church and Shefchik
Accounting HorizonsMarch 2012

Accounts and Financial Statements Impacted
We identify the specific financial statement account(s) impacted by the audit deficiency from
the detailed description included in the inspection report. We then infer the primary emphasis of the
financial statement(s) impacted from the specific accounts(s) impacted. In some cases, the audit
deficiency does not impact a specific account, but something more general, such as internal
controls, journal entries, going-concern evaluations, related-party transactions, or reportable
segments.
Firms’ Responses to PCAOB’s Findings
For each inspection report, we examine the firm’s response, regarding any disagreements, to
the PCAOB’s findings included in the draft report. We identify four types of responses. First, the
firm may acknowledge the PCAOB’s findings, but not mention any disagreement with the findings.
Second, the firm may acknowledge differences in professional judgment between the firm and the
PCAOB’s inspectors, without explicitly disagreeing with the findings. Third, the firm may disagree
with some of the PCAOB’s findings, but not provide a specific defense. Fourth, the firm may
disagree with some of the PCAOB’s findings and offer specific arguments to defend their position.
Quality Control Criticisms
For each inspection report, we examine whether there is an indication of quality control
criticisms. There are two indicators contained in the inspection reports: (1) the cover page states that
it is a public version of the inspection report and that portions of the report are omitted to comply
with sections 104 (g)(2) and 105 (b)(5)(A) of SOX and (2) Part I, Section B of the report states that
any criticisms of the firm’s quality control are discussed in the nonpublic portion of the report.
RESULTS
Total Number and Severity of Deficiencies
We coded 664 deficiencies for inspection years 2004 to 2009 (across 48 reports). The average
number of deficiencies per report is slightly higher for Big 4 firms (mean¼ 15.5, n¼ 372) than for
second-tier firms (mean¼12.2, n¼292), but the difference is not significant (t¼�1.308, p¼0.197,
two-tailed). However, the average number of deficiencies per report for large firms is considerably
higher than that for small firms (mean ¼ 1.6, n ¼ 510), as reported by Hermanson et al. (2007,
146).3 This difference is not surprising because the PCAOB examines many more issuers for large,
annually inspected firms than for small, triennially inspected firms. For the largest accounting firms,
the PCAOB typically examines 50 to 75 issuers per report (Evans et al. 2011, A1). For small firms,
on the other hand, Hermanson et al. (2007, 142) find that the PCAOB examines, on average, just
under three issuers per report.
The detailed coding results are presented in Table 5. We note that the vast majority of
deficiencies (88.6 percent) do not result in a misstatement. The most frequent subcategories, by far,
are NO-SUFF and NO-EVAL, comprising 53.3 percent and 28.0 percent, respectively, of the total.
The proportion of deficiencies for each non-misstatement subcategory is similar for Big 4 firms and
second-tier firms (p . 0.30 using Chi-squared tests). Likewise, the rates of deficiencies that do not
3 As a side note, the descriptions of audit deficiencies in large firm reports appear to be more detailed than in smallfirm reports. This difference may be driven by the fact that large firms are able to tolerate riskier clients and, inturn, deal with more challenging auditing issues. As a consequence, identified audit deficiencies may involvemore complicated matters, which require greater detail to explain.
PCAOB Inspections and Large Accounting Firms 51
Accounting HorizonsMarch 2012

result in a misstatement are comparable to those of small firms, as reported by Hermanson et al.
(2007, 148).
Deficiencies that lead to a misstatement are identified much less frequently (11.4 percent). The
proportion of deficiencies for each misstatement subcategory is similar for Big 4 firms and second-
tier firms (p . 0.10 using Chi-squared tests). Further examination of the data indicates that the
misstatement deficiencies encompass a broad range of auditing issues, including testing revenues,
income taxes, derivatives, debt obligations, leases, and expenses. The PCAOB (2008, 10) made
TABLE 5
Frequencies of Audit Deficiencies by Severity over Time
2004 2005 2006 2007 2008 2009 Total
Misstatement Deficiencies
RESTATE Total 17 8 3 3 3 1 35
[Big 4] [12] [5] [1] [2] [3] [0] [23]
(Second-tier) (5) (3) (2) (1) (0) (1) (12)
NON-GAAP Total 4 4 5 1 1 6 21
[Big 4] [2] [1] [2] [1] [1] [3] [10]
(Second-tier) (2) (3) (3) (0) (0) (3) (11)
ERROR Total 6 5 4 4 0 1 20
[Big 4] [6] [2] [3] [4] [0] [0] [15]
(Second-tier) (0) (3) (1) (0) (0) (1) (5)
Total Total 27 17 12 8 4 8 76
[Big 4] [20] [8] [6] [7] [4] [3] [48]
(Second-tier) (7) (9) (6) (1) (0) (5) (28)
Non-Misstatement Deficiencies
NO-TEST Total 10 12 5 5 8 8 48
[Big 4] [8] [5] [4] [1] [3] [3] [24]
(Second-tier) (2) (7) (1) (4) (5) (5) (24)
NO-EVAL Total 43 41 35 31 21 15 186
[Big 4] [21] [21] [19] [20] [12] [12] [105]
(Second-tier) (22) (20) (16) (11) (9) (3) (81)
NO-SUFF Total 112 73 43 33 38 55 354
[Big 4] [63] [37] [18] [18] [19] [40] [195]
(Second-tier) (49) (36) (25) (15) (19) (15) (159)
Total Total 165 126 83 69 67 78 588
[Big 4] [92] [63] [41] [39] [34] [55] [324]
(Second-tier) (73) (63) (42) (30) (33) (23) (264)
Total Deficiencies Total 192 143 95 77 71 86 664
[Big 4] [112] [71] [47] [46] [38] [58] [372]
(Second-tier) (80) (72) (48) (31) (33) (28) (292)
For deficiencies that result in a misstatement, RESTATE means that the issuer restated its financial statements; NON-GAAP means that the accounting firm failed to identify and appropriately address a GAAP departure; and ERRORmeans that the accounting firm failed to identify and appropriately address an accounting error. For deficiencies that donot result in a misstatement, NO-TEST means the accounting firm failed to test an account and/or an accountingassertion; NO-EVAL means that the accounting firm failed to adequately or properly evaluate an accounting issue and/orwhether the accounting treatment was appropriate; and NO-SUFF means that the accounting firm failed to perform ordocument sufficient procedures/analyses when testing. For each category of deficiencies, we show the number ofobservations for all firms combined (denoted total), for the Big 4 firms in brackets (Deloitte & Touche, Ernst & Young,KPMG, and PricewaterhouseCoopers), and for the second-tier firms in parentheses (BDO Seidman, Crowe Horwath,Grant Thornton, and McGladrey & Pullen).
52 Church and Shefchik
Accounting HorizonsMarch 2012

similar observations for large firms: they note that deficiencies that produce a GAAP departure
often involve revenues, income taxes, derivatives, and cash flow presentations.4
We note that 35 misstatement deficiencies (or 5.3 percent) result in a restatement of the issuer’s
financial statements. The rates are comparable for Big 4 firms (6.2 percent) and second-tier firms
(4.1 percent). The overall rate of restatements also is very similar to that for small firms (5.1
percent), as reported by Hermanson et al. (2010, 148) for the same time period. We caution,
however, that RESTATE deficiencies may be understated because restatements potentially occur
after the report date. A review of Table 5 indicates that the number of restatements drops
considerably over time. While the result is consistent with improved audit quality, inspection
reports also have been issued nearer to calendar year end over time (Roybark 2009). Hence, some
of the drop in restatements may be attributable to the shorter period of time (i.e., less time for the
restatement to occur).
If the inspection process serves a useful means to the audit industry, then we would expect to
observe a decline in audit deficiencies identified in inspection reports over time. While the PCAOB
(2008, 2) cautions against drawing conclusions from the total number of deficiencies included in
inspection reports, they hint toward some general improvements. To provide further insight, we test
for changes in observed deficiencies over time. As noted above (also refer to Table 5), the total
number of deficiencies, as well as the number resulting in a misstatement (i.e., more severe
deficiencies), declined markedly over the six years:5 the total deficiencies identified in 2009 (n ¼86) was just 44.8 percent of the total in 2004 (n¼192). Using a repeated-measures (years) test for a
linear trend, we find evidence of a downward, linear trend over the six-year period in the total
number of deficiencies (F ¼ 13.348, p ¼ 0.008), the number of misstatement deficiencies (F ¼16.909, p¼ 0.005), and the number of non-misstatement deficiencies (F¼ 9.813, p¼ 0.017). The
findings generally are consistent with those reported by Hermanson et al. (2007, 145), who
document that the number of deficiencies for small firms was significantly lower in 2005 than in
2004.
Nature of Deficiencies
Next, we look at the nature of common audit deficiencies identified in the inspection reports
categorized as primary audit deficiencies (i.e., those that are common to testing specific accounting
areas) and secondary audit deficiencies (i.e., those that are common to specific auditing procedures).
Of the total deficiencies (n ¼ 664), 92.3 percent contain at least one common audit deficiency
(primary or secondary). Tables 6 and 7 present the frequency of common audit deficiencies over
time. Though not tabulated, the data are similar comparing Big 4 firms and second-tier firms. Our
findings also are similar to those presented by the PCAOB (2008); however, we provide additional
details, especially regarding the frequencies of the unique audit deficiencies over time.
The frequencies of common, primary audit deficiencies are shown in Table 6. We observe a
general downward trend in the number of primary deficiencies that involve revenues and other
accounting estimates. This finding is encouraging because revenue recognition and other estimates
(e.g., reserves and allowances) are often contentious accounting issues that are at the heart of
financial scandals. Indeed, Beasley et al. (2010) document that approximately 60 percent of all
4 The AICPA’s (2006, 3) report, on the other hand, indicates that deficiencies that produce GAAP departures mostoften involve derivatives, segments, securitization arrangements, and related parties. But, the AICPA’s reportonly encompasses one inspection year. Further, the AICPA’s approach to categorizing audit deficiencies differsfrom our approach.
5 We also observe that the average proportion of misstatement deficiencies (i.e., misstatement deficiencies dividedby total deficiencies) declined each year through 2008. The percentages are 15.3, 12.3, 11.0, 9.2, 5.2, and 11.3from 2004 to 2009, respectively.
PCAOB Inspections and Large Accounting Firms 53
Accounting HorizonsMarch 2012

fraud cases examined from 1998 through 2007 involved revenues, and the next most common issue
involved overvaluation of existing assets (e.g., understating reserves and allowances).
We also observe that the number of primary deficiencies that involve fair value measurements
is reasonably stable over the six-year period. Accordingly, the make-up of primary deficiencies
shifts markedly over time. In 2004, the total number is split fairly evenly across the three common,
primary deficiencies. As time progresses, the make-up becomes more heavily weighted toward
deficiencies that involve fair value measurements: the percentage increases from 35.3 percent in
2004 to 60.3 percent in 2009. The increase corresponds to a recent increase in the number and
significance of accounting standards that deal with fair value accounting. The movement toward fair
value accounting has very likely introduced new challenges for the auditor. The details of the
PCAOB’s inspection reports include the following involving fair value measurements: failures to
obtain an understanding of the methods used by management; failures to test the significant
assumptions and underlying data that the issuers used; relying on issuer-supplied or third-party
TABLE 6
Frequencies of Common Primary Audit Deficiencies over Time
Panel A: Revenues
2004 2005 2006 2007 2008 2009 Total
Basic principles of revenue recognition 13 9 6 5 5 7 45
Complex revenue-generating transactions or processes 5 7 9 5 7 2 35
Confirmations on amounts due from revenue-
generating transactions
18 12 7 3 4 1 45
Others 8 10 5 2 6 4 35
Total 44 38 27 15 22 14 160
Panel B: Fair Value Measurements
2004 2005 2006 2007 2008 2009 Total
Evaluating goodwill and other long-lived assets for
impairment
10 12 17 8 10 13 70
Testing the fair values of financial instruments (e.g.,
derivative instruments, securities, etc.)
15 9 10 14 17 24 89
Testing the fair value of loans and the allowance for
loan losses
18 13 2 11 10 8 62
Testing the fair value of acquisitions and business
combinations
4 9 10 2 4 2 31
Total 47 43 39 35 41 47 252
Panel C: Other Accounting Estimates
2004 2005 2006 2007 2008 2009 Total
Accounting for income taxes and related accounts 4 6 5 6 2 4 27
Other accounting estimates (e.g., reserves, accrued
liabilities, allowance for doubtful accounts, etc.)
38 28 18 18 8 13 123
Total 42 34 23 24 10 17 150
The data are consistent for Big 4 firms and second-tier firms; thus, we only report the total for all firms.
54 Church and Shefchik
Accounting HorizonsMarch 2012

information without corroborating that information; and failures to challenge management’s
conclusions, despite indicators that are contradictory (see also PCAOB 2008, 13–14). We suggest
that accounting firms may continue to face difficulties auditing fair value measurements, as the
accounting profession moves steadily toward fair value accounting.
We cross-reference common, primary audit deficiencies with the severity of deficiencies. Our
aim is to determine the extent to which common, primary deficiencies account for misstatements
(i.e., RESTATE, NON-GAAP, and ERROR). We find that 58 of 76 (76.3 percent) misstatement
deficiencies, including 27 of 35 (77.1 percent) RESTATE deficiencies, fall into the categories of
primary audit deficiencies explained above. In order of frequency, misstatement deficiencies most
often relate to testing other accounting estimates (non-tax related); testing fair value measurements
of derivative instruments and securities and of goodwill and other long-lived assets impairment; and
auditing revenues, specifically related to testing basic principles of revenue recognition and
complex revenue-generating transactions processes. Looking further, we note that RESTATE
deficiencies are generally in line with these common audit deficiencies. By comparison, restatement
deficiencies for small firms were most often related to the following accounting areas or issues:
mergers, acquisition, consolidation, and equity method; equity transactions; and convertible debt
(Hermanson et al. 2010, 69).
Next, we turn to secondary audit deficiencies (i.e., those that are common to specific auditing
procedures), shown in Table 7. We note that a significant number of secondary deficiencies relates
to testing internal controls over financial reporting (refer to Panel A of Table 7), which is consistent
with the AICPA’s (2006) report. Surprisingly, the frequency of these deficiencies has increased
considerably in the most recent inspection year from an average of 21 for years 2004 to 2008 to 40
TABLE 7
Frequencies of Common Secondary Audit Deficiencies over Time
Panel A: Internal Controls
2004 2005 2006 2007 2008 2009 Total
Reliance on internal controls 22 11 5 4 5 17 64
Reliance on information in reports that were generated
from the issuer’s computer system
13 4 4 1 1 13 36
Reliance on internal controls at service organizations 9 4 3 1 2 6 25
Others 6 5 1 0 3 4 19
Total 50 24 13 6 11 40 144
Panel B: Others
2004 2005 2006 2007 2008 2009 Total
Inappropriate reliance on the use of others’ work 12 11 13 7 15 13 71
Analytical procedures intended to be substantive tests 25 14 6 8 7 6 66
Audit sampling 19 13 4 3 6 4 49
Evaluating the effects of passed adjustments and/or
misstatements
14 11 4 1 2 0 32
Total 70 49 27 19 30 23 218
The data are consistent for Big 4 firms and second-tier firms; thus, we only report the total for all firms.
PCAOB Inspections and Large Accounting Firms 55
Accounting HorizonsMarch 2012

in 2009. The most frequent internal control deficiency relates to inappropriate reliance on internal
controls for substantive testing. The PCAOB (2008, 17) also observed that firms often did not test
controls they relied on, failed to test controls sufficiently, and relied on controls that had been
identified as ineffective. Finally, other secondary deficiencies that are most common include an
inappropriate reliance on the use of others’ work and an insufficient use of analytical procedures
intended to be substantive tests (refer to Panel B of Table 7).
Accounts Impacted
Looking carefully at each audit deficiency (n ¼ 664, of which many contained multiple
references to an account), we identify 703 references to a specific account and 83 references to an
accounting issue that did not impact an account (e.g., going-concern evaluation, related-party
transaction, and internal controls). We compile a list of the specific accounts that were commonly
referenced in the audit deficiencies. Panel A of Table 8 summarizes the frequencies of accounts
impacted by deficiencies over time, grouping related accounts together. The frequencies are
generally consistent with those reported by the AICPA (2006, 3). We observe that revenues were
impacted most often, representing 14.2 percent of the total. The finding is consistent with concerns
about improper revenue recognition expressed by Beasley et al. (2010). Other accounts identified
frequently in our sample include investment securities and derivatives (10.6 percent), loans and
reserve for loan losses (9.3 percent), goodwill and intangibles (9.2 percent), inventories and cost of
sales (8.5 percent), and accounts receivable and allowance for bad debts (7.0 percent). The findings
are generally consistent with those for small firms reported by Hermanson et al. (2007, 149). In
contrast, however, Hermanson et al. (2007) also report that deficiencies frequently impact equity-
related accounts, liabilities, and expenses (in excess of 10.0 percent of the total).
We examine the frequencies of accounts impacted over time to look for notable trends. While
revenues are impacted the most in early years (an average of 24.3 from 2004 to 2006), the account
is impacted much less frequently in later years (an average of 13.0 from 2007 to 2009). Inventories
and costs of sales and accounts receivable and allowance for bad debts also are impacted frequently
in 2004 and 2005 and show a marked decline thereafter. In contrast, the frequency of deficiencies
impacting investment securities and derivatives has increased every year since 2006, reaching a
high of 26 in 2009, more than double that of any other account.
Finally, we note some differences in accounts impacted between Big 4 and second-tier firms
(refer to Panel B of Table 8). Specifically, deficiencies identified for Big 4 firms, as compared to
second-tier firms, are more likely to impact investment securities and derivatives, accounts
receivable and allowance for bad debts, and current liabilities and accrued expenses (p , 0.10
using Chi-squared tests). In contrast, loans and reserve for loan losses and expenses are more likely
to be impacted by deficiencies of second-tier firms than Big 4 firms (p , 0.05 using Chi-squared
tests). The statistical differences may be attributable to differences in auditor performance (between
Big 4 and second-tier firms) and/or differences in the make up of client portfolios. We return to this
issue later in the Additional Analyses section.
Financial Statements Impacted
Based on the accounts identified, we determine the primary emphasis of the financial
statement(s) impacted. Table 9 summarizes the frequencies. Of the total deficiencies, 80.9 percent
impacted one financial statement, 9.2 percent impacted two financial statements, and 9.9 percent did
not relate to a financial statement (e.g., those that relate to internal controls or going-concern
evaluations). The total deficiencies impacted 665 financial statements with the balance sheet being
impacted the most frequently—69.0 percent. Though not tabulated, the data are very similar for Big
4 firms and second-tier firms. We note that our findings are comparable to those included in the
56 Church and Shefchik
Accounting HorizonsMarch 2012

AICPA’s (2006) report. In addition, our findings are comparable to those of Hermanson et al.
(2007, 149) for small firms.
Firms’ Responses to PCAOB’s Findings
We examine firms’ responses to the PCAOB’s findings in the inspection reports. We note that
30 of 48 responses (62.5 percent) disagree with some of the PCAOB’s findings (refer to Table 10).
Further examination of the data indicates that disagreements occur more frequently for Big 4 firms
TABLE 8
Accounts Impacted by Audit Deficiencies
Panel A: Frequencies over Time
Account 2004 2005 2006 2007 2008 2009 Total
Revenues 25 28 20 9 18 12 112
Investment securities and derivatives 19 8 7 11 12 26 83
Loans and reserve for loan losses 23 16 3 13 10 8 73
Goodwill and intangibles 6 16 20 10 10 10 72
Inventories and cost of sales 23 21 8 6 1 8 67
Accounts receivable and allowance 21 13 9 4 6 2 55
Other income and other expenses 11 7 4 6 0 5 33
Taxes (deferred taxes and expense) 7 8 5 6 2 4 32
Fixed assets 11 7 3 3 1 4 29
Expenses (SG&A, payroll depreciation) 11 7 6 1 1 0 26
Current liabilities and accrued expenses 10 5 2 2 2 0 23
Debt and long-term liabilities 6 8 2 3 0 4 23
Panel B: Frequencies and Percentages for Big 4 and Second-Tier Firms
Account Big 4 Percent Second-Tier Percent
Revenues 58 16.9 54 19.0
Investment securities and derivatives*** 57 16.6 26 9.2
Loans and reserve for loan losses*** 25 7.3 48 16.9
Goodwill and intangibles 39 11.3 33 11.6
Inventories and cost of sales 36 10.5 31 10.9
Accounts receivable and allowance* 36 10.5 19 6.7
Other income and other expenses 14 4.1 19 6.7
Taxes (deferred taxes and expense) 20 5.8 12 4.2
Fixed assets 20 5.8 9 3.2
Expenses (SG&A, payroll depreciation)** 9 2.6 17 6.0
Current liabilities and accrued expenses* 17 4.9 6 2.1
Debt and long-term liabilities 13 3.8 10 3.5
*, **, *** Indicate statistical significance at the 10 percent, 5 percent, and 1 percent levels (two-tailed), respectively.Percentages are computed as frequencies over the total of 786 accounts impacted. The total is comprised of 703references to a specific account and 83 references to an accounting issue that did not impact an account (e.g., going-concern evaluation, related-party transactions, and internal controls).In Panel A, no other account, set of related accounts, or accounting issue comprises at least 2.5 percent of the total.In Panel B, we performed Chi-squared tests for differences in proportions of account frequencies for Big 4 firms andsecond-tier firms.
PCAOB Inspections and Large Accounting Firms 57
Accounting HorizonsMarch 2012

(79.2 percent) than for second-tier firms (45.8 percent), with the difference being significant (Chi-
squared¼5.689, p¼0.017). Subsequent analyses indicate that, for Big 4 firms, we are able to reject
the null that the frequency of responses in each category is equal (Chi-squared¼10.333, p¼0.016).
Rather, the responses of Big 4 firms clearly favor disagreements. For second-tier firms, on the other
TABLE 10
Frequencies of Firms’ Responses to PCAOB’s Findings
2004 2005 2006 2007 2008 2009 Total
No mention of disagreement Total 0 2 1 1 1 5 10
[Big 4] [0] [1] [0] [0] [0] [2] [3]
(Second-tier) (0) (1) (1) (1) (1) (3) (7)
Difference in professional judgment Total 3 1 2 0 0 2 8
[Big 4] [0] [0] [1] [0] [0] [1] [2]
(Second-tier) (3) (1) (1) (0) (0) (1) (6)
Disagreement/no specific defense Total 2 1 0 3 4 1 11
[Big 4] [1] [1] [0] [2] [2] [1] [7]
(Second-tier) (1) (0) (0) (1) (2) (0) (4)
Disagreement/specific defense Total 3 4 5 4 3 0 19
[Big 4] [3] [2] [3] [2] [2] [0] [12]
(Second-tier) (0) (2) (2) (2) (1) (0) (7)
For each category of response, we show the number of observations for all firms combined (denoted total), for the Big 4firms in brackets (Deloitte & Touche, Ernst & Young, KPMG, and PricewaterhouseCoopers), and for the second-tierfirms in parentheses (BDO Seidman, Crowe Horwath, Grant Thornton, and McGladrey & Pullen).
TABLE 9
Primary Emphasis of the Financial Statement(s) Impacted by Audit Deficiencies
Panel A: Number of Financial Statements Impacted
Count Percent
One financial statement 537 80.9
Two financial statements 61 9.2
None 66 9.9
Total 664 100.0
Panel B: Financial Statement Impacted
Count Percent
Balance sheet 459 69.0
Results of operations 198 29.8
Cash flows 8 1.2
Total 665 100.0
The data in Panels A and B are consistent for Big 4 firms and second-tier firms; thus, we only report the total for all firms.
58 Church and Shefchik
Accounting HorizonsMarch 2012

hand, we are unable to reject the null that the frequency of responses in each category is equal (Chi-
squared¼ 1.000, p¼ 0.801). We note that our rates of disagreement are greater than those for small
firms (38.6 percent) reported by Hermanson et al. (2007, 141), particularly our rate for Big 4 firms.
The differences are not surprising in that large accounting firms are likely to be more concerned
about their reputational capital and they have more resources and wherewithal to disagree with the
PCAOB.
Finally, we consider changes in firm responses over time. Although the sample size is small,
we observe a noticeable decrease in disagreements in the last year of inspection reports. In 2009,
there was only one disagreement (or 12.5 percent) for all large firms’ responses, whereas the
minimum number of disagreements per year was five (or 62.5 percent) from 2004 to 2008.
Quality Control Criticisms
For each inspection report, we determine whether there is an indication of quality control
criticisms. We find that every large firm has criticisms of quality control in every inspection year
2004 to 2009. However, we note that to date, none of the criticisms have been publicly disclosed.
Hence, the quality control defects have either been remediated in a timely fashion, or the firms have,
in good faith, made reasonable progress toward remediating the defects.6 Similarly, Hermanson and
Houston (2008, 2009) observe that small firms with quality control defects typically remediate the
defect in a timely fashion. For instance, Hermanson and Houston (2008, 39) note that 179 of 199
small firms (89.9 percent) adequately addressed the PCOAB’s criticisms in a timely manner.
In contrast to our findings, Hermanson et al. (2007) find that a number of small firms do not
receive quality control criticisms. Looking at 2004 and 2005, they document that 89 of 316 firms
(28.2 percent) do not experience quality control criticisms. However, we point out that size can
have a dramatic impact on the complexity and formality of firms’ quality control systems. In fact,
the PCAOB (2006, 9) readily acknowledges that firm size is a critical factor in assessing quality
control policies and procedures. The quality control criticisms of small firms, for the most part, are
attributable to audit performance issues—inferred from deficiencies uncovered in the performance
of the audits. By comparison, the quality control criticisms of large firms not only focus on audit
performance issues, but also on firms’ infrastructure to ensure audit quality. In particular, the
PCAOB (2006, 10) scrutinizes policies and procedures that underlie ‘‘internal inspections,
evaluation and compensation of partners, compliance with independence requirements, establish-
ment and internal communication of policies and procedures, and client acceptance and retention.’’
Additional Analyses
Throughout the paper, we make comparisons between Big 4 and second-tier firms. At this
point, we note other differences between the two groups, which are important to keep in mind when
assessing our findings. The Big 4 and second-tier firms have very different client portfolios, in
terms of the number of issuer clients and the type of issuer clients. Table 11 provides a summary of
the firms’ issuer-client portfolios for fiscal year 2009 (the last inspection year included in our data).7
6 Because none of the quality control criticisms have been publicly disclosed, we are unable to comment on thenature of the criticisms. However, interested readers are referred to the PCAOB’s report (2008), which provides asummary of quality control deficiencies observed for large accounting firms for inspection years 2004 to 2007.Further, Evans et al. (2011) provide a prototype of the nonpublic portions of PCAOB inspection reports for largefirms: the paper includes a detailed, representative example of the structure and substance of quality controlcriticisms included in PCAOB inspection reports for large firms.
7 For comparisons to small firms, interested readers should consult Hermanson et al. (2007) for clientcharacteristics of triennially inspected firms. Obviously, the small firm issuer client portfolios are considerablysmaller than Big 4 and second-tier firms.
PCAOB Inspections and Large Accounting Firms 59
Accounting HorizonsMarch 2012

As might be expected, the Big 4 firms have far more issuer clients (n¼6,648) than second-tier firms
(n¼ 1,432) and a higher number of issuers inspected.8 Using data obtained from Audit Analytics
and Compustat, we report key client characteristics to gauge differences in client portfolios between
Big 4 and second-tier firms. As shown in Table 11, Big 4 firms’ issuer clients, on average, have
significantly higher market capitalization, assets, revenues, earnings, market-to-book value ratios,
and audit fees than second-tier firms (all p values , 0.01, two-tailed). By comparison, second-tier
firms have a significantly greater proportion of issuer clients in high-litigation industries than Big 4
firms (p , 0.01, two-tailed), suggesting more relative exposure.
Although Big 4 and second-tier firms have very different issuer-client portfolios, the issuers
selected for inspection may be comparable. Recall that the PCAOB’s issuer selection process is
risk-based (i.e., the riskiest issuers are selected for inspection). The total number of issuers reviewed
each inspection year is a relatively small portion of the firms’ issuer-client portfolios (PCAOB
2008). During inspection year 2009, the PCOAB only reviewed 4.0 and 7.3 percent of the Big 4
and second-tier firms’ issuer clients, respectively. Even though the two groups’ average issuer
clients are very different, their high-risk issuers may be relatively alike, each with challenging,
complex auditing issues. Therefore, the notable differences in client portfolios may not necessarily
TABLE 11
Firms’ Client Portfolios for 2009($s in 000s)
Big 4 Second-Tier
Issuer clients
Total number 6,648 1,432
Number inspected by the PCAOB in 2009 267 104
Client characteristics
Market capitalization*** $256,952.5 $70,096.4
Assets*** $1,193,972.0 $195,481.2
Revenues*** $430,147.0 $92,612.0
Earnings*** $15,594.5 $(1,084.5)
Market value/book value*** 264.0% 157.2%
Audit fees*** $507.1 $328.0
Probability of bankruptcy 0.379 0.401
High-litigation industries*** 44.1% 51.9%
*** Denotes a statistically significant difference at the 1 percent level (two-tailed).We determine the total number of issuer clients for fiscal 2009 using Audit Analytics. We determine the number ofissuers inspected using the PCAOB’s inspection reports. For client characteristics, we report issuer-client data for U.S.-based firm audits for fiscal year 2009, per Audit Analytics and Compustat. The probability of bankruptcy is computedfollowing Ohlson (1980). High-litigation industries include biotechnology, computing, electronics, retailing, andfinancial services (Palmrose 1988; Francis et al. 1994). The cell entries for market capitalization, assets, revenues,earnings, market value/book value, and audit fees are median values, due to extreme observations. The cell entry forprobability of bankruptcy is the mean value. We perform t-tests and Mann-Whitney tests to compare clientcharacteristics, excepting high-litigation industries, between Big 4 and second-tier firms. We perform a Chi-squared testto compare the proportion of issuer clients in high-litigation industries between Big 4 and second-tier firms.
8 We determine the number of issuer clients using Audit Analytics, and we determine the number of inspectedclients using the PCAOB’s inspection reports. Beginning in 2010 (for inspection year 2009), the PCAOB’sreports disclosed the total number of issuers examined for annually inspected firms. The number for Big 4 firmsranges from 58 to 76 and for second-tier from 13 to 39.
60 Church and Shefchik
Accounting HorizonsMarch 2012

lead to inherent differences in the inspection results of Big 4 and second-tier firms. Indeed, our
findings are generally consistent when comparing the two groups of firms.
CONCLUDING REMARKS
This study provides insight into the PCAOB’s inspection results for large, annually inspected
accounting firms. The inspection reports identify audit deficiencies that have implications for audit
quality. By examining the inspection reports in detail, we can assess the nature and severity of audit
deficiencies, track the total number of deficiencies over time, and determine common, recurring
audit deficiencies. We document a significant, downward linear trend in the total number of audit
deficiencies from 2004 to 2009. This result holds, looking at the number of misstatement and
non-misstatement deficiencies separately. We identify common, recurring audit deficiencies, and
note that 92.3 (77.0) percent of the total (misstatement) audit deficiencies involve a common,
recurring deficiency. Further, we identify the financial statement accounts most often impacted by
audit deficiencies and the primary emphasis of the financial statement impacted by audit
deficiencies. We also discuss firms’ responses to the PCOAB’s findings, noting that Big 4 firms
have more disagreements than second-tier firms. Finally, we document that every large accounting
firm has criticisms of quality control in every inspection year, although all of the criticisms have
been addressed in a timely manner (avoiding public disclosure). Our findings should be of interest
to academics, practicing accountants, regulators, and users of inspection reports.
Throughout the paper, we make comparisons between Big 4 and second-tier firms and also
with the findings for small firms reported by others (e.g., AICPA 2006; Hermanson et al. 2007;
Hermanson and Houston 2008, 2009; PCAOB 2008; Hermanson et al. 2010). For the most part, our
findings are consistent across Big 4 and second-tier firms as well as with findings reported
elsewhere, although a few differences emerge. The most notable difference involves the accounts
impacted by audit deficiencies. We also provide evidence of other differences between Big 4,
second-tier, and small firms.
Our findings should be interpreted in light of various limitations. First, our ability to code audit
deficiencies into unique categories relies on the wording contained in the inspection reports. That is,
the coding is dependent on the standardization and consistency applied by the PCAOB in preparing
and disseminating the inspection reports. Second, though we document a steady decline in audit
deficiencies over time, the explanation for this finding is unclear. Auditor performance may have
improved due to the PCAOB’s inspections or due to some other factor(s) (e.g., other aspects
entailed in the passage of SOX). Alternatively, accounting firms may have become more adept at
dealing with the PCAOB inspection process by providing special attention to issuers that are likely
targets for inspection (i.e., high-risk issuers) or by stylizing working papers to appease inspectors
(as opposed to producing substantive changes to audit quality). Still another possibility is that the
inspection process has changed over time: the PCAOB’s inspectors may have become less picky in
identifying audit deficiencies or the relative riskiness of inspected engagements may have declined.
Third, recall that Parts II and III of the PCAOB’s inspection reports are not publicly available.
Hence, we are unable to determine the extent to which improvements in accounting firms’ quality
control procedures led to the decrease in audit deficiencies over time. Finally, we make
comparisons throughout the paper with findings reported elsewhere for small accounting firms.
Such comparisons, however, are complicated by the fact that small firms have dramatically different
client portfolios than large firms. Most small firms are unable to tolerate the exposure associated
with risky clients and, thus, encounter less complex auditing issues. Moreover, the inspection
process may be more predictable for small firms because it is easier to pinpoint likely candidates for
inspection.
PCAOB Inspections and Large Accounting Firms 61
Accounting HorizonsMarch 2012

Notwithstanding the limitations described above, our study provides useful insights into the
inspection results for large firms. But further research is needed to continue to expand our
knowledge of PCAOB inspections and whether the inspection process has enhanced audit quality.
We encourage future studies to delve into the specific effects that the PCAOB inspections have on
large firms’ quality control procedures and audit methodology. We also encourage future studies to
examine the link between inspection audit deficiencies and overall audit quality. The aim is to
isolate the effect of inspection outcomes on suitable proxies for audit quality (e.g., Bedard et al.
2010). While some researchers have begun to address this issue (Gunny and Zhang 2009; Carcello
et al. 2010), the empirical challenges are daunting. Yet, this line of research is needed to shed light
on the efficacy of the PCAOB inspection process.
REFERENCES
American Institute of Certified Public Accountants (AICPA). 2006. Large Firm PCAOB InspectionDeficiency Analysis. New York, NY: AICPA.
Beasley, M. S., J. V. Carcello, D. R. Hermanson, and T. L. Neal. 2010. Fraudulent financial reporting 1998–
2007: An analysis of U.S. public companies. Available at: http://www.coso.org/documents/
COSOFRAUDSTUDY2010_001.pdf
Bedard, J. C., K. M. Johnstone, and E. F. Smith. 2010. Audit quality indicators: A status update on possible
public disclosures and insights from audit practice. Current Issues in Auditing 4: C12–C19.
Carcello, J. V., C. Hollingsworth, and S. Mastrolia. 2010. The Effect of PCAOB Inspections on Big 4 AuditQuality. Working paper, University of Tennessee.
DeFond, M. L. 2010. How should the auditors be audited? Comparing the PCAOB inspections with the
AICPA peer reviews. Journal of Accounting and Economics 49: 104–108.
Evans, R. J., R. S. Boster, and B. Gradison. 2011. Increasing transparency: A prototype of the nonpublic
portions of PCAOB large-firm inspection reports. Current Issues in Auditing 5 (1): A1–A21.
Farrell, J., and H. Shadab. 2005. The focus of future PCAOB auditor inspections. CPA Journal 75 (6): 9.
Fogarty, T. J. 1996. The imagery and reality of peer review in the U.S.: Insights from institutional theory.
Accounting, Organizations and Society 21 (2/3): 243–267.
Francis, J., D. Philbrick, and K. Schipper. 1994. Shareholder litigation and corporate disclosures. Journal ofAccounting Research 32 (2): 137–164.
Glover, S. M., D. F. Prawitt, and M. H. Taylor. 2009. Audit standard setting and inspection for U.S. public
companies: A critical assessment and recommendations for fundamental change. AccountingHorizons 23 (June): 21–37.
Gunny, K., and T. Zhang. 2009. PCAOB Inspection Reports and Audit Quality. Working paper, University
of Colorado and Singapore Management University.
Hermanson, D. R. 2009. Evidence from the PCAOB’s second inspections of small firms. The CPA Journal79 (2): 58–60.
Hermanson, D. R., and R. W. Houston. 2008. Quality control defects revealed in smaller firms’ PCAOB
inspection reports. The CPA Journal 78 (12): 36–39.
Hermanson, D. R., R. W. Houston, and J. C. Rice. 2007. PCAOB inspections of smaller CPA firms: Initial
evidence from inspection reports. Accounting Horizons 21 (June): 137–152.
Hermanson, D. R., R. W. Houston, and Z. Ye. 2010. Accounting restatements arising from PCAOB
inspections of smaller audit firms. The CPA Journal (September): 68–70.
Hilary, G., and C. Lennox. 2005. The credibility of self-regulation: Evidence from the accounting
profession’s peer review program. Journal of Accounting and Economics 40: 211–229.
Hilzenrath, D. S. 2002. SEC seeks reform of auditor controls: Battered Enron fires accounting firm.
Washington Post (January 18): A1.
Hodowanitz, J., and S. A. Solieri. 2005. Guarding the guardians. Strategic Finance 87 (August): 46–53.
Kinney, W. R., Jr. 2005. Twenty-five years of audit deregulation and re-regulation: What does it mean in
2005 and beyond? Auditing: A Journal of Practice & Theory 24 (Supplement): 89–109.
62 Church and Shefchik
Accounting HorizonsMarch 2012

Ogus, A. 1995. Rethinking self-regulation. Oxford Journal of Legal Studies 15 (1): 97–108.
Ohlson, J. A. 1980. Financial ratios and the probabilistic prediction of bankruptcy. Journal of AccountingResearch 18 (Spring): 109–131.
Palmrose, Z.-V. 1988. An analysis of auditor litigation and audit quality service. The Accounting Review 63
(1): 55–73.
Peltzman, S. 1976. Toward a more general theory of regulation. Journal of Law and Economics 19 (2):
211–240.
Public Companies Accounting Oversight Board (PCAOB). 2003. Rules on Investigations andAdjudications. PCAOB Release No. 2003-015. Washington, D.C.: PCAOB.
Public Companies Accounting Oversight Board (PCAOB). 2004. Statement Concerning the Issuances ofInspection Reports. PCAOB Release No. 104-2004-001. Washington, D.C.: PCAOB.
Public Companies Accounting Oversight Board (PCAOB). 2006. The Process for Board DeterminationsRegarding Firms’ Efforts to Address Quality Control Criticisms in Inspection Reports. PCAOB
Release No. 104-2006-077. Washington, D.C.: PCAOB.
Public Companies Accounting Oversight Board (PCAOB). 2008. Report on the PCAOB’s 2004, 2005,2006, and 2007 Inspections of Domestic Annually Inspected Firms. PCAOB Release No. 2008-08.
Washington, D.C.: PCAOB.
Public Companies Accounting Oversight Board (PCAOB). 2009. 2008 Annual Report. Available at: http://
pcaobus.org/About/Ops/Pages/default.aspx
Public Companies Accounting Oversight Board (PCAOB). 2010. Report on Observations of PCAOBInspectors Related to Audit Risk Areas Affected by the Economic Crisis. PCAOB Release No. 2010-
006. Washington, D.C.: PCAOB.
Read, W. J., D. V. Rama, and K. Raghunandan. 2004. Regional and local audit firms and the market for
SEC audits. Accounting Horizons 18 (4): 241–254.
Roybark, H. M. 2009. PCAOB inspection report card. CPA Journal (February): 65–69.
Stigler, G. 1971. The theory of economic regulation. Bell Journal of Economics and Management Science3: 3–18.
Woodlock, P., and G. Claypool. 2001. Your audit committee: How to cope with the end of the ‘‘rubber
stamp’’ era. Journal of Corporate Accounting and Finance 12 (May/June): 27–39.
PCAOB Inspections and Large Accounting Firms 63
Accounting HorizonsMarch 2012

Copyright of Accounting Horizons is the property of American Accounting Association and its content may not
be copied or emailed to multiple sites or posted to a listserv without the copyright holder's express written
permission. However, users may print, download, or email articles for individual use.
Copyright © 2022 FDOKUMEN