Economics - Knowledge Horizons
11
Knowledge Horizons - Economics Volume 9, No. 3, pp. 9–19, © 2017 Pro Universitaria 9 “Dimitrie Cantemir” Christian University Knowledge Horizons - Economics Volume 9, No. 3, pp. 9-19 P-ISSN: 2069-0932, E-ISSN: 2066-1061 © 2017 Pro Universitaria www.orizonturi.ucdc.ro ELEMENTS OF UNIFORMING THE ECOECONOMY Cristina Teodora BALACEANU 1 , Daniela PENU 2 1 Professor PhD, “Dimitrie Cantemir” Christian University Bucharest, Email [email protected] 2 Associated Professor, “Dimitrie Cantemir” Christian University Bucharest, Email [email protected] Abstract Ecoeconomy is regarded as a further step towards a new economic science that should devise economic life and health values produced from the perspective of 'the health of the whole living', is strongly grounded in the principles of Economics and Bio-economics. Bio-economics uses soil and biological resources (growth), as well as waste as raw material for the production of bio-products (food, feed, energy, industrial and production). It also includes the use of friendly environmental processes for sustainable industrial sectors (it is known that bio-waste have a considerable potential as an alternative to chemical fertilizers or for conversion into bio-energy and can contribute to the achievement of the 2 % of the EU objective of renewable energy). Key words: Ecoeconomy, green economy, environment, sustainability JEL Codes: Q20, Q50, Q56 Green economy, as defined by the United Nations Environment Programme (launched in February 2011), results in an improved well-being and social equity, together with the significant reduction of environmental risks and ecological deficit. Green economy involves risk-taking and investment policies which will prepare the growth of intensive consumption of raw materials and energy. A green economy can be thought as a low- carbon economy, through effective and sustainable use of resources and ensuring social inclusion. In a green economy, increasing incomes and employment should be bolstered by public and private investments that lower the carbon emissions and pollution, increase energy efficiency and resource efficiency, and prevent the loss of biodiversity and ecosystem services. Moreover, green economy is a mode of economic development based on sustainable development and knowledge on ecological economy. Karl Burkart 1 defines green economy as a basis for six main sectors: 1. Renewable energy (solar, wind, geothermal); 2. “green” constructions (constructions LEED- Leadership in Energy and Environmental Design); 3. Alternative fuels (electrical and hybrid vehicles etc); 1 KARL BURKART –independent entrepreneur in the field of green media and technology. 4. Water management (water treatment, systems of collecting the rainwater etc); 5. Management of waste r (recycling etc); 6. Territorial management (including organic agriculture, habitat preservation, afforestation at the urban level, reafforestation and grounds stabilization). The Global Citizens Center 2 lead by Kevin Danaher defines “green economy” as an integrated concept based on: 1. sustainability– humanity depends on the natural resources of the earth and that’s why an economic system that respects the integrity of ecosystems should be created; 2. social environment– an economic system full of opportunities for social and personal development should be created in order to grant all people the access to a decent standard of living; 3. green economy is a global aggregate of the individual communities of satisfying the citizens’ needs by the means of the local responsible production as well as the exchange of goods and services. In order to acquire a clear perspective on the 2 Global Citizen Center-laboratory for activities of education and economic development of the socibally responsible and ecological societies from San Francisco.
-
Upload
khangminh22 -
Category
Documents
-
view
3 -
download
0
Transcript of Economics - Knowledge Horizons

Knowledge Horizons - Economics Volume 9, No. 3, pp. 9–19, © 2017 Pro Universitaria
9
“Dimitrie Cantemir” Christian University
Knowledge Horizons - Economics
Volume 9 , No. 3, pp. 9-19 P-ISSN: 2069-0932, E-ISSN: 2066-1061
© 2017 Pro Universitaria www.orizonturi.ucdc.ro
ELEMENTS OF UNIFORMING THE ECOECONOMY
Cristina Teodora BALACEANU1 , Daniela PENU2
1 Professor PhD, “Dimitrie Cantemir” Christian University Bucharest, Email [email protected] 2 Associated Professor, “Dimitrie Cantemir” Christian University Bucharest, Email [email protected]
Abstract Ecoeconomy is regarded as a further step towards a new economic science that should devise economic life and health values produced from the perspective of 'the health of the whole living', is strongly grounded in the principles of Economics and Bio-economics. Bio-economics uses soil and biological resources (growth), as well as waste as raw material for the production of bio-products (food, feed, energy, industrial and production). It also includes the use of friendly environmental processes for sustainable industrial sectors (it is known that bio-waste have a considerable potential as an alternative to chemical fertilizers or for conversion into bio-energy and can contribute to the achievement of the 2 % of the EU objective of renewable energy).
Key words: Ecoeconomy,
green economy, environment, sustainability
JEL Codes: Q20, Q50, Q56
Green economy, as defined by the United Nations Environment Programme (launched in February 2011), results in an improved well-being and social equity, together with the significant reduction of environmental risks and ecological deficit. Green economy involves risk-taking and investment policies which will prepare the growth of intensive consumption of raw materials and energy.
A green economy can be thought as a low-carbon economy, through effective and sustainable use of resources and ensuring social inclusion. In a green economy, increasing incomes and employment should be bolstered by public and private investments that lower the carbon emissions and pollution, increase energy efficiency and resource efficiency, and prevent the loss of biodiversity and ecosystem services.
Moreover, green economy is a mode of economic development based on sustainable development and knowledge on ecological economy. Karl Burkart1 defines green economy as a basis for six main sectors:
1. Renewable energy (solar, wind, geothermal); 2. “green” constructions (constructions LEED-
Leadership in Energy and Environmental Design);
3. Alternative fuels (electrical and hybrid vehicles etc);
1 KARL BURKART –independent entrepreneur in the
field of green media and technology.
4. Water management (water treatment, systems of collecting the rainwater etc);
5. Management of waste r (recycling etc); 6. Territorial management (including organic
agriculture, habitat preservation, afforestation at the urban level, reafforestation and grounds stabilization).
The Global Citizens Center2 lead by Kevin Danaher defines “green economy” as an integrated concept based on:
1. sustainability– humanity depends on the natural resources of the earth and that’s why an economic system that respects the integrity of ecosystems should be created;
2. social environment– an economic system full of opportunities for social and personal development should be created in order to grant all people the access to a decent standard of living;
3. green economy is a global aggregate of the individual communities of satisfying the citizens’ needs by the means of the local responsible production as well as the exchange of goods and services. In order to acquire a clear perspective on the
2 Global Citizen Center-laboratory for activities of
education and economic development of the socibally
responsible and ecological societies from San Francisco.
Knowledge Horizons - Economics Volume 9, No. 3, pp. 9–19, © 2017 Pro Universitaria
10
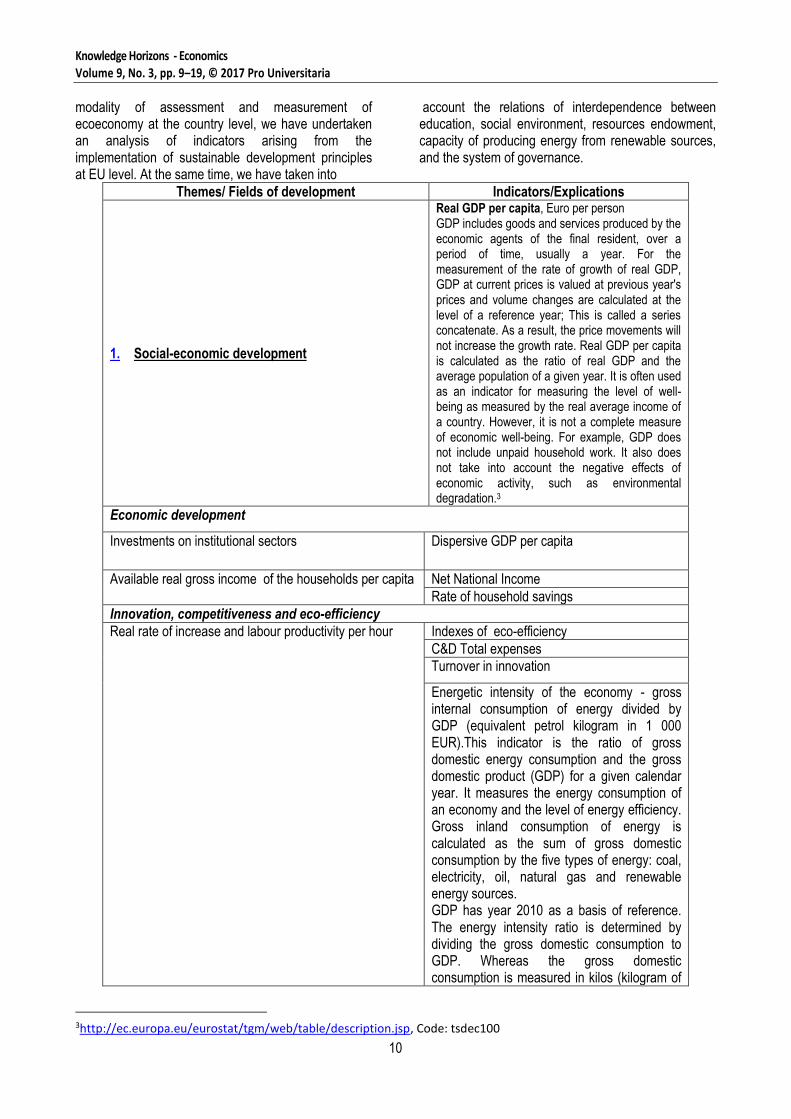
modality of assessment and measurement of ecoeconomy at the country level, we have undertaken an analysis of indicators arising from the implementation of sustainable development principles at EU level. At the same time, we have taken into
account the relations of interdependence between education, social environment, resources endowment, capacity of producing energy from renewable sources, and the system of governance.
Themes/ Fields of development Indicators/Explications
1. Social-economic development
Real GDP per capita, Euro per person GDP includes goods and services produced by the economic agents of the final resident, over a period of time, usually a year. For the measurement of the rate of growth of real GDP, GDP at current prices is valued at previous year's prices and volume changes are calculated at the level of a reference year; This is called a series concatenate. As a result, the price movements will not increase the growth rate. Real GDP per capita is calculated as the ratio of real GDP and the average population of a given year. It is often used as an indicator for measuring the level of well-being as measured by the real average income of a country. However, it is not a complete measure of economic well-being. For example, GDP does not include unpaid household work. It also does not take into account the negative effects of economic activity, such as environmental degradation.3
Economic development
Investments on institutional sectors Dispersive GDP per capita
Available real gross income of the households per capita Net National Income
Rate of household savings
Innovation, competitiveness and eco-efficiency
Real rate of increase and labour productivity per hour Indexes of eco-efficiency
C&D Total expenses
Turnover in innovation
Energetic intensity of the economy - gross internal consumption of energy divided by GDP (equivalent petrol kilogram in 1 000 EUR).This indicator is the ratio of gross domestic energy consumption and the gross domestic product (GDP) for a given calendar year. It measures the energy consumption of an economy and the level of energy efficiency. Gross inland consumption of energy is calculated as the sum of gross domestic consumption by the five types of energy: coal, electricity, oil, natural gas and renewable energy sources. GDP has year 2010 as a basis of reference. The energy intensity ratio is determined by dividing the gross domestic consumption to GDP. Whereas the gross domestic consumption is measured in kilos (kilogram of
3http://ec.europa.eu/eurostat/tgm/web/table/description.jsp, Code: tsdec100

Knowledge Horizons - Economics Volume 9, No. 3, pp. 9–19, © 2017 Pro Universitaria
11
oil equivalent) and the GDP to 1 000 euros invested, this ratio is measured in kilos per 1 000 euro.4
Employment
Employment rate Employment rate, considering the education level
Dispersive regional occupancy rate , by gender
Young people who do not work are included neither in education nor in training (NEET)
Employment rate
Unitary cost of the nominal labour
2. Production and sustainable consumption
Productivity of resources Resource productivity is GDP (PGDP), divided by the domestic consumption of materials (DMC). DMC measured the total quantity of materials used directly by an economy. It is defined as the annual quantity of raw materials extracted from the national territory of the local economy, adjusted by the balance of incomes in relation to foreign exchange factors (physical imports minus physical exports). It is important to note that the term 'consumer', as used in DMC, relate to apparent consumption/current consumption and not the final consumption. DMC does not include upstream flows related to the import and export of raw materials and products outside the local economy. To calculate productivity resources, Eurostat uses GDP expressed in EURO units either in concatenated volume '(with reference year 2010 exchange rates) or in PPC units (purchasing power parity). Therefore, the indicator is expressed as: (i)) in euro/kg, to compare the changes from a country in time; II) in PPC per kg, in order to compare different countries in a given year, is calculated as an index for the year 2010, when comparing countries in different years5.
Utilization of resources and waste
Generating waste, exception making the major mineral waste
Components of the domestic material consumption
Domestic material consumption, by material types
Generating municipal and treatment waste, depending on the type of treatment
Generation of hazardous waste, of economic activity
Emissions of sulphur oxides (SOx), by sector source
Emissions of nitrogen oxides (NOx), by sector
4http://ec.europa.eu/eurostat/tgm/web/table/description.jsp, Code sdec360 5http://ec.europa.eu/eurostat/tgm/web/table/description.jsp, Code: tsdpc100
Knowledge Horizons - Economics Volume 9, No. 3, pp. 9–19, © 2017 Pro Universitaria
12
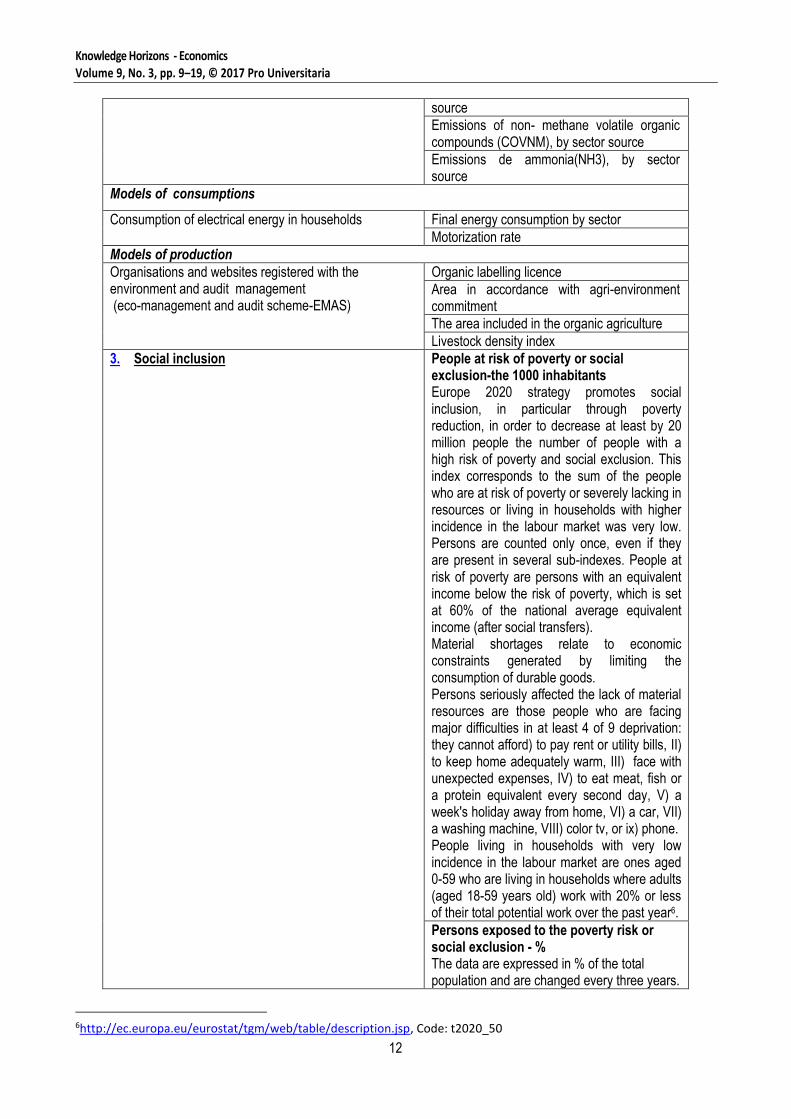
source
Emissions of non- methane volatile organic compounds (COVNM), by sector source
Emissions de ammonia(NH3), by sector source
Models of consumptions
Consumption of electrical energy in households Final energy consumption by sector
Motorization rate
Models of production
Organisations and websites registered with the environment and audit management (eco-management and audit scheme-EMAS)
Organic labelling licence
Area in accordance with agri-environment commitment
The area included in the organic agriculture
Livestock density index
3. Social inclusion People at risk of poverty or social exclusion-the 1000 inhabitants Europe 2020 strategy promotes social inclusion, in particular through poverty reduction, in order to decrease at least by 20 million people the number of people with a high risk of poverty and social exclusion. This index corresponds to the sum of the people who are at risk of poverty or severely lacking in resources or living in households with higher incidence in the labour market was very low. Persons are counted only once, even if they are present in several sub-indexes. People at risk of poverty are persons with an equivalent income below the risk of poverty, which is set at 60% of the national average equivalent income (after social transfers). Material shortages relate to economic constraints generated by limiting the consumption of durable goods. Persons seriously affected the lack of material resources are those people who are facing major difficulties in at least 4 of 9 deprivation: they cannot afford) to pay rent or utility bills, II) to keep home adequately warm, III) face with unexpected expenses, IV) to eat meat, fish or a protein equivalent every second day, V) a week's holiday away from home, VI) a car, VII) a washing machine, VIII) color tv, or ix) phone. People living in households with very low incidence in the labour market are ones aged 0-59 who are living in households where adults (aged 18-59 years old) work with 20% or less of their total potential work over the past year6.
Persons exposed to the poverty risk or social exclusion - % The data are expressed in % of the total population and are changed every three years.
6http://ec.europa.eu/eurostat/tgm/web/table/description.jsp, Code: t2020_50

Knowledge Horizons - Economics Volume 9, No. 3, pp. 9–19, © 2017 Pro Universitaria
13
People at risk of poverty or social exclusion-% per 1 000 persons
Shortage of financial resources and living conditions
Persons exposed to the poverty risk, after social transfers Persistence-at- the poverty risk
The average lag time regarding the risk of poverty
People seriously deprived of financial possibilities Inequality of income distribution
Access to the labour market y
People living in households with very low work intensity Risk of poverty for those persons who laugh A disposable income below the risk-of-poverty equated, which is set at 60 of the national average equivalent income (after social transfers).
Unemployment rate on long- term
Gap between women and men in terms of gross salary
Education
Persons who abandon early education and training Poverty risk rate Gap between women and men in terms of salary in raw form
The level of secondary education, by age
Level of tertiary education on gender, age groups 30-34 Lifelong learning
Low-performance concerning ability of reading students
Individual IT skills
Internet use at the individual level
4. Demographical changes Employment rate for seniors Employment rate of older workers is calculated by dividing the number of employed persons and the age of 55 and 64 years of age in the total population of the same age group. The indicator is based on the survey of the labour force in the EU. The survey includes population from private households and excludes the population in collective households such as boarding houses, halls of residence and hospitals. Population consists of those persons who during the reference week did any work for pay or profit for at least one hour, or were not working, or they had jobs from which they were temporarily absent
Demography
Number of years of healthy life and life expectancy at 65 years, by gender
Total fertility rate
Gross rate of total population change Gross rate of net migration (plus adjustment)
Adjusting the income by age
Aggregated rate of replacement
Sustenability of public finance
Knowledge Horizons - Economics Volume 9, No. 3, pp. 9–19, © 2017 Pro Universitaria
14
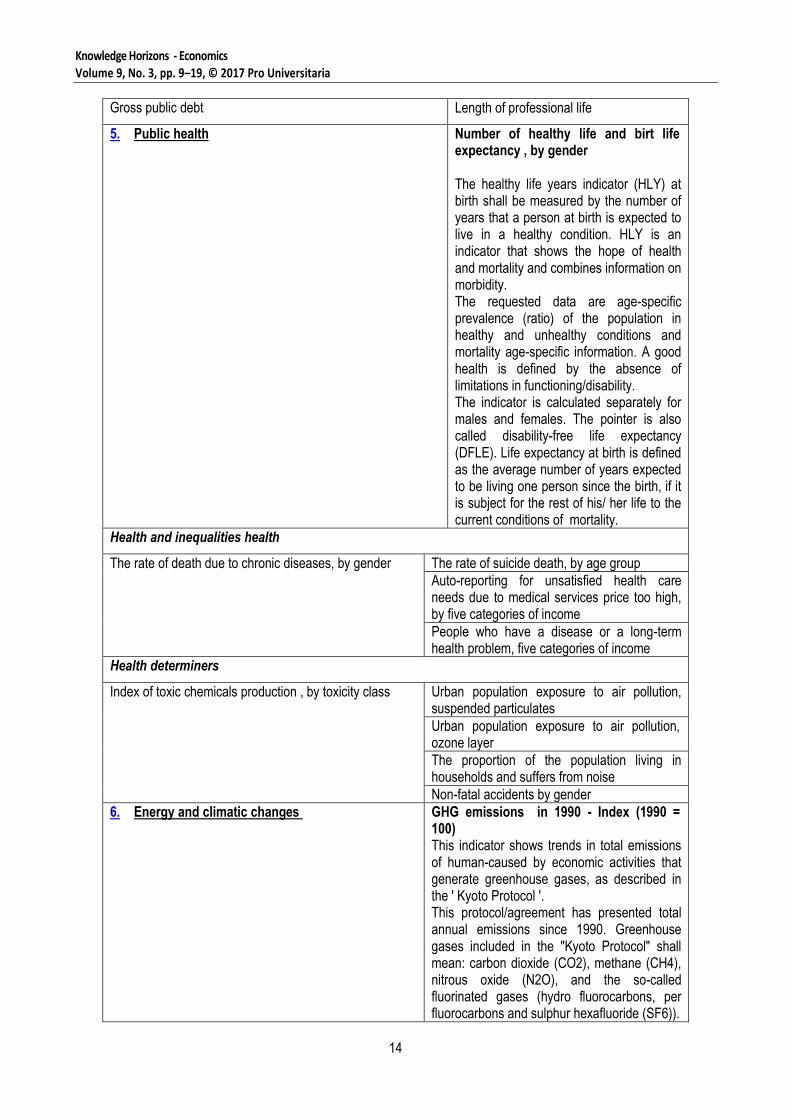
Gross public debt Length of professional life
5. Public health Number of healthy life and birt life expectancy , by gender The healthy life years indicator (HLY) at birth shall be measured by the number of years that a person at birth is expected to live in a healthy condition. HLY is an indicator that shows the hope of health and mortality and combines information on morbidity. The requested data are age-specific prevalence (ratio) of the population in healthy and unhealthy conditions and mortality age-specific information. A good health is defined by the absence of limitations in functioning/disability. The indicator is calculated separately for males and females. The pointer is also called disability-free life expectancy (DFLE). Life expectancy at birth is defined as the average number of years expected to be living one person since the birth, if it is subject for the rest of his/ her life to the current conditions of mortality.
Health and inequalities health
The rate of death due to chronic diseases, by gender The rate of suicide death, by age group
Auto-reporting for unsatisfied health care needs due to medical services price too high, by five categories of income
People who have a disease or a long-term health problem, five categories of income
Health determiners
Index of toxic chemicals production , by toxicity class Urban population exposure to air pollution, suspended particulates
Urban population exposure to air pollution, ozone layer
The proportion of the population living in households and suffers from noise
Non-fatal accidents by gender
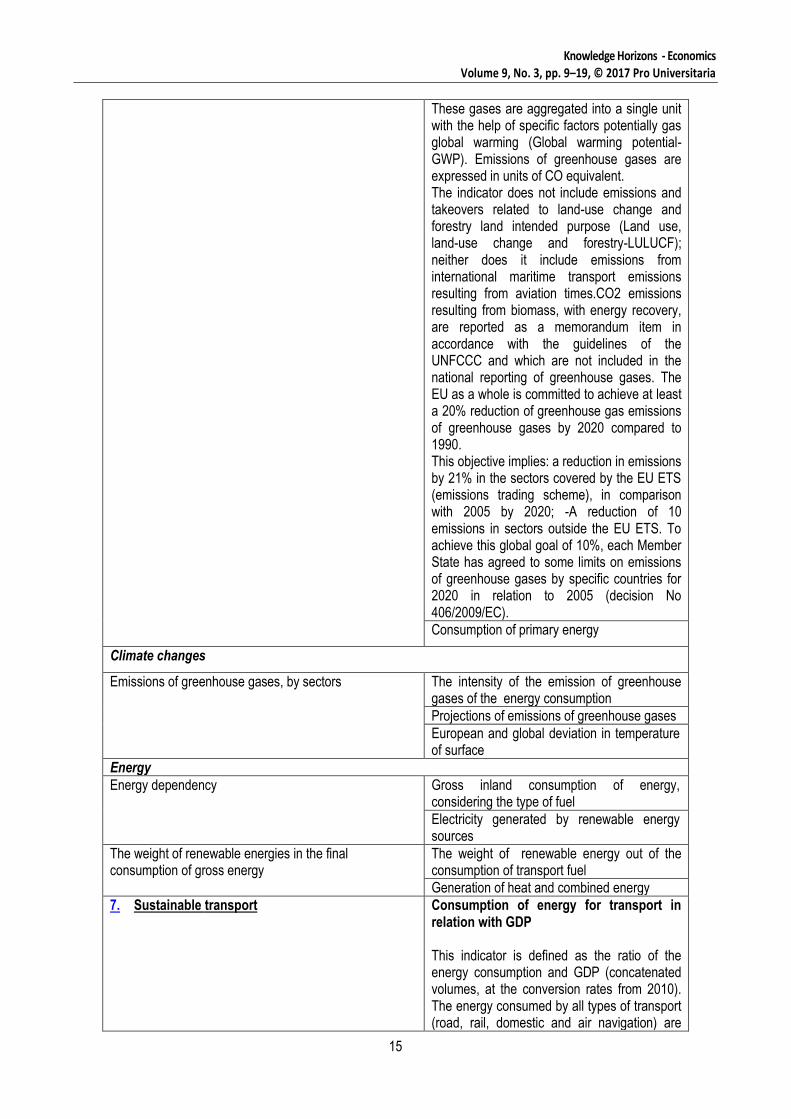
6. Energy and climatic changes GHG emissions in 1990 - Index (1990 = 100) This indicator shows trends in total emissions of human-caused by economic activities that generate greenhouse gases, as described in the ' Kyoto Protocol '. This protocol/agreement has presented total annual emissions since 1990. Greenhouse gases included in the "Kyoto Protocol" shall mean: carbon dioxide (CO2), methane (CH4), nitrous oxide (N2O), and the so-called fluorinated gases (hydro fluorocarbons, per fluorocarbons and sulphur hexafluoride (SF6)).
Knowledge Horizons - Economics Volume 9, No. 3, pp. 9–19, © 2017 Pro Universitaria
15
These gases are aggregated into a single unit with the help of specific factors potentially gas global warming (Global warming potential-GWP). Emissions of greenhouse gases are expressed in units of CO equivalent. The indicator does not include emissions and takeovers related to land-use change and forestry land intended purpose (Land use, land-use change and forestry-LULUCF); neither does it include emissions from international maritime transport emissions resulting from aviation times.CO2 emissions resulting from biomass, with energy recovery, are reported as a memorandum item in accordance with the guidelines of the UNFCCC and which are not included in the national reporting of greenhouse gases. The EU as a whole is committed to achieve at least a 20% reduction of greenhouse gas emissions of greenhouse gases by 2020 compared to 1990. This objective implies: a reduction in emissions by 21% in the sectors covered by the EU ETS (emissions trading scheme), in comparison with 2005 by 2020; -A reduction of 10 emissions in sectors outside the EU ETS. To achieve this global goal of 10%, each Member State has agreed to some limits on emissions of greenhouse gases by specific countries for 2020 in relation to 2005 (decision No 406/2009/EC).
Consumption of primary energy
Climate changes
Emissions of greenhouse gases, by sectors The intensity of the emission of greenhouse gases of the energy consumption
Projections of emissions of greenhouse gases
European and global deviation in temperature of surface
Energy
Energy dependency Gross inland consumption of energy, considering the type of fuel
Electricity generated by renewable energy sources
The weight of renewable energies in the final consumption of gross energy
The weight of renewable energy out of the consumption of transport fuel
Generation of heat and combined energy
7. Sustainable transport Consumption of energy for transport in relation with GDP This indicator is defined as the ratio of the energy consumption and GDP (concatenated volumes, at the conversion rates from 2010). The energy consumed by all types of transport (road, rail, domestic and air navigation) are

Knowledge Horizons - Economics Volume 9, No. 3, pp. 9–19, © 2017 Pro Universitaria
16
covered, including commercial, transport and public, with the exception of maritime transport and by pipeline.
Transport and mobility
Passenger transport Volume of the commodities transport in relation with GDP
Volume of the passengers transport in relation with GDP
Commodities transport Consumption of energy in accordance with the transport mode
Impact of transports
Emissions of greenhouse gases regarding the transport mode
Emissions of nitrogen oxides (NOx) from transport
Emissions of suspended particulate from transport
Persons dead in driving accidents
Medium emissions of CO2 per km generated by new automobiles
8. Natural resources Index of the ordinary birds This indicator is an index and it includes the population abundance and diversity of a selection of common bird species associated with specific habitats. Rare species are excluded. Three groups of bird species are represented: common species on the land (39), common forest species (34 species) and all species of birds (167 species), which include species of farmland, forest and other94 common species joint (general, in contrast to the agricultural land and forest). The birds on the agricultural land have a high dependence on the land cultivated during the nesting and feeding in most part of the year, while forest birds are just as dependent on forested areas. A list of European bird species has been carried out, each country chooses the species to be covered by the data collected in the field. This means that different species are covered in each country, depending on their occurrence; for example, for agricultural land birds, it is only the lark included in the indexes of all countries. Although this indicator has a limited concentration in relation to the policy objectives of the EU's biodiversity and ecosystem services, it is considered to be the best available data set and also an indicator of the general state of the environment.7
Biodiversity
Sites designed in accordance with EU directive regarding the habitats
Destruction of habitats
Resources of fresh water
Index of water exploitation Population connected to wastewater treatment
7http://ec.europa.eu/eurostat/tgm/web/table/description.jsp, code tsdnr100
Knowledge Horizons - Economics Volume 9, No. 3, pp. 9–19, © 2017 Pro Universitaria
17
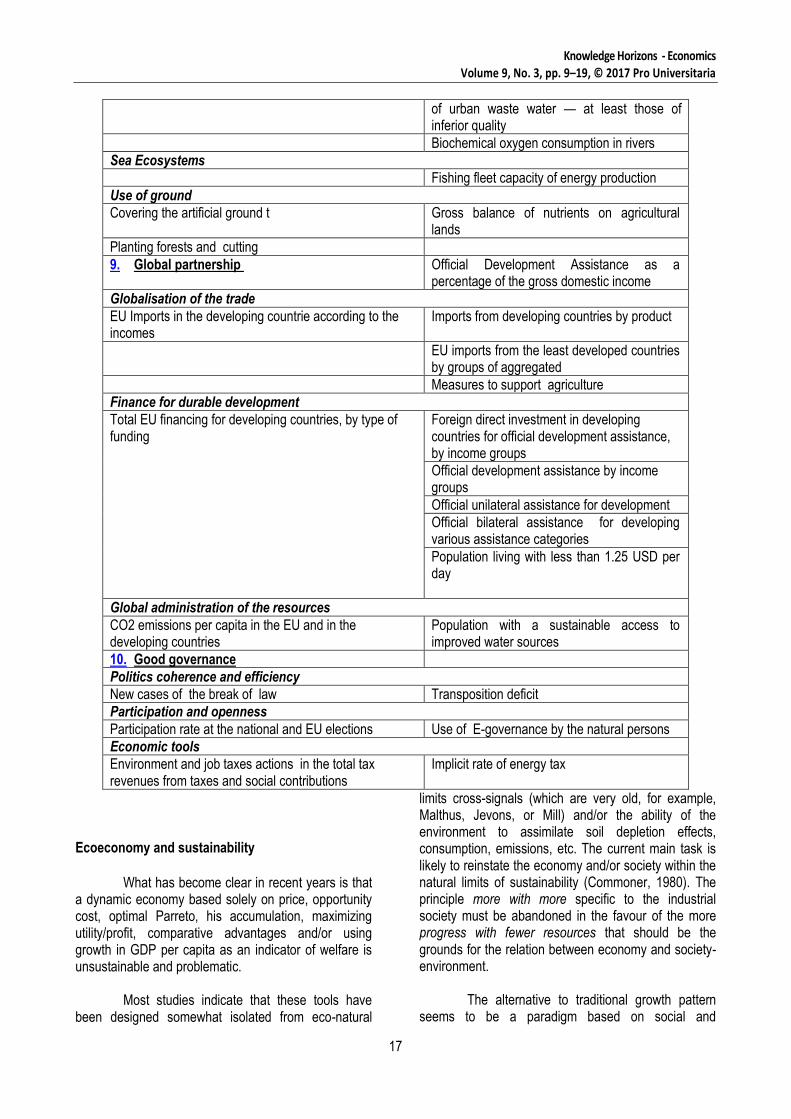
of urban waste water — at least those of inferior quality
Biochemical oxygen consumption in rivers
Sea Ecosystems
Fishing fleet capacity of energy production
Use of ground
Covering the artificial ground t Gross balance of nutrients on agricultural lands
Planting forests and cutting
9. Global partnership Official Development Assistance as a percentage of the gross domestic income
Globalisation of the trade
EU Imports in the developing countrie according to the incomes
Imports from developing countries by product
EU imports from the least developed countries by groups of aggregated
Measures to support agriculture
Finance for durable development
Total EU financing for developing countries, by type of funding
Foreign direct investment in developing countries for official development assistance, by income groups
Official development assistance by income groups
Official unilateral assistance for development
Official bilateral assistance for developing various assistance categories
Population living with less than 1.25 USD per day
Global administration of the resources
CO2 emissions per capita in the EU and in the developing countries
Population with a sustainable access to improved water sources
10. Good governance
Politics coherence and efficiency
New cases of the break of law Transposition deficit
Participation and openness
Participation rate at the national and EU elections Use of E-governance by the natural persons
Economic tools
Environment and job taxes actions in the total tax revenues from taxes and social contributions
Implicit rate of energy tax
Ecoeconomy and sustainability
What has become clear in recent years is that
a dynamic economy based solely on price, opportunity cost, optimal Parreto, his accumulation, maximizing utility/profit, comparative advantages and/or using growth in GDP per capita as an indicator of welfare is unsustainable and problematic.
Most studies indicate that these tools have
been designed somewhat isolated from eco-natural
limits cross-signals (which are very old, for example, Malthus, Jevons, or Mill) and/or the ability of the environment to assimilate soil depletion effects, consumption, emissions, etc. The current main task is likely to reinstate the economy and/or society within the natural limits of sustainability (Commoner, 1980). The principle more with more specific to the industrial society must be abandoned in the favour of the more progress with fewer resources that should be the grounds for the relation between economy and society- environment.
The alternative to traditional growth pattern
seems to be a paradigm based on social and

Knowledge Horizons - Economics Volume 9, No. 3, pp. 9–19, © 2017 Pro Universitaria
18
environmental targets and not on maximizing usefulness (strong sustainability/quality growth). The main problem is that a current invoked the concept of strong sustainability is normative and ethical rather than analytical and operational (Dietz, Neumayer, 2006). The main weak argument is that what determines the ability of future generations to enhance their wellbeing/utility function is the quantity and quality of capital goods that are at their disposal. In other words, a sustainable economy is inseparable from its productive capacities, which should produce in extenso wellbeing for future generations and is based on the substitution of different forms of natural and manufactured capital (Pearce, Atkinson, 1998). The main charge of this position is that, in general, the natural capital is undervalued, a very large part of the economy's effects on the environment are irreversible, unknown and uncontrollable (Chichilnisky, 1998).
Relying on an overly optimism due to the fact
that technological progress tends to generate rebound effects and the market internalizes costs and benefits to socialize; the substitution of manufactured capital for natural non- renewable capital makes the it problematic because it is limited and mostly because the production of manufactured implies capital materials consumption and energy that cannot be substituted (Daly, 1997).
On the contrary, the concept of strong
sustainability rejects optimism based on continuous, dynamic market price(as the only tool for efficient allocation and distribution) and environmental substitution and insists that sustainability means rather to make available to future generations the same level of non-renewable resources and/or environmental quality; in terms of growth, the concept of strong sustainability is soon focused on aspects pertaining to the development and quality of life than the accumulation, increase consumption, GDP growth etc (Ayres, Bergh, Gowdy (2000). Difficulties, advantages and applications arising from the weak/strong concepts of sustainability are discussed extensively by Goodland (1995), and Rennings and Hohmeyer (1997) and Dietz and Neumayer (2006).
Ecoeconomy transforms the benefits of
ecology and bio economics into economic policies which gives sense and rationality in economic activity, both at the level of consumption, as the defining act that supports a market economy, as well as at the level of the allocation, as a way to reduce societal inequalities.
CONCLUSION
The problems mankind is facing, from those related to the irrational use of natural resources, reaching their limits and generating increasing greenhouse gases, global warming, the intensification of natural disasters, to those generating economic crisis, prolonged recession, unemployment, structural deficits with repercussions on the quality of life, make necessary a rethinking of the economic system on the basis of rational, ethical, ecological. Naturally, ecoeconomy becomes an integrative concept which can manage unitarily environmental, social, economic, or ethical issues.
The allocation issue is obvious, especially for the fact that without effective allocation, production might lie more than the marginal cost, which would mean the waste of resources and energy etc. We believe that the allocation can be integrated into paradigms of development/growth and completely different from the traditional approach. The issue of allocation lies in the size of the scale and intensity of the increase, which takes perverse effects on a finite ecosystem, as the Earth's ecosystem, which cannot support a continuous growth of savings through the introduction of new and new needs.
BIBLIOGRAPHY
Ayres, Robert and Jeroen vand den Bergh, and John Gowdy (2000), “Viewpoint: Weak versus Strong Sustainability”, http://www.tinbergen.nl/discussionpapers/98103.pdf
Chichilnisky, G., (1998), “Sustainable development and North-South trade”, Published in: Protection of Global Biodiversity (0198): pp. 101-117, http://mpra.ub.uni-muenchen.de/8894/
Chichilnisky, Graciela (1995), “The economic value of the Earth’s resources”, MPRA Paper No.8491
Commoner, Barry (1980), Cercul care se închide, Politică Printing House
Daly, Herman E. (1997), “Georgescu Roegen versus Solow/Stiglitz”, Ecological Economics 22
Dietz, Simon and Eric Neumayer (2006), “Weak and Strong Sustainbility in the SEEA: Concepts and Measurement”, Ecological Economics 61 (4), http://eprints.lse.ac.uk/3058/1/Weak_and_strong_sustainability_in_the_SEEA_(LSERO).pdf
Goodland, R. (1996). The Concept of Environmental Sustainability. Annual Review of Ecology and Systematics, Vol. 26,
Knowledge Horizons - Economics Volume 9, No. 3, pp. 9–19, © 2017 Pro Universitaria
19
Gowdy, J. and Mesner, S. (1998). The Evolution of Georgescu-Roegen’s Bioeconomics. Review of Social Economy, Vol.LVI, No.2,
http://are.berkeley.edu/courses/ARE298/Readings/goodland.pdf
http://homepages.rpi.edu/~gowdyj/mypapers/RSE1998.pdf
Pearce, David and Giles Atkinson (1998), “The concept of sustainable development: An evaluation of its usfulness ten years after Brundtland”, Swiss Journal of Economics and Statistics, Vol.134 (3)
http://ec.europa.eu/eurostat/tgm/web/table/description.jsp, code tsdnr100