Impact of GDP and Inflation on Unemployment Rate: A Study of Pakistan Economy in 2000-2010
Upload
independentCategory
view
4download
0
[Elnour, 3(11): November, 2014] ISSN: 2277-9655
Scientific Journal Impact Factor: 3.449
(ISRA), Impact Factor: 1.852
http: // www.ijesrt.com (C)International Journal of Engineering Sciences & Research Technology
[542]
IJESRT INTERNATIONAL JOURNAL OF ENGINEERING SCIENCES & RESEARCH
TECHNOLOGY
Tire Inflation Rate Modeling Mohamed Gomma Elnour* and Hala Abbas Laz
* Department of Mechanical Engineering- Faculty of Engineering- University of Bahri- Sudan &
University of Tabuk- KSA
Department of Mathematics- Faculty of Science- University of Bahri- Sudan & university of Tabuk- KSA
Abstract This paper will examine in detail the conditions of correctly inflated tire pressure that gives appropriate support from
the contained air pressure to provide an even distribution of load across the footprint and help stabilize the tire's
structure which has a significant impact on tire wear, rolling resistance, durability and allows drivers to feel
acceptable vehicle comfort, and adequate performance. Tire industry load and inflation standards are in a constant
state of change and all tires manufacturers continually updates their product information to reflect these changes.
Therefore the printed information’s may not reflect the latest load and inflation standards, so tires users will be in
need of continuous following for information updating and this is one of the main problem for the most tire dealer.
In this paper we have taken into consideration all factors and the condition of tire work that have direct effect on
tires performance, stability and safety. Also the paper is presenting all technical procedures to guarantee better
performance, stability, safety and long duration. Finally, the paper will introduce the risks faced by the use of
improper pressure inflation and worn tires.
Keywords: Tire size, Tire load, Tire cold inflation pressure rate, pressure rate modeling.tion.
Introduction Tires now manufactured in around 455 tire factories
in the world with over 1 billion tires manufactured
annually [1]. According to high number of
manufactures and due to the pure economical
interests tendency rather than quality technical
specifications, tires performance has been declined at
the last decade as a result of considerable low quality
production [2,3].While tires appear solid, the
molecular structure of the rubber used to manufacture
them actually looks like strands stuck together. These
molecular strands are stretched and returned to their
relaxed state every time the tire rolls (about 800 times
every mile) [4] this result to a very high excessive
stresses and strains then to wear and finally to a
failure.
It’s an important issue in planning and managing
vehicle’s safety and economical running to know
how to select a proper load and cold inflation
pressure of vehicles due to tires size. Choosing the
correct load rating of a tire can be very confusing.
There are many things to be considered when
selecting a load rating due to maximum inflation rate,
payload and vehicle type and in addition industry
load and inflation standards. [5]. Tires support the
weight of the vehicle by means of the air pressure
inside them that actually supports the weight.
Maintaining sufficient air pressure is required if the
tires are to provide all of the handling, traction and
durability of which they are expected to good
performance. Tires should be applied to appreciate
designing procedures. Failure of the tire would
endanger human life, and since the tire is made in
extremely large quantities; consequently, an elaborate
testing program is justified during design and even
after the production [6]. However, even if tires are
correctly inflated, setting of tire pressure has to be
checked periodically to assure that the influences of
time; change in ambient temperatures or small tread
punctures have not caused it to drop. However, even
if tires are correctly inflated, setting of tire pressure
has to be checked periodically to assure that the
influences of time; change in ambient temperatures or
small tread punctures have not caused it to drop [7].
The tire load and cold inflation pressure per axle for
road vehicles there are standard tables to be used. It’s
always recommended weighing each axle end

[Elnour, 3(11): November, 2014] ISSN: 2277-9655
Scientific Journal Impact Factor: 3.449
(ISRA), Impact Factor: 1.852
http: // www.ijesrt.com (C)International Journal of Engineering Sciences & Research Technology
[543]
separately and using the heaviest end weight to
determine the axle's cold inflation tire pressure. For
control of the road vehicles inflation rate it is
critical that the tire pressures should be the same
across all axles, while never exceeding the
maximum air pressure limit stamped on the
wheels but in fact tire fitter men and vehicle
drivers are so far not interested to do so properly
[8].Tires are normally inflated with air (a
combination of gasses comprised of about 78%
nitrogen (N2), 21% oxygen (O2) and 1% argon (Ar)
along with some traces of other gasses) from the local
gas station. Unfortunately, using air permits moisture
and the amount of water vapor in the air that varies
from place to place, time of the year and due to
weather conditions. While air is all around the world
is extremely different sometimes, finding a
convenient source of an ideal compressed air is
becoming difficult, and finding a source of "dry,"
vapor free compressed air is even more difficult and
this as a result has a negative influence to tire
performance and its time life. Correctly inflated tires
receive appropriate support from the contained air
pressure to provide an even distribution of load
across the footprint and help stabilize the tire's
structure. And while most drivers recognize that
proper inflation rate has a significant impact on tire
wear, rolling resistance and durability, only a few
realize that under inflation also has a noticeable
influence on how quickly and precisely the tires
respond to the driver's work commands [9].
Since typical tire pressures range from 30 to 35 psi
for cars (with light truck tire pressures often higher),
there is a constant force trying to push the air through
the tire. This allows some of the air to escape (called
permeation) right through the microscopic spaces
between the rubber molecules and somewhat like a
rubber balloon; the air will eventually escape if it is
not replenished. Generally, a tire's inflation pressure
rate will go down by about 1 psi every month. This
means that if air isn't added for two to three months,
the tire's inflation pressures will probably be 2 to 3
psi low, but normal car owners are not paying great
attention to that. In order to help maintain more
constant tire pressures, tires should be checked more
frequently, once a month and before trips is the
minimum but once a week is preferred. This will
allow refilling lost pressure that escapes over time, as
well as discover any pressure losses due to slow leaks
caused by minor punctures before significant
pressure is lost and the tire's internal structure is
damaged [10]. An underinflated tire will tend to wear
the shoulder areas of the tread faster than the center.
This is because there is insufficient air pressure to
allow the center of the tread to carry its fair share of
the weight. A correctly inflated tire receives
appropriate support from the contained air pressure to
provide an even distribution of load across the
footprint. While most drivers recognize that proper
inflation rate has a significant impact on tire wear,
rolling resistance and durability, only a few realize
that also has a noticeable influence on how
effectively the tires can resist hydroplaning to
maintain wet traction. An underinflated tire can't
maintain its shape and becomes flatter than intended
while in contact with the road. If a vehicle’s tires are
underinflated by only 6 psi it could lead to tire
failure. Additionally, the tire’s tread life could be
reduced by as much as 25%. Lower inflation pressure
will allow the tire to deflect (bend) more as it rolls.
This will build up internal heat, increase rolling
resistance and cause a reduction in fuel economy of
up to 5%. Drivers would experience a significant loss
of steering precision and cornering stability. While 6
psi doesn’t seem excessively low it usually represents
about 20% of the tire’s recommended pressure [11].
An overinflated tire is stiff and unyielding and the
size of its footprint in contact with the road is
reduced that increasing a local stress. If a vehicle's
tires are overinflated by 6 psi, they could be damaged
more easily when running over potholes or debris in
the road. Higher inflated tires cannot isolate road
irregularities well, causing them to ride harsher.
However, higher inflation pressures usually provide
an improvement in steering response and cornering
stability up to a point. This is why participants who
use street tires in autocrosses, track events and road
races run higher than normal inflation pressures. The
pressure must be checked with a quality air gauge as
the inflation pressure cannot be accurately estimated
through visual inspection. In order to evaluate the
influence of inflation pressure on response and
handling, the tire rack conducted a performance test
track drive, comparing properly inflated tires to
purposely underinflated tires [12].
Objectives of this study were taken in the study all
needed materials and statistical analysis to assess
their potential impact on tires performance, stability,
safety, time life and operational comforts. Having
summarized the factors that influence the tire cold
pressure air inflation rate that are considered in this
study they can be: - tire size, tire load rating, vehicle
mean speed rating, vehicle regime of service rating
and air pressure with respect to temperature
fluctuation.

[Elnour, 3(11): November, 2014] ISSN: 2277-9655
Scientific Journal Impact Factor: 3.449
(ISRA), Impact Factor: 1.852
http: // www.ijesrt.com (C)International Journal of Engineering Sciences & Research Technology
[544]
Materials and methods Tire production starts with bulk raw materials such as
rubber, carbon black, and chemicals and produces
numerous specialized components that are assembled
and cured. Many kinds of rubber are used; the most
common materials are styrene-butadiene copolymer.
So these are generally the article describes the
components assembled to make a tire like, the
various materials, the manufacturing processes ,
machinery and the overall business model (see figure
2). Regardless of how well a product meets design
specifications and quality standards, it also must meet
economical criteria in order to be competitive in the
domestic and global marketplace. The first strict
liability concept of product liability generally
prevails in the United States. This concept states that
the manufacturer of an article is liable for any
damage or harm that results because of a defect and it
doesn’t matter whether the manufacturer knew about
the defect, or even could have known about it [13].
Figure (1)
Styrene-butadiene copolymer (chemical structure
pictured) is the most popular material used in the
production of rubber tires. In 2004, $80 billion of
tires were sold worldwide; in 2010 it was $140
billion. The top five tire manufacturing companies by
revenue are Bridgestone, Michelin, Goodyear,
Continental, and Pirelli [14].
Many tires used in industrial and commercial
applications are non-pneumatic, and are
manufactured from solid rubber and plastic
compounds via molding operations. Solid tires
include those used for lawn mowers, skateboards,
golf carts, scooters, and many types of light industrial
vehicles, carts, and trailers. One of the most common
applications for solid tires is for material handling
equipment (forklifts). Such tires are installed by
means of a hydraulic tire press.
Semi-pneumatic tires have a hollow center, but they
are not pressurized. They are light-weight, low-cost,
puncture proof, and provide cushioning. These tires
often come as a complete assembly with the wheel
and even integral ball bearings. They are used on
lawn mowers, wheelchairs, and wheelbarrows. They
can also be rugged, typically used in industrial
applications and are designed to not pull off their rim
under use. Tires that are hollow but are not
pressurized have also been designed for automotive
use, such as the Towel (a portmanteau of tire and
wheel), which is an experimental tire design being
developed at Michelin. The outer casing is rubber as
in ordinary radial tires, but the interior has special
compressible polyurethane springs to contribute to a
comfortable ride. Besides the impossibility of going
flat, the tires are intended to combine the comfort
offered by higher-profile tires (with tall sidewalls)
with the resistance to cornering forces offered by low
profile tires. They have not yet been delivered for
broad market use.
Aircraft tires are designed to withstand extremely
heavy loads for short durations. The number of tires
required for aircraft increases with the weight of the
plane (because the weight of the airplane has to be
distributed better). Aircraft tire tread patterns are
designed to facilitate stability in high crosswind
conditions, to channel water away to prevent
hydroplaning, and for braking effect.
Tires often overheat if maximum braking is applied
during an aborted takeoff or an emergency landing.
The fuses provide a safer failure mode that prevents
tire explosions by deflating in a controlled manner,
thus minimizing damage to aircraft and objects in the
surrounding environment [15]. The requirement that
an inert gas, such as nitrogen, be used instead of air
for inflation of tires on certain transport category
airplanes was prompted by at least three cases in
which the oxygen in air-filled tires combined with
volatile gases given off by a severely overheated tire
and exploded upon reaching auto ignition
temperature. The use of an inert gas for tire inflation
will eliminate the possibility of a tire explosion.

[Elnour, 3(11): November, 2014] ISSN: 2277-9655
Scientific Journal Impact Factor: 3.449
(ISRA), Impact Factor: 1.852
http: // www.ijesrt.com (C)International Journal of Engineering Sciences & Research Technology
[545]
Drivers usually have no ability to know the actual
pressure with naked eyes to pay attention for that.
Therefore a test is done to confirm this issue. The
first part of the test was visual. The drivers were
asked to look at the tires and decide which of the two
vehicles was equipped with the underinflated tires.
While perhaps this visual test might have been easier
with taller tires of the past, today's low profile tires
fitted to the car demonstrated how difficult it has
become. The drivers agreed that the tire appearance
alone did not provide irrefutable confirmation of the
tire pressure contained inside see figure (2).
Figure (2)
Therefore person can't use his naked eyes as a tire
pressure gauge. While driving at the edge of a tire's
ability in wet conditions is challenging, the car with
the properly inflated tires provide handling that was
predictable. Driving the car with the underinflated
rear tires proved to be much more difficult to drive
and forced the driver to slow down to retain control,
producing lap times that were several seconds slower
than the properly inflated car. While tire
manufacturers can develop tires with great
hydroplaning resistance and wet traction, poor
maintenance of tire inflation pressures can make a
great tire awful like excessive wearing and car
disorder resulting even to car accident. Therefore
adjusting tires pressures as indicated on the vehicle
tire placard or in the owner's manual is very
important. Checking tire inflation pressures at least
once a month and before highway trips is a must.
Driving at high speeds certainly helps make a trip go
faster, however with the exception of events like the
road rally or a driver's school on a racetrack; so it's
difficult to find a place that allows unlimited speeds.
The tires on the vehicle should be properly sized,
inflated and inspected when planning to drive fast
because the tires will be subjected to tremendous
stresses.
Because of the weight they bear, pneumatic tires'
sidewalls bulge and their treads flatten as they roll
into contact with the road. The tires flatten treads
results in dimensional difference between the tire's
"unloaded" radius and its "loaded" radius). Increasing
vehicle speed will cause the tires to deflect quicker
and increasing vehicle load will cause the tires to
deflect farther (if tire pressure isn't increased). The
European Tire and Rim Technical Organization
(ETRTO) establishes the standards for tires sold in
Europe, and recognizes that the tire's deflection must
be minimized and controlled in order to surpass high
speed driving stresses. In order to accomplish this,
the tire inflation pressure recommendations and the
tire's rated load capacities are customized when
speeds exceed 160 km/h (99 mph) for all tires up to
be nominate as a V-speed rating, and when speeds
exceed 190 km/h (118 mph) for all tires that are Z-
speed rated. Beginning with the vehicle
manufacturer's recommended tire pressure for normal
highway conditions, tire cold inflation pressures are
initially increased and then the tire's rated load
capacities (branded on the sidewalls) are reduced as
speeds climb up. As an example shown below, the
vehicle manufacturer's recommended 35 psi for a
225/45R17 91W Standard Load tire installed on a
vehicle initially rises in 1.5 psi increments for every
10 km/h (6.2 mph) increase in speed until the
inflation pressures max out with an increase of 7.5
psi when the vehicle's top speed has increased 50
km/h (31mph). Then as the vehicle's top speed
continues to climb, the rated load capacity of the tire
is reduced in 5% increments for every additional 10
km/h until the vehicle's top speed has increased an
additional 30 km/h (18.6 mph). In this case the
225/45R17 91W standard load size's rated load
capacity of 1,477 lbs. is reduced to 1,255 lbs. when
applied to a vehicle with a 270 km/h (168 mph) and
general condition Tire safety:
Proper vehicle safety requires specific attention to
inflation pressure, tread depth, of the tires. Over-
inflated tires run the risk of explosive decompression.
On the other hand, under-inflated tires tread wear
particularly on the edges of the tread. As tire treads
decreases, there inflated tires have a higher rolling
resistance and suffer from overheating and rapid
tread wear more traction between the tire and the
road resulting in better grip. However, there is an
increased risk of hydroplaning, so as the tire wears
the performance in the dry generally improves, but

[Elnour, 3(11): November, 2014] ISSN: 2277-9655
Scientific Journal Impact Factor: 3.449
(ISRA), Impact Factor: 1.852
http: // www.ijesrt.com (C)International Journal of Engineering Sciences & Research Technology
[546]
gets worse in the wet. Tires worn down past their
safety margins and into the casing run the very real
risk of rupturing. Also, certain combinations of cross
ply and radial tires on different wheels of the same
vehicle can lead to vehicle instability, and may also
be illegal [15].
Tire Load and Inflation Standards:
The load range or ply rating branded on a tire's
sidewall helps identify how much load the tire is
designed to carry at its industry specified pressure.
Passenger tires feature named load ranges while light
truck tires use load ranges that ascend in alphabetical
order (letters further along in the alphabet identify
stronger tires that can withstand higher inflation
pressures and carry heavier loads). Before load
ranges were adopted, ply ratings and/or the actual
number of carcass plies were used to identify the
relative strength with higher numeric ratings or plies
identifying tires featuring stronger, heavier duty
constructions. Today's load range/ply ratings do not
count the actual number of body ply layers used to
make up the tire's internal structure, but indicate an
equivalent strength compared to early bias ply tires.
Most radial passenger tires have one or two body
plies, and light truck tires, even those with heavy-
duty ratings (10-, 12- or 14-ply rated), actually have
only two or three fabric plies, or one steel body ply.
In all cases, when changing tire sizes or converting
from one type of size to another, it is important to
confirm that the Load Index in the tire's s service
description of the new tire is equal to or greater than
the Load Index of the original tire and/or that the new
tire’s rated load capacity is sufficient to carry the
vehicle's Gross Axle Weight Ratings.
Tire pressure monitoring systems (TPMS) are in
some cases used as electronic systems that monitor
the tire pressures on individual wheels on a vehicle,
and alert the driver when the pressure goes below a
warning limit. There are several types of designs to
monitor tire pressure. Some actually measure the air
pressure, and some make indirect measurements,
such as gauging when the relative size of the tire
changes due to lower air pressure.
Since air is a gas, it expands when heated and
contracts when cooled. In most parts of North
America, this makes fall and early winter months the
most critical times to check inflation pressures...days
are getting shorter...ambient temperatures are getting
colder...and your tires' inflation pressure is going
down. The rule of thumb is for every 10° Fahrenheit
change in air temperature, your tire's inflation
pressure will change by about 1 psi (up with higher
temperatures and down with lower). In most parts of
North America as an example, the difference between
average summer and winter temperatures is about 50°
Fahrenheit...which results in a potential loss of about
5 psi as winter's temperatures set in and a 5 psi loss is
enough to sacrifice handling, traction, and durability.
Additionally, the difference between cold nighttime
temperatures and hot daytime temperatures in most
parts of the US country is about 20° Fahrenheit. This
means that after setting tire pressures first thing in the
morning, the vehicle's tire pressures will be almost 2
psi higher when measured in the afternoon (if the
vehicle was parked in the shade), while that is
expected, the problem is when setting the vehicle's
tire pressures in the heat of the day, their cold
pressures will probably be 2 psi low the following
morning. So if the vehicle is parked in the sun, the
sun's radiant heat will artificially and temporarily
increase tire pressures. We put some of these theories
to the test at the Tire Rack. First, we mounted two
tires on wheels. We let them sit overnight to equalize
and stabilize their temperatures and pressures. The
following morning we set them both to 35 psi. One
tire and wheel was placed in the shade while the
other was placed directly in the sun. We then
monitored the ambient temperatures, tire
temperatures and tire pressures through all the day.
As the day's temperatures went from 67° to 85°
Fahrenheit, the tire that was kept in the shade went
from our starting pressure of 35 psi to a high of 36.5
psi. The tire that was placed in the sun and subject to
the increase in ambient temperature plus the sun's
radiant heat went from our starting pressure of 35 psi
to a high of 40 psi. In both cases, if we had set our
tire pressures in the afternoon under the conditions of
our evaluation, they would have been between 2 and
5 psi low the following morning.
Next we evaluated the effects of heat generated by
the tire's flexing during use. We monitored the
changes in tire pressure in 5-minute intervals. The
test tires were inflated to 15 psi, 20 psi, 25 psi and 30
psi. Running them all under the same load, the air
pressure in all of the tires went up about 1 psi during
every 5 minutes of use for the first 20 minutes of
operation. Then the air pressures stabilized, typically
gaining no more than 1 psi of additional pressure
during the next 20 minutes. This means that even a
short drive to inflate your tires will result in tires that
will probably be under-inflated by a few psis the
following morning. Adding all of these together, we
can understand why the conditions in which vehicle's
tire pressures are set are almost as important as the

[Elnour, 3(11): November, 2014] ISSN: 2277-9655
Scientific Journal Impact Factor: 3.449
(ISRA), Impact Factor: 1.852
http: // www.ijesrt.com (C)International Journal of Engineering Sciences & Research Technology
[547]
fact that we do set it. It's important to remember that
the vehicle's recommended tire pressure is its cold
tire inflation pressure. Tires should be frequently
checked in the morning before driving more than a
few miles, or before rising ambient temperatures or
the sun's radiant heat affects it.
The tire contact patch is readily reduced by both
overinflated and under inflation. Over-inflation may
increase the wear on the center contact patch, and
under-inflation will cause a concave tread, resulting
in less center contact. Most modern tires will wear
evenly at very high tire pressures, but will degrade
prematurely due to low (or even standard) pressures.
It has been found, that an increased tire pressure
almost exclusively results in shorter stopping
distances, except in some circumstances that may be
attributed to the low sample size. If tire pressure is
too low, the tire contact patch is changed more than if
it were over-inflated. This increases rolling
resistance, tire flexing, and friction between the road
and tire. Under-inflation can lead to tire overheating,
premature tread wear, and tread separation in severe
cases [16].
In some cases drivers may tend to increase or to
decrease tire mean pressure to insure expected
comfort. So for high performance and dynamic
drivers often increase the tire pressure to near the
maximum pressure as printed on the side wall. This is
done to sacrifice comfort for performance and safety.
A tire at higher pressure is more inclined to keep its
shape during any encounter, and will thus transmit
the forces of the road to the suspension, rather than
being damaged it. This allows for an increased
reaction speed, and “feels" the driver perceives of the
road. Modern tire designs allow for minimal tire
contact surface deformity during high pressures, and
as a result the traditional wear on the center of the tire
due to reasonably high pressures is only known to
very old or poorly designed tires. Therefore very high
tire pressures have only two downsides: The sacrifice
in comfort; and the increased chance of obtaining a
puncture when driving over sharp objects, such as on
a newly scraped gravel road. Many individuals have
maintained their tire pressures at the maximum side
wall printed value (inflated when cold) for the entire
lifetime of the tire, with perfect wear until the end.
This may be of negative economic value to the rubber
and tire companies, as high tire pressures decrease
wear, and minimize side wall blow outs [17].
It is dangerous to allow tire pressure to drop below
the specification recommended on the vehicle
placard. Low pressure increases the amount of tire
wall movement resulting from cornering forces.
Should a low-pressure tire be forced to perform an
evasive maneuver, the tire wall will be more pliable
than it would have been at normal pressure and thus
it will "roll" under the wheel. This increases the
entire roll movement of the car, and diminishes tire
contact area on the negative side of the vector. Thus
only half the tire is in contact with the road, and the
tire may deform to such an extent that the side wall
on the positive vector side becomes in contact with
the road. The probability of failing in the emergency
maneuver is thus increased. When driving on sand or
in deep snow, tire pressure is sometimes lowered to
reduce the chance of bogging down.
Furthermore, the tire will absorb more of the irregular
forces of normal driving. With this constant bending
of the side wall as it absorbs the contours of the road,
it heats up the tire wall to possibly dangerous
temperatures. Additionally, this flexing degrades the
steel wire reinforcement; this often leads to side wall
blow-outs.
Low pressure tires can be subjected to pinching. If
the vehicle drives into a pot-hole, the side wall can
temporarily collapse, thereby pinching the tire
between the steel wheel and road. This can result in a
tire laceration and blow-out, as well as a damaged
wheel. Feathering occurs on the junction between the
tire tread and side wall, as a result of too low tire
pressures. This is as a result of the inability of the tire
to perform appropriately during cornering forces,
leading to aberrant and shearing forces on the
feathering area. This is due to the tire moving
sideways underneath the wheel as the tire pressures
are insufficient to transmit the forces to the wheel and
suspension. One of the most important issues is how
to set properly tire cold mean pressure with relative
to applied force. Tires are specified by the
manufacturer with a maximum load rating. Loads
exceeding the rating can result in unsafe conditions
that can lead to steering instability and even rupture.
The work load of a tire is monitored so that it is not
put under undue stress, which may lead to its
premature failure. Work load is measured in Ton
Kilometer per Hour (TKPH). The measurement's
appellation and units are the same. The recent
shortage and increasing cost of tires for heavy
equipment has made TKPH an important parameter
in tire selection and equipment maintenance for the
mining industry. For this reason, manufacturers of
tires for large earth-moving and mining vehicles
assign TKPH ratings to their tires based on their size,

[Elnour, 3(11): November, 2014] ISSN: 2277-9655
Scientific Journal Impact Factor: 3.449
(ISRA), Impact Factor: 1.852
http: // www.ijesrt.com (C)International Journal of Engineering Sciences & Research Technology
[548]
construction, tread type, and rubber compound. The
rating is based on the weight and speed that the tire
can handle without overheating and causing it to
deteriorate prematurely. The equivalent measure used
in the United States is Ton Mile per Hour (TMPH).
Speed rating:
The speed rating denotes the maximum speed at
which a tire is designed to be operated. Nowadays for
passenger vehicles these ratings range from 99 to 186
miles per hour (159 to 299 km/h). The study obtained
results as a reported standard as its shown bellow.
Vehicle
Top Speed
Required Tire
Pressure Increase
Tire Load Capacity
% of Branded Maximum
W-Speed Rated Tire
35 psi O.E. Example
mph km/h psi Bar % of value branded on sidewall psi lbs.
118 190 0 0 100% 35.0 1000
124 200 1.5 0.1 100% 36.5 1000
130 210 3.0 0.2 100% 38.0 1000
136 220 4.5 0.3 100% 39.5 1000
143 230 6.0 0.4 100% 41.0 1000
149 240 7.5 0.5 100% 42.5 1000
155 250 7.5 0.5 95% 42.5 950
161 260 7.5 0.5 90% 42.5 900
168 270 7.5 0.5 85% 42.5 850
Table (1)
In our example shown below, the vehicle
manufacturer's recommended 35 psi for a 225/45R17
91W Standard Load tire installed on a vehicle
initially rises in 1.5 psi increments for every 10 km/h
(6.2 mph) increase in speed until the inflation
pressures max out with an increase of 7.5 psi when
the vehicle's top speed has increased 50 km/h
(31mph). Then as the vehicle's top speed continues to
climb, the rated load capacity of the tire is reduced in
5% increments for every additional 10 km/h until the
vehicle's top speed has increased an additional 30
km/h (18.6 mph). In this case the 225/45R17 91W
Standard Load size's rated load capacity of 1,477 lbs.
is reduced to 1,255 lbs. when applied to a vehicle
with a 270 km/h (168 mph) top speed see table (1).
Work load:
The work load of a tire is monitored so that it is not
put under undue stress, which may lead to its
premature failure. Work load is measured in Ton
Kilometer per Hour (TKPH). The measurement's
appellation and units are the same. The recent
shortage and increasing cost of tires for heavy
equipment has made TKPH an important parameter
in tire selection and equipment maintenance for the
mining industry. For this reason, manufacturers of
tires for large earth-moving and mining vehicles
assign TKPH ratings to their tires based on their size,
construction, tread type, and rubber compound. The
rating is based on the weight and speed that the tire
can handle without overheating and causing it to
deteriorate prematurely. The equivalent measure used
in the United States is Ton Mile per Hour (TMPH)
Tire Load and Inflation Standards:
Load inflation tables for passenger cars and light
trucks are based on various standards organizations
including The Tire and Rim Association, (TRA) the
European Tyre and Rim Technical Organization
(ETRTO) and The Japan Automobile Tyre
Manufacturers Association (JATMA). The sizing
systems and a brief explanation of each component of
the size from each standard are listed below in figure
(3):

[Elnour, 3(11): November, 2014] ISSN: 2277-9655
Scientific Journal Impact Factor: 3.449
(ISRA), Impact Factor: 1.852
http: // www.ijesrt.com (C)International Journal of Engineering Sciences & Research Technology
[549]
Figure (3)
Reinforced (RD) or Extra Load (XL):
‘Reinforced’ and ‘Extra Load’ both refers to the tire’s ability to carry additional load capacity at a higher inflation
pressure compared to standard load tires. The sidewall of the tire is marked with either “REINFORCED” or
“EXTRA LOAD” as shown in Figure 4. Figure 5 shows the added load capacity of a reinforced of the same size.
Figure 4

[Elnour, 3(11): November, 2014] ISSN: 2277-9655
Scientific Journal Impact Factor: 3.449
(ISRA), Impact Factor: 1.852
http: // www.ijesrt.com (C)International Journal of Engineering Sciences & Research Technology
[550]
Figure (5)
Service rating:
Tires (especially in the U.S.) are often given service
ratings, mainly used on bus and truck tires. Some
ratings are for long haul, and some for stop-start
multi-drop type work. Tires designed to run 500
miles (800 km) or more per day carrying heavy loads
require special specifications.
Tread wear rating:
The tread wear rating or tread wear grade is how long
the tire manufacturers expect the tire to last. A
Course Monitoring Tire (the standard tire that a test
tire will be compared to) has a rating of "100". If a
manufacturer assigns a tread wear rating of 200 to a
new tire, they are indicating that they expect the new
tire to have a useful lifespan that is 200% of the life
of a Course Monitoring Tire. The "test tires" are all
manufacturer-dependent. Brand A's rating of 500 is
not necessarily going to give you the same mileage
rating as Brand B's tire of the same rating. The testing
is non-regulated and can vary greatly. Tread wear
ratings are only useful for comparing Brand A's
entire lineup against itself. Tread wear, also known as
tire wear, is caused by friction between the tire and
the road surface. Government legal standards
prescribe the minimum allowable tread depth for safe
operation [18].
The study had been done by descriptive method and
collecting the data through visiting the Khartoum
capital in different petrol station where tires
maintenance workshops are available in service clock
the time. Also data is collected through specialized
tire maintenance centers at the boarder limit of the
capital and at the automobiles central parks. We have
observed common problem in their activities, and
they were always established and sited beside the
civilian regions. The worn tires and their wastes are
polluted it, beside the following general observations:
Most of tire maintenance centers are private
owned, with poor designing as auto tire
repair workshop area.
Work is done inside or outside workshop,
e.g. on footpaths or road and in inadequate
to safety, performing the job with missed
special skillful technician and technical
knowledge.
The pressure is checked with a low quality
air gauge and also area subjected to
exposure and to harmful chemicals or other
risks since it’s sited in petrol station or
around maintenance mechanical workshops.
Lifting equipment suitable for the task is not
supplied by employer and is not available at
the breakdown scene. Service person
manually handles heavy tires, and mostly
there is no monitoring of the service persons
health, safety and welfare. The service
person has no means of emergency
[Elnour, 3(11): November, 2014] ISSN: 2277-9655
Scientific Journal Impact Factor: 3.449
(ISRA), Impact Factor: 1.852
http: // www.ijesrt.com (C)International Journal of Engineering Sciences & Research Technology
[551]
communication with the workshop or
emergency services.
Vehicle ramps and stands have no rated
capacity marked and the safe working load
is unknown. Vehicles on ramps not secured
in such a way as to prevent movement. Lack
of stock control leads to excess tires-parts –
crowding storage area.
Using air lines to clear away dust from
engines, filters this will release large
quantity of asbestos fibers into the breathing
zones of employees and causing a serious
damage to social health and to the
environment.
Qualified fitter men are using constant tire
pressure rating depend on only tire size with
the means of low quality gauges, while most
car drivers using their sense to check their
tire pressure. As a result of that according to
data collected from Khartoum car park
center daily for a week we took a hundred
light car and a hundred heavy trucks as a
sample to check the tire pressure rate at
morning to record and to obtain the
following results:
33% of heavy trucks samples are
underinflated,
8% are overinflated,
3% improper alignment,
2% dissimilar pair and with
11% misbalanced tire. For light cars
samples
23% are underinflated,
27% are overinflated,
13% improper alignment,
22% dissimilar pair and with
8% misbalanced tires.
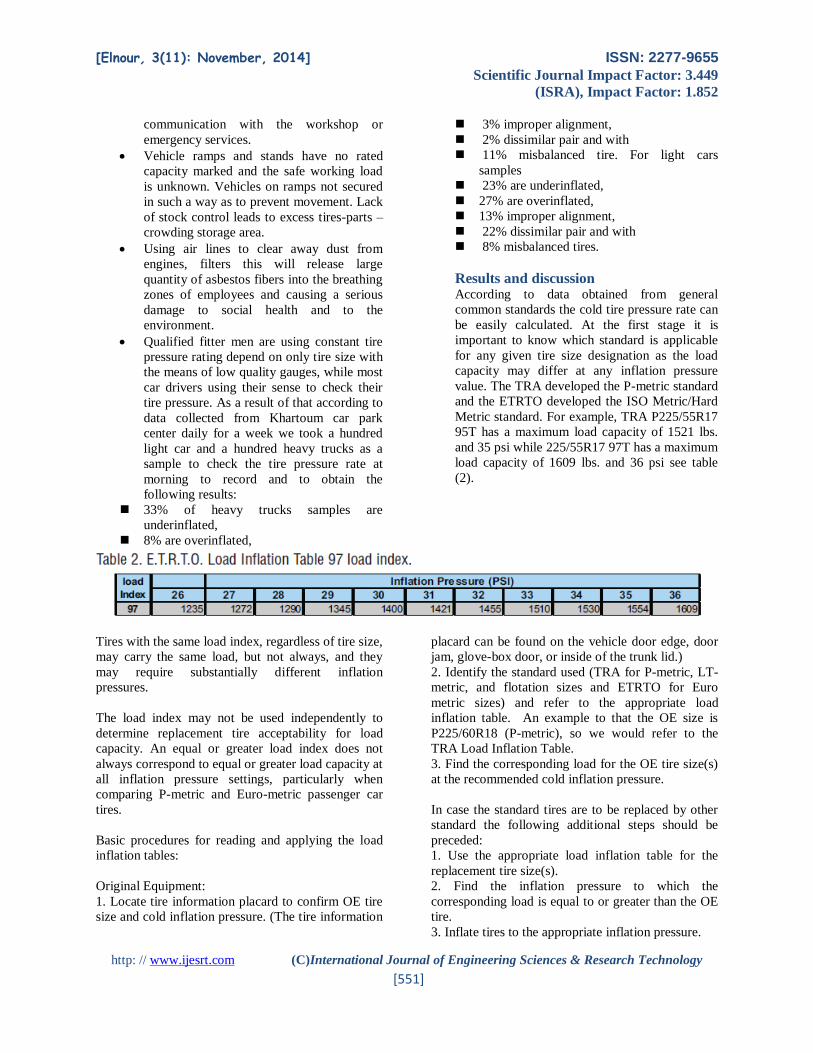
Results and discussion According to data obtained from general
common standards the cold tire pressure rate can
be easily calculated. At the first stage it is
important to know which standard is applicable
for any given tire size designation as the load
capacity may differ at any inflation pressure
value. The TRA developed the P-metric standard
and the ETRTO developed the ISO Metric/Hard
Metric standard. For example, TRA P225/55R17
95T has a maximum load capacity of 1521 lbs.
and 35 psi while 225/55R17 97T has a maximum
load capacity of 1609 lbs. and 36 psi see table
(2).
Tires with the same load index, regardless of tire size,
may carry the same load, but not always, and they
may require substantially different inflation
pressures.
The load index may not be used independently to
determine replacement tire acceptability for load
capacity. An equal or greater load index does not
always correspond to equal or greater load capacity at
all inflation pressure settings, particularly when
comparing P-metric and Euro-metric passenger car
tires.
Basic procedures for reading and applying the load
inflation tables:
Original Equipment:
1. Locate tire information placard to confirm OE tire
size and cold inflation pressure. (The tire information
placard can be found on the vehicle door edge, door
jam, glove-box door, or inside of the trunk lid.)
2. Identify the standard used (TRA for P-metric, LT-
metric, and flotation sizes and ETRTO for Euro
metric sizes) and refer to the appropriate load
inflation table. An example to that the OE size is
P225/60R18 (P-metric), so we would refer to the
TRA Load Inflation Table.
3. Find the corresponding load for the OE tire size(s)
at the recommended cold inflation pressure.
In case the standard tires are to be replaced by other
standard the following additional steps should be
preceded:
1. Use the appropriate load inflation table for the
replacement tire size(s).
2. Find the inflation pressure to which the
corresponding load is equal to or greater than the OE
tire.
3. Inflate tires to the appropriate inflation pressure.

[Elnour, 3(11): November, 2014] ISSN: 2277-9655
Scientific Journal Impact Factor: 3.449
(ISRA), Impact Factor: 1.852
http: // www.ijesrt.com (C)International Journal of Engineering Sciences & Research Technology
[552]
4. If the replacement tire requires a different inflation
pressure than OE, the installer should inform the
owner of the new required inflation pressure and
should also place a sticker or decal over the vehicle
tire placard showing the new tire size and
recommended inflation pressure for future reference.
Generally never use an inflation pressure lower than
what is recommended by the vehicle manufacturer.6
Examples of implementing this procedure are carried
out in the following:
Example 1:
Replace O.E. P235/45ZR17 93W with a Plus-1
245/40ZR18 97W reinforced on a 2006 Mitsubishi
Lancer Evolution IX. The O.E. tire is P-metric;
therefore use the TRA Load Inflation Table (see
Table 3) to look up the load capacity at the O.E.
inflation pressure. For the standard load
P235/45ZR17 93W, at 32 psi the load carrying
capacity of the front is 1354 lbs and the rear load at
29 psi is 1272 lbs according to table (3) TRA Load
Inflation Table.
If replacing the O.E. tires with Proxies
T1R245/40ZR18 97W RD which is a reinforced
ETRTO spec; therefore, refer to the ETRTO
Reinforced Load Inflation Table (Table 4). As
indicated previously, always maintain any differences
in inflation pressures front to rear that are shown on
the vehicle placard. In order to maintain the same
staggered inflation pressure from front to rear, while
still carrying an equal or greater load, the front tire
must be inflated to 35 psi (1378 lbs.) in the front,
while the rear tires will need to be inflated to 32 psi
(1290 lbs.).
Table4. ETRTO Reinforced Load Inflation Table.
In order to adequately support the load, the 2006
Mitsubishi Lancer Evolution IX with a plus 1 fitment
of 245/40ZR18 97W RD must be inflated to front 35
psi and rear 32psi.9
Application of load inflation tables from LT-metric to
LT-Metric
Example2:
Replace the O.E. LT315/70R17 121R with a plus
zero LT325/70R17 122R on a 2006 Hummer H2.
The original equipment size is LT- metric; therefore
use the TRA Light Truck Load Inflation Table (see
Table5) to find the load carrying capacity at the
recommended 37 psi.
It’s seen that in this table that the 37 psi falls
between the published values, so by extrapolation,
the load is 2595 lbs. This can be calculated as follows
[19]:

[Elnour, 3(11): November, 2014] ISSN: 2277-9655
Scientific Journal Impact Factor: 3.449
(ISRA), Impact Factor: 1.852
http: // www.ijesrt.com (C)International Journal of Engineering Sciences & Research Technology
[553]
Therefore, add 60 lbs. to 2535 lbs. to calculate the
load at 37 psi to get 2595 lbs.
Then if the O.E.tires also is to be replaced with the
Open Country A/T LT325/70R17 122R D/8, so we
use the Open Country A/T Load Inflation Table 6, we
extrapolate again to find that the tires at 37 psi will
sufficiently carry the O.E. load based on the O.E.
inflation pressure. The corresponding load at 37 psi is
2667 lbs.
In order to adequately support the load, the 2006
Hummer H2 with a plus zero fitment of
LT325/70R17 122R D/8 must be inflated to 37 psi
(front and rear).
The cold inflation pressure is
the inflation pressure of tires before the car is driven
and the tires warmed up. Generally its recommended
cold inflation pressure that displayed on the owner's
manual and on the placard (or sticker) attached to
the vehicle door edge, pillar, glove box door or fuel
filler flap. Drivers are encouraged to make sure their
tires are adequately inflated, as suboptimal tire
pressure can greatly reduce fuel economy, increase
emissions, increased wear on the edges of the tire
surface, and can lead to premature failure of the tire.
Excessive pressure, on the other hand, will lead to
blowouts, decrease braking performance, and cause
uneven wear (i.e. greater wear on the inner part of the
tire surface). Anyhow there are many factors that
have a direct effect on tire inflation pressure that
make any normal vehicle driver unable to calculate
all mentioned factors when he is setting the tire
pressure rate. As a clear example it’s known that the
ambient temperature affects the cold tire pressure.
Cold tire pressure varies directly with the absolute
temperature. The following table 7 shows the
relationship between ambient temperature and cold
tire pressure, where the volume of air in the tire
remains constant.
Ambient
temperature
% change in pressure if
originally filled at 75 °F
(24 °C; 297 K)
Pressure change, tire originally filled
to 32 psi (220 kPa; 2.2 bar) at 75 °F
(24 °C; 297 K)
Pressure change, tire originally filled
to 60 psi (410 kPa; 4.1 bar) at 75 °F
(24 °C; 297 K)
0 °F (−18 °C;
255 K) - 14 % −4.5 psi (−31 kPa; −0.31 bar) −8.4 psi (−58 kPa; −0.58 bar)
20 °F (−7 °C;
266 K) - 10 % −3.3 psi (−23 kPa; −0.23 bar) −6.2 psi (−43 kPa; −0.43 bar)
40 °F (4 °C;
278 K) - 7 % −2.1 psi (−14 kPa; −0.14 bar) −3.9 psi (−27 kPa; −0.27 bar)
60 °F (16 °C;
289 K) - 3 % −0.9 psi (−6.2 kPa; −0.062 bar) −1.7 psi (−12 kPa; −0.12 bar)
75 °F (24 °C;
297 K) 0 % 0.0 0.0
100 °F (38 °C;
311 K) + 5 % 1.5 psi (10 kPa; 0.10 bar) 2.8 psi (19 kPa; 0.19 bar)
Table (7)
Since the industry load and inflation standards are in
a constant state of change, and the manufacturers are
continually update their product information to
reflect these changes the normal vehicle owner
cannot follow these changes. Also the load and
inflation tables for single or dual vehicle tires are
different from one company to another. These tables
are applicable for each company individually. Below

[Elnour, 3(11): November, 2014] ISSN: 2277-9655
Scientific Journal Impact Factor: 3.449
(ISRA), Impact Factor: 1.852
http: // www.ijesrt.com (C)International Journal of Engineering Sciences & Research Technology
[554]
are some tables (8) and (9) as examples. The first
table indicates tire loads limits with relative to
various cold pressure inflation by Michelin Company
while the second table by Goodyear. It’s clear that
there is a big difference between the information
delivered by Michelin Company and by Goodyear.
The load by Michelin when the pressure is 35PSI is
1495LBS while for the same pressure by Goodyear
table is 2090LBS both for the same wheel size 16in.
Wheel Diameter 16
LT215/85R16 LRE XPS RIB®
PSI 35 40 45 50 55 60 65 70 75 80 Maximum load
& pressure on
sidewall kPa 240 280 310 340 380 410 450 480 520 550
LBS Single 1495 1640 1785 1940 2055 2180 2335 2430 2550 2680 S 2680 LBS
at 80 PSI
Dual 2720 2980 3250 3530 3723 3970 4300 4420 4640 4940 D 2470 LBS
at 80 PSI
Table 8
Table (9)
According to all mentioned factors that have direct
effect on cold tire inflation it’s clear that to select the
proper load and inflation rate is still a problematic
issue.
Conclusions It can simply be summarized as follows:-
It was observed that availability of
information on tire specifications provided
by all tire manufacturers is extremely poor,
with a general absence of a central
monitoring information management
system.
As a result of this it is impossible for tire
fitter men and individuals’ dealers to assess
really the extent of good tire operation and
maintenance and to formulate appropriate
tire failures solutions.
It was noted that there was poor networking
and functional relations between industries,
academic institutions, Non-Governmental
Organizations and Community Based
Organizations to transfer or share of needed
tire properties information, dissemination of
lessons learned from tire failure and to
insure best practices among tire national and
international stakeholders.
Most countries are not heavily industrialized
to produce any advanced technology for tire
quality control, maintenance and tire waste
processing.
In some cases tire operation and
maintenance management problems are due
to poor technology of manufacturing of
[Elnour, 3(11): November, 2014] ISSN: 2277-9655
Scientific Journal Impact Factor: 3.449
(ISRA), Impact Factor: 1.852
http: // www.ijesrt.com (C)International Journal of Engineering Sciences & Research Technology
[555]
some tire manufacturers industries and
outdated technology of maintenance in other
cases and low trained cadre.
Inadequacy of legislation for tire
manufacturing industries and tire
maintenance workshops in most part of the
world as the result of that tire quality is
continuously declined.
Lack of trained personnel in most countries
to establish, enforce, and implement strong
tire quality control system in stage of
manufacturing and in tire operation to
standard limit tire failure is expected to be in
continuous rising.
Lack of experience cadre to understand and
use latest technologies in tire maintenance
especially in most small tire auto repair
workshop to set a proper tire inflation rate is
resulting severely in tire time life and safety.
To insure proper tire inflation pressure rate an effort
should be done including the following:-
Memorandum of a need to technical study
for proper understanding of tire contracts on
manufacturing and purchasing for different
conditions of use.
Need for investment in research and
development for new technology of tire risk
minimization options before it can be let in
use in the country.
Formulating easy funding mechanisms in
studying tire quality control in all tire life
stages according to different needed
conditions if possible.
To limit the use of high tire manufacturers
mark number as far as possible to help in the
process of quality assurance following.
Good and efficient tire maintenance
management will result to a reduction in
earlier tire failure.
Encouraging international standardization of
all tire stages of designing, manufacturing
and exploitation to guarantee high safety and
acceptable tire duration.
Persuade the use of latest technology in tire
manufacturing and maintenance.
Promote supportive relevant legislations and
regulation in order to empower efficient
management of tire quality control in all
countries of the world.
References 1. Global tire industry hits $80 billion. Goliath
Business News.
2. Global Tire Shipments to Reach 1.7 Billion
Units by 2015, According to a New Report
by Global Industry Analysts, Inc
3. Hartley, R., and Okamoto, S., (1998),
“Concurrent Engineering: Shortening Lead
Times, Raising Quality, and Lowering
Costs, Productivity Press,
4. Jazar, Reza N.,( 2008), “Vehicle dynamics:
theory and applications” Springer.. p. 11.
5. "Car Talk Service Advice: Tire Pressure".
Retrieved 2009-01-16. Consumer Reports.
6. Petersen, "Tires - Nitrogen air loss study".
Gene (October 4, 2007). Consumer Reports.
7. "FEA Chapter III: Tire pressure survey and
test results". Retrieved 2009-01-16.
8. Serope Kalpakjian, (2002) “Manufacturing
Processes for Engineering Materials,”
Fourth Edition, Addison Wesley.
9. Bralla. G., 1999, “Design for
Manufacturability Handbook”, 2nd ed.,
McGraw-Hill.
10. Billatos, S., and Basaly, N., (1997),” Green
Technology and Design for the
Environment”, Taylor 85 Francis.
11. Research Report on World's Top 50 Tire
Enterprises, 2010-2011 Market Research
Report - 02 December 2010
12. "Thomas Net sources for industrial use
'Semi-Pneumatic Wheels'". Thomasnet.com.
Retrieved 2010-10-23.
13. Petersen, Gene (October 4, 2007). "Tires -
Nitrogen air loss study". Consumer Reports.
Retrieved 2011-12-10.
14. Werner Obrecht, and others, (2012),
"Rubber, 4. Emulsion Rubbers" in
Ullmann's Encyclopedia of Industrial
Chemistry, Wiley-VCH, Weinheim.
15. Hundai, M. (ed.), (2001), “Mechanical Life
Cycle Handbook”, CRC Press.
16. Shina, S.G. (ed.), (1997), “Successful
Implementation of Concurrent Engineering
Products and Processes, Wiley.
17. Wenzel, H., Hauschild, M., and Alting, L., ,
(2003) “ Environmental Assessment of
Products”, Vol. 1, Springer.
18. Mikell Groover, (2003) “Fundamentals of
Modern Manufacturing,” Second Edition,
John Wiley & Sons.
19. Douglas C. Montgomery, (2011) “Applied
Statistics and Probability for Engineers”,
5e International Student Version, McGraw-
Hill.
Copyright © 2022 FDOKUMEN