Tire and Natural rubber Industry - FPTS
88
Tire and Natural rubber Industry “… The low cost of Radial tire manufacturing, being attributed the dramatic reduction in Rubber prices, enables domestic enterprises to foster sustainable development, thereby helping to put Vietnam tire brands on the world map…” Luan Ngo Kinh Senior Analyst E: [email protected] P: (08) - 6290 8686 - Ext: 7595 Oct 2014 POTENTIAL GROWTH IN TIMES OF HARDSHIP
-
Upload
khangminh22 -
Category
Documents
-
view
1 -
download
0
Transcript of Tire and Natural rubber Industry - FPTS
Tire and Natural
rubber Industry
“… The low cost of Radial tire manufacturing, being attributed the dramatic reduction in Rubber prices, enables domestic enterprises to foster sustainable
development, thereby helping to put Vietnam tire brands on the world map…”
Luan Ngo Kinh
Senior Analyst
P: (08) - 6290 8686 - Ext: 7595
Oct 2014
POTENTIAL GROWTH IN
TIMES OF HARDSHIP
Tires and Natural Rubber
CONTENT
A. NATURAL RUBBER AND TIRES 4
I. Overview of the Natural Rubber 4
1. The Global Rubber Value chain 7
2. Vietnam’s Natural Rubber Industry 9
3. Value chain of Natural rubber industry of Vietnam 12
4. The position of Vietnam Natural rubber industry 14
5. The difference among Vietnam and the 3 neighboring countries Thailand,
Malaysia and Indonesia 15
6. Exporting – Importing of natural rubber of Vietnam 18
7. Analysis of the 5-Forces model of Vietnam Natural Rubber Industry 21
8. Policies related to Natural Rubber 22
9. Natural rubber industry outlook (NR) 23
II. Tire Industry 24
1. Overview of global tire industry 24
2. The Tire industry in Vietnam 28
3. Tire industry value chain in Vietnam 34
4. Era of Radial tire 37
5. SWOT Analysis of Tire industry in Vietnam 39
6. Policies related to tire industry 41
7. Tire industry outlook 42
B. UPDATED TIRE & RUBBER COMPANIES 43
I. Overview of listed companies in the industry 43
II. Opposite Business Performance between Natural rubber and Tire 48
III. Financial Analysis 52
C. INVESTMENT RECOMMENDATION 57
D. APPENDIX 64
NA
TU
RA
L R
UB
BE
R
TIR
ES
E
NT
ER
PR
ISE
S

Tires and Natural Rubber
www.fpts.com.vn www.fpts.com.vn Bloomberg- FPTS <GO> | 1
SUMMARY The world’s natural rubber industry
In the period of 2003-2013, the global production and consumption reach the CAGR of 4.2% and 3.7%, respectively.
The rubber plantation and the tapping production are largely located in Asia (93%) By the end of 2013, 88.85% of natural rubber’s global production is attributable to 6 countries including:
Thailand (34.41%); Indonesia (25.6%); Vietnam (7.89%); China (7.11%); India (6.99%) and Malaysia (6.85%).
About 68.7% of total NR demand of the world is consumed by China (36.65%), India (8.46%), US (8.06%), Japan (6.23%), Indonesia (4.72%) and Thailand (4.59%)
The supply surplus is expected to continue until the end of 2016. It shows that the motivation for price increase is quite low. Hardly any factor can apparently promote price increase in the years to come.
Vietnam’s natural rubber industry
Rubber planting area in 2013 was 955,700 ha (+4.1% yoy), production volume was 949,100 tons (an +8.2% yoy).
In the ten-year phase of 2003-2013, CAGR of rubber area was 8.0%/year with exploitation volume reaching 10.1%/year.
Vietnam ranks the fifth in the world in terms of rubber area and the third in term of production volume of natural rubber. In 2013, Vietnam surpassed its competitor – India, becoming one of the leading countries in exploiting capacity – 1.74 tons/ha.
56% of rubber area is in the Southeast of Vietnam.
Up to 2013, rubber area of Vietnam in Laos and Cambodia were 28,000 ha and 89,000 ha, respectively. Especially, HAGL possessed an area of 36,130 ha in the 2 countries above, and Gemadept JSC was planting 29,500 ha of rubber trees in Cambodia.
Domestic consumption of rubber is only 15-16% of the total supply.
There still remains a vast distinction in operation between Vietnam and neighbouring countries like Thailand, Malaysia, and Indonesia.
In the first 6 months of 2014, export volume decreased by 8.7% and export value reduced by more than 32% yoy.
In the first 6 months of 2014, Vietnam imported about 44,557 tons natural rubber with value of 82.9 mil USD, a decrease of 12.1% in quantity and 35.4% in value yoy.
Prospects of domestic natural rubber are not proved very bright considering the excess supply situation will continue at a high level and will not stop until 2016.
The world’s tire industry
The world’s tire industry is categorized into 2 segments: OEM (25-27%) and Replacement tires (73-75%).
70% of global market share is dominated by the top 5 countries such as Japan (23.9%), France (14.2%), the USA (13.1%), China (13.5%).
In terms of auto tire production: 60-61% of global products belongs to the Asia.
Regarding consumption: Consumption of the Asia, Europe and North America in combination is 86% of global consumption.
Currently, Radial tires are dominating the world’s consuming market.

Tires and Natural Rubber
www.fpts.com.vn www.fpts.com.vn Bloomberg- FPTS <GO> | 2
Vietnam’s Tire industry
There are about 830 enterprises operating in the tire industry in Vietnam.
Tires for bicycles in Vietnam are close to saturation while tires for motorbikes can satisfy only 80% of
the demand. As for automobile tires, 80-90% of the volume is for export.
61% of the truck tire market share in the country is traced back from the 5 enterprises as follows:
Bridgestone (importation), Michelin (exportation), Da Nang rubber (DRC), Casumina (CSM) and
Yokohama (manufacturing and importing).
Speaking of tire market share in the country: Casumina makes up for 33% followed by DRC (25%),
SRC (10%) and others (31%).
For Radial tires, 90% of the market share is dominated by FDI corporations and imported tires.
According to the statistics of the first 6 months of 2014, export value achieved USD 217 mil, an increase
of 12.9% yoy. Import value of tires of Vietnam was 140.57 mil USD, decreasing by 16% yoy.
The year of 2014 has witnessed the initial penetration of Radial tires of DRC and CSM. In the phase of
2015-2016, it is predicted that sales will grow and market share of both DRC and CSM for this segment
will increase accordingly.
Recommendation
Phuoc Hoa Rubber JSC. (PHR – HOSE) NEUTRAL, TARGET PRICE: 30,300 VND/share (+4.5%. Revenue in 2014 is expected to reduce by 16-20% yoy. EAT is estimated to be around 221-245 bn VND, 8-17% lower than 2014 plan – a decrease of 49-54% yoy. With the above estimation, EPS 2014 will be 2,154-2,388 VND/share. Accordingly, PHR is trading with PE forward of 11x, which is relatively higher than the average. The
target price measured by FCFF is 30,300 VND/share. (More details)
Dong Phu Rubber JSC. (DPR – HOSE) NEUTRAL, TARGET PRICE: 35,400 VND/share (-16%) Revenue in 2014 is expected to be around VND 925-940 bn, achieving 92% of the plan for the whole
year.
EBT of the whole year is about VND 211-221 bn, achieving 85-89% of the 2014 plan, a decrease of
46% yoy.
With this estimation, EPS 2014 will achieve 4,565 – 4,723 VND/share. Short-term target price is 35,400
VND/share, 16% lower than the market price. Currently DPR price can range from 40,000 – 50,000
VND/share thanks to the purchase of 2,000,000 shares. We, thus, recommend a NEUTRAL for this
stock. (More details)
Tay Ninh Rubber JSC. (TRC – HOSE) NEUTRAL, TARGET PRICE: 33,200 VND/share (+3.8%) Revenue yield from rubber business will be about 532 bn VND making a total revenue of the year of 573 bn VND, achieving 80% of the plan. EBT is estimated to be around VND 168 bn, exceeding 23% of the plan and decreasing by 37% yoy. Accordingly, EPS achieves 4,740 VND/share. In terms of PE, target price of TRC is 33,200 VND, equivalent to PE of 7.0x. (More details)
Hoa Binh Rubber JSC. (HRC – HOSE) SELL With more than 50% of aged rubber trees, low productivity and ineffective business activity, the future does not look very positive. Revenue of the year is VND 230.7 bn, achieving 88% of the plan. EAT this year will be about VND 53.7
bn, achieving 77% of the plan – a decrease of 17% yoy.
EPS 2014 will achieve 3,110 VND/share. At the current price of 39,000 VND/share (dated Sep 30,
2014), HRC is trading at PE forward of 12.5x, which is relatively higher than the average of 7.0x. We
recommend SELLING this stock. (More details)

Tires and Natural Rubber
www.fpts.com.vn www.fpts.com.vn Bloomberg- FPTS <GO> | 3
Thong Nhat Rubber JSC. (TNC – HOSE) SELL Business activities involve a number of unstable business fields, let alone small-scale plantation, low
productivity and inefficient business performance.
TNC is not as highly recognized as other listed corporations.
EPS 2014 is expected to be 694 VND/share. The company is now trading at PE forward of 17x, which
is relatively higher than the average of 7x. We recommend SELLING this stock. (More details)
Da Nang Rubber (DRC – HOSE) – HOLD, target price at the middle of 2015 is 60,300 VND/share (- 4,3%) The sale volume of both Bias tires and Radial tires increases quickly. The EAT is VND 369 – 383 bn,
declining by 2% yoy because the company recognizes the depreciation and interest expenses of Radial
factory.
It is very potential for the high growth of Radial tires in near future.
The estimated EPS of 2014 is about 4,450 – 4,615 VND/share. The target price of this year is 54,000
VND/share and 60,300 VND/share by the mid-2015. (More details)
Casumina (CSM–HOSE) – HOLD, the 12-month target price is 48,200 – 51,500 VND/share (increase from 3.4% to 10%). We forecast that the selling volume will highly rise, however, the profit will decrease because the
depreciation and interest expenses of Radial factory will be recognized next year.
The company will have an infrequent contribution from real estate in both 2014 and 2015.
It is very potential for the high growth of Radial tires in near future.
EPS of 2014 will be 4,820 VND/share (excluding the real estate transfer) and is 5,150 VND/share
(including the real estate transfer). (More details)
Sao Vang Rubber (SRC – HOSE) ADD, the year-end target price is 30,600 VND/share (+9%) We expect that the business result will be more positive than that of last year thanks to high growth
of demand of the market in general and SRC in particular on tires.
The selling quantity achieved the high growth in the first eight months of this year. Bicycle tires rose by
10%; motorcycle tires increased by 40%.
We forecast that the revenue of 2014 will reach VND 959 bn, PBT is VND 95.3 bn, increasing by 10%
yoy. Consequently, the EPS of 2014 will be 4,081 VND/share. The target price of this year is 30,600
VND/share. (More details)
Abbreviation
ANRPC : Association of Natural Rubber Producing Countries
IRSG : International Rubber Study Group
VRA : Vietnam Rubber Association
VRG : Vietnam Rubber Group
AFET : Agricultural Futures Exchange of Thailand
LMC : LMC Automotive
ASP : Average Selling Price
NR : Natural Rubber

Tires and Natural Rubber
www.fpts.com.vn www.fpts.com.vn Bloomberg- FPTS <GO> | 4
A. Natural Rubber and Tire
I. Overview of the Natural Rubber
The world natural rubber’s production and consumption are 12.04 and 11.32 million ton respectively in 2013, increasing by 2.67% and 3.73%, respectively compared to that of 2012.
In the period of 2003-2013, the production achieves the CAGR of 3.7% higher than that of consumption of 3.4%.
The supply surplus of the world rose continuously from 2011 to 2013 by 243 thousand
tons, 524 thousand tons and 640 thousand tons, respectively.
The rubber plantation and the tapping production are the most densely in Asia (93%),
followed by Africa (4-5%) and Latin America (2-3%).
Asia is the largest consumer of natural rubber accounting for about 72% of total
demand, followed by Europe (12%); North of America (10%); 6% of others.
Supply – Demand of Global Natural Rubber
Source: IRSG and ANRPC
Source: IRSG
(600)
(400)
(200)
-
200
400
600
800
-
2,000
4,000
6,000
8,000
10,000
12,000
14,000
2003 2004 2005 2006 2007 2008 2009 2010 2011 2012 2013
Production
Consumption
Supply Surplus
93.4%
4.3% 2.5%
Asia
Africa
Latin America 72%
12%
10%
5%
1%
Asia
Europe
North of America
Latin America
Africa

Tires and Natural Rubber
www.fpts.com.vn www.fpts.com.vn Bloomberg- FPTS <GO> | 5
By the end of 2013, 88.85% of total natural rubber’s production of the world comes from
6 countries including: Thailand (34.41%); Indonesia (25.6%); Vietnam (7.89%); China
(7.11%); India (6.99%) and Malaysia (6.85%). Last year, Vietnam surpassed Malaysia
and India to make it to the top 3 of the largest rubber producers of the world.
By the end of 2013, Indonesia owned the largest rubber plantation of the world
accounting for 3.49 million tons with Thailand ranking the second (3.43) and China;
Malaysia holding the third and the fourth place (1.16 and 1.06 respectively). The fifth
and sixth position belong to Vietnam and India (955,700 ha and 776,000 ha
respectively).
About 68.7% of total NR demand of the world consumed by China (36.65%), India
(8.46%), US (8.06%), Japan (6.23%), Indonesia (4.72%) and Thailand (4.59%). In
particularly, China occupied about 32% of total NR consumption and 25% of total NR
export value of the world for the last 5-year.
Approximately 87-94% of total NR export volume of the world belongs to Thailand (3.66
million tons), Indonesia (2.72 million tons), Malaysia (1.38 million tons) and Vietnam
(1.07 million tons).
Top 4 of Natural rubber exporters in 2013
Source: The Rubber Economist
Source: ANRPC
Natural rubber production’s structure
by country in 2013
Natural rubber consumption’s
structure by country in 2013
Country 1,000 Ton % Proportion
Thailand 4,141 34.4
Indonesia 3,081 25.6
Vietnam 950 7.89
China 856 7.11
India 842 6.99
Malaysia 825 6.85
Cote d'Ivoire 275 2.29
Brazil 173 1.44
Myanmar 147 1.22
Sri Lanka 131 1.08
Philippines 111 0.92
Others 26- 4.20
Country 1,000 Ton % Proportion
China 4,150.0 36.65
India 958.2 8.46
USA 913.0 8.06
Japan 705.4 6.23
Indonesia 534.0 4.72
Thailand 520.0 4.59
Malaysia 434.1 3.83
Korea 396.0 3.50
Brazil 395.3 3.49
Germany 249.5 2.20
Vietnam 154.0 1.36
Others 1,718.5 16.91
Country 1,000 ton % Proportion
Thailand 3,664 40.5%
Indonesia 2,719 30.1%
Malaysia 1,380 15.3%
Vietnam 1,076 11.9%
Others 201 2.2%

Tires and Natural Rubber
www.fpts.com.vn www.fpts.com.vn Bloomberg- FPTS <GO> | 6
Natural Rubber price volatility based on the economic events of 2008-2014
Based on the structure of global NR consumption and production as described above and the events that happened in the past, we could see that the NR price is always influenced by economic and social events, disasters, etc. in developed countries which has a great effect on the demand and supply of NR from countries like US, Japan, China, Thailand, Malaysia, etc.
Natural Rubber price forecast
According to the data of The Rubber Economist and IRSG, it shows that the supply surplus will continue until the end of 2016. Massive influx of countries joining rubber plantation in the period 2007-2009 (the positive price uptrend period) results in the current oversupply. The supply will increase quickly from 2013 to 2016 when all rubber in the period of 2007-2009 is tapped. From 2013-2016, the production is estimated to grow 2% per year lower than the 3% of consumption. It would narrow the gap between supply and demand for the next 3 years. However, it shows that the motivation for price increase is quite low. Hardly can any factor apparently promote price increase in the years to come.
Source: The Rubber Economist Report
Supply-Demand of Global Natural Rubber of 2012-2016
0
1000
2000
3000
4000
5000
6000
7000T
1
T3
T5
T7
T9
T1
1
T1
T3
T5
T7
T9
T1
1
T1
T3
T5
T7
T9
T1
1
T1
T3
T5
T7
T9
T1
1
T1
T3
T5
T7
T9
T1
1
T1
T3
T5
T7
T9
T1
1
T1
T3
T5
T7
2008 2009 2010 2011 2012 2013 2014
Thailand Malaysia Vietnam
Source: VRG, AFET, Malaysia Rubber
Natural Rubber price’s performance in the period of 2008 - 2014
Global financial
crisis
Flood in Thailand Tsunami in Japan
Debt crisis in Europe
QE in US, Japan,
China The highest rubber inventory in China
Crisis in China US reduced QE
Thailand, Malaysia, Indonesia together reduce supply volume for supporting the natural rubber price
-
100
200
300
400
500
600
700
10,000
10,500
11,000
11,500
12,000
12,500
13,000
2012 2013 2014 2015 2016
Production Consumption Supply Surplus

Tires and Natural Rubber
www.fpts.com.vn www.fpts.com.vn Bloomberg- FPTS <GO> | 7
1. The Global Rubber Value chain
a.1 Materials: This is the most critical part of the value chain with capital and land
investment being demanded on a long-term basis. This, accordingly, builds a
major barrier for any would-be entrepreneurs in this industry. Natural rubber trees
grow well primarily in tropical regions that feature the 4 factors as follows:
temperature of higher than 260C, an annual 1,800 mm of rain, humidity range of
well above 80%, 1-metre soil layer and elevation of lower than 300m. Business
efficiency is subject to the tapping productivity. At the present, 88.85% of the
world’s total natural rubber production comes from the 6 countries namely:
Thailand, Indonesia, Vietnam, China, India and Malaysia. These countries also
have the dominant acreage constituting 80-90% of the total globe’s land area.
a.2 Purchasing: This involves the transporting natural rubber from the plantations to
processing factories with profit margin being quite modest. Natural rubber are also
known to be a popular commodity frequently traded at world-renowned
commodities exchanges such as Tocom, Sicom, AFET, Malaysia, to name just a
few. Therefore, purchases will be made via these commodities exchanges with
intermediate traders taking part in or otherwise paid for by processing factories in
those countries. In addition, the Government of such countries will make purchase
of natural rubber and keep it in reserve as following their national policy to
stabilize prices.
Large holder (State-owned
corporation,
Government)
)
International
merchant Technical
rubber (block,
sheet)
Latex
processing
(liquid)
Processing Manufacturers Materials
Imported rubber
Smallholder (Private
companies,
households)
Purchasing
Collectors
Processing
companies
State-owned
corporation,
Government
Others
International
producers
Domestic
merchant
Domestic
producers
Synthetic rubber (Raw Oil)
Synthetic
rubber
(Butadiene,
Styrene,...)
Retails/Distribution
Distributors/St
ores
Retails chain
Import –
Export
companies
Industrial
manufacturers
Consumer petrochemical

Tires and Natural Rubber
www.fpts.com.vn www.fpts.com.vn Bloomberg- FPTS <GO> | 8
a.3 Processing: after being tapped, latex will be sent to processing factories to
manufacture mid-stream products available for related industries in the value
chain. Profit margin yielded from this stage secures a significant proportion of 21-
40% with the percentage varying depending on rubber’s seasonal prices.
However, experience shows that large-scale businesses are often owners of a
chain of materials and processing. Such profit margin is higher than that earned
from each segment of the chain separately. Typical products are latex concentrate
(for manufacture of pillows, mattress, and medical gloves); block rubber (for
manufacture of tires, conveyor belts, etc.)
a.4 Industrial manufacture: the added value is greater than that of the processing
segment. Processed rubber is used in this segment to produce consumer
products like: tires, gloves, mattress, condoms, conveyor belts, seat belts, shoes
and sporting equipment. This segment features some giant corporations namely
Michelin (France), Bridgestone (Japan), Top Gloves (Malaysia), Kossan
(Malaysia), Durex (USA), Trojan (USA), Bata Shoes (Thailand, Aquatex (USA),
etc.
Currently, tire industry is proved to be the largest consumption of natural rubber,
accounting for 65% of global consumption. Molding products and mattresses
occupy 17% and 11% respectively. With tire production playing the dominant role
in consumption of natural rubber, this industry is given top priority in this report.
Besides natural rubber, synthetic rubber is also known to be well consumed
worldwide (14.8 million tons) with consumption sometimes exceeding that of
natural rubber (11.1 million tons). As for synthetic rubber, the disparity in supply
and demand within the past 5 years has been so modest that it has managed to
sustain the supply and demand balance. Synthetic rubber is generated by
refineries and used together with natural rubber to manufacture tires and other
products.
Global natural rubber consumption’s
structure by product
Source: VRA
Global consumption Structure Global production Structure
Source: ANRPC, The Rubber Economist
36.7
8.5
8.1 6.2
4.7
4.6
31.3
China
India
US
Japan
Indonesia
Thailand
Others
34.4
25.6
7.9
7.1
7.0
6.9
11.2 Thailand
Indonesia
Vietnam
China
India
Malaysia
Others
65%
17%
11%5%
1% 1%
Tires
Molding products
Foam, Pillow, Packaging
Rubber tubes & Conveyor Belt
Shoes
Others

Tires and Natural Rubber
www.fpts.com.vn www.fpts.com.vn Bloomberg- FPTS <GO> | 9
a.5 Retailing: Finished products will be distributed to consumers or other
manufacturing factories as their input materials to make conveyor belts, curoa
bando or assembling automobiles.
As depicted above, the segments can be divided into 2 main groups with the Upstream group including materials and processing and the Downstream group involving manufacturing and consuming. Evidently, the Upstream group proves to earn more added value than the Downstream group.
2. Vietnam’s Natural Rubber Industry
Total rubber area reached 955,700 ha at the end of 2013, increasing by 4.1% yoy
(equivalent to 37,800 ha). The tapping area occupied 57% of total rubber area
equivalent to 545,600 ha. In the last 10 years, the CAGR of Vietnam’s rubber area
achieves 8.0% per year higher than the 7.4% of tapping area.
Besides, there is the new rubber area planted in Cambodia (89,000 ha) and Laos (28,000 ha) of Vietnam Rubber Group (VRG). In particular, Hoang Anh Gia Lai Corporation (HAG) planted by around 36,130 ha in these countries and about 29,500 ha rubber is underway in Gemadept Co. (GMD) in Cambodia. Moreover, there are a lot of unofficial statistic rubber areas planted by many other Vietnam’s companies across of Cambodia and Laos.
In 2013, total of rubber production of Vietnam is 949,100 tons, increasing by 8.2% yoy.
Last year, the Vietnam’s rubber yield reached the highest rate for the past 10 years of 1.74 tons/ha marking the 5 successive years having the yield above 1.7 tons/ha. Therefore, Vietnam officially surpassed India to make it to the top 3 of highest yield on the world.
Source: ANRPC, FPTS
Rubber plantation and Tapping Area Tapping volume and Tapping yield
483 522
556
631 678
749
834
911 956
334 356 373 399 422 439 472
506 546
-
200
400
600
800
1,000
1,200
2005 2006 2007 2008 2009 2010 2011 2012 2013
Total Plantation Tapping Area
29
1
31
3
29
8
36
4
41
9
48
2
55
5
60
2
66
0
72
4
75
2
81
2
86
4
95
0
1,25
1,30
1,23
1,36 1,39 1,44
1,56 1,61
1,65
1,72
1,71
1,72 1,71
1,74
-
0.20
0.40
0.60
0.80
1.00
1.20
1.40
1.60
1.80
2.00
-
100
200
300
400
500
600
700
800
900
1,000
2000 2002 2004 2006 2008 2010 2012
Tapping Volume Yield

Tires and Natural Rubber
www.fpts.com.vn www.fpts.com.vn Bloomberg- FPTS <GO> | 10
Natural Rubber plantation in Vietnam
South East area is considered as the largest rubber
region of Vietnam, occupying 56% of total rubber area
in Vietnam. It is followed by Highland, Central Coast
and the North.
Binh Phuoc and Binh Duong provinces have the
highest rubber yield in Vietnam. Binh Phuoc province
occupies about 22% of total nationwide rubber area
and nearly 36% of total rubber plantation of the South
East area.
Binh Duong province holds 18%, Tay Ninh province
takes up 10%, followed by Gia Lai and Dong Nai with
the rate of 11% and 6%, respectively. The highest
yield belongs to Binh Phuoc, Tay Ninh and Binh
Duong which reaches the average of 2 tons/ha higher
than the nationwide average yield of 1.74 tons/ha.
At the end of 2013, total rubber area of Vietnam
planted in Laos and Cambodia is 28,000 ha and
89,000 ha, respectively. In Laos, total rubber area
of Vietnam is located in the South region adjacent
to Quang Nam province, KonTum city, Hue city,
etc. Vietnamese enterprises and VRG in
particularly make an effort to plant rubber to reach
the area of 30,000 ha as permitted by Laos’s
Government before. In Cambodia, we plan to finish
planting a total of 100,000 ha in 2014.
Structure of Natural rubber plantation
Source: VRA, FPTS
Currently, HAGL is the private enterprise of Vietnam has the
largest rubber plantation in Laos and Cambodia with total area
of 36,130 ha located in Attepeu, Sekong and Ratanakiri
province.
(More details)
8.000 ha
5.000 ha
36.000 ha
25.300 ha
8.000 ha
7.600 ha
19.000 ha
38.400 ha
South East 535,514 ha 1.86 ton/ha
Central 140,775 ha 1.28 ton/ha
Highland 258,396 ha 1.56 ton/ha
North 25,102 ha
Kampongthom
SiemRiep
Ratanakiri
Kratie
Savanakhet
Sekong
Champasak
Attapeu
56%27%
15%3%
South East Highland Central Coast North
-
0.50
1.00
1.50
2.00
2.50
BinhPhuoc
Tay Ninh BinhDuong
DongNai
Gia Lai Daklak Averageof
Vietnam
Tapping yield by provinces in Vietnam
Source: VRA
Rubber area of VRG’s members and Hoang Anh Gia Lai Group
Tires and Natural Rubber
www.fpts.com.vn www.fpts.com.vn Bloomberg- FPTS <GO> | 11
317 364
422
490 522
560 604
612
667
714
796
-
100
200
300
400
500
600
700
800
900
1,000
2003 2004 2005 2006 2007 2008 2009 2010 2011 2012 2013
Supply Demand Supply Surplus
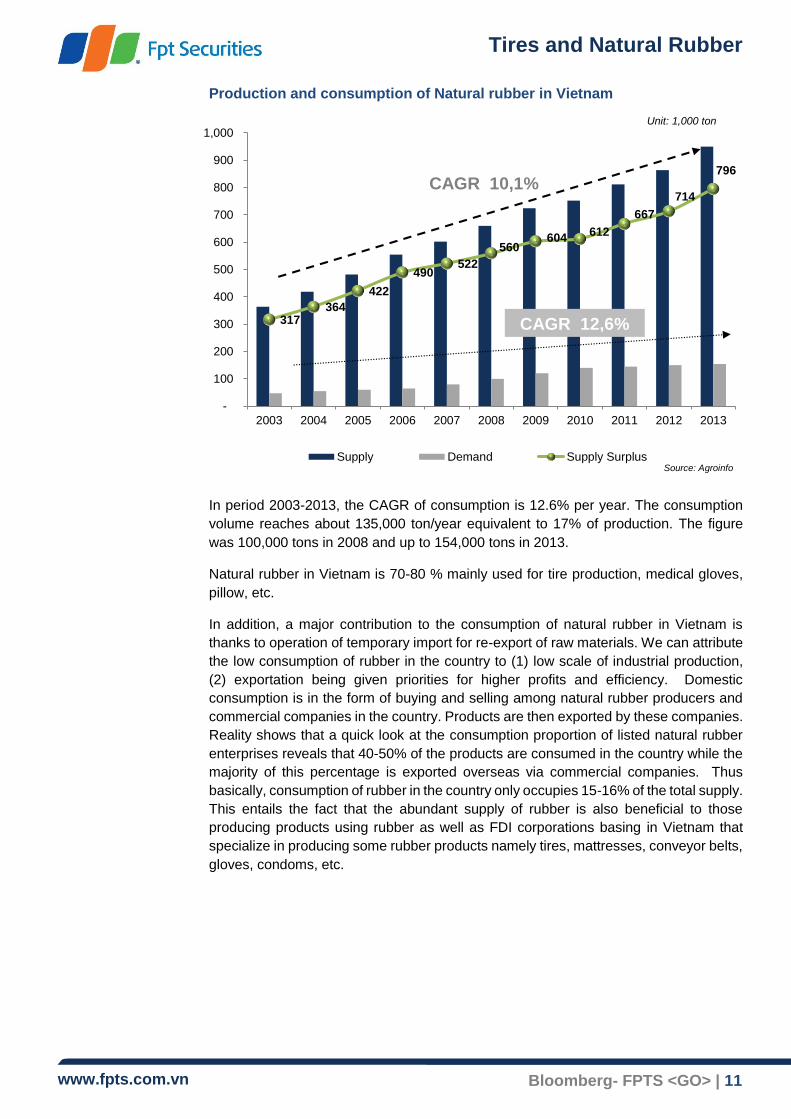
Production and consumption of Natural rubber in Vietnam
In period 2003-2013, the CAGR of consumption is 12.6% per year. The consumption
volume reaches about 135,000 ton/year equivalent to 17% of production. The figure
was 100,000 tons in 2008 and up to 154,000 tons in 2013.
Natural rubber in Vietnam is 70-80 % mainly used for tire production, medical gloves,
pillow, etc.
In addition, a major contribution to the consumption of natural rubber in Vietnam is
thanks to operation of temporary import for re-export of raw materials. We can attribute
the low consumption of rubber in the country to (1) low scale of industrial production,
(2) exportation being given priorities for higher profits and efficiency. Domestic
consumption is in the form of buying and selling among natural rubber producers and
commercial companies in the country. Products are then exported by these companies.
Reality shows that a quick look at the consumption proportion of listed natural rubber
enterprises reveals that 40-50% of the products are consumed in the country while the
majority of this percentage is exported overseas via commercial companies. Thus
basically, consumption of rubber in the country only occupies 15-16% of the total supply.
This entails the fact that the abundant supply of rubber is also beneficial to those
producing products using rubber as well as FDI corporations basing in Vietnam that
specialize in producing some rubber products namely tires, mattresses, conveyor belts,
gloves, condoms, etc.
CAGR 10,1%
CAGR 12,6%
Source: Agroinfo
Unit: 1,000 ton

Tires and Natural Rubber
www.fpts.com.vn www.fpts.com.vn Bloomberg- FPTS <GO> | 12
3. Value chain of Natural rubber industry of Vietnam
Materials and processing (Upstream) (Click here for more further details)
High profit margin: Dong Nai Rubber Corporation (26.8%), PHR (31%), DPR (41%), TRC (36%), Kuala Lumpur Kepong (20.6%); HwaFong Thai Rubber (24.5%).
Materials and processing: Natural rubber industry of Vietnam as well as the global is categorized into 2 groups namely Upstream and Downstream with the former including planting, exploiting and processing companies and the latter involving companies with industrial products such as tires and tube, gloves, mattresses, conveyor belts, etc. The downstream group, as comparable to the world’s, yields a greater number of products with higher added value than that of the upstream group. Reality shows that in Vietnam, large holder farmers and smallholder farmers takes up the share of rubber planting area of 53% and 47% respectively. On an annual basis, large corporations have to purchase rubber from these farmers for (1) the sufficiency of input rubber for processing and (2) the economic support for the local farmers as a policy implemented by the Province and the Government.
Nguồn: FPTS tổng hợp
Source: FPTS collected
Industrial products:
Chemical products:
Condom
Gloves
Others Consumer product: Balloon, Foam, Pillow, Toys, Shoes, ball, etc.
Rubber plantation
Distribution:
Direct export
Traders
Manufacturers
Others
SVR
Latex
Automobile
kits
Rubber band Rubber belt Curoa bando
Typical companies: Vu Minh, Vuong Hung, Giai Phong, Ruthimex
Tires
Tires for bicycle, motorcycle, truck, agriculture vehicle,OTR,etc.
Typical companies: DRC, CSM, SRC
Construction
materials
Rubber floor
Glue, rubber tubes, etc.
Typical companies: Giai Phong, Rubber No.75, Rubtechco
Conveyor belt
Rubber cover of Wire Conveyor belt, etc.
Typical companies:
BenThanh rubber,
Rubber No.75,etc.
Others
Rubber shoes Sport tools Others Typical companies: Doc Lap Co., GeruSport, Dong Luc Co., Ruthimex, etc.
Smallholder (individual-owned plantation, small private companies). Large holder (VRG, Joint stock Co.: Dau Tieng, Dong Nai, Hoang Anh Gia Lai Group, Phuoc Hoa, Dong Phu, Tay Ninh,etc.)
Materials Processing Industrial
Manufacture

Tires and Natural Rubber
www.fpts.com.vn www.fpts.com.vn Bloomberg- FPTS <GO> | 13
Large corporations in this upstream group are Dong Nai Rubber Corporation, Dau Tieng Rubber Co. Ltd., Phu Rieng Co. Ltd. and the 5 listed rubber companies namely PHR, DPR, TRC, HRC, TNC, etc. Besides, HAGL Corporation (HAG) also makes an investment of around 44,500 ha across the 3 countries of Vietnam – Laos – Cambodia. It is also known to have the largest privately owned rubber area in Vietnam up to now.
Distributing and commercial trading (Midstream) (Click here for more further details)
This group is reported to yield a rather modest and unstable profit margin of 1-5% with
the majority of money procured from production.
There are 2 basic procedures with (1) rubber processing and exploiting companies (Dau Tieng, Dong Nai, PHR, DPR, TRC, HAGL, etc.) selling their product directly to domestic customers or overseas and (2) commercial companies specializing in purchasing processed rubber to export thus making profit from price errors as well as typical companies among the top 50 in the industry (Binh Phuoc General Import and Export JSC, Viet Phu Thinh, Trung Chinh, Hoa Sen Vang, etc. ) Due to their typical commercial trading, corporations of group (2), without their own rubber plantations, are facing the risk of a heavy dependence on the market. Profits by and large are not stable.
Industrial production (Downstream)
A good amount of gross profit.
Purchased natural rubber is the input of manufacturing industrial products. In Vietnam, its main purpose is for production of tires (60-70% or production) with the remaining share going to medical gloves, mattresses, conveyor belts, etc. There are 29 tire manufacturing companies, 15 glove manufacturing companies and 6 mattress manufacturing companies and other miscellaneous products such as shoe soles, rubber bands, sporting balls, etc… within the nation. In terms of proportion of natural rubber production as well as industrial production corporation, tire manufacturing takes up the largest share. We, therefore, carried out an in-depth analysis of the tire industry in this report.
Gross profit margin by sectors
Company Tires Conveyor Belt Gloves Rubber shoes Condom
Domestic DRC: 21%; CSM: 19%; SRC: 14% BRC:23% NA NA NA
Foreign Michelin: 30.5%
Bridgestone: 33.6%
Apollo: 21-25%
Doublecoin:14.3%
Chengshin:20%
Kenda: 20-28%
Titan International: 14.3%
Somi Conveyor: 29%
Nippon conveyor: 16.3%
Top Glove: 17.6%
Kossan: 27-33%
Hartalega: 34.45%
Supermax: 20-30%
BataShoe
Thailand: 35%
Durex: 35%
Karex: 20.6%
Source: Bloomberg
Source: Vietnam Rubber Business Directory
Number of rubber product manufacturers in Vietnam Domestic Typical companies:
1. Tires: DaNang Rubber JSC. (DRC), Casumina
(CSM), Sao Vang Rubber JSC. (SRC),etc.
2. Conveyor Belt: Ben Thanh Rubber JSC.(BRC),
Rubber 17/05 Co,etc.
3. Gloves: VRG Khai Hoan, Showa Glove (Japan),
Nam Cuong, Nam Long,netc.
4. Condom: Merufa, Laprodex,etc
5. Foam, piilow: KymDan, Dong Phu Rubber (DPR),
Van Thanh, Lien A, etc.
6. Sports: Geru Star Sport, Dong Luc,etc.
0
5
10
15
20
25
30
35

Tires and Natural Rubber
www.fpts.com.vn www.fpts.com.vn Bloomberg- FPTS <GO> | 14
4. The position of Vietnam Natural rubber industry
In 2013, Vietnam was ranked the 5th all over the world with rubber planting area of
955,700 ha and surpassed Malaysia, India and China to take the third place in the world
in terms of rubber exploiting (949,100 tons). Exploiting productivity was 1.71 and 1.74
ton/ha in 2012 and 2013 respectively beating India to be among the top countries of
rubber exploiting worldwide.
Global natural rubber in 2013 was 11.5 mil tons with 88.85% acquired from the 6
following countries: Thailand (1.14 mil tons); Indonesia (3.08 mil tons), Vietnam (0.95
mil tons), China (0.86 mil tons), India (0.84 mil tons), Malaysia (0.83 mil tons). Vietnam,
together with the 3 neighboring countries Thailand, Indonesia, Malaysia is among the
top 4 leading exporter of natural rubber the world over with the total export volume being
85-93% of the global export volume (Thailand (3.66 mil tons), Indonesia (2.7 mil tons),
Malaysia (1.38 mil tons), Vietnam (1.07 mil tons). As for Vietnam, export volume
increases by 24.4% yoy. Favorable climate, soil and agricultural advantages as well as
seed researching projects also enable the 6 countries to secure the leading positions in
the world in terms of area, exploitation and export volume over the decade.
Top 6 countries of Natural rubber in the world in 2013
Top 5 of natural rubber producers in the world Top 5 of natural rubber exporters in the world
Source: ANRPC
Source: ANRPC
3.428 3.492
1.167
1.057 956
776
4.170
3.180
856 826 949
849
1,72
1,10 1,25
1,40
1,74
1,64
0.00
0.20
0.40
0.60
0.80
1.00
1.20
1.40
1.60
1.80
2.00
-
500
1,000
1,500
2,000
2,500
3,000
3,500
4,000
4,500
Thailand Indonesia China Malaysia Vietnam India
To
n/h
a
Th
ou
san
d t
on
-h
a
Rubber area
Tapping Volume
Tapping Yield
36%
27%
7%
7%
8%
14%
Thailand
Indonesia
Malaysia
India
Vietnam
Others
41%
30%
15%
12%2%
Thailand
Indonesia
Malaysia
Vietnam
Others

Tires and Natural Rubber
www.fpts.com.vn www.fpts.com.vn Bloomberg- FPTS <GO> | 15
5. The difference in the natural rubber operating process among Vietnam and
the 3 neighboring countries Thailand, Malaysia and Indonesia
Management
Currently, the rubber industry of Vietnam has yet to be under any direct management
of the State, which reflects the difference from other neighboring countries. Meanwhile,
the rubber industry of the 3 aforementioned countries is governed by the General
Department of Rubber or other institutes for this industry of its own. In Vietnam, it is
misunderstood that Vietnam rubber group (VRG) is the representative organization of
the State while in truth, VRG is only a state-owned corporation as well as a holder of
the majority of shares. VRG does not constitute a governmental management of the
domestic rubber industry. The natural rubber industry of Vietnam is in fact just under
the Ministry of Agriculture and only by the Department of Agricultural and Forestry
Products Processing has the natural rubber industry of Vietnam as well as other
produce been governed so far. Consequently, there exists no separate structural
governance of the industry itself which inevitably leads to the lack of harmony in
planning areas of rubber plantation nationwide as well as distributing and assessing
rubbery products within regions and overseas. (Click here for more details)
Quality
Smallholder farmers, known to constitute a hefty 47% of total rubber plantation
nationwide, fails to closely observe every regulation and standard of rubber processing
workflow and sustain the required quality. Reality shows that, privately-owned
organizations are prone to cut out the quality control stage to lower cost unless there is
a request of quality certificates from their foreign importers. Consequently, the inequality
of quality of domestic and exported rubbery products, to some extent, has destroyed
the reputation of Vietnam’s Rubber Industry, thus bringing down the price of exported
rubber which is usually lower than that of Thailand, Malaysia and Indonesia.
(Click here for more details)
Natural Rubber structure by owner of Top 4 countries
Source: FPTS’s data
0 0.2 0.4 0.6 0.8 1
Thailand
Indonesia
Malaysia
Vietnam
Largeholder (state-owned or private)
Smallholder

Tires and Natural Rubber
www.fpts.com.vn www.fpts.com.vn Bloomberg- FPTS <GO> | 16
Unit: 1,000 ton
Flag Country Production Consumption Export Import
Thailand 4,170 519 3,664 0.9
Indonesia 3,180 603 2,719 26
Malaysia 826 456 1,380 955
Vietnam 950 155 1,076 280
India 849 953 26 292
China 856 4,150 15 3,701
Others 675 4,293 - -
Global 11,505 11,128 - -
Source: ANRPC
Exploiting productivity
One more favorable feature of the natural rubber industry of Vietnam than the other 3
countries is the fair balance in ownership between smallholder and large holder farmers
(47%-53%). The percentage of smallholder farmers is by contrast 85% and 90% for
Indonesia and Thailand, irrespectively. Vietnam is also ranked among the top 3 in the
world for the invention of new seeds of high quality every year.
What’s more, large rubber plantation of VRG corporation also fosters the pilot planting
of new seeds and popularizes it to smallholder farmers. This, if successful, can shorten
the usual time spent of new seed pilot planting and simultaneously enhance the
productivity over the country. Today, Vietnam is still among the group of countries with
the highest rubber’s exploiting productivity all over the globe (the average figure is
above 1.7 ton/ha for the past 3 years). (Click here for more details)
Tires and Natural Rubber
www.fpts.com.vn www.fpts.com.vn Bloomberg- FPTS <GO> | 17
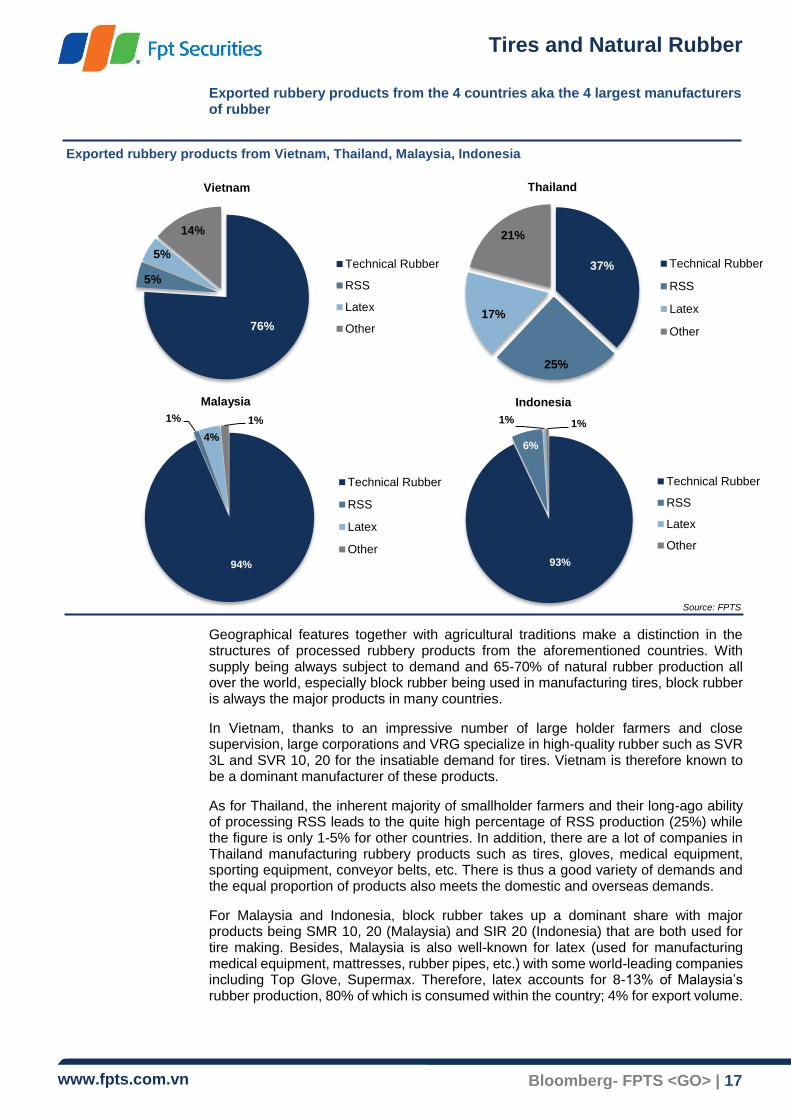
Exported rubbery products from the 4 countries aka the 4 largest manufacturers of rubber
Geographical features together with agricultural traditions make a distinction in the structures of processed rubbery products from the aforementioned countries. With supply being always subject to demand and 65-70% of natural rubber production all over the world, especially block rubber being used in manufacturing tires, block rubber is always the major products in many countries.
In Vietnam, thanks to an impressive number of large holder farmers and close supervision, large corporations and VRG specialize in high-quality rubber such as SVR 3L and SVR 10, 20 for the insatiable demand for tires. Vietnam is therefore known to be a dominant manufacturer of these products.
As for Thailand, the inherent majority of smallholder farmers and their long-ago ability of processing RSS leads to the quite high percentage of RSS production (25%) while the figure is only 1-5% for other countries. In addition, there are a lot of companies in Thailand manufacturing rubbery products such as tires, gloves, medical equipment, sporting equipment, conveyor belts, etc. There is thus a good variety of demands and the equal proportion of products also meets the domestic and overseas demands.
For Malaysia and Indonesia, block rubber takes up a dominant share with major products being SMR 10, 20 (Malaysia) and SIR 20 (Indonesia) that are both used for tire making. Besides, Malaysia is also well-known for latex (used for manufacturing medical equipment, mattresses, rubber pipes, etc.) with some world-leading companies including Top Glove, Supermax. Therefore, latex accounts for 8-13% of Malaysia’s rubber production, 80% of which is consumed within the country; 4% for export volume.
Thái Lan
Indonesia
Malaysia Indonesia
Thailand Vietnam
Source: FPTS
Exported rubbery products from Vietnam, Thailand, Malaysia, Indonesia
76%
5%
5%
14%
Technical Rubber
RSS
Latex
Other
37%
25%
17%
21%
Technical Rubber
RSS
Latex
Other
93%
6%
1% 1%
Technical Rubber
RSS
Latex
Other
94%
1%
4%
1%
Technical Rubber
RSS
Latex
Other
Tires and Natural Rubber
www.fpts.com.vn www.fpts.com.vn Bloomberg- FPTS <GO> | 18
6. Exporting – Importing of natural rubber of Vietnam
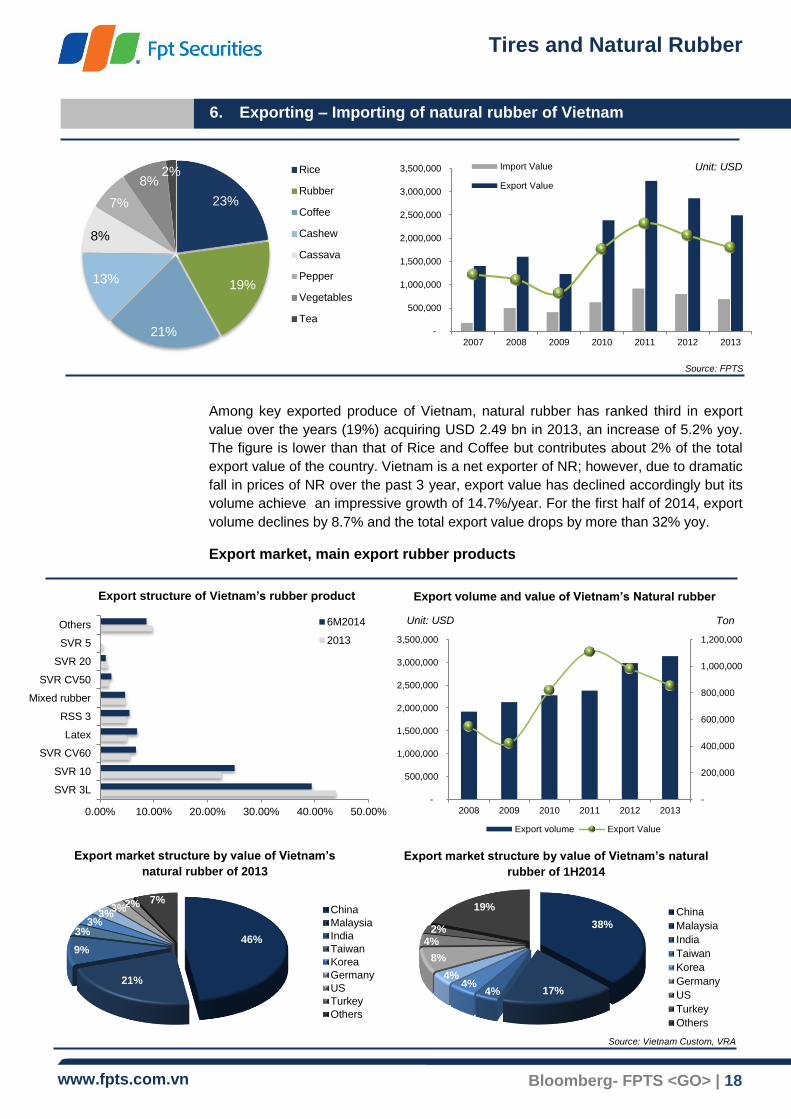
Among key exported produce of Vietnam, natural rubber has ranked third in export
value over the years (19%) acquiring USD 2.49 bn in 2013, an increase of 5.2% yoy.
The figure is lower than that of Rice and Coffee but contributes about 2% of the total
export value of the country. Vietnam is a net exporter of NR; however, due to dramatic
fall in prices of NR over the past 3 year, export value has declined accordingly but its
volume achieve an impressive growth of 14.7%/year. For the first half of 2014, export
volume declines by 8.7% and the total export value drops by more than 32% yoy.
Export market, main export rubber products
Unit: USD
Export structure of Vietnam’s rubber product Export volume and value of Vietnam’s Natural rubber
Export market structure by value of Vietnam’s
natural rubber of 2013
Export market structure by value of Vietnam’s natural
rubber of 1H2014
Source: Vietnam Custom, VRA
Source: FPTS
Ton Unit: USD
23%
19%
21%
13%
8%
7%
8%2% Rice
Rubber
Coffee
Cashew
Cassava
Pepper
Vegetables
Tea -
500,000
1,000,000
1,500,000
2,000,000
2,500,000
3,000,000
3,500,000
2007 2008 2009 2010 2011 2012 2013
Import Value
Export Value
0.00% 10.00% 20.00% 30.00% 40.00% 50.00%
SVR 3L
SVR 10
SVR CV60
Latex
RSS 3
Mixed rubber
SVR CV50
SVR 20
SVR 5
Others 6M2014
2013
-
200,000
400,000
600,000
800,000
1,000,000
1,200,000
-
500,000
1,000,000
1,500,000
2,000,000
2,500,000
3,000,000
3,500,000
2008 2009 2010 2011 2012 2013
Export volume Export Value
46%
21%
9%
3%3%
3%3%2% 7%
China
Malaysia
India
Taiwan
Korea
Germany
US
Turkey
Others
38%
17%4%4%
4%
8%
4%2%
19% China
Malaysia
India
Taiwan
Korea
Germany
US
Turkey
Others

Tires and Natural Rubber
www.fpts.com.vn www.fpts.com.vn Bloomberg- FPTS <GO> | 19
In 2013, NR of Vietnam has been exported to more than 72 markets, 97,6% of which are major markets including the leading market in China (511,448 tons) accounting for 47.5% which is of the same volume in 2012 but a slight decrease compared to the 61% market share in 2011. Export value of NR in China also reduced from 59% in 2011 to 46% in 2013. Malaysia market ranks the second (acquiring 227,159 tons, a proportion of 21.1% higher than the figure of 19.6% in 2012) followed by India with a volume of 88,178 tons, attaining 8.2% compared to 7% in 2012. What caused the decrease of export market share to China is the restructuring and diversification of export markets of VRG for the sake of being less dependent upon the China market. This approach has enabled Vietnam NR industry to keep the output risk to a minimum and to encourage the flexibility needed in exporting practices and at the same time extending the customer base. Such was a great global demand for rubber that not resorting to a few particular markets will surely improve export volume and growth.
Export market of Natural rubber of 1H2014
Market 6M2014 % YoY
Volume (Ton)
%Proportion Value (1,000 USD)
Volume Value
China 138,542 39.7% 247,840 -23.6% -42.6%
Malaysia 64,624 18.5% 112,296 -13.4% -41.3%
India 24,998 7.2% 49,658 +23.9% -10.4%
Korea 14,921 4.3% 28,960 -0.4% -23.8%
US 12,987 3.7% 24,194 +19.1% -9.3%
Germany 11,618 3.3% 24,870 -12.3% -32.9%
Taiwan 10,935 3.1% 23,013 -18.4% -40.6%
Turkey 8,398 2.4% 16,154 +18.8% -9.4%
Others 61,584 17.8% 125,255 - -
Total 348,607 100% 652,241 -8.7% -32.2%
Adopting such an approach, VGR have experienced a dramatic change in export NR for the first 6 months of this year with export volume to China dropping by 23.6% and export value reducing by 42.6%. Export value to China now takes up a proportion of only 39.7% whereas the percentage substantially increases in some markets like India (by 23.9%), USA (19.1%), and Turkey (18.8%) yoy.
Tires and Natural Rubber
www.fpts.com.vn www.fpts.com.vn Bloomberg- FPTS <GO> | 20
Vietnam’s import market of Natural rubber (NR) and its products
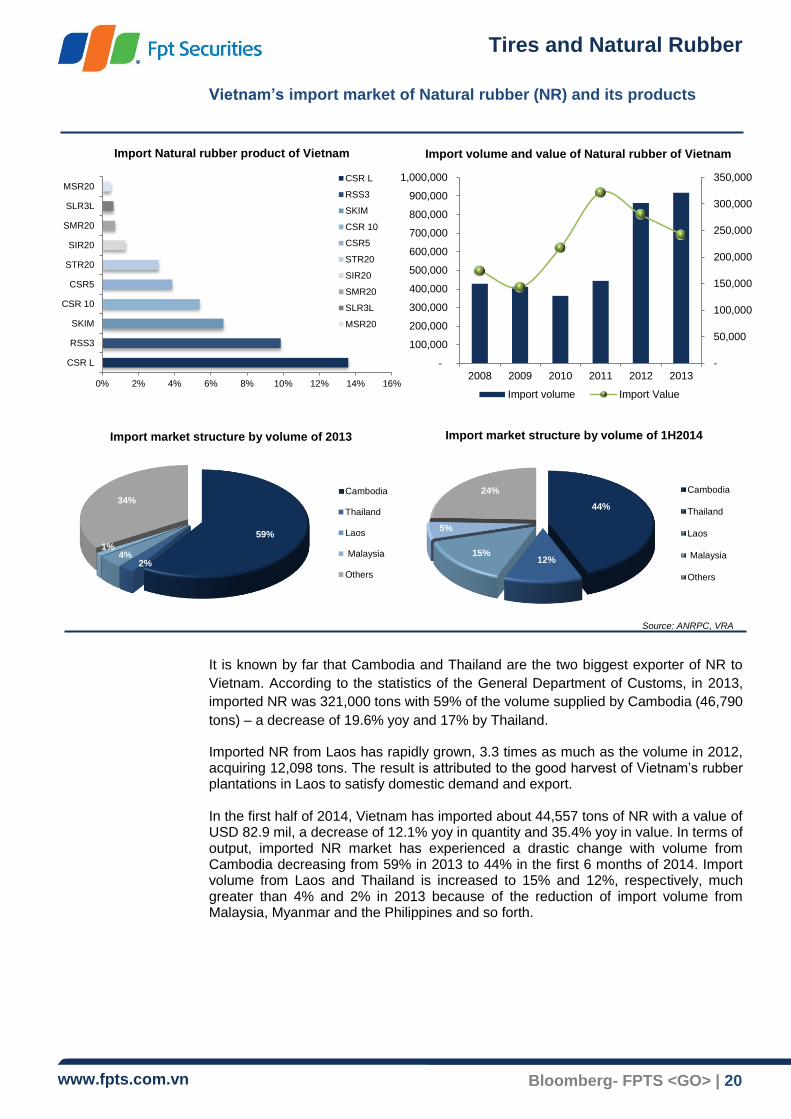
It is known by far that Cambodia and Thailand are the two biggest exporter of NR to
Vietnam. According to the statistics of the General Department of Customs, in 2013,
imported NR was 321,000 tons with 59% of the volume supplied by Cambodia (46,790
tons) – a decrease of 19.6% yoy and 17% by Thailand.
Imported NR from Laos has rapidly grown, 3.3 times as much as the volume in 2012, acquiring 12,098 tons. The result is attributed to the good harvest of Vietnam’s rubber plantations in Laos to satisfy domestic demand and export. In the first half of 2014, Vietnam has imported about 44,557 tons of NR with a value of USD 82.9 mil, a decrease of 12.1% yoy in quantity and 35.4% yoy in value. In terms of output, imported NR market has experienced a drastic change with volume from Cambodia decreasing from 59% in 2013 to 44% in the first 6 months of 2014. Import volume from Laos and Thailand is increased to 15% and 12%, respectively, much greater than 4% and 2% in 2013 because of the reduction of import volume from Malaysia, Myanmar and the Philippines and so forth.
CSR L
RSS3
SKIM
CSR 10
CSR5
STR20
SIR20
SMR20
SLR3L
MSR20
0% 2% 4% 6% 8% 10% 12% 14% 16%
CSR L
RSS3
SKIM
CSR 10
CSR5
STR20
SIR20
SMR20
SLR3L
MSR20
Import Natural rubber product of Vietnam Import volume and value of Natural rubber of Vietnam
Import market structure by volume of 1H2014 Import market structure by volume of 2013
Source: ANRPC, VRA
-
50,000
100,000
150,000
200,000
250,000
300,000
350,000
-
100,000
200,000
300,000
400,000
500,000
600,000
700,000
800,000
900,000
1,000,000
2008 2009 2010 2011 2012 2013
Import volume Import Value
59%
2%4%
1%
34%Cambodia
Thailand
Laos
Malaysia
Others
44%
12%15%
5%
24% Cambodia
Thailand
Laos
Malaysia
Others
Tires and Natural Rubber
www.fpts.com.vn www.fpts.com.vn Bloomberg- FPTS <GO> | 21
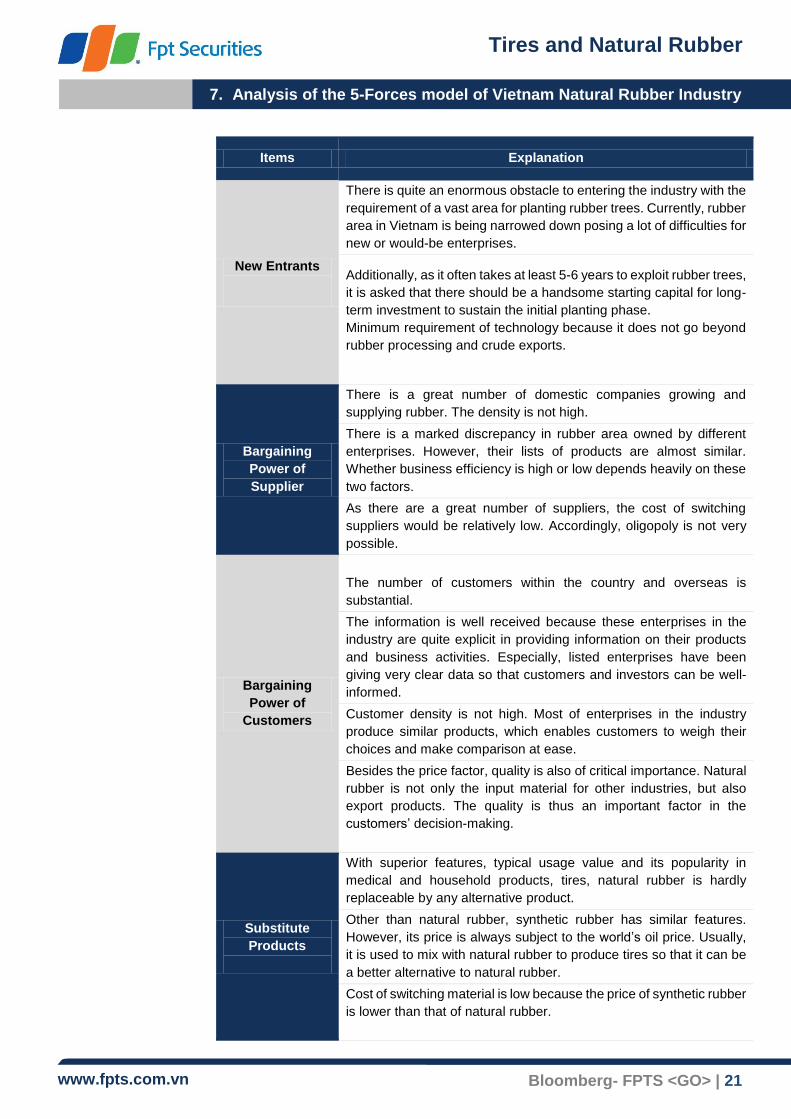
7. Analysis of the 5-Forces model of Vietnam Natural Rubber Industry
Items Explanation
New Entrants
There is quite an enormous obstacle to entering the industry with the
requirement of a vast area for planting rubber trees. Currently, rubber
area in Vietnam is being narrowed down posing a lot of difficulties for
new or would-be enterprises.
Additionally, as it often takes at least 5-6 years to exploit rubber trees,
it is asked that there should be a handsome starting capital for long-
term investment to sustain the initial planting phase.
Minimum requirement of technology because it does not go beyond
rubber processing and crude exports.
Bargaining
Power of
Supplier
There is a great number of domestic companies growing and
supplying rubber. The density is not high.
There is a marked discrepancy in rubber area owned by different
enterprises. However, their lists of products are almost similar.
Whether business efficiency is high or low depends heavily on these
two factors.
As there are a great number of suppliers, the cost of switching
suppliers would be relatively low. Accordingly, oligopoly is not very
possible.
Bargaining
Power of
Customers
The number of customers within the country and overseas is
substantial.
The information is well received because these enterprises in the
industry are quite explicit in providing information on their products
and business activities. Especially, listed enterprises have been
giving very clear data so that customers and investors can be well-
informed.
Customer density is not high. Most of enterprises in the industry
produce similar products, which enables customers to weigh their
choices and make comparison at ease.
Besides the price factor, quality is also of critical importance. Natural
rubber is not only the input material for other industries, but also
export products. The quality is thus an important factor in the
customers’ decision-making.
Substitute
Products
With superior features, typical usage value and its popularity in
medical and household products, tires, natural rubber is hardly
replaceable by any alternative product.
Other than natural rubber, synthetic rubber has similar features.
However, its price is always subject to the world’s oil price. Usually,
it is used to mix with natural rubber to produce tires so that it can be
a better alternative to natural rubber.
Cost of switching material is low because the price of synthetic rubber
is lower than that of natural rubber.

Tires and Natural Rubber
www.fpts.com.vn www.fpts.com.vn Bloomberg- FPTS <GO> | 22
Intensity of
Rivalry
Added value of the industry is still low with most of it being yielded
from crude rubber export.
There is a minor difference in the products of various corporations in
the industry because the manufacturing process is similar so that it
is each company’s technology and experience that could make a
difference.
The selecting process is now going on mainly among smallholder
farmers. Because of large investment but low sales price, some
smallholder farmers have got rid of rubber trees to grow other
produce. However, this happens only in a small scale with little harm
to the industry.
Regulations on the floor price: the possibility of floor price imposition
is quite high and this depends on the decisions of VRG for the
purpose of maintaining a profitable margin and avoiding dumping
products among members in the industry. As for the price, most of
Vietnam’s rubber products are charged according to the world’s price
especially Malaysia, Thailand and Indonesia.
8. Policies related to Natural Rubber
Decision No. 1003 / QD-BNN-CB by the Ministry of Agriculture and Rural
Development Ministry of Finance decided to reduce export taxes for rubber products. Exemption from corporate income tax for individuals, households and rubber Establishment of rubber triangular area in Indochina
Decision 1003/QD-BNN-CB by the Ministry of Agriculture and Rural Development According to Decision 1003 / QD-BNN-CB by the Ministry of Agriculture and Rural
Development, signed on dated 13th May, 2014, government decided to raise added
values of agricultural, forestry and fisheries sector in processing and reduce post-
harvest losses. (More details)
Ministry of Finance decided to reduce export taxes for rubber products
The Ministry of Finance issued Circular No 111/2014 / TT-BTC in order to amend the
export tax rate for some rubber goods in group 40.01, 40.02, 40.05, stipulated in the
Export Tariff issued together with Circular No. 164/2013 / TT-BTC to 0 percent, and has
been applicable since 2nd, October 2014. (More details)
Exemption of personal income tax for rubber households and individuals
Deputy Minister of Finance, Mr. Tuan Hoang Anh Do has sent documents to Taxation
Department of the province or city, which is under Central Government to conduct about
income tax exemption for families and individuals, who plant rubber trees.
(More details)
Establishment of rubber triangular area in Indochina
To ensure sustainable development for the sector, Vietnam Rubber Group (VRG) has
been developed to promote cooperation of rubber plantation in Laos (30,000 hectares)
and Cambodia (100,000 hectares), in order to form triangular zones Indochinese with
development orientation becoming the world's largest rubber area. (More details)

Tires and Natural Rubber
www.fpts.com.vn www.fpts.com.vn Bloomberg- FPTS <GO> | 23
9. Natural rubber industry outlook (NR)
Up to now, Natural Rubber Industry has observed a gradual decrease of rubber
price. From early this year, many supportive measures made from Thailand,
Malaysia and Indonesia such as export output cuts; limit of tapping volume in order
to reduce the supply volume. Vietnam reduce the export tax of rubber from 3% and
5% down to 0%; reschedule and restructure debt of NR export companies in trouble.
However, there is no prosperity of the rubber industry in nationwide and worldwide. At present, there is an inconsistency of the rubber master planning all over the world. So it is the reason for a strong oversupply of natural rubber from now to 2016.
In the period of 2007-2009, a lot of countries all over the world plant rubber because of very high rubber price. It makes the rubber plantation increase quickly. All of them are matured from now to 2016 and it will dramatically increase the supply. This is the main reason for price decline over the past 2 years and it puts the global rubber industry into trouble.
Global market
Under forecast of The Rubber Economist Ltd., the supply surplus will be 651,000 ton higher than the 640,000 tons of 2013 (+1,7%yoy) whereas forecast consumption volume increases about 2% yoy. It shows that the recovery for rubber price is unlikely to happen this year. In addition, the gap between supply and demand continues tobe high until 2016: 483,000 tons (2015) and 316,000 tons (2016).
Besides, according to the forecast of global HSBC, the demand of truck tires increases by 5.5% yoy (2014) and 5.7% (2015) higher than the rate 3.8% of PC and light truck tires (2014) and 4% (2015). This suggests that there is a recovery in demand for tires production. Nevertheless, the high supply surplus until 2016 will control the rising of rubber price. So it will be a slow recovery.
In addition, the global rubber storage reserves continue to increase. By the Rubber Economist Ltd., the reserve will reach 3.79 million tons at the end of 2014 and up to 4.33 million tons in 2015. The number of reserve month will rise from 2 months (2013) up to 4 months in 2016. We consider that the natural rubber industry continue to get into trouble for the next 2 years.
Domestic market
In our opinion, Vietnam is not out of difficult situation of the world. Because rubber is the commodity type so every country in the world will be affected similarly. Under the direction of the State and Vietnam Rubber Group (VRG), we have been diversifying the structure of export market to avoid depending on unique market like China before. It helps to reduce the risk for export activities of Vietnam rubber industry. Recently, VRG has been entering into a partnership with Japanese partners including: JTC Corporation and Shinichi Kato Officer to purchase natural rubber of Vietnam annually. Those partners are professional rubber trader for many famous Japan tire manufacturers such as: Bridgestone, Yokohama, etc. This is the positive factor to export natural rubber of Vietnam for the next years.
However, the efficiency is still the price of rubber. As discussed above, it completely depends on supply and demand of the world. We think that the rubber companies continue to face to the industrial difficulty for this year and 2015.
Domestic Consumption Forecast: We consider that the domestic demand of natural rubber will increase when VRG invest to expand the capacity of glove

Tires and Natural Rubber
www.fpts.com.vn www.fpts.com.vn Bloomberg- FPTS <GO> | 24
factory of VRG Khai Hoan Company from 1.2 billion units/year to 3.2 billion units/year. In addition, two all-steel radial tire factories of DRC and CSM came into operation with the capacity of the 1st phase are 300,000 units/year and 350,000 units/year, respectively and up to 600,000 units/year and 1,000,000 units/year several next years. Moreover, in 2015, the factory of Kumho Tire (capacity of 3.15 million units/year up to 6.3 million unit/year) and the factory of Bridgestone (capacity of 24,700 – 49,000 units/day) will be in operation. The fact that the tires and gloves manufacture uses about 70-80% of total domestic consumption of NR shows that the aforementioned new factories will help to boost the local demand of NR in coming years. According to our estimation, total increased volume of NR will be around 433,000 tons. It helps Vietnam’s rubber companies increase the sale volume for domestic market and improve the added value for Vietnam rubber products. That the reason why we focus to analyze the tire segment which is one of the sectors of rubber industry’s value chain.
II. Tire Industry
1. Overview of global tire industry
The global tire industry is divided into 2 types of tires for Original Equipment Manufacturer (OEM – occupies 25-27%) and Replacement tires (around 73-75%).
The famous tire companies always research and develop new products with high technology, extreme quality and high profit margin such as semi-steel and all-steel radial tires for trucks, aircraft, luxury passenger car, etc. The small companies focus on niche market with lower profit margin such: motorcycle tires, bicycle tires, rubber’s spare parts, etc.
In tire industry, the product is divided into 3 types basing on quality and brand. Tier 1 is about famous brand, high-quality such as: Bridgestone, Michelin, Goodyear, Continental, Pirelli, etc. ; Tier 2 is middle-class brand such as: Kumho, Yokohama, Hankook, Apollo, etc. Tier 3 is acceptable products such as: Inoue, Chengshin, Double Coin, Kenda, etc.
Tires market share by country Tires market share by brand
Source: Tire Business, FPTS
23.9%
14.2%
13.5%13.1%
6.0%
5.8%
5.2%
4.5%3.6%
1.0% 9.2%Japan
France
China
US
Korea
Germany
India
Italy
Taiwan
Finland
Others
15.3%
14.2%
10.1%
5.8%4.1%4.1%
3.3%
3.0%
2.5%
2.4%2.2%
1.9%
1.5%
30%
Bridgestones
Michellin
GoodYear
Continental
Sumitomo
Pirelli
Hankook
Yokohama
Maxxis
HangZhou Zhongce
Cooper Tire
Kumho
Toyo
Others

Tires and Natural Rubber
www.fpts.com.vn www.fpts.com.vn Bloomberg- FPTS <GO> | 25
The revenue of tier 1 group occupies 53% of global market share. Accordingly,
Bridgestone achieve the best seller for 5 consecutive years with the market share of
15%, followed by Michelin (14%) and Goodyear (10%), 60% of remains.
70% of market share is occupied by Japan (23.9%); France (14.2%); USA (13.1%);
China (13.5%).
Production and consumption
As categorized by regions: according to the statistics from LMC, China is now topping
the world in production of tires for passenger cars, light trucks and heavy trucks making
up for 27% of the total production of tires globally equal to 501 mil tires in 2013. The
USA and Japan are the second and the third largest producers with market share of
11% and 10% respectively. China also tops the list of countries with the highest
consumption of tires for heavy trucks with 34% equal to 51 mil tires in 2013, followed by
the USA (16%), Japan (5%), Germany (6%). The USA, on the other hand, dominates
the market of tires for passenger cars and light trucks with 22% equal to 316 mil tires in
2013, followed by China (14%) and Japan (8%).
Speaking of tire production, Asian countries supply up to 60-61% of the total volume
globally equal to 1.02 bn tires in 2013. The European countries, by comparison, only
account for 19%, equal to 317 bn tires, followed by North America, the USA and the
Africa with 11.5%, 6.5% and 1.5%, respectively.
Top 20 of tires manufacturers of the world (by sales)
Source: Tire Business, FPTS
Unit: million USD
-
5,000
10,000
15,000
20,000
25,000
30,000
35,000

Tires and Natural Rubber
www.fpts.com.vn www.fpts.com.vn Bloomberg- FPTS <GO> | 26
As categorized by consumption volume: Consumption volume of Asia, Europe and
North America takes up a share of 86% of global consumption with Asia consuming
540 mil tires (36%), Europe using 383 mil tires (25%), North America consuming 192
mil tires (24%). The remainder of 14% is distributed to South America, Africa and the
Middle East.
As categorized by products: According to the statistics, the segment for passenger
cars, light trucks constitutes about 87-89% of global volume with the remaining 11-
13% is of tires for heavy trucks and buses.
Car tires production
Heavy truck proportion
Light truck and passenger car tires (< 9 seats)
Source: HSBC Global
Source: FPTS
60%25%
15%
Light Truck and Passenger Car (< 9 seats)
Heavy Truck and Passenger Car (> 9 seats)
Others

Tires and Natural Rubber
www.fpts.com.vn www.fpts.com.vn Bloomberg- FPTS <GO> | 27
Based on the scale of global tire sales, tires for passenger cars (<=9 seats) and light
trucks takes the share of up to 60%, the remainder is divided into the group of heavy
trucks, buses and passenger cars (>9 seats) (25%) and that of specialty tires such as
agricultural tires, aircraft tires, solid tires (15%).
As categorized by purposes of usage: Replacement market achieves a dominant
proportion of 73-75% whereas OEM only occupies 25-27% of consumption products.
Supplies of tires for passenger cars (<=7 seats), light trucks have always exceeded
demands by 5% for the past 5 years. For tires for heavy trucks and buses, supplies are
outstripping demand by 17%.
As categorized by types – Bias vs Radial:
Radial tires are now dominating global demands being used by 92% of passenger cars
and light trucks; 53% of heavy trucks. Especially in North America, 96% of vehicles use
Radial tires, 72% in Africa and Middle East, and 79% in Europe. Particularly in Asia
Pacific including frontier and developing countries, the need for switching from Bias to
Radio tires is on the increase. The current proportion of them both is 52% (Radial) and
48% (Bias). In the near future, Radial tires are expected keep exceeding Bias tires and
Tires production and consumption for
light vehicle
Tires production and consumption for
heavy vehicle
Source:: LMC
Source: HSBC Global
23% 23%36%
24%14%
77% 77%64%
76%86%
0%
20%
40%
60%
80%
100%
120%
Europe North ofAmerica
Asean South ofAmerica
Africa
Replacement OEM
OEM27%
Replacement73%
-
200
400
600
800
1,000
1,200
1,400
1,600
2009 2010 2011 2012 2013
Production Consumption
-
20
40
60
80
100
120
140
160
180
200
2009 2010 2011 2012 2013
Production Consumption

Tires and Natural Rubber
www.fpts.com.vn www.fpts.com.vn Bloomberg- FPTS <GO> | 28
maintain the stable growth corresponding with the economy well-being and the
infrastructure development in such countries.
2. The Tire industry in Vietnam
According to the statistics from Vietnam Rubber Association, our country has 830
entrepreneurs specializing in the tire industry including 30 tire-manufacturing
companies, 17 large-scale tire-manufacturing factories, 170 tire-trading companies, 170
exporters and 460 importers of all size. In 2013, there were 23.3 mil tires for bike, 30
mil tires for motorbikes and 6.3 mil tires for automobiles of all types manufactured.
Noticeably, there were well above 5.4 mil car tires exported from FDI companies like
Kumho, Chengshin, Kenda, Yokohama, etc.).
The domestic consumption of tires is now obviously heavy with 24 mil tires for bike, 37.5
mil for motorbikes and 5 mil for automobiles. Statistics show that there is a stable
balance between supply and demand with the market being saturated. Tires for
motorbike, on the other hand, are insufficient considering its capacity to satisfy only 80%
of the demand. With the segment of tires for motorbikes, domestic entrepreneurs are
only able to share the market of replacement tires rather than OEM which is almost
monopolized by FDI companies or imported brand-new motorbikes. As for automobile
tires, despite the massive domestic production volume, 80-90% of the products are for
exportation. Thus, the remaining production volume only satisfies 20-27% (radial) and
67% (Bias) of the domestic market. This suggests the unfulfilled potential of the
domestic tire market.
Additionally, as stated by many analysts, the rate of cars owned per 1,000 people in
Vietnam is still modest (17.8 cars/1,000 people) as compared to neighboring countries.
The rate is 77.7 in Thailand, 48.3 in Indonesia, 341 in Malaysia, 30 in the Philippines.
As said by AFTA convention, import tax rate for automobiles will plunge to 0% in 2018
onwards. With improved living standard and better transport infrastructure, more
Vietnamese consumers are believed to be more accessible to automobiles, thus
increasing the rate of owned automobiles. In the long run, it is firmly believed that there
is an ensured growth in replacement tires in supply for the increased number of cars
and current ones within the country.
Bias and Radial tires consumption structure by continents
Source: LMC
52%
96% 95%
65%
100%
80%72%
48%
4% 5%
35%20%
28%
0%
20%
40%
60%
80%
100%
120%
Asean Pacific North ofAmerica
South ofAmerica
Latin America West ofEurope
East ofEurope
Africa andCentral
Bias Radial

Tires and Natural Rubber
www.fpts.com.vn www.fpts.com.vn Bloomberg- FPTS <GO> | 29
Domestic tire market share
In the domestic market, the 5 corporations namely Bridgestone (import), Michelin
(import), Danang rubber, Casumina, and Yokohama account for 61% of the market of
automobile tires. The remaining percentage is shared by other private domestic
entrepreneurs, FDI and other importers. Speaking of tires of all kinds consumed,
Casumina dominates the domestic market with 33% followed by DRC (25%), and SRC
(10%) and other companies (31%).
-10,000
-
10,000
20,000
30,000
40,000
50,000
60,000
-100 0 100 200 300 400
19%
15%
13%
8%6%
5%
5%
2%
3%
4%
20%
Bridgestone
Michelin
DRC
CSM
Yokohama
Maxxis
Double Coin
Chengshin
Kumho
SRC
Others
33%
25%
10%
32%CSM
DRC
SRC
Others
Vehicle consumption per 1,000 people Vehicle ownership per 1,000 people
Vehicle ownership per 1,000 people
and GDP per capita
Number of large-scale tire
factories in the world
Source: WorldBank, Asean Automobile Federation, FPTS
Source: Tyre Business, FPTS
Truck-tire market share in Domestic Tires market share in Domestic market
158
59
22 21 17 15 9 6 2
0
20
40
60
80
100
120
140
160
180
- 10 20 30 40
Thailand
Indonesia
Malaysia
Phillipines
India
Vietnam
Singapore
Car
Motorcycle
0 100 200 300 400
Thailand
Indonesia
Malaysia
Phillipines
India
Vietnam
Singapore
Car
Motorcycle

Tires and Natural Rubber
www.fpts.com.vn www.fpts.com.vn Bloomberg- FPTS <GO> | 30
For Radial tires, FDI and importers claim to have 90% of market share. From 2014
onwards, all-steal Radial tires, however, are also manufactured by DRC and CSM with
their 2 factories with capacity of 600,000 tires/year and 1,000,000 tires/year,
respectively. At present, the two factories are having their phase 1 in progress which
expects to yield 300,000 tires/year and 350,000 tires/year. This segment is projected to
promise quite intense competition in the years to come.
Tire importation-exportation in Vietnam
In 2013, Vietnam’s tire export value is 363 mil USD, increasing by 8.1% yoy (335.7 mil
USD in 2012). For the past 3 years, export value has a CAGR of 8%/year. 2013 is the
fourth consecutive year when Vietnam has experienced exportation in surplus.
According to the statistics for the first 6 months of 2014, export value is 217 mil USD,
rising by 12.9% yoy. Net surplus in the first 6 months is 76.7 mil USD, 2.5 times as much
as the figure in the whole 2013 year. There is, thus, a tendency for exportation to
prosper this year.
Reality shows that the largest exporters of tires are still FDI corporations namely Kumho,
Chengshin, Chinh Tan, Kenda, Yokohama with 65% of export value. The three major
manufacturers of tires in Vietnam are DRC, CSM and SRC with 14% of export value.
As always, CSM is the largest exporter among the 3 listed corporations and ranks 67th
in revenue in the world scale according to 2013 statistics of Tire business.
Importation: For the past 3 years, export value has the CAGR of 18%. In the first 6 months of this year, tire export value of Vietnam is 140.57 mil USD, decreasing by 16% yoy.
Import – Export value of Tires in Vietnam
Source: VRA, Vietnam Custom, FPTS
309
336
363
217.25
239
327 332
140.57
0
10
20
30
40
50
60
70
80
90
0
50
100
150
200
250
300
350
400
2011 2012 2013 6M2014
Export Import Net Export

Tires and Natural Rubber
www.fpts.com.vn www.fpts.com.vn Bloomberg- FPTS <GO> | 31
Export market: in 2013, Vietnam’s rubbery products were exported to 115 countries.
The USA topped the export market with 62.5 mil USD (17.2%), followed by China with
39.2 mil USD (10.8%), Malaysia with 27.2 mil USD (7.5%), Japan with 19.6 mil USD
(5.4%), Arab with 17.1 mil USD (4.7%) and other 110 countries with 197 mil USD. These
percentage figures, however, went through some slight changes in the first 6 months
this year with Japan climbing to the highest of 11.2% (24.38 USD) and USA (10.4%)
and Malaysia (7.9%).
In terms of production volume, Brazil has the most imported capacity of 2.3 mil tires, most of which are tires for bikes and motorbikes with rather modest value.
Import market: In 2013, Vietnam imports a majority of tires from Thailand (43%), China
(12%), HongKong (12%), Indonesia (4%), and India (3%). Interestingly, the ranks of
these countries remained the same in the first 6 months this year with 40% of import
value equivalent to 78 mil USD from Thailand and 16% from China. Tires imported from
Thailand and China are mostly for automobiles with popular brands like Double Coin,
Transking, Chengshin (China-Taiwan) and Bridgestone, Michelin (Thailand). Besides,
the majority of tires for motorbike are also imported from Thailand with common brands
like Inoue, Vee Rubber, Deestone, etc. Products from Japan, also, are mostly tires for
trucks and passenger cars (<9 seats) with famous brands like Bridgestone, Yokohama,
etc. with import value of 13.7 mil USD, a 31% decrease yoy.
Tires export-market structure by value of
Vietnam in 2013
Source: VRA, Vietnam Custom, FPTS
Tires export - market structure by value of
Vietnam of 6M2014
(*): excluding the data of China
Tires import-market structure by value of
Vietnam of 6M2014
Tires import - market structure by value of
Vietnam in 2013
US, 17%
China, 11%
Malaysia, 8%
Japan, 5%
Saudi Arabia, 5%
Brazil, 4%Thailand, 3%Egypt, 3%
UAE, 2%
Cambodia, 2%
Others, 38%
Thailand, 43%
China, 12%
Hongkong, 12%
Japan, 17%
Indonesia, 4%
India, 3%Others, 9%
Thailand, 40%
China, 16%
Hongkong, 13%
Japan, 10%
Indonesia, 4%
India, 3%Others, 15%
US, 10.4%
Malaysia, 7.9%
Japan, 11.2%
Saudi Arabia, 5.6%
Brazil, 2.8%
UAE, 2.5%Egypt, 2.6%
Cambodia, 4.1%
Korea, 9.9%
Others, 42.9%

Tires and Natural Rubber
www.fpts.com.vn www.fpts.com.vn Bloomberg- FPTS <GO> | 32
In 2013, exported products with the highest export value are tires for passenger cars
(<9 seats), constituting 44% (159.47 mil USD), followed by tires for truck (26% - 93.7
mil USD), tires for motorbikes (19% - 68 mil USD), tires for bikes (5% - 18.2 mil USD),
and other tires (6.5% - 23.5 mil USD).
Export value structure by enterprises of 1H2014
Vietnam’s tires export structure in 2013
Source: VRA, Vietnam Custom, FPTS
Vietnam’s tires export structure in 6M2014
Vietnam’s tires import structure in 2013
Vietnam’s tires import structure of 6M2014
Source: VRA, Vietnam Custom
Passenger Tires, 48%
Truck tires, 22%
Motorcycle tires, 19%
Bicycle tires, 4.8%Industrial
tires, 3.7%OTR , 1.4%
Agriculture tires, 0.7%
Solid tires, 0.4%
Others, 0.04%
Car tires, 32%
Truck tires, 62%
Others, 6.00%
Passenger Tires, 29.8%
Truck Tires, 64.0%
Industrial Tires, 1.5%Aircraft Tires,
0.5%
Others, 6.2%
Passenger Tires, 44%
Truck tires, 26%
Motorcycle tires, 19%
Bicycle tires, 5%Industrial
tires, 4%OTR , 2%Agriculture tires, 0.7%
Solid tires, 0.5%
Others, 0.1%
Kumho Vietnam, 31.4%
Chinh Tan, 13.0%
Kenda, 9.3%
Casumina, 8.7%
Bridgestone VN, 7.30%
Sailun VN, 4.40%
Yokohama Vietnam, 3.7%
DRC, 3.5%
Lien Phuc, 2.5%
Thoi Ich Rubber Co., 2.4%
SRC, 0.9%
Others, 12.9%

Tires and Natural Rubber
www.fpts.com.vn www.fpts.com.vn Bloomberg- FPTS <GO> | 33
In the first 6 months of 2014, the top three tires of export volume are still tires for
passenger cars (<9 seats) (104.5 mil USD – 48%), tires for trucks (46.8 mil USD – 22%),
tires for motorbike (41.9 mil USD – 19%). Noticeably, tires for passenger cars (<9 seats)
are mostly exported to Japan, USD and Korea accounting for 30% of export value in
the first 6 months.
It is Kumho Tires (Korea) corporation that has the most export volume of 31.4% of the
market share in the first 6 months of 2014. The second largest export volume belongs
to Chinh Tan (13%) followed by Kenda (Taiwan) (9.3%) and DRC, CSM, SRC (13%
altogether).
Regarding importation in the first 6 months this year, tires for trucks and passenger cars
(<9 seats) has the largest import volume with 64% and 29.8%, respectively. Almost 50%
of import value of Vietnam goes to the 7 corporations as follows: Bridgestone Vietnam
Ltd. Co., Michelin Vietnam Ltd. Co., Coalimex JSC, Viet Tire JSC, P&T Ltd. Co., Toyota
Vietnam, Hanoi Jaguar International Ltd. Co.
Imported tire brands of Vietnam
No. Types Imported market Border gate
1 Sover Stone Malaysia Hai Phong city
2 Annaite China Cat Lai
3 Michelin Thailand Hai Phong city
4 Toyo Japan Tan Cang
5 Triangle brand types China Hai Phong city
6 Belaz Belarut Hai Phong city
7 Gold Tire China Hai Phong city
8 Bridgestone tires Japan Hai Phong city
9 Kumho tires Korea Hai Phong city
10 MRF tires India Cang Viet
Source: VRA

Tires and Natural Rubber
www.fpts.com.vn www.fpts.com.vn Bloomberg- FPTS <GO> | 34
3. Tire industry value chain in Vietnam
Materials Industrial
manufacture Distribution
FO-R oil Black coal Crumb Rubber Modifier (CRM) Rubber particles, rubber carpet Others
Export
Car driver, enterprises,
transportation companies,…
Trading companies
Importers
Materials Product structure Distribution
OEM
Replacement
Consumer
Recycling
Materials Natural rubber Synthetic rubber Chemical, Steel, Text tile, Black Coal, etc.
FDI’s enterprises Kumho, Yokohama, Inoue,
Kenda, etc.
Domestic manufacturers
Private companies Chinh Tan, Dai Thanh Cong, Lien
Phuc, etc.
Vinachem DRC, CSM, SRC Exported manufacturers
Main distributors, Car Care
Center
Private car salon, car repair
stores
For 3 tire listed companies
30%
20%13%
2%
23%
12%
Natural rubber Synthetic rubberBlack coal SteelTextile Others
69%
12%
19%
Replacement OEM Export
39%
50%
11%
Bicycle Tyre Motorcycle Tyre Automobiles Tyre

Tires and Natural Rubber
www.fpts.com.vn www.fpts.com.vn Bloomberg- FPTS <GO> | 35
Materials
Currently, domestic tire industry is self-sufficient in natural rubber with a large volume
and reasonable price. Synthetic rubbers are almost imported by Korea, China and
Taiwan,… with the value of USD 500 bil. Two biggest producers of synthetic rubber of
the world are Lanxess (Germany) and Sinopec (China). Chemicals, fabric, black coal
which is used in tire production are almost imported from China. Especially, steel is
partly imported, the remaining is domestic products.
Production
Production capacity and demand of domestic market
Based on the statistic of 2013, total volume of tires production nationwide reaches 59.6
bn units in which motorcycle tires is 30 bn units (50%); the remaining 11% is of 6.3 bn
units. During the past 5 years, the product structure maintains stable.
Tires Supply – Demand in Vietnam
Items (million units/year)
2011 2012 2013
Consumption
Bicycle - - 24.00
Motorcycle 35.78 38.02 37.50
Automobiles 4.32 4.58 5.00
Production
Bicycle 21.30 22.28 23.30
Motorcycle 28.40 29.19 30.00
Automobiles 3.08 3.08 6.30
Source: MOIT, Vietnam Register, FPTS
At present, the domestic production of bicycle tires is enough quantity to meet the annual demand. In particular, automobile tires are still imported with a high volume. Motorcycle tires and automobile tires satisfy about 80% and 67-70% of total demand, respectively. The current domestic production of Radial tires has yet to meet the demand with about 70-80% of Radial tires being imported until now.
Source: FPTS
Tires manufacturing structure in
Vietnam
Tires capacity in Vietnam
39%
50%
11%
Bicycle Tire
Motorcycle Tire
Automobiles Tire
-
5,000
10,000
15,000
20,000
25,000
30,000
35,000
2011 2012 2013
Bicycle Tire Motorcycle Tire Automobiles Tire
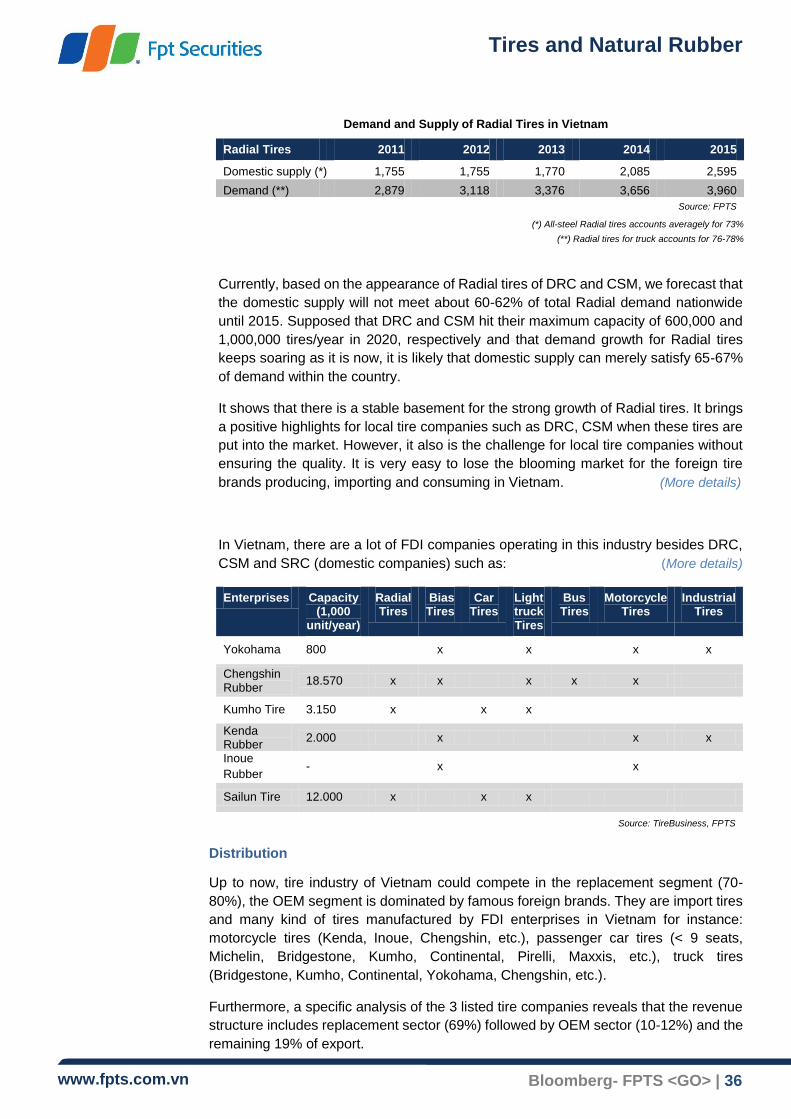
Tires and Natural Rubber
www.fpts.com.vn www.fpts.com.vn Bloomberg- FPTS <GO> | 36
Demand and Supply of Radial Tires in Vietnam
Currently, based on the appearance of Radial tires of DRC and CSM, we forecast that
the domestic supply will not meet about 60-62% of total Radial demand nationwide
until 2015. Supposed that DRC and CSM hit their maximum capacity of 600,000 and
1,000,000 tires/year in 2020, respectively and that demand growth for Radial tires
keeps soaring as it is now, it is likely that domestic supply can merely satisfy 65-67%
of demand within the country.
It shows that there is a stable basement for the strong growth of Radial tires. It brings
a positive highlights for local tire companies such as DRC, CSM when these tires are
put into the market. However, it also is the challenge for local tire companies without
ensuring the quality. It is very easy to lose the blooming market for the foreign tire
brands producing, importing and consuming in Vietnam. (More details)
In Vietnam, there are a lot of FDI companies operating in this industry besides DRC,
CSM and SRC (domestic companies) such as: (More details)
Enterprises Capacity (1,000
unit/year)
Radial Tires
Bias Tires
Car Tires
Light truck Tires
Bus Tires
Motorcycle Tires
Industrial Tires
Yokohama 800 x x x x
Chengshin Rubber
18.570 x x x x x
Kumho Tire 3.150 x x x
Kenda Rubber
2.000 x x x
Inoue
Rubber - x x
Sailun Tire 12.000 x x x
Source: TireBusiness, FPTS
Distribution
Up to now, tire industry of Vietnam could compete in the replacement segment (70-
80%), the OEM segment is dominated by famous foreign brands. They are import tires
and many kind of tires manufactured by FDI enterprises in Vietnam for instance:
motorcycle tires (Kenda, Inoue, Chengshin, etc.), passenger car tires (< 9 seats,
Michelin, Bridgestone, Kumho, Continental, Pirelli, Maxxis, etc.), truck tires
(Bridgestone, Kumho, Continental, Yokohama, Chengshin, etc.).
Furthermore, a specific analysis of the 3 listed tire companies reveals that the revenue
structure includes replacement sector (69%) followed by OEM sector (10-12%) and the
remaining 19% of export.
Radial Tires 2011 2012 2013 2014 2015
Domestic supply (*) 1,755 1,755 1,770 2,085 2,595
Demand (**) 2,879 3,118 3,376 3,656 3,960
Source: FPTS
(*) All-steel Radial tires accounts averagely for 73%
(**) Radial tires for truck accounts for 76-78%

Tires and Natural Rubber
www.fpts.com.vn www.fpts.com.vn Bloomberg- FPTS <GO> | 37
Besides doing outsourcing for automobile assembly companies such as: Truong Hai
Auto, Vinaxuki, Chengshin, Continental, Honda, Yamaha, Suzuki, etc.; a great number
of tires are consumed in domestic market by tier 1 distributors, authorized shops around
the country, for instance:
Enterprises Domestic distributors
CSM 159
SRC 119
DRC 107
Yokohama 124
Inoue 47
Kumho 222 (Tier 1 agencies)
Source: FPTS
In addition, there still exist many commercial streets specializing in buying, selling and repairing tires, namely: Ho Chi Minh city (Ly Thai To street); DaNang city (from the Airport to Nguyen Huu Tho Street and CMT8 roundabout).
(More details)
Recycling sector
After using, a lot of tires will be put into recycling for reuse. Based on the research in
Thailand, the recycled tires could likely reach about 60-90% of quality compared to new
tires and will be used for additional 50,000-70,000 km.
Moreover, used tires could be processed for many useful ingredients for instance: FO-
R Oil for steel production, boiler; black coal for tire production; asphalt additives; rubber
seed and rubber carpet for sports, etc. (More details)
Products recovered from recycling tires
Types Oil Carbon Steel Gas
Heavy truck 45%-50% 25%-30% 10% 10%-15%
Passenger car 40%-45% 30%-35% 10% 10%-15%
Motorcycle, Bicycle 30%-35% 35%-40% 15%-25%
Source: ttmindustry
4. Era of Radial tire
It is the duration, safety, less heat and fuel efficiency that help Radial tires gain the
popularity as it is now in the global scale. In Vietnam, however, consumption of Radial
is rather low, occupying only 10% and falls mostly in the segment of passenger car and
light trucks.
In the world, Radial tires have been of great use for a very long time. With their superior
features, Radial tires appeal to a great number of users in the world. Especially in
developed regions like North America, Radial tire consumption goes up to 96-100%,
Africa and Middle East (72%), Europe (79%), Asia – Pacific (52%). Interestingly, in USA
and Japan the figure is 100% and Malaysia (90%), China (50%).

Tires and Natural Rubber
www.fpts.com.vn www.fpts.com.vn Bloomberg- FPTS <GO> | 38
Source: Michelin, Apollo, FPTS
Radial tires are best fit for road of excellent quality at high speed. If it is used properly,
Radial tires will bring a lot more outstanding features compared to bias tires. They
provide greater longevity of more than 50%, fuel efficiency of 11%, better safety and
usage efficiency of up to 30%. (More details)
In Vietnam, many roads and highway of high quality are under construction so that there is a good chance that more and more users will switch from Bias tires to Radial tires in the near future.
Currently, in Vietnam, DRC and CSM are known to have operated the 2 all-steel radial
tire factories with capacity of up to 600,000 tires/year and 1,000,000 tires/year,
respectively. Products from these 2 plants will serve as an incentive for growth of these
2 companies in the subsequent years. Also, the introduction of all-steel radial tires will
help boost the market share of DRC and CSM in this product segment which is known
to be a potential demand in the country. This will help enhance the prestige and value
of Vietnam’s tires and at the same time minimize imported products of the same type.
Remarkable features of Radial tire versus Bias tire
106%
106%
111%
150%
130%
0% 20% 40% 60% 80% 100% 120% 140% 160%
Time performance
Fuel saving for 1 more litre
Fuel saving for car load
Lifetime
Efficiency per 1 hour
Radial Bias

Tires and Natural Rubber
www.fpts.com.vn www.fpts.com.vn Bloomberg- FPTS <GO> | 39
Radial production process
5. SWOT Analysis of Tire industry in Vietnam
SWOT Analysis
Strengths
With the large population and the industrialization-modernization as well as the development of road infrastructure, demands for motorbikes and automobiles will be on the long-term increase because there is a strong need for commuting to work and downtown areas or factories, companies. It is certain that the demand for tires, both OEM and replacement is insatiable.
With natural rubber abounding in Vietnam and being the major component in the pricing of tire manufacturing, the domestic tire industry has a huge advantage in the competitive market.
In addition to cheap labour cost and export tax for tires of 0%, there is a very promising potential growth of tire products.
On geographical terms, it is very favorable for our country to export tires to some of the largest tire consuming markets in the world namely China, India and Japan. Besides, some domestic enterprises have managed to gain access to some emerging markets like the Africa, Bangladesh, Srilanka, Cambodia, Laos and Myanmar. This is also seen as a competitive advantage of Vietnam tires compared to some expensive brands in the world.
Materials
processing Semi-Product Product
Source: FPTS

Tires and Natural Rubber
www.fpts.com.vn www.fpts.com.vn Bloomberg- FPTS <GO> | 40
Weaknesses
Regarding to the manufacturing scale, our domestic enterprises are still inferior to other foreign corporations. (Economics of scale).
The technology in current use is imported from China and Taiwan and is certainly less competitive than that of Europe, France, the USA, Korea and Japan.
Vietnam has yet to set up a national standard for rubber products or create barriers to imported low-quality tires that also causes strong competition to domestic enterprises. Worse still, Vietnam has to face the problem of trade protection when exporting products to other countries.
Incompetent staff have yet to penetrate the market of passenger cars. Domestic corporations are not self-reliant in tire materials and thus have to resort to imported products like synthetic rubber, black coal and chemicals, etc…
Opportunities
Domestic market:
According to the statistics, the rate of car ownership in Vietnam is lower than the average rate of some neighboring countries like Indonesia, Thailand and Malaysia. This suggests a potential consumption growth in the country in the years to come.
All of the tire manufacturers in the country including FDI corporations only satisfy 70-80% of the total demand. As for Radial tires, only 10% of the demand is met and the rest is reliant on importation. There is, there for a promising outlook for the tire industry. Besides, automobile import tax from ASEAN countries will fall down to 50% and hit a low of 0% in 2018 onwards. The growing number of cars imported in Vietnam will increase the need for replacement tires accordingly.
According to the provisions of Circular No. 06 of the Ministry of Transport, truck weight limit will prohibit the current practice of overloading. Carriers, consequently, are left with no choice but to invest in more trucks and lorries to respond to the insatiable need. If we strictly abide by this Circular, there is a strong likelihood that tire consumption will increase in the years to come.
Moreover, according to the annual vehicle inspection regulations on tire origins and official documents of buying and selling tires. The inspection, in one way or another, can help get rid of unauthorized and low-quality tires or tires with no clear origins, and at the same time, benefits domestic tire manufacturers.
Export market :
Agreement on ASEAN Trade in Goods (ATIGA) specifies the decision on lowering and abolishing tax for a number of products till 2018. In addition, the upcoming Trans-Pacific Strategic Economic Partnership Agreement, when imposed, will open up many opportunities for Vietnam in the tire industry especially Radial tires to penetrate larger markets in the world.
Currently, in terms of scale, Vietnam’s tire industry is just about 0.4% of the world’s. As surveyed by Reseach and markets, global auto production in the next 12 yeaers will proliferate espcially in China (11%/year), India (12%/year), Southeast Asia (5%/year), South America (5%/yeaer). These are known to be large consuming markets of Radial tires, which can foster the production of Radial tires for exportation in Vietnam in the near future.

Tires and Natural Rubber
www.fpts.com.vn www.fpts.com.vn Bloomberg- FPTS <GO> | 41
Challenges
We are up against the fierce competition from neighboring countries. With the adjacent China market, its inexpensive and low-quality tires are imported to domestic market every year.
Vietnam’s tire enterprises are faced with the cut-throat competition not only from foreign corporations and imports but also from their fellow internal enterprises. These days, there are more and more world-renowned brands establishing their representative offices in Vietnam. Worse still, Bridgestone’s new plant with capacity of 9 mil tires/year will go into operation in late 2016 in Hai Phong. Yokohama is maintain its capacity of 400,000 tires/year. Kumho will also increase its capacity from 3.15 mil tires/ year up to 6.3 mil tires/year. Other brandnames like Chengshin, Maxxis, Sailun, to name just a few, are also strong competitors. Foreign corporations will respond to the domestic market, beating our domestic enterprises. Undeniably, this is a real threat that should never be overlooked.
6. Policies related to tire industry
Import duties for car tires
Challenges of TPP for Vietnamese Tires and Tubes Industry
Process of tax reducing for imported automobiles
Circular 06/VBHN-BGTCT, regulated about vehicle weight and road size limit.
Development Planning for Automobile Industry to 2020, vision to 2030
Import duties for car tires (More details)
Under the provisions of Circular No. 156/2011 / TT-BTC published on 14th November, 2011 of the Ministry of Finance and Import Tariff Special of Vietnam to implement The Free Trade Area ASEAN- China period sections 2012-2014, issued with Circular No. 162/2011 / TT-BTC on date 17th, November 2011 of the Ministry of Finance: If imported items are rubber truck tires, unused, and width not exceeding 450 millimeters (less than or equal to 18 inches), import tax rates are:
- 25 percent - products are imported from China - 5 percent - products are imported from ASEAN
If imported items are rubber truck tires, unused, and width exceeding 450 millimeters (bigger than 18 inches), import tax rates are:
- 10 percent - products are imported from China - 0 percent - products are imported from ASEAN
Challenges of TPP for Vietnamese Tires and Tubes Industry
With the pace of infrastructure development in Vietnam today, the trend of bias tire
consumptions will gradually switch to radial tires. Simultaneously with the WTO, AFTA
agreements and the upcoming ATIGA TPP, Radial products from overseas will overflow
into Vietnam with more attractive prices. (More details)
Process of tax reducing for imported automobiles
According to the commitments in Agreement on Trade in Goods of ASEAN (ATIGA)
formerly known as CEPT / AFTA, Vietnam have to reduce and remove tax for import
goods in the ASEAN region until 2018, including cars and motorcycles. Imported
automobiles duties had been maintained at a very high level of 100-150 percent in the

Tires and Natural Rubber
www.fpts.com.vn www.fpts.com.vn Bloomberg- FPTS <GO> | 42
past two decades to protect domestic automobile industry. Implementation of
commitments ATIGA, import tax has cut since 2012 to 70 percent in 2012, to 50 percent
in 2014 and will cut completely to 0 percent in 2018. (More details)
Circular No.06/ VBHN-BGTCT, regulated on vehicle weight and road size limit
Circular No. 06 / VBHN-BGTVT applies to organizations and individuals related to the
loading weight, size limits of the highway; circulation of over-load vehicles, and over-
sized vehicles, tracked vehicles on roads; over-size and over-load transportation, and
loading limits on vehicles while in traffic. (More details)
Development Planning for Automobile Industry to 2020, vision to 2030
Vietnam Automobile Industry has the aim of developing automotive industry Vietnam
becoming an important industry of the country, achievement needs of domestic market
in all kinds of trucks, passenger cars and some common types of specialist vehicles,
also endeavor to become suppliers of components, parts and assemblies for details
some of the production chain in the world automotive industry.
(More details)
7. Tire industry Outlook
With the rapid pace of infrastructure development these days, a series of highways
have been put into use since 2013. This encourages and accelerated the switch
from Bias to Radial tires. The two domestic corporations namely DRC and CSM,
therefore, have begun penetrating this type of product’s segment through the
operation of the two all-steal Radial factories. According to the assessment of
Vinachem, these projects are of critical importance to the development of tire
industry of Vietnam in the future as they can help minimize imported products and
diversify the supply of tires, thus increasing the value of natural rubber material of
the country. Reality shows that domestic demand for such tire is so great that it
should be a promising future for domestic rubber corporations.
2014 is believed to be the start for DRC and CSM to make the introduction of Radial
tires to the market. Also, these both companies can carefully finalize preparations
for products’ quantity, quality and their export certification so as to launch a
VietNam product in such a competitive international market. The current sale
volume of 3,000 – 5,000 tires/month of CSM and 10,000 tires/month of DRC is not
as great as expected given the maximum capacity of the factory and the huge
demand of the market. However, these figures should prove a positive feedback
from the market. Based on such good reputation, it is highly likely that consumption
volume and revenue will leap in the 2015-2016 phase, thus increasing the market
share for DRC and CSM.
It is a long-standing problem that our domestic market has encountered contraband
tires of low quality, 60-70% of which have their origin traced back to China.
Moreover, local corporations specializing in contraband tires from China with their
frauds of offering wrong prices, 25-30% lower than the actual ones to evade import
and VT taxes. Only half of the prices of tires for sale are invoiced, the other half is
incurred in cash. This alerting problem entails potential losses of the Government
and at the same time poses an unhealthy competition among manufacturers of
auto tires and domestic high-quality tires.

Tires and Natural Rubber
www.fpts.com.vn www.fpts.com.vn Bloomberg- FPTS <GO> | 43
With an effort to preclude all these frauds, the General Customs Department has
issued a Dispatch No. 10934/TCHQ-TXNK dated 09/06/2014 specifying that
Customs Departments of every province and city are obliged to monitor and control
the importing procedures of auto tires so as to issue an appropriate tax as for
particular products. This serves as a warning for the government to make
necessary adjustment to the importing processes and therefore encourage a sound
competition. This would be a positive sign of better production for the 3 corporations
namely DRC, CSM and SRC in the next months and years.
B. UPDATED TIRE & RUBBER COMPANIES
I. Overview of listed companies in the industry
DPR
PHR
TRC
HRC
TNC
Dong Nai Rubber
Phu Rieng Rubber
Dau Tieng Rubber
Loc Ninh Rubber
Tan Bien Rubber
Binh Long Rubber
HAG

Tires and Natural Rubber
www.fpts.com.vn www.fpts.com.vn Bloomberg- FPTS <GO> | 44
Exchange Sector Ticker Share outstanding
Price 30/09/2014
Market Capital (VND)
(Billion VND)
Owner Equity
(06/2014) (Billion VND)
Total Asset
(06/2014) (Billion VND)
HOSE Natural Rubber
PHR 78,490,047 29,000 2,339 2,092 3,177
HOSE Natural Rubber
DPR 42,125,000 43,200 1,841 2,201 3,330
HOSE Natural Rubber
TRC 29,125,000 32,000 958 1,375 1,521
HOSE Natural Rubber
HRC 17,260,976 39,000 675 486 656
HOSE Natural Rubber
TNC 19,250,000 11,900 229 295 322
HOSE Tire DRC 83,073,849 61,000 5,109 1,368 3,244
HOSE Tire CSM 67,292,000 46,600 3,135 1,199 3,294
HOSE Tire SRC 18,224,216 29,900 539 290 542
Source: FPTS
In these two field, DRC has the biggest market capitalization which is up to VND 4,776 billion. In terms of owner equity, the DPR is now the leader with VND 2,201 billion. In terms of total assets, PHR, DPR, DRC and CSM are similar to each other.
Natural rubber companies
Company name Rubber plantation area
(hectare)
Tapping area (hectare)
Productivity
(Ton per hectare)
Tapping production (Ton)
Dong Nai Rubber Corporation - Donaruco
43,822 22,240 1.69 35,000
Dau Tieng Rubber Corporation - DRC 28,820 19,377 1.59 30,800
HAGL Joint Stock Company 44,500 6,136 1.32 8,110
Phu Rieng Rubber Company Limited 18,850 12,661 2.02 26,100
Phuoc Hoa Rubber Joint Stock Company - PHR (**)
22,728 10,708 2.02 19,196
Binh Long Rubber Company Limited 14,737 10,958 2.01 21,400
Kontum Rubber Company Limited (*) 10,233 8,763 1.28 12,500
Dong Phu Rubber Joint Stock Company– DPR (**)
16,933 7,502 2.25 16,323
Loc Ninh Rubber Company Limited 10,800 6,952 2.02 12,700
Chu Păh Rubber Company Limited 9,000 5,693 1.23 8,300
Ba Ria Rubber Company Limited 8,546 3,250 1.85 6,000
Chu Se Rubber Company Limited 7,744 6,000 1.50 9,300
Mang Yang Rubber Company Limited 7,607 6,612 1.14 8,000
Tay Ninh Rubber Joint Stock Company – TRC (**)
9,412 5,015 2.14 10,722
Tan Bien Rubber Company Limited 6,162 6,050 2.21 12,200
Hoa Binh Rubber Joint Stock Company – HRC
5,102 2,224 1.11 1,639
Thong Nhat Rubber Joint Stock Company – TNC
2,074 1,364 0.95 1,257
Source: VRG, VRA, Enterprises
(*): Data is updated in 2011, the rest are up to date in 2013 (**): Including planning area in Cambodia and Laos

Tires and Natural Rubber
www.fpts.com.vn www.fpts.com.vn Bloomberg- FPTS <GO> | 45
According to industry statistics, rubber plantation area has reached 956,000 hectares
in all over the country, production reached 950,000 tons. In particular, VRG reached
392,000 hectares (41 percent), production reached 266,800 tons (28 percent).
Currently, Dong Nai Rubber Corporation now has the largest rubber plantation area in
the country, while reaching 43,822 hectares. In listed rubber companies that are belong
to VRG, PHR now is still the leader about planning area and production. In the private
sector, considering about acreage in three countries: Vietnam - Cambodia – Laos,
HAGL Group has largest rubber plantation area, reaching 44,500 hectares. In terms of
mining productivity, DPR is considered as the leader in this indicator over the years
through scientific management and strictly tending and exploiting in order to help
keeping yields stable garden at a high level. HRC and TNC has less planning area
compare to others in the field, low extraction efficiency, extraction yield only around 1
ton / hectare. About HRC, due to many old orchards rate (about 50 percent) resulted in
low extraction efficiency, forcing the company to purchase latex exterior for processing
and sale, and lead to reduce the effectiveness of the company business.
Plantation structure of natural rubber of listed companies
DPR
a DPR
TRC
PHR
a DPR
HRC
a DPR
TNC
a DPR
Source: Enterprises, FPTS
36%
10%
51%
3%
0-6
7-10
11-25
>2559%
10%
27%
4%
0-6
7-10
11-25
>25
16%
71%
13%
7-10
11-25
>25
16%
71%
13%
7-10
11-25
>25
32%
11%
39%
18%
0-6
7-10
11-25
>25
88%
12%
0-5
> 5
HAG
a DPR
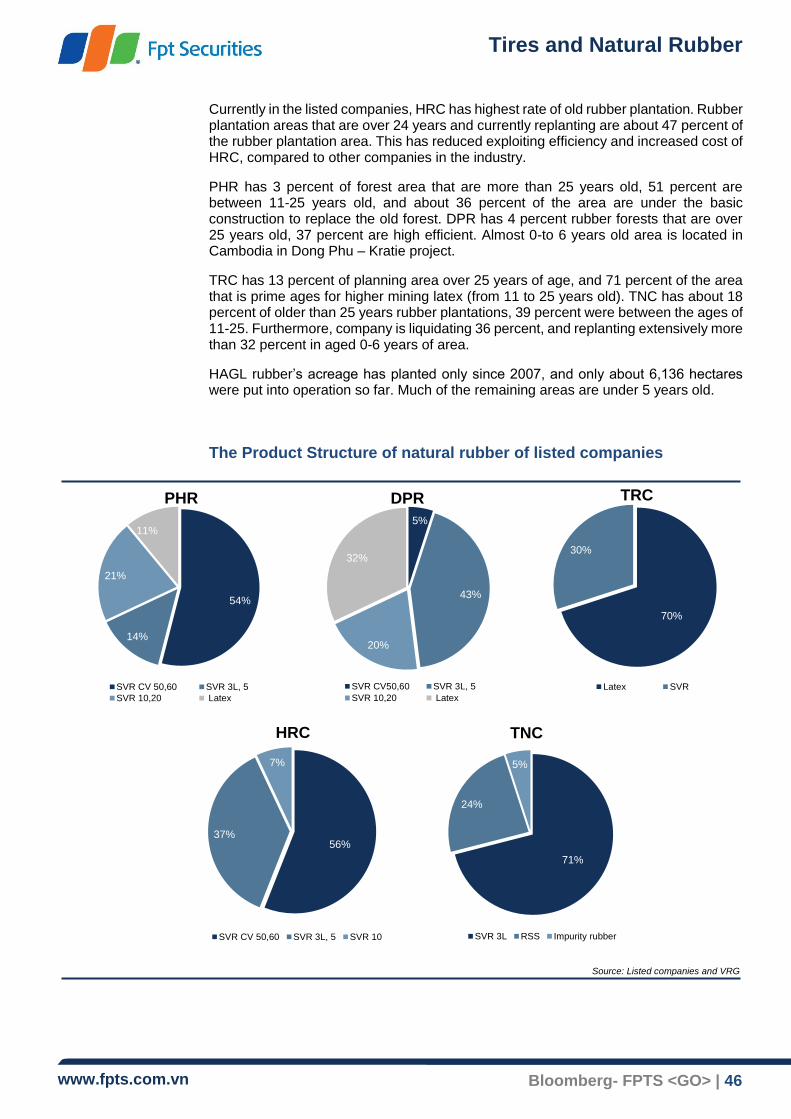
Tires and Natural Rubber
www.fpts.com.vn www.fpts.com.vn Bloomberg- FPTS <GO> | 46
Currently in the listed companies, HRC has highest rate of old rubber plantation. Rubber plantation areas that are over 24 years and currently replanting are about 47 percent of the rubber plantation area. This has reduced exploiting efficiency and increased cost of HRC, compared to other companies in the industry.
PHR has 3 percent of forest area that are more than 25 years old, 51 percent are between 11-25 years old, and about 36 percent of the area are under the basic construction to replace the old forest. DPR has 4 percent rubber forests that are over 25 years old, 37 percent are high efficient. Almost 0-to 6 years old area is located in Cambodia in Dong Phu – Kratie project.
TRC has 13 percent of planning area over 25 years of age, and 71 percent of the area that is prime ages for higher mining latex (from 11 to 25 years old). TNC has about 18 percent of older than 25 years rubber plantations, 39 percent were between the ages of 11-25. Furthermore, company is liquidating 36 percent, and replanting extensively more than 32 percent in aged 0-6 years of area.
HAGL rubber’s acreage has planted only since 2007, and only about 6,136 hectares were put into operation so far. Much of the remaining areas are under 5 years old.
The Product Structure of natural rubber of listed companies
PHR
TRC DPR
Source: Listed companies and VRG
HRC
PHR
TNC
54%
14%
21%
11%
SVR CV 50,60 SVR 3L, 5
SVR 10,20 Latex
5%
43%
20%
32%
SVR CV50,60 SVR 3L, 5
SVR 10,20 Latex
70%
30%
Latex SVR
56%37%
7%
SVR CV 50,60 SVR 3L, 5 SVR 10
71%
24%
5%
SVR 3L RSS Impurity rubber

Tires and Natural Rubber
www.fpts.com.vn www.fpts.com.vn Bloomberg- FPTS <GO> | 47
Looking at the product structure of listed companies in the industry, we can see that
most of the enterprises are producing block rubber (SVR) and latex (liquid rubber). In
that, SVR is predominate, and also is favorable product of Vietnam. In the exporting
structure of natural rubber products, this product line accounts from 75 to 80%. PHR
and HRC focus on high-value product lines such as SVR CV 50, 60; while DPR focuses
on line SVR 3L, 10, 20; TRC has their own strengths in latex (accounted for about 70%
of the company's annual output and they also have additional product RSS latex (a type
of latex used in the manufacture of tires) to make a difference for that two companies in
the industry for the remaining listed companies. HAGL also focuses on producing SVR
5, 10, 20 to supply for tire and tube manufactures. However, because mining production
in the early stages is low, the proportion of latex product structure has not been specific
published.
Tire companies
Company Unit 2012 2013
DRC CSM DRC CSM
Factory output 1,000 unit/year
Bicycle tire 6,000 5,000 8,000 6,200 5,000 8,000
Motorcycle tire 2,000 6,000 2,500 2,000 6,000 2,500
Car and truck tire 780 1,200 500 780 1,200 500
Radial tire 300 350
Consumption 1,000 unit/year
Bicycle tire 7,686 9,044 7,896 8,045 9,941 7,877
Motorcycle tire 3,944 23,391 5,796 4,354 25,956 6,104
Car and truck tire 1,221 1,204 455 1,371 1,512 445
Radial tire 15
Productivity 1,000 unit/year
Bicycle tire 57% 56% 45% 60% 72% 45%
Motorcycle tire 56% 70% 22% 57% 65% 21%
Car and truck tire 100% 62% 56% 95% 72% 55%
Radial tire - - - 5% - -
Source: FPTS, Enterprises
In these three tire listed companies, DRC has strength in manufacturing tires for trucks
and special vehicles (with capacity about 780,000 tires per year), CSM focuses on
motorbike tires and light truck tires (capacity about 6 million tires per year and 1.2 million
tires per year, respectively), SRC focuses on bicycle tires (capacity about 8 million tires
per year).
In recently, both DRC and CSM have operated two full-steel radial tire factories that
specialize in manufacturing truck tires with first stage‘s capacity respectively 300,000
units per year and 350,000 tires per year. In 2013, the DRC has sold 15,000 radial tires,
about for 5 percent of their factories’ output. In the first 6 months of 2014, sale volume
increased sharply, reaching approximately 42,500 radial tires. For CSM, the factory has

Tires and Natural Rubber
www.fpts.com.vn www.fpts.com.vn Bloomberg- FPTS <GO> | 48
only operated from May 2014, so consumption rate was not high, about 3,000-5,000
tires per month.
In terms of factory’s efficient operation, according to statistics, DRC had very good
extraction capacity of car and truck tires production (about 95-100 percent); CSM had
highest extraction rate of motorcycle in these three (65 percent). Although, SRC has
their own strength in bicycle tires but their factory extracting capacity was still low (about
45 percent), and bicycle tires sale volume annually was even lower than DRC and CSM.
This indicates that SRC’s competitiveness was very low compared to DRC and CSM.
II. Opposite Business Performance between Natural rubber and Tire
Revenue – Gross margin – Net margin
In the rubber industry value chain, natural rubber is a product that belongs to
Upstream group, while tires and tubes are belongs to Downstream group. In addition,
natural Rubber is the input material of tire manufacture. These factors indicate the
opposite business performance of 2 sectors of the value chain the industry.
In the period 2010-2013, rubber prices experienced a mixed trend between 2010-
2011 period (Natural Rubber prices has the highest prices in the historical record, up
to 6,000 USD/ton) and 2012 to present period (natural rubber‘s price has decreased
in long term). In fact, it led to negatively impacts on business performance of natural
rubber companies, and decreased efficiency continuously since 2012 until now. In
Source: Listed Companies, FPTS
Gross margin of 2009 - 2013 Gross margin of the 1st half
Sector Code Revenue growth
rate of 2010-2013
EAT growth rate
of 2010-2013
Gross margin of
2010-2013
Net margin of
2010-2013
Revenue
of 2013
EAT of
2013
1H2014
Revenue
1H2014
EAT
1H2014
Net
margin
Natural Rubber PHR -2.00% -8.60% 33.00% 26.50% 1.912 387 726,6 119,3 16.40%
Natural Rubber DPR 2.30% 0.70% 43.20% 38.60% 1.1 369 314,2 75,5 24.00%
Natural Rubber TRC -4.00% -5.80% 37.10% 38.60% 675 230 232,4 68,2 29.40%
Natural Rubber HRC -0.50% -11.90% 14.80% 18.90% 406 65 88,8 30,4 34.20%
Natural Rubber TNC -7.80% -13.00% 30.90% 34.70% 142 34 30,9 11,3 36.60%
Tyres DRC 9.10% 24.20% 20.20% 10.40% 2.803 375 1.545,6 184,9 11.90%
Tyres CSM 5.40% 36.70% 18.50% 6.70% 3.133 360 1.468,4 169,3 11.50%
Tyres SRC 8.80% 49.50% 13.00% 2.50% 982 48 477,4 36,9 7.70%
0.00%
5.00%
10.00%
15.00%
20.00%
25.00%
30.00%
35.00%
40.00%
45.00%
2009 2010 2011 2012 2013
Natural Rubber Tires
0.0%
5.0%
10.0%
15.0%
20.0%
25.0%
1H2013 1H2014
Natural rubber Tires

Tires and Natural Rubber
www.fpts.com.vn www.fpts.com.vn Bloomberg- FPTS <GO> | 49
fact, both growth rate of revenue and net profit of almost companies in the filed were
negative.
Profit rate of the Natural Rubber group fell under latex devaluation, and decreased
from the average of 36.6 percent (2010) to 21.9 percent (2013). In this group, the
highest gross margins were belonging to PHR, DPR and TRC (higher than 33
percent). About profit after tax, DPR and TRC had the highest efficiency (higher than
38 percent), because TRC always focus on latex which has a stable gross margin,
and low impact by price fluctuations of the market; and DPR has mix product
diversification in order to focus on SVR 3L, 5; SVR 10, 20 and Latex. This group of
product has high demand for high-efficient consumption, and mostly use their own
latex, so it helps to improve business efficiency of these products. Meanwhile PHR
focuses on SVR 50 and 60 (54 percent) – the type of latex has lower demand than
SVR group of 10 and 20. In addition, large amount of external purchasing latex,
which are collecting and processing from external sources each year about 9,000-
10,000 tons per year, leads to lower efficiency than two companies above.
On the other side, the tire industry was beneficial greatly from this situation. From
2011 to the present, this sector of business performance has been improving welly.
Revenue and net profit consistently achieved high growth over the year as indicating
in the table above figures. Gross profit margin improved from the average of 13.6
percent in2010 to 23.5 percent in 2013. This was also the first time in 5 years,
exceeding average gross margin of 5 listed natural rubber companies.
In listed tires companies, DRC was the company that had efficiency including highest
gross margin and net profit with average rate of 2010 to 2013 reached respectively
20.2 percent and 10.4 percent. The factors that made DRC to have highest number
was product structure based on automotive and truck tires (80 percent of revenue,
and 72 percent gross profit). In addition, this segment had highest earnings,
compared to motorcycle tires and bicycle tires. At the present time, DRC has the
third biggest market share of truck tires in the field with 13 percent.
In addition, CSM was ranked 67th worldwide by tire sales and ranked 4th in the tires
exporting structure of Vietnam (accounted for 9.2 percent of total tires exports) while
exports reached 43 million dollars in 2013. Because of high performance in
exporting activities and product diversity, CSM had higher growth than DRC in the
period 2010-2013 with 36.7 percent
According to operating results in the first 6 months of 2014, gross margin of the
natural rubber group was reduced from 21 percent (6 months of 2013) to 14 percent
(6 months of 2014). Meanwhile, tire industry has been maintaining a high level of
gross margin at 24 percent. We believe that this situation can be last at least until
the end of 2015 while the world's supply of Natural Rubber is still quite high
compared to demand and price of Natural Rubber has not recovered sharply by the
end of 2015 yet.

Tires and Natural Rubber
www.fpts.com.vn www.fpts.com.vn Bloomberg- FPTS <GO> | 50
Selling cost on Revenue
Natural rubber companies: Average selling cost accounted for 1.2 percent of revenue.
In particular, PHR, DPR and HRC have high COGS proportion. These companies mostly
produce technical rubber SVR (blocks), so they should have high cost of packaging and
transporting. On the other hand, TRC is specializing in producing latex (70 percent of its
volume), so they don’t need to pay selling cost because customer will purchase product
in their factory. Therefore, the selling cost of TRC is usually only from 0.7 to 0.8 percent
of revenue. In the first 6 month, PHR and HRC’s selling cost were somehow higher while
the 3 remaining companies declined over the same period in 2013 due to sales of HRC
slumped by 53.6 percent while selling cost only decrease by 33.8 percent over the same
period. With a PHR, selling cost increased due to subsidiaries woodworking and
manufacturing rubber mattresses branch.
Tire companies: selling cost are usually quite high, with average about 2.5-3.5 percent
of revenue. Due to industry‘s characteristics, the companies must invest and maintain
dealer network over nationwide in order to sales their products to consumers. Besides
that, they also have cost of packaging, printing labels, advertising marketing year. These
requirements force them to maintain the higher selling cost compared to revenue over
the years. In the first 6 months of this year, this costs of all three firms were higher than
the same period last year due to the price of rubber dropped by these enterprises had to
increase the discount to agents leading to higher selling cost.
Administration Cost on Revenue
0.0%
0.5%
1.0%
1.5%
2.0%
2.5%
3.0%
3.5%
4.0%
PHR DPR TRC HRC TNC DRC CSM SRC
2012 2013
0.0%
1.0%
2.0%
3.0%
4.0%
5.0%
6.0%
7.0%
PHR DPR TRC HRC TNC DRC CSM SRC
2012 2013
Source: Listed Companies, FPTS
Source: Listed companies, FPTS
0.0%
0.5%
1.0%
1.5%
2.0%
2.5%
3.0%
3.5%
4.0%
4.5%
5.0%
PHR DPR TRC HRC TNC DRC CSM SRC
1H2013 1H2014
0.0%
2.0%
4.0%
6.0%
8.0%
10.0%
12.0%
14.0%
16.0%
PHR DPR TRC HRC TNC DRC CSM SRC
1H2013 1H2014

Tires and Natural Rubber
www.fpts.com.vn www.fpts.com.vn Bloomberg- FPTS <GO> | 51
Natural rubber companies: costs of operation have averaged at 4.6 percent of
revenue. DPR now has the highest rate was mainly due to salary costs at DPR
managers department that are relatively high compared to the average of the listed
companies in the natural rubber field. In the first 6 months of this year, because of
rubber‘s price fell sharply, revenues reduce deeplier than cost, therefore the
cost/revenue ratio in most businesses this group increased compared with the same
period of 2013. In particular, TNC has the highest increase due to revenue of 6 months
of TNC dramatically decreased (down 58% with the same period last year) because the
company had no revenue from the sale of cashew nuts, raw cashew production and
furniture production. Meanwhile, cost of operation increased because companies had
to pay for layoff cost due to rubber price‘s reduction. Therefore, cost of operation
increased 52% over the same period.
Tire companies: SRC, CSM had high administration cost (more than 5 percent of
revenue), while this ratio of DRC was only at 2.6 percent of revenue. This numbers
indicated that management ability; cost control and cost savings of the DRC were good
and stable. In addition, difference in headquarters‘ location among DRC and CSM, SRC
led to difference in salary costs for staff management in each company, and caused a
big difference in cost among them.
Net profit and net profit margin
Because of characteristics the industry, natural rubber business group had higher
gross margin than tires and tubes business group. At the same time, cost of goods
sold plus cost of operation over revenue took lower percentage rate, and would lead
to higher profit after tax than tires and tubes business groups. However, if we
considered separately each group, we could realize that natural rubber business
group‘s efficiency in the past 2 years was falling while tires and tubes business
groups improved efficiency significantly.
Profit after tax rate of three tire companies in 2013 increased at least 15% compared
to 2012. Furthermore the effective rate of profit after tax over sales of this group was
somehow mitigated from 10.78 percent (first 6 months of 2013) was 10.4% in the
first 6 months of this year (6 months of 2014), mainly because these firms cut prices
Source: Listed companies, FPTS
0.0%
5.0%
10.0%
15.0%
20.0%
25.0%
30.0%
35.0%
40.0%
45.0%
50.0%
-
20,000
40,000
60,000
80,000
100,000
120,000
140,000
160,000
180,000
200,000
PHR DPR TRC HRC TNC DRC CSM SRC
1H2013 1H2014
Net margin of 1H2013 Net margin of 1H2014
0%
5%
10%
15%
20%
25%
30%
35%
40%
45%
-
100,000
200,000
300,000
400,000
500,000
600,000
700,000
PHR DPR TRC HRC TNC DRC CSM SRC
2012 2013
Net margin of 2012 Net margin of 2013

Tires and Natural Rubber
www.fpts.com.vn www.fpts.com.vn Bloomberg- FPTS <GO> | 52
by 5-7% and increased the discount to dealers due to te strongly decreasing of
natural rubber material’s prices.
About group of natural rubber business, Gross profit margin in the first six months of
this year mostly declined over the same period. Particularly with HRC and TNC
improvement over the same period. The reason was HRC strongly liquidated their
old rubber forest area in order to help other profits rose more than 10 billion VND
more over the same period in the first 6 months. For TNC, Profit After Tax (PAT)
improved; however, this was not derived from core business activities but came from
financial operations and liquidation of the plantation area. Specifically, in the first 6
months because rubber prices fell sharply (down 28 percent compared to last year)
led to the company achieved a gross profit of VND 568 million (same period in 2013
to reach VND 9.8 billion). Meanwhile, more than VND 8.7 billion from financial
activities and VND 8.6 billion from disposals of TNC garden helped net income to
reach VND 11.26 billion in the corresponding ratio of Gross Profit Margin was 36
percent higher than the 34 percent for the same period in 2013.
III. Financial Analysis
Asset and Equity structure
Short-term and Long term Asset – Asset Turnover
Among group of natural rubber businesses, asset structure has remained largely not
consistent. Mainly because companies were making long-term investment plans in
different time leads to different in long-term assets ratio. In particular, PHR and DPR
are two leading companies in investing in Cambodia's rubber plantations, so long-term
assets accounts for a higher proportion of asset structure, respectively, 62 percent and
55 percent. After that TRC following invested, short-term assets were taking high
proportion due to the cash items, cash equivalents and short-term investments. For
HRC, long-term assets accounted for the majority (83 percent) such as fixed assets and
Source: Listed companies, FPTS
62% 55% 41% 83% 37% 59% 50% 25%
0.59
0.36
0.39
0.60
0.39
1.03
1.33
1.86
-
0.20
0.40
0.60
0.80
1.00
1.20
1.40
1.60
1.80
2.00
0.00
0.20
0.40
0.60
0.80
1.00
1.20
PHR DPR TRC HRC TNC DRC CSM SRC
Long-term Asset Current Asset Asset Turnover

Tires and Natural Rubber
www.fpts.com.vn www.fpts.com.vn Bloomberg- FPTS <GO> | 53
long-term receivables from the company's staff for housing loans. In fixed assets,
orchards and processing factory (total 14 percent), long-term financial investments in
other rubber companies to share profits (about 47 percent) were mainly apart. At the
same time, there was an additional construction in progress that the company has spent
to plant replanting the old and newly planted trees in 2013 added about VND 225 billion
(about 38 percent). At TNC, short-term assets accounted for a higher proportion of
mainly cash and cash equivalents amount in companies (40 percent of total assets).
The company also had capital expenditure for rubber plantation until the end of June
2014 with a value of about VND 37 billion, beside long-term investments were worth $
VND 26.8 billion in of agro-forestry export companies and Baria Serece fertilizer from
the previous year.
In the group of tires and tube business, DRC and CSM had similar structures properties.
In additional, investments in full- steel radial tire factory increased the percentage of
assets in both companies over the last year. About SRC, in recent years the company
had no plans to invest in fixed assets investment and long-term financial assets, led to
decreases in asset because of depreciation. TSNH had large proportion of structural
properties primarily because of inventories (accounted for 53.6 percent of total assets,
which finished inventories are nearly 50%) and trading receivables (about 16 percent).
In term of total asset turnover: tires and tubes group had faster rotation. In that, SRC
had the highest turnover, but we did not value this provision because of the SRC
property values were declining, while DRC and CSM had invested heavily in Radial
factory, led to differences between DRC, CSM and SRC. The asset turnover of this
natural rubber group were falling due to weakened in sale performance since 2011. In
addition, PHR were remaining total asset turnover.
Debt structure
Short-term debt – Long-term debt – Leverage
Group of tires and tubes business generally have higher leverage than group of
Natural Rubber business with average about 2.2 compared with 1.1 of Natural Rubber
group. In three tires and tubes manufacture companies; DRC and CSM had high
leverage especially in 2013, because these two companies need capitals to invest in
Source: Listed companies, FPTS
19.7%
36.4%
0.3%
67.2%
0.0%
48.3%
50.4%
7.3%
1.6
1.4 1.3
1.4
1.1
2.3
2.4
1.8
-
0.5
1.0
1.5
2.0
2.5
3.0
0.00
0.20
0.40
0.60
0.80
1.00
1.20
PHR DPR TRC HRC TNC DRC CSM SRC
Long-term debt Short-term debt Leverage

Tires and Natural Rubber
www.fpts.com.vn www.fpts.com.vn Bloomberg- FPTS <GO> | 54
all-steel radial factories. PHR had highest leverage in 5 natural rubber listed
companies with the average at 1.7x, while other four are around 1.3x.
Inventory – Inventory Turnover
Group of Natural Rubber business have inventory turnover averaged at 4.8 cycles per year. Companies in this field have familiar inventory, reaching an average of 3.1 cycles per year.
HRC now had the highest inventory turnover in-group of Natural Rubber business, and then PHR and TRC. HRC’s inventory turnover was the highest, because selling prices and sales dropped sharply forcing companies to actively reduce the amount of inventory, especially finished inventories by the end of the year (time that rubber ‘s prices fall by exploiting season), led to company‘s inventory in period from 2011 to 2013 fell 40 percent in order to increase the turnover. PHR had lower turnover than the TRC, because the company recorded charges unfinished products of Phuoc Hoa Industry Zone (over 52 billion VND) in order to increase the inventory of company. If excluding this category, inventory turnover of PHR and TRC were similar, around 5 cycles per year.
Receivable Turnover– Payable Turnover
Source: Listed companies, FPTS
Source: Listed companies, FPTS
-
1.00
2.00
3.00
4.00
5.00
6.00
7.00
-
100,000
200,000
300,000
400,000
500,000
600,000
700,000
800,000
900,000
1,000,000
PHR DPR TRC HRC TNC DRC CSM SRC
1H2014 2013 Inventory Turnover
-
2
4
6
8
10
12
14
16
18
20
-
50.0
100.0
150.0
200.0
250.0
300.0
PHR DPR TRC HRC TNC DRC CSM SRC
Receivable Turnover Payable Turnover
Days of receivable Days of payable

Tires and Natural Rubber
www.fpts.com.vn www.fpts.com.vn Bloomberg- FPTS <GO> | 55
Most companies in Natural Rubber and Tires and tubes sectors maintains number of paying days higher than number of receiving days. About Natural Rubber group, most of companies receive money before delivery, so there are almost no receivables. On the other hand, tires and tubes companies often maintain receivables in 3 to 5 days in in order to support customers and maintain market share.
Dupont analysis
According to the industry data, we can realize that tires group achieved higher ROE
than Natural Rubber group. Because of effectively business combinations by using
reasonable leverage to help businesses improve their tires mining assets. Moreover,
rubber‘s prices had been falling continuously in the past 3 years to help reducing
production materials. These advantages helped these companies to maintain their
ROE at high rate, averaged over 20 percent.
Cash flow
CFO CFI CFF
2013 6M2014 2013 6M2014 2013 6M2014
PHR 102,836 (609) (240,090) 19,489 181,652 (47,068)
DPR 595,641 (24,274) (269,505) (154,186) (215,184) (37,309)
TRC (62,205) (81,403) (18) 126,173 72,756 (395.900)
HRC (16,280) (6,231) (16,538) 14,460 22,811 (55.539)
TNC (30,525) 6,743 10,827 15,646 (38,453) (26,960)
DRC 148,754 419,656 (561,845) (126,638) 391,978 (119,090)
CSM 333,407 521,597 (916,185) (485,792) 587,657 6,943
SRC 126,802 12,684 (2,008) 247,288 (112,452) (33,526)
Source: Audited financial statement
Cash flow from operation of SRC plummeted as the company increased dealer
support account receivables to maintain sale volume. Cash flow from operation of
DRC and CSM increased strongly due to highly consumption of market in first six
months of this year; led to increase in sale over the same period and decrease cost
of goods sold because of natural rubber price reduction approximately 30 percent
0.0
0.2
0.4
0.6
0.8
1.0
1.2
1.4
1.6
1.8
2.0
0.0%
50.0%
100.0%
150.0%
200.0%
250.0%
PHR DPR TRC HRC TNC DRC CSM SRC
ROE Leverage EAT margin Asset turnover

Tires and Natural Rubber
www.fpts.com.vn www.fpts.com.vn Bloomberg- FPTS <GO> | 56
over the same period. These advantages helped both companies improve their cash
flow significantly.
With the large investment for full-steel Radial factories, both of DRC and CSM had
large negative investment cash flow in 2013. In 2014, both DRC and CSM have been
operating their 2 factories, so investment cash flow in 6 months of 2014 have been
sharply decreased, compared to earlier of the year. In the other hand, SRC currently
has no plans to invest, but their investment cash flow increased mainly from loan
interest and dividends.
In contrast, cash flow from operation of Natural Rubber group in the first 6 months of
year were all negative because of decreasing in sale due to price reduction of natural
rubber.
DPR is in the final stages of rubber plantation in Dong Phu Cambodia – Kratie
project, planted area is 6,335 hectares, and while the remainder primarily in
progressing investment costs so the investment cash flow decreased, compared to
earlier of the year. Therefore, DRC has disbursed loan financing for investment
projects in Cambodia to make financial cash flow lower than a year earlier. PHR had
finished planting about 7,583 hectares in Cambodia in 2013, so investment cash flow
was back to positive within the first 6 months of this year.
TRC’s investment cash flow increased strongly in the first 6 months because they
paid back reciprocal capital (amount of loan guarantees for division in Cambodia).
This fund was financed by short-term loans. Therefore after revocation, TRC had
used this money to repay short-term borrowings and led to financial cash flow
decreased strongly compared to earlier of the year.

Tires and Natural Rubber
www.fpts.com.vn www.fpts.com.vn Bloomberg- FPTS <GO> | 57
C. Investment Recommendation
Code Recommendation
Market
price
30/09/2014
Target
price % +/-
EPS 2014 %Foreigner’
s own
PE
2013 2014E Trailing Forward
PHR Neutral 29,000 30,300 +4.4% 4,744 2,154 19.77% 6.2x 11.0x
DPR Reduce 43,200 35,400 -18.0% 8,706 4,723 26.21% 6.3x 7.5x
TRC Neutral 32,000 33,200 +3.7% 7,893 5,088 21.42% 4.7x 7.5x
HRC Sell 39,000 22,000 -43.5% 3,739 3,110 5.30% 9.6x 7.0x
DRC Neutral 61,000 60,300 -1.1% 4,519 4,850 36.82% 13.6x 11.5x
CSM Neutral 46,600 48,200 +3.4% 5,351 4,820 25.23% 8.7x 10.0x
SRC Add 29,900 30,600 +2.3% 3,592 4,081 6.76% 7.8x 7.2x
Source: FPTS
PHR NEUTRAL – Target price 30,300 VND/share
In the first 6 months of 2014, PHR produced 12,349 tons, an increase of 17.5% yoy
(10,511 tons in 2013), and achieved 43% of the plan for the whole year (28,500
tons).
The average sales price in the first 6 months is VND 45.7 mil per ton, reducing
by 25% yoy (VND 61 mil per ton in the first 6 months of 2013).
After the first 6 months, total revenue is VND 691.6 bn, increasing by 8.7% yoy,
achieving 46% of the 2014 plan. This growth is attributed to the increased activities
of collecting, processing and exporting. However, as the collected rubber has a
lower profit margin compared to self-exploited rubber as well as selling price
decreases by 25.1% yoy, the total profit margin is only 18.8%, lower than the figure
of the same period last year (26.7%). EBT of the first 6 months is VND130 bn, a
decrease of 23.5% yoy, achieving 49% of the plan.
Recommendation:
According to our projection, with the current price being around 40-43 mil
VND/ton, it is very likely that 2014 revenue of PHR will be VND 1,527 – 1,583
bn, exceeding 0.7-4.4% of the plan, decreasing by 16-20% yoy. EBT is
estimated to be VND 221-245 bn, being 8-17% lower than 2014 plan and
decreasing by 49-54% yoy.
With such estimations, EPS 2014 will be 2,154-2,388 VND/share. Accordingly,
with the current trading price dated Oct 3rd of 29,800 VND, PHR is trading with
PE forward of 11x, relatively high compared to the average (7.0x). Target price
according to FCFF is 30,300 VND. We recommend staying NEUTRAL for this
stock.
(Turn back)

Tires and Natural Rubber
www.fpts.com.vn www.fpts.com.vn Bloomberg- FPTS <GO> | 58
DPR NEUTRAL – Target price 35,400 VND/share
DPR had an accumulated value of the first half of 2014 of 6,411 tons, an
increase of 18.9% yoy (5,393 tons in 2013), achieving 33.7% as planned for the
year (19,000 tons).
Average selling price of the first 6 months was 43.6 mil VND/ton, a decrease of
26.0% yoy (59.7 mil VND/ton).
For the past 6 months, total revenue was 339 bn VND, an increase of 4.6% yoy,
achieving 33.8% as planned for 2014. This improvement is attributed to the
increased volume from the collect-process-sell process (twice as much as the
figure of 2013). However, collected rubber has profit margins lower than those
of in-house tapped rubber, not to mention the fact that selling price reduced by
26.9% yoy leading to total profit before tax margin of the company acquiring
only 27% compared to 53% yoy. Therefore, profit before tax of the first 6 months
were 91.5 bn dong, a decrease of 46.7% yoy and met 36.7% as planned for the
whole year.
Recommendation: Our forecast is that, with the current selling price of around 36-40 mil
dong/ton, the whole year’s revenue will be around VND 925-940 bn, reaching 92% of the
plan. PBT 2014 is projected to be VND 211-221 bn, achieving 85-89% of the 2014 plan,
a decrease of 46% yoy.
Based on the estimation above, EPS 2014 will achieve 4,565 – 4,723
VND/share. PPR is accordingly traded with PE forward ratio of 9.1x (at 43,100
VND/share on Oct 3), which is higher than the average industry PE ratio of 7.0x.
Dong Phu Rubber has finalized its decision to buy treasury stock of 2,000,000
shares at lower than 50,000 VND/share scheduled from Oct 1 to Oct 30, 2014.
Supposed that all these shares are purchased, the total number of treasury
shares will go up to 2,875,210 shares (6.68% of total shares). I should suggest
that the purchasing of treasury shares will benefit DPR stock in a short time with
volatility ranging from 40,000 to 50,000 VND.
However, with the aforementioned target price based on P/E method, it is
advisable to remain NEUTRAL for this stock. (Turn back)
TRC NEUTRAL – Target price 33,200 VND/share
For the first half of this year, total selling volume is 4,773 ton (+11.9% yoy), reaches
34.9% of the plan (13,670 ton).
The average selling price (ASP) reaches 45.3 million VND/ton, decreases 26.1% yoy
(the price of 1H2013 is 61.4 million VND/ton).
1H2014, total revenue is VND 232.8 bn, declines 2.5% yoy, reaches 32.2% of 2014
plan. As a result, rubber sector reaches VND 217 bn, rises 11.8% yoy thanks to the
sharp increase of selling quantity (+51% yoy). In addition, financial revenue
contributes VND 19.2 bn and about VND 49.9 bn from liquidating of rubber tree.
Profit before tax (PBT) of the first half of 2014 is VND 83.1 bn. It falls 19.9%
compared to the same period of 2013 and achieves 60% of the plan. However,
51%of PBT comes from liquidating of rubber tree and only 23% contributed by core
business (rubber latex business). In the last years, the contribution between
liquidation and rubber latex business is highly balanced whatever it is a big difference

Tires and Natural Rubber
www.fpts.com.vn www.fpts.com.vn Bloomberg- FPTS <GO> | 59
between these sectors this year. It reflects the difficulties of the company at present.
The profit for rubber business is very slow based on the current selling price.
In the first half of 2014, TRC has just reached about 32.2% by quantity of the year
plan. In order to achieve the plan, the average selling quantity must be 1,453
ton/month in the second half, 24.6% higher than the average quantity of 2013. It is a
big challenge for TRC.
In the first week of Sep 2014, the price of latex and SMR10 is 30.3 million VND/ton
and 33.4 million VND/ton, respectively. The price of SVR10 and SVR3L at the Mong
Cai border gate is only 33.2 million VND/ton and 33.8 million VND/ton, respectively.
These are the main products and occupies 95% of total selling volume of TRC. In
the fact that, the tapping volume will highly rise for the remain of the year by season.
In the past, the price often has the downtrend, it is so difficult for TRC to achieve the
target selling price (45 million VND/ton). We predict that the probability for TRC to
meet the year plan is so slow.
Recommendation:
The revenue of rubber latex business of the second half could be VND 314 bn basing on the ASP of 36-40 mil VND/ton. We forecast that total revenue of TRC will reach VND 573 bn equivalent to 80% of the plan. Therefore, the total revenue of rubber latex business will be about VND 532 bn. The estimated PBT is VND 168 bn, 23% higher than the plan but decrease by 37% compared to the result of 2013. Consequently, the EPS will be 4,740 VND/share. The target price for this year of TRC is VND 33,200/share by PE method with the PE ratio of 7.0x.
We recommend staying NEUTRAL for this stock. (Turn back)
HRC SELL
In August 2014, the company exploited 168.9 tons and an accumulated volume of
the first 8 months of 449.7 tons equal to 28.1% of the plan (1,600 tons). Also, the
company collected and purchased an accumulated volume of 1,799 tons.
Consumption volume of the first 8 months of 2014 is 2,436 tons (42% of the plan)
with revenue being VND 107.7 bn which is equal to 41% of the whole year
Currently, HRC is going through an intense process of replanting about 50% of the
rubber tree area. Therefore, the latex yielded in the current phase is rather low with
most of its being collected from smallholder farmers before processed and exported.
This makes an adverse impact on the sales performance of the company. An
example is that after the second quarter the year, without the clearance sales of the
rubber plantation, the company would have suffered losses. As encountered by
many difficulties, rubber prices reduce continuously (about 30% yoy) with more and
more exploiting areas being reduced causing a hindrance to HRC and other
companies in the industry. In this case, HRC has made investment in the four rubber
companies namely Viet Lao Rubber Co. (15% of chartered capital); Binh Long
Rubber Co. (7.1% of chartered capital); Ba Ria-Kamphongthom Co. (13.5% of
chartered capital), Lai Chau Rubber Co. (4.1% of chartered capital) to earn some
shared profits, thus saving the company through this difficult time.
To maintain the current pace, HRC will have to consume 841 tons every month for
the last 4 months to finish the plan of 5,800 tons. Revenue for the last 4 months is
expected to be around VND 123 bn. The projected revenue of this year is thus
around VND 230.7 bn achieving 88% of the plan. The company is forecast to
liquidate over 1,100 ha. For the past 8 months, 814 ha has been liquidated, leaving
the remaining 300 ha for the last 4 months. Revenue and profit are expected to be

Tires and Natural Rubber
www.fpts.com.vn www.fpts.com.vn Bloomberg- FPTS <GO> | 60
approximately VND 21 bn and VND 20.7 bn accordingly. EAT this year is thus around
VND 53.7 bn, achieving 77% of the plan.
Recommendation: Based on the above forecast, EPS 2014 is likely to achieve 3,110
VND/share. With the current 40,100 VND/share (Oct 3, 2014), HRC is trading at a PE
forward rate of 12.9x, which is higher than the average in the industry (7x). We,
therefore, recommend SELLING HRC shares. (Turn back)
TNC SELL
Despite being a corporation specializing in planting, processing and selling rubber,
TNC has some parts of its annual revenue traced back to the selling of cashew and
fodder and woodwork. In the first 6 months of the year, let alone a hard time of the
rubber business reducing its revenue to only VND 22.9 bn (50% yoy), the other
business of cashew, woodwork is no longer yielding profits. The fodder business is
also in the decrease with revenue being one-third of than in 2013.
EAT of the first 6 months is not yielded from the core business but from financial
activities and liquidation of the rubber plantation. In other words, with rubber price
decreasing during the first 6 months (28% yoy), the company only acquired gross
profit of 568 mil VND (compared to VND 9.8 bn in 2013). However, with more than
VND 8.7 bn from financial activities and VND 8.6 bn from liquidation of the rubber
plantation, EAT of TNC bounced back to VND 11.26 bn.
Recommendation:
According to the Resolution of the board in April 2014, the company has adjusted its
plan of EBT from VND 27 bn to VND 15 bn (Link). Therefore, the business result of the
first 6 months reveals that the company has achieved 75% of the adjusted plan.
However, we do not highly appreciate the results due to the fact that the profit is hardly
earned from its core business.
Because of its modest scale, quite unproductive and unstable business, TNC is still
rather far from being of the same rank as other listed companies. EPS 2014 is expected
to be 694 VND/share. On Oct 3, 2014, the price was 12,100 VND/share, and this reflects
that TNC is trading at a PE forward rate of 17x, which is extremely greater than the
average of 7.0x. Therefore, we recommend SELLING this stock in the near future.
(Turn back)
DRC HOLD – Target price 60,300 VND/share
In the first 6 months of 2014, DRC had net revenue of VND 1,545 bn (achieving
45.3% of the 2014 plan, increasing by 12.1% yoy). In particular, domestic
sales accounted for 90%, equivalent to a growth of 14%; export revenue
growth is 12%. EBT is VND 287 bn (55.3% of the 2014 plan, decreasing by
5.8% yoy). EBT has reduced due to the fact that the company had to incur the
depreciation cost and loan interest for the Radial project.
Despite little profit yielded from Radial tires, what matters most is the high
consumption of DRC’s products in the market. In the first stage, the consumption
progress of radial tires, rather than their profits, is of greatest concern. In the first 6
months of the year, the company has produced more than 42,500 Radial tires with

Tires and Natural Rubber
www.fpts.com.vn www.fpts.com.vn Bloomberg- FPTS <GO> | 61
monthly volume boosting from 6,000 to 10,000 tires. This proves the recognition of
DRC’s tires in the market and helps increasing the market share for this segment.
In the long run, impressive growth is predicted once produced volume is also in the
increase.
Revenue of the third quarter of 2014 is expected to achieve VND 894 bn, an
increase of 42% yoy. EBT of the third quarter of 2014 is estimated to be around
VND 90 bn, reducing by 25% yoy. This is due to the fact that DRC had to incur the
depreciation cost and loan interest for the Radial project, which accumulate up to
VND 48 bn in the third quarter of 2014.
In spite of the reduced EBT, it should be noticed that the consumption of DRC
proves to be very promising, which makes DRC being among the top 3 listed tire
enterprises with the most impressive growth. This will help lay a solid foundation
for DRC to maintain and improve the production of Radial tires for the rest of the
year and the following years. (Turn back)
Recommendation: It is estimated that EBT of DRC will be around VND 473-491 bn.
EPS 2014 is expected to be around 4,450 – 4,615 VND/share, achieving 96-98% of the
plan. Target price according to PE will be 54,000 VND/share and according to FCFF, it
will be 60,300 VND/share (from now to mid-2015). We recommend HOLDING this stock
for middle-long term investment.
CSM HOLD – Target price 48,200 – 51,500 VND/share
Accumulated during 6 months of 2014, net profits of CSM reached VND 1,468 bn,
achieving 43.8% of 2014 plan and reducing 3.8% yoy. In particular, export revenue
reached VND 435 bn, securing 43.5% of the year plan. EAT also reached VND 217 bn,
achieving 72% of 2014 plan, a decrease of 2.7% yoy.
The consumption of all-steal Radial tires: During the first 6 months of the year, CSM
has yet to record depreciation and interest expense of the Radial project into the general
business results. Then these figures will be excluded in the business result of the first
6 months. The company sold about 1,500 tires this June and 7,000 tires this July and
August. This year plan is 50,000 tires. Therefore, for the remaining 7 months, there
should be 6,928 tires sold each month. With the current pace of consumption, CSM is
expected to sell about 35,000 tires/month and earn VND 170 bn for the revenue of the
year. The company is going to send their samples to the USA, Japan and some
European countries requesting for some export certificates like DOT (the USA), JIS
(Japan) and E-mark (Europe). These certificates are likely to be offered by the 4th
quarter of 2014.
The sharp decrease in price of rubber material (from 43 mil VND/ton early 2014 to 33
mil VND/ton currently) would help improve profit margin of the last 6 months and
simultaneously partly cover the expense of depreciation and loan interest of the Radial
project. Hence, EAT this year is forecasted to be around VND 325-347 bn, which would
be 3.6-9.7% lower yoy. The loss here could be attributed to the Radial business which
has yet to yield money making a negative influence on the overall profit of the company.
Tires and Natural Rubber
www.fpts.com.vn www.fpts.com.vn Bloomberg- FPTS <GO> | 62
Information on the transfer of real estate project
Project No. 09 Nguyen Khoai, District 4, Ho Chi Minh City:
Casumina is divesting itself of this project and transfer it to Novaland (this is a joint
venture project with Tan Thuan Viet). The total proceeds are about VND 225 bn with
VND 100 bn being paid to Casumina and the outstanding VND 125 bn being equally
divided for the next 6 quarters. Accordingly, the company will receive 20.8 bn
VND/quarter. This project transfer is expected to yield a profit of VND 75 bn with the
profit being subject to the payment schedule). For this year, estimated profit is about
VND 28-37.5 bn.
Project No. 504 Nguyen Tat Thanh, District 4, Ho Chi Minh City: the company will
withdraw its invested funds and receive a reimbursement of VND 20 bn and other
related cost. The company is current doing the paperwork so that there is no official
written proof for this. Until then, this should not be included in this year’s business
performance.
Recommendation:
This year, despite the decrease in profits compared to that of the previous year
2013, it should be taken as an inevitable outcome of the operation of Radial
factory. On the contrary, it should be highlighted that with the above forecasted
consumption, it is highly possibly that the company could achieve 10-11% of
productivity in phase 1.
EAT 2014 is predicted to be around VND 325-347 bn with EPS 2014 achieving
4,820 VND/share (excluding the profit from the project transfer) and 5,150
VND/share (including the profit from the project transfer). Target price at the end
of the year is 48,200 – 51,500 VND, we recommend staying HOLD this stock
(Turn back)
SRC ADD - Target price: 30,600 VND/share
SRC is considered that has the lowest competition among 3 listed tires companies
(DRC, CSM, SRC). Specifically, bicycle tires market now meets saturation. The low
potential growth of the market limits the future growth of the company. The revenue
of the first half decreases by 1.4% yoy, it is very difficult for SRC to push the tire
sales of the company.
The export market is seen as the bright chance remain of the company. However,
the export revenue of 2Q2014 declines by 4.5% yoy, it shows that the export sector
is struggled. Although the natural rubber price fell by 20-25% yoy, the gross profit
margin of SRC also declines slightly yoy, including: the gross profit margin of the
first 6 months is 19.3% compared to the 19.9% of the same period of last year.
Recommendation:
This year, we expect that the business result will be more positive than the last year
thanks to the high growth of demand on almost of tires of the market in general and
SRC in particular. As the data we collected, the sale volume of the first 8 months
grows quickly such as: bicycle tires increases by 10% yoy; motorcycle tires
increases by 40% yoy. Therefore, we forecast that the revenue of 2014 will reach
VND 959 bn (-2.5% yoy); profit before tax (PBT) will be VND 95.3 bn (+ 9.2% yoy).

Tires and Natural Rubber
www.fpts.com.vn www.fpts.com.vn Bloomberg- FPTS <GO> | 63
Consequently, EPS of 2014 will be 4,081 VND/share. The target price for 12-month
basing on PE method is 30,600 VND/share which is higher than 9% compared to
the current market price (28,000 VND/share 29/09/2014). We recommend
ADDING for short-term investment.
For long-term period, the potential growth of SRC is very poor because the
company has no plan to develop new product or expand production. If there is no
strong and suitable changes in production, it is very difficult for SRC to have the
high growth in future.
(Turn back)

Tires and Natural Rubber
www.fpts.com.vn www.fpts.com.vn Bloomberg- FPTS <GO> | 64
D. APPENDIX
Area, Volume, Tapping yield of Vietnam natural rubber by province in 2013
Location Area Tapping area Volume Tapping yield
North 25,102
Ha Giang 1,105 - - -
Lao Cai 1,516 - - -
Yen Bai 1,291 - - -
Phu Tho 188 - - -
Đien Bien 4,257 - - -
Lai Chau 10,168 - - -
Son La 6,577 - - -
North Central and Coast Central
140,775 62,216 79,525 1,283
Thanh Haa 18,326 6,402 5,960 931
Nghe An 9,501 3,987 4,651 1,167
Ha Tinh 10,722 2,601 2,301 885
Quang Binh 14,821 4,566 4,461 977
Quang Tri 18,542 10,906 14,265 1,308
Thua Thien Hue 9,270 5,897 6,782 1,150
Quang Nam 12,880 2,684 3,355 1,250
Quang Ngai 1,231 506 416 822
Binh Đinh 68 4 5 1,400
Phu Yen 4,376 2,000 2,675 1,338
Binh Thuan 41,038 22,664 34,954 1,542
Highland 114,687 178,920 1,560
Kontum 72,870 24,270 37,866 1,560
Gia Lai 105,064 58,019 89,930 1,550
Dak Lak 39,985 20,383 31,365 1,539
Dak Nong 31,739 12,015 19,759 1,645
Lam Đong 8,738 - - -
South East 535,514 371,298 690,355 1,856
Binh Phuoc 232,051 142,981 264,902 1,853
Tay Ninh 98,170 76,969 165,526 2,151
Binh Duong 133,155 108,484 194,849 1,796
Đong Nai 44,514 27,289 42,125 1,509
Ba Ria VungTau 23,624 12,175 15,953 1,310
Ho Chi Minh city 4,000 3,400 7,000 2,059
Total 959,787 548,835 949,100 1,729 Source: VRA, VRG, MARD
Area, volume and tapping yield by business sector in Vietnam in 2013
(Turn back)
Types Plantation Area Volume Tapping yield
ha % Ton % Ton/ha
Large holder 503,061 52.4 261,953 47.2 1.71
State-owned 424,194 44.2 251,566 45.8 1.71
Private 78,867 8.2 10,387 1.9 1.64
Smallholder 456,726 47.6 286,882 52.3 1.75
Total 959,787 100 548,835 100 1.73

Tires and Natural Rubber
www.fpts.com.vn www.fpts.com.vn Bloomberg- FPTS <GO> | 65
(Turn back) The differences between Vietnam and other South East countries in Rubber Industry
Management
According to the statistics of the distribution area about big four countries in rubber
industry including Thailand, Vietnam, Indonesia and Malaysia, we can recognized that
different from Vietnam, most of rubber areas in 3 other countries are belongs to
smallholdings (over 85 percent). Therefore, mechanism for management, operation and
coordination of the rubber industry are different from Vietnam. Currently, Rubber
Industry is operating without direct management of the State. On the other hand, rubber
industry in Malaysia, Thailand and Indonesia are managed directly by the State through
the Bureau of Rubber or other authorities responsible for the rubber industry. In
Vietnam, there are misunderstandings that Vietnam Rubber Group (VRG) is
representative of State’s management for Vietnam’s Rubber Industry. In deep, VRG is
just a business owned by the State, operates and holds dominant shares in the
members of the group. VRG has no management function for the Natural Rubber
Industry in the country. In Vietnam, there is no state agency that is specialized for the
rubber industry, but it is under management of the Ministry of Agriculture, subject to the
general management along with other agricultural commodities such as rice, cassava,
etc. through the Department of Agriculture and Forestry products processing. Therefore,
in Vietnam, there is no separation, no mechanism for the rubber industry. This situation
leads to the lack of uniformity in scheme of rubber area, product distribution between
the regions in the country. It is very weak and asynchronous in control of rubber quality
in domestic and exported rubber products.
In three other countries, government policies often support smallholder about seeds,
initial investment cost for planting rubber trees. About financial problem, smallholder
farmers receive support from the purchasing enterprises (similar to deposits) to invest
in their rubber plantation and also ensure output for production and price, whereby
mutually beneficial for both sides. However, financial pressures to maintain long-term
garden has always been a difficult problem for Malaysia, Indonesia, Thailand and
Vietnam, especially in current rubber price situation at low level.
(Turn back)
Consolidated for VRG Source: FPTS
Operating structure of VRG

Tires and Natural Rubber
www.fpts.com.vn www.fpts.com.vn Bloomberg- FPTS <GO> | 66
Quality
Domestic rubber products are tested and certified according to the Vietnamese
Standard (TCVN 3769: 2004, TCVN 6314: 2007, etc). Currently, in domestic market,
although VRG‘s rubber products (accounting for 41 percent of production and 28
percent of the country) is well qualified for Vietnamese standards and International
standards for through cross-checking programs among members within the Group and
standards of national laboratories pretty tough for each laboratories of division
members. However, private sector and smallholders which accounts for 47 percent of
area and more than 55 percent of rubber products in domestics market haven’t ensure
their goods to meet the standards. Furthermore, if import parties do not suggest quality
certificates, private sectors also eliminate quality control to reduce costs. This is the
main factor that causes to downgrade exported quality of rubber products and influence
to the whole Vietnamese natural rubber industry from past to present. It makes a
decrease in reputation and export price of Vietnamese rubber products always lower
than Thailand, Malaysia and Indonesia.
Featuring in three countries, planting area mostly are owned by smallholders and have
large scale even comparable to member of VRG, so the nation has to establish
specialized sections as co-operatives to manage and support about breeding, farming
techniques, purchasing management and quality control in every location. Trading latex
auction will be held through the centralized auction in each location. Furthermore,
Malaysia, Indonesia and Thailand have technical standards department for latex
collection process at every auction and additional verification at factories before being
into production. These factors help to create strict management and quality assurance
input of purchased latex from smallholders in order to ensure for them similar price to
the market and control quality right from the beginning stages. This is also the weakness
of Vietnamese rubber industry. Procurement mechanism still quite fragmented,
depending on each factory. Most of rubber manufacturing companies purchases latex
by their own. On the other hand, smallholder farmers usually owns small orchards with
less output, forced them to sell through dealers before being sold to the factory. From
there arise two problems: (1) lower selling price than the market price due to the low
quantity of smallholdings; (2) reduction of latex quality by mixing to make more profit
from dealers.
Export quality is a matter for serious consideration by the fact that in all four countries,
the production of rubber created mostly for export, domestic consumption rate is not
high such as 13 percent in Thailand, 19 percent Indonesia, 55 percent in Malaysia, and
about 15-16 percent in Vietnam. In Thailand, Indonesia and Malaysia are very strict in
management of product quality from input to output of finished products. Typically in
Malaysia, rubber products must be examined by the Rubber Research Institute before
certified rubber products originated from Malaysia prior sale. It is the key that helps to
build great reputation of rubber products quality for these 3 countries on the global
market. The rubber quality management in Vietnam is not really tight and inconsistent
(mostly affected by the private sectors, smallholders). It led to the situation that the
rubber qualities are not ensured to create reputation on the global market, and
decreases competitive abilities on price in the market, and usually have to consult these
3 countries’ prices. (Turn back)

Tires and Natural Rubber
www.fpts.com.vn www.fpts.com.vn Bloomberg- FPTS <GO> | 67
Tapping Yield issues (Turn back)
The positive point of Vietnam rubber industry compared to 3 other countries above
(Thailand, Indonesia, Malaysia) is rubber garden‘s proportional that owners fairly
between the smallholder sector and the state sector corresponding 47 percent and 53
percent. In these 3 countries, smallholders usually have large scale (even the equivalent
to divisions of VRG), this group accounts for a very high proportion (over 85 percent).
In fact that the rubber plantation area of Thailand, Indonesia are 3.5 times larger than
in Vietnam led to conditions for testing and deployment in large area have many
difficulties and asynchronism. It makes a reduction in the general productivity of the
whole industry. In Vietnam, the Breeding Research Institute is considered in the top 3
in the world with a lot of new breeds and high quality research published every year.
That advantage and large planting area of VRG are favorable conditions for
experimenting new seeds. If it is successful, it can be done instantly on a large scale,
and then recommended for smallholder farmers to apply. This helps to shorten
application time of new seeds, and improve productivity on nationwide area. Thus,
Vietnam today is a country that has highest yield of rubber exploitation in the world.
During the past 3 years, tapping productivity is always higher than 1.7 ton per hectare.
This is the advantage of Vietnam's rubber industry than other countries.
Based on evaluations and analysis above, we can realize current problem of Vietnam's
rubber sector is that policies to allocate rubber products suitable for domestic
consumption and export. It needs a management agency for Rubber Industry.
Moreover, Vietnam needs to be aggressive in the management process of rubber
products quality; there should be mechanisms and policies as well as the technical
standards with strict quality control steps through input to output, especially for export.
If we can accomplish these works, reputations and competitiveness of Vietnam Rubber
products will be greatly enhancing on the international market, in order to motivate work
strategic planning and development of domestic rubber.
(Turn back) Policies related to Vietnam’s Natural rubber industry
Decision 1003/QD-BNN-CB by the Ministry of Agriculture and Rural Development
According to Decision 1003 / QD-BNN-CB by the Ministry of Agriculture and Rural
Development signed on 13th March, 2014 about raising the added value of
agricultural, forestry and fisheries sector in processing and reducing losses after
harvesting.
In particular, natural rubber products will focus on improving the manufacturing
proportion of high value rubber such as SVR 50, SVR 60 and reducing SVR 3L,
according to the following structure: SVR CV 50, 60 (rubber tube, buffer in
automobiles, high-class automobile tires, etc.) accounts for 25 percent; SVR 3L
accounts 20 percent; latex accounts for 20 percent; and RSS, SVR 10 and SVR
20 accounts for 35 percent remaining.
According to our evaluation, this project will help to standardize the structure of
latex products in Vietnam as well as a way to categorize groups of rubber
enterprises producing in the country, and create competitive advantages for
Vietnam rubber in the region and the world. Specifically, in listed rubber
Tires and Natural Rubber
www.fpts.com.vn www.fpts.com.vn Bloomberg- FPTS <GO> | 68
companies, PHR has strength of latex SVR 50, 60; DPR specializes in SVR 3L,
10, 20; TRC has 70 percent of output that is latex, etc.
In addition, the project also will improve oriented investment of processing for
rubber products such as tires, gloves, mattress, etc. to increase rubber domestic
consumption from 17 percent to 30 percent in 2020. The project will raise demand
for rubber in domestic market in order to ensure output for domestic
manufacturing companies.
Decision of reducing exports tax for rubber products by Ministry of Finance
The Ministry of Finance issued Circular No 111/2014 / TT-BTC to amend the
export tax rate for some rubber goods in group 40.01, 40.02, 40.05 stipulated at
the Export Tariff issued together with Circular No. 164/2013 / TT-BTC to 0
percent, applicable from 02 rd Oct, 2014.
Previously, natural rubber latex have piece shape such as SVR 10, 20, L, 3L;
RSS; crepe latex, and mixtures rubber not vulcanized subject to export tax of 3
percent and synthetic rubber of 5 percent. However, these taxes were reduced to
1 percent in 2013, and now reduced to 0 percent for all items.
As an objective assessment, the tax reduction has a positive impact that
businesses promote product diversification to reduce outlet risk for rubber
products. However, considering about supporting levels for the industry, this is
not big enough because of strong reduction of rubber price in global market.
Furthermore, the important issue is the global rubber supply is relatively high
compared to demand. As estimated in 2016, new demand-supply gap will be
shortened. Therefore, this is only technical measure in the current difficult
situation.
According to our assessment, reducing export tax has only short-term effects. In
long- term consideration, it is more important to have flexibility in applying export
duty based on different market, on different prices at specific period time and on
clearly identical purpose of using tax revenues from exporting rubber products to
contribute in improving rubber products quality of Vietnam.
Exemption Personal Income Tax for rubber household
Deputy Minister of Finance, Mr. Tuan Hoang Anh Do has written documentation
for Taxation Department of the province or city under State‘s management to
conduct about personal income tax exemption for families and individuals who
plants rubber trees. Accordingly households and individuals who directly involve
in production of unprocessed rubber into other products or preliminarily
processed, they will be exempt from personal income tax.
According to our assessments, this is a measure of supporting and sharing with
rubber farmers in the difficult situation of the whole industry in Vietnam today to
help stabilizing psychological as well as guaranteed income for rubber farmers.
This will also be the motivation for households to maintain rubber plantation area
to ensure the area planted and mining production in the country.

Tires and Natural Rubber
www.fpts.com.vn www.fpts.com.vn Bloomberg- FPTS <GO> | 69
Establishment of Triangle Rubber Area in Indochina
Rubber Association, ministries and agencies are studying ways to establish rubber-
trading platform in 2015 in order to achieve transparences and fair prices for buyers
and sellers. In order to ensure sustainable development of as well as ensure
abundant commodity trading floor, VRG has been promoting cooperation rubber
development in Laos (30,000 hectares) and Cambodia (100,000 hectares) to form a
triangular Indochinese area with oriented development as the world's largest rubber
area. This is considered as a well long-term development for the rubber industry of
Vietnam. If successful, this establishment will help to enhance position as well as the
voice of Vietnam in the global rubber industry, and bring many benefits to businesses
and smallholder in the industry.
Business performance of Tires enterprises in the World
Brand Country ROE Gross margin PBT margin
2012 2013 2012 2013 2012 2013
Bridgestone Japan 13,69 12,70 33,64 36,45 8,82 9,53
Yokohama Japan 17,72 14,74 32,53 34,26 9,25 9,28
Michelin France 17,92 12,68 31,25 31,64 10,18 8,41
Goodyear USA 37,90 63,70 18,24 21,07 2,10 4,16
Cooper USA 33,00 12,70 15,57 15,01 8,77 6,19
Pirelli Italia 17,27 12,88 - - 9,71 8,41
Kumho Korea 14,43 5,56 18,92 20,12 2,19 3,35
Nokian Finland 25,23 12,99 44,14 46,09 24,04 20,57
Source: Bloomberg
(Turn back) Analysis of the value chain of Vietnam tire industry
Materials
At present, the tire industry of Vietnam is taking advantage of the natural rubber
material abounding in our country at a very reasonable price. Synthetic rubber, on
the other hand, has to be imported from Korea, China and Taiwan with annual
imported value being up to USD 500 mil. The two world-renowned manufacturers of
synthetic rubber are Lanxess (Germany) and Sinopec (China). Chemicals, fabric and
black coal used in making tires are largely imported from China. As for metal, though
domestically made, the production is not great enough to satisfy the demand leading
to importation from other countries.
Materials structure in tires production (% on quantity)
Materials Passenger car
tires Light truck tires OTR tires
Natural Rubber 47% 45% 47%
Coal 21.50% 22% 22%
Steel 16.50% 25% 12%
Textiles 5.50% - 10%
Chemicals, other materials 9.50% 8% 9%
Source: FPTS

Tires and Natural Rubber
www.fpts.com.vn www.fpts.com.vn Bloomberg- FPTS <GO> | 70
Sources of Materials
No. Materials Suppliers
1 Natural rubber Domestic
2 Synthetic rubber Taiwan, Korea, Japan, Thailand
3 Black coal India, Korea, Japan, Australia
4 Chemicals Taiwan, Viet Nam, Japan, Thailand
5 Steel Malaysia, Korea, Viet Nam, Japan, Thailand
6 Textile China, US, Japan, Thailand
Source: FPTS
Production (Turn back)
Production capacity and consumption demand within the country.
According to the statistics up to 2013, the total number of produced tires of the whole
country is 59.6 mil tires with tires for bikes accounting for 39% (23.3 mil tires), tires for
motorbikes constituting about 50% (30 mil tires) and auto tires taking up the remaining
11% (6.30 mil tires). For the past 5 years, these percentage figures have remained
quite stable.
Supply – Demand of domestic market
Items (million units/year)
2011 2012 2013
Consumption demand
Bicycle tires - - 24.00
Motorcycle tires 35.78 38.02 37.50
Automobile tires 4.32 4.58 5.00
Production
Bicycle tires 21.30 22.28 23.30
Motorcycle tires 28.40 29.19 30.00
Automobile tires 3.08 3.08 6.30
Source: MOIT, Vietnam Register, FPTS
Source: MOIT, FPTS
Structure of domestic tires
production
Domestic capacity of tire
production
-
5,000
10,000
15,000
20,000
25,000
30,000
35,000
2011 2012 2013
Bicycle Tire Motorcycle Tire Automobiles Tire
39%
50%
11%
Bicycle Tire
Motorcycle Tire
Automobiles Tire
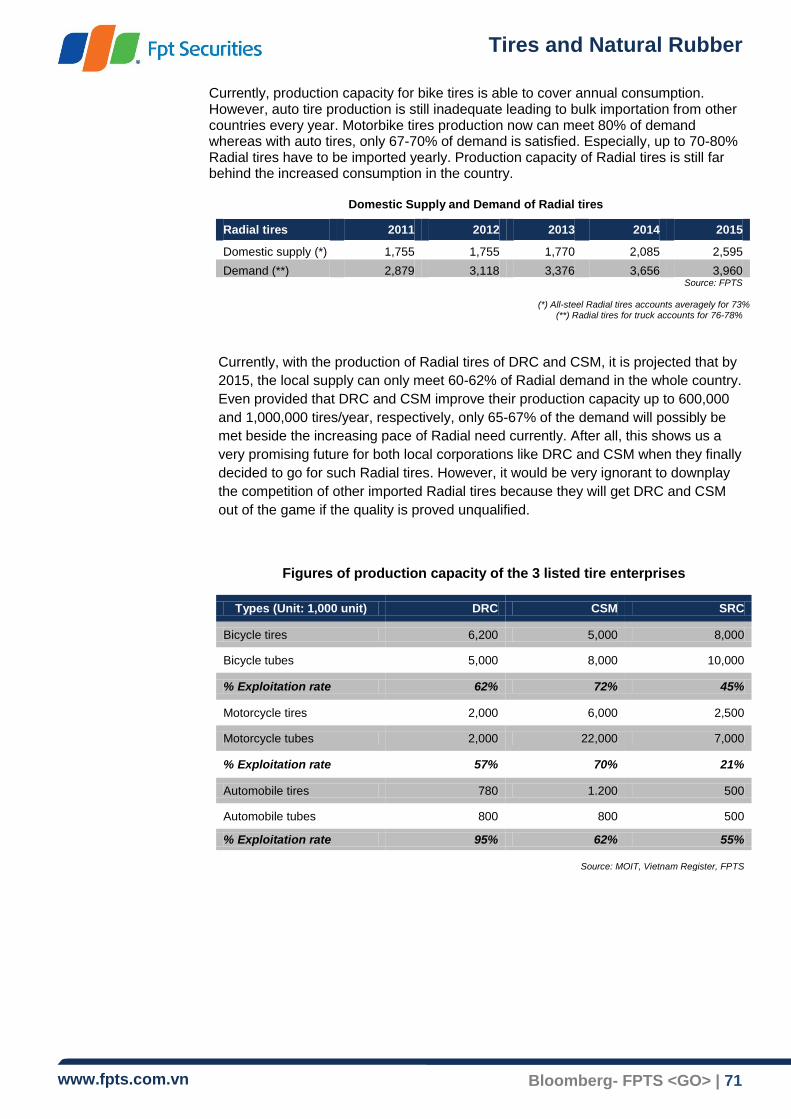
Tires and Natural Rubber
www.fpts.com.vn www.fpts.com.vn Bloomberg- FPTS <GO> | 71
Currently, production capacity for bike tires is able to cover annual consumption. However, auto tire production is still inadequate leading to bulk importation from other countries every year. Motorbike tires production now can meet 80% of demand whereas with auto tires, only 67-70% of demand is satisfied. Especially, up to 70-80% Radial tires have to be imported yearly. Production capacity of Radial tires is still far behind the increased consumption in the country.
Domestic Supply and Demand of Radial tires
Currently, with the production of Radial tires of DRC and CSM, it is projected that by
2015, the local supply can only meet 60-62% of Radial demand in the whole country.
Even provided that DRC and CSM improve their production capacity up to 600,000
and 1,000,000 tires/year, respectively, only 65-67% of the demand will possibly be
met beside the increasing pace of Radial need currently. After all, this shows us a
very promising future for both local corporations like DRC and CSM when they finally
decided to go for such Radial tires. However, it would be very ignorant to downplay
the competition of other imported Radial tires because they will get DRC and CSM
out of the game if the quality is proved unqualified.
Figures of production capacity of the 3 listed tire enterprises
Types (Unit: 1,000 unit) DRC CSM SRC
Bicycle tires 6,200 5,000 8,000
Bicycle tubes 5,000 8,000 10,000
% Exploitation rate 62% 72% 45%
Motorcycle tires 2,000 6,000 2,500
Motorcycle tubes 2,000 22,000 7,000
% Exploitation rate 57% 70% 21%
Automobile tires 780 1.200 500
Automobile tubes 800 800 500
% Exploitation rate 95% 62% 55%
Source: MOIT, Vietnam Register, FPTS
Radial tires 2011 2012 2013 2014 2015
Domestic supply (*) 1,755 1,755 1,770 2,085 2,595
Demand (**) 2,879 3,118 3,376 3,656 3,960
Source: FPTS
(*) All-steel Radial tires accounts averagely for 73% (**) Radial tires for truck accounts for 76-78%

Tires and Natural Rubber
www.fpts.com.vn www.fpts.com.vn Bloomberg- FPTS <GO> | 72
Overview Capacity of Tire manufacturers in Vietnam
Foreign tire manufacturers like Bridgestone, Michelin, Kumho, Yokohama and
Goodyear are investing in Vietnam in the hope of turning Vietnam intro a new tire
manufacturing and consuming market of the world. With low labor cost, abundant
rubber material and export tax of 0% (compared to 8% of China), Vietnam proves itself
an advantageous destination for investment in tire manufacturing. As surveyed by
tirebusiness.com, Vietnam’s tire market is still very modest in scale compared to the
global scale (USD 800 mil vs USD 235 bn). However, those foreign manufacturers
hold the opinion that Vietnam is a fertile land to yield enormous profit with growth rate
of 20-25%/year. Currently, the segment for passenger cars is in the hand of foreign
corporations. Kumho (Korea), a typical example, has announced its investment of
another USD 100 mil in Vietnam for construction of a tire manufacturing factory in Ninh
Binh with the initial investment fund of USD 200 bn. The factory is projected to be
launched in 2015 with production capacity of 6.3 mil tires/year, a twofold volume
compared to this year of 3.15 mil tires/year. Bridgestone (Japan) has been given
investment license to invest more in the factory in Northern Hai Phong (from USD 574
bn to USD 1.2 bn) The expected capacity is about 9 bn tires/year, 5 to 6 times as many
as the productivity of the 2 Radial factories of Casumina and DRC combined in 2017
(equivalent to 49,000 tires/day). Kumho and Bridgestone, with their state-of-the-art
technique, are currently focusing on manufacturing Radial tires for passenger cars
and in the near future, for trucks as well. 95% of the production volume will be exported
to the North America, Middle East, Asia and Australia.
Source: FPTS
-
500
1,000
1,500
2,000
2,500
3,000
3,500
4,000
Bridgestone Kumho CSM DRC SRC Yokohama Others
Capacity
Domestic supply
Export

Tires and Natural Rubber
www.fpts.com.vn www.fpts.com.vn Bloomberg- FPTS <GO> | 73
In Vietnam, there are 3 local tire corporations with impressive business performance
namely: Da Nang Rubber JSC, Casumina and Sao Vang Rubber. Da Nang Rubber
JSC has the highest tire production volume in the industry and specializes in tires for
trucks, OTR trucks. Casumina is a popular brand name for motorbike or light-truck
tires. Sao Vang Rubber specializes in bike tires. Besides them, there are some FDI
corporations in Vietnam as follows:
Enterprises Capacity (1,000
unit/year)
Radial tires
Bias tires
Automobile tires
Light truck tires
Bus tires
Motorcycle tires
Industrial tires
Yokohama 800 x x x x
Chengshin Rubber
18,570 x x x x x
Kumho Tire 3,150 x x x
Kenda Rubber
2,000 x x x
Inoue
Rubber - x x
Sailun Tyre 12,000 x x x
Source: TireBusiness, FPTS
Effective performance by product
EBIT Margin Light truck and passenger car tires (< 9 seats)
Heavy truck tires Motorcycle tires
Bicycle tires
Global 9-15% 5-7% 6-7% -
Typical companies
Michelin, Continental, Pirelli, Bridgestone
Michelin, Continental
Falcon Tyres -
Viet Nam 19% 13% 14% 4,9%
Typical companies
DRC, CSM DRC CSM SRC
Source: Bloomberg, FPTS
There are various types of tires for the corresponding vehicles. However, the main
categories are: tires for light trucks and passenger cars (<9 seats), passenger cars (>9
seats), heavy trucks, motorbikes and bikes.
Among these categories, tires for trucks have the highest profit margin, followed by tires
for motorbikes and bikes. In the world, most of tire companies cater for the segments of
tires for passenger cars (<9 seats) and trucks because of their high profit margin. In
particular, 53% of the market share is held by large corporations like Michelin,
Bridgestone, Goodyear, Continental, Pirelli, etc. Tires for motorbikes and bikes are
mostly produced in frontier and developing markets like Vietnam, Sri-lanka, Brazil and
Malaysia. Interestingly, China which caters for every kind of tires with large-scale
production to supply global need has 27% of market share globally.
Distribution (Turn back)
Distribution of tires in Vietnam focuses mainly in the replacement tire segment (70-
80%). As for OEM tires, large corporations with well-known brands take over the
distribution of imported tires and tires manufactured by FDI companies operating in
Vietnam namely: motorbike tires (Kenda, Inoue, Chengshin, etc.), passenger car tires
(Michelin Bridgestone, Kumho, Continental, Pirelli, Maxxis, etc), truck tires
(Bridgestone, Kumho, Continental, Yokohama, Chengshin, etc.)

Tires and Natural Rubber
www.fpts.com.vn www.fpts.com.vn Bloomberg- FPTS <GO> | 74
It is inconclusive which of the OEM channel and replacement tire channel has higher
profit margin because the result is subject to the consumption scale of each channel as
well as the actual consumption percentage in sales proportion of each corporation. For
global corporations, the price was brought down by assembling companies making the
profit margin lower than that of Replacement channel. However, this price squeeze is
offset by the bulk distribution of tires resulting in relatively high overall profit. On the
other hand, with a small scale of OEM distribution, tire manufacturers can maintain a
good enough profit margin to secure their profitability ratios (in this case, profitability
ratios are higher than those of replacement tires of the same kinds). Another reason
why profit margin of the OEM channel is often lower than that of replacement channel
is the lower sales price offered by assembling companies given the fact that tires are
sold directly and money can be saved from advertising and sales activities. Reality
shows that with OEM channel, a profit margin of >5% is feasible however with
replacement channel, the figure is much higher (>15%).
In Vietnam, there still exist many commercial streets specializing in buying, selling and repairing tires, namely: Ho Chi Minh city (Ly Thai To Street); Ha Noi (Giang Vo, Lang Ha); DaNang city (from the Airport to Nguyen Huu Tho Street and CMT8 roundabout). Especially on Ly Thai To, district 10, HCMC from Ngo Gia Tu – Le Hong Phong roundabout to Nguyen Van Cu – Nguyen Thi Minh Khai roundabout, there are more than 20 stores specializing in fixing cars, selling, buying or replacing automobile tires. There are also official distributors of the worlds’ largest tire company such as Michelin, Yokohama, Bridgestone, to name just a few.
Recycling process and renewable products from used tires (Turn back)
After consumed, tires will be recycled for continued use in the future. According to a
study in Thailand, if done with effective techniques, the quality of renewed tires can be
of 60-90% quality of brand-new ones and can be used for another 50,000 – 70,000 km.
In addition, used tires can be made to create beneficial products for related industries
like: FO-R oil used as fuel for boilers or steel furnaces; black coal used as additional
material to make tires and asphalt; rubber particles and rubber mats used in sports.
Currently, there are some large domestic enterprises that recycle rubber such as Green
Industrial Environment Company Ltd. Co. in Hanoi, South East Tay Ninh Technology
and Investment Joint Venture of Thailand-Malaysia-Laos-Vietnam. In addition,
Renewable Energy DVA JSC has been constructing a rubber and plastic recycling
factory in Tan Thanh District, Ba Ria–Vung Tau. The plant has a processing capacity of
2,400 tons rubber every month, manufacturing well above 1,000 tons FO-R oil and 1000
tons Carbon Black, etc. In Thailand, the proportions of recycled products are Fuel Oil
(35%), Carbon Powder (33%), Steel (12%), and Natural Gas (20%). Below is the
percentage of a machine supplier in Vietnam.
Recycled rate of Used Tires
Types Oil Carbon Steel Natural gas
Heavy truck 45%-50% 25%-30% 10% 10%-15%
Passenger car 40%-45% 30%-35% 10% 10%-15%
Motorcycle and
Bicycle
30%-35% 35%-40% 15%-25%
Source: ttmindustry

Tires and Natural Rubber
www.fpts.com.vn www.fpts.com.vn Bloomberg- FPTS <GO> | 75
Features comparison between Bias and Radial Tires (Turn back)
Because of preeminent structure improvement and important innovation in the tire
industry, Radial tires gave users many practical benefits and enhanced safety for car
users.
The biggest difference between bias tires and radial tires as follows: (1) bias tires before
are made by overlapping fabric wrapping based on angle of 60 degrees. Radial tires
use steel or semi-steel tires (both medium steel fabric) instead of fabric to woven into
each tire overlap with the radial angle of 90 degrees. This structure makes the tire
definitely more reliable and creates balance from within inside as well as reduces the
heat of tire during operation. (2) Bias tires have surface and sidewalls as one unity, but
radial tires have 2 independent parts. For radial tires, sidewall now is seen as part of
the transmission frame. The force will be distributed evenly between both the surface
and sidewall, and make better under pressure ability; better gripping road ability, and
less vehicle vibration during circulation.
For bias tire, both the surface and the sidewalls are generally affected, fabric wraps
under pressure will slide over one another, and resulting in reduced ability to transmit
force from the surface to sidewall. So Bias tries has better road traction and higher heat,
lead to faster attrition and less security. The table below is a general comparison
different criteria between Bias and Radial Tires that we have collected:
Bias tire Radial tire
Lifetime
Used in rough and off-the-road 40,000 – 80,000 km
Specializing for high speed Life expectancy is longer from 50 to 100 percent in same operating condition 60,000 km to 120,000 km
Attrition
Faster attrition About 30 to 50 percent slower
Traction control
Less traction control makes.
Higher control, speed and more
secure.
Traction surface
Smaller Bigger
Fuel saving
Higher 11% lower than

Tires and Natural Rubber
www.fpts.com.vn www.fpts.com.vn Bloomberg- FPTS <GO> | 76
Heated level
Higher Lower
Quality
Lower because the pyrogenic
status and quick atrophy
Higher than bias tires through
better road traction and less
pyrogenic. However, it can be
easily damaged if loading over
capacity
Performance
Less due to the low road traction than Radial tires.
Easily causing concussions for
car, driver and passengers in the
car.
Safe, convenient and comfortable driving feeling.
Good traction, reducing vibration
to the vehicle, driver and
passengers in the car.
Price and repair
Easier to repair
Lower price
Complicated to repair
More Expensive
(Turn back) Policies for Tires industry
Car Tires import Duties
Under the provisions of Circular No. 156/2011 / TT-BTC published on 14th November, 2011 of the Ministry of Finance and Import Tariff Special offers Vietnam to implement the Free Trade Area ASEAN-China period sections 2012-2014, issued Circular No. 162/2011 / TT-BTC dated 11/17/2011 of the Ministry of Finance: If imported items are rubber truck tires, unused, with width not exceeding 450 millimeters (less than or equal to 18 inches), import tax rates are: - 25 percent - products are imported from China - 5 percent - products are imported from ASEAN
If imported items are rubber truck tires, unused, of a width exceeding 450 millimeters (bigger than 18inch), import tax rates are: - 10 percent - products are imported from China - 0 percent - products are imported from ASEAN
The provisions shall be considered as a trade barrier to limit tire import products to protect and keep the domestic market for the tires produced domestically. However, in the longer-term consideration, tax rates will be almost 0 percent in 2018; then there will be no regardless about imported or domestic tires so all must compete fairly. At that time, the quality will decide it all. From now until then, it will be the improving technologies time for the domestic tire enterprises in order to enhance quality to maintain domestic market and expand exports, also enhanced growth rate for domestic tire industry in general and manufactures in particular.
(Turn back)

Tires and Natural Rubber
www.fpts.com.vn www.fpts.com.vn Bloomberg- FPTS <GO> | 77
TPP challenges for Vietnam tires and tubes industry
Based pace of infrastructure development in Vietnam today, a consumer trend of
bias tire will gradually switch to radial tires. Simultaneously with the WTO, AFTA,
and the upcoming ATIGA TPP, Foreign Radial products will overflow into Vietnam
with more attractive prices. Compared with domestic enterprises, foreign enterprises
have advantages in terms of scale, brand and manufacturing experience with high
quality radial tires and low cost based on large-scale production (economics of
scale). Specifically, Kumho Tires has expansion plant in Pacific with capacity of 6.3
million tires per year. In addition, Bridgestone, which is of the giants in the tire
industry, is also building tire factory in Dinh Vu Industrial Zone (Hai Phong) with
capacity 49,000 tires per day.
With the advantage about the large rubber materials supply in Vietnam and Korea
and Japan are two of the countries participating in the TPP Agreement, these two
factories will benefit greatly in import of raw materials for production and export of
finished products. Initially, the product of these two firms will serve for export
demands for the activities of these groups overseas, but if needs change, both
Kumho and Bridgestone are able to enter Vietnam market. In addition, domestic
enterprise cedes passenger vehicles tire segment for foreign brands in domestic
market. However, the truck tire segment is considered at low level of competition, so
domestic enterprise such as DRC and CSM can compete fairly about price and
quality in this segment. (Turn back)
Process of tax cutting for imported automobiles
According to the commitments in the Agreement on Trade in Goods of ASEAN
(ATIGA) formerly known as CEPT / AFTA, Vietnam have to reduce and remove tax
of import goods in the ASEAN region until 2018, including cars and motorcycles.
Imported automobiles duties have been maintained at a very high level of 100-150
percent in the past two decades to protect domestic automobile industry.
Implementation of commitments ATIGA, import tax has cut since 2012 to 70 percent
(2012), to 50 percent in 2014 and will cut completely to 0 percent in 2018.
That means Vietnam automobile industry has very little time to raise the
competitiveness under pressure of imported vehicles from ASEAN when imported
automobiles tax turns to 0 percent. It will be pressured on the automotive industry of
Vietnam. However, in term of automobile tire consumption, it would be positive
aspects about replacement tire segment (replacement) for cars and trucks. Once
taxes are reduced to 0 percent according to the schedule, the amount of cars
imported into Vietnam will increase and lead to increase of replacement tire
consumption; but it is the story the future after 2018.
The time between now and 2018 is an important period for the domestic tire industry
in order to refine and improve quality to compete fairly with imported tires. However,
under our view of point, domestic tire industry only can compete in the segment tires
for trucks (especially radials), agricultural vehicles, bicycles, motorcycles bicycles
while the line of car tires (less than 9 seats) would be very difficult to compete in
long-term consideration.
In fact, from observation in the market most of the cars (less than 9 seats) use
product line imported as Michelin, Bridgestone, Dunlop, Goodyear, and Continental,

Tires and Natural Rubber
www.fpts.com.vn www.fpts.com.vn Bloomberg- FPTS <GO> | 78
instead of CSM and DRC; because this is a unique product segment with popular
sentiment foreign products as well as the level of used tires under the car, so both
conditions about quality and brand are considered to compete.
(Turn back)
Circular 06/ VBHN-BGTVT regulations on vehicle weight and size limits of road
As before, when Circular 06 of the Ministry of Transport unreleased, the majority
carriers were carrying excess weight, and this situation is the lasted long in the past.
However, the introduction of Circular 06 is entirely consistent with economic
conditions and the current infrastructure. With the aim of reorganizing executives in
matters properly load will cause difficulties for the majority of carriers operating
today, also indirectly affect business and manufactures in the country. In fact, that
not many large manufacturing firms in the country have their own vehicle team to
transport goods, so have to use outsourced. Therefore, since Circular 06 has
released, many carrying firms had to increase charges, led to increase cost for
domestic firms. The circular has impacts on the business that uses of transportation
services.
For transportation companies, Circular 06 will be a barrier for their existing operation
businesses. Now, in order to transport the same volume of goods, transportation
companies needs additional investment for truck team. Meanwhile, consumption of
light trucks, heavy trucks in domestic market will rise because a large amount of
truck, which is manufactured locally, only use domestic tires and tubes. Accordingly,
because the consumption of trucks increase, demand for new tires will also increase
correspondingly. Indeed, DRC and CSM have been outsourcing for large domestic
automobile manufacturers such as Truong Hai Auto, Vinaxuki, etc.
Look at positive sides, we can see Circular 06 helps to strictly regulate compliance
with transport regulations, also indirectly helps tires industry to has basic conditions
for growth in the future, it is a positive outlook for the domestically tire producers,
typically DRC and CSM. In addition, under Bureau of Vehicle Registration‘s
provisions, vehicles can be registered annually only when the parts are assembled
to meet the new standard registration certificate. These factors will eliminate cheap
and low quality tires that imports from China and other neighboring countries, and
helps to standardize regulations on tires and create local surplus growth for the
domestic tire market. (Turn back)
Development plan for Vietnam Automobiles Industry to 2020, vision to 2030
According to the plans of the Prime Minister for the automotive industry and further to
2020-2030, Government will concentrate in developing supporting industries that
provides raw materials for the manufacture of automobiles in domestics. In particular,
products will certainly have automobile tires. In addition, our country development plan
will focus and develop on trucks and vans which has more than 10 seats, so demand
for parts assembly for these 2 car segments will be significant, especially tires and
tubes.
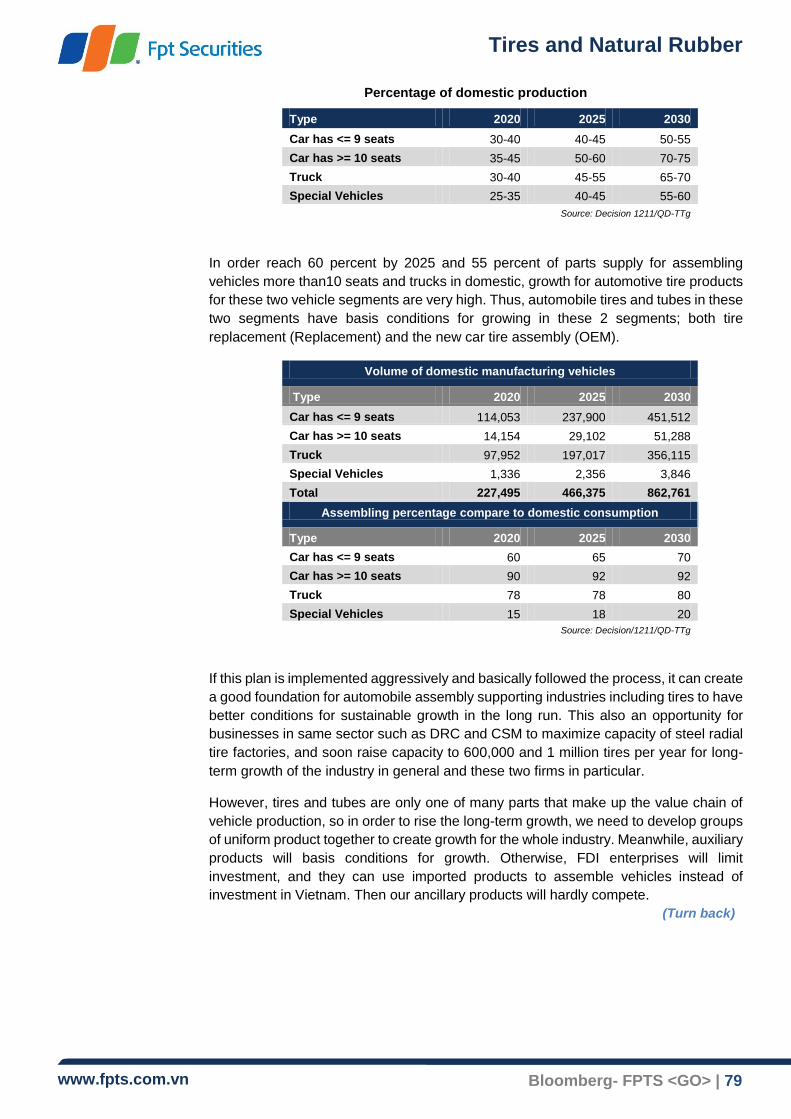
Tires and Natural Rubber
www.fpts.com.vn www.fpts.com.vn Bloomberg- FPTS <GO> | 79
Percentage of domestic production
Type 2020 2025 2030
Car has <= 9 seats 30-40 40-45 50-55
Car has >= 10 seats 35-45 50-60 70-75
Truck 30-40 45-55 65-70
Special Vehicles 25-35 40-45 55-60
Source: Decision 1211/QD-TTg
In order reach 60 percent by 2025 and 55 percent of parts supply for assembling
vehicles more than10 seats and trucks in domestic, growth for automotive tire products
for these two vehicle segments are very high. Thus, automobile tires and tubes in these
two segments have basis conditions for growing in these 2 segments; both tire
replacement (Replacement) and the new car tire assembly (OEM).
Volume of domestic manufacturing vehicles
Type 2020 2025 2030
Car has <= 9 seats 114,053 237,900 451,512
Car has >= 10 seats 14,154 29,102 51,288
Truck 97,952 197,017 356,115
Special Vehicles 1,336 2,356 3,846
Total 227,495 466,375 862,761
Assembling percentage compare to domestic consumption
Type 2020 2025 2030
Car has <= 9 seats 60 65 70
Car has >= 10 seats 90 92 92
Truck 78 78 80
Special Vehicles 15 18 20
Source: Decision/1211/QD-TTg
If this plan is implemented aggressively and basically followed the process, it can create
a good foundation for automobile assembly supporting industries including tires to have
better conditions for sustainable growth in the long run. This also an opportunity for
businesses in same sector such as DRC and CSM to maximize capacity of steel radial
tire factories, and soon raise capacity to 600,000 and 1 million tires per year for long-
term growth of the industry in general and these two firms in particular.
However, tires and tubes are only one of many parts that make up the value chain of
vehicle production, so in order to rise the long-term growth, we need to develop groups
of uniform product together to create growth for the whole industry. Meanwhile, auxiliary
products will basis conditions for growth. Otherwise, FDI enterprises will limit
investment, and they can use imported products to assemble vehicles instead of
investment in Vietnam. Then our ancillary products will hardly compete.
(Turn back)

Tires and Natural Rubber
www.fpts.com.vn www.fpts.com.vn Bloomberg- FPTS <GO> | 80
Group of Companies in the value chain of rubber industries
Unlisted Natural Rubber Companies
DONG NAI RUBBER CORPORATION - DONARUCO
Established in 2009, and has the largest area in VRG with 43,822 hectares, divided
to 13 farms. In that, mining area has reached 22,240 hectares, and exploiting
production reaches 30,000-35,000 tons. In addition, the company also invested in
Cambodia about 6,293 hectares, and processing factory that has capacity of 12,000
tons per year expected operation in March 2015
Productivity: 1.69 tons/ha.
Total assets was about VND 4,224 billion, owner equity was VND 2,579 billion,
Authorized Capital was VND 1,707 billion.
Revenue in 2013 was VND 1,834 billion; EBT was VND 759 billion, equivalent to
41.4% EBT margin (down from 43.4% in 2012). In that, export accounted about 46
percent of total revenue. The Company is in the top 50 of domestic Natural Rubber
exporters; major export markets are Singapore, Taiwan, Malaysia, Germany, Italy.
Strengths: has largest rubber area in the industry, products are certified to ISO 9001:
2008; especially FSC created favourable conditions for the company's products to
export around the world.
Weaknesses: Many old rubber area leads to low productivity (about 1.69 tons /per
hectares). The company is investing in rubber replanting orchards with large unfinished
investment cost at VND 929 billion.
DAU TIENG RUBBER CORPORATION
Having second biggest rubber area in VRG) with 28,820 hectares distributed into 11 farms. In that, the exploiting area is 19,377 hectares
Authorized Capital is VND 1,283 billion. Productivity area in 2013 reached 30,800 hectares. Favourable products of Dau
Tieng are SVR CV50, SVR 3L 60. In addition, the company also produces other types of latex such as SVR L; SVR10, 20; SVR 5; centrifugal rubber latex. Products are processed through three factories. The Company is also ranked in the top 50 of domestic Natural Rubber exporters.
Revenue in 2013 reached VND 2,388 billion (down 20 percent compared to 2012). EBT in 2013 reached VND 663.9 billion, equivalent to EBT / sales ratio reached 27.8%.
Strengths:
- Having Large rubber area, diversity of product range, and quality of CV50,60 SVR are the best in the VRG and in the region.
- Factories and products have been certified ISO 9001: 2008; ISO 14001: 2004; FSC / FM-CoC; ISO / IEC 17025: 2005. Therefore, the export turnover of the company accounts for a large proportion, approximately 70 percent of total company revenue annually. The main export markets are Europe, Korea, Japan and Taiwan.
Weaknesses: many old rubber orchards lead to low productivity of about 1.59 tons per hectares.

Tires and Natural Rubber
www.fpts.com.vn www.fpts.com.vn Bloomberg- FPTS <GO> | 81
PHU RIENG RUBBER CORPORATION
Established in 1978, the company locates in Binh Phuoc, now is the 3rd largest in the group with a rubber area of 18,850 hectares, allocated to 14 farms. Mining area reached 12,661 hectares. Mining production in 2013 reached 26,100 tons, and productivity is 2.02 tons per hectares. Main products are SVR 3L, 10; SVR CV60. The Company is in the top 50 of domestic Natural Rubber exporters. Export turnover accounts for 49 percent of the total revenue of the company. The main export markets are Europe, South Korea, Taiwan, China, etc.
LOC NINH RUBBER CORPORATION Established in 1978, located in Binh Phuoc province. The company currently has a
total area of 10,800 hectares, including mining area about 7,000 hectares, allocated to 07 farms. Mining production in 2013 reached 12,700 tons. Productivity is 2.02 tons per ha.
Favourable products are SVR 3L, SVR 5, and accounted for 39 percent of the processing yield.
There are also SVR 10, 20 accounted for 24 percent; latex accounted for 25 percent, the remaining is RSS.
Export turnover is about 11 percent of the total revenues; the main export markets including Europe, America, and Asia.
TAN BIEN RUBBER CORPORATION Established in 1985 and located in Tay Ninh province. Total rubber area reached
6,161 hectares. The company currently is planting 17,000 hectares in Cambodia through its division, Tan Bien - Kampongthom.
The company manufactures almost all kinds of rubber, about 70 percent is SVR and 30 percent is latex.
The Company is in the top 50 of domestic Natural Rubber exporters. Export sales accounted for 20% of total revenue. The main export markets are Singapore, Russia, the US, Taiwan, Malaysia, Indonesia, France.
BINH LONG RUBBER CORPORATION Established in 1976, located in Binh Phuoc province. The total rubber area reached
14,737 hectares, and divided to 8 farms. Mining area is about 10,958 hectares. Averaged productivity is about 2.01 tons hectares. The company has two processing factories.
In 2013, the company mined 21,354 tons of rubber. The Company is in the top 50 of domestic Natural Rubber exporters. Annual exports accounted for 35 percent of total revenue of the company. Major export markets are China, Taiwan, Korea, Europe, and South America.
Main product is CV50, SVR 60; SVR 10, 20 and latex. Products of the company are achieved the ISO 9001-2008 quality; ISO 17025-2005.
BA RIA RUBBER CORPORATION Founded in 1994, located in Ba Ria - Vung Tau. The total plantation area reached 8,546 hectares, including 3,250 hectares of mining.
Mining production in 2013 reached 6,000 tons. Currently the company is investing about 10,400-11,400 rubber hectares in Cambodia by its division, Ba Ria – Kampongthom.
Total assets reached VND 1,279 billion, owner equity reached VND 1,025 billion.

Tires and Natural Rubber
www.fpts.com.vn www.fpts.com.vn Bloomberg- FPTS <GO> | 82
Revenues in 2013 reached VND 385.9 billion, EBT was VND 67.8 billion, equivalent to 17.6 percent of EBT margin. Business performance of the company is relatively low compared to other companies in the sector, only 1.6% of ROE.
Main products include: SVR CV50,60, SVR 3L, SVR 10. Main export markets are Singapore, Japan, Korea, Russia, Europe.
(Turn back)
Commercial Enterprises in the Natural Rubber Industrial Chain
Binh Phuoc General Import Export Joint Stock Company
Established in 1997, and published in 2006. The headquarters is located in Binh Phuoc province.
The Company specializes in the manufacture and export of rubber (SVR 10, 3L); tapioca starch, and also produces medical gloves, furniture.
The company owns 06 factories manufacturing tapioca starch (total capacity is about 15,000 tons/month) and 10 rubber-producing factories (total capacity is about 10,000 tons/month).
Annually, the company produces around 71,000 tons of rubber and 75,000 tons of tapioca starch.
Main export markets include China, Taiwan, Malaysia, the Philippines, India, Japan, South America, ... Repeatedly in the past 3 years, the company has always ranked No. 01 in the nation for export value of rubber products for than VND 5,000 billion.
VIET PHU THINH RUBBER JOINT STOCK COMPANY
Founded in 2003. Headquarters is located in Binh Phuoc province, and has factories with capacity about 18, 000 tons per year.
Key activities: Manufacture and export most rubber products such as SVR CV50,60; SVR 3L; SVR 10.20; SVR 5, RSS, ... For latex production, the company only does business commerce. Trading Chemicals: Formic Acid, Acetic ACIC, etc.
Viet Phu Thinh is a now ranked 2nd biggest rubber exporter in domestic today. Is a reputation company in production and export of natural rubber with large
quantities, and full category, also being as leader of manufacturer in Vietnam. In addition, Viet Phu Thinh has the ability to offer rubber products that are manufactured from Thailand, Malaysia, Indonesia, Cambodia with large volume up to 1,000 tons per shipment via import – export channel that the company has built to date.
GOLDEN LOTUS TRADING AND MANUFACTURING COMPANY LIMITED
Established in 2005, and the main business activity is the production, sales and exports of most natural rubber products such as SVR 10.20; SVR 3L; SVR CV 50.60, Latex, ...
Having enterprise value belongs top 3 largest rubber exporters in country today. Main markets include the USA, Europe, China, India, Southeast Asia,...The value
of exports reached more than VND 3,300 billion (USD 162 million).
(Turn back)

Tires and Natural Rubber
www.fpts.com.vn www.fpts.com.vn Bloomberg- FPTS <GO> | 83
The “major players” in the industry
Sri-Trang Agro - Industry – Natural rubber
This is rubber manufacturing and processing company that has largest value chain in
the world today. Headquarters is located in Thailand, and has 23 factories including 21
factories in Thailand and 2 in Indonesia, beside 61 latex supply sources destinations
including in 40 points in Thailand and 21 points in Indonesia. In addition, the company
also owns more than 6,000 hectares of rubber in Thailand. These are large supple
source to ensure proactively latex input source.
Rubber production annually is up to 1.3 million tons (mainly rubber blocks (TSR), RSS
and latex). The company supplies accounts about 10% of the global rubber demand,
and accounts 21% of Thailand market's supply and about 15% of China’s total import
demand.
Sri-Trang is also currently producing gloves (ranked 4th largest in the world, and 1st in
Thailand). Output is of about 14 billion pieces per year. In addition, Sri-Trang is also the
biggest manufacturer of rubber tube (high pressure) in Thailand with an output about
42.5 million meters per year.
Total assets reached USD 1.37 billion, and ROE was USD 621 million.
Revenues in 2013 reached USD 2.86 billion. PAT margin was about 2 percent; ROE was 9.3 percent.
Alliance Rubber Net – Natural Rubber
It is a multinational company based in Singapore, and owned by Japan's Itochu Corporation, which specializes in import and export goods, and Thailand Southland Rubber Co.Ltd, which specializes in manufacturing and processing rubber. This alliance is considered as biggest production and distribution of rubber products in the world.
The annual output was 1 million tons of production and sales about 800,000 tons.
The company has 16 processing factories including twelve in Thailand, one in Malaysia, two in Indonesia and one in India. All factories is owned by Southland Rubber Co.Ltd. In addition, the Company also indirectly owns the factories of PT Aneka Bumi Pratama - a division of Itochu Corporation and 3 factories of Thaitech Rubber Corporation Ltd., which is a joint venture between Itochu Corporation (33%), Southland Rubber Co.Ltd (33.5%) and Sri-Trang (33.5%).
Astlett Rubber Inc – Distribution
Founded in 1885, headquarters is located in Canada. It is well known as top 10 distributors of natural rubber and synthetic rubber in the world today. Their rubber supplies are from Thailand, Indonesia, Malaysia and Vietnam. Synthetic rubber is mostly from the Russia and Kumho (Korea).
Lanxess – Synthetic Rubber
It is well know as the world's leading chemical producers, and world's biggest synthetic rubber production with more than 1.6 million tons per year. The company is located in Germany, and revenue in 2013 was about EUR 8.3 billion. In that, synthetic rubber and elastic products, plastics accounted for 54 to 57 percent. The biggest part of revenue was from the European market (47 percent) and Asia – Pacific Ocean (26 percent). The company's total assets reached EUR 6.8 billion; ROE was EUR 1.9 billion. EBITDA margin of synthetic rubber and plastics segments reached 15.8 percent in 2012 and 8.7 percent in 2013.

Tires and Natural Rubber
www.fpts.com.vn www.fpts.com.vn Bloomberg- FPTS <GO> | 84
Sinopec – Synthetic rubber
Founded in 1998, and belonged to Chinese Chemical Corporation. Sinopec is an
enterprise, which specializes extraction and processing of petroleum products such as
gasoline, LPD, CNG, crude oil, synthetic rubber, other chemicals. Sinopec now is
leading Asia's synthetic rubber production with output in 2013 reached 1.33 million tons.
Total assets reached USD 233 billion. Revenue in 2013 reached USD 7.1 billion; including chemical sales accounted for 38 percent; petroleum products accounts for 28 percent, and the rest are other products.
FDI Tire manufacturing companies in Vietnam
Inoue Tires Vietnam
The company was founded in 1997, and has factory located in Vinh Phuc. The
shareholder structure includes: 76 percent of foreign and 24percents of the
Vietnam National Chemical Group (Vinachem). In 76 percent of foreign
shareholders including Asian Inoue Rubber Pte. (Japan); Inoue Rubber
(Thailand) Public Co., Ltd.; Inoue Rubber Singapore Pte.; Bridgestone
Corporation.
As far as we know, this is the only company in Vietnam was officially signed a
contract to transfer technology from INOUE Rubber Company of Japan. This
factory is the most advanced in Southeast Asia.
Currently the company has 50 dealers across the country, and their main
products: motorcycle tires, bicycle tires and stroller tires.
Inoue is seen as a direct competitor to 3 companies in the VRG (DRC, CSM,
SRC) in segment motorcycle tires including tires for new vehicle assembly (OEM)
and replacement tires.
With modern technology along with the brand from Japan, Inoue tires and tubes
are official supplier for manufacturers and famous local assemblers such as
Yamaha, Honda, SYM, etc. bicycle tires and trolley that serves exports.
Particularly in motorcycle tires product line, the company has introduced new tires
that is made from 100 percent synthetic rubber (butyl) with 4 times higher air tight
than normal tires, this is seen as a unique product of companies compared to
other local firms.
Yokohama Tyre Vietnam Limited Company
The Company was founded in 2006, with 100 percent of capital from Japanese.
Before the company was founded, it has a joint venture between Yokohama
(56%), Casumina (30%) and Mitsubishi (14%) born late in 1997. However, this
venture was dissolved in 2012 due to business ineffectiveness.
Main product: Motorcycle tires, light truck, forklift.
The company has two factories: the factory located in Binh Duong has capacity
of 800,000 tires per year; Factory located in Nhon Trach has capacity of 180 tons
per month.
The company's motorbike tires are supplied to popular manufacturers and
assemblers in Vietnam such as Honda, Yamaha, SYM, Suzuki, Piaggio.
Yokohama Tyre is seen as a direct competitor to the 3 companies in VRG (DRC,
CSM, SRC) in the tire segment of OEM motorcycle tires and tire replacement.

Tires and Natural Rubber
www.fpts.com.vn www.fpts.com.vn Bloomberg- FPTS <GO> | 85
Kumho Tires Viet Nam
Company was founded in 1993 with 100 percent owned by Korea investor.
Main products are passenger car tires and light truck radial tires.
The factory is located in Binh Duong Province with a capacity of 3.15 million tires
per year, and is planning to raise up to 6.3 million tires per year. Most of
company‘s are used exports; approximately 945,000 tires are sold in the domestic
market. Kumho Tires are considered direct competitors to the DRC and
Casumina in passenger car tires and light truck tires (including OEM segment and
replacement tires). Passenger car tires mostly are belong to Kumho Tires. In truck
replacement tires segment, DRC still dominates with 13 percent market share,
Casumina has 8 percent, and Kumho has 5 percent.
Sailun Viet Nam
This is a company with 100 percent capital of the Group's capital Sailun – China.
In 2013, the company has operated semi-steel radial tire factory in Tay Ninh
The main products are: Steel Radial tires sold for passenger cars and trucks; and
OTR tires .
The Company’s factory has a total investment of USD 597 million, divided into 3
stages. The first stage was completed with an expected capacity about 7.8 million
PCR tires and 15,000 tons OTR per year. The second stage will begin in 2015 in
order to increasing capacity to 12 million PCR tires; while the final stage will be
conducted in 2017 to increase capacity up to 50,000 tons OTR. Thus by the time
of 2017, Sailun Vietnam factory will have a total capacity of 19.8 million PCR tires
and 65,000 tons OTR.
Products from the factory will be exported to Europe and the US (about 70
percent) , exported to the Middle East and Southeast Asia (about 25 percent) ,
used for domestic consumption in Vietnam (about 5 percent). In the coming
years, the proportion of domestic consumption will be increased gradually
depending on the level of economic development and Vietnam's automobile
market.
Chengshin Viet Nam Rubber
Company was founded in 2005.
Specialized in manufacturing tires for truck, passenger car, motorcycle.
Factory’s capacity in Nhon Trach, Dong Nai reaches 63,380 tires per day. Like
Kumho and Yokohama, Chengshin is also a direct competitiors to local
manufacturers in motorcycle tires, truck and passenger car segments.
(Turn back)

Tires and Natural Rubber
www.fpts.com.vn www.fpts.com.vn Bloomberg- FPTS <GO> | 86
INTERPRETATION OF RECOMMENDATION
This assessment aims to determine the share’s value representing the corporate valuation, in order to find each share’s potential value and provide the useful information to investors during the 12-month investment. The rate of 18% is based on the rate of 12-month Vietnamese Government Bond adjusted by the risk premium of Vietnamese market.
Recommendation Interpretation
12 months
Buy Target price > Market price more than 18%
Add Target price > Market price between 7% and 18%
Neutral -7% < Target price - Market price < 7%
Reduce The Target price < Market price between -7% and -18%
Sell The Target price < Market price more than -18%
Disclaimer
The information and statements contained herein, including any expression of opinion, are based upon sources believed to be reliable but their accuracy, completeness or correctness is not guaranteed. Expressions of opinion herein were arrived at after due and careful consideration and they were based upon the best information then known to us, and in our opinion are fair and reasonable in the circumstances prevailing at the time. Expressions of opinion contained herein are subject to change without notice. This document is not and should not be construed as, an offer or the solicitation of an offer to buy or sell any securities. FPTS and other related companies and/or their officers, directors and employees may have positions and may have affect transactions in securities of companies mentioned herein and may also perform or seek to perform investment banking services for these companies. No person is authorized to give any information or to make any representation not contained in this document and any information or representation not contained in this document must not be relied upon as having been authorized by or on behalf of FPTS. This document is private circulation only and is not for publication in the press or elsewhere. FPTS accepts no liabilities whatsoever for any direct or consequential loss arising from any use of this document or its contents. The use of any information, statements forecasts and projection contained herein shall be at the sole discretion and risk of the users. This document is confidential and is intended solely for the use of its recipient. Any duplication or redistribution of this document is prohibited. At the time of writing this analytic report, FPTS and FPTS’ analysts do not hold any share of these enterprises.
The information related to other stocks or other information related these stocks can be
viewed at https://ezsearch.fpts.com.vn or will be provided upon official request.
Authorized © 2010 FPTS
FPT Securities joint-stock company Head office
Floor 2 – Tower 71 Nguyen Chi Thanh, Dong Da district, Hanoi, Vietnam Phone: (84.4) 3 773 7070 / 271 7171 Fax: (84.4) 3 773 9058
FPT Securities joint-stock company Ho Chi Minh city branch
136-138, Floor 3 – Timesquare Building, Le Thi Hong Gam Str., District 1, HCMC, Vietnam Phone: (84.8) 6 290 8686 Fax: (84.8) 6 291 0607
FPT Securities joint-stock company Da Nang branch
100 Quang Trung Str., Hai Chau district, Da Nang city, Vietnam Phone: (84.511) 3553 666 Fax: (84.511) 3553 888