
The nexus between inflation rate and economic growth of Polish provinces after EU accession
18
1 Henryk Gurgul AGH University of Science and Technology, Faculty of Management, Department of Applications of Mathematics in Economics, [email protected] Lukasz Lach AGH University of Science and Technology, Faculty of Management, Department of Applications of Mathematics in Economics, [email protected] THE NEXUS BETWEEN INFLATION RATE AND ECONOMIC GROWTH OF POLISH PROVINCES AFTER EU ACCESSION Abstract This paper is one of the first contributions which examine the nexus between inflation rate and economic growth of Poland after EU accession based on the regional data. The results prove that in the period 2004-2010 the causal link between inflation rate and economic growth among Polish regions was of a nonlinear nature. The empirical analysis confirmed the existence of two statistically significant inflation threshold levels related to contemporaneous as well as one-year-lagged causal effects. Keywords: Inflation rate, economic growth, threshold point, structural break, Polish regional data. Introduction The effect of inflation on the rate of economic development and growth has become one of the central points of research in both theoretical and empirical aspects. This complex problem is still an issue that needs to be resolved, especially in case of transition economies which
Transcript of The nexus between inflation rate and economic growth of Polish provinces after EU accession

1
Henryk Gurgul AGH University of Science and Technology, Faculty of Management, Department of Applications of Mathematics in Economics, [email protected]
Łukasz Lach AGH University of Science and Technology, Faculty of Management, Department of Applications of Mathematics in Economics, [email protected]
THE NEXUS BETWEEN INFLATION RATE AND ECONOMIC GROWTH OF POLISH PROVINCES
AFTER EU ACCESSION
Abstract
This paper is one of the first contributions which examine the nexus between inflation
rate and economic growth of Poland after EU accession based on the regional data. The
results prove that in the period 2004-2010 the causal link between inflation rate and
economic growth among Polish regions was of a nonlinear nature. The empirical
analysis confirmed the existence of two statistically significant inflation threshold levels
related to contemporaneous as well as one-year-lagged causal effects.
Keywords: Inflation rate, economic growth, threshold point, structural break, Polish regional data.
Introduction
The effect of inflation on the rate of economic development and
growth has become one of the central points of research in both
theoretical and empirical aspects. This complex problem is still an issue
that needs to be resolved, especially in case of transition economies which

2
have gained less attention from the researchers so far. The link between
output growth and inflation has not yet been well defined, although there
are many contributions which are concerned with this relationship.
A common assumption in macroeconomic theory holds that low
inflation is a necessary condition for economic growth. However, the
discussion about the relationship between inflation and economic growth
is still not finished. Different schools of economic thought supplied
different results of research on this relationship. The representatives of so-
called structuralists, who trace the origins of their approach to Kalecki's
“Problems of Financing Economic Development in a Mixed Economy”,
claim that inflation is essential for economic growth [Kalecki, 1970].
Some theoretical studies suggest that inflation supports long-run growth
by raising capital accumulation [Mundell, 1963]. Tobin [1965] introduced
money into the Solow-Swan model as an asset alternative to capital. He
stressed that inflation increases the opportunity cost of holding money.
Therefore, it favours capital accumulation and in consequence supports
economic growth. Some authors indicate that money expansion speeds up
inflation and accelerates growth in the long run by lowering the marginal
product of capital, tax credits or the saving rate [Stockman, 1981; Cooley
and Hansen, 1989; Haslag, 1995; Jones and Manuelli, 1995]. In contrast,
the monetarists see inflation as a harmful factor for economic growth
[Mallik and Chowdhury, 2001].
In endogenous growth models, the effects of inflation are derived in
the works of Gomme [1993] and Jones and Manuelli [1995] among
others. The contributors noticed that when money is introduced in the
budget constraint in a model of human capital accumulation, a rise in the

3
rate of inflation negatively affects both consumption and supply of labour.
De Gregorio [1993] argued that inflation may have essential effects also
on the accumulation of physical capital.1 Besides theoretical deliberations,
also most of previous empirical contributions supported the view that
there exists a negative relationship between inflation and economic
growth [Barro, 1991; Fischer and Modigliani, 1978; Bullard and Keating,
1995].
If the view that inflation has negative impact on economic activity
and growth holds true, then policy-makers should try to hold a low rate of
inflation. At this place an important question arises: What is the desired
level of inflation rate in the context of maximizing economic growth? The
answer to this question is not straightforward as it depends on the time
period considered but also on the nature and structure of a specific
economy. The nonlinearity in the relationship between inflation and
economic growth is a subject of research conducted in more recent
contributions. It can be concluded that at lower rates of inflation, the
relationship is insignificant or positive. However, at higher levels,
inflation has an essential negative impact on economic growth. Under the
assumption that a nonlinear relationship between inflation and economic
growth is given, the key issue is to determine the threshold level, i.e. the
structural break point at which the sign of the relationship between the
two variables switches. In order to establish the threshold level one may
either define a priori the thresholds for different levels of inflation rate in
ad hoc manners [Fischer, 1993; Barro, 1996; Bruno and Easterly, 1998] or
1 He assumed that money is one of the means of reducing transaction costs both for households
and firms. Thus, a higher inflation rate forces agents to reduce their money holdings. The result causes a rise in the transaction costs and a negative impact on investment and growth.

4
apply a spline regression in order to estimate the threshold rate of
inflation directly from the available data [Ghosh and Phillips, 1998; Sarel,
1996]. According to Friedman [1997], one of the most famous
monetarists, an increase in inflation may imply inflation uncertainty. The
latter is a possible source of the ineffective price mechanisms which in
turn lead to many economic problems and lower the rate of economic
growth.2 Cukierman and Meltzer [1986] stressed that more inflation
uncertainty results in rise of inflation due to the policy of monetary
authorities. In contrast, Holland [1995] argues that when inflation rises
and leads to uncertainty, the rate of money supply growth will soon be
reduced by the central bank. This would cut down inflation rate and
diminish the negative growth effects of inflation uncertainty.
To summarize, the impact of inflation on economic growth is still
one of the most important topics in economics. However, the scientific
discussion has not led to consistent results so far. In addition, to the best
of our knowledge the inflation-growth link among Polish provinces has
never been examined so far. Both these facts are the main sources of the
motivation to conduct this empirical study.
Literature overview
The content of this section is mostly concerned with the recent
empirical results on the link between inflation and economic growth. In
general, most of previous empirical contributions showed that economic
2 The allocation of resources depends on the inflation uncertainty due to its impact on interest
rates. Thus, in order to examine the real effects of inflation one should take into account the link between inflation uncertainty and output. A positive causal effect of inflation uncertainty on inflation may give a rise to the positive correlation between inflation and inflation uncertainty.

5
growth is essentially affected by inflation and the sign of this impact is
negative. The channels through which inflation could have an impact on
growth are those of savings [Gylfason, 1999; Fry, 1994], the structure of
the tax system, such as depreciation allowances [Feldstein, 1983], the
effect of the tax system on investments [De Long and Summers, 1991],
the distortions the tax system infers on the allocation of capital
[Auerbach, 1989; Cohen, Hassett and Hubbard, 1997], the effect of
inflation on the activity of financial markets [Boyd, Levine and Smith,
1995; Huybens and Smith, 1999], the impact of inflation on
macroeconomic volatility (expressed through the volatility in interest and
exchange rates [Ferderer, 1993; Cukierman et al., 1993; Gylfason, 1999]
and the indirect impact imposed through the distribution of human capital
[De Gregorio, 1993; Heymann and Leijonhufvud, 1995]).
Wang [1996] used annual data from the period 1978-1993 to
examine the relation between inflation and economic growth in China. He
demonstrated that inflation in year t had an insignificant contemporaneous
impact on economic growth, however, it had a significant negative impact
on growth in year t+1.
In contrast, Liu and Xie [2003] and Liu and Zhang [2004] examined
short-run inflation-growth relations and found that inflation supported
economic growth in China. Similarly, Chen [2007] applied the
generalized autoregressive conditional heteroskedasticity in mean model
and showed that inflation supported economic growth in China in the
period 1952-2004.
One can easily see that previous empirical research has not
formulated sharp conclusions on inflation-growth links. From a historical

6
perspective, one can notice that before the two oil shocks in 1973 and
1979, many researchers believed that the inflation-growth relationship
was either positive or insignificant. However after the stagflation of the
1970s, this idea was challenged by new macroeconomic data. Economists
have found that inflation harms growth [Barro, 1991; Kim and Willett,
2000; Apergis, 2005]. On the basis of some developments in the field of
theoretical economics which took place in the 1990s, some contributors
have found empirical evidence supporting the point of view that low
inflation might enhance employment and economic growth [Fischer,
1993; Sarel, 1996; Khan and Senhadji, 2001; Pollin and Zhu, 2006].
Furthermore, since the inflation-growth relationship is one of the most
important links for the central bank in every country, some economists
have estimated the inflation turning points for single countries [Singh and
Kalirajan, 2003; Sweidan, 2004; Mubarik, 2005].
Fischer [1993] argued that growth is mainly affected through the
uncertainty channel. This impact is a result of uncertainty associated
either with inflation or instability of the budget and the current account.
Both of them distort the price mechanism or influence the effects of an
uncertain macroeconomic framework on investment. Friedman [1997]
stressed the importance of the assumption that a higher variability of
inflation is usually accompanied by higher average rates of inflation.3 He
also argued that firms and workers waste productive resources in order to
deal with inflation [Fischer and Modigliani, 1978]. Therefore, inflation
uncertainty is likely to reduce the allocative efficiency of the price
3 In addition, Friedman stressed that increased inflation uncertainty seems to negatively affect real
economic activity and, thus, economic growth (this relationship is well known in the literature as the Friedman hypothesis).

7
system. This, in turn, can contribute again to relative price variability (this
effect is known in economic literature as so-called Lucas’s signal
extraction hypothesis). This leads to a lower ability of an economy to
grow [Smyth, 1994]. The uncertainty linked with high inflation reduces
the level of productivity and consequently harms economic growth
[Fisher, 1993].
By the means of the exponential general autoregressive conditional
heteroskedastic model, Narayan, Narayan and Smyth [2009] established
empirically that rise in inflation uncertainty lowers average inflation.
Moreover, they proved that inflation volatility harms economic growth.
Some recent results on the link between uncertainty, inflation and
economic growth are presented in Ozdemir’s paper [Ozdemir, 2010]. The
author stressed the importance of research on causal relationships
between inflation, output growth, and real and nominal uncertainty. Kong
[2007] found evidence supporting the impact of inflation threshold on
growth using bootstrap approach in two different scenarios. He claimed
that the effects of inflation on growth are uniformly negative (or
uniformly positive) when using the 3.9 per cent (or 6.5 per cent) inflation
threshold level. He could not confirm that high inflation lowered China’s
economic growth and moderate inflation enhanced it.
Mubarik [2005] estimated the threshold level of inflation for
Pakistan. He applied a dataset covering the period 1973-2000. He found
that the inflation rate beyond 9 per cent is harmful for the economic
growth of Pakistan. However, Hussain [2005] could not detect any
threshold level of inflation for Pakistan in the period 1973-2005.
8
Lee and Wong [2005] calculated the threshold levels of inflation for
Taiwan and Japan using quarterly data from the period 1965-2002 for
Taiwan and the period 1970-2001 for Japan. The contributors stressed
that the inflation rate beyond 7.25 per cent is harmful for the economic
growth of Taiwan. They also managed to establish two threshold levels
for Japan (equal to 2.52 per cent and 9.66 per cent). An extensive
discussion on the relationship between inflation and growth is given in
other recent contributions [Apergis, 2005; Munir, Mansur and Furuoka,
2009; Hwang and Wu, 2011].
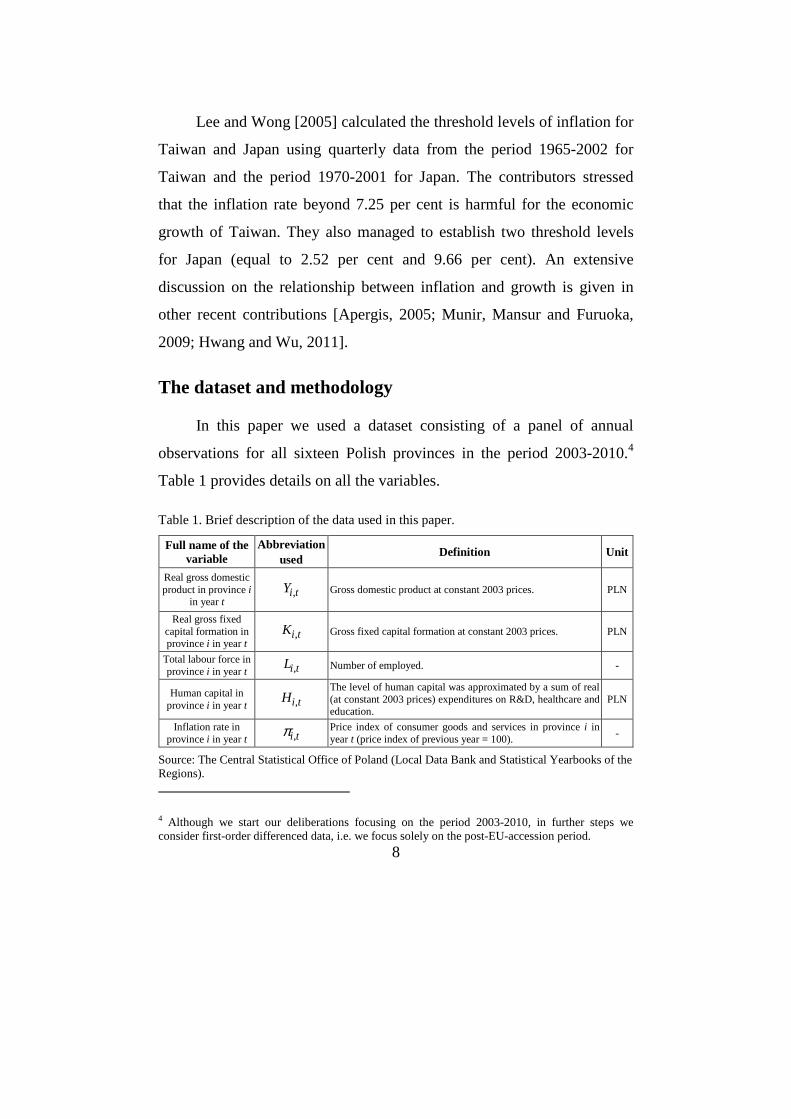
The dataset and methodology
In this paper we used a dataset consisting of a panel of annual
observations for all sixteen Polish provinces in the period 2003-2010.4
Table 1 provides details on all the variables.
Table 1. Brief description of the data used in this paper.
Full name of the variable
Abbreviation used
Definition Unit
Real gross domestic product in province i
in year t ,i tY Gross domestic product at constant 2003 prices. PLN
Real gross fixed capital formation in province i in year t
,i tK Gross fixed capital formation at constant 2003 prices. PLN
Total labour force in province i in year t ,i tL Number of employed. -
Human capital in province i in year t ,i tH
The level of human capital was approximated by a sum of real (at constant 2003 prices) expenditures on R&D, healthcare and education.
PLN
Inflation rate in province i in year t ,i tπ
Price index of consumer goods and services in province i in year t (price index of previous year = 100). -
Source: The Central Statistical Office of Poland (Local Data Bank and Statistical Yearbooks of the Regions).
4 Although we start our deliberations focusing on the period 2003-2010, in further steps we consider first-order differenced data, i.e. we focus solely on the post-EU-accession period.

9
In order to examine the possible threshold effect of inflation on economic
growth we refer to Fischer [1993] and use a growth accounting equation
as the basis of our model. In the first step we examine standard Cobb-
Douglas production function:
, , , , , , ,( , , )i t i t i t i t i t i t i tY F A K L A K Lβα= = , (1)
where Ai,t is the level of technology in i-th province in year t and remaining
symbols were described in Table 1. After differentiating (1) with respect
to time, we get the conventional growth accounting equation:
( ) ( ), , , , , , , ,/ / / /i t i t i t i t i t i t i t i tY Y A A K K L Lα β= + +ɺɺ ɺ ɺ , (2)
which can be rewritten in the following linear-approximated form:
, , , ,ln ln ln lni t i t i t i tY A K Lα β∆ = ∆ + ∆ + ∆ . (3)
Figure 1 contains the plots of measures of economic growth ( ,i tY∆ ) and
inflation rate ( ,i tπ ), i.e. the pair of variables for which the analysis of
causal links will be conducted in this study.

10
Fig. 1. Inflation rate (previous year =100) and economic growth in Polish provinces in
period 2004-2010 (growth) and 2003-2010 (inflation).5
Source: The Central Statistical Office of Poland (Local Data Bank and Statistical Yearbooks of the Regions).
Plots presented in Figure 1 provide some important suggestions. First,
inflation rate could have caused not only the contemporaneous but also
the one-period-lagged impact on economic growth. Second, it seems
likely that in the period 2004-2010 the inflation threshold effect could
take place. The latter may be taken into account in the growth model via
the dummy variable which equals one when the inflation rate is greater or
equal to the threshold level, and zero otherwise. If one additionally takes
the level of human capital into account the final form of the equation
describing the rate of technological progress could be as follows
[Edwards, 1998; Dollar and Kraay, 2004; Rao and Vadlamannati, 2011]:
( )1 1
*, , , ,
0 0
ln ln j ji t i i t i t j i t j
j j
A t H D Dπ πα γ λ π π π− −= =
∆ = + + ∆ + + −∑ ∑ ɶ , (4)
where *π denotes the inflation threshold level, jDπɶ stands for a dummy
variable which is equal to one if *,i t jπ π− − is positive and zero otherwise.
5 In order to keep the plots as readable as possible we did not name the plots of ,i tY∆ and ,i tπ for all possible choices of i. The solid lines, which correspond to maximal and minimal values of both variables among Polish provinces, provide useful information about the rate of inflation and economic growth in the whole group of the voivodeships. However, in order to provide general information on the dynamics of the examined variables, the dotted lines were also used to mark the values of ,i tY∆ and ,i tπ for 1,...,16i = .

11
Empirical results
In the first step we performed unit root test to verify whether all
continuous variables considered in models (3) and (4) are stationary. The
results confirmed that the variables are I(0), thus no panel-cointegration
methods are required during the estimation.6 In the next step we run a
stepwise procedure to find the threshold level. We examined a set of trial
points defined as * 100 0.05p pπ = + ⋅ for 0 100p≤ ≤ . For each choice of *pπ
we estimated (via fixed effects) model (3) using equation (4). After each
estimation we calculated three different model choice criteria: AIC and
HQ information criteria as well as sum of squared errors (ESS). Figure 2
summarizes the outcomes.
Fig 2. Plots of the selected model choice criteria against trial inflation threshold levels.
Source: The Central Statistical Office of Poland (Local Data Bank and Statistical Yearbooks of the
Regions).
6 All tests were performed at 5% significance level. We tested both common (Levin, Lin and Chu, Breitung tests) as well as individual unit root processes (Im-Pesaran-Shin and Fisher tests). For each test we examined solely individual effects as well as individual effects and linear time trends. In case of Levin, Lin and Chu, Breitung and Im-Pesaran-Shin tests autocorrelation was corrected via application of additional lags (SIC criterion was used to choose the optimal lag from the set {1, …,4}), while in case of Fisher test autocorrelation was corrected via application of variance estimators based on Bartlett kernel and bandwidth chosen according to the Newey and West method.

12
As one can see plots presented in Figure 2 suggest the existence of two
threshold levels. Thus, in the next step we focused on models (3) in which
the technological progress was described by the following expression:
( ) ( )1 1 1
* **, , , , ,
0 0 0
ln ln j j ji t i i t i t j i t j p i t j r
j j j
A t H D D Dπ π πα γ λ π π π π π− − −= = =
∆ = + + ∆ + + − + −∑ ∑ ∑ɶɶ ɶ , (5)
where *pπ and **
rπ denote two inflation threshold levels, jDπɶ ( jDπɶɶ ) stands
for a dummy variable which is equal to one if the expression *,i t j pπ π− −
( **,i t j rπ π− − ) is positive and zero otherwise. Next, for each pair of
* 100 0.05p pπ = + ⋅ and ** 100 0.05r rπ = + ⋅ , where 0 100p r≤ < ≤ , we estimated
(via fixed effects)7 and analysed models (3) using equation (5). Following
table presents the results of establishing *pπ and **
rπ according to AIC, HQ
and ESS criteria in the group of 101 100 / 2 5050⋅ = different variants of
model (3).
Table 2. The results of estimating inflation threshold rates in Poland after EU accession.
Criteria *pπ **
rπ
AIC 101.4 103.4 HQ 101.4 103.4 ESS 101.35 103.45
Source: Own elaborations.
Despite slight differences, we may assume that * 101.4pπ = and ** 103.4rπ =
as these values were clearly pointed out by two out of the three measures
applied. After finding the threshold levels we estimated model (3)
7 For the sake of comprehensivity we re-estimated all 5050 variants of model (3) using random effects. Since the results turned out to be similar to those obtained via fixed effects we did not decide to present them in a separate table.

13
assuming that progress of technology may be described by the formula (5)
in which * 101.4pπ = and ** 103.4rπ = . Table 3 contains the results.8 In order
to control for heteroscedasticity we used the robust Huber/White/sand-
wich VCE estimator [Wooldridge, 2009; Stock and Watson, 2008;
Arellano, 2003].
Table 3. The results of estimation of model (3) with two threshold levels assumed.
Fixed effects Random effects Coefficient Value p-value Value p-value
0Dπ 0.4 0.602 [0.593] 0.6 0.663 [0.651]
1Dπ 1.8 0.089 [0.093] 1.6 0.101 [0.095]
0Dπɶ -0.7 0.531 [0.592] -0.9 0.473 [0.452]
1Dπɶ -2.9 0.041 [0.022] -2.9 0.028 [0.011]
0Dπɶɶ -0.9 0.093 [0.073] -0.8 0.122 [0.092]
1Dπɶɶ 1.2 0.192 [0.143] 1.1 0.353 [0.249]
Source: Own elaborations.
As one can see not all inflation-related coefficients turned out to be
statistically significant even at the 10% level. Thus, in the next step we
performed the backward stepwise regression procedure described in detail
in Gurgul and Lach [2010]. After dropping variables insignificant at 10%
level we obtained the final form of the model.9
Table 4. The results of backward stepwise regression of the model (3) with the two threshold levels.
Fixed effects Random effects
8 In tables 3 and 4 we present the results devoted solely to the inflation-related coefficients as remaining outcomes are less important from the perspective of the main goals of this paper. Moreover, to control for possible impact of heteroscedasticity we also applied robust standard errors (p-values in square brackets). 9 In each case the order of dropping insignificant variables was the same for the asymptotic and robust variants of calculating the standard errors.

14
Coefficient Value p-value Value p-value 1Dπ 1.65 0.091 [0.093] 1.63 0.094 [0.093]
1Dπɶ -2.80 0.023 [0.027] -3.11 0.009 [0.027]
0Dπɶɶ -0.8 0.097 [0.087] -0.7 0.082 [0.095]
Source: Own elaborations.
As one can see after dropping statistically insignificant variables only
three inflation-related coefficients were left in the growth model. The
results allow to claim that the strongest effect of inflation on economic
growth was observed with one year lag. If the inflation in year t was
smaller (greater) than *pπ its impact on economic growth in year t+1 was
positive (negative). When inflation remained low, the lagged impact of
inflation on economic growth was positive: every 1-percentage-point
increase in the inflation rate stimulated economic growth in next period
by around 1.6 per cent. When inflation remained high, the impact on
growth was negative: every 1-percentage-point increase lowered growth
in next period by around 1.2-1.5 per cent. In addition, the results prove
that if inflation exceeded **rπ it caused contemporaneous negative impact
on economic growth: every 1-percentage-point increase in the inflation
rate lowered economic growth in the same period by around 0.7-0.8%.
Concluding remarks
To the best of our knowledge this paper is one of the first contributions
which examine the nexus between inflation rate and economic growth in
Polish provinces after EU accession. The results allow to claim that in the
period 2004-2010 inflation rate was statistically significant factor which
has been imposing contemporaneous as well as one-period-lagged

15
nonlinear causal effects on economic growth. The threshold levels (i.e.
the levels above which inflation becomes inimical to growth) were equal
to 1.4% and 3.4% for one-year-lagged and contemporaneous effects,
respectively. It is important to note, that much stronger effect of inflation
on economic growth was observed with one year lag. These findings seem
to have a wide range of important policy implications, especially in terms
of the inflation targeting. One cannot forget, however, that the post-
accession period was a specific time in the history of Polish regions as it
was a period of rapid economic growth (2006-2007) but also a period in
which the global financial crisis outbroke and started to affect Polish
economy. Therefore, further research seems to be required to re-examine
and verify the robustness of the empirical outcomes presented in this
study.
Acknowledgements
Financial support for this paper from the National Science Centre of
Poland (Research Grant no. 2011/01/N/HS4/01383) and the Foundation
for Polish Science (START 2012 and START 2013 Scholarships) is
gratefully acknowledged by Łukasz Lach.
References
1. Apergis N. (2005), Inflation uncertainty and growth: Evidence from panel data, “ Australian Economic Papers”, Vol. 44, No. 2, pp. 186-197. 2. Arellano M. (2003), Panel Data Econometrics, Oxford University Press, Oxford. 3. Auerbach A.J. (1989), The Deadweight Loss from ‘Non-Neutral’ Capital Income Taxation, “Journal of Public Economics”, Vol. 40, pp. 1-36. 4. Barro R.J. (1991), Economic Growth in a Cross Section of Countries, “Quarterly Journal of Economics”, Vol. 106, pp. 407-444. 5. Barro R.J. (1996), Inflation and Growth, “Federal Reserve Bank of St. Louis Review” , Vol. 78, pp. 153-169. 6. Boyd J.H., Levine R., Smith B.D. (1995), Inflation and Financial Market Performance. Federal Reserve Bank of Minneapolis, Minneapolis. 7. Bruno M., Easterly W. (1998), Inflation Crises and Long-Run Growth, “Journal of Monetary Economics”, Vol. 41, pp. 3–26. 8. Bullard J., Keating J.W. (1995), The long-run relationship between inflation and output in postwar economies, “Journal of Monetary Economics”, Vol. 36(3), pp. 477-496.

16
9. Chen T. (2007), Uncertainty, inflation and output growth in China, “Economic Theory and Business Management”, Vol. 27, No. 12, pp. 23-29. 10. Cohen D., Hassett K.A., Hubbard R.G. (1997), Inflation and the User Cost of Capital: Does Inflation Still Matter?, “NBER Working Papers”, no. 6046. 11. Cooley T.F., Hansen G.D. (1989), The inflation tax in a real business cycle model ”American Economic Review”, Vol. 79, No. 4, pp. 733-748. 12. Cukierman A., Meltzer A.H. (1986), A Theory of Ambiguity, Credibility, and Inflation under Discretion and Asymmetric Information, "Econometrica”, Vol. 54(5), pp.1099-1128. 13. Cukierman A., Kalaitzidakis P., Summers L.H., Webb S.B. (1993), Central bank independence, growth, investment, and real rates, “Carnegie-Rochester Conference Series on Public Policy”, Vol. 39(1), pp. 95-140. 14. De Gregorio J. (1993), Inflation Taxation and Long-Run Growth, “Journal of Monetary Economics”, Vol. 31, pp. 271-298. 15. De Long B.J., Summers L.H. (1991), Equipment Investment and Economic Growth, “Quarterly Journal of Economics”, Vol. 106, pp. 445-502. 16. Dollar D., Kraay A. (2004), Trade, growth and poverty, “Economic Journal”, Vol. 114, F22 F49. 17. Edwards S. (1998), Openness, productivity and growth: what do we really know? “Economic Journal”, Vol. 108, pp. 383-398. 18. Feldstein M. (1983), Inflation, Tax Rules and Capital Formation, University of Chicago, Chicago. 19. Ferderer P. (1993), The Impact of Uncertainty on Aggregate Investment Spending: An Empirical Analysis, “Journal of Money Credit and Banking”, Vol. 25, pp. 30-48. 20. Fischer S., Modigliani F. (1978), Towards and Understanding of the Real Effects and Costs of Inflation, “Weltwirtschaftliches Archiv”, pp. 810-832. 21. Fischer S. (1993), The Role of Macroeconomic Factors in Growth, “Journal of Monetary Economics”, Vol. 32, pp. 485-512. 22. Friedman M. (1977), Nobel Lecture: Inflation and Unemployment, “Journal of Political Economy”, Vol. 85, pp. 451-472. 23. Fry M. (1994), Money, Interest and Banking in Economic Development, second edition. John Hopkins University Press. Baltimore. 24. Ghosh A., Phillips S. (1998), Warning: Inflation may be harmful to your growth, “IMF Staff Papers”, Vol. 45, No. 4, pp. 672-710. 25. Gomme P. (1993), Money and growth revisited : Measuring the costs of inflation in an endogenous growth model, “Journal of Monetary Economics”, Vol. 32(1), pp. 51-77. 26. Gurgul H., Lach Ł. (2010), The causal link between Polish stock market and key macroeconomic aggregates, “Betriebswirtschaftliche Forschung und Praxis”, Vol. 4, pp. 367–383. 27. Gylfason T. (1999), Output Gains from Economic Stabilization, “Journal of Development Economics”, Vol. 56, pp. 81-96. 28. Haslag J.H. (1995), Monetary policy, banking, and growth, “Economic Inquiry”, Vol. 36, No. 3, pp. 489-500. 29. Heymann D., Leijonhufvud A. (1995), High Inflation, Clarendon Press, Oxford. 30. Holland S. (1995), Inflation and uncertainty: tests for temporal ordering, “Journal of Money, Credit, and Banking”, Vol. 27(3), pp. 827-837. 31. Hussain M. (2005), Inflation and Growth: Estimation of Threshold Point for Pakistan, “Pakistan Business Review”, Vol. 17(3), pp. 1-15. 32. Huybens E., Smith B.D. (1999), Inflation, Financial Markets and Long-Run Real Activity, “Journal of Monetary Economics”, Vol. 43, pp. 283-315. 33. Hwang T., Wu J. (2011), Inflation and Economic Growth in China: An Empirical Analysis, “China and World Economy”, Vol. 19, No. 5, pp. 67-84. 34. Jones L.E., Manuelli R.E. (1995), Growth and the effects of inflation, “Journal of Economic Dynamics and Control”, Vol. 19, No. 8, pp. 1405-28.

17
35. Kalecki M. (1970), Problems of Financing Economic Development in a Mixed Economy, [In:] W.A. Eltis, M.F.G. Scottand J.N. Wolfe (eds.) Induction, Growth and Trade: Essays in Honour of Sir Roy Harrod, Oxford University Press, Oxford. 36. Khan M.S., Senhadji A.S. (2001), Threshold effects in the relationship between inflation and growth, “IMF Staff Papers”, Vol. 48, No. 1, pp. 1-21. 37. Kim S., Willett T.D. (2000), Is the Negative Correlation between Inflation and Growth Real? An Analysis of the Effects of the Oil Supply Shocks, “Applied Economics Letters”, Vol. 7, Issue 3, pp. 141-147. 38. Kong D. (2007), Does inflation restrain the financial development and economic growth? “IMF Staff Papers”, Vol. 48, No. 1, pp. 1-21. 39. Lee C., Wong S.Y. (2005), Inflationary threshold effects in the relationship between financial development and economic growth: evidence from Taiwan and Japan, “Journal of Economic Development”, Vol. 30(1), pp. 49-68. 40. Liu J., Xie W.D. (2003), Dynamic relationship between economic growth and inflation, “The Journal of World Economy”, Vol. 26, No. 6, pp. 48-57. 41. Liu J., Zhang H. (2004), Positive testing for the Tobin effect or anti Tobin effect in China’s economy, “Management World”, Vol. 20, No. 5, pp. 18-24. 42. Mallik G., Chowdhury A. (2001), Inflation and Economic Growth: Evidence from Four South Asian Countries, “Asia-Pacific Development Journal”, Vol. 8(1), pp. 123-135. 43. Mubarik Y.A. (2005), Inflation and growth: An estimate of the threshold level of inflation in Pakistan, “State Bank of Pakistan Research Bulletin”, Vol. 1, No. 1, pp. 35-44. 44. Mundell R. (1963), Inflation and real interest, “Journal of Political Economy”, Vol. 71, No. 3, pp. 280-283. 45. Munir Q., Mansur K., Furuoka F. (2009), Inflation and Economic Growth in Malaysia: A Threshold Regression Approach, “ASEAN Economic Bulletin”, Vol. 26(2), pp. 180-193. 46. Narayan P.K., Narayan S., Smyth, R. (2009), Understanding the inflation-output nexus for China, “China Economic Review”, Vol. 20, No. 1, pp. 82-90. 47. Ozdemir Z.A. (2010), Dynamics Of Inflation, Output Growth And Their Uncertainty In The UK: An Empirical Analysis, “Manchester School”, Vol. 78(6), pp. 511-537. 48. Pollin R., Zhu A. (2006), Inflation and economic growth: A cross-country nonlinear analysis, “Journal of Post Keynesian Economics”, Vol. 28, No. 4, pp. 593-614. 49. Rao B.B., Vadlamannati K.C. (2011), Globalization and growth in the low income African countries with the extreme bounds analysis, “Economic Modelling”, Vol. 28(3), pp. 795-805. 50. Sarel M. (1996), Nonlinear effects of inflation on economic growth, ”IMF Staff Papers” , Vol. 43, No. 1, pp. 199-215. 51. Singh K., Kalirajan K. (2003), The inflation-growth nexus in India: An empirical analysis, “Journal of Policy Modeling”, Vol. 25, No. 4, pp. 377-396. 52. Smyth D.J. (1994), Inflation and Growth, “Journal of Macroeconomics”, Vol. 16, pp. 261-270. 53. Stock J.H., Watson M.W. (2008), Heteroskedasticity-robust standard errors for fixed effects panel data regression, “Econometrica”, Vol. 76, pp. 155-174. 54. Stockman A.C. (1981), Anticipated inflation and the capital stock in a cash-in-advance economy, “Journal of Monetary Economics”, Vol. 8, No. 3, pp. 387-393. 55. Sweidan O.D. (2004), Does inflation harm economic growth in Jordan? An empirical analysis for the period 1970-2000, “International Journal of Econometrics and Quantitative Studies”, Vol. 1, No. 2, pp. 41-66. 56. Tobin J. (1965), Money and Economic Growth, “Econometrica”, Vol. 33, pp. 671-684. 57. Wang T. (1996), Economic Analysis of Price Inflation in Mainland China, Chung-Hua, Taipei. 58. Wooldridge J.M. (2009), Introductory Econometrics: A Modern Approach. 4th ed., South-Western College Pub, Cincinnati.

18
ZWI ĄZKI POMI ĘDZY STOPĄ INFLACJI A WZROSTEM GOSPORCZYM W POLSKICH WOJEWÓDZTWACH W OKRESIE POAKCESYJNYM
Streszczenie: Artykuł jest jednym z pierwszych opracowań analizujących na poziomie regionalnym związki pomiędzy stopą inflacji a wzrostem gospodarczym w Polsce po wejściu do UE. Wyniki potwierdziły, że w okresie 2004-2010 występował nieliniowy związek przyczynowy pomiędzy stopą inflacji a tempem wzrostu gospodarczego w polskich województwach. Badania potwierdziły występowanie dwóch statystycznie istotnych progowych poziomów inflacji związanych z równoczesnymi i opóźnionymi efektami czasowymi. Słowa kluczowe: stopa inflacji, wzrost gospodarczy, poziomy progowe, zmiana strukturalna, polskie dane regionalne.