economic reform & accession to - World Bank Documents
404
TURKEY Economic Reform & accession to the European Union Editors Bernard M. Hoekman • Sübidey Togan 34422 Public Disclosure Authorized Public Disclosure Authorized Public Disclosure Authorized Public Disclosure Authorized Public Disclosure Authorized Public Disclosure Authorized Public Disclosure Authorized Public Disclosure Authorized
-
Upload
khangminh22 -
Category
Documents
-
view
0 -
download
0
Transcript of economic reform & accession to - World Bank Documents

T U R K E YEconomic Reform &
accession to the European Union
EditorsBernard M. Hoekman • Sübidey Togan
34422P
ublic
Dis
clos
ure
Aut
horiz
edP
ublic
Dis
clos
ure
Aut
horiz
edP
ublic
Dis
clos
ure
Aut
horiz
edP
ublic
Dis
clos
ure
Aut
horiz
edP
ublic
Dis
clos
ure
Aut
horiz
edP
ublic
Dis
clos
ure
Aut
horiz
edP
ublic
Dis
clos
ure
Aut
horiz
edP
ublic
Dis
clos
ure
Aut
horiz
ed

Kara
man
Kara
man
Kony
aKo
nya
Aks
aray
Aks
aray
Nig
deN
igde
Nev
sehi
rN
evse
hir
Kays
eri
Kays
eri
Mal
atya
Mal
atya A
diya
man
Adi
yam
anElaz
igEl
azigTu
ncel
iTu
ncel
i
Erzi
ncan
Erzi
ncan
Bing
Bing
ööllM
usM
us
Bitli
sBi
tlis
Diy
arba
kir
Diy
arba
kir
Batm
anBa
tman
Siirt
Siirt
Sirn
akSi
rnak
Mar
din
Mar
din
Hak
kari
Hak
kari
Van
Van
Agr
iA
gri
Igdi
rIg
dir
Erzu
rum
Erzu
rum
Kars
Kars
Artv
inA
rtvin
Rize
Rize
GGüümm
üüsha
nesh
ane
¸
Bayb
urt
Bayb
urt
Gire
sun
Gire
sun
Toka
tTo
kat
Siva
sSi
vas
Am
asya
Am
asya
Sam
sun
Sam
sun
Kasta
mon
ouKa
stam
onou
ÇÇank
irian
kiri
Kara
bKa
rabüü
kkBo
luBo
luSa
kary
aSa
kary
a(A
dapa
zari)
(Ada
paza
ri)
Koca
eli
Koca
eli
(Izm
it)(Iz
mit)
Bile
cik
Bile
cik
Eski
sehi
rEs
kise
hir
KKüüta
hya
tahy
a
Burs
aBu
rsa
Edirn
eEd
irne
Kirk
lare
liKi
rkla
reli
ÇÇana
kkal
ean
akka
le
Balik
esir
Balik
esir
Man
isaM
anisa
Usa
kU
sak
Ayd
inA
ydin
Den
izli
Den
izli
Burd
urBu
rdur
Ispar
taIsp
arta
Afy
onA
fyon
Ant
alya
Ant
alya
Mug
laM
ugla
Kirik
kale
Kirik
kale
ÇÇoru
mor
um
Yozg
atYo
zgat
Kirs
ehir
Kirs
ehir
Ada
naA
dana
Osm
aniy
eO
sman
iye
Kahr
aman
Kahr
aman
Mar
asM
aras G
azia
ntep
Gaz
iant
epKi
lisKi
lis
Sanl
iurfa
Sanl
iurfa
Ard
ahan
Ard
ahan
Kara
man
Kony
a
Aks
aray
Nig
de
Nev
sehi
rKa
yser
iM
alat
ya Adi
yam
anElaz
igTunc
eli
Erzi
ncan
Bing
ölM
us
Bitli
s
Diy
arba
kir
Batm
anSi
irt
Sirn
akM
ardi
n
Hak
kari
Van
Agr
i
Igdi
r
Erzu
rum
Kars
Artv
in
Rize
Trab
zon
Güm
üsha
ne¸
Bayb
urt
Gire
sun
Ord
u
Toka
t
Siva
s
Am
asya
Sam
sun
Sino
p
Kasta
mon
ou
Çank
iri
Kara
bük
Barti
nZo
ngul
dak
Bolu
Saka
rya
(Ada
paza
ri)
Koca
eli
(Izm
it)
Bile
cik
Eski
sehi
r
Küta
hya
Burs
a
Yalo
va
Istan
bul
Teki
rdag
Edirn
eKi
rkla
reli
Çana
kkal
e
Balik
esir
Man
isaIz
mir
Usa
k
Ayd
inD
eniz
li
Burd
urIsp
arta
Afy
on
Ant
alya
Mug
la
Kirik
kale
Çoru
m Yozg
at
Kirs
ehir
Icel
(Mer
sin)
Ada
na
Hat
ay (A
ntak
ya)
Osm
aniy
e
Kahr
aman
Mar
as Gaz
iant
epKi
lis
Sanl
iurfa
Ard
ahan
AN
KARA
SY
RIA
N A
RA
BR
EPU
BLI
C
IRA
Q
ISLA
MIC
REP.
OF
IRA
N
AR
MEN
IA
GEO
RG
IA
BU
LGA
RIA
RU
SS
IAN
FED
ERA
TIO
N AZE
R-BA
IJAN
AZE
R.
GREECE
GREECE
Tuz
Göl
ü
Hoy
ran
Göl
üBa
yseh
irG
ölü
Aks
ehir
Göl
ü
Lake
Van
Çoru
h
Mur
at
Kura
Ara
s
Fira
t
Tigr
is
Euph
rate
s
Saka
rya
Devre
z
Kizil
Cek
erek
Kizil
Seyhan
Göksu
Ceyh
an
Kelki
t
Bla
ck
Sea
Med
iter
rane
an
Sea
Sea
ofM
arm
ara
Gul
f of
Ant
alya
Bosp
orus
Dard
anel
les
26°E
28°E
30°E
32°E
34°E
36°E
38°E
42°E
44°E
30°E
28°E
32°E
34°E
36°N
38°N
40°N
42°N
40°N
42°N

Turkey: Economic Reformand Accession to the
European Union


Turkey: EconomicReform and
Accession to theEuropean Union
Editors
Bernard Hoekman and Sübidey Togan
A copublication of the World Bank and the Centre for Economic Policy Research

© 2005 The International Bank for Reconstruction and Development / The World Bank1818 H Street, NWWashington, DC 20433Telephone 202-473-1000Internet www.worldbank.orgE-mail [email protected]
All rights reserved.A copublication of the World Bank and the Centre for Economic Policy Research
1 2 3 4 08 07 06 05
The findings, interpretations, and conclusions expressed herein are those of the author(s) and do not necessarilyreflect the views of the Board of Executive Directors of the World Bank or the governments they represent.
The World Bank does not guarantee the accuracy of the data included in this work. The boundaries, colors,denominations, and other information shown on any map in this work do not imply any judgment on the part of theWorld Bank concerning the legal status of any territory or the endorsement or acceptance of such boundaries.
Rights and PermissionsThe material in this work is copyrighted. Copying and/or transmitting portions or all of this work without
permission may be a violation of applicable law. The World Bank encourages dissemination of its work and willnormally grant permission promptly.
For permission to photocopy or reprint any part of this work, please send a request with complete information tothe Copyright Clearance Center, Inc., 222 Rosewood Drive, Danvers, MA 01923, USA, telephone 978-750-8400,fax 978-750-4470, www.copyright.com.
All other queries on rights and licenses, including subsidiary rights, should be addressed to the Office of the Publisher, World Bank, 1818 H Street NW, Washington, DC 20433, USA, fax 202-522-2422,e-mail [email protected].
Cover: Design by Tomoko Hirata. Photographs courtesy of the Ministry of Culture and Tourism of Turkey.
Library of Congress Cataloging-in-Publication Data
Turkey: economic reform and accession to the European Union / edited by Sübidey Togan, Bernard Hoekman.p. cm.—(Trade and development series)
Includes bibliographical references and index.ISBN 0-8213-5932-0 (pbk.)
1. Turkey—Economic policy. 2. Turkey—Economic conditions. 3. European Union—Membership. 4. Internationaleconomic integration. I. Togan, Sübidey. II. Hoekman, Bernard M., 1959- . III. Series.HC492.T8576 2005330.9561'04—dc22 2004063747
ISBN 0-8213-5932-0E-ISBN 0-8213-6084-1DOI 10.1596/978-0-8213-5932-0

Contents
Acknowledgments xiList of Contributors xiiiAcronyms and Abbreviations xvOverview xvii
PART I: MACROECONOMIC POLICIES FOR EU ACCESSION 1
1 MACROECONOMIC POLICIES FOR TURKEY’S ACCESSION TO THE EU 3Sübidey Togan and Hasan Ersel
PART II: AGRICULTURE, MANUFACTURING, SERVICES, AND NETWORK INDUSTRIES 37
2 ANALYSIS OF THE IMPACT OF EU ENLARGEMENT ON THE AGRICULTURAL MARKETS AND INCOMES OF TURKEY 39Sübidey Togan, Ahmet Bayener, and John Nash
3 INTEGRATION AND THE MANUFACTURING INDUSTRY 87Sübidey Togan, Hüsamettin Nebioglu, and Saadettin Dogan
4 ACCESSION OF TURKEY TO THE EUROPEAN UNION: MARKET ACCESS ANDREGULATORY ISSUES 123Joseph Francois
5 THE TURKISH TELECOMMUNICATIONS SECTOR: A COMPARATIVE ANALYSIS 147Erkan Akdemir, Erdem Basçı, and Gareth Locksley
6 ACCESSION TO THE EUROPEAN UNION: POTENTIAL IMPACTS ON THE TURKISH BANKING SECTOR 161Ceyla Pazarbasıoglu
7 COMPETITION AND REGULATORY REFORM IN TURKEY’S ELECTRICITY INDUSTRY 187I.zak Atiyas and Mark Dutz
8 INSTITUTIONAL ENDOWMENT AND REGULATORY REFORM IN TURKEY’S NATURAL GAS SECTOR 209Maria Rita Mazzanti and Alberto Biancardi
v

PART III: ECONOMIC CHALLENGES 221
9 LABOR MARKET POLICIES AND EU ACCESSION: PROBLEMS AND PROSPECTS FOR TURKEY 223Erol Taymaz and Sule Özler
10 TURKEY’S FOREIGN DIRECT INVESTMENT CHALLENGES: COMPETITION,THE RULE OF LAW, AND EU ACCESSION 261Mark Dutz, Melek Us, and Kamil Yılmaz
11 TURKEY ON THE PATH TO EU ACCESSION: THE ENVIRONMENTAL ACQUIS 295Anil Markandya
PART IV: IMPLICATIONS OF EU ACCESSION FOR TURKEY AND THE EU 309
12 ECONOMIC IMPLICATIONS OF EU ACCESSION FOR TURKEY 311Sübidey Togan
13 THE IMPACT OF TURKEY’S MEMBERSHIP ON EU VOTING 331Richard Baldwin and Mika Widgrén
14 ECONOMIC EFFECTS OF TURKEY’S MEMBERSHIP ON THE EUROPEAN UNION 341Harry Flam
INDEX 353
LIST OF BOXES, FIGURES, AND TABLES
BOXES7.1 California’s Electricity Crisis 205
11.1 The Experience of the World Bank with Water Utilities in the Baltic States 299
FIGURES1.1 Inflation and the Growth Rate of Reserve Money: January 1987–September 2004 41.2 Inflation and the Rate of Depreciation of Turkish Lira: January 1987–September 2004 41.3 Current-Account-to-GDP Ratio, 1975–2004 71.4 Real Exchange Rate, 1980–2004 71.5 Real Interest Rate, January 1990–October 2003 93.1 Average Value of Manufacturing Industry Markup, 1980–2000 1164.1 Comparison of Regulatory Regimes 1384.2 Decomposition of Overall Transport Regulation Index 1394.3 Armington Aggregation Nest 1424.4 Trading Costs in the Services Sector 1434.5 Basic Features of the Simulation Model 1435.1 Telecommunications Revenue in GDP
150
5.2 Households with Fixed-Line Telephone Service5.3 Fixed-Line Penetration Rates5.4 Largest City/Overall Country Teledensity Ratio5.5 Investment in Telecommunications5.6 Mobile Penetration Rates5.7 Households with Internet Access
vi Contents
150
148149
149149
149

5.8 Regular Users of Internet in Population
152
5.9 Internet Access Costs5.10 Regular Use versus Dial-up Access Costs of Internet 5.11 Penetration versus Dial-up Access Costs of Internet 5.12 Personal Computer Use5.13 Residential Monthly Access Fee (Including Value Added Tax) for Fixed-Line
Telephone Service5.14 Cost (Including Value Added Tax) of a Three-Minute Economy Local Call5.15 Quality of Service5.16 International Telephone Traffic5.17 Basket of National Calls 155.18 Basket of International Calls 156.1 Turkish Bank Restructuring Strategy 1636.2 Concentration Ratios of Five Largest Banks, 2003 1656.3 Share of Assets of State-Owned Banks, 2003 1656.4 Capital Adequacy Ratios, 2003 1656.5 Size of Deposits Subject to Insurance, 2003 1666.6 Average Bank Size, 2003 1666.7 Number of Branches per Bank, 2003 1676.8 Number of Personnel per Branch, 2003 1676.9 Selected Indicators, 2003 1676.10 Return on Equity of EU Banks by Asset Size, 2003 1686.11 Return on Equity: Turkey and EU Banking Sectors, 2003 1686.12 Personnel Expenses to Total Assets, 2003 1686.13 Personnel Expenses to Total Expenditures, 2003 1686.14 Total Loans to Total Assets, 2003 1696.15 Nonperforming Loans (Gross) to Total Loans, 2003 1696.16 Debt Securities to Total Assets, 2003 1696.17 Financial Strength Rating of the Sector (Moody’s), 2003 1707.1 Structure of the Electricity Market, Turkey 1947.2 Electricity Losses of Turkey versus OECD, 1984–2000 1989.1 Employment Protection Legislation, Selected OECD Countries 2459.2 Flow into Unemployment and Employment Protection: Selected Countries, 1985–94 2469.3 Unemployment Duration and Employment Protection: Selected Countries, 1985–94 2479.4 Unemployment Rate and Employment Protection: Selected Countries, 1985–94 2479.5a Interindustry Wage Differentials: Selected Countries, 1980–2000 2489.5b Interindustry Wage Differentials: Selected Countries, 1980–2000 2489.6 Labor Demand Adjustment Speed and Wage Elasticity: Selected Countries, 1980–97 2509.7 Sectoral Distribution of Employment, Value Added, and Output: Private
Manufacturing Industry, Turkey, 2000 2549.8 Structure of Value Added in Private Manufacturing: Turkey, 2000 255
10.1 FDI Inflows: Turkey versus Comparator CEE Countries, 1990–2001 26410.2 M&A-Related Inflows: Turkey versus Comparator CEE Countries, 1990–2001 26710.3 Privatization Revenues: Turkey versus Comparator CEE Countries, 1990–2000 26710.4 Case Studies 27710.5 Areas for Investment Climate Reform 28512.1 OECD Composite Telecommunications Business Basket, November 2001 32312.2 OECD Composite Telecommunications Residential Basket, November 2001 32313.1 Passage Probabilities: European Council, 1957–2004, and after Entry
of Bulgaria, Romania, Croatia, and Turkey 33213.2 Change in Power for EU25, Nice Treaty to Constitutional Treaty Rules 334
Contents vii
150
151150
151151
152152152
77

13.3 Power Difference between Nice Treaty and Constitutional Treaty Rules for EU29 33513.4 NBI Values under Nice Treaty and Constitutional Treaty Voting
Rules for EU29 33613.5 Impact of Enlargement on EU25 Power, Nice Treaty Rules 33713.6 Impact of Enlargement on EU25 Power, Constitutional Treaty Rules 33814.1 Effects of Migration 34214.2 Forecast of Turkish Immigrant Population in Germany, 2000–30 345
TABLES1.1 Estimated Inflation (Monthly) 51.2 Structure of Revenues, Expenditures, and Public Sector Borrowing
Requirements (PSBR), 1998–2002 81.3 Debt and Fiscal Sustainability, 1994–2002 101.4 Ratios of Public Sector Borrowing Requirements (PSBR) and Debt to GNP
and GDP, 2000–03 111.5 Total Tax Revenue as Percentage of GDP, 1998–2000 111.6 Revenue from Major Taxes as a Percentage of Total Tax Revenue, 1998 121.7 Personal Tax, Corporate Tax, and VAT System: Turkey and EU Countries, 2002 131.8 Labor Market Indicators: Turkey, 2001–03 131.9 European Monetary Union Convergence Criteria 201.10 Estimates of the Sacrifice Ratio 211.11 Current Account Sustainability Measures, 1984–2003 251.12 Results for Quarterly Instrumental Variable Regression of Ratio of Noninerest
Current Account (NICA) to GDP 262.1 Land Use in Turkey, 1995 and 2000 402.2 Value of Agricultural Production: Turkey, 2000 402.3 Agricultural Holdings and Land Engaged in Crop Production, Turkey 412.4 Exports and Imports of Agricultural Commodities: Turkey, 1999–2001 422.5 Most-Favored-Nation Tariff Rates of EU and Turkey, 2002 462.6 Agricultural Supports: Turkey, 1998–2002 492.7 Base Period Results of Model for Major Activities 572.8a Simulation Results for Adoption of Agenda 2000 without Direct Payments 602.8b Simulation Results for Adoption of Agenda 2000 with Direct Payments 602.9a Simulation Results for Adoption of Agenda 2000 with Direct
Payments at 35 Percent 612.9b Simulation Results for Adoption of Free Trade with Direct Payments 612.10 Selected Positions of Agricultural Negotiation between Slovak Republic
and European Commission (EC) 622.11 Simulation Results for Alignment to Agenda 2000 under Positive Supply Response 642.12 Structure of Household Expenditures 652.13 Simulation of Scenario Effects on Real Income, Selected Household Types 662.14 Trade-Related Budget Effects and Direct Payments under Agenda 2000 682.15 Contributions to and Revenues from EU Budget 692.16 Impact of Changes in Agricultural Policies on Agricultural Incomes 702.17 Arrangements Applicable to European Community Importation of Agricultural
Products, Other than Fruits and Vegetables Originating in Turkey 762.18 Arrangements Applicable to European Community Importation of Fruits
and Vegetables Originating in Turkey 782.19 Agricultural Products for Which EU Entry Price System Applies 802.20 Structure of Household Expenditures 81
viii Contents

3.1 Exports and Imports, Turkey 883.2 Exports and Imports, EU 913.3 Trade with EU, 1990–2003 933.4 Effects of Customs Union between Turkey and EU, 1995–2001 953.5 Nominal and Effective Protection Rates, 2002 1003.6 Frequency Distribution of Protection Rates, 2002 1023.7 Nominal and Effective Protection Rates, 2002 1023.8 Products Subject to Antidumping Investigations, 1996–2002 1043.9 EC Technical Regulation Directives and European Community (EC)
Imports, 1995 1083.10 Trade Coverage of Technical Regulations and of Different Approaches
to Their Removal 1113.11 Sectors with Highest RCA Values in Each Category 1133.12 Characteristics of Turkish Manufacturing Industries, 2000 1153.13 Average Profit Margins, Turkey and Belgium 1173.14 Concentration of Domestic Activity 1184.1 Structure of EU Free Trade Agreements with Selected Developing Countries 1254.2 Processed Food Concessions under the EU-Turkey Customs Union 1284.3 Customs Union Scenario 1294.4 Summary of Macroeconomic Effects of Customs Union for Turkey 1304.5 Change in Output by Sector in Turkey 1314.6 Variables Used from OECD International Regulation Database 1334.7 Regulation Indexes, Air Transport 1354.8 Regulation Indexes, Road Transport 1364.9 Regulation Indexes, Rail Transport 1374.10 Regulation Indexes, All Transport 1384.11 Regression Results for Gravity Equation on Cross-Border Trade 1404.12 Sectoring Scheme of Model 1415.1 Monthly Residential Access Fee and Local Call Tariffs: 15 EU Member States
and Washington, DC, July 1, 20025.2 Monthly Residential Access Fee and Local Call Charges: 13 EU
Preaccession Countries (PAC), March 31, 20026.1 Initial Fiscal Costs of Turkish Banking Crisis, 2000–01 1636.2 Results, Quantitative Impact Study 2003 1716.3 Statistics on Banking Sectors of EU15 and Turkey, 2003 1746.4 Statistics on Banking Sectors of EU15 and Turkey, 2001 1756.5 Statistics on Banking Sectors of Enlargement (Candidate) Countries
and Turkey, 2003 1766.6 Statistics on Banking Sectors of Enlargement (Candidate) Countries
and Turkey, 2001 1776.7 Income, Costs, and Profits of EU Banks in Different Size Groups, 2003 1786.8 Indicators of 50 Major EU Banks, 2002 and 2003 1796.9 Nonperforming Assets and Provisioning of EU Banks, 2003 1796.10 Regulatory Capital Ratios and Risk-Adjusted Items of EU15 Banks, 2003 1806.11 EU Balance Sheet Structure of EU Banks, 2003 1807.1 Turkey’s Electricity Generating Capacity: 2002, 2005, 2010 1967.2 Retail Prices for Electricity 1998.1 Existing Gas Agreements, Turkey 2129.1 Employment Indicators: EU and Selected Group of Candidate Countries, 2000 2279.2a Income Tax Plus Employees’ and Employers’ Social Security Contributions, 2002 228
Contents ix
15
15
8
8
9.2b Income Tax Plus Employees’ and Employers’ Contributions Less Cash Benefits, by Family Type and Wage Level, 2002 229
9.3 EU Directives and Turkish Labor Law 2329.4 Employment Protection Legislation Index: OECD Countries, Late 1990s 2419.5 Employment Protection Legislation for Regular Employment,
Selected OECD Countries 2429.6 Employment Protection Legislation for Temporary Employment,
Selected OECD Countries 2449.7 Job Turnover, Selected Countries 2499.8 Job Turnover in Turkish Manufacturing Industries 2499.9 Composition of Output in Private Manufacturing: Turkey, 2000 2549.10 Simulation Results 256
10.1 FDI Summary Data: Turkey versus Comparator CEE Countries 26510.2 FDI Definition in OECD Countries 26610.3 FDI Stocks by Industrial Sector, 2000 26810.4 Largest Affiliates of Foreign Transnational Corporations 26910.5 FDI Stocks by Country of Origin, 2000 27110.6 Macroeconomic Indicators, 1995–2001 27210.7a Infrastructure-Related Factors—Strengths: Turkey versus Comparator
CEE Countries 27310.7b Infrastructure-Related Factors—Weaknesses: Turkey versus
Comparator CEE Countries 27411.1 Comparison of Environmental Costs of EU Accession for Turkey
and Other Candidate Countries 29711.2 Scenarios for Implementation of Environmental Investments for the Acquis 30111.3 Environmental Accesson Costs for Turkey 30211.4 Types of Benefits of Compliance with Directives Estimated
for Candidate Countries 30211.5 Estimated Benefits for Turkey from Compliance with Environmental Directives 30311.6 Costs of Accession for Turkey in First Six Years 30411.7 Environmental Expenditures in Turkey, 1997–99 30511. 8 Estimated Annual Spending on Monitoring and Enforcement, Turkey 30512.1 Impact of Agenda 2000 Policies 31212.2 Restrictiveness Index Scores and Price Effects for Banking Services,
EU and Turkey 31312.3 Restrictiveness Index Scores for Telecommunications Services 31512.4 Country Data on European and Turkish Electricity Sectors, 1998 31812.5 Price Impact of Regulation in Electricity Supply, EU and Turkey 31912.6 EU Country Data on European Natural Gas Sectors 32012.7 Retail Prices of Natural Gas and Electricity, 2000 32212.8 OECD Basket of International Telephone Charges, November 2001 32412.9 Estimated Tariff Equivalents in Traded Services and Network Industries 32412.10 Gravity Estimates for Intra-EU15 Trade 32913.1 Power Indices under Constitutional Treaty Rules 33913.2 Power Indices under Nice Treaty Rules 33914.1 EU Budget, 2002 34614.2 Estimates of EU Budget Contributions/Receipts Equations 34814.3 Estimated EU Budget Contributions and Receipts 34814.4 Pooled Panel Gravity Estimates for Intra-EU15 Trade 35014.5 Forecast of Trade with EU15 350
x Contents

xi
Acknowledgments
The essays in this volume, with the exception of thelast three, were discussed at the conference “Turkey:Towards EU Accession,” held May 10–11, 2003, inAnkara, Turkey. Among the participants were eco-nomists from Turkey, Britain, Italy, the Netherlands,Central and Eastern European countries, the WorldBank, and the Organisation for Economic Co-operation and Development (OECD). The mixedcomposition of the participants—drawn from vari-ous Turkish universities; official agencies in Turkey,including the Ministry of Foreign Affairs, Ministry ofAgriculture, Ministry of Environment, Ministry ofLabor, General Secretariat for EU Affairs, Undersec-retariat of Treasury, Undersecretariat of ForeignTrade, State Planning Organization, Central Bank,Banking Regulatory and Supervisory Agency,Telecommunications Board, and Energy Board;European University Institute; Erasmus University;the World Bank; and the OECD—allowed a wide-ranging discussion of the issues.
The project was supported by the World Bank,European Commission, Robert Schuman Centrefor Advanced Studies at the European UniversityInstitute, and Bilkent University. We would liketo express our appreciation to the sponsors ofthe project. We are particularly grateful to AjayChhibber and James Parks of the World Bank,Giacomo Luciani and Helen Wallace of the RobertSchuman Centre, Hansjörg Kretschmer and VincentRey at the European Union Representation of the
European Commission to Turkey,andAli Dogramacıof Bilkent University.
As editors of the volume, we would like to expressour gratitude to all the participants in the 2003 con-ference, including the contributors to this volumeand their discussants, for their valuable contribu-tions. We also are grateful to the three referees whoprovided constructive suggestions for revision of thechapters, to Ines Garcia-Thoumi for helping to findthe resources to allow this book to be published, toRebecca Martin for her assistance in preparing themanuscript, to Thierry Verdier, Riccardo Faini, andStephen Yeo for their support in co-publishing thisvolume with CEPR, and to Mary Fisk, SantiagoPombo-Bejarano, and Stephen McGroarty in theOffice of the Publisher for their management of thepublication process. This volume provides readerswith insights into selected aspects of Turkish acces-sion to the European Union, and we hope it willinspire similar studies.
Disclaimer
All opinions expressed in this volume are strictlypersonal and should not be attributed to any gov-ernment, official agency, or institution with whichauthors are or have been affiliated.
Bernard Hoekman and Sübidey Togan


List of Contributors
Erkan Akdemir Telecommunications Authority of TurkeyIzak Atiyas Sabancı University, IstanbulRichard Baldwin Graduate Institute of International Studies, Geneva, and
Centre for Economic Policy and Research (CEPR), LondonErdem Basçı Central Bank of TurkeyAhmet Bayener Ministry of Agriculture and Rural Affairs, AnkaraAlberto Biancardi Acquirente Unico Spa, ItalySaadettin Dogan Undersecreteriat of Foreign Trade, AnkaraMark Dutz World BankHasan Ersel Sabancı University, IstanbulHarry Flam Institute for International Economic Studies, StockholmJoseph Francois Erasmus University, Rotterdam, and CEPRBernard Hoekman Groupe d’Economie Mondiale, Institut d’Etudes Politiques, Paris;
World Bank; and CEPRGareth Locksley World BankAnil Markandya World BankMaria Rita Mazzanti Italian Electricity and Gas Regulatory AuthorityJohn Nash World BankHüsamettin Nebioglu Undersecretariat of Foreign Trade, AnkaraSule Özler University of California at Los AngelesCeyla Pazarbasıoglu International Monetary FundErol Taymaz Middle East Technical University, AnkaraSübidey Togan Bilkent University, AnkaraMelek Us Association of Dairy Beef and Food Manufacturers and Producers
in TurkeyMika Widgrén Turku School of Economics, Turku, Finland, and CEPRKamil Yılmaz Koç University, Istanbul
xiii


Acronyms andAbbreviations
ACC agricultural credit cooperatives BEPG Broad Economic Policy GuidelinesBIPS border inspection postsCAP Common Agricultural Policy CCT Common Customs TariffsCEE Central and Eastern European
(Countries)CEEP European Centre of Enterprises
with Public ParticipationCEN Comité Européen de NormalisationCENELEC Comité Européen de Normalisation
ElectrotechniqueCOM Common Organization of the Market CPI consumer price indexCUD Customs Union DecisionEAGGF European Agricultural Guidance
and Guarantee FundECSC European Coal and Steel
Community EEA European Economic AreaEFTA European Free Trade AssociationEMRA Energy Market Regulatory AuthorityEMU Economic and Monetary UnionESA European System of AccountsECB European Central BankECOFIN Council for Economic and Financial
AffairsEONIA European Over-Night Index AverageEPL employment-protection legislationESCB European System of Central BanksETUC European Trade Union
ConfederationEU European UnionFDI foreign direct investmentFTA free trade agreementFX foreign exchangeGATT General Agreement on Tariffs and
TradeGDP gross domestic productGFCF gross fixed capital formationGNP gross national productHICP Harmonised Index of Consumer
Prices
IACS Integrated Administration andControl System
IMF International Monetary FundJAP joint assessment paper MARA Ministry of Agriculture and Rural
AffairsM&A merger and acquisitionMFN most-favored nationMRA Mutual Recognition AgreementMRP Mutual Recognition PrincipleMTR mid-term reviewNBI normalized Banzhaf indexncb national central bank OECD Organisation for Economic
Co-operation and DevelopmentPEP Preaccession Economic ProgrammePPP purchasing power parity PSBR public sector borrowing
requirementsRER real exchange rate SDR special drawing rightsSEE state economic enterpriseSITC Standard Identification Trade
ClassificationSPO state Planning Organization
(Turkey) SSI Shapley-Shubik indexTBT technical barriers to tradeTEKEL Tobacco and Tobacco Products, Salt,
and Alcohol IndustryTFP total factor productivity TL Turkish lira TSE Turkish Standards InstituteTUBITAK Turkish Scientific and Technical
Research InstituteTT Türk TelecomUME National Metrology InstituteUNCTAD United Nations Conference on Trade
and Development UNICE Union of Industrial and Employers’
Confederations of EuropeVAT value-added systemWTO World Trade Organization
xv


xvii
Overview
Turkey first applied for associate membership inthe European Union (EU)—then the EuropeanEconomic Community (EEC)—in 1959. The appli-cation resulted in an association agreement in1963, whereby Turkey and the EU would, in princi-ple, gradually create a customs union by 1995 at thelatest. The customs union was seen as a step towardfull EU membership at an unspecified future date.The EU unilaterally granted Turkey preferentialtariffs and financial assistance, but the process ofstaged, mutual reductions in tariffs and nontariffbarriers was delayed because of the economic andpolitical conditions in Turkey. After pursuinginward-oriented development strategies through-out the 1960s and 1970s, Turkey switched over to amore outward-oriented policy stance in 1980. Theopening up of the economy was pursued in partwith the aim of integrating the country into the EU.
Turkey applied for full membership in the EU in1987. The response in 1990 was that accessionnegotiations could not be undertaken at the timebecause the EU was engaged in major internalchanges, and that matters were further complicatedby developments in Eastern Europe and the SovietUnion. However, the EU was prepared to extendand deepen economic relations without explicitlyrejecting the possibility of full membership at afuture date. Thus the plans for a customs unionwere revived.
On March 6, 1995, it was agreed at an Associa-tion Council meeting in Brussels that a customsunion would be created between Turkey and the EUas of January 1, 1996, to be fully phased in by 2001.1
As a result, Turkey currently imposes no quotas ortariffs on imports of industrial goods from the EU.The associated liberalization for Turkey has beenestimated as implying a 7 percent average reductionin tariffs (Harrison, Rutherford, and Tarr 1997).The major exception to free trade is agriculture—neither party liberalized completely. The averagetariff rate on imports of agricultural commoditiesfrom the EU is 21.4 percent. Agricultural trade isalso subject to tariff quotas and price regulation,
which have produced a high degree of protection inboth the EU and Turkey. Thus, in terms of furtherliberalization of merchandise trade, accession willprimarily have an effect on agriculture.
A major development under the customs unionwas that Turkey implemented the EuropeanUnion’s Common Customs Tariff on imports ofindustrial goods from third countries. It has alsoadopted most of the preferential trade agreementsconcluded by the EU, as well as other measurescovered by the EU’s commercial policy (such asantidumping). Turkey has adopted EU competitionpolicies, established a Competition Board, adoptedEU rules on protection of intellectual and indus-trial property rights, set up a Patent Office, and ini-tiated a process of harmonizing technical standardsfor industrial products and strengthening internalconformity assessment and market surveillancestructures.
On December 10–11, 1999, the European Coun-cil meeting held in Helsinki produced a break-through in Turkey-EU relations. At Helsinki,Turkey was officially recognized as a candidate statefor accession, on an equal footing with other candi-date states. The result was the creation of a so-calledAccession Partnership with the EU, which meansthat the EU is working together with Turkey toenable it to adopt the acquis communautaire, thelegal framework of the EU. But, in contrast to othercandidate countries, Turkey did not receive atimetable for accession. After the approval of theAccession Partnership by the Council and the adop-tion of the Framework Regulation on February 26,2001, the Turkish government announced onMarch 19, 2001, its own National Program for theadoption of the acquis communautaire. Progresstoward accession continues along the path set bythe National Program.
In late 2004 another milestone was reached withthe recommendation of the European Commissionthat the European Council endorse the launchingof formal accession negotiations with Turkeyand establish a timetable for accession (European

Commission 2004b). In December 2002, theCopenhagen European Council had concluded that“if the European Council in December 2004, on thebasis of a report and a recommendation fromthe Commission, decides that Turkey fulfills theCopenhagen political criteria, the European Unionwill open accession negotiations with Turkey with-out delay.” At a December 2004 Council meeting, itwas decided to launch negotiations.
Although the process has now been launched,great uncertainties continue to prevail aboutwhether Turkey will be able to achieve its goal ofaccession to the EU.2 Some of these uncertaintiesare economic, and they are the subject of this book.Other uncertainties are more political in nature.Some of these are in the hands of the Turkishgovernment—for example, realization of the EUpolitical and human rights criteria formalized bythe European Council in Copenhagen in 1993, andacceptance of restrictions on immigration post-accession.3 Others are not. Arguably, the greatestuncertainty is whether EU governments and soci-eties are willing to accept a large secular butnonetheless Muslim state as part of the EU. Timewill reveal the ultimate outcome. What matters inthe short to medium term is the impact that con-tinued progress toward achieving the conditionsfor membership will have on Turkey. The EU is thefocal point for reforms in a large number of policyareas, and the preaccession process, which hasbeen ongoing for several years, is a unique experi-ment in using international harmonization as atool in implementing a comprehensive reformstrategy.
Much has been achieved by Turkey in recentyears, including progress in implementing thecustoms union—which covers many policy areas,not just trade but also nontariff barriers and com-petition policies—despite severe macroeconomicshocks and instability. The 1999 European Coun-cil decision affirming that Turkey is a candidatefor membership was followed by far-reachingconstitutional and legislative reforms, rangingfrom improved civil liberties and human rights toenhanced civilian control of the military. ADepartment for EU Affairs was set up in 2000 tocoordinate all of Turkey’s policies related to thepreaccession process. A series of constitutionaland legislative changes were adopted during2001–04, some of them major, as well as numer-
ous regulations, decrees, and circulars detailinghow these reforms should be implemented. AReform Monitoring Group, under the chairman-ship of the deputy prime minister responsiblefor human rights, was established to supervisethe reforms across the board and to solve practi-cal problems, including bureaucratic inertia andbottlenecks at both the central government andstate government levels (European Commission2004c).
However, clearly much remains to be done onboth the macro- and the microeconomic fronts.Accession entails going beyond the customs unionfor manufactures and integrating the markets foragriculture, services, and factors (labor, investment,and capital flows). Until now, liberalization of tradehas been restricted to industrial goods. Because agri-culture accounts for about 14 percent of Turkey’sgross domestic product (GDP) and services 60 per-cent, the liberalization of trade to date has thus hadlimited implications for three-quarters of eco-nomic activity. Although this statement is an exag-geration because autonomous reforms have beenimplemented in these sectors of the economy, join-ing the EU will require Turkey to adopt and imple-ment the whole body of EU legislation—the acquiscommunautaire—in all areas.
The purpose of this volume is to highlight cer-tain aspects of Turkish accession, with an emphasison the implications of integrating fully into the sin-gle market, adopting the acquis, and meeting theMaastricht Treaty criteria for fiscal and monetarypolicy.4 The contributors to this volume focus pri-marily on the impact of accession on Turkey—onlytwo chapters consider the possible impacts on theEU. One reason for this emphasis is that in sizeTurkey is small relative to the EU as a whole.Turkey’s GDP in 2004 was €240 billion comparedwith the combined GDP of the EU25 of €10.2 tril-lion.5 Thus Turkey would account for only 2.3 per-cent of the EU’s total output. Most of the adjust-ment burden and potential benefits thereforepertain to Turkey. One major exception, however, isrelated to Turkey’s large population: the free move-ment of workers could have a substantial impact onthe EU in both economic and political terms, andthe large population of Turkey may also have impli-cations for decision making in a larger EU. The out-come of accession talks on the movement of peopleis very important not only for the EU but also for
xviii Overview

Turkey, because the net benefits of accession willdepend on the conditions under which Turkey mayaccede to the EU.
Although the primary interest in this volume isto assess what accession may mean for Turkey andto gauge how far along Turkey is toward meetingthe acquis, the Turkish case is also relevant forother countries that may seek to use a strategy of“deep integration” with a large, developed countryor common market as a focal point and mecha-nism for undertaking both trade-related and regu-latory reforms. Increasingly, developing countriesare negotiating deeper forms of regional integra-tion agreements with high-income trading part-ners. Even though most of these agreements do notcome close to the depth of cooperation entailed byaccession to the EU—and in some sectors such asagriculture the accession process is unique in thatit implies integration into a common policyinvolving direct subsidies and managed trade—close study of the implications of seeking to emu-late the acquis should be of interest to other coun-tries contemplating the design of integrationefforts.
The volume is divided into four parts:
• the macroeconomic dimensions of EU accessionfor Turkey
• sectoral analyses of the effects of integrationinto the EU (adoption of the acquis) for the agri-culture, manufacturing, services, and networksectors
• the economic challenges of accession forTurkey’s labor market, investment framework,and environmental policy
• an assessment of the net impact for the Turkisheconomy as a whole of the various changesimplied by adoption of the acquis in the areascovered by the other parts of the volume, com-plemented by analyses of the likely implicationsfor the EU in three central areas: European deci-sion making and voting after Turkish accession;international transactions, both trade with andinward migration from Turkey; and the EUbudget.
This introduction begins by summarizing thethemes and key findings emerging from the chap-ters that follow. It then briefly discusses the likelyimpacts of Turkey’s accession on the EU, and it
concludes with a discussion of lessons for otherdeveloping countries that can be drawn fromTurkey’s efforts to date to bring its policies intoalignment with the acquis.
Macroeconomic Developments and Prospects
From 1990 to 2000, economic crises began to affectthe Turkish economy with growing frequency. Peri-ods of rapid economic expansion alternated withperiods of equally rapid decline. Inflation during1990–2000 fluctuated between 55 and 106 percent,for an average rate of 75 percent. Currently, Turkeyis in the midst of a determined campaign to turnaround decades of weak performance stemmingfrom pervasive structural rigidities and weak pub-lic finances. The past few years have witnessedthree major attempts at addressing underlyingweaknesses. The first, during 2000, was under thethree-year stand-by agreement with the Interna-tional Monetary Fund (IMF), initiated in Decem-ber 1999 after a significant drop in output mostlycaused by external factors, including the 1999earthquake. Despite some notable achievements, aworsening current account and a weak bankingsystem led to a liquidity crisis in late 2000. Thiscrisis turned into a full-blown banking crisisin February 2001, in which the governmentresponded by abandoning the crawling peg regimeand floating the currency. In May 2001, the IMFincreased its assistance under a new stand-byarrangement. Just as the revised program wasbeginning to show results, the terrorist attacks ofSeptember 11 in the United States triggered thereemergence of serious financing problems. In Feb-ruary 2002, the IMF approved a new three-yearstand-by credit agreement for Turkey to supportthe government’s economic program. With theimplementation of the stabilization program,Turkey envisaged a gradual but steady improve-ment in its economic conditions. In August 2004,Turkey approached the IMF for what it hopedwould be a final three-year stand-by agreementthat will serve as an exit program from instabilityand excessive debt.
The economic stabilization programs provedsuccessful at combating inflation, which fell from54.7 percent during 2000–01 to 10.6 percent in 2004because of efforts to maintain fiscal and monetary
Overview xix

discipline. According to the Turkish State PlanningOrganization (SPO), the fiscal deficit during 2001amounted to 16.4 percent of the gross nationalproduct (GNP)—and 20.9 percent of GNP, accord-ing to the IMF definition. During 2004, the fiscaldeficit was brought back down to 6.2 percent andthe government ran a primary surplus of 6.9 per-cent of GNP. After contracting by 9.5 percent in2001, real GNP expanded by 7.9 percent in 2002,5.9 percent in 2003, and 9.9 percent in 2004. Thegrowth was driven by strong productivity gainsand by robust private consumption, investment,and exports, and it has not been hindered by cutsin government consumption and investment. Theunemployment rate fell from 11.5 percent in thefirst quarter of 2002 to 10.3 percent in 2004, andthe average interest rate on government debtdeclined from 63.8 percent in 2001 to 25.7 percentduring 2004. Ratios of debt to GNP are still high,but they have been falling. The net public debt-to-GNP ratio has decreased from 90.5 percent in 2001to 63.5 percent in 2004. This decline reflects signif-icant income growth during 2002–04, attainmentof sizable primary surpluses over the last threeyears, and appreciation of the real exchange rate(RER).
Although these are positive developments, it istoo early to determine to what extent the reboundreflects a transition to sustainable growth. Substan-tial risks remain. First, during 2002–04 the RERappreciated to what is arguably an unsustainablelevel. Although the appreciation of the RER helpedto reduce the inflation rate and the debt-to-GDPratio, it led to a widening current account deficit.The annual deficit in 2004 reached US$15.4 bil-lion,6 and the current account-deficit-to-GDP ratioincreased to 5.1 percent. Because foreign directinvestment (FDI) inflows remain weak, the deficitis funded by additional foreign debt, raising con-cerns about the sustainability of the currentaccount. Second, the public sector debt remains fartoo high for comfort. Assuming trend economicgrowth of 5 percent and a primary fiscal surplus of6.5 percent of GDP, the debt ratio will fall over timeas long as real interest rates remain below 15 per-cent. Currently, the real rates on domestic debt areabout 11 percent. But shocks to credibility couldeasily push them higher and lead to concerns aboutthe sustainability of fiscal policy.7 A primary fiscalsurplus of 6.5 percent remains the minimum
required for safety. Third, the labor force participa-tion rate declined from about 57 percent at thebeginning of the 1990s to 48.7 percent in 2004,mainly because of the discouragement of job seek-ers. The policy of keeping the primary fiscal surplusat 6.5 percent of GDP over the coming years willconstrain the use of fiscal policy to drive down theunemployment rate in the economy. But unlessemployment growth picks up, continually highunemployment and low participation rates couldundermine the social and political support forreforms.
As discussed in greater depth by Sübidey Toganand Hasan Ersel in chapter 1, the macroeconomicchallenges for Turkey remain substantial. Besidessolving the problems summarized in this introduc-tion, during the preaccession period Turkey needsto reduce its annual inflation rate to about 3 per-cent, keep the debt-to-GDP ratio below 60 percent,and achieve stable growth in real income over time.Unless Turkey’s growth performance does improve,its real per capita GDP will never converge with theEU average and the accession of Turkey might cre-ate unmanageable stresses. In addition, the authorsnote that to avoid the risk of speculative attacks onits currency over the coming years, Turkey shouldcontinue to follow policies aimed at establishing asound fiscal framework, a robust banking sector,and sustained price stability. Turkey also must takemeasures to increase the national savings rate fromits rather low level of 22 percent in 2004 (China’ssavings rate is 44 percent) and reverse the apprecia-tion of the real exchange rate. To attain sustainabil-ity of the current account, the real exchange ratehas to depreciate gradually over time to its long-run equilibrium level. After accession, Turkey willbe expected to join the Exchange Rate Mechanism(ERM II) for at least two years and to meet theMaastricht conditions for monetary and fiscal con-vergence before a bid for membership in the Euro-pean Economic and Monetary Union (EMU) isconsidered. Once admitted to the EMU, Turkeywould replace its domestic currency with the euroat an irrevocably fixed exchange rate, confer thebulk of its reserves to the European Central Bank,and be bound by the Stability and Growth Pact.Togan and Ersel argue that for Turkey the problemis not how to stay out of the EMU but, to the con-trary, how to reap the net benefits expected ofmonetary integration by fulfilling the Maastricht
xx Overview

criteria as soon as possible. Finally, the authorsnote that the benefits of integration can only bederived at some cost, and the costs of fulfilling theMaastricht criteria, including the conditions forsustainability of the current account when esti-mated by expected output losses, could turn out tobe quite substantial.
Sectoral Reform Challenges
Achieving and sustaining macroeconomic stabilitywill depend importantly on structural reforms,especially removal and reduction of subsidies andprice controls, and the imposition of hard budgetconstraints on enterprises owned by the publicsector. Agriculture has been a heavily distortedsector of the economy, accounting for a significantshare of the public sector deficit. The bankingsector was at the heart of the 2001 crisis—betterregulation and noninterference in lending deci-sions are needed to reduce the probability ofanother crisis requiring bailouts or recapitaliza-tion of the system. Privatization of state-ownedfirms is the most direct means of imposing hardbudget constraints. These and many other issuesare addressed in the sectoral chapters that explorethe effects of integration into the EU on agricul-ture and on the manufacturing, services, and net-work industries.
Agricultural Markets and Incomes
In chapter 2, Sübidey Togan, Ahmet Bayener, andJohn Nash study the impact of EU accession onTurkey’s agricultural markets and incomes. InTurkey, agriculture accounts for a large shareof total output (14 percent) and employment(33 percent). The corresponding figures for theEU15 are 1.7 percent and 4.3 percent. In absolutenumbers, Turkey employs about the same numberof people in agriculture as the EU15, or more than7 million. Trade in agricultural products betweenthe EU and Turkey is a relatively small part oftheir total trade, because it is not part of the cus-toms union and so is subject to duties, quotas, andprice regulations. Turkey applies high specificduties to the commodities supported by the EU’sCommon Agricultural Policy (CAP): cereals andprocessed cereals, sugar and sugar products, dairyproducts, and meat. Olive oil is also highly pro-
tected. Turkish exports of vegetables and fruitsreceive export subsidies. The EU, by contrast, hasgranted imports from Turkey preferential treat-ment. Import barriers exist mostly in the form oftariff-quota schemes, in which imports within thequota benefit from preferential treatment. Toganand his colleagues estimate that about 70 percentof imports from Turkey enter the EU duty-freeand are not subject to any other import barriers.As a result, most of the adjustment after integra-tion of Turkish agriculture into the CAP will fallon Turkey.
Agricultural support has been important inTurkey, imposing a large burden on taxpayers. In2003 the total support of agriculture, including thehigher prices paid by consumers, was equivalent to4.4 percent of GDP (OECD 2004a). This figure ismuch higher than the comparable one for agricul-ture in the EU—1.3 percent of GDP. These num-bers suggest that Turkey’s accession to the EU islikely to have important social, distributional,and political effects, unless these transfers aremaintained under a common agricultural policy,which is unlikely. Indeed, adoption of CAP-typepolicies—something Turkey is already in theprocess of doing—will reduce the overall level ofsupport, even if Turkey becomes eligible for thecurrent CAP levels of financial support.
Since 1993, the CAP has been gradually shiftingaway from price support to income support, withthe result that prices in the EU are now closer (butstill above) world market–clearing prices and farm-ers are compensated by direct income payments.The structure of the CAP is such that it favors themain agricultural products (and farmers) of theoriginal six EU members: Belgium, Germany,France, Italy, Luxembourg, and the Netherlands.Those products are grains, sugar beets, dairy prod-ucts, and beef. Fruits, vegetables, poultry, andpork—important products of the newer, southernmembers—receive less or no support. In prepar-ing for the accession of the Central and EasternEuropean (CEE) countries, the EU decided thatfarmers from the CEE countries would not beexcluded from direct income support payments,but that such payments would be lower: equivalentto 25, 30, and 35 percent of the system prevailing in2004–06. After 2006, direct payments will beincreased gradually in order to achieve parity withthe original EU15 in 2013.
Overview xxi

Turkish agriculture will confront major reformsin the preaccession period. In Turkey, the mostimportant part of agricultural policy has been pricesupport. State economic enterprises and agriculturalsales cooperatives have been commissioned to buycereals, tobacco, tea, and sugar beet from farmers atprices determined by the government. These prices,which are higher than world market prices, havebeen protected by import tariffs. The second mostimportant component of Turkey’s agricultural pol-icy is the various subsidies, grants, and exemptionslowering the cost of inputs, including capital, fertil-izer, seed, pesticides, and water. The output oftobacco, hazelnut, tea, and sugar beet production hasbeen controlled in various ways. Services to farmers,such as research, training, and extension and inspec-tion services, have been provided free or at low cost.
Turkey is implementing significant reforms tomove it toward more decoupled and targeted formsof support. Under the government’s reform pro-gram, output price supports, import tariffs andinput subsidies and grants are gradually beingreplaced by direct payments to farmers based ontheir holdings of land and animals. Income supporthas been capped. Privatization of state enterprisesin the agricultural sector is also part of the pro-gram. The end goal is that Turkey will have an agri-cultural policy similar to what is now being pur-sued by the EU in its reforms of the CAP: highintervention prices and protection from the worldmarket will have been replaced by direct incomesupport, lower protection, and prices approachingthose on the world market. In chapter 4, JosephFrancois uses a global general equilibrium model toassess the quantitative effects of completion of thecustoms union by extending its coverage to agri-culture. He concludes that despite the importanceof the agricultural sector for Turkey, the overallaggregate welfare gain associated with completionof the customs union is limited, although resourceswill be pulled into agriculture. Commodity-specificimpacts are small, with the largest adjustmenteffects in the more protected sectors, such as grainsand meat, and expansion in the sectors that arehighly subsidized in the EU, such as sugar.
The Turkish reforms have emerged from theprospect of accession, as well as the need to reducepublic expenditure. In the short run they will leadto considerable gains in efficiency. According toTogan and his colleagues, adoption of the CAP will
generate substantial changes in the agriculturalincomes of producers, the welfare levels of con-sumers, and the budget revenues of the govern-ment. The authors estimate that, in the medium tolong term, EU-like policies will lead to a 1.9 per-cent increase in real household incomes in Turkey.Lower-income households (rural households) willexperience an even larger increase in real income.But adoption of the CAP will require substantialadjustments on the part of Turkish farmers. Theeffect on farmers’ incomes will be driven mainly bythe amount of CAP-like compensation paymentsthey obtain. Their income will decrease consider-ably under Agenda 2000 policies without directpayments, but will increase under Agenda 2000policies with direct payments. The budgetary coststo Turkey of adopting EU-like agricultural policieswill depend on whether Turkey receives compen-sation from the EU budget for introducing thesepolicies. Without compensation, the cost willamount to €3 billion under Agenda 2000 policieswith direct payments similar to those applied inthe EU and to €1.2 billion if the payments equalonly 35 percent of what is granted in the EU mem-ber countries.
Manufacturing
In chapter 3, Sübidey Togan, Hüsamettin Nebioglu,and Saadettin Dogan study the effects of EU inte-gration on the Turkish manufacturing sector.After reviewing developments in the trade inmanufactures and in particular the effects of thecustoms union with the EU, they analyze tariffsand nontariff barriers in trade with the EU andthird countries. Because tariffs are now largely anonissue, they focus more on nontariff barriers,especially technical barriers to trade (productstandards). They conclude that challenges lieahead for both Turkish firms and the govern-ment. Both must apply a large number of EUnorms. For example, Turkey has adopted all ofthe 23 new approach directives that require affix-ing the CE conformity marking, but only 18 ofthese directives entered into force up to the presenttime. As a result of these directives, the number ofmandatory EU standards decreased from 1,150 in1999 to less than 500 in 2004 (European Commis-sion 2004c). The Turkish Standards Institute(TSE) is presently concentrating its activities on
xxii Overview

Overview xxiii
the transposition of the European and interna-tional standards and on achieving full membershipin the European Committee for Standardization(CEN) and the European Committee for Elec-trotechnical Standardization (CENELEC).8
Many of the requirements of the acquis in thisarea revolve around accreditation and conformityassessment, in which a large number of governmentbodies establish criteria as part of regulatory over-sight activities and the Turkish AccreditationAgency (TÜRKAK) accredits the inspection serviceproviders. Here a major challenge is for TÜRKAKitself to become accredited and recognized in theEU. Currently, its certifications are not recognized,requiring double accreditation for providers orredundant inspection on entry of goods into theEU. Progress is also needed on the introduction ofmutual recognition clauses in national legislationand the acceptance and adoption of simplified pro-cedures for the import of products bearing theCE (Conformité Européene) marking. In 2003 toys,medical devices, and other products bearing the CEmarking were entitled to enter the Turkish marketfreely with no further check on the technicaldossiers (European Commission 2004c). Suchmeasures will facilitate trade and reduce costs fortraders. Indeed, it has been reported that during theperiod after the decision was made to accept the CElabel, customs authorities sent numerous consign-ments to the TSE for inspection, arguing that theywere not able to assess the risks related to the mini-mum safety requirements. Numerous studies of theimpacts of a customs union have argued that theabolition of such real trade costs is likely to generatesignificant gains for Turkey. Full implementation ofthe EU acquis on technical barriers to trade, withthe accompanying institutional strengthening, willconstitute the major change from the status quo inthe nonagricultural merchandise trade with the EU.
Market Access and Regulatory Issues
In chapter 4, Joseph Francois complements theanalysis of the impacts of extending the customsunion to include agriculture by a discussion of theimplications of EU accession for regulatory reformin Turkey, focusing in particular on the transporta-tion sector. For this sector, the acquis revolvesaround the EU’s common transport policy, whichseeks to develop integrated transport systems based
on advanced technologies that contribute to envi-ronmental and safety objectives; to improve thefunctioning of the single market in order to promoteefficiency and choice; and to improve transport linksbetween the European Union and third countries.The common transport policy places a majoremphasis on the strict application of competitionrules and state aid disciplines. Challenges range fromphysical integration to harmonization of infrastruc-ture, vehicle, environmental, and other standards;development of logistics networks; and improve-ment of border crossings and trade facilitation poli-cies (such as modernization of customs facilities).The EU is concentrating on greater liberalizationof rail transport, landing rights/access to airports(allocation of slots), gradual abolition of the queu-ing system for certain inland waterway markets, andimproved application of the rules on work practicesin the road haulage sector (European Commission2004c). An overall goal is a more level playing fieldthrough the application of competition principles,including the use of state aid and cross-subsidies.9
Railways are a major fiscal burden for theTurkish state. Turkish State Railways (TCDD),manages Turkey’s seven largest ports and its rail-ways, locomotive and carriage manufacturers, andrepair workshops. During the 1980s and 1990s, railoperation cost the Turkish government more than$10.5 billion in constant 2002 U.S. dollars. As notedby the World Bank’s Trade and Transport Facilita-tion Web page on Turkey,10 TCDD needs to berestructured, the railway network scaled down,service improved, and prices increased. The acquisin this sector requires that TCDD separate out andreport on the results of each of its activities (toidentify cross-subsidies), and that it end cross-subsidies from ports to rail and from freight topassenger traffic by shifting to a system of directsubsidies for passenger services (motivated bysocial objectives such as universal service). Themuch more stringent fiscal discipline associatedwith implementing the acquis will have a beneficialeffect on resource allocation and the use of trans-port services. Existing cross-subsidization of therailways by the ports suggests that port authoritiesshould be subjected to greater scrutiny by regula-tors and the competition authorities, because inother countries (the threat of) competition byother (new) terminal operators has been shown tobe an effective source of market discipline.

xxiv Overview
Francois explores both the quantitative andqualitative implications of Turkish accession tothe EU for the transport sector. He adopts aninnovative methodology using data provided by theOrganisation for Economic Co-operation andDevelopment (OECD) to determine how farTurkey is from “best practice” as defined by the EUstandards for this sector—not just in the regulatorydomain but also in terms of “performance.” In part,this involves applying numerical estimates of theeconomy-wide and sector-specific impacts of acces-sion (given the preexistence of the customs unionfor goods) on the transport sector. This process iscomplemented by an assessment of the prevailingregulatory regime, using factor analysis (principalcomponents) to identify commonalities acrosscountries and regulations. Francois concludes thatthere is little support for the claim that accession isexerting significant pressure on Turkey to restruc-ture in view of either general market access condi-tions or regulatory convergence requirements.Notwithstanding this conclusion, as noted above,Turkey confronts numerous policy changes inadopting the acquis in the transport area.
Telecommunications Sector
Chapter 5 by Erkan Akdemir, Erdem Basçı, andGareth Locksley examines the Turkish telecommu-nications services from the perspective of EU acces-sion. Turkey is the last OECD country to liberalizeits fixed-telephone services. Likewise, its privatiza-tion of the public monopoly in fixed lines has beendelayed significantly. Yet Turkey, in the mediumterm, will need to adopt the new set of directivesapproved and published by the European Parliamentand the European Council in 2002. In chapter 5 theauthors consider the framework directive, accessdirective, authorization directive, and universalservice directive.
In June 2001, Turkey and the other EU candidatecountries signed the eEurope+ Action Plan, bywhich Turkey committed itself to achieving certainmeasurable goals in the electronic communicationssector. Akdemir and his colleagues provide adetailed comparison of the current Turkish andEuropean statistics and practices in the telecommu-nications industry. They discuss licensing, price reg-ulation, access regulation, and universal servicedimensions. For each dimension, they also describe
the main Turkish legislation and its implementationand compare them to those in the EU member andcandidate countries. They argue that the main prob-lems facing Turkey are related to the implementa-tion of the new legislation, especially in areas such asaccess to the network.
Their conclusion was confirmed by the Euro-pean Commission’s 2004 assessment, which foundthat only limited progress has been achieved inacquis alignment to date, despite the fact that theremaining monopoly rights of the state-ownedincumbent operator, Türk Telekom, were legallyabolished at the end of 2003, including those relatedto national and international voice telephony andthe establishment and operation of telecommuni-cations infrastructure. Thus the market has beenopen to new entrants since January 2004. However,the authors argue that the (regulatory) measuresneeded to facilitate market entry are not yet fully inplace, including on matters such as numbering,interconnection, conditions of access to the net-work, and facility sharing, implying that there arestill de facto barriers to new entry.
Banking
In chapter 6, Ceyla Pazarbasıoglu describes theimpact of EU accession on the Turkish banking sec-tor. One of the primary causes of the 2001 currencycrisis was the unhealthy structure of the sector,stemming from several factors.11
• First, there were problems with state banks.Governments have used these banks for noncom-mercial objectives such as agricultural support;income redistribution; and industrial, urban, andphysical infrastructure development. As a result,the banks faced unrecovered costs from mandatescarried out on behalf of the government called“duty losses.”The state banks covered their financ-ing needs by borrowing at very high interest ratesand at short maturities from the capital markets.
• Second, the banking sector faced problems cre-ated by high public sector deficits. As privatebanks found the financing of public deficitsincreasingly profitable, government domesticsecurities as a share of total assets of domesticbanks increased considerably, making the banksvulnerable to changes in interest rates. Further-more, during the 1990s banks began to borrow
funds from abroad and use the funds to buygovernment bonds.12 Thus banks also becamevulnerable to exchange rate risk.
• Third, in 1994 as part of an effort to prevent aneconomic collapse following a fear of a bank run,the government introduced full (100 percent)state guarantees for deposits. Before 2001, fear ofa renewed banking crisis prevented the authori-ties from replacing this supposedly temporarymeasure with a more reasonable deposit insur-ance scheme.
• Fourth, Turkey lacked competent supervisoryauthorities, a good regulatory framework, and aneffective legal and institutional infrastructure.
Since 1999, Turkey has taken measures to reformthe regulatory and institutional framework of itsbanking sector and restructure the state and privatebanks. The acquis in this area requires, among otherthings, an independent central bank that, as a pri-mary task, maintains price stability. It also prohibitsdirect central bank (or public sector bank) financ-ing of the government deficit. Accession entailsacceptance of the objectives of the EMU, althoughcompliance with the convergence criteria is notnecessarily a precondition. However, because thosecriteria are indicative of a macroeconomic policygeared to achieving stability, all member statesmust in due course comply with them on a perma-nent basis.
In 1999 the Turkish Parliament passed a newbanking law, which mandated the creation of anindependent Banking Regulation and SupervisionAgency (BRSA). The BRSA took over the bank reg-ulatory and supervisory responsibilities previouslyfulfilled by the Treasury and the Central Bank. Forstate banks, the Treasury provided floating ratenotes to those banks securitizing their “duty losses,”and it strengthened their capital base. A law wasalso introduced prohibiting state banks from run-ning more duty losses—that is, any support pro-vided to the state banks will henceforth have to bebudgeted. The state banks were also required tocomply fully with all banking regulations. Privatebanks that had incurred significant losses in theaftermath of the currency crises were either takenover by the Savings Deposit Insurance Fund (SDIF)or asked to strengthen their net worth and balancesheet structure. The capital base of banks underSDIF management was enhanced by the injection
of government funds, and measures were taken tofacilitate bank mergers and prepare the state banksfor privatization.
In addition, the regulation of existing banks wasgreatly strengthened. Currently, banks are requiredto maintain an 8 percent capital adequacy standardratio, on both a consolidated and unconsolidatedbasis. The maximum open foreign exchange posi-tion was reduced from 30 percent to 20 percent.Steps have also been taken to correct flaws such asweak loan loss provisioning and the lenient largeexposure and related lending limits. Tighter limitswere imposed on both on- and off-balance sheetcommitments to related parties, and especially tocompanies belonging to the same group as a bank.Bank shareholders and managers are now personallyliable for the mismanagement and abuse of bankresources. The BRSA requires that banks introduceinternationally recognized accounting and auditingstandards. All in all, as of 2004 Turkish prudentialrequirements were in general in conformancewith those in the EU for capital adequacy standards,loan classification and provisioning requirements,limits on large exposures, limits on lending torelated parties, and requirements for liquidity andmarket risk management.
The objective of the legislative and regulatoryreform has been to bring the regulatory and super-visory regime for the Turkish financial sector up tothe level of international practice in line with EUstandards. This objective has been achieved to alarge extent. Pazarbasıoglu argues that Turkey hasfulfilled most of the conditions necessary forattaining compliance in the banking sector withthe EU integration process. She stresses that theTurkish banking sector will be exposed to certaincosts during and after accession in the form ofcompetitive pressures from EU banks that have astrong capital base and risk management skills.However, the Turkish banking system has becomemore resilient and sounder since the extensiverestructuring program and implementation ofinternational standards. This restructuring processcame at a large implied fiscal cost estimated tohave reached close to one-third of GDP in theinitial stages.
A major remaining issue that needs to be solved isthe privatization of state banks. In 2003 Turkeydecided to privatize the two largest state banks withinthree years, to withdraw the banking license of
Overview xxv

another state bank, and to resume the privatizationprocess of another large state bank as soon as marketconditions allowed.13 The data on the Turkish bank-ing sector reveal that in 2004 private domesticbanks held about 57.6 percent of the total assets ofthe banking sector, with the five largest banksaccounting for 60 percent of total assets. The shareof state banks was 34.6 percent, while that of banksmanaged by the SDIF was 0.6 percent. Foreignbanks’ share of total banking assets amounted to3.5 percent. Thus foreign banks, in terms of theirshares of total credits and deposits, remain insignif-icant in Turkey.
With Turkish accession to the EU, competition inthe financial sector will increase as Turkey recognizesthe competence of the supervisory authorities of theEU member states and incorporates the principle ofhome country control in its legislation. Accordingto Claessens, Demirgüç-Kunt, and Huizinga (1998),foreign bank assets as a share of total bank assets over1988–95 averaged 77 percent in Greece, 31 percent inSpain, 61 percent in Hungary, and 51 percent in theCzech Republic. Thus, with the liberalization offinancial markets, the penetration rates of foreignbanks in Turkey will increase substantially, causingadjustment costs in the sector. Increased competi-tion will improve the quality and availability offinancial services in the domestic market, enablethe application of modern banking skills and tech-nology, enhance the country’s access to interna-tional capital, lower prices for consumers, and leadto a larger variety of financial instruments. Some ofthe Turkish banks will benefit from larger marketsby concentrating on activities in which they have acomparative advantage. Other Turkish banks maybe forced to merge with foreign banks or leave themarket altogether.
Energy
Chapters 7 and 8 examine Turkey’s energy sector.The objectives of the EU’s energy policy includeimproving competitiveness, securing energy sup-plies, and protecting the environment. The energyacquis consists of rules and policies, notably oncompetition and state aid (including in the coalsector), the internal energy market (for example,opening up of the electricity and gas markets, pro-motion of renewable energy sources, crisis manage-ment, and oil stock security obligations), energy
efficiency, and nuclear energy (European Commis-sion 2004c).
In chapter 7, Izak Atiyas and Mark Dutz describecompetition and regulatory reform in the Turkishelectricity industry. After reviewing the physicalpeculiarities of the electricity industry and dis-cussing how those characteristics have shaped theevolution of its industrial organization, Atiyas andDutz present an overview of regulatory reform inthe EU, the key directives, and the recent proposalsfor amendment advanced by the European Com-mission. They also identify five main challengesassociated with adoption of EU norms in this area:market opening, unbundling, third-party access,public service obligations, and regulation.
Historically, the Turkish electricity sector hasbeen dominated by state-owned enterprises thatprovide distribution, generation, trading, andtransmission services. However, privatization hasbeen widespread for some time. Privately ownedfirms have entered the industry through build-operate-transfer (BOT) or auto-generator schemes.They account for about 21 percent of electricity gen-eration. In addition, firms have been bidding com-petitively on build-operate-own (BOO) contractsfor electricity generation. Transfer of operatingrights contracts (TOORs) have been awarded foreight thermal plants and 14 distribution regions.Privatization of generation assets is envisaged tostart in 2006 and to be completed in 2011. All assetsin the distribution sector will be divested by mid-2006 (European Commission 2004c).
Many of the benefits of privatization come withthe transfer of risk. When private companiesbear risk, privatization can be expected to lead toefficiency gains. Under the current regulations inTurkey, the private owners in the electricity sectorbear construction and operating cost risks. The pri-vate operator signs a long-term power purchaseagreement with the state-owned generation enter-prise in which the latter commits itself to buy theoutput of the plant for a period of, say, 20 years at afixed price in foreign currency. In BOT projects, theprice has ranged on average from between $.08 and$.09 per kilowatt-hour for the first five to 10 yearsof operation. The BOO projects tend to have lowerprices. The BOO contract, guaranteed by the Trea-sury, assures the investor that the project will beprofitable irrespective of the future demand forpower. As a result, the government retains the
xxvi Overview

commercial risks. Significant problems have arisenwith these arrangements. The high-cost electricitypurchase agreements have exposed the stateproviders to significant losses and contingent liabil-ities. The financial position of these firms is poorpartly because of high-cost BOT contracts thatinvolve purchase costs to the Turkish Electricityand Transmission Company (TEAS) in excess of thesubsequent sales prices to the Turkish ElectricityDistribution Company (TEDAS) set by the govern-ment. The associated subsidies and cross-subsidieswill have to be removed as a result of accession.
A new electricity law passed in 2001 provides forthe establishment of an independent Energy Mar-ket Regulatory Authority (EMRA) to take over reg-ulatory functions from the Ministry of NaturalResources. Standard regulatory functions includetariff setting, market monitoring, and settlement ofdisputes concerning access. With this law, the gov-ernment is introducing a market model along EUlines that will transfer most of the task of supplyingand distributing electricity and the associatedmarket risks to the private sector, eliminate theneed for additional state-guaranteed power pur-chase agreements, and minimize costs throughcompetitive pressures on producers and distribu-tors, again along the EU model (see chapter 7). Thegovernment, then, will largely withdraw from theelectricity generation and distribution businesses.Electricity generation companies will sign contractsfor power directly with distribution companieswithout government guarantees. The government’sfuture role will be largely confined to determiningsector policy, owning the transmission system, andensuring that the rules are respected and that pricesare determined competitively. The implication isthat, once the law is fully implemented, the regula-tory and supervisory regime for the electricitysector will have been brought up to the level ofinternational practice in line with EU standards.Although the various BOT and BOO contractssigned in the past imply that the establishment of acompetitive environment may take quite a longtime, once the system begins to operate Turkey canexpect to derive efficiency gains in the sector result-ing in price reductions and improvements in thequality of the service.
In chapter 8, Maria Rita Mazzanti and AlbertoBiancardi analyze the institutional endowment andregulatory reform in Turkey’s natural gas sector.
They focus on Turkey’s natural gas market and themeasures adopted to liberalize the sector and tocomply with EU requirements for accession. As inthe electricity industry, the main challenge con-fronting Turkey is to increase competition in themarket while dealing with the legacy of past deci-sions, in this case the long-term take-or-pay con-tracts signed by Turkey’s Petroleum Pipeline Corpo-ration (BOTAS). This government-owned companydominates the natural gas sector in Turkey, control-ling the pipeline infrastructure for oil and gas trans-mission, liquefied natural gas (LNG) terminals, andgas distribution. BOTAS has monopoly rights ongas imports and exports and on wholesale trading,transmission, and storage activities.
The 2001 natural gas market law (No. 4646) callsfor liberalization of the gas market and the creationof a financially sound, stable, and transparent mar-ket (Article 1), including the removal of the importmonopoly. As noted in World Bank (2004:1),progress in the three years following adoption ofthe law was slow: “Industry structure remainsmonolithic, with no separation of functions otherthan some distribution. Cost transparency, largelydue to the existing industry structure, remains defi-cient. Competition has not developed in the whole-sale sector. International investors remain con-cerned by the delays.” The 2001 law requiresBOTAS to conduct tenders to transfer to othermarket players its existing contractual obligationson natural gas purchases and sales until its importsfall to 20 percent of annual consumption (the so-called gas release program). Little progress has beenmade to date on implementing this requirement,and Mazzanti and Biancardi argue that enforcementof measures to limit the market power of theincumbent will be an important determinant ofgains to Turkey from reform as well as a require-ment for satisfying the acquis in this area. Competi-tion in the natural gas industry is impeded by long-term investments and contracts in the upstreamactivities (gas contracts and infrastructures). Gastends to be purchased on the basis of long-termcontracts with take-or-pay clauses that require thegas purchaser to pay 70–90 percent of the con-tracted capacity whether it receives the natural gasor not; the reason is that extractors must investhuge amounts mining and transporting the gas andthus confront very high up-front fixed (sunk) costsand almost zero marginal costs.
Overview xxvii

Breaking up the upstream and downstream(wholesale) monopoly of BOTAS is a preconditionfor the emergence of competition in the sector.Mazzanti and Biancardi note that the targets set bythe law for BOTAS shares (no more than 20 percentof imports and the wholesale market) are veryambitious, and much more so than the targets setby EU member states. They also argue that the gasrelease provisions of the law—which have also beenused by EU states in introducing competition—could have a beneficial impact, as long as they aredesigned appropriately.14
The Complementary Implicationsand Challenges of Reform
Although much has been achieved in sector-specific regulation and reform, much remains to bedone in some areas, especially energy and trans-port. Other economic reform challenges are associ-ated as well with accession and realizing gains fromthe process. Chapters 9–11 consider three impor-tant “horizontal” areas: the labor market, (foreign)investment policy, and EU regulations pertaining tothe environment. The first two complement thefinancial (banking) sector as critical determinantsof the effects of accession. Labor market regulationswill affect the incentives to invest, the costs to work-ers of layoffs, as well as the overall cost structure ofdoing business in Turkey. FDI is an importantsource of knowledge, employment, and competitivepressure on incumbent firms. Finally, environmen-tal regulation has the potential to enhance socialwelfare by ensuring that firms and consumers con-front the appropriate (social) prices of their eco-nomic activities, but it also raises the danger ofexcessively costly regulation that may not be appro-priate to Turkey’s circumstances and preferences.
In chapter 9, Erol Taymaz and Sule Özler look atthe labor market. They argue that one of the mostimportant issues for Turkey in adopting and imple-menting the EU acquis is related to the labor mar-ket regulations and employment policies that pre-vail in the EU. The acquis in this area includes EUlegislation covering health and safety at work, laborlaw and working conditions (working hours, part-time work, collective redundancies, worker protec-tion in case of bankruptcy and closure of plants,child labor—minimum working age), genderequality (equal pay and opportunities), and social
inclusion of handicapped people in the workforce.In all of these areas, EU social legislation lays downminimum requirements that must be met by mem-ber states.
Adoption of the EU acquis will bring radicalchanges in the functioning of the labor market inTurkey, with vital consequences for firms, workers,and the long-term performance of the economy.The main impact will fall on the informal sector.Taymaz and Özler note that the Turkish labor mar-ket is currently quite flexible, because the formaland informal sectors have very different wage-setting mechanisms. The informal sector is largelyfree from labor regulation and avoids most of thetaxes and related charges. Job insecurity is perva-sive, and workers receive very few benefits fromtheir employers. By contrast, in the formal sectorlabor regulations are observed, and taxes andrelated charges such as social security contributionsand payments to various funds are paid. Becausethe informal sector accounts for some 40 percent ofmanufacturing jobs, applying EU regulations tothis part of the labor market will have major effects.
Taymaz and Özler estimate that when all infor-mal sector firms in the manufacturing sector beginto pay taxes and social security contributions at thesame rates applied in the formal sector, the firmsaffected will lose half of their market shares as theircosts rise. As a result, employment in the manufac-turing sector will decline by 9 percent, or some300,000 jobs. As noted by Togan in chapter 12, theeffect of this policy change on employment will beeven more drastic when one considers its effects onemployment in agricultural and services sectors aswell. The policy implication is that if a massiveincrease in unemployment is to be avoided, com-prehensive labor market reform will be requiredthat includes both substantial decreases in tax rateson wage income, tax-related charges, and paymentsto various funds, and reductions in layoff costs.Such measures will also increase the flexibility ofthe formal market. Such flexibility will benefit theeconomy overall, because it will remove a disincen-tive for firms to grow and become part of the for-mal sector—a step that requires access to the capitalmarkets and banking system, which, in turn,implies becoming subject to taxation. An impor-tant corollary not discussed by any of the contribu-tions in this volume is that other policies in the areaof taxation and support for the private sector are
xxviii Overview

rendered neutral with respect to the size of firms—in Turkey, as in many other countries, tax andrelated policies tend to discriminate de facto if notde jure against small firms (Hoekman and Javorcik2004).
Chapter 10 by Mark Dutz, Melek Us, and KamilYılmaz turns to Turkey’s FDI challenges. Theauthors conclude that Turkey would benefit signifi-cantly from EU accession, largely because the acces-sion process would help Turkey to overcome itsrule-of-law and competition-related constraints toFDI inflows. More rapid and consistent implemen-tation of the rules and regulations that ensure alevel playing field for all companies would beassisted by the EU accession process; this process, inturn, would enable Turkey to take full advantage ofinvestment-related benefits.
During the 1980s, Turkey made frequent use ofinvestment and export incentives and also reliedheavily on state-owned enterprises. The Turkishpublic enterprise sector has been and still is verylarge. The state-owned enterprises have shown, ingeneral, poor economic performance because of thesoft-budget constraints they have faced. They arenot confronted with the threat of bankruptcy andhave benefited from government subsidies in theform of direct transfers, equity injections, and debtconsolidation. In recent years, Turkey has elimi-nated most investment and export incentives, butsimilar progress could not be achieved for the pub-lic enterprises. Although privatization has becomea prominent part of the Turkish reforms, it gainedmomentum only after the 2001 crisis and the asso-ciated reforms, because it was recognized that state-owned firms and the related structure of subsidiesand soft-budget constraints were a part of theproblem underlying the large nonperforming assetsof the banks. Turkey recognizes that it will haveto stop subsidizing the public enterprises at theprevailing rates, align its state aid policies withthose of the EU, apply the same competition poli-cies to all firms whether private or public, and pri-vatize the public enterprises. Greater FDI can playan important role in this transition, as it has in theCEE countries.
In chapter 11, the final major cross-cutting orhorizontal issue chapter, Anil Markandya looks atthe costs, especially in the public sector, Turkey islikely to incur in meeting the environmental acquis.In this area, as in the labor market, the EU acquis
will probably have major repercussions for Turkey.Joining the EU will require implementing the entirebody of EU legislation and standards on environ-mental protection. This step, in turn, implies sub-stantial investments by the public and privatesectors, as well as changes in regulations andsupporting institutions. EU policy in this area isbased on integration of environmental policy withthe sectoral policies of the EU, prevention meas-ures, implementation of the “polluter pays” princi-ple, and measures to address environmental exter-nalities at their source. The acquis comprises some200 legal instruments covering a wide range ofareas, including water and air pollution, manage-ment of waste and chemical products, biotechnol-ogy, radiation protection, and nature conservation.
Markandya breaks down the potential costs ofadopting the acquis based on three scenarios: a“base case” in which no special reforms are madeand the public sector remains much as it is today; a“medium reform” case in which the private sector’sshare is increased modestly and reforms in pricingproceed to reduce the demand for some of the envi-ronmental cleanup services; and a “high reform”case in which the private sector’s role is somewhatgreater and environmental reforms are imple-mented with more rigor.
Consider just one representative area subject toenvironmental regulation in the EU: wastewatercollection and treatment. According to the EUurban wastewater directive (91/271/EEC), all urbanareas with a total wastewater discharge of 2,000population equivalent must be connected to thesewer system, and discharges must receive atleast secondary treatment except for towns withpopulations of less than 10,000 and in cases inwhich such treatment would produce no environ-mental benefit or would involve excessive cost.Because the majority of the Turkish populationlives in municipalities that are not connected tosewer treatment, and because only a very smallnumber of municipalities have wastewater treat-ment facilities, the implementation costs associatedwith meeting this EU regulation will be very largeindeed. How large will depend in part on negotia-tions with the EU to determine its interpretation ofwhat is allowed in view of the flexibility provisionsembodied in the regulation. But rough estimates ofthe investment costs of compliance run up to morethan $10 billion. Adding the additional operating,
Overview xxix

maintenance, and replacement costs would furtherincrease this amount.
Wastewater collection and treatment is just oneof the relevant directives; others include EU regula-tions on drinking water, industrial pollution, dan-gerous chemicals, fuel standards, air quality, andwaste management. Markandya estimates that thetotal investment will run between €28 billion and€49 billion. Although this estimate is very high, healso notes that the costs will be spread over manyyears—he assumes 17 years. Annual investmentswould amount to about €2 billion to €3 billion inthe high reform (i.e., low-cost) case and €3 billionto €5 billion in the medium reform (i.e., high-cost)case. In the initial years, this investment wouldamount to 1–1.5 percent of GDP in the low-costcase and 1.5–2.5 percent in the high-cost case. Tothis one would have to add the extra annual operat-ing costs that will be incurred, which would be inthe range of €5 billion to €8 billion. BecauseTurkey’s capital investment spending on environ-mental areas is about 0.5 percent of GDP, accessionwill imply an increase of anywhere from a factor oftwo to four or more. However, many of these invest-ments would probably be made in any event byTurkey, although perhaps not as fast insofar as theEU directives do not correspond to Turkey’s priori-ties at its current stage of development. Importanthere is the extent to which there is “wiggle room” inthe various directives, as well as flexibility on thepart of the European Commission in assessingwhether achievement of the acquis in all of the vari-ous areas is a necessary condition for accession.
Also important will be the extent to which fund-ing for some of these investments will be providedby EU member states—although it must be recog-nized that the money is fungible and that the Turk-ish government must determine for itself wheregrants and loans should be allocated for the highestsocial rate of return. Indeed, determining this allo-cation and deciding what trade-offs to make willperhaps be one of the greatest challenges con-fronting successive Turkish governments as theaccession process proceeds. In making this determi-nation, the government must compare cost esti-mates with benefit estimates that evaluate the gainsfrom the implementation of the directives. Under-taking such a cost-benefit analysis is critical. Onestrong conclusion that emanates from Markandya’schapter, as well as others in this volume, is that such
an analysis is needed to determine where the casefor investment is strongest and where it would bebetter to delay making investments (and negotiateextensions or agree on different sequencing withthe European Commission).
Toward an Assessment: Net Effectson Turkey
What will be the net impact on Turkey of all the vari-ous policy reforms involved in EU accession? Inchapter 12, Sübidey Togan attempts to go beyond themerchandise trade liberalization analysis undertakenby Francois in chapter 4 and quantify the impacts onthose areas identified by the chapter authors asrequiring the implementation of concrete policychanges. Specifically, Togan considers the welfareeffects of integration with the EU associated withpolicy changes in the agriculture, banking, telecom-munications, transportation, electricity, and naturalgas sectors.He concludes that a conservative estimateof the resulting net increase in the real income ofTurkish households is some 3.6 percent of GDP.15
Integration with the EU will remove numerous dis-tortions in the price system and improve the businessclimate for private sector development, which, inturn, will increase the allocative efficiency of theTurkish economy. Because these achievements willmake Turkey a better place to invest, investment,including foreign direct investment, can be expectedto increase, bringing with it associated employmentopportunities. The allocative efficiency gains fromintegration will be boosted by induced capital forma-tion. But these welfare gains will have a price: theadjustment costs associated with attaining macro-economic stability, adopting EU labor market rulesand regulations, and complying with EU environ-mental directives.
No assessment of costs and benefits shouldignore the opportunity costs associated with theaccession strategy. Indeed, one can and should askwhat the counterfactual is to accession. Any processof regional integration by definition excludes otheroptions—going it alone or relying more intensivelyon multilateral approaches as the focal points andanchors for reform. Clearly, the political decisionhas already been made to pursue the accessionpath, but that decision does not take away theimportance of determining whether alternativestrategies might not be superior in economic terms.
xxx Overview

It is very difficult, however, to address this question.Virtually everything that is being done and will bedone by Turkey could be done unilaterally. Many ofthe benefits from the reforms undertaken to datewere gained autonomously—for example, the stepsto exert greater macroeconomic discipline, themeasures to strengthen the banking system, and theintroduction of greater fiscal discipline for agricul-ture and state-owned firms. How much the tem-plates provided by the EU model have helped is notpossible to determine. Clearly, however, the prospectof accession played a role in the pursuit of some ofthese reforms. The key dimensions of accessionas an anchor and focal point for reforms are asfollows:
• the availability of the EU “model” to follow andimplement
• the prospect of eventual free access to the EU forTurkish workers
• the assistance granted to Turkey by the EU.
Does the EU model (the acquis) make sense forTurkey? When it comes to disciplines associatedwith the single market, we would argue the answeris yes. The agenda here revolves around introducingmarket disciplines, controlling state aids, andencouraging competition in markets for goods andservices. Integrating transport and energy marketsalso makes good economic sense, as do measuresaimed at increasing the contestability of these mar-kets and removing competition-distorting cross-subsidies. This is not to say that the EU model inthese areas is perfect—EU trade policy, for exam-ple, and the CAP most obviously are not very goodexamples of efficiency-maximizing policies. But thepoint is that they are better than the status quo anteprevailing in Turkey, and their adoption thereforeimproves the expected policy stance in these areas.
Other dimensions of the acquis leave room fordoubt. Although much of what is being pursuedthrough the EU directives in the social and envi-ronmental areas is justifiable and will bring bene-fits, the costs of implementing regulation in theseareas can be high. It is not clear that benefits willalways outweigh costs, suggesting that these areareas in which greater care and attention arerequired to sequence implementation appropriately.As emphasized before, however, the accessionprocess will take a long time, allowing for a more
gradual convergence in areas where this is likely tobe appropriate in view of Turkey’s initial conditions.
In part, the cost-benefit ratio will depend on theextent to which additional grants are made availableto Turkey that otherwise would not be forthcom-ing. Accession implies access to the CAP and Struc-tural Funds, and, as a poor country, Turkey will be anet recipient of such transfers. It is not possible atthis point to determine how large this net flow willbe. The structure of the present system of EU rev-enue and expenditure is such that rich memberstates transfer resources to poorer members.Because Turkey is poor relative to the EU25 (eventhough the difference will be smaller than it wasbefore the accession of the 10 new members), acces-sion will clearly have budgetary effects for the EU ifthe current criteria are maintained for transfersamong EU members. Allocations are determined inpart by voting power (in turn, a function of popula-tion and size of the economy) as well as relativepoverty, and so there is a possibility that the rules ofthe game will be changed before Turkey accedes inorder to manage the fiscal and redistributive reper-cussions of its accession. In addition, it is projectedthat by 2020 Turkey’s population will be larger thanthat of any other EU25 member. This projectionmay raise concerns about the decision-making pro-cedures of the EU, as well as worries about possibleimmigration effects.
Effects of Turkey’s Accession on the EU
The effects of Turkey’s accession on the EU willdepend importantly on what accession will entailfor EU transfers to Turkey, EU governance (deci-sion making), and trade and factor flows, espe-cially migration.16 Because the trade in goods,services, and capital has already been either cov-ered by the customs union or addressed unilater-ally by both parties in terms of bilateral flows, theeffects on the EU in these dimensions are likely tobe limited in the sense that they will have alreadyoccurred at the time of any accession decision. Inany event, the aggregate impacts on intra-EU tradewill be small. Production and trade in agriculturalgoods will be affected by accession, but the majoreffects will be in Turkey, not in the EU, becauseimport barriers are relatively low for Turkish agri-cultural exports.
Overview xxxi

Decision Making
In chapter 13, Richard Baldwin and Mika Widgrénevaluate the impact of Turkey’s membership on EUvoting. They analyze the EU’s decision-making effi-ciency (its capacity to act, as measured by the prob-ability of proposals passing a vote) and the distribu-tion of power in the EU’s leading decision-makingbody, the Council of Ministers. They also comparetwo alternative Council voting rules: those acceptedin the Treaty of Nice and implemented by theaccession treaty of the 10 new entrants in 2004 andthe rules laid down in the draft ConstitutionalTreaty (CT). The latter are conditional on the ongo-ing ratification process.
Baldwin and Widgrén conclude that, in terms ofcapacity to act, the enlargement will likely have rel-atively little impact, as long as the CT voting rulescome into effect. In particular, Turkey’s member-ship will have only a negligible effect on the EU’scapacity to act—in large part because moving from27 members (the EU25 plus Bulgaria and Romania)to 29 (Turkey and Croatia) does not change much.The answer, however, is quite different if the CT isrejected and the Nice Treaty rules remain in place.Under the Nice Treaty voting rules, the enlargementwould substantially lower the EU’s ability to act.These findings confirm earlier conclusions by theauthors that an enlarged EU cannot function wellunder the Nice Treaty rules. They also suggest that ifthe CT is rejected, the Nice Treaty voting rules mustbe reformed before further enlargement takes place.
As for the distribution of power, they find thatTurkish accession will have a big impact. Under boththe Nice Treaty and CT rules, Turkey would be thesecond most powerful member of an EU29. Underthe CT rules, Turkey would be substantially morepowerful than countries such as Britain and Italy;under the Nice Treaty rules the power differencesamong the countries with a population of morethan 50 million would be small. This situation sug-gests that the acceptability of the ConstitutionalTreaty and the probability of Turkey’s membershipmay well be negatively affected.
Migration and the EU Budget
Turkey is likely to have a population larger thanGermany’s 82 million by 2020, if not earlier. Turkeyis poor by European standards—PPP (purchasingpower parity)-adjusted per capita income is roughly
$7,000—and income disparities within the countryare great. The population in the southeast has lessthan half the average national income, and the largerural population is generally much poorer than theurban population. As discussed by Harry Flam inchapter 14, these facts have implications for boththe EU budget and for emigration from Turkey.
If the existing rules for contributions to andreceipts from the EU budget remain unchanged—including the Common Agricultural Policy—Flamestimates that Turkey would receive a net transferof €12 billion from the EU, corresponding to about14 percent of the present EU budget. The overallnet contribution to the 10 new entrants in 2004 andTurkey is projected to correspond to about 60 per-cent of the present budget. Flam concludes fromthis that it is unlikely that current rules will remainunchanged in the face of such large increases in nettransfers from richer to poorer countries.
As noted earlier, the major trade impacts ofTurkish accession on the EU are likely to be in themovement of labor. The decision to emigratedepends on a variety of factors, but real wage differ-entials are clearly important, as are social networks,culture, language, and geographic distance.17 It willtake decades for Turkey to attain an income levelcomparable with that of the EU15, implying thatincome differentials will be a strong incentive formigration from Turkey to the EU. The prospect oflarge-scale immigration from Turkey (as well asfrom new members and other candidate countries)is a source of considerable concern among theEU15. This was a major factor in the French deci-sion to subject approval of Turkish accession to areferendum. Fears that immigrants will depresswages, boost unemployment, and cause social fric-tion and political upheavals prevail in many EUmember states. Clearly, free migration will not beallowed immediately upon full membership. Forthe 2004 new EU members, the length of the transi-tion period was seven years, as it was for Greece,Portugal, and Spain. For Turkey, the period may belonger, and it may be subject to longer-term con-trols. However, because accession is unlikely tooccur before 2012, this is an issue that would onlycome into play in 2020. By that time, Turkey shouldhave converged more toward the average incomelevels of the EU25, reducing migratory pressures.
As noted by Flam, the strength of the incentive tomove and the total number of people who might
xxxii Overview

move are also a function of how rapidly wages rise inTurkey. As workers leave and the supply of workersdeclines in Turkey, wages will go up. Conversely,immigration will have a depressing effect on wagesin the EU—albeit much smaller because the EUlabor market is much bigger. The net impact on theTurkish economy will be determined by the extentto which capital owners are affected in Turkey, theimpact of the loss of (qualified) workers on TurkishGDP, the extent to which earnings in the EU areremitted, and the magnitude and impact of reversemovements as people of Turkish origin relocateupon retirement and repatriate capital. Much alsowill depend on the skill levels of the people whomove. Unskilled migrants are more likely to be com-plementary to more skilled nationals in the hosteconomy because they will allow the latter to increasetheir productivity and thus their real wages.
Whatever the specific impacts, overall welfare willincrease as a result of migration, but there will be aredistribution of income. Turkish GDP will decline,and the EU’s GDP will rise.EU firms (capital owners)and more highly skilled workers are likely to benefitfrom the increased supply of less-skilled workers.Turkish migrants will gain from the move, and less-skilled EU workers will lose. The overall welfareincrease will stem from a more efficient allocation oflabor; Turkish laborers become more efficient whenthey move to European countries, and the optimalallocation is achieved when the marginal productiv-ity of labor is equalized across EU members.
Flam concludes that the Turkish immigrant pop-ulation in Germany may rise by some 60 percent by2030. About 3 million people of Turkish origin arepresently in the EU, the overwhelming majority inGermany, which implies a total movement of some1.8 million Turks.18 Although this is a highly specu-lative exercise—as stressed by Flam, much dependson the parameters assumed in the model—thesenumbers are manageable in view of the currentoverall EU25 population of 450 million. However,Flam’s projections assume no restrictions are placedon migration—a strong assumption.
What such immigration will imply for wages andemployment in the receiving countries is even morespeculative. While those who have investigated theimpacts of immigration suggest that it is likely to belimited, it should be noted that in contrast to thedebates between the proponents and opponents oftrade integration (where there is significant disagree-
ment about the impact of greater trade on labor mar-ket outcomes), there is agreement that immigrationwill have much greater impacts than expanded tradebetween poor and rich countries. One reason is thatmigrants will seek employment in all sectors, not justtradables.19
Implications for Other DevelopingCountries
The requirements for accession to the EU provide aready-made template, if a constantly evolving andexpanding one, for countries seeking to implementfar-reaching structural reform programs. What isthe relevance of the Turkish experience? What les-sons can be drawn for other countries with a start-ing point similar to that of Turkey that will not beable to accede because they are not part of Europe?
A first lesson is that the prospect of accession isnot a panacea. What matters are the autonomousdecisions on economic policy made by govern-ments. Although Turkey’s accession to the EU wasalready under discussion in the 1960s, very littleprogress was made in converging toward EU normsuntil the early 1990s. A related lesson is that much ofwhat is associated with accession can be pursued bycountries that will not be able, or may not desire, toaccede. The EU acquis is a public good in the sensethat any country can avail itself of that body of leg-islation and regulation. What matters is implemen-tation, which, in turn, requires commitment and therelevant institutions to apply the standards. The reg-ular monitoring and interaction between the Euro-pean Commission and the partner government,facilitated by the provision of technical and finan-cial assistance, can help to maintain progress. How-ever, accession does not have to be part of the equa-tion for countries to obtain such assistance—a verysimilar structure is available in the form of theassociation and economic partnership agreementsthat many countries have signed with the EU.
Such agreements can have major potentialdownsides if they involve asymmetric liberaliza-tion of trade in favor of the EU, while keeping bar-riers to imports from the rest of the world at highlevels. For this reason, the standard policy advice togovernments implementing such discriminatorytrade agreements is to pursue a parallel strategy oflowering most-favored-nation protection rates aswell (Schiff and Winters 2003). Turkey, because it
Overview xxxiii

formed a customs union with the EU, has adoptedthe common external tariff, which tends to imply alow average level of protection, at least for manu-factures.20 Assuming the problem of trade diver-sion is addressed through the adoption of low, andideally uniform, levels of external protection, theEU model of regulatory principles has much tooffer countries that are similar to Turkey—that is,emerging markets that have extensive state involve-ment in the economy, limited competition in serv-ice markets, and weak banking systems. A processof “conversion à la carte” is, by definition, not feasi-ble when it comes to accession, but it is possible inthe context of partnership agreements. Indeed, thisoption was made explicit by the EU in its 2004European Neighborhood Policy, which offers part-ner countries that do not have the prospect ofaccession the opportunity to adopt parts of theacquis and through this harmonization share thebenefits associated with the relevant elements ofthe EU’s Internal Market. The challenge for part-ner countries is to determine where such approxi-mation-cum-harmonization will be beneficial andwhere not. The Turkish case and its experienceoffer valuable guidance on what part of the “EUpackage” would be beneficial to adopt and emulate(with assistance from the EU in the context of suchagreements) and which parts are best left on theshelf for the future.
The Turkish experience—as well as those of theCEE countries that acceded to the EU—revealsclearly that trade policy is important, in that the lib-eralization of trade with the EU led to significantimprovements in productivity and trade perform-ance, but that in itself is not sufficient. In an envi-ronment characterized by limited, if any, competi-tion in the key network services industries—energy,telecom, transport—a weak financial sector, andlimited fiscal discipline (and thus extensive cross-subsidization and transfers), trade liberalizationneeds to be complemented by measures to hardenbudget constraints and to enact pro-competitiveregulation. The limited stock of inward FDI—aphenomenon that also characterizes neighboringcountries in the Middle East and is in strikingcontrast to the situation in CEE countries—isindicative: foreign investors either perceive theattractiveness of locating in Turkey to be limited orperceive the barriers to FDI to be prohibitive. Inpractice, the answer is likely to be a mix of these two
factors. A long history of macroeconomic instabilityand high-cost services will lower the interest of aninvestor, especially in light of the fact that the Cen-tral and Eastern European countries offer an alter-native location. Administrative barriers to FDI(including red tape) have also been high in the past.Finally, slow progress on privatization helps toexplain low FDI.
A similar situation prevails in neighboringcountries, although with one major difference:most Arab countries have experienced macroeco-nomic stability. Administrative barriers to FDI,monopoly provision of services, state-owned enter-prises, and slow privatization all reflect politicaldecisions. It is an open question to what extenttrade agreements that do not involve the prospectof accession could assist countries that want to pur-sue an investment and services liberalizationagenda, although the Turkish experience suggeststhat even in a context of possible accession,progress on this overall agenda can be slow. How-ever, the deepening of accession efforts in the futurewill, by necessity, imply that much of the “behindthe border” reform agenda must be implementedfor accession to become feasible. This may or maynot be true for association agreements that includeservices and investment policies. Much tends to bemade of the fact that bilateral and regional tradeagreements are increasingly covering these areas,but there is little experience with actual implemen-tation. In principle, again, reforms in this area canand should be implemented unilaterally. Tradeagreements may help by allowing gradual commit-ments to be made in a more credible manner, butmuch depends on the substance of the reforms. Akey requirement (precondition) for the networkservices industries and the financial sector is appro-priate regulation to ensure efficiency, to guardagainst systemic risks, and to achieve social orequity objectives (e.g., universal service obliga-tions). These are complex areas. Much can belearned from the experience of other countries—such as in the natural gas sector (see chapter 8by Mazzanti and Biancardi)—but what mattersfirst and foremost is clear objectives. Also impor-tant is the establishment of an effective, generalcompetition authority and mechanisms to assessthe impacts and effects of reforms.21 Indeed, animportant policy decision is to what extent a coun-try should rely on general competition law to
xxxiv Overview

discipline the behavior of enterprises, includingdominant firms in the network services industries,as opposed to sector-specific regulatory bodies.
Conclusion
To join the EU, Turkey will have to attain macro-economic stability, adopt the EU’s Common Agri-cultural Policy, and liberalize its services andnetwork services industries. Integration will bebeneficial for Turkey, because it will remove manydistortions in the price system, boosting the alloca-tive efficiency in the economy and, in turn, makingthe country a more attractive place to invest. Withaccession, Turkey will also be eligible for EU Struc-tural Funds, with the resulting increase in infra-structural investments further contributing toprospects for economic growth. In addition, Turkeywill reap benefits from monetary integration, aswell as from migration of Turkish labor to the EU.However, the welfare gains derived by Turkey fromintegration will have a price: the adjustment costsassociated with attaining macroeconomic stability,adopting the CAP, liberalizing services and the net-work industries, and complying with EU environ-mental directives.
According to the European Commission (2004a),71 percent of the Turkish population supports EUmembership. This high percentage of support canbe explained in part by the economic benefits thatTurkey expects to derive from membership. Equallyimportant is the recognition in Turkey that the sys-tem of governance of a rule-based society, as in theEU with its many institutions, may provide betterprospects for meeting the demands of variousgroups in society.22 Support for EU membershipalso stems from the process of Westernization andfrom geostrategic considerations.23
Turkish accession will also affect the welfare ofcurrent members of the EU. Welfare will increasebecause of the further specialization, reflected intrade, capital, and labor flows, as well as the likelygrowth effects of integration. The empiricalresearch on the economic effects of immigrationindicates fairly small and on the whole positiveeffects.24 There will also be political gains for theEU. Turkey is a large and fast-expanding market. Itis, in fact, the largest market in its neighborhoodand has a GDP that amounts to 55 percent of thatof Russia. Located at the crossroads of Europe,
Eurasia, and the Middle East, Turkey has the poten-tial to act as a major link between these markets.With harmonization of commercial legislation, EUcompanies will be able to use Turkey as a jointinvestment and export base for the Middle East andEurasia. Istanbul is already emerging as a base fortransnational corporations operating in the Cauca-sus and Central Asia. Finally, Turkish membershipcould help to secure stability and security in theBalkans and Caucasus, thereby increasing EUenergy security.
Although the potential net gains for Turkey andthe EU members are significant, Turkey faces majorchallenges in implementing the acquis. Major chal-lenges also must be overcome in realizing the poten-tial gains associated with increased labor flows fromTurkey—even if they will probably be relativelysmall compared with the size of the EU labor force.The same is true of decision making and manage-ment of the net annual budgetary cost of Turkishmembership to the EU. The Baldwin-Widgrénanalysis in chapter 13 points to the importance ofpassage of the EU Constitutional Treaty and theacceptance by existing members of a significant rolefor Turkey in decision making. Estimates reportedby Flam in chapter 14 and in Togan (2004) suggestthat budgetary costs will be quite high unless therules on the CAP and Structural Funds arechanged—constituting yet another challenge thatwill have to be negotiated successfully beforeaccession.
Notes
1. Decision No. 1/95 of the EC-Turkey Association Councilof December 22, 1995, on implementing the final phase of thecustoms union (96/142/EC).
2. “By [their] very nature, [accession negotiations are] anopen-ended process whose outcome cannot be guaranteedbeforehand” (European Commission 2004b: 10).
3. The Copenhagen criteria for membership were establishedin preparation for the eastern enlargement and cover politicaland human rights as well as economic criteria. Membership cri-teria include “stability of institutions guaranteeing democracy,the rule of law, human rights and respect for and protection ofminorities.” As noted by many observers, such as Flam (2003),Turkey confronts serious problems in meeting the political andhuman rights criteria: they imply placing the military underpolitical control and ridding it of its power in the judicialsystem, and they have direct implications for recognizing indi-vidual and collective cultural rights for minorities (i.e., theKurds). In its recommendation to launch accession negotiations,the Commission argued that in “order to guarantee the sustain-ability and irreversibility of the political reform process, the EUshould continue to monitor progress of the political reforms
Overview xxxv

closely, on the basis of an Accession Partnership setting out pri-orities for the reform process. The Commission will, followingthe analysis in the Regular Report, propose to revise the Acces-sion Partnership in spring 2005. On this basis, a general reviewof the way in which political reforms are consolidated andbroadened will take place on a yearly basis starting from the endof 2005. The pace of the reforms will determine the progress innegotiations. In line with the Treaty on European Union and theConstitution for Europe the Commission will recommend thesuspension of negotiations in the case of a serious and persistentbreach of the principles of liberty, democracy, respect for humanrights and fundamental freedoms and the rule of law on whichthe Union is founded. The Council should be able to decide onsuch recommendation by a qualified majority.” See EuropeanCommission (2004c, 6).
4. The European Commission reports on Turkey provide anextensive list of actions taken by the government (EuropeanCommission 2004b, 2004c).
5. In this volume, EU15 refers to the 15 members of the EUprior to the 2004 enlargement in which 10 more countriesbecame members, creating the EU25. The 15 original membercountries were Austria, Belgium, Denmark, Finland, France,Germany, Greece, Ireland, Italy, Luxembourg, the Netherlands,Portugal, Spain, Sweden, and the United Kingdom. Those addedduring the enlargement were Cyprus, Czech Republic, Estonia,Hungary, Latvia, Lithuania, Malta, Poland, Slovak Republic, andSlovenia.
6. All dollar amounts are U.S. dollars unless otherwiseindicated.
7. The short maturity of debt stock and the large share offoreign currency–linked securities imply particularly high ratesof rollover on domestic and international markets, increasingthe vulnerability to interest rate and currency rate shocks.
8. The major standards-setting bodies in the EU are CEN,CENELEC, and the European Telecommunication StandardsInstitute (ETSI).
9. The competition authorities have an important role toplay. The Turkish Competition Authority has taken action in thetransport sector, such as investigating a price-fixing cartel inBlack Sea maritime shipping (see OECD 2004b).
10. See http://inweb18.worldbank.org/ECA/Transport.NSF/Countries/Turkey? Opendocument.
11. The ratio of nonperforming loans to gross loans of thebanking system in Turkey reached about 22 percent in 2001.The situation improved during 2002 due to acceleration ofout-of-court settlements and voluntary debt restructuringarrangements.
12. The average excess return on Turkish government bondsover the London Interbank Offered Rate, or LIBOR (both meas-ured in U.S. dollars), amounted to only 4 percent over the period1990–93, but was 22.9 percent over the period 1995–November2000. In chapter 6, Pazarbasıoglu argues that the fiscal cost of the2001 financial crisis has initially amounted to €50 billion (some34 percent of GDP). If Turkey had adopted the legislative, regu-latory, and institutional framework of the EU banking system atthe beginning of the 1990s and had enforced these rules, thenthe cost of the crisis would have been much smaller.
13. The state banks to be privatized within three years areZiraat Bank and Halk Bank. The government has withdrawn thebanking license of Emlakbank, and it will resume the privatiza-tion process of Vakifbank as soon as market conditions allow.
14. See World Bank (2004) for an in-depth discussion of thechallenges in and policy options for introducing greater compe-tition into the Turkish natural gas market, including an analysisof the sector’s strengths and weaknesses.
15. This is equivalent to about a 2.8 percent increase in realGDP.
16. The 2004 European Commission recommendationstates: “The negotiations will be complex and reflect . . . the needfor provisions facilitating the harmonious integration of Turkeyinto the EU. The application in Turkey of the common agricul-tural policy and the cohesion policy are two examples. The rulesregarding the free movement of persons are a third. It is likelythat there will be, as in previous enlargement rounds, a need forsubstantial and specific arrangements and in some areas longtransition periods. In the case of free movement of persons per-manent safeguards can be considered. . . . The EU will need toprepare itself because . . . the Union’s capacity to absorb newmembers, while maintaining the momentum of Europeanintegration, is also an important consideration in the generalinterest of both the Union and the candidate countries. . . . Inany event, the EU will need to define its financial perspective forthe period from 2014 before the financial implications of certainnegotiating chapters can be tackled” (European Commission2004b: 7–8).
17. For a survey, see Ghatak, Levine, and Wheatley Price(1996).
18. Flam obtains a number of 1.3 million for Germany, basedon an initial Turkish-origin population there of 2.2 million. Thenumber in the text takes into account the additional 800,000Turks in the rest of the EU as of 2002.
19. Borjas, Freeman, and Katz (1992, 1997) found thatunskilled immigrants, particularly from Mexico, increased theratio of unskilled to skilled workers in the United States by some20 percent, whereas trade flows were found to have increased the(implicit) ratio by only 4 percent. Freeman (2004) notes thatindustries that export still hire a sizable number of unskilledworkers, while import-competing industries have large numbersof skilled workers. He also observes that the evidence that immi-gration has a larger impact on the ratio of skilled to unskilledworkers does not necessarily mean that large wage impacts areassociated with immigration. Even large-scale inflows of work-ers into specific locations are not found to have big effects onwages (Borjas, Freeman, and Katz, 1996).
20. In principle, any country can choose to adopt the com-mon external tariff of the EU, so that even if a customs union isnot on the table any country with a free trade agreement withthe EU could emulate the Turkish solution in this dimension.But better than adopting the idiosyncrasies of the EU politicaleconomy of protection would be to move toward a system of lowand uniform tariffs.
21. The Turkish experience, like that elsewhere in the world,illustrates the need for a competition authority. The Black Seamaritime case of restrictive business practices (see note 10) is acase in point.
22. This may explain the support provided to EU member-ship by followers of the Islamist political parties as well as byrepresentatives of different minority groups.
23. During the Tanzimat period (1839–77), Westernizingreforms were responsible for the adoption of a series of Westernlaw codes, creation of a judicial organization with secular lawcourts, introduction of French-style provincial administration(1864), and use of the so-called millet system, which made itpossible for the Christian minorities to have their own religiousautonomous administration with representative councils. Theseliberal reforms culminated in the declaration of a constitutionand the convocation of a parliament in 1876–77. The process ofreforms continued after the national War of Independenceof 1919–23. Under Mustafa Kemal Atatürk’s leadership, thenewly founded Republic of Turkey carried out an extensive and
xxxvi Overview

comprehensive program of modernization and secularization.Atatürk believed that total Westernization of the country was anabsolute precondition for Turkey’s becoming a member of theWestern family of nations. He succeeded in forging a modernnation out of a failing empire and a traditional community,based on the model of the Western countries. Turkey’saspiration to membership in the EU stems from the process ofmodernization and Westernization, the roots of which may betraced to Atatürk’s reforms designed to establish a secular orderin a country with a predominantly Muslim population. TheTurkish elite consider membership in the EU a natural, desir-able, and inevitable step in this process. Furthermore, Turkeyrealizes that it sits strategically at the edge of three regions ofconflict—the Balkans, the Middle East, and the Caucasus.Because of the complexity of its security, Turkey seeks to culti-vate stability in order to minimize the potential for conflict. ForTurkey, EU membership can help to secure this stability andcontain conflict, particularly in the Balkans. Furthermore, theEU and Turkey have a mutual interest in preventing and con-taining any instability that could arise in the Commonwealth ofIndependent States (CIS) region.
24. In addition to chapter 14 by Flam, see the studies byZimmerman (1995), Haisken-De New and Zimmerman (1996),Winter-Ebmer and Zimmerman (1998), and Storesletten (2000).
References
Boeri,T., and H.Brucker.2000. The Impact of Eastern Enlargementon Employment and Labour Markets in the EU Member States:Final Report. Berlin: European Integration Consortium.
Borjas, G. 1995. “The Economic Benefits from Immigration.”Journal of Economic Perspectives 9: 3–22.
Borjas, George, Richard B. Freeman, and Lawrence F. Katz. 1992.“On the Labor Market Effects of Immigration and Trade.” InImmigration and the Work Force: Economic Consequencesfor the United States and Source Areas, ed. G. Borjas andR. Freeman. Chicago: University of Chicago Press forNational Bureau of Economic Research.
————. 1996. “Searching for the Effect of Immigration on theLabor Market.” American Economic Review 86: 246–51.
————. 1997. “How Much Do Immigration and Trade AffectLabor Market Outcomes?” Brookings Papers on EconomicActivity, 1–90.
Claessens, S., A. Demirgüç-Kunt, and H. Huizinga. 1998. “HowDoes Foreign Entry Affect the Domestic Banking Market?”Working Paper, World Bank, Washington, DC.
European Commission. 2004a. “Euro Barometer 2004,” PublicOpinion in the Candidate Countries, Brussels.
————. 2004b. “Recommendation of the European Commis-sion on Turkey’s Progress towards Accession.” COM(2004)656 final, Brussels.
————. 2004c. “Regular Report on Turkey’s Progress towardsAccession—2004.” COM(2004) 656 final, Brussels.
Flam, Harry. 2003. “Turkey and the EU: Politics andEconomics of Accession.” CESifo Working Paper 893, March.http://www.cesifo.de.
Freeman, Richard. 2004. “Trade Wars: The Exaggerated Impactof Trade in Economic Debate.” World Economy.
Ghatak, S., P. Levine, and S. Wheatley Price. 1996. “MigrationTheories and Evidence: An Assessment.” Journal of EconomicSurveys 159–98.
Haisken-De New, J., and K. F. Zimmerman. 1996. “Wage andMobility Effects of Trade and Migration.” CEPR DiscussionPaper No. 1318, Centre for Economic Policy Research,London.
Harrison, G. W., T. F. Rutherford, and D. G. Tarr. 1997. “Eco-nomic Implications for Turkey of a Customs Union with theEuropean Union.” European Economic Review 41: 861–70.
Hoekman, B., and Beata Smarzynska Javorcik. 2004. “PoliciesFacilitating Firm Adjustment to Globalization.” OxfordReview of Economic Policy 20 (3): 457–73.
OECD (Organisation for Economic Co-operation and Develop-ment). 2001. Market Effects of Crop Support Policies. Paris:OECD.
————. 2004a. OECD Agricultural Policies 2004. Paris: OECD.————. 2004b. “Anticompetitive Practices in the Maritime
Transport Industry in Turkey.” COM/DAFFE/TD(2004)63,September.
Schiff, Maurice, and L. Alan Winters. 2003. Regional Integrationand Development. Washington, DC: World Bank and OxfordUniversity Press.
Storesletten, K. 2000. “Sustaining Fiscal Policy through Immi-gration.” Journal of Political Economy 108: 300–23.
Togan, S. 2004. “Turkey: Toward EU Accession.” World Economy27: 1013–45.
Winter-Ebmer, R., and K. F. Zimmerman. 1998. “East-WestTrade and Migration: The Austro-German Case.” IZA Dis-cussion Paper No. 2. http://www.iza.org.
World Bank. 2004. “Turkey: Gas Sector Strategy Note,” ReportNo. 30030-TR. Washington, DC, September.
Zimmerman, K. F. 1995. “Tackling the European MigrationProblem.” Journal of Economic Perspectives 9: 45–62.
Overview xxxvii


1
Part I
MacroeconomicPolicies for EU
Accession

Despite some notable achievements, a worseningcurrent account and a fragile banking system led inlate 2000 to a liquidity crisis that turned into a full-blown banking crisis in February 2001. In response,the government decided to abandon the crawlingpeg regime and floated the currency. In May 2001,the International Monetary Fund (IMF) increasedits assistance to Turkey under a new standbyarrangement. But just as the revised program wasbeginning to show results, the terrorist events ofSeptember 11, 2001, in the United States triggeredthe reemergence of serious financing problems. InFebruary 2002, the IMF approved a new three-yearstandby credit for Turkey to support the govern-ment’s economic program. With the implementa-tion of the stabilization program, Turkey envisagesa gradual but steady improvement in its economicconditions. In August 2004 Turkey approached theIMF for a final three-year standby agreement—anexit program from instability and excessive debt.
Monetary Developments and Inflation
During the past two decades, Turkey has experiencedhigh and variable inflation. There is strong evidencethat, in the medium and long term, a close correla-tion exists between the rate of growth of monetaryaggregates and inflation. This correlation appears infigure 1.1 between the monthly series of annual con-sumer price index (CPI) inflation and the monthlyseries of the annual growth rate of base moneyover the period January 1987–September 2004.
This chapter investigates the macroeconomic poli-cies appropriate for Turkey both before and after itsaccession to the European Union (EU).1 The firstsection of the chapter considers the recent macro-economic developments in Turkey, and the secondexamines the macroeconomic policy framework forEU membership. The third section analyzes themacroeconomic challenges faced by Turkey, empha-sizing the issues related to inflation, fiscal policy,public debt, sustainability of current account, andexchange rate regimes. The final section offersconclusions.
Macroeconomic Developments in Turkey
Over the past decade, economic crises began toaffect the Turkish economy with increasing fre-quency. Periods of economic expansion alternatedwith periods of equally rapid decline. Althoughinflation during the period 1990–2000 fluctuatedbetween 54.9 percent and 106.3 percent, the averageinflation rate amounted to 75.2 percent. Currently,Turkey is in the midst of a determined campaign toturn around decades of weak performance stem-ming from pervasive structural rigidities and weakpublic finances. The past few years have witnessedthree major attempts at addressing underlyingweaknesses. The first was during 2000 under thethree-year standby agreement initiated in Decem-ber 1999 after a significant drop in output caused bymostly external factors, including the earthquake.
3
1Macroeconomic
Policies for Turkey’sAccession to the EU
Sübidey Togan and Hasan Ersel

A close relation also exists between the annual infla-tion rate and the annual rate of change in theexchange rate on a monthly basis over the sameperiod (see figure 1.2).2
Recent empirical studies of Turkish inflationhave drawn attention to a set of factors that affectinflation in Turkey.3 Besides the obvious relationbetween the aggregate demand and supply, publicsector deficits and exchange rate developmentsseem to be the major factors affecting the rate ofinflation.
In equation 1.1, the relation between totaldemand and supply is proxied by the output gap.Almost all researchers agree that, besides the outputgap, public sector deficits play a significant role inexplaining inflation in Turkey. We model the effectof public sector deficits on inflation through twovariables. The first variable is the noninterestexpenditures. In contrast to interest expenditures,this portion of the public expenditures is deter-mined by the government and is the major factorbehind the changes in public sector deficits. The
4 Turkey: Economic Reform and Accession to the European Union
0
20
40
60
80
100
120
140
Jan.
198
7
Jan.
198
8
Jan.
198
9
Jan.
199
0
Jan.
199
1
Jan.
199
2
Jan.
199
3
Jan.
199
4
Jan.
199
5
Jan.
199
6
Jan.
199
7
Jan.
199
8
Jan.
199
9
Jan.
200
0
Jan.
200
1
Jan.
200
2
Jan.
200
3
Jan.
200
4
Growth rate
Price level
Reserve money
FIGURE 1.1 Inflation and the Growth Rate of Reserve Money: January 1987–September 2004
Source: Central Bank of Turkey.
�50
0
50
100
150
200
250
300
Jan.
198
7
Jan.
198
8
Jan.
198
9
Jan.
199
0
Jan.
199
1
Jan.
199
2
Jan.
199
3
Jan.
199
4
Jan.
199
5
Jan.
199
6
Jan.
199
7
Jan.
199
8
Jan.
199
9
Jan.
200
0
Jan.
200
1
Jan.
200
2
Jan.
200
3
Jan.
200
4
Growth rate
Price level
Exchange rate
FIGURE 1.2 Inflation and the Rate of Depreciation of the Turkish Lira: January 1987–September 2004
Source: Central Bank of Turkey.

second variable is the public sector component ofthe wholesale price index. The movement of thisvariable is almost totally determined by administra-tive decisions. Adjustments in these prices, regard-less of their relation with public sector deficits, havean impact on inflation. Because most of the goodsand services produced by the public sector are usedas inputs, changes in these prices have an impact onprivate sector costs. Yet as these changes are publiclyannounced, they have a signaling effect. In thissense, the role of public sector prices is very similarto that of the exchange rate. The third variableinfluencing inflation in the equation is the exchangerate, which affects the prices of imported commodi-ties. Fourth, in this equation the effect of monetaryexpansion on inflation is captured by movements inthe base money. Thus one can now estimate Turkishinflation by using monthly data to solve
(1.1) d log(CPI) =β0 + β1d log( ppublic) + β2(d log(E )+ d log(E (−1))) + β3 OG(−1)+ β4NIEXP + β5(d log(M(−1))+ d log(M(−2))) + β6d log(CPI(−12))+ β6 Dummy
where CPI denotes the consumer price index, ppublic
the public sector component of the wholesale priceindex, E the Turkish lira/U.S. dollar exchange rate,OG the output gap measured by the difference of
the monthly industrial production index from itstrend, NIEXP the moving average of the consoli-dated budget noninterest expenditures over the past12 months, M the base money supply, and Dummythe dummy variable taking the value of 1 duringthe summer months of June, July, and August ofeach year and 0 otherwise. When we checked all thevariables used in the estimation for unit roots, welearned that the series as used in the equation are allstationary. The results of the estimation are pre-sented in table 1.1.
To deal with the problem of identifying thelong-run determinants of inflation, we carried outthe Johansen cointegration test with the variablesthat were significant in the short-term inflationequation and that were found to be I(1)—that is,CPI, NIEXP, M, ppublic, and E.4 The significant coin-tegration equation found among four of these vari-ables can be expressed as
(1.2) CPI = −2.234 + 0.000357 M+ 0.279695 ppublic + 0.000315 E
As one would expect from economic theory, basemoney and exchange rate play an important role inexplaining inflation in the long run. By contrast, thepresence of the public sector component of thewholesale price index reflects an invariant charac-teristic of policymaking in Turkey. The rather popu-lar political instrument used to achieve short-term
Macroeconomic Policies for Turkey’s Accession to the EU 5
TABLE 1.1 Estimated Inflation (Monthly)
Coefficient t-Statistic
Constant 0.01 1.872Public price (d log(ppublic)) 0.31 14.35Exchange rate (d log(E) + d log(E(−1)) 0.04 2.753Output gap (OG) 0.033 2.567Noninterest expenditures (NIEXP) 0.012 1.822Base money (d log (M(−1)) + d log(M(−2)) 0.025 1.963CPI inflation (d log(CPI(−12))) 0.192 4.282Dummy −0.016 −6.072AR(1) 0.463 6.364
R-squared: 0.802Adjusted R-squared: 0.792Durbin Watson statistic: 1.884
Note: The dependent variable was d log(CPI), and the estimation period was January1990–November 2003. The diagnostic tests for this regression indicate that there is noevidence of deviation from normality, autocorrelation, and heteroscedasticity.Source: The authors.

objectives seems to have had a strong inflationaryimpact in the long run.
Real Exchange Rate and Current Account
Until the end of the 1970s, Turkey followed a fixedand multiple exchange rate policy while experienc-ing relatively high inflation rates. The policy led toa loss of competitiveness and eventually to theforeign exchange crisis of the late 1970s. The grossnational product (GNP) shrank by 0.5 percent in1979 and by 2.8 percent in 1980. With the stabiliza-tion measures of 1980, Turkey devalued its lira by100 percent and eliminated the multiple exchangerate system, except for imports of fertilizers and fer-tilizer inputs. After May 1981, the exchange rate wasadjusted daily against major currencies to maintainthe competitiveness of Turkish exports. Multiplecurrency practices were phased out during the firsttwo years of the 1980 stabilization program, andthe government pursued a policy of depreciatingthe real exchange rate (RER)—on average by about6 percent annually over the period 1980–88.5
In January 1984, domestic commercial bankswere allowed to engage in foreign exchange opera-tions within certain limits, and restrictions on for-eign travel and investment from abroad were easedand simplified. Determination of the exchange ratewas further liberalized by permitting banks to settheir own rates within a specified band around thecentral bank rate. In August 1988, major reformwas introduced, and a system in which the marketset foreign exchange rates was adopted. In 1989 for-eign exchange operations and international capitalmovements were liberalized entirely.6
A drawback of the RER depreciation policy pur-sued during the 1980s was the decline in real wages,measured in terms of foreign currency.7 By the sec-ond half of the 1980s, popular support for the gov-ernment had begun to fall off. In the local electionsof March 1989, the governing political party suf-fered heavy losses. To increase political support, thegovernment conceded substantial pay increasesduring collective bargaining in the public sector.Pressure then built up in the private sector to arriveat similarly high wage settlements, real wages beganto increase, and the RER started to appreciate.
According to the government, the appreciationof the RER after 1989 stemmed from marketforces. During the 1990s, Turkey’s public finances
deteriorated considerably. The large public sectordeficits were financed by borrowing from the mar-ket at very high real interest rates. Significant capitalflowed into the country because it was offering notonly high real interest rates but also the prospect ofsteady real appreciation of the exchange rate. Thusthe government’s implicit commitment to the RERappreciation insured the private sector, domesticand foreign, against currency risk. It encouragedcapital inflows from abroad and lending to thepublic sector, giving rise to the phenomenon oflarge, arbitrage-related, short-term capital inflows.
The policy pursued during the first half of the1990s was not sustainable. By 1993 the current-account-deficit-to-GDP (gross domestic product)ratio had reached 3.6 percent. In 1994 the countryfaced balance of payments crises from which theGDP shrank by 5.5 percent. But with the introduc-tion of stabilization measures, the trend in the RERreversed. The RER depreciated by 64 percent dur-ing January 1994 and April 1994. The country hadto reverse its economic policies, however, becauseof the relatively weak coalition governments. TheRER began to appreciate again after April 1994, andby September 1995 it had appreciated by about23.5 percent.
Between 1995 and 1997, the economy wentthrough a boom period of above-trend growth,only to find itself badly hit in 1998 by the Russiancrisis. In August 1999, a severe earthquake hit theMarmara area of Turkey, and another large shockhit the Bolu area in November 1999. Because ofthese shocks, real GDP shrank by 4.7 percent in1999. At the end of that year, Turkey embarked onan ambitious stabilization program. Central to theprogram has been the policy of using a predeter-mined exchange rate path as a nominal anchor forreducing inflationary expectations.
During 2000, the RER appreciated considerably,which aggravated further the current accountdeficits, leading to concerns about the sustainabilityof the exchange rate regime. The current-account-deficit-to-GDP ratio reached 4.9 percent in 2000.This episode ended with a severe currency crisis inFebruary 2001. There was a serious run on theTurkish lira (TL), interest rates skyrocketed, andforeign exchange reserves began to decline rapidly.The government decided to abandon the crawlingpeg regime and to float the currency. The exchangerate then depreciated sharply.
6 Turkey: Economic Reform and Accession to the European Union

On May 15, 2001, the IMF increased its assistanceunder a new standby arrangement. This programaimed to strengthen the balance of public finances ina way that would prevent deterioration in the future.During 2001, Turkey introduced a set of structuralreforms. But the terrorist attacks of September 11,2001, threatened the progress of the reforms. Turkeyresponded with a strengthened medium-term pro-gram intended to clean up the banking sector, con-solidate fiscal adjustments, and achieve disinflation,and in February 2002 the IMF approved a three-yearstandby credit for Turkey to support the govern-ment’s economic program. During 2001, the GNPcontracted by 9.5 percent, and the loss in employ-ment was put at more than 1 million.8 Toward theend of 2001, the RER began to appreciate again.With the appreciation of the RER, considerable eco-nomic recovery was observed during 2002–04.
Figure 1.3 shows developments in the currentaccount-to-GDP ratio over the period 1975–2003.Currency crises arose in the late 1970s, 1994, and2001. The figure indicates that the probability of abalance of payments crisis increases in Turkey asthe current-account-deficit-to-GDP ratio increasesabove the critical level of 5 percent.9 By October2004, the annual current account deficit hadreached $14.17 billion, and the current-account-deficit-to-GDP ratio had increased to about 5 per-cent by the third quarter of 2004.
Figure 1.4 shows the time path of the RER overthe past two decades, and it reveals four episodes ofRER developments. After the foreign exchange cri-sis of the late 1970s, the RER began to depreciatesharply in response to the stabilization measures of1980. It continued to depreciate until 1988, when itbegan to appreciate—that is, until 1994, when thecountry was faced with another currency crisis. In1994 the RER depreciated sharply, but it appreci-ated again from April 1994 to February 2001, whenthe country was faced with yet another currencycrisis. After the sharp depreciation of the RER fromFebruary 2001 to April 2001, it began to appreciate,especially after October 2001. It appreciated untilMarch 2004 by about 36.3 percent. During March2004 and May 2004, the RER depreciated by about11 percent, and thereafter it stayed relatively con-stant until October 2004.
Fiscal Developments
Table 1.2 shows the structure of the revenues andexpenditures of the public sector from 1998 to2002. The public sector consists of the central gov-ernment, revolving funds, social security institu-tions, extrabudgetary funds, local governments, andstate economic enterprises (SEEs). The table revealsthat, on average, during 1998–2002 revenues madeup 29.24 percent of GNP, expenditures 42.4 percent
Macroeconomic Policies for Turkey’s Accession to the EU 7
�6
�5
�4
�3
�2
0
2
�1
1
3
1970
1975
1980
1985
1990
1995
2000
2005
Ratio
FIGURE 1.3 Current-Account-to-GDP Ratio, 1975–2004
Source: Central Bank of Turkey.
0
20
40
60
80
100
140
120
160
Jan.
198
0
Jan.
198
2
Jan.
198
4
Jan.
198
6
Jan.
198
8
Jan.
199
0
Jan.
199
2
Jan.
199
4
Jan.
199
6
Jan.
199
8
Jan.
200
0
Jan.
200
2
Jan.
200
4
RER
FIGURE 1.4 Real Exchange Rate, 1980–2004
Note: An increase in the real exchange rate indicatesits depreciation.Source: The authors.

TABLE 1.2 Structure of Revenues, Expenditures, and Public Sector Borrowing Requirements (PSBR), 1998–2002
Share of Total Revenue Share of Total Expenditure
Nontax Factor Social Privatization Current Investment Interest Other StockTaxes Income Income Funds Revenues Expenditures Expenditures Payments Transfers Changes Fund Revenue/GNP Expenditure/GNP PSBR/GNP
1998 80.62 4.94 19.93 −9.27 3.78 31.63 19.43 35.88 9.89 3.16 25.56 34.99 9.421999 87.01 5.93 18.60 −11.84 0.31 32.45 16.17 37.21 10.82 3.35 25.57 41.09 15.522000 82.51 7.37 11.41 −6.30 5.00 29.19 16.34 41.30 11.07 2.10 30.45 42.23 11.782001 81.64 6.63 16.31 −7.34 2.76 26.41 11.21 49.31 9.80 3.27 33.26 49.65 16.392002 76.60 9.74 23.38 −10.24 0.53 28.74 14.21 44.66 10.82 1.57 31.38 44.06 12.68
Average 81.67 6.92 17.93 −9.00 2.48 29.68 15.47 41.67 10.48 2.69 29.24 42.40 13.16
Source: Turkish State Planning Organization.
8

of GNP, and public sector borrowing requirements(PSBR) 13.16 percent of GNP. Taxes are the mainsource of revenues, forming about 81.67 percent ofthe total; indirect taxes make up about 70 percent oftax revenue. Although factor incomes generated bythe profits of SEEs have constituted, on average,17.93 percent of total revenues, the social fundshave not generated revenue; they have been subsi-dized from the budget. On the expenditures side,current expenditures and investments constitute,on average, 29.68 percent and 15.47 percent of totalexpenditures, respectively. The most importantexpenditure item during the period 1998–2002 wasthe interest payments—on average, they were41.67 percent of total expenditures.
Public Sector Borrowing Requirements and PublicDebt During the 1990s, the PSBR amounted onaverage to 12 percent of GNP. The high deficitincurred during the period was financed by borrow-ing from the market at very high real interest rates, asshown in figure 1.5.10 Table 1.3 reveals that betweenthe end of 1995 and the end of 2001 Turkey’s debtstock more than doubled in terms of the debt-to-GDP ratio and reached 95 percent at the end of 2001.In 2002 the debt stock shrank somewhat, but itremained at almost twice its level in 1995. By 2002
external and foreign exchange (FX) indexed debt hadreached 59.4 percent of total debt.
The evolution of public debt is best explained bydecomposing the annual change in debt into vari-ous components as shown in table 1.3. Concentrat-ing on developments during the past two years, theWorld Bank (2003) notes that the debt-to-GNPratio in 2001 alone rose by 37.6 percent. Althoughthe country ran a primary surplus of 5.5 percent ofits GNP with the introduction of the IMF stabiliza-tion program, three factors mainly contributed tothe increase in the debt-to-GNP ratio: (1) the highinterest rates prevailing in the country; (2) depreci-ation of the real exchange rate, leading to increasesin the ratio of FX-denominated debt to GNP; and(3) the costs of the banking crisis. In response tothe banking crisis, the government issued newbonds in order to recapitalize failing banks. Thebonds issued for this purpose amounted to 20 per-cent of GNP (table 1.3). In 2002 the debt pictureimproved, but this time it stemmed mainly fromthe real appreciation of the real exchange rate.
The PSBR-to-GNP and debt-to-GNP ratiosgiven earlier are based on data from Turkey’s StatePlanning Organization (SPO). Two other sets ofdata on the PSBR-to-GNP ratio, and thus on thedebt-to-GNP ratio in Turkey, are also available—the first from the IMF and the second from the EU,consistent with the European System of Accounts1995 (ESA 95) codes. The differences among thethree sets of data are mainly attributable to thelarge duty losses. During the 1990s, the state banksfaced unrecovered costs from duties carried out onbehalf of the government, and they covered theirfinancing needs from markets by borrowing at veryhigh interest rates and at short maturities. Thedirect subsidies given through the state banks tofarmers and small business were not shown in thegovernment budget figures of the SPO; instead,they were shown on state banks’ balance sheets asperforming assets accruing interest income. ThePSBR-to-GNP ratios of the SPO do not reflect thesubsidy components given through the state banks,whereas the figures estimated by the IMF and EUdo. A close look at the data in table 1.4 will revealthat the public sector, according to the IMF defini-tion, ran a deficit equal to 18.9 percent in 2000,21.1 percent in 2001, 12.1 percent in 2002, and10 percent in 2003. As a result, the net debt-to-GNPratio, according to the IMF definition, increased
Macroeconomic Policies for Turkey’s Accession to the EU 9
0
20
�20
�40
40
60
80
100
140
120
160
Jan.
199
0
Jan.
199
1
Jan.
199
2
Jan.
199
3
Jan.
199
4
Jan.
199
5
Jan.
199
6
Jan.
199
7
Jan.
199
8
Jan.
199
9
Jan.
200
0
Jan.
200
1
Jan.
200
3
Jan.
200
2
Real interest rate
FIGURE 1.5 Real Interest Rate, January 1990–October 2003
Note: Some data are missing in this figure becauseauctions could not be held during the indicatedmonths.Source: The authors.
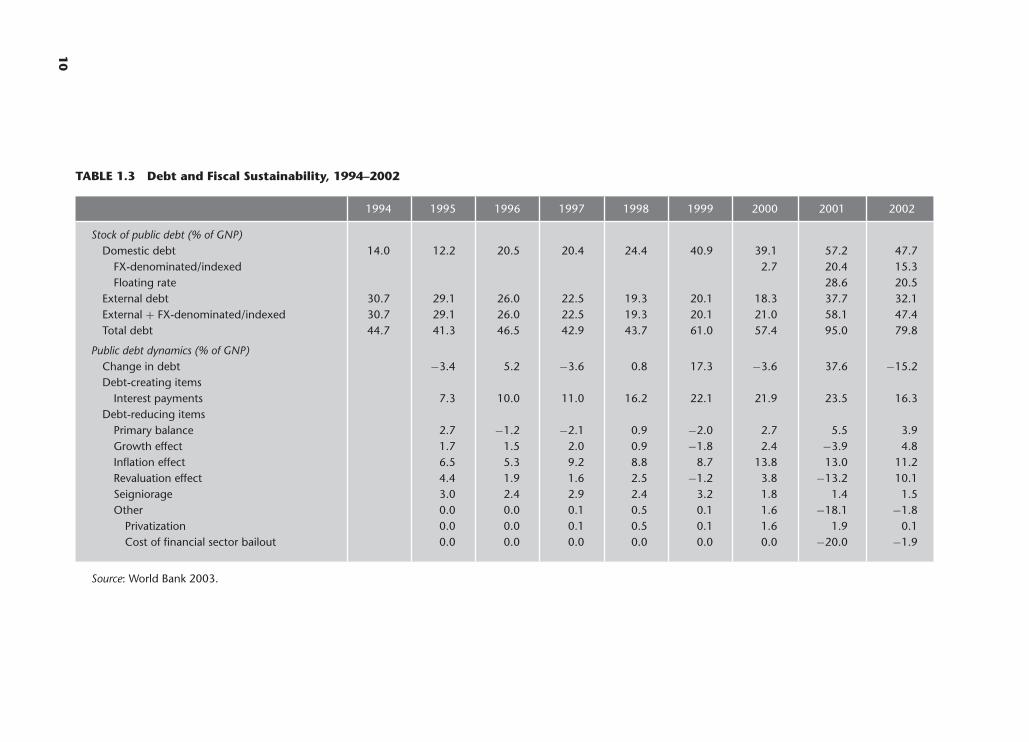
10
TABLE 1.3 Debt and Fiscal Sustainability, 1994–2002
1994 1995 1996 1997 1998 1999 2000 2001 2002
Stock of public debt (% of GNP)Domestic debt 14.0 12.2 20.5 20.4 24.4 40.9 39.1 57.2 47.7
FX-denominated/indexed 2.7 20.4 15.3Floating rate 28.6 20.5
External debt 30.7 29.1 26.0 22.5 19.3 20.1 18.3 37.7 32.1External + FX-denominated/indexed 30.7 29.1 26.0 22.5 19.3 20.1 21.0 58.1 47.4Total debt 44.7 41.3 46.5 42.9 43.7 61.0 57.4 95.0 79.8
Public debt dynamics (% of GNP)Change in debt −3.4 5.2 −3.6 0.8 17.3 −3.6 37.6 −15.2Debt-creating items
Interest payments 7.3 10.0 11.0 16.2 22.1 21.9 23.5 16.3Debt-reducing items
Primary balance 2.7 −1.2 −2.1 0.9 −2.0 2.7 5.5 3.9Growth effect 1.7 1.5 2.0 0.9 −1.8 2.4 −3.9 4.8Inflation effect 6.5 5.3 9.2 8.8 8.7 13.8 13.0 11.2Revaluation effect 4.4 1.9 1.6 2.5 −1.2 3.8 −13.2 10.1Seigniorage 3.0 2.4 2.9 2.4 3.2 1.8 1.4 1.5Other 0.0 0.0 0.1 0.5 0.1 1.6 −18.1 −1.8
Privatization 0.0 0.0 0.1 0.5 0.1 1.6 1.9 0.1Cost of financial sector bailout 0.0 0.0 0.0 0.0 0.0 0.0 −20.0 −1.9
Source: World Bank 2003.

from 57.4 percent in 2000 to 93.9 percent in 2001,and then decreased to 79.2 percent in 2002 and to70.9 percent in 2003. Public debt, according to theIMF definition, is a net debt that is measured inpercent of centered GNP, defined as the sum ofquarterly GNP in the last two quarters of the yearand in the first two quarters of the following year.11
By contrast, the EU measures the debt in grossterms. Thus total gross public debt, according tothe EU definition, decreased from 102.6 percent ofGDP in 2001 to 89.5 percent in 2002 and 80.2 per-cent in 2003.
Structure of Taxes Because taxes constitutedabout 80.25 percent of total revenues during2000–02, this section will consider the tax burdenin Turkey, compare the composition of tax rev-enues in Turkey with that of tax revenues in the EU,and compare the main features of personal, corpo-rate, and value added tax (VAT) systems in Turkeyand the EU.
Turkey is an upper-middle-income country,whose per capita income falls at the lower end ofthose of this group of countries. A comparison ofthe central government tax revenues of Turkey withthose of other countries reveals that Turkey has arelatively high tax burden in its per capita incomegroup (see World Bank 2003). When comparedwith those of lower-middle-income countries,Turkey’s tax burden is markedly above the revenueaverage of 13.6 percent of the lower-income group.It is also significantly above the average of 21.3 per-cent for all upper-middle-income countries. In fact,
it is comparable with that of Ireland (see table 1.5),but it is still below the tax/GDP figures in the mem-ber countries of the EU.12
Table 1.6, which shows the composition of taxrevenues in Turkey and the EU, reveals that EUcountries obtain a significantly larger percentage oftax revenues from social security and payroll taxes(32.7 percent) compared with Turkey (14.3 per-cent). In Turkey, the share of taxes on goods andservices (35.7 percent) is higher than the similarshare in the EU (28.8 percent).
Macroeconomic Policies for Turkey’s Accession to the EU 11
TABLE 1.4 Ratios of Public Sector Borrowing Requirements (PSBR) and of Debt toGNP and GDP, 2000–03
PSBR/GNP PSBR/GDP Debt/GNP Debt/GDP
SPO IMF EU SPO IMF EU
2000 11.8 18.9 9.8 57.5 57.4 65.42001 16.4 21.1 15.9 91.0 93.9 102.62002 12.8 12.1 13.6 78.7 79.2 89.52003 9.4 10.0 10.1 70.5 70.9 80.2
Note: The debt/GNP figures of the IMF refer to the net debt of the public sector as a ratio of centered GNP,where centered GNP is defined as the sum of quarterly GNP in the last two quarters of the year and in the firsttwo quarters of the next year. The debt/GDP figures of the EU refer to the ratio of the gross debt of the publicsector to GDP.
Sources: IMF 2004; Turkish State Planning Organization (SPO) 2004; http://www.treasury.gov.tr.
TABLE 1.5 Total Tax Revenue as Percentageof GDP, 1998–2000
1998 1999 2000
Austria 44.3 44.1 43.7Belgium 45.8 45.4 45.6Denmark 50.1 51.2 48.8Finland 46.1 46.8 46.9France 45.1 45.7 45.3Germany 37.1 37.8 37.9Greece 35.6 36.9 37.8Ireland 31.7 31.3 31.1Italy 42.5 43.3 42.0Luxembourg 39.8 40.9 41.7Netherlands 40.0 41.2 41.4Portugal 33.3 34.1 34.5Spain 34.0 35.0 35.2Sweden 51.6 52.0 54.2United Kingdom 36.9 36.4 37.4
Turkey 28.4 31.3 33.4
Source: OECD 2003.

Table 1.7 compares for 2002 the personal tax,corporate tax, and VAT systems of Turkey and theEU countries. The table reveals that the averageincome tax and social security contribution rate ongross labor income in Turkey amounts to 43.2 per-cent, whereas the same tax rate is 25.8 percent inIreland and 29.7 percent in the United Kingdom.The corporate income tax in Turkey is 44.1 percent,whereas it is 16 percent in Ireland and 30 percentin United Kingdom. By contrast, the VAT rate inTurkey is 18 percent, whereas it is 15 percent inLuxembourg and 16 percent in Germany andSpain. According to the table, tax rates are in gen-eral very high in Turkey. With such high tax rates,Turkey should have achieved a much higher total-tax-to-GNP ratio than the 31.8 percent achievedin 1999. Currently, the country has a large shareof employment declared to be at the minimumwage because of attempts by both employees andemployers to reduce their tax burden, and it has rel-atively large employment in the informal sector. Asa result, Turkey’s tax base is rather narrow.
Employment and Growth
Table 1.8, which shows developments in the labormarket for 2001–03, reveals that Turkey, with a
population of 70.7 million and a labor force partici-pation rate of 48.3 percent in 2003, has created jobsfor about 21 million people. During 2003, 33.9 per-cent of the labor force was employed in agriculture,18.2 percent in industry, and 47.9 percent in serv-ices. The unemployment rate was 10.5 percent. Theaverage unemployment rate during 1990–2000 was7.6 percent, but it increased considerably with thefinancial crisis of 2001.
These figures indicate that Turkey must createjobs for its unemployed workers, as well as for thoseentering the labor force for the first time at theaverage rate of 900,000 persons a year. In addition,Turkey has to increase the labor force participationrate from its current low level of 48.3 percent to thelevels that prevailed at the beginning of the 1990s.At that time, the labor force participation rate was56.5 percent. By contrast, the comparable level inthe EU was about 63 percent. Job creation, then, is amajor challenge that Turkey must meet over time.
The Turkish labor market is extremely flexiblebecause of the country’s formidable informal sector,whose wage-setting mechanism is quite differentfrom that of the formal sector. The informal sectoris largely free from most types of labor regulation,and it does not pay most taxes and related charges.Activities in this sector rely largely on the provision
12 Turkey: Economic Reform and Accession to the European Union
TABLE 1.6 Revenue from Major Taxes as a Percentage of Total Tax Revenue, 1998
Personal Corporate Social Security Goods and General Income Income and Other Payroll Property Services Consumption Taxes
Austria 22.5 4.8 40.3 1.3 27.9 18.7
Belgium 30.7 8.5 31.5 3.2 24.9 15.3
Denmark 51.6 5.6 3.9 3.6 33.2 19.6
Finland 32.3 9.0 25.2 2.4 30.7 18.5
France 17.4 5.9 39.5 7.3 26.6 17.5
Germany 25.0 4.4 40.4 2.4 27.4 17.9
Greece (1997) 13.2 6.4 32.3 3.8 41.0 22.6
Ireland 30.9 10.7 13.8 5.2 38.7 22.2
Italy 25.0 7.0 29.5 4.8 27.4 14.2
Luxembourg 18.8 19.7 25.6 8.4 26.1 13.7
Netherlands 15.2 10.6 39.9 4.9 27.7 16.9
Portugal 17.1 11.6 25.5 2.9 41.3 23.3
Spain 20.8 7.3 35.2 6.0 29.4 16.6
Sweden 35.0 5.7 33.5 3.7 21.6 13.6
United Kingdom 27.5 11.0 17.6 10.7 32.6 18.1
EU 23.9 7.1 32.7 5.4 28.8 17.2
Turkey 27.0 5.8 14.3 2.8 35.7 30.0
Source: Noord and Heady 2001.

Macroeconomic Policies for Turkey’s Accession to the EU 13
TABLE 1.7 Personal Tax, Corporate Tax, and VAT System: Turkey and EUCountries, 2002
Marginal Income Average IncomeTax and Social Tax and Social
Security Contribution Security Contribution Corporate StandardRate on Gross Rate on Gross Income Tax VATLabor Income Labor Income Rate Rate
Austria 55.3 44.7 34.0 20.0Belgium 66.7 55.6 40.2 21.0Denmark 50.4 44.2 30.0 25.0Finland 57.4 45.9 29.0 22.0France 53.0 48.3 — 19.6Germany 63.9 50.7 38.9 16.0Greece 44.1 36.0 — 18.0Ireland 33.9 25.8 16.0 21.0Italy 54.5 46.2 — 20.0Luxembourg 47.9 34.2 30.4 15.0Netherlands 51.0 42.3 34.5 19.0Portugal 39.4 32.5 33.0 19.0Spain 45.5 37.9 35.0 16.0Sweden 50.4 48.6 28.0 25.0United Kingdom 39.2 29.7 30.0 17.5
Turkey 45.6 43.2 44.1 18.0
— Not available.Note: The first two columns report marginal and average personal income tax and social securitycontribution rates for a single person without dependents at 100 percent of the average production wage.The corporate income tax rate for Turkey refers to the total effective tax burden of a nonpublicly ownedcompany. In the case of a publicly owned company, the tax burden goes down to 36.7 percent.Source: OECD tax database (http://www.oecd.org).
TABLE 1.8 Labor Market Indicators: Turkey, 2001–03
2001 2002 2003
Population (thousands) 68,610 69,626 70,712Population 15 and over (thousands) 47,158 48,041 48,912Labor force (thousands) 23,491 23,818 23,640
Participation ratio (%) 49.8 49.6 48.3Civilian employment (thousands) 21,524 21,354 21,147Unemployment (thousands) 1,967 2,464 2,493Unemployment rate (%) 8.4 10.3 10.5
Employment by sector (thousands)
Agriculture 8,089 7,458 7,165Industry 3,774 3,954 3,847Services 9,661 9,942 10,135
Sectoral distribution of employment (%)
Agriculture 37.6 34.9 33.9Industry 17.5 18.5 18.2Services 44.9 46.6 47.9
Source: Treasury statistics, 1980–2003.

of labor without formal employment contracts. Jobinsecurity is pervasive, and workers receive very fewbenefits from their employers. Because wages in theinformal sector are determined by demand and sup-ply conditions, the informal sector itself is flexible.By contrast, the formal sector observes labor regula-tions, and it pays all taxes and related charges suchas social security contributions and payments tovarious funds. Thus, this sector is not as flexible asthe informal sector. Until now, Turkey has success-fully solved the unemployment problem by meansof its large informal sector.13 Indeed, over time thissector has grown considerably through the laxenforcement of tax, social security, and labor laws.But the current system of formal and informal sec-tors, with the informal sector accounting for about60 percent of total employment, does not seem to besustainable in the long run.14
As for the growth of GDP, over the period1950–2002, GDP increased at an average annualrate of 4.9 percent.15 However, over the same periodthe average growth rate declined. The growth rateof GDP was 7.1 percent during 1950–59, 5.4 per-cent during 1960–69, 4.7 percent during 1970–79,4.1 percent during 1980–89, and 3.6 percent over theperiod 1990–2002. Besides experiencing decreasingaverage growth rates of real income, Turkey hasrecently faced greater economic volatility, becauseeconomic crises have begun to affect the Turkisheconomy with increasing frequency. As noted ear-lier, during the last decade periods of economicexpansion have alternated with periods of equallyrapid decline.
Macroeconomic Policy Frameworkfor EU Membership
Upon accession, Turkey, according to Article 122 ofthe treaty establishing the European Community(hereafter known as the “Treaty”), will be treated asa “Member State with a derogation” until it fulfillsthe convergence criteria.16 The Central and EasternEuropean (CEE) countries, when signing the acces-sion treaty, have accepted the goal of monetaryunion as part of the acquis communautaire, theentire body of legislation of the European Commu-nities and Union. To become members of theEuropean Economic and Monetary Union (EMU),the CEE countries must fulfill the convergence cri-teria, which involve conditions on price stability,
interest rate convergence, budget deficits, govern-ment debt, and exchange rate stability.17
Macroeconomic Policy Framework for EMU Members
On January 1, 1999, 11 of the 15 member countriesof the EU entered the third and final stage of theprocess leading to the formation of the EMU. Atthat time, the exchange rates among the currenciesof the participating countries were irrevocablyfixed in relation to the new single currency, theeuro, and the newly formed European Central Bank(ECB) had taken over responsibility for monetarypolicy in the Euro Area. Individual member coun-tries of the EMU therefore no longer have controlover either monetary policy or exchange ratepolicy; they have surrendered their sovereignty inmonetary and exchange rate policy to the suprana-tional authority, the ECB.
Monetary Policy The European System of Cen-tral Banks (ESCB) is composed of the EuropeanCentral Bank and the national central banks(NCBs) of all 15 EU member states.18 Because notall members joined the monetary union from theoutset, the term Eurosystem was adopted todescribe the ECB and the NCBs of the 11 memberstates that have adopted the euro. All decisionsrelated to the Eurosystem are made by the decision-making bodies of the ECB, the Executive Board,and the Governing Council. The Executive Boardcomprises the president and the vice president ofthe ECB and four other members. It implementsmonetary policy in accordance with the guidelinesand decisions laid down by the Governing Council.The Governing Council comprises the members ofthe Executive Board and the governors of the NCBsparticipating in the Euro Area. It is the primarydecision-making body of the ECB.
The Treaty specifies that the main task of theEurosystem is to deliver price stability (Article 105).According to Article 107 of the Treaty, the Eurosys-tem is solely responsible for the Euro Area’s singlemonetary policy, and it is to pursue the goal ofprice stability free from political pressure by EUinstitutions, interest groups, or individuals. TheTreaty does not precisely define price stability. TheEurosystem interprets it as a year-to-year increase inthe Harmonised Index of Consumer Prices (HICP)
14 Turkey: Economic Reform and Accession to the European Union

for the Euro Area of below 2 percent (EuropeanCentral Bank 2003b), which is to be maintainedover the medium term. The phrase “below 2 per-cent’’ delineates the upper bound for the rate ofmeasured inflation in the HICP.
To achieve price stability, the Eurosystem usestwo pillars. The first pillar is what the Eurosystemcalls “economic analysis.” It consists of a broadlybased assessment of the outlook for price develop-ments and the risks to price stability in the EuroArea as a whole. The assessment concentrates onthe medium impact of the current conditions ofinflation. The second pillar is an assessment of theevolution of monetary aggregates (M3) and credit.It analyzes the longer-run impact of monetaryaggregates on inflation. The two perspectives offercomplementary analytical frameworks to supportthe Governing Council’s overall assessment of risksto price stability. The inflation forecast is publishedtwice a year. If the forecast exceeds the target (i.e.,the 2 percent definition of price stability), the pre-sumption under an inflation targeting strategy isthat monetary policy will be tightened. Althoughthe Eurosystem’s strategy resembles inflation tar-geting, the Eurosystem does not want to give theappearance that it acts mechanically.
In conducting monetary policy, the Eurosystemuses mainly short-term interest rates and focuses onthe overnight rate EONIA (European Over-NightIndex Average, a weighted average of overnightlending transactions in the Euro Area’s interbankmarket). Control over EONIA is achieved in twoways. First, the Eurosystem has two facilities at itsdisposal: a marginal lending facility and a depositfacility. These facilities operate under overnightmaturity and are available to counterparties at theirown initiative. They are administered on a decen-tralized basis, with their features harmonized acrossthe Eurosystem. Overnight liquidity is provided at aprespecified interest rate against eligible collateral.In normal circumstances, the interest rate on themarginal lending facility defines the ceiling forEONIA in the market. Similarly, the deposit facilitydefines the floor for overnight market rates. Allfinancial institutions fulfilling the general eligibilitycriteria may access this facility. Access is grantedthrough the NCB in the country in which the finan-cial institution is established and on all days that thenational payment and securities settlement systemsare operational.
The second way in which control is exercised overEONIA is ECB auctions, usually weekly, with amaturity of two weeks at a rate the ECB chooses.These auctions, called refinancing operations, pro-vide the liquidity needed by the banking system, andthe chosen interest rate serves as a guide for EONIA.Transactions related to weekly tenders are conductedby the NCBs in the form of standard (fixed-rate orvariable-rate) tenders. The NCBs are responsible forcollecting the tender offers and transmitting them tothe ECB. They also inform credit institutions aboutthe results of the tenders and arrange the settlementaspects—that is, receiving the collateral and provid-ing the liquidity. Both the ECB and the NCBs con-duct longer-term refinancing operations monthly,with a maturity of three months. These operationsprovide the financial sector with additional longer-term liquidity. In addition, the NCBs may carry outstructural open-market operations. The GoverningCouncil can authorize fine-tuning, outright transac-tions of securities, foreign exchange swaps, and thecollection of deposits to be conducted, in excep-tional circumstances, by the ECB itself.
Although in conducting monetary policy theEurosystem uses mainly short-term interest rates, itis the long-term interest rate that affects the econ-omy. Indeed, households and firms borrow for rel-atively long periods. Thus central banks control theshort maturity, while it is the long maturity thatreally matters. Yet these banks do influence thelong-term rates by being clear about their longer-run aims and intentions.
Overall, the Eurosystem constitutionally enjoysconsiderable independence, both in defining itsobjectives and in deciding how to conduct mone-tary policy. The ECB is accountable to the EuropeanParliament.
Fiscal Policy The Euro Area does not have a cen-tral fiscal authority.19 There is a budget for the EUas a whole, but it is relatively small. Spendingamounts to only a little over 1 percent of GDP,devoted mostly to common agricultural policy andthe structural funds, and deficit financing is pro-hibited. Thus, budgetary decisions in the Euro Areawill remain almost exclusively the province ofmember states, albeit subject to surveillance by theEU as a whole in the context of the requirements setout in the Maastricht Treaty and subsequently theStability and Growth Pact.
Macroeconomic Policies for Turkey’s Accession to the EU 15

For countries seeking to qualify for EMU mem-bership and those already members, the MaastrichtTreaty and the SGP established certain targets onthe size of debt and deficits and other obligations.For countries already in the EMU, the targets wereintended to achieve and maintain “sound” budget-ary positions and to avoid harsh penalties. Article104 of the Treaty establishes that “member statesshall avoid excessive government deficits” and thatcompliance with budgetary discipline will bejudged on the basis of two criteria:
(a) whether the ratio of the planned or actualgovernment deficit to gross domestic productexceeds a reference value, unless either the ratiohas declined substantially and continuously andreached a level that comes close to the referencevalue, or, alternatively, the excess over the refer-ence value is only exceptional and temporary andthe ratio remains close to the reference value
(b) whether the ratio of government debt togross domestic product exceeds a referencevalue, unless the ratio is sufficiently diminishingand approaching the reference value at a satis-factory pace.
As is well known, these two reference values wereset at 3 percent and 60 percent, respectively.
The SGP was designed to provide concretenessto several provisions of the Treaty on economicpolicies in the EU. It consists of a resolution ofthe European Council and of two regulations(No. 1466/97 and No. 1467/97) of the Council forEconomic and Financial Affairs (ECOFIN).20 Theresolution reaffirms the commitment to fiscal disci-pline and introduces the notion that the “medium-term budgetary objective of positions close tobalance or in surplus” should be respected by mem-ber states in order to “allow all Member States todeal with normal cyclical fluctuations while keep-ing the government deficit within the referencevalue of 3 percent of GDP.” The medium term isunderstood to represent about three years.
Regulation No. 1466/97 clarifies the proceduresto be followed in implementing the surveillance ofthe Stability and Growth Pact, as envisioned in gen-eral terms in Article 99 of the Treaty. In particular,it establishes, first, that member states must everyyear submit an update to the stability program thatcontains a medium-term objective for the budget-ary position, as well as a description of the assump-
tions and of the main economic policy measuresthe country intends to take to achieve the targets;and, second, that the European Council, on a rec-ommendation from the Commission, must deliveran opinion on each program and its yearly updatesand, if deemed necessary, a recommendation.Three types of recommendations are possible. First,the Council could issue a recommendation that theprogram be adjusted if deemed deficient in somerespect. Second, if after approving the programthe Council identifies a “significant divergenceof the budgetary position from the medium-term budgetary objective, or the adjustment pathtowards it,” the Commission can issue a recom-mendation (early warning) in accordance withArticle 103(4). Third, if the divergence persists, theCouncil can issue a recommendation to take cor-rective action, and can make the recommendationpublic.
Regulation No. 1467/97 first tries to make moreprecise the notion of “exceptional and temporary”excess of the deficit over the 3 percent of GDPthreshold, as introduced by Article 104 of theTreaty. Article 2(1) of the regulation specifies thatan “exceptional and temporary” excess of the deficitis allowed “when resulting from an unusual eventoutside the control of the Member State concernedand which has a major impact on the financialposition of the general government or when result-ing from a severe economic downturn.” Arti-cles 2(2) and 2(3) further specify that a deficit willbe considered exceptional “if there is an annual fallof real GDP of at least 2 percent” or if a memberstate can argue successfully that the circumstancesare “exceptional,” based on “the abruptness of thedownturn or on the accumulated loss of outputrelative to past trends.” The regulation then clarifiesthe “excessive deficit procedure” set out in Arti-cle 104 of the Treaty, including the imposition offines.
Countries found exceeding the 3 percent ofGDP limit must take corrective action “as quickly aspossible after [its] emergence.” The timing of thepolicy decisions and the rhythm at which the Com-mission, which monitors the process, prepares itsreports imply that a country can run deficits inexcess of 3 percent of GDP for two years in a rowwithout incurring sanctions. If a country failsto take corrective action and to bring its deficitbelow 3 percent of GDP by the deadline set by the
16 Turkey: Economic Reform and Accession to the European Union

Council, it is sanctioned. The sanction takes theform of a nonremunerated deposit. The depositstarts at 0.2 percent of GDP and rises by 1/10th ofthe excess deficit, up to a maximum of 0.5 percentof GDP. Deposits are imposed each year until theexcessive deficit is corrected. If the excess is not cor-rected within two years, the deposit is convertedinto a fine; otherwise, it is returned.21
Exchange Rate Policy The exchange rate of theeuro in relation to other currencies such as the dol-lar and the yen is determined by the market,although market misalignments and excessiveexchange rate fluctuations are corrected through acombination of economic policy dialogue, theoccasional use of interventions, and verbal exchangerate management.
Macroeconomic Policy Framework for Accession Countries
Based on the Treaty, three distinct phases for theadoption of the EMU acquis by accession countriescan be identified: (1) the preaccession period,(2) the period from accession to the adoption of theeuro, and (3) the Euro Area phase, after adoptingthe euro.22
Preaccession Phase During the preaccessionphase, accession countries carry out the economicreforms and policies needed to fulfill the Copen-hagen economic criteria, which are the existence ofa market economy and the capacity to cope withcompetitive pressure and market forces within theEU.23 In this context, countries have to establishfunctioning property rights, competition, free priceformation, and a well-developed financial sector. Ifa country is to be able to cope with internationalcompetition and if capital is to be channeledsmoothly within a country, it is of paramountimportance that the domestic banking and finan-cial sector are efficient. Such efficiency requires ahigh degree of financial intermediation, liquid cap-ital markets, banks with a sufficient capital base, afunctioning system of banking and securitiessupervision, and a sound payments system. Inaddition, the accession countries must adopt theEMU legislation in order to acquire the status of“Member State with a derogation,” which they needto adopt the euro (Article 122). According to
Italianer (2002), the requirements of the legislationare
• Completion of the orderly liberalization of capi-tal movements (Article 56)
• Prohibition of any direct public sector financingby the central bank (Article 101)
• Prohibition of privileged access of the publicsector to financial institutions (Article 102)
• Alignment of the national central bank statuteswith the Treaty, including the independence ofthe monetary authorities (Articles 108 and 109).
The first requirement—that capital movementsbe completely liberalized—underpins the efficientallocation of resources in the internal market.24 Thesecond and third requirements are related to centralbank economic independence, which rests onthe condition that operating procedures not berestricted by government policies. Traditionally, thegreatest threat to central bank economic independ-ence is pressures to monetize the fiscal deficit. As aresult of the second and third requirements, thecentral bank is prohibited from having primarydealings with the fiscal authorities. Essentially, thisprohibition means no automatic overdraft facilityfor treasuries and no central bank purchases of debtdirectly from the government. The prohibition ofprivileged access complements the prohibition ofcentral bank financing, imposes market disciplinein public sector borrowing, reinforces freedom ofcapital movements, and gets rid of the distortions inthe allocation of financial resources toward the pub-lic sector. The two requirements force the market toestablish the relevant price, thereby making conces-sionary finance more difficult, and they make trans-actions more visible, thereby making the monitor-ing of central bank performance much easier. Thefourth requirement related to central bank inde-pendence prepares the national central bank for itsfuture assignment of seeking price stability, and itreinforces fiscal discipline.
Policy coordination in the preaccession phasebetween the EU and the accession country isachieved through (1) preparation of an annual Pre-accession Economic Programme (PEP) by theaccession country, (2) annual evaluation of the PEPby the European Commission, (3) a fiscal notifica-tion system, (4) a report on the macroeconomic andfinancial sector stability developments in candidatecountries, (5) macroeconomic forecasts by the
Macroeconomic Policies for Turkey’s Accession to the EU 17

Commission, (6) meetings between the ECB andcandidate countries aimed at bringing financial andpayment systems in line with those in the Eurosys-tem, and (7) the Commission’s regular reports onprogress toward accession.
The PEP concentrates on the economic reformsneeded for EU accession, and the PEP procedureoffers an opportunity to develop the institutionaland analytical capacity necessary to participate inthe EMU upon accession, particularly in the areas ofeconomic analysis and medium-term policy plan-ning. The PEP consists of four parts: (1) a review ofrecent economic developments, (2) a detailedmacroeconomic framework, (3) a discussion ofpublic finance issues, and (4) an outline of thestructural reform agenda. It places special emphasison public finance by presenting the medium-termfiscal objectives in terms of the general governmentdeficit, the primary balance, and the public indebt-edness. Moreover, the candidate countries specifyand explain the factors underpinning their choice ofobjectives, and the programs undertaken to achievethe objectives should demonstrate the feasibility ofthe government’s fiscal objectives by means of aprojection of the main fiscal aggregates. Shortlyafter submission of the PEP, the Commission evalu-ates the program. The evaluation does not make anassessment of whether a country has made progresstoward meeting the Copenhagen criteria—this isprovided on an annual basis by the Commission’sregular report on progress toward accession. Yet theaccession countries report to the Commissionthrough the fiscal notification system the debt anddeficit figures calculated in accordance with theEU methodology based on the ESA 95 system ofnational accounts. These notifications use the sameformat as the fiscal notifications provided by mem-ber states in the framework of the excessive deficitprocedure (see European Commission 2002).
From Accession to Adoption of the Euro PhaseUpon accession, the new member state will havethe status of “Member State with a derogation”granted in the accession treaty. It will have to showadherence to the aim of economic and monetaryunion and compliance with the relevant parts ofTitle VII of the European Commission Treaty andthe other EMU acquis. These parts are
• Treatment of exchange rate policy as a matter ofcommon interest and, eventually, participationin the exchange rate mechanism (Article 124)
• Treatment of economic policies as a matter ofcommon concern and coordination of eco-nomic policies between the member statesthrough participation in Community proce-dures (Articles 98 and 99)
• Avoidance of excessive government deficits andadherence to the relevant provisions of the SGP(Article 104)
• Further adaptation of the national central bank’sstatutes with a view toward integration into theEuropean System of Central Banks (Article 109)
• Progress toward achieving a high degree of sus-tainable convergence (Article 121).
With accession, the common macroeconomicpolicy framework becomes more constraining, witha strong reinforcement of fiscal discipline and theintegration of other economic policies. Budgetarypolicy and outcomes become subject to the excessivedeficit procedure and the nonpunitive parts of theSGP. The Maastricht Treaty specifies that these coun-tries will have to make progress toward fulfillment ofthe Maastricht criteria, and, under the conditions ofthe SGP, they will have to endeavor to avoid excessivedeficits. Furthermore, the exchange rate policybecomes a matter of common interest. This develop-ment means that, to protect the smooth functioningof the single market, competitive devaluations arenot allowed. Thus, new member states must avoidpolicies leading to excessive fluctuations of theexchange rate.Participation in the ERM II is expectedsometime after accession. Such participation impliessetting the central rate to the euro and the fluctuationbands within ±15 percent by mutual agreement.
Because the economic policies of the accessioncountries become a matter of common concern,these policies will be subject to policy coordinationand multilateral surveillance procedures. Shortlyafter accession, the new member states will berequired to submit a full notification of govern-ment debt, deficit, and associated data. New mem-ber states also will have to prepare convergenceprograms, which will set out their budgetary strate-gies for the coming years, in particular with respectto the medium-term objective of reaching a budg-etary position “close to balance or surplus.” TheEuropean Council will examine the programs, and,based on the Commission’s recommendation, willadopt an opinion on each of the programs.
In addition to the convergence programs,economic and fiscal policy coordination and
18 Turkey: Economic Reform and Accession to the European Union

surveillance in the EU are achieved through theBroad Economic Policy Guidelines (BEPG). Theseguidelines, which are prepared on an annual basis,present the member states’ consensus opinion onmacroeconomic and other structural economicpolicies in the medium term. Each year, the Euro-pean Commission reviews in its annual economicreport the implementation of the guidelines by themember states.25
Participation in the Euro Area will be the ulti-mate goal for each new member state. A favorabledecision is made when the conditions for adoptionof the single currency are met, after determiningwhether a new member state has achieved a highdegree of sustainable convergence. Prior to acces-sion, there is no requirement that the EU assessprogress made on convergence criteria, or that can-didates for accession meet the criteria. As it was forthe present member states, adoption of the eurooccurs when a high degree of sustainable conver-gence has been demonstrated within the internalmarket.
Euro Area Phase The adoption of the euro willadd two key elements to the macroeconomicframework of “Member States with a derogation.”One is the single stability-oriented monetary policyand the ensuing single exchange rate policy. Thesecond is implementation of the sanction provi-sions of the SGP, by which member states surpass-ing the 3 percent ceiling in their deficit will besubjected to substantial fines. The aim is to allowthe ECB to conduct an independent monetarypolicy supported by prudent national fiscal poli-cies, which are subjected to the SGP and policycoordination. The Treaty does not specify anymandatory timetable for fulfillment of the condi-tions for introduction of the euro. In otherwords, although the economic policies of the newmember states will have to pursue a high degreeof sustainable convergence, the speed at whichthis should happen is left undetermined by EUlegislation.
Prospects for Central and Eastern EuropeanCountries The Central and Eastern Europeancountries that acceded to the EU on May 1, 2004,will have to coordinate their economic and fiscalpolicies with the Community in the ECOFINCouncil. They must submit annual convergenceprograms, and restrictions on capital movements
will no longer be permitted. The EU expects each ofthe acceding countries to join the ERM II—that is,to agree to an exchange rate arrangement betweenthe euro and each country’s currency. This phasewill last at least two years. The test period for theexchange rate criterion will probably be from May 1,2004, to April 30, 2006. It is crucial that a countryavoid devaluation within the two-year test period,because that country would fail the exchange ratecriterion.
During the second half of 2006, the convergencetest will probably be conducted by the ECB and theEuropean Commission. The decision on acceptanceinto the EMU will be made by ECOFIN on the basisof a proposal of the European Commission andafter consultation with the European Parliamentand after a discussion in the European Council. Theexamination of the budget and of government debtwill likely be based on the data for 2005 or the latestavailable figures. In January 1, 2007, the euro willprobably be adopted as national currency. The cen-tral bank governor of each new EMU country thenbecomes a member of the Governing Council, themain decision-making body of the ECB.26
The Macroeconomic ChallengesFacing Turkey
Turkey realizes that, in the long run, price stabilityand fiscal discipline create the best conditions forsustained, robust economic growth, but currentlythe situation is problematic. The data in table 1.9show the EMU convergence criteria for Turkey andthe Central and Eastern European countries. Thetable reveals that the CEE countries are about tosatisfy the criteria, but that Turkey is far from satis-fying the conditions. In 2003 the inflation rate inTurkey was 25.3 percent, compared with a referencevalue of 2.7 percent for the EU; the budget deficit asa percentage of GDP was 8.8 percent, comparedwith a reference value of 3 percent for the EU; thedebt-to-GDP ratio was 80.2 percent, comparedwith a reference value of 60 percent for the EU; andinterest rates were 28.5 percent, compared with areference value of 6.2 percent for the EU.27
The challenge facing Turkey is how to movefrom the current state of affairs to one in which theMaastricht criteria will be satisfied. The main issuesare reducing the inflation rate to about 3 percentover time and reducing the debt-to-GDP ratio to60 percent over time, while attaining sustainability
Macroeconomic Policies for Turkey’s Accession to the EU 19

20
TABLE 1.9 European Economic and Monetary Union Convergence Criteria, 2000–03
Interest ExchangeRates, Rate against
Inflation Rate (%) Budget Deficit (% of GDP) Government Debt (% of GDP) 10Y Bonds Parity2000 2001 2002 2003 2000 2001 2002 2003 2000 2001 2002 2003 (last) (max, 2Y) Currency Regime
Czech Rep. 3.9 4.7 1.8 0.1 −4.0 −3.2 −4.6 −6.6 29.2 29.0 22.4 37.6 5.1 −5.0 Managed float (EUR)Estonia 4.0 5.8 3.6 1.3 −0.7 1.1 1.2 2.4 6.6 6.2 5.4 5.1 2.3 −0.4 Currency board (EUR)Hungary 9.8 9.2 5.3 4.7 −3.5 −5.0 −9.6 −5.7 56.1 51.5 50.4 58.6 8.4 −9.3 Target zone (EUR)Latvia 2.7 2.5 1.8 2.9 −2.8 −1.9 −2.7 −1.6 10.0 12.2 13.9 16.3 7.4 −9.9 Peg (SDR)Lithuania 1.0 1.3 0.3 −1.2 −2.8 −1.4 −2.8 −1.7 28.3 29.0 25.0 23.6 6.4 0.2 Currency board (EUR)Poland 10.1 5.5 1.9 0.7 −2.7 −6.3 −5.4 −4.5 43.8 38.0 48.0 51.0 7.3 −17.2 FloatSlovakia 12.0 7.3 3.3 8.5 −6.8 −7.2 −1.9 −3.6 32.9 42.7 32.0 42.8 5.1 −6.3 Managed float (EUR)Slovenia 8.9 8.5 7.5 5.6 −1.4 −1.3 −1.1 −1.4 25.1 25.4 32.2 26.8 4.0 −4.3 Managed float (EUR)
Bulgaria 10.1 7.9 5.8 2.3 −1.1 −1.0 0.2 0.0 83.8 72.5 60.9 53.7 5.4 −0.8 Currency board (EUR)Romania 45.7 34.5 22.5 15.3 −4.1 −3.7 −1.7 −2.3 29.2 31.2 25.7 26.2 17.3 −19.2 Managed float (US$)
Turkey 54.9 54.4 45.0 25.3 −6.1 −29.8 −12.6 −8.8 65.4 102.6 89.5 80.2 28.5 16.3 Float
Reference value 2.8 3.3 3.0 2.7 −3.0 −3.0 −3.0 −3.0 60.0 60.0 60.0 60.0 6.2 +/− 15%
Note: Parity refers to the last three-year average exchange rate against the euro. In the case of Turkey, the interest rate is the annual compound interest rate obtained in the auctionof treasury bills and government bonds during November 2004. SDR = special drawing rights.
Sources: Deutsche Bank Research, EU Enlargement Monitor, April 2002, and EU Monitor, September 2004; State Planning Organization 2004; Central Bank of Turkey(http://www.tcmb.gov.tr).

of the current account and decreasing the unem-ployment rate in the economy.
Inflation
As of November 2004, the annual inflation rate inTurkey was 9.8 percent, and the government wasaiming to reduce the inflation rate to 8 percent in2005. To satisfy the Maastricht criteria on inflation,Turkey must reduce the inflation rate further, to3 percent. The annual inflation rate in Turkey hasbeen reduced in recent years through strict imple-mentation of the IMF economic program, whichcalls for controlling the growth of base money.Another factor leading to a lower inflation rate hasbeen the decrease in the cost of imported goods,achieved as a result of real appreciation of theTurkish lira. But reducing the inflation rate overtime through real appreciation of the currency isnot sustainable in the long run, because the realappreciation of the currency will lead to problemsof sustainability of the current account. Currentaccount sustainability in Turkey as of December2004 requires that the real exchange rate be depre-ciated to its long-run equilibrium level.28 Yet reduc-ing the inflation rate by reducing the public sectorcomponent of the wholesale price level, ppublic, isalso not sustainable, because this policy will lead toincreases in the ratio of the public sector borrowingrequirement to GDP, leading, in turn, to problemsrelated to the sustainability of fiscal policy. Thusppublic should be increased at least at the same rate asthe inflation rate in the economy. The only policyoption for reducing the rate of inflation is thereforeto control the growth rate of base money.
To reduce the inflation rate from its current levelof 9.8 percent to around 3 percent, Turkey willprobably go through a disinflation period. But dis-inflation in general entails costs, and the most
commonly used measure of the costs of disinflationis the “sacrifice ratio,” which can be defined as thenumber of percentage points of lost output associ-ated with a policy-induced 1 percent reduction ininflation. Following Ball (1994), we identify disin-flation episodes as the time range within whichtrend inflation falls substantially and define trendinflation as a centered five-quarter moving averageof the actual inflation rate.29 During the time periodbetween the first quarter of 1987 and the third quar-ter of 2003, we identify in Turkey two disinflationepisodes. The first episode starts at the fourth quar-ter of 1994 and ends during the fourth quarter of1996. The second episode starts at the first quarterof 1998 and ends during the first quarter of 2001.The trend inflation rate decreases by 29.62 percentduring the first episode and by 43.05 percent dur-ing the second episode. We assume that output is atits potential level at the start of the disinflationepisode. For potential output and output gap pro-jections, we consider the estimates provided by theTurkish State Planning Organization (SPO).30 Theyhave estimated the potential output using the linearmethod, the Hodrick-Prescott method, and theproduction function method (see State PlanningOrganization 2003). The sacrifice ratio is then cal-culated by the formula
(1.3) SR =[
Z+4∑t=S
(yt − y∗t )
]/(πt − πt−1)
where yt stands for the natural logarithm of realoutput, y∗
t for the natural logarithm of potentialoutput, πt−1 for the trend inflation rate at thebeginning of the episode, πt for the trend inflationrate at the end of the episode, and the disinflationepisode starts at period S and ends at period Z. Thecalculations are presented in table 1.10. In the table,
Macroeconomic Policies for Turkey’s Accession to the EU 21
TABLE 1.10 Estimates of the Sacrifice Ratio
Production LinearEpisode HP Filter Function Method
April 1994–April 1997 0.000 0.000 −0.013April 1994–April 1996 0.005 0.006 −0.003
January 1998–January 2002 −0.001 −0.001 −0.001January 1998–January 2001 0.005 0.005 0.007
Source: The authors.

the first line of each episode denotes the estimate ofthe sacrifice ratio obtained under the assumptionthat output returns to its potential level four quar-ters after the end of an episode, as in Ball (1994). Bycontrast, the second line of each episode denotesthe estimate of the sacrifice ratio obtained underthe assumption that output returns to its potentiallevel right at the end of the episode.
The table reveals that the estimates of the sacri-fice ratio in Turkey are not very much different fromzero,31 which indicates, in turn, that disinflation inTurkey will entail relatively little output cost. Theresult probably stems from the extreme flexibility ofthe Turkish labor market.32 But the output costs ofdisinflation will increase as the Turkish labor mar-ket becomes less flexible.33 Thus it would be advis-able for Turkey to follow the disinflationary policiesas long as the labor market is flexible.
Public Debt and Fiscal Policy
To analyze the issues associated with reducing thedebt-to-GDP ratio from 80.2 percent in 2003 to60 percent over time, we consider the governmentbudget constraint represented by
(1.4) G t − Tt + it Bt−1 + i∗ E t B∗t−1 + FSBt
= (Bt − Bt−1) + E t (B∗t − B∗
t−1)+ Mt − Mt−1 + PRIVt
where G refers to government expenditures exclud-ing the interest payments, T government revenues,B the TL-denominated debt stock of the publicsector, B∗ the FX-denominated debt stock ofthe public sector, i the nominal interest rate onthe TL-denominated government debt, i∗ theinterest rate on the FX-denominated governmentdebt, E the exchange rate, FSB the public expen-diture for the financial sector bailout, M themonetary base, and PRIV privatization revenues.Let Yt = pt, yt be the nominal GDP, p the GDPdeflator, and y real GDP. Denoting the primary-surplus-to-GDP ratio by pst = (Tt − G t )/Yt , theTL-denominated debt-to-GDP ratio by bt =(Bt/Yt), the FX-denominated-debt-to-GDP ratioby b∗
t = (E t B∗t )/Yt , the privatization-revenues-to-
GDP ratio by privt = (PRIVt/Yt), the financial-sector-bailout-to-GDP ratio by fsbt = (FSBt/Yt),the domestic rate of inflation by π, the foreign rateof inflation by π∗, the growth rate of real GDP by g,
the real rate of interest by r, the foreign real interestrate by r ∗, the real exchange rate by q, the rate ofdepreciation of the real exchange rate by η, and thevelocity of money by V, we get the equation deter-mining the time path of the total-debt-to-GDPratio dt = bt + b∗
t :
(1.5) dt = −pst + (1 + r )
(1 + g )bt−1
+ (1 + r ∗)(1 + η)
(1 + g )b∗
t−1
− 1
V
[g + π + πg
(1 + π)(1 + g )
]
−privt + fsbt
The equation shows that debt-to-GDP ratiodecreases with increases in the primary-surplus-to-GDP ratio ps, the growth rate of real GDP g, theprivatization-revenues-to-GDP ratio priv, andthe seigniorage-revenues-to-GDP ratio, defined as1V
[g+π+πg
(1+π)(1+g )
]. By contrast, the debt-to-GDP ratio
increases with increases in the real domestic inter-est rate r, the real foreign interest rate r ∗, the rate ofdepreciation of the real exchange rate η, and thefinancial-sector-bailout-to-GDP ratio fsb.
Over 2000–03, seigniorage and privatizationrevenues were running at about 1.3 and 1.7 percentof GDP, respectively. The crucial parameters deter-mining the time path of the debt-to-GDP ratio turnout to be the primary-surplus-to-GDP ratio, thedomestic and foreign real rates of interest, and therate of real exchange rate depreciation. Turkey iscommitted to the primary surplus target of 6.5 per-cent of GNP over the next few years. In 2004 thedomestic real interest rate was running at about12 percent and the foreign real interest rate at about8 percent (see OECD 2002 and IMF 2004). Finally, itis noteworthy that Turkey, after appreciating thereal exchange rate by 13 percent in 2002, appreci-ated the real exchange rate by a further 23.8 percentin 2003. All these factors have contributed to reduc-ing the debt-to-GDP ratio. But even under thesefavorable circumstances, it will take quite a longtime to reduce the debt-to-GDP ratio from its levelof 80.2 percent in 2003 to 60 percent and below.Here three issues deserve careful analysis.
First, the real appreciation of the exchange ratecontributed substantially to the reduction in the
22 Turkey: Economic Reform and Accession to the European Union

debt-to-GDP ratio during 2002 and 2003. But thispolicy is not sustainable in the long run, becausethe real appreciation of the currency will lead toproblems of sustainability in the current account,as explained later in this chapter in some detail.
Second, EU accession will entail costs for Turkeythat must be identified and financed. These costswill include the social consequences of economicrestructuring, such as those in the agriculture sec-tor, where restructuring presents particular prob-lems for small farmers. The process of adopting theacquis communautaire entails, among other things,comprehensive structural reforms of the publicadministration and the productive sectors, as wellas extensive investment in human resources and theenvironment. From a budgetary perspective, thefiscal costs of EU accession in the other accessioncountries have been estimated to be over 3 percentof GNP annually. Turkey would also face significantfiscal costs—costs that would have to be financedin the context of continuing fiscal adjustment.34
This situation implies either a reduction in theprimary-surplus-to-GDP ratio by the same amountor further increases in the revenues of the publicsector.
Third, to reduce the debt-to-GDP ratio from itslevel of 80.2 percent in 2003 to 60 percent overtime, Turkey, even in the face of the higher costs ofEU accession, must stick to the primary surplus tar-get of at least 6.5 percent of GNP over the next fewyears. Any downward deviation from the target willpostpone achievement of the 60 percent debt-to-GDP ratio. Achievement of the primary surplustarget of at least 6.5 percent of GNP over timerequires that Turkey increase its tax revenue bybroadening its tax base. In this context, Turkeycould introduce, like Russia and Ukraine, a flat taxon income at a relatively low rate. The introductionof such a flat tax at a low rate would improve taxcompliance and efficiency,35 and it would increasethe tax base and thus the tax revenue, as long as thenecessary steps are taken simultaneously to mod-ernize the tax administration and improve taxcompliance.36 Such measures also will help todecrease the share of the informal sector in theeconomy.
Finally, the government’s desire to achieve a pri-mary surplus target of at least 6.5 percent of GNPover the next few years will constrain its use of fis-cal policy for decreasing the unemployment rate in
the economy, which was 9.5 percent during thethird quarter of 2004. That constraint may haveserious political implications, unless the countrytries to broaden its tax base, reduce the tax burdenof economic units in the formal sector, andimprove tax compliance in the country.
Sustainability of Current Account
The basic presumption of our approach is that thecurrent account is sustainable. If not, Turkey couldface an exchange rate collapse or an external debtdefault, which, in turn, would imply a reduction inreal income and employment, deviating from thelong-run growth path. Starting from the notionthat under current account sustainability the coun-try must satisfy its lifetime budget constraint, wecontend that the current policies are sustainable ifcontinuation of the current government policystance and private sector behavior into the futuredoes not entail a drastic policy shift or lead to a cur-rency or balance of payments crisis.
Here we emphasize the points stressed earlier byconsidering the balance of payments relation,which can be written as
(1.6) TB$t − i∗ Dt−1 + FDIt + Dt − Dt−1
−�Rt = 0
where TB$ denotes the noninterest current account(NICA), i∗ the foreign rate of interest, D the stock offoreign debt, FDI the net foreign direct investment, Rthe foreign exchange reserves of the country,and�Rt
the change in reserves. Also, (TB $t − i∗ Dt−1) =
Current Accountt and (FDIt + Dt − Dt−1) = Capi-tal Accountt. All variables are measured in terms offoreign currency. If dt = E t Dt
pt ytis the foreign-debt-
to-GDP ratio, tbt = E t T B$t
pt ytthe noninterest-current-
account-to-GDP ratio, fdit = FDIt Et
pt ytthe FDI-to-
GDP ratio, and �rt = (�Rt )E t
pt ytthe change-in-
reserves-to-GDP ratio, the equation determiningthe time path of dt can be written as
(1.7) dt = −tbt + (1 + r ∗)(1 + η)
1 + gdt−1
− fdit + �rt
where r ∗ denotes the foreign real rate of interestand η the rate of depreciation of the RER. Theequation reveals that the external-debt-to-GDPratio decreases with increases in the noninterest-current-account-to-GDP ratio tb, the FDI-to-GDP
Macroeconomic Policies for Turkey’s Accession to the EU 23

ratio fdi, and the growth rate of GDP g. By contrast,the debt-to-GDP ratio increases with increases inthe foreign real interest rate r ∗, rate of depreciationof the RER η, and changes in the reserves-to-GDPratio �r .
Following the approach of von Hagen andHarden (1994), we solve this expression forward forn periods and obtain
(1.8) dt = �t δt,n dt+n + �t
n∑i=1
δt, i At+i
where
δt,k
k∏i=1
1 + gi
(1 + r ∗i )(1 + ηi )
and
At = tbt + fdit − �rr .
Here, δt,k can be interpreted as the “k-periodsahead” discount factor used to calculate the presentvalue of assets and liabilities in period t + k forperiod t. �t xt+k denotes the period t expectation ofthe variable x in period t + k. The equation showsthat current-debt-to-GDP ratio equals the expecteddiscounted present value of foreign debt outstand-ing in period t + n relative to GDP, plus the sum ofall discounted At’s between period t and periodt + n. Theoretically, the intertemporal budgetconstraint requires that lim �t δt,n dt+n ≤ 0 as nbecomes very large, so that foreign debt remainsbounded relative to GDP. If the intertemporalbudget constraint were violated, private investorswould realize that the government’s liabilitieswould eventually exceed its revenue-raising capa-bilities. As a result, the price of the debt of thecountry would fall to zero, and the country wouldsee itself barred from international capital markets.
To translate the intertemporal budget constraintinto a practically more relevant requirement, weconsider the above relation for a limited period oftime n∗ and add the condition that the discounted-debt-to-GDP ratio at the end of period t + n∗
should not exceed the debt-to-GDP ratio at time t.We use actual data on dt, tbt , and fdit for any yearduring the time period 1984–2003. For each year tof the time period, we estimate the expected dis-counted present value at time t of foreign debt out-standing in period t + n∗ relative to GDP, plus thesum of all discounted At’s between period t andperiod t + n∗. As for the government policy stanceand the private sector behavior over the period t to
t + n∗, we assume that the values of tbt+i and fdit+i
for i = 1, . . . , n∗ will remain unchanged at theirinitial values of tbt and fdit. Thus we assume thatthe government, private sector, and rest of theworld will not change the policies they pursue inperiod t over the time period t + 1 and t + n∗.
A look at Turkey’s annual GDP growth rate overthe period 1980–2003 reveals that the average growthrate of GDP amounted to 4.1 percent during1980–1989 and to 3.7 percent during 1990–2003.Thus for the growth rate of GDP over the time periodt to t + n∗ we take the figure of 4 percent. By con-trast, the foreign real interest rate is to equal 8 per-cent. Finally, we assume in the following calculationsthat �r = 0 for each year of the period t to t + n∗
and that over the same period η equals zero.Following the approach of von Hagen and Harden
(1994), the current account is not sustainable if
(1.9) S(n∗) = dt − �t δt,n dt+n
= �t
n∑i=1
δt, i At+i < 0 .
This is a rather mild sustainability condition. Heredt denotes the actual debt-to-GDP ratio in period t,and At+i = (tbt + fdit) for i = 1, . . . , n∗ . Theresult of the calculations for n∗ = 10, n∗ = 20, andn∗ = 25 are shown in table 1.11.
The table reveals that during 1993 the currentaccount was unsustainable in the sense that the actualdebt-to-GDP ratio in 1993 fell short of the expecteddiscounted present value of foreign debt outstandingin period 2003 relative to GDP by 14.03 percent whenn∗ = 10 and that the actual debt-to-GDP ratio in1993 fell short of the expected discounted presentvalue of foreign debt outstanding in period 2018 rel-ative to GDP by 27.26 percent when n∗ = 25. Thisfinding indicates that the current account neededadjustment in the NICA-to-GDP and FDI-to-GDPratios. During 1994, Turkey increased the NICA-to-GDP ratio considerably, but there was not muchchange in the FDI-to-GDP ratio. The table indicatesthat the policy was successful; the sustainabilitymeasure was positive thereafter. The warning signalsfor the 2001 currency crisis were evident in the nega-tive figures of the sustainability measure for the year2000. The situation improved after the crisis, whenthe sustainability measure increased and becamepositive at the end of 2001. Although the currentaccount was sustainable in 2001 and 2002, the systemwas not sustainable again in 2003.
24 Turkey: Economic Reform and Accession to the European Union

A look at the sustainability measure for 2003 withn∗ = 25 reveals that the actual-debt-to-GDP ratioin 2003 fell short of the expected discounted presentvalue of foreign debt outstanding in the period 2028by 17.07 percent. The system is not sustainable. Thesustainability of the current account requires thatthe value of the sustainability measure be increasedso that it becomes positive. This goal can be achievedeither through an increase in the NICA-to-GDPratio tbt or through an increase in the FDI-to-GDPratio fdit during each year of the period 2004–28 orthrough a combination of increases in both theNICA-to-GDP and FDI-to-GDP ratios during thesame time period. During 2003, the actual value ofAt = (tbt + fdit) was −1.08 percent. For Turkey toachieve the minimal condition for external sustain-ability, the value of At during each time period of theinterval 2004–29 would have to be 0 percent. ThusTurkey has to increase the sum of its noninterest-current-account-to-GDP ratio and its FDI-to-GDPratio during each period of the interval 2004–29 byat least 1.08 percent. Supposing that fdit during thetime period 2004–28 remains constant at its 2003
level of 0.03 percent, we next turn to the study ofthe determinants of noninterest-current-account-to-GDP ratio.37
Using quarterly data from 1988 (first quarter) to2003 (second quarter) we note that one of the maindeterminants of this ratio is the RER. A second fac-tor that strongly affects the NICA-to-GDP ratio isthe aggregate demand for domestic goods and serv-ices, consisting of total consumption plus invest-ment demand in the home country as well as therest of the world. As the aggregate domesticdemand for goods and services in the home coun-try increases, it triggers imports, and, other thingsbeing equal, the NICA-to-GDP ratio is expected todecline. Similarly, as aggregate domestic demandfor goods and services increases in the rest of theworld, it triggers imports of the foreign country,and, other things being equal, the NICA-to-GDPratio in the home country is expected to increase.
To explain the developments in the NICA, thefollowing equation is estimated:
(1.10) (NICA/GDP)
= β0 + β1 d log(ADD)
+ β2 d log(ADDF) + β3 RER + β4DQ3
+ β5 D1999 + β6 D93ST + β7 D2000
where d log(ADD) denotes the annual growth rateof real aggregate domestic demand in the homecountry; d log(ADDF) the annual growth rate of realaggregate domestic demand in the rest of the world;DQ3 the third-quarter seasonal dummy; D1999 therecession and earthquake dummy for the year 1999,taking the value of 1 for the second, third, and fourthquarters of 1999 and 0 otherwise; D93ST the struc-tural break dummy in 1993, taking the value of 1after 1993 and 0 otherwise; and D2000 the exchangerate–based stabilization measures, taking the valueof 1 for all quarters of 2000 and 0 otherwise. TheD93ST dummy refers to the structural break inTurkey’s balance of payments that took place afterthe liberalization of the capital account in 1990.Because economic agents respond with lag to suchdecisions, a series of tests were conducted to identifythe structural break resulting from this decision. Allof the variables used in the estimation were checkedfor unit roots, and it was learned that the series areall stationary. Because of the simultaneity problemsfaced in the model, we use instrumental variabletechniques to estimate the parameters.38 The resultsof the estimation are presented in table 1.12.
Macroeconomic Policies for Turkey’s Accession to the EU 25
TABLE 1.11 Current Account SustainabilityMeasures, 1984–2003(values of S (n*), percent)
10 Years 20 Years 25 Years
1984 1.55 2.61 3.001985 6.53 11.01 12.691986 4.85 8.18 9.431987 12.30 20.73 23.891988 39.31 66.27 76.381989 29.16 49.15 56.651990 2.20 3.71 4.281991 19.12 32.23 37.151992 11.54 19.46 22.431993 −14.03 −23.65 −27.261994 36.46 61.45 70.831995 3.00 5.06 5.831996 1.74 2.93 3.381997 3.06 5.16 5.951998 21.57 36.37 41.911999 9.89 16.67 19.212000 −25.41 −42.83 −49.362001 58.32 98.31 113.312002 12.70 21.40 24.672003 −8.79 −14.81 −17.07
Source: The authors.

26 Turkey: Economic Reform and Accession to the European Union
TABLE 1.12 Results for Quarterly Instrumental Variable Regressionof Ratio of Noninerest Current Account (NICA) to GDP
Variable Coefficient t-Statistic
C −2.56863 −1.41186d log (aggregate domestic demand, home country) −29.89038 −12.12362d log (aggregate domestic demand, foreign country) 38.84045 1.95129Real exchange rate 0.03719 1.97118DQ3 1.84541 4.52182D1999 −3.82977 −4.34096D93ST −0.91545 −2.34142D2000 −2.72463 −3.18816
R-squared 0.82106Adjusted R-squared 0.79787Durbin-Watson statistic 2.14602
Source: The authors.
The coefficients of the variables are all statisti-cally significant, and all have the expected signs. Anincrease in the growth rate of aggregate domesticdemand in the home country reduces the NICA-to-GDP ratio; an increase in the growth rate of aggre-gate domestic demand in the rest of the worldincreases that ratio. The ratio increases as the RERdepreciates. The coefficient of the structural changedummy is negative, which indicates that liberaliza-tion of the capital account had a negative impact onthe NICA-to-GDP ratio, as expected.
The above considerations reveal that the NICA-to-GDP ratio can be increased by decreasing aggre-gate demand for domestic goods and services and/orby depreciating the RER. Decreasing the aggregatedemand for goods and services requires that thecountry aims for a more ambitious fiscal objectivethan the constant primary surplus of 6.5 percent ofGDP. But this will be very painful after so manyfailed stabilization attempts. The alternative is todepreciate the RER and keep the RER at its “long-run equilibrium level” over time.39
To determine the extent of depreciation in theRER,we consider the regression equation reported intable 1-12. But, this equation yields rather high levelsof required rates of depreciation of the RER for alter-native specifications of the sustainability condition.We therefore consider a different approach in orderto determine the extent of the required rate of depre-ciation of the RER for achieving current account sus-tainability. We consider the elasticity of the ratio ofnoninterest-current account-to-GDP with respect to
the RER, θ =(
d NICA/GDPd RER
RERNICA/GDP
). Then starting
from initial trade balance we derive that
θ = (ηim + ηexp − 1),
where ηim and ηexp denote the import and exportelasticities with respect to the RER. Estimates basedon estimated Turkish import and export functionsrange quite widely. Here we consider the estimatesof Tansel and Togan (1987) who determine theexport price elasticity as 0.933 and import priceelasticity as 0.472. Thus, θ = 0.405. Considering theratio of exports to GDP of 19.6 percent, the param-eter values imply that a reduction of the ratio ofnoninterest-current account-to-GDP of 1 percentrequires a depreciation of the RER by 12.6 percent.Thus sustainability of the current account follow-ing the approach of von Hagen and Harden (1994)requires that the RER at the end of 2003 be depreci-ated by 13.6 percent.
An alternative specification of the sustainabilitycondition requires that the ratio of the stock of for-eign liabilities to GDP stay constant over time at itsinitial value in time period 2003. In that case, theequation determining the time path of the debt-to-GDP ratio d can be solved for the equilibrium valueof the sum of tb and fdi, under the assumption that�r = 0, as
(1.11) (tb + fdi) = −[
(g − r ∗ − η − r ∗η)
(1 + g )
]d
Assuming that η equals 0 and setting the values ofg = 0.04, r ∗ = 0.08, and d = 0.612 of the year

2003, the equilibrium value of (tb + fdi) is deter-mined to be 2.354 percent. Because in 2003 theactual value of (tbt + fdit) equaled −1.08 percent,Turkey must increase the sum of its noninterest-current-account-to-GDP and FDI-to-GDP ratiosover time by 3.4 percent. Suppose again that fdit
over time stays constant at its 2003 level of 0.03 per-cent. Then the increase in tbt, and thus in At overtime, can be achieved by depreciating the RER byabout 42.8 percent and maintaining it at about thatlevel over time.
Finally, following the suggestion of Reinhart,Rogoff, and Savastano (2003), we consider cases inwhich the country tries to decrease its ratio of stockof foreign liabilities to GDP from its initial value of0.612 to 0.5 and 0.4 over a period of 10 years. Inthose cases, Turkey has to increase the sum of itsnoninterest-current-account-to-GDP ratio and itsFDI-to-GDP ratio over time by 4.3 and 5.2 percent,respectively. This change, under the assumptionthat fdit over time stays constant at its 2003 level,requires that the RER be depreciated by 54.2 per-cent and 65.5 percent, respectively.
Consider now the issue of increasing the FDI-to-GDP ratio. A striking feature of foreign directinvestment flows to Turkey is that the level is toolow compared with that of FDI flows to developingcountries with similar levels of GDP per capita. Inparticular, the FDI flows to Central and EasternEuropean countries are much larger than those toTurkey. However, in terms of population, Turkey’sis larger than that of Poland, the Czech Republic,and Hungary combined. In terms of GDP, Turkey’seconomy is four times larger than that of the CzechRepublic or Hungary, and one-quarter larger thanthat of Poland in 2000. In terms of gross fixed capitalformation, Turkey’s investments during 2000 werethree to four times larger than those of the CzechRepublic and Hungary and roughly a sixth largerthan those of Poland. In terms of average annualinflows of FDI during the 1990s, Turkey attractedinflows valued at US$800 million, which is roughlyone-fifth of the US$4.1 billion in FDI inflows toPoland and significantly lower than the inflows tothe Czech Republic and Hungary, each of whichattracted about US$2.1 billion per year.
An explanation of the factors determining theFDI flows must begin with a definition of theinvestment climate in the country. It is the policy,institutional, and behavioral environment, present
and expected, that influences the perceived returnsand risks associated with investment in terms ofboth quantity and productivity of investmentflows. Investment climate thus defined depends ona wide array of factors that can be grouped underthe headings of (1) macroeconomic and trade poli-cies, (2) infrastructure, and (3) governance andinstitutions.
Although Turkey had an open trade regime overthe past two decades, it was unable to attract largeFDI inflows. One of the main culprits behind thisfailure was the uncertain macroeconomic environ-ment, which, along with the uncertainties stem-ming from domestic politics and the ensuing highreal interest rates, produced a very erratic growthperformance. Throughout the past two decades,Turkey put on hold many decisions that could helpforeign investors cope with high inflation. One ofthe critical measures that Turkey did not introducewas the inflation accounting framework in thecontext of the highly inflationary environment.Infrastructure-related factors were at play as well.Although the quantity and quality of Turkey’sbroadly defined infrastructure—including its geo-graphic and demographic endowments and itsphysical and financial infrastructure—help to posi-tion Turkey as a potentially powerful magnet forFDI inflows, these factors were ineffective inTurkey’s effort to increase those flows. The mainbottlenecks, as emphasized by Dutz, Us, and Yılmazin chapter 10 of this volume, seem to have beeninsufficient respect for the rule of law and weakcompetition in local markets, reinforced by anuneven application of bureaucratic red tape.To attract higher levels of FDI flows in the future,Turkey must therefore not only improve its macro-economic environment, but also increase respectfor the rule of law, increase competition in localmarkets, and reduce the bureaucratic red tape.
Once Turkey is able to attract higher levels ofFDI into the country, it does not need to depreciateits RER by as much as before in order to attain sus-tainability in its current account. With increases inthe FDI-to-GDP ratios, the calculated requiredrates of depreciation of the RER decreases. Whenthe net FDI-to-GDP ratio increases by 1.08 percentto 1.11 percent of GDP while the non-interest-current-account-to-GDP ratio stays constant at its2003 value of −1.11 percent, then the systembecomes sustainable under the approach of von
Macroeconomic Policies for Turkey’s Accession to the EU 27

Hagen and Harden (1994) with no change in theRER. For increases in net FDI-to-GDP ratio below1.08 percent, the required rate of depreciation ofthe RER will be positive but less than 13.6 percent.In the second case when sustainability requires thatdebt-to-GDP ratio stays constant over time thesystem becomes sustainable with no change in RERwhen the net FDI-to-GDP ratio increases by 3.4 per-cent while the non-interest-current-account-to-GDP ratio stays again at its 2003 value of −1.11 per-cent. In this case for increases in net FDI-to-GDPratio below 3.4 percent, the required rate of depre-ciation of the RER will again be positive but lessthan 42.8 percent. Finally, under the third approachwhen sustainability requires that debt-to-GDPratio decreases over a period of 10 years from itsinitial value of 0.612 to 0.4, the system becomessustainable with no change in RER when the netFDI-to-GDP ratio increases by 5.2 percent while thenon-interest-current-account-to-GDP ratio stays atits 2003 value of −1.11 percent. For increases in netFDI-to-GDP ratio below 5.2 percent, the requiredrate of depreciation of the RER again be positive butless than 65.5 percent.
Employment and Growth
As emphasized earlier in this chapter, the unem-ployment rate in 2003 was high in Turkey. Theemployment challenge facing the country is to cre-ate jobs for those unemployed, to create new jobsfor those entering the labor force for the first timeat an average rate of 900 thousand persons per year,and to increase the labor force participation ratefrom its low level of 48.3 percent.
To solve the unemployment problem over time,Turkey has to preserve the flexibility of the labormarket and achieve a relatively high but sustainablegrowth rate of GDP over the next decades. Turkeycan no longer sustain the flexibility of the labormarket through the lax enforcement of laws on tax-ation and social security, because such enforcementtends to create different problems for Turkish soci-ety.40 Instead, the country has to attack the root ofthe problem, which is the large wedge betweenlabor costs and workers’ disposable income becauseof the high labor taxes. Such a high tax wedge raiseslabor costs, discourages work in the formal econ-omy, and contributes to high nonemployment inthe working-age population. The challenge facingTurkey is to reduce the high labor taxes without
increasing the fiscal deficits. The country has tointroduce tax reforms that will aim to lower thepersonal income and social security taxes, whilebroadening the tax base through, for example, theintroduction of a relatively low flat tax and simulta-neously modernizing the tax administration.
Achieving a relatively high but sustainablegrowth rate of GDP is also a challenge for Turkey.According to a recent study by Togan (2003), theproblem can be analyzed in terms of the growth ofproductivity and the growth of employment.41
Noting that Turkey achieved annual productivitygrowth of 3.12 percent over the period 1950–99,Togan emphasizes that the percentage contributionof the three sources of growth to productivitygrowth were (1) 38.1 percent from growth in theamount of capital per worker in the economy (cap-ital deepening), (2) 25.15 percent from improve-ments in labor quality, and (3) 36.75 percent fromtotal factor productivity (TFP) growth.42 Thus ifTurkey wants to achieve higher growth rates ofGDP than the 3.6 percent a year achieved over theperiod 1990–2002, it has to increase, on the onehand, the productivity growth rate—through capi-tal deepening, improvements in labor quality, andincreases in the growth rate of the TFP—and, onthe other hand, the growth rate of employment.43
Togan (2003) points out that Turkey, to increasethe amount of capital per worker, has to increasenot only its investment ratio but also its domesticsavings rate, because too much reliance on foreignsavings over considerably long periods of time maylead to problems of solvency and sustainability ofthe current account. In addition, Turkey has toincrease its investment in human capital formation.It must increase not only the proportion of theadult population with primary, secondary, andhigher education, but also the quality of educationat each of these levels. Turkey also must increaseTFP growth. Because the sources of TFP growth arebetter technology, better organization, specializa-tion, and innovations on the shop floor, Turkey hasto increase the channels of acquiring knowledge,as well as the competitive pressure in the economiesunder consideration. Besides creating the knowl-edge itself through strict enforcement of intel-lectual property rights, Turkey can adopt theknowledge created by others, mainly through inter-national trade, FDI, and licensing. Finally, variouseconomists have shown that trade liberalizationaffects productivity change positively.44 TFP
28 Turkey: Economic Reform and Accession to the European Union

Macroeconomic Policies for Turkey’s Accession to the EU 29
growth also depends on the macroeconomic poli-cies followed.
To elaborate statistically the relationship betweenthe TFP and trade and macroeconomic policies, wefollow the approach of Burnside and Dollar (2000)in which
(1.12) TFP = α0 + α1 INFLATION
+ α2 OPEN
+ α3 BUDGET SURPLUS
where INFLATION refers to the rate of inflationmeasured by the GDP deflator, OPEN to the tradeindicator, and BUDGET SURPLUS to the ratio ofbudget surplus to GDP. In the equation, the secondterm indicates the effect of instability in macropolicies. It is hypothesized that instability inmacroeconomic policies negatively influences theTFP and that its coefficient should therefore benegative. The third term refers to trade policiesmeasured by the ratio of exports and imports toGDP. The coefficient would be positive if trade lib-eralization contributes to increases in the TFP.Finally, it is hypothesized that a budget surplus pos-itively influences the TFP. Insolvent debt pathscharacterized by large budget deficits will requiremonetization of debts and thus inflation, leading toinstability in the economy. Uncertainty from insta-bility reduces both the willingness and the capabil-ity of economic units to take a long-term viewtoward increasing efficiency, which eventuallydecreases the TFP. Furthermore, falling budgetdeficits will lead to greater private use of privatesavings, leading to increases in the TFP.
Based on annual data for 1951–99, the estima-tion yields
(1.13) TFP = 0.593 − 0.0713 INFLATION(0.477) (–2.741)
+ 0.2454 OPEN(2.693)
+ 0.6832 BUDGET SURPLUS(1.996)
n = 49 (1951–99); R2 = 0.311; DW = 2.2686.
The variables have the expected signs. Instability inmacroeconomic policies proxied by the inflationrate negatively influences the TFP. Yet trade liberal-ization and budget surplus positively affect the TFP.
The factors just mentioned determine produc-tivity and its growth rate, which, in turn, influencethe growth rate of GDP. However, for a given level
of productivity growth, GDP growth depends posi-tively on the growth rate of employment, and thelevel of employment in the economy is determinedlargely by the flexibility in labor markets. Increasesin labor market flexibility increase employmentand reduce the unemployment rate in the econ-omy. Thus, GDP increases until labor is fullyemployed with increases in labor market flexibility.
In summary, to increase the growth rate of itsGDP, Turkey must (1) increase not only its invest-ment ratio but also its domestic savings rate,(2) increase its investment in human capital forma-tion, (3) follow outward-oriented and prudentmacroeconomic policies, and (4) increase the flexi-bility in the labor market. The pursuit of thesepolicies, however, should not jeopardize the sus-tainability of fiscal policy or the sustainability ofthe current account.
Exchange Rate Policy
As for an appropriate exchange rate regime, theMaastricht criteria do put restrictions on the per-missible exchange rate regime after accession.Floating within a band or target zone measuring nomore than 15 percent from a euro central rate, withintervention at or within margins of the band, ispermissible. Even without adopting a formal targetzone, the country could manage to maintain itsexchange rate within 15 percent of some eurocentral rate. Definitely permissible under theMaastricht exchange rate criterion are a conven-tional fixed exchange rate regime and a currencyboard with the euro. Furthermore, any of the previ-ous regimes could be combined with the adoptionof the euro as a parallel currency. Under such ascheme, the euro would be joint legal tender withthe domestic currency. However, full, unilateraleuroization, with the abolition of the domestic cur-rency, is not compatible with the Maastricht criteriafor joining the EMU. The argument is that, oncethe domestic currency has been abolished, theCouncil of Ministers can no longer determinethe conversion rate at which the candidate EMUmember’s currency eventually joins the EMU.
Before we turn to the question of what theexchange rate arrangement for Turkey ought to beduring the preaccession period, a quick glanceat current practice by the 10 new members andcandidate countries is useful. Table 1.9 character-izes the current exchange rate regime of each of

these countries. Among the 10 CEE countries,Bulgaria, Estonia and Lithuania have currencyboards with respect to the euro; Latvia has a fixedexchange rate regime with a peg against the specialdrawing rights (SDR); Hungary has a target zonewith a central rate fixed against the euro and a 15 per-cent fluctuation band on either side; the CzechRepublic, Slovakia, Slovenia, and Romania havemanaged float; Poland has floating currency.
The countries under consideration had optedduring the early 1990s for different exchange rateregimes. Although most of them chose some kindof fixed exchange rate arrangements, others such asSlovenia opted for more flexible solutions. Sincethen, most of these countries have moved towardmore flexible exchange rate arrangments. Forexample, Poland now has fully flexible exchangerates. Meanwhile, in all of these countries exceptRomania inflation is under control, and as of 2003five countries satisfied the Maastricht condition oninflation (the Czech Republic, Estonia, Lithuania,Poland, and Bulgaria). All of these countries areinterested in adopting the euro as early as possible.According to Nuti (2002), the benefits of earlyadoption of the euro include greater exchange ratecertainty, greater policy credibility, lower transac-tion costs, lower interest rates, greater macroeco-nomic stability, and greater economic integrationthrough both trade and investment. The costs ofeuroization are loss of seigniorage, loss of a lenderof last resort, and, more generally, loss of monetarypolicy.
According to the optimum currency area litera-ture of Mundell (1961) and McKinnon (1963), thecosts will exceed the benefits of joining the cur-rency area as long as the country exhibits a highdegree of nominal rigidity in domestic prices andcosts, a relatively large size in terms of GDP and lowdegree of openness to trade in real goods and serv-ices, a high incidence of asymmetric (nation-specific) shocks as opposed to symmetric shocks,a less diversified structure of production anddemand, a low degree of real factor mobility acrossnational boundaries, and an absence of significantinternational (and supranational) fiscal tax transfermechanisms. Consider the case of asymmetricshocks and assume that the monetary policy of theEurosystem does not take into account the businesscycle in the accession country. Also assume thata shock calls for depreciation of the accessioncountry’s real exchange rate. Under these assump-
tions, the Eurosystem’s monetary policy will notchange, and real depreciation will call for a lowerprice level in the accession country. Thus if pricesand wages are downward inflexible in the accessioncountry, higher unemployment or capacity utiliza-tion may result—a situation that might be avoidedif the accession country conducted its own mone-tary policy and devalued it currency in nominalterms. Yet as long as the accession country conductsa large share of its trade with countries in the EuroArea, the likelihood of the country being hit hardby an external shock originating from a country orregion outside the EU is rather small. A high degreeof real factor mobility can be an effective substitutefor nominal exchange rate adjustments in the faceof sysmmetric shocks. Real factors, whose mobilitymatters, are labor and physical capital. Finally, theexistence of international (and supranational) fis-cal tax transfer mechanisms with serious redistrib-utive powers spanning the member countries of thecurrency area will ensure compensation of the lossof the exchange rate instrument if the accessioncountry were to give up monetary autonomy.
The optimum currency area literature empha-sizes that during the period in which the conditionsjust stated are not satisfied, it is advisable for theaccession country to adopt a flexible exchange rateregime. Clearly, any individual CEE country shouldhave doubts about the net advantage of giving upnational monetary independence. The migration ofworkers is not free, and all the candidate countriesare relatively small compared with the Euro Area,with the exception of Poland and Romania, and thenonly in terms of population. The candidate countriesare all very open to the EU, and the diversification ofexports to the EU is growing. As for the instrumentsto absorb asymmetric shocks in the absence of inde-pendent monetary and exchange rate policies, thepicture for the CEEs does not look worse than thatfor the existing EMU members.45 Maurel (2002)notes that one cannot assess ex ante the optimal cur-rency area criteria, because the mere fact of enteringa monetary union also influences the way in whichthose criteria are satisfied. Corricelli (2002) empha-sizes that the 10 candidate countries would incur rel-atively small losses from asymmetric shocks and thatthe CEE countries do qualify to join the EMU.
Buiter and Grafe (2002) point out that only twoexchange rate regimes are sustainable in the longrun. These are the free-floating exchange rate and asymmetric monetary union, which is defined to be
30 Turkey: Economic Reform and Accession to the European Union

a monetary union with a monetary authority thatsatisfies the following conditions: (1) its mandatespans the entire monetary union, (2) it acts aslender of last resort on the same terms in everyunion member state, (3) seigniorage is shared fairlyamong all union member states, and (4) it isaccountable to the legitimate political representa-tives of the citizens of the whole union. To join amonetary union with a fixed exchange rate, a coun-try must resolve its fiscal problems, attain price sta-bility, achieve a sound banking sector, and ensureits current account is sustainable. Until these condi-tions are satisfied, Turkey should avoid adoptinga fixed exchange rate regime. Currency boardarrangements and euroization should not be alter-natives for Turkey.46 Because participation in theEMU is a must for Turkey, it will ultimately be partof a symmetric monetary union.47 But during theperiod before accession, Turkey could pursue anexchange rate policy with central bank interven-tions aimed at attaining the long-run equilibriumvalue of the RER. In the terminology of the IMF’s“Exchange Arrangements and Exchange Restric-tions Annual Report,” we thus refer to “CrawlingBand” with a +/− 10 percent width.48 The countrycould pursue this policy until it resolves its fiscalproblems, attains price stability, and achieves soundbanking sector and sustainability in the currentaccount.
Conclusion
The criteria for accession to the EMU include a ceil-ing for the permissable rate of inflation one yearprior to accession and a constraint on the permit-ted variations of the nominal exchange rate—membership in the ERM for a two-year period priorto accession while observing the normal fluctuationlimits of the ERM. This constraint means thatTurkey would be free to choose the exchange rateregime until accession. During this period, the riskof speculative attacks on the Turkish currency will beunavoidable, unless Turkey establishes a sound fiscalframework, achieves a sound banking sector, andensures that its real exchange rate equals its long-runequilibrium level. In addition, Turkey should pursuea policy of maintaining the real exchange rate ataround its long-run equilibrium level. By contrast, alook at fiscal issues reveals that Turkey, to reduce itsdebt-to-GDP ratio from its 2003 level of 80.2 per-cent to 60 percent over time, must stick to the
primary surplus target of at least 6.5 percent of GNP,even in the face of the increased costs of EU acces-sion for a considerable period of time. Any down-ward deviation from the target will postponeachievement of the 60 percent debt-to-GDP ratio.The primary surplus target of at least 6.5 should beachieved within the context of a fiscal reform thatwill broaden the tax base by reducing the tax burdensubstantially on both labor and capital.
Notes
1. The authors thank Juergen von Hagen and seminar partic-ipants at the Center for European Integration Studies (ZEI) inBonn for their useful comments. They are particularly in debt toanonymous referees, whose comments helped them to correctseveral errors in an earlier draft. Sübidey Togan thanks ZEI forits hospitality and the Alexander von Humboldt Stiftung forfinancial support while this paper was written.
2. The value of the correlation coefficient between themonthly series of annual CPI inflation and the monthly series ofthe annual growth rate of base money is 0.7572, and thatbetween the monthly series of annual CPI inflation and themonthly series of the annual rate of change in the exchange rateis 0.7698.
3. See, for example, Metin (1995, 1998), Lim and Papi(1997), and Kibritçioglu (2002).
4. The output gap, which has been found to be stationary,and the dummy variable have been included in the Johansencointegration test as exogenous variables.
5. Anyone constructing real exchange rate indices is facedwith choosing the price index, the currency basket, weights, anda mathematical formula. In formulating the RER, we use theCPI, because these data are available on a monthly basis for alarge number of countries. For the currency basket, we considercountries that are major competitors of Turkey in world mar-kets, as well as major suppliers of imported commodities toTurkey. These countries are the following: Western Europe:Belgium, France, Germany, Greece, Italy, the Netherlands,Portugal, Spain, Switzerland, and the United Kingdom; America:Brazil, Canada, Mexico, and the United States; Middle East andNorth Africa: Egypt, Iran, Syria, Tunisia; Central and EasternEuropean and Commonwealth of Independent States countries:Czech Republic, Hungary, Poland, Russia; Asia: China,Indonesia, Japan, Republic of Korea, Malaysia, Taiwan (China),Thailand. To determine the weights of different countries, weuse the approach developed by Zanello and Desruelle (1997), inwhich overall trade weights are derived by combining thebilateral import weights with the double export weights, usingthe relative size of Turkish imports and exports in overallTurkish trade to average both sets of weights. In formal terms,the import weight can be expressed as wm
i = (Mi /M), theexport weight as
wxi =
(Xi
X
) yi
yi +∑
h
Xih
+∑k �=i
(Xk
i
X
) Xk
i
yk +∑
h
Xkh
Macroeconomic Policies for Turkey’s Accession to the EU 31

and the overall weight as
wi =(
M
X + M
)wm
i +(
X
X + M
)wx
i
where Mi denotes Turkish imports from country i, M the totalvalue of Turkish imports, Xi Turkish exports to country i, X thetotal value of Turkish exports, yi the value of domestic manufac-turing production for the home market of country i, and Xk
iexports of country k to country i. The formula used to estimatethe RER is
RER =∏[
CPIi /E i
CPI/E
]wi
where ∏
stands for the product sign, i for the index that runsover the country’s trade partners, Ei for the exchange ratedefined as domestic currency per unit of U.S. dollar of country i,E for the Turkish lira/U.S. dollar exchange rate, and wi for thecompetitiveness weight attached by Turkey to country i, calcu-lated using the method of Zanello and Desruelle (1997).
6. Turkey opened the capital account in 1989 before it hadtaken measures to upgrade banking and financial market super-vision and regulation, adopt international auditing andaccounting standards, strengthen corporate governance andshareholder rights, and modernize bankruptcy and insolvencyprocedures. The 1994 and 2001 crises occurred while the coun-try was facing large fiscal deficits, public debts, and high infla-tion rates. Problems of competitiveness led to substantial cur-rent account deficits. In addition, the currency and maturitymismatches on the balance sheets of the banks had left theauthorities with little leeway for using either interest rate orexchange rate adjustments to restore balance without under-mining the stability of the banking sector. Finally, there was anexcessive dependence on short-term foreign borrowing tofinance the current account deficits. These weaknesses con-tributed substantially to the balance of payments crisis of 1994and 2001.
7. Let p∗ E/p be the RER where p∗ denotes the gross domes-tic product (GDP) deflator in the foreign country, E theexchange rate, and p the GDP deflator in the home country, andlet py = wL + rK be the nominal GDP where y stands for realGDP, w the nominal wage rate, L total employment, r the returnon capital, and K the stock of capital. Expressing the capitalincome in this equation as rK = λ (wL), where λ stands for theprofit margin, the RER can be written as
E p∗
p=
(y/
L
)E w∗(1 + λ∗)(
y∗/
L∗
)(1 + λ)w -
where (y/L) denotes labor productivity in the home country,(y∗/L∗) labor productivity in the foreign country, λ∗ the profitrate in the foreign country, and w∗ the wage rate in the foreigncountry. Thus for given values of productivities and profit ratesin the two countries, depreciation of the RER leads to a decreasein wages measured in foreign currency (w/E).
8. The severity of the 2001 crisis when compared with theeffect of the previous foreign exchange crisis is explained by thefact that by 2001 Turkey had a high level of “liability dollarization,”with high public and private foreign debt denominated in foreigncurrencies, and a high share of foreign currency–denominatedbank deposits. The sharp depreciation caused a large increase inboth the gross and the net indebtedness of the economy, whichmore than offset the positive effect of depreciation on the demandfor exports.
9. In addition to the size of the current account deficits, thequality of the sources of financing the deficit is important. Ahigh percentage of short-term debt increases the probability thatsudden capital outflows will lead to a crisis. It is recognized thatforeign direct investment (FDI) is by far the surest form of exter-nal financing. But FDI flows into Turkey have been rather low.Thus external sustainability is an important issue for Turkey.
10. Real interest rate is defined as
r1 =
1 +(
it100
)1 + (
πt100
) − 1
∗ 100
where it denotes the annual rate of interest on governmentbonds and treasury bills, attained as the weighted average rate inauctions during the month t weighted by total sales during themonth, and πt denotes the expected annual rate of inflation attime t over the period t to t + 12. In the calculations of the realinterest rate, we set the expected annual rate of inflation at timet over the period t to t + 12 equal to the actual annual rate ofinflation over the period t to t + 12. The average level of realinterest rates over the period February 1994 to October 2003 was25.5 percent.
11. Net debt figures are from IMF (2004), measured in per-cent of centered GNP, defined as the sum of quarterly GNP inthe last two quarters of the year and in the first two quarters ofthe following year, in line with the IMF definition.
12. Consideration of total tax revenues, including socialsecurity contributions, reveals that total tax receipts in Turkeyamounted in 1999 to 31.3 percent of GDP, compared with gen-eral government receipts of 40.7 percent in EU countries.According to Noord and Heady (2001), the unweighted averageof total tax revenue as a percent of GDP in the EU is 42.1 per-cent, and the GDP weighted average is 40.7 percent.
13. Other factors contributing to the country’s relativelylow unemployment rate are labor migration from the countryand the achievement of relatively high growth rates of GDPover time.
14. Various methods can be used to estimate the size of theinformal sector in the labor market.
Castells and Portes (1989) define informal employment asthe sum of unpaid family workers, domestic servants, and theself-employed, minus professionals and technicians.
An alternative approach to determining the size of the infor-mal sector considers the coverage of workers by social securityinstitutions (Assaad 1997). Workers are divided into two groups:those who are covered by a social security program and thosewho are not. The covered workers are considered to be part ofthe formal sector and uncovered workers to be part of the infor-mal sector.
A third approach to determining the size of the informal sec-tor is provided by Bulutay (1999). He considers the data pro-vided by Turkish Household Labour Force Survey Results on“employed persons by size of workplace and status in employ-ment.” As he defines the informal sector, it consists of (1) theself-employed, (2) unpaid family workers, (3) employers whoemploy two or three workers, and (4) regular and casualemployees in private sector work places that employ one to threeworkers.
In his estimation of informal employment, Togan (1997)defines employment in the informal sector as the sum ofemployment in the agricultural sector and in the private, non-agricultural informal sector. He determines employment inthe private, nonagricultural informal sector by deducting fromregular and casual employers in the nonagricultural sector
32 Turkey: Economic Reform and Accession to the European Union

(reported by the State Institute of Statistics) the number of reg-istered wage earners reported by the Ministry of Labor.
A fifth estimation method used to determine the size of theinformal sector considers the share of subcontracting activity inthe economy.
Calculations by each of these methods reveals that, on aver-age, informal labor makes up about 60 percent of total employ-ment in Turkey.
15. The growth rate of GDP at time period t is calculated as[GDP(t) − GDP(t − 1)]∗100/GDP(t − 1). The average annualgrowth rate over the time period under consideration is then theaverage of these growth rates over the indicated time period.
16. According to Italianer (2002), there are two formal rea-sons a new member state has this status. First, the proceduresforeseen in Article 121(1) for assessment of the conditions foradoption of the euro cannot be applied before accession. Sec-ond, one of these conditions cannot possibly be met upon acces-sion, because it requires participation in the Exchange RateMechanism (ERM II), which is not open to nonmembers. Moreimportant, the economic rationale for the construction of theEMU presupposes participation in the internal market beforeadoption of the euro. The free movement of goods, the freedomto provide services, the free movement of persons, and full liber-alization of capital movements are expected to be accomplishedbefore adoption of the euro, except for negotiated transitionperiods in a limited number of areas.
17. Price stability requires that, over a period of one yearbefore the examination, a country’s inflation rate not exceed theaverage rate of the three best-performing EU member states inprice stability by more than 1.5 percentage points. Interest rateconvergence requires that the average long-term interest rate notexceed that of the three EU countries with the best inflation per-formance by more than two percentage points. The budgetdeficit criterion requires that the ratio of general governmentdeficit to GDP not exceed 3 percent. The government debt crite-rion requires that the ratio of general government debt to GDPnot exceed 60 percent. Finally, the exchange rate stability crite-rion requires that the country observe the normal fluctuationmargins of the ERM II for at least two years without devaluing.In the ERM II, the euro is the anchor currency. Although thestandard fluctuation band for the exchange rates of the partnercountries is ±15 percent around the central rate, narrowerbands are possible.
18. This section is largely based on Mottiar (1999).19. This section is based mainly on the work of Gali and
Perotti (2003).20. ECOFIN, a formation of the Council of the European
Union, is made up of the ministers responsible for economicaffairs and finance in the EU countries.
21. In late 2003, France, Portugal, and Germany faced exces-sive deficit proceedings after violating the 3 percent limit forthree years in a row. In January 2004, this situation culminatedin the European Commission taking legal action against thecouncil of finance ministers over the latter’s decision to suspendthe SGP. These events have led to substantial public debate onthe effectiveness of the SGP for ensuring fiscal discipline, andon the wider issue of the optimal institutional structure for fiscalpolicy within the EU. See, for example, Fatas and others (2003).
22. This section draws heavily on European Commission(1998), European Parliament (1999), and Italianer (2002).
23. At the Copenhagen summit of June 1993, the EU mem-ber states agreed that “accession will take place as soon as anassociated country is able to assume the obligations of member-ship by satisfying the economic and political conditionsrequired. Membership requires that the candidate country has
achieved stability of institutions guaranteeing democracy, therule of law, human rights and respect for and protection ofminorities, the existence of a functioning market economy aswell as the capacity to cope with competitive pressure and mar-ket force within the Union. Membership presupposes the candi-date’s ability to take on the obligations of membership includingadherence to the aims of political, economic and monetaryunion” (European Council 1993). These criteria have from thenon been referred to as the Copenhagen criteria.
24. With the entry into force of the Treaty on EuropeanUnion on November 1, 1993, the principle of full freedom ofcapital movements was incorporated into the treaty. As of Janu-ary 1, 1994, which corresponds to the start of the second stage ofthe economic and monetary union, Articles 73a–73g of theTreaty on European Union introduced new arrangements forcapital movements. Article 73a states that as of January 1, 1994,Articles 67–73 of the Treaty of Rome no longer apply and arereplaced by Articles 73b–73g of the Maastricht Treaty. Article 73bintroduces the principle of full freedom of capital movementsand payments, both between member states and betweenmember states and third countries. This article is directly appli-cable. Article 73c introduces the possibility of maintaining cer-tain existing restrictions vis-à-vis third countries. Article 73d setsout the areas in which member states can maintain information,prudential supervision, and taxation requirements without capi-tal movements being hindered. Article 73e provides for the dero-gations adopted prior to the entry into force of the Treaty onEuropean Union to be maintained for a transitional period. Arti-cle 73f provides for the possibility of taking safeguard measures ifmovements of capital to or from third countries cause seriousdifficulties for the operation of the economic and monetaryunion. Article 73g allows the European Community or a mem-ber state to take measures on movements of capital to or fromthird countries for security or foreign policy reasons.
25. In addition, member states participating in the Euro Areahave to prepare yearly stability programs that will report on themedium-term budgetary objectives and on measures the mem-ber states intend to take toward fiscal convergence.
26. On voting modalities in the Governing Council afterenlargement, see European Central Bank (2003a).
27. The figures for the government-deficit-to-GDP ratio andthe debt-to-GDP ratio were obtained from State Planning Orga-nization (2004). These figures have been harmonized with thedeficit and debt definitions of the EU.
28. Consideration of current account sustainability inTurkey reveals that under perfect capital mobility there willalways be an unavoidable risk of speculative attacks on the Turk-ish currency, unless the country resolves its fiscal problems,attains price stability, achieves a sound banking sector, andbrings its real exchange rate equal to the RER’s long-run equilib-rium level. Currently, Turkey is trying hard to satisfy the firstthree conditions, but its RER is, as emphasized later in this chap-ter, overvalued.
29. Ball (1994) defines trend inflation as a centered nine-quarter moving average of the actual inflation rate. In our calcu-lations, we start with the monthly consumer price index seriesand determine the quarterly CPI series as the average of the threemonthly CPI series. Thereafter, we determine the annual quar-terly inflation rate as ( p(t) − p(t − 4))100/p(t − 4), where p(t)denotes the CPI value during quarter t. The trend inflation isthen defined as the average of inflation rates between (t − 2) and(t + 2).
30. We are grateful to Zafer Mustafaoglu of the SPO forproviding the estimates of potential output and output gapprojections.
Macroeconomic Policies for Turkey’s Accession to the EU 33

34 Turkey: Economic Reform and Accession to the European Union
31. Similar results were obtained by Yavuz and Çetinkaya(2002).
32. As emphasized earlier, the reason for this flexibility lies inthe existence of a formidable informal sector, whose wage-setting mechanism is quite different from that of the formalsector.
33. As Turkey begins to enforce the labor, tax, and socialsecurity laws within the economy, labor market flexibility willdecrease, unless the country decreases the tax and social securitycontribution rates substantially and changes the labor lawaccordingly.
34. For estimates of the costs of EU accession for Turkey, seein this volume chapter 2 on agriculture, chapter 9 on labor mar-kets, and chapter 11 on the environment.
35. A flat tax on income of 13 percent was introduced inRussia in 2001. The income tax revenue growth then outstrippedthe rates of economic growth and inflation in both 2001 and2002. The flat tax has also boosted the share of total tax revenueheld by the personal income tax. After the adoption and successof the flat tax in Russia, Serbia, Slovakia, and Ukraine adopted it,and other countries are in the process of adopting it as well.
36. If tax rates are reduced and the tax system is simplifiedbut taxes cannot be effectively enforced in the private sector, thecountry may find itself facing major revenue shortfalls.
37. During 2003, inward and outward FDI flows amountedto 0.23899 percent and 0.20990 percent of GDP, respectively.Thus the net FDI inflow was 0.0290946 percent of GDP.
38. To deal with the simultaneity problem in a simple way, afour-quarter lagged value of RER is used as the instrumentalvariable.
39. The literature basically includes two approaches to deter-mining the long-run equilibrium value of the RER. According toWilliamson (1994) and Wren-Lewis and Driver (1998), the funda-mental equilibrium exchange rate (FEER) is the real exchange ratethat would exist when the economy is at full employment (internalbalance) and in current account equilibrium (external balance).Thus the FEER is the RER that will bring the current account intoequality with the “sustainable” capital account, where home andforeign aggregate outputs are set at their full employment values.By contrast, the model of a behavioral equilibrium exchange rate(BEER) by Clark and MacDonald (1998) analyzes the actualbehavior of the RER using econometric techniques, where thereduced form equation is estimated with assumed longer-termfundamentals and short-term variables using cointegration analy-sis. MacDonald and Stein (1999) and Hinkle and Montiel (1999)consider productivity and net foreign assets as fundamental vari-ables. Other variables identified in the literature include real inter-est differentials, measures of openness of trade and the exchangesystem, and size of fiscal balance. Finally, Stein and Allen (1995)distinguish between medium- and long-term factors influencingthe RER. The approach developed in this chapter can be consid-ered an extension of the FEER approach. The latter approachrequires that the NICA-to-GDP ratio be sustainable.
40. The economic units may begin to assume they can avoidthe rule of law.
41. Productivity is defined as GDP measured at constantprices, Q, divided by employment, L—that is, Q/L.
42. Letting Q stand for GDP, K for capital, L for labor, andH for the index of labor quality, total factor productivity,using the Cobb-Douglas production function, is defined asQ/[K α(H L )(1−α)], where α denotes the output elasticity withrespect to capital.
43. Symbolically, the relations can be expressed by theequations
q = A + αk + (1 − α)H
and
Q = q + L
where Q denotes the growth rate of output, q the growth rate oflabor productivity, A the growth rate of technical progress, k thegrowth rate of the capital-to-labor ratio, H the growth rate oflabor quality, L the growth rate of employment, and α the out-put elasticity with respect to capital.
44. See, for example, Özler and Yılmaz (2003). Yet manyeconomists argue to the contrary. They maintain that if tradeliberalization reduces the domestic market shares of domesticproducers, the incentives of those producers to invest in superiortechnologies might decrease as protection is lifted. Furthermore,they stress that liberalization of trade under asymmetric infor-mation in markets may prove fragile for developing economies.
45. On the similarity of business cycles of countries in theEuro Area and the accession countries, see European ForecastingNetwork (2003).
46. Before the collapse of its currency regime in 2001, Turkeydid have a regime very close to the currency board. But the sys-tem failed, because Turkey had neither a sound fiscal frameworknor a sound banking sector and had not attained price stability.Furthermore, it did not have a graceful exit strategy.
47. The European Monetary Union is such a symmetricmonetary union that has strict conditions on fiscal policy. Thebudgetary decisions by member countries are subject to surveil-lance by the EMU as a whole in the context of the requirementsset out in the Maastricht Treaty and subsequently the Stabilityand Growth Pact.
48. “Crawling pegs” refers to pegs with central parity period-ically adjusted in fixed amounts at a preannounced rate or inresponse to changes in selected quantitative indicators. “Crawl-ing band” refers to crawling pegs combined with bands largerthan �1 percent. “Managed Floating with no PreannouncedPath for the Exchange Rate” refers to regimes in which themonetary authority intervenes in the foreign exchange marketwithout precommitment to a preannounced path for theexchange rate. Finally, “Independent Floating” refers to regimesin which the exchange rate is market-determined, with anyforeign exchange intervention aimed only at preventing exces-sive volatility in the exchange rate movement. For a system ofclassification of exchange rate regimes different from that of theIMF, see Reinhart and Rogoff (2002).
References
Assaad, R. 1997. “Explaining Informality: The Determinants ofCompliance with Labor Market Regulations in Egypt.” Paperpresented at the Economic Research Forum Fourth AnnualConference, Beirut, Lebanon, September 7–9.
Ball, L. 1994.“What Determines the Sacrifice Ratio?” In MonetaryPolicy, ed. N. G. Mankiw. Chicago: University of Chicago.
Buiter, W. H., and C. Grafe. 2002.“Anchor, Float or Abandon Ship:Exchange Rate Regimes for Accession Countries.” DiscussionPaper No.3184,Centre for Economic Policy Research,London.
Bulutay, T. 1999. “Giris: Türkiye’de Azörgütlü Kesim.” StateInstitute of Statistics, Ankara.
Burnside, C., and D. Dollar. 2000. “Aid, Policies and Growth.”American Economic Review 90: 847–68.
Castells, M., and A. Portes. 1989. “World Underneath: TheOrigins, Dynamics, and Effects of the Informal Economy. InThe Informal Economy, ed. A. Portes, M. Castells, and L. A.Benton. Baltimore: Johns Hopkins University Press.
Clark, P., and R. MacDonald. 1998. “Exchange Rates and Eco-nomic Fundamentals: A Methodological Comparison of

Macroeconomic Policies for Turkey’s Accession to the EU 35
BEERs and FEERs.” Working Paper 98/67, InternationalMonetary Fund, Washington, DC.
Corricelli, F. 2002. “Exchange Rate Policy during Transition tothe European Monetary Union: The Option of Euroization.”Economics of Transition 10 (2): 405–17.
European Central Bank. 2003a. “The Adjustment of VotingModalities in the Governing Council.” European CentralBank Monthly Bulletin (May): 73–83.
————. 2003b. “Editorial.” European Central Bank MonthlyBulletin (May): 8.
European Commission. 1998. “Reports on Progress towardsAccession by each of the Candidate Countries.” Compositepaper, Brussels: EC.
————. 2002. “Enlargement Paper 13.” Brussels.European Council. 1993. “Conclusions of the Presiding.”
European Council meeting, Copenhagen, June 21–22,SN 180/1/93 REV 1.
European Forecasting Network. 2003. “EFN Report on the EuroArea Outlook: Autumn 2003.” http://www.efn.uni-bocconi.it.
European Parliament. 1999. “EMU and Enlargement: A Reviewof Policy Issues.” Directorate General for Research WorkingPaper, Economic Affairs Series ECON 117, European Parlia-ment, Luxembourg.
Fatas, A., J. von Hagen, A. Hughes Hallet, R. Strauch, and A.Sibert. 2003. “Stability and Growth in Europe: Towards aBetter Pact.” In Monitoring European Integration 13. London:Centre for Economic Policy Research.
Gali, J., and R. Perotti. 2003. “Fiscal Policy and Monetary Inte-gration in Europe.” Discussion Paper No. 3933, Centre forEconomic Policy Research, London.
Hinkle, L., and P. Montiel. 1999. Exchange Rate Misalignments:Concepts and Measurements for Developing Countries.Washington, DC: World Bank.
IMF (International Monetary Fund). 2004. Various issues.Exchange Arrangements and Exchange Restrictions AnnualReport. Washington, DC: IMF.
————. 2004. Turkey: “Seventh Review under the Stand-ByArrangement, and Requests for Waiver of Applicability andNonobservance of Performance Criteria, Rephasing ofPurchases, and Extension of Arrangement.” Staff report,Washington, DC.
Italianer, A. 2002. “The Macroeconomic Policy Framework forEU Membership and Euro Area Participation—The Role ofBudget Policy.” Paper presented at Conference on “EUAccession—Developing Fiscal Policy Frameworks forSustainable Growth, Brussels, May 13–14.
Kibritçioglu, A. 2002. “Causes of Inflation in Turkey: A Litera-ture Survey with Special Reference to Theories of Inflation.”In Inflation and Disinflation in Turkey, ed. A. Kibritçioglu, L.Rittenberg, and F. Selçuk. Aldershot, UK, and Burlington,VT: Ashgate.
Lim, C. H., and L. Papi. 1997. “An Econometric Analysis of theDeterminants of Inflation in Turkey.” Working PaperNo. WP/97/170, International Monetary Fund, Washington,DC.
MacDonald, R., and J. Stein. 1999. Equilibrium Exchange Rates.Boston: Kluwer Academics.
Maurel, M. 2002. “On the Way of EMU Enlargement towardsCEECs: What Is the Appropriate Exchange Rate Regime?”Discussion Paper No. 3409, Centre for Economic PolicyResearch, London.
McKinnon, R. I. 1963. “Optimum Currency Areas.” AmericanEconomic Review 717–25.
Metin, K. 1995. “An Integrated Analysis of Turkish Inflation.”Oxford Bulletin of Economics and Statistics 57: 513–31.
————. 1998. “The Relationship between Inflation and theBudget Deficit in Turkey.” Journal of Business, Economics andStatistics 16: 412–22.
Mottiar, R. 1999. “Monetary Policy in the Euro Area: The Role ofNational Central Banks.” Central Bank of Ireland QuarterlyBulletin (winter): 57–69.
Mundel, R. A. 1961. “A Theory of Optimum Currency Areas.”American Economic Review 657–75.
Noord, P. van den, and C. Heady. 2001. “Surveillance of TaxPolicies: A Synthesis of Findings in Economic Surveys.” Eco-nomics Department Working Paper No. 303, Organisationfor Economic Co-operation and Development, Paris.
Nuti, D. M. 2002.“Costs and Benefits of Unilateral Euroization inCentral Eastern Europe.” Economics of Transition 10: 419–44.
OECD (Organisation for Economic Co-operation and Develop-ment). 2002. OECD Economic Surveys: Turkey. Paris: OECD.
Özler, S., and K. Yılmaz. 2003. “Does Foreign Ownership Matterfor Survival and Growth? Dynamics of Competition andForeign Direct Investment.” Paper presented at the 10thAnnual Conference of the Economic Research Forum for theArab Countries, Iran and Turkey, Marrakesh, December16–18.
Reinhart, C., K. S. Rogoff, and M. Savastano. 2003. “Debt Intol-erance.” Brookings Papers on Economic Activity, 1–74.
State Planning Organization. 2003. Pre-Accession EconomicProgramme 2003. Ankara: SPO.
————. 2004. Pre-Accession Economic Programme 2004.Ankara: SPO.
Stein, J., and P. Allen. 1995. Fundamental Determinants ofExchange Rates. Oxford: Clarendon Press.
Tansel,A.,and S.Togan.1987.“Price and Income Effects in TurkishForeign Trade.”Weltwirtschaftliches Archiv 123: 521–34.
Togan, S. 1997. “Türkiye’de Isgücü Piyasasında Esneklik.” InTürk Is gücü Piyasası ile Ilgili Temel Gelismeler, ed. T. Bulutay.Ankara: State Institute of Statistics.
————. 2003. “Labor Market Flexibility in Turkey.” In Com-petitiveness in the Middle Eastern and North African Coun-tries, ed. S. Togan and H. Kheir-El-Din. ERF Research ReportSeries. Cairo: Economic Research Forum for the Arab Coun-tries, Iran and Turkey.
Undersecretariat of the Treasury. 2003. Kamu Borç YönetimiRaporu. Ankara: Hazine Müstesarlıgı.
von Hagen, J., and I. J. Harden. 1994. “National Budget Processand Fiscal Performance.” European Economy. Reports andStudies 3. Towards Greater Fiscal Discipline. 311–93. EuropeanCommission: Directorate General for Economic and Finan-cial Affairs.
Williamson, J. 1994. Estimating Equilibrium Exchange Rates.Washington, DC: Institute for International Economics.
World Bank. 2003. Turkey Country Economic Memorandum:Toward Macroeconomic Stability and Sustained Growth.Report No. 26301-TU. Washington, DC: World Bank.
Wren-Lewis, S., and R. Driver. 1998. Real Exchange Rates for theYear 2000. Washington, DC: Institute for InternationalEconomics.
Yavuz, D., and A. Çetinkaya. 2002. “Calculation of Output-Inflation Sacrifice Ratio: The Case of Turkey.” WorkingPaper No. 11, Central Bank of Turkey, Ankara.
Zanello, A., and D. Desruelle. 1997. “A Primer on the IMF’sInformation Notice System.” IMF Working Paper WA/97/71.Washington, DC: International Monetary Fund.


37
Part II
Agriculture,Manufacturing,
Services, andNetwork
Industries


gross domestic product (GDP), while the corre-sponding figure for the EU15 is 1.7 percent.2
Although the Turkish GDP grew at 4 percent peryear over the period 1980–2003, the growth rate ofagriculture was only 1.1 percent per year, and itfluctuated widely over the period. As a result, thesector shrank as a share of the economy, from25 percent in 1980 to 12 percent in 2003. The sectorstill accounts for a very large share of employment,although this share has also fallen considerably.Between 1980 and 2003, the number of peopleemployed in agriculture fluctuated between 7.2 mil-lion and 9.2 million, but because of a steady increasein employment in other sectors, agriculture’s share incivilian employment dropped from 54.2 percentin 1980 to 33.9 percent in 2003.
Turkey has a total land area of 78 millionhectares (see table 2.1 for land use in Turkey). Thetotal agricultural area of 39 million hectares con-sists of arable land (24 million hectares), the areaused for permanent crops (2.5 million hectares),and permanent meadows and pastures (12.7 mil-lion hectares). Fallow land makes up more than20 percent of total arable cropland. In addition,Turkey has slightly more than 20 million hectaresof forested land. The total irrigated area is about4.5 million hectares, or 19 percent of total arablearea. It is estimated that the country can potentiallyirrigate about 8.5 million hectares.
Turkey’s agricultural land, exposed to both mar-itime and continental weather conditions, tolerates
Integration into the European Union (EU) is one ofTurkey’s central foreign policy priorities.1 As a partof this integration, Turkey will have to adopt anagricultural policy and institutional frameworkcompatible with the EU’s Common AgriculturalPolicy (CAP) and accept the full body of the legisla-tion and policies on agriculture in the EU as it existson the date of accession. For Turkey, the adoption ofEU-like agricultural policies will constitute a signif-icant modification of current policies, and suchpolicies will have enormous implications for theincomes of both farmers and the wider population.
The purpose of this chapter is to explore theseissues of EU enlargement to Turkey. The chapter isorganized as follows. The first section reviews theagricultural situation in Turkey. The second andthird sections consider the agricultural policies inTurkey and in the EU, respectively, as they are nowand as they may evolve in line with changes recentlyproposed formally by the European Commission(the administrative arm of the EU government).The impact of introducing the CAP is analyzed inthe fourth section using a partial equilibrium modelof the agricultural sector. The fifth section discussesissues related to institutional development. Conclu-sions are presented in the final section.
Agricultural Situation
Agriculture is an important part of the Turkisheconomy; it contributes about 12 percent to the
39
2Analysis of the Impactof EU Enlargement on
the Agricultural Marketsand Incomes of Turkey
Sübidey Togan, Ahmet Bayener, and John Nash
2

a wide range of crops. Climate and geography alsohave an important bearing on the location and typeof animal husbandry carried out in Turkey. Accord-ing to table 2.2, which shows the value of agricul-tural production during 2000, crops account for69 percent of production value, livestock productsfor 26 percent, forestry for 3 percent, and fishingproducts for 3 percent.
In Turkey, the family-owned farm is the basicunit of agricultural production, and family mem-bers provide most of the farm labor. The numberand size of holdings are inferred from agriculturalcensuses, which are conducted every 10 years onthe basis of small sample surveys. The picturethat emerges from these censuses is that of a large
number of small farms. The 2001 census revealedthat 83.4 percent of farms had less than 10 hectaresof land. The average size of farm holdings was6.1 hectares (see table 2.3).3
An examination of Turkey’s foreign trade in theagricultural commodities HS (Harmonized Sys-tem) 01–24, HS 41.01–41.03, HS 51.01–51.03, andHS 52.01–52.03 reveals that over the period1999–2001 the average annual agricultural exportsamounted to US$4.06 billion, or about 14.2 percentof total exports.4 Turkey’s agricultural exports tothe EU of $1.8 billion made up about 12 percent ofits total exports to the EU. By contrast, Turkey’stotal agricultural imports amounted on average to$2.7 billion, or about 6.2 percent of total imports.Agricultural imports from the EU, valued at$0.7 billion, made up about 3.2 percent of Turkey’stotal imports from the EU.
Table 2.4 shows that the three agricultural com-modities with the highest shares of total agricul-tural exports were edible fruits and citrus fruits,28.5 percent; foods made of vegetables, fruits, andother plants, 13.0 percent; and processed tobaccoand substitutes, 12.2 percent. The three agriculturalcommodities with the highest shares of exports tothe EU, of total agricultural exports to the EU, wereedible fruits and citrus fruits; foods made of vegeta-bles, fruits, and other plants; and processed tobacco
40 Turkey: Economic Reform and Accession to the European Union
TABLE 2.1 Land Use in Turkey, 1995 and 2000
1995 2000(thousand Percentage (thousand Percentagehectares) Distribution hectares) Distribution
Arable land 24,373 31.5 23,826 30.8Area sown 18,464 23.8 18,207 23.5Vegetable gardens 785 1.0 793 1.0Fallow land 5,124 6.6 4,826 6.2
Permanent crops 2,461 3.2 2,553 3.3Vineyards 565 0.7 535 0.7Orchards 1,340 1.7 1,418 1.8Olive groves 556 0.7 600 0.8
Permanent meadows and pastures 12,659 16.3 12,671 16.4Total agricultural land 39,493 51.0 39,050 50.4Forests and woodland 20,199 26.1 20,703 26.7Other land 17,271 22.3 17,210 22.2Total land area 76,963 99.3 76,963 99.3Total area 77,482 100 77,482 100
Source: Food and Agriculture Organization Statistical Database.
TABLE 2.2 Value of AgriculturalProduction: Turkey, 2000
Value PercentageProduct (US$ millions) Distribution
Crops 28,163 68.48Livestock 10,600 25.77Forestry 1,101 2.68Fishing 1,246 3.03
Total 41,129 100.00
Source: Turkish State Planning Organization.
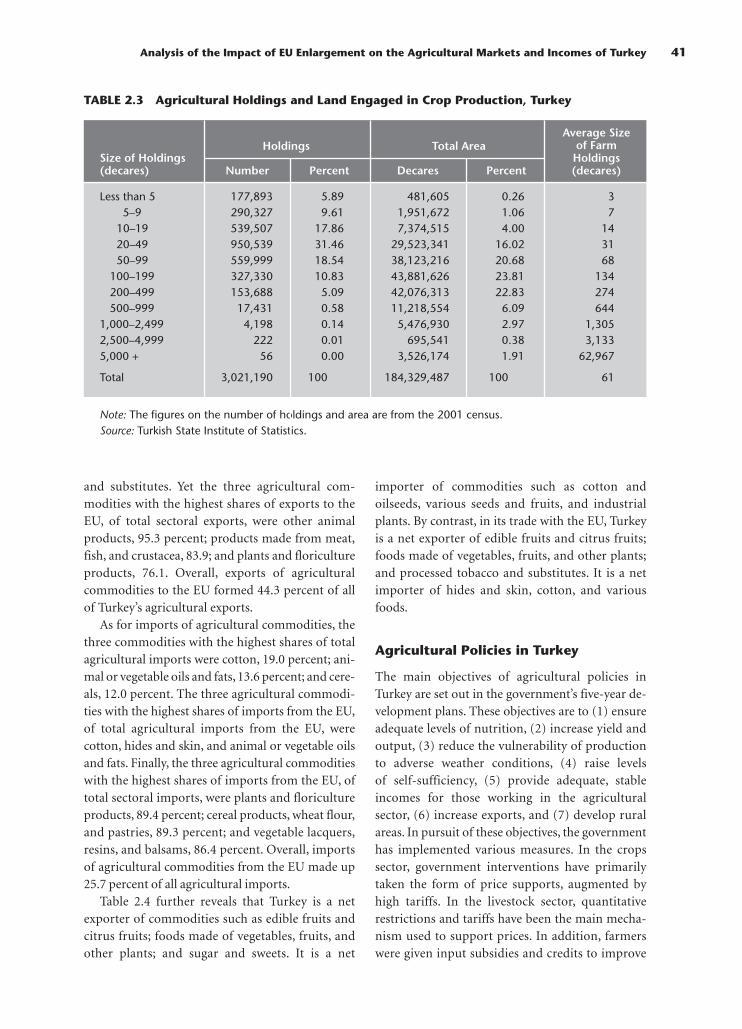
and substitutes. Yet the three agricultural com-modities with the highest shares of exports to theEU, of total sectoral exports, were other animalproducts, 95.3 percent; products made from meat,fish, and crustacea, 83.9; and plants and floricultureproducts, 76.1. Overall, exports of agriculturalcommodities to the EU formed 44.3 percent of allof Turkey’s agricultural exports.
As for imports of agricultural commodities, thethree commodities with the highest shares of totalagricultural imports were cotton, 19.0 percent; ani-mal or vegetable oils and fats, 13.6 percent; and cere-als, 12.0 percent. The three agricultural commodi-ties with the highest shares of imports from the EU,of total agricultural imports from the EU, werecotton, hides and skin, and animal or vegetable oilsand fats. Finally, the three agricultural commoditieswith the highest shares of imports from the EU, oftotal sectoral imports, were plants and floricultureproducts, 89.4 percent; cereal products, wheat flour,and pastries, 89.3 percent; and vegetable lacquers,resins, and balsams, 86.4 percent. Overall, importsof agricultural commodities from the EU made up25.7 percent of all agricultural imports.
Table 2.4 further reveals that Turkey is a netexporter of commodities such as edible fruits andcitrus fruits; foods made of vegetables, fruits, andother plants; and sugar and sweets. It is a net
importer of commodities such as cotton andoilseeds, various seeds and fruits, and industrialplants. By contrast, in its trade with the EU, Turkeyis a net exporter of edible fruits and citrus fruits;foods made of vegetables, fruits, and other plants;and processed tobacco and substitutes. It is a netimporter of hides and skin, cotton, and variousfoods.
Agricultural Policies in Turkey
The main objectives of agricultural policies inTurkey are set out in the government’s five-year de-velopment plans. These objectives are to (1) ensureadequate levels of nutrition, (2) increase yield andoutput, (3) reduce the vulnerability of productionto adverse weather conditions, (4) raise levelsof self-sufficiency, (5) provide adequate, stableincomes for those working in the agriculturalsector, (6) increase exports, and (7) develop ruralareas. In pursuit of these objectives, the governmenthas implemented various measures. In the cropssector, government interventions have primarilytaken the form of price supports, augmented byhigh tariffs. In the livestock sector, quantitativerestrictions and tariffs have been the main mecha-nism used to support prices. In addition, farmerswere given input subsidies and credits to improve
Analysis of the Impact of EU Enlargement on the Agricultural Markets and Incomes of Turkey 41
TABLE 2.3 Agricultural Holdings and Land Engaged in Crop Production, Turkey
Average Sizeof Farm
Size of HoldingsHoldings Total Area
Holdings(decares) Number Percent Decares Percent (decares)
Less than 5 177,893 5.89 481,605 0.26 35–9 290,327 9.61 1,951,672 1.06 7
10–19 539,507 17.86 7,374,515 4.00 1420–49 950,539 31.46 29,523,341 16.02 3150–99 559,999 18.54 38,123,216 20.68 68
100–199 327,330 10.83 43,881,626 23.81 134200–499 153,688 5.09 42,076,313 22.83 274500–999 17,431 0.58 11,218,554 6.09 644
1,000–2,499 4,198 0.14 5,476,930 2.97 1,3052,500–4,999 222 0.01 695,541 0.38 3,1335,000 + 56 0.00 3,526,174 1.91 62,967
Total 3,021,190 100 184,329,487 100 61
Note: The figures on the number of holdings and area are from the 2001 census.Source: Turkish State Institute of Statistics.

42
TABLE 2.4 Exports and Imports of Agricultural Commodities: Turkey, 1999–2001
Net ExportsExports Exports Imports Net in TradeExportsto EU, from
Importsfrom EU, Imports from Exports, with EU,
Average, Average EU as a Average, Average EU as a Average AverageHarmonized 1999–2001 1999–2001 Share of 1999–2001 1999–2001 Share of 1999–2001 1999–2001System (HS) (US$ Percentage (US$ Total (US$ Percentage (US$ Total (US$ (US$ Code Description thousands) Distribution thousands) Exports thousands) Distribution thousands) Imports thousands) thousands)
Live animals and animal products
01 Live animals 19,159 0.47 1,471 7.68 26,326 0.98 15,467 58.75 �7,168 �13,996
02 Meat and edible offal 13,916 0.34 708 5.09 418 0.02 64 15.41 13,498 643
03 Fish and sea products 54,154 1.33 38,532 71.15 22,508 0.83 12,378 54.99 31,647 26,154
04 Milk and dairy products; eggs; 35,301 0.87 6,316 17.89 30,824 1.14 20,828 67.57 4,477 �14,512honey
05 Other animal products 36,423 0.90 34,701 95.27 18,860 0.70 2,516 13.34 17,563 32,185
Vegetable products
06 Plants and floriculture products 15,262 0.38 11,613 76.09 16,203 0.60 14,490 89.43 �941 �2,877
07 Vegetables, plants, roots, tubers 304,529 7.50 100,117 32.88 75,451 2.80 6,605 8.75 229,079 93,512
08 Edible fruits; citrus fruits 1,159,461 28.54 743,676 64.14 57,082 2.12 6,103 10.69 1,102,379 737,573
09 Coffee, tea, spices 58,123 1.43 22,574 38.84 27,450 1.02 3,135 11.42 30,673 19,439
10 Cereals 203,561 5.01 33,582 16.50 323,726 12.00 57,506 17.76 �120,165 �23,923
11 Products of the milling industry 82,013 2.02 26,202 31.95 5,175 0.19 4,431 85.61 76,838 21,772
12 Oilseeds, various seeds/fruits; 52,430 1.29 28,351 54.07 233,454 8.66 31,223 13.37 �181,024 �2,872industrial plants
13 Vegetable lacquers, resins, 1,341 0.03 145 10.84 14,110 0.52 12,194 86.42 �12,770 �12,049balsams
14 Vegetable plaiting materials 16,471 0.41 10,819 65.68 2,695 0.10 62 2.28 13,776 10,757

43
Animal or vegetable oils and fats
15 Animal or vegetable oils and 241,189 5.94 81,999 34.00 366,550 13.59 74,579 20.35 �125,361 7,419fats
Foodstuffs, beverages, tobacco
16 Products made from meat, 34,964 0.86 29,342 83.92 830 0.03 369 44.43 34,134 28,973fish, crustacea
17 Sugar and sweets 258,178 6.36 25,237 9.77 14,019 0.52 9,125 65.09 244,158 16,112
18 Cocoa and cocoa products 81,023 1.99 12,256 15.13 68,351 2.53 22,007 32.20 12,672 �9,751
19 Cereal products, wheat flour, 116,732 2.87 13,538 11.60 30,841 1.14 27,544 89.31 85,891 �14,006pastries
20 Foods made of vegetables, 528,298 13.00 352,375 66.70 17,542 0.65 12,057 68.73 510,757 340,319fruits, and other plants
21 Various foods 93,845 2.31 11,226 11.96 101,011 3.75 81,416 80.60 �7,165 �70,190
22 Alcoholic and nonalcoholic 38,877 0.96 18,984 48.83 14,331 0.53 12,365 86.28 24,546 6,619beverages
23 Residues of food industry; 13,271 0.33 357 2.69 167,152 6.20 17,820 10.66 �153,881 �17,463fodders
24 Processed tobacco and 496,247 12.22 145,360 29.29 308,653 11.45 11,652 3.77 187,594 133,708substitutes
Hides, wool, and cotton
4101–4103 Hides and skin 21,519 0.53 209 0.97 199,473 7.40 106,243 53.26 �177,954 �106,035
5101–5103 Wool and animal hair 6,553 0.16 3,255 49.67 42,362 1.57 1,905 4.50 �35,809 1,350
5201–5203 Cotton 79,630 1.96 46,330 58.18 511,392 18.96 129,916 25.40 �431,762 �83,586
Total 4,062,470 100.00 1,799,277 44.29 2,696,790 100.00 694,001 25.73 1,365,680 1,105,276
Source: The authors.

yields and income and to counterbalance theimplicit protection given to domestic input indus-tries through border measures. Finally, administra-tive controls have been applied to the production ofa few important crops.
Output Price Supports, Input Subsidies, and SupplyControl Measures
Output price supports, input subsidies, and supplycontrol measures are three important componentsof agricultural support policies. Government pricesupports for most major crops (such as grains,oilseeds, cotton, sugar beet, tobacco, hazelnut, andtea) have in the past been announced by decreeeach year, but this practice is changing because ofthe reform program discussed later in this sectionon agricultural policies. Related state-owned enter-prises (SOEs) and agricultural sales cooperativeunions (ASCUs) were commissioned to buy at theannounced floor prices. Crops could also be sold toindependent buyers. For some crops, a system of“deficiency payments” or premiums was intro-duced in 1993 in place of floor prices. The HighPlanning Council announced a target price forthose crops as well as an intervention price, and thetarget price moved in parallel with the world prices.Farmers selling their crop to ASCUs or commodityexchanges received the difference between the priceobtained and the target price in the form of a pay-ment directly from the state-owned Turkish Bankof Agriculture. The payment was then reimbursedby the Treasury. The deficiency payments wereimplemented for sunflower seed, soybean, cotton,and olive oil. Tea growers were also fully compen-sated for the costs incurred in implementing thestrict pruning requirements to control supply.Direct payments were, until recently, only a minorpart of the agricultural support system. The maintypes of direct payments were natural disasterrelief, the return on sugar beet pulp, deficiencypayments for oilseeds and cotton, and incentivepremiums for milk and meat.
Input subsidies are a second important compo-nent of agricultural support policies. The mostimportant have been the credit, fertilizer, and irri-gation subsidies. Short-term and investment creditfor agriculture has long been subsidized by the gov-ernment at interest rates well below inflation andcommercial rates. The result is that interest rates on
loans from the Turkish Bank of Agriculture havebeen significantly negative in real terms. In addi-tion, the unpaid loans of the ASCUs have been rou-tinely covered as “duty losses” of the Treasury.
The domestic manufacturers and consumers offertilizers have received subsidies since 1961. Thesubsidy was set until recently as a percentage ofmarket price, with the percentage varying consider-ably over the years. In 1996 and 1997, the subsidywas about 40–50 percent of the market price,depending on the type of fertilizer. In November1997, the government decided to fix the fertilizersubsidy at a nominal amount of Turkish lira (TL)per kilogram. This shift in policy has reduced thefertilizer subsidy substantially in real terms, andinflation has eroded its value.
Agriculture has also received substantial subsi-dies through irrigation projects. The Turkish gov-ernment has been investing heavily in irrigation,financing the associated capital investments largelythrough the budget. Farmers have paid no fee forthe resource value of water they have used for irri-gation, whether privately extracted or supplied by apublic scheme, even though farmers who grewcrops on irrigated land did contribute to the cost ofoperating and maintaining the infrastructure. Buteven in this situation the bulk of operating andmaintenance costs were financed through budgetallocations.
Supply control measures, the third component ofTurkish agricultural policies, have been used tocontrol the fiscal cost of support policies. Tobacco,hazelnuts, and tea have been under area or produc-tion control. Sugar beet output has been indirectlycontrolled to some extent by the state-owned sugarcompany (Seker) through contracts with growers.Tobacco farmers have received payments to com-pensate for the area controls, and tea producers tocompensate for lost production from pruning.
Agricultural producers have also received gen-eral services either free or at subsidized prices. Themeasures taken to improve the production basisof agriculture were mainly research, training andextension services, inspection, pest and diseasecontrol, and land improvements (including capitalinvestments in small-scale irrigation works). Inaddition, only the large farms are required to payincome tax. In all transactions related to agricul-ture, a 5 percent sales tax is applied at the point ofsale. Consumers have not benefited from subsidies
44 Turkey: Economic Reform and Accession to the European Union

directly. They are protected indirectly through pricecontrols, market intervention, and a lower value-added tax on food.
Agricultural Trade Policy
Table 2.5 shows the applied most-favored-nation(MFN) tariff rates for the major agricultural com-modity groups during 2002. The table reveals thatthe agricultural sector is highly protected in Turkey.The three sectors with highest simple average tariffrates applied to imports from third countries arethe products made from meat, fish, and crustacea(HS 16) with a tariff rate of 132.70 percent; meat andedible offal (HS 02), 116.52 percent; and milk anddairy products (HS 04), 105.20 percent. The threesectors with the highest weighted average tariffrates applied to imports from third countries areproducts made from meat, fish, and crustacea (HS16) with a tariff rate of 124.08 percent; sugar andsweets (HS 17), 124.08 percent; and edible fruitsand citrus fruits (HS 08), 120.17 percent. The tablealso reveals that Turkey, upon becoming a memberof the EU, could have to change its tariff scheduleon agricultural commodities substantially. To alignits tariff schedule with the current EU schedule,Turkey would have to increase its tariffs on cereals;processed tobacco and substitutes; residues of thefood industry and fodders; alcoholic and nonalco-holic beverages; vegetable lacquers, resins, and bal-sams; cotton; and vegetable plaiting materials. In allother categories, Turkey would have to decrease itstariff rates.
As for the market access conditions for agricul-tural commodities imported from the EU, the pref-erential regime applied by Turkey to imports ofagricultural products originating in the EU isdetermined by Decision No. 1/98 of the EC–TurkeyAssociation Council of 1998. Under this decision,Turkey must grant a large number of commoditiesduty-free access to the Turkish market up to thequota limits specified in the decision. A look at thequota levels and trade data for the agriculturalcommodities specified in Decision No. 1/98 of theEC–Turkey Association Council reveals that formost of the commodities the quota limits havebeen exceeded. Thus “out of quota” tariff rates are,in general, applicable to imports of these com-modities from the EU. Consideration of the “out ofquota” tariff rates for these commodities, together
with the MFN tariff rates shown in table 2.5 for theother agricultural commodities, reveals that thethree sectors with the highest simple average tariffrates are meat and edible offal (HS 02), with a tariffrate of 116.52 percent; milk and dairy products(HS 04), 99.60 percent; and products made frommeat, fish, and crustacea (HS 16), 76.90 percent.The three sectors with the highest weighted averagetariff rates applied on imports from the EU are edi-ble fruits and citrus fruits (HS 08) with a tariff of120.17; milk and dairy products (HS 04), 101.79;and meat and edible offal (HS 02), 71.40 percent.
The preferential regime applied by the EU toimports of agricultural products originating inTurkey is determined by Decisions No. 1/72, 1/80,and 1/98 of the EC–Turkey Association Councils of1972, 1980, and 1998, respectively. Under thesedecisions, almost all of the agricultural commodi-ties originating in Turkey are imported by theEuropean Community free from ad valorem duties,and the EU applies tariff quotas only for a relativelysmall number of commodities (see chapter annextables 2.17 and 2.18). These tables reveal that thosecommodities made up about 30 percent of Turkishexports to the EU during 1999. In addition, the EUapplies an entry price system for about 30 fruits andvegetables such as tomatoes, artichokes, courgettes,tangerines, lemons, and apples. For these com-modities, specific duties are applied as long as thevalue of consignment falls below the entry price.These commodities, shown in annex table 2.19,made up about 4.8 percent of Turkish agriculturalexports to the EU during 1999.
Finally, a sanitary ban on the import of livestockand meat products has remained in place. Exportsubsidies, applied to a number of products andlimited to a maximum of between 10 percent and20 percent of the export values and between 29 per-cent and 100 percent of the quantities exported,have continued for processed fruits and vegetables,fruit juices, olive oil, potatoes, apples, poultry meat,and eggs.
The considerations just described reveal thatsubstantial border measures still affect trade be-tween the EU and Turkey and that the externaltariffs applied by the EU and Turkey to third coun-tries’ imports differ significantly. Completion of thecustoms union between the EU and Turkey to coveragricultural products implies the abolition of allborder measures and the adoption of the EU external
Analysis of the Impact of EU Enlargement on the Agricultural Markets and Incomes of Turkey 45
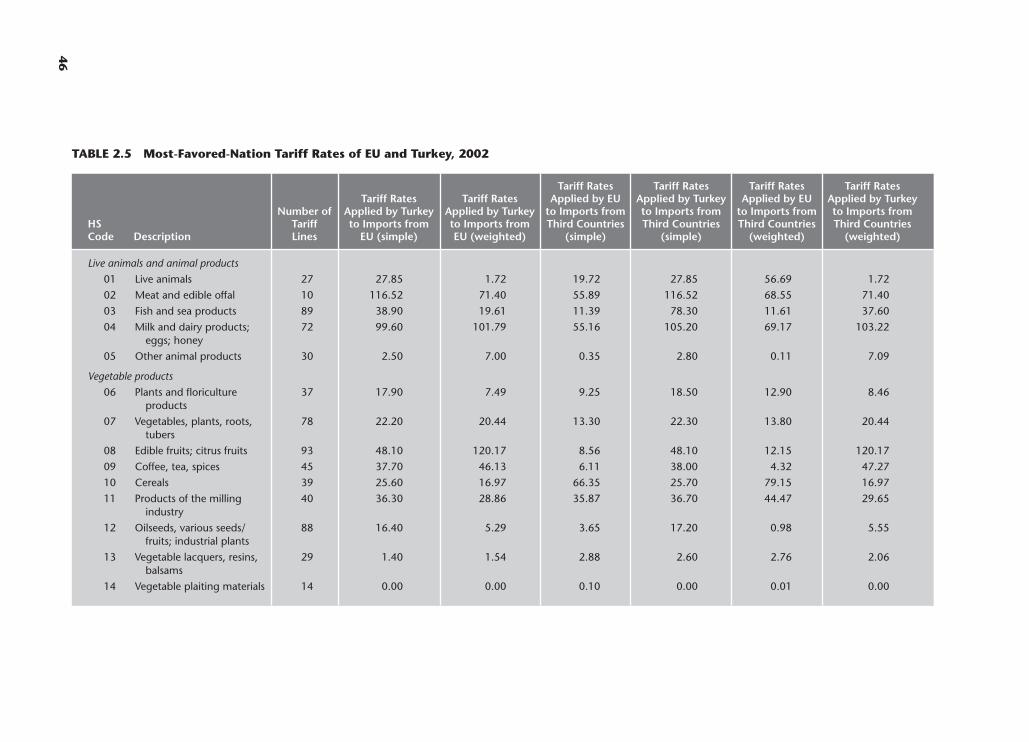
46
TABLE 2.5 Most-Favored-Nation Tariff Rates of EU and Turkey, 2002
Tariff Rates Tariff Rates Tariff Rates Tariff RatesTariff Rates Tariff Rates Applied by EU Applied by Turkey Applied by EU Applied by Turkey
Number of Applied by Turkey Applied by Turkey to Imports from to Imports from to Imports from to Imports fromHS Tariff to Imports from to Imports from Third Countries Third Countries Third Countries Third CountriesCode Description Lines EU (simple) EU (weighted) (simple) (simple) (weighted) (weighted)
Live animals and animal products
01 Live animals 27 27.85 1.72 19.72 27.85 56.69 1.72
02 Meat and edible offal 10 116.52 71.40 55.89 116.52 68.55 71.40
03 Fish and sea products 89 38.90 19.61 11.39 78.30 11.61 37.60
04 Milk and dairy products; 72 99.60 101.79 55.16 105.20 69.17 103.22eggs; honey
05 Other animal products 30 2.50 7.00 0.35 2.80 0.11 7.09
Vegetable products
06 Plants and floriculture 37 17.90 7.49 9.25 18.50 12.90 8.46products
07 Vegetables, plants, roots, 78 22.20 20.44 13.30 22.30 13.80 20.44tubers
08 Edible fruits; citrus fruits 93 48.10 120.17 8.56 48.10 12.15 120.17
09 Coffee, tea, spices 45 37.70 46.13 6.11 38.00 4.32 47.27
10 Cereals 39 25.60 16.97 66.35 25.70 79.15 16.97
11 Products of the milling 40 36.30 28.86 35.87 36.70 44.47 29.65industry
12 Oilseeds, various seeds/ 88 16.40 5.29 3.65 17.20 0.98 5.55fruits; industrial plants
13 Vegetable lacquers, resins, 29 1.40 1.54 2.88 2.60 2.76 2.06balsams
14 Vegetable plaiting materials 14 0.00 0.00 0.10 0.00 0.01 0.00

47
Animal or vegetable oils and fats
15 Animal or vegetable oils 107 18.10 17.74 15.49 20.20 22.90 17.86and fats
Foodstuffs, beverages, tobacco
16 Products made from meat, 39 76.90 65.27 21.32 132.70 22.79 124.08fish, crustacea
17 Sugar and sweets 53 58.90 63.18 22.79 79.70 48.46 124.08
18 Cocoa and cocoa products 24 38.60 22.38 7.12 99.30 3.06 51.11
19 Cereal products, wheat 66 58.20 54.45 26.05 83.90 22.88 78.96floor, pastries
20 Foods made of vegetables, 173 58.50 62.41 25.47 60.80 27.59 73.92fruits, and other plants
21 Various foods 54 25.20 28.64 13.42 42.02 15.89 42.37
22 Alcoholic and nonalcoholic 41 11.90 2.01 22.52 17.04 13.87 6.27beverages
23 Residues of food industry; 49 6.30 1.12 18.03 7.81 26.96 2.84fodders
24 Processed tobacco and 17 14.70 0.22 51.55 33.78 51.01 23.98substitutes
Hides, wool and cotton
4101–4103 Hides and skin 44 0.00 0.00 0.00 0.00 0.00 0.00
5101–5103 Wool and animal hair 36 0.00 0.00 0.00 0.00 0.00 0.00
5201–5203 Cotton 15 0.00 0.00 0.18 0.00 0.01 0.00
Source: The authors.

tariff applied to third countries.5 As a result, theprices of agricultural products for which bordermeasures still exist would become much closer inthe EU and Turkey, with the remaining differencesdue to quality and to transportation and marketingcosts. Such a development would, however, requirethat the parties harmonize their agricultural pricepolicies.
Agricultural Reform Implementation Project
The overly generous system of agricultural supportpolicies pursued until the late 1990s was fiscallyexpensive and unsustainable, and they encouragedwaste and abuse (World Bank 2000). They did notprovide a cost-effective way for addressing policyobjectives such as alleviation of rural poverty andregional development, and the “duty loss” systemof administration burdened the Treasury withenormous debts. There were other problems aswell. Support and administered prices wereannounced only after key production decisions hadbeen made, and payments were delayed by inter-vention agencies. These problems confirm the dif-ficulties inherent in trying to administer outcomesin a dynamic, complex market. Neither the overalldemand-supply balance nor the equilibrium in thevery complex intertemporal, spatial, and qualitydimensions could be achieved. The Turkish gov-ernment recently tried to replicate the market byestablishing more quality-differentiated prices. Butsuccess in duplicating the price flexibility of freelyfunctioning commodities market was limited.
In the late 1990s, Turkey decided to reform itsagricultural policies. Beginning in late 1999, withsupport from the International Monetary Fund(IMF) and the World Bank, the government devel-oped the Agricultural Reform ImplementationProject (ARIP) to phase out current production- andinput-oriented support and replace it with area-based income support payments during the 2001–04period. ARIP was intended to achieve following:
• To phase out the unsustainable and distor-tionary system of subsidies for fertilizer—creditand price supports that disproportionately ben-efited large farmers, placed a regressive tax onconsumers, and cost about $5 billion a year.ARIP was determined to link domestic prices toworld prices.
• To privatize most state enterprises in agricultureand to turn the agricultural sales cooperativeunions (ASCU) into true private sector unionsof producer-owned cooperatives in order toreduce government involvement in the market-ing and processing of agricultural products.
• To introduce a unified national program ofdirect income support (DIS). These reforms areintended to increase the efficiency of the agri-cultural sector and thereby help Turkey meet thepreconditions for accession to the EU.
Implementation of ARIP began in 2000 with apilot program of income support payments appliedto four regions. An important part of the pilot pro-gram was preparation of a farm registry and testingof the eligibility conditions. All agricultural landusers received $50 per hectare of agricultural land,up to a maximum of 20 hectares per farmer. Theprogram was extended nationwide in 2001–02.Table 2.6 shows the intervention prices and directpayments for selected commodities over the period1998–2002. The table reveals how the governmenthas tried to compensate for the drop in interven-tion prices with increases in direct payments.
The intention of direct income support is not tofully compensate every farmer for income lost byremoval of the old subsidy system, but rather tocushion the blow and continue to provide adequatesupport to the agricultural sector in an incentive-neutral way. Within the existing legal framework,the DIS payments should be usable as collateral,thereby giving farmers enhanced access to credit.Payments under the DIS system will be ongoing butshould become more explicitly targeted or mergedwith the general social safety net system. Thus DISallows the government to disengage from its currentsupport mechanism in a politically acceptable andhumane way. The government is also easing thetransition for growers of certain crops that weregrossly overproduced (i.e., tobacco and hazelnut)by making onetime payments to farmers to covertheir cost of switching to alternative activities. Thisprogram is distinct from, and in addition to, DIS.
After the policy change, the fertilizer subsidydecreased from 31 percent in 1999 to almost 20 per-cent by the end of 2000,and it was phased out in 2002.By 2002, credit subsidies channeled through ZiraatBank, as well as most other input subsidies, were alsophased out. In addition, price supports for grains
48 Turkey: Economic Reform and Accession to the European Union

were reduced, with the aim of eliminating the sup-ports completely by 2002.Even though grain supportprices were not announced by a decree by the govern-ment in 2002, the Turkish Grain Board (TMO)announced its purchasing prices based on produc-tion, its stocks, and expected market conditions.
Estimates of Support in Agriculture
Agricultural production in Turkey is protected.According to the official estimates of the Organisa-tion for Economic Co-operation and Development(OECD), total transfers from consumers andtaxpayers to agricultural producers, as measured bythe producer support estimate (PSE), amounted toa peak of $9.955 billion in 1998 (almost 25 percentof producers’ receipts) and fell slightly to $6.8 bil-lion (21 percent) in 2000. As a result of the reformefforts, the PSE decreased to $2.251 billion (10 per-cent) in 2001, but increased to $6.1 billion (23 per-cent) in 2002. According to the OECD (2003a),market price support remained the most importanttype of support, for a share of 69 percent of totalsupport to producers in 2001 and 75 percent in
2002. Payments based on input use are the othercategory of support to producers. This category as ashare of total support decreased from 22 percent in1999 to 8 percent in 2001, and further to 2 percentin 2002. By contrast, the total transfers to the agri-cultural sector measured by the total support esti-mate (TSE) amounted to $13.84 billion in 1998(6.9 percent of GDP) and $12.1 billion in 1999(6.6 percent of GDP). The TSE decreased to$5.4 billion (3.6 percent of GDP) in 2001, butincreased again to $7.7 billion (4.1 percent of GDP)in 2002. At the same time, the corresponding fig-ures for all OECD countries fell from 1.39 percentof GDP in 1998 and 1999 to 1.2 percent in 2002.The TSE for the EU fell from 1.52 percent of GDPin 1999 to 1.3 percent in 2002. Over the sameperiod, the PSE in the EU, as a percentage of pro-ducers’ receipts, fell from 43 percent to 36 percent.
The Common Agricultural Policy of the EU
The Common Agricultural Policy (CAP) of theEuropean Union, which was set up against the
Analysis of the Impact of EU Enlargement on the Agricultural Markets and Incomes of Turkey 49
TABLE 2.6 Agricultural Supports: Turkey, 1998–2002(US$ millions)
1998 1999 2000 2001 2002
Market price supportCereals 425.8 356.7 183.0 27.8 0.0Tobacco 276.9 146.6 81.8 43.3 26.7Sugar beet 245.2 141.6 70.5 40.1 0.0
Payments based on inputs usedFertilizer 476.7 238.6 153.4 60.5 0.0Pesticides 33.0 24.7 19.2 14.7 0.0Seed 6.6 3.4 4.6 0.8 0.0
Development of animal husbandry 0.0 0.0 19.2 31.9 50.1a
Incentive premiumsMilk 31.5 25.6 19.2 9.8 0.0
Compensation paymentTea 13.8 7.1 25.2 22.1 26.7Natural disaster relief 29.7 37.2 22.4 0.0 0.0
Credit subsidy 1,663.2 1,675.3 562.7 274.8 0.0
Deficiency payments 0.0 265.8 298.2 280.5 145.1
Direct income support 0.0 0.0 0.0 68.1 1,159.0
Total 3,202.4 2,922.6 1,459.6 874.4 1,357.5
a. The figure includes the milk premium.Source: Turkish Ministry of Agriculture and Rural Affairs.

backdrop of the food shortages and rations thatfollowed World War II, had five founding aims:(1) higher productivity, (2) a fair standard of livingfor farmers, (3) stable markets, (4) regular foodsupplies, and (5) reasonable prices for consumers.It was based on the principles of a single market infarm products with common prices and the freemovement of agricultural goods within the com-munity, preference for community members, andshared costs. Its main mechanisms were supportprices set above world price levels and the use ofimport taxes, nontariff barriers to imports, andexport subsidies to maintain the higher internalprices. As production responded to higher prices,surpluses became chronic and increasingly expen-sive. As a result, the CAP has been subjected to var-ious reforms. In particular, production has beenartificially constrained by mechanisms such as milkquotas and compulsory set-asides for arable crops;prices have been cut, and producers have normallybeen given direct payments in compensation; andmore emphasis has been put on rural developmentand encouraging farmers to look to markets anddiversified forms of income to reduce their depend-ence on subsidies.
The CAP is financed by the European Agricul-tural Guidance and Guarantee Fund (EAGGF),which is an integral part of the EU’s budget. In the2003 EU budget of €99.69 billion, appropriationsfor the EAGGF accounted for about €44.78 billion.In addition to budget costs, the CAP imposes a coston EU consumers through higher food costs. Theadditional cost to consumers varies according tomovements in world prices, but in 2003 it was esti-mated by the OECD at about €55.5 billion.
In the EU, like in Turkey, it eventually becameclear that price supports, import tariffs and nontar-iff barriers, export subsidies, and the other govern-ment interventions required by the CAP were creat-ing unsustainable pressures on the EU budget andfriction in international trade relations. Further-more, they were not achieving the social objectivesof environmental preservation and equity. The EUtherefore embarked on a far-reaching reform pro-gram for CAP that is still under way. The reformbegan with the McSharry reforms of 1992 and wasaccelerated with the Agenda 2000 agreement, whichwas approved at the Berlin Council in March 1999.The underlying principle of the reform was thesame as that of ARIP: to minimize the government’s
role in setting prices and allow prices to be closelylinked to world prices, while compensating farmersfor income losses with area-based direct paymentsthat would not be linked to output or input use.Under the Agenda 2000 agreement, some interven-tion prices were set at levels so low that they wouldbe binding only in years of very low world prices,and other intervention prices were reduced greatly,with producers compensated by direct income sup-port payments. The agreement represented a signif-icant shift from price supports to direct payments,and it helped to reduce the economic distortions ofthe CAP. It will go some way toward helping agri-culture to meet the challenges of further trade lib-eralization and enable the formulation of an inte-grated EU rural development policy that shifts theemphasis from production support to environmen-tal and rural economy measures in the future. But,as described in the rest of this section, furtherreforms also are under way.
Common Organization of Market
Within the CAP framework, the Common Organi-zation of Market (COM) is the basic instrumentused to manage agricultural production and to sta-bilize markets in accord with the declared objec-tives of the CAP. COMs, which were introducedgradually, now cover most EU agricultural prod-ucts, accounting for 90 percent of the final agricul-tural output of the European Community. Theessential features of the current CAP under Agenda2000 reform is summarized in the following sections(see Europarl 2002 and Csaki and others 2002).
COM for Cereals In the past, at the core of theCOM for cereals was a state intervention systembased on guaranteed prices, but after the 1993/94marketing year, compensation payments perhectare became the main mechanism.6 The inter-vention price was set at a very low level to serve asonly a safety net in years of extremely low worldprices. It was €101.31 per metric ton from the2001/02 marketing year, and it would decline fur-ther, to a little over €90 per metric ton under theCAP Mid-term Review proposals described later inthis chapter. This intervention price applies to apredefined “standard quality” that meets the regu-lations on moisture content and specific weight.
50 Turkey: Economic Reform and Accession to the European Union

Direct area payments to cereal producers, set ineuros per metric ton, were introduced to compen-sate farmers for reductions in price supports. Toreceive such compensation, farmers must withdraw10 percent of their land from production. Smallfarmers with a total output of less than 92 metrictons are exempt from set-aside as a compulsoryrequirement to receive compensation payments.For the 2001/02 marketing year, these direct pay-ments were fixed at €63 per metric ton of the his-torical yield. For durum wheat, the supplementarydirect area–based income payment per hectareamounts to €344.5 in traditional areas (traditionaldurum wheat aid) and €138.9 in other areas (well-established durum wheat aid).
To apply for direct area payments, each memberstate must draw up a regionalization plan by takinginto account specific factors that influence yieldssuch as soil fertility. The area concerned must notexceed the region’s “base area”—that is, the averagenumber of hectares in the region allocated to grow-ing crops or set aside within the context of the pub-lic assistance scheme in 1989, 1990, and 1991.7 Ifthe total eligible claims exceed the base area, thenall claims are reduced proportionately. Article 9 ofCouncil Regulation No. 1251/1999 states that thebase areas of future member states will be estab-lished by the European Commission. Finally, aid forthe production of “traditional durum wheat” islimited to certain regions that are mentioned inAnnex II to Council Regulation No. 1251/1999, andper member state a maximum area that may be eli-gible for the “traditional durum wheat aid” is fixedin Annex III of that regulation.8
According to Article 3 of Council RegulationNo. 1252/1999, the historical reference yield forcereals should be the average of the median threeyears of the five-year period 1986/87–1990/91.9 Formaize, a specific yield can be set, possibly distin-guishing between irrigated and nonirrigated areas.In the areas thus defined, per hectare payments arecalculated by multiplying the basic amount permetric ton by the historical average cereal yield forthe area. Article 7 of Council Regulation No. 1252/1999 states that applications for payments may notbe made for land that on December 31, 1991, wasunder permanent pasture, permanent crops, ortrees, or was used for nonagricultural purposes.10
As for import duties, export taxes, and exportrefunds, under commitments to the World Trade
Organization (WTO), the EU can levy an importduty on cereal imports from third countries, whichis payable by the European Community importer.Within the limit of the agreement, the duty cannotexceed the intervention price, increased by 55 per-cent less the representative CIF (cost, insurance,freight) price. Under these rules, the EU is allowedto vary the tariffs for cereals over time.
COM for Oilseeds The McSharry reformsremoved the system of institutional prices foroilseeds (i.e., rapeseed, sunflowers, and soybeans),but since the 1993/94 marketing year their produc-ers also qualify for compensatory payments.11
These payments are aligned with the one applicablefor cereals (€63 per metric ton of reference yieldsince 2002). The area grown with oilseeds is takeninto account in determining the individual farmer’sset-aside obligation as described under the regula-tions for cereals. As a prerequisite for the imposi-tion of specific oilseed production provisions, pro-duction area constraints for the member countrieshave been implemented under the Blair Houseagreement. This agreement includes a system ofreduced aids for regions where the predeterminedagricultural area is exceeded. For nonedible oilseedsfor industrial use, specific regulations apply andrequire that set-aside areas, for example, be plantedwith several oil-bearing crops for industrial pur-poses. Currently, there is no regulatory levy onimports, and the Common Customs Tariff ratesapply.
COM for Sugar Beet The EU sugar market ishighly protected.12 Besides protection at the border,the CAP on sugar is implemented through a mar-keting quota system. Sugar beet quotas are allo-cated to and administered through sugar refinerieson the basis of equity shares. The intervention pricefor refined beet sugar is set, since the 1998/99 mar-keting year, at €631.9 per metric ton for white sugarand €523.7 per metric ton for raw sugar in order toguarantee a basic price for sugar beet of €47.67 permetric ton. Intervention is provided for limitedquantities corresponding to a production quota forwhich there is an almost total guarantee (quota A)and a quota with a partially guaranteed price(quota B). For net importers, quota A equals netproduction, and quota B equals 10 percent of quotaA. For net exporters, quota A equals that part of net
Analysis of the Impact of EU Enlargement on the Agricultural Markets and Incomes of Turkey 51

production consumed domestically, and quota Bequals net exports. The EU insists that the total ofquotas A and B should not exceed internal con-sumption plus the quantity that can be exportedwithin the limits of the WTO commitments. Fur-thermore, the COM is based on a system of sugarand isoglucose production levies to cover the costof storage and production refunds for the manu-facture of certain chemical products. The regula-tions are complemented with import tariffs andwarrants of export refunds. Agricultural areasplanted with sugar beets are not eligible for com-pensatory area payments and are not subject to set-aside obligations.
COM for Fruits and Vegetables In late July 1996,the European Council reached a political agreementto reform the fresh and processed fruit and vegetablesector.13 The reform was intended to improve theorganization of supply by strengthening producerorganizations (POs), tightening up the criteria forrecognizing POs, and setting up an operation fundco-financed by the EU for promotion and qualitycampaigns and the cessation of farming operationsthat are not covered by European Community com-pensation schemes, which, with this reform, willprovide on-retributive compensation—that is, theywill not encourage production. Based on the firstyear’s experience, some rules were modified in 2001to simplify the regime, to make it more flexible, andto increase producer responsibility.
EU-wide aid schemes are in place to assist pro-ducer organizations supplying tomatoes, peaches,pears, and citrus fruits. This aid is granted for thefresh produce delivered during prescribed periods.Aid is paid to recognized producer organizations,which then pay out to the growers. Deliveryto approved processors is based on contractsspecifying the quantities they cover, the price,and the schedule of supply. These contracts requirethe processor to process the products delivered.The minimum characteristics of the raw materialsupplied for processing and the minimum qualityrequirements for the finished products are defined.Annual EU thresholds have been established tolimit the total volume of aid, and there are penaltiesfor overrunning thresholds. Aid per hectare is avail-able to growers of grapes for use as dried muscatelgrapes, sultanas, and currants, within a maximumguaranteed area. Contracts must be concludedbetween the producer or producer organizations
and processors. The aid level is fixed per hectare ofspecialized area harvested, on the basis of the aver-age yield per hectare of the area concerned.
COM for the Wine-Growing Sector The com-mon market organization for wine (Council Regu-lation No. 1493/1999) aims to maintain a balancebetween supply and demand in the European Com-munity market, thereby giving producers a chanceto bring production into line with market develop-ments and to allow the sector to become competi-tive. This goal is pursued by financing the restruc-turing of a large portion of the present vineyards,and it should give rise to products in demand athome and abroad. The Common Customs Tariffrates apply to imports of wine into the EuropeanCommunity. To prevent imports from havingadverse effects, and subject to compliance with therules of the WTO, an additional import duty maybe imposed.
COM for Milk and Dairy Products The marketfor milk and dairy products is one of the mostimportant (about 18 percent of the total value ofagricultural production) and most regulated mar-kets in the EU.14 The current market regime com-prises the target price for milk (2000–05, €309.80per metric ton), intervention price for butter(2000–05, €3282.00 per metric ton), interven-tion price for skimmed milk powder (2000–05,€2,055.20 per metric ton), a producer quota sys-tem, support of prices by the imposition of tariffson dairy products, warrant of export subsidies, theguaranteed purchase and storage of butter andskimmed milk powder through intervention agen-cies, and a milk quota system introduced in 1984(117.49 million metric tons, EU total). Farmerswho exceed this reference amount of their quotaare subject to a payable levy. Since 1998, milk quo-tas have been transferable from one individual toanother within one EU member state through sale,lease, or inheritance. Also related to these measuresare a public intervention scheme, private storage,production aids for using milk in animal feedstuffsand processing milk into casein, special measures toreduce stocks, and some aids for reducing or ceas-ing production. Import levies and export refundsare also applied.
From 2005 on, intervention prices for butter andskimmed milk powder will be reduced by 15 per-cent in three equal steps of 5 percent each. In the
52 Turkey: Economic Reform and Accession to the European Union

final stages of reform, they will amount to€2,789.70 per metric ton and €1,746.90 per metricton, respectively. According to the EU’s impactanalyses, these changes will put the interventionprice after 2007 below the expected world price lev-els. Benefits for farmers will be provided by threecomplementary measures: (1) increasing availablemilk quotas by 1.5 percent in three equal steps overthree years in parallel with the price reductionsstarting in 2005, (2) retaining a crop premium forsilage cereals, and (3) implementing a new yearlypayment for dairy cows. The payment for dairycows is to be paid on a flat rate basis per metric tonof the quota held in the 1999/2000 marketing yearand amounting to €17.24 per metric ton in thefinal stages of reform.
On June 26, 2003, EU farm ministers adopted afundamental reform of the CAP. With the reform,the intervention price for butter will be reduced by25 percent over four years, which is an additionalprice cut of 10 percent compared with that ofAgenda 2000 reforms.
COM for Beef and Veal In 1999 the beef support“regime” was altered significantly as part of theAgenda 2000 CAP reform process; the practice ofEU-subsidized purchases of surplus beef from themarket (intervention buying) was reduced to a min-imal“safety net.”In return for this reduction in mar-ket price support, farmers received direct aid in theform of premiums based on the number of cattlethey held in a reference period.
Direct aid includes various types of directfarmer support measures (Council Regulation [EC]No. 1254/1999 and Commission Regulation [EC]No. 2342/1999). They are designed to compensatefor the reductions in the intervention price(slaughtering premium and the special beef pre-mium), support the incomes of producers who arespecialized in beef production (suckler cowpremium), encourage producers to undertakeextensive farming (extensification payment), assistproducers in less favored areas or in member stateshighly specialized in beef production (additionalsuckler cow premium), balance the marketthroughout the year (deseasonalization premium),and permit member states to support specific pro-duction systems (national expenditure envelopes).
The intervention price was set for the 2001/02marketing year at €3,013 per metric ton of carcassweight (for R3 classification) and was replaced in
July 2002 by a basic price for storage, fixed at €2,224per metric ton. The payment for private storage isgranted when the average Community market pricelevel is less than 103 percent of the basic price. As ofJuly 2002, producers also could benefit from a safetynet intervention system. When the average marketprice for bulls or steers in a member state falls to lessthan €1,560 per metric ton of carcass weight, theEU buys beef into intervention stores.
Since 2002, steer and bull premiums have beenset at €150 and €210 per head, and the premium forsuckler cows at €200 per year. Although the bull pre-mium is paid once a lifetime for bulls older thannine months or at a minimum carcass weight of185 kilograms, the steer premiums are paid twice alifetime, at the age of 9 months and after 21 months.The suckler cow premium is granted per calendaryear and per holding within the limits of regionalceilings for not more than 90 animals. These premi-ums are granted provided that the stocking densityon the holding is not more than two livestock unitsper unit of forage area used for these animals. Inaddition to these premiums, a slaughter premiumapplicable at slaughter or export to a third countryof €80 has been introduced for bulls, steers, sucklercows, and heifers over the age of eight months, andof €50 for calves more than one and less than sevenmonths in age (with an upper limit of 160 kilo-grams).15 The slaughter premium is paid directly tothe farmer, provided that the eligible animals havebeen held for a minimum period of two months.Extensive production (stocking density less than1.4 livestock units per hectare) may qualify for anadditional payment of €100 per premium granted.16
The reform of the CAP agreed to in June 2003changes the way the EU supports its farm sector. InJanuary 1, 2005, a single-payment scheme replacedmost of the direct aid payments currently offered tofarmers, and it is not linked to what a farmerproduces. The amount of the payment is calculatedon the basis of the direct aids a farmer received in areference period (2000–02). Member states maydelay implementation of this scheme up to 2007, butby 2007, at the latest, all member states must have atleast introduced the scheme. Full decoupling is thegeneral principle from 2005 onward. However,member states may decide to partially implementthe single-payment scheme and grant additionalpayment to the beef producers by way of choosingfrom the options for partial decoupling of directpayments. Under such partial decoupling, member
Analysis of the Impact of EU Enlargement on the Agricultural Markets and Incomes of Turkey 53

states may opt to keep up to 100 percent of theslaughter premium for calves. However, memberstates may also opt to keep up to 100 percent of thesuckler cow premium and up to 40 percent of theslaughter premium for calves coupled. Alternatively,they could keep up to 100 percent of the slaughterpremium coupled or, instead, up to 75 percent of thespecial male premium.
The relatively high internal price supports arecomplemented by measures affecting imports ofbeef and veal to the EU and by refunds on EUexports to third countries. A basic import tariff (lessthan 20 percent for most beef products) and anadditional variable levy (ranging from 180 to 390percent) are imposed. Exports are subsidized, andthe refunds are set by the European Commission,depending on world market conditions, the presentand anticipated condition of the EU market, andthe competitive environment in third-country mar-kets. Under the WTO Uruguay Round agreement,these levels are to be reduced in the future.
COM for Ovine Meat This COM comprises asafety net intervention system and a direct paymentfor ewes of €21 (€16.8 for female goats and forewes kept for milk production) per head and yearsince 2002.17 Each member state has an upper limiton the number of animals eligible for direct pay-ment for ewes.
The reform of the CAP agreed to in June 2003means that this simplified premium system will beincorporated into a new support structure. Fulldecoupling will be the general principle from 2005onward. However, member states may decide tomaintain a proportion of direct aids to farmers intheir existing forms, notably where the statesbelieve agricultural markets may be disturbed orproduction may be abandoned because of the moveto the single-payment scheme. Fifty percent of thesheep and goat premiums under the 2001 systemcan continue to be granted as coupled payments.
Future Evolution of the CAP
Although the Agenda 2000 reforms made the CAPmuch more efficient, it is recognized that the budg-etary pressures of accession and international tradeobligations will require further reform in the samedirection.
Reforms from the Mid-term Review and FutureDirections In June 2003, the EU endorsed a seriesof additional reforms that had been proposed in the
Mid-term Review of the CAP in January. The thrustof the reforms is to continue to reduce the reliance ofthe CAP on market-distorting measures such as pricesupports and to channel more of the support given tofarmers through payments linked to environmental,food safety, general rural development, and animalwelfare objectives (i.e., to receive direct income pay-ments, farmers would have to comply with the con-ditions tied to these objectives). The catchphrase forthis refocusing of the mechanisms of support is“support for producers, not for production.” Thereform program is supposed to be budget-neutral.
The key elements of the reforms are as follows:18
• Most support will take the form of a singledecoupled farm payment for EU farmers, inde-pendent from production, with member statesallowed to maintain limited coupled elements(up to 25 percent of the value of current pay-ments) to avoid abandonment of production.
• This payment will be linked to the respect forenvironmental, food safety, animal and planthealth, and animal welfare standards, as wellas to the requirement to keep all farmland ingood agricultural and environmental condition(“cross-compliance”).
• There will be a strengthened rural developmentpolicy with more EU money and new measuresto promote the environment, quality, andanimal welfare and to help farmers meet EUproduction standards starting in 2005.
• Direct payments for bigger farms will be reduced(“modulation”) to finance the new rural devel-opment policy.
• A mechanism will be implemented for financialdiscipline to ensure that the farm budget fixeduntil 2013 is not exceeded.
• Specific revisions to the market policy of theCAP include:— Making asymmetric price cuts in the milk sec-
tor, with the intervention price for butterreduced, as noted earlier, by 25 percent overfour years.For skimmed milk powder, a 15 per-cent reduction over three years, as agreed on inAgenda 2000, is retained.
— Reducing the monthly increments in thecereals sector by half while maintaining thecurrent intervention price.
— Implementing reforms in the rice, durumwheat, nuts, starch potatoes, and dried foddersectors.
54 Turkey: Economic Reform and Accession to the European Union

According to the Mid-term Review, the reformshave the following objectives:
• First, enhance the competitiveness of EU agricul-ture by setting intervention as a real safety netmeasure, allowing EU producers to respond tomarket signals (i.e., world prices), while protect-ing them from extreme price fluctuations. Thereforms as adopted by the member states did notgo as far as was proposed in the Mid-term Review,which had included further reduction in the sup-port price for cereals, but they still representedprogress toward this goal.
• Second, promote market-oriented, sustainableagriculture by completing the shift from productto producer support with the introduction of adecoupled system of payments per farm, based onhistorical references and conditional upon cross-compliance toenvironmental,animalwelfare,andfood quality criteria. Again, the Mid-term Reviewproposal was more ambitious than the programactually adopted, because it will allow memberstates to pay up to 25 percent of support (or morefor durum wheat and certain kinds of beef pay-ments) as coupled payments if necessary to avoidabandonment of production. It is expected, how-ever, that few states will use this exception.
• Third, strengthen rural development by transfer-ring funds from the first pillar (payments toproducers) to the second pillar (funding topromote rural development) of the CAP. Thistransfer process is known as “dynamic modula-tion.” Payments under the second pillar will beincreased to 30 percent of the CAP budget fromits current 10 percent. Because small farmerswill be exempt from modulation, it would affect25 percent of farmers, who now receive about80 percent of the direct payments. Funds savedby “modulation” will be redistributed to themember states based on several criteria, and thesouthern states are expected to be the net gain-ers. The reform will also expand the scope of thecurrently available instruments for rural devel-opment to promote food quality, meet higherstandards, and foster animal welfare.
Although this reform process is beingdriven largely by the internal needs of the EU—particularly the need to simplify the CAP andcontrol the potentially explosive budgetary impli-cations that accession of the Central and Eastern
European countries would have for an unreformedCAP—the reforms would have other salutaryeffects outside the EU. Most important, they willreduce the need to rely on export subsidies to dis-pose of surplus production, and they will providean alternative way to support farmers’ incomeswithout high domestic prices. Thus the reformswill increase the EU’s flexibility to agree in theDoha negotiations to phase out export subsidiesand increase market access (i.e., to reduce tariffsand nontariff barriers). This point is important,because the EU is almost alone in its position—maintained throughout the WTO’s Cancun minis-terial meeting in September 2003—that exportsubsidies should not be phased out (only reduced)under the Doha Round agreement. Most otherWTO members interpret the Doha Declaration’swording that export subsidies would be reduced“with a view to eliminating” them as meaning thatthe eventual agreement will require that these sub-sidies eventually be totally eliminated.
Although the magnitudes have not been esti-mated definitively, the reform process would alsolead to some direct improvements in internationalmarket conditions for developing country (andother) producers. The European Commission’ssimulations estimate that by 2009–10 EU exports ofcereals will fall by 3.8 percent and exports of beefby 60 percent. Eurocare estimates that the EU willbecome a net importer of beef. Other simulationsindicate an effect on world cereal prices of 2 per-cent or less, although, because it would entail amove from a very trade-distorting mechanismof support to one with relatively small trade-distorting effects,19 there is some reason to thinkthat the impact may be more substantial.
Beyond the Mid-term Review The adoption ofthe proposals in the Mid-term Review wouldessentially decouple payments from production inthe grain and oilseed markets and partially decou-ple them in beef, but some important sectors arenot touched by the reforms, including sugar andtobacco. The same motivations for reform arepresent in these sectors, and other pressures will beoperating to ensure that these sectors also areeventually reformed, using much the same modelused for grains and oilseeds. One of these motiva-tions is the Doha negotiations. As noted, the EUwill be under tremendous pressure to agree to theelimination of export subsidies. Another very
Analysis of the Impact of EU Enlargement on the Agricultural Markets and Incomes of Turkey 55

important motivation—especially for sugar—isthe “Everything but Arms” (EBA) initiative. Underthe EBA, the EU has eliminated tariff and nontariffbarriers20 to the imports of all products from thedeveloping countries. For most products, this sys-tem has been in effect since 2001, but for rice,bananas, and sugar there are phase-in periods. Forsugar, the phase-in period is until 2009, but after2009 sugar will enter the EU duty- and quota-freefrom developing countries, clearly ending thesugar regime under the CAP. Before the regimeends, sugar prices in the EU will have to fall tosomething much closer to world prices, and pro-ducers may have to be brought under the directpayment system. The EU is also currently negotiat-ing Economic Partnership Agreements with manyother developing countries. Although it is not clearwhat form these agreements will take, the basicintention is that essentially they will be reciprocalfree trade agreements. Such agreements will puteven more pressure on the CAP to complete thetransition to a regime of very low import barriersfor products that can be produced in developingcountries and a regime in which farmers are com-pensated for income losses by decoupled directpayments.
In September 2003, the European Commissiontabled its proposal for reforms in the cotton,tobacco, sugar, and olive oil sectors. The main fea-tures of the proposals are the following:
• Tobacco. The production-coupled premium ontobacco would be completely eliminated, withmost of it rolled into the decoupled single-farmpayment and the rest put into a fund for restruc-turing tobacco-producing areas.
• Olives. The current system of production-linkedpayments would be eliminated. For farms under0.3 hectares, coupled payments would be elimi-nated and replaced with only single-farm pay-ments. For large farms, 60 percent of their cou-pled payments would be converted intosingle-farm payments. The rest of the budgetthat would have funded the coupled paymentsfor these farms would be converted into pay-ments based on hectares or number of trees toensure the permanence of olive trees in marginalareas or low-output olive groves. This measuremay act as a production incentive, but it isintended to be an environmental measure.
• Cotton. Sixty percent of the current coupled pay-ments would be converted into single-farm pay-ments. The other 40 percent would be retainedas an area-based payment, based on cotton hec-tarage. Thus this 40 percent would remain fullycoupled, though based on area rather than pro-duction. The new area payment would be givenfor a maximum number of hectares, but admin-istered in the same way as current blue boxmeasures, with area ceilings set on a regionalbasis and any excess in the region resulting in areduction in payments to all farmers in theregion.21 This situation implies that the measuremay not be very effective in controlling the areaplanted, because farmers have little incentive tostay below the ceiling.
• Sugar. There is no specific proposal but rathertwo options: (1) relatively small changes in thecurrent system, or (2) radical reform, withdomestic prices lowered to world market levelsand direct support payments increased in com-pensation. In view of the pressures facing theCAP sugar regime, it seems likely that some-thing close to the second option will have to beadopted.
Impact of Introducing the CommonAgricultural Policy in Turkey
This section employs a partial equilibrium modelof the Turkish agricultural sector to simulate theeffects of introducing the CAP.22 The model pro-vides information about the likely impact of theCAP on farmers’ and consumers’ incomes andits budgetary implications. Because the CAP hasbeen a “moving target,” the model does not incor-porate the most recent reforms, but rather uses theAgenda 2000 scenario. Subsequent reforms havebeen of the same variety as those in the Agenda2000 program, but they have moved further inreducing support prices and distributing support asdecoupled payments. These later reforms couldthen be generally expected to result in lowerdomestic producer and consumer prices than thoseproduced by Agenda 2000 reforms, but with higherdirect payments.
The model considers 11 major agricultural prod-ucts: wheat, barley, maize, sunflower, sugar beet,potato, grapes, milk, beef, poultry, and ovine meat.Table 2.7 shows the base period results for the major
56 Turkey: Economic Reform and Accession to the European Union

57
TABLE 2.7 Base Period Results of Model for Major Activities
BorderEquivalent Quantity VA, Inclusive
Actual Price Price Produced GOV Direct(thousand TL (thousand TL (thousand GOV (billions Share Payments VA Share
per metric ton) per metric ton) metric tons) of TL) (percent) (billions of TL) (percent)
Wheat 97,325 73,412 15,866.67 1,544,223.37 18.10 781,454.26 16.16Barley 80,765 56,850 6,189.17 499,868.64 5.86 284,464.38 5.88Maize 90,000 64,475 2,152.33 193,709.97 2.27 74,848.48 1.55Sunflower 292,692 141,069 816.67 260,259.67 3.05 205,825.27 4.26Sugar beet 36,612 20,585 16,807.79 618,223.98 7.25 543,851.74 11.25Potato 132,444 100,017 5,081.33 672,992.07 7.89 595,596.29 12.32Grapes 280,139 222,260 3,250.67 910,638.60 10.67 847,373.01 17.52Milk 167,041 97,945 7,466.33 1,450,093.01 16.99 682,852.63 14.12Beef 2,153,528 1,085,793 444.67 1,086,378.40 12.73 326,386.03 6.75Poultry 748,350 469,748 725.00 542,553.75 6.36 180,598.86 3.73Sheep 2,244,433 1,762,319 237.67 753,628.09 8.83 312,353.42 6.46
Intermediate Intermediate VA, BorderInputs, Inputs, Border VA, Actual Price NPR on
Actual Price Price Equivalent Price Equivalent Tradable(thousand TL (thousand TL (thousand TL (thousand TL NPR EPR Inputs
per metric ton) per metric ton) per metric ton) per metric ton) (percent) (percent) (percent)
Wheat 48,074 45,462 49,251 27,949 32.57 76.22 5.74Barley 34,803 32,153 45,962 24,697 42.07 86.10 8.24Maize 55,224 52,335 34,776 12,140 39.59 186.45 5.52Sunflower 66,654 59,687 252,031 81,381 107.48 209.69 11.67Sugar beet 4,425 4,243 32,357 16,342 77.86 98.00 4.29Potato 15,231 13,486 117,213 86,531 32.42 35.46 12.94Grapes 19,462 19,684 260,677 202,576 26.04 28.68 -1.13Milk 102,760 76,925 91,458 47,712 70.55 91.69 33.59Beef 1,709,127 1,301,899 734,001 83,372 98.34 780.39 31.28Poultry 499,248 382,865 249,102 86,882 59.31 186.71 30.40Sheep 1,856,693 1,370,015 1,314,248 1,350,414 27.36 �2.68 35.52
Note: Gross output value (GOV) comprises the output value from main products and, if applicable, from by-products. Consequently, value added (VA) is calculatedon the basis of these gross output values. All variables are measured in terms of 2000 prices. TL = Turkish liras; NPR = nominal protection rate; EPR = effective protection rate.Source: The authors.

activities carried out under the agricultural policiesfollowed during 2000.23 From the table it followsthat wheat, milk, and beef are the most importantcommodities considered, because these commodi-ties have the highest shares of total gross output. Butthe order changes to grapes, wheat, and milk whenwe consider the value added shares, and to grapes,wheat, and potato when we consider the valueadded shares measured at border price equiva-lents.24 The table reveals that crop products consti-tute 68.93 percent of total value added generated bythe 11 commodities and that animal productsaccount for 31.07 percent of the total value added.
Impact on Producers
The domestic prices of the commodities shown intable 2.7 diverge considerably from the border priceequivalents. Examination of the profile of nominalprotection rates (NPRs)25 reveals the height of pro-tection in agriculture in Turkey observed earlier intable 2.5 for aggregates such as cereals and oilseeds.Table 2.7 shows a similar picture for the 11 com-modities analyzed. The NPRs of these commoditiesare all positive, and NPR exceeds 100 percent forsunflower. Indeed, the NPRs lie between 50 percentand 100 percent for beef, sugar beet, milk, andpoultry, and are between 20 percent and 50 percentfor barley, maize, wheat, potato, sheep, and grapes.To examine the effects of agricultural policies onfarmers’ incomes, we consider first the NPRs ofpurchased intermediary inputs to agriculture. Con-sider, for example, wheat production. Although thecost of intermediate inputs per metric ton of wheatamounts to TL 48.074 million, the cost of interme-diate inputs evaluated at border price equivalentsamount to TL 45.463 million. Thus, the intermedi-ate inputs are taxed on average by 5.74 percent.Among the inputs, the most important cost posi-tions are fertilizers (28.2 percent), seeds (25 per-cent), and fuel (21.4 percent). A comparison of thedomestic prices of each of these inputs with theirborder price equivalents reveals an implicit taxa-tion of 32.6 percent for seed and subsidization of3.4 percent for fertilizers.
Farmers’ income is determined by the differencebetween input costs and revenues originating fromthe sale of agricultural produce, and by any non-price-related monetary transfers to farmers (e.g., perhectare payments for crops or per head payments for
livestock). Agricultural policies with an impact oninput prices, output prices, or other direct monetarytransfers translate into changes in the value added,defined as the difference between the value of grossoutput and the value of intermediate inputs, or, interms of factor payments, the return to land, labor,and owned capital. This effect is computed using theeffective protection rate (EPR).26 Table 2.7 displaysthe value added of the analyzed activities at domesticprices in relation to value added at border priceequivalents. As expected, the levels of effective pro-tection are more pronounced than those of nominalprotection. The incomes of producers of crop andlivestock products are all implicitly subsidized underthe agricultural policies followed during 2000 exceptfor the incomes of producers of sheep. The extent ofrelative subsidization measured by the EPR is highestfor beef, and this measure decreases for sunflower,poultry, maize, sugar beet, milk, barley, wheat,potato, and grape production. Sheep production hasa negative EPR, with an absolute value less than 100,indicating the comparative advantage of the countryin the production of sheep.
Alternative Agricultural Policy Options for Turkey
We assume that, as a new entrant, Turkey will have toadjust to the EU and accept its legislation and poli-cies. Accession negotiations will therefore focus onhow long Turkey will have to adopt the EU legisla-tion and how it will do so. However, agricultural pol-icy in the EU is also evolving beyond the changesintroduced under the McSharry reforms and Agenda2000. Because it is not easy to anticipate what EUagricultural policies will be at the time of Turkey’saccession, we use a simulation approach to analyzethe potential impacts, using the following scenarios:
• Scenario A1: partial adoption of Agenda 2000without direct payments
• Scenario A2: complete adoption of Agenda2000, including direct payments equal to thosecurrently applied in the EU
• Scenario B: adoption of the European Commis-sion proposal similar to that given CEE coun-tries, including direct payments at a level of35 percent of payments granted in the EU mem-ber countries
• Scenario C: free trade with direct payments.
58 Turkey: Economic Reform and Accession to the European Union

Simulation results for Scenario A1 are presentedin table 2.8a. When Turkey adopts Agenda 2000without direct payments, domestic prices decreasesubstantially for all commodities except grapes,milk, and poultry. For example, the price of wheatdecreases from TL 97,325,000 per metric ton in thebase case scenario to TL 73,412,000 per metric ton.Similarly, the prices of barley, maize, sunflower,sugar beet, potatoes, beef, and sheep fall signifi-cantly. With the decrease in output prices, the grossoutput value decreases for all commodities underconsideration except poultry and milk. Similar con-siderations hold for the value added; it decreases forall commodities except grapes, milk, poultry, andsheep. Relative to the base case scenario, the largestdecreases occur for sunflower, beef, and wheat.Finally, the share of crop products in total valueadded generated by the 11 commodities decreasesfrom 68.93 percent in the base case scenario to62.66 percent in Scenario A1.
In Scenario A2 Turkey adopts Agenda 2000 in fulland introduces direct payments to agricultural pro-ducers equal to those applied in the EU (table 2.8b).Because prices are basically the same as in ScenarioA1, only those activities to which the direct paymentschemes apply will be affected. Among the produc-tion activities considered are wheat, barley, maize,sunflower, milk, beef, and sheep. As a result of thedirect payments, the value added relative to the baseperiod increases as shown in table 2.8b by 71.42 per-cent for barley, 57.72 percent for beef, and 48.06 per-cent for sheep. For sunflower, the decline in valueadded in Scenario A2 (Agenda 2000 with direct pay-ments) is smaller than that in Scenario A1 (Agenda2000 with no direct payments). For wheat, barley,maize,and beef, the decline in value added turns intoincreases in value added.Whereas wheat productiondeclines by 41.78 percent in Scenario A1, it increasesin Scenario A2 by 38.62 percent relative to the baserun. Similar considerations apply for barley, maize,and beef. The increase in milk production goes upfrom 24.47 percent in Scenario A1 to 45.82 percentin Scenario A2, and the increase in sheep productiongoes up from 6.28 percent in Scenario A1 to48.06 percent in Scenario A2.As for the share of cropproducts generated by the 11 commodities, in totalvalue added, it decreases from 68.93 percent in thebase case to 62.32 percent in Scenario A2.
Table 2.9a displays the results of Scenario B. Inthis scenario, direct payments are introduced, but,
following the EU proposals for Central and EasternEuropean countries, on a level of 35 percent ofdirect payments granted to agricultural producersin the EU. The final results of the introduction ofthe CAP will depend on the positions taken by thegovernment of Turkey and the European Commis-sion. Because the negotiations have not yet started,we analyze only the effects of the introduction ofdirect payments at the rate of 35 percent of EU lev-els.27 Table 2.10 shows the positions taken in agri-cultural negotiations between the Slovak Republicand the European Commission. The table revealsthat the main issues in the agricultural negotiationswill be the shares of compensation payments forcrops and livestock as a percentage of the EU directpayments, the level of reference yield for crop com-pensation payments, the level of quotas for sugarand milk, slaughter premiums, suckler cow premi-ums, and ewe ceilings.
In Scenario B, the value added generated in theproduction of wheat, barley, maize, sunflower,milk, beef, and sheep decreases considerably com-pared with the value added generated in ScenarioA2. The change in value added compared with thebase case becomes negative for wheat, maize, andbeef production, indicating the extreme vulnerabil-ity of the sectors to changes in direct payments. Theshare of crop products in total value added gener-ated by the 11 commodities decreases now from68.93 percent in the base case to 62.52 percent inScenario B.
Table 2.9b presents the results of Scenario C—removal of current trade interventions but withdirect payments as under Agenda 2000. In the freetrade scenario with direct payments, the valueadded increases compared with the base case forwheat, barley, beef, and sheep production. For allother commodities, the value added decreases.The share of crop products of total value addedgenerated by the 11 commodities remains almostunchanged.
Effects of Policies on Producers’ Incomes in the Medium Term: Adjusting for SupplyResponse Effects
The discussion so far has been based on theassumption that the output levels for all analyzedactivities remain constant (i.e., the assumption oftotally inelastic supply). This is a simplifying
Analysis of the Impact of EU Enlargement on the Agricultural Markets and Incomes of Turkey 5959

60
TABLE 2.8b Simulation Results for Adoption of Agenda 2000 with Direct Payments (Scenario A2)
Quantity Direct GOV Change VA ChangeDomestic Price Produced Payments GOV Relative to VA VA Relative to(thousand TL (thousand (billions (billions Base Run (billions Share EPR Base Run
per metric ton) metric tons) of TL) of TL) (percent) of TL) (percent) (percent) (percent)
Wheat 73,412 15,867 628,217 1,793,013 16.11 1,083,218 17.85 144.26 38.62Barley 74,155 6,189 238,716 697,671 39.57 487,616 8.04 219.01 71.42Maize 76,283 2,152 41,339 205,526 6.10 90,665 1.49 246.98 21.13Sunflower 141,069 817 70,112 185,318 −28.80 137,889 2.27 107.47 −33.01Sugar beet 26,867 16,808 0 451,569 −26.96 379,559 6.26 38.19 −30.21Potato 100,017 5,081 0 508,220 −24.48 441,846 7.28 0.49 −25.81Grapes 376,586 3,251 0 1,224,157 34.43 1,160,892 19.13 76.29 37.00Milk 180,301 7,466 145,791 1,658,707 14.39 995,757 16.41 179.52 45.82Beef 1,614,137 445 339,577 1,186,106 9.18 514,770 8.48 1288.54 57.72Poultry 888,077 725 0 643,856 18.67 313,190 5.16 397.21 73.42Sheep 2,055,348 238 130,488 839,176 11.35 462,468 7.62 44.09 48.06
Note: All variables are measured in terms of 2000 prices. TL = Turkish liras; NPR = nominal protection rate; GOV = gross output value; VA = value added; EPR = effectiveprotection rate.
Source: The authors.
TABLE 2.8a Simulation Results for Partial Adoption of Agenda 2000 without Direct Payments (Scenario A1)
Domestic NPR, Quantity GOV Change NPR, VA ChangePrice Main Produced GOV Relative Intermediary VA VA Relative
(thousand TL Outputs (thousand (billions to Base Run Inputs (billions Share EPR to Base Runper metric ton) (percent) metric tons) of TL) (percent) (percent) of TL) (percent) (percent) (percent)
Wheat 73,412 0.00 15,867 1,164,796 −24.57 −1.60 455,001 10.17 2.60 −41.78Barley 74,155 30.44 6,189 458,955 −8.18 5.56 248,900 5.56 62.84 −12.50Maize 76,283 18.31 2,152 164,187 −15.24 1.97 49,326 1.10 88.78 −34.10Sunflower 141,069 0.00 817 115,206 −55.73 −2.70 67,777 1.52 1.98 −67.07Sugar beet 26,867 30.52 16,808 451,569 −26.96 0.98 379,559 8.48 38.19 −30.21Potato 100,017 0.00 5,081 508,220 −24.48 −3.14 441,846 9.88 0.49 −25.81Grapes 376,586 69.43 3,251 1,224,157 34.43 −1.13 1,160,892 25.95 76.29 37.00Milk 180,301 84.08 7,466 1,512,916 4.33 15.43 849,966 19.00 138.60 24.47Beef 1,614,137 48.66 445 846,529 −22.08 15.97 175,193 3.92 372.56 −46.32Poultry 888,077 89.05 725 643,856 18.67 19.13 313,190 7.00 397.21 73.42Sheep 2,055,348 16.63 238 708,689 −5.96 15.69 331,980 7.42 3.44 6.28

61
TABLE 2.9b Simulation Results for Adoption of Free Trade with Direct Payments (Scenario 2C)
Domestic Quantity Direct GOV Change VA ChangePrice Produced Payments GOV Relative to VA VA Relative to
(thousand TL (thousand (billions (billions Base Run (billions Share EPR Base Runper metric ton) metric tons) of TL) of TL) (percent) of TL) (percent) (percent) (percent)
Wheat 73,412 15,867 628,217 1,793,013 16.11 1,071,679 24.17 141.66 37.14Barley 56,850 6,189 238,716 590,568 18.14 391,569 8.83 156.17 37.65Maize 64,475 2,152 41,339 180,111 −7.02 67,468 1.52 158.21 −9.86Sunflower 141,069 817 70,112 185,318 −28.80 136,573 3.08 105.49 −33.65Sugar beet 20,585 16,808 0 345,981 −44.04 274,666 6.20 0.00 −49.50Potato 100,017 5,081 0 508,220 −24.48 439,691 9.92 0.00 −26.18Grapes 222,260 3,251 0 722,494 −20.66 658,508 14.85 0.00 −22.29Milk 97,945 7,466 145,791 1,076,369 −25.77 502,024 11.32 40.93 −26.48Beef 1,085,793 445 339,577 955,562 −12.04 376,650 8.50 915.98 15.40Poultry 469,748 725 0 340,567 −37.23 62,990 1.42 0.00 −65.12Sheep 1,762,319 238 130,488 777,044 3.11 451,437 10.18 40.66 44.53
Note: All variables are measured in terms of 2000 prices. TL = Turkish liras; NPR = nominal protection rate; GOV = gross output value; VA = value added;EPR = effective protection rate.Source: The authors.
TABLE 2.9a Simulation Results for Adoption of Agenda 2000 with Direct Payments at 35 Percent (Scenario 2B)
Border GOV Change VA ChangeEquivalent NPR Domestic Quantity Direct Relative NPR Relative
Price Main Price Produced Payments GOV to Base Intermediary VA VA to Base(thousand TL Outputs (thousand TL (thousand (billions (billions Run Inputs (billions Share EPR Run
per metric ton) (percent) per metric ton) metric tons) of TL) of TL) (percent) (percent) of TL) (percent) (percent) (percent)
Wheat 73,412 0.00 73,412 15,867 219,876 1,384,672 −10.33 −1.60 674,877 13.41 52.18 −13.64Barley 56,850 30.44 74,155 6,189 83,550 542,506 8.53 5.56 332,451 6.61 117.50 16.87Maize 64,475 18.31 76,283 2,152 14,469 178,656 −7.77 1.97 63,794 1.27 144.15 −14.77Sunflower 141,069 0.00 141,069 817 24,539 139,745 −46.31 −2.70 92,316 1.83 38.90 −55.15Sugar beet 20,585 30.52 26,867 16,808 0 451,569 −26.96 0.98 379,559 7.54 38.19 −30.21Potato 100,017 0.00 100,017 5,081 0 508,220 −24.48 −3.14 441,846 8.78 0.49 −25.81Grapes 222,260 69.43 376,586 3,251 0 1,224,157 34.43 −1.13 1,160,892 23.07 76.29 37.00Milk 97,945 84.08 180,301 7,466 51,027 1,563,943 7.85 15.43 900,993 17.91 152.92 31.95Beef 1,085,793 48.66 1,614,137 445 118,852 965,381 −11.14 15.97 294,045 5.84 693.16 −9.91Poultry 469,748 89.05 888,077 725 0 643,856 18.67 19.13 313,190 6.22 397.21 73.42Sheep 1,762,319 16.63 2,055,348 238 45,671 754,360 0.10 15.69 377,651 7.51 17.67 20.90

assumption, but one that presumably captures theessence of short-run effects. However, after sometime producers would begin to adjust to the newprice situation, readjusting the output mix and theoverall level of resource intensity. The medium- tolong-term supply response in the model is deter-mined by the elasticities of supply.28
When supply effects are taken into considera-tion, modeling the impact of introducing the CAPwith direct payments becomes tricky for the follow-ing reason: the direct payments are made perhectare currently planted, with the amount perhectare computed by multiplying a basic per metricton payment amount by a historical regional yieldfor the 1986–91 baseline period. The payments arenot based on the individual farmer’s current levelsof production (yield). For this reason, the directpayment should not affect the farmer’s cultivationdecisions,29 but it does affect the farmer’s decisionon how many hectares to plant. Under Agenda2000, these payments were originally crop-specificfor large farmers (the “professional farmer”scheme) and non-crop-specific for small farmers(the “small producer” scheme). However, even for
large farmers, under Agenda 2000 the payments perhectare for cereals and oilseeds have been progres-sively aligned, and by the end of the Agenda 2000period they will be virtually equal.30 Thus the pay-ments will not affect whether a large farmerchooses to plant, say, wheat or sunflower, or thefarmer’s decision on how much seed or fertilizer touse. They will, however, affect the amount of arableland in cultivation. In this sense, the direct pay-ments do have an impact on agricultural produc-tion, but they do not have as much of an effect onincentives to plant individual crops as would addi-tional income from higher prices for the products.This factor makes it difficult to model the pay-ments’ effects. In the simulations, we first treat thepayments as if they do not come from higher prices.The resulting supply response should then beregarded as a lower bound (Case I).31 In Case I, thepayments do not produce any supply response, butthey do increase value added. Next, we treat thepayments as if they come from higher prices andthus generate an increase in production. The result-ing supply response should be regarded as an upperbound (Case II).
62 Turkey: Economic Reform and Accession to the European Union
TABLE 2.10 Selected Positions in Agricultural Negotiation between the SlovakRepublic and European Commission (EC)
SlovakEC Proposal Proposal
Share of compensation payments for crops and livestock (% of EU)a 35 100Reference yield for crop compensation payments
(cereal metric ton per hectare)b 4.16 4.99Sugar quota—type A (metric tons)c 189,800 190,000Sugar quota—type B (metric tons)c 19,000 45,000Milk quota (metric tons) 946,150 1,235,000Slaughter premium—adults (head)d 204,062 260,000Slaughter premium—calves (head)d 62,841 60,000Suckler cow premium (head)d 39,708 50,000Ewe ceilings (head)d 219,360 370,000
a. As percent of payments granted to farmers in EU member countries.b. Reference yield used in calculation of compensatory payments for crops.c. Sugar beets used to produce sugar up to the A quota secure a higher price (about €46.72 permetric ton in 2000). Sugar beets used to produce sugar above the A quota and up to the B quota securea slightly lower price (about €32.42 per metric ton in 2000). Sugar production exceeding the sum ofboth quotas has to be exported at world market prices (i.e., without export refunds). It is known as C sugar.d. Number of head eligible for compensation payments.Source: Csaki and others 2002.

We adjust the medium-run supply elasticities, ei ,to capture the difference in the ratio of value addedto price. In particular, the adjusted elasticities, εi ,are calculated (as emphasized by Valdes 1973) bymultiplying the unadjusted elasticities with theratio of value added to product price so thatε = ei vi, where vi is the ratio of the per unit valueadded at base run prices to the base period price.The supply response is then computed by applyingthe relation
(2.1)�qj
qj= ε
(VAjA2
VAjBase− 1
)
where qj indicates the quantity of product j, VAjA2
the value added generated in the production ofcommodity j in Scenario A2 (Agenda 2000 withdirect payments), and VAjBase the value added gen-erated in the production of commodity j in the basecase. Here we first incorporate the direct paymentsunder Agenda 2000 as part of the value added;thereafter we abstract from considering direct pay-ment as part of value added.
Table 2.11 shows the effects of the alignment toAgenda 2000 under alternative elasticities of sup-ply. For each commodity, the first column showsthe results under the assumed medium-run supplyelasticities and the second column the results underthe assumption of a completely inelastic supplyresponse. The table reveals that output quantitiesunder the Agenda 2000 scenarios decrease, on aver-age, by 3.7 percent for Scenario A1 and increase by2.5 percent for Scenario A2 under Case II. Asexpected, the introduction of direct payments givesincentives to increase the output relative to the casein Scenario A1.
Furthermore, the changes in total value added inthe simulations with a supply response are largerthan under a totally inelastic response. Similarly,Case II results in higher changes in total value addedcompared with Case I. Consider, for example, wheatproduction. Whereas total value added generated inwheat production increases by 38.62 percent in Sce-nario A2 (Agenda 2000 with direct payments) underthe inelastic response assumption and Case II, theincrease goes up to 46.20 percent under the elasticsupply assumption and Case II. By contrast, underelastic supply the value added under Case I increasesby only 30.41 percent. Under free trade with directpayments (Scenario C) and Case II, value added gen-erated in wheat production goes up by 37.14 percent
under inelastic supply and by 44.36 percent underthe elastic supply assumption. Note that in ScenarioC, the value added increases despite the lower pricesfor wheat, barley, beef, and sheep. As a result, thequantity produced increases under elastic supplyand Case II—5.26 percent for wheat, 4.50 percentfor barley, 1.78 percent for beef, and 15.64 percentfor sheep production. In all other cases, the quantityproduced decreases by 0.53 percent for maize,4.64 percent for sunflower, 14.87 percent for sugarbeet, 21.78 percent for potato, 2.07 percent forgrapes, 17.11 percent for milk, and 40.75 percentfor poultry.
Impact on Consumers
Changes in agricultural output prices also have animpact on consumers through food prices. Lowerfood prices lead to a decrease in consumer spend-ing on food. A consumer with a fixed, nominal dis-posable income (i.e., a fixed amount of moneyavailable for consumption) is able to increase his orher overall consumption of total goods and servicesby a percentage derived from multiplying theabsolute value of the percentage decrease in foodexpenditure by the share that food expendituremakes up of total consumption. This increase in theconsumer’s ability to purchase goods and services isequivalent to an increase in his or her real income.The relative increase in real consumer incomes ishighest for households with low disposableincomes, because poor households allocate a highershare of expenditures to food products. In themedium to long term, consumers will adjust tothe new set of relative prices, moving away from theconsumption of foods that have become relativelymore expensive as a result of the policy changes.The medium- to long-term impact on income,therefore, is expected to be more moderate than theshort-run impact. The exact amount will be deter-mined by the price elasticity of demand for eachproduct, which regulates the extent of consumers’adjustments to changes in food prices.
To trace the effects of changes in output priceson consumers, we start with the information onexpenditure given in table 2.12 and annex table 2.20for the average consumer and for the averageconsumer in urban and rural areas, respectively.Consider a commodity such as bread. Annex table2.20 reveals that for the average consumer the
Analysis of the Impact of EU Enlargement on the Agricultural Markets and Incomes of Turkey 63

64
TABLE 2.11 Simulation Results for Alignment to Agenda 2000 under Positive Supply Response(percent change relative to 2000 base run)
Wheat Barley Maize Sunflower Sugar Beet
Elastic Inelastic Elastic Inelastic Elastic Inelastic Elastic Inelastic Elastic Inelastic
Scenario A1
Price change �24.57 �24.57 �8.18 �8.18 �15.24 �15.24 �51.80 �51.80 �26.62 �26.62Quantity change �5.92 0.00 �1.49 0.00 �1.84 0.00 �9.24 0.00 �9.08 0.00GOV change �29.04 �24.57 �9.56 �8.18 �16.80 �15.24 �59.82 �55.73 �33.59 �26.96Total VA change �45.22 �41.78 �13.81 �12.50 �35.31 �34.10 �70.11 �67.07 �36.54 �30.21
Scenario A2(a)
Price change �24.57 �24.57 �8.18 �8.18 �15.24 �15.24 �51.80 �51.80 �26.62 �26.62Quantity change �5.92 0.00 �1.49 0.00 �1.84 0.00 �9.24 0.00 �9.08 0.00GOV change 9.24 16.11 37.49 39.57 4.14 6.10 �35.37 �28.80 �33.59 �26.96Total VA change 30.41 38.62 68.85 71.42 18.90 21.13 �39.20 �33.01 �36.54 �30.21
Scenario A2(b)
Price change �24.57 �24.57 �8.18 �8.18 �15.24 �15.24 �51.80 �51.80 �26.62 �26.62Quantity change 5.47 0.00 8.53 0.00 1.14 0.00 �4.55 0.00 �9.08 0.00GOV change 22.46 16.11 51.48 39.57 7.31 6.10 �32.03 �28.80 �33.59 �26.96Per unit VA change 38.62 38.62 71.42 71.42 21.13 21.13 �33.01 �33.01 �30.21 �30.21Total VA change 46.20 38.62 86.05 71.42 22.52 21.13 �36.05 �33.01 �36.54 �30.21
Scenario C(a)
Price change �24.57 �24.57 �29.61 �29.61 �28.36 �28.36 �51.80 �51.80 �43.78 �43.78Quantity change �6.13 0.00 �5.53 0.00 �3.52 0.00 �9.33 0.00 �14.87 0.00GOV change 9.00 16.11 11.61 18.14 �10.29 �7.02 �35.44 �28.80 �52.36 �44.04Total VA change 28.73 37.14 30.04 37.65 �13.03 �9.86 �39.84 �33.65 �57.01 �49.50
Scenario C(b)
Price change �24.57 �24.57 �29.61 �29.61 �28.36 �28.36 �51.80 �51.80 �43.78 �43.78Quantity change 5.26 0.00 4.50 0.00 �0.53 0.00 �4.64 0.00 �14.87 0.00GOV change 22.22 16.11 23.46 18.14 �7.52 �7.02 �32.10 �28.80 �52.36 �44.04Total VA change 44.36 37.14 43.84 37.65 �10.34 �9.86 �36.72 �33.65 �57.01 �49.50
Note: GOV = gross output value; VA = value added.
Source: The authors.
Potato Grapes Milk Beef Poultry Sheep
Elastic Inelastic Elastic Inelastic Elastic Inelastic Elastic Inelastic Elastic Inelastic Elastic Inelastic
�24.48 �24.48 34.43 34.43 7.94 7.94 �25.05 �25.05 18.67 18.67 �8.42 �8.42�21.48 0.00 3.44 0.00 15.81 0.00 �5.37 0.00 45.94 0.00 2.21 0.00�40.70 �24.48 39.06 34.43 20.83 4.33 �26.26 �22.08 73.19 18.67 �3.89 �5.96�41.75 �25.81 41.72 37.00 44.15 24.47 �49.21 �46.32 153.09 73.42 8.63 6.28
�24.48 �24.48 34.43 34.43 7.94 7.94 �25.05 �25.05 18.67 18.67 �8.42 �8.42�21.48 0.00 3.44 0.00 15.81 0.00 �5.37 0.00 45.94 0.00 2.21 0.00�40.70 �24.48 39.06 34.43 32.47 14.39 3.32 9.18 73.19 18.67 13.81 11.35�41.75 �25.81 41.72 37.00 68.88 45.82 49.25 57.72 153.09 73.42 51.33 48.06
�24.48 �24.48 34.43 34.43 7.94 7.94 �25.05 �25.05 18.67 18.67 �8.42 �8.42�21.48 0.00 3.44 0.00 29.60 0.00 6.69 0.00 45.94 0.00 16.88 0.00�40.70 �24.48 39.06 34.43 48.25 14.39 16.48 9.18 73.19 18.67 30.15 11.35�25.81 �25.81 37.00 37.00 45.82 45.82 57.72 57.72 73.42 73.42 48.06 48.06�41.75 �25.81 41.72 37.00 88.99 45.82 68.27 57.72 153.09 73.42 73.06 48.06
�24.48 �24.48 �20.66 �20.66 �41.36 �41.36 �49.58 �49.58 �37.23 �37.23 �21.48 �21.48�21.78 0.00 �2.07 0.00 �30.90 0.00 �10.27 0.00 �40.75 0.00 0.97 0.00�40.93 �24.48 �22.31 �20.66 �48.71 �25.77 �21.08 �12.04 �62.81 �37.23 4.10 3.11�42.25 �26.18 �23.90 �22.29 �49.20 �26.48 3.55 15.40 �79.34 �65.12 45.92 44.53
�24.48 �24.48 �20.66 �20.66 �41.36 �41.36 �49.58 �49.58 �37.23 �37.23 �21.48 �21.48�21.78 0.00 �2.07 0.00 �17.11 0.00 1.78 0.00 �40.75 0.00 15.64 0.00�40.93 �24.48 �22.31 �20.66 �38.47 �25.77 �10.47 �12.04 �62.81 �37.23 19.24 3.11�42.25 �26.18 �23.90 �22.29 �39.06 �26.48 17.46 15.40 �79.34 �65.12 67.14 44.53
Alignment, excluding direct compensatory payments
Complete alignment, including direct compensatory payments (Case I)
Complete alignment, including direct compensatory payments (Case II)
Free trade with direct payments (Case I)
Free trade with direct payments (Case II)

Analysis of the Impact of EU Enlargement on the Agricultural Markets and Incomes of Turkey 65
expenditure share for bread is 3.5371 percent.Next, we consider the value share of the primarycommodity in bread, wheat. Multiplying the expen-diture on bread with this share, we obtain the valueof the analyzed primary commodity (wheat) in thebread expenditure. Considering the price relationpi = p∗
i (1 + NPRi ), where pi denotes the domes-tic price, p∗
i the Agenda 2000 price of wheat, andNPRi the nominal protection rate on wheat, weobtain the relation p∗
i = Pi
1+NPRi. We then normalize
the domestic price so that pi = 1 for wheat in thebase case. By means of the NPR, we determinethe foreign price of wheat. Then, by multiplying theexpenditure on bread in the form of wheat with theforeign price, we can determine the value of the pri-mary commodity (wheat) evaluated at foreignprices in the bread expenditure. By adding the valueof the contents of bread other than wheat, we arriveat the value of bread evaluated at Agenda 2000prices. Based on the expenditure of the averageincome group on bread evaluated at base yearprices and the expenditure on bread evaluated atAgenda 2000 prices, we determine the effect ofAgenda 2000 on the bread expenditure in percent-age terms. Once we conduct similar calculations forall the commodities under consideration, we obtainthe expenditure on food, beverages, and tobaccoevaluated at Agenda 2000 prices. If E stands for total
expenditure, F for food expenditure in the basecase, and F ∗ for food expenditure evaluatedat Agenda 2000 prices, F ∗ can be defined asE ∗ = F ∗ + (E − F ). The effect on consumer wel-fare is then calculated as (E − E ∗)100/E ∗ .32
Table 2.13 summarizes the main results of thesimulations. For each scenario, we estimated theimpact of changes in food prices on, first, the nom-inal expenditure (change of food expenditurerelative to the base period food expenditure) andsecond, consumers’ real income (reduction in pur-chasing power of nominal income induced bychanges in the expenditure on food). The tablereveals that, on average, the price changes under theAgenda 2000 scenario (Scenarios A and B) producea 5.91 percent decrease in the expenditure on food,beverages, and tobacco. As for the expenditure onfood and nonalcoholic beverages only, consumerswould have to spend 6.41 percent less than underthe current base period market conditions. In theAgenda 2000 scenario, the greatest decreases inexpenditure occur in the groups fat (30.53 percent),sugar and sugar products (13.44 percent), and meatand meat products (9.48 percent). Because of thesignificant price changes in the main agriculturalproducts of the Agenda 2000 scenario (comparedwith the prevailing prices in Turkey), decreases inexpenditure were recorded for all food product
TABLE 2.12 Structure of Household Expenditures(1994 prices, Turkish liras)
Average Rural Urban
Total expenses per household 111,044,759 66,698,941 167,764,049Food, beverages, and tobacco per household 39,552,432 30,202,155 51,511,644Food and nonalcoholic beverages per household 36,457,528 28,287,252 46,907,494
Expenditure shares (% of total expenditure)
Cereals and pasta 7.24 9.54 6.07Meat and meat products 5.18 5.69 4.92Milk, dairy products, and eggs 4.61 5.84 3.99Fat 3.00 4.76 2.10Fruit, fresh or dried 7.82 9.65 6.89Sugar and sugar products 1.95 3.07 1.38Other food and nonalcoholic beverages 3.03 3.86 2.61Alcoholic beverages 0.34 0.30 0.36Tobacco 2.45 2.57 2.39
Total food, beverages, and tobacco 35.62 45.28 30.70
Source: Turkish State Institute of Statistics.

66 Turkey: Economic Reform and Accession to the European Union
groups under the assumptions of Scenarios A and Bexcept for milk and dairy products. Scenario C (freetrade with direct payments) also induces a decreasein consumers’ expenditure on food, beverages, andtobacco of about 14.64 percent. Expenditures foralmost all product groups will be reduced.
The results in table 2.13 of the simulated intro-duction of EU-type agricultural policies in Turkey
reveal an increase in consumers’ real income of2.15 percent as an impact of food price changes onaverage households. The increase is more pro-nounced in the lower-income group, the rural sector.Because food makes up a higher share of their totalexpenditures and because their food consumptionbasket has a different mix, lower-income householdsexperience a more significant change in real income
TABLE 2.13 Simulation of Scenario Effects on Real Income, SelectedHousehold Types
Inelastic Demand Own Price ElasticitiesReference Scenario (removal of all divergences) Average Rural Urban Average Rural Urban
Change in real income 5.50 8.09 4.23 3.91 5.97 2.89
Change in nominal expenditure (%)
Food, beverages, and tobacco �14.64 �16.53 �13.23 �10.56 �12.45 �9.14Food, and nonalcoholic beverages �15.88 �17.64 �14.52 �11.45 �13.29 �10.03Cereals and pasta �13.21 �18.41 �9.06 �12.04 �16.90 �8.16Meat and meat products �29.12 �27.79 �29.90 �13.20 �12.63 �13.54Fish and fish products 0.00 0.00 0.00 0.00 0.00 0.00Milk, dairy products, and eggs �25.85 �26.44 �25.40 �18.75 �19.14 �19.82Fat �37.10 �37.11 �37.10 �29.16 �28.56 �29.86Fruits, fresh and dried 0.00 0.00 0.00 0.00 0.00 0.00Vegetables and potatoes �2.54 �3.01 �2.15 �2.34 �2.78 �1.98Sugar and sugar products �22.10 �24.39 �19.51 �20.68 �22.82 �18.24Other food and nonalcoholic beverages 0.00 0.00 0.00 0.00 0.00 0.00Alcoholic beverages �1.08 �1.09 �1.08 �0.87 �0.88 �0.87Tobacco products 0.00 0.00 0.00 0.00 0.00 0.00
Inelastic Demand Own Price Elasticities
Agenda 2000 Scenario Average Rural Urban Average Rural Urban
Change in real income 2.15 3.43 1.51 1.87 3.03 1.28
Change in nominal expenditure (%)
Food, beverages, and tobacco �5.91 �7.32 �4.85 �5.14 �6.49 �4.13Food, and nonalcoholic beverages �6.41 �7.82 �5.33 �5.58 �6.93 �4.53Cereals and pasta �8.03 �11.19 �5.51 �7.22 �10.11 �4.91Meat and meat products �9.48 �9.44 �9.50 �5.20 �4.86 �5.41Fish and fish products 0.00 0.00 0.00 0.00 0.00 0.00Milk, dairy products, and eggs 4.96 5.07 4.88 2.87 2.92 2.83Fat �30.53 �29.36 �31.88 �27.96 �27.14 �28.91Fruits, fresh and dried 0.00 0.00 0.00 0.00 0.00 0.00Vegetables and potatoes �2.54 �3.01 �2.15 �2.34 �2.78 �1.98Sugar and sugar products �13.44 �14.83 �11.86 �12.44 �13.73 �10.98Other food and nonalcoholic beverages 0.00 0.00 0.00 0.00 0.00 0.00Alcoholic beverages �0.12 �0.14 �0.11 �0.10 �0.11 �0.09Tobacco products 0.00 0.00 0.00 0.00 0.00 0.00
Source: The authors.

Analysis of the Impact of EU Enlargement on the Agricultural Markets and Incomes of Turkey 67
than the average of all groups. The immediate intro-duction of Agenda 2000 in Turkey would increasethe real incomes of the households with the lowestincomes by 3.43 percent, which is significantlyhigher than the increase of 1.51 percent for house-holds with the highest income—that is, the urbansector.
Columns 4–6 of table 2.13 present the results ofthe simulation of changes in consumers’ real incomeand in nominal expenditures under the elasticdemand assumption.33 As expected, the effects ofthe “elastic” scenarios are substantially lower thanthose of the “inelastic” scenarios. Under the Agenda2000 scenario, real income increases in the elasticvariant are 1.87 percent instead of 2.15 percent inthe inelastic demand. The pattern of impacts on thedifferent groups of households under the elasticvariant is principally the same as just described.
Impact on the State Budget
In addition to the implications for farmers’ incomesand for consumers, the implementation of EU poli-cies would have wide budgetary implications. Themost important budgetary effects are the directeffects on internal price support measures (e.g., inter-vention purchases and border measures) and thosestemming from direct income transfers.
When estimating the effects of the policy changeson tariff revenues and export refunds, we assumethat before accession Turkey will adopt the EU-likeagricultural policies on its own and will not receiveany compensation from the EU budget for doing so.Under this assumption, we suppose that any subsi-dies to agriculture resulting from adoption of theEU-like agricultural policies will have to be financedfrom the Turkish Treasury.34 Later, we relax thisassumption by considering the case in which Turkeywould receive compensation from the EU budget forintroducing the EU-like agricultural policies. Itshould be noted that the total trade-related budget-ary effects under Scenarios A1, A2, and B are similar,because the level of domestic support prices is thesame for all scenarios under consideration.
The trade-related budgetary implications ofadopting EU-like agricultural policies are analyzedby multiplying the net traded quantity by the dif-ference between the base period domestic price andthe Agenda 2000 price. Whenever the base perioddomestic price exceeds the Agenda 2000 price, theproduct determines the loss in tariff revenue for
imported commodities such as sunflower. Forexported commodities, the product can be consid-ered the decrease in export subsidies, as long as thebase period domestic price exceeds the Agenda2000 price, such as for wheat. Finally, for poultrythe Agenda 2000 price exceeds the base perioddomestic price. Because poultry is an importedcommodity, the product is considered to be anincrease in tariff revenue.
Table 2.14 shows that after adoption of theAgenda 2000 policies Turkey will incur a net trade-related revenue loss of €226 million. In the longerterm, the losses could become even greater as pro-ducers and consumers adjust to the new price lev-els. These results account only for expenditure onthe commodities analyzed in this study. Thus theyare likely to underestimate the true trade-relatedbudgetary effects of an implementation of CAP-type market regimes in Turkey.
The budgetary effects of direct income transferscan be determined for each agricultural commod-ity such as wheat, barley, maize, and beef. Forwheat, direct income support can be determinedfrom the relation [direct payments (euros/metricton)] ∗ [exchange rate (lira/euro)] ∗ [historicalgrain yield for the EU compensatory area payments(metric tons/hectare)] ∗ [quantity of wheat pro-duced (metric tons)]/[actual yield in 2000 perhectare (metric tons/hectare)]. The direct incomesupport for other commodities can be similarlydetermined. A close look at the figures in table 2.14reveals that direct payments to agriculture willamount to €2.772 billion under Scenarios A1 andA2 and to €970 million under Scenario B.
Overall, the budgetary costs to Turkey ofadopting EU-like agricultural policies whenuncompensated by the EU budget for introducingthose policies will be €2.998 billion under Scen-ario A policies and €1.196 billion under Scenario Bpolicies.
After accession to the EU, Turkey will be eligiblefor payments under the EU’s Structural Funds andCohesion Fund. But after accession, Turkey will alsohave to contribute to the EU budget in the form ofVAT-based and GNP-based contributions. The VAT-based contribution is determined by the relation0.008522 ∗ 0.55 ∗ GDP, where the value of 0.008522denotes the proportion used in calculation of theVAT-based contribution, and the parameter valueof 0.55 is derived from the relation that the VATbase may not exceed 55 percent of national GDP.

68 Turkey: Economic Reform and Accession to the European Union
Table 2.15 shows that Turkey’s VAT-based contribu-tion will amount to €1.023 billion. The GNP-basedcontribution is determined by the relation 34.46 ∗(exchange rate) ∗ (share of Turkish GDP in EUGDP), where 34.46 denotes the amount measuredin terms of billions of euros that must be met by theEU budget requirement by the GNP-based contri-bution.35 From table 2.15, we note that Turkey’sGNP-based contribution will be €878 million.
After accession, Turkey will receive from the EUbudget direct income support payments, trade-related net subsidies, payments under the StructuralFunds and Cohesion Fund. The direct income sup-port will amount to €2.772 billion in Scenarios A1and A2 and to €970 million in Scenario B. Trade-related net subsidies, consisting of subsidies onexports minus tariff revenues on imports, are deter-mined by multiplying the net traded quantity(exports minus imports) from third countries bythe difference between the Agenda 2000 price andthe border price. Basing the calculations on theaverage 1999–2001 net trade figures with third
countries, trade-related net subsidies from the EUwill be €23 million. The payments under the Struc-tural Funds that Turkey may receive from the EUafter accession can be calculated, assuming thatTurkey falls under Objective 1 of the StructuralFunds.36 According to the European Commission(2002), per capita payments under Objective 1 cur-rently amount to €217 per inhabitant per year.Therefore, assuming Objective 1 applies to Turkey,the country would receive about €14.6 billion—that is, about 6.75 percent of the 2000 GDP. Turkey’spotential gains from the Cohesion Fund havebeen estimated on the basis of the paymentsgranted to Greece, Ireland, Portugal, and Spain.Cohesion Fund payments are granted to countrieswith a per capita GNP of less than 90 percent of theEU average. The total amount to be spent in 2002was about €45 per inhabitant. If Turkey receivesequal payments, it could expect to receive about€3 billion.
The calculations just presented are optimistic,because, according to EU rules, transfers from the
TABLE 2.14 Trade-Related Budget Effects and Direct Payments under Agenda 2000
Agenda 2000Net Exports, Trade-Related Direct1999–2001 Effects on Payments
Average Budget (billions of TL)(metric tons) (billions of TL) Scenario A Scenario B
Wheat EX 617,845 16,729 628,217 219,876Barley EX 160,508 1,061 238,716 83,550Maize IM �881,072 �12,085 41,339 14,469Sunflower IM �394,310 �66,002 70,112 24,539Sugar beet IM �31,675 �309 0 0Potato EX 91,237 3,467 0 0Grapes EX 470,095 �45,339 0 0Milk IM �146,669 1,945 145,791 51,027Beef IM �69,392 �37,429 339,577 118,852
Poultry IM �374 52 0 0Sheep EX 42,162 7,972 130,488 45,671
Total �129,939 1,594,239 557,984Total (€ millions) �226 2,772 970
Total budgetary cost (€ millions):Scenario A 2,998Scenario B 1,196
Note: Because of the prevailing sanitary ban by Turkey on imports of livestock and meat products, the1990–96 average of net exports for beef, sheep, and poultry is used. TL = Turkish liras; EX = export; IM = import.Source: The authors.

Analysis of the Impact of EU Enlargement on the Agricultural Markets and Incomes of Turkey 69
Structural Funds and Cohesion Fund cannotexceed 4 percent of GDP. Thus this requirementplaces an upper bound on the amount that Turkeycan receive from the EU under these funds. ForTurkey, this requirement is binding, and thereforethe payments under the Structural Funds andCohesion Fund cannot exceed €8.664 billion.The total annual net revenue that Turkey canreceive from the EU under accession will thereforebe about €9.557 billion under Scenario A and€7.755 billion under Scenario B.
Furthermore, an assessment of Turkey’s poten-tial gains from the Structural Funds must bear inmind that funding of projects under the priorityobjectives are subject to a co-financing mecha-nism. The amount just estimated therefore consti-tutes the EU’s share of project funding and mustbe complemented by funds from the nationalbudget. The EU’s contribution to structural fund-ing is subject to two ceilings. The first is a maxi-mum of 75 percent of the total eligible cost and, asgeneral rule, is at least 50 percent of the eligiblepublic expenditure for measures carried out in theregions covered by Objective 1. When the regions
are located in a member state covered by theCohesion Fund, the European Community contri-bution may rise, in exceptional cases, to a maxi-mum of 80 percent of the total eligible cost. Thesecond ceiling is a maximum of 50 percent of thetotal eligible cost and, as a general rule, is at least25 percent of the eligible public expenditure formeasures carried out in areas covered by Objec-tives 2 and 3. Assuming that Turkey will qualify forassistance under Objective 1 and the CohesionFund, and assuming an EU participation rate (onaverage) of 75 percent, the EU’s contribution of€8.664 billion would have to be accompanied by aTurkish co-financing share of about €2.9 billionfrom the national budget.
Welfare Effects
The situation just described reveals that, in Turkey,integration into the EU will lead to substantialchanges in the agricultural incomes of producers,the welfare levels of the consumers, and the budgetrevenues of the government. On the effects of inte-gration into the EU, we have five observations.
TABLE 2.15 Contributions to and Revenues from EU Budget
Turkish Liras Euros(billions) (millions)
Contributions to EU budgetVAT-based contribution 588,682 1,023GNP-based contribution 505,112 878
Total contribution 1,093,793 1,902
Revenues from EU budgetDirect payments to agriculture Scenario A 1,594,239 2,772Direct payments to agriculture Scenario B 557,984 970Trade-related budgetary effects 13,473 23Structural Funds 8,421,079 14,641Cohesion Fund 1,746,307 3,036
Total revenue Scenario A 11,775,099 20,472Total revenue Scenario B 10,738,843 18,670
Net revenue from EU budgetUnrestricted Scenario A 10,681,305 18,570Unrestricted Scenario B 9,645,050 16,768
Structural operations (restricted) Agenda 2000 4,983,338 8,664
Restricted Scenario A 5,497,258 9,557Restricted Scenario B 4,461,002 7,755
Source: The authors.

70 Turkey: Economic Reform and Accession to the European Union
First, the impact on farmers’ incomes of the intro-duction of EU-type agricultural policies (ScenariosA1, A2, B, and C) will be driven mainly by theamount of CAP-like compensation paymentsgranted to the farmers (see table 2.16), and theimpact will be greater in the medium to long termas farmers adjust to the new policies. The largestreduction in farmers’ incomes is produced byAgenda 2000 policies without direct payments(Scenario A1). From the point of view of the farm-ers, the best alternative among the various EU poli-cies considered is the Agenda 2000 scenario withdirect payments given at the EU levels.
Second, the impact will not be uniformly dis-tributed across all agricultural products; somefarmers will gain and others will lose from thereforms as a result of changes in relative rates ofprotection.
Third, EU-type agricultural policies will reduceagricultural prices substantially in Turkey, leadingto lower food prices. In the short term, food expen-ditures are projected to fall by as much as 5.91 per-cent compared with the current base period condi-tions. In the medium to long term, EU-like changesin agricultural policies (Scenarios A1, A2, and B)would induce a 5.14 percent average drop in foodexpenditures. Expenditures are projected to fall forthe major food product groups, with the largestdecreases projected for fat products (30.53 per-cent), sugar and sugar products (13.44 percent),and meat and meat products (9.48 percent).
Fourth, because Turkish households spend onaverage about 36 percent of their disposableincome on food and beverages, policy reforms thataffect food prices will undoubtedly affect con-
sumers’ real income. In fact, the model estimatesthat, in the medium to long term, EU-like policies(Scenarios A1, A2, and B) will lead to a 1.87 percentincrease in real household incomes in Turkey. Thisimpact is higher (2.15 percent) in the short term,before consumers can adjust to the higher prices forsome food products. Therefore, although farmersas a group could lose from the new policies,depending on the amount of direct payments, thepopulation as a whole stands to gain from theintroduction of these policies. Furthermore,because food makes up a higher share of their totalexpenditures and their food consumption baskethas different mixes, lower-income households (i.e.,rural households) experience a more significantincrease in real income.
Fifth, the budgetary costs to Turkey of adoptingEU-like agricultural policies (when Turkey will notreceive any compensation from the EU budget forintroducing these policies) will amount to €2.998billion under Scenario A policies and to €1.196billion under Scenario B policies. Yet after the EUaccession, Turkey will be a net recipient of fundsfrom the EU; it can expect to receive from the EU€9.557 billion in net transfers under Scenario A and€7.755 billion in net transfers under Scenario B.37
Institutional Development and EU Accession
The institutional and human capital enhancementsimplied by EU membership require significanteffort and investment during the preaccessionperiod. Not only is the alignment of legislationnecessary; Turkey also must develop the judicial
TABLE 2.16 Impact of Changes in Agricultural Policies on Agricultural Incomes
Value AddedGross Agricultural Inclusive Direct
Output Payments (billions of TL) (billions of TL)
Base run with current policies 8,532,570 4,835,604Agenda 2000 without direct payments 7,799,080 4,473,629Agenda 2000 with direct payments 9,393,319 6,067,868Agenda 2000 with 35 percent direct payments 8,357,064 5,031,613Free trade with direct payments 7,475,246 4,433,256
Note: All variables are measured in terms of 2000 prices. TL = Turkish liras.Source: The authors.

Analysis of the Impact of EU Enlargement on the Agricultural Markets and Incomes of Turkey 71
and administrative capacity to implement andenforce the acquis communautaire. In preparationfor joining the EU and adopting regulations andpolicies of the EU, Turkey will have to strengthensome institutions and create others. This sectionfirst outlines Turkey’s key institutions for agriculturein the context of implementation of the acquis and,in particular, the mechanisms to operate the CAP.The section then briefly discusses Turkey’s statusand ability to adopt and implement the acquis.
Implementing Agencies for Agricultural Policies
The Ministry of Agriculture and Rural Affairs(MARA), Ministry of Industry and Trade, TurkishBank of Agriculture, and Treasury are the mainorganizations responsible for the formulation andimplementation of agricultural policy in Turkey.The main task of MARA is to assist in the elabora-tion and implementation of agricultural policies,particularly services such as research and develop-ment, quarantine and inspection, rural develop-ment, and small-scale irrigation works.
MARA also carries out commercial functionsthrough the Turkish Grain Board (TMO), an affili-ated state economic enterprise. For more than sixdecades, the TMO has functioned as a buffer stockagency in order to stabilize the grain prices receivedby producers and paid by consumers. The boardannounces the purchase prices, which are later re-determined based on market conditions. The TMOuses its stock capacity to regulate the market, sothat prices in the bread and pasta industries are sta-bilized, and so producers and consumers do not facehigh price fluctuations (MARA 2002). Under theAgricultural Reform Implementation Project,the prices of the TMO will be increasingly linkedto the world price (with a margin equal to the tariff)in order to allow state procurement to function onlyas a “buyer of last resort,” which is now the case inthe EU. The TMO also declares a sales price forgrain no less than either (1) the TMO’s purchaseprice plus the storage cost up to the date of sale,including imputed interest charges on stocks, or (2)the tariff-inclusive import parity price for grain ofequivalent quality as of the time the grain is sold.Prices increase in general to take into account thedepreciation of the Turkish lira. This system dis-courages wheat buyers from letting the TMO incurall of the storage costs and then buying the grain at
a subsidized price later in the year, which has beenthe case in the past. TMO’s new purchase and salespricing policies have been very successful in elimi-nating its deficit (TMO 2002).
The Turkish Bank of Agriculture is, as explainedearly in this chapter, the principal supplier of agri-cultural credit for crop and livestock production. Itwas the channel through which the bulk of thecredit was extended to farmers through the agricul-tural credit cooperatives (ACCs) and the agricul-tural sales cooperatives unions (ASCUs). Virtuallyall of these loans carried negative real interest rates,with losses covered by the Treasury. The ACCs pro-vided short- and medium-term credit in the formof a limited cash payment (up to 25 percent of thetotal loan) plus production inputs (e.g., seed, fertil-izer, feed, and machinery.). The ACC system was aretail network of the Turkish Bank of Agriculturefor the distribution of subsidized credit in kind tosmall farmers, with some independence from thegovernment since 1995. It was the only source ofproduction credit for smallholder farmers. Becausealmost all of the financial requirements were pro-vided by the Turkish Bank of Agriculture, the cost-effectiveness of the ACCs was never a concern.Recently, the Turkish Bank of Agriculture was com-mercialized (about 500 branches were closed inrural areas), and the credit subsidy was eliminated.Since then, an alternative arrangement for provid-ing small farmers with credit has not yet beenestablished.
In the past, the ASCUs operated under the con-trol of the Ministry of Industry and Trade.They wereauthorized to set prices for members’ commoditiesand to implement support purchases from produc-ers on behalf of the state. They also were authorizedto set up facilities such as warehouses and primaryprocessing and packing plants and to market com-modities in accordance with wholesale and retailmarket practices. Today, within the framework ofthe Agricultural Reform Implementation Project(ARIP), financial aid is granted to assist the restruc-turing and transformation of ASCUs into genuinecooperative organizations—that is, independent,financially autonomous, self-managed cooperativesthat sell and process members’ production.
Financial aid is also provided for improving pub-lic services to facilitate reform implementation. Reg-ulations are in place to control water and soil pollu-tion and to protect wetlands. National and regional

72 Turkey: Economic Reform and Accession to the European Union
plans distribute information on ways to combatdesertification and reduce discharges of nutrients.The government plays a large role in investment ininfrastructure, especially irrigation works.
Status of Implementation of the Acquisin Agriculture
This section examines Turkey’s status and ability toassume the obligations of EU membership.
Adoption of the Common Market OrganizationsThe markets policy is the most important instru-ment of the CAP. As noted earlier, it places productsor a group of products under a particular regime,the Common Organization of the Market (COM),so that common rules govern production and trade.The CAP is seeking to gradually reduce institutionalprices toward the world market levels, while consol-idating direct aid as the basic support mechanismfor European Community farming. The acquisrequires that the intervention agencies be capable ofcarrying out tasks such as regular market and pricemonitoring, buying-in, public storage, and salesand stock control in premises that meet Commu-nity standards. Furthermore, the acquis specifiesprecise rules for producer organizations, whichmust be fulfilled if such an organization is tobenefit from Community support. Finally, theCOMs require specific administrative structures foroperation of the Community supply-managementinstruments such as production quotas in the sugar,dairy, and starch sectors.
During late 1990s, Turkey, with the introductionof ARIP, completely reformed its prevailing outputprice support and input subsidy policies. TheASCUs were restructured, and the TMO was down-sized. The TMO will preserve the assets needed tocarry out a minimum level of purchases and stor-age and will liquidate the rest of its assets.
In addition, a process of privatizing the agricul-tural state economic enterprises has begun. Thesugar law adopted on April 19, 2001, opens themarket to competition, reduces state interference,and aims to maintain stable and self-sufficientsugar production. The state-owned sugar companywill operate on a commercial basis, and sugar millswill be transferred to the Privatization Agency. Inaddition, a sugar board was established. The sugarlaw aims to maintain the demand and supply
balance through a system of production quotas likethat used in the EU. In the tobacco sector, the Turk-ish Parliament adopted a new law restructuring theDirectorate General for the Tobacco and TobaccoProducts, Salt and Alcohol Industry (TEKEL). Thelaw converts TEKEL from a monopoly to a com-mercial enterprise that will operate under free-market conditions. Parliament also adopted newregulations on tobacco, tobacco products, and alco-holic beverages. The processing facilities of TEKELare to be privatized. In January 2002, a tobacco lawwas adopted that aimed to end state-subsidizedtobacco purchases as of 2002 and to introduce auc-tion sales, individual purchasing contracts betweenproducers and buyers, and liberalization of themarket.
In this restructuring, some firms were liqui-dated, such as the Turkish Agricultural SupplyCorporation, the state firm responsible for inputsupply. Although the achievements described areconsiderable, Turkey, according to the EuropeanCommission (2004), lags behind in adopting theEU’s common market organizations.
Implementation of the Integrated Administra-tion and Control System of Payments Accord-ing to the acquis, the administrative structuresand systems needed for handling the CAP expendi-ture under the Guarantee Section of the EuropeanAgricultural Guarantee and Guidance Fund mustmeet certain requirements. In particular, the pay-ing agencies must be accredited and must offersufficient guarantees that the admissibility ofclaims and compliance with European Communityrules are checked before payment is authorizedand that the payments effected are correctly andfully recorded in accounts. To help combat fraudand ensure that the direct payments scheme iseffectively applied, the EU introduced the Inte-grated Administration and Control System. Farm-ers wishing to claim direct payments must com-plete detailed IACS forms, which are designed toensure that only eligible land is entered into thescheme and that only one claim is made on anyindividual piece of land. According to the acquis,the IACS must have a computerized database, analphanumeric identification system for agriculturalparcels, and a system for identifying and recordinganimals.

Analysis of the Impact of EU Enlargement on the Agricultural Markets and Incomes of Turkey 73
Turkey realizes that direct income support is atthe heart of ARIP and that registration of farmers isa critical part of the DIS program. Two approacheshave been used to build an adequate registry offarmers in Turkey. The first approach is based onthe existing land registry records (cadastre), andthe second is based on certificates of farmers. Landregistry was used where it exists, but it was comple-mented by farmer certificates. In addition, MARAdeveloped a farm registry system in collaborationwith related organizations. The database of this sys-tem includes information on the number of farm-ers, their demographic characteristics and assets,the number and the size of land parcels, and landuse. This information is more accurate than formalstatistics, and to access it, all provinces and districtsare provided an online connection to the MARARegistration Center. The 2.6 million farmers regis-tered hold a total of 16.4 million hectares of land, ofwhich 16.3 million hectares are eligible for directincome support. The number of parcels registeredis 15.5 million. In 2001, direct payments of aboutTL 500 trillion were made, paid in two installments.DIS continued in 2002 with a payment of TL 135 mil-lion ($85) per hectare of land up to 50 hectares.Transition payments to help farmers divert fromhazelnut and tobacco increased in 2002 to $0.2 mil-lion, and transition payments were to be granteduntil 2004. In addition to the farmer registry, aGeographic Information System (GIS) and RemoteSensing Department was established within MARAto classify and map agricultural land, estimateproduction and production capacity for variousproducts, and create a database for land use plan-ning purposes.
These are considerable achievements. Yet,according to the European Commission (2004),Turkey has achieved little progress in introducingan IACS for payments. This situation is particularlyserious because the data required for IACS are noteasily available. It requires a uniform, centralizeddatabase that would allow payments control at thecentral level, and an integrated system of on-the-spot controls needs to be developed. According toEU legislation, the individual member states areobliged to control areas that have at least 5 percentof applicants for payments. Fifty percent of therequested area must be verified—one part on-siteand one part perhaps from aerial photography. The
registration system in Turkey developed under theDIS is certainly a start on an IACS. It includes avery comprehensive audit and financial manage-ment system that is in line with the kind of controlsystem mentioned earlier.
By the end of 2004, all EU member states willbe required to use a land register and parcel identi-fication control system based on GIS analysis ofdigital images. Turkey could adopt this systemfrom the outset. Over time, GIS maps of the wholeterritory of Turkey should be prepared. Such a sys-tem will derive the basic data from the cadastremap of the Turkish territory, which needs to bedigitized. The cadastre data will then be superim-posed with ortho-photomaps, which will allowidentification of the exact borders of cultivatedagricultural land and of less favored areas. Theprocessed ortho-photomaps, along with other rele-vant cadastre data (on disadvantaged areas, pro-tected areas, environmentally sensitive areas, andso forth), will be given to an institution in chargeof the data processing, and the result is expected tobe an entirely new register of land use. Becauseintroduction of the IACS and establishment of anagency to disburse direct payments and other sub-sidies to farmers are prerequisites for the function-ing of the CAP, it appears that Turkey must extendthe present system in order to develop the landregister and parcel identification control systemlike those of the EU and establish the associatedpayment agency.
Food Safety and Quality Standards Food safetyissues in the EU are spread over food, veterinary,phytosanitary, and animal nutrition legislation.Food legislation includes general rules for hygieneand control, food labeling, food additives, foodpackaging, and genetically modified foods. Veteri-nary legislation addresses animal health, animalwelfare, animal identification and registration,internal market control systems, external bordercontrols, and public health requirements forestablishments in relation to animal products.Phytosanitary legislation includes plant health(harmful organisms, pesticides), seeds and propa-gating material, and plant hygiene. Finally, animalfeed legislation includes the safety of feed materialsand additives, labeling, contaminants in feed, con-trols, and inspections.

74 Turkey: Economic Reform and Accession to the European Union
The acquis requires that each member state haveappropriate administrative structures to inspect andcontrol the implementation of all food legislation.In particular, the various hygiene control officialsmust be trained in inspection and in the HazardAnalysis and Critical Control Point (HACCP) sys-tem. Food operators must implement HACCP, andlaboratories used in hygiene and foodstuff analysismust comply with the European Community sys-tem on accreditation, method of sampling, andanalysis.38 In the realm of plant and animal healthand nutrition, the acquis requires that appropriateinspection arrangements be available at the site oforigin, that nondiscriminatory checks be performedduring transport and at the destination point, andthat satisfactory testing arrangements be available.
A recent white paper on food safety stated thatthe commission is determined to set the higheststandards of food safety (see European Commis-sion 2000). The white paper proposes the follow-ing: (1) establishment of an independent EuropeanFood Authority with responsibility for independentscientific advice on all aspects of food safety, opera-tion of rapid alert systems, and communication ofrisks; (2) an improved legislative framework cover-ing all aspects of food products “from farm totable”; (3) greater harmonization of national con-trol systems; and (4) dialogue with consumers andother stakeholders. According to the white paper,imported foodstuffs and animal feed should meethealth requirements at least equivalent to those setby the European Community for its own products.The white paper on food safety also states that it isessential that the EU candidate countries imple-ment the basic principles of the treaty establishingthe European Community, pass food safety legisla-tion, and put in place control systems equivalent tothose in place within the European Community.Similar considerations will certainly apply toTurkey. Because the EU will not take any risks thatmight lead to lower food safety standards or affectEU consumers, it is of prime importance thatTurkey comply with the EU’s acquis on food safety.
In Turkey, food legislation has been updatedcontinually since 1985. The harmonization of“Good Agricultural Practices” has been completed,and the regulation on agricultural quarantine hasbeen in force, and regularly strengthened, since1991.39 A food act was passed in 1995, according towhich all stages of food production are targeted for
inspection. Turkey has formally adopted a numberof typical elements of food safety regulations andcontrol systems by adopting some of the EU rulesand regulations. In particular, Turkey has started toset up the Rapid Alert System for Food and Feed,and has revised the regulation on the Establishmentand Duties of Province Control Laboratories.Accreditation has been initiated for some of thelaboratories involved in the ring test organized bythe Food Analysis Performance Assessment Schemeand Turkish Scientific and Technical Council. Fif-teen provincial laboratories have been brought upto EU standards. The Plant Health Regulations,which are the Turkish equivalent of the basicCouncil Directive 2000/29/EC, dating back to 1991,were amended in 2003. HACCP control instruc-tions have been prepared to improve food process-ing. In the veterinary area, Turkey amended theLaw on Animal Health and Surveillance in 2004,creating the legal bases for banning the administra-tion of certain substances to animals and imposingsanctions in this regard. It has also upgraded thecontrol performance of the veterinary service,including the implementation of residue monitor-ing plans.40
Trade and Border Control Implementation of theCAP requires the establishment of effective customscontrol for trade with third countries. BecauseTurkey’s borders will become EU borders at the pointof accession, Turkey will have to protect its long bor-ders and ensure, for example, an adequate veterinaryinfrastructure to manage livestock inspection andcontrol disease. Thus Turkey needs to assess the cur-rent conditions and to design technical specificationsfor construction of other veterinary and phytosani-tary border crossings along its future EU border.
EU controls on third-country imports requirethat a system of border inspection posts (BIPs) becompleted to EU standards at external borders withthird countries. Currently, some 283 EU BIPs areoperated by national authorities. Most of these areat ports and airports; others are at road or rail linkslocated, in particular, on the eastern borders ofthe EU.
The accession of Turkey will extend the EU’s east-ern frontier with Georgia, Armenia, Iran, Iraq, andSyria. Veterinary checks on imports at the BIPsinclude documentary, identity, and physical checksof the animals or animal products.After these checks

Analysis of the Impact of EU Enlargement on the Agricultural Markets and Incomes of Turkey 75
at the first border crossing into the EU, animals andproducts can in principle circulate freely in the inter-nal market. It is therefore essential that BIP facilitiesand procedures are adequate to maintain animal andpublic health safety. Setting up border inspectionposts for veterinary and other controls in the newmember states requires that buildings, equipment,and staff be in place to carry out the required borderchecks. EU legislation sets out minimum standardsfor BIP facilities, depending on the types of productsto be checked.
Conclusion
Accession to the EU implies some major changes,both in the incentive structure for agricultural pro-duction and in the institutions of the sector. Thischapter modeled and quantified the probablechanges in the incentive structure and examinedtheir implications for the structure of production,value added in primary agriculture, and welfare ofproducers and consumers. It also investigated qual-itatively what changes will be needed in majorinstitutions by comparing those existing currentlyin Turkey with those of the EU’s Common Agricul-tural Policy.
The results of any modeling exercise should betaken with a grain of salt, and that is even truer ofthose in this chapter. One reason is that the CAP is amoving target undergoing fundamental reforms.The general direction of the reform program is clear,but how far it will have gone by the time of Turkey’saccession is not. It is quite possible—some wouldargue likely—that the price structure in the EU willin another 5–10 years be very close to that prevailingin world markets, but this development depends onsome future political decisions,and so is by no meanscertain. Clearly, however, prices will be much lowerthan they are at present. Because of the uncertainties,this chapter modeled several different scenarios, butall results should be interpreted as indicative of gen-eral orders of magnitude rather than as precisenumerical forecasts. If the model were run using thescenario of the recently adopted reform programthat is an extension of Agenda 2000, Turkey’sproducers and consumers would face lower prices.Turkish consumers would gain even more than theywould under the Agenda 2000 scenario, and produc-ers would lose more in price supports but wouldreceive substantially higher direct payments.
One important difference between Turkey andthe accession countries of Central and EasternEurope is that in most of the latter, agriculturalprices were lower than those in the EU at the timethose countries began accession negotiations. InTurkey, the converse is true, which implies that theprices for many major agricultural products inTurkey will have to be reduced at some pointbetween now and accession. As quantified in thischapter, such a reduction would be of great benefitto Turkish consumers, especially the poor. Itwould, however, require adjustments on the part ofTurkish farmers. Under its current reform pro-gram, ARIP, Turkey has made a good start in thisadjustment process. The way in which it has donethis—by partially compensating farmers by meansof an incentive-neutral, WTO-compatible directincome support system—is fully consistent withthe mechanisms of the CAP. By bringing agricul-tural prices in Turkey more in line with worldprices, the reforms will begin to make Turkish agri-culture more efficient. This improvement, in turn,would help Turkey to meet one of the EU’s pri-mary criteria for accession countries—that its pro-ducers be able to compete in the unified marketthat follows from membership. Of course, animportant lesson from other reform-mindedcountries is that to realize the benefits of thereform program in increased competitiveness, pro-ducers must be supported by having the appropri-ate infrastructure and services, as well as continuedsectoral and economy-wide reforms.
As for institutions, Turkey has made a good startin some areas, but it still has a long way to go inothers. The DIS system in Turkey lays the founda-tion for a system to administer direct paymentsunder the CAP, and the financial management sys-tem of the DIS should be a good basis on which tobuild the Integrated Administrative and ControlSystem of payments. But some improvements willclearly be needed. For example, the system will haveto be based on GIS analysis of digital images,implying that GIS maps will have to be prepared forall of Turkey. Food safety and quality standards willhave to be improved, as will veterinary borderposts. But with a good investment program andsupport from the EU and international commu-nity, Turkey should find it feasible to completethe improvements in the period leading up toaccession.

76
Annex
TABLE 2.17 Arrangements Applicable to European Community Importation of Agricultural Products, Other than Fruits and Vegetables Originating in Turkey
Ad Valorem Duty Specific Duty
Tariff Rates on Imports from Turkey on Imports from Turkey Over-1999 Applied by EU Tariff Tariff Quota Duty
Turkish Exports on Imports from Ad Valorem Quota In-Quota Quota on ImportsHS Description to EU (US$) Third Countries Duty (metric tons) Duty (metric tons) from Turkey
0204 Meat of sheep or goat 123,880 78.10–157.20 0 — 0 200
020725 Frozen turkeys — 20.85 1,00002072510 — ECU/t 17002072590 — ECU/t 186
020727 Frozen cuts of turkeys — 27.6402072730 — ECU/t 13402072740 — ECU/t 9302072750 — ECU/t 33902072760 — ECU/t 12702072770 — ECU/t 230
040690 Cheese 67.7604069029 338 0 1,500 ECU 67.19/100 kg04069031 804,04204069050 —04069086 —04069087 —04069088 —
0811 10008111011 Frozen strawberries 125,928 25.27 0 — 008112011 Frozen raspberries — 19.89 0 — 008119019 Other fruits, frozen 1,122 18.93 0 — 0
10020000 Rye — 103.90 Reduction according to Article 3(4)
1107 Malt 1,538110710 50.40 Reduction of ECU/t 6.5711072000 29.30 Reduction of ECU/t 6.57

77
1509 Olive oil15091010 — 81.30 10% reduction15091090 121,068,014 81.30 10% reduction15099000 — 69.90 5% reduction
151000 Other olive oil15100010 — 79.20 10% reduction15100090 2,201,779 79.20 5% reduction
2002 Prepared tomatoes 8,000200210 3,622,783 16.80 020029011 485,353 16.80 020029019 78,337 16.80 0
2002 Prepared tomatoes20029031 12,924,543 16.80 0 30,000 t20029039 4,760,473 16.80 020029091 5,718,862 16.80 020029099 256,187 16.80 0
200720079130 Prep. of citrus fruit,
with sugar — 32.50 0 — 0 10020079939 Other preparations
with sugar 1,000,696 39.26 0 — 0 100
200850 Apricot pulp 600ex 20085092 481,445 25.39 0ex 20085094 27,604 25.39 0
2204 Wine220410 Sparkling wine 32,099 9.80 0 —220421 Other wine, 2 liters or less 4,196,588 8.70 0 —220429 Other 2,224,958 17.70 0 —
220600 Other fermented beverages 2,358 8.51 0 —
ex 2007 Undenatured ethyl alcohol — 28.00–39.26 0 —
200900 Vinegar and substitutes — 0 —
Note: ECU/t = European currency unit per metric ton.
Source: Decision 1/98 of the EC-Turkey Association Council of February 25, 1998.

78
TABLE 2.18 Arrangements Applicable to European Community Importation of Fruits and Vegetables Originating in Turkey
Tariff RatesApplied by EU
1999 Tariff Rates on Imports fromTurkish Exports Applied by EU Turkey during Tariff
to EU on Imports from Specified QuotaHS (US$) Third Countries Time Period Time Periods (metric tons)
ex 070190 Potatoes 805,142 13.85 January 1–March 31 0 —
070310 Onions 444,377 11.20ex 07031011 February 15–May 15 0 —ex 07031019 February 15–May 15 0 —ex 07031011 May 16–February 14 0 2,000ex 07031019 May 16–February 14 0 2,000
070820 Beans 460,017 13.37ex 07082020 November 1–April 30 0 —ex 07082095 November 1–April 30 0 —ex 07089000 July 1–April 30 0 —
070930 Aubergines 1,546,945 14.90ex 070930 January 15–April 30 0 —ex 070930 May 1–January 14 0 1,000
070940 Stick celery 8,598 14.90ex 07094000 January 1–April 30 0 —
070990 Fresh or chilled vegetables NES 179,561 13.08
07099071 Courgettes December 1–end of February 0 —ex 07099073 Courgettes December 1–end of February 0 —ex 07099079 Courgettes December 1–end of February 0 —
070990 Fresh or chilled vegetables NES 500
ex 07099073 Courgettes March 1–November 30 0 —07099075 Courgettes March 1–November 30 0 —07099077 Courgettes March 1–November 30 0 —ex 07099079 Courgettes March 1–November 30 0 —

79
ex 07099090 Pumpkins and courges December 1–end of February 0 —ex 07099090 Other wild onion February 15–May 15 0 —
080221- 22 Fresh or dried hazelnuts 354,662,275 3.7008022100 3 —08022200 3 —
080610 Fresh table grapes 21,850,312 16.1008061021 Nov. 15–April 30, June 18–July 31 0 —ex 08061029 Nov. 15–April 30, June 18–July 31 0 —08061030 Nov. 15–April 30, June 18–July 31 0 —ex 08061040 Nov. 15–April 30, June 18–July 31 0 —ex 08061050 Nov. 15–April 30, June 18–July 31 0 —08061061 Nov. 15–April 30, June 18–July 31 0 —08061069 Nov. 15–April 30, June 18–July 31 0 —
080711 Watermelon 784,893ex 08071100 April 1–June 15 0 —ex 08071100 June 16–March 31 0 14,000
080719 Melons 1,437,680ex 08071900 November 1–May 31 0 —
080940 Plums 1,278,413ex 08094010 May 1–June 15 0 —ex 08094020 May 1–June 15 0 —
Note: NES = not elsewhere classified.Source: Decision 1/98 of the EC-Turkey Association Council of February 25, 1998.

80 Turkey: Economic Reform and Accession to the European Union
TABLE 2.19 Agricultural Products for Which EU Entry PriceSystem Applies
1999 Turkish Exports
to EUHS Description (US$)
07020000 Tomatoes 2,306,80007070005 Cucumbers 1,303,75707091000 Artichokes 9,30707099070 Courgettes 1,417,56208051030 Oranges 5,191,27008051050 Oranges 174,02708052010 Clementine 439,67008052030 Satsumas 69,80308052050 Mandarins —08052070 Tangerines —08052090 Citrus hybrids 8,010,67608053010 Lemons 13,367,25908061010 Grapes 21,834,06108081000 Apples —08081050 Apples—Granny Smith 1,73508081090 Other Apples 5,35008082010 Pears —08082050 Other pears 1,520,56008091000 Apicots 674,11508092005 Sour cherries 189,78708092095 Table cherries 37,176,17508093010 Peaches —08093090 Other peaches 310,74408094005 Plums 1,270,28720096011 Fruit juices —20096019 Fruit juices—grapes 410,95020096051 Fruit juices—grapes 271,16320096059 Fruit juices—grapes 76822043092 Wine of fresh grapes —22043094 Wine of fresh grapes —22043096 Wine of fresh grapes —22043098 Wine of fresh grapes 16,965
Total 95,972,791
Source: Turkish State Institute of Statistics.
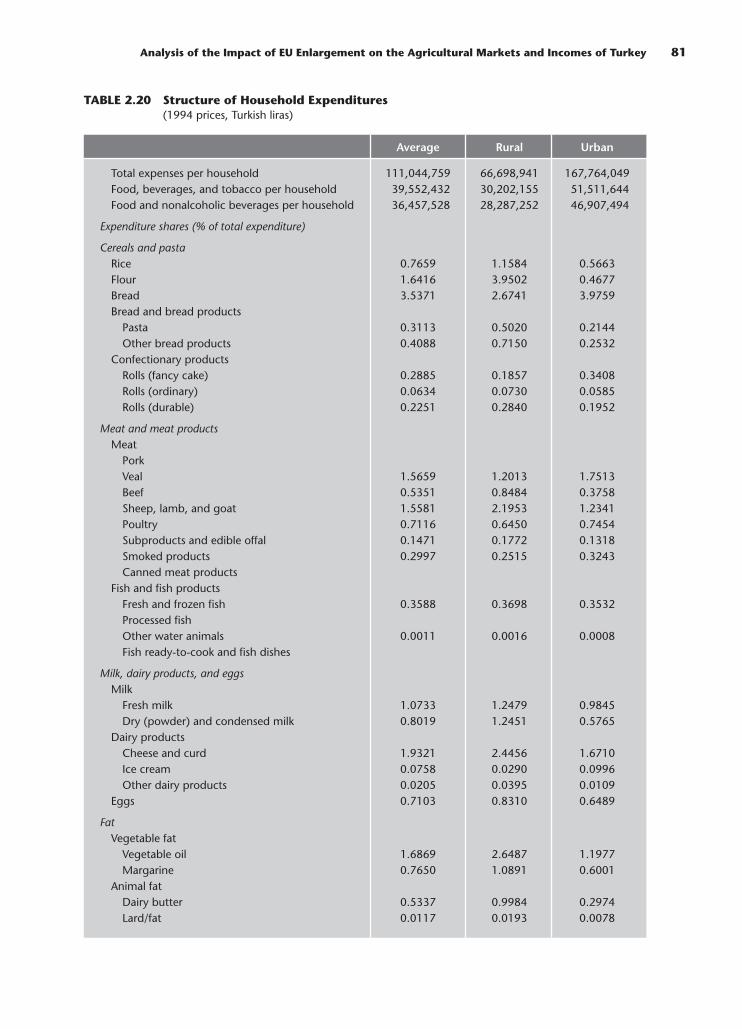
Analysis of the Impact of EU Enlargement on the Agricultural Markets and Incomes of Turkey 81
TABLE 2.20 Structure of Household Expenditures(1994 prices, Turkish liras)
Average Rural Urban
Total expenses per household 111,044,759 66,698,941 167,764,049Food, beverages, and tobacco per household 39,552,432 30,202,155 51,511,644Food and nonalcoholic beverages per household 36,457,528 28,287,252 46,907,494
Expenditure shares (% of total expenditure)
Cereals and pastaRice 0.7659 1.1584 0.5663Flour 1.6416 3.9502 0.4677Bread 3.5371 2.6741 3.9759Bread and bread products
Pasta 0.3113 0.5020 0.2144Other bread products 0.4088 0.7150 0.2532
Confectionary productsRolls (fancy cake) 0.2885 0.1857 0.3408Rolls (ordinary) 0.0634 0.0730 0.0585Rolls (durable) 0.2251 0.2840 0.1952
Meat and meat productsMeat
PorkVeal 1.5659 1.2013 1.7513Beef 0.5351 0.8484 0.3758Sheep, lamb, and goat 1.5581 2.1953 1.2341Poultry 0.7116 0.6450 0.7454Subproducts and edible offal 0.1471 0.1772 0.1318Smoked products 0.2997 0.2515 0.3243Canned meat products
Fish and fish productsFresh and frozen fish 0.3588 0.3698 0.3532Processed fishOther water animals 0.0011 0.0016 0.0008Fish ready-to-cook and fish dishes
Milk, dairy products, and eggs Milk
Fresh milk 1.0733 1.2479 0.9845Dry (powder) and condensed milk 0.8019 1.2451 0.5765
Dairy productsCheese and curd 1.9321 2.4456 1.6710Ice cream 0.0758 0.0290 0.0996Other dairy products 0.0205 0.0395 0.0109
Eggs 0.7103 0.8310 0.6489
FatVegetable fat
Vegetable oil 1.6869 2.6487 1.1977Margarine 0.7650 1.0891 0.6001
Animal fatDairy butter 0.5337 0.9984 0.2974Lard/fat 0.0117 0.0193 0.0078

82 Turkey: Economic Reform and Accession to the European Union
TABLE 2.20 (Continued)
Average Rural Urban
Fruit, fresh or driedFresh fruit
Fresh fruits, temperate zones 2.2800 2.4176 2.2101Fresh fruits, tropical zones 0.1158 0.0812 0.1333
Dried fruit and nuts 0.4174 0.4317 0.4101Fruit, canned
Frozen fruit 0.0068 0.0084 0.0060Bottled fruitJam, marmalade, and jelly 0.2569 0.3638 0.2026Fruit juices, syrups, and nectars 0.0845 0.0528 0.1006
Vegetables and potatoesFresh vegetables and mushrooms 3.0108 3.6075 2.7073Dried vegetables 1.0826 1.7756 0.7302Frozen vegetables 0.0587 0.0962 0.0396Potatoes
Potatoes 0.5085 0.8146 0.3529Potato products 0.0013 0.0007 0.0017
Sugar and sugar productsSugar 1.3920 2.4582 0.8498Sugar products—nonchocolate 0.2004 0.2435 0.1785Chocolate products 0.1588 0.0993 0.1891Honey 0.1953 0.2680 0.1583
Other food and nonalcoholic beverages 3.0312 3.8650 2.6072Coffee, tea and cocoa
Coffee—all sorts 0.0840 0.0541 0.0991Tea, including dried herb and others 1.0452 1.7319 0.6961Cocoa 0.0067 0.0058 0.0071
Other food 1.5310 1.8555 1.3659Soft drinks
Fizzy soft drinks 0.3415 0.2098 0.4085Mineral water 0.0228 0.0078 0.0305
Alcoholic beveragesSpirits 0.2095 0.1852 0.2218Wine 0.0151 0.0121 0.0166Beer 0.1132 0.1017 0.1190
TobaccoCigarettes 2.4142 2.4970 2.3721Tobacco products 0.0352 0.0749 0.0150
Source: Turkish State Institute of Statistics.

Analysis of the Impact of EU Enlargement on the Agricultural Markets and Incomes of Turkey 83
Notes
1. The authors are grateful to Mr. Antonio Nucifora for hisassistance and advice on the model used in this paper to quanti-tatively estimate the effects of adopting the Common Agricul-tural Policy of the European Union.
2. EU15 refers to the 15 members of the EU prior to the 2004enlargement in which 10 more countries joined the EU. The15 countries are Austria, Belgium, Denmark, Finland, France,Germany, Greece, Ireland, Italy, Luxembourg, the Netherlands,Portugal, Spain, Sweden, and the United Kingdom.
3. The last agricultural census was carried out in 2001, but theresults of this census are still not available. The large number ofmultiparcel agricultural land holdings, the landless peasants insome parts of eastern Turkey, and the feudal structures in easternand southeastern Anatolia are three of the major problems in Turk-ish agriculture. The land fragmentation is in part a consequence ofthe inheritance provisions of the 1926 Civil Code, which is pat-terned after the Swiss Civil Code. To attack the problem of landlesspeasants, the government has pursued various agrarian reformssince the formation of the Republic, but more work needs to bedone.Finally, the local lord’s hegemony in eastern and southeasternTurkey is a peculiarity of the Turkish agricultural setting.
4. All dollar amounts are U.S. dollars unless otherwiseindicated.
5. A review of the tariff binding commitments of Turkey andthe EU under the World Trade Organization (WTO) on agricul-tural products reveals that by 2004 Turkey’s tariff bindings willall be almost above the EU final bound levels under the UruguayRound agreement, which will be further reduced by the ongoingDoha Round negotiations. Thus, under the accession process,Turkey will have to conform to the lower EU levels.
6. For the COM on cereals, see Council Regulations (EC) No.1251/1999 and No. 1253/1999.
7. See Article 2 of Council Regulation No. 1251/1999. In theCentral and Eastern European (CEE) countries, the arable basearea for each accession country has been determined by takingthe average for the years 1997, 1998, and 1999.
8. In the CEE countries, aid for durum wheat applies to thedurum wheat used to produce pasta. The glassiness of the vari-ety grown should be higher than 73 percent. Furthermore,durum wheat must have been grown for a minimum of some20 years to qualify for aid. Finally, aid is contingent on the areaunder durum wheat production constituting at least 2 percent ofthe total area under cereal production.
9. For CEE countries, the reference yields have been deter-mined as the average of the median three years of the period1994/95–1998/99. The reference yields have been set at 4.26 met-ric tons per hectare for Hungary, 2.96 tons per hectare forPoland, and 4.16 tons per hectare for Slovakia.
10. For CEE countries, the date is December 31, 2000.11. The regulations that apply to sunflower seed are gov-
erned by Council Regulation (EC) No. 1251/1999 amendingRegulation No. 3405/93.
12. Sugar beets are governed by Council Regulation (EC)No. 1260/2001.
13. Fruits and vegetables, including grapes, are governed byRegulation (EC) No. 2699/2000 amending Council Regulation(EC) No. 2200/1996, No. 2201/1996, and No. 2202/1996.
14. Milk and dairy products are governed by Council Regu-lation (EC) No. 1255/1999 on the COM for milk and dairy prod-ucts. Also applicable is Council Regulation (EC) No. 1256/1999amending Regulation (EEC) No. 3950/1992 establishing anadditional levy in the milk and milk products sector.
15. Ceilings have been established per member state on thebasis of slaughterings and exports registered in 1995. Where thenational ceiling is exceeded, the premiums are reduced propor-tionately.
16. In particular, member states may choose between twoformulas for granting additional extensification premiums onsuckler cows and special beef payments: (1) a simple supplementof €100 per premium where the stocking intensity is less than1.4 livestock units per hectare; or (2) as of 2002, €40 where thestocking intensity is between 1.8 and 1.4 livestock units perhectare and €80 if less than 1.4 livestock units per hectare.
17.Ovine meat is governed by Regulation (EC) No.2529/2001.18. More information on the reforms is available at
http://europa.eu.int/comm/agriculture/mtr/index_en.htm.19. Even decoupled payments involve some distortion as
they are currently administered. But, according to an analysis bythe OECD, this distortion is very small. See OECD (2001) andDewbre, Anton, and Thompson (2001).
20. This elimination of barriers does not include food safety,sanitary, and phytosanitary requirements, and it is subject torules of origin.
21. In WTO terminology, subsidies in general are identifiedby “boxes” given the colors of traffic lights: green (permitted),amber (slow down—that is, will be reduced), and red (forbid-den). The Uruguay Round agreement on agriculture has no redbox, although domestic support exceeding the reductioncommitment levels in the amber box is prohibited. A blue boxrefers to an amber box with conditions designed to reduce dis-tortions. Subsidies that are tied to programs that limit produc-tion are included in the blue box.
22. For a discussion of the modeling methodology, see Csakiand others (2002).
23. The policies have been projected using the 2000 priceand cost situation, because complete data for later periods werenot available at the time of preparation of this chapter.
24. The exchange rates used in the study for 2000 were TL624,325 to the U.S. dollar and TL 575,179.98 to the euro.
25. Given the domestic price of commodity i, pi, and its bor-der equivalent price, p∗
i , the nominal protection rate (NPR) isdefined as
NPRi =(
Pi
P ∗i
− 1
)∗ 100
26. The effective protection rate (EPR) is computed on thebasis of the ratio of value added in the production of i measuredat domestic prices (VAi ) over such value added at border prices(VA∗
i ) and is shown by
EPRi =(
VAi
VA∗i
− 1
)∗ 100
EPR > 0 implies direct protection of domestic producers of thecommodity; EPR < 0 implies underlying disincentives todomestic producers of the commodity; and EPR = 0 implies aneutral structure of net incentives.
27. We do not consider the effects of the imposition of quo-tas on sugar and milk production by the EU.
28. The assumed output supply elasticities, taken largelyfrom Koç, Uzunlu, and Bayaner (2001), are 0.28 for wheat, 0.21for barley, 0.14 for maize, 0.16 for sunflower, 0.34 for sugar beet,0.94 for potato, 0.10 for grapes, 1.18 for milk, 0.34 for beef, 1.88for poultry, and 0.60 for sheep.
29. This is why these kinds of payments are classified underWTO rules as “green box”—that is, payments that minimallydistort trade.

84 Turkey: Economic Reform and Accession to the European Union
30. For a description of the direct payments and an estimateof their effects, see OECD (2003b).
31. In Case I, there is a negative supply response to the dropin prices due to the alignment with Agenda 2000 prices (exceptgrapes, the price of which increases), and no compensatingincrease in price or production from the direct payments. InCase II, the negative effect of alignment with Agenda 2000 pricesis offset by the direct payments.
32. Note that this approach determines the equivalent varia-tion in consumer income. Alternatively, one could determine thechange in consumer surplus.
33. The assumed price elasticities of demand, taken largelyfrom Koç, Uzunlu, and Bayaner (2001), are 0.12 for bread andpasta, 0.81 for beef, 0.7 for sheep meat, 1.23 for poultry, 0.5 formilk, 0.3 for dairy products, 0.2 for fat, and 1.09 for butter.
34. This assumption helps to highlight the impact of EU-likeagricultural policies on the state budget.
35. Note that the EU budget must be balanced during eachfiscal year. So this value of 34.46 will change from year to year bythe requirements of the budget during that year.
36. Structural Funds allow the EU to grant financial assis-tance to resolve structural economic and social objectives.Objective 1 of the Structural Funds is the main priority of theEU’s cohesion policy. The EU aims to narrow the gap betweenthe development levels of the various regions. “Objective 1regions” refers to areas lagging behind in their development andin which GDP is below 75 percent of the European Communityaverage. Objective 2 of the Structural Funds aims to revitalize allareas facing structural difficulties, whether industrial, rural,urban, or dependent on fisheries. Objective 3 covers the entireEU territory outside of areas covered by Objective 1 and servesas a reference framework for all measures to promote humanresources in the member states. It takes account of the title onemployment in the Treaty of Amsterdam and the new Europeanstrategy for employment.
37. For alternative quantitative analyses of the effects ofadopting the CAP, see Çakmak and Kasnakoglu (2001); Çagatay,Saunders, and Amor (2001); Grethe (2004); and Oskam andothers (2004). Whereas Çakmak and Kasnakoglu (2001) studythe impact of the CAP on producers, consumers, and foreigntrade, Çagatay, Saunders, and Amor (2001) concentrate only onthe effects on producers and foreign trade. Both papers abstractfrom consideration of the impact on the state budget. Accordingto Çakmak and Kasnakoglu (2001), adoption of Agenda 2000policies with direct payments equal to those currently applied inthe EU will lead to reductions in producers’ welfare, which iscontrary to our results summarized in table 2.16. The compre-hensive study by Oskam and others (2004) analyzes the likelyconsequences for Turkey’s agricultural and agrifood sectorsshould it become an EU member in 2015.
38. HACCP is a system that establishes process controlthrough identification of the production points most critical tocontrolling and monitoring the production process. It involvesseven principles. First, analyze hazards. Potential hazards associ-ated with a food and measures to control those hazards are iden-tified. The hazard could be biological such as a microbe, chemi-cal such as a toxin, or physical such as ground glass or metalfragments. Second, identify critical control points. These arepoints in a food’s production—from its raw state through pro-cessing and shipping to consumption by the consumer—atwhich the potential hazard can be controlled or eliminated.Examples are cooking, cooling, packaging, and metal detection.Third, establish preventive measures with critical limits for eachcontrol point. For a cooked food, for example, this might includesetting the minimum cooking temperature and time required to
ensure the elimination of any harmful microbes. Fourth, estab-lish procedures to monitor the critical control points. Such pro-cedures might include determining how and by whom cookingtime and temperature should be monitored. Fifth, establish thecorrective actions to be taken when monitoring shows that a crit-ical limit has not been met—for example, reprocessing or dis-posing of food if the minimum cooking temperature is not met.Sixth, establish procedures to verify that the system is workingproperly—for example, testing time and temperature recordingdevices to verify that a cooking unit is working properly. Seventh,establish effective recordkeeping to document the HACCP sys-tem. This documentation would include records of hazards andtheir control methods, the monitoring of safety requirements,and action taken to correct potential problems. Each of theseprinciples must be backed by sound scientific knowledge—forexample, published microbiological studies on time and temper-ature factors for controlling food-borne pathogens.
39. “Good Agricultural Practices” refers to applying availableknowledge to use of the natural resource base in a sustainableway for the production of safe, healthy food and nonfood agri-cultural products in a humane manner, while achieving eco-nomic viability and social stability.
40. See chapter 10 of Oskam and others (2004) for a discus-sion of animal and plant health issues in Turkey.
References
Çagatay, S., C. Saunders, and R. Amor. 2001. “The Impact on theAgricultural Sector of the Potential Extension of the Cus-toms Union Agreement to Cover Agricultural Commodi-ties.” Unpublished paper, Lincoln University, New Zealand.
Çakmak, E. H., and H. Kasnakoglu. 2001. “Tarım SektöründeTürkiye ve Avrupa Birligi Etkilesimi: Türkiye’nin AB’yeÜyeliginin Analizi” [The Turkey–European Union Interac-tion in Agricultural Sector: Analysis of Turkey’s of EU Mem-bership]. Working Paper, Agricultural Economics ResearchInstitute, Ministry of Agriculture and Rural Affairs, Ankara.
Csaki. C., A. Nucifora, Z. Lerman, T. Herzfeld, and G. Blaas.2002. Food and Agriculture in the Slovak Republic: The Chal-lenges of EU Accession. Washington, DC: World Bank.
Dewbre, J. H., J. Anton, and W. Thompson. 2001. “The TransferEfficiency and Trade Effects of Direct Payments.” AmericanJournal of Agricultural Economics 83: 1204–15.
Europarl. 2002. “European Parliament Fact Sheets.” http://www.europarl.eu.int/factsheets/default_en.htm.
European Commission. 2000. “White Paper on Food Safety.”COM (1999) 719 final. Brussels: EC.
————. 2002. “Regional Policy Interim Report.” http://www.europa.eu.int/comm/regional_policy/sources/docoffc/official/reports/pdf/interim1/report_en.pdf.
————. 2004. “2004 Regular Report on Turkey’s ProgressTowards Accession.” COM (2004) 656 final. Brussels: EC.
Grethe, H. 2004. “Turkey’s Accession to the EU: What Will theCommon Agricultural Policy Cost?” Humboldt UniversityWorking Paper 70/2004. Berlin.
Koç, A., V. Uzunlu, and A. Bayaner. 2001. “Türkiye’de TarımsalÜrün Projeksiyonları 2000–2010” [Forecasts for AgriculturalProducts in Turkey for the Period 2000–2010]. AgiıculturalEconomics Research Institute, Ankara.
MARA (Ministry of Agriculture and Rural Affairs). 2002. “Datafiles.” Research Planning and Coordination Council, MARA,Ankara.
OECD (Organisation for Economic Co-operation and Develop-ment). 2001. “Market Effects of Crop Support Policies.”OCED, Paris.

Analysis of the Impact of EU Enlargement on the Agricultural Markets and Incomes of Turkey 85
————. 2003a. “Agricultural Policies in OECD Countries:Monitoring and Evaluation.”OECD, Paris.
————. 2003b. “Risk Related Non-price Effects of the CAPArable Crop Regime: Results from an FADN Sample.”AGR/CA/APM(2002)14/REV1, Directorate for Food, Agri-culture, and Fisheries, February 27.
Oskam, A., A. Burrell, T. Temel, S. van Berkum, N. Lonworth,and I. M. Vilchez. 2004. “Turkey in the European Union:Consequences for Agriculture, Food, Rural Areas and Struc-tural Policy.” Wageningen University, Wageningen.
TMO (Turkish Grain Board). 2002. TMO files. http://www.tmo.gov.tr.
Valdes, A. 1973. “Trade Policy and Its Effects on the ExternalAgricultural Trade in Chile, 1945–1965. American Journal ofAgricultural Economics 55: 154–64.
World Bank. 2000. “Turkey Country Economic Memorandum:Structural Reforms for Sustainable Growth.” Report No.20657-TU, World Bank, Washington, DC.


1996, to adopt by 2001 all of the preferential tradeagreements the EU has concluded over time,and to implement on the commercial policy sidemeasures similar to those of the EuropeanCommunity’s commercial policy. Adhering to thestipulations of the Customs Union Decision,Turkey maintained rates of protection above thosespecified in the CCT for certain “sensitive” prod-ucts until 2001. In order to adopt EU’s preferentialtrade agreements, Turkey signed FTAs with theEuropean Free Trade Association countries, Israel,and the Central and Eastern European (CEE)countries. FTAs are being discussed with theMediterranean countries. As for export subsidies,Turkey joined the Tokyo Round Agreement onSubsidies and Countervailing Duties of theGeneral Agreement on Tariffs and Trade (GATT),agreeing to eliminate export subsidies by 1989.Recently, Turkey eliminated most of the exportincentives that were introduced during the 1970sand 1980s. Within this context, GATT legal subsi-dies such as research and development subsidiesand subsidies to facilitate the adaptation of plantsto new environmental regulations were introducedin 1995.
Basic data on Turkey’s merchandise trade areshown in table 3.1. The table reveals that in 2003Turkish merchandise exports amounted to US$47.2billion and merchandise imports to $69.3 billion.3
Exports to the EU15 made up 49.7 percent of totalexports, and imports from the EU made up42.8 percent of total imports.4 The table further
This chapter studies the effects of European Union(EU) integration on the manufacturing sector.1 Thefirst section describes the main developments inTurkey’s trade regime and trade performance, andthe second examines the structure of protection-ism. Market access issues emphasizing contingentprotectionism and the issues related to technicalbarriers to trade are the subjects of the third andfourth sections. The fifth section analyzes condi-tions of competition, and the final section offersconclusions.
Main Developments in Turkey’sTrade Regime
In 1994 Turkey signed the agreement establishingthe World Trade Organization (WTO), and a cus-toms union was created between Turkey and theEU as of January 1, 1996. According to the CustomsUnion Decision (CUD) of 1995, all industrialgoods, except products of the European Coal andSteel Community (ECSC), that comply with theEuropean Community norms could circulate freelybetween Turkey and the EU as of January 1, 1996.For ECSC products, Turkey signed a free tradeagreement (FTA) with the EU in July 1996, and asa result, ECSC products have received duty-freetreatment between the parties since 1999.2
The Customs Union Decision required Turkeyto implement the European Community’s Com-mon Customs Tariffs (CCTs) on imports of indus-trial goods from third countries as of January 1,
87
3Integration and
the ManufacturingIndustry
Sübidey Togan, Hüsamettin Nebioglu, and Saadettin Dogan

88 TABLE 3.1 Exports and Imports, Turkey, 1990–2003
Annual Annual Total Percentage Growth Rate Exports Percentage Share of Growth Rate of
Exports, Distribution, of Exports, to the EU, Distribution, Exports to EU Exports to EU,2003 Total 1990–2003 2003 Exports of Sectoral 1990–2003
SITC Commodity (US$ millions) Exports (percent) (US$ millions) to EU Exports (percent)
Agricultural products0 + 1 + 4 + 22 Food 4,735 10.03 2.01 1,949 8.31 41.17 2.322 − 22 − 27 − 28 Agricultural raw materials 522 1.11 2.56 220 0.94 42.24 0.41
Mining products27 + 28 Ores and other minerals 572 1.21 4.23 246 1.05 42.95 2.563 Fuels 980 2.08 7.93 211 0.90 21.53 −0.3168 Nonferrous metals 457 0.97 8.64 222 0.94 48.45 9.03
Manufactures67 Iron and steel 3,342 7.08 5.12 939 4.00 28.09 16.52
Chemicals51 Organic chemicals 171 0.36 1.53 107 0.46 62.55 4.2857 + 58 Plastics 545 1.15 9.20 112 0.48 20.50 5.4052 Inorganic chemicals 230 0.49 5.99 80 0.34 34.68 5.3854 Pharmaceuticals 220 0.47 10.28 72 0.31 32.64 17.9953 + 55 + 56 + 59 Other chemicals 726 1.54 10.19 65 0.28 8.97 4.006 − 65 − 67 − 68 Other semimanufactures 4,143 8.77 12.52 1,645 7.01 39.70 12.21
Machinery and transportequipment
71 − 713 Power generating 246 0.52 24.80 85 0.36 34.47 22.77machinery
72 + 73 + 74 Other nonelectrical 1,566 3.32 18.16 537 2.29 34.29 17.73machinery
75 + 76 + 776 Office machines and 1,978 4.19 17.99 1,569 6.68 79.30 17.27telecommunications equipment
77 − 776 − 7783 Electrical machinery 2,076 4.40 16.83 999 4.26 48.14 14.64and apparatus
78 − 785 − 786 + Automotive products 4,928 10.44 24.42 3,139 13.38 63.70 29.307132 + 7783
79 + 785 + 786 + Other transport 1,542 3.27 20.70 853 3.63 55.31 23.077131 + 7133 + equipment7138 + 7139
65 Textiles 5,262 11.14 10.14 2,340 9.97 44.48 7.5084 Clothing 9,962 21.10 7.21 7,079 30.17 71.07 5.948 − 84 − 86 − 891 Other consumer goods 2,675 5.67 16.37 954 4.06 35.66 12.44
9 + 891 Other products 335 0.71 30.17 44 0.19 13.02 16.10
Total 47,211 100 9.01 23,466 100 49.70 8.56

89
Annual Annual Total Percentage Growth Rate Imports Percentage Share of Growth Rate,
Imports, Distribution, of Imports, from EU, Distribution, Imports from EU Imports from EU,2003 Total 1990–2003 2003 Imports of Sectoral 1990–2003
SITC Commodity (US$ million) Imports (percent) (US$ million) from EU Imports (percent)
Agricultural products0 + 1 + 4 + 22 Food 2,789 4.03 3.29 548 1.85 19.65 1.702 − 22 − 27 − 28 Agricultural raw materials 2,471 3.57 6.42 894 3.01 36.19 6.76
Mining products27 + 28 Ores and other minerals 2,262 3.26 4.58 670 2.26 29.61 −0.053 Fuels 11,575 16.71 8.06 460 1.55 3.97 7.7168 Nonferrous metals 1,411 2.04 9.55 308 1.04 21.80 4.23
Manufactures67 Iron and steel 3,282 4.74 5.46 1,232 4.15 37.53 1.91
Chemicals51 Organic chemicals 2,102 3.03 7.39 1,059 3.57 50.39 6.8357 + 58 Plastics 2,837 4.09 12.80 1,645 5.54 58.00 11.5752 Inorganic chemicals 543 0.78 2.82 178 0.60 32.78 0.9954 Pharmaceuticals 2,302 3.32 17.09 1,546 5.21 67.14 17.0553 + 55 + 56 + 59 Other chemicals 2,643 3.82 7.00 1,560 5.26 59.03 7.656 − 65 − 67 − 68 Other semimanufactures 3,489 5.04 8.27 2,245 7.56 64.33 7.66
Machinery and transportequipment
71 − 713 Power generating 758 1.09 12.52 382 1.29 50.34 12.44machinery
72 + 73 + 74 Other nonelectrical 7,250 10.46 5.21 4,607 15.52 63.54 4.18machinery
75 + 76 + 776 Office machines and 4,166 6.01 10.95 1,618 5.45 38.83 12.15telecommunications equipment
77 − 776 − 7783 Electrical machinery 2,065 2.98 6.82 1,175 3.96 56.93 5.75and apparatus
78 − 785 − 786 + Automotive products 6,209 8.96 11.67 5,150 17.35 82.95 13.917132 + 7783
79 + 785 + 786 + Other transport 1,012 1.46 1.80 711 2.40 70.29 4.887131 + 7133 + equipment7138 + 7139
65 Textiles 3,441 4.97 13.03 1,185 3.99 34.43 13.4984 Clothing 422 0.61 24.93 204 0.69 48.26 21.688 − 84 − 86 − 891 Other consumer goods 3,540 5.11 10.07 1,910 6.44 53.96 9.27
9 + 891 Other products 2,714 3.92 27.10 391 1.32 14.42 18.75
Total 69,283 100 8.27 29,678 100 42.84 8.06
Note: SITC = Standard International Trade Classification.Source: The authors.

reveals that the three export commodities withthe highest shares of total exports were clothing,21.1 percent; textiles, 11.1 percent; and automotiveproducts, 10.4 percent. The three import commodi-ties with the highest shares of total imports werefuels, 16.7 percent; other nonelectrical machinery,10.5 percent; and automotive products, 9 percent.Similarly, the three export commodities with thehighest shares of exports to the EU were clothing,30.2 percent; automotive products, 13.4 percent;and textiles, 10 percent. The three commoditieswith the highest shares of imports from the EUwere automotive products, 17.4 percent; other non-electrical machinery, 15.5 percent; and other semi-manufactures, 7.6 percent.
During the period 1990–2003, Turkey’s totalexports grew at an annual rate of 9 percent andtotal imports at a rate of 8.3 percent. The exportcommodities with the highest annual growth rateswere other products, 30.2 percent; power generat-ing machinery, 24.8 percent; and automotive prod-ucts, 24.4 percent. The import commodities withthe highest growth rates were other products, 27.1percent, clothing, 24.9 percent; and pharmaceuti-cals, 17.1 percent. Similarly, the export commodi-ties to the EU with the highest growth rates wereautomotive products, 29.3 percent; other transportequipment, 23.1 percent; and power generatingmachinery, 22.8 percent. The imported commodi-ties from the EU with the highest growth rates wereclothing, 21.7 percent; other products, 18.8 percent;and pharmaceuticals, 17.1 percent.
A look at the EU’s share of total sectoral exportsreveals that the highest shares of exports to the EUare held by office machines and telecommunica-tions equipment, 79.3 percent; clothing, 71.1 per-cent; and automotive products, 63.7 percent.Among the sectors considered, other chemicals,other products, and plastics have the lowest shares.The three sectors with the highest EU shares of sec-toral imports are automotive products, 83 percent;other transport equipment, 70.3 percent; and phar-maceuticals, 67.1 percent. Among the sectors con-sidered, fuels, other products, and food have thelowest EU shares of sectoral imports.
Table 3.2 shows similar information for the EU.It reveals that in 2001 the EU’s merchandise exportsamounted to ECU (European currency unit)982.6 billion and merchandise imports were ECU1,028 billion. Exports to Turkey made up 2 percent
of total EU exports, and imports from Turkey werealso 2 percent of total EU imports. The table fur-ther reveals that the three export commodities withthe highest shares of total EU exports were othernonelectrical machinery, 12.1 percent; other con-sumer goods, 10.3 percent; and automotiveproducts, 10 percent. The three import commodi-ties with the highest shares of total EU importswere office machines and telecommunicationsequipment, 14.3 percent; fuels, 14.1 percent; andother consumer goods, 10.3 percent. During theperiod 1990–2001, total EU exports grew at anannual rate of 8.2 percent and total imports at therate of 7.5 percent. The export commodities withthe highest growth rates were office machinesand telecommunications equipment, 15.4 percent;pharmaceuticals, 14.2 percent; and organic chemi-cals, 11 percent. The three import commoditieswith the highest growth rates were pharmaceuticals,12.4 percent; electrical machinery and apparatus,12.1 percent; and office machines and telecommu-nications equipment, 11.8 percent. Examination ofTurkey’s share of total sectoral EU exports revealsthat the highest shares of exports to Turkey are heldby ores and other minerals, 5.7 percent; plastics,5 percent; and agricultural raw materials, 4.6 per-cent. Among the sectors considered, food, clothing,and fuels have the lowest shares of exports toTurkey. The three sectors with the highest shares ofimports from Turkey of sectoral EU imports aretextiles, 11.7 percent; clothing, 11.2 percent; andiron and steel, 6.4 percent. Among the sectors con-sidered, fuels, pharmaceuticals, and other chemi-cals have the lowest shares of imports from Turkeyof sectoral EU imports.
As noted earlier, as of January 1, 1996, Turkeyand the EU entered a customs union. Table 3.3shows the evolution of Turkish trade with the EUover the period 1990–2003. The data reveal thatwith the formation of the customs union, the shareof imports from the EU of total imports went upfrom 47.2 in 1995 to 53 percent in 1996, but thenbegan to decrease, reaching 45.4 percent in 2003.Comparison of the growth rate of Turkish importsfrom the EU prior to formation of the customsunion with that observed after formation of thecustoms union shows that the average growth rateof imports from the EU has even declined, from9.1 percent during 1990–95 to 1.5 percent during1996–2003. On the other hand, annual average
90 Turkey: Economic Reform and Accession to the European Union

91
TABLE 3.2 Exports and Imports, EU, 1990–2001
Total Annual Exports Share of Total Annual Imports Share ofExports, Growth Rate to Turkey, Exports to Turkey Imports, Growth Rate from Turkey Imports from
2001 of Exports, 2001 of Sectoral 2001 of Imports, 2001 Turkey in Sectoral(thousands Percentage 1990–2001 (thousands Exports, (thousands Percentage 1990–2001 (thousands Imports,
SITC Commodity of ECU) Distribution (percent) of ECU) 2001 of ECU) Distribution (percent) of ECU) 2001
Agricultural products
0 + 1 + 4 + 22 Food 54,042,390 5.50 4.80 378,968 0.70 66,571,904 6.48 4.52 2,094,348 3.15
2 − 22 − 27 − 28 Agricultural raw 10,740,870 1.09 7.48 491,794 4.58 23,074,732 2.24 1.14 228,864 0.99materials
Mining products
27 + 28 Ores and other 4,860,506 0.49 5.76 275,558 5.67 17,659,307 1.72 5.50 270,064 1.53minerals
3 Fuels 23,892,389 2.43 7.25 311,131 1.30 144,980,806 14.10 5.81 246,383 0.17
68 Nonferrous metals 11,936,772 1.21 6.99 197,170 1.65 23,351,448 2.27 6.51 239,103 1.02
Manufactures
67 Iron and steel 19,976,063 2.03 2.97 667,511 3.34 14,075,992 1.37 4.47 905,075 6.43
Chemicals
51 Organic chemicals 33,838,441 3.44 11.04 676,813 2.00 20,696,334 2.01 9.25 89,717 0.43
57 + 58 Plastics 20,724,369 2.11 7.67 1,027,062 4.96 10,758,582 1.05 4.68 114,084 1.06
52 Inorganic chemicals 5,388,087 0.55 4.72 81,981 1.52 6,264,051 0.61 7.71 128,624 2.05
54 Pharmaceuticals 43,908,279 4.47 14.16 915,569 2.09 22,620,592 2.20 12.37 42,924 0.19
53 + 55 + 56 + 59 Other chemicals 38,460,679 3.91 7.48 1,229,805 3.20 17,193,103 1.67 7.44 44,913 0.26
6 − 65 − 67 − 68 Other semimanufactures 87,731,435 8.93 8.24 1,509,193 1.72 68,710,081 6.68 5.46 1,509,363 2.20
Machinery and transport equipment
71 − 713 Power generating 34,903,182 3.55 9.54 595,281 1.71 24,777,213 2.41 11.57 92,876 0.37machinery
72 + 73 + 74 Other nonelectrical 118,584,299 12.07 6.77 2,719,502 2.29 53,724,194 5.23 6.99 404,780 0.75machinery
75 + 76 + 776 Office machines and 96,408,088 9.81 15.37 1,909,617 1.98 146,734,704 14.27 11.75 1,005,984 0.69telecommunications equipment
77 − 776 − 7783 Electrical machinery 50,751,415 5.17 10.10 896,479 1.77 47,678,281 4.64 12.06 845,547 1.77and apparatus
78 − 785 − 786 + Automotive products 97,777,703 9.95 9.16 1,920,099 1.96 50,701,618 4.93 8.21 1,892,016 3.73
7132 + 7783

TABLE 3.2 (Continued)
Total Annual Exports Share of Total Annual Imports Share ofExports, Growth Rate to Turkey, Exports to Turkey Imports, Growth Rate from Turkey Imports from Turkey
2001 of Exports, 2001 of Sectoral 2001 of Imports, 2001 in Sectoral(thousands Percentage 1990–2001 (thousands Exports, (thousands Percentage 1990–2001 (thousands Imports,
SITC Commodity of ECU) Distribution (percent) of ECU) 2001 of ECU) Distribution (percent) of ECU) 2001
79 + 785 + 786 + Other transport 63,162,827 6.43 10.38 972,860 1.54 56,327,638 5.48 10.78 706,280 1.257131 + 7133 + equipment7138 + 7139
65 Textiles 24,739,564 2.52 6.07 978,099 3.95 19,178,029 1.87 5.02 2,242,208 11.69
84 Clothing 17,559,440 1.79 4.29 218,928 1.25 53,910,204 5.24 8.05 6,060,245 11.24
8 − 84 − 86 − 891 Other consumer 101,086,773 10.29 7.32 1,443,680 1.43 106,259,111 10.34 8.11 867,501 0.82goods
9 + 891 Other products 22,106,890 2.25 2.54 398,968 1.80 32,781,100 3.19 2.83 124,630 0.38
Total 982,580,462 100 8.23 19,816,069 2.02 1,028,029,024 100 7.48 20,155,528 1.96
Note: SITC = Standard International Trade Classification; ECU = European currency unit.
Sources: Data provided by Eurostat; the authors.
92

TABLE 3.3 Trade with EU, 1990–2003
Growth Rate Growth Rate Growth Rate Growth RateTotal Imports from of Total of Imports Share of Imports Total Exports to of Total of Exports Share of Exports Trade Balance Real
Imports EU Imports from EU from EU of Exports EU Exports to EU to EU of with EU Exchange(US$ millions) (US$ millions) (percent) (percent) Total Imports (US$ millions) (US$ millions) (percent) (percent) Total Exports (US$ millions) Rate
1990 22,302 9,898 — — 44.38 12,959 7,177 — — 55.38 −2,721 99.67
1991 21,047 9,987 −5.63 0.90 47.45 13,594 7,348 4.90 2.38 54.05 −2,639 96.66
1992 22,870 10,656 8.66 6.70 46.59 14,719 7,937 8.28 8.02 53.92 −2,719 100.94
1993 29,429 13,875 28.68 30.21 47.15 15,348 7,599 4.27 −4.26 49.51 −6,276 91.59
1994 23,270 10,915 −20.93 −21.33 46.91 18,105 8,635 17.96 13.63 47.69 −2,280 124.35
1995 35,708 16,861 53.45 54.48 47.22 21,636 11,078 19.50 28.29 51.20 −5,783 116.72
1996 43,627 23,138 22.18 37.23 53.04 23,224 11,549 7.34 4.25 49.73 −11,589 116.67
1997 48,559 24,870 11.30 7.49 51.22 26,261 12,248 13.08 6.05 46.64 −12,622 110.32
1998 45,921 24,075 −5.43 −3.20 52.43 26,974 13,498 2.72 10.21 50.04 −10,577 100.42
1999 40,687 21,417 −11.40 −11.04 52.64 26,589 14,349 −1.43 6.30 53.97 −7,068 94.30
2000 54,509 26,610 33.97 24.25 48.82 27,775 14,510 4.46 1.12 52.24 −12,100 85.17
2001 41,399 18,280 −24.05 −31.30 44.16 31,334 16,118 12.81 11.08 51.44 −2,162 106.33
2002 51,554 23,321 24.53 27.57 45.24 36,059 18,459 15.08 14.52 51.19 −4,863 96.11
2003 69,340 31,496 34.50 35.05 45.42 47,253 24,350 31.04 31.92 51.53 −7,146 88.23
Average 1990–95 8.31 9.13 46.62 9.90 7.46 51.96
Average 1996–2003 4.20 1.46 50.38 8.39 9.30 50.68
— Not available.
Note: An increase in the real exchange rate (RER) indicates depreciation of the RER.
Source: State Planning Organization (http://www.dpt.gov.tr); the authors.
93

growth rate of Turkish exports to the EU, whichwas 7.5 percent prior to formation of the customsunion, increased to 9.3 percent over the period1996–2003. Similarly, the share of exports to the EUof total exports increased from 51.2 percent in 1995to 54 percent in 1999, but thereafter the sharedeclined to 51.5 percent in 2003. Finally, table 3.3reveals as well that Turkey has run a trade deficitwith the EU during every year of the period1996–2003 and that the deficit has been substantialby any standard. It reached $12.6 billion in 1997and $7.1 billion in 2003.
These findings reveal that the formation of thecustoms union between Turkey and the EU did notlead initially to considerable increases in trade withthe EU. Substantial increases in trade with the EUwere achieved only during the period 2002–03. Thereasons vary. First, the formation of the customsunion did not lead to considerable reductions intrade barriers on the EU side, because the EU hadabolished the nominal tariff rates on imports ofindustrial goods from Turkey on September 1,1971, long before the formation of the customsunion. But at that time certain exceptions weremade. The European Community had retained theright to charge import duties on some oil productsover a fixed quota and to implement a phasedreduction of duties on imports of particular textileproducts. Moreover, the trade in products withinthe province of the ECSC have been protected bythe Community through the application of nontariffbarriers and, in particular, antidumping meas-ures. With the formation of the customs union,quotas applied by the EU were abolished, but theEU retained the right to impose antidumpingduties.
Second, not until 2003 did Turkey incorporateinto its internal legal order the European Commu-nity instruments related to removal of technicalbarriers to trade that would allow Turkish industrialproducts to enter into free circulation in the EU.
Third, during the 1990s economic crises beganto affect Turkey with increasing frequency. Periodsof economic expansion alternated with periods ofequally rapid decline. After a year of severe reces-sion in 1994 when the gross national product(GNP) shrank by 6.1 percent, the economy wentthrough a boom period of above-trend growthbetween 1995 and 1997. Then, in 1998, the econ-omy was badly hit by the Russian crisis. In August
1999, the Marmara area of Turkey was hit by asevere earthquake, which was followed by a furtherlarge shock in the Bolu area in November 1999. As aresult of these shocks, real GNP shrank by 6.1 per-cent in 1999. At the end of 1999, Turkey embarkedupon a stabilization program, but a severe bankingcrisis arose in November 2000. Developments inFebruary 2001 led to a total loss of confidence inthe government’s stabilization program and a seri-ous run on the Turkish lira. With the floating of itscurrency, the country faced its severest economiccrisis. The loss of income and wealth and the associ-ated social and political stresses were unprecedented.As a result of these developments, the country sawsubstantial decreases in import demand during1994, 1999, and 2001.
Fourth, with the substantial reductions in tradebarriers on the Turkish side during 1996, the increasein imports was inevitable, so long as it was notaccompanied by a real devaluation of the Turkishlira. As table 3.3 reveals, there was no change in thereal exchange rate during 1996, and it then began toappreciate until the currency crisis of 2001. The realappreciation of the Turkish lira stimulated theimport growth and hampered the growth of exports,leading to higher trade balance deficits. Also duringthe period 2001–03, the euro appreciated against theU.S. dollar, leading to increases in the dollar value ofEU exports, which was then reflected in the higherdollar trade values of Turkish imports from the EUand of exports to the EU.
Table 3.4 shows the commodity composition ofTurkish exports to the EU and imports from theEU, as well as the shares of Turkish exports to theEU of total EU imports and the shares of Turkishimports from the EU of total EU exports overthe period 1995–2001. The table reveals that inabsolute terms Turkey achieved large increasesin exports for clothing, automotive products, tex-tiles, other semimanufactures, office machines andtelecommunications equipment, and iron and steel.For these commodities, Turkey experienced consid-erable increases in the shares of its exports to theEU of total EU imports. As for Turkish imports,again in absolute terms, large increases in importswere observed for chemicals, office machines andtelecommunications equipment, automotive prod-ucts, and other consumer goods. For those com-modities, the shares of Turkish imports from theEU of total EU exports also increased.
94 Turkey: Economic Reform and Accession to the European Union

95
TABLE 3.4 Effects of Customs Union between Turkey and EU, 1995–2001 (thousands of ECU)
Turkish Exports to EU
SITC Commodity 1995 1996 1997 1998 1999 2000 2001
Agricultural products0 + 1 + 4 + 22 Food 1,488,476 1,551,769 1,812,357 1,780,063 1,907,213 1,841,607 2,094,3482 − 22 − 27 − 28 Agricultural raw 179,233 205,765 216,488 210,663 213,382 213,457 228,864
materials
Mining products27 + 28 Ores and other 221,117 212,143 237,159 239,314 243,109 322,824 270,064
minerals3 Fuels 128,412 122,060 125,193 81,415 127,553 191,871 246,38368 Nonferrous metals 86,544 97,097 99,635 157,722 152,601 216,471 239,103
Manufactures67 Iron and steel 294,209 229,501 371,900 545,231 592,639 791,231 905,0755 Chemicals 237,583 198,285 258,291 274,909 297,999 386,476 420,2626 − 65 − 67 − 68 Other semimanufactures 572,754 638,208 776,036 879,443 979,327 1,234,435 1,509,363
Machinery and transportequipment
71 − 713 Power generating 31,551 48,097 73,328 81,867 86,265 89,163 92,876machinery
72 + 73 + 74 Other nonelectrical 106,447 129,455 175,601 211,566 261,858 330,166 404,780machinery
75 + 76 + 776 Office machines and 167,685 214,597 388,026 688,309 671,934 936,482 1,005,984telecommunications equipment
77 − 776 − 7783 Electrical machinery 301,881 386,368 449,078 574,577 614,099 714,463 845,547and apparatus
78 − 785 − 786 + Automotive products 270,766 357,760 301,337 389,917 995,122 1,212,181 1,892,0167132 + 7783
79 + 785 + 786 + Other transport 391,498 625,377 485,647 670,554 665,531 675,812 706,2807131 + 7133 + equipment7138 + 7139
65 Textiles 1,013,714 1,110,291 1,440,550 1,663,269 1,774,158 2,041,595 2,242,20884 Clothing 3,434,992 3,636,313 4,175,655 4,632,190 4,808,707 5,576,756 6,060,2458 − 84 − 86 − 891 Other consumer goods 271,714 347,685 403,340 442,251 582,351 679,154 867,501
9 + 891 Other products 45,150 48,420 54,352 75,862 69,906 74,247 124,630
Total 9,243,725 10,159,191 11,843,971 13,599,124 15,043,754 17,528,392 20,155,528

96
TABLE 3.4 (Continued)
Turkish Imports from EU
SITC Commodity 1995 1996 1997 1998 1999 2000 2001
Agricultural products0 + 1 + 4 + 22 Food 615,174 607,284 632,062 605,447 501,142 579,811 378,9682 − 22 − 27 − 28 Agricultural raw 393,666 459,321 589,606 447,182 379,080 533,469 491,794
materials
Mining products27 + 28 Ores and other 487,556 528,444 462,002 269,811 152,588 261,142 275,558
minerals3 Fuels 119,124 227,392 264,755 271,988 387,760 763,082 311,13168 Nonferrous metals 183,778 228,589 260,355 224,136 180,355 253,115 197,170
Manufactures67 Iron and steel 586,834 694,789 845,798 641,451 479,250 880,515 667,5115 Chemicals 2,043,193 2,441,128 3,184,322 3,213,593 3,465,937 4,569,685 3,931,2316 − 65 − 67 − 68 Other semimanufactures 978,841 1,339,036 1,568,580 1,567,096 1,400,645 1,912,605 1,509,193
Machinery and transportequipment
71 − 713 Power generating 178,837 252,654 393,062 555,062 442,280 545,555 595,281machinery
72 + 73 + 74 Other nonelectrical 2,372,464 3,786,516 3,994,368 3,678,348 2,596,553 3,538,331 2,719,502machinery
75 + 76 + 776 Office machines and 765,742 1,023,595 1,523,088 1,995,757 2,799,791 4,055,137 1,909,617telecommunications equipment
77 − 776 − 7783 Electrical machinery 546,930 769,613 1,065,654 1,226,264 1,059,906 1,300,772 896,479and apparatus
78 − 785 − 786 + Automotive products 1,237,308 1,909,360 3,201,332 2,866,472 2,304,918 5,568,748 1,920,0997132 + 7783
79 + 785 + 786 + Other transport 690,618 1,214,031 968,872 941,586 946,855 1,032,438 972,8607131 + 7133 + equipment7138 + 7139
65 Textiles 584,726 786,038 997,564 946,855 859,326 1,063,715 978,09984 Clothing 64,034 122,894 171,487 205,098 174,845 248,766 218,9288 − 84 − 86 − 891 Other consumer goods 808,246 1,041,430 1,324,120 1,391,441 1,331,107 1,750,501 1,443,680
9 + 891 Other products 690,158 514,377 185,256 447,875 406,893 567,749 398,968
Total 13,347,228 17,946,494 21,632,282 21,495,462 19,869,232 29,425,136 19,816,069

97
Share of Imports from Turkey of EU Imports
SITC Commodity 1995 1996 1997 1998 1999 2000 2001
Agricultural Products0 + 1 + 4 + 22 Food 2.955 2.948 3.225 3.075 3.327 2.966 3.1462 − 22 − 27 − 28 Agricultural raw materials 0.871 1.151 1.067 1.058 1.099 0.850 0.992
Mining products27 + 28 Ores and other minerals 1.767 1.718 1.597 1.650 1.778 1.798 1.5293 Fuels 0.198 0.155 0.147 0.132 0.163 0.129 0.17068 Nonferrous metals 0.531 0.719 0.586 0.885 0.889 0.855 1.024
Manufactures67 Iron and steel 2.942 2.754 4.000 4.424 5.813 5.454 6.4305 Chemicals 0.552 0.447 0.501 0.495 0.506 0.542 0.5426 − 65 − 67 − 68 Other semimanufactures 1.490 1.578 1.688 1.816 1.827 1.861 2.197
Machinery and transportequipment
71 − 713 Power generating machinery 0.349 0.438 0.529 0.497 0.439 0.360 0.37572 + 73 + 74 Other nonelectrical machinery 0.371 0.413 0.500 0.529 0.605 0.618 0.75375 + 76 + 776 Office machines and 0.245 0.290 0.440 0.681 0.584 0.581 0.686
telecommunications equipment77 − 776 − 7783 Electrical machinery and apparatus 1.251 1.530 1.491 1.736 1.632 1.392 1.77378 − 785 − 786 + Automotive products 1.278 1.555 1.024 1.073 2.309 2.506 3.7327132 + 7783
79 + 785 + 786 + 7131 + Other transport equipment 1.797 2.549 1.458 1.665 1.407 1.219 1.2547133 + 7138 + 7139
65 Textiles 7.796 8.397 9.287 10.134 11.041 10.800 11.69284 Clothing 11.049 10.863 10.768 11.306 10.999 10.878 11.2418 − 84 − 86 − 891 Other consumer goods 0.487 0.580 0.578 0.589 0.702 0.662 0.816
9 + 891 Other products 0.282 0.284 0.300 0.332 0.310 0.217 0.380
Total 1.695 1.749 1.761 1.914 1.929 1.696 1.961

98
TABLE 3.4 (Continued)
Share of Exports to Turkey of EU Exports
SITC Commodity 1995 1996 1997 1998 1999 2000 2001
Agricultural Products0 + 1 + 4 + 22 Food 1.488 1.399 1.296 1.286 1.078 1.101 0.7012 − 22 − 27 − 28 Agricultural raw materials 4.901 5.835 6.835 5.484 4.259 4.812 4.579
Mining products27 + 28 Ores and other minerals 14.852 15.620 10.797 8.375 4.228 5.376 5.6693 Fuels 0.893 1.469 1.544 1.941 2.337 2.564 1.30268 Nonferrous metals 2.635 3.061 3.021 2.716 2.190 2.122 1.652
Manufsactures67 Iron and steel 3.532 3.959 4.475 3.625 3.204 4.515 3.3425 Chemicals 2.781 3.081 3.414 3.349 3.250 3.529 2.7626 − 65 − 67 − 68 Other semimanufactures 1.764 2.225 2.327 2.339 1.998 2.247 1.720
Machinery and transportequipment
71 − 713 Power generating machinery 1.139 1.427 1.815 2.232 1.723 1.808 1.70672 + 73 + 74 Other nonelectrical machinery 2.889 4.141 3.951 3.663 2.744 3.225 2.29375 + 76 + 776 Office machines and 1.825 2.169 2.550 3.143 3.913 4.014 1.981
telecommunications equipment77 − 776 − 7783 Electrical machinery and apparatus 1.945 2.417 2.899 3.228 2.715 2.700 1.76678 − 785 − 786 + Automotive products 2.339 3.306 4.764 4.075 3.220 6.166 1.9647132 + 7783
79 + 785 + 786 + 7131 + Other transport equipment 1.966 3.280 2.153 1.945 1.918 1.729 1.5407133 + 7138 + 7139
65 Textiles 3.480 4.376 4.947 4.667 4.269 4.532 3.95484 Clothing 0.561 0.953 1.235 1.450 1.275 1.565 1.2478 − 84 − 86 − 891 Other consumer goods 1.354 1.611 1.781 1.865 1.701 1.833 1.428
9 + 891 Other products 6.328 3.878 1.296 2.557 1.965 2.486 1.805
Total 2.328 2.866 3.000 2.931 2.614 3.126 2.017
Note: For abbreviations, see table 3.2Source: Data provided by Eurostat; the authors.

Structure of Protection
To study the structure of applied tariffs, we con-sider tariff and tariff-like charges on imports intrade with the EU, with countries with whom theEU has free trade agreements, and with third coun-tries. In each case, we use the 12-digit HarmonizedCommodity Description and Coding System (HS)data on customs duties and the mass housing fundtax.5 Let ti
c denote the rate of customs duty on com-modity i and tis the ad valorem equivalent of themass housing fund tax rate. The relation betweendomestic prices and foreign prices is written as pi = (1 + ti
c + ti s ) E p$i , where pi denotes the
domestic price of commodity i, p$i the foreign
price of commodity i, and E the nominal exchangerate. To calculate the ad valorem equivalent of themass housing duty, we let Mi denote the CIF (cost,insurance, freight) value of the import of commod-ity i measured in Turkish liras; mi the quantity ofthe import of commodity i measured in units (theU.S. dollar–denominated housing fund tax isreported); FUNDi
1 the U.S. dollar–denominatedmass housing fund tax rate on commodity i;FUNDi
2 the ad valorem housing fund tax rate oncommodity i; and E the exchange rate (Turkish liraper U.S. dollar).
The base of the customs duty is the CIF price.Therefore, this duty is calculated as ti
c Mi . The masshousing fund tax levy is usually specific. For thosetaxes, the ad valorem equivalents of the specificrates must be calculated. Given the foreign price ofthe commodity, p$
j = Mj
mj E , the Turkish lira equiva-lent of the U.S. dollar–denominated levy is calcu-lated as FUNDi
1mi E = (Mi (FUNDi1/p$
i )). The advalorem mass housing fund tax rate is given byFUNDi
2 Mi . The sum total of all the above taxes andsurcharges is denoted by
(3.1) ti =(
tic +
(FUNDi
1
/p$
i
)+ FUNDi
2
)
Next we consider the tradable sectors in the 1996input-output table. The average applied tariff insector j is then calculated as
(3.2) applied tariff j =k∑
i=1
t ji
(M j
i
/M j
)
where t ji denotes the applied tariff rate on commod-
ity i of sector j, M ji the import of commodity i into
sector j, M j total imports of sector j, and k thenumber of commodities in sector j ( j = 1, . . . , 68).
Table 3.5 shows the nominal and effective pro-tection rates for the 68 tradable sectors of the 1996input-output table prepared by Turkey’s State Insti-tute of Statistics. The table reveals that the weightedaverage nominal protection rate (NPR) during2002 in trade with the EU is 1.95 percent; in tradewith Romania, a representative country among theeconomies with which Turkey has free trade agree-ments, 1.76 percent; and in trade with third coun-tries, 5.3 percent. By contrast, the weighted averageeffective protection rate (EPR) is 11.24 percent.6
Table 3.6 shows the frequency distribution ofthe NPRs and EPRs. Forty-eight out of 68 sectorshave zero NPRs in trade with the EU and in tradewith the countries with which Turkey has FTAs. Intrade with the EU, five sectors have NPRs largerthan 50 percent, and seven sectors have NPRs ofbetween 10 percent and 50 percent. Similar consid-erations apply for NPRs in trade with countrieswith which Turkey has FTAs. The NPRs in tradewith third countries are larger than 50 percent inseven sectors, between 10 percent and 50 percentin 10 sectors, and positive but less than 5 percent in38 sectors. Concomitant with the relatively lowNPRs are the low EPRs. Six sectors have EPRs above50 percent,and six sectors have EPRs between 10 per-cent and 50 percent. In 20 sectors the EPRs are neg-ative but larger than −100. The EPR is less than−100 in only one sector.
Table 3.5 shows that NPRs in trade with the EUand with countries with which Turkey has FTAs areall zero for industrial commodities and positive foragricultural and processed agricultural commodi-ties. For trade with third countries, the averageNPRs are high for food products, 11.1 percent foriron and steel, 10.92 percent for wearing apparel,10.28 percent for footwear, 7.01 percent for textiles,and 6.74 percent for plastics. The most protectedsectors measured in terms of EPRs are the manu-facture of sugar; manufacture of bakery products;processing and preserving of fruits and vegetables;growing of fruits, nuts, beverage and spice crops;and manufacture of cocoa, chocolate, sugar confec-tionary, and other food products. The sectors indi-cating a clear-cut comparative advantage includethe manufacture of textiles; casting of metals; man-ufacture of fabricated metal products; manufactureof furniture; manufacture of office, accounting,
Integration and the Manufacturing Industry 99

100 Turkey: Economic Reform and Accession to the European Union
NPR, NPR, NPR,I-O Code Sector EU EU with FTAs Other EPR
01 Growing of cereals and other crops NEC 8.83 8.84 8.84 9.9302 Growing of vegetables, horticultural 14.37 16.00 16.00 17.74
specialties, and nursery products03 Growing of fruit, nuts, beverage and 74.23 70.49 78.46 82.18
spice crops04 Farming of animals 2.33 2.29 2.74 −2.6005 Agricultural and animal husbandry service 21.82 26.35 26.35 48.50
activities, except veterinary activities06 Forestry, logging, and related service activities 0.22 0.28 0.28 0.0807 Fishing 30.10 12.80 56.06 50.4208 Mining of coal and lignite 0.00 0.00 0.00 −0.1709 Extraction of crude petroleum and natural gas 0.00 0.00 0.00 −0.1710 Mining of metal ores 0.00 0.00 0.77 0.0511 Quarrying of stone, sand and clay 0.00 0.00 0.00 −0.2712 Mining and quarrying NEC 0.00 0.00 0.02 −0.1613 Production, processing, and preserving 1.51 1.52 1.52 −1.52
of meat and meat products14 Processing and preserving of fish and 14.25 9.48 28.48 19.92
fish products15 Processing and preserving of fruit, 55.54 46.79 65.09 90.68
and vegetables16 Manufacture of vegetable and animal 13.82 9.37 14.59 18.24
oils and fats17 Manufacture of dairy products 107.61 107.46 109.49 a18 Manufacture of grain mill products, starches, 21.71 17.12 24.78 46.99
and starch products19 Manufacture of prepared animal feeds 6.36 6.36 6.57 −0.0820 Manufacture of bakery products 83.23 8.72 109.61 b21 Manufacture of sugar 78.49 78.49 78.49 b22 Manufacture of cocoa, chocolate, sugar 34.64 12.16 55.61 54.49
confectionery and other food products NEC23 Manufacture of alcoholic beverages 2.73 2.90 4.03 0.8624 Manufacture of soft drinks; production 0.11 0.01 9.03 −5.47
of mineral waters25 Manufacture of tobacco products 2.01 17.29 17.29 11.3726 Manufacture of textiles 0.00 0.01 7.01 −2.9527 Manufacture of other textiles 0.00 0.00 3.02 −0.0728 Manufacture of knitted and crocheted 0.00 0.00 10.25 3.70
fabrics and articles29 Manufacture of wearing apparel, except 0.00 0.00 10.92 7.01
fur apparel30 Dressing and dyeing of fur; manufacture 0.00 0.00 2.05 0.62
of articles of fur31 Tanning and dressing of leather; manuf. of 0.00 0.00 1.17 −0.85
luggage, handbags, saddlery, and harnesses32 Manufacture of footwear 0.00 0.00 10.28 8.8733 Sawmilling and planing of wood 0.00 0.00 0.71 −0.4134 Manufacture of wood and of products of 0.00 0.00 4.95 3.23
wood and cork35 Manufacture of paper and paper products 0.00 0.00 1.49 0.1836 Publishing 0.00 0.00 1.53 0.5537 Printing and service activities related to 0.00 0.00 2.18 0.88
printing
TABLE 3.5 Nominal and Effective Protection Rates, 2002(percent)

Integration and the Manufacturing Industry 101
TABLE 3.5 (Continued)
38 Manufacture of coke, refined petroleum 0.00 0.00 2.91 1.96products
39 Manufacture of basic chemicals, plastics in 0.01 0.01 6.31 2.79primary forms and synthetics rubber
40 Manufacture of fertilizers and nitrogen 0.00 0.00 6.49 4.00compounds
41 Manufacture of pesticides, other 0.00 0.00 6.00 2.92agrochemicals and paints, and varnishes
42 Manufacture of pharmaceuticals, medicinal 0.00 0.00 0.97 0.12chemicals, and botanical products
43 Manufacture of cleaning materials, cosmetics, 0.01 0.02 4.29 1.07and other chemicals and manmade fibers
44 Manufacture of rubber products 0.00 0.00 3.61 1.3845 Manufacture of plastic products 0.00 0.00 6.74 3.3046 Manufacture of glass and glass products 0.00 0.00 4.90 2.3247 Manufacture of ceramic products 0.00 0.00 4.76 2.6348 Manufacture of cement, lime, and 0.00 0.00 1.94 0.87
plaster-related articles of these items49 Cutting and finishing of stone and man. of 0.00 0.00 1.21 0.40
other nonmetallic mineral products NEC50 Manufacture of basic iron and steel 0.00 0.00 11.10 6.2351 Manufacture of basic precious and 0.00 0.00 3.40 1.54
nonferrous metals52 Casting of metals 0.00 0.00 0.00 −1.8953 Manufacture of fabricated metal products, 0.00 0.00 2.29 −0.87
tanks, reservoirs, and steam generators54 Manufacture of other fabricated metal 0.00 0.00 2.55 −0.06
products; metalworking service activities55 Manufacture of general-purpose machinery 0.00 0.00 2.53 0.1656 Manufacture of special-purpose machinery 0.00 0.00 1.65 −0.0657 Manufacture of domestic appliances NEC 0.00 0.00 2.55 0.6158 Manufacture of office, accounting, and 0.00 0.00 0.06 −0.35
computing machinery59 Manufacture of electrical machinery and 0.00 0.00 2.77 0.58
apparatus NEC60 Manufacture of radio, television, and 0.00 0.00 2.95 1.25
communication equipment and apparatus61 Manufacture of medical, precision and optical 0.00 0.00 1.81 0.32
instruments, watches, and clocks62 Manufacture of motor vehicles, trailers, 0.00 0.00 4.33 1.71
and semitrailers63 Building and repairing of ships, pleasure 0.00 0.00 0.25 −0.22
and sporting boats64 Manufacture of railway and tramway 0.00 0.00 1.69 0.48
locomotives and rolling stock65 Manufacture of aircraft and spacecraft 0.00 0.00 0.00 −0.0266 Manufacture of transport equipment NEC 0.00 0.00 4.03 1.6067 Manufacture of furniture 0.00 0.00 1.14 −0.6668 Manufacturing NEC 0.00 0.00 3.29 1.36Average 1.95 1.76 5.30 11.24
Note: I-O = input-output table; NPR = nominal protection rate; FTA = free trade agreement; EPR = effective protection rate; NEC = not elsewhere classified.a. Less than −100.b. More than 100.Source: Turkish State Institute of Statistics; the authors.
NPR, NPR, NPR,I-O Code Sector EU EU with FTAs Other EPR

and computing machinery; manufacture of basicprecious and nonferrous metals; manufacture ofbasic iron and steel; and mining products.7
Now we move from the structure of protection atthe industry level to a more aggregate level. Table 3.7presents the NPR and EPR for broad industrygroups. In the upper part of this table, industrieshave been classified into three industry groups.In the lower part, they have been divided intofour trade categories: export, export and importcompeting, import competing, and non-importcompeting.8
Calculations presented in the upper part oftable 3.7 reveal that primary commodities receive themost protection, contrary to the tendency for pro-tection to escalate from the lower to higher stages offabrication. The lower part of the table shows thatthe most protected sectors are the export industriesand the non-import-competing industries.
Contingent Protectionism
Article 36 of the Customs Union Decision of 1995specifies that as long as a particular practice is
102 Turkey: Economic Reform and Accession to the European Union
TABLE 3.6 Frequency Distribution of Protection Rates, 2002(percent)
NPR, NPR, NPR,EU EU with FTAs Other EPR
� 50.00 5 3 7 610.01–50.00 7 7 10 65.01–10.00 2 5 8 40.01–5.00 6 5 38 31
0 48 48 5 0−0.01–100.00 0 0 0 20
� −100.00 0 0 0 1
Total 68 68 68 68
Note: For abbreviations, see table 3.5.Source: The authors.
TABLE 3.7 Nominal and Effective Protection Rates, 2002(percent)
NPR, NPR, NPR,EU EU with FTAs Other EPR
Commodity groups
Primary commodities 18.23 18.06 20.21 25.57Mining and energy 0.00 0.00 0.08 −0.17Manufacturing 3.07 2.07 6.11 4.50
Trade categories
Export industries 11.64 10.06 22.26 21.54Export- and import-
competing industries 0.53 0.36 5.89 1.81Import-competing
industries 3.90 3.90 5.73 3.82Non-import-competing
industries 24.62 20.12 28.72 27.03
Note: For abbreviations, see table 3.5.Source: The authors.

incompatible with the competition rules of thecustoms union as specified in Articles 30–32 of thedecision and “in the absence of such rules if suchpractice causes or threatens to cause serious preju-dice to the interest of the other Party or materialinjury to its domestic industry,” the EuropeanCommunity or Turkey may take the appropriatemeasures. Article 42 allows antidumping actions aslong as Turkey fails to implement effectively thecompetition rules of the customs union and otherrelevant parts of the acquis communautaire. In suchcases, Article 47 of the Additional Protocol signedin 1970 between Turkey and the European Com-munity remains in force. According to the article,the Association Council, if it finds dumping, willaddress recommendations to the persons withwhom such practices originate. The injured partymay take suitable measures if the Council has madeno decision within three months and if the dump-ing practices continue. In the event a party needs animmediate action, it may introduce an interim pro-tection measure such as antidumping duties for alimited duration. But the Council may recommendthe abolition of those interim measures. Finally,Article 61, which addresses safeguards, states thatsafeguard measures specified in Article 60 of theAdditional Protocol will remain valid. According toArticle 60, the Community or Turkey may take thenecessary protective measures if serious distur-bances occur in a sector of the economy of theCommunity or Turkey or if they prejudice theexternal financial stability of one or more memberstates or Turkey, or if difficulties arise that adverselyaffect the economic situation in a region of theCommunity or Turkey.
Table 3.8 shows the products that were subject todefinitive antidumping and antisubsidy measuresby both parties at the end of 1995 and those subjectto antidumping and antisubsidy investigations dur-ing the period 1996–2002. The table reveals that atthe end of 1995, eight products exported fromTurkey were subject to definitive antidumping andantisubsidy measures by the EU. Ad valorem dutieswere imposed in five cases, a duty and “undertak-ings” were imposed in one case, and in the remain-ing cases undertakings were imposed. In undertak-ings, the Turkish firms must commit themselves toraising the export prices in the European Commu-nity market to agreed-on levels or to restrict thequantities exported to the Community to agreed-
on levels. These products were cotton yarn, poly-ester fibers and yarns, semifinished products ofalloy steel, and asbestos cement pipes. After 1996,the EU opened new investigations involvingTurkish exports of cotton fabrics, bed linen, ironand steel products, paracetamol, color televisionreceivers, and hallow sections. By contrast, at theend of 1995 Turkey had imposed duties on threecommodities: benzoic acids, printing and writingpapers, and polyester. After 1996, Turkey openedtwo new investigations involving imports of ballbearings and polyvinyl chloride from the EU andimposed antidumping duties in the case of thelatter.
Both the EU and Turkey have been active users ofcontingent protection measures, but the EU evenmore so. The results indicate that the formation ofthe customs union does not grant protection fromantidumping by the European Community. The EUhas continued to protect its sensitive sectorsthrough contingent protection measures and hasprotected the sectors most where Turkish penetra-tion measured by the share of Turkish exports of EUimports was highest (see table 3.2). With Turkey’saccession to the EU, the contingent protectionmeasures will no longer be available to both parties.
Technical Barriers to Trade
Technical barriers to trade are said to exist as longas the EU and Turkey impose different technicalregulations as conditions for the entry, sale, and useof commodities; as long as the two parties have dif-ferent legal regulations on health, safety, and envi-ronmental protection; and as long as the partieshave different procedures for testing and certifica-tion to ensure conformity to existing regulations orstandards.9 The different country requirements forthe entry, sale, and use of commodities can beimposed by governments in the form of technicalregulations and by nongovernmental organizationsin the form of standards. Technical regulations thatrelate to either technical specifications or testing orcertification requirements are mandatory, and theproduct must comply with the specifications towhich it is subjected. However, standards are volun-tary, not legally binding, and arise from the desireof producers or consumers to improve the infor-mation in commercial transactions and to ensurecompatibility between products.
Integration and the Manufacturing Industry 103

104
TABLE 3.8 Products Subject to Antidumping Investigations, 1996–2002
Commodity OJ Reference Measure
Investigations by EUDefinitive antidumping and antisubsidy measures in force as of December 31, 1995
Cotton yarn L82, 27.03.1992 and L289, 24.11.1993 DutiesCotton yarn L182, 27.07.1994 DutiesPolyester fibers and yarns L272, 28.09.1991 Undertakings (countervailing)Polyester yarns (man-made staple fibers) L88, 3.04.1992 DutiesPolyester yarns (POY and PTY) L347, 16.12.1988 DutiesSemifinished products of alloy steel L182, 2.07.1992 Duties and undertakingsSynthetic textile fibers of polyester L306, 22.10.1992 DutiesAsbestos cement pipes L209, 31.07.1991 Undertakings
New investigations after January 1, 1996Cotton fabrics, unbleached C50, 21.02.1996 Provisional duty imposed, but no definite measure imposedCotton fabrics, unbleached L295, 20.11.1996 Provisional duty imposedCotton fabrics L42, 20.02.1996 Terminated without the imposition of measuresBed linen L171, 07.05.1996 Terminated without the imposition of measuresCotton fabrics, unbleached C210, 11.07.1997 Terminated without the imposition of measuresSteel wire rod C144, 22.05.1999 Terminated without the imposition of measuresSteel ropes and cables C127, 05.05.2000 DutiesParacetamol C134, 13.05.2000 Terminated without the imposition of measuresColour television receivers C202, 15.07.2000 Terminated without the imposition of measuresWelded tubes and pipes, of iron and nonalloy steel C183, 29.06.2001 DutiesFlat rolled products of iron and nonalloy steel C364, 20.12.2001 PendingSteel ropes and cables L34, 03.02.2001 and L211, 04.08.2001 UndertakingsHallow sections C249, 16.10.2002 Pending
Investigations by TurkeyDefinitive antidumping and antisubsidy measures in force as of December 31, 1995
Benzoic acids 14.08.1991 DutiesPrinting and writing papers 20.05.1992 DutiesPolyester ELYAF 08.01.1993 Duties
New investigations after January 1, 1996Ball bearings 26.12.1998 Terminated without the imposition of measuresPolyvinyl chloride 02.11.2001 Duties
Note: OJ = Official Journal of the EU.Sources: Undersecretariat of Foreign Trade and various issues of the reports of the Commission on Anti-Dumping and Anti-Subsidy Activities.

Technical barriers have two aspects: (1) the con-tent of the norms (regulations and standards), and(2) the testing procedures needed to demonstratethat a product complies with the norm. The techni-cal barriers to trade (TBTs) thus come in two basicforms, content-of-norm TBTs and testing TBTs. Ineither case, the costs of the product design adapta-tions, reorganization of production systems, andmultiple testing and certification needed byexporters can be high. These costs are both up-front and onetime—for example, learning aboutthe regulation and bringing the product intoconformity—and ongoing, such as periodic testing.TBTs are said to distort trade when they raise thecosts of foreign firms relative to those of domesticfirms. As emphasized by Baldwin (2001), liberaliza-tion requires closing the gap between the costs ofthe foreign and domestic firms. The two maindimensions to such a step are content of norms andconformity assessment. Liberalization of the con-tent of norms involves making product normsmore cosmopolitan and thus narrowing the costadvantage of domestic firms. Liberalization of thesecond involves lowering the excess costs that for-eign firms face in demonstrating the compliance oftheir goods to accepted norms. The EuropeanCommission (1998) has pointed out that theremoval of technical barriers to trade will lead tofour types of benefits: (1) economies of scale;(2) rationalization of products or production,increased efficiency, and price reductions as a resultof increased competition; (3) restructuring ofindustry (e.g., plant closures, mergers, reorganiza-tion, relocation) to gain comparative advantage;and (4) innovation, stimulated by the dynamics ofthe single market.
The EU Approach to Technical Barriers to Trade
The basic objective of the EU policy andapproaches to removing technical barriers to tradeis to achieve free trade within the European Com-munity. Currently, this policy has two approaches:enforcement of the Mutual Recognition Principle(MRP) and harmonization of technical regulations.
Mutual Recognition Principle Mutual recogni-tion refers to the principles enshrined in the TreatyEstablishing the European Economic Community(Treaty of Rome), interpreted by the European
Court of Justice, as set out in the 1979 Cassis deDijon judgment. In this ruling, the court stated thatGermany could prohibit imports of a French bever-age (cassis de Dijon) only if it could invoke manda-tory requirements such as public health, protectionof the environment, and fairness of commercialtransactions. In other words, the court introduced avery wide definition of Article 28 (ex 30) of theTreaty of Rome, which prohibits quantitativerestrictions on imports between member states and“all measures having equivalent results.” As a resultof this ruling, the European Commission statedthat a product lawfully produced and marketed inone member state shall be admitted to other mem-ber states for sale, except in cases of mandatoryrequirements (the Mutual Recognition Principle).Thus, the basic EU approach under the MRP hasbeen to promote the idea that products manufac-tured and tested in accordance with a partnercountry’s regulations could offer levels of protec-tion equivalent to those provided by correspondingdomestic rules and procedures. Mutual recogni-tion, in other words, reflects the existence of ex antetrust between the trading partners.
The European Commission (1998) divides thetraded products into regulated and nonregulatedcommodities. The regulated products are thosewhose commercialization is governed by the regu-lations of member states, and the nonregulatedproducts are those for which no regulations havean impact on commercialization. The regulatedproducts are further divided into commoditiesunder the harmonized sphere and those under thenonharmonized sphere. Products under the har-monized sphere are covered by European rules forthe harmonization of regulations and mandatoryspecifications. Commodities under the nonhar-monized sphere are governed by national rules.The MRP is considered the first line of defenseagainst technical barriers in the regulated nonhar-monized sphere.
The principal examples of success of the MRPare those regulations that are new and have beennotified to the European Community under the83/189 procedures, but then they have been negoti-ated away or had specific mutual recognitionclauses inserted into the regulations.10 Any problemin implementation of the MRP is harder to identify,because it relies on complaints from firms or tradeassociations.
Integration and the Manufacturing Industry 105

In its relations with third countries, the EuropeanCommunity has advocated the use of mutual recog-nition agreements (MRAs) in many regional orbilateral forums. These agreements are based on themutual acceptance of test reports, certificates, andmarks of conformity issued by conformity assess-ment bodies of one of the parties to the agreement,in conformity with the legislation of the other party.Such agreements were signed with Australia, Canada,Israel, Japan, New Zealand, Switzerland, and theUnited States. The European Community also nego-tiated protocols to the Europe Agreements on Con-formity Assessment and Acceptance of IndustrialProducts (PECAs) with some of the then-candidatecountries. PECAs represent recognition of theprogress made in adopting and implementing therelevant Community legislation on industrial prod-ucts and in creating the necessary administrativeinfrastructure. The agreements cover a wide rangeof sectors, from medical devices to pressure vesselsand electrical equipment.
In 1992 the European Economic Area (EEA)Agreement was signed between the European FreeTrade Association (EFTA) countries and the EU. Inextending the EU Single Market to the EFTA coun-tries, the EU felt that ongoing and effective surveil-lance and enforcement were essential. Accordingly,the EFTA Court of Justice and the EFTA Surveil-lance Authority were established in 1992. Throughthe EEA Agreement, the EFTA countries Iceland,Lichtenstein, and Norway participate fully in theEU internal market and thus in the establishmentof common product requirements and methods ofconformity assessment. Outside the areas coveredby EEA legislation related to product requirements,EEA states are permitted to introduce nationalproduct requirements, if it can be proved that suchrequirements are needed to meet public health,environmental, safety, and other social considera-tions. To ensure transparency, the EEA states arerequired to notify the EFTA Surveillance Authorityand the European Commission of all draft nationaltechnical rules for products. Finally, the EEA Agree-ment forces the EFTA countries to accept futureEuropean Council directives on the Single Marketwithout formal participation into the formation ofthese new laws.
In summary, MRAs seek to facilitate trade whilesafeguarding the health, safety, and environmentalobjectives of each party. Each party is free to set its
health, consumer protection, environmental, orother regulations at whatever level it deems neces-sary, as long as they comply with internationalobligations. These obligations require that eachside have full confidence that the certificationprocess on the other side can wholly satisfy itsrequirements.
Harmonization of National Regulations andStandards The EU legislation on harmonizingtechnical specifications has followed two distinctapproaches, the old approach and the newapproach. The old approach was based on the ideathat the EU would become a unified economic areafunctioning like a single national economy. It dealtwith the content-of-standards issue using negoti-ated harmonization, and it sought adoption of asingle standard that laid out in detail technical reg-ulations for single products or groups of products.The regulations were implemented by the directivesof the European Council, and the designated bodiesin EU nations performed the conformity assess-ments. Technical regulations were harmonizedusing the old approach for products such as chemi-cals, motor vehicles, pharmaceuticals, and food-stuffs. Under this approach, the Council issueddirectives such as Directive 70/220/EEC on the har-monization of the member states’ laws related to themeasures to be taken against air pollution caused bygases from positive-ignition engines of motor vehi-cles. The directive detailed EU specifications apply-ing to the related products and their testing require-ments. Under the old approach, European standardsinstitutions such as CEN (Comité Européen deNormalisation) and CENELEC (Comité Européende Normalisation Electrotechnique) were not man-dated to draw up supplementary technical specifica-tions. But over time, the need was recognized toreduce the intervention of the public authoritiesprior to a product being placed on the market. Sothe “new approach” was adopted and applied toproducts that have “similar characteristics” and thathave been subject to a widespread divergence oftechnical regulations in EU countries.
Under the new approach, only “essential require-ments” are indicated. This approach gives manufac-turers greater freedom on how they satisfy thoserequirements by dispensing with the “old” type ofexhaustively detailed directives. Directives underthe new approach provide for more flexibility by
106 Turkey: Economic Reform and Accession to the European Union

using the support of the established standardiza-tion bodies—CEN, CENELEC, and the nationalstandards bodies. The standardization work is eas-ier to update and involves greater participationfrom industry.
Under the new approach, the European Coun-cil issues a directive that lays down “essentialrequirements”—the 1989 machinery directive isone example. So far, 23 directives have beenadopted on the basis of this approach. Examples ofproduct sectors regulated in accordance with thenew approach are toys, machines, constructionproducts, medical equipment, telecommunicationsterminal equipment, and recreational craft. Once anew approach directive has been issued, memberstates must conform their national laws and regula-tions to it. The European Commission is empow-ered to determine whether the national measuresare equivalent to the essential requirements. TheCouncil refers the task of formulating detailedstandards meeting the essential requirements toCEN, CENELEC, and the European Telecommuni-cations Standards Institute.
Conformity Assessment and Market SurveillanceTo ensure that products meet the requirements laiddown in the new approach directives, specialconformity assessment procedures have been estab-lished. They describe the controls to which prod-ucts must be subjected before they are consideredcompatible with the essential requirements andthus placed on the internal market. The extent ofthe controls a product must undergo varies accord-ing to the risk attached to use of the product.Requirements may range from a declaration by themanufacturer stating that certain standards havebeen applied, to extensive testing and certificationby independent, third-party conformity assessmentbodies (notified bodies). In 1993 Council Decision93/465/EEC was adopted in connection with thenew approach directives. It provides an overview ofall the conformity assessment procedures availableunder the directives, divided up into modules andgrouped by category of risk.
For products regulated by the new approachdirectives, a CE (Conformité Européne) markingconfirms conformity with the essential require-ments of the directives and is required for a productto be placed on the internal market. The CE mark-ing indicates not only that the product has been
manufactured in conformity with the requirementsof the directive, but also that the manufacturer hasfollowed all the prescribed procedures for conform-ity assessment. It ensures free access to all of the EU.Meanwhile, the manufacturer or its local represen-tative is required to keep all necessary technicaldocumentation as proof for the relevant authoritiesthat the requirements have been satisfied.11
The final stage of implementation of the newapproach system consists of market surveillanceprocedures that develop a common approach toenforcement. Market surveillance consists of thecontrol that the relevant authorities in the memberstates are required to carry out to ensure that thecriteria for CE marking have been satisfied—afterthe products have been placed on the market. Thecontrol is intended to prevent misuse of the CEmarking, to protect consumers, and to secure alevel playing field for producers. Basically, marketsurveillance is carried out in the form of randominspections to ensure that the technical documen-tation as required by the directive is available, but italso may include examination of the documenta-tion or the product itself.
Coverage of EC Technical Regulations Table 3.9provides crude estimates of the sectoral valueadded covered under the old approach and the newapproach. A large proportion of European Com-munity value added in manufacturing has beencovered by the Community’s technical regulationspolicy: 33 percent by the old approach directivesand 42 percent by the new approach directives,with each approach dominating different sectors.Finally, columns four and five show the share thateach sector holds in intra-EC trade and worldtrade. The table reveals that sectors dominated bythe old approach represent 29 percent of EC valueadded, 26 percent of intra-EC trade, and 17 percentof EC imports from the rest of the world. Sectorsdominated by the new approach represent 33 per-cent of EC value added, 43.5 percent of intra-ECtrade, and 56 percent of EC imports from the restof the world.
Turkish Policies and Approaches
With the formation of the EU-Turkey customsunion, Turkey has removed all customs duties andequivalent charges as well as quantitative restrictions
Integration and the Manufacturing Industry 107

on industrial products.12 Thus industrial productsmove freely between the EU and Turkey—with theexception of contingent protection measures andtechnical legislation. According to Decision 1/95 ofthe EC-Turkey Association Council establishing thecustoms union, Turkey must harmonize its techni-cal legislation with that of the EU. Decision 2/97 ofthe Association Council listed the areas in whichTurkey must align its legislation. This work shouldhave been finalized before the end of 2000, but,unfortunately, it was not completed until the begin-ning of 2005. According to Annex II of Decision2/97, Turkey was supposed to incorporate into itsinternal legal order 324 instruments that corre-spond to various European Economic Communityor European Community regulations and directives.Currently, Turkey has incorporated into its legalorder only 203 of these 324 instruments. In the
meantime, the number of instruments that Turkeyhas to incorporate into its legal order has increasedto 560, and Turkey has incorporated 276 of them.Thus, progress has been rather slow.
Turkey also must establish the so-called qualityinfrastructure, a generic term encompassing theoperators and operation of standardization, testing,certification, inspection, accreditation, and metrol-ogy (industrial, scientific, and legal). In the EU,national quality infrastructures that functionaccording to the same principles and obey the samerules are a critical element of the free circulation ofgoods in the Single Market. Turkey, as a member ofa customs union with the EU and as a candidatecountry, has to align its national quality infrastruc-ture to the European one. Products manufacturedin a future EU member state must satisfy the samerequirements prevailing in the EU, and conformity
108 Turkey: Economic Reform and Accession to the European Union
TABLE 3.9 EC Technical Regulation Directives and European Community (EC) Imports, 1995
Coverage of EC Technical Regulations (percent of Import Structuresectoral value added) (percent)
Old New Intra-ECISIC Manufacturing Sector Approach Approach Total Imports World
200 Mining 96 0 96 0.4 2.4311–312 Agribusiness 100 0 100 5.8 3.8313 Beverages and sugar 63 37 100 3.2 1.1321 Textiles 0 59 59 3.6 4.2322 Clothing 0 77 77 2.3 5.6323 Leather goods 0 0 0 0.4 1.0331 Wood and wood products 0 100 100 1.9 2.2341 Paper and paper products 63 0 63 4.7 2.5351–352 Chemicals 22 76 98 14.7 9.2353 Petroleum refineris 100 0 100 1.5 1.6354 Petroleum and coal products 0 100 100 0.8 8.5355 Rubber and rubber products 54 0 54 3.7 2.1361 Pottery, china, etc. 0 79 79 0.3 0.6369 Nonmetallic products 11 55 66 1.9 1.0371 Iron and steel 0 24 24 6.9 7.1381 Metal products 0 43 43 3.1 2.2382 Machinery 0 93 93 14.0 16.5383 Electrical and electronic goods 18 82 100 10.0 13.5384 Transport equipment 74 19 93 15.6 8.3
Other manufactured goods 0 62 62 5.3 6.7
All sectors 33 42 75 100.0 100.0
Note: Coverage of EC technical regulation is measured in percentage value added. ISIC = InternationalStandard Industrial Classification.Source: Messerlin 2001.

to these requirements must be demonstrated in thesame “harmonized” way and according to the sameprinciples.
Recently, Turkey has taken major steps to alignwith the acquis. Law 4703 on the Preparation andImplementation of Technical Legislation on Prod-ucts, which entered into force in January 2002, hasbeen supplemented by secondary legislation. Thisframework law provides the legal basis for harmo-nization with the EC legislation. It defines the prin-ciples for product safety and for implementation ofthe old and new approach directives, including theconditions for placing products on the market; theobligations of the producers and distributors, con-formity assessment bodies, and notified bodies;market surveillance and inspection; withdrawal ofproducts from the market; and notification proce-dures.13 The legislation on market surveillance, useand affixing of the CE conformity mark, workingprinciples and procedures for the conformityassessment bodies and notified bodies, and notifi-cation procedures between Turkey and the EU fortechnical regulations and standards which apply tonon-harmonized regulated area entered into forceduring 2002.14 Furthermore, Turkey has adopted allof the 23 new approach directives that require affix-ing the CE conformity marking, and 18 of thedirectives entered into force up to the present time.They cover commodities and product groups suchas low-voltage equipment, toys, simple pressurevessels, construction products, electromagneticcompatibility, gas appliances, personal protectiveequipment, machinery, medical devices, nonauto-matic weighing instruments, telecommunicationsterminal equipment, hot water boilers, civil explo-sives, lifts, and recreational crafts.
Overall, then, Turkey has advanced the harmo-nization of its technical legislation both on a sec-toral (vertical) basis and at a horizontal level. It is inthe process of establishing the necessary structureson conformity assessment and market surveillance.By now Turkey has the legal basis on which accred-itation could be based. In order to assign the noti-fied bodies that would deal with the certification ofproducts, the ministries have established the crite-ria for the selection of such bodies for the prod-ucts covered by certain new approach directives.Although in Europe, as in Turkey, accreditation isnot mandatory to be appointed as a notified body,since the Turkish Ministries did not feel adequately
prepared to select notified bodies, they madeaccreditation one of the criteria for their selectionby signing protocols with the Turkish NationalAccreditation Body, TURKAK.15 However the factthat TURKAK has been a member of EuropeanAccreditation Agency since 2003 and yet has notsigned any multilateral agreement with the Europeanpartners makes its accreditation non-functional.Thus, even though TURKAK has given accreditationto potential notified bodies, this accreditation ismeaningless in the eyes of national accreditationbodies of the EU.
Because of this the market is also reluctant touse TURKAK, because TURKAK accreditation isnot accepted within the EU. This situation presentsTurkish conformity assessment bodies with a dis-advantage. The relatively large Turkish firms wish-ing to obtain CE marking for products exported tothe EU market usually contact local subsidiaries ofEuropean notified bodies that use their Europeanlaboratories for testing. But for other Turkish com-panies this process seems to be expensive and slow.The small and medium-size enterprises (SMEs)that export products find it particularly difficult topay the high costs. In Turkey, marking and certifi-cation parallel to the EU system are implementedonly in the automotive sector, which is subject tothe old approach directives. Istanbul Technical Uni-versity (ITU) does automotive testing under theauthorization of the Ministry of Industry andTrade, and it performs acoustic, emissions, andother tests. The Turkish Standards Institute (TSE),16
Tofas-Fiat, and Ford-Otosan also have engine andemissions test facilities; Seger has an audible warn-ing devices laboratory; Tam-Test is implementingtesting and certification in the case of agriculturaltractors; Fren Teknik has test facilities for brakesand Brisa has a pneumatic tires laboratory. Turkeyis implementing all relevant automotive EC direc-tives via these facilities.17 Crash tests, electromag-netic compatibility (EMC), and other tests on com-plete cars are largely conducted abroad; as of May2003 the National Metrology Institute (UME) wasable to run the EMC tests on vehicles.18
Other than for the automotive sector, as of 2005Turkey is suffering from a lack of certification bod-ies (see European Committee for Standardization2003). To make its conformity assessment compati-ble with that in the EU, Turkey has opened up thecertification, testing, and calibration market to
Integration and the Manufacturing Industry 109
other Turkish actors. However, Turkish firms arereluctant to enter the market for conformity assess-ment bodies as long as uncertainties prevail regard-ing the acceptance of notified bodies by the Euro-pean Commission. Some of the Turkish firms incooperation with the notified bodies in the EU haveentered the Turkish market. Over time competitionwill ensure lower costs for conformity assessment.The expense, time, and unpredictability incurred inobtaining approvals can then be reduced by havingproducts evaluated in Turkey once the Turkishnotified bodies are accepted by the European Com-mission and joint ventures with notified bodies inthe EU increase. These savings can be particularlyimportant where rejection of products in the EUcan create delays and necessitate additional ship-ping or other costs. In addition, the SMEs can ben-efit from procedures in which all testing and certifi-cation steps are carried out locally at lower costs.Turkish firms, and in particular the SMEs, can thenbe expected to increase their competitiveness in theEU market
Although, in principle, standards are voluntaryin Turkey, in the absence of a proper market sur-veillance system the technical ministries and theUndersecretariat of Foreign Trade have turned thestandardization regime and licensing before pro-duction into a mandatory regime in order to pro-tect the market and the consumers. This pre-market control system gives the TSE a great dealpower. According to the European Committee forStandardization (2003), the TSE has misused itspower in several cases of imports and has createdtechnical barriers to trade. The TSE asked for thetechnical files of the imported products when theyentered the Turkish market, and the processing ofthe files took an usually long time. There are alsocases in which products bearing the CE markingwere asked for further inspection. Yet the Turkishinternal market is regulated largely throughmandatory standards and marking issued by theTSE.Since 2004 products covered by directives on toysafety, medical devices, active implantible medicaldevices, low voltage electrical equipment, electro-magnetic compatibility and machinery are not sub-ject to mandatory controls when imported andused in the internal market. But products coveredby the remaining 12 new approach directives aresubject to mandatory controls.
In Turkey, 500 standards are mandatory for thedomestic market as well as for imports. For all of
these the TSE occupies a monopoly position, andfor 500 of them TSE certification is mandatory. Forthese mandatory standards, manufacturers mostlyneed first a TSE certificate and then a Ministry ofIndustry and Trade license to put the products onthe market.
The system in use in Europe, for those areasunder the new approach directives, is in-marketcontrol. Under this system, the responsibility forplacing a product on the market is left to the pro-ducer, so long as it is certified that the product sat-isfies the minimum requirements set under thedirectives. Market surveillance, the safeguard of thesystem, is the responsibility of public authorities.The market surveillance authorities carry out theiroperations in an impartial and nondiscriminatoryway. They shall have the power, competence, andresources to regularly visit commercial, industrial,and storage facilities; to regularly visit, if appropri-ate, workplaces and other premises where productsare put into service’ to organize random and spotchecks; to take samples of products and subjectthem to examination and testing, and to require allnecessary information. Through this system, meas-ures are taken in the EU to ensure that productsmeet the requirements of the applicable directives,that action is taken to bring noncompliant prod-ucts into compliance, and that sanctions areapplied when necessary. Member states are free tochoose the type of sanction they are going to use.The only requirement is that the penalties be effec-tive, proportionate, and dissuasive.
Technical Barriers and Trade betweenthe EU and Turkey
To determine those sectors and products in whichtechnical regulations are important for Turkishexporters, we used data produced by a study under-taken by the European Commission (1998). Thisstudy provides information, at the three-digit levelof the NACE (Nomenclature Générale des ActivitésÉconomiques dans les Communautés Européennes)classification, about whether trade is affected bytechnical regulations and the dominant approachused by the European Commission to removesuch barriers in the EU.19 It classifies the technicalregulations as follows: those in which barriers areovercome using mutual recognition, old approach,new approach, and those in which there are notechnical barriers.
110 Turkey: Economic Reform and Accession to the European Union

Integration and the Manufacturing Industry 111
Table 3.10 shows the overall trade coverage oftechnical regulations and of the differentapproaches to their removal in the EU and to theirapplication to Turkish exports to the EU. Here weaggregated, following the approach of Breton,Sheehy, and Vancauteren (2001), the value of man-ufacturing imports across the four-digit StandardIdentification Trade Classification (SITC) cate-gories, which are subject to old approach directives,new approach directives, mutual recognition, and aresidual.20 We then identified the proportion of totalimports value in sectors subject to old approachdirectives, new approach directives, mutual recogni-tion, and a residual.
The table demonstrates that a very high propor-tion of EU manufacturing imports and of Turkishmanufacturing exports to the EU are subject totechnical barriers. The average value of the propor-tion over the period 1990–2001 is 82.0 percent forthe EU and 84.2 percent for Turkey. In the EU,sectors subject to old approach directives make upon average 20.4 percent; mutual recognition andnew approach directives, 31 percent each; and sec-tors subject to no technical barriers, 18.0 percent.For Turkish exports to the EU, the average values ofthe shares are 11.7 percent for old approach prod-ucts; 60.0 percent, mutual recognition; 12.5 per-cent, new approach products; and 15.8 percent,
TABLE 3.10 Trade Coverage of Technical Regulations and of Different Approachesto Their Removal, 1990–2001 (percent)
Subject toTechnical No Technical
Old Approach Mutual Recognition New Approach Barriers Barriers
Manufacturing Imports of EU1990 24.507 28.463 29.869 82.838 17.1621991 23.662 29.839 29.187 82.689 17.3111992 23.550 29.692 29.165 82.407 17.5931993 21.970 30.615 28.662 81.248 18.7521994 21.925 29.543 30.041 81.508 18.4921995 19.078 30.497 31.459 81.034 18.9661996 18.593 31.266 31.331 81.189 18.8111997 18.700 32.269 30.435 81.404 18.5961998 18.795 32.990 30.632 82.418 17.5821999 18.663 33.245 30.627 82.535 17.4652000 17.407 31.318 33.835 82.560 17.4402001 18.108 31.602 32.538 82.248 17.752
Manufacturing Exports of Turkey to EU1990 8.815 63.561 14.911 87.287 12.7131991 9.436 66.096 10.349 85.881 14.1191992 8.735 66.411 10.694 85.840 14.1601993 7.334 68.648 9.470 85.452 14.5481994 9.048 64.839 10.607 84.494 15.5061995 10.029 61.501 12.685 84.215 15.7851996 10.143 61.589 12.267 83.998 16.0021997 10.096 58.503 13.465 82.064 17.9361998 12.474 56.552 13.042 82.069 17.9311999 16.432 52.961 13.545 82.939 17.0612000 17.634 50.762 14.332 82.728 17.2722001 20.707 47.358 14.887 82.951 17.049
Note: The variables show the percentages of different approaches to the removal of technical barriers totrade in total manufacturing imports for the EU and in Turkish manufacturing exports to the EU.Source: The authors.

sectors subject to no technical barriers. Sectors withno significant technical barriers to trade includenonferrous metals, footwear, and sawing and pro-cessing of wood. Old approach products includemainly motor vehicles and parts, and new approachproducts include sectors specified earlier, such asmachinery.
Developments in the proportions of sectors sub-ject to technical barriers over the period 1990–2001reveal that the proportion of manufacturingimports subject to technical barriers has been rela-tively stable in the EU and that for Turkish exportsto the EU declined from 87.3 percent in 1990 to82.9 percent in 2001. In the EU, the proportion ofsectors subject to mutual recognition and newapproach directives has increased slightly overtime, and the proportion of sectors subject to oldapproach directives has correspondingly declined.As for Turkish exports to the EU, the proportion ofsectors subject to the new approach has been rela-tively constant. As the share of sectors subject tothe old approach has increased, a correspondingdecline appears in the share of sectors subject tomutual recognition.
We now turn to consideration of the index val-ues of revealed comparative advantage (RCA)defined as
(3.3) RCAi = ln
[(Xi/X)
(MEUi /MEU )
]
where Xi denotes Turkish exports of commodity i tothe EU, X the total value of Turkish manufacturingexports to EU, Mi
EU the total EU imports of com-modity i, and MEU the total value of EU imports.Equation 3.3 considers the share of commodity iexports to the EU of total Turkish exports to the EUrelative to the share of commodity i imports by theEU to total EU imports. If this ratio is greater than1, the natural logarithm of the variable will be posi-tive. In that case, the country is said to have a com-parative advantage in producing that product, andthe higher the value, the more competitive theproduct. Using the index of revealed comparativeadvantage, it is possible to determine in whichproduct categories Turkey has the greatest compar-ative advantage. Table 3.11 shows the nine sectorswith the highest RCA values by the different EUapproaches to technical barriers to trade. The tablereveals that the highest RCA values are attained inthe sectors with no technical barriers. Turkey seems
also to be quite an efficient producer of goods fromthe sectors under mutual recognition as well asfrom the new approach sectors. Thus if tradebetween Turkey and the EU is constrained by tech-nical barriers to trade, then with the accession ofTurkey, competition in the EU for these productsmay intensify.
This analysis reveals that, for Turkey, sectorssubject to technical regulations in the EU accountfor considerable shares of Turkish exports to theEU. The calculations demonstrate that accessionwill affect the exports of Turkish old and newapproach products to the EU, and that Turkey has acomparative advantage in sectors subject to newapproach directives. Therefore, it is of utmostimportance that Turkey establish the quality infra-structure needed, encompassing the operators andoperation of standardization, testing, certification,inspection, accreditation, and metrology. TheTurkish quality infrastructure has to functionaccording to EU principles and obey the same rulesas in the EU. Only then will Turkey be able to par-ticipate in the free circulation of goods in theenlarged Single Market.
Conditions of Competition
Over the past few decades, Turkey has used inten-sively three tools of industrial policy: investmentincentives, export incentives, and a policy of state-owned enterprises. In using these measures, the gov-ernment has tried to obtain a preferred allocation ofresources. The purpose of the investment incentivescheme has been to increase investment and over-come the barriers imposed by capital market imper-fections to entry into industry. But investmentincentives in Turkey have also been a barrier to com-petition. Through the incentive system, establishedfirms have obtained cost advantages that havehelped them to consolidate their market position.Entrants, competing with scarce fiscal resources,have been at a disadvantage relative to well-informed incumbents. The credit incentives, whichwere supposed to promote entry, have often turnedinto instruments that have reinforced the positionof large incumbents. Furthermore, the government,with its large share of the banking system, has alsodirectly controlled the allocation of credit, andcredit from public banks has often been extendedon the basis of political considerations. Overall,
112 Turkey: Economic Reform and Accession to the European Union

TABLE 3.11 Sectors with Highest RCA Values in Each Category
Turkish Exports to EU,
RCA, 1999–2001 AverageSITC 1999–2001 (thousands of ECU)
Old approach7831 Public transport-type passenger motor vehicles 3.2198 181,8345238 Other metallic salts, peroxysalts of inorganic, acids 2.9270 65,2037611 Television receivers, color, whether or not combined 2.2189 725,3835323 Synthetic inorganic tanning matter; preparations 1.4908 8955237 Percarbonates; commercial ammonium carbonate 1.3940 26,1407139 Parts, NES, for the engines of 7132, 7133 and 7138 1.1439 217,5825234 Polysulphides, dithionites, sulphites, sulphates 0.8834 5,1485233 Hypochlorites; chlorites; chlorates; bromates; iodates 0.8047 1,1908986 Magnetic tapes, recorded 0.7545 4,692
Mutual recognition6534 Fabrics, woven, � 85% synthetic staple fibers, mixed 3.1060 101,4948462 Panty hose, socks, and other hosiery, knitted 2.5733 285,684
or crocheted6542 Fabrics, woven, � 85% wool or fine animal hair 2.4675 29,0228454 T-shirts, singlets and other vests, knitted 2.4476 984,273
or crocheted6529 Other woven fabrics of cotton 2.4372 4,2658442 Suits, ensem., dresses, skirts, trousers, knitted, 2.3862 349,327
women6513 Cotton yarn, other than sewing thread 2.3166 235,3516524 Other woven fabrics > 85% cotton, 2.2850 85,496
weight � 200 g/m2
6536 Fabrics, woven, � 85% artificial staple fiber 2.2635 21,646(excluding pile)
New approach7753 Dishwashing machines of the household type 3.4565 11,5696624 Nonrefractory ceramic bricks and similar products 2.7997 117,9966762 Rods (excluding 6761), iron, steel, hot-rolled, 2.6528 188,512
hot-drawn6761 Bar and rods, hot-rolled, irregular wound coils, 2.4310 114,585
iron, steel6612 Hydraulic cements, whether or not colored, clinkers 2.4192 160,4318121 Boilers (excluding 711), radiators, etc., not electrical 2.2241 83,0126794 Other tubes, pipes, and hollow profiles of iron, steel 2.1659 132,2057752 Household-type refrigerators and food freezers 2.0630 152,8366652 Glassware for domestic use 1.8532 105,440
(excluding 66511, 66592, 66593)
No technical barriers7753 Dishwashing machines of the household type 3.4565 11,5696581 Sacks and bags of textile materials, for packing goods 2.8222 109,7786579 Special products of textile materials 2.5383 39,2826564 Tulles and other net fabrics; lace, in the piece 2.5145 10,0518122 Ceramic sinks and similar sanitary fixtures 2.3625 58,2566584 Bed, table, toilet, and kitchen linen 2.3485 471,4566112 Composition leather, basis of leather, slabs, sheets 2.0423 1,3806931 Stranded wire, ropes, slings, and the like, of metal 1.9921 44,4416252 Other knitted or crocheted fabrics, noncoated, etc. 1.7149 70,236
Note: RCA = revealed comparative advantage; SITC = Standard International Trade Classification; NEC = notelsewhere classified.Source: The authors.
113

established firms benefit from the investment incen-tive schemes such as investment allowances, but newentrants do not, because to benefit from devicessuch as investment allowances, they must show pos-itive profits in their income statements first.
In Turkey, the investment incentive scheme hasbeen used while no specific competition legislationor competition policy has been enforced in thecountry. To promote competition within the coun-try, Turkey eliminated quantitative restrictions inforeign trade during the 1980s and substantiallydecreased the levels of nominal and effective pro-tection rates. With the formation of the customsunion with the EU, all of the tariff barriers onimports of industrial commodities from the EUwere completely eliminated, as noted earlier.
On the export side, over the 1980s Turkey usedvarious export incentive measures. But in 1985 itagreed to eliminate export subsidies by 1989. After1989, Turkey eliminated most of the export incen-tives, introduced GATT legal subsidies, andreduced substantially the nominal and effectiveexport subsidy rates. The reduction in the nominaland effective protection and subsidy rates was notsufficient, however, to ensure proper functioning ofmarkets in Turkey. During the 1950s, a similar situ-ation in Europe had led to the adoption of compe-tition policies aimed at ensuring effective competi-tion, allocating resources efficiently, and creatingthe best possible climate for fostering innovationand technical progress.
In June 1989, Turkey adopted the law titledOn the Prevention of Unfair Competition inImportation, containing both antidumping andantisubsidy provisions. Turkey adopted its compe-tition policy during December 1994 with the Lawon the Protection of Competition. The key provi-sions of the competition law are based on the EU’scompetition law: agreements, decisions, and con-certed practices in constraint of competition; abuseof dominant position; and mergers and acquisi-tions. The statute contains not only rules on forbid-den practices and provisions against the abuse ofa dominant market position, but also regulationson acquisitions and mergers. The CompetitionAuthority responsible for the implementation andenforcement of the prohibitions set out in the lawopened its doors in October 1997. As indicated byOECD (2002) competition policy, institutions inTurkey are in place and active, but competition pol-
icy is not fully integrated into the general policyframework for regulation. Turkey’s competitionlaw has no rule equivalent to Article 86 of theTreaty Establishing the European Community togovern the permissible operations of monopoliesproviding public services. Nevertheless, specialrules limit competition in some sectors such as thefinancial sector, tobacco industry, mineral prod-ucts, agriculture, and postal services. In addition,Turkey has to control its anticompetitive state aidpolicy.21
It could be said, then, that Turkey has achievedconsiderable progress in the fields of investmentand export incentives, but it has not achieved simi-lar progress in dealing with public enterprises.Although privatization has become a prominentpart of the Turkish structural adjustment program,since 1983 privatization has not gained momentum.
Table 3.12 presents basic data on Turkey’s man-ufacturing sector for 2000. The data are taken fromtwo surveys, “Annual Manufacturing IndustryStatistics” and “Small Manufacturing Industry Sta-tistics,” published by the State Institute of Statistics.The first survey covers all firms in the public sectorand private firms employing 10 or more employees.The second survey covers all private firms employ-ing less than 10 employees. The table reveals thatthe sectors with the highest shares of total valueadded of the manufacturing sector were petroleumand coal, 12.49 percent; textiles, 12.29 percent; foodprocessing, 11.45 percent; and chemicals, 9.71 per-cent. The sectors with the highest shares of totalmanufacturing employment were textiles, 18.56 per-cent; food processing, 15.41 percent; wearing appareland footwear, 9.62 percent; and metal products,7.98 percent. The sixth column of the table givesthe share of 1998 public sector value added of thetotal value added of the corresponding manufac-turing subsector. From the table, it follows that theaverage share of public sector value added of thetotal manufacturing industry value added was18.91 percent. Petroleum and coal had the highestshare with 89.83 percent, followed by the tobaccoindustry with 78.25 percent, and the beveragesindustry with 50.58 percent.
The seventh and eighth columns of table 3.12indicate exposure to international trade. Columnseven provides a measure of competitiveness on thedomestic market measured by the rate of importpenetration. If Q, X, and M stand, respectively, for
114 Turkey: Economic Reform and Accession to the European Union

115
TABLE 3.12 Characteristics of Turkish Manufacturing Industries, 2000
Rate ofShare of Share of Public Sector Share of Public Exposure
Value Sector of Sector of Value Sector of Import Export to InternationalAdded Total Manuf. Total Manuf. Added Total Sectoral Penetration Ratio Competition
(US$ millions) Value Added Employment Employment (US$ millions) Value Added (percent) (percent) (percent)ISIC Sector (1) (2) (3) (4) (5) (6) (7) (8) (9)
311 + 312 Food processing 4,687.9 11.45 255,437 15.41 609.8 13.01 7.47 9.44 16.20313 Beverages 908.2 2.22 11,194 0.68 459.4 50.58 0.77 1.98 2.74314 Tobacco 1,063.8 2.60 18,951 1.14 832.4 78.25 1.97 5.28 7.15321 Textiles 5,030.6 12.29 307,689 18.56 56.0 1.11 17.31 39.88 50.29322 + 324 Wearing apparel and footwear 1,533.9 3.75 159,561 9.62 19.1 1.25 30.70 86.35 90.54323 Fur and leather products 110.8 0.27 10,358 0.62 0.0 0.00 50.93 38.19 69.67331 Wood and cork products 526.7 1.29 67,688 4.08 0.0 0.01 12.03 3.99 15.54332 Furniture and fixtures 449.2 1.10 72,072 4.35 0.0 0.01 53.63 44.26 74.1634 Paper and products 1,314.5 3.21 56,459 3.41 111.5 8.48 27.49 5.30 31.33351 + 352 Chemicals 3,977.7 9.71 59,537 3.59 287.9 7.24 49.13 13.66 56.08353 + 354 Petroleum and coal 5,112.4 12.49 9,882 0.60 4,592.3 89.83 17.08 2.34 19.02355 + 356 Rubber and plastic products 1,574.5 3.85 60,577 3.65 4.3 0.27 9.01 8.90 17.1136 Nonmetallic minerals 2,712.5 6.62 92,160 5.56 23.1 0.85 9.01 20.84 27.9837 Basic metals 2,216.0 5.41 65,729 3.96 454.8 20.52 40.04 27.04 56.25381 Metal products 1,946.2 4.75 132,276 7.98 50.2 2.58 15.95 11.20 25.36382 Machinery 1,822.5 4.45 100,594 6.07 96.5 5.29 63.39 18.98 70.34383 Electrical machinery 2,218.8 5.42 68,616 4.14 44.4 2.00 62.00 38.25 76.53384 Transport equipment 3,218.6 7.86 84,358 5.09 82.0 2.55 48.87 25.22 61.76385 Professional and sci. measuring equip. 251.1 0.61 11,327 0.68 12.0 4.80 69.28 11.23 72.7339 Other manufacturing industries 271.9 0.66 13,647 0.82 5.9 2.16 56.67 61.23 83.203 Manufacturing 40,947.8 100.00 1,658,112 100.00 7,741.6 18.91 33.10 21.78 47.67
Note: ISIC = International Standard Industrial Classification.Source: Annual manufacturing industry statistics and small manufacturing industry statistics provided by Turkish State Institute of Statistics.

sectoral output, exports, and imports, the domesticdemand D will be equal to D = Q – X + M, andthe rate of import penetration will equal[M ∗ 100/D]. A low level of penetration does notnecessarily mean that there are barriers to entry.The table reveals that the professional and scientificmeasuring equipment sector had the highestimport penetration with 69.28 percent, followed bythe machinery sector with 63.39 percent and elec-trical machinery with 62.00 percent. Column eightof table 3.12 gives the export ratio, defined as[X ∗ 100/Q]. From the table, it follows that thewearing apparel and footwear sector had thehighest export ratio at 86.35 percent, followed byother manufacturing industries at 61.23 percent,furniture and fixtures at 44.26 percent, and textilesat 39.88 percent. Finally, column nine gives the rateof exposure to international competition, definedas [(export ratio) + [1 – (export ratio/100)] ∗ importpenetration]. The construction of this indicatorrests on the idea that the exported share of produc-tion is 100 percent exposed and that the share soldon the domestic market is exposed in the same pro-portion as the penetration of the market. The tablereveals that the wearing apparel and footwear sec-tor had the highest exposure to international com-petition with an index value of 90.54 percent, fol-lowed by the other manufacturing industries sectorwith an index value of 83.20 percent and the elec-trical machinery sector with an index value of76.53 percent.
Defining the markup by the relation
(3.4) λ = (value added − labor cost)
labor cost
we note from the first two columns of table 3.13that the markup calculated for three-digit Interna-tional Standard Industrial Classification (ISIC) sec-tors in Turkey are much higher than the markup inBelgium, a small open economy considered to bethe benchmark country in the analysis. The data inthis table were obtained from the “Annual Manu-facturing Industry Statistics” of the State Instituteof Statistics for the period 1999–2000 for the Turk-ish economy, and from the OECD STAN Databasefor Belgium for the period 1997–99. The tableshows that the markups in all other sectors inTurkey exceed those in Belgium, and that the aver-age markup in Turkey relative to that in Belgium,[(1 + λ)/(1 + λ′)], is highest in the sectors coke,refined petroleum products, and nuclear fuel
(ISIC 353 + 354); other manufacturing (ISIC 39);and wood and products of wood (ISIC 331). Thelowest average markups in Turkey relative to thosein Belgium, [(1 + λ)/(1 + λ′)], are found in thesectors paper and paper products (ISIC 341);leather, leather products, and footwear (ISIC 323 +324); and nonferrous metals (ISIC 372). Figure 3.1plots the average value of the markup for the man-ufacturing industry over the period 1980–2000. Onthe other hand, defining the markup as
(3.5) λ = (output − labor cost − material cost)
(labor cost + material cost)
we note from the last two columns of table 3.13 thatthe markups in Turkey exceed those in Belgiumexcept in the sectors electrical and optical equip-ment (ISIC 383 + 385); iron and steel (ISIC 371);and publishing, printing, and reproduction ofrecorded media (ISIC 342). The average markup inTurkey relative to that in Belgium, [(1 + λ)/(1 + λ′)], is now highest in the sectors tobaccoproducts (ISIC 314); other nonmetallic mineralproducts (ISIC 36); and coke, refined petroleumproducts, and nuclear fuel (ISIC 353 + 354). Theresults are striking. They indicate the lack of com-petition in the Turkish manufacturing sector.
To further illustrate the arguments about theconditions of competition in the Turkish manufac-turing sector, we consider in table 3.14 the four-firmconcentration ratios. The table reveals that the con-centration ratios are relatively high and that themost concentrated sectors are the manufacture ofcoke coal and briquettes (ISIC 3542), manufactureof sporting and athletic goods (ISIC 3903),
116 Turkey: Economic Reform and Accession to the European Union
0
100
200
300
500
400
600
1975
1980
1985
1990
1995
2000
2005
Turkey
Belgium
FIGURE 3.1 Average Value of Markups forManufacturing, 1980–2000
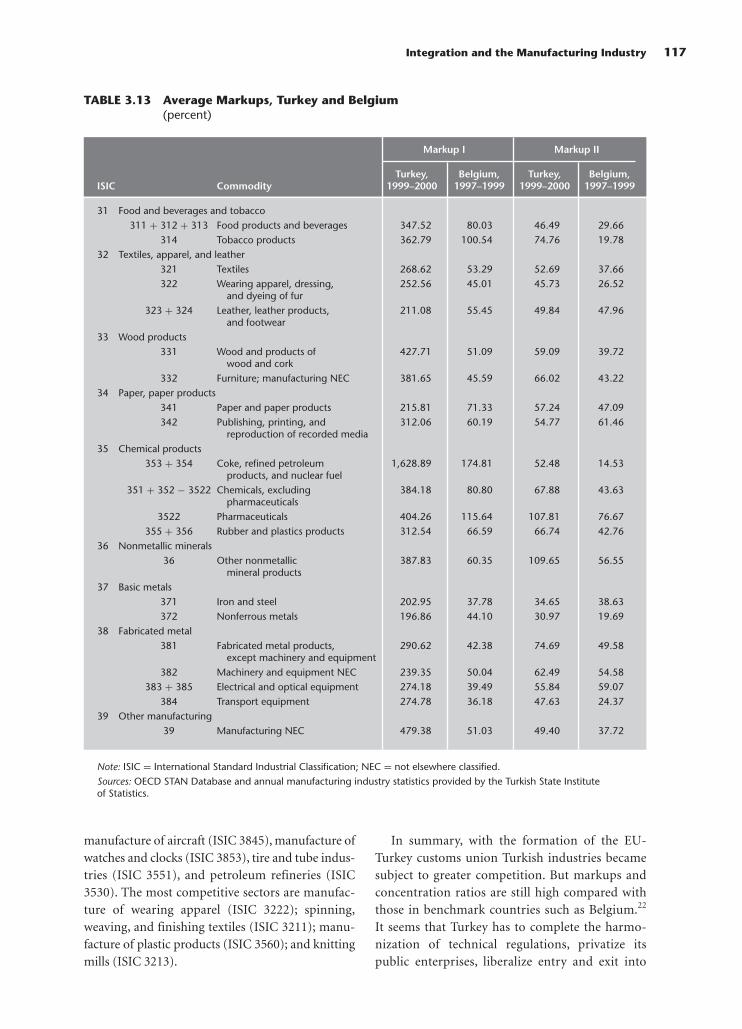
Integration and the Manufacturing Industry 117
TABLE 3.13 Average Markups, Turkey and Belgium(percent)
Markup I Markup II
Turkey, Belgium, Turkey, Belgium,ISIC Commodity 1999–2000 1997–1999 1999–2000 1997–1999
31 Food and beverages and tobacco311 + 312 + 313 Food products and beverages 347.52 80.03 46.49 29.66
314 Tobacco products 362.79 100.54 74.76 19.7832 Textiles, apparel, and leather
321 Textiles 268.62 53.29 52.69 37.66322 Wearing apparel, dressing, 252.56 45.01 45.73 26.52
and dyeing of fur323 + 324 Leather, leather products, 211.08 55.45 49.84 47.96
and footwear33 Wood products
331 Wood and products of 427.71 51.09 59.09 39.72wood and cork
332 Furniture; manufacturing NEC 381.65 45.59 66.02 43.2234 Paper, paper products
341 Paper and paper products 215.81 71.33 57.24 47.09342 Publishing, printing, and 312.06 60.19 54.77 61.46
reproduction of recorded media35 Chemical products
353 + 354 Coke, refined petroleum 1,628.89 174.81 52.48 14.53products, and nuclear fuel
351 + 352 − 3522 Chemicals, excluding 384.18 80.80 67.88 43.63pharmaceuticals
3522 Pharmaceuticals 404.26 115.64 107.81 76.67355 + 356 Rubber and plastics products 312.54 66.59 66.74 42.76
36 Nonmetallic minerals36 Other nonmetallic 387.83 60.35 109.65 56.55
mineral products37 Basic metals
371 Iron and steel 202.95 37.78 34.65 38.63372 Nonferrous metals 196.86 44.10 30.97 19.69
38 Fabricated metal381 Fabricated metal products, 290.62 42.38 74.69 49.58
except machinery and equipment382 Machinery and equipment NEC 239.35 50.04 62.49 54.58
383 + 385 Electrical and optical equipment 274.18 39.49 55.84 59.07384 Transport equipment 274.78 36.18 47.63 24.37
39 Other manufacturing39 Manufacturing NEC 479.38 51.03 49.40 37.72
Note: ISIC = International Standard Industrial Classification; NEC = not elsewhere classified.Sources: OECD STAN Database and annual manufacturing industry statistics provided by the Turkish State Institute of Statistics.
manufacture of aircraft (ISIC 3845), manufacture ofwatches and clocks (ISIC 3853), tire and tube indus-tries (ISIC 3551), and petroleum refineries (ISIC3530). The most competitive sectors are manufac-ture of wearing apparel (ISIC 3222); spinning,weaving, and finishing textiles (ISIC 3211); manu-facture of plastic products (ISIC 3560); and knittingmills (ISIC 3213).
In summary, with the formation of the EU-Turkey customs union Turkish industries becamesubject to greater competition. But markups andconcentration ratios are still high compared withthose in benchmark countries such as Belgium.22
It seems that Turkey has to complete the harmo-nization of technical regulations, privatize itspublic enterprises, liberalize entry and exit into

118 Turkey: Economic Reform and Accession to the European Union
TABLE 3.14 Concentration of Domestic Activity, 1997–2000(four-firm concentration ratios)
ISICRev 2 Commodity 1997 1998 1999 2000
3111 Slaughtering, preparing, and preserving meat 34.15 29.64 32.45 31.133112 Manufacture of dairy products 51.54 50.25 51.55 49.573113 Canning and preserving of fruits and vegetables 19.08 17.34 16.16 18.903114 Canning, preserving, and processing of 91.72 89.85 81.40 84.98
fish and crustacea3115 Manufacture of vegetable and animal oils and fats 46.66 42.28 43.25 43.923116 Grain mill products 17.01 17.97 25.46 24.303117 Manufacture of bakery products 29.52 30.37 31.30 34.813118 Sugar factories and refineries 39.14 33.43 35.94 31.623119 Manufacture of cocoa, chocolate and sugar 58.61 49.26 51.03 53.03
confectionery3121 Manufacture of food products NEC 25.47 28.75 21.88 24.943122 Manufacture of prepared animal feeds 22.66 26.41 27.40 28.953131 Distilling, rectifying, and blending spirits 60.97 66.08 71.99 74.503132 Wine industries 74.24 74.21 80.89 75.163133 Malt liquors and malt 74.56 80.12 69.04 76.493134 Soft drinks and carbonated waters industries 63.17 64.82 60.90 66.063140 Tobacco manufactures 54.81 58.92 57.64 70.823211 Spinning, weaving, and finishing textiles 9.90 7.68 9.44 11.083212 Manufacture of madeup textile goods, 21.74 22.99 24.71 25.32
except wearing apparel3213 Knitting mills 14.93 12.20 22.89 13.953214 Manufacture of carpets and rugs 43.34 41.66 43.84 39.653215 Cordage, rope, and twine industries 82.12 88.77 70.69 95.913219 Manufacture of textiles NEC 67.88 65.07 66.28 65.043221 Manufacture of fur and leather products 23.98 23.95 22.03 24.893222 Manufacture of wearing apparel, except 12.03 7.45 8.79 9.21
fur and leather3231 Tanneries and leather finishing 21.42 30.47 19.40 19.423233 Manufacture of products of leather and 58.23 68.77 57.75 61.04
leather substitutes3240 Manufacture of footwear, except vulc. or 34.04 32.18 38.43 28.27
molded rubber3311 Sawmills, planing, and other wood mills 37.98 34.23 38.27 35.163312 Manufacture of wooden and cane containers 61.99 47.05 64.11 51.02
and small cane ware3319 Manufacture of wood and cork products NEC 67.83 60.53 63.29 60.223320 Manufacture of furniture and fixtures, except 45.99 44.06 44.37 49.66
primarily of metal3411 Manufacture of pulp, paper, and paperboard 55.42 42.42 39.29 38.823412 Manufacture of containers and boxes of paper 24.46 25.52 27.95 26.09
and paperboard3419 Manufacture of pulp, paper, and paperboard articles 45.79 41.45 56.87 47.003421 Printing, publishing, and allied industries 63.28 40.42 50.08 45.553511 Manufacture of basic industrial chemicals, 47.00 53.20 54.64 67.81
except fertilizers3512 Manufacture of fertilizers and pesticides 56.58 54.43 55.28 54.653513 Manufacture of synthetic resins, plastic materials 92.64 88.30 90.34 86.913521 Manufacture of paints, varnishes, and laquers 49.15 45.49 39.82 38.843522 Manufacture of drugs and medicines 31.28 31.59 29.74 33.373523 Manufacture of soap and cleaning preparations, 62.17 66.35 71.32 63.36
perfumes3529 Manufacture of chemical products NEC 37.67 44.02 44.98 43.683530 Petroleum refineries 97.81 97.86 97.51 97.39

Integration and the Manufacturing Industry 119
TABLE 3.14 (Continued)
3541 Manufacture of asphalt paving and 88.54 73.54 72.19 92.33roofing materials
3542 Manufacture of coke coal and briquettes 100.00 100.00 100.00 100.003543 Compounded and blended lubricating 87.51 85.54 79.22 88.25
oils and grease3544 Liquid petroleum gas tubing 88.96 84.60 87.49 84.173551 Tire and tube industries 97.88 98.03 98.24 99.083559 Manufacture of rubber products NEC 28.85 22.80 25.84 23.663560 Manufacture of plastic products NEC 18.01 16.38 16.48 14.413610 Manufacture of pottery, china, and earthenware 74.71 58.05 60.97 69.813620 Manufacture of glass and glass products 43.64 40.68 42.21 39.513691 Manufacture of structural clay products 47.09 43.91 41.59 42.783692 Manufacture of cement, lime, and plaster 31.23 29.52 33.68 34.953699 Manufacture of nonmetallic mineral products 27.70 26.82 25.89 20.083710 Iron and steel basic industries 32.29 31.76 36.69 32.913720 Nonferrous metal basic industries 40.27 42.40 44.92 49.063811 Manufacture of cutlery, hand tools, and 28.72 33.58 20.19 24.52
general hardware3812 Manufacture of furniture and fixtures, primarily 49.40 43.18 45.58 40.87
of metal3813 Manufacture of structural metal products 23.59 24.04 24.80 24.413819 Manufacture of fabricated metal products 26.31 25.96 27.67 23.853821 Manufacture of engines and turbines 92.31 88.68 86.78 92.533822 Manufacture of agricultural machinery 81.46 81.59 79.93 80.73
and equipment3823 Manufacture of metal and wood working machinery 46.89 45.84 37.63 35.703824 Manufacture of special industrial machinery 26.99 26.61 21.65 21.16
and equipment3825 Manufacture of office, computing, and accounting 75.13 86.06 82.19 90.88
machinery3829 Machinery and equipment, except electrical 51.73 49.54 54.52 48.103831 Manufacture of electrical industrial machinery 58.63 56.01 57.51 53.22
and apparatus3832 Manufacture of radio, television, and communication 75.40 69.75 64.74 62.37
equipment3833 Manufacture of electrical appliances and housewares 48.54 51.99 51.95 45.453839 Manufacture of electrical apparatus and supplies 27.08 24.94 29.73 26.143841 Ship building and repairing 50.28 46.01 48.48 52.183842 Manufacture of railroad equipment 98.04 98.78 96.62 94.213843 Manufacture of motor vehicles 40.81 40.60 46.44 47.323844 Manufacture of motorcycles and bicycles 78.79 77.45 80.31 76.123845 Manufacture of aircraft 100.00 100.00 100.00 99.783849 Manufacture of transport equipment NEC 94.08 95.81 94.22 100.003851 Controlling equipment NEC 34.87 43.34 36.34 55.933852 Manufacture of photographic and optical goods 62.06 76.78 81.98 84.303853 Manufacture of watches and clocks 100.00 100.00 100.00 98.733854 Other 79.65 81.46 65.87 65.643901 Manufacture of jewelery and related articles 48.80 46.02 47.12 53.393902 Manufacture of musical instruments 100.00 100.00 — —3903 Manufacture of sporting and athletic goods 100.00 100.00 100.00 100.003909 Manufacturing industries NEC 31.38 32.74 39.74 45.58
— Not available.Note: For abbreviations, see table 3.13.Source: Turkish State Institute of Statistics.
ISICRev 2 Commodity 1997 1998 1999 2000

various sectors of the economy, and impose hardbudget constraints on all public and private enter-prises. Further integration with the EU will thenremove the distortions in the price system, which,in turn, will boost the allocative efficiency in theeconomy.
Conclusion
Although customs duties and equivalent charges, aswell as quantitative restrictions on industrial prod-ucts, were eliminated with the formation of thecustoms union in 1996 between Turkey and the EU,the free movement of industrial products betweenthe parties could not be established until 2003. Thetwo remaining issues are contingent protectionismand technical barriers to trade. Article 44 of theCustoms Union Decision allows the EU to imposeantidumping measures until Turkey implementseffectively the competition rules and the rules onthe intellectual, industrial, and commercial prop-erty rights of the customs union. Similar considera-tions apply for Turkey. Since 1996, both partieshave been active users of these measures.
On another front, under Decision 2/97 of theAssociation Council, Turkey had to incorporateinto its internal legal order, before the end of 2000,324 instruments corresponding to various Euro-pean Economic Community and European Com-munity regulations and directives on technical leg-islation. But the work has still not been completed.In addition, Turkey has to align its national qualityinfrastructure to the European one. Products man-ufactured in Turkey must satisfy the same require-ments as those prevailing in the EU, and thedemonstration of conformity to these require-ments must be done in the same “harmonized” wayand according to the same principles as in the EU.Recently, Turkey has taken major steps to align itslegislation with the acquis. But it still has to estab-lish the operators and operation of standardization,testing, certification, inspection, accreditation, andmetrology according to the same principles andobeying the same rules as in the EU. Once theseproblems are solved, competition will increase inthe economy, leading to decreases in markups andconcentration ratios, provided it is complementedwith privatization and adoption of appropriatecompetition policies. Thus, to benefit from freetrade between the parties, Turkey has to adopt and
implement the whole body of EU legislation—thatis, the acquis communautaire, and in particular therules on competition, intellectual, industrial, andcommercial property rights, and the whole body oftechnical legislation on a sectoral as well as a hori-zontal level.
Notes
1. The authors wish to thank their discussant, BernardHoekman, and anonymous referees for helpful comments.Ibrahim Yılmaz and Harun Çelik provided excellent researchsupport.
2. For a discussion of the trade regime during the 1980s, seeTogan (1994).
3. All dollar amounts are U.S. dollars unless otherwiseindicated.
4. EU15 refers to the 15 members of the EU prior to the 2004enlargement in which 10 more countries joined the EU. The15 countries are Austria, Belgium, Denmark, Finland, France,Germany, Greece, Ireland, Italy, Luxembourg, Netherlands,Portugal, Spain, Sweden, and the United Kingdom.
5. The mass housing fund tax is a specific tariff imposedmainly on agricultural commodities.
6. The average rates of nominal protection were derived byweighting nominal rates estimated as applied rates for the sec-tors by sectoral outputs valued at world prices. The average ratesof effective protection were obtained by weighting effective ratesestimated for the sectors by sectoral value addeds evaluated atworld market prices.
7. These are the sectors with negative EPRs and with valuesgreater than −100.
8. The classification of the sectors into four trade groups fol-lows the same rule adopted by Balassa and others (1982). Theexport category includes sectors whose exports amount to morethan 10 percent of domestic production and whose importsaccount for less than 10 percent of domestic consumption. Forsectors classified as export and import competing, both of theseshares exceed 10 percent. The import-competing and non-import-competing categories include sectors whose exportsamount to less than 10 percent of domestic production. In sec-tors in the import-competing category, imports exceed 10 per-cent of domestic consumption. In sectors in the non-import-competing category, imports are less than 10 percent ofdomestic consumption.
9. The authors are grateful to Ela Yazıcı Inan for her contri-butions to this section. On technical barriers to trade, see Sykes(1995).
10. Directive 83/189/EEC, amended by Directive 98/34/EC,established the requirements that member states notify draftregulations and that national standards bodies notify work onnew standards.
11. Consider the machinery directive that applies to allmachinery and to safety components. The directive defines amachine as “an assembly of linked parts or components, at leastone of which moves.” Annex I of the directive gives a compre-hensive list of the hazards that may arise from the design andoperation of machinery, and gives general instructions on whathazards must be avoided. The directive requires the machinemanufacturer to produce a “technical file” of documentary evi-dence that the machinery complies with the directive, the formand content of which is dictated in the directive. Machinery
120 Turkey: Economic Reform and Accession to the European Union

meeting the requirements of the directive is required to have theCE symbol clearly affixed to indicate compliance. An item ofequipment may only display the CE mark when the equipmentsatisfies all relevant directives—for example, machines withelectrical controls must also comply with the requirements ofthe low voltage and electromagnetic compatibility (EMC) direc-tives. For most items of machinery, the manufacturer (or itsauthorized representative) can self-certify—that is, it designs itsproducts to meet the requirements of the directive and signs aDeclaration of Conformity. This declaration of conformity mustbe backed up with the technical file. The file must be retained fora period of 10 years after the manufacture of the machine (or thelast machine of a production run). For certain especially danger-ous items of machinery (known as Annex IV machines), justifi-cation of use of the CE mark must be independently verified bya recognized authority (called an “approved body” or “notifiedbody”). Manufacturers of Annex IV machines are required tocompile a technical file that shows how the machinery has beenconstructed to meet the requirements of the directive. The file isthen audited by the notified body to confirm that the directive’srequirements have indeed been met, and a sample of themachinery is examined to confirm that it is constructed asdescribed in the file. If a harmonized standard for a particulartype of Annex IV machine exists, the manufacturer can avoidthe expense of type examination by manufacturing the machinefully in accordance with the standard. All that is then required isthat the file be lodged with a notified body, but the notified bodydoes not have to give an opinion on the machine—it simply actsas an independent repository for the file. This procedure canonly be applied to machines that are manufactured fully inaccordance with the harmonized standard. If there are any devi-ations from the standard (e.g., a light guard is fitted where thestandard says a physical guard is required), the full type approvalroute must be followed.
12. This section reports the state of affairs on technical barri-ers to trade in Turkey as of 2003.
13. Law 4703 is based on Council Directive 92/59/EEC ongeneral product safety, Council Regulation 85/C 136/01 on thenew approach to technical harmonization and standards, and theCouncil resolution of December 1989 on the global approach toconformity assessment.
14. The legislation on market surveillance was prepared usingCouncil Directive 92/59/EEC on general products safety, theCouncil resolution of December 1989 on the global approach toconformity assessment, Council Directive 88/378/EEC on theapproximation of the laws of the member states on the safety oftoys, and on a European Commission implementation guide(2000). The legislation on working principles and procedures forthe conformity assessment bodies and notified bodies was pre-pared using the material in chapter 6 of the European Commis-sion guide (2000). The legislation on the use and affixing of theCE conformity mark is based on Council Decision 93/465/EECon the modules for the various phases of the conformity assess-ment procedures and the rules for affixing and the use of the CEconformity marking. Finally, the legislation on notification pro-cedures between Turkey and the EU for technical legislation andstandards is based on Council Directive 98/34/EC, laying down aprocedure for the provision of information in the field of techni-cal standards and regulations and the relevant section of Decision2/97 of the EC-Turkey Association Council.
15. Under a law published on October 27, 1999, TURKAK isthe national accreditation body in all fields. But the regulationsthat gave the Turkish Standards Institute (TSE) and Turkish
Scientific and Technical Research Council (TUBITAK) thepower to accredit are still in force.
16. The TSE was established in 1954 to draw up standards forall kinds of products and services.
17. For automotive products, the “e” sign confirmsconformity.
18. UME is organized as part of TUBITAK. UME has cali-bration laboratories in mechanics, physics, electricity, ionizingradiation, and chemicals. The laboratories under constructioninclude EMC, acoustics, and liquid flow.
19. We use four-digit SITC trade data and correspondencesbetween the NACE, International Standard Industrial Classifica-tion, and Standard Identification Trade Classification classifica-tions provided by the Eurostat’s Classification Server (http://europa.eu.int/comm/eurostat/ramon/).
20. Manufactures are defined as consisting of sectors underSITC sections 5, 6, 7, and 8 minus division 68 and group 891.
21. Although Turkey realizes that the major pillars of a com-petition policy must comprise privatization, liberalization ofentry and exit, imposition of hard budget constraints on all pub-lic and private enterprises, and a very liberal trade regime, itfaces difficulties in implementing these principles.
22. For concentration ratios in Slovakia and Belgium, seeDjankov and Hoekman (1998).
References
Balassa, B. 1982. Development Strategies in Semi-IndustrialEconomies. Baltimore: Johns Hopkins University Press.
Baldwin, R. E. 2001. “Regulatory Protectionism, DevelopingNations and a Two-Tier World Trade System.” BrookingsTrade Forum 3: 237–80.
Breton, P., J. Sheehy, and M. Vancauteren. 2001. “Technical Barri-ers to Trade in the European Union: Importance for AccessionCountries.” Journal of Common Market Studies 39: 265–84.
Djankov, S., and B. Hoekman. 1998. “Conditions of Competi-tion and Multilateral Surveillance.” World Economy 21:1109–28.
European Commission. 1998. Technical Barriers to Trade. Vol. 1,Subseries III, Dismantling of Barriers, The Single MarketReview. Luxembourg: Office for Official Publications of theEuropean Communities (OOPEC).
————. 2000. Guide to the Implementation of Directives basedon the New Approach and the Global Approach. Brussels.
————. 2002. 2002 Regular Report on Turkey’s Progresstowards Accession. Brussels.
European Committee for Standardization. 2003. Support to theQuality Infrastructure in Turkey: Country Report 2003.Brussels: CEN.
Messerlin, P. A. 2001. Measuring the Costs of Protection in Europe:European Commercial Policy in the 2000s. Washington, DC:Institute for International Economics.
OECD (Organisation for Economic Co-operation and Develop-ment). 2002. Turkey: Crucial Support for Economic Recovery.OECD Reviews of Regulatory Reform. Paris: OECD.
Sykes, A. O. 1995. Product Standards for Internationally IntegratedGoods Markets. Washington, DC: Brookings Institution.
Togan, S. 1994. Foreign Trade Regime and Trade Liberalization inTurkey during the 1980’s. Avebury, UK: Ashgate Publishing.
Undersecretariat of Foreign Trade. 2002. “Türkiye’nin AB TeknikMevzuatına Uyumu—Çerçeve Kanun, Uygulama Yönet-melikleri” [Harmonization of Turkish Regulations on Tech-nical Barriers to Trade to EU Approaches]. Ankara: UFT.
Integration and the Manufacturing Industry 121


tions of EU regulation for the sector. The first sec-tion discusses the context of membership, espe-cially the Customs Union between the EU andTurkey, but also the other protocols agreed to andunder negotiation between the EU and Turkey.That section is followed by a brief quantitative dis-cussion of the likely impact of full membership ontrade and on the transport sector itself. Because thecustoms union covers many of the steps needed formembership, the incremental impact of the lastnecessary steps for the transport sector is relativelyminimal. Other possible effects are then identifiedthrough a detailed assessment of the regulatoryregime in Turkey for transport as compared withthe one in effect for the rest of the EU. Here, too,the major steps have already been taken, implyingthat EU membership will have little direct impact,institutionally or economically, on the domestictransport sector. Effects may be related to EU struc-tural funds (which was the case in Spain and Portu-gal), but in view of the size of the looming enlarge-ment, such funds are likely to be limited.
The Customs Union
The primary difference between the current list ofnew EU members and membership for Turkey is thedepth and long history of trade integration in placebetween the EU and Turkey. The EU-Turkey cus-toms union has been a long time in the making. In
The European Union (EU) has been at the center ofa recent explosion in regional trading schemes. Acombination of economic and political factors—including greater peace and stability in the EU hin-terland, support for democratic reforms in devel-oping countries, greater trade and investmentliberalization in developing countries, and access tonew markets for EU exports—have been advancedas motives for the EU to conclude such agreements.For developing countries, the attraction has beenpreferential access to the large EU market and theprospect of increased EU aid. The reality is thateverybody, except the North American and high-income Asian economies, now seems to have pref-erential access to the EU.1
For those countries that are immediate neigh-bors of the EU, the big prize has been the promiseof accession to the EU (see Baldwin and Francois1997). Turkey is no exception. Although Turkey wasnot included in the list of new members for thenext round of accession, an ongoing process (with avery long history) is supposed to lead eventually toEU membership.
This chapter explores the implications of even-tual Turkish accession to the EU. The potentialimpacts of regulatory reform under such a processare examined by focusing on the transport sector,broadly defined to include air, land, rail, and other.Two issues studied are the linkage between tradeeffects and the transport sector, and the implica-
123
4Accession of Turkey
to the EuropeanUnion: Market Access
and Regulatory Issues
Joseph Francois

1963 the Treaty of Ankara envisaged Turkey becom-ing a full member of the EU, with preparationoccurring over a series of stages. In 1970 a protocolto this Ankara agreement outlined a framework ofthe customs union between the EU and Turkey.Even though Turkey’s 1987 application for fullmembership in the EU was rejected, it continued topursue unilateral trade liberalization with the EU.As a result, when the customs union was finallyestablished for industrial products on January 1,1996, after a transition period of 22 years, much ofthe required tariff changes for industrial productshad already been implemented.
The existence of the customs union, along withthe protocols that go with it, has important impli-cations for the discussion that follows of the likelyeffects of full EU membership. The average reduc-tion in tariffs required by the CU for Turkey hasbeen estimated to be only 7 percent (Harrison,Rutherford, and Tarr 1997). The combination ofadopting the Common Customs Tariff (CCT)structure and Uruguay Round commitmentsshould have produced a trade-weighted averagetariff on industrial goods of 3.5 percent by 2001(WTO 1998). In theory, the objective of thecustoms union agreement is to prepare Turkeyfor full membership in the EU, and the agree-ment is, therefore, not only deeper than the EU’sfree trade agreements, but also goes well beyondthe basic requirements of a customs union agree-ment. In particular, it requires Turkey to introducea wide range of legislation covering all aspectsof trade; competition law; industrial, commer-cial, and intellectual property rights; and to adoptEU technical standards.2 In this sense, thecustoms union agreement carries with it many ofthe consequences that would follow from full EUmembership.
Table 4.1 compares the current EU arrangementwith Turkey with recent and ongoing agreements(in the form of free trade agreements, FTAs) withselected developing countries and regions. Behindall of these agreements is a mix of politics and eco-nomics. A basic dilemma facing EU negotiators ofthese free trade agreements is that, according totheir negotiating mandate, they must not under-mine the finely tuned border protection of theEU’s Common Agricultural Policy (CAP) and theCommon Fisheries Policy. At the same time, theymust ensure that agreements are compatible with
Article XXIV of the General Agreement on Tariffsand Trade (GATT) of 1994, particularly Section 8requiring coverage of “substantially all trade” andthe Understanding on Article XXIV (especially thepreamble, which states that “no major sector isexcluded”). The EU seeks to resolve this dilemmaby interpreting World Trade Organization (WTO)rules as requiring free trade to be established on90 percent of total bilateral trade flows.
Because EU tariffs on most industrial productsare zero or very low (exceptions are, for example,clothing and motor vehicles), the EU has little diffi-culty in liberalizing imports of all, or practically all,industrial products. Moreover, because imports ofagricultural and fisheries products are limited by(sometimes prohibitive) border protection, theyaccount for only a small proportion of existingtotal imports from the partner country. As a result,the EU is able to make a sufficient contribution tothe fulfillment of the 90 percent criterion by liber-alizing only around 60 percent of its imports ofagricultural products. Similar calculations, it isargued by the EU, also enable the partner countryto protect sensitive industrial and agriculturalsectors of its economy while remaining withinthe EU’s interpretation of the requirements ofArticle XXIV.
Given these constraints, the pattern of tariffreductions in the developing country usually takesthe form of abolishment of the duties on capitaland intermediate goods before duties on final con-sumer goods, which are also subject to significantlyhigher initial duties and which are liberalized onlytoward the end of the transitional period. It is inthe area of trade in agricultural and fisheries prod-ucts that the agreements fall significantly short offree trade. The EU routinely excludes products suchas beef, sugar, a range of dairy products, some cere-als and cereal products, rice, some fresh fruits andvegetables, some cut flowers, and fisheries prod-ucts. The partner developing country also excludesa range of agricultural products, not least to protectits agriculture from imports of subsidized agricul-tural goods from the EU, such as beef, sugar, dairyproducts, and cereals. As a result, in the agreementwith Mexico only 62 percent of bilateral trade inagricultural products is fully liberalized. In theagreement with South Africa, 62 percent of EUimports are liberalized, while South Africa fully lib-eralizes 82 percent of its imports from the EU. No
124 Turkey: Economic Reform and Accession to the European Union

Accession of Turkey to the European Union: Market Access and Regulatory Issues 125
TABLE 4.1 Structure of EU Free Trade Agreements with Selected Developing Countries
Rationale:EU Security Reinforce
democracy;regional hub
Access to NAFTA;regional hub
Customs unionagreement inindustrialproducts;objective ofmembership in EU
Egypt South Africa Mexico Turkey
Partner Maintainpreferences;lock in reforms;attract FDI
Improve access toEU market;attract FDI; lockin reforms
Reducedominance ofUnited States;improve accessto EU market;attract FDI
Transitional period: EU
Partner
Immediate
12–15 years
10 years
12 years
10 years
10 years
Turkey’s customslegislation nowalmost same asthat of EU
Industry coverage:EU All Almost all, most
by 2006All by 2003 All
Partner All, less than halfby year four,end-weightedon mostprotected
87% and end-weighted
All by 2007, mostby 2003
All
Agriculturalcoverage:EU Approx. 60%+ of imports, entry prices, plus preferences
with tariff quotasSeparate preferen-
tial agreementcovering rangeof products,some with tariffquotas
Partner Very limited;some dutyreductionswithin tariffquotas
Substantial; somewines subject totariff quotas
Some, such asdairy, tobacco,processed foods
Rules of origin:EU EU rules; bilateral cumulation with EU; derogations
can be requested.EU rules
Partner Part MEDAcumulation anobjective
Full SACUcumulation;partial SADCcumulation withone country
Relaxation in somesectors due tolack of rawmaterials andcomponents
Safeguards Standard EU clause for both parties plus transitional arrangements for partner
EU rules
Antidumping Standard WTO rules
Intellectualproperty rights
Protected under TRIPS plus list of international agreements
Special committeeto solve difficulties
TRIPS plus list ofinternationalagreements

126 Turkey: Economic Reform and Accession to the European Union
TABLE 4.1 (Continued)
Competition rules Outlaws collusion/abuse ofdominantposition ofenterprises,which distortscompetition intrade (exceptfor ECSCproducts)
Each retain ownrules; outlawscollusion/abuseof marketpower, etc.;cooperationplus EUassistance
Own laws;detailedstatement oncooperation;technicalassistance
EU policy
Egypt South Africa Mexico Turkey
State aids
Public procurement Consultation with aim ofliberalization
“Fair, equitable andtransparent”
Nationaltreatment andnondiscrimina-tion phased inover 10 years,except somepublic utilitiesand transport
Agreement to bereached infuture
Rights of establishmentand services
Trade in mostservicesliberalized plusmost modes ofsupply by 2004;transitionalperiod of10 years;nationaltreatment
Nationaltreatment;servicesagreementundernegotiation aspart of customsunion
Capital movements Program of liberalizationrelating toinvestment plus protectionof investment
Export of largesums fromTurkey unclear
Standards Cooperation;SpecialCommittee onSPS Measures
Working towardimplementationof EU rules
Customcooperation
EU commercialpolicy and rules
Aid, economicdevelopmentcooperation
MEDA programs(grants) tosupport allEuro-Medagreements;three-yearrolling nationalindicativeprograms
Multiannualindicativeprograms ofgrants andloans
n.a. MEDA plus EIBpreaccessionloan facility
Institutions Association Council;CU JointCommittee; JointConsultativeCommittee
Must not distort competition in trade between EU and partner, but are permissible for public or policy objectives (EU Article 92)
GATS plus possibility of further liberalization
Free movement of capital relatingto direct investment plus interestprofits and dividends
Aim of reducing differences (especiallySPS) and mutual recognition
For example, exchange of information, introduction of singleadministration document, simplification of controls andprocedures for clearance, cooperation on rules of origin
Joint EU/Partner Association/Cooperation Council atministerial level supported by committees (high official) and technical working groups

comparable figures are published for trade in agri-cultural products with Egypt or Turkey.
Agricultural products are not included in thecustoms union agreement with Turkey, but becausethe objective is full membership in the EU, bothparties have agreed to progressively improve theirpreferential regime in the agricultural sector withthe aim of allowing Turkey to adapt its agriculturalpolicy to the EU’s Common Agricultural Policy.However, no time frame has been applied to thisprocess, and the system of preferences does not“restrict in any way the pursuance of the respectiveagricultural policies of the Community or Turkey.”3
In addition, both countries have a safeguard clausethat can be activated if “either quantities or theprices of imported products from the other Party inrespect of which a preferential regime has been cre-ated, causes or threatens to cause a disturbance ofthe Community or Turkish market.” The EuropeanCommission estimates that 93 percent of Turkey’sagricultural exports to the EU and 33 percent of EUagricultural exports to Turkey are covered by the1998 scheme of preferences.
The customs union agreement is part of themore general program of preparation for EU mem-bership, signaled in particular by the Helsinkiagreement to include Turkey as a candidate coun-try for accession to the EU and by Turkey’s adop-tion on March 19, 2001, of the “National Pro-gramme for the Adoption of the Acquis” (theacquis communautaire is the entire body of legisla-tion of the European Communities and Union).This program includes the economic aspects of theacquis, in particular the “four freedoms” (related togoods, persons, services, and capital) that form thebasis for the operation of the internal market. Asdiscussed in other chapters in this volume, theseeconomic aspects have immediate implications forservices trade.
A Quantitative Assessment
As noted earlier, the customs union between theEU and Turkey already covers most, if not substan-tially all, trade. To analyze the impact of Turkey’saccession to the EU, this section describes the
Accession of Turkey to the European Union: Market Access and Regulatory Issues 127
Dispute settlement AssociationCouncil by“decision” or by arbitrationbinding onboth parties; no time limit orenforcementprocedures
CooperationCouncil orarbitration;stages timelimited; noenforcementprocedures
Joint Committeeor arbitration;rules forprocedures,time-limited,stages, compensation
AssociationCouncil orarbitration
General
Other Moneylaundering;drug trafficking;migrant workersand illegalimmigration;regionalintegration
Wine and spiritsagreement;fisheries (notconcluded);regionalcooperation
Turkey to adopt all of EU’s preferentialtradeagreements
Egypt South Africa Mexico Turkey
n.a. Not applicable.Note: NAFTA � North American Free Trade Agreement; FDI � foreign direct investment; MEDA is thefinancial instrument of the Euro-Mediterranean Partnership; SACU � South African DevelopmentCommunity; SADC � South African Development Community; WTO � World Trade Organization;TRIPS � Agreement on Trade-Related Aspects of Intellectual Property Rights; ECSC � European Coal andSteel Community; GATS � General Agreement on Trade in Services; SPS � sanitary and phytosanitary;EIB � European Investment Bank; CU � Customs Union.Source: Francois, McQueen, and Wignaraja 2003.
Political dialogue; social and cultural cooperation; democratic principles and respectfor human rights; scientific, technical, and technological cooperation

application of a global general equilibrium model(the model, which is described in annex 2, is basedon Francois, McQueen, and Wignaraja 2003). Thepolicy experiments involve a summary of the esti-mated economic effects of the customs union andof its extension, under membership, to cover alltrade.
The EU-Turkey customs union agreement isreally designed for industrial products; the finalstage was completed in 2000. As such, there is unre-stricted trade in all industrial products betweenthe two countries, and Turkey applies the CCT toimports of industrial products from third countries.Agriculture is largely excluded from the agreement,although there is a preferential trade regime for alimited range of agricultural products (see table 4.2for a summary).
EU imports of products not listed in table 4.2are exempt from ad valorem duties, but they arestill subject to specific duties and quotas. Evenwhere preferences are given for some food products(fruits and vegetables), they are only availablebetween certain dates. Turkey has liberalized evenless in the area of food and agriculture. Most-
favored-nation (MFN) duties have been abolishedfor live bovine (pure breeding animals) and meator fish unfit for human consumption. For a fairlyshort list of other products, duties are abolishedwithin small tariff quotas, including products listedin table 4.2.
Turkey has undertaken “far-reaching structuraland legislative reforms within the framework ofthe customs union agreement” (WTO 1998). Theadoption of the CCT has meant that Turkey’s levelof border protection on industrial products andthe industrial component of processed foods hasdeclined significantly. As a result, even thoughthere may be some concerns about the possibilityof relative trade diversion, the absolute levelof imports from third countries should haveincreased, not only because border measures ofprotection have declined significantly, but alsobecause the adoption of EU customs regulationshas provided exporters with greater certainty oftreatment. Turkey illustrates as well some of thesubstantial difficulties that developing countriesexperience in implementing far-reaching structuralreforms even when, like Turkey, they have both the
128 Turkey: Economic Reform and Accession to the European Union
TABLE 4.2 Processed Food Concessions under the EU-Turkey Customs Union
EU Concessions Turkey Concessions
Tomato paste Live bovine animalsPoultry meat Frozen meatsSheep and goat meat ButterOlive oil CheeseCheese Vegetable and flower seedsSome fresh fruit and vegetables Flower bulbsHazelnuts Apples and pearsFruit juices PotatoesMarmalade and jams Cereals
Refined/raw vegetable oilSugarTomato pasteSome alcoholic beveragesSome animal foods
Note: Products not listed by the EU are exempted from ad valoremduties, but they are still subject to quotas and specific duties. Examplesare beef and sugar. Turkey has liberalized some agricultural tariffs withinvery narrow tariff-rate quotas.Source: Francois, McQueen, and Wignaraja 2003.

incentive of full membership in the EU and thebacking of substantial financial and technicalresources.
Because the customs union reflects political sen-sitivities in the EU and Turkey, areas of significantpotential (agricultural) trade have been excludedby both parties to the agreement. Reflecting thecustoms union as just described, the scenario forapplication of the computable general equilibrium(CGE) model is summarized in table 4.3.4
Of immediate interest here is the sectoral impactof the actual customs union and of a full free tradescenario. The omission of the agricultural sectorfrom the customs union agreement almost cer-tainly means that the agreement does not conformwith Article XXIV of the GATT. Interestingly, thisissue was raised in the WTO review of the reportof the Trade Policy Review Board (TPRB) onTurkey (no response by Turkey was recorded), butno WTO member state has so far challenged theagreement, presumably because those states feelthat adoption of the CAP by Turkey would increase
the current level of discrimination against theirexports.
Agriculture is, however, an important sector ofthe Turkish economy, accounting for about 11.4percent of its gross domestic product and 34 per-cent of employment. The omission of this sectorfrom the customs union agreement must producesignificant distortions in the allocation of resourcesin the economy and in the economic effects of theagreement.
The macroeconomic effects of the customsunion are summarized in table 4.4. Consider firstnational welfare (measured as current welfarederived from economy-wide consumption pat-terns). The customs union, as currently constructed,yields a boost in Turkish welfare (measured as a per-centage of base national income) of over 1.3 percentrelative to the baseline with MFN industrial tariffs.Based on 1997 values, this gain is comparable to aboost in real GDP of US$2.2 billion.5 The staticeffect is slight, adding less than 0.1 percent towelfare through induced capital accumulation.
Accession of Turkey to the European Union: Market Access and Regulatory Issues 129
TABLE 4.3 Customs Union Scenario
Full Partial NoLiberalization Liberalization Liberalization
Grains Turkey EUOther agriculture EU, TurkeyMining EU, TurkeyOther primary production EU, TurkeySugar Turkey EUDairy Turkey EUMeats EU, TurkeyProcessed foods EU, TurkeyTextiles EU, TurkeyClothing EU, TurkeyLeather EU, TurkeyWood and paper EU, TurkeyChemicals EU, TurkeyRefineries EU, TurkeySteel EU, TurkeyNonferrous metals EU, TurkeyMotor vehicles EU, TurkeyElectronics EU, TurkeyOther machinery EU, TurkeyManufactures, NEC EU, Turkey
Note: Partial liberalization is modeled as 50 percent. NEC � not elsewhere classified.Source: Author’s definition of model aggregation.

A comparable improvement appears in Turkey’sterms of trade through static effects—the gapbetween export and import prices widens by over2.5 percent. However, there is an interactionbetween long-run capital accumulation and theterms of trade that erodes terms-of-trade gains overthe medium run. The agreement, as modeled,yields a considerable boost in the capital stock(1.24 percent).Normally, a large boost in real incomewould follow. In fact, the quantity index for GDPdoes expand. But because of the erosion in theterms of trade in the medium to long run, the valueof GDP (in dollar terms) falls somewhat. Even so,the initial terms-of-trade gains are strong enoughto outweigh these effects.
Consider next the impact on wages. Both skilledand unskilled workers gain from the agreement,with a 2.2 percent and 1.7 percent boost, respec-tively, to real incomes (net of changes in the con-sumer price index, CPI) over the long run. Suchwage changes are considerable, given that theyare realized in the context of a trade agreement.The positive wage effects imply that, overall, thecustoms union will not make labor market condi-tions worse.
The next set of indicators reported in table 4.4relate to real exchange rates and GDP. GDP is notan appropriate measure of economic welfare—it
misses substitution effects in production and con-sumption—but it is a common metric for govern-ment monitoring of economic climate. Thechanges in both the value and quantity of GDP(based on a fixed 1997 basket of goods and serv-ices) fail to track welfare gains in any meaningfulway.
How does the actual customs union comparewith a full customs union? A comparison of thelast two columns of table 4.4 reveals the differ-ences. The EU-Turkey customs union does notcover all potential EU-Turkey trade, but Turkey isat a stage of development where critical marketaccess revolves around manufactured goods ratherthan agriculture. As a result, the actual customsunion does cover enough trade to generate gainsthat are broadly similar to those of a full cus-toms union. The differences between the twocolumns are within the margin of error for thiskind of modeling exercise. Broadly speaking, thetable does not reveal a significant difference, interms of welfare, between a full customs union andthe EU-Turkey customs union. But there is someexpansion of trade (primarily in food) under fullmembership.
Although the overall macro effects of the actualcustoms union are comparable with those of a fullcustoms union, some slight differences emerge at
130 Turkey: Economic Reform and Accession to the European Union
TABLE 4.4 Summary of Macroeconomic Effects of Customs Union for Turkey
A B C � A � B D
Long-RunEffects of Long-Run
Actual Effects ofStatic Dynamic Customs Full EU Effects Effects Union Membership
Welfare (% of national income) 0.91 0.4 1.31 1.36Welfare (millions of US$) 1,558.92 678.31 2,237.23 2,335.73Terms of trade (%) 2.64 0.91 1.73 1.95Value of exports (%) 10.6 3.46 14.06 15.21Unskilled worker wages (%) 2.02 0.22 2.24 2.62Skilled worker wages (%) 1.28 0.43 1.71 1.72Capital stock (%) 0.00 1.24 1.24 1.24Value of GDP in dollars (%) 3.17 0.36 2.81 3.01Real exchange rate (%)a 3.05 1.1 1.95 2.16GDP quantity index (%) 0.11 0.74 0.85 0.84
a. Real exchange rate is the dollar price of the base period GDP basket.Source: Author’s calculations.

the sectoral level (see table 4.5). Under a fullcustoms union, EU grain production squeezesTurkey’s production, with a projected drop in out-put of 1.18 percent. However, under the actualagreement this sector is largely sheltered, with pro-duction projected to drop only 0.09 percent frombaseline levels. A similar story holds for meat pro-duction, which is largely insulated under the currentagreement.
Outside of food production, the largest effectsare in textiles, clothing, and motor vehicle produc-tion. Textiles and clothing have benefited tremen-dously from improved EU access. Production is25 percent and 50 percent higher, respectively, thanwithout preferred access. At the same time, the
motor vehicle sector in the EU applied strong pres-sure on the motor vehicle and parts sector in Turkey,which shrank by 15 percent. Another sector thatbenefits is (consumer) electronics, which enjoyed a12 percent increase in production.
The sector-level results also point to no realgreat adjustment pressures within Turkey, exceptin heavy manufacturing. The motor vehicle,machinery, and equipment sectors are squeezed.This situation is consistent with expectations aboutTurkey’s comparative advantage, with an advantagein lighter manufactures and a relative disadvantagein some heavy manufacturing sectors.
The trade results largely mirror the results forproduction. One outlier is motor vehicles. Although
Accession of Turkey to the European Union: Market Access and Regulatory Issues 131
TABLE 4.5 Change in Output by Sector in Turkey(percent)
A B C � A � B D
Long-Run Long-RunEffect of Effect of
Static Dynamic Actual Full EU Sector Effects Effects FTA Membership
Grains 0.76 0.67 0.09 1.18Other agriculture 0.89 0.78 0.11 2.3Mining 4.14 0.65 3.49 4.67Other primary production 0.28 0.34 0.62 0.4Sugar 0.4 0.61 0.21 4.6Dairy 0.09 0.39 0.48 0.09Meats 0.77 1.03 0.26 2.96Processed foods 0.84 1.06 1.9 1.61Textiles 21.81 4.43 26.24 25.46Clothing 49.16 6.46 55.62 54.86Leather 0.81 3.92 4.73 4.88Wood and paper 0.76 0.05 0.71 0.87Chemicals 2.31 1.21 1.1 1.14Refineries 0.85 0.97 0.12 0.1Steel 3.93 0.74 3.19 3.67Nonferrous metals 7.09 2.23 4.86 5.5Motor vehicles 17.12 2.05 �15.07 15.73Electronics 11.6 1.46 13.06 12.7Other machinery 6.35 1.81 4.54 5.08Manufactures, NEC 1.0 0.39 0.61 0.81Transport 0.43 0.87 0.44 0.35Construction 3.47 2.77 0.7 0.64Business services 3.71 1.83 1.88 2.13Other services 1.07 0.78 0.29 0.41
Note: NEC � not elsewhere classified.Source: Author’s calculations.

production is squeezed and imports go up substan-tially, exports also go up substantially. Mexico’sexperience with the North American Free TradeAgreement (NAFTA) was similar. The motor vehiclesector is forced to restructure, and in the process itbecomes more deeply integrated with the Europeanindustry. As a result, significant growth is projectedin both imports and exports in the sector relative to abaseline with continued MFN protection for the sec-tor.The result for sugar under the full customs unionreflects the subsidies to EU production and a largeincrease in a small export base for Turkey (smallchanges in small flows can lead to large percentagechanges). In the actual customs union agreement,these effects are sterilized.
What happens to the transport sector under thecustoms union? The static effect is contraction, asresources are pulled out of the sector and into manu-facturing. However, because the customs union isestimated to have positive investment effects (i.e., thecapital stock expands), there is a projected expansionof the sector in the medium term of roughly 0.44 per-cent. Because the agreement is already in place, theinterpretation is that the transport sector is almost ahalf percent larger than it would be otherwise.
What happens to the transport sector underactual EU membership (the focus here is on thetrade-related effects)? Again, the impact is positiverelative to no preferential trade at all. However,because full membership would extend access to theEU food markets (food production is a large share ofTurkey’s economy), resources would be pulled outof the service sectors and into agriculture.
Finally, what happens to direct trade in trans-port services? The Global Trade Analysis Project(GTAP) database reveals that Turkey’s trade intransport services is relatively small, with importsof roughly $1.207 billion in 1997. Based on gravityestimates of services trade barriers, the import tar-iff equivalent for cross-border transport serviceimports into Turkey is roughly 8.9 percent (seeannex 1). Assuming an import demand elasticity of–3.9 (equal to the import substitution elasticity indemand in the GTAP model for this sector) anddeadweight trade costs, a back-of-the-envelope cal-culation yields gains of roughly $126 million per yearfrom full trade liberalization in the sector. The EUaccounts for roughly 25 percent of this total, or onlyabout $30 million per year in welfare gains in the sec-tor from direct trade related to liberalization vis-à-vis
the EU. This would follow from roughly $100 millionin additional services imports from the EU.
A Factor Analysis of RegulatoryStructures
Membership in the EU involves not only marketaccess, but also community rules and regulations.In this section, the regulation database of theOrganisation for Economic Co-operation andDevelopment (OECD) is used to examine the struc-ture of competition and regulation in the transportsector across OECD countries. The goal is to com-pare the regulatory status of Turkey’s transport sec-tor with those of EU members. In the end, it turnsout that the Turkish regulatory regime is not at allinconsistent, by these measures, with the broad pat-tern observed within the EU. This finding mayreflect the long, ongoing process of Turkish integra-tion. In any event, it suggests that the sector mayrequire little overall realignment of regulation inview of what is currently allowed within the EU.
The 2000 OECD International Regulation Data-base includes more than 1,100 variables for eachOECD member on both economy-wide productmarket regulation and regulation at the sector level.For the purposes of this study, it includes dataon regulation in road transport, national and inter-national air transport, and rail transport (seeNicoletti, Scarpetta, and Boylaud, 1999, for adetailed description of the data). In general, thedata of interest here are centered around 1998.
The OECD database may contain over 1,100 vari-ables, but only a limited number apply to transport.In addition, many remain unanswered by a largenumber of members, and many others simply defyquantification. For this reason, the full set of trans-port questions has been reduced to the set covered intable 4.6. The 18 variables listed for air transport areclassified into domestic competition, internationalcompetition, and government ownership and regu-lation. The 15 variables for road transport and thesix for rail are roughly classified into domestic com-petition and government ownership and regulation.
Within each set of variables, the assigned valuesrange from 0 to 6 (so that for dummies, yes is gener-ally 6 and no is 0), and the assigned weights are basedon the number of variables in a sector:category set.In this factor analysis of the variables, the result ofthis scaling is a set of regulatory indexes ranging
132 Turkey: Economic Reform and Accession to the European Union

Accession of Turkey to the European Union: Market Access and Regulatory Issues 133
TABLE 4.6 Variables Used from OECD International Regulation Database
Data SetOECD Survey VariableQuestion No. Question Name
17 Does national, state, or provincial government hold equity stakes in ATOR1business company? 7,131 air transport carriers
52 Do national, state, or provincial laws or other regulations restrict in at ATOR2least some markets the number of competitors allowed to operate a business? 7,131 air transport carriers
547 Air travel/national market structures: domestic market share of the largest ATDC1airline (incl. subsidiaries) (more than 500,000 passengers a year)
548 Air travel: market structure: domestic routes (all routes): share of traffic ATDC2(passengers/km) of the incumbent carrier
558 Air travel: market structure: international routes (all routes): share of ATIC1traffic (passengers/km) of the largest carrier in the international traffic of national carriers
566 Air travel: Is the largest operator in international routes also the largest ATIC2operator in domestic routes? (all routes)
567 Air travel/national market structures: share of 100 international routes ATIC3with more than three carriers
572 Air travel/national regulations and government ownership: government ATOR3ownership in largest airline (%)
573 Air travel/national regulations and government ownership: government ATOR4golden share in a major airline
579 Air travel/national regulations and government ownership: government ATOR5loss makeups in major airlines in the past five years
580 Air travel/national regulations and government ownership: the largest ATOR6airline has public service obligations
611 Air travel/national regulations and government ownership: domestic ATOR7market deregulated
612 Air travel/national regulations and government ownership: Open Sky ATIC4agreement with United States
613 Air travel/national regulations and government ownership: Open Sky ATIC5agreement older than six years
618 Air travel/national market structures: international market share of the ATIC6largest airline (incl. subsidiaries) (more than 500,000 passengers a year )
619 Air travel/national market structures: Herfindahl concentration index in ATDC3domestic market
620 Air travel/national market structures: Herfindahl concentration index in ATIC7international market (%)
1120 Air travel: ceiling on foreign ownership allowed in national air transport ATOR8carriers
13 Does national, state, or provincial government hold equity stakes in RTOR1business company? 7,114 road freight
48 Do national, state, or provincial laws or other regulations restrict in at RTDC1least some markets the number of competitors allowed to operate a business? 7,114 road freight
492 Road freight: Is there a firm in the road freight sector that is publicly RTOR2controlled (i.e., national, state, or provincial governments hold the largest single share)?
493 Road freight: Is registration in any transport register required in order to RTOR3establish a new business in the road freight sector?
494 Road freight: In order to operate a national road freight business (other RTOR4than for transporting dangerous goods or goods for which sanitary assurances are required) do you need to be granted a state concession or franchise by any level of government?

from 0 (generally open, competitive regimes withminimal regulation) to 6 (generally more regulated,with less or no competition).
Multivariate factor analysis is a standard tech-nique for summarizing patterns in regulatory data(see Nicoletti, Scarpetta, and Boylaud 1999 andBoylaud 2000). Factor analysis yields factors that arelinear combinations of the variables observed andthat, in theory, identify latent variables or indicatorsthat lurk behind the observed data. In the presentcontext, this approach allows the construction ofindexes of regulatory frameworks in the sample.
Factor analysis is applied first to the regulatoryvariables grouped by sector and type of regulation,thereby yielding a set of indicators for road trans-port, air, and rail, which are listed in tables 4.7, 4.8,and 4.9. The critical point to pick up from theseindexes is that in all three transport sectors Turkey’sregulatory regime is fully consistent with theregimes of current EU members. For example,the road transport regime in Turkey has fewer limitson competition (including pricing guidelines) thanGermany, Greece, Finland, and the Netherlands.Overall, the road transport sector compares favorably
134 Turkey: Economic Reform and Accession to the European Union
Data SetOECD Survey VariableQuestion No. Question Name
495 Road freight: In order to operate a national road freight business do you RTOR5need to obtain a license (other than a driving license) or permit from the government or a regulatory agency?
496 Road freight: In order to operate a national road freight business do you RTOR6need to notify any level of government or a regulatory agency and wait for approval before you can start operation?
505 Road freight: Does the regulator, through licenses or otherwise, have any RTDC2power to limit industry capacity?
513 Road freight: Are there any regulations setting conditions for driving RTOR7periods and rests?
515 Road freight: Do regulations prevent or constrain: backhauling? RTDC3516 Road freight: Do regulations prevent or constrain: private carriage? RTDC4517 Road freight: Do regulations prevent or constrain: contract carriage? RTDC5520 Road freight: Within the last five years, have laws or regulations removed RTOR8
restrictions on: commercial, for-hire shipments?521 Road freight: Are retail prices of road freight services in any way regulated RTOR9
by the government?522 Road freight: Does the government provide pricing guidelines to road RTDC6
freight companies?
10 Does national, state, or provincial government hold equity stakes in RROR1business company? 7,111 railways
45 Do national, state or provincial laws or other regulations restrict in at least RRDC1some markets the number of competitors allowed to operate a business? 7,111 railways
528 Railways: freight transport: total number of operators RRDC2538 Railways: Please indicate if the government has any liability for losses made RROR2
by a railway company (excluding subsidies related to service obligations).539 Railways: Did the government in the past five years make up for any losses RROR3
made by railway companies?540 Railways: Are companies operating the infrastructure or providing railway RROR4
services subject to universal service requirements (e.g., obligation to serve specified customers or areas)?
Note: Questions have generally been rescaled from 0 to 6, with 0 being a positive indicator (morecompetition, less regulation, less participation by government through ownership, golden shares, pricesetting, and so forth). Questions have also been assigned inverse weights (i.e., if there are four domesticcompetition questions for air, each gets a 1/4 weighting for the domestic competition for air transportfactoring and scoring exercise).Source: OECD International Regulation Database, 2001.
TABLE 4.6 (Continued)

135
TABLE 4.7 Regulation Indexes, Air Transport
PublicInternational Service
Public Service Reservation Obligation,Government Regulation Obligations for Dominant Competition Regulation of Regulated GovernmentOwnership or Government and Limits on and Custom Domestic International Domestic and Price Industry Customer Ownership
Overall Management Bailouts Restructuring Guarantees Competition Competition Carrier(s) Air Road Rail Regulation Structure Access and Bailouts
United States 2.1 2.5 2.7 1.7 0.8 1.1 2.4 3.7 2.1 1.4 2.6 0.827486135 0.639225018 0.373642805 0.451764654
Japan 3.6 2.5 2.6 1.3 0.9 2.2 4.7 3.8 3.6 1.2 1.7 1.608383946 0.398000994 0.440217734 0.397295435
Germany 4.6 2.7 2.5 2.7 1.5 3.4 5.9 4.0 4.6 1.6 1.2 2.001897264 0.760787878 0.464155476 0.478902558
France 3.8 4.7 3.5 2.1 1.3 2.5 5.7 3.4 3.8 1.0 1.9 1.648319644 0.690636245 0.58446881 0.551299765
Italy 4.1 4.6 3.5 2.1 2.2 3.1 5.8 3.5 4.1 2.1 2.0 1.802392871 0.653592598 0.710903353 0.539211452
United Kingdom 3.7 2.7 1.7 2.3 2.8 1.9 4.7 4.4 3.7 1.9 0.9 1.41077272 0.838287495 0.998012427 0.190062094
Canada 3.4 2.5 1.9 0.7 1.2 2.3 4.7 3.2 3.4 1.4 1.8 1.634645345 0.316644254 0.4247025 0.304681501
Finland 4.0 4.4 1.4 2.4 1.2 3.4 6.0 2.8 4.0 2.1 1.9 1.854702305 0.722343477 0.560720801 0.32557426
Greece 4.2 4.7 3.4 1.5 2.2 3.8 5.9 3.0 4.2 2.4 2.1 1.95420938 0.461873888 0.714813349 0.543616231
Mexico 2.1 4.2 3.5 1.7 1.1 2.0 3.4 1.8 2.1 1.0 1.3 1.353502801 0.694882568 0.570964691 0.522586274
Netherlands 4.0 4.0 2.2 3.7 0.2 3.6 5.4 3.2 4.0 1.8 1.6 1.768005014 1.039911684 0.309726703 0.337963967
New Zealand 4.5 2.7 2.7 3.5 1.2 3.7 6.0 3.0 4.5 2.8 0.7 2.010288982 0.905292063 0.478973959 0.385442689
Norway 3.3 4.3 1.4 2.4 1.1 2.2 5.6 1.9 3.3 2.8 1.9 1.550070023 0.703961664 0.571637512 0.309285763
Portugal 4.2 4.7 3.4 1.5 2.2 3.9 5.9 3.1 4.2 1.4 1.9 1.927716035 0.537816601 0.712804139 0.52197316
Spain 3.7 4.7 3.6 2.9 1.0 2.5 5.6 3.1 3.7 1.2 1.9 1.682086662 0.927405698 0.473408351 0.55497655
Sweden 4.0 4.2 2.1 2.8 0.7 3.1 6.0 2.9 4.0 1.7 1.9 1.836297304 0.773933652 0.427582084 0.399262966
Switzerland 4.2 3.7 1.4 1.6 0.5 3.5 6.0 3.0 4.2 2.2 1.9 1.90027128 0.545283018 0.315114694 0.280302128
Turkey 4.1 4.8 1.3 1.6 2.2 3.7 5.8 3.3 4.1 2.3 1.9 1.740053875 0.631766305 0.758792739 0.343861905
Czech Rep. 3.8 4.7 1.3 1.7 1.3 3.8 5.9 1.9 3.8 1.5 1.4 1.976677595 0.599534062 0.47354244 0.250246189
Hungary 2.8 4.4 1.3 1.8 1.1 2.6 4.9 1.0 2.8 2.1 1.9 1.512782968 0.653479446 0.495375794 0.162857349
Korea, Rep. of 3.9 2.6 2.5 2.1 1.5 3.2 4.8 3.6 3.9 0.6 0.3 1.830529419 0.767582267 0.66823034 0.245312432
Poland 3.7 4.9 1.3 1.6 1.3 3.7 5.7 2.1 3.7 1.4 1.7 1.875180579 0.60420922 0.557323214 0.26365386
Note: Indexes, which range from 0 to 6, are based on rotated factor loadings. The overall index is based on the first factor for the summary indexes, with 90 percent of the variance explained.
Source: Author’s calculations.

136
TABLE 4.8 Regulation Indexes, Road Transport
Limits onState Backhauling, Limits on
Concession Regulatory Private CompetitionState Requirements Approval Carriage, and (Including
Government Ownership/ and Price Required for Other Contract PriceOverall Licensing Concessions Regulation Establishment Regulations Carriage Guidelines)
United States 1.4 4.7 1.9 1.3 1.8 1.2 0.8 1.7Japan 1.2 4.7 1.4 2.3 0.6 1.4 0.5 1.7Germany 1.6 4.6 2.3 1.2 2.1 1.3 1.2 2.4France 1.0 4.9 3.5 1.1 0.3 1.3 0.5 1.7Italy 2.1 4.4 1.6 3.9 1.8 2.0 0.7 1.5United Kingdom 1.9 4.6 1.8 1.4 1.7 2.1 0.9 1.7Canada 1.4 4.7 1.9 1.3 1.8 1.2 0.8 1.7Finland 2.1 4.4 2.2 1.3 1.2 2.2 1.2 3.9Greece 2.4 4.4 1.6 3.9 1.8 2.0 0.7 4.1Mexico 1.0 4.8 1.7 1.2 1.8 0.2 0.7 3.4Netherlands 1.8 4.5 1.8 1.4 1.0 2.1 0.8 2.9New Zealand 2.8 3.0 1.8 1.4 2.7 2.1 0.0 1.7Norway 2.8 3.2 3.9 1.1 2.2 2.3 0.2 2.1Portugal 1.4 4.7 1.9 1.3 1.8 1.2 0.8 1.7Spain 1.2 4.6 1.9 1.3 1.1 1.2 0.8 1.8Sweden 1.7 4.5 1.8 1.4 1.0 2.1 0.8 1.7Switzerland 2.2 1.8 1.8 1.6 0.6 1.4 0.9 3.4Turkey 2.3 1.8 2.3 1.5 1.6 1.5 1.4 1.7Czech Rep. 1.5 4.6 4.2 2.6 1.9 1.1 1.1 1.7Hungary 2.1 4.6 1.8 1.4 1.7 2.1 0.9 3.2Korea, Rep. of 0.6 4.7 1.7 1.2 1.1 0.2 0.6 1.7Poland 1.4 4.5 4.2 2.6 1.2 1.1 1.0 1.7
Note: Indexes, which range from 0 to 6, are based on rotated factor loadings. The overall index is based on the first factor for the summary indexes, with 90 percentof the variance explained.Source: Author’s calculations.

Accession of Turkey to the European Union: Market Access and Regulatory Issues 137
TABLE 4.9 Regulation Indexes, Rail Transport
GovernmentFinancial/
Operational Government DomesticOverall Interventions Ownership Competition
United States 2.6 1.9 1.7 0.2Japan 1.7 1.7 1.8 1.3Germany 1.2 1.7 1.8 1.9France 1.9 3.4 1.8 1.3Italy 2.0 3.4 1.8 1.2United Kingdom 0.9 2.2 0.3 1.3Canada 1.8 1.9 1.7 1.2Finland 1.9 1.3 2.2 1.3Greece 2.1 3.0 2.2 1.3Mexico 1.3 1.7 1.8 1.8Netherlands 1.6 2.3 1.4 1.3New Zealand 0.7 1.3 1.1 1.9Norway 1.9 1.3 2.2 1.3Portugal 1.9 3.4 1.8 1.3Spain 1.9 3.4 1.8 1.3Sweden 1.9 1.3 2.2 1.3Switzerland 1.9 3.4 1.8 1.3Turkey 1.9 3.4 1.8 1.3Czech Rep. 1.4 3.4 1.8 1.9Hungary 1.9 3.4 1.8 1.3Korea, Rep. of 0.3 2.2 0.3 1.9Poland 1.7 1.9 1.7 1.3
Note: Indexes, which range from 0 to 6, are based on rotated factor loadings. The overall index is basedon the first factor for the summary indexes, with 90 percent of the variance explained.Source: Author’s calculations.
with that of the EU, as does air and rail (see figure 4.1,which compares Turkey with 21 other OECDmembers on the overall sector indexes).
Another set of indicators, for the transport sec-tor broadly defined, is presented in table 4.10. Likethose in tables 4.7, 4.8, and 4.9, these indicators arebased on a factor analysis of the regulatory vari-ables. In table 4.10, however, the full set of sectorindicators in the previous three tables are combinedto yield a set of four factors used to construct thecomposite index—that is, a set of overall regulatoryindicators for competition, regulation of industrystructure, public service obligations, and financialinvolvement of government—as well as an overallindex, based on these four factors and aggregatedusing rotated factor loadings. These four factorsexplain roughly 90 percent of the regulatory vari-able variance, because they are constructed fromsector indicators. For the overall index, the most
important summary indictor is competition andprice regulation (37.4 percent), followed by regula-tion of industry structure (23.2 percent), publicservice obligations and regulation of customeraccess (22.5 percent), and indicators of governmentownership and bailouts (16.9 percent).
The indexes in table 4.10 are summarized in fig-ure 4.2. The figure presents a breakdown (based onthe weights in table 4.10) of the contribution ofeach factor to the total index. Note the level ofTurkey in relation to the average level for the EU. Itreveals for all of transport, as it was for the individ-ual subsector indicators, a rough congruencebetween the Turkish regulatory regime and therange of regimes tolerated by the European Union.
What do these indicators say? Overall, the regimein Turkey appears to be consistent with regimesexisting within the EU, including, for example,Greece, Spain, Italy, Germany, and Portugal. Thus,

138 Turkey: Economic Reform and Accession to the European Union
TABLE 4.10 Regulation Indexes, All Transport
Public ServiceObligation,
Competition Regulation of Regulated Governmentand Price Industry Customer Ownership and
Overall Regulation Structure Access Bailouts
United States 2.3 2.2 2.8 1.7 2.7Japan 2.8 4.3 1.7 2.0 2.4Germany 3.7 5.3 3.3 2.1 2.8France 3.5 4.4 3.0 2.6 3.3Italy 3.7 4.8 2.8 3.2 3.2United Kingdom 3.4 3.8 3.6 4.4 1.1Canada 2.7 4.4 1.4 1.9 1.8Finland 3.5 5.0 3.1 2.5 1.9Greece 3.7 5.2 2.0 3.2 3.2Mexico 3.1 3.6 3.0 2.5 3.1Netherlands 3.5 4.7 4.5 1.4 2.0New Zealand 3.8 5.4 3.9 2.1 2.3Norway 3.1 4.1 3.0 2.5 1.8Portugal 3.7 5.2 2.3 3.2 3.1Spain 3.6 4.5 4.0 2.1 3.3Sweden 3.4 4.9 3.3 1.9 2.4Switzerland 3.0 5.1 2.3 1.4 1.7Turkey 3.5 4.6 2.7 3.4 2.0Czech Rep. 3.3 5.3 2.6 2.1 1.5Hungary 2.8 4.0 2.8 2.2 1.0Korea, Rep. of 3.5 4.9 3.3 3.0 1.5Poland 3.3 5.0 2.6 2.5 1.6Weight 0.374 0.232 0.225 0.169
Note: Indexes, which range from 0 to 6, are based on rotated factor loadings. The overall index is basedon the first factor for the summary indexes, with 90 percent of the variance explained.Source: Author’s calculations.
0.0
United
Sta
tes
0.5
1.0
1.5
2.0
2.5
3.0
3.5
4.0
4.5
5.0
Japa
n
Germ
any
Franc
eIta
ly
United
King
dom
Canad
a
Finlan
d
Greec
e
Mex
ico
Nethe
rland
s
New Z
ealan
d
Norway
Portu
gal
Spain
Sweden
Switzer
land
Turke
y
Czech
Rep
ublic
Hunga
ry
Korea
, Rep
. of
Poland
Air transport Road transport Rail transport
FIGURE 4.1 Comparison of Regulatory Regimes
Source: The author.

Accession of Turkey to the European Union: Market Access and Regulatory Issues 139
0.0
United
Sta
tes
0.5
1.0
1.5
2.0
Com
posi
te in
dex
2.5
3.0
3.5
4.0
Japa
n
Germ
any
Franc
eIta
ly
United
King
dom
Canad
a
Finlan
d
Greec
e
Mex
ico
Nethe
rland
s
New Z
ealan
d
Norway
Portu
gal
Spain
Sweden
Switzer
land
Turke
y
Czech
Rep
ublic
Hunga
ry
Korea
, Rep
. of
Poland
Competition and price regulation Regulation of industry structurePublic service obligation, regulatedcustomer access
Government ownership and bailouts
EU average
FIGURE 4.2 Decomposition of Overall Transport Regulation Index
Source: The author.
given what is tolerated within the EU, there is noclear indication that Turkey will need to realign itsregulatory stance upon accession to the EU. Thissituation probably reflects, in part, the country’salready long history of regulatory alignment.
Summary and Conclusions
This chapter has explored the possible implicationsof Turkish accession to the EU, particularly regula-tory issues in the transport sector in Turkey. Thetransport sector is important to the general condi-tions for economic performance and growth.Because it serves as an important intermediateinput, both nationally and internationally, changesin the trade and regulatory regime of the sector canhave important economic effects. The chapter hasaddressed two sets of issues. The first is the quanti-tative impact, through direct trade and economy-wide effects, of full membership. These effects havebeen examined through reference to computablegeneral equilibrium analysis and partial equi-librium analysis. Because of the existence of theEU-Turkey customs union, deeper integrationalong this front does not appear to carry significant
threats of pressure for restructuring, surges inimports, or, as a consequence, significant incomegains from the sector. The second set of issuesinvolves regulatory convergence. Here, factor analy-sis of a database of regulatory variables indicatesthat, overall, the two regimes (Turkey and the EU)are broadly consistent in their regulatory stance(e.g., degree of competition, price regulation, gov-ernment financial intervention). This consistencymost likely reflects the long process of negotiationand regulation that has accompanied evolution ofthe customs union. It means as well that pressure torestructure for broad regulatory reasons may beminimal.
Annex 1: Tariff Equivalents for Transport Services
This annex describes a basic methodology for theestimation of sector-specific gravity equations inrelation to global trade levels. The results arereported in table 4.11. Basically, services trade dataare fitted to a simple gravity model of total importsby country. These equations have been estimated atthe level of transport services.

140 Turkey: Economic Reform and Accession to the European Union
The gravity equations are estimated using ordi-nary least squares with the variables
(4.1) Xi � a1 � ln(POPi) � a2 � ln(PCGDP)i
� a3 � ln(PCGDP)2i � εi
where Xi represents imports from the world, POPrepresents population, and PCGDP per capitaincome in the importing country.
In the regressions, Hong Kong (China) is brokenout as a free trade“benchmark.”Deviations from pre-dicted imports, relative to this free trade benchmark,are taken as an indication of barriers to trade. Thesetariff equivalent rates are then backed out from a con-stant elasticity import demand function as follows:
(4.2)T1
T0=
[M1
M0
]1/e
Here, T1 is the power of the tariff equivalent (1 �
t1 ) such that in free trade T0 � 1, and [M1/M0] is theratio of actual to predicted imports (normalized rel-ative to the free trade benchmark ratio for HongKong). In this reduced form, actual prices and con-stant terms drop out because ratios are formed. Theterm e is the demand elasticity (taken to be �3.9).
This approach yields an estimated tariff equiva-lent for Turkey’s imports of transport services of8.9 percent, and the EU data reveal no barriers to
cross-border trade in the sector at the EU15 level—that is, including all 15 member states. Barriers mayemerge, however, at the level of individual memberstates (see Francois, van Meij, and van Tongerenforthcoming).
Annex 2: The Model
This annex describes the basic structure of the stan-dard multiregion computable general equilibriummodel used in this study. The model is imple-mented in GEMPACK, a software package designedfor solving large applied general equilibrium mod-els.6 It is solved as an explicit nonlinear system ofequations, using techniques described by Harrison,Horridge, and Pearson (2000).7 The nationalaccounts data were organized into 24 sectors and29 regions. The sectors and regions for this 24 � 29aggregation of the data are detailed in table 4.12.
The data were taken from various sources. Dataon production and trade are based on nationalaccounting data linked through trade flows anddrawn directly from the GTAP Version 5 dataset(GTAP 2001; also see Reinert and Roland-Holst,1997, for a discussion of the organization of suchdata for CGE models). The GTAP Version 5 dataset isbenchmarked to 1997 and includes detailed national
TABLE 4.11 Regression Results for Gravity Equation on Cross-Border Trade
Regression Statistics
Multiple R 0.967335R-square 0.935736Adjusted R-square 0.926556Standard error 0.179688Observations 25
ANOVA
df SS MS F Significance F
Regression 3 9.872914 3.290971 101.9261 1.12E-12Residual 21 0.678044 0.032288Total 24 10.55096
Coefficients Standard Error t Statistic
Intercept 2.48491 1.213893 2.04706log(POP) 0.901064 0.064715 13.92348LOG (PCGDP) 1.43188 0.693996 2.063239log(PCGDP)sq 0.0585 0.098696 0.59275
Source: Author’s calculations.

Accession of Turkey to the European Union: Market Access and Regulatory Issues 141
input-output, trade, and final demand structures.Significant modifications were made to the basicGTAP database. The basic social accounting andtrade data were supplemented with trade policydata, including additional data on tariffs and nontar-iff barriers. The dataset was also updated to betterreflect actual import protection for goods and serv-ices (for example, the basic GTAP database includesno information at all on trade barriers for services).
General Structure
The general conceptual structure of a regionaleconomy in the model is represented in figure 4.3.Within each region,firms produce output,employing
land, labor, and capital and combining these withintermediate inputs. Firm output is purchased byconsumers, government, the investment sector,and other firms. Firm output also can be sold forexport. Land is employed only in the agricul-tural sectors, while capital and labor (both skilledand unskilled) are mobile between all productionsectors. Moreover, capital is fully mobile withinregions. However, capital movements betweenregions are not modeled, but rather are held fixed inall simulations. Labor mobility is discussed below.
All demand sources combine imports withdomestic goods to produce a composite good, asindicated in figure 4.3. These are Armingtoncomposites.
TABLE 4.12 Sectoring Scheme of Model
Model Regions Model Sectors
Australia and New Zealand GrainsChina Other agricultureHong Kong (China) MiningJapan Other primary productionKorea SugarTaiwan DairyOther ASEAN MeatsVietnam Processed foodsBangladesh TextilesIndia ClothingSouth Asia LeatherCanada Wood and paperMexico ChemicalsUnited States RefineriesCaribbean Basin Initiative countries SteelAndean Trade Pact Nonferrous metalsMERCOSUR Motor vehiclesChile ElectronicsOther Latin America Other machineryEuropean Union (EU15) Manufactures, NECCentral European Associates Trade, transport, communicationsTurkey ConstructionSACU Business servicesBotswana Other servicesMalawiMozambiqueRest of Southern AfricaNorth Africa and Middle EastRest of world
Note: ASEAN � Association of South East Asian Nations; MERCOSUR �Southern Cone Common Market (Mercado Común del Sur); SACU �Southern African Customs Union; NEC � not elsewhere classified.Source: Author’s definition of model aggregation.

142 Turkey: Economic Reform and Accession to the European Union
Dynamics
An important feature of the model is a dynamiclink, whereby the static or direct income effects oftrade liberalization induce shifts in the regionalpattern of savings and investment. These effectshave been explored extensively in the trade litera-ture, including Baldwin and Francois (1999), Smith(1976, 1977), and Srinivasan and Bhagwati (1980).Several studies of the Uruguay Round have alsoincorporated variations on this mechanism. Sucheffects compound initial output welfare effects overthe medium run and can magnify income gains orlosses. How much these “accumulation effects” willsupplement static effects depends on various fac-tors, including the marginal product of capital andunderlying savings behavior. This applicationemploys a classical savings-investment mechanism(Francois, McDonald, and Nordstrom 1997), whichmeans modeling medium- to long-run linkagesbetween changes in income, savings, and invest-ment. The results reported here therefore includechanges in the capital stock and the medium- tolong-run implications of such changes.
Taxes and Policy Variables
Taxes are included in the theory of the model at sev-eral levels. Production taxes are placed on interme-diate or primary inputs, or on output. Some tradetaxes are modeled at the border. Additional internal
taxes can be placed on domestic or imported inter-mediate inputs and may be applied at differentialrates that discriminate against imports. Whererelevant, taxes are also placed on exports and on pri-mary factor income. Finally, where relevant (as indi-cated by social accounting data), taxes are placed onfinal consumption and can be applied differentiallyto consumption of domestic and imported goods.
Trade policy instruments are represented asimport or export taxes/subsidies. This includesapplied most-favored-nation tariffs, antidumpingduties, countervailing duties, price undertakings,export quotas, and other trade restrictions. The oneexception is services sector trading costs, which arediscussed in the next section.
The basic data on current tariff rates are takenfrom the UN Conference on Trade and Develop-ment (UNCTAD) and WTO data on applied andbound tariff rates, and they are integrated into thecore GTAP database. These data are supplementedwith those from the U.S. Trade Representative(USTR) and U.S. International Trade Commission(USITC) on regional preference schemes in theWestern Hemisphere. For agriculture, protection isbased on OECD and U.S. Department of Agriculture(USDA) estimates of agricultural protection, asintegrated into the GTAP core database. Tariff andnontariff barrier estimates are further adjusted toreflect the remaining Uruguay Round commit-ments, including the phasing out of the remainingtextile and clothing quotas under the Agreement onTextiles and Clothing (ATC). Data on post–UruguayRound tariffs are taken from recent estimatesreported by Francois and Strutt (1999), which aretaken, in turn, primarily from the WTO’s integrateddatabase, with supplemental information from theWorld Bank’s recent assessment of detailed pre– andpost–Uruguay Round tariff schedules. All of thistariff information was concorded to the model sec-tors. The services trade barriers are based on theestimates described in Annex 1.
Trade and Transport Costs
International trade is modeled as a process thatexplicitly involves trading costs, which include bothtrade and transportation services. These tradingcosts reflect the transaction costs of interna-tional trade, as well as the physical activity of trans-portation itself. Those trading costs related to the
CES
M1 M2 MR
CES
Domesticgoods
Compositeimports
Armingtoncomposite
FIGURE 4.3 Armington Aggregation Nest
Note: CES � constant elasticity of substitution.Source: The author.

Accession of Turkey to the European Union: Market Access and Regulatory Issues 143
international movement of goods and related logis-tic services are met by composite services purchasedfrom a global trade services sector in which thecomposite “international trade services” activity isproduced as a Cobb-Douglas composite of regionalexports of trade and transport services. Trade costmargins are based on reconciled free on board(FOB) and cost, insurance, and freight (CIF) tradedata, as reported in Version 5 of the GTAP dataset.
A second form of trade costs, known in the liter-ature as frictional trading costs, is implemented in
the services sector. These costs represent the realresource costs associated with producing a servicefor sale in an export market instead of the domesticmarket. Conceptually, a linear transformation tech-nology was implemented between domestic andexport services. This technology is represented infigure 4.4. The straight line AB indicates, given theresources needed to produce a unit of services forthe domestic market, the feasible amount that caninstead be produced for export using those sameresources. If there are no frictional barriers to tradein services, this line has a slope of 1. This free tradecase is represented by the line AC. As trading costsfall, the linear transformation line converges on thefree trade line, as indicated in the figure.
Production Structure
The basic structure of production is depicted in fig-ure 4.5. Intermediate inputs are combined, and thiscomposite intermediate is in turn combined infixed proportions with value added. This yields sec-tor output Z.
Composite Household and Final Demand
Final demand is determined by an upper-tierCobb-Douglas preference function that allocatesincome in fixed shares to current consumption,investment, and government services. This process
SDomestic
SExport B C
A
FIGURE 4.4 Trading Costs in the Services Sector
Source: The author.
Specification of production ina representative sector
Leontief
Valueadded
Intermediateinputs
Composite goods
Output
CapitalLaborLand
Production and trade flows
Primaryfactors
Compositegoods
Imports
Exports Domesticproduction Final
demand
LeontiefCES
FIGURE 4.5 Basic Features of the Simulation Model
Note: CES � constant elasticity of substitution.Source: The author.

144 Turkey: Economic Reform and Accession to the European Union
yields a fixed savings rate. Government services areproduced by a Leontief technology, with house-hold/government transfers being endogenous. Thelower-tier nest for current consumption is alsospecified as a CDE (constant difference of elastici-ties) demand function. The regional capital mar-kets adjust so that changes in savings matchchanges in regional investment expenditures. (Notethat the Cobb-Douglas demand function is a spe-cial case of the CDE demand function, as is the CESor constant elasticity of demand specification. TheCobb-Douglas version of the CDE is implementedthrough GEMPACK parameter files.)
Labor Markets
The default closure involves modeling labor marketsas clearing with flexible wages. This fits with the“long-run” approach in which labor markets tend tobe more flexible. A situation is specified in which thebasic structural rigidities of labor markets (and theaggregate employment levels implied) are unaf-fected by the simulations in the long run. However,in implementation the mobility of labor betweensectors is slightly “sluggish” in the sense that there isnot a perfectly linear transform technology for themovement of labor between sectors. The implemen-tation of sluggish factor mobility represents theassumption that, for institutional reasons (andbecause some skills are sector-specific), labor is notfully flexible in its application across sectors. Thisrepresentation of labor markets seems reasonable.To the extent that wage rigidities are important, thedirection of aggregate employment effects may beinferred from wage effects. (Hertel, 1996, refers tothis as “sluggish” factor movements). A theoreticaldiscussion of factor mobility, along the lines devel-oped in Hertel and employed here, can be found inCasas (1984). In practice, the transformation elastic-ities are set very high (25.0), but not infinitely so.This effectively allows for almost full mobility.
Notes
1. One might say that, in the eyes of the EU, when it comes totrading partners, “Everybody is special and unique, just likeeverybody else.”
2. The procedures for implementing the final phase of thecustoms union in industrial products are set out in the OfficialJournal of the European Communities 13.02.95 L 035, and in abilateral steel agreement.
3. Decision No. 1/98 of the EC–Turkey Association Council,February 25, 1998, on the trade regime for agricultural produc-tions (98/223/EC).
4. See Francois, McQueen, and Wignaraja (2003; technicalannex) for a detailed discussion of the model. Also see therelated background report cited therein.
5. All dollar amounts are U.S. dollars unless otherwise indi-cated.
6. See Hertel (1996: chap. 2) for a detailed discussion of thebasic algebraic model structure represented by the GEMPACKcode. The capital accumulation mechanisms are described inFrancois, McDonald, and Nordstrom (1996).
7. More information can be obtained at http://www.monash.edu.au/policy/gempack.htm. Social accounting data arebased on Version 5 of the GTAP dataset (GTAP 2001), with anupdate to reflect post–Uruguay Round protection.
References
Baldwin, R. E., and J. F. Francois. 1997. “The Costs and Benefitsof Eastern Enlargement: The Impact on the EU and CentralEurope.” Economic Policy 12 (24): 125–76.
————. 1999. Applied Issues in Dynamic Commercial PolicyAnalysis. Cambridge: Cambridge University Press.
Boylaud, O. 2000. “Regulatory Reform in Road Freight andRetail Distribution.” Economics Department Working PaperNo. 225, Organisation for Economic Co-operation andDevelopment, Paris, August.
Casas, F. R. 1984. “Imperfect Factor Mobility: A Generalizationand Synthesis of Two-Sector Models of International Trade.”Canadian Journal of Economics 17(4).
Francois, J. F., and A. Strutt. 1999. “Post Uruguay RoundTariff Vectors for GTAP Version 4.” Manuscript, ErasmusUniversity.
Francois, J. F., B. McDonald, and H. Nordstrom. 1996. “TradeLiberalization and the Capital Stock in the GTAP Model.”GTAP consortium technical paper, http://www.agecon.purdue.edu/gtap/techpapr/tp-7.htm.
————. 1997. “Capital Accumulation in Applied Trade Mod-els.” In Applied Methods for Trade Policy Analysis: A Hand-book, ed. J. F. Francois and K. A. Reinert. Cambridge:Cambridge University Press.
Francois, J. F., M. McQueen, and G. Wignaraja. 2003. “AnOverview of EU FTAs.” Paper presented at the Vienna WorldEconomics Institute Workshop on WTO Issues, April.
Francois, J. F., H. van Meij, and F. van Tongeren. 2005. “TradeLiberalization under the Doha Round.” Economic Policy20(42): 349–390.
GTAP (Global Trade Analysis Project). 2001. “The GTAP Ver-sion 5 Dataset.” Centre for Global Trade Analysis, PurdueUniversity.
Harrison, G., D. Rutherford, and D. Tarr. 1997. “EconomicImplications for Turkey of a Customs Union with theEuropean Union.” European Economic Review 41 (3–5):861–70.
Harrison, W. J., J. M. Horridge, and K. Pearson. 2000. “Decom-posing Simulation Results with Respect to ExogenousShocks.” Computational Economics 15: 227–49.
Hertel, T., ed. 1996. Global Trade Analysis. Cambridge:Cambridge University Press.
Nicoletti, G., S. Scarpetta, and O. Boylaud. 1999. “SummaryIndicators of Product Market Regulation with an Extension toEmployment Protection Legislation.”Economics Department

Accession of Turkey to the European Union: Market Access and Regulatory Issues 145
Working Paper No. 226, Organisation for Economic Co-operation and Development, Paris.
Reinert, K. A., and D. W. Roland-Holst. 1997. “Social AccountingMatrices.” In Applied Methods for Trade Policy Analysis: AHandbook, ed. J. F. Francois and K. A. Reinert. New York:Cambridge University Press.
Smith, M. A. M. 1976. “Trade, Growth, and Consumption inAlternative Models of Capital Accumulation.” Journal ofInternational Economics 6 (November): 385–88.
————. 1977.“Capital Accumulation in the Open Two-SectorEconomy.” Economic Journal 87 (June): 273–82.
Srinivasan, T. N., and J. N. Bhagwati. 1980.“Trade and Welfare ina Steady-State.” In Flexible Exchange Rates and the Balance ofPayments, ed. J. S. Chipman and C. P Kindelberger, chap. 12.Amsterdam: North-Holland Publishing.
WTO (World Trade Organization). 1998. Trade Policy Review:European Union 1997. Geneva: WTO.


The second and third aspects of the telecom-munications industry—its rapid technologicalprogress and its role in providing the infrastructurefor the information society and knowledge econ-omy—are central to investments and economicdevelopment. Private investments are becoming themain source of technology development and capac-ity building in the telecommunications industry.Licensing and privatization are the two main chan-nels to attracting initial private capital and pavingthe way for further investments. Human capital for-mation and innovation are facilitated by means ofsharing knowledge at almost no cost. The easy inter-action between universities and research institu-tions also encourages research and innovation.Moreover, easy access to networks promotes socialcohesion and inclusiveness. Finally, government-citizen and government-business relations are sim-plified through e-government projects. In this area,Turkey has signed the eEurope+ 2003 Action Planalong with other EU candidate countries. Someprogress has been made in areas of liberalizationand licensing, but very little progress has been madein privatization.
The fourth aspect of the telecommunicationsindustry—its direct utility to the end users oftelecommunications services—can be measuredroughly by the share of telecommunications
The telecommunications industry has many inter-esting aspects.1 First, it is a network industry, withhigh fixed costs and low marginal costs. Second, itis subject to rapid technological progress. Third, itserves as the infrastructure for the informationsociety and knowledge economy. Finally, it providesdirect utility to the end users of telecommunica-tions services.
The first aspect—the telecommunications in-dustry as a network industry—has been a challengeto both economic theorists and policymakers ingeneral. How to maintain an efficient outcome byan appropriate mix of competition and regulationpolicies is still an active research area (e.g., Baumoland Sidak 1994; Laffont and Tirole 1996, 2000;Armstrong 1997, 1998; Shy 2001). The legal andregulatory arrangements have been evolving quitefast in the last decade as well (e.g., World Bank2000; OECD 2003; 1997 and 2002 acquis commu-nautaire of the European Union on telecommuni-cations services). Turkey has already adopted the1998 acquis of the European Union (EU) in tele-communications, and it has shown some progressin regulatory capacity building and liberalization ofmobile phone (GSM) services. A crucial milestonewas reached in May 2004, when the first licenses forthe provision of voice telephony services by alter-native operators were issued.
147
5The Turkish
TelecommunicationsSector: A Comparative
Analysis
Erkan Akdemir, Erdem Bassçi, and Gareth Locksley

spending of households as a fraction of gross domes-tic product (GDP). Other indicators are per capitanumber of fixed plus mobile lines (teledensity) andInternet use and the urban-rural teledensity ratio. Insome of these measures, Turkey has shown substan-tial progress; in others, it is still lagging behind.
The focus in recent years, however, has shiftedfrom building infrastructure to regulatory andmarket structure issues. For example, using datafrom 23 Organisation for Economic Co-operationand Development (OECD) countries over the1991–97 period, Boylaud and Nicoletti (2000) findsignificant price, quality, and productivity effectsfor both prospective and effective competition. Theymeasure prospective competition by the number ofyears remaining until liberalization and measureeffective competition by the share of new entrantsor by the number of competitors. Legal competi-tion in fixed lines became effective in Turkey as ofJanuary 2004.
Likewise, a recent paper by Fink, Mattoo, andRathindran (2002) based on data from 86 develop-ing countries finds that both the privatization andliberalization of fixed lines significantly increasemainline penetration and productivity. They alsoshow that competition without privatization is notsignificant on these two performance measures.The sequencing also matters. According to Fink andhis colleagues, simultaneous privatization and com-petition have a greater impact on mainline penetra-tion than the privatization-before-competitionscenario. The estimated quantitative impact ofcomplete reform is 8 percent higher mainline pene-tration and 21 percent higher productivity com-pared with the case of no reform.
This chapter is organized as follows. The firstsection gives a quantitative comparison of recentindicators for price, quantity, and quality of variousservices for Turkey, EU member countries, and EUaccession countries. The second section summarizesdevelopments in the liberalization and regulation ofthe sector, and the third discusses the brief historyof the privatization process for Türk Telekom.A comparison of the legal infrastructure and insti-tutional aspects of Turkey’s telecom sector withthose of the EU follows in the fourth section. Theconcluding section provides an overview of needsassessment in market structure, legislative, regula-tory, and taxation issues in light of EU accession andthe eEurope+ Action Plan.
A Quantitative Comparison
Broadly speaking, the Turkish telecommunicationssector is comparable with those of the accessioncountries2 that have with a similar level of GDP.Turkey scores better in terms of total teledensityand the urban-rural teledensity ratio, but lagsbehind in Internet usage.
The total expenditure on telecommunicationsservices constitutes a significant portion of GDP inboth EU members and candidate countries. Fig-ure 5.1 shows this statistic to be about 3 percent forboth Turkey and candidate countries and slightlylower for EU members.
Figure 5.2 shows that in terms of fixed-line tele-phones per household, Turkey scores better thanboth the candidate countries and the EU. However,in terms of the fixed-line penetration rate (i.e., thenumber of fixed lines per 100 inhabitants) Turkeyseems to lag behind (figure 5.3). The striking differ-ence between figures 5.2 and 5.3 can be attributedto the large families in Turkey. Therefore, the rela-tively low penetration rate in fixed lines need not beseen as a deficiency.
The urban-rural teledensity ratio (Istanbul ver-sus the rest of the country) is shown in figure 5.4.This figure reflects the fact that most of the invest-ments of Türk Telekom were carried out with theimplicit understanding that it would provide uni-versal service throughout the country. The figurealso is indicative of the significant investments
148 Turkey: Economic Reform and Accession to the European Union
Turkey
3.1
Candidatecountriesaverage
3.4
EU average
2.6
Percent of GDP4
3
2
1
0
FIGURE 5.1 TelecommunicationsRevenue in GDP
Source: ITU 2001.

The Turkish Telecommunications Sector: A Comparative Analysis 149
Turkey
87
Candidatecountriesaverage
77
EU average
86
Percent100
80
60
40
90
70
50
20
30
10
0
FIGURE 5.2 Households with Fixed-LineTelephone Service
Source: eEurope+ 2003.
Turkey
1.5
Candidatecountriesaverage
1.7
EU average
1.2
2.0
1.5
1.0
0.5
0.0
Ratio
FIGURE 5.4 Largest City/Overall CountryTeledensity Ratio
Source: ITU 2001.
Turkey
11.9
Candidatecountriesaverage
29.7
EU average
23
40
Percent of revenue
30
20
10
0
FIGURE 5.5 Investment in Telecommunications
Source: ITU 2001.
Turkey
29
Candidatecountriesaverage
36
EU average
57
Number of lines80
60
40
20
0
FIGURE 5.3 Fixed-Line Penetration Rates(fixed lines per 100 inhabitants)
Source: eEurope+ 2003.
made by Türk Telekom during the 1980s. In 1980the ratio of Türk Telekom investments to the grossnational product (GNP) was about 0.3 percent.This ratio steadily increased to 1 percent of GNP in1987. Afterward, it sharply declined and fell backon average to about 0.3 percent during the secondhalf of the 1990s (Yılmaz 2000). The significantslowdown in investments by TT brought stagnationin improvements in the fixed-line teledensity.
Figure 5.5 also supports the investment slow-down reported by Yılmaz (2000). The slowdowncan be attributed largely to the financial squeeze inthe government’s budget and the use of TT profitsto contribute to the primary budget surplus of thegeneral government under the International Mone-tary Fund (IMF) program.
The mobile penetration rate is also significant.According to figure 5.6, Turkey has a mobile

150 Turkey: Economic Reform and Accession to the European Union
Turkey
30
Candidatecountriesaverage
39
EU average
7676
Number of mobile phones80
60
40
20
0
FIGURE 5.6 Mobile Penetration Rates(per 100 inhabitants)
Source: eEurope+ 2003.
Turkey
3
Candidatecountriesaverage
15
EU average
48
Percent100
80
60
40
20
0
FIGURE 5.8 Regular Users of Internet in Population
Source: eEurope+ 2003.
Turkey
0.7
Candidatecountriesaverage
3.1
EU average
1.7
6
Euros per hour
4
2
0
FIGURE 5.9 Internet Access Costs(purchasing power standard[PPS]–adjusted)
Source: eEurope+ 2003.
Turkey
7
Candidatecountriesaverage
11
EU average
38
Percent100
80
60
40
20
0
FIGURE 5.7 Households with InternetAccess
Source: eEurope+ 2003.
penetration rate comparable with that of the candi-date countries. Given Turkey’s population, this ratetranslates into a large mobile market in Europe.
In line with the 2002 acquis and the eEurope+2003 Action Plan, Internet use and related dataservices are also important. Figures 5.7 and 5.8indicate that both the Internet availability perhousehold and Internet use per individual are lowin Turkey compared with the rates even in the can-didate countries. There are two possible explana-tions for this observation. One is related to the
price of Internet services, and the second is relatedto the availability of Internet facilities—that is, datalines and personal computers (PCs).
Figure 5.9 shows that the cost of connecting tothe Internet is significantly lower in Turkey than inthe other countries. Connection prices are less thanhalf of the EU average and less than a quarter of thecandidate countries’ average. Thus the only possibleobstacle to use of the Internet in Turkey wouldbe the availability of PCs. Although significant
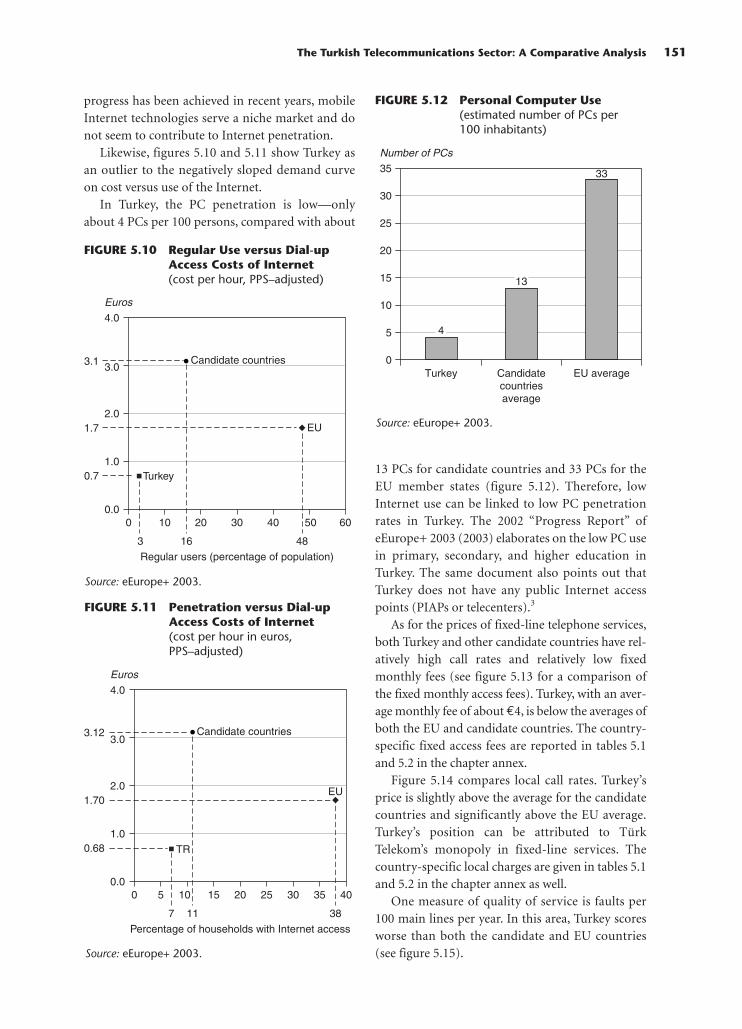
The Turkish Telecommunications Sector: A Comparative Analysis 151
7
0.68
3.12
1.70
4.0
Euros
Candidate countries
EU
TR
Percentage of households with Internet access
3.0
1.0
2.0
0.00 5 10 15 20 30 4025 35
11 38
FIGURE 5.11 Penetration versus Dial-upAccess Costs of Internet(cost per hour in euros, PPS–adjusted)
Source: eEurope+ 2003.
FIGURE 5.12 Personal Computer Use(estimated number of PCs per 100 inhabitants)
Source: eEurope+ 2003.
3
0.7
3.1
1.7
4.0
Euros
Candidate countries
EU
Turkey
Regular users (percentage of population)
3.0
1.0
2.0
0.00 10 20 30 40 50 60
16 48
FIGURE 5.10 Regular Use versus Dial-upAccess Costs of Internet(cost per hour, PPS–adjusted)
Source: eEurope+ 2003.
Turkey
4
Candidatecountriesaverage
13
EU average
33
Number of PCs35
25
15
30
20
10
5
0
progress has been achieved in recent years, mobileInternet technologies serve a niche market and donot seem to contribute to Internet penetration.
Likewise, figures 5.10 and 5.11 show Turkey asan outlier to the negatively sloped demand curveon cost versus use of the Internet.
In Turkey, the PC penetration is low—onlyabout 4 PCs per 100 persons, compared with about
13 PCs for candidate countries and 33 PCs for theEU member states (figure 5.12). Therefore, lowInternet use can be linked to low PC penetrationrates in Turkey. The 2002 “Progress Report” ofeEurope+ 2003 (2003) elaborates on the low PC usein primary, secondary, and higher education inTurkey. The same document also points out thatTurkey does not have any public Internet accesspoints (PIAPs or telecenters).3
As for the prices of fixed-line telephone services,both Turkey and other candidate countries have rel-atively high call rates and relatively low fixedmonthly fees (see figure 5.13 for a comparison ofthe fixed monthly access fees). Turkey, with an aver-age monthly fee of about €4, is below the averages ofboth the EU and candidate countries. The country-specific fixed access fees are reported in tables 5.1and 5.2 in the chapter annex.
Figure 5.14 compares local call rates. Turkey’sprice is slightly above the average for the candidatecountries and significantly above the EU average.Turkey’s position can be attributed to TürkTelekom’s monopoly in fixed-line services. Thecountry-specific local charges are given in tables 5.1and 5.2 in the chapter annex as well.
One measure of quality of service is faults per100 main lines per year. In this area, Turkey scoresworse than both the candidate and EU countries(see figure 5.15).

152 Turkey: Economic Reform and Accession to the European Union
Turkey
56
Candidatecountriesaverage
29
EU average
8
75
Number of faults
50
25
0
FIGURE 5.15 Quality of Service(faults per 100 main lines per year)
Source: ITU 2001.
Turkey
39
Candidatecountriesaverage
115
EU average
253280
Number of minutes
160
40
200
80
240
120
0
FIGURE 5.16 International Telephone Traffic(minutes per subscriber)
Source: ITU 2001.
Turkey
0.129
Candidatecountriesaverage
0.107
EU average
0.05
Euros0.20
0.15
0.10
0.05
0.00
FIGURE 5.14 Cost (Including Value AddedTax) of a Three-Minute Economy Local Call
Source: World Bank 2002.
In the final measure—international calling—Turkey, possibly because of its high internationaltariffs, ranks far behind both the candidate and EUcountries.
Competition Policy and Regulation
As of January 2004, Turkey’s telecommunicationssector was fully open to competition, makingTurkey the last of the OECD countries to fully
liberalize its sector. To this end, in 1998 the Turkishgovernment had committed itself, in accordancewith World Trade Organization (WTO) guidelines,to liberalize its fixed-line telephone network andservices no later than the end of 2004. However, thetelecommunications law (No. 4502) enacted inJanuary 2000 shifted the liberalization timetable tothe end of 2003.
After taking the important step of openingup fixed lines for competition, the government
Turkey
4.3
Candidatecountriesaverage
7.2
EU average
14.5
Euros20
15
10
5
0
FIGURE 5.13 Residential Monthly AccessFee (Including Value AddedTax) for Fixed-Line TelephoneService
Source: World Bank 2002.

The Turkish Telecommunications Sector: A Comparative Analysis 153
addressed the institutional capacity of the inde-pendent Telecommunications Authority (TA),Telekomünikasyon Kurumu. The TA was establishedby the 2000 telecommunications law. Some criticismwas directed at the authority’s initial compositionand the excessive amount of power that it was givento apply sanctions if national security or publicorder were imperiled (OECD 2002; Goldstein 2003).Nevertheless, the secondary legislation was broadlycompleted by the TA before January 2004.
In fact, limited competition had been under wayin mobile phone services since 1994, when two pri-vate firms, Turkcell and Telsim, were given therights to offer GSM services through revenue-sharing agreements with Türk Telekom. In 1998 thegovernment sold the two operators licenses, bymeans of a concession agreement, to operate theirGSM 900 networks for 25 years in return forUS$500 million apiece.4
In April 2000, the Ministry of Transportation ten-dered two new GSM 1800 licenses by means of con-cession agreements. A third license was reserved forTürk Telekom at the price of the first auction.Because of the auction design, only one of thelicenses was sold, but the revenue generated washigher than expected. I
.sbank-Telecom Italia Mobile
(TIM) consortium (Aria) won the first auction witha bid of $2.5 billion. This number was then the min-imum price for the second auction, and thus the auc-tion attracted no bidders.5 Türk Telekom decided tolaunch its own GSM 1800 operator, Aycell. As of theend of 2003, the four GSM operators—Turkcell,Telsim, Aria, and Aycell—had market shares of68 percent, 18 percent, 7 percent, and 7 percent,respectively. The two small operators, Aria andAycell, merged in 2004 under TT-I
.sbank-TIM with
the brand name Avea.
Privatization of Türk Telekom
The already delayed privatization of Türk Telekombears urgency, because competition between thecompany and potential private entrants will not beeasy. Some of the difficulties facing Türk Telekomin its competition with others are as follows:
• Turkey’s Treasury does not permit the state-owned corporation to borrow funds for invest-ments.
• Only a small fraction of net profits can be usedfor investments.6
• As a state-owned corporation, Türk Telekomwould find it difficult to undertake risky andambitious projects and restructuring plans.
Since 1994, when the postal and telecommuni-cations services of the General Directorate of Post,Telegraph, and Telephone (PTT) were separated,various attempts have been made to privatize TürkTelekom. Earlier attempts were turned down by theSupreme Court. After addressing the legal issuesmore carefully, the government offered a tender in2000 that left 51 percent of the shares with the Trea-sury, but it was not successful in part because ofpoor market conditions in the telecommunicationssector worldwide. Law No. 4673 of May 2001 left agolden share of Türk Telekom to the Treasury,which means, in fact, to one strong member of theboard of directors. Türk Telekom employees areentitled to 5 percent of the shares, and the remain-ing are available for block sale or for initial publicofferings (IPOs). The restriction on foreign owner-ship was removed by the foreign direct investmentlaw of 2004.
In December 2003, the Council of Ministersadopted a new privatization plan for Türk Telekom.The plan called for a block sale of 51 percent ofshares in 2004. Since then, the valuation committeeand the tender committee have been preparing forthat sale. Law No. 5189 of July 2004 providedfurther amendments to foster the privatizationprocess.
Legal and Institutional Comparisons with the EU
The most recent legal development in the EU is theacceptance of the 2002 acquis in telecommunica-tions. The European Parliament and the EuropeanCouncil approved and published a set of new direc-tives in 2002. The directives considered here are theframework directive, authorization directive, accessdirective, and universal service directive. This sec-tion, in light of the EU directives, describes therecent progress of Turkey in each area. It also com-pares price regulation practices in EU and Turkey.
Framework
The purpose of the 2002 EU legislation is to pro-vide a common regulatory framework and compe-tition principles and practices for the electronic

communications sector, comprising telecommuni-cations, media, and information technology serv-ices (the framework does not regulate content).The purpose of introducing the new directives isto address the technological convergence observedin these three sectors. Under the frameworkdirective,
• Member states are to guarantee the independ-ence of the national regulatory authority (NRA).
• Telecommunication service providers have theright of appeal against NRA decisions.
• NRAs are responsible for the gathering and dis-semination of sector-related information.
• All potential service providers have the right toinstall facilities in a timely, nondiscriminatory,and transparent manner.
• Facility sharing among service providers is nor-mally voluntary, but the NRAs can also make itcompulsory under exceptional circumstances.
• NRAs are responsible for identifying serviceproviders that have a “significant market power”in the relevant market.
• In cases in which significant market power isidentified, the NRAs are supposed to imposeregulations ex ante on the company with signifi-cant market power.
• If access and interconnection negotiationsbetween companies fail, the NRA resolves thedispute within four months.
In Turkey, an important reform process began in2000 in the telecommunications sector. The previ-ous legislation, which dates back to 1924, wasamended. The new legislation is broadly compati-ble with the EU perspective. In June 2001, Turkey,along with the other EU candidate countries, was asignatory to the eEurope+ Action Plan by which itcommitted itself to achieving certain measurablegoals in the electronic communications sector.
Authorization
The most recent EU document on licensing andrelated issues is the authorization directive(2002/20/EC). The objective of the directive is
to create a legal framework to ensure the freedomto provide electronic communication networksand services, subject only to the conditions laiddown in this Directive and to any restrictions in
conformity with Article 46(1) of the Treaty, inparticular, measures regarding public policy,public security and public health. (Emphasisadded.)
A general authorization is available for every serv-ice provider. Yet the member states may at mostrequire a notification from the service provider.Other than the notification, no permissions orother administrative barriers to entry will beimposed (Article 3.2). In cases in which there is atechnical need to limit the number of rights of usegranted, such as the allocation of radio frequencies,the selection criteria must be objective, transparent,nondiscriminatory, and proportionate. Time limitsare imposed on the administration to finalize theapplications (Articles 5.2, 7.4).
Although obtaining a general authorization is assimple as it can be, an undertaking that does notcomply with the general conditions laid downby the NRAs may be subject to financial penaltiesand even be prevented from providing service(Article 10).
In Turkey, the government monopoly on fixed-line services dates back to 1924 and the telegramand telephone law (No. 406). This monopolyended, however, at the beginning of 2004 under thetelecommunications law (No. 4502). Licensing wasmentioned in legal arrangements for the first timein 1995, when a value added telecommunicationsservices regulation was enacted. In 2000 the telecom-munications law brought with it a new approach tolicensing. Based on this approach, the Ministry ofTransportation issued a new telecommunicationsservices regulation.
In May 2001, by means of Law No. 4673, the rightto issue licenses was transferred to the Telecom-munications Authority. Accordingly, the TA pub-lished a Licensing Communiqué in 2002. Thecommuniqué states the conditions to be met byapplicants, the time limits, and the other proceduraldetails for issuing licenses. The minimum license feesare determined by the Council of Ministers. Thesefees are broadly consistent with the average adminis-trative fees set in the EU.
In 2002, new licenses were issued by the TA.These were general authorizations and telecommu-nications licenses for some existing Internet serv-ice provider, very small aperture terminal, andsatellite platform operators. The licenses for long-distance telephony operators have been issued since
154 Turkey: Economic Reform and Accession to the European Union

The Turkish Telecommunications Sector: A Comparative Analysis 155
May 2004. Although some applications for telecom-munications services, such as fixed wireless access,are outstanding, the TA is expected to issue licensesin the fourth quarter of 2004.
The 2000 telecommunications law containsclauses on licensing with four types of authoriza-tion: (1) authorization agreement, (2) concessionagreement, (3) telecommunications license, and(4) general authorization. The approach in the EUis general authorization and allocation rules forindividual licenses for radio frequencies based oncompetitive principles. In Turkey, the four differentarrangements for licensing are confusing and diffi-cult to implement.
The latest telecommunications services reg-ulation should be updated to reflect changes inlegislation (mainly Law No. 4502 and No. 4673).Authorization agreements and concession agree-ments could be converted to individual licenses,and telecommunications licenses could be con-verted to general authorizations or permits. Rev-enue share agreements also could be converted tolicenses. There is no genuine license concept in cur-rent arrangements because the TA can changelicense conditions unilaterally.
Access
The most recent EU documents regulating access tothe network of other firms are the access directive(2002/19/EC) and the regulation on unbundledaccess to the local loop (No. 2887/2000). The accessdirective defines access as “the making available offacilities and/or services, to another undertaking,under defined conditions, on either an exclusive ornon-exclusive basis, for the purpose of providingelectronic communication services” and intercon-nection as
the physical and logical linking of public com-munications networks used by the same or a dif-ferent undertaking in order to allow the users ofone undertaking to communicate with users ofthe same or another undertaking, or to accessservices provided by another undertaking. . . .Interconnection is a specific type of access imple-mented between public network operators.
Local loop unbundling is based on the definition inthe local loop regulation in which the “‘local loop’is the physical twisted metallic pair circuit in the
fixed public telephone network connecting thenetwork termination point at the subscriber’spremises to the main distribution frame or equiva-lent facility.”
The access directive establishes the rights andobligations of operators regarding interconnec-tions and access. It also defines the NRA objectivesand procedures regarding access. The main pointsare as follows:
• Private negotiations between undertakings forinterconnections cannot be restricted by mem-ber states.
• Operators cannot be obliged to discriminatebetween different undertakings for equivalentservice.
• Operators are obliged to negotiate interconnec-tion when others ask for it.
• The NRAs can impose, when necessary, obliga-tions on an operator to facilitate interconnections.
• The obligations may be imposed only on an objec-tive, transparent, proportionate, and nondis-criminatory basis.
• With the permission of the European Commis-sion, the NRAs can impose additional measuresrelated to access on operators with significantmarket power.
Likewise, the local loop unbundling regulationaims to facilitate access to the “least competitivesegments of the liberalized telecommunicationsmarket.” It is recognized that the new entries will bedifficult, given the high costs of fixed-line infra-structure, and that the existing infrastructure hasbeen financed by monopoly rents. Yet the eEurope+Action Plan, in order to substantially reduce thecosts of using the Internet, identifies unbundledaccess to the local loop as a short-term priority.
According to the local loop unbundling regula-tion, the NRA has the following responsibilities:
• To identify notified operators (NOs) as those thathave significant market power in fixed publictelephone networks
• To ask NOs to publish a reference offer for unbun-dled access to their local loops and related facilities
• To supervise NOs in their cost-based pricing andin providing other operators with transparent,fair, and nondiscriminatory unbundled access tothe local loop.

The clauses in Turkey’s Law No. 4502 on inter-connection and roaming are in harmony with theEU acquis. The law also includes a dispute resolu-tion mechanism for interconnection via the TA.However, no direct legal basis exists for local loopunbundling. The secondary legislation for nationalroaming, interconnection, and local loopunbundling were put in place in 2002, 2003, and2004, respectively.
Universal Service
Universal service is defined in the 2002 acquis as“the provision of a defined minimum set of serv-ices to all end-users at an affordable price.” The EUviews universal service as an obligation of its mem-ber states (see Article 3.1 of the universal servicedirective). However, care is taken not to distort themarket mechanism while safeguarding the publicinterest (Article 3.2).
The minimum service requirements in the uni-versal service directive can be summarized as theprovision of
• Access to a fixed telephone at every reasonablefixed location
• Directory inquiry services and directories• Public pay phones• Special measures for disabled users • Affordable tariffs• Adequate quality of service• Number portability.
How much of the obligation of universal servicethat should be allocated on the service providershas been greatly debated (see, e.g., Choné, Flochel,and Perrot 2002 for a theoretical investigation). Theuniversal service directive of the 2002 acquisimposes certain obligations on all undertakings,including the competitive ones, but it imposes extraobligations on firms with significant market power(Articles 16–19). Nevertheless, the financing of animportant part of the universal service obligationsis left to the member states (Articles 12–14).
In Turkey, universal service is covered by variouslaws, but no explicit mechanism is in place. TheMinistry of Transportation is responsible for uni-versal service policy, and the burden is carriedmostly by Türk Telekom. As for the rights of users,the legislation contains no solid regulation, exceptfor the general consumer rights protection law.
Thus the main and secondary legislation for uni-versal service needs to be put in place, and new pro-grams should be developed for a low-user schemeand special needs. As for financing the burden ofthe universal service organization, a fund or abudgetary mechanism must be established.
Price Regulation
According to the EU acquis, only firms with signifi-cant market power can be regulated. The sameprinciple carries over to the telecommunicationsservices. National regulatory authorities are sup-posed to define the relevant markets and then, ineach relevant market, determine the presence offirms with SMP. Where SMP exists, the NRA wouldimplement price regulation.
The economics literature discusses two possibleways of price regulation: price cap regulation and rateof return (or cost plus) regulation. For price cap reg-ulation,the regulator determines a“reasonable price”for the base year and then for the following yearsapplies a consumer price index (CPI) inflation − Xpercent adjustment on the base year’s price. Price capregulation is desirable because it provides an incen-tive for a firm to find ways to cut its production cost.The disadvantages are a greater need to regulate thequality of services and the difficulty encountered insetting the base price and the X factor—that is, theexpected growth in productivity (see Weisman 2002for an interesting discussion). Rate of return regula-tion also has negative aspects. First, the NRA mustbe cautious about the costs reported by the firm.Second, the incentives to improve productivity andthus cut costs are not there.
The trend in Europe, as well as in Australia, theUnited States, and South America, over the past15 years has been toward implementing price capregulation (Weisman 2002: 350). In Turkey, theprice cap method is also used. Turkish telecom lawhas several clauses on price regulation. The 2001Pricing (Tariff) Regulation and 2001 Price CapCommuniqué for SMP operators are in force. GSMtariffs are subject to price regulation based on theoperators’ concession agreements. But their Xfactor is fixed at 3 percent (CPI – 3 percent [CPI]),which is much lower than that of Türk Telekom.
Türk Telekom is subject to price regulation aswell. For the years 2002–03, the voice telephonyservices of TT were subject to an X factor of 7.5 per-cent, which was changed to 4 percent in 2004. By
156 Turkey: Economic Reform and Accession to the European Union

The Turkish Telecommunications Sector: A Comparative Analysis 157
contrast, the leased-line tariffs price cap methodwas used for 2002. The TA approved cost-basedtariffs for leased lines in 2004, which were in forceby June 2004.
Another important issue lagging behind sched-ule for the TA and Türk Telekom is the rebalancingof the local, long-distance, and international pricesof TT. Rebalancing is central to price regulation.The new structure, which is based on a monthlyrental fee and a reduction in the tariffs of nationaland international calls in order to eliminate crosssubsidy, came into effect in August 2004. A whole-sale tariff is needed for resale and new entrants.
For GSM operators, the inconsistency betweentheir concession agreements and tariff regulationshould be removed. For operators with significantmarket power, a flexible price regulation similar tothe one in the EU should be followed.
Conclusion and Recommendations
The liberalization of telecommunications servicesin the EU has had a substantial impact. During1998–2002, the prices of telecommunications serv-ices fell substantially, ranging from 14 percent inresidential national calls to 70 percent in interna-tional business calls (see figures 5.17 and 5.18 in thechapter annex). Turkey is also expected to benefitfrom a reduction in prices and increase in qualityby adopting the EU regulatory framework and byliberalizing the market for fixed lines.
This chapter has shown that Turkey scores rea-sonably well when compared with the EU candi-date countries in terms of the significance oftelecommunications services in GDP, the mainlineand mobile penetration rates, the urban to ruralpenetration rates (i.e., universal service), and Inter-net service prices. However, performance needs tobe improved in some areas. Examples are invest-ments in fixed lines such as fiber cables, Internetusage, tariff rebalancing by means of higher fixedaccess fees and lower marginal fees, and the qualityof services offered by Türk Telekom.
Therefore, a clear need exists for a new, singletelecommunications act that would update thecentury-old telegraph and telephone law (LawNo. 406), eliminate conflicting clauses in the amend-ing laws, and harmonize with EU regulations. Themain problems facing Turkey are related to theimplementation of the new legislation and, by impli-cation, the quantitative targets. It is also important
that the TA be strengthened in its technical, legal,and economics capabilities. Finally, after full liberal-ization of the sector, the successful privatization ofTürk Telekom would benefit not only the sector butalso significantly benefit the Turkish economy.
Annex: Price Comparisons
0
10
20
30
40
50
60
90
80
70
1998 1999 2000 20022001
Euros per month
Business, excluding value added tax
Residential, including value added tax
FIGURE 5.17 Basket of NationalCalls
Note: Figure shows estimates of the average monthlyspending by a typical “European business/residentialuser” for fixed national calls.Source: European Commission 2002.
0.0
0.2
0.4
0.6
0.8
1.0
1.2
1.8
1.6
1.4
1998 1999 2000 20022001
Euros
Business, excluding value added tax
Residential, including value added tax
FIGURE 5.18 Basket of International Calls
Note: Figure shows the average price of a single callfrom the originating country to all other OECD desti-nations. A full description of the methodology can befound in OECD 1990.Source: European Commission 2002.

158 Turkey: Economic Reform and Accession to the European Union
TABLE 5.1 Monthly Residential Access Fee and Local Call Tariffs: 15 EU MemberStates and Washington, DC, July 1, 2002
Monthly Residential Cost of Three-Minute LocalAccess Fee, Including Value Economy Call, Including
Country Added Tax (euros) Value Added Tax (euros)
Austria 17.44 0.09Belgium 16.20 0.12Denmark 15.74 0.08Finland 13.79 0.16France 12.55 0.13Germany 12.69 0.05Greece 11.77 0.09Ireland 19.60 0.04Italy 14.88 0.07Luxembourg 18.40 0.05Netherlands 16.42 0.07Portugal 14.10 0.17Spain 13.54 0.08Sweden 13.25 0.08United Kingdom 15.51 0.05
EU average 14.46 0.05
Washington, DC 10.67 0.05(Verizon), low-user, flatfee per call (excludingtax of $2.69 and othercharges and levies of$6.00)
Source: World Bank 2002.
TABLE 5.2 Monthly Residential Access Fee and Local Call Charges: 13 EUPreaccession Countries (PAC), March 31, 2002
Monthly Residential Cost of Three-Minute LocalAccess Fee, Including Value Economy Call, Including
Country Added Tax (euros) Value Added Tax (euros)
Bulgaria 3.00 0.022Cyprus 9.50 0.076Czech Republic 9.70 0.136Estonia 5.90 0.096Hungary 12.30 0.111Latvia 6.30 0.143Lithuania 5.50 0.130Malta 5.30 0.132Poland 11.80 0.970Romania 3.50 0.940Slovakia 5.90 0.141Slovenia 9.90 0.084Turkey 4.30 0.129PAC average 7.15 0.107
Source: PWC Consulting 2002.
Annex:

Notes
1. The authors would like to thank Izak Atiyas, AndreaGoldstein, Sübidey Togan, Kamil Yılmaz, Tolga Kılıç, and SahinArdıyok for their comments and encouragement. The usual dis-claimer applies.
2. In this chapter, the term accession or candidate countriesrefers to the 10 countries that joined the EU in May 2004,together with Bulgaria and Romania.
3. PIAPs are government-initiated centers within the contextof universal service policies.
4. All dollar amounts are U.S. dollars unless otherwiseindicated.
5. The auction design for mobile phone service licenses isheavily discussed in the literature, especially after the so-calledUMTS auction tragedy in Europe (UMTS is a third-generationmobile system). See Klemperer (2002) and van Damme (2002)for possible reasons why the UMTS auctions in Europe during2000 and 2001 produced incredibly different outcomes.
6. See the paper by Li, Qiang, and Xu (2001) for cross-country evidence that supports the “cash cow” hypothesis,among other reasons, for delayed privatization of the telecom-munications sector.
References
Armstrong, M., 1997. “Competition in Telecommunications.”Oxford Review of Economic Policy 13: 64–82.
————. 1998. “Network Interconnections.” Economic Journal108: 545–64.
Baumol, W. J., and G. Sidak. 1994. Toward Competition in LocalTelephony. Cambridge, MA: MIT Press.
Boylaud, O., and G. Nicoletti. 2000. “Regulation, Market Struc-ture and Performance in Telecommunications.” EconomicsDepartment Working Paper No. 237, Organisation forEconomic Co-operation and Development, Paris.
Choné, P., L. Flochel, and A. Perrot. 2002. “Allocating andFunding Universal Service Obligations in a CompetitiveMarket.” International Journal of Industrial Organization1247–76.
eEurope+ 2003. 2003. “eEurope+ Progress Report.” Prepared bythe EU membership candidate countries with the assistanceof the European Commission, Ljubljana, June 3–4, 2002.
European Commission. 2002. “Eighth Report from the Com-mission on the Implementation of the TelecommunicationsRegulatory Package. COM(2002) 695. Brussels.
Fink, C., A. Mattoo, and R. Rathindran. 2002. “Liberalizing BasicTelecommunications: Evidence from Developing Countries.”Paper presented at the OECD-World Bank Services ExpertsMeeting, Organisation for Economic Co-operation andDevelopment, Paris.
Goldstein, A. 2003. “The Political Economy of RegulatoryReform: Telecoms in the Southern Mediterranean.” Paperpresented at the Fourth Mediterranean Social and PoliticalResearch Meeting, Florence-Montecatini Terme.
ITU (International Telecommunications Union). 2001. “WorldTelecommunications Indicator.” March.
Klemperer, P. 2002. “How (Not) to Run Auctions: The European3G Telecom Auctions.” European Economic Review 46:829–45.
Laffont, J. J., and J. Tirole. 1996. “Creating Competition throughInterconnection: Theory and Practice.” Journal of RegulatoryEconomics 10: 227–56.
————. 2000. Competition in Telecommunications.Cambridge, MA: MIT Press.
Li, W., C. Z. Qiang, and L. C. Xu. 2001. “The Political Economyof Privatization and Competition: Cross Country Evidencefrom Telecommunications Sector.” World Bank, Washing-ton, DC.
OECD (Organisation for Economic Development and Co-operation). 2002. “Regulatory Reform in the TurkishTelecommunications Industry.” In Review of RegulatoryReform in Turkey. Paris: OECD.
————. 2003. Communications Outlook. Paris: OECD.PWC Consulting. 2002. “1st Report on Monitoring of EU
Candidate Countries (Telecommunication Services Sector).”July 25, Brussels.
Shy, O. 2001. The Economics of Network Industries. Cambridge:Cambridge University Press.
van Damme, E. 2002. “The European UMTS-Auctions.” Euro-pean Economic Review 46: 846–58.
Weisman, D. L. 2002.“Is There ‘Hope’ for Price Cap Regulation?”Information Economics and Policy 14: 349–70.
World Bank. 2000. Telecommunications Regulation Handbook.http://www.infodev.org/projects/314regulationhandbook.
————. 2002. European Universal Service Atlas. Washington,DC: World Bank.
Yılmaz, K. 2000. “Türk telekomünikasyon sektöründe reform:özellestirme, düzenleme ve serbestlesme” [Reform in theTurkish Telecommunications Sector: Privatization, Regula-tion and Liberalization]. In Devletin Düzenleyici Rolü [TheRegulatory Role of the State], ed. Izak Ati yas. Istanbul:TESEV Yayınları.
The Turkish Telecommunications Sector: A Comparative Analysis 159

initial fiscal costs of the resolution of the Turkishbanking crisis were about €50 billion (about34 percent of the gross domestic product, GDP),which, with servicing costs, implies an annual costof €5 billion. These restructuring costs must betaken into account in an assessment of the potentialcosts to the Turkish banking sector of EU accession.In effect, much of the adjustment costs have alreadybeen borne because of the major bank restructur-ing that took place during 2001–03.
In implementing structural reforms, Turkey hasmet nearly all of the conditions set for the bankingsector so that it complies with EU norms. Indeed, thesector has made the necessary amendments as dic-tated by the Turkish “National Program,” which putsforth the criteria for accession to the EU. Setting cap-ital adequacy standards, redefining “own funds” andsubsidiaries, setting related lending limits, regulatingaccounting practices, and ensuring transparency offinancial reporting are among the issues addressedin the recent regulations that have been adopted andthat are in full compliance with EU principles.
Despite the relatively small asset size and lowdegree of intermediation of the Turkish financialsystem, Turkey’s potential and its regional situationmake it an attractive market. The entry of foreignbanks into Turkey’s financial markets is expected toenhance competition in the financial sector andimprove the quality of banking services and finan-cial products. Furthermore, the Turkish banking
Turkey’s prospects of accession to the EuropeanUnion (EU) are highly dependent on the progressmade with political and economic reforms.1 Ofthese reforms, financial sector–related issues are animportant component of the criteria associatedwith full membership. Most of the issues are con-centrated in the banking sector, because banksaccount for more than 90 percent of the total assetsof the Turkish financial system.
Turkey adopted a comprehensive disinflationprogram, supported by the International MonetaryFund (IMF), at the beginning of 2000. Beforeadoption of this program, macroeconomic instabil-ity, crowding out by the public sector, systemic dis-tortions created by state banks, inadequate riskassessment and management systems, and a lack ofindependent and effective supervision were all fac-tors contributing to the major structural weak-nesses of the Turkish banking system. In September2000, the Banking Regulation and SupervisionAgency (BRSA), an independent institution withresponsibility for regulating and supervising thebanking sector, began operations. Soon after its for-mation, the BRSA had to manage a major bankingcrisis brought on by the escalating political uncer-tainties, the loss of credibility by the exchange rateregime, and, finally, the abolition of the peggedexchange rate system in February 2001.
As in many other countries, the restructuring ofTurkey’s banking sector has been very costly. The
161
6Accession to theEuropean Union:
Potential Impacts on theTurkish Banking Sector
Ceyla Pazarbasıoglu
system, with its high-technology systems andregulatory compliance, is a strong candidate forbecoming a member of the EU financial system.
The remainder of this chapter is organized asfollows. The next section provides an overview ofthe major reforms undertaken in restructuring theTurkish banking sector during 2001–03 and theassociated costs.2 That overview is followed by acomparison of the Turkish banking sector withthose of the EU member states and other EU acces-sion countries in order to evaluate the impact of thegreater competition that may result from joiningthe EU. The chapter then summarizes the currentsituation in relation to compliance with EU bank-ing legislation. The final section is devoted to anassessment of the general findings.
The Restructuring of the TurkishBanking Sector and Related Fiscal Costs
In the early 1980s, the Turkish economy underwent asignificant policy shift from financial repressiontoward liberalization. Compared with its stancebefore the 1980s, Turkey became an outward-oriented economy and experienced significantchanges in foreign trade and external capital move-ments. During the same period, Turkey also experi-enced high inflation,coupled with high public sectordeficit financing. High real interest rates and greatermacroeconomic instability became the definingfeatures of the Turkish economy after the 1980s.
Turkey’s banks therefore found themselves oper-ating in an environment of macroeconomic insta-bility, characterized by high and volatile inflationrates and fragile external capital flows. Because ofthe high interest rates resulting from the highpublic sector deficits, banks invested in risk-freegovernment securities. The systemic distortionscreated by the state banks and the inadequate riskmanagement and internal control procedures ofthe sector exacerbated the vulnerability of thebanks to financial crises. In the aftermath of the1994 financial crisis, the strength of the Turkishbanking sector was severely tested. The recoverythat began in 1995 was negatively affected by theEast Asian and Russian crises of 1997–98. The dev-astating earthquakes of 1999 also had negativeeffects on the Turkish economy in general and thebanking sector in particular.
The exchange rate–based disinflation programintroduced in January 2000 had a major impact onbanks’ balance sheets. Deposit and lending rates fellsharply during the initial stages of the program’simplementation phase. Funding in foreign currencybecame cheaper because of the preannouncedexchange rate and the real appreciation of theTurkish lira. As a result, banks borrowed short term,leading in turn to a maturity mismatch becauseoutstanding loans had longer durations. Moreover,open foreign currency positions increased sharply.The financial crises of November 2000 and February2001 led to the abolition of the pegged exchangerate system and triggered another severe hit on theTurkish banking sector.
The Bank Restructuring Strategy
The Banking Regulation and Supervision Agency,established in 2000, is a financially and administra-tively independent institution funded by the pre-miums collected from Turkish banks. Before theformation of the BRSA, the Undersecretariat ofTreasury was responsible for preparing and issuingprudential banking regulations and conductingbank examinations under the Banks Act, and theCentral Bank of the Republic of Turkey conductedoff-site monitoring of banks under the CentralBank Act.
In May 2001, in the aftermath of the crises, theBRSA announced the Banking Sector RestructuringProgram (see BRSA 2001). The main objective ofthe program was to eliminate distortions in thefinancial sector and adopt regulations to promotean efficient, globally competitive, sound Turkishbanking sector (see figure 6.1). The restructuringprogram was based on four main pillars: (1) restruc-turing the state banks, (2) seeking prompt resolu-tion of the intervened banks, (3) strengthening theprivate banks, and (4) strengthening the regulatoryand supervisory framework. Despite various chal-lenges, much progress has been achieved in all ofthese areas.
As in many other countries, the costs of re-structuring the banking sector have been high (seetable 6.1). During the restructuring of the statebanks (the first pillar), the Treasury issued govern-ment bonds worth about €18 billion in 2001 tosecuritize the state banks’ losses arising from subsi-dized lending (so-called duty losses). At the same
162 Turkey: Economic Reform and Accession to the European Union

time, legislation was introduced to prevent thefuture accumulation of duty losses. Meanwhile, thebanking license of the third largest state bank(Emlak) was revoked, and the management of theremaining two state banks, Ziraat and Halk, wasstrengthened through the establishment of a jointboard of management. The total resources trans-ferred to the state banks to eliminate duty lossesand to provide capital support amounted to about€22.5 billion as of the end of 2001.
Operational restructuring was a very importantcomponent of the overall restructuring of the statebanks. The number of branches was reduced from2,494 as of December 2000 to 1,685 as of December2002, and the number of personnel was reducedto 30,399 from 61,601. State banks became moreefficient in organization, technology, humanresources, financial control, planning, and riskmanagement, so that they can operate in line withthe requirements of modern banking and interna-tional competition.
The second pillar of the restructuring strategywas the resolution of the banks taken over by theSavings Deposit Insurance Fund (SDIF). The SDIF,run by the Central Bank of Turkey since 1983 withthe mandate to insure saving deposits, was alsocharged with resolving insolvent banks in 1994. Itwas transferred to the BRSA on August 31, 2000.Twenty banks were transferred to the SDIF during1997–2002. An Asset Management Unit was createdand charged with recovering the value of the assetsof the banks taken over by the SDIF. As of the dateof transfer, the total liabilities of the banks takenover were €33 billion, and the total losses of thesebanks amounted to about €18 billion.
The funds needed for the resolution of the banksin which the SDIF intervened were met by govern-ment bonds issued by the Treasury (€18.5 billion)
Accession to the European Union: Potential Impacts on the Turkish Banking Sector 163
Banking SectorRestructuring
Program
State bankreform
Strong capitalbase
Costefficiency
Structural reform• Macroeconomic stability
Efficientsupervision
Market disciplineand transparency
Corporaterestructuring
Sound banking
Strongeconomy andsustainable
growthenvironment
FIGURE 6.1 Turkish Bank Restructuring Strategy
Source: The author.
TABLE 6.1 Initial Fiscal Costs of TurkishBanking Crisis, 2000–01
Cost in2001 Ratio of Cost
(billion to 2001 euros) GDP (%)
State banks’ duty 18.5 12.8losses
Capital support to 2.9 2.0state banks
Resolution of SDIF 27.1 18.7banksPublic resources 24.6 17.0Private resources 2.5 1.7
Total costs 48.5 33.5
Source: Banking Regulation and SupervisionAgency of Turkey.

and the SDIF’s own resources (€5 billion). Themain source of the SDIF revenues were premiumscollected from the banking sector, as well as pro-ceeds from the sale and collection of the assets ofthe intervened banks. Thus the private sector alsoshared the burden of the costs of restructuring.
To avoid even greater losses and to accelerate theresolution process, the SDIF has subjected the trou-bled banks to an intensive financial and operationalrestructuring. The speed of the resolution has beenvery rapid compared with the international experi-ence. As of May 2003, only two banks remainedunder management of the SDIF. One was a bridgebank used for asset management purposes; theother bank was put up for sale.
The third pillar of the restructuring strategy wasthe establishment of a sound private banking sec-tor. The financial structure and profitability of theprivate banks deteriorated sharply in the aftermathof the crises. During the first stage of the restruc-turing program, measures were put in place torecapitalize the private banks, limit foreign cur-rency open positions, and encourage mergers andacquisitions. In line with the program, importantsteps were taken toward strengthening the capitalbase of the private banks with their own resources.
The deeper-than-expected recession in 2001and the general global economic conditions high-lighted the need to further bolster the private banksby strengthening their capital through public sup-port if necessary, by resolving the nonperformingloans of the banking sector through the IstanbulApproach,3 and by establishing asset managementcompanies.
The recapitalization program consisted of threephases.4 During the assessment phase, the financialstatus of all private commercial banks using inter-national accounting standards was obtained bymeans of a three-phase audit procedure carried outon a fair and impartial basis. An independent auditcompany appointed by the bank undertook the firstaudit. A second audit was conducted by anotherindependent audit company to ensure that the firstaudit was carried out according to the agreed-onprinciples. The BRSA conducted the final audit.This multiphase auditing procedure was utilized toincrease transparency and credibility. The auditswere based on the financial statements of thebanks, as well as on the supplementary reportingschedules completed, based on the detailed instruc-tions of the BRSA. The supplementary reporting
schedules and statements focused on four areas:(1) capital adequacy, (2) credit portfolio and coun-terpart risk, (3) risk groups to which the bankbelongs, and (4) structured transactions and otherincome recognition issues.
In preparation of the financial statements the fol-lowing central issues were taken into consideration:
• Inflation accounting• Consolidated reporting• Inclusion of material changes to financial state-
ments after December 2001 • Special issues related to the assessment• Loan portfolio assessment and provisioning• Evaluation of derivative instruments• Evaluation of swap bonds• Valuation of foreign currency accounts.
The bank recapitalization phase began with theBRSA’s notification to the banks. During this phase,ordinary general assemblies were convened, and thefinancial situation of the banks, as determined dur-ing the assessment phase, was presented to theshareholders. The shareholders made the requiredresolutions for the recapitalization of the bankswhose capital adequacy ratio fell below the 8 per-cent minimum required.
The public recapitalization phase was designed toprovide public capital support for solvent banksthat did not satisfy the minimum capital adequacyratio (8 percent) on a pari passu basis with themajority shareholders. The public support took theform of a capital injection or subordinated debtwith the appropriate contingencies and safeguards.
Banking Sectors in the EU and Turkey: A Comparison of Structural Indicators
This section presents an overview of the structuralcharacteristics of the Turkish banking sector andcompares these characteristics with those of thebanking sectors of the EU member countries aswell as the countries included in the EU enlarge-ment process.5
Concentration Ratio, Entry to the Sector, PublicShare, and Capital Adequacy
The five largest Turkish banks have a market shareof 60 percent of total assets, which is similar to theaverage for the EU’s five largest banks (see figure 6.2
164 Turkey: Economic Reform and Accession to the European Union

and annex 1).6 This ratio is a little higher for the EUcandidate countries, reflecting the entry of largeforeign banks in the financial markets of thesecountries. The concentration of the large Turkishbanks is significantly higher than in the late 1990sbecause of the significant merger and acquisitionactivities, as well as the state’s intervention into thefailed banks. The launching of negotiations withthe EU and thus the expected “convergence play”are likely to generate more consolidation in thebanking industry and increased interest by bothdomestic and foreign participants.
The €11 million in capital required to license abank in Turkey is in line with the EU average of€12 million (see annex 1, table 6.3). Licensingrequirements have become much more onerous inTurkey since the bank failures of 2000–01.
Although the withdrawal of the state from thebanking sector in many EU member countries issignificant, state banks still play a dominant role inTurkey, accounting for one-third of total assets asof June 2004 (see figure 6.3). However, a key pillarof the bank restructuring strategy (as discussed inthe earlier section) is the restructuring and privati-zation of state banks.
The average capital adequacy ratio of the Turkishbanking system is high compared with the EU aver-age and that of the candidate countries (see fig-ure 6.4). A minimum capital adequacy ratio—the
ratio that measures a bank’s capital as a percentageof its risk-weighted assets—is a regulatory require-ment intended to ensure that banks maintain ade-quate capital to support their risk exposures. Thecapital adequacy ratio of a bank is a good indicationof its vulnerability to potential shocks and thus thehealth of that bank. The capital adequacy regula-tions in Turkey are in line with those of the EU.
Accession to the European Union: Potential Impacts on the Turkish Banking Sector 165
54
56
58
60
62
64
66
72
70
68
EU average Candidatecountriesaverage
Turkey(June 2004)
Percent
60.0
70.8
62.8
FIGURE 6.2 Concentration Ratios of FiveLargest Banks, 2003(percent)
Sources: World Bank, and the Banking Regulation andSupervision Agency of Turkey.
0
5
10
15
20
35
30
25
EU average Candidatecountriesaverage
Turkey(June 2004)
Percent
32.7
11
7.6
FIGURE 6.3 Share of Assets of State-OwnedBanks, 2003(percentage of total assets)
Sources: World Bank, and the Banking Regulation andSupervision Agency of Turkey.
0
5
10
15
20
30
25
EU average Candidatecountriesaverage
Turkey(June 2004)
Percent
25.42
16.67
12.5
FIGURE 6.4 Capital Adequacy Ratios, 2003(percent)
Sources: World Bank, and the Banking Regulation andSupervision Agency of Turkey.

Deposit Insurance
An explicit full deposit guarantee for the banks inwhich the state intervened was extended to avoidthe deposit runs that occurred during the 2001financial crisis in Turkey. However, because of thedistortions and the moral hazard such a blanketguarantee creates, the BRSA subsequently imple-mented a partial deposit guarantee system in linewith EU regulations. This system was put into placein 2004 with a one-year notice period.
Compared with the GDP and per capita nationalincome of the EU countries, it can be argued that thelevel of protection of deposits in Turkey—€27,000per account holder—is very high.7 Although thelevel of deposit protection (guarantee or insurance)varies between €20,000 and €60,000 in the EUcountries, the average amount of insured deposits isabout €29,000 (figure 6.5). The average depositguarantee amounts to nearly €13,000 in the candi-date countries.8
Number of Banks, Average Size,and the Staff Employed
Compared with EU averages, the Turkish bankingsystem has fewer banks that have a high-density net-works and a high level of employment. Althoughthere is wide variance among EU member countries,
as of the end of 2003 an EU member country hadon average 500 banks with 11,500 branches and140,000 employees (see annex 1, table 6.3). As ofend of June 2004, Turkey had 49 banks with 6,000branches and 126,000 employees.
An average EU bank is almost twice as large asan average Turkish bank. The average asset size perbank (calculated as total assets divided by numberof banks) in EU countries is about €5.3 billion,compared with about €3.1 billion in Turkey. Theaverage asset size of banks in the candidate coun-tries is about €1 billion (see figure 6.6).
An average bank in Turkey has 125 branches,much higher than the comparable number for EUmember and EU candidate countries. In the EUmember countries, the average number of branchesper bank is 36, and the average number of employ-ees per branch is 27 (see figures 6.7 and 6.8). Simi-lar figures apply to the EU candidate countries. Theaverage number of personnel per branch in Turkeyis 21, which is comparable to that of EU memberand candidate countries.
Asset, Deposit, and Loan Indicators
The total asset size of the banking system of Turkeyis about €152 billion, compared with the EU aver-age of €1.7 trillion. One of the large banks in
166 Turkey: Economic Reform and Accession to the European Union
0
5,000
10,000
15,000
20,000
40,000
30,000
35,000
25,000
EU average Candidatecountriesaverage
Turkey(June 2004)
Euros
27,691
12,892
28,973
FIGURE 6.5 Size of Deposits Subject toInsurance, 2003(euros)
Sources: World Bank, and the Banking Regulation andSupervision Agency of Turkey.
0
1,000
2,000
6,000
4,000
5,000
3,000
EU average Candidatecountriesaverage
Turkey(June 2004)
Value (millions of euros)
3,113
1,024
5,323
FIGURE 6.6 Average Bank Size, 2003(total assets per number of banks, inmillions of euros)
Sources: European Banking Federation and BankingRegulation and Supervision Agency of Turkey.

Europe, Deutsche Bank, had total assets of about€803 billion as of December 2003, which is five anda half times larger than that of the whole Turkishbanking sector.
In terms of the ratio of loans to GDP, Turkey farespoorly, reflecting the crowding out of the real sectorby the government. The loans-to-assets ratio was20 percent in Turkey in June 2004, compared with
147 percent in the EU member countries and 55 per-cent in candidate countries. Similar observations canbe made about deposit mobilization (figure 6.9).
Profitability
The return on equity of Turkish banks has beenvery volatile, reflecting the macroeconomic devel-opments. For example, the ratio of the term profit9
of the Turkish banking sector to total equity (returnon equity) was −80 percent as of December 2001,10
reflecting the financial crises of 2000–01 and theadoption of inflation accounting (figure 6.10).During 1995–2000, this ratio averaged about22 percent. However, these figures are estimated tobe close to the 8–10 percent levels under inflationaccounting. The average return on equity of the EUmember countries’ banks was about 10 percent(after deduction of tax and extraordinary items) in2003 (see figure 6.11 and annex 1).11 However, thereturn on equity of the large-scale banks is muchhigher than that of the other bank segments.
Income, Expenditure, and Cost Structure
In banks in the EU countries, net interest incomeaccounts for almost 60 percent of total income, butit accounts for only 14 percent of the total incomeof Turkish banks. The share of other operating
Accession to the European Union: Potential Impacts on the Turkish Banking Sector 167
0
20
40
140
80
100
120
60
EU average Candidatecountriesaverage
Turkey(June 2004)
Number of branches
125
3336
FIGURE 6.7 Number of Branchesper Bank, 2003
0
5
10
15
20
30
25
EU average Candidatecountriesaverage
Turkey(June 2004)
Number of personnel
21
2527
FIGURE 6.8 Number of Personnelper Branch, 2003
Sources: European Banking Federation and BankingRegulation and Supervision Agency of Turkey.
Sources: European Banking Federation and BankingRegulation and Supervision Agency of Turkey.
0
150
100
50
200
250
300
450
400
350
Assets/GDP Deposits/GDP Loans/GDP
Percent
EU averageCandidate countries averageTurkey (June 2004)
111
422
64
169
6940
147
5520
FIGURE 6.9 Selected Indicators, 2003(percent)
Sources: World Bank, Banking Regulation andSupervision Agency of Turkey, European BankingFederation, and Eurostat.

income (net) is the largest item in the total incomeof Turkish banks.
The staff expenses of EU banks constitute about61 percent of total expenditures (figures 6.12 and6.13), whereas such expenses account for only13 percent of the total expenditures of Turkish banks.
Asset Quality
The ratio of nonperforming loans to total loans inTurkish banks (6.3 percent) is more than double thatfor the average EU bank (figures 6.14 and 6.15).Withthe onset of the severe financial crises in Turkey in2000–01, the quality of the assets of Turkish banksdeteriorated sharply, with the ratio of nonperform-ing loans reaching about 22 percent in 2001. The
168 Turkey: Economic Reform and Accession to the European Union
0
5
20
15
10
All banks Large-scale
Medium-scale
Small-scale
Percent
6.2
8.73
10.899.87
FIGURE 6.11 Return on Equity of EU Banksby Asset Size, 2003(percent)
Source: EU Banking Sector Stability (European CentralBank 2004).
8.03
6.75
9.87
0
5
15
10
Turkey(June 2004)
Turkey(June 2003)
EuropeanUnion
Percent
FIGURE 6.10 Return on Equity: Turkey andEU Banking Sectors, 2003(percent)
Sources: EU Banking Sector Stability (European CentralBank 2004) and Banking Regulation and SupervisionAgency of Turkey.
0
20
40
80
60
European Union Turkey (June 2004)
Percent
61.43
12.51
Figure 6.13 Personnel Expenses to TotalExpenditures, 2003(percent)
Sources: EU Banking Sector Stability (European CentralBank 2004) and Banking Regulation and SupervisionAgency of Turkey.
Sources: EU Banking Sector Stability (European CentralBank 2004) and Banking Regulation and SupervisionAgency of Turkey.
0.74
0.78
0.82
0.90
0.86
0.88
0.76
0.80
0.84
European Union Turkey (June 2004)
Percent
0.79
0.88
FIGURE 6.12 Personnel Expensesto Total Assets, 2003(percent)

situation improved during 2002–03 because of theacceleration of out-of-court settlements and volun-tary debt restructuring arrangements.
Share of Government Debt Securities
Government debt securities held by Turkish banksamounted to 40 percent of total assets as of June2004, compared with less than 2 percent for EUbanks at the end of 2003. This ratio increases to 22.6
percent for the EU banks when nongovernmentsecurities are included, indicating the dominanceof the real sector in the securities portfolio (fig-ure 6.16). The nongovernment securities holdingsof Turkish banks are about 1.5 percent of total assets.
Financial Strength Ratings
Turkish banks have much lower financial strengthratings than banks in the EU member countries. Ina study conducted by Moody’s Investors Service inMarch 2003, all countries were rated by their finan-cial strength by assigning weights to their assets(figure 6.17). E was the lowest rating and A was thehighest. The average rating mark of the EU mem-ber states was B–; the average rating mark of thecandidate countries was D; and Turkey’s ratingmark was D– (figure 6.17).
Foreign Bank Entry
The low share of foreign banks in Turkey (less than10 percent) offers a striking contrast with the sharesof foreign banks in newly liberalized or liberalizingCentral and Eastern European countries (close to70 percent). Persistent macroeconomic instabilityappears to be the main reason for the very smallshare of foreign banks in Turkey. A positive correla-tion exists between the volume of foreign direct
Accession to the European Union: Potential Impacts on the Turkish Banking Sector 169
0
10
20
30
40
50
European Union Turkey (June 2004)
Percent
32
45
FIGURE 6.14 Total Loans to Total Assets,2003(percent)
0
1
2
3
4
7
6
5
Percent
European Union Turkey (June 2004)
3.1
6.3
FIGURE 6.15 Nonperforming Loans (Gross)to Total Loans, 2003(percent)
Sources: European Banking Federation and BankingRegulation and Supervision Agency of Turkey.
Sources: European Banking Federation and BankingRegulation and Supervision Agency of Turkey.
0
10
20
30
40
50
European Union Turkey (June 2004)
Percent
41.5
22.61
FIGURE 6.16 Debt Securities to TotalAssets, 2003(percent)
Sources: EU Banking Sector Stability (European CentralBank 2004) and Banking Regulation and SupervisionAgency of Turkey.

investment and foreign bank expansion in the hostcountry originating from the same parent country.In 2003 the net foreign direct investment in Turkeywas about $1 billion. In addition to macroeco-nomic instability, the delays in implementingfinancial sector reforms in Turkey have preventedforeign investors from entering the Turkish market.Host country regulations also determine foreignbank entry. Foreign banks prefer countries withfewer regulatory restrictions for investment.
Since completion of the Turkish bank restruc-turing program, the banking sector has becomemore resilient to economic shocks, regulations havebeen streamlined with international standards, andoverall bank soundness has improved. As a result,the interest of foreign investors in Turkish bankshas begun to increase. Ongoing efforts to decreasehigh intermediation costs and implement limiteddeposit insurance are expected to accelerate foreignentry.
Compliance with EU BankingLegislation
Because of the European Commission’s work in par-allel with the Basel Committee on Banking Supervi-sion, Turkey’s efforts to prepare changes in thebanking system regulations serve both bodies’ pro-posals (and thus directives). Specifically, Turkey’scompliance with EU banking legislation is mainly in
the area of EU directives. Several initiatives havebeen taken in the context of the ongoing regulatoryefforts of the EU.
After establishing the BRSA,12 Turkey increasedits effort to harmonize Turkish legislation with therelated EU directives. The new Banks Act and theregulations issued by the BRSA are in line withinternational standards, and the Turkish bankinglegislation in force is almost fully in compliancewith the EU in many areas.
The remaining pieces of legislation that need tobe introduced or amended in order for Turkey toachieve full alignment with the EU legislation areon the agenda, and they are expected to be realizedwithin the framework of the National Program thatis currently being revised by the Secretariat Generalfor the EU in cooperation with the related Turkishauthorities, including the BRSA. The comprehen-sive table in annex 2 of this chapter describes boththe legislation in force in banking in the EU and thecorresponding Turkish legislation to give a pictureof the current state of play in legislative compliance.
Adoption of the Capital Adequacy Directive
Parallel with the consultative process of the BaselCommittee on Banking Supervision for the final-ization of the New Basel Accord (Basel II), theEuropean Union released an advance draft of a newdirective on the EU capital framework knownas Capital Adequacy Directive 3 (CAD 3), whichtranslates Basel II into EU legislation and appliesBasel-type provisions to investment firms anddomestic credit institutions as well as to interna-tional banks. Unlike Basel II, which addresses inter-nationally active banks, CAD 3 will be applied to allcredit institutions in the EU (including buildingsocieties). It also will be applied to nonbank invest-ment firms authorized under the Investment Ser-vices Directive (ISD). The directive will take effectin 2007.
In parallel with CAD 2 principles, the commu-niqué on capital adequacy was amended in February2001 to cover market risks, and further amendmentswere made in January 2002 to include options and toaddress some other specific issues, such as the inclu-sion of Tier 3 capital and structural positions. Theregulation requires banks to incorporate their mar-ket risks into their regulatory capital calculation,and it stipulates that banks must separate their
170 Turkey: Economic Reform and Accession to the European Union
0
2
4
6
8
10
EU average TurkeyCandidatecountriesaverage
D–
D
B–
FIGURE 6.17 Financial Strength Rating ofthe Sector (Moody’s), 2003
Source: Moody’s Investors Service(http://www.moodys.com).

books into a banking book and a trading book. Thecalculation of market risk covers the interest raterisk and equity risk of the trading book, and the for-eign exchange risk covers both the trading book andthe banking book. Banks are permitted to use eitherthe standard approach or the model approach tocalculate their market risks. Banks implementingthe internal model approach will calculate theirmarket risk–based capital requirements on the basisof their their value-at-risk (VaR) figure. Banks arealso required to conduct a regular stress testing pro-gram. Whether a bank can use the model approachis determined by compliance with the qualitativeand quantitative criteria defined in the regulation.Currently, all banks are using the standard approachto report their market risk capital charges on both asolo basis (since January 2002) and on a consoli-dated basis (since July 2002).
The BRSA has prepared a draft “CircularRegarding the Evaluation of Risk MeasurementModels of Banks by the Agency,” which sets out theprinciples and procedures for assessment of the riskmeasurement models to be used for regulatoryreporting purposes by banks. Whether a bank canuse the model is determined on the basis of a care-ful and comprehensive set of checks to grant per-mission for its use.
To gauge the impact of Basel II (and CAD 3), sixof the top 10 Turkish banks (ranked by asset size)participated in the third Quantitative Impact Study(QIS 3) under the guidance of the BRSA (BaselCommittee 2003). The study focused on the pro-posed minimum capital requirements under pillar
one of Basel II. The results of the study, in whichparticipant Turkish banks have applied simplerapproaches for credit and operational risks,13 havebeen shared with the QIS Working Group of theBasel Committee on Banking Supervision.
The results of the QIS 3, in which 365 banksfrom 43 countries participated, convey significantinformation about the potential impact of Basel IIon Turkey as well as other on participant countries.The results are generally in line with the BaselCommittee’s objectives: the minimum capitalrequirements would be broadly unchanged forlarge, internationally active banks under the inter-nal ratings–based (IRB) approach, and the propos-als would offer an incentive for internationallyactive banks to adopt more sophisticatedapproaches. The summary of worldwide results,which reflects the impact of the last consultativepaper of Basel II (Consultative Paper 3), is pre-sented in table 6.2.
The results show that under three differentapproaches for credit risk (standardized approach,foundation IRB approach, and advanced IRBapproach), both the G-10 countries and the EUcountries have lower capital requirements.14 How-ever, other countries incur a small increase in creditrisk capital requirements under the standardizedapproach. For operational risk capital charges, allbanks incur on average nearly an 8–10 percentincrease in risk-weighted assets.
The table also reveals that there is considerablevariation in the extent to which capital requirementswill rise or fall under Basel II for different banks.
Accession to the European Union: Potential Impacts on the Turkish Banking Sector 171
TABLE 6.2 Results, Quantitative Impact Study, 2003(percent)
Foundation IRB Advanced IRBStandardized Approach Approach Approach
Average Max Min Average Max Min Average Max Min
G-10 Group 1 11 84 �15 3 55 �32 �2 46 �36Group 2 3 81 �23 �19 41 �58
EU Group 1 6 31 �7 �4 55 �32 �6 26 �31Group 2 1 81 �67 �20 41 �58
Other Groups 1 12 103 �17 4 75 �33and 2
Note: IRB � internal ratings–based approach; for definition of G-10 countries, see note 14.Sources: Quantitative Impact Study Results, Basel Committee on Banking Supervision, 2003.
This variation reflects the differences between bankportfolios. The variation in results for the standard-ized approach also largely stems from the relativeimportance of retail portfolios for different banks.Moreover, the level of specialization in differentlines of activities will imply different capital chargesfor operational risk between banks.
The results of the third quantitative impactstudy (QIS 3) imply that the implementation ofnew capital adequacy regulations will mean thatTurkish banks must incur significant costs to meettheir credit and operational risk capital require-ments and the cost of funding. Even though thesaid effects have been verified by the QIS 3, thepotential effects of CAD 3 are not expected to besignificantly different from the effects of Basel II.This expectation is based on the assumption thatthere is a negligible difference between CAD 3 andBasel II, in view of the fact that CAD 3 has so farsuggested Basel-type provisions. Because the newdirective requires additional inputs and newmethodologies for capital adequacy, the inherentcosts appear in three main areas: input gathering,system design, and additional charges for capitalrequirements and cost of funding.
Contrary to the relatively low data intensivenessof CAD 2, which basically requires the location ofthe counterparty (whether it is an Organisation forEconomic Co-operation and Development countryor not) and the type of collateral, CAD 3 requires acomprehensive amount of technical data, such asexternal ratings, probability of default or of a loss-given event for credit risk, and a new type of datafor operational risk (such as event data or grossincome by business lines). Providing this data willobviously be a difficult task for Turkish banks andbanks elsewhere and will require modifications inthe accounting and reporting framework andinformation technology restructuring. New datarequirements can be met only by means of an effi-cient infrastructure such as the existence of a well-functioning rating system and liquid markets forcollaterals.
The BRSA aims to implement CAD 3 by 2007.This target also includes working on the potentialeffects of Basel II and CAD 3, as well as clarificationof the provisions of CAD 3 by taking the country-specific issues into consideration. To serve this pur-pose, a steering committee, pioneered by the BRSAand consisting of representatives of the member
banks of the Banks Association of Turkey, wasformed in February 2003 to prepare a road map forthe adoption and implementation of Basel II andCAD 3 principles by the Turkish banking sector.
Conclusion
Turkey has fulfilled most of the conditions requiredfor the banking sector to comply with the integra-tion process for the EU. Within the National Pro-gram, the necessary legislation on various issueshas been amended or enacted in line with EU direc-tives. Examples are indirect loans; definitions ofcapital and subsidiary; related lending limits; prin-ciples on the establishment and operations ofbanks and special finance houses; regulation onaccounting practices; steps to ensure transparencyon financial reporting; principles on bank mergersand acquisitions; the issues surrounding decreasingthe public share within the financial sector; steps toensure the efficiency of supervision and surveil-lance in cross-border banking; capital adequacy,including market risk; and risk management andinternal control systems.15
The BRSA has revised the regulations on depositinsurance in line with international standards; theintroduction of the new scheme was announced in2004 (with a one-year transition period). Areas thatneed further improvements in regulations are thebusiness of electronic money institutions and sup-plementary supervision of financial conglomerates.Various directives such as the one for cross-borderpayments in euros will become effective with fullEU membership. Thus the preparation at this stageis restricted to the technical evaluations.
Despite the adverse macroeconomic conditions,the core Turkish banking sector proved to beresilient. Many of these banks are comparable totheir European counterparts in terms of selectedindicators, such as high quality of human resources,technological infrastructure, a nationwide branchnetwork, and high-quality service provided in avariety of financial products. However, it will be dif-ficult for Turkish banks to compete with the largerEuropean banks with their large assets and capitalstrength. Thus the initiation of negotiations with theEU and the expected “convergence play” are likely togenerate more consolidation in the banking indus-try and increased interest of both domestic and for-eign participants.
172 Turkey: Economic Reform and Accession to the European Union

Because of the crowding out by the government,the share of consumer and corporate loans of totalassets or deposits is very low. However, under aconvergence scenario it is clear that the Turkishfinancial sector has important future growthpotential. The convergence to the EU implies notonly convergence of the capital structure, prof-itability, and management techniques, but also ofaccounting standards, transparency guidelines, andcorporate structure.16
There is no doubt but that the Turkish bankingsector will be exposed to certain costs duringintegration with the EU. EU banks tend to keeptheir profitability high through restructuring theiractivities and improving their risk managementtechniques. Competitive pressure on the Turkishbanking sector may arise from EU banks that arewell known for their strong capital base and theircapability for managing risks. It appears that, to
be competitive in the EU banking sector, or atleast to form partnerships based on solid groundwith EU banks, Turkish banks must furtherstrengthen their equity structures during the tran-sition period.
The Turkish banking system has become moreresilient and sound since the extensive restructur-ing program and implementation of internationalstandards. This development inevitably implied alarge fiscal cost in which the initial fiscal burden ofthe bank restructuring reached levels close to one-third of GDP. Thus a large portion of the cost thatwill emerge from full membership and full conver-gence to the EU banking sector has already beenborne. Furthermore, the confidence that will resultfrom the convergence to the EU is expected to havesignificant positive externalities on the banking sec-tor that should at least partially offset the impact ofcompetition from strong EU banks.17
Accession to the European Union: Potential Impacts on the Turkish Banking Sector 173

174
TABLE 6.3 Statistics on Banking Sectors of EU15 and Turkey, 2003
Percentage Percentageof Banking of BankingSystem’s System’s
Concen- Assets Assets Deposit Scaletration Minimum Risk- in Banks in Banks Insurance Moody's Corres-Ratio of Capital Entry Number Number Number Adjusted 50% or More 50% or More per Total Total Total Rating ponding to
Five Largest Requirement of of of CAR Capital Government- Foreign- Account Assets Deposits Credit GDP (March Moody'sBanks (%) (€ millions) Banks Branches Staff (%) Ratio (%) Owned Owned (€) (€ billions) (€ billions) (€ billions) (€ millions) 2003) Rating
Austria — 5 896 4,401 62,674 8 — 0.0 — 20,000 605 370 288 199,603 C+ 8
Belgium 88.0 62.5 109 4,935 72,210 8 12.7 0.0 — 20,000 891 420 397 269,546 B 10
Denmark 90.0 5 198 2,014 38,740 8 9.7 0.0 0.0 47,728 312 125 126 187,951 B 10
Finland 99.5 5 343 1,527 23,372 8 10.5 0.0 6.2 25,000 177 64 81 142,518 B− 9
France 60.0 7 925 25,789 — 8 — 0.0 — 70,000 3,779 978 1,196 1,557,245 B− 9
Germany 20.0 5 2,465 36,599 712,000 8–12.5 10.6 42.2 4.3 20,000 6,471 2,448 3,025 2,128,200 C 6
Greece 73.9 18 59 3,095 61,074 8 13.6 22.8 10.8 20,000 200 116 101 153,045 D+ 5
Ireland — 6.3 91 856 42,126 8 — — — 20,000 575 160 249 134,786 B− 9
Italy 51.2 6.3 788 30,502 337 8 13.4 10.0 5.7 — 2,170 596 1,039 1,300,926 C+ 8
Luxembourg 27.9 8.7 169 200 22,529 8 12.7 5.1 94.6 20,000 656 218 118 23,956 B− 9
Netherlands 88.1 5 147 4,000 144,000 8 11.5 3.9 2.2 — 1,911 1,263 1,096 454,276 B+ 11
Portugal 79.8 17.5 52 5,431 54,089 8 9.5 22.8 17.7 — 318 139 181 129,908 C+ 8
Spain 53.2 18 265 39,506 240,210 8 13.0 0.0 8.5 — 1,430 807 813 744,754 B 10
Sweden 62.0 5 126 1,900 38,200 8 19.9 0.0 — 27,000 287 123 123 267,251 B 10
U.K. 23.0 5 356 11,624 455,500 8 — 0.0 46.0 — 6,786 3,493 3,283 1,591,412 B+ 11
EU average 62.8 12 466 11,492 140,504 8 12.5 7.6 20 28,973 1,771 755 808 619,025 B− 9
Turkey 60.0 11.1 49 6,126 126,274 8 25.4 32.7 3.2 27,691 152.5 95 48 237,723 D− 3
— Not available, not applicable, or negligible.
Note: In June 2004, 1 euro = TL 1,805.605; in December 2003, 1 euro = TL 1,757.480.
Sources: Data on concentration, minimum capital, capital adequacy ratio (CAR), public share, foreign share, deposit insurance: “2003 World Bank Banking Survey,” http://www.worldbank.org; otherbanking indicators: European Banks Federation (FBE), http://www.fbe.org; GDP figures: Eurostat, http://www.europa.eu.int.
Unless otherwise stated, data on Turkey are from national sources. Concentration, number of banks, number of branches, realized capital ratio data are as of June 2004, http://www.bddk.org.tr.Turkish data can be found in BRSA 2004.
Annex 1: Banking Sector Statistics—The EU, New Member States, and Turkey

175
TABLE 6.4 Statistics on Banking Sectors of EU15 and Turkey, 2001
Personnel per Number of Branches Total Assets/ Total Deposits/ Total Credit/ Deposits/Credit Credit/Assets Assets/Number ofBranch per Bank GDP (%) GDP (%) GDP (%) (%) (%) Banks (€ millions)
Austria 14 5 303 185 144 128 48 675Belgium 15 45 331 156 147 106 45 8,173Denmark 19 10 166 67 67 100 40 1,577Finland 15 4 124 45 57 80 46 517France — 28 243 63 77 82 32 4,085Germany 19 15 304 115 142 81 47 2,625Greece 20 52 130 76 66 114 51 3,384Ireland 49 9 427 119 185 64 43 6,321Italy 0 39 167 46 80 57 48 2,754Luxembourg 113 1 2,737 912 491 185 18 3,880Netherlands 36 27 421 278 241 115 57 13,002Portugal 10 104 245 107 139 77 57 6,110Spain 6 149 192 108 109 99 57 5,395Sweden 20 15 107 46 46 100 43 2,278U.K. 39 33 426 220 206 106 48 19,061
EU average 27 36 422 169 147 100 45 5,323
Turkey 21 125 64 40 20 196 32 3,113
— Not available, not applicable, or negligible.Note: In June 2004, 1 euro = TL 1,805.605; in December 2003, 1 euro = TL 1,757.480.
Sources: Banking indicators: European Banks Federation (FBE), http://www.fbe.org; GDP figures: Eurostat, http://www.europa.eu.int.
Unless otherwise stated, data on Turkey are from national sources. Concentration, number of banks, number of branches, realized capital ratio data are as of June 2004,http://www.bddk.org.tr. Turkish data can be found in BRSA 2004.

176
TABLE 6.5 Statistics on Banking Sectors of Enlargement (Candidate) Countries and Turkey, 2003
Percentage Percentageof Banking of BankingSystem’s System’sAssets Assets Deposit
Concentration Minimum Risk- in Banks in Banks Insurance Moody's ScaleRatio of Capital Entry Number Number Number Adjusted 50% or More 50% or More per Total Total Total Rating Corresponding
Five Largest Requirement of of of CAR Capital Government- Foreign- Account Assets Deposits Credit GDP (March to Moody'sBanks (%) (millions) Banks Branches Staff (%) Ratio (%) Owned Owned (euros) (€ billions) (€ billions) (€ billions) (€ millions) 2003) Rating
Bulgaria 56.52 Lev 10 35 727 21,434 12 31.1 17.6 74.6 6,843 9 6 5 15,793 D− 3(approx.
US$5.40)
Cyprus 89.2 £C 3 13 940 10,300 10 14.0 4.2 12.7 — 36 28 20 11,645 D+ 5
Czech Rep. 69 CZK 500 35 1,647 39,004 8 15.4 3.8 90.0 No limit 78 52 31 80,097 D 4
Estonia 98.9 EEK 75 7 206 4,018 8 15 0.0 98.9 20,000 7 3 5 125,832 C− 6
Hungary 62.5 Ft 2,000 38 1,126 27,200 8 15.6 9.0 88.8 No limit 51 31 32 73,213 C− 6
Latvia 66.2 €5 23 206 8,895 12 14.2 3.2 65.2 — 9 6 4 9,868 D 4
Lithuania 87.9 €5 13 485 7,027 10 15.7 12.2 78.2 10,000 6 4 4 16,271 —
Malta 84.13 Lm 2 15 106 3,407 8 18.4 0.0 60.0 16,488 18 8 8 4,333 D+ 5
Poland 57.4 €5 660 4,394 151,257 8 15.1 23.5 68.7 — 104 61 44 185,227 D 4
Romania 42.8 Rol 370 000 38 2,921 46,535 11 20.3 41.8 47.3 No limit 14.7 10.23 7.27 47,936 D− 3
Slovak Rep. 66.5 Sk 500 21 553 19,797 8 13.4 4.4 85.5 11,129 24 17 9 28,822 E+ 2
Slovenia 69 SIT 1,100 20 636 11,397 8 11.9 12.2 20.6 No limit 21 14 11 24,576 D+ 5(approx.
US$5.10)
Candidatecountriesaverage 70.8 — 77 1,162 29,189 9 16.67 11 66 12,892 31 20 15 51,968 D 4
Turkey 60 11.1 49 6,126 126,274 8 25.42 32.7 3 27,691 152.5 95 48 237,723 D− 3
— Not available, not applicable, or negligible.Note: In June 2004, 1 euro = TL 1,805.605; in December 2003, 1 euro = TL 1,757.480.Sources: Concentration, minimum capital, capital adequacy ratio (CAR), public share, foreign share, deposit insurance: “2003 World Bank Banking Survey,” http://www.worldbank.org; other banking indicators: European Banks Federation (FBE), http://www.fbe.org; GDP figures: Eurostat, http://www.europa.eu.int. Unless otherwise stated, data on Turkey are from national sources. Concentration, number of banks, number of branches, realized capital ratio data are as of June 2004, http://www.bddk.org.tr. Turkish data can be found in BRSA 2004.

177
TABLE 6.6 Statistics on Banking Sectors of Enlargement (Candidate) Countries and Turkey, 2001
Personnel per Number of Branches Total Assets/ Total Deposits/ Total Credit/ Deposits/ Credit/ Assets/Number ofBranch per Bank GDP (%) GDP (%) GDP (%) Credit (%) Assets (%) Banks (€ millions)
Bulgaria 29 21 56 39 29 134 52 253Cyprus 11 72 307 238 171 139 56 2,750Czech Rep. 24 47 97 64 38 167 40 2,229Estonia 20 29 5 3 4 76 69 931Hungary 24 30 70 43 43 99 62 1,350Latvia 43 9 87 57 46 124 53 372Lithuania 14 37 37 24 22 112 58 462Malta 32 7 412 189 195 97 47 1,191Poland 34 7 56 33 24 140 42 157Romania 16 77 31 21 15 141 49 387Slovak Rep. 36 26 83 59 31 193 37 1,140Slovenia 18 32 87 57 44 130 50 1,069
Candidate 25 33 111 69 55 129 51 1,024countries average
Turkey 21 125 64 40 20 196 32 3,113
Note: In June 2004, 1 euro = TL 1,805.605; in December 2003, 1 euro = TL 1,757.480.
Sources: Banking indicators: European Banks Federation (FBE), http://www.fbe.org; GDP figures: Eurostat, http://www.europa.eu.int.
Unless otherwise stated, data on Turkey are from national sources. Concentration, number of banks, number of branches, realized capital ratio data are as of June 2004,http://www.bddk.org.tr. Turkish data can be found in BRSA 2004.

178 Turkey: Economic Reform and Accession to the European Union
TABLE 6.7 Income, Costs, and Profits of EU Banks in Different Size Groups, 2003
All
Change2002–03 2003 Large Medium Small
(% of total assets)Income
Net interest income −0.02 1.38 1.22 1.64 2.54Fees and commissions (net) −0.02 0.64 0.65 0.57 0.84Trading and foreign exchange results 0.04 0.20 0.25 0.06 0.09Other operating income (net) 0.00 0.17 0.16 0.17 0.31Total income 0.00 2.38 2.28 2.44 3.78
ExpensesStaff costs −0.03 0.88 0.86 0.84 1.47Other −0.01 0.11 0.09 0.13 0.28Total expenses −0.07 1.44 1.37 1.43 2.62
ProfitabilityProfits I (operating profits) 0.08 0.94 0.91 1.00 1.16Specific provisions −0.02 0.36 0.32 0.44 0.47Funds for general banking risks (net) 0.00 0.01 0.00 0.01 0.02Profits II (before tax and extraordinary items) 0.10 0.59 0.59 0.56 0.67Extraordinary items (net) −0.02 0.01 −0.01 0.05 0.08Tax charges 0.03 0.18 0.18 0.20 0.27Profits III (after tax and extraordinary items) 0.05 0.41 0.40 0.42 0.48
(% of Tier 1 capital)Return on equity
Profits III (after tax and extraordinary items) 1.08 9.87 10.89 8.73 6.20
(% of total income)Income structure
Net interest income −0.71 58.05 53.48 67.29 67.15Fees and commissions (net) −1.02 26.80 28.55 23.42 22.22Trading and foreign exchange results 1.42 7.33 9.64 2.34 2.28Other operating income (net) 0.11 6.94 6.88 6.79 8.22
(% of total expenses)Expenditure structure
Staff costs 0.94 61.43 63.02 58.84 56.28Administrative costs −0.68 31.10 30.42 32.19 33.33Other −0.26 7.47 6.56 8.97 10.51
Cost-to-income ratio −3.18 60.39 60.15 58.89 69.31
Source: European Central Bank 2004.

Accession to the European Union: Potential Impacts on the Turkish Banking Sector 179
TABLE 6.8 Indicators of 50 Major EU Banks, 2002 and 2003(percent)
2002 2003
ProfitabilityCost-to-income ratio 67.9 64.5Return on assets (after tax and extraordinary items) 0.4 0.4Return on equity A9 (after tax and extraordinary items) 8.0 8.7Net interest income/total assets 1.4 1.3Net noninterest income/total assets 1.2 1.2Noninterest income/total operating income 48.9 47.5
SolvencyTier 1 ratio 6.7 6.7Total capital ratio 9.6 9.9
Note: The sample of large banks in table 6.8 differs from that in table 6.7. Table 6.8 coversthe weighted average figures for 50 major banks of EU15 countries.Source: European Central Bank 2004.
TABLE 6.9 Nonperforming Assets and Provisioning of EU Banks, 2003(percent)
All
Change from 2002 2003 Large Medium Small
Nonperforming and doubtful loans (gross; −0.1 3.1 2.7 3.6 6.5% of loans and advances)
Nonperforming and doubtful loans (gross; −1.9 51.1 46.6 55.7 61.6% of own funds)
Nonperforming and doubtful loans (net; −1.9 16.7 12.1 22.7 28.3% of own funds)
Provisioning (stock; % of nonperforming 2.3 67.4 74.1 59.1 54.0and doubtful assets)
Source: European Central Bank 2004.

180 Turkey: Economic Reform and Accession to the European Union
TABLE 6.10 Regulatory Capital Ratios and Risk-Adjusted Items ofEU15 Banks, 2003
Change All Banks from 2002
Tier 1 ratio 8.8 0.3Overall solvency ratio 12.4 0.4
Overall solvency ratio below 9%Number of banks 98 −74Asset share (% of total banking sector assets) 0.7 −1.26
Risk-adjusted items (% of total risk adjusted assets)Risk-weighted assets 82.3 −0.16Risk-weighted off-balance-sheet items 11.1 0.0Risk-adjusted trading book 6.6 0.1
Source: European Central Bank 2004.
TABLE 6.11 EU Balance Sheet Structure of EU Banks, 2003
All Banks Change from(% of total assets) 2002 (%)
AssetsCash and balances with central bank 1.24 0.1Treasury bills 1.0 0.0Loans to credit institutions 15.8 −0.2Debt securities (public bodies) 7.8 0.8Debt securities (other borrowers) 10.5 0.1Loans to customers 50.6 −0.4Shares and participating interests 3.3 0.0Tangible assets and intangibles 1.6 0.0Other assets 8.0 −0.2
LiabilitiesAmounts owed to credit institutions 30.4 0.1Amounts owed to customers 41.9 −0.2Debt certificates 20.7 0.1Accruals and other liabilities 8.8 0.0Fund for general banking risks 0.14 0.0Provisions for liabilities and charges 1.2 0.0Subordinated liabilities 1.8 0.0Equity capital 4.2 0.0Other liabilities 0.5 0.0Profit/loss for financial year 0.4 0.1
Selected off-balance-sheet itemsCredit lines 14.2 0.7Guarantees and other commitments 6.5 0.7
Source: European Central Bank 2004.

Accession to the European Union: Potential Impacts on the Turkish Banking Sector 181
EU Banking Turkish Directives in Force The Directive . . . Equivalent
Directive No. 2002/87/EC of EuropeanParliament andEuropean Council,December 16, 2002, onthe supplementarysupervision of creditinstitutions, insuranceundertakings, andinvestment firms in afinancial conglomerate
No correspondingregulation. The intro-duction of compliantlegislation may bringabout some costsbecause of reorganiza-tion and relatedchanges at the institu-tional level, but it isexpected that theultimate overalloutcome is likely toproduce efficiencygains for the bankingsector and the wholeeconomy.
• Lays down rules for supplementary supervisionof “regulated entities” that are part of afinancial conglomerate.
• Defines the term regulated entity as a creditinstitution, an insurance undertaking, or aninvestment firm.
• Defines the term financial holding company as afinancial institution, the subsidiary undertak-ings of which are either exclusively or mainlycredit institutions or financial institutions.
• Makes it compulsory for all financialconglomerates that are subject tosupplementary supervision to have acoordinator appointed from among thecompetent authorities involved. Thecoordinator does not affect the tasks andresponsibilities of the competent authorities asprovided for by the sectoral rules, but works incooperation and exchanges information withthese authorities.
• Specifies that the activities of a group occurmainly in the financial sector if the ratio of thebalance sheet total of the regulated and non-regulated financial sector entities in the groupto the balance sheet total of the group exceeds40 percent. Sets out the thresholds foridentifying a financial conglomerate, takinginto account the regulated entities and theother undertakings and their significanceamong the whole.
• Sets out that regulated entities shall be subjectto supplementary supervision.
• Requires regulated entities to have in placeadequate capital adequacy policies and laysdown the rules for the supplementarysupervision of the capital adequacy of theregulated entities.
• Requires regulated entities to report on aregular basis and at least annually to thecompetent authority any significant riskconcentration at the level of financialconglomerate.
• Requires regulated entities to report on aregular basis and at least annually to thecoordinator all significant intragrouptransactions and requires the supervisoryoverview of these transactions to be carriedout by the coordinator.
• Requires regulated entities to have adequaterisk management process and internal controlmechanisms.
• Requires the member states to decide or givetheir competent authorities the power todecide according to which sectoral rules assetmanagement companies shall be included inthe consolidated or supplementary supervision.
Annex 2: EU Banking Directives in Force, Main Issues

182 Turkey: Economic Reform and Accession to the European Union
EU Banking Turkish Directives in Force The Directive . . . Equivalent
Regulation (EC)No. 2560/2001 ofEuropean Parliamentand European Council,December 2001, oncross-border paymentsin euros
Directive No. 2001/24/EC of EuropeanParliament andEuropean Council, April4, 2001, on the reor-ganization and windingup of credit institutions
No need for anynational implementinglegislation, because theEU regulation becomesbinding and directlyapplicable upon fullmembership. Its imple-mentation is notexpected to incur amajor cost for thebanking sector.
Banks Act as amendedby Act No. 4743.
• Amends Directives No. 93/6/EC andNo. 2000/12/EC.
• Lays down rules on cross-border payments ineuros to ensure that charges for thesepayments are the same as those for paymentsin euros within a member state.
• Applies to cross-border payments in euros upto €50,000 within the European Community.
• Specifies that cross-border payments madebetween institutions for their own account arenot covered.
• Specifies that the charges levied for cross-border payments and for paymentseffected within the member state shall betransparent.
• Requires that prior to exchanging currenciesinto and from euros, customers be informedabout the exchange charges the institutionspropose to apply and about the variouscharges that have been applied.
• Applies to credit institutions and their branchesset up in member states other than those inwhich they have their head offices.
• Stipulates that the administrative or judicialauthorities of the home member state shall bethe sole authority to decide on the implemen-tation of reorganization measures.
• States that the home member state shallwithout delay inform the competentauthorities of the host member state ofdecisions on reorganization.
• Calls for the home member state to publish anextract from the decision to adapt a reorgani-zation measure in the Official Journal of theEuropean Communities to facilitate the exerciseof right of appeal.
• Mandates that the administrative or judicialauthorities of the host member state of abranch of a credit institution having its headoffice outside the community shall withoutdelay inform the other authorities of theirdecision to adopt any reorganization measure.
• Specifies that the home member state shall bethe sole authority to decide on the opening ofwinding-up proceedings.
• Calls for the home member state to, withoutdelay, inform the competent authorities of thehost member state of its decision to openwinding-up proceedings.
• Sets out that where the opening of winding-upproceedings is decided after the failure ofreorganization measures, the authorization ofthe institution shall be withdrawn.
Annex 2: (Continued)

Accession to the European Union: Potential Impacts on the Turkish Banking Sector 183
Directive No.2000/46/EC ofEuropean Parliamentand European Council,September 18, 2000,on the taking up,pursuit, and prudentialsupervision of thebusiness of electronicmoney institutions
Directive No. 2000/12/EC of EuropeanParliament andEuropean Council,March 20, 2000, on thetaking up and pursuit ofthe business of creditinstitutions
No correspondingTurkish legislation. Theintroduction of suchlegislation would enrichthe scope of financialservices.
• Banks Act asamended by ActNo. 4743.
• Regulation on theEstablishment andOperations of Banks.
• Regulation onMeasurement andAssessment of CapitalAdequacy of Banks.
• Defines an electronic money institution as anundertaking or any other legal person, otherthan a credit institution, that issues means ofpayment in the form of electronic money.
• Restricts the business activities of electronicmoney institutions, other than the issuing ofelectronic money, to the provision of closelyrelated financial and nonfinancial services andto the storing of data in electronic deviceson behalf of other undertakings or publicinstitutions.
• Sets out the redeemability of the bearerof electronic money during the period ofvalidity and depending on the contractbetween issuer and bearer.
• Sets out that electronic money institutionsshould have initial capital of not less than€1 million.
• Specifies that the maximum storage amount ofthe electronic storage device shall not exceed€150.
• Defines the term credit institution as anundertaking whose business is to receivedeposits or other repayable funds from thepublic and to grant credits for its own account.
• Prohibits undertakings other than credit institu-tions from carrying on the business of takingdeposits or other repayable funds from thepublic and makes it compulsory for credit insti-tutions to obtain authorization from memberstates before commencing their activities.
• Stipulates that credit institutions should possesstheir separate own funds and that the initialcapital for access to the taking up of creditinstitutions should be equal to or greater than€5 million.
• States that the competent authorities shall notgrant authorization (1) unless at least twopersons are effectively directing the business ofthe credit institution and (2) before they havebeen informed of the identities of the share-holders or members.
• Calls for any natural or legal person whoproposes to hold, directly or indirectly, aqualifying holding in a credit institution to firstinform the competent authorities.
• Permits the competent authorities of the hostmember state to, in emergencies, take anyprecautionary measures necessary to protectthe interests of depositors, investors, andothers to whom services are provided.
• Specifies that the state is responsible for theprudential supervision of a credit institution.
• States that the competent authorities of themember states concerned shall collaborateclosely in order to supervise the activities of thecredit institutions operating.
EU Banking Turkish Directives in Force The Directive . . . Equivalent

184 Turkey: Economic Reform and Accession to the European Union
EU Banking Turkish Directives in Force The Directive . . . Equivalent
Annex 2: (Continued)
Directive No. 94/19/ECof European Parliamentand European Council,May 30, 1994, ondeposit guaranteeschemes
Decree No. 2000/682on Savings DepositInsurance andPremiums Collected bythe Saving DepositInsurance Fund.
• Specifies that the solvency ratio expresses ownfunds as a proportion of risk-adjusted totalassets and off-balance sheet items, and requiresthe competent authorities to ensure that theratios are calculated not less than twice eachyear, either individually or consolidated, whererequired.
• Requires credit institutions to permanentlymaintain the solvency ratio at a level of at least8 percent, but the competent authorities mayprescribe any higher minimum ratios theyconsider appropriate.
• Limits a credit institution’s large exposure to aclient or group of connected clients to 25percent of its own funds and limits the largeexposures in total to 800 percent of the creditinstitution’s own funds.
• States that no credit institution shall have aqualifying holding, the amount of whichexceeds 15 percent of its own funds, in anundertaking that is neither a credit institutionnor a financial institution.
• Limits the total amount of a credit institution’squalifying holdings in undertakings other thancredit institutions and financial institutions tono more than 60 percent of its own funds.
• Subjects every credit institution that has acredit institution or a financial institution as asubsidiary or that holds a participation in suchinstitutions to supervision on the basis of itsconsolidated financial situation.
• Sets up a Banking Advisory Committeealongside the European Commission in orderto ensure the proper implementation of thisregulation and to assist the Commission in thepreparation of new proposals to the EuropeanCouncil.
• Defines deposit as any credit balance thatresults from funds left in an account orfrom temporary situations deriving fromnormal banking transactions, which a creditinstitution must repay under the legal andcontractual conditions applicable, and anydebt evidenced by a certificate issued by acredit institution.
• Specifies that the scheme does not coverdeposits made by other credit institutions ontheir own behalf, all instruments that fall withinthe definition of own funds, and depositsarising out of transactions in connection withwhich there has been a criminal conviction formoney laundering.
• Permits credit institutions authorized in amember state to take deposits only if they aremembers of such a scheme.

Accession to the European Union: Potential Impacts on the Turkish Banking Sector 185
EU Banking Turkish Directives in Force The Directive . . . Equivalent
• States that the aggregate deposits of eachdepositor shall be covered up to 20,000European currency units (ECUs).
• States that this regulation shall not precludethe retention or adoption of provisions thatoffer a higher or more comprehensive cover fordeposits.
• Allows deposit guarantee schemes to, on socialconsiderations, cover certain kinds of depositsin full.
• Calls for depositors to be informed of theprovisions of the deposit guarantee.
Notes
1. This chapter was written while the author was vice presi-dent of the Banking Regulation and Supervision Agency ofTurkey. She is grateful to Münür Yayla and Serdar Özdemir fortheir contributions to this chapter. The views expressed in it arehers and do not necessarily represent those of the Banking Reg-ulation and Supervision Agency of Turkey.
2. Details of the restructuring program can be found in“Banking Sector Restructuring Program—Progress Reports ofBRSA” at http://www.bddk.org.tr.
3. The Istanbul Approach is a voluntary corporate debtrestructuring scheme based on the London Approach. It wasintroduced by amendments to the Banks Act. A FinancialRestructuring Framework Agreement was prepared and submit-ted to the banks by the Banks Association of Turkey on May 24,2002. The agreement was signed by 25 banks and 17 financialinstitutions and approved by the BRSA on July 4, 2002.
4. Detailed explanations about and the results of the auditand assessment phases of the program have been released tothe public through the “Introductory Report” and “ProgressReport.” These reports are available on the BRSA Web site,http://www.bddk.org.tr.
5. The description of the EU banking sector in this study isbased on the report EU Banking Sector Stability (EuropeanCentral Bank 2003a).
6. Data for the figures that follow are reported in annex 1and were drawn from World Bank (http://www.worldbank.org),European Central Bank (2003a, 2003b; see http://www.ecb.int),and European Banking Federation (http://www.fbe.be) sources.These data are based on Banking Supervision Committee (BSC)sources. The banks of current member countries are classifiedby asset size as large, medium, and small. The data on bankscover 99 percent of the credit institutions in EU countries.Large, medium, and small banks account for 66 percent, 30 per-cent, and 4 percent of total assets, respectively. The data for 2003cover 57 large banks, 968 medium banks, and 3,600 small banks.
7. The euro–Turkish lira exchange rate for June 2004 wasused in these calculations.
8. These figures should be considered with caution, becausedata were not available for five of the candidate countries.
9. Based on the historical cost and for the whole banking sec-tor, including the intervened banks.
10. For the same period, this ratio is −33 percent for statebanks, −132 percent for privately owned banks, −12 percent fordevelopment and investment banks, −242 percent for SDIFbanks, and 1.6 percent for foreign banks.
11. Because consistent data for candidate countries are notavailable, comparisons are made only between the EU countriesand Turkey in the rest of this chapter.
12. The BRSA was established by the Banks Act (Law No.4389), issued on June 23, 1999.
13. They applied the standardized approach for credit riskand the basic indicator and standardized approaches for opera-tional risk.
14. The Group of Ten is made up of 11 industrial countries—Belgium, Canada, France, Germany, Italy, Japan, the Netherlands,Sweden, Switzerland, the United Kingdom, and the UnitedStates—that consult and cooperate on economic, monetary, andfinancial matters. The ministers of finance and the central bankgovernors of the Group of Ten usually meet once a year in con-nection with the fall meetings of the Interim Committee of theInternational Monetary Fund. The governors of the Group ofTen normally meet bimonthly at the Bank for InternationalSettlements.
15. For recent information on actions taken to satisy acces-sion requirements, see “Monitoring the Implementation of theNational Program,” http://www.abgs.gov.tr.
16. It is believed that an assessment of new organizationalmodels, such as a financial holding company, within the samescope will be useful.
17. In fact, the economic criteria that are a precondition forEU membership will independently be an important develop-ment for ensuring confidence and stability in the markets. Mem-bership might further strengthen this confidence.
References
Basel Committee on Banking Supervision. 2003. “QuantitativeImpact Study 3: Overview of Global Results.” Bank forInternational Settlements, Basel.
BRSA (Banking Regulation and Supervision Agency of Turkey).2001. Towards a Competitive Turkish Banking Sector. June.
————. 2003. Banking Sector Assessment Report. Variousissues.
————. 2004. “Banking Sector Evaluation Report.” Ankara:BRSA.
European Central Bank. 2003a. EU Banking Sector Stability.Frankfurt: ECB, February.
————. 2003b. Report on EU Banking Structure. Frankfurt:ECB.
————. 2004. EU Banking Sector Stability. Frankfurt: ECB,November.

Characteristics and Evolution of the Industry
The electricity industry is made up of three maininterrelated segments. Electricity is generated inplants by harnessing the flow of water or the powerof the wind, sun, or earth (geothermal); burningfossil fuels (thermal); or capturing nuclear fission.Distribution refers to supplying residences or busi-nesses with electricity through lower-voltage wiresand transformers. The transmission of electricityrefers to the actual transportation of higher-voltageelectricity between generation plants and distribu-tion facilities, the interconnection of geographicallydispersed generation plants, their scheduling, andorderly dispatch. The operation and commercialprinciples of related wholesale and retail supplyactivities are quite similar; both involve metering,computing, and billing. An important distinctionis that the wholesale trade business is carriedout mostly at the transmission level on a largerscale, and the retail trade business is carried outthrough the distribution system at the end userlevel with both smaller business and householdcustomers.
Several characteristics of the electricity industrydistinguish it from other industries. For one thing,there is no economical way to store electricity. Thissituation implies that the demand for and supply ofelectricity must be balanced almost continuously
Turkey has begun a major overhaul of the legal andregulatory framework surrounding its electricityindustry.1 The reform program entails liberalizationas well as a radical restructuring of the industry—that is, its generation, transmission, and distribu-tion segments, including its wholesale and retailactivities. The purpose of this chapter is to reviewand assess the new regulatory regime, identify themain competition-related challenges the industry islikely to face, and discuss future prospects. Thechapter will attempt to evaluate the reform processin light of the regulatory framework established atthe level of the European Union (EU) and the cur-rent debate on the proposals about its amendment.
The chapter is organized as follows. The firstsection reviews the physical peculiarities of theelectricity industry and discusses how they haveshaped the evolution of its industrial organization.The second section presents an overview of regula-tory reform in the EU, the electricity directiveissued by the European Parliament in 1996, and therecent proposals for amendment advanced by theEuropean Commission. The pre-and postreformstructure of the electricity industry in Turkey andthe main features of the new regulatory regime arefeatured in the third section. The fourth sectionidentifies the main challenges that the industry islikely to face in the process of developing effectivecompetition. A final section discusses possiblecompetition-enhancing solutions.
187
7Competition and
Regulatory Reform inTurkey’s Electricity
Industry
I.zak Atiyas and Mark Dutz

in real time. In addition, the demand for electricityvaries hourly and daily, as well as across monthsand seasons. Consumers can obtain electricity aslong as they are connected to the network, becausethere is no cost-effective way to establish physicalcontact between specific consumers and genera-tors. Rather, electricity from generating plantsflows to a common pool and is retrieved by con-sumers from that pool. In the short run, the priceelasticity of demand is very low. Because generat-ing plants have rigid, nonflexible capacity con-straints, supply is relatively inelastic, especially atpeak demand times. In addition, several physicalconstraints, such as voltage, have to be met. Themost binding constraint affecting system opera-tions is the limitation on the power-carryingcapacities of lines and transformers. Congestionresulting from this constraint can, in principle, soseverely limit system operation that it couldimpede the transfer of production from a least-costplant to a load, even though both parties wouldlike to make the requisite sales agreement. Thus,balancing supply and demand requires coordinat-ing and scheduling the production of differentplants, taking the existing capacity of lines andtransformers into account. The use of generatorswill allow the system to respond to changes indemand or supply. The generators must hold aminimum level of reserve capacity to keep theprobability of system failure below an acceptablethreshold. Failure at one point in the network (e.g.,failure of a generation plant) can have seriousrepercussions for the whole network if not man-aged properly. Thus there are strong externalities interms of network security.
The need to coordinate generation and supplyon an almost minute-by-minute basis is an incen-tive to integrate these two activities vertically.Indeed, in most countries electricity services his-torically have been supplied through vertically inte-grated enterprises encompassing generation, trans-mission, and distribution activities. In Europe, suchenterprises have been organized as monopoliesunder public ownership. In the United States, thepredominant form of industrial organization hasbeen privately owned but regulated franchises withmonopoly rights to serve specific geographicregions.
Because the transmission and distribution ofelectricity involve large sunk capital costs with
188 Turkey: Economic Reform and Accession to the European Union
strong economies of scale (in the sense thatduplication of lines would be economically waste-ful), there is little scope for competition in these seg-ments of the industry. By contrast, the generation ofelectricity is now regarded as potentially competi-tive, especially with the advent of the smaller-scalecombined-cycle gas turbine (CCGT) technology.Generation is generally believed to exhibit increas-ing returns of scale at low levels of production andconstant returns to scale otherwise (Armstrong,Cowan, and Vickers 1994: 282). Armstrong andothers report Joskow and Schmalensee’s estimate ofminimum efficient scale for fossil-based plants at400-megawatt capacity.
In the last 10–15 years, the predominant viewhas evolved to favor the introduction of competi-tion into generation and retail supply activities.Some countries, such as Chile and the UnitedKingdom, were pioneers, but the wave of liberaliza-tion has been widespread, covering developing anddeveloped economies alike.
Regulatory Reform in the EU
The European Commission’s effort to liberalizeelectricity markets in the EU was driven primarilyby the quest for a single market, but it was met withresistance by many national governments.2 In 1991the Commission proposed allowing third-partyaccess within the electricity markets of all memberstates, but the Council of Ministers rejected theproposal. By 1993 the concept of negotiated (asopposed to full or regulated) third party accesswas being presented as one of the options underdiscussion. In 1994 France introduced the singlebuyer model as an alternative to negotiated thirdparty access. Eventually, in 1996, an agreementwas reached on a timetable for liberalization, andeach member state was given a choice betweenthe three alternatives for access. The agreement cul-minated in the European Parliament’s electricitydirective.3
Liberalization of the electricity sector wasstrongly supported by the Competition DirectorateGeneral of the European Commission (the formerDG IV) through its threats that no liberalizationwould call for tougher action on the basis of Arti-cles 81 and 82 of the Treaty Creating the EuropeanCommunity (Pollitt 1999: 50).

The Electricity Directive of 1996
The basic idea behind the electricity directive isto introduce competition to the potentially com-petitive segments of the electricity industry—generation and retail supply—and to regulate trans-mission and distribution, which retain naturalmonopoly characteristics. This section examinesfour aspects of the directive: market opening,unbundling, third party access, and public serviceobligations and regulation
Market Opening On the demand side, the direc-tive envisaged market opening targets on the basisof consumers being designated to have freedom tocontract their consumption of electricity (so-calledeligible customers). Thus, according to the direc-tive, each member state would “open” a given andincreasing percentage of its market over the next sixyears. That percentage was to be calculated as theshare, in overall European Community consump-tion, of final customers consuming more than40 gigawatt-hours per year. The threshold was tobe reduced to 20 gigawatt-hours in the secondstage (within three years) and 9 gigawatt-hours inthe third step (within six years). Those thresholdshave been estimated to correspond to market shareopenings equal to 27 percent, 28 percent, and33 percent, respectively, in 1999, 2000, and 2003.4
Each member state was to designate its own set ofeligible customers, but consumers with more than100 gigawatt-hours of consumption were to bedefinitely included in that designation. To addressproblems that might arise if the degree of marketopening differed across states, the directive includedprovisions for reciprocity: a member state has theright to refuse access for companies from states thathave not liberalized to an equal extent.
On the supply side, the directive provided fortwo mechanisms for the development of newcapacity in generation, both aimed at introducingcompetition:
• Authorization. Companies offer to build newpower plants under an open and impartial pro-cedure that decides whether they should goahead.
• Tendering. An authority decides what newcapacity is required. It solicits tenders, whichare then assessed through an impartialprocedure.
Unbundling To prevent discrimination, crosssubsidization, and distortion of competition, thedirective obliged integrated operators to separatethe management of the generation, transmission,distribution, and nonelectricity activities and tokeep separate accounts for each. To ensure nondis-crimination, it envisaged creation of an independ-ent authority for dispute settlement.
Each member state was required to specify atransmission system operator (TSO), whose taskwas to ensure dispatch of a generation plant underfair and transparent rules that did not favor plantsowned by the same company as the TSO. Theunbundling of the TSO was deemed crucial (man-agement, legal, or ownership unbundling).
As for distribution, the system was to operate onthe same nondiscriminatory basis as transmission.
Third Party Access One of the main objectives ofthe directive was to enable independent generatorsto have access to the transmission and distributionnetworks in order to supply final customers. Thedirective prescribed three types of access arrange-ments (but member countries could also choosehybrid arrangements):
• Negotiated third party access (nTPA). Consumersand producers contract directly with each otherand then negotiate with the transmission anddistribution companies for access to the net-work.
• Regulated third party access (rTPA). Access pricesare not negotiated, but rather are published bythe regulator.
• Single buyer model (SBM). There is a singlewholesale buyer of electricity. Competition ingeneration is allowed, but retail competition islimited. Eligible consumers not tied to a specificdistributor or retailer can still contract with pro-ducers. The single buyer pays the producer itsregulated sales price minus network charges.The producer can then compensate the con-sumer so that the consumption prices becomeequal to the contract price.
Public Service Obligations (PSOs) The directivealso recognized that some objectives deemed desir-able from a social point of view may not be achievedthrough unfettered competition. To achieve theseobjectives, the directive provided that memberstates may impose such obligations on electricity
Competition and Regulatory Reform in Turkey’s Electricity Industry 189

undertakings.The objectives mentioned in the direc-tive were security (including security of supply),regularity, quality, price, and environmental pro-tection. The obligations would be defined by themember states.
Progress with Implementation and Proposed Amendments
In March 2001, the European Commission issued acommunication that assessed the progress in devel-opment of the internal market for electricity andthe effects of implementation of the 1996 directive(European Commission 2001a) and proposed aseries of amendments (European Commission2001b). The communication underlined the impor-tance of fully opening energy markets to improvingEurope’s competitiveness. According to the Com-mission, the effects of market opening were posi-tive. However, it also stated that to complete theinternal market, further measures were necessary.The key points of the communication are describedin this section.
By 2000 the average market openness in theEuropean Community had reached 66 percent—afigure higher than the thresholds established in thedirective. However, progress was very uneven acrosscountries. Some countries had full market opening;in others, market opening was limited to 30 per-cent. It also was observed that the reciprocity provi-sions of the directive had proved unable to addressproblems of unevenness in the competitive envi-ronments between member states. There was con-cern that if this unevenness persisted over a longerperiod, a level playing field would not developwithin the internal market.
For access, 14 member states had chosen rTPA;only Germany had selected the nTPA regime. Italyand Portugal had chosen SBM for captive (i.e.,noneligible) customers and rTPA for eligible cus-tomers. Most member states had chosen authoriza-tion as the procedure to elicit additions to genera-tion capacity. However, the ultimate goal ofnondiscriminatory access to the network was notfully achieved. The absence of standard and pub-lished third party access tariffs was thought to be asignificant barrier to entry. Another barrier wasthe absence of effective unbundling in memberstates. Germany and France chose managementunbundling,seven countries chose legal unbundling,
and five countries chose ownership unbundling.Thus effective access required further strengtheningof unbundling.
The communication underlined the benefits ofprogress in competition. Prices for industrial usershad come down in all member states, but largerprice decreases occurred in countries where liberal-ization was 100 percent. Household prices fell,though to a lesser extent overall than prices forindustrial users. Overall, larger reductions occurredin countries in which customers were free tochange suppliers and in which changing supplierswas actually easy to do.
The communication also raised concerns aboutthe pace of cross-border trade: “The objective ofthe Electricity and Gas Directives is the creation ofone truly integrated single market, not fifteen moreor less liberalized but largely national markets.” Itpointed out that even though the number of cus-tomers who switched suppliers rose overall, mostcustomers tended to opt for national suppliers. Ingeneral, cross-border trade was limited. Its expan-sion would require developing appropriate rules onthe pricing of this trade, developing rules for theallocation and management of scarce interconnec-tion capacity, and, where necessary, increasing suchcapacity.
In short, the Commission indicated that therewere “several weaknesses in the current legal frame-work which needed to be remedied if a fully opera-tional internal market for gas and electricity is to beachieved” (European Commission 2001a: 6). Onthe basis of these findings, the Commission devel-oped proposals to amend the directive (EuropeanCommission 2001b). The most important pro-posed amendments were as follows:
• Market opening. Allow all electricity customersfreedom to choose suppliers (end domestic cus-tomer franchise monopoly) by January 1, 2005.This was called the quantitative proposal.
• Unbundling. Strengthen unbundling to legal andfunctional separation of transmission from gen-eration (thus management separation alone wasno longer sufficient, and ownership separationis now appropriately promoted as a form ofunbundling stronger than legal separation).
• Access. Strengthen access by requiring rTPA withpublished tariffs. Do not permit the single buyermodel.
190 Turkey: Economic Reform and Accession to the European Union

• Public service obligations. Make explicit mentionof the obligation that member states shouldensure universal service, defined as “supply ofhigh quality of electricity to all customers intheir territory,” as well as protection of vulnera-ble customers and final consumers’ rights.
• Regulation. Establish an independent regulatoryauthority to approve tariffs and conditions foraccess to transmission and distribution net-works ex ante and to monitor and report to theCommission on the state of the electricity mar-kets (especially supply-demand balances).
The proposals did not prescribe a specific modelfor organization of wholesale activities. Some of theproposals initially met with opposition. In particu-lar, Germany opposed the requirement for anindependent regulator and ex ante regulation ofaccess prices and conditions (Newbery 2002a). Theprinciples of nondiscriminatory access to the net-work, based on transparent and published tariffs,and the establishment of independent regulatorswere adopted by the Barcelona European Council inMarch 2002 (European Commission 2002b). TheBarcelona council also pointed out the need to takemeasures on PSO, in particular for remote areas andvulnerable groups. During their November 2002meeting, EU energy ministers agreed that full marketopening would be achieved in 2004 for nonhouse-hold customers and in 2007 for household cus-tomers (European Commission 2002a). Unbundlingwas to be achieved by July 2004 for transmission and2007 for distribution. The proposed amendmentswere finally adopted in June 2003.5
The Current Structure of Turkey’sElectricity Industry
As in many European countries until recently, theTurkish electricity industry was dominated by astate-owned vertically integrated company, TEK.6
In 1993, in an attempt to prepare TEK for priva-tization, the government separated TEK into theTurkish Electricity and Transmission Company(TEAS) and the Turkish Electricity DistributionCompany (TEDAS).
Background
Beginning in the 1980s, the government sought toattract private participation in the industry. Its
motivation was both the general disposition towardthe private sector that emerged in the 1980s and fis-cal constraints, purportedly to ease the investmentload on the general budget. This effort was con-strained, however, by the constitutional regime thatinterpreted the provision of electricity as a publicservice—that is, something that had to be suppliedby the government. Instead of responding directlyby seeking to remove this constitutional challenge,the governments of the 1980s and 1990s chose tocreate shortcuts7 through various private sectorparticipation models short of privatization. Thefirst law setting up a framework for private partici-pation in electricity was enacted in 1984 (LawNo. 3096).8 This law forms the legal basis for pri-vate participation through build-operate-transfer(BOT) contracts for new generation facilities,transfer of operating rights (TOOR) contracts forexisting generation and distribution assets, and theautoproducer system for companies wishing toproduce their own electricity. Under a BOT conces-sion, a private company would build and operate aplant for up to 99 years (later reduced to 49 years)and then transfer it to the state at no cost.9 Under aTOOR contract, the private enterprise would oper-ate (and rehabilitate, where necessary) an existinggovernment-owned facility through a lease-typearrangement.
In 1994 Law No. 3996 and Implementing Decree5907 were enacted to enhance the attractiveness ofBOT projects. The laws authorized the Undersecre-tariat of the Treasury to grant guarantees and pro-vided tax exemptions (as well as extended thepurview of the model to other public services suchas water and wastewater, transport, and communi-cations).10 An additional law was enacted in 1997for private sector participation in the construc-tion and operation of new thermal power plantsthrough a licensing system rather than concessionaward. The build-operate-own (BOO) law (LawNo. 4283) again provided guarantees by the Trea-sury. Under the BOO model, investors retainownership of the facility at the end of the contractperiod.
A typical BOT, BOO, or TOOR generation con-tract, signed between the private party and TEAS orTEDAS, includes exclusive “take-or-pay” obligationswith fixed quantities and prices (or price formulas)over 15–30 years. Thus it does not provide a frame-work for competition in the market, but only
Competition and Regulatory Reform in Turkey’s Electricity Industry 191

potentially for competition for the market if thecontracts are granted through a competitiveprocess in which the lowest-cost proposals areaccepted. The main benefits, in principle, of suchprivate sector participation contracts arise from(1) transferring those risks to the private sectorthat is best able to manage them (including mostcommercial risk during the operating phase),(2) accessing strong and effective private sectorcommercial and managerial skills for reducedoperational costs and improved service quality, and(3) spurring adoption of innovation at both thedesign and implementation phases of projects. Suchefficiency-related benefits are only likely to arise,however, from competitively tendered projects.Unfortunately, no rigorous framework was in placeto ensure implementation of competitive tendering.On the contrary, under the Turkish BOT model therewas no requirement for prequalification, nor for acompetitive open tender, nor even for a closed tender(the“method of sealed bid from selected companies”merely requires that at least three interested compa-nies submit their offers). Unsolicited bids could bebrought forward and negotiated solely on the basis ofan investor-completed feasibility study (through“the method of negotiation”).
Compounding these problems, under theTurkish BOT, BOO, and TOOR generation modelsthe government has retained most of the commer-cial risks while providing the private sector withsubstantial rewards. Under these contracts, theTreasury has provided guarantees to cover criticalcommercial take-or-pay payment obligations, suchas minimum electricity generation levels and mini-mum quantities of gas in power station gas pur-chase contracts, at associated predetermined pricesin U.S. dollars over the life of the contracts.11
Although the fixed-price nature of the contractscreates incentives for cost efficiencies, the contractspreclude any possibility of making consumers sharein any efficiency gains: all cost savings are appropri-ated by the generator. In addition to the relativelyhigh electricity cost of many of these projects, theBOT and TOOR contracts are heavily front-endloaded with higher capacity charges in the firstyears of operation to allow for early recovery ofinvestment costs (OECD 2002). As discussed below,the current structure of these contracts acts as amajor barrier to the development of competition inthe generation sector.12
A large number of BOT proposals or projectshave not been completed.13 Initially, the mainconstraint was the prevailing interpretation ofTurkey’s constitution—that is, that even thoughLaw No. 3996 stated that BOT contracts would besubject to private law, the Constitutional Courtdecided that electricity was a public service andthat therefore the BOTs were to be considered asconcessions under public administrative law. Thisruling meant that the development and eventualcompletion of a BOT contract required interven-tion and approval from a multitude of governmentagencies, including the Ministry of Energy andNatural Resources (MENR), the High PlanningCouncil (referred to by its Turkish initials, YPK),the State Planning Organization (SPO), and theTreasury. In addition, the public law character ofthe contract meant that investors did not haverecourse to international arbitration and that con-tracts had to be reviewed by Danıstay, the Councilof State, which was a lengthy process.
In August 1999, a constitutional amendmentopened the way for privatization in the electricitysector, for the application of private law to con-tracts, and for limits to the scope and duration ofthe Danıstay review.14 Although the constitutionalamendment (and the subsequent Law No. 4501 ofJanuary 2000, which implemented these changes)simplified the legal framework for private partici-pation, the new obstacle to the development ofBOT contracts was the unwillingness of the Trea-sury to provide new guarantees in light of theimplied contingent liabilities.
By the end of the 1990s, it had become clear thatquasi-privatization with Treasury guarantees wasnot going to be feasible because of the rapidly dete-riorating fiscal stance. In addition, there was widerappreciation that these types of contracts, whichlocked generation companies into long-term exclu-sive sale agreements with predetermined, fixedprices, did not serve the overall objective of develop-ing competition in electricity markets. Several gov-ernment agencies (e.g., MENR, SPO, the Treasury)were already working on the design of a competitiveelectricity sector regulated through an independentagency. In 2001 Law No. 4628 (the electricity marketlaw, or EML) provided a new and radically differentlegal framework for the design of electricity marketsand established a new, independent Energy MarketRegulatory Authority (EMRA).
192 Turkey: Economic Reform and Accession to the European Union

The Current Model
The main drivers for liberalization in Turkey werevery different from those that preoccupied the EUor the leaders of electricity liberalization such as theUnited Kingdom. The EU was primarily concernedwith creating an internal market. Countries such asthe United Kingdom were motivated by the ineffi-ciency of public enterprises (the ownership dimen-sion) and the opportunities generated by techno-logical changes that made competition possible ingeneration (the market structure dimension).15 InTurkey, the main driver of and the public justifica-tion for private participation under the pre-2001regime, and liberalization under the new regulatoryregime, were rapid growth in demand, combinedwith the inability of the government to meet thatdemand through public investments or Treasury-guaranteed private investments because of thedeteriorating fiscal situation.
Still, the degree of competition envisaged in thenew framework is more advanced than the EUdirective of 1996. In most respects, it is compatiblewith (if not more competitive than) the proposedamendments to the directive currently under dis-cussion. As described in the next section, the mainchallenge for Turkey is that, the competitive frame-work notwithstanding, the actual development ofcompetition is likely to take some time because ofthe legacy of Turkey’s recent past: the current struc-ture of ownership (dominance of state-ownedassets in generation) and even more problemati-cally the uncompetitive, tied nature of the contractsgoverning the privately operated assets.
The new regime contained in primary legislationand implementing regulations emphasizes competi-tion in ordering the market. The main principles ofthe EML, and their status in relation to the 1996directive, are as follows.
Market Opening On the demand side, customersthat consume more than 9 gigawatt-hours per yearare designated as eligible consumers who are free tochoose their suppliers—a measure that meets thetargets of the directive. The main operational diffi-culty in market opening is estimating the numberof expected eligible customers, because highernumbers mean more measuring, telemetering, andcomputing hardware and software, which meanslarger investments by wholesale and retail
companies. These costs must be reflected in con-sumer tariffs. As of May 2003, the estimated eligiblecustomers above 9 gigawatt-hours per year were103 at the transmission level and 507 at the distri-bution level, accounting for 13.5 percent of overallconsumption (Sevaioglu n.d.).16 This number islikely to increase, however, because additionalindustrial users are expected to enroll as eligiblecustomers through demand aggregation, with usershaving similar demand characteristics.
On the supply side, the authorization-typelicensing framework established in the new regimealso appears to be fully compatible with the direc-tive. It provides entry opportunities into the gener-ation (independent power producers, or IPPs, andautoproducers who can sell up to a maximum of20 percent of their annual production to consumersother than their shareholders), wholesale trade,distribution, retail trade, import, and export ofelectricity. Distribution companies may also oper-ate as retail sales companies in their regions byobtaining a retail sales license and may import elec-tricity if allowed in their license. Distribution com-panies may establish joint ventures with generationcompanies or set up generation units (not exceed-ing a market share of 20 percent). Transmissionremains a state monopoly, but private generatorscan establish private direct transmission lines. Theonly limitation is that the EMRA’s granting of gen-eration licenses is conditional on no congestion inthe transmission-distribution link connecting thenew plant to the grid or directly to customers.According to EMRA, congestion in the transmis-sion network is most likely to be resolved throughsome type of auctions among the companies thatwould benefit from the transmission investments(Sevaioglu n.d.).
Unbundling TEAS has been further unbundledinto the Turkish Electricity Generation Company(EUAS), Turkish Electricity Wholesale Company(TETAS), and Turkish Electricity TransmissionCompany (TEIAS), each organized as a separatelegal entity. Thus, the degree of unbundling betweengeneration, transmission, and distribution envis-aged and carried out under the EML goes beyondthe minimum directive requirements of manage-ment separation and unbundling of accounts. Thesecondary legislation regulating these activities isbeing prepared by EMRA.
Competition and Regulatory Reform in Turkey’s Electricity Industry 193

Under the new structure, EUAS will take over,operate, or close down the state’s existing powerplants that are not transferred to the private sector.TETAS is created to carry out wholesale operations.It will take over all existing energy sale and purchaseagreements from TEAS and TEDAS (distribution).TEIAS is responsible for transmission assets, for sys-tem operation and maintenance, for planning ofnew transmission investments and building of newtransmission facilities, and, critically, for the balanc-ing and settlement procedure that will balance thepower transactions among parties, both physicallyand financially. Thus, in the words of the directive,TEIAS is the transmission system operator. It isenvisaged that all transmission facilities owned andoperated by other companies will be transferred toTEIAS under the EML. In line with this require-ment, the transmission facilities that had beenawarded to private investors through concessions tothe two companies Kepez Elektrik (Antalya region)and Cukorova Elektrik, or CEAS (Adana, Mersin,Hatay, and Osmaniye regions), were seized by theMinistry of Energy17 and handed over to TEIAS inJune 2003, because the companies had failed tohand them over by February 2003 as required.18
Third Party Access EML requires the rTPAregime for access to transmission and distribution.An independent regulatory authority was createdthat, among other things (see later discussion), willsettle disputes between parties.
Market Design As highlighted in figure 7.1, at theheart of the new regime is a bilateral contractsmarket in which generation companies contractwith wholesale trade companies (TETAS and anyeventual new entrants), distribution companies,any new independent retail companies, and eligiblecustomers (EMRA 2003). On the generation side,EUAS is likely to be split into a hydro generator(holding all state-owned hydro plants transferredfrom DSI, the Directorate General of State WaterWorks) and a small number of affiliate portfoliogeneration companies (holding the state-ownedthermal plants and mobile plant contracts). EUASalso will hold the physical assets associated with anyTOOR (generation) contracts. For any excesscapacity, existing and new autoproducers (genera-tion by industrial facilities for own use) willcompete with other generators for contracts withdistribution companies and independent retailers,
194 Turkey: Economic Reform and Accession to the European Union
Market structure
Distributor 1(incl. supply)
Captiveconsumers
Eligibleconsumers
Distributor 2(incl. supply)
Balancingmarket
TEIASSystem operator
Settlements administrator
EUAS(thermal)
TETAS
TOOR (D)
All hydros
EUAS
BOTs � BOOs TOOR (gen.)Kepez &
CEAS HydroMobile
producersIPPs and
autoproducers
EUAS portfoliogeneration co. 2
Portfoliogeneration (thermal)
Distributor 3(incl. supply)
Independentretailer 1
FIGURE 7.1 Structure of the Electricity Market, Turkey
Source: Modified from Draft Electricity Market Implementation Manual (see EMRA 2003).

and directly with eligible consumers. As illustratedin figure 7.1, the dominant state-owned wholesalerTETAS also holds all previous BOO, BOT, andTOOR (generation) contracts and will assumeother stranded costs such as the debts and employ-ment liabilities of EUAS and TEIAS.19 In fact, deal-ing with stranded costs is one of the main reasonsfor the creation of TETAS.
As for end users, eligible customers may buyelectricity from their regional distributor/retaileror TOOR distributor, but they also may buydirectly from a wholesaler, from a new independentretailer, or from an independent generator. Captivecustomers, by contrast, must buy their electricityfrom a distributor/retailer in their region, but theyhave the right to buy from any retailer carrying outthe same commercial activity in the region—that is,either their existing regional distributor or retaileror TOOR distributor or any other new retailer inthe region.
The current market design does not envisage acentralized pool or power exchange. Therefore,dispatch is separated from the operation of thewholesale market. The actual real-time equality ofdemand and supply, given the bilateral contracts,will be carried out by the system operator throughpurchases and sales in a balancing market. For thispurpose, a market System Balancing and Settle-ment Center20 is to be established within TEIAS.In principle, it is expected that the balancingmarket will make up a small percentage of totaldemand and will be used for adjustments at themargin.
Privatization The new regime envisages eventualdirect privatization in generation and distribution.Transmission assets are to remain under govern-ment ownership. Foreign investors cannot assume acontrolling interest in the generation, transmission,and distribution sectors.
The details of licensing procedures, marketoperation, tariffs, vesting contracts, privatization,and stranded cost mechanisms have been left tosecondary legislation and decisions.
Vesting Contracts Vesting contracts are an initialset of bilateral contracts put in place by the govern-ment between companies it owns (or betweenstate-owned companies and private companiessuch as independent retailers when the governmentdecides the contract structure and when the retailerdecides whether to buy it) to provide a smooth
transition to competitive markets and to improvethe predictability of revenues during this transi-tion. The contracts remain with the companieswhen they are privatized—the private buyer paysfor the company and its package of contracts. Vest-ing contracts are intended to cover a large portionof sales (90–100 percent) of each supplier initially.This share is reduced gradually in later years andreplaced by freely negotiated bilateral contracts asthe vesting contracts expire.
Vesting contracts are expected to include pur-chases by TETAS from all EUAS hydro plants, salesfrom TETAS to all distribution companies and dis-tribution TOORs to cover franchise captive con-sumer demand (with part of hydro capacity avail-able for the balancing market), and sales fromaffiliate portfolio generation companies to all dis-tribution companies.
The main objectives of vesting contracts are asfollows (OECD 2002, EMRA 2003):
• Avoid large physical imbalances or large finan-cial risks to participants.
• Avoid chaotic prices.• Ensure that distribution companies are not
overexposed in the balancing market.• Allow a period of time for learning how the
bilateral market works before distribution com-panies undertake their own contracting.
• Allow companies to be privatized with a set ofmatching purchase and sale contracts so thatpotential buyers can value them.
• Allow government to influence the portfoliomix of generation purchased by each distributorto ensure reasonable regional balance.
• Allow determination of a reasonable flow offunds between companies (e.g., minimum saleslevels for generation companies).
Public Service Obligations The EML under theconsumer support section of Article 13 and the tar-iff regulation under Article 20 allow for an explicitcash subsidy: direct cash refunds to consumerswithout affecting the price structure and the prices“in cases where consumers in certain regionsand/or in line with certain objectives need to besupported.” The mechanism for allocation of thesedirect cash refunds (“amount, procedure andprinciples”) has not been defined in the primarylegislation; it will be established by the Council ofMinisters upon proposal by the MENR.
Competition and Regulatory Reform in Turkey’s Electricity Industry 195

The Independent Regulatory Authority Thenew regime establishes the independent EnergyMarket Regulatory Authority, which is governed byits own board.21 The main functions of the author-ity include:
• Applying and overseeing the new licensingframework
• Preparing and publishing secondary legislationon electricity and natural gas markets22
• Enforcing regulated third party access• Applying a new transmission and distribution
code• Determining eligible customers over time• Regulating tariffs for transmission and distribu-
tion activities (connection and use of system), aswell as provision of retail services to noneligiblecustomers, and the wholesale tariff of TETAS
• Performing tenders for city gas distributionnetworks
• Following the performance of all actors in themarket
• Following and protecting customer rights• Applying sanctions to parties violating the
established rules.
Main Challenges
The actual development of competition in theTurkish electricity market is likely to take timebecause of various challenges and difficulties, espe-cially those related to the exit from the old system.Primary among these challenges is the fact thatmost generation capacity is currently either undergovernment ownership or tied up in take-or-paycontracts that leave no room for competition.Additional challenges lie in the financial difficultiesthat may persist in distribution. Finally, liberaliza-tion will entail significant tariff rebalancing, whichmay pose serious political challenges.
Stranded Costs and Competition in the Generation Market
As of 2002, private generators in Turkey accountedfor a total of about 37 percent of capacity, including12 percent for autoproducers (table 7.1). Under cur-rently committed BOO, BOT, and TOOR contracts(see table)—assuming no privatization in genera-tion, a significant increase in autoproduction capac-ity, but little additional new entry for the foreseeable
196 Turkey: Economic Reform and Accession to the European Union
TABLE 7.1 Turkey’s Electricity Generating Capacity: 2002, 2005, 2010
2002 2005 2010Megawatts Percent Megawatts Percent Megawatts Percent
Non-EUAS plant
Build-own-operate (BOO) 3,830 11.3 5,810 14.4 5,810 13.5Build-own-transfer (BOT) thermal 1,450 4.3 1,450 3.6 1,450 3.4BOT hydro and wind 899 2.7 899 2.2 899 2.1Transfer of operating rights 650 1.9 650 1.6 650 1.5
(TOOR) transferred Mobile 623 1.8 823 2.0 823 1.9Kepez and CEAS 1,120 3.3 1,120 2.8 1,120 2.6Autoproduction 3,944 11.7 5,344 13.2 6,844 15.9Subtotal 12,516 37.0 16,096 39.8 17,956 41.7
EUAS plant
Natural gas 3,983 11.8 3,983 9.8 3,983 9.3Hydro 10,326 30.6 11,685 28.9 12,762 29.7Coal/lignite and fuel oil 6,972 20.6 8,692 21.5 8,692 20.2Subtotal 21,281 63.0 24,360 60.2 25,437 59.1
Total capacity 33,796 100.0 40,455 100.0 43,032 100.0
Note: The forecasts in the table exclude additional hydro plants with signed intergovernmental protocolsscheduled for 2007 and after.Source: ECA 2002.

future—the public sector’s share of capacity willremain at about 60 percent in 2010. Publicly ownedhydro assets alone account for about a third of totalgeneration capacity.
Because a significant share of privately operatedassets are tied to contracts entailing fixed amountsand prices, those assets will not be deployed undercompetitive forces. As highlighted in table 7.1, as of2002 the three BOO plants in operation accountedfor the largest share. Total energy sold by the BOOplants in 2002 was 36.4 gigawatt-hours, or 34.3 per-cent of the total energy purchased by TETAS in 2002.Four natural gas plants, 17 hydroelectric plants,and two wind BOT plants are already in operation.These BOT projects sold 12.7 gigawatt-hours ofenergy in 2002, which accounted for an additional11.9 percent of total TETAS consumption. There-fore, 46.2 percent of all purchases made by TETAS isbased on existing tied BOO and BOT contracts.
Procedures are not complete for an additional30 BOT projects with a capacity of 2,771 mega-watts, and their legal status is still not clear. Theanticompetitive nature of these contracts and theirapparent high cost have roused public reactionagainst them. As for TOORs, two generators (onelignite and one hydro) are operating. TOOR con-tracts accounting for an additional 3,926 mega-watts have not been transferred; their legal status isnot clear (and their transfer would have little effecton available capacity, because they represent exist-ing production).
Stranded costs—that is, the costs incurredwithin the previous market structure that cannotbe economically recovered within a competitivemarket structure—include the high operating costsof old and inefficient generators, long-term powerpurchase agreements with high prices, removal ofproduction subsidies, and high staffing costs (pay-ments of redundancies resulting from the transferof operations to the private sector, including pen-sion liabilities for workers able to retire). Strandedcosts create uncertainty for new investors and riskstifling competition.
Stranded costs have two main sources. The firstis the substantial surplus generating capacity.Reserve margins were over 60 percent in 2002 andmay remain substantially above the minimum25 percent or so required for system security for thenext few years, depending on the evolution ofdemand. This substantial level of excess capacity cre-ates a situation in which facilities have low capacity
factors and thus lower revenues than required torecover full costs. Surplus generating capacity mayhave been driven at least in part by overly opti-mistic demand forecasts, a natural occurrence in asystem in which the costs of substantial publiclypromoted overbuilding are not apparent, and thecosts of underbuilding are immediately obviousand extremely high. The two earthquakes and theeconomic crises that Turkey suffered in recent yearsalso play a significant role in explaining the devia-tion between initial demand forecasts and actualdemand. The second main source of stranded costsis the long-term power purchase contracts betweenthe state and private producers with especially highfront-end costs. The high cost of electricity frommany of these contracts makes it difficult to generatethe required revenues to service these contracts with-out increasing average wholesale and retail prices.
The long-term, Treasury-guaranteed generationcontracts and associated stranded costs have twoimportant implications. The first relates to compe-tition. The prospects for competition among gener-ators are poor for the immediate future unless thereis new entry by IPPs or autoproducers. However,new entry may exacerbate the problem of strandedcosts, because generation capacity is alreadyexpected to be in substantial surplus. Furthermore,the existing finalized BOT, BOO, and TOOR(generation) contracts adversely affect the possibil-ities of market liberalization by preserving anuneven playing field (in which favored generatorsbenefit from state guarantees, privileged tradingrelationships, and noncompetitive pricing, andthereby face substantially fewer market risks), bypreventing pressures on prices from new entry, andby preventing flexible price and quantity adjust-ments to unanticipated market shocks (such as therecent macro crisis).
The second implication has to do with the con-tingent liabilities created for the government. If rev-enues to the electricity sector do not cover paymentsto the Treasury-guaranteed generators, then theguarantees would be activated and payments fromthe government’s constrained budgetary resourceswould be needed to subsidize electricity (whether itis actually used or not). The substantial state-ownedhydro resources that have been developed to date gosome way toward minimizing these potential liabil-ities, because the low cost of hydro can be consid-ered a “stranded benefit” that can be used to helpoffset the sizeable transition-related stranded costs.
Competition and Regulatory Reform in Turkey’s Electricity Industry 197

Indeed, the idea behind initially contracting all state-owned hydro assets to TETAS is to enable it to covera substantial part of the stranded costs through theprofits on sales at market levels of this low-costpower. However, under some low demand scenarios,even with hydro fetching the very low price ofUS$0.002 per kilowatt-hour,23 TETAS may be facedwith a substantial revenue deficit. Under the worst-case but not necessarily zero-probability scenarios,Economic Consulting Associates calculates thesedeficits to be between $100 million and $800 millionannually (adding to a total of $4.1 billion) between2003 and 2010 (ECA 2002: table 29).24
Revenue Deficits, Technical Losses, and Private Participation in Distribution
The main challenge in distribution when trying tocreate competition is to ensure the creation of cred-itworthy entities that can act as counterparts toincumbents and potential entrants on the genera-tion side.
Turkey presently has 33 distribution areas. In afew regions (including those served by Kepez andCEAS, concessions that had permitted operation ofthe networks by private investors have beencancelled. Additional tenders for TOORs were heldfor other regions in 1996. Bidding occurredthrough offers of distribution tariffs over the con-cession period, with the lowest bidder winning.Thus, as for the fixed-price BOT, BOO, and TOORgeneration contracts, any efficiency gains over thefranchise period will not be passed on to con-sumers. In addition, winners had to commit toreducing technical electricity losses; gains or lossesgenerated by changes in electricity losses would beappropriated fully by the company. An additionalproblem with distribution TOOR contracts is thatthey may prevent the subsequent imposition of aharsh efficiency-enhancing, incentive-based tariffformula, because these companies would then loseprofits relative to the initially promised fixed-cost-plus tariffs, and they would therefore seek(and have grounds for) compensation. Finally, tothe extent that the desirable distribution regionswere cherry-picked through the TOOR process,sufficiently marketable and competitive groupingscould not be formed from the remaining regions,and the most desirable subregions could not bematched with least desirable subregions, thereby
jeopardizing distribution privatization and possiblyresulting in nonsalable assets. In 2003 most of thosecontracts were canceled by the Council of State.
The distribution sector suffers from growingoperating revenue deficits, which are driven by elec-tricity theft and nonpayment (about 14 percent oftotal energy purchased by TEDAS with large regionalvariation), technical losses (about 7 percent), and afree or unbilled electricity supply (4 percent, espe-cially street lighting). In member countries of theOrganisation for Economic Co-operation andDevelopment (OECD), the average of electricitylosses (which are driven mainly by technical losses) isabout 8 percent (figure 7.2). Theft and nonpaymentare fundamentally a political economy and distri-bution problem that has implications for rebalanc-ing tariffs.
Tariff Rebalancing, Social Protection,and Industrial Competitiveness
Industrial prices are almost as high as householdprices, unlike in more liberalized markets whereindustrial prices are often less than half those ofhouseholds (lower industrial prices reflect thelower unit cost of delivery of large amounts ofelectricity to industrial customers). According todata on end-user prices, Turkish industry facesone of the highest costs in Europe. However,equally noteworthy is that Turkish householdprices are not particularly high, in the lower end of
198 Turkey: Economic Reform and Accession to the European Union
0
5
10
15
20
25
1984
1985
1986
1987
1988
1989
1990
1991
1992
1993
1994
1995
1996
1997
1998
1999
2000
Turkey
OECD average
Percent
FIGURE 7.2 Electricity Losses of Turkey versus OECD, 1984–2000
Source: OECD 2002.

the range for Europe. Out of 32 countries listed inthe International Energy Agency (IEA) report KeyWorld Energy Statistics 2002, Turkey is the onlycountry (apart from India) in which consumerprices are so close to industrial prices (IEA 2002).Consumer prices are more than double industrialprices in 8 of the 12 EU countries in table 7.2 andin Denmark they are three times higher. The num-bers in table 7.2 suggest that, although large indus-trial users are likely to see substantial pricedecreases from increased competition, householdsand smaller industrial users are likely to see sub-stantial price increases.
This large cross subsidy to households will notsurvive with liberalization, because eligible con-sumers are entitled to switch to lower-cost sourcesunder bilateral agreements, and because less effi-cient or higher-cost regional distribution systems
reflect these costs in user tariffs. This issue of tariffrebalancing toward cost-reflective tariffs, if notproperly handled, could jeopardize the entirereform effort by creating political pressures forbacktracking. Rebalancing will have effects onpoverty and relocation incentives—poorer house-holds in the east are likely to see their prices risemost in the short term, while already overpopu-lated cities in the west with more efficient distribu-tion systems will face somewhat less steep tariffincreases. And it will have effects on employmentand industrial competitiveness—business userswith annual consumption below the threshold,including all small and medium-size enterprises(SMEs), will also likely see substantial price rises.
The recent difficulties over the creation of distri-bution regions reflected the income distributiondilemma faced by the authorities. The agreementreached ultimately among EMRA, MENR, TEDAS,and the Treasury after months of work was rejectedby the government because of intense pressuresfrom localities that did not want to be included inregions designated as high-cost areas. EMRAresponded by proposing instead province-based,cost-reflective retail tariffs. The highest proposedtariff was for Hakkari, which is both one of thepoorest provinces and the one with the highestincidence of theft (Radikal, March 3, 2003).
Wholesale Market Concentration and the Dominant Role of TETAS
In the design of the new market model, the role ofTETAS is critical as an instrument to help resolvetransitional stranded costs through market mecha-nisms, and thereby help protect captive consumersfrom sudden and large increases in wholesaleprices. It is with this purpose in mind that TETASwas designated to hold all legacy state-ownedcontracts and liabilities—including BOT, BOO,and TOOR contracts as well existing import andexport contracts—and play a key role as a whole-saler trader of electricity. The EML requires TETASto be financially viable and authorizes TETAS tocharge a wholesale price sufficient to cover itsstranded cost obligations (based on the weightedaverage costs of the generation plants selling to it,including BOT, BOO, and TOOR plants). However,there is no requirement for profitability on a year-by-year basis. Rather, surpluses and deficits must
Competition and Regulatory Reform in Turkey’s Electricity Industry 199
TABLE 7.2 Retail Prices for Electricity(US¢ per kilowatt-hour)
Electricity Electricityfor for
Industry Households
EU12
Austria 9.21 12.14Belgium 4.77 13.23Denmark 5.97 19.53Finland 3.94 7.89France 3.58 10.17Germany 7.90 16.66Greece 4.31 7.75Ireland 4.62 9.57Italy 9.30 13.42Portugal 6.59 11.77Spain 5.58 14.33United Kingdom 4.96 10.10
Central and Eastern Europe
Czech Republic 4.68 6.11Hungary 5.21 6.98Poland 4.76 8.34Slovak Republic 4.35 6.28
North America
Canada 3.86 6.01United States 4.27 8.50
Turkey 8.05 8.49
Source: IEA 2002.

balance over a reasonable period. The initial con-tracting to TETAS of all state-owned hydro plantsis intended to help it meet this financial viabilitycriterion.
As the holder of the majority of generation con-tracts, TETAS will be the dominant seller in themarket for the foreseeable future. Through itsrights to hydro capacity, TETAS also will be thedominant participant in the balancing market.Given its dominant position, it will be critical thatTETAS be effectively regulated. In the absence ofeffective regulation, TETAS has no incentive tokeep its costs as low as possible, because it passes itscosts fully to captive customers.
In practice, the ability of TETAS to raise thewholesale price to cover its stranded cost obliga-tions is constrained by the prices that could beoffered by new entrants (such as the cost of elec-tricity from a new gas-fired CCGT power plant), tothe extent that new developers are willing to takethe risk of building new power plants over the nextfew years. If the TETAS wholesale price is above theprice offered by IPPs, then distribution companiesand eligible consumers will choose to buy fromIPPs, causing TETAS’s sales to fall. However,because TETAS’s costs have a large take-or-paycomponent from BOT, BOO, and TOOR plants,those costs will remain high as TETAS’s marketshare falls, forcing the company to recover its fixedcosts over a lower level of sales. To avoid such avicious cycle of falling sales and required higherwholesale prices, TETAS cannot afford to charge awholesale price significantly above that offered by anew gas-fired plant.
Interinstitutional Coordination and a NationalElectricity Policy
Turkey’s electricity policy lacks the strong, central-ized leadership needed to take an overall perspec-tive of the electricity reform program—includingtariffs, market structure, promotion of competi-tion, and privatization issues—and to ensure coor-dination of the eight or more entities with separatemanagement teams: MENR, EMRA, PA (Privatiza-tion Authority), EUAS, TETAS, TEIAS, TEDAS, andthe Treasury. It would be highly desirable to achieveconsensus among all main national stakeholdersaround a national electricity policy that presents acoherent strategy for market structure, that out-lines what is meant by competition in Turkey’s
electricity market for the foreseeable future andhow more room could be made for additional com-petition, and that articulates a well-defined endstate for the industry and a strategy for achieving it.
Possible Competition-EnhancingSolutions
Evidence of the benefits of electricity reform israther recent, and most of the detailed studies con-centrate on well-known cases such as the UnitedStates, United Kingdom, and Scandinavian coun-tries. Some studies do not provide strong conclu-sions. For example, a recent study by the OECD(Steiner 2002) fails to find that regulatory variablessuch as third party access and unbundling have asignificant effect on industrial prices. Such vari-ables are found to have an impact on the ratio ofindustrial to residential prices, but this finding maybe capturing the impact of rebalancing rather thanthe impact of the other components of reform.Privatization is found to increase industrial prices.Yet the same regulatory variables are found to havea positive impact on a proxy for efficiency.
Nevertheless, there is a general consensusamong analysts that the key to welfare-enhancingelectricity reform is adequate competition in gener-ation. Efficiency gains, especially those stemmingfrom cost reduction, are easiest to obtain in thissegment of the industry. However, enhancedcompetition is necessary for those efficiency gainsto be passed on to consumers. The rest of this sec-tion discusses some options that can acceleratethe development of competition in the Turkishcontext.
Transitional Regimes for Tackling Stranded Costs
In minimizing and addressing stranded costs, thegovernment will have to consider several options.Lowering and more rapidly resolving strandedcosts will have benefits—in particular, allowing themore rapid introduction of competition. Such astep also would allow a more rapid release of hydroplants for privatization, which would have theadded benefits of enabling generators and retailersto offer more valuable contract shapes and ofproviding flexible energy to the balancing market.Possible options include
• A final resolution of all outstanding nonfinalizedBOT and TOOR generation contracts that does
200 Turkey: Economic Reform and Accession to the European Union

not increase stranded costs. In view of the poten-tial costs to the economy and the electricity sec-tor in both additional fiscal costs and foregonecompetition benefits, it appears to be in thepublic interest not to provide Treasury guaran-tees for most of the nonfinalized BOT andTOOR projects, while remaining open to nego-tiated win-win solutions subject to this con-straint. The basic strategy of EMRA has been toencourage project sponsors to apply for generat-ing licenses and to act according to the dictatesof the new market model. Because of the poten-tial reputational costs to Turkey as a destinationfor foreign direct investment (FDI) inflows fromsuch a unilateral government decision, the gov-ernment should remain open to negotiatingwith project sponsors on a case-by-case basis toseek acceptable solutions that do not burdenTurkey with additional expensive and unneededpower. The broader international impact shouldnot be too negative, as long as the underlyingpublic policy reasons are clearly explained andthe initially agreed-upon contractual terms aremet, including the appropriate compensationbeing offered after arbitration if a negotiatedsolution is not possible.
• Voluntary win-win renegotiation of tariffs. Theexisting BOT contracts are heavily front-loadedwith higher capacity charges in the first5–10 years of operation. By exploring the scopefor nonunilateral improvements to the contractsin the spirit of the basic principles of the EU’s1996 directive, the government could lower thelevel of stranded costs. Possible win-win modifi-cations include lowering the average tariff levelover time and flattening the tariff slope inexchange for removing the “T” (transfer require-ment) in BOT or using alternate approaches toproviding an equity return over a longer period.To facilitate negotiations, the following potentialwin-win modifications that would transform theexisting BOT contracts into IPPs should beunbundled and discussed separately (Sevaioglun.d.): (1) tariff smoothing, flattening the pay-ment curve by retarding the higher payments ofthe first years; (2) ownership transfer, transform-ing the BOT to a BOO model by subtracting thevalue of the assets from the tariff profile;(3) price risk transfer, removing the take-or-pay condition by compensating the differencebetween the agreed-on and estimated stabilized
market price; and (4) volume risk transfer, com-pensating the estimated revenue loss when thecompany fails to find customers paying the sameprice as agreed to in the initial take-or-payclause. The potential for outsiders to challengeany such negotiated solution should be minimal,so long as project sponsors are no better off thanthey were prior to the renegotiation. Strandedcosts also could be reduced by agreeing to lowerthe gas prices charged in individual contracts byBOTAS, the state-owned national gas company.
• Postponing or canceling of nonfinalized intergov-ernmental protocols on hydro. Intergovernmentalprotocols refer to commitments between two ormore sovereign governments for specific invest-ments. To help lower the extent of excess genera-tion capacity on the system, authorities shouldconsider altering the existing pipeline of country-to-country protocols. Because such protocols arepolitical undertakings rather than establishedprivate contractual rights, modifications in linewith unexpected public policy imperatives maybe easier to achieve.
• Low pricing of TETAS-contracted, state-ownedhydro generation assets. By pricing hydro at itsoperations and maintenance cost, TETAS couldreduce the revenues required to pay the strandedcosts. However, depending on the demandscenario, low pricing of hydro may not be ade-quate on its own.
• Stranded cost levy. A levy or additional surchargecould be applied in various ways to obtainrevenue to cover any deficit, but the simplestway would be to apply it to final electricityconsumption. Imposing the levy on final con-sumption ensures that eligible consumers anddistribution companies cannot avoid the levywhen they buy power from sources other thanTETAS. A stranded cost levy may be the easiestand best solution from an economic point ofview. However, the levy would result in anincrease in prices to end consumers: theapproach suffers from the obvious drawbackthat the tariff would raise.
• Sale of hydropower plants. Selling (or leasing)hydropower plants to the private sector andusing these sales revenues to cover the strandedcost deficits is an option that also should beconsidered. This would have an impact similar tothat produced by diluting the high BOT, BOO,and TOOR generation costs with low-cost hydro,
Competition and Regulatory Reform in Turkey’s Electricity Industry 201
but the advantages would be twofold. First, rev-enues would be realized immediately, at a timewhen Treasury resources are particularly con-strained. Second, such an approach would allowmarket liberalization to go ahead more rapidly.However, an important consideration for thegovernment is whether adequate revenues wouldbe realized from the sale of what are potentiallyextremely valuable assets in the balancing mar-ket in the immediate term, or whether higherrevenues could be realized once the marketbegins functioning, once experience accumu-lates on how the new market would value hydroplants and hydro electricity, and once investorconfidence increases with additional regulatoryoversight experience. Yet the benefit of morerapid liberalization or at least a staged privatiza-tion approach with annual auctions for somehydro (either for capacity in, say, 1-megawatttranches of all hydro or for all of a specific plantfor one-year leases) may well outweigh the fore-gone higher revenue proceeds of a later sale, inparticular if the earlier prospect of privatizationhelps to spur better regulatory oversight andother market-friendly policy decisions duringthe shorter preprivatization period (driven bythe pressures of an incipient privatization).
Tariffs and Universal Service
Under the electricity reforms, industrial tariffs areexpected to fall, and household tariffs are expectedto increase from tariff rebalancing. However, in anyassessment of the impact of overall tariff changeson consumer welfare, it is important to take intoaccount the decrease in the prices of all goods in thehousehold consumer basket that will result fromthe lower cost of this key intermediate input.More generally, efficiency gains from cost-reflectiveprices are expected throughout the economy.
To mitigate the effect of rising household tariffs,the first priority should be to reduce costs by elimi-nating theft and nonpayment rather than byadjusting household tariffs upward by the fullmargin required to cover costs (inclusive of theftand nonpayment). In addition, a means-tested sys-tem is needed to provide support to those who can-not afford the higher retail prices and are eligiblefor such social protection (in part replacing thecurrent reliance on theft and nonpayment of bills
as a social safety net). Such support has fiscal impli-cations for forthcoming budgets. It also requiresthe implementation of workable eligibility anddelivery mechanisms.
As part of a possible policy solution, the EMLand the tariff regulation allow an explicit cash sub-sidy under a mechanism to be established by theCouncil of Ministers. Provisional Article 12 of thelicensing regulation allows vesting contracts, whichcould be bundled in order to offer lower-costcontracts to higher-cost distribution regions andthereby ease cross-regional adjustment. One addi-tional mechanism that might help to ease the costburden on residents in the eastern part of Turkey isthe use of meters with a three-term tariff structure.By using such meters, the electricity sector couldoffer extremely low prices during off-peak periodsand thereby help to reduce illicit utilization.
Cross-Border Trade and the Benefits of EU Accession
EU countries have reported benefits from adoptingthe electricity directive, but problem areas remain(European Commission 2002c):
• Differential rates of market liberalization. By2002, five countries had implemented 100 per-cent market liberalization, but the rest hadopened up less than 60 percent of their markets.Indeed, Denmark, France, and Greece hadopened up only 35 percent of their markets.
• Disparities in access tariffs between network oper-ators. Because of a lack of transparency causedby insufficient unbundling (e.g., managementor accounting but not legal or ownership sepa-ration) and inefficient regulation, these dispari-ties may form a barrier to competition.
• The high level of market power among existinggenerating companies associated with a lack of liq-uidity in wholesale and balancing markets. Suchhigh market power impedes new entrants. Forexample, only in three member states do the topthree companies have less than 50 percent mar-ket share; in nine member states the top threecompanies have more than 75 percent marketshare. Large divergences in prices continue toexist across member states.
A central implication of the full internal marketis that an important source of competition in
202 Turkey: Economic Reform and Accession to the European Union

countries where the generation market is con-centrated would be cross-border transactions.However, the ratio of import capacity to installedcapacity is more than 25 percent in only four outof the 15 EU countries to date. A heavier relianceon cross-border transactions requires better cross-border arrangements. The problem is insufficientinterconnection infrastructure between memberstates and, where congestion exists, unsatisfactorymethods for allocating scarce capacity. But it isencouraging that participants in the sixth Florenceforum in September 2001 agreed on commonguidelines on congestion management. There hasbeen more progress on cross-border tariffication.Since the adoption of a temporary mechanism forcross-border electricity exchanges in March 2002,EU market players involved in cross-borderexchanges no longer have to pay a series of uncoor-dinated charges to transmission networks (“pan-caking”) because all transit and import chargeshave been removed. Under the new regime, only asingle export charge is allowed (€1 per megawatt-hour). Nevertheless, the European Commissionremains worried about the pace of development ofcross-border trade. By the end of 2000, four yearsafter adoption of the electricity directive, the physi-cal cross-border trade in electricity did not exceed8 percent of total consumption, which left “theEU far from a real, competitive internal market”(European Commission 2002c: 22)
As for Turkey, obstacles to increased cross-border trade include:
• Operating standards and interconnector capacity.Currently, Turkey does not comply with themain continental European UCPTE (Union forthe Coordination of Production and Transmis-sion of Electricity) operating standards, andtherefore it cannot connect its network synchro-nously. In 2006 Turkey is expected to be part ofthe UCPTE network. A 400-kilowatt overheadline to Greece is expected to be commissionedby 2006 (with a subsea cable connecting Greecewith Italy and the Western Europe network). Aconnection exists with Bulgaria when a portionof the Turkish network in Thrace is discon-nected (according to the OECD, imports fromBulgaria account for 3 percent of domesticconsumption).
• Cross-border transmission pricing and settlementcoordination. The tariff framework for cross-
border transactions is not yet very well devel-oped, so it is still organizationally and economi-cally difficult for individual electricity customersto choose suppliers situated in another EUmember state, although proposals for morerefined systems of cross-border pricing are beingdeveloped.
• Technological transmission losses over distance.Absent a DC (direct current) direct transmissionlink (like the one between Greece and Italy), thecost of running electricity through intermediarytransmission networks makes shipping elec-tricity from Turkey to France or the UnitedKingdom prohibitive. Therefore, trade in themedium term will remain fairly localized, possi-bly including Greece, Italy, and Bulgaria-Romania. Because Turkey has lower-costendowments than neighboring countries, it islikely that the eventual flow will be from Turkeyto neighboring countries, implying a gradualincrease in Turkish prices as low-cost assets arefully utilized.
Without a doubt, one of the most significantbenefits of EU accession for Turkey in the electric-ity sector would be the stability provided byanchoring Turkish regulations and practices to EUnorms and practices. Because of the degree of polit-ical instability in Turkey (especially, until recently,the predominance of coalition governments and theshort tenure of governments), and because in thepast the discretionary authority of the state has notalways been used in the clear interest of the public(the existing stranded contracts in electricity are anexample), the European anchor will provide astrong signal of discrete and irreversible regimechange from past practices that may have causedconcern among both foreign and domestic playersin the electricity industry. The confidence-boostingeffect on potential investors, who otherwise maycontinue to be reluctant to enter the Turkish elec-tricity market, is likely to be significant.
Privatization and Entry Promotion Strategies for Generation and Distribution Assets
It has been asserted that one of the worst fea-tures of EU electricity reforms until the recentproposals was the continued presence of verticalintegration—in Europe, common ownership of
Competition and Regulatory Reform in Turkey’s Electricity Industry 203

generation and distribution is increasing. Verticalownership separation or unbundling of distri-bution from generation at the time of privatiza-tion seems to have become the consensus approachin the rest of the world; it has been adoptedsuccessfully in England/Wales, Latin America(Argentina, Bolivia, Chile, Colombia, El Salvador,Guatemala, and Peru as the most-cited examples),several transition economies, and Australia andNew Zealand. Malaysia and many EU countries areexceptions to this pattern.
The recent crisis in California, however, raiseddoubts, including in Europe, about the stabilityand viability of unbundled electricity markets(Newbery 2001, 2002a). It has been argued that gen-erating companies in California had the incentivesand ability to behave strategically, withhold capac-ity, and thereby manipulate and increase wholesaleprices (although other factors were at work as well,including flawed market design—see box 7.1). Bycontrast, it is argued that integration of generationwith distribution eliminates these incentives andcreates a more stable market structure.
An assessment of which way to go must includeweighing the benefits of mitigating the wholesaleprice risk that vertical integration can provideagainst the costs of foregone competition and fore-gone effective regulation. The arguments point tovertical separation as the preferred initial configu-ration, allowing markets to reconfigure assets at alater stage if desirable (subject to oversight bythe competition authorities). Whether Turkey’s state-owned thermal generation plants should beprivatized as a small number of bundled portfoliocompanies or sold as separate units depends at leastin part on how geographically apart from eachother they are.
Mitigating Wholesale Price Risk The recent rushtoward vertical mergers in England/Wales has beendriven at least in part by their move from a compul-sory, single-price power pool to a bilateral contractsframework in which there would no longer be asingle price for the delivery of electricity at anyparticular time but rather directly negotiated pricesbetween buyers and sellers (and substantial penal-ties for generators and customers who deviatefrom their contracted levels). The wholesale pricerisk that arises in a bilateral contracting environ-ment translates directly into profit risk in an
unbundled structure: a high price shifts profits togenerators and away from the retailing business,and a low price benefits retailing at the expense ofgenerators. This risk can be reduced by verticalintegration in which generators are assured of acaptive market. Vertical integration also reduces thetransaction costs of contracting, as well as the riskof failing to find a buyer and thus being forced intoa distress sale in the short-term balancing market.Yet the larger the share of the market covered byvertically integrated companies, the harder newentry will be and the more disadvantaged will bethose companies that remain nonintegrated.
Developing Competition Where Possible If akey objective of reform is to stimulate the stableprovision of low-cost, low-priced electrical energy,international evidence suggests that sufficient com-petition is the best means to achieve it. A negativeaspect of vertical integration is that the monopolistdistributor will, in many circumstances, be able toincrease its profits (together with delayed innova-tion) at the expense of society by favoring its ownintegrated generating companies over more efficient(existing and potential that may not enter) genera-tors. Ownership separation removes the incentivefor market foreclosure. Although there remaineconomies of scope between generation and trans-mission/distribution that may suggest benefits fromfull vertical integration, there is also substantial evi-dence that the benefits of unbundled competitionmay be substantial. A telling example is the earlyexperience of Scotland, where the two producerswere privatized as vertically integrated companies,and England/Wales, where there was strict verticalseparation at the time of privatization. Prior to thereforms in 1990, prices in Scotland were about8 percent lower than those in England/Wales. In2000, Scottish prices were 5 percent higher, a swingof 13 percent (OECD 2001).
Facilitating Effective Regulation If the regula-tors of the distribution monopolies are unable todetect or prevent discriminatory treatment towardfavored generators, many of the benefits of compe-tition would be lost, casting doubt on the benefitsof the overall liberalization project. Vertical owner-ship separation facilitates the job of the regulatorby removing incentives for nontransparent transferpricing, differential quality of access to the wires, or
204 Turkey: Economic Reform and Accession to the European Union

Competition and Regulatory Reform in Turkey’s Electricity Industry 205
BOX 7.1 California’s Electricity Crisis
In 1996 the California electricity industry under-went a fundamental restructuring. Beforereforms, three vertically integrated utilitiesowned and operated generation, transmission,and distribution assets. Retail prices were regu-lated by the state, and wholesale prices wereregulated at the federal level by the FederalEnergy Regulatory Commission (FERC). Priceswere higher than U.S. averages, a situation thatwas blamed on the vertically integrated structureand long-term contracts with independent powerproducers (IPPs). Thus, the public demandedreform.
The most important features of the Restruc-turing Law of 1996 were as follows:
• Customers could choose a competitiveelectricity service provider (ESP) or buydefault service from the local utility distri-bution company (UDC).
• Incumbents were required to provide com-peting generators, wholesale marketers,and ESPs with open access to their trans-mission and distribution networks at regu-lated prices.
• The UDC default service price was set equalto the wholesale spot market prices deter-mined in the day-ahead real-time markets.
• A retail rate freeze of a maximum of fouryears was set to recover the stranded costsof generating assets (the assumption wasthat wholesale prices would be lower thanfrozen retail levels).
• The California Independent System Opera-tor (ISO) and California Power Exchangewere created.
• The two largest investor-owned utilities(IOUs) were ordered to divest at least halfof their fossil fuel generating capacity.
• The IOUs were required to meet defaultservice obligations by purchasing from thespot market (i.e., they had to sell powerfrom their remaining assets and then buy itback to meet their default servicedemand). They were “short” for the differ-ence between what they could sell andwhat they had to meet in terms of defaultdemand; and they were not allowed tohedge by forward contracts with genera-tors, because it was feared that such con-tracts could be anticompetitive.
Market design represented a series of inco-herent and fragmented compromises between
interest groups (bits and pieces from differentdesigns) rather than a well-thought-out strategy.It also was very complicated. The design reliedmore on individual generator owners to makecommitment and dispatch decisions and tomanage congestion based on their self-interests(in that sense, it was closer to the “New TradingArrangements” in the United Kingdom than theprevious pool system). Meanwhile, seriousepisodes of horizontal market power problemsbegan to emerge: because of the rigid capacityconstraints, small amounts of withheld capacityresulted in large price increases. But thebuildup of new capacity turned out to be veryslow, and California found itself also experienc-ing a rapid increase in demand. In response,the IOUs became increasingly reliant on thespot market. Customer switching to ESPs wasslower than expected, which meant largedefault service obligations for the IOUs. Theban on hedging contracts made their situationeven more difficult. As a result, a large portionof demand was served through the volatilewholesale market.
The meltdown of the system was triggeredby dramatic increases in the wholesale pricesthat utilities had to pay. The main reasons for theincrease were rising natural gas (input) prices, alarge increase in demand (due to abnormallyhot weather, high economic growth), reducedimports, and rising prices for nitrogen oxideemissions credits. In addition, there were seriousmarket power problems. It has been estimatedthat about a third of price increases were attrib-utable to market power and strategic behavior byplayers. High prices also further distorted incen-tives. For example, ESPs lost incentives to sell inthe retail market because they could increaseprofit by selling in the wholesale market.
Because retail prices were frozen, the utilitiesbegan to experience financial problems andcreditworthiness declined. Their requests toincrease retail prices were turned down by thestate regulator. Finally, they went bankrupt. Thestate government practically took over supply.
Bad luck played an important role in theCalifornian crisis in the sense that a large num-ber of adverse events jointly triggered wholesaleprices. However, flawed design and existence ofmarket power made the system vulnerable toadverse shocks.
Sources: Joskow 2001; Cabral 2002.

other discriminatory treatment between distribu-tors and generators, and thereby making it easierfor regulators to get information about the trueunderlying costs and to secure fair access to the net-works. The much more difficult task of effectivelyregulating vertically integrated companies, if that isto be an outcome preferred by the markets at a sub-sequent stage, should only be attempted by moreseasoned regulators after a significant period oflearning-by-doing in an unbundled environment.
As for sequencing, it is appropriate first to priva-tize distribution companies and ensure commercialmanagement of those assets. This approach willallow the creation of financially viable companiesthat, in turn, allow private generators to structurebankable projects without government guarantees.
According to Newbery (2002a, 2002b), four con-ditions must be met for unbundled electricity mar-kets to create socially beneficial outcomes. The firstis that potential suppliers must have access to thetransmission system. Access is best achieved byunbundling transmission from generation andsecuring third party access, both of which are satis-fied in the Turkish design.
The second condition is the existence of ade-quate and secure supplies of electricity, whichimplies the existence of adequate transmission andgeneration capacity. This condition also seems tobe satisfied in the Turkish case, at least in the shortto medium term, because of the substantialamounts of excess capacity available at present.
The third condition is the presence of a suffi-cient number of untied generation companies, sothat generation is truly competitive. This situationis perhaps the most problematic in the currentTurkish context because of the sizable amount ofgeneration capacity that is either state-owned orhas tied quantities and prices through long-termcontracts. Thermal generation assets under publicownership can, in principle, be regrouped prior toprivatization to create a number of viable compa-nies. These affiliate portfolio generation companiescan be granted managerial and financial independ-ence so that they can perform their activities inaccordance with more competitive conditions evenprior to privatization. This situation would bedesirable in any case in order to put at least a mini-mum amount of structurally based competitivepressure on existing state-owned thermal plants forincreased productive efficiency and lower costs.
However, the weight of tied generation assets thathave been contracted to private parties throughBOT, BOO, and TOOR contracts may continue toprevent sufficient competition from emerging forsome time, particularly to the extent that hydroassets also remain contracted to TETAS over themedium term to ensure its financial viability. Inthis area, bold policy measures that reduce strandedcosts and allow earlier hydro release to the marketcould yield substantial benefits.
An alternate but complementary way in whichto increase competition and reduce market powerin generation markets is through policies that workon the demand rather than the supply side byincreasing the elasticity of demand—that is, bypromoting stronger customer response to pricechanges. Traditionally, all customers pay fixedprices (for industrial customers, these are based onannually negotiated fixed-price contracts) that mayvary in a mutually agreed-upon manner on a dailyor weekly basis, but independent of fluctuations inwholesale prices. As a result, the drop in demand inresponse to a rise in market price is negligible,greatly facilitating the exercise of market power.The key here is to induce customers to reduce con-sumption when prices rise. Two options are possi-ble. For the first, interruptible contracts, which givethe electricity supplier the right to curtail supply orto ripple off specific appliances for short periodsof time when price exceeds some level, could bepromoted—if necessary through subsidies becauseof their positive externality—for customers whocan switch to other fuels or self-generation. Butthe preferred option, again promoted throughsubsidies if necessary because of their positivespillover, is to subject customers, especially thelargest, to real-time (time-of-use) metering andbilling. Once end users receive the technology notonly to observe but also to respond to real-timeprices, they are empowered to modify their pur-chasing habits accordingly.
A powerful additional mechanism for enhanc-ing customer response to price changes is the pro-motion of competition in retail activities. As dis-cussed earlier, the EML allows for several retailcompanies to undertake activities in a distributionregion along with the retailer that belongs to thedistribution company.
Newbery’s fourth and final condition is that theliberalized markets should be adequately regulated.
206 Turkey: Economic Reform and Accession to the European Union

This condition means, among other things, that reg-ulation should not be limited to naturally monopo-listic segments, but also should include wholesalemarkets. The argument here is that relying solely onex post competition policy remedies to disciplinestrategic behavior in wholesale markets may beinsufficient for preventing large welfare losses.Instead, regulators may need competition powers toensure that pricing in wholesale markets does notdeviate too much for too long from costs.25 This areaseems to have been overlooked in the proposedamendments to the electricity directive in Europe.
In the Turkish market design, the wholesale tar-iff applicable to electricity sales by TETAS will beregulated to reflect TETAS’s average purchaseprices as well as its financial obligations (see Provi-sional Article 1 of the electricity market tariff regu-lation). In addition, the vested contracts discussedearlier should prevent high volatility as the non-TETAS segment of the market develops. Because ofthe initial monopolistic structure of the wholesalemarket in Turkey, it is appropriate that the behaviorof TETAS be closely regulated. However, as notedearlier, it may be desirable that the regulator begranted additional oversight powers over thewholesale market even as the dominant power ofTETAS dissipates over time.
Conclusion
It will take some time before electricity reform inTurkey starts showing benefits that are appreciatedby consumers. In fact, in the short run someconsumers may be adversely affected as measuresare undertaken to correct for past mistakes. Yet theslow pace of market development may be turnedinto a blessing. Electricity reform of the Turkishtype is radical and entails huge uncertainties. Theslow pace of liberalization stemming from inheritedstranded costs should allow market players and reg-ulators alike to experiment and adjust the ruleswherever necessary.
Notes
1. The authors are grateful for extremely helpful writtencomments on an earlier draft provided by Osman Sevaioglu,board member of Turkey’s Energy Market Regulatory Authority,and for additional feedback from conference participants.
2. This section builds on Pollitt (1999) and Newberry(2002b, 2002c).
3. Directive 96/92/EC of the European Parliament and of theCouncil of 19 December 1996 Concerning Common Rules forthe Internal Market in Electricity. The text of the directive, aswell as the accompanying explanatory memorandum andproposed amendments (discussed later in this chapter), canbe found at http://europa.eu.int/comm/energy/en/elec_single_market/index_en.html.
4. See the guide to the electricity directive at http://europa.eu.int/comm/energy/en/elec_single_market/memor.htm.
5. See “Directive 2003/54/EC of the European Parliament andof the Council of 26 June 2003 Concerning Common Rules forthe Internal Market in Electricity and Repealing Directive96/92/EC.” The new directive is available at http://europa.eu.int/comm/energy/electricity/legislation/index_en.htm.
6. For background on the Turkish electricity sector, seeKulalı (1997), Zenginobuz and Ogur (2000), and OECD (2002).
7. OECD (2002) calls this “policy work-arounds.”8. The law is titled Law Concerning the Authorization of
Enterprises Other than Turkish Electricity Authority for the Pro-duction, Transmission, Distribution and Trade of Electricity.
9. In practice, most BOT contracts have been for 20 years.10. Law No. 3996 is titled Law for Certain Investments and
Services to be Carried Out under the Build-Operate-TransferModel. The scope of the BOT model under this new law (Article 2)appears to limit its application to greenfield projects and torequire TOOR projects for existing assets to be governed by theprivatization law (Law No. 4046, also dated 1994). The electric-ity sector was removed from the domain of Law No. 3996 in1994 (through Law No. 4047), but was reinstated in 1999(through Law No. 4493).
11. The take-or-pay element of the contracted gas variesfrom contract to contract, but on average it is 80 percent, imply-ing, for example, that in 2005 some 33 billion cubic meters of gasmust be purchased whether needed or not (ECA 2002).
12. Although there now is general agreement that these con-tracts are not in the best public interest, it is still not clear whythey were awarded in the first place. One explanation, men-tioned earlier in this chapter, is that the government saw anurgent need to attract private investors (both to deal with fiscalconstraints and to reduce state dominance), and that it had topay high risk premiums because of macroeconomic uncertaintyand, in general, weak protection of property rights. Others arguethat that view is naïve, and they point to lobbying and capture byinvestor groups and weaknesses in checks and balances.
13. The evolution of BOT and TOOR projects in generationand distribution is further discussed later in this chapter.
14. Law No. 4446 Regarding Amendments on Certain Arti-cles of the Constitution of the Republic of Turkey, published inthe Official Gazette on August 14, 1999.
15. Many authors also point to the Conservative Party’soverall—ideological—dislike of government intervention in theeconomy (see, e.g., Newbery 2001).
16. Data provided by Osman Sevaioglu, board member,EMRA, May 11, 2003.
17. EML Article 2.b states that TEIAS is to take over all “pub-licly owned” transmission facilities. A communiqué issued byEMRA in November 2002 envisaged the transfer of all transmis-sion assets to TEIAS by December 31, 2002. This deadline wasmoved a month by the decision of the board of EMRA (Com-muniqué on the Amendments of Contracts of UndertakingsActive in More than One Market and on Transfer of Transmis-sion Activities and Activities Which Are to Be WithdrawnFrom). Apparently, CEAS and the government disagree aboutthe ownership of transmission facilities that were operated byCEAS.
Competition and Regulatory Reform in Turkey’s Electricity Industry 207

18. All production, distribution and commercial facilities ofthese two companies were also seized in June 2003, on groundsthat the companies persistently violated provisions of the TOORconcession agreements that they had signed with the govern-ment to run the power stations and distribute electricity.
19. Stranded costs are those incurred within the previousmarket structure that cannot be economically recovered withina competitive market structure.
20. In the English translation available on EMRA’s Web site,it is called the Market Financial Reconciliation Center.
21. The EML provided for an authority responsible for regu-lating the electricity sector. This provision was changed, how-ever, through Law No. 4646 (the natural gas market law), whichdesignated a single authority for both the electricity and gassectors.
22. For the electricity market, EMRA has issued, amongother things, regulations on licensing, tariffs, exports andimports, and eligible consumers, as well as a grid code and a dis-tribution code. These are available at http://www.epdk.gov.tr/english/regulations/electricity.htm.
23. All dollar amounts are U.S. dollars unless otherwiseindicated.
24. The worst-case scenario entails demand growth at levelsprojected by the Organisation for Economic Co-operation andDevelopment (OECD), which are lower than those projected byMENR and with all pending BOT and TOOR projects goingahead. In addition to assumptions on demand, results also aresensitive to the assumed level of wholesale prices that mightemerge with new entry (lower wholesale prices will create largeroperating deficits for the relevant generation plants selling toTETAS) and to the assumed minimum unavoidable costs of thestate-owned plants that must be covered (sustainable operatingcost levels, rather than those required just to cover operationsand maintenance, fuel, and debt service costs, could lead to rev-enue deficits even with the higher MENR demand levels).
25. For example, in the United States FERC has a statutoryresponsibility to ensure that prices are “just and reasonable,”which gives it the authority it needs to replace market-determined prices with regulated prices. See the discussion inNewbery (2002b).
References
Armstrong, Mark, Simon Cowan, and John Vickers. 1994. Regu-latory Reform: Economic Analysis and British Experience.Cambridge, MA: MIT Press.
Cabral, Luis. 2002. “The California Energy Crisis.” Japan and theWorld Economy 14: 335–39.
ECA (Economic Consulting Associates). 2002. “Turkey PowerSector Review Study.” Draft, October.
EMRA (Energy Market Regulatory Authority). 2003. ElectricityMarket Implementation Manual. Ankara.
European Commission. 2001a. Communication from the Commis-sion to the Council and the European Parliament: Completing theInternal Energy Market. COM(2001)125 final, March 13, 2001.http://europa.eu.int/comm/energy/en/elec_single_market/index_en.html.
————. 2001b. Proposal for a Directive of the European Parlia-ment and the Council Amending Directives 96/92/EC and98/30/EC Concerning Rules for the Internal Markets in Electricityand Natural Gas. COM(2001)125 final, March 13, 2001.http://europa.eu.int/comm/energy/en/elec_single_market/index_en.html.
————. 2002a. “Energy Council: Loyola de palacio. EuropeanEnergy Market Revolutionized.” EC Press Release, IP/02/1733, November 26.
————. 2002b. “Presidency Conclusions Barcelona EuropeanCouncil 15 and 16 March 2002.” EC Press Release, C/02/930,March 20.
————. 2002c. “Second Benchmarking Report on the Imple-mentation of the Internal Electricity and Gas Market.” SEC(2002)1038, Brussels, January 10.
IEA (International Energy Agency). 2002. Key World EnergyStatistics 2002. Paris.
Joskow, Paul. 2001. “California’s Electricity Crisis.” OxfordReview of Economic Policy 17(3): 365–88.
Kulalı, Ihsan. 1997. Elektrik Sektöründe Özellestirme ve TürkiyeUygulaması [Privatization in the Electricity Sector andApplication to Turkey]. Ankara: DPT Uzmanlık Tezi.
Newbery, David M. 2001. “Regulating Unbundled NetworkUtilities.” http://www.econ.cam.ac.uk/dae/people/newbery/files/dublin.pdf.
————. 2002a. “Mitigating Market Power in Electricity Mar-kets.” http://www.econ.cam.ac.uk/dae/people/newbery/files/rome.pdf.
————. 2002b. “Problems of Liberalising the ElectricityIndustry.” European Economic Review 46: 919–27.
————. 2002c. “Regulatory Challenges to European Electric-ity Liberalization.” Department of Applied EconomicsWorking Paper No. 0230, University of Cambridge.
OECD (Organisation for Economic Co-operation and Develop-ment). 2001. OECD Review of Regulatory Reform, UK. Paris.
————. 2002. “Regulatory Reform in Electricity, Gas andRoad Freight Transport.” Background paper for OECDReview of Regulatory Reform: Regulatory Reform in Turkey.http://www.oecd.org/regreform/backgroundreports.
Pollitt, Michael. 1999. “Issues in Electricity Market Integrationand Liberalization.” In A European Market for Electricity, ed.Lars Bergman, Gert Brunekreeft, Chris Doyle, Nils-Henrik M.von der Fehr, David M. Newbery, Michael Pollitt, and PierreRegibeau. London: Centre for Economic Policy Research.
Sevaioglu,Osman.n.d.“Discussion Notes on the Paper:‘Competi-tion and Regulatory Reform in the Turkish Electricity Sector.’”Middle East Technical University.
Steiner, Faye. 2002. “Regulation, Industry Structure andPerformance in the Electricity Supply Industry.” EconomicsDepartment Working Paper ECO/WKP(200)11, Organisa-tion for Economic Co-operation and Development, Paris.
Zenginobuz, Ünal, and Serhan Ogur. 2000. “Türkiye ElektrikSektöründe Yeniden Yapılanma, Özellestirme ve Regülasyon”[Restructuring, Privatization and Regulation in the TurkishElectricity Sector]. In Devletin Düzenleyici Rolü [The Regu-latory Function of the State], ed. Izak Atiyas. Istanbul:TESEV Publications.
208 Turkey: Economic Reform and Accession to the European Union

The Present Situation in the Turkish Gas Market
The Turkish natural gas market is still an emergingone. Turkey has limited gas resources, and it beganproduction and distribution only in 1976. A con-siderable part of the country is still not served bynatural gas.
The use of natural gas by industry is also rela-tively new. It began in 1989—after the initiation ofgas imports from the Russian Federation and israpidly growing. Demand in the power generationsector is expected to grow even more rapidly, dou-bling between 2001 and 2010. In 2001 total gasdemand was 15.5 billion cubic meters. Of this, thepower industry accounted for about 10.6 billioncubic meters, followed by residential demand atabout 2.7 billion cubic meters and industry demandat 2.0 billion cubic meters.2
Between 1990 and 1998, the average annualprimary gas demand increased by 15.3 percent,with peak growth of 18.4 percent in 1999. Pastgovernment forecasts had predicted that demandwould grow by almost 26 percent per year between1999 and 2005; for the next 15 years it was expected togrow at a rate of between 3.5 percent and 4 percent.Figures published recently by Turkey’s state-owned
This chapter focuses on Turkey’s natural gas mar-ket and the regulatory reforms recently adopted toliberalize the sector and comply with EuropeanUnion (EU) requirements for accession.1 To thisend, the first section of the chapter analyzes thepresent situation of the gas market from the pointof view of its structural parameters—that is, thestructure of its demand and supply and the presentstatus of its import and export interconnectionsand national networks, as well as its future develop-ment. The section then goes on to analyze theissues related to the long-term take-or-pay con-tracts by the national transportation company andtheir impact on liberalization. The second sectionof this chapter addresses questions related to thepresent ownership and industry structure, and itcompares the Turkish case with that of some EUcountries. In doing so, the section discusses simi-larities with other emerging gas markets as well asdifferences with more mature markets. The thirdsection is devoted to regulatory reforms. It analyzesthe new Turkish gas law and compares it with thesolutions adopted in selected EU countries, withparticular reference to the gas release program andmeasures that might be taken to limit the marketpower of the incumbent. A concluding sectionfollows.
209
8Institutional
Endowment andRegulatory Reformin Turkey’s Natural
Gas Sector
Maria Rita Mazzanti and Alberto Biancardi
gas company, BOTAS, indicate that the companyexpects the Turkish gas market to double in size overthe next years, with 55 cities receiving natural gas forthe first time. Many independent observers haveexpressed doubts about these figures, however. Theybelieve BOTAS’s demand forecasts were overly opti-mistic and point to the fact that subsidies andbelow-cost pricing would have to be phased out dur-ing the process of liberalization of the energy sector.
Import and Export Infrastructure and Future Developments
The state-owned company, BOTAS, has enjoyedmonopoly rights for oil and gas pipeline trans-portation, as well as for import, export, and whole-sale trading, since 1987. BOTAS owns seven naturalgas pipelines and related facilities: RussianFederation–Turkey Natural Gas Main TransmissionLine, Marmara Ereglisi Liquefied Natural Gas(LNG) Import Terminal, Izmit-Karadeniz EregliNatural Gas Transmission Line, Bursa-Çan NaturalGas Transmission Line, Çan-Çanakkale Natural GasTransmission Line, Eastern Anatolia Natural GasMain Transmission Line, and Karacabey-Izmir Nat-ural Gas Transmission Line.
In view of the expected rapid increase in naturalgas consumption, in 1984 the government ofTurkey signed an intergovernmental agreementwith the former Soviet Union. Consequently, in1986 BOTAS and SOYUZGAZEXPORT signed anatural gas sale and purchase agreement for a 25-year period. Natural gas began flowing toTurkey in 1987, and the volume transported gradu-ally increased, reaching 6 billion cubic meters peryear in the plateau period in 1993.
The 842-kilometer Russian Federation–TurkeyNatural Gas Main Transmission Line enters Turkeyat Malkoçlar at the Bulgarian border and then fol-lows the Hamitabat, Ambarlı, Istanbul, Izmit,Bursa, Eskisehir route to reach Ankara. The maindispatching center is located in Yapracık-Ankara.Construction of the pipeline began on October 26,1986, and the line reached Hamitabat on June 23,1987. Since then, imported natural gas has beenused together with domestic gas for power genera-tion at the Trakya Combined Cycle Power Plant inHamitabat. The pipeline reached Ankara in August1988. The Istanbul Fertilizer Industry Company(IGSAS) began to receive natural gas in July 1988,
the Ambarlı Power Plant in August 1988, andAnkara for residential and commercial purposes inOctober 1988. In 1996, the transmission pipelinewas extended to the western Black Sea region viathe Izmit-Karadeniz Eregli line (209 kilometers);the main customers are the Eregli Iron and SteelWorks plants. In the same year, the main transmis-sion line also was extended to Çan.
The Bursa-Çan Natural Gas Transmission Linewas completed in 1996 for the purpose of supply-ing natural gas to the Çanakkale Ceramic Factory,together with other industrial establishments alongthe route. In 2000, the Çan-Çanakkale Natural GasTransmission Line was completed.
In 1998, BOTASsigned an agreement with Russiato import 8 billion cubic meters per year of naturalgas from the West through TURUSGAZ—aBOTAS, GAZPROM (Russia), and GAMA (Turkey,civil contractor) joint venture. Another agreementwas signed with the Russian Federation on Decem-ber 15, 1997, to import 16 billion cubic meters ofgas per year through a pipeline beneath the BlackSea. A joint venture was also established byGAZPROM and ENI (Italy) to lay the “BlueStream” pipeline, and on December 29, 2002, thefirst Blue Stream pipeline gas from Russia enteredTurkey, crossing the Black Sea at a depth of down to2,150 meters. Deliveries were expected to amountto 16 billion cubic meters by 2007 in accordancewith the natural gas sale and purchase agreement.
In August 1996, Turkey and the Islamic Republicof Iran signed a 25-year natural gas sale and pur-chase agreement that called for the delivery of nat-ural gas to start at a volume of 3 billion cubicmeters per year, to reach 10 billion cubic meters peryear in the plateau period in 2007.The agreement wasthen amended in August 2000. A dedicated pipeline,the Eastern Anatolia Natural Gas Main TransmissionLine, running between Dogubayazit on the Turkish-Iranian border and Ankara/Seydisehir (Konya) wascompleted at the end of 2001 after some delay. OnDecember 2001, the delivery of natural gas beganthrough the Eastern Anatolia line. In April 2002 theconstruction works of the Karacabey-Izmir NaturalGas Transmission Line were completed, and the linebecame operational.
In 1999, BOTAS signed an agreement with Turk-menistan for the purchase of 16 billion cubicmeters of natural gas per year. The Turkmen gaswould be transported to Turkey for a period of
210 Turkey: Economic Reform and Accession to the European Union

30 years. On February 19, 1999, the Turkmengovernment commissioned project studies to aconsortium comprising PSG–General ElectricCapital and Bechtel. Shell joined this consortiumon August 6, 1999. This project involves construc-tion of a pipeline from Turkmenistan to Turkey,running parallel to the Baku-Tbilisi-Ceyhan crudeoil pipeline until it joins the Eastern Anatolia Nat-ural Gas Main Transmission Line near Erzurum.Gas imports were expected to begin between 2002and 2004; however, no progress has been made onthis gas pipeline. Meanwhile, the Turkish Petro-leum Corporation (TPAO) has conducted the rele-vant studies needed to join the international con-sortium that will develop and produce gas from sixdedicated gas fields (including the Körpece, Zeagli,Darvaza, Garacaovlak, and Malay fields) to feed theTrans-Caspian gas pipeline.
In April 2002, after two years of planning,Turkey and Greece signed a memorandum ofunderstanding for a gas pipeline linking the twocountries. The Ankara–Dedeagac link, which formspart of the EU’s INOGATE (Interstate Oil GasTransport to Europe) program, will feed Iraniangas through western Turkey to the Greek frontier.INOGATE is a technical assistance program of theEU (covering central and eastern Europe, includingthe newly independent states) that seeks to inte-grate the hydrocarbon transport networks betweenthe Caucasus, central Asia, and central and easternEurope. Start-up is planned for 2005, with an initialcapacity of 0.5 billion cubic meters per year, risingto a plateau of 3.6 billion cubic meters per year. Thelink is capable of carrying 13 billion cubic meters ofgas per year, with Turkey’s share set to plateau at10 billion cubic meters per year in 2007. Thepipeline will connect Karacabey in western Turkeyto Komotini city in northeast Greece, enablingTurkey to sell Greece some of the gas surplus. Thecost of this project is estimated at €250 million, andit should be completed in 2005. An economic feasi-bility study for the project, conducted by SociétéGénérale, was funded equally by DEPA (theGreek national gas company) and the EuropeanCommission. Countries that could be interestedin selling gas to the European market via thispipeline include Azerbaijan, the Islamic Republic ofIran, Kazakhstan, Turkmenistan, and Uzbekistan.In particular, Iran hopes to export the extra 3 bil-lion cubic meters per year to the European market.
The natural gas could reach Italy by means of anoffshore connection, where it could eventuallycompete with Algerian and Libyan natural gas.Another possibility is to export gas to Bosnia andHerzegovina. A further possibility could be theconstruction of a pipeline to Austria throughBulgaria, Romania, and Hungary.
In fact, in November 2002 five companies signedan agreement to carry out a joint feasibility studyon the construction of a natural gas pipeline fromTurkey to Austria via Bulgaria, Romania, andHungary. Participants in the project are BOTAS,(Turkey),Bulgargaz (Bulgaria),Transgaz (Romania),MOL (Hungary), and OMV Erdgas (Austria). Thestudy received approval from the EU in July 2003.At the beginning of 2004, the Nabucco Companybegan its financial and market studies, and the finalreport of the feasibility study is due by the begin-ning of 2005. The construction phase is scheduledto start in mid-2006, and operations are expectedto begin at the end of 2009. Once contracted, thepipeline will stretch about 3,400 kilometers, withtotal capacity from Turkey of 25 billion to 30 billioncubic meters per year. The expected offtake in tran-sit countries would be 8 billion to 10 billion cubicmeters per year, and the total capacity to Austria’sBaumgarten region would be 17 billion to 20 bil-lion cubic meters per year. Total costs are projectedto be about €4.4 billion. The idea behind the proj-ect is that Turkey would act as an “energy corridor”for the export of Caspian oil and gas. Turkey findsthe idea attractive, because it would allow the coun-try to reduce the gas surplus it seems to be facing inthe near future. In view of its geographic position,Turkey could, in fact, play a pivotal role in enhanc-ing the security of supply and competition in theEU, connecting the Caspian gas reserves with theMediterranean region and Europe.
Long-Term Purchase Contracts
BOTAS has signed eight long-term sales and pur-chase contracts with six different supply sources.Six contracts are presently in effect. Of these, threeare with Russia for plateau volumes of 6 billioncubic meters per year, 16 billion cubic meters peryear, and 8 billion cubic meters per year, respec-tively, through the Blue Stream pipeline across theBlack Sea; one is with Iran for 10 billion cubicmeters per year; and two are liquefied natural gas
Institutional Endowment and Regulatory Reform in Turkey’s Natural Gas Sector 211

(LNG) contracts—one with Algeria for 4 billioncubic meters per year and the other with Nigeria for1.2 billion cubic meters per year. These agreementsare summarized in table 8.1.
Of the two contracts that are not yet in effect,one was signed with Turkmenistan for 16 billioncubic meters per year, and the Shah Deniz contractwith Azerbaijan is for 6.6 billion cubic meters peryear, starting in 2005 (see table 8.1). It is likely,however, that these two contracts will prove mutu-ally incompatible. Although progress has beenreported on imports from Azerbaijan, the pipelineproject from Turkmenistan appears to be stalled.
On December 26, 1996, a framework agreementwas signed between Iraq and Turkey to pipe 10 bil-lion cubic meters of Iraqi gas per year to Turkeyafter development of the gas fields in Iraq. On theTurkish side, BOTAS, TPAO, and TEKFEN havebeen involved in this project. ENI was designated ascoordinator of the upstream activities.
Finally, a natural gas sale and purchase agree-ment was initialed on March 31, 2001, by BOTASand EMG (Eastern Mediterranean Gas Company)of Egypt to supply Turkey with 4 billion cubicmeters per year of natural gas.
To diversify natural gas supply sources, BOTASentered into a 20-year LNG sale and purchaseagreement with SONATRACH (Algeria) in 1988. Inorder to receive the imported LNG, BOTAS beganconstruction of the Marmara Ereglisi LNG ImportTerminal in September 1989. The terminal, whichbegan operations in 1994, is used both as a LNGregasification plant and as a storage facility forimported LNG.
In addition to long-term contracts, BOTAS hasalso purchased natural gas on the spot market. Thefirst spot LNG was from Australia within the scopeof an agreement signed with North West Shelf LNGin 1995. Spot LNG was also purchased from Qatarand Algeria under two different agreements signedwith Qatar Gas and SONATRACH in 1998.
In 2001 BOTAS purchased a total of 16,368 mil-lion cubic meters of natural gas.The Russian Federa-tion was the main natural gas supplier with 10,931million cubic meters, followed by Algeria (3,985 mil-lion cubic meters) and Nigeria (1,337 million cubicmeters). Iran provided 115 million cubic meters(BOTAS 2001).
BOTAS justified signing these long-term pur-chase contracts by pointing to the expected rapidgrowth in the Turkish gas market; it predicted thatgas demand would reach 55 billion cubic meters in2010 and 83 billion cubic meters in 2020. As notedearlier, however, most observers believed the ambi-tious BOTAS demand forecasts were overly opti-mistic, and they cautioned as well about the coun-try’s economic crisis. Some analysts foresee that in2010 Turkey will have surplus gas of 10 billion to25 billion cubic meters, increasing to 50 billioncubic meters in 2020 (Hafner 2002).
Oversupply also seems to be the basis of the dis-pute that arose between Turkey and Iran in 2001 inconnection with a natural gas purchase agreementfor 10 billion cubic meters per year signed in 1996.Under the contract, Iran was to export to Turkey atotal of 192 billion cubic meters of Iranian gas over22 years, with deliveries starting in January 2000.However, when deliveries were scheduled to start,
212 Turkey: Economic Reform and Accession to the European Union
TABLE 8.1 Existing Gas Agreements, Turkey
Amount (billioncubic meters
per year) Signature Date Duration (years)
Russian Federation (West) 6 February 1986 25Algeria (LNG) 4 April 1988 20Nigeria (LNG) 1.2 November 1995 22Islamic Republic of Iran 10 August 1996 25Russian Federation (Black Sea) 16 December 1997 25Russian Federation (West) 8 February 1998 23Turkmenistan 16 May 1999 30Azerbaijan 6.6 March 2001 15
Source: BOTAS, http://www.botas.gov.tr/.

BOTAS had not completed the necessary importinfrastructure, and an amendment to the originaldeal was negotiated under which first gas wasdelayed to July 2001, and the duration of the con-tract was extended to 25 years. The total contractualvolume was also increased to 228 billion cubicmeters, with annual volumes scheduled to reachtheir plateau level of 10 billion cubic meters per yearin 2007. But again, when the July 2001 date arrived,BOTAS claimed that Iran had not constructed thenecessary border metering facilities, and gas did notactually start flowing until December 2001.
In June 2002, BOTAS announced that gasimports from Iran had been halted because of analleged quality problem. Iran accused Turkey ofusing the quality issue as a pretext, and said that thereal reason for the halt was that Turkey was not in aposition to consume the gas. The dispute wasresolved after a reduction in the contract price (inline with the reduction that BOTAS agreed to withthe Blue Stream consortium—about 9 percent) andin the take-or-pay level (down from the original87 percent of annual contract quantity to 70 per-cent, which means that BOTAS will need to takeonly 7 billion cubic meters per year at the plateau).
National Networks and Future Development
Residential users in Ankara began receiving naturalgas in 1988. In 1992 Istanbul and Bursa also beganto receive supplies of natural gas; Izmit andEskisehir received supplies in 1996. The distribu-tion of natural gas is undertaken by local distribu-tion companies; EGO in Ankara, IGDAS in Istanbul,IZGAZ in Izmit, and BOTAS in Bursa and Eskisehir.The distributors are owned or co-owned by themunicipalities they serve, except in Bursa andEskisehir. The gas supply continues to be restrictedto limited areas of western Turkey, but there areplans to extend the system.
The city distribution networks have beenenlarged over the years, parallel with demand. In2001 the number of consumers increased to197,303 in Bursa and 76,484 in Eskisehir because ofthe work under way to enlarge the city distributionnetworks in these cities. In view of the growth sce-nario described earlier, BOTAS has planned to con-nect local distribution networks in 55 new cities.The connection dates for all of these projects arein 2002–04.
In order to become “a Bridge to Europe” andboost its internal demand, Turkey will have toimprove its national transmission and distributionnetwork. Five projects are already under study andslated to become operational in 2005: the SouthernNatural gas transmission line project; the Konya-I·zmir natural gas transmission line project; theeastern Black Sea gas transmission line project; thewestern Black Sea natural gas transmission line proj-ect; and the Georgian border–Erzurum (Horasan)natural gas transmission line project.
The Southern Natural gas transmission lineproject is aimed at meeting natural gas demand inthe southern and southeastern regions of Turkey bytransmitting natural gas through a branch line tobe extended from the Eastern Anatolia Natural GasMain Transmission Line near Sivas. The totallength of this 40-inch pipeline from Sivas toMersin via Malatya, Kahramanmaras, Gaziantep,Osmaniye, and Adana will be 565 kilometers.
By means of the Konya-I·zmir natural gas trans-mission line project, the Eastern Anatolia NaturalGas Main Transmission Line will be extended fromKonya to Izmir, and will supply natural gas to citiessuch as Burdur, Isparta, Denizli, and Nazilli. The618-kilometer 40-inch line will have branches tothe cities in the vicinity of Afyon and Antalya.
The eastern Black Sea gas transmission line proj-ect will supply Hopa, Artvin, Rize, Trabzon, Giresun,Ordu, and Samsun via Bayburt and Gümüshane byextending a branch from the Eastern AnatoliaNatural Gas Main Transmission Line at Erzincan.The plan is to supply natural gas to Gümüshane,Bayburt, Trabzon, and Rize as the first stage of theproject. Through the western Black Sea gas trans-mission line project, natural gas will be supplied toBartın, together with the industrial and residentialsectors along the route via Zonguldak, Devrek, andÇaycuma, by extending a branch from KaradenizEregli. It is foreseen that the 141-kilometer line willconsist of a 78-kilometer line of 16-inch pipe and a63-kilometer line of 12-inch pipe. In addition, a 65-kilometer loop line of 16-inch pipe will be con-structed on the Izmit-Karadeniz Eregli Natural GasTransmission Line.
To transport Turkmenistan and Azerbaijan natu-ral gas within Turkish territories, an approximately225-kilometer pipeline will be constructed from theGeorgian border of Turkey to Erzurum (Horasan).This line will be connected to the Eastern Anatolia
Institutional Endowment and Regulatory Reform in Turkey’s Natural Gas Sector 213

Natural Gas Main Transmission Line at Horasan.The project includes a commercial metering stationand a compressor station.
Ownership and Industry Structure
This section addresses questions related to the pres-ent ownership and industry structure of Turkey’snatural gas sector, with the goal of comparing theTurkish case with that of some EU countries. Indoing so, the section discusses similarities withother emerging gas markets as well as differenceswith more mature markets.
Turkey
Turkey’s natural gas sector is dominated byBOTAS. BOTAS Petroleum Pipeline Corporationwas established as an affiliated company of theTurkish Petroleum Corporation on August 15,1974, to transport Iraqi crude oil to the Gulf ofIskenderun. In 1995 the company was restruc-tured as a state economic enterprise (SEE) byDecree of the Council of Ministers No. 95/6526,thereby obtaining the status of an independentcompany. Since 1987, BOTAS has expanded itsoriginal mission of transporting crude oil throughpipelines to cover the natural gas transportationand trading activities. In 1995 all kinds ofpetroleum-related activities such as exploration,drilling, production, transportation, storage, andrefining for the purpose of providing crude oiland natural gas from sources abroad was added toBOTAS’s activities.
BOTAS is made up of a series of sectoral andprovincial organizations: Petroleum OperationsManagement, Natural Gas Operations Manage-ment, LNG Operation Management, DörtyolOperation Management, Kayseri Operation Man-agement, Istanbul Operation Management, BursaOperation Management, and Eskisehir OperationManagement.
By Decision of the High Planning CouncilNo. 2002/T-15 of June 6, 2002, the Bursa andEskisehir Operation Managements were restruc-tured and transformed into affiliate companies ofBOTAS that took the form of joint stock compa-nies. The new companies were the Bursa CityNatural Gas Distribution, Trade and ContractingCorporation (BURSAGAZ) and the Eskisehir City
Natural Gas Distribution, Trade and ContractingCorporation (ESGAZ).
BOTAS’s monopoly rights to natural gas import,distribution, sales, and pricing, granted by DecreeNo. 397 of February 9, 1990, were abolished by thenatural gas market law (No. 4646) enacted on May 2,2001, to establish a stable and transparent naturalgas market based on competitive rules. The new lawcovers the import, transmission, distribution, stor-age, wholesale trading, and export of natural gas,and the transmission and distribution of com-pressed natural gas (CNG), as well as the rights andobligations of all real and legal persons related tothese activities. Under the law, BOTAS will compet-itively tender and release the import contracts tonew private entrants until its import share fallsbelow 20 percent by the year 2009. The companymust auction at least 10 percent of its gas purchaserights a year, starting from the enactment date ofthe law. BOTAS will also undergo further restruc-turing, and separate companies will be establishedfor trade, transmission, and storage after the year2009.
The 2001 natural gas market law also set theminimum annual consumption limit for qualifica-tion as an eligible consumer to 1 million cubicmeters, which corresponds to a market opening ofapproximately 80 percent (European Commission2003).
EU Emerging Gas Markets
Within the European Union, Greece and Portugalare considered to be emerging gas markets. As aresult, both countries obtained derogation to the lib-eralization schedule foreseen in Directive 98/30/ECof the European Parliament and of the Council ofJune 22, 1998, on common rules for the internalmarket in natural gas.
Greece Greece is not directly linked to the inter-connected system of any other member state, andit has only one main external supplier of importedgas, Russia, which has a market share of more than75 percent. So far, Greece has only a verticallyintegrated gas company, DEPA (Public Gas Corpo-ration). Plans are under way to separate DEPA’sactivities into transmission and supply. At present,there is no unbundling of gas supply and high-pressure transmission.
214 Turkey: Economic Reform and Accession to the European Union

Low-pressure gas distribution is performed (forindividuals and small industrial consumers) bythree independent private companies, each cover-ing a specific geographic area. An energy regulatoryauthority was established by Law No. 2773/99.Greece has an LNG terminal, which may serve asstorage. No underground gas storage is yet in oper-ation. The opening of the Greek gas market isscheduled for 2006.
Portugal The Portuguese gas market is verysmall. Transgas, the main operator for the high-pressure network, was set up in 1993, and its majorshareholder is Gas de Portugal, which previouslywas in charge of supply and transmission. Indus-trial and commercial consumers with a gas con-sumption profile of over 10,000 thousand cubicmeters are served directly by Transgas, along withthe four distribution companies in Portugal (Gasde Lisboa for the capital city, Portgas for the north-ern region, Lusitania Gas for the central region, andSet Gas for the southern region). These four com-panies sell, in turn, to smaller distribution compa-nies (less than 2,000 cubic meters purchased annu-ally). To promote investment in the enlargement ofthe three provincial distribution networks, thePortuguese government conducted in the 1990s aninternational tender to select strategic investors foreach network. Italgas, a subsidiary of ENI, wasselected as the strategic investor for two out of three(Lusitania Gas and Set Gas).
In 2000 the government merged the state-owned oil and gas operators with the intention ofprivatizing them. A holding was then set up (Galp-SGPS) in which Eletricidade de Portugal is themajor shareholder. ENI took 33 percent of the cap-ital. As an emerging market, Portugal has appliedfor derogation; therefore, the EU natural gas direc-tive will not be implemented before 2007.
EU Mature Gas Markets: The Italian Case
Italy produces only about one-fifth of its internalgas consumption, and production is falling, inabsolute and relative terms, in relation to needs. Inthe production sector, ENI is the dominant opera-tor (in 2001 it accounted for 88 percent of totalproduction), followed by Edison T&S SpA (12 per-cent of total production). Proven overall reservesamount to about 215 billion cubic meters, the
equivalent of 13 years of production at current lev-els. Imports fulfill most of the country’s require-ment (just under 80 percent), and their share isexpected to cover 88 percent of the total require-ment by 2005 and 90 percent by 2010. As forimports, the ENI Group is again the dominantoperator, accounting for about 85 percent of thetotal in 2001. The second importer after ENI is EnelSpA (the former electricity monopoly), with about11 percent of imports in 2001.
In 2004, Italy started importing gas from Libya,and in 2007 the operator Edison will begin import-ing liquefied natural gas from Qatar upon the con-struction of a regasification terminal in the upperAdriatic. The import contracts that are signed willsatisfy expected requirements until 2010.
The contracts for the vast majority of importsare long term; in 2001 they accounted forabout 98 percent of the imported volume. Nearly93 percent of imported gas is transported bypipeline to entry points in Italy. The transporta-tion rights paid by importers on foreign pipelinesserving the national gas system go mainly to com-panies of the ENI Group, which was responsiblefor constructing and funding the infrastructure.Snam Rete Gas SpA3 owns 96 percent of the trans-portation capacity in Italy in terms of investedcapital. The network of the second operator,Edison, is geographically complementary to that ofSnam Rete Gas, especially in the central part of thecountry. The section of pipeline passing underthe territorial waters of the Channel of Sicily isalso part of the national system. It is owned byTransmediterranean Pipeline Company Limited(TMPC, an Italian-Algerian company in whichSONATRACH and ENI hold equal stakes).
Access to Italy’s transportation networks is regu-lated in accordance with Legislative Decree164/2000 implementing the EU directive on theinternal market for natural gas. Tariffs, access crite-ria, and the obligations to be met by the transporta-tion companies are set by the Electricity and GasRegulatory Authority.
Legislative Decree 164/2000 also defined thenational network of gas pipelines, which is made upof import pipelines, connections to storage facilitiesand the principal interregional pipelines. For thisnetwork, as defined and updated by ministerialdecree, access has been regulated since October 2001along entry-exit lines.
Institutional Endowment and Regulatory Reform in Turkey’s Natural Gas Sector 215

The Italian storage system consists of depletedfields. The storage sites currently in operation aremanaged by Stoccaggi Gas Italia SpA (Stogit), acompany set up in 2001 by the ENI Group, afterhiving off its storage branch, and Edison. Stogitmanages eight storage facilities, and Edison has twostorage facilities. The energy authority sets the tar-iffs, criteria, access priorities, and obligations thatstorage companies are required to respect. The onlyregasification terminal in Italy at present is the oneat Panigaglia, which is run by Snam Rete Gas. Itscapacity is presently entirely taken up. Six new ter-minals are planned.
The Italian market has been fully open since Jan-uary 1, 2003. Article 1 of Legislative Decree 164/00implementing European Commission Directive98/30/EC on common rules for the internal naturalgas market provides that the importation, exporta-tion, transportation, dispatch, distribution, andsale of natural gas are free.
Imports from non-EU countries are subject toauthorization by the Ministry of Industry on thebasis of objective, nondiscriminatory publishedcriteria on technical and financial capabilities;assurances about the origin of the gas; the availabil-ity of strategic storage capacity in Italy in propor-tion to the quantity of gas imported annually; andthe ability to contribute to the development andsafety of the system or to the diversification ofsupply. LNG imports are facilitated through thereduction of strategic storage obligations. Twotransitional annual constraints have been intro-duced to facilitate the entry of new operators: aceiling on the national consumption level that canbe served by a single company from 2003 to 2010(50 percent) and a ceiling on the deliveries to thenational network by any single company from 2002to 2010 (initially 75 percent of national consump-tion, with a reduction of 2 percentage points peryear, to 61 percent).
Transportation and dispatch are public serviceactivities, with connection and network access obli-gations according to the criteria and tariffs laiddown by the energy authority. Storage is conductedon a licensing basis lasting no more than 20 years,and is subject to access obligations under thecriteria, priorities, and tariffs laid down by theauthority. Storage and exploitation activities mustbe separated.
Distribution is a public service activity. Theservice is entrusted to a concessionaire through anopen tendering process for a period not exceeding12 years. The local authorities that grant the con-cession are entrusted with the orientation, supervi-sion, and control powers, and their relation withthe distributors are regulated on the basis of a stan-dard contract prepared by the regulatory authorityand approved by the Ministry of ProductiveActivities.
The legislative decree implementing the EUdirective completely transformed the structure ofthe gas sector in Italy and provided a new impetusto the reorganization of the sector. The majorenergy companies acquired many distributioncompanies so that they could increase their marketshare and create new consortia. Companies that usegas have also set up consortia with a similar goal ofpurchasing gas on competitive terms.
The Italian case represents a median case of lib-eralization in the EU context. The U.K. market isconsiderably more competitive than the Italianone, because the country has, until recently, beenself-sufficient in natural gas. In almost all other EUcountries, the market is less competitive: inGermany, a regulatory authority has not yet beenintroduced, although it was recently decided tointroduce one; in France, the incumbent controlsthe market almost completely; in Spain, competi-tion is facilitated by the presence of multiple regasi-fication terminals, and a model gas release programwas implemented to reduce the share of the incum-bent, Gas Natural.
Regulatory Reform in Turkey
On May 15, 2001, the executive board of the Inter-national Monetary Fund (IMF) approved a newthree-year standby arrangement for Turkeyamounting to US$19 billion. As part of the packageof economic measures, which were a condition ofIMF support, Turkey passed new electricity andgas laws.
The new natural gas market law (Law No. 4646)was adopted on May 2,2001.The law came into forceimmediately,but its implementation was subject to a12-month transition period, extendable to a maxi-mum of 18 months. The transitional period was infact extended until November 2002. Implementing
216 Turkey: Economic Reform and Accession to the European Union

legislation on gas market licensing was issued inSeptember 2002.
The law is intended to establish a competitive gasmarket and to ensure independent regulation of thesector. The law also seeks to harmonize Turkish leg-islation with EU law in view of Turkey’s future acces-sion. The main features of the law are the following:
• All legal entities can carry out import, export,wholesale trade, transportation, distribution,storage, and CNG transmission and distributionactivities under license from the energy marketregulator.
• The natural gas activities of BOTAS are to beunbundled. BOTAS is to be split into three stateeconomic enterprises after the year 2009,responsible for trading, storage, and transmis-sion, respectively. The two local distributorsowned by BOTAS in Bursa and Eskisehir willlater be corporatized and privatized.
• No importer will be allowed to import morethan 20 percent of Turkey’s gas consumptionduring any one year. BOTAS will be required tosell part of its gas import contracts to complywith this provision. This sale will be accom-plished through a series of annual competitivetenders to sell existing import contracts to newimporters for no less than 10 percent of totalimports each year. No new natural gas purchaseagreement can be executed by any import com-pany with countries that have existing contractswith BOTAS. This limitation shall apply for theentire duration of the agreement.
• No legal entity is allowed to sell more than20 percent of annual gas consumption. Onlynational gas producers may sell more than20 percent of annual gas consumption in thedomestic market, provided that the amount solddirectly to eligible consumers does not exceed20 percent. The remaining gas could be soldthrough importers, distributors, or wholesalers.
• Gas companies will not be allowed to establishanother company in the same field of activity,but will be allowed to own participations in acompany operating in another field. They maynot, however, directly or indirectly hold themajority of the capital or commercial assets ofthe company, nor do they have the right to usethe majority of voting rights of the company.
The rights of BOTAS on existing participationsare preserved.
• To ensure security of supply, gas importers andwholesalers must inform the Energy MarketRegulatory Authority (EMRA) about the sourceand security of their gas imports, and they muststore 10 percent of the gas they import in fiveyears. Importers also must prove that they cancontribute to the improvement and security ofthe national transmission system.
• Transportation companies that own transporta-tion networks and the owners and operators ofLNG and storage facilities are to offer services atnondiscriminatory conditions.
• Third parties also will be allowed to buildpipelines. BOTAS and other potential grid oper-ators are to undertake investment, which is sub-ject to EMRA’s approval. The regulatory agencyis to control this investment, along with servicequality. Existing and planned national transmis-sion networks as well as transmission networksunder construction remain under the ownershipof BOTAS.
• Eligible consumers will be free to select the sup-plier of their choice. Eligibility will be deter-mined by the regulator. Consumers purchasingmore than 1 million cubic meters of natural gasa year and users unions (consortia), power gen-erators, and cogenerators are considered eligible.
• Distribution rights for cities and municipalitiesmust be awarded under a tender. Once a distrib-utor has won a tender, it applies the unit serviceand the amortization price as specified in thetender announcement. After this period, itsprices and conditions will be reviewed everyyear by the regulator. Distributors must con-struct, operate, and extend distribution equip-ment as specified in the license. Once the licensefor a distribution area has been awarded, theselected operator has to allow the local govern-ment to participate up to 20 percent in the com-pany capital. The size of public participation, tobe remunerated at the nominal share price, is tobe determined by the regulator. Distributioncompanies may hold a license for no more thantwo cities within the country.
• EMRA has to develop five different categories ofgas prices: for connection, transmission, storage,wholesale sales, and retail sales. Prices for
Institutional Endowment and Regulatory Reform in Turkey’s Natural Gas Sector 217

connection will be determined between theregulator and distribution companies. Networktariffs will be based mainly on distance and vol-ume. Storage tariffs will be freely determinedbetween storage companies and users. Trans-mission and storage companies will have anobligation to prove to the regulator that theirservices are economical and safe. Wholesaleprices will be negotiated by the trading parties,but the regulator will maintain some oversightof wholesale prices. The distribution companiesmust prove that they provide gas from thecheapest source, and they must operate effi-ciently and safely during their license period.Distributors’ retail sales prices for captive con-sumers are subject to rate-of-return regulation.
The Energy Market Regulatory Authority, whichopened its doors in November 2001, was estab-lished to meet a condition of the IMF’s support forTurkey. EMRA is an independent, administrativelyand financially autonomous public administrationrelated to the Ministry of Energy and NaturalResources. According to Article 4, paragraph 3, ofthe electricity market law (No. 4628), “The head-quarters of the Authority shall be located in Ankaraand the ministry to which it is related shall be theMinistry of Energy and Natural Resources. TheAuthority may establish representative offices indistribution regions in order to carry out customerrelations.” Most of the technical specialists have sofar been recruited through temporary assignmentsfrom various public administrations, including theMinistry of Energy and Natural Resources, BOTAS,the former Turkish Electricity and TransmissionCompany (TEAS), the Treasury, and public banks.By March 2003, its overall personnel, includingsupport staff, totaled 270. Its budget is €4.3 million.
EMRA has begun to develop some of the sec-ondary regulation for the liberalization of theenergy sector. In September 2002, EMRA issued aregulation on principles and procedures pertainingto connection, transmission and dispatch, storage,and wholesale and retail sale tariffs. In January2003, the new transmission tariff was announced.The tariff—the maximum that system operatorBOTAS can charge to shippers—is a flat rate postaltariff equivalent to $0.4 per million Btus. This tariffis lower than many expected, indicating that EMRAseriously intends to create a competitive market
and that the prices for industrial consumers willprobably go down as a result of liberalization.Secondary legislation on licensing procedures andon network operation rules to be determined bytransmission companies was also adopted.
Comparative Analysis of Turkey’s Gas Legislation
Even though Turkey is an emerging market, its indus-try structure does not differ considerably from thatof other countries of the EU, including more maturemarkets. Furthermore, its new legislation goes evenfurther than the laws in force in many EU countries.Although liberalization was postponed in Greece andPortugal until 2006 and 2007, respectively, in Turkeythe threshold of 1 million cubic meters per year foreligibility represents a market opening of approxi-mately 80 percent. This figure may, however, be aresult of the structure of the demand, mainly consist-ing of large consumers. The average market openingwithin the EU is about 78 percent.
As for unbundling, the obligation imposed onBOTAS to divest all distribution activities, in addi-tion to separating trading and transmission activi-ties, is more stringent that that found in other EUcountries. In Italy, for example, ENI has substantialinterest in distribution (100 percent of Italgasthrough Snam Rete Gas) and was not requested todivest its distribution arm, which owns 35 percentof the distributors. In Spain, Gas Natural is stronglylinked to Enagas and Repsol. In Germany, Ruhrgashas a minority interest in regional companiesand distributors at least sufficient to influencethem. RWE Gas and E. ON cover the whole chain,including small production interests. In France,over 90 percent of distribution is undertaken byEdF-GdF. In Austria, the regional gas companiesmay be connected with their distributors.
The limit on BOTAS’s share of imports is muchmore stringent than what is imposed in Italy and inSpain. No limit was imposed in France or Germany.Likewise, the limit on BOTAS’s domestic market shareis more stringent than what was imposed on SnamRete Gas in Italy. The 10 percent storage obligation issimilar to that existing in Italy. However, Turkey’s sit-uation is different because it is a transit country thateventually will have access to much more gas than itconsumes domestically, but it has little opportunityto create underground storage sites (which insteadare available“downstream,” in the Balkans).
218 Turkey: Economic Reform and Accession to the European Union

The most interesting feature of the new gas law,however, is the gas release program. If managedwisely, the program has the potential to create realcompetition within the country. The natural gaslaw states (temporary article 2) that every year untilthe aggregate of the annual import amount falls to20 percent of the annual consumption amount,BOTAS shall release part of its contracts to com-petitors by means of a tender. However, it is not yetclear how such a system will work in practice.BOTAS has a final say on the winner of the tenderprocedure. If BOTAS is left free to choose the oper-ator to whom it will cede its purchase agreements,the program may turn out to be not too effective.Also, in view of the Italian experience, it would bepreferable that the gas be released by means of atendering procedure based on objective criteria.
Italian legislation implementing the EU direc-tive introduced two constraints on the incumbent,ENI, to facilitate the entry of new operators. Thefirst is a ceiling on the national consumption levelthat can be served by a single company from 2003to 2010 (50 percent). This measure, however,excludes gas for self-consumption.4 The second is aceiling on the deliveries to the national network byany single company from 2002 to 2010 (initially75 percent of national consumption, with a reduc-tion of 2 percentage points a year, to 61 percent).
ENI was left free to decide how to resell part ofthe gas for which it had already contracted throughlong-term take-or-pay contracts. The result wasthat only Italian companies (Plurigas SpA, DalmineEnergia, and Energia SpA) benefited from themeasure; major international gas companies, espe-cially producers, were not offered an opportunityto enter the market.
The solution adopted in Italy thus, in the end,reinforces the position of some weak competitorsthat represent no real threat to the incumbent, but itdoes not seem very effective as a means of reducingprices and building competition. The three compa-nies that benefited from the measure are too small toeffectively compete with ENI. On the contrary, it ismore likely in practice that smaller firms will adjusttheir prices to be in line with that of the incumbent.
In the United Kingdom, competition effectivelystarted only in the early 1990s, when a gas releaseprogram was introduced. Each year, the release gaswas allocated on a pro rata basis to successful appli-cants (32 in the first year and an additional 70 in
the second year—albeit including some multiplebids), who paid BG (British Gas) a price equalto BG’s weighted average cost of gas. Previousattempts by the British government to introducesupply side competition through voluntary com-mitments by BG (including the 90/10 rule underwhich BG would contract no more than 90 percentfrom new fields, leaving 10 percent to other compa-nies) were less effective than hoped, because mostof the 10 percent gas contracts were bought for newpower generation rather than competing in theindustrial market.
One example of a competition-enhancingrelease program was undertaken in Spain. By RoyalDecree Law 6/2000 of June 23, 2000, and by anorder of June 29, 2001, the Spanish governmentconducted a gas release program for 25 percent ofthe gas supplies that Spain received from Algeriathrough the Maghreb pipeline from October 2001to January 1, 2004—that is, for about 26 months.This program, like the gas release program in theUnited Kingdom, was based on the principle ofkeeping the incumbent neutral.
The release was designed to give competitors toGas Natural access to gas, so that customers in thelarge industrial market would receive offers fromalternative suppliers. Trading companies with amarket share of more than 50 percent of the marketwere excluded from the bidding. Fourteen bidswere made by different company groups (the totalbid was for two and a half times the amount of gasbeing offered). Bids could be made for only up to25 percent of the total volume offered. The averageprice paid by bidders was equivalent to GasNatural’s purchasing cost (oil-related gas price)plus a fixed management fee.
The final awards were made on October 22, 2001.Among the winning applicants were three Spanishcompanies—Iberdrola Gas (25 percent), UniónFenosa Gas Comercializadora (20 percent), andEndesa Energía (18 percent)—and two interna-tional companies—BP Gas (25 percent) and Shell(2 percent)—through their Spanish subsidiaries.
Spanish imports from Algeria by pipelinetotaled 6.54 billion cubic meters in 2001; totalimports were almost 17.5 billion cubic meters.Spain’s gas release program was therefore equal toabout 16 percent of Spanish consumption, whereasthe planned gas release for Turkey will be for80 percent of total imports.
Institutional Endowment and Regulatory Reform in Turkey’s Natural Gas Sector 219

Conclusion
Turkey plays a central role as a transit country foroil and gas from the Caspian Sea, Black Sea, andCentral Asia regions to the EU. Because of its strate-gic position, Turkey can help to improve naturalgas supply diversification and security in Europe aswell as to enhance competition. It is expected thatthe EU will have a gas supply deficit of about13 percent in 2010 and about 28 percent in 2020(European Commission 2002).
To perform this role effectively, Turkey will haveto develop its national infrastructure and stimulateinternal gas demand. The development of distribu-tion networks is important to maintain marketgrowth, which itself will be vital if the gas thatBOTAS has contracted is to be absorbed and if thecountry is to attract international investors. In thatrespect, clear regulations on access rules, tariffs, andnew investments are vital. Experience in othercountries reveals that uncertainty over the applica-ble regime may seriously prevent investments.
To develop the internal market, regulatorsshould also enact the appropriate secondary legisla-tion that will allow prices to domestic consumers togo down while maintaining good quality standards.Time limits must be imposed on the licensing sys-tem for distribution.
Finally, the release program must be imple-mented soon to increase the number of marketparticipants.
Notes
1. The authors wish to thank the participants in the confer-ence “Turkey: Towards EU Accession” for their comments, andespecially Ahmet Aydin, who sent them detailed comments andadditional information that allowed them to substantiallyimprove the first draft of this chapter.
2. These numbers were provided by the state-owned gascompany, BOTAS.
3. In 2001 both Snam Rete Gas and Edison were separatedfrom their respective vertically integrated groups (ENI andEdison) in compliance with the provisions of LegislativeDecree 164/2000 on the unbundling of activities in the gassector. At the end of 2001, 40.24 percent of the shares of SnamRete Gas were floated, with ENI continuing to own the remain-ing stake.
4. The fact that gas for self-consumption has been excludedfrom the ceiling means that Snam can minimize the amount ofgas it releases by entering the electricity market through theconstruction of gas-fired power generators, thus reducingthe effect of the program.
References
BOTAS. 2001. 2001 Annual Report. http://www.botas.gov.tr/raporlar/Botas/index.htm.
European Commission. 2002. “Discussion Document on Long-Term contracts, Gas Release Programmes and the Availabil-ity of Multiple Gas Suppliers.” Draft paper for discussion ofthe Fifth Meeting of the European Gas Regulatory Forum,January 22.
————. 2003. “Second Benchmarking Report on the Imple-mentation of the Internal Electricity and Gas Market.” Com-mission Staff Working Paper SEC (2003) 448, July 4.http://www.europa.eu.int/comm/energy/gas/benchmarking/doc/2/sec_2003_448_en.pdf.
Hafner, Manfred. 2002. “Future Natural Gas Supply Options andSupply Costs for Europe.” Observatoire Méditerranéen del’Energie, Workshop on the Internal Market for Gas, Brussels,November 7–8.
220 Turkey: Economic Reform and Accession to the European Union

221
Part III
EconomicChallenges


medium term, removal of all forms of discrimina-tion, adoption of EU legislation in the field of laborlaw, effective implementation and enforcement ofthe social policy and employment acquis, andpreparation of a national employment strategywith a view toward later participation in the Euro-pean Employment Strategy (EES). These institu-tional changes are expected to enhance Turkey’scapacity to develop and implement, together withthe European Community, strategies for “employ-ment and particularly for promoting a skilled,trained and adaptable workforce and labour mar-kets responsive to economic change” (Treaty Estab-lishing the European Community, Article 125; alsosee the EU’s Official Journal, C 325, December 24,2002).
Adoption of the EU acquis on employment andsocial affairs is likely to put a burden on the firmsand workers that need to adapt themselves to thenew competitive environment. The adverse effectsof this process of transformation would be mini-mized if the government, the private sector, andlabor understand what needs to be changed andthen adopt effective policies and strategies. Themain aim of this study is to provide, for use bythese agents, information on the employment andlabor market issues that are important during theEU accession process. A study of labor markets inthe process of EU membership is crucial for Turkey,because, as in all other European countries, the
The process of European Union (EU) accession hasprovided a strong stimulus for various institutionalchanges in Turkey. The recognition of Turkey as acandidate state for accession by the EuropeanCouncil at Helsinki on December 10–11, 1999, wasan important turning point in this process.1 TheAccession Partnership (AP), which followed theHelsinki summit, identified the short-term andmedium-term priorities, intermediate objectives,and conditions on which accession preparationsmust concentrate in light of the political and eco-nomic criteria. One of the most important issuesfor Turkey in adopting and implementing the EUacquis communautaire (the entire body of legisla-tion of the European Communities and Union) islabor market regulations and employment policies.Adoption of the EU acquis will certainly bring radi-cal changes to the functioning of the labor marketin Turkey, with vital consequences for firms,workers, and the long-term performance of theeconomy.
As noted, the Accession Partnership identifiedshort-term and medium-term priorities and objec-tives in employment and social affairs. In the shortterm, Turkey was expected to strengthen efforts totackle the problem of child labor, to ensure thatthe conditions are in place for an active andautonomous social dialogue, and to support thesocial partners’ capacity-building efforts to developand implement the acquis. The AP envisaged, in the
223
9Labor Market Policies
and EU Accession:Problems and
Prospects for Turkey
Erol Taymaz and Sule Özler

labor market is the single largest market whose effi-cient operation has significant repercussions for theperformance of the whole economy. Moreover,being a social institution, the labor market, and therules and regulations defining how it should oper-ate, have a direct impact on the lives of almost allcitizens.
Because the topic is rather broad, this study con-centrates on the possible effects of the adoption ofthe employment acquis regulating work andemployment conditions, and it ignores some issuessuch as child labor, discrimination, and social pro-tection. The chapter thus focuses on employmentprotection and labor market flexibility issues. Itbegins by briefly summarizing the literature onlabor market policies, institutions, and economicperformance. It then presents basic employmentindicators for Turkey, the EU, and some accessioncountries to set the background for the study. Thenext section compares EU and Turkish labor lawand discusses the main characteristics of the ration-ale and implementation of the European Employ-ment Strategy. The sections that follow analyze themeasurement of labor market flexibility and theflexibility of the Turkish labor market and describethe impact of the accession process and the adop-tion of the acquis. The final section summarizes thebasic findings and policy proposals.
Labor Market Policies, Institutions,and Economic Performance
Although the link between labor market institu-tions and economic performance has received con-siderable attention in the literature beginning withthe classical economists, since the mid-1970s it hasbecome a major contentious issue among econo-mists and policymakers. The member countries ofthe Organisation for Economic Co-operation andDevelopment (OECD) experienced a rapid increasein inflation and unemployment rates in the secondhalf of the 1970s. Almost all the OECD countries(with a major exception, Turkey) were successful incurbing the inflation, but high unemployment rateshave persisted in European countries.
The difference in the labor market performancesof the United States and European countrieshas instigated an intensified debate on the linkbetween labor market institutions and economicperformance. Many economists and international
organizations such as the OECD have pointed toinefficient and inflexible labor markets as a reasonfor the high and, in many cases increasing, unem-ployment in European countries. The concept of“labor market flexibility” has played a key role inthese discussions.2
The concept of labor market flexibility refers tothe functioning of labor markets (“external flexibil-ity”), and it focuses mainly on wage and numericalflexibility. Wage flexibility refers to the speed ofadjustment in wages in the labor market. What isusually meant by wage flexibility is the downwardflexibility of real or nominal wages. Specific wage-setting institutions (centralized collective bargain-ing, wage indexation, and minimum wage legisla-tion) and tax and social spending policies (such ashigh unemployment benefits, high nonwage laborcosts, and high marginal tax rates) are blamed forreducing wage flexibility. Numerical flexibility refersto how fast and at what cost a firm can adjust thecomposition and the number of workers it employsby hirings, layoffs, and firings. Employment protec-tion legislation (EPL) is one of the main institutionsthat determines numerical flexibility. Becausenumerical and wage flexibility are closely related (aswill be discussed later—rigidities in EPL may lead tohigher wages), in this chapter we use only the termlabor market flexibility to cover both aspects ofexternal flexibility.
In the 1990s, some researchers emphasizedthe importance of functional (or “internal”)flexibility—that is, flexibility in job description andjob design for multiskilled workers. Althoughexternal and internal flexibility could be substitutes,or options, for alternative corporate strategies, wedo not study the issue of internal f lexibility.
As noted earlier, Article 125 of the Treaty Estab-lishing the European Community calls for a coordi-nated strategy for promoting a “skilled, trained andadaptable workforce and labour markets responsiveto economic change.” The concept of adaptabilityis certainly broader than the concept of flexibility.For example, it is suggested in a report financedby the European Commission that adaptabilityrefers to “the broad process by which labour mar-kets adjust to exogenous developments over aperiod of time.” whereas flexibility is now usedto refer to the “short-term response of wages andlabour costs, in particular, to variations in thedemand for labour relative to supply, or to the
224 Turkey: Economic Reform and Accession to the European Union

ability of employers to adjust their work force tochanges in economic activity.” Therefore, “[w]hileflexibility defined in these terms may be an impor-tant part of the wider concept of adaptability, it isfar from being the only aspect of labour marketbehavior which is of significance. Indeed, a highdegree of flexibility so defined may not only con-flict with the achievement of wider objectives thansimply the maintenance of a high level of employ-ment but might also make it more difficult to securelonger-term growth objectives” (Algoé Consultans2002: 2). Keeping in mind these differences, thisstudy focuses on labor market flexibility, especiallyon changes needed in the EPL during the accessionprocess in Turkey.
Researchers disagree about the effects of labormarket flexibility on economic performance. Onegroup claims that labor market flexibility isrequired for the good functioning of competitivemarkets and thus for the efficient allocation ofresources. Because employment protection andrigidities in wage setting are costs incurred byfirms, they have profound effects on firms’ deci-sions (OECD 1994a, 1994b, 1999; Salvanes 1997;Blanchard 2000; Scarpetta and Tressel 2002;Heckman and Pagés 2004). These researcherssuggest, first, that stricter labor market regulationsmay lead to higher unemployment (and loweroutput) and change the composition of unemploy-ment, because they affect the flows to and fromemployment—that is, hiring and layoffs. EPL costsaffect layoffs directly, because these costs are addedto the cost of layoffs, and the cost of hiring indi-rectly, because firms will take into consideration the(potential) costs of layoffs (including EPL costs) intheir hiring decisions. If the second effect domi-nates the first one, then the unemployment rate willbe higher. EPL will also increase unemploymentduration because of the decrease in the exit ratefrom unemployment.
Second, strict EPL is likely to strengthen the bar-gaining power of workers and, depending on thestructure of product and labor markets, may lead towages higher than the market-clearing wages andhigher unemployment. Moreover, EPL providesprotection for insiders, those workers who haveregular jobs in the formal sector. Thus, strict EPLmay cause a widening gap between insiders andoutsiders and may encourage firms to operate inthe informal sector.
Although there is almost a consensus on theeffects of EPL on the composition and rate ofunemployment among neoclassical economists,another group of researchers suggests that excessivelabor market flexibility may hinder investment intraining and innovative activities, diminish theaccumulation of human and knowledge capital,and thus have a negative impact on growth andemployment in the long run. According to Michieand Sheehan (2003), “The sort of ‘low road’ laborflexibility practices encouraged by labor marketderegulation—short term and temporary con-tracts, a lack of employer commitment to job secu-rity, low levels of training, and so on—are nega-tively correlated with innovation.” Firms that relyon labor market flexibility to be more competitivewill have weak incentives for conducting innovativeactivities. Moreover, reduced innovative activitieswill, in turn, have a negative impact on employ-ment and company profits because “(1) lower wageincreases will lead to a slower replacement of thecapital stock, (2) lower wages prevent the Schum-peterian process of creative destruction, and(3) lower wages will lead to a lack of effectivedemand” (Kleinknecht 1998).3 Patterns of sectoralspecialization also may be influenced by labor mar-ket flexibility. For example, Bassanini and Ernst(2002) show in an empirical study that “countrieswith coordinated industrial relations systems andstrict employment protection tend to specialize inindustries with a cumulative knowledge basebecause coordinated industrial relations and employ-ment protection encourage firm-sponsored train-ing as well as the accumulation of firm-specificcompetencies.”
Rigidities and frictions in the labor market mayreduce labor flows and lead to wage compression(lower wage differentials). These factors, however,may induce firms to provide more training for theiremployees and contribute to the accumulation ofhuman capital, both at the firm level and at theeconomy level (see, e.g., Acemoglu and Pischke1998, 1999; Agell 1999; Ballot and Taymaz 2001).The stability of the employment relationship, com-plementarities between training and innovationactivities, and wage compression all make trainingactivities more profitable. Thus, firms will achievehigher productivity and a higher rate of growth inproductivity as a result of employing more skilledand well-educated employees.
Labor Market Policies and EU Accession: Problems and Prospects for Turkey 225

Although the issue of the effects of labor marketinstitutions on economic performance has yet to beresolved, some remarkable contributions in recentyears have improved understanding of how labormarket institutions function. For example, Belot,Boonez, and van Ours (2002) have developed amodel that proves that there is an optimal degree ofemployment protection. In other words, bothexcessive and limited labor market flexibility couldbe detrimental to economic growth. More impor-tant, it has been shown that the impact of labormarket regulations and institutions depends onother market and technology conditions (Scarpettaand Tressel 2002). Blanchard has developed modelsin which he studies the interactions between laborand product markets (e.g., Blanchard 2000). Heshows that institutions play a more important rolein the process of wage setting if product marketsare monopolistic or oligopolistic, because only inthose markets would workers be able to bargainover rents. Therefore, (de)regulation of labor andproduct markets must be implemented together.Finally, Belot (2002) develops the idea that labormarket flexibility itself could be an endogenouslydetermined variable, and he shows in a model thatcountries with low migration costs and high eco-nomic heterogeneity (such as the United States)may prefer no employment protection.
Numerous empirical studies have attempted totest the effects of labor market flexibility on eco-nomic performance. Most of these studies show thatthe effect on the composition of unemployment isunambiguous: employment protection increasesthe duration of unemployment by slowing down theflows through the labor markets (more long-termunemployment and less short-term unemploy-ment), but the effect on the rate of unemploymentand output is ambiguous. Labor market flexibilityhas an adverse impact on specific groups of workerssuch as youth and marginal groups (for extensivesurveys, see Nickell and Layard 1999; Addison andTeixeira 2001; Baker and others 2002; Heckman andPagés 2004). As for growth and productivity, Nickelland Layard (1999) suggest that“there seems to be noevidence that either stricter labor standards oremployment protection lowers productivity growthrates. If anything, employment protection can leadto higher productivity growth if it is associated withother measures taken by firms to enhance the sub-stantive participation of the workforce.”
Labor Market Indicators for Turkey
Turkey, with its population of 64 million, is thelargest of the 13 accession and candidate coun-tries.4 Its eventual membership in the EU will havea profound impact on both Turkey and the EUcountries, and the impact of membership will bedetermined, to a large extent, by the peculiarities ofthe structure of the population and labor marketsin Turkey.
One of the most important characteristics of thepopulation of Turkey is its age composition. Theshare of young people is relatively high because ofthe country’s high birthrate. The birthrate is declin-ing, but it is predicted to remain higher than theEuropean average in the coming decades (the pop-ulation growth rate was about 1.8 percent in the1990s). The high proportion of young people couldbe an advantage for Turkey because it includes ahigh share of active population, but it imposes aheavy burden on the educational system and makesemployment generation one of the main socialissues.
The employment rate as a percentage ofworking-age population (aged 15–64) is lower inTurkey than in the EU and other candidate countries.In 2000 the employment rate was only 48.2 percentin Turkey, whereas it was 63.2 percent in the EU andwell above 50 percent in all candidate countries (seetable 9.1 for data on Turkey, the EU, and candidatecountries with more than 5 million population).One of the main reasons for the low employmentrate in Turkey is the fact that the participation rate isalso low, especially for urban women. Turkey isexpected to experience an increase in its participa-tion rate in the future, which may intensify pressuresfor employment generation.
Self-employment rates and part-time and fixed-term employment rates5 seem to be quite high inTurkey (24.5 percent, 20.7 percent, and 10.0 per-cent, respectively). However, the majority of theself-employed and part-time employed are workingin agriculture, and the fixed-term employment isdominant in the construction sector. Therefore,these rates basically reflect sectoral specificities andthe importance of these sectors (agriculture andconstruction) in total employment.
In Turkey, the share of agriculture in totalemployment is extremely high (34.5 percent);among all candidate countries, it is second to that
226 Turkey: Economic Reform and Accession to the European Union

of Romania (45.2 percent). Because the share ofagriculture is expected to decline in the future, thistransformation may tend to lower the participationrate (the participation rate for urban women ismuch lower than that for rural women) and addanother source of demand for urban male jobs,mainly in the services sector. The share of servicesin total employment in Turkey is much lower thanthat in the EU and candidate countries, but againwith the exception of Romania where the agricul-tural sector is predominant.
The unemployment data reveal that there couldbe substantial differences between the labor marketsin Turkey and the EU. The unemployment rate inTurkey is relatively lower. Moreover, the youthunemployment rate is significantly lower, especiallycompared to major candidate countries, in spite of ahuge influx of the young people into the labor force.Most interesting, the long-term unemploymentrate6 (as a percentage of labor force) is very low, only1.3 percent, although it is 3.7 percent in the EU, 9.5percent in Bulgaria, 3.1 percent in Hungary, 7.3 per-
cent in Poland, and 3.4 percent in Romania. Theproportion of long-term unemployed in totalunemployed in Turkey is also very low, only 20 per-cent in 2000. Among all large candidate countries,the lowest rate after Turkey is observed in Poland(45 percent), and the EU average is about 47 per-cent. These data seem to suggest that Turkey hasmaintained a high rate of labor market flows so that,in spite of a huge youth population and the growingdemand for new jobs, the rate of long-term unem-ployment remains relatively low. In other words,Turkey has quite a dynamic labor market.
The labor market indicators summarized intable 9.1 also reveal that employment generation is amajor issue in Turkey. The demand for labor mustincrease at a high rate to keep the rate of unemploy-ment at the existing level. One of the main determi-nants of labor demand is, of course, the cost oflabor. Table 9.2a presents the data on labor costs,income tax, and employees’ and employers’ socialsecurity contributions (SSCs) for a single individualwithout children in OECD countries in 2002.
Labor Market Policies and EU Accession: Problems and Prospects for Turkey 227
TABLE 9.1 Employment Indicators: EU and Selected Group of CandidateCountries, 2000a
Turkey EU Bulgaria Hungary Poland Romania
Total population (thousands) 64,059 370,914 6,832 9,927 30,535 22,338Population aged 15–64 (thousands) 41,147 247,708 5,502 6,760 25,652 15,213Total employment (thousands) 20,579 165,537 2,872 3,807 14,518 10,898Employment rate (% population aged 15–64) 48.2 63.2 51.5 55.9 55.1 64.2FTE employment rate (% population 49.3 57.9 50.3b 56.0 53.0b 63.8
aged 15–64)c
Self-employed (% total employment) 24.5 15.0 14.7 14.5 22.5 25.4Part-time employment (% total employment)c 20.7 17.8 3.4b 3.6 10.6 16.4Fixed-term contracts (% total employment)c 10.0 13.6 5.7b 5.8 4.2 1.6Employment in services (% total employment) 47.3 69.0 54.0 59.8 50.3 29.0Employment in industry (% total employment) 18.2 26.7 32.8 33.8 31.1 25.8Employment in agriculture 34.5 4.3 13.2 6.5 18.7 45.2
(% total employment)Unemployment rate (% labor force) 6.6 7.9 16.2 6.6 16.3 7.0Youth unemployment rate (% labor force 13.2 15.5 33.3 12.3 35.7 17.8
aged 15–24)Long-term unemployment rate 1.3 3.7 9.5 3.1 7.3 3.4
(% labor force)
Note: FTE � full-time equivalent.a. Candidate countries with more than 5 million population in 2000.b. Data for 2001.c. Calculated from Turkish State Institute of Statistics; Household Labour Force Statistics (SIS 2000b).Sources: Turkey: SIS 2000b; all other countries: European Commission DG for Employment and SocialAffairs 2002.

Table 9.2b presents the same data for various familytypes and wage levels.
Three striking observations about Turkey emergefrom the data presented in tables 9.2a and 9.2b. First,the average labor cost for employers is substantiallylower in Turkey than in the developed OECD coun-tries, but it is relatively higher than in some majorcandidate countries (Hungary, Poland, and theSlovak Republic). The tax wedge (the proportion ofincome tax and employers’ and employees’ SSCs inlabor cost) for a single individual without children is
close to the EU average and lower than the oneobserved in most of the candidate countries.
Second, the tax wedge does not differ much inTurkey across family types and wage levels. Forexample, the lowest tax wedge exists for an individ-ual without any children earning 67 percent of theaverage wage rate (41.3 percent) and the highest foran individual without any children earning 167 per-cent of the average wage rate (44.3 percent); thedifference is only 3 percentage points. In all EUcountries (with the exception of Greece), the tax
228 Turkey: Economic Reform and Accession to the European Union
TABLE 9.2a Income Tax Plus Employees’ and Employers’ Social SecurityContributions, 2002a
(percent of labor costs)
Social Security Contributions LaborIncome Tax Employee Employer Total Costs (US$)b
Australia 24 0 0 24 33,964Austria 8 14 23 45 34,030Belgium 21 11 24 55 43,906Canada 18 6 7 31 34,793Czech Rep. 8 9 26 43 18,631Denmark 32 11 1 43 36,690Finland 20 5 20 45 35,513France 9 9 29 48 32,856Germany 17 17 17 51 42,197Greece 0 12 22 35 20,570Hungary 13 9 24 46 11,934Iceland 21 0 5 26 25,379Ireland 10 4 10 24 27,775Italy 14 7 25 46 35,709Japan 6 9 10 24 32,287Korea, Rep. of 2 6 8 16 32,116Luxembourg 7 12 12 32 37,573Mexico 2 1 13 16 10,295Netherlands 6 19 10 36 36,019New Zealand 20 0 0 20 26,629Norway 19 7 11 37 36,262Poland 5 21 17 43 16,268Portugal 4 9 19 32 15,376Slovak Rep. 5 9 28 42 13,249Spain 10 5 23 38 27,156Sweden 18 5 25 48 33,345Switzerland 9 10 10 30 37,710Turkey 12 12 18 42 17,367United Kingdom 14 7 8 30 32,557United States 15 7 7 30 34,650
a. Single individual without children at the income level of the average production worker. Note that suchworkers do not receive family benefits.b. Annual labor cost per worker, U.S. dollars with equal purchasing power.Source: OECD 2002.

wedge differences between various categories ofworkers are much wider. These figures show thatincome tax and social security structures in Turkeydo not have a social policy component that favorsdisadvantaged groups.
Third, significant differences appear acrosscountries in terms of the shares of income taxesand SSCs. For example, the tax wedge is almost thesame for Denmark and Austria, but the share ofincome tax is 32 percent in Denmark and only
8 percent in Austria. In other words, there are sub-stantial intercountry differences in the compositionof cuts on labor costs.
These observations indicate that anyone makingintercountry comparisons should be extremelycareful. There are significant differences in theinstitutional setups: different institutions may havesimilar functions, and there may be complementar-ities or substitutions between various institutionsand functions. Therefore, issues such as labor
Labor Market Policies and EU Accession: Problems and Prospects for Turkey 229
TABLE 9.2b Income Tax Plus Employees’ and Employers’ Contributions Less CashBenefits, by Family Type and Wage Level, 2002(percent of labor costs)
Single, Single, Single, Single, Married, Married, Married, Married,Family Type No Child No Child No Child 2 Children 2 Children 2 Children 2 Children No Child
Wage Levela 67 100 167 67 100–0 100–33b 100–67b 100–33b
Australia 19.7 23.6 32.0 �10.5 14.7 16.8 19.2 20.3Austria 39.9 44.8 50.0 16.3 29.6 31.9 34.4 42.5Belgium 48.9 55.3 61.1 32.9 40.1 42.5 48.5 49.8Canada 26.8 30.8 31.8 4.6 20.9 24.5 27.4 27.9Czech Rep. 41.8 43.5 45.8 18.0 28.7 35.4 39.3 42.3Denmark 40.4 43.4 51.2 15.8 30.9 35.7 38.4 40.5Finland 40.4 45.4 51.2 26.7 38.5 37.4 39.3 42.5France 37.8 47.9 50.5 30.1 39.2 37.8 39.9 43.0Germany 45.9 51.3 55.8 29.1 32.5 38.7 43.0 45.9Greece 34.3 34.7 40.2 34.3 35.1 34.9 34.8 35.3Hungary 42.0 46.3 54.8 17.7 30.2 32.1 34.9 44.2Iceland 19.4 25.8 31.0 �6.4 1.9 12.3 19.0 19.4Ireland 16.6 24.5 34.4 �13.3 9.0 13.5 16.9 19.1Italy 42.7 46.0 49.9 25.4 34.0 39.3 41.8 42.9Japan 23.2 24.2 27.1 20.4 20.3 21.8 22.6 23.3Korea, Rep. of 14.8 16.0 20.3 14.4 15.4 15.0 15.3 15.3Luxembourg 27.3 31.5 39.0 1.3 9.0 12.8 15.4 25.9Mexico 11.4 16.1 22.4 11.4 16.1 13.4 14.2 13.4Netherlands 37.2 35.6 40.4 18.2 25.2 29.1 32.6 33.6New Zealand 18.8 20.0 25.7 1.6 18.2 19.2 19.5 19.2Norway 33.8 36.9 43.5 14.0 27.2 29.2 31.4 34.5Poland 41.4 42.7 43.8 36.5 37.7 41.4 42.2 41.4Portugal 29.5 32.5 38.0 18.9 23.4 24.6 27.1 30.2Slovak Rep. 40.3 41.4 44.7 23.8 29.6 34.1 35.9 40.5Spain 33.9 38.2 41.9 28.3 31.4 34.5 34.7 35.7Sweden 45.9 47.6 52.0 35.3 40.5 41.3 42.7 46.6Switzerland 27.0 29.6 33.8 12.6 18.1 20.5 23.6 27.3Turkey 41.3 42.4 44.3 41.3 42.4 41.7 41.9 41.7United Kingdom 24.7 29.7 32.9 �10.8 18.2 18.0 22.4 24.7United States 27.3 29.6 35.2 5.0 17.6 22.7 25.0 27.8
a. Percentage of the wage rate for an average production worker.b. Two-earner family.Source: OECD 2002.

market flexibility must be studied within a largerframework that encompasses all institutions inter-acting with each other.
Turkey and EU Labor Market Policies
Turkey must fulfill the accession criteria and adoptthe regulatory framework required for EU member-ship. This process will lead to a rather dramatictransformation in the Turkish labor market throughtwo channels. First, the membership process implieseconomic integration with the EU, and competitionin all markets will be intensified. Indeed, Turkeyshould ensure “the existence of a functioning mar-ket economy as well as the capacity to cope withcompetitive pressure and market forces within theUnion” to satisfy the economic criteria for member-ship—that is, the so-called Copenhagen criteria.Second,Turkey is required to apply fully the acquis ofthe EU in force,7 including all rules and regulationsin the field of employment and social policy thatform Chapter 13 in accession negotiations.
Turkey has had a customs union with the EUsince 1996. Therefore, the impact of the process ofmembership on the labor market through changesin product markets could be expected to be limited.The adoption of the acquis would have a directimpact on the labor market, because it requires anew institutional setup and a new way of formingpolicy. In this section, we compare the labor law inTurkey with the EU directives and assess the effectsof adopting the acquis. We focus on the labor lawand issues related to labor market flexibility.8 Wealso briefly analyze how employment policies areformed in the EU (the European EmploymentStrategy) and how the candidate countries areexpected to adjust employment policies and coor-dinate them with the EU during the membershipprocess.9
The EU Law
The EU law is composed of three different types oflegislation: primary legislation, secondary legisla-tion, and case law. These types of legislation com-pose the acquis communautaire.10
Primary Legislation Primary legislation includesthe treaties establishing the European Union andother agreements having similar status. The treatieshave been revised several times (for all treaties,see the EU Web site, http://europa.eu.int/eur-lex/
lex/en/treaties/index.htm). The Treaty of Amster-dam, which was signed by the heads of state or gov-ernment of the member states on October 2, 1997,and entered into force on May 1, 1999, promoted aseries of social policy priorities at European Com-munity level, especially in the area of employment.The change in emphasis on employment isreflected in the fact that the employment articlesare included in the treaty as a title (like the mone-tary and economic articles), not as a mere chapter.The employment title (Title VIII of the treaty) laysdown the principles and procedures for developinga coordinated strategy for employment. Article 125sets the basic objectives as follows:
Article 125: Member States and the Communityshall, in accordance with this title, work towardsdeveloping a coordinated strategy for employ-ment and particularly for promoting a skilled,trained and adaptable workforce and labourmarkets responsive to economic change with aview to achieving the objectives defined in Arti-cle 2 of the Treaty on European Union and inArticle 2 of this Treaty.
The treaty maintains the commitment toachieving a high level of employment as one of thekey objectives of the EU, and it calls attention topromoting “a skilled, trained and adaptable work-force and labour markets responsive to economicchange.” This objective is an issue of “common con-cern” for all member states.
The Treaty of Amsterdam, like earlier treaties,leaves the implementation of employment policy tothe member states, but it obliges member states andthe Community to work toward developing a“coordinated strategy for employment,” becausethe labor market policies of a member state willhave a direct impact on other member states aswell. Article 128 sets out the specific steps leadingto the formulation of such a strategy, including, onan annual basis, guidelines for employment, possi-ble recommendations to the member states, and ajoint report by the Council of the European Unionand the Commission to the European Councilthat describes the employment situation in theEuropean Community and the implementation ofthe guidelines. Each member state is to provide theCouncil of the European Union and the Commis-sion with an annual report on the principal meas-ures taken to implement its employment policy inlight of the guidelines for employment.
230 Turkey: Economic Reform and Accession to the European Union

Finally, the treaty provides a legal base for theanalysis, research, exchange of best practices, andpromotion of incentive measures for employment(Article 129), and it establishes permanent, consti-tutionally based institutional structures (Article130, Employment Committee) that will help todevelop employment policies.
Secondary Legislation The EU secondary legisla-tion is based on the treaties and takes the followingforms:
• Regulations, which are directly applicable andbinding in all member states without the needfor any national implementing legislation.
• Directives, which bind member states as to theobjectives to be achieved within a certain timelimit while leaving to the national authorities thechoice of form and means to be used. Directiveshave to be implemented in national legislationin accordance with the procedures of the indi-vidual member states.
• Decisions, which are binding in all their aspectsfor those to whom they are addressed. Thus,decisions do not require national implementinglegislation. A decision may be addressed to anyor all member states, to enterprises, or toindividuals.
• Recommendations and opinions, which have nobinding force. The Commission can make a rec-ommendation for a party to behave in a particu-lar way without any legal obligation, or it candeliver an opinion to assess a given situation ordevelopment in the Community or individualmember states.
The EU secondary legislation on employment ismainly regulated through European Council direc-tives, which bind member states to the objectives tobe achieved within a certain time limit but leavethem the choice of form and means to be used. Inother words, the directives are implemented innational legislation in accordance with the proce-dures of the individual member states. Most ofthe employment directives can be implementedthrough collective agreements, provided suchagreements apply to all workers that the directiveintends to cover or to protect.
The secondary legislation, like the treaty itself,directly confers certain individual rights on the cit-izens of member states under the protection of thejudicial system. Moreover,
[u]nder article 226 EC (ex article 169 EC) theEuropean Commission or a Member State maybring a complaint, alleging the failure by aMember State to fulfil an obligation under theTreaty, before the European Court of Justice(ECJ or the Court). Grounds for a complaintmay be, for example, the lack of transposition ofa binding Directive, or the non repeal of anational rule that is not consistent with theTreaty or a Directive. If the Court finds that theobligation has not been fulfilled, the MemberState concerned must comply without delay. If,after new proceedings are initiated by the Com-mission, the Court finds that the Member Stateconcerned has not complied with its judgment,it may impose a fixed or a periodic penalty.(Bronstein 2003)11
Case Law Case law includes judgments of theEuropean Court of Justice and of the EuropeanCourt of First Instance, for example, in response toreferrals from the Commission, national courts ofthe member states, or individuals. In this study,we do not cover the case law on employmentregulations.
Council Directives on Employment and the Turkish Labor Law
Turkey has begun to change its laws and regulationsin accordance with the acquis. In this section, wecompare the European Council directives onemployment with the Turkish labor laws, both thenew Labor Law No. 4857 enacted by the TurkishParliament on May 22, 2003, and the former LaborLaw No. 1475 that regulated the labor market fordecades. We compare both the former and newlabor laws because the new law has been in force fora few months and the agents in the labor market arein the process of adapting to the new circum-stances. This comparison will also make it possibleto show how far the new law goes in adopting theacquis. As mentioned earlier, we focus only onemployment directives and not on directives onother labor-related issues such as discrimination,free mobility of workers, and health and safety reg-ulations (for a comprehensive study of all directivesas of 2001, see Hermans 2001). Table 9.3 comparesthe EU directives,12 the existing labor law, and theformer labor law.13 It summarizes the main issuesand regulations addressed in each directive.
Labor Market Policies and EU Accession: Problems and Prospects for Turkey 231

232
TABLE 9.3 EU Directives and Turkish Labor Law
Directive Date of Issue Former Labor Law No. 1475 New Labor Law No. 4857(Entry into Force) Issues/Regulations (Relevant Articles) (Relevant Articles)
93/104 Organization of • Normal weekly work • � • � (45 hours)working time • Maximum week time • � • �November 23, 1993 • Minimum period of daily rest • � • �(November 23, 1996) • Minimum period of weekly rest • � • �
• Minimum period of annual leave • � • �• Shift work • � • �• Night work (information/health) • � (excl. men) • �• Patterns of work • � • �
(Articles 41, 43, 49, 61–65, 73) (Articles 41, 46, 53–70)
99/70 Framework agreement • Definition of fixed-term work No specific clause on • �on fixed-term work • Definition of “comparable fixed-term work • ?(UNICE/CEEP/ETUC) permanent worker”June 28, 1999 • Abuse arising from the use of • ? (no limit)(July 10, 1999) successive fixed-term contracts
• Rights of fixed-term workers • �• Information/training • ? / −
(Article 8 defines only temporary (Articles 11–12)and permanent work)
97/81 Framework agreement • Definition of fixed-time work No specific clause on • �on part-time work • Definition of “comparable part-time work • ?(UNICE/CEEP/ETUC) full-time worker”December 15, 1997 • No shift from full-time to part-time • �(January 20, 2000) work without consent
• Rights of part-time workers • �• Information/training • ? / −
(Article 8 defines only temporary (Article 13)and permanent work)
98/59 Collective redundancies • Definition of collective redundancy • �/� (changed by Law No. 4773) • �July 20, 1998 • Information and consultation • �/� (changed by Law No. 4773) • � (excl. A 2.3.b.v and vi)(September 1, 1998) • Procedure • �/� (changed by Law No. 4773) • �
(Article 24) (Article 29)

233
2001/23 Employees’ rights in • Employees’ rights • � • �the event of transfers • Employers’ liabilities • � • �March 12, 2001 • Information and consultation (Articles 14, 53; • �(April 12, 2001) Law No. 2822, Article 8) (Article 6)
80/987 Protection of employees • Claims No specific clause (Law No. 2004 • �in the event of insolvency • Guarantees (guarantee on bankruptcy, Article 206; • �(Amended by 2002/74) institution) workers’ claims have priority in
Oct. 20, 1980/Sept. 23, 2002 • Coverage the event of insolvency) • �(Oct. 28, 1983/Oct. 8, 2002) (Article 33)
94/33 Protection of young • Definition of “young” • � • �people at work • Employers’ obligations • � • �June 22, 1994 • Restrictions • � • (to be regulated by(June 22, 1996) (Article 67; also regulated by the MESS)
law on apprenticeship and (Articles 71–73, 85, 87)vocational training, No. 3308)
91/533 Information for • Information content • �? • �?employees • Time limits • � • �October 14, 1991 • Enforcement • � • �(June 30, 1993) (Articles 9 and 11) (Article 8)
2002/14 Consultation and • Information content • � • �employee representation • Coverage • � • �March 11, 2002 • Procedures/enforcement • � • �(March 23, 2005/2007)
Note: A positive mark (+) for a labor law indicates that it is in conformity with the directive. A negative sign (−) indicates either that the law does not satisfy therequirements set by the directive or that the issue is not addressed in the law. A question mark (?) indicates that the issue is not addressed in a well-defined way orthat there are some differences between the law and the directive. The third and fourth columns refer to relevant articles of the new labor law. UNICE = Union of Industrial and Employers’ Confederations of Europe; CEEP = European Centre of Enterprises with Public Participation; ETUC = European Trade Union Confederation;MESS = Ministry of Employment and Social Security.Source: The authors.

Turkey, like the member states, can comply withthe directives either by adopting the laws, regula-tions, and administrative provisions, or by introduc-ing the required provisions through an agreementbetween the employers’ and workers’ representa-tives. For example, some directives have been intro-duced in some member states through collectiveagreements. However, Turkish lawmakers seem toprefer to cover almost all provisions of the directivesin the new labor law. Therefore, the lack of regula-tions in the labor law may require further legislativework.14
Council Directive 93/104 on certain aspects ofthe organization of working time is one of the maindirectives regulating working conditions. Thedirective lays down minimum safety and healthrequirements for the organization of working time;it applies to minimum periods of daily rest, weeklyrest, and annual leave; to breaks and maximumweekly working time; and to certain aspects ofnight work, shift work, and patterns of work. Thedirective brings flexibility to working time by set-ting the minimum requirements for the “averageworking time” for a reference period not exceedingfour months. Labor Law No. 1475 does not complywith the directive for the maximum average workweek (48 hours). Although the proposal for the newlaw prepared by the Scientific Committee intro-duced the maximum limit to the average workweek, Parliament failed to adopt the provisions anddid not set any explicit limit for the weekly workingtime. This is surprising because the new law waspromoted by its proponents as introducing flexibleworking arrangements, including part-time work.The new law also failed to meet the requirement ofthe directive on annual leave. Although the direc-tive states that “every worker is entitled to paidannual leave of at least four weeks,” the new law setsshorter periods on the basis of a worker’s tenure (ifa worker is employed 1–5 years, annual leave is only14 days; 6–14 years, 20 days; and more than 14years, 26 days). The former labor law had a similarscheme, but two days shorter leave for all cate-gories. Both the new and former labor laws also failto take the measures necessary “to ensure that anemployer who intends to organize work accordingto a certain pattern takes account of the generalprinciple of adapting work to worker, with a view,in particular, to alleviating monotonous work andwork at a predetermined work-rate, depending on
the type of activity, and of safety and healthrequirements, especially as regards breaks duringworking time” (Article 13 of Directive 93/104).
Directive 97/81 on part-time work and Directive99/70 on fixed-term work have adopted the frame-work agreements on part-time and fixed-termwork, respectively, between the general cross-country organizations UNICE (Union of Industrialand Employers’ Confederations of Europe), CEEP(European Centre of Enterprises with Public Par-ticipation), and ETUC (European Trade UnionConfederation). The social partners (UNICE,CEEP, and ETUC) recognize that “contracts of anindefinite duration are, and will continue to be, thegeneral form of employment relationship betweenemployers and workers,” but follow the conclusionsof the Essen European Council on the need totake measures with a view toward “increasing theemployment-intensiveness of growth, in particularby a more flexible organization of work in a waywhich fulfills both the wishes of employees and therequirements of competition.” Thus, the main aimof these directives is to facilitate the development ofpart-time and fixed-term work on a voluntary basisand to contribute to the flexible organization ofworking time by providing measures for the removalof discrimination against part-time and fixed-termworkers and by improving the quality of part-timeand fixed-term work. These directives require that,in relation to employment conditions, part-timeand fixed-term workers not be treated in a lessfavorable manner than comparable full-time andpermanent workers. The former labor law did notspecifically define part-time and fixed-term con-tracts. Although the new law complies with thedirectives to a large extent, it does not include thereference to the “applicable collective agreement” inthe definition of “comparable worker.”15 The direc-tive on fixed-term work explicitly calls for the pre-vention of abuse arising from the “use of successivefixed-term employment contracts or relationships.”The new law, however, does not impose any restric-tion on the cumulative duration or the number ofsuccessive contracts, but allows successive fixed-term contracts if there is a “sound reason” (esaslıneden) to do so.
Directive 98/59, which deals with the approxi-mation of the laws of the member states related tocollective redundancies, introduced the proceduresan employer should follow in contemplating
234 Turkey: Economic Reform and Accession to the European Union

collective redundancies. The former labor law hadnot envisaged any formal procedure for collectiveredundancies. However, the law on employmentprotection (No. 4773), adopted by Parliament onAugust 15, 2002, and effective as of March 15, 2003,after a lengthy political struggle, replaced Article 24in compliance with the directive. Law No. 4773 hasbeen repealed by the new labor law, which endorsesthe same procedure for collective redundancies(Article 29).
Directive 2001/23 (which repealed Directive77/187) and its amending directive (98/50) arerelated to the protection of workers’ rights in theevent of transfers of undertakings, businesses, orparts of undertakings or businesses. Directive 80/987(which was amended by Directive 2002/74) regu-lates the protection of employees in the event of theinsolvency of their employers. The directive ontransfers stipulates that the “transferor’s rights andobligations arising from a contract of employmentor from an employment relationship existing onthe date of transfer shall, by reason of such transfer,be transferred to the transferee,” and the transferorand the transferee shall be jointly and individuallyliable with respect to obligations, including collec-tive agreements, that arose before the date of trans-fer from a contract of employment or from anemployment relationship existing on the date oftransfer (Article 3). Moreover, both the transferorand the transferee shall be required to inform rep-resentatives of their respective employees affectedby the transfer. The labor law and the law on collec-tive bargaining agreements (Law No. 2822) haveprovided similar safeguards to protect employees’rights. The new labor law complies with most of theprovisions of the directive, with the exception ofthose on “information and consultation” withemployees (the third chapter).
Directives 80/987 and 2002/74 set rules to protectemployees’ claims arising from contracts ofemployment or employment relationships in theevent of their employer’s insolvency. The directivestates explicitly that the member states may notexclude from its scope part-time employees, work-ers with fixed-term contracts, and workers with atemporary employment relationship. Memberstates “shall take the necessary measures to ensurethat guarantee institutions guarantee . . . paymentof employees’ outstanding claims, resultingfrom contracts of employment or employment
relationships, including, provided for by thenational law, severance pay on termination ofemployment relationships” (Article 3). The formerlabor law did not specifically address the issue ofemployees’ rights in the case of insolvency. How-ever, the law on bankruptcy (No. 2004) assigns pri-ority to workers’ outstanding claims. The new lawcalls for the creation of a Wage Guarantee Fund as apart of the Unemployment Insurance Fund to pro-tect employees’ claims, excluding severance pay.16
Directive 94/33 provides the measures necessaryto prohibit work by children (any person under15 years of age or who is still subject to compulsoryfull-time schooling under national law) and theminimum working conditions for young people(any person under 18 years of age). The labor lawprohibits employment of any person under 13 yearsof age and restricts employment of people under15. The law on apprenticeship and vocational train-ing (No. 3308) also regulates the employment ofchildren and young people. The new law satisfiesmost of the provisions set by the directive, andrefers to the Ministry of Employment and SocialSecurity (MESS) for regulation of the employmentconditions for young people.
Directive 91/533 states that employers have anobligation to provide an employee with informa-tion in the form of a written document on theessential aspects of the contract or employmentrelationship not later than two months after thecommencement of employment. The former laborlaw had a similar clause but did not specify the timelimit in which the information has to be providedto the employee. The new law, in accordance withthe directive, mentions that the document has to behanded over to the employee within two months ifthere is no employment contract signed by theemployee and employer. Although the directiverequires that any change in the conditions referredto in the written document “must be the subject ofa written document to be given by the employer tothe employee at the earliest opportunity and notlater than one month after the date of entry intoeffect of the change in question,” the new law doesnot enforce this requirement.
Directive 2002/14, published in the EU’s OfficialJournal on March 23, 2002, establishes a generalframework for informing and consulting employeesin the European Community. The directive requiresall undertakings employing at least 50 employees,
Labor Market Policies and EU Accession: Problems and Prospects for Turkey 235

or all establishments employing at least 20 employ-ees in any one member state, to adopt practicalarrangements for exercising the right to informa-tion and consultation at the appropriate level.Information and consultation shall cover:
(a) information on the recent and probable devel-opment of the undertaking’s or the establish-ment’s activities and economic situation;
(b) information and consultation on the situation,structure and probable development ofemployment within the undertaking or estab-lishment and on any anticipatory measuresenvisaged, in particular where there is a threatof employment;
(c) information and consultation on decisionslikely to lead to substantial changes in workorganization or in contractual relations.
Information shall be provided by the employer“at such time, in such fashion and with such con-tent as are appropriate to enable, in particular,employees’ representatives to conduct and ade-quately study and, where necessary, prepare forconsultation.” A related directive (Directive 94/45)on the establishment of a European Works Councilsets the rules and procedures to improve the right toinformation and to consultation of employeesspecifically in Community-scale undertakings andCommunity-scale groups of undertakings. The newlabor law does not provide any provisions to estab-lish the framework for informing and consultingemployees within the context of these directives.
There are also directives on parental leave(96/34),17 health and safety conditions (89/391 and91/383), and working conditions in specific sectors(93/104, 99/63, 2000/34, 2000/79, and others). TheTurkish labor law is in compliance with most of theprovisions of these directives.
European Employment Strategy
The European Council Summits The treatiesestablishing the European Community haveassigned the responsibility for employment andsocial protection exclusively to the member states.The role of the European Commission was to pro-mote cooperation between the member states at theEU level. In the early 1990s, persistent European-wide unemployment and structural problems inthe labor markets, together with the increased inte-
gration of national economies, led to a process ofseeking European solutions through closer cooper-ation and convergence of structural policies,including the employment and social protectionpolicies.
The issuance of the EU’s famous “Delors’ WhiteBook” on Growth, Competitiveness and Employmentin 1993 set the scene for the development of coor-dinated employment policies at the EU level.Inspired by the White Book, the European Councilin Essen in 1994 agreed on five objectives18 and for-mulated the Essen Strategy, which was reinforcedby successive Council conclusions and resolutions.A permanent Employment and Labour MarketCommittee was created in 1996. The Essen Strategydeclared a political commitment to the issue ofemployment, but the strategy itself and its imple-mentation were based on nonbinding conclusionsof the European Councils. The Treaty of Amsterdam(signed in 1997 and entered into force in 1999) andthe new Title on Employment provided the neces-sary legal framework for implementing a coordi-nated employment policy.
The European Council in Luxembourg (November1997), which is now known as the Luxembourg JobsSummit, launched the European EmploymentStrategy on the basis of the new provisions ofthe employment title of the Treaty of Amsterdambefore it entered into force. The following EuropeanCouncils have provided additional orientations andtargets for the EES and reinforced its links withother EU policies.
The European Council in Lisbon (March 2000)set a new strategic goal for the EU for the nextdecade (“to become the most competitive anddynamic knowledge-based economy in the world,capable of sustainable economic growth with moreand better jobs and greater social cohesion”) andintegrated the EES into a wider framework of pol-icy coordination to achieve this strategic goal. TheEuropean Council agreed on the objective ofachieving an employment rate as close as possibleto 70 percent overall, and exceeding 60 percent forwomen, on average in the EU by 2010. After themidterm review of the first three years of imple-mentation, the Council proposed strengthening theEES.
The European Council in Nice (December2000) introduced the issue of quality as the guid-ing thread of the Social Policy Agenda, and in
236 Turkey: Economic Reform and Accession to the European Union

particular quality in work as an important objec-tive of the EES.
Confirming the commitment of the EU and itsmember states to the goal of full employment, theEuropean Council in Stockholm (March 2001)added two intermediate and one additional target:the employment rate should be raised to 67 percentoverall by 2005, to 57 percent for women by 2005,and to 50 percent for older workers (aged 55–64) by2010.
The Barcelona European Council (March 2002)underlined that the full employment goal in theEU is at the core of the Lisbon strategy and consti-tutes an essential goal of economic and social poli-cies. It called for a reinforced EES to underpin theLisbon strategy in an enlarged EU. After the 2002evaluation, the Barcelona Council also urged theCouncil and the Commission to streamline thevarious policy coordination processes at the EUlevel.
The Brussels European Council (March 2003)reiterated that the EES has the leading role in theimplementation of the employment and labor mar-ket objectives of the Lisbon strategy, and that it andthe Broad Economic Policy Guidelines (BEPG)should operate in a consistent way. The EuropeanCouncil called for the guidelines to be limited innumber and for them to be results-oriented inorder to allow member states to design the appro-priate mix of action.
The 2002 Evaluation of the European Employ-ment Strategy The EES, from its inception in1997 to its evaluation in 2002, was based on four“pillars” (employability, entrepreneurship, adapt-ability, and equal opportunities) together with hor-izontal objectives. In its fifth year, an extensive eval-uation was conducted to give an overview of theobjectives of the EES and to strengthen the policyformulation and implementation processes. Thestudy (European Commission 2002d) noted:
The comprehensive approach of the EES gener-ally strengthened national employment policycoherence and framework. Policies under eachpillar were progressively adjusted and employ-ment priorities were mainstreamed into otherpolicy areas like taxation and social security. Inaddition, the Strategy has brought about a grad-ual change in priority from managing unem-ployment to managing employment growth,
and has become gradually embedded in nationalpolicy formulation.
Beyond the clear convergence towards theactive labour market principles of the EES in theearlier years of the strategy, the evaluation showsthat other policies were also significantly influ-enced by the EES (notably gender equality andsocial inclusion policies). . . . Over the years, theEES has added momentum to longer term struc-tural reforms in labour markets, not leastthrough the use of recommendations, addressedto individual Member States, adopted by theCouncil on a proposal from the Commission.
The EES also fostered political agreement onnew common paradigms, such as lifelong learn-ing and quality in work. The need for lifelonglearning, and the complementarity betweeneducation and training systems, has becomegenerally accepted, and Member States are all inthe process of re-designing their education andtraining policies in a more integrated way. Qual-ity in work appeared as a new priority in theEmployment Guidelines for 2000.
Streamlining Policy Processes After the BarcelonaCouncil, the Commission adopted its communica-tion on streamlining the annual economic andemployment policy coordination cycles (EuropeanCommission 2002a and 2003a). The main idea is toreorganize existing EU coordination processesaround a few key points to make the coordinationcycle more transparent and intelligible and tostrengthen its visibility and impact. In line with theoverall Lisbon strategy, this process is expected toreinforce the focus on the medium term and toimprove policy coherence.Within the new approach,the BEPGs are expected to provide the overarchingeconomic policy coordination, and the leading roleon employment policy coordination will lie with theEmployment Guidelines (EGs) and Recommenda-tions to Member States.
The main building blocks of a better and moreclearly articulated policy coordination cycle can bebriefly described as follows (European Commission2003c and 2003d):
(i) Preparation of the Spring European Council.The Commission would, in its Spring Report,highlight the main areas where furtherprogress has to be made and the key policy ori-entations on which general guidance is
Labor Market Policies and EU Accession: Problems and Prospects for Turkey 237

required from the Spring European Council.The Spring Report would be complementedand presented together with the Implementa-tion Package (including the ImplementationReport on the BEPGs, the draft Joint Employ-ment Report, and the implementation reporton the Internal Market Strategy). The Com-mission’s various reports and scoreboards(including inter alia the Cardiff Report; thestate aids, innovation, and enterprise policyscoreboards) will feed into the Implementa-tion Package and the Spring Report. ThisCommission input would assist differentCouncil formations, as well as any other appro-priate actor, in reviewing implementation intheir specific policy areas.
(ii) The Spring European Council. The SpringEuropean Council is a defining moment in theannual policy coordination cycle. It reviewsimplementation and, on that basis, gives gen-eral political orientations on the main policypriorities.
(iii) Commission proposals for new guidelines andrecommendations. On the basis of the SpringEuropean Council political orientations, theCommission would present its proposals forfurther action in the various policy areastogether in a Guidelines Package (which wouldinclude the Commission drafts for general andcountry-specific policy recommendations ascontained in the BEPGs, the EGs, and theannual employment recommendations tomember states). This Package, the first ofwhich would be issued in April 2003, would, inprinciple, cover a three-year period, i.e., up to2006. The guidelines would continue to beissued every year to take account of possiblemajor new developments, but should other-wise remain stable until 2006, unless circum-stances require otherwise. Consistent with therecommendations of the BEPGs and the out-come and conclusions of the Cardiff process,the Internal Market Strategy—which willaccompany the Guidelines Package—woulddeal with internal market matters at a Commu-nity level up to 2006, and would be adjusted inthe intervening years only if necessary.
(iv) Adoption of new guidelines and recommenda-tions. After, where appropriate, further prepa-ration by the competent Council formations
ahead of the June European Council and fol-lowing the latter’s consideration, the relevantCouncil formations would adopt the BEPGs,the EGs and the Employment Recommenda-tions to member states and/or endorse actionplans (e.g., the Internal Market Strategy) intheir competence areas.
(v) Concentration of implementation review inQuarter 4. A better streamlined review ofimplementation requires:• Systematic information provision by mem-
ber states on the implementation of policiesagreed on at European level. In this context,there may be scope for rationalizing andstreamlining current national reportingrequirements. Fewer and more comprehen-sive reports, allowing also for coverage ofinformation on newly identified issues(thus avoiding the need to add new reportsand procedures), might help in clarifyingand ensuring the coherence of memberstates’ responses to policy recommenda-tions issued by the Community; thesereports should ideally be presented togetherin October at the latest. The NationalEmployment Plans would be sent as a sepa-rate document around the same time.
• An implementation assessment by theCommission. On the basis of the availableinformation (through reports, throughbilateral contacts, and through the results ofvarious benchmarking exercises), the Com-mission services would assess implementa-tion in the various relevant policy areas.The Commission will present the findings
of its review in the form of a new Implementa-tion Package together with the Commission’sSpring Report in mid-January, marking thestart of a new cycle.
The 10 Commandments, Targets, and IndicatorsThe European Council has identified and con-firmed three objectives for the EES:
1. Full employment. Employment rate overall,67 percent in 2005 and 70 percent in 2010 onaverage; for women, 57 percent in 2005 and 60percent in 2010; for older workers, 50 percent in2010.
238 Turkey: Economic Reform and Accession to the European Union
2. Quality and productivity at work. Satisfactionwith pay and working conditions, health andsafety at the workplace, the availability of flexi-ble work organization, working time arrange-ments, and balance between flexibility and secu-rity. Full attention is given to increasingproductivity, in particular through continuedinvestment in human capital, technology, andwork organization.
3. Cohesion and an inclusive labor market. Thereduction of unemployment and of the remain-ing disparities in access to the labor market,both in socioeconomic and regional terms, is amatter of both the equity and efficiency of theEES.
To support these three objectives, the Commis-sion has identified 10 priorities (10 command-ments) for action in the new guidelines:
1. Help unemployed and inactive to find a job,prevent long-term unemployment
2. Encourage entrepreneurship and improve cli-mate for business start-ups
3. Promote adaptability of workers and firms tochange
4. Provide more and better investment in humancapital
5. Increase labor supply and promote active aging6. Promote gender equality in employment
and pay7. Combat discrimination against disadvantaged
groups8. Improve financial incentives to make work pay9. Reduce undeclared work substantially
10. Promote occupational and geographicmobility.
The Commission has also defined specific tar-gets that could be used as a part of an assessment ofprogress on implementing the guidelines:
• Personalized job search plan for all unemployedbefore fourth month of unemployment by 2005
• Work experience or training for all unemployedbefore 12th month of unemployment (before sixmonths for young and vulnerable) by 2005
• Thirty percent of long-term unemployed inwork experience or training by 2010
• Reduction of 15 percent in rate of accidents atwork and a reduction of 25 percent for high-risksectors by 2010
• Eighty percent of persons aged 25–64 to have atleast upper secondary education by 2010
• Increased rate of participation of adults in edu-cation and training, to 15 percent on average inthe EU and to at least 10 percent in every mem-ber state by 2010
• Increased investment by companies in trainingof adults from the existing level of the equivalentof 2.3 percent of labor costs up to 5 percent oflabor costs on average in the EU by 2010
• An increase in the effective average exit age fromthe labor market from 60 to 65 years on averagein the EU by 2010
• Elimination of gender gaps in employment andhalving of gender pay gaps in each member stateby 2010
• Child care places available for 33 percent of chil-dren aged 0–3 and 90 percent of those from 3years to mandatory school age in each memberstate by 2010
• Halving of the school dropout rate in eachmember state and reduction of EU averagedropout rate to 10 percent by 2010
• Reduction by half in each member state in theunemployment gaps for people defined as beingat a disadvantage in accordance with nationaldefinitions by 2010
• Reduction by half in each member state in theemployment gap between non-EU and EUnationals by 2010
• All job vacancies advertised by national employ-ment services accessible and able to be consultedby anyone in the EU by 2005
• National targets to be set for business training,reduced red tape for start-ups, per capita increasein public and private investment in humanresources, tax burden on low-paid workers, andundeclared work.
EU Labor Market Policies and Enlargement In1999 the European Commission initiated a cooper-ation process on employment with the candidatecountries. The objective of this process is toencourage those countries to define employmentpolicies that prepare them for membership of theEU and progressively adjust their institutions andpolicies. Moreover, the financial support for acces-sion would be directed toward the employmentpolicy priorities identified in this cooperationprocess (European Commission 2003b).
Labor Market Policies and EU Accession: Problems and Prospects for Turkey 239

It was agreed that as a first step the candidatecountries and the Commission would analyze thekey challenges for employment policies in JointAssessment Papers (JAPs). The work was startedwith background studies funded by the Commis-sion in cooperation with the European TrainingFoundation. The first JAPs were signed with theCzech Republic, Estonia, Poland, and Slovenia in2000 and early 2001, followed by Cyprus, Hungary,Lithuania, Malta, and Slovakia in late 2001 andearly 2002 and by Bulgaria and Romania in thefall of 2002. The JAP with Latvia was signed inFebruary 2003. Cooperation with Turkey is at anearly stage; the background study for the Employ-ment Policy Review was prepared in early 2003under the auspices of the Turkish EmploymentOrganization (ISKUR)—see Tunalı and others(2003). This study will form the basis of the JAP tobe drawn up with the European Commission.
The candidate countries and the Commissionagreed to monitor the implementation of the JAPcommitments. After signature of the JAPs, the maincommitments were discussed in a series of techni-cal seminars between the Commission and repre-sentatives of different institutions in the candidatecountries. The Göteborg European Council of June2001 asked candidate countries to translate the EUeconomic, social, and environmental objectivesunderpinning the Lisbon strategy into theirnational policies and announced that the SynthesisCommunication 2003 would include informationabout the candidate countries on this subject.
Employment Protection and LaborMarket Flexibility in Turkey
The growing interest in labor market flexibility hasprovided an impetus for empirical studies that aimat measuring the degree of labor market flexibility,mainly at the national and regional levels.Researchers have developed two sets of measures.The first set of measures, pioneered by the OECD’sinfluential study on employment protection legisla-tion, is based on indicators of labor market regula-tion that summarize the information on the regula-tory environments. The OECD has constructed adatabase of internationally comparable data oncertain economy-wide and industry-specific prod-uct market and labor market regulations (forthe methodology, the database, and summary
indicators, see Nicoletti, Scarpetta, and Boylaud2000). Because the OECD database allowsresearchers to make international comparisons andto analyze the impact of labor market regulationson economic performance in a cross-country set-ting, it has led to a surge in empirical studies andestimation of similar indicators for other countries.For example, Riboud, Sánchez-Páramo, and Silva-Jáuregui (2002), Cazes and Nesporova (2003), andHeckman and Pagés (2004) have calculated EPLindicators for Latin American, Central and EasternEuropean (CEE), and transition countries, respec-tively. In a similar fashion, Betcherman, Luinstra,and Ogawa (2001) present a detailed analysis oflabor market regulations in 17 countries, includingTurkey. In this section, we will compare the strin-gency of the EPL in Turkey under the former laborlaw (which formed the basis of the OECD indica-tors) and under the new labor law with that in theOECD countries.
The second set of measures, which we define asdirect measures, are based on the estimation of var-ious aspects of labor market flexibility using thedata on labor market variables. In this study, weuse three types of direct measures to assess thelabor market flexibility in Turkey: wage differen-tials, job turnover, and mode-based indicators(employment and wage flexibility).
Employment Protection Legislation
The OECD EPL index, calculated by Nicoletti,Scarpetta, and Boylaud (2000), exploits the rawdata published in the OECD Employment Outlook1999 (OECD 1999). The data cover two basic ele-ments of the EPL system—restrictions on dis-missals of workers with regular contracts, andrestrictions on the use of temporary forms ofemployment contracts—and refer to the situation inmost of the OECD countries in the late 1980s aswell as in 1998.
Regulations for regular contracts (permanentemployment) cover detailed indicators on
• Procedural requirements (the process that has tobe followed from the decision to lay off a workerto the actual termination of the contract)
• Notice and severance pay (for three tenure peri-ods beyond any trial period)
• Prevailing standards and penalties for “unfair”dismissals.
240 Turkey: Economic Reform and Accession to the European Union

The following elements were considered for reg-ulations for temporary contracts (fixed-term con-tracts and contracts under temporary work agen-cies, TWAs):
• “Objective” reasons under which a fixed-term(or a TWA) contract could be offered
• The maximum number of successive renewals• The maximum cumulated duration of the
contract.
Nicoletti, Scarpetta, and Boylaud (2000)assigned a score of 0–5 to each indicator, dependingon the degree of stringency of employment protec-tion implied by that indicator, and conducted a fac-tor analysis to aggregate the detailed indicators ofeach domain (regular employment and temporaryemployment) into summary indicators of the strin-gency of regulation by domain. The overall index ofstringency of the EPL (EPL index) was obtained bysimply averaging the two summary indicators forregular and temporary contracts. The factor analy-sis was conducted on the 1998 regulatory indicatorsfor 21 OECD countries for which most informa-tion was available.
Table 9.4 presents the summary indicators for25 countries (ranked in descending order by thestringency of the EPL index) for the late 1990s.Turkey has a very high overall score (ranked sec-ond), mainly because of its score from the tempo-rary employment domain (index value 4.6, thehighest among all countries in the table).
Table 9.5 presents basic indicators—the EPL andEPL index scores—for regular employment for fivecountries: Germany (a leading country case fromthe EU, and Turkey’s main trade partner), Spain (alatecomer in the EU), Poland (a case for candidatecountries), the United States (the extreme caseamong the OECD countries), and Turkey. The datafor Turkey are presented in two columns. The firstcolumn refers to the situation prevailing under theformer labor law (No. 1475), and the data weretaken from Nicoletti, Scarpetta, and Boylaud(2000). The second column refers to the current sit-uation with the new labor law (No. 4857). The val-ues of some indicators are based on our assessment.Table 9.6 presents the same data for temporaryemployment.
Table 9.5 reveals that the EPL index scores forregular employment for Turkey are higher thanthose for other countries mainly because of high
severance payments after 4 and 20 years of tenure, atrial period before the eligibility arises, and unfairdismissal compensation (20 years of tenure).Because the new labor law changes these provi-sions, there is a significant reduction in the EPLindex values for regular employment. The EPLindex scores for temporary employment are higherthan those of the other countries because of therestrictions on fixed-term contracts and the lack oflegal framework for TWAs. The draft labor law hadspecial provisions on the TWAs, but these provi-sions were left out of the law adopted by Parlia-ment. The new labor law allows, with the writtenconsent of the worker, temporary transfer betweenenterprises belonging to the same holding com-pany, or between different companies if the worker
Labor Market Policies and EU Accession: Problems and Prospects for Turkey 241
TABLE 9.4 Employment Protection Legislation Index: OECD Countries, Late 1990s
EPL Index
Regular TemporaryAverage Contracts Contracts
Portugal 3.7 4.3 3.2Turkey 3.6 2.6 4.6Greece 3.5 2.6 4.5Italy 3.3 3.0 3.6Spain 3.2 2.8 3.7France 3.1 2.5 3.7Norway 2.9 2.9 2.8Germany 2.8 3.0 2.5Japan 2.6 3.0 2.3Austria 2.4 2.8 2.0Netherlands 2.4 3.2 1.5Sweden 2.4 3.0 1.8Belgium 2.1 1.6 2.6Finland 2.1 2.3 1.9Poland 1.9 2.3 1.4Czech Rep. 1.7 3.0 0.5Denmark 1.5 1.7 1.2Hungary 1.4 2.2 0.6Switzerland 1.3 1.3 1.2Australia 1.1 0.9 1.2Ireland 1.0 1.7 0.3New Zealand 1.0 1.6 0.5Canada 0.6 0.9 0.3United Kingdom 0.5 0.7 0.3United States 0.2 0.1 0.3
Source: Nicoletti, Scarpetta, and Boylaud 2000.

242
TABLE 9.5 Employment Protection Legislation for Regular Employment, Selected OECD Countries
United TurkeyGermany Poland Spain States L. 1475 L. 4857
Employment Protection LegislationRegular procedural inconveniences
Procedures Scale 0–3 2.5 2.0 2.0 0.0 2.0 1.0Delay to start of notice Days 17.0 13.0 1.0 1.0 1.0 1.0
Notice and severance pay for no-fault individual dismissals by tenure categoriesNotice period after
9 months Months 1.0 1.0 1.0 0.0 1.0 1.04 years Months 1.0 3.0 1.0 0.0 2.0 2.020 years Months 7.0 3.0 1.0 0.0 2.0 2.0
Severance pay after9 months Months 0.0 0.0 0.5 0.0 0.0 0.04 years Months 0.0 0.0 2.6 0.0 4.0 0.020 years Months 0.0 0.0 12.0 0.0 20.0 0.0
Difficulty of dismissalsDefinition of unfair dismissal Scale 0–3 2.0 0.0 2.0 0.0 0.0 0.0Trial period before eligibility arises Months 6.0 1.8 2.5 n.a. 2.0 2.0Unfair dismissal compensation (20 years) Months 24.0 3.0 22.0 n.a. 26.0 6.0Extent of reinstatement Scale 0–3 1.5 2.0 0.0 0.5 0.0 0.0

243
Employment Protection Legislation Index ScoresRegular procedural inconveniences
Procedures 5.0 4.0 4.0 0.0 4.0 2.0Delay to start of notice 2.0 2.0 0.0 0.0 0.0 0.0
Notice and severance pay for no-fault individual dismissals by tenure categoriesNotice period after
9 months 3.0 3.0 3.0 0.0 3.0 3.04 years 2.0 4.0 2.0 0.0 4.0 4.020 years 4.0 2.0 1.0 0.0 1.0 1.0
Severance pay after9 months 0.0 0.0 1.0 0.0 0.0 0.04 years 0.0 0.0 4.0 0.0 6.0 0.020 years 0.0 0.0 4.0 0.0 6.0 0.0
Difficulty of dismissalsDefinition of unfair dismissal 4.0 0.0 4.0 0.0 0.0 0.0Trial period before eligibility arises 3.0 5.0 5.0 0.0 5.0 5.0Unfair dismissal compensation (20 years) 4.0 0.0 4.0 0.0 5.0 1.0Extent of reinstatement 3.0 4.0 0.0 1.0 0.0 0.0
n.a. Not applicable.Sources: Nicoletti, Scarpetta, and Boylaud 2000; authors’ assessment for Law No. 4857.

244
TABLE 9.6 Employment Protection Legislation for Temporary Employment, Selected OECD Countries
United TurkeyGermany Poland Spain States L. 1475 L. 4857
Employment Protection LegislationFixed-term contracts
Valid cases other than the usual objective reasons Scale 0–3 2.5 3.0 1.0 3.0 0.0 2.0Max. number of successive contracts Number 4.0 2.0 3.0 No limit 1.5 No limitMax. cumulative duration Months 24.0 No limit 36.0 No limit No limit No limit
Temporary work agencies (TWAs)Types of work for which TWA employment is legal Scale 0–4 3.0 4.0 2.0 4.0 0.0 4.0Restrictions on number of renewals Yes/no Yes Yes Yes No limit n.a. n.a.Max. cumulative duration of temporary work Months 12.0 No limit 36.0 No limit n.a. n.a.
contracts
Employment Protection Legislation Index ScoresFixed-term contracts
Valid cases other than the usual objective reasons 1.0 0.0 4.0 0.0 6.0 2.0Max. number of successive contracts 2.0 4.0 3.0 0.0 5.0 0.0Max. cumulative duration 3.0 0.0 2.0 0.0 0.0 0.0
Temporary work agencies (TWAs)Types of work for which TWA employment is legal 1.5 0.0 3.0 0.0 6.0 4.0Restrictions on number of renewals 4.0 4.0 4.0 2.0 n.a. n.a.Max. cumulative duration of temporary work 4.0 0.0 6.0 0.0 n.a. n.a.
contracts
n.a. Not applicable.Sources: Nicoletti, Scarpetta, and Boylaud 2000; authors’ assessment for Law No. 4857.

is employed in a similar position, up to 12 monthsin total. For fixed-term contracts, the law does notimpose any restriction on the maximum cumula-tive duration or renewal. Thus the new law providesflexibility, under the OECD definition, for tempo-rary employment.
Figure 9.1 shows the EPL index for the samegroup of countries and the contribution of eachmain category (factors) on the EPL index. As evi-dent in the figure, the changes introduced by thenew labor law (No. 4857) have dramaticallyreduced the EPL index for Turkey, mainly by mak-ing temporary employment easier. The index valuewould be much smaller had the new law providedthe legal basis for TWAs.
Although the EPL measures are used extensivelyin empirical studies, they have four known short-comings. First, there are significant measurementproblems. As Addison and Teixeira (2001) men-tion, measuring the stringency of employmentprotection merely from the legal texts may not be agood indicator of the monetary costs to employers,
because the costs to employers depend on variousother factors, such as voluntary turnover and theoccupational and tenure distributions of the laborforce that define the entitlements for severance pay.
Second, the coverage of the law and regulations isvery important. The OECD EPL index almost com-pletely ignores the coverage issue. The EPL index isa simple average of the indexes for regular and tem-porary employment, although temporary employ-ment accounts for only 20 percent of wage earnersin Turkey. Moreover, the employment protectionprovisions of the new law do not cover establish-ments employing fewer than 30 workers, leavingmore than 40 percent of workers registered at theSocial Insurance Institution (Sosyal SigortalarKurumu, SSK) without protection (HouseholdLabour Force Survey 2000 data). The law alsoexcludes certain sectors and activities.
Third, enforcement and implementation of thelaw are a major issue in countries such as Turkey. AsBertola, Boeri, and Cazes (1999) discuss in detail,the EPL is enforced to different degrees, and a sim-ple ranking of countries on the basis of legal provi-sions may lead to misleading results.
Finally, the existing EPL measures do not reflectthe links and interactions between the EPL andother labor market institutions, such as unemploy-ment benefit schemes, wage-setting institutions,early retirement, and pensions. Some of these insti-tutions could be substitutes, some others comple-mentary. According to Bertola, Boeri, and Cazes(2000, p. 13),
Protection against job loss is all the more desir-able when only scant unemployment insuranceis available, and unemployment insurance ishighly appreciated when weak job security pro-visions increase the risk of job loss. Indeed, insome countries job security—especially case lawfavourable to employees—does appear to beinversely correlated to the coverage and level ofunemployment insurance (suggesting a trade-off between the strictness of EPL and the unem-ployment benefit system, as in Denmark, Italy orSpain, for example) or other adjustment toolssuch as early retirement provisions.
Blanchard (2002) observes that there is aninverse relation between the degree of employmentprotection and the generosity of the state unem-ployment insurance system in continental Europe.
Labor Market Policies and EU Accession: Problems and Prospects for Turkey 245
0.0
0.5
1.0
1.5
2.0
2.5
3.5
3.0
4.0
Germ
any
EPL index
Poland
Spain
USA
Turke
y, La
w
No. 1
475
Turke
y, La
w
No. 4
857
RE/Procedural inconvenienceRE/Direct cost of dismissalsRE/Notice and trial period
TE/ProceduresTE/Maximum duration
FIGURE 9.1 Employment ProtectionLegislation, Selected OECDCountries
Note: RE = regular employment; TE = temporaryemployment.Sources: Nicoletti, Scarpetta and Boylaud 2000;authors’ assessment for Law No. 4857.

He explains this inverse relationship by suggestingthat these institutions are two different ways ofaddressing the same failures, each one more appro-priate to the circumstances of the country. This isexactly the case in Turkey. Unemployment insur-ance legislation was enacted in 1999 (Law No. 4447),and it began to provide unemployment benefits forthose eligible in 2002. Therefore, severance pay wasconsidered as a kind of protection and insuranceagainst unemployment in the implementation ofthe former labor law, and it proved to be easier tochange the provisions on severance pay in the newlabor law after introducing the unemploymentinsurance system in the country.
There is almost a consensus on the impact ofthe EPL on flows from and into unemployment(Jackman, Layard, and Nickell 1996; Blanchard2000). On the one hand, stricter EPL decreaseshiring, which, in turn, makes it difficult for theunemployed to find a new job and thus increaseslong-term unemployment. On the other hand,stricter EPL also decreases firing and decreases(short-term) unemployment. The net effect onunemployment is ambiguous.
Blanchard (2000) discovers a negative correla-tion between flow into unemployment and theOECD EPL ranking (figure 9.2) and a positive cor-relation between unemployment duration and theEPL (figure 9.3), but no correlation at all betweenthe unemployment rate and the EPL (figure 9.4), as
predicted by the theory. The Turkish data,19 notincluded in Blanchard’s study, are also plotted infigures 9.2–9.4. Turkey is an apparent outlier in fig-ure 9.2, and in figure 9.3 to a lesser extent. In otherwords, the data on flow into unemployment sug-gest less strict employment protection than isimplied by the OECD index. This discrepancycould be regarded as confirmation of the caveatsabout relying on the EPL as an indicator of flexibil-ity for a country such as Turkey.
Direct Measures of Labor Market Flexibility
Rigidities in labor markets are expected to changethe behavior of economic agents and labor marketoutcomes. In this study, we use three measuresthat could reflect the extent of labor marketrigidities. Because of the lack of internationallycomparable data, we focus on the manufacturingindustries.20
Wage differentials tend to be lower in countrieswith rigid labor markets, because various labormarket institutions, especially labor unions andminimum wage legislation, usually aim at wagecompression across sectors and different categoriesof workers.
Figure 9.5a depicts the data on the evolution ofinterindustry wage differentials21 for a selectedgroup of countries for the period 1980–2000.Throughout the period, Turkey had much wider
246 Turkey: Economic Reform and Accession to the European Union
0.0
0.5
1.0
1.5
2.0
2.5
3.0
0 2 4 6 8 10 12 14 16 18 20
Flow into unemployment (percent)
POR
ITA
SPA
GRE
SWE
GER
BEL
NOR
NETFRA
FIN
AUS
DEN
IRE
TR
GBR
CANUS
Employment protection index
FIGURE 9.2 Flow into Unemployment and Employment Protection: Selected Countries, 1985–94
Sources: Blanchard 2000; Turkey for 2000–02, authors’ calculations from Turkish State Institute of Statistics,Household Labour Force Survey.

interindustry wage differentials than the UnitedStates (the benchmark case for flexible labor mar-kets), Greece and Spain (two EU countries), andHungary and Poland (two candidate countries). Asmight be expected, Poland and Hungary had rela-tively low wage differentials in the 1980s, but theyhave experienced a widening gap in interindustrywages since the late 1980s because of their transi-tion toward a market economy. Wage differentialsin Turkey increased in the late 1980s when real
wages increased rapidly in the post-military period,and they declined in the period of wage depressionsin the late 1990s. The same data are presented fordeveloped EU countries and the United States infigure 9.5b. Among all the developed countriesdepicted in figure 9.5b, the United States has thehighest wage differentials in the manufacturingindustry and the Scandinavian countries have thelowest. The data in figures 9.5a and 9.5b seem toconfirm the widely held belief that the Scandinavian
Labor Market Policies and EU Accession: Problems and Prospects for Turkey 247
0
10
20
30
5
15
25
35
40
45
0 2 4 6 8 10 12 14 16 18 20
Unemployment duration
Employment protection index
US
GBR
CAN
IRE
DEN
AUSFIN
FRA NET
NOR
BEL
GER
SWE
GRE
SPA
ITA
TR
POR
FIGURE 9.3 Unemployment Duration and Employment Protection: Selected Countries, 1985–94
Sources: See figure 9.2.
0
10
20
5
15
25
0 2 4 6 8 10 12 14 16 18 20
Unemployment rate (percent)
Employment protection index
POR
TR
ITA
SPA
GRE
SWE
GER
BEL
NOR
NET
FRA
FIN
AUS
DEN
IRE
CANGBR
US
FIGURE 9.4 Unemployment Rate and Employment Protection: Selected Countries, 1985–1994
Sources: See figure 9.2.

248 Turkey: Economic Reform and Accession to the European Union
countries have more equal income and wage distri-bution as a result of their specific centralized wage-setting institutions.
Rigidities in labor markets make the cost of fir-ing, and the potential cost of hiring, higher. Thusexpansion and contraction of firms will be morecostly, new firm formation will be limited, and theexit rate will be lower. All those factors will reducejob turnover. Table 9.7 presents the data on jobturnover for selected countries. The rate of jobturnover for Turkey is calculated only for manufac-turing establishments employing more than 10workers. For Chile, Colombia, and the United States,job turnover data are available only for the manufac-
turing industry. For all other countries, the data areavailable for the whole economy. The U.S. data seemto suggest that the job turnover rate is lower in themanufacturing industry than in other sectors.
The average job turnover rate for the Turkishmanufacturing industry for the period 1980–2000is 21 percent—that is, the proportion of jobs cre-ated and abolished in a year is 21 percent of all jobsavailable. The rate for Turkey is somewhat higherthan the one observed in the United States andslightly lower than those in Colombia and Chile.Although cross-country comparisons do presentsome problems, it could be claimed that the jobturnover rate in Turkey is high. Table 9.8 presents
0.00
0.02
0.04
0.05
0.01
0.03
0.06
1980
1981
1982
1983
1984
1985
1986
1987
1988
1989
1990
1991
1992
1993
1994
1995
1996
1997
1998
1999
2000
Coefficient of variation of (log) industry wages
Turkey Greece Spain Hungary Poland USA
FIGURE 9.5a Interindustry Wage Differentials: Selected Countries, 1980–2000
Source: Authors’ calculations from UNIDO data.
0.00
0.02
0.04
0.05
0.01
0.03
0.06
1980
1981
1982
1983
1984
1985
1986
1987
1988
1989
1990
1991
1992
1993
1994
1995
1996
1997
1998
1999
2000
Coefficient of variation of (log) industry wages
Austria Denmark Finland Germany
Italy Sweden U.K. USA
FIGURE 9.5b Interindustry Wage Differentials: Selected Countries, 1980–2000
Source: Authors’ calculations from UNIDO data.

the same data for the public sector and private sec-tor by size categories for two subperiods, 1980–90,and 1990–2000. The job turnover rate is muchhigher in the private sector, especially among smallestablishments, because of high rates of entry andexit. Job turnover stemming from expansion andcontraction dominates entry and exit for medium-size and large establishments. There seems to be aslight increase in the job turnover rate in the 1990s.
Model-based indicators are extensively used inempirical studies to assess employment and wageflexibility (see, e.g., Nickell and Layard 1999;
Fabiani and Rodriguez-Palenzuela 2001; Plasmansand others 2002). These indicators are based on thecoefficients of adjustment terms or elasticities inemployment or wage equations.
Employment flexibility can be defined as thespeed of adjustment of employment in a labordemand equation. A simple dynamic conditionallabor demand equation can be written as
(9.1) Lt,i = βi + β1Lt-1,i + β2Qt,i + β3wt,i + εt,i
where L, Q, and w refer to the number of employed,real output, and real product wage, respectively. All
Labor Market Policies and EU Accession: Problems and Prospects for Turkey 249
TABLE 9.7 Job Turnover, Selected Countries
Period Entry Expansion Exit Contraction Turnover
Turkey (M) 1980–2000 4.8 6.7 4.1 5.5 21.0Chile (M) 1980–1995 4.7 9.1 4.7 7.2 25.8Colombia (M) 1978–1891 5.3 6.6 5.1 6.7 23.8United States (M) 1984–1988 1.4 6.7 2.7 7.7 18.6United States 1984–1991 8.4 4.6 7.3 3.1 23.4Canada 1983–1991 3.2 11.2 3.1 8.8 26.3France 1984–1991 6.1 6.6 5.5 6.3 24.4Germany 1983–1990 2.5 6.5 1.9 5.6 16.5Italy 1987–1992 3.8 7.3 3.8 6.2 21.0United Kingdom 1985–1991 2.7 6.0 3.9 2.7 15.3
Note: M � manufacturing industries.Sources: Bertola, Boeri, and Cazes 1999; authors’ calculations from Turkish State Institute of Statistics data.
TABLE 9.8 Job Turnover in Turkish Manufacturing Industries(percent)
PrivatePublic Small Medium Large Average
1981–90
Entry 1.6 14.5 7.1 3.0 4.4Expansion 2.8 4.7 9.7 8.5 6.8Contraction 4.5 8.0 6.3 3.4 4.7Exit 1.3 14.9 5.4 2.7 3.8Turnover 10.3 42.1 28.4 17.6 19.7
1991–2000
Entry 0.4 20.2 8.5 3.1 5.2Expansion 2.1 3.6 8.1 7.7 6.6Contraction 6.5 10.3 6.8 5.4 6.2Exit 2.6 17.9 5.7 2.6 4.4Turnover 11.7 52.1 29.3 18.8 22.3
Source: Authors’ calculations from Turkish State Institute of Statistics data.

variables are in log form. The subscripts t and idenote time and the cross-sectional unit (industryor firm), respectively; ε denotes the usual errorterms. The coefficient of the lagged employment,β1, measures the speed of adjustment, and the coef-ficient of the wage variable, β3, the wage elasticity oflabor demand.
The wage equation can be defined in a similarway and can be used to estimate the effects of inde-pendent variables on wages. In real wage equations,the unemployment rate is usually included in themodel to estimate the degree of real wage flexibility,because the coefficient of the unemploymentterm reflects how sensitive real wages are to theunemployment level. If the rate of unemploymentis higher than the NAIRU (nonaccelerating infla-tion rate of unemployment), then the real wage isexpected to decline to clear the market—that is, astatistically significant negative coefficient isexpected for the unemployment term. The absolutevalue of the coefficient will indicate how fast thelabor market adjusts.
Because of the lack of data, we estimated onlythe dynamic labor demand equation for a group ofOECD and candidate countries by using panel dataat the International Standard Industrial Classifica-tion (Rev. 2) three-digit level for the period1980–2000. The GMM (generalized method ofmoments) technique is used to estimate the modelin difference form. Figure 9.6 plots the adjustmentparameter against the wage elasticity. Because a
military government ruled the country in the early1980s, we reestimated the same equation for Turkeyfor the 1990s. As is the case of almost all othermeasures, the United States seems to have a flexiblelabor market for the manufacturing industries. Theadjustment parameter is small, which implies fastadjustment, and the wage elasticity is high. The rateof adjustment is rather slow in Turkey, but it seemsto gain speed in the 1990s.
Only a few empirical studies measure wage flex-ibility for Turkey. Onaran (2002), who estimated awage equation by using panel data at the industrylevel, found that real wages are quite flexible in thepost-1980 period.22 The findings by Ilkkaracan andSelim (2002) on the basis of a cross-sectional esti-mation of an individual-level wage equation sug-gest that there is a statistically significant negativecorrelation between wages and regional unemploy-ment rates. Separate regressions for men andwomen, however, show a wage curve to exist only inthe male labor market. Unemployment elasticity ishigher in the private sector, supporting the anec-dotal evidence that the private sector has more flex-ible employment practices that the public sector.
The evidence presented here suggests that theEPL in Turkey is “rigid,” but the legislation excludesa large part of the economy—legally, small busi-nesses and certain sectors, and illegally, the infor-mal sector. There are enforcement problems in theformal sector as well. Some measures studied hereshow that the labor market for the manufacturing
250 Turkey: Economic Reform and Accession to the European Union
�0.70
�0.50
�0.10
�0.60
�0.30
�0.20
�0.40
0.00
0.20 0.30 0.40 0.50 0.60 0.70 0.80
Wage elasticity
Adjustment parameter
TurkeyTurkey,1990s
US
Austria
Finland
Sweden
Spain
UK
Denmark
Poland
Italy Hungary
FIGURE 9.6 Labor Demand Adjustment Speed and Wage Elasticity: Selected Countries, 1980–97
Source: Authors’ estimates from UNIDO data.

industry, which is probably the most regulated andunionized sector, is quite flexible. Moreover, thenew labor law provides a legal basis for flexibleemployment practices such as part-time and fixed-term employment.
Problems and Prospects: An Assessment
The labor market institutions in Turkey will con-front four major challenges in the next decade23:
1. Dealing with the continuing decline in the shareof agriculture in total employment by creatingmore jobs, especially in the services sector.
2. Increasing the employment rate—most impor-tant, by increasing the participation rate forurban women. This step will require a substantialincrease in employment opportunities for urbanwomen, especially an increase in part-time jobs.
3. Investing in the education and training of theyoung people in Turkey, whose share of thepopulation will remain quite high comparedwith the shares in the EU and candidate coun-tries. This demographic window of opportunityfor the Turkish economy can turn into an obsta-cle for development if the educational systemfails to raise the skills level of the young people.
4. Eliminating the informal sector that continuesto be an important source of low-quality, low-wage jobs. The informal sector is still a source ofsurvival for a huge number of small andmedium-size enterprises (SMEs) that enjoy flex-ible employment practices and are able to avoidpaying taxes, SSCs, and so forth. This sectorhelps to curb the pressures on employment, butat the same time, it hinders the generation ofbetter jobs by the formal sector.
The prospect of EU membership has sparkedchanges in Turkey’s legal framework and labormarket institutions so that it can adopt the Com-munity acquis. Against the background of thesefour challenges, the likely effects of adopting andimplementing the acquis can be discussed at threelevels: (1) the impact of the new labor law that hasintroduced various directives (the short term), (2)the impact of adopting and implementing allemployment directives (the medium and longterm), and (3) the impact of designing andimplementing employment policies in line with theobjectives and targets of the EES.
The Impact of the New Labor Law
The new labor law (No. 4857) has introducedchanges in accordance with the European Commis-sion directives, but further reform in the labor lawand related regulations are needed to comply fullywith the acquis. The potential effects of the changesintroduced by the new labor law can be summa-rized as follows.
First, the new labor law has provided a legalbasis for “atypical” employment relationships—that is, part-time and fixed-term employment.This is the most welcome aspect of the new lawfor employers. However, as mentioned early inthis chapter, part-time employment is not wide-spread in Turkey (except in the agricultural sec-tor). Moreover, the average work week is quitelong, and the lobbying against implementing thedirective’s provision (93/104) on the maximumaverage work week (48 hours) has been effective.24
According to the Household Labour Force Statisticsof the State Institute of Statistics (SIS 2000b), 41.5percent of all paid workers work 50 hours orlonger a week. Therefore, the law is not expectedto have any significant impact on part-timeemployment. Because of the emphasis on labormarket flexibility, one might expect a tendencytoward the increasing use of fixed-term and sub-contract labor. The directives on part-time andfixed-term employment require “that, in respect ofemployment conditions, part-time and fixed-termworkers shall not be treated in a less favorablemanner than comparable full-time and perma-nent workers,” but it could be difficult to enforcethese provisions in the Turkish context, at least inthe medium term, because the Turkish labor lawdoes not provide sufficient safeguards to protectpart-time and fixed-term employees. Moreover,the law does not impose any restriction on thecumulative duration or the number of successivecontracts. Thus, employers are expected to lowerlabor costs by gradually switching to fixed-termcontracts and subcontract labor. However, thisstrategy, if it is thought to be the main strategy forimproving competitiveness, could easily turn outto be a “low road” labor flexibility practice thatmight lead to neglect of investment in humancapital.
Second, the new law reduces the cost of layoffs byestablishing a special Severance Payment Fund(SPF). Firms are required to pay a certain proportion
Labor Market Policies and EU Accession: Problems and Prospects for Turkey 251

of the wage bill to the fund, and it then covers all sev-erance payments. Thus the overall effect of thechange in the severance pay system is likely to reducefirms’ (hiring and firing) costs.
Third, the new labor law has included most ofthe articles of the law on employment protection(No. 4773), but reduced the coverage of employ-ment protection by excluding those establishmentsemploying fewer than 30 workers (Law No. 4773excluded only those employing fewer than 10 work-ers). Therefore, the new labor law has legally pro-vided extensive flexibility to small establishments.
To summarize, the changes introduced by thenew labor law address mainly the short-termconcerns of employers about achieving labor mar-ket flexibility. However, as shown in our earlieranalysis, even the labor market for the manufac-turing industry seems to be quite flexible. There-fore, excessive emphasis on labor market flexibilitymay lead to the adoption of a “defensive strategy”by firms that ignores the human capital, entrepre-neurship, and innovativeness that the Turkisheconomy needs to tackle the challenges listed ear-lier. This process may also delay the restructuringof the corporate sector, because it would tilt thefield of competition in favor of less productivefirms that reduce their costs by relying on atypicalemployment relations and avoiding all socialexpenditures.
The new labor law, by increasing flows from andto unemployment, is likely to change the structureof unemployment. The proportion of short-termunemployment may increase, just as it did, forexample, after the labor market reform in Colom-bia (Kugler 1999; Kugler and Cárdenas 1999).
The Impact of Adopting and Implementing the Employment Acquis
Although the new labor law has made someprogress in the field of social policy and employ-ment, it is still far from full alignment with theacquis. Therefore, Turkey needs to extensivelyamend its laws and regulations in order to complyfully with the acquis. As the comparison betweenthe new labor law and directives indicates, thoseprovisions that are not yet incorporated into thelabor law are exactly those that mean additionalcosts for firms (e.g., the provisions on themaximum work week and minimum period of
annual leave). These provisions, if implemented,may increase the firms’ costs by a few percentagepoints of the wage bill.
The most important discrepancy between theTurkish labor law (both the former one and thenew law) and the EU directives is the complete dis-regard of any social dialogue, employee participa-tion, and consultation in the Turkish labor law. AsTable 9.3 demonstrates, the new law does not referto the provisions of various directives regardinginforming workers, and it does not address at allDirective 2002/14 on consultation and employeerepresentation. Although the draft law prepared bythe tripartite Scientific Committee referred toemployees’ representatives, all these referrals wereomitted in the final version of the law adopted byParliament. Therefore, it is no surprise that theEuropean Commission’s report on the progresstoward accession by candidate countries points outthat “[s]teps have been taken in the field of socialpolicy and employment [in Turkey], but are notalways in full conformity with the acquis. There isan urgent need to develop and strengthen the con-ditions for a genuine social dialogue at all levels”(European Commission 2002e). The Regular Reporton Turkey’s Progress towards Accession (EuropeanCommission, 2002c) summarizes what needs to bedone, as follows:
As regards social dialogue, despite improve-ments for trade union rights in free trade zones,further progress needs to be made as a matter ofpriority to create the conditions for a free andgenuine bipartite as well as tripartite social dia-logue at all levels in line with the acquis. Turkeyshould make rapid progress towards establishingfull trade union rights that includes eliminationof restrictive thresholds for forming a tradeunion branch and requirement of 10% thresholdfor a trade union to be eligible for collective bar-gaining at company level. The law on public ser-vants’ trade unions, which was adopted in June2001 and which is not in line with the Commu-nity acquis and the relevant ILO Conventionsratified by Turkey, has not been amended. Thelaw contains a number of provisions whichentail significant constraints on the right toorganise in the public sector. Notably, there arerestrictive provisions relating to the exclusion ofthe right to strike and to collective bargaining.
252 Turkey: Economic Reform and Accession to the European Union

The percentage of the labour force covered bycollective agreements is extremely low; it is esti-mated to be below 15%. No social dialogue existsin most private enterprises, which may limit theproper implementation of the Communityacquis at enterprise level. . . . Promoting socialinclusion and developing a national employ-ment strategy in line with the European Employ-ment Strategy is a matter of priority.
Social dialogue and employee participation arecrucial for implementation of the acquis, but thecurrent emphasis on short-term solutions makes itdifficult to establish cooperative relationshipsbetween employers and employees.25
The Copenhagen criteria for membershipinclude the acquis criterion that highlights theimportance not only of incorporating the acquisinto national legislation, but also of ensuring itseffective application through the appropriateadministrative and judicial structures.26 Effectiveapplication of the acquis by extending the coverageto include the informal sector would be by far themost important impact of the accession process. Inother words, firms in the informal sector have to beforced to abide by laws and regulations—that is,they have to bear the costs of taxes and SSCs,together with the firms that had been complyingwith regulations. This process is likely to eliminatesome firms operating in the informal sector andlead to a painful adjustment process in the mediumterm. With the gradual elimination of the informalsector, the long-run effect is very likely to be posi-tive for productivity, growth, and employment. Asimple quantitative analysis is performed later inthis chapter to assess the impact of this process.
The Impact of Coordinating Employment Policies
Turkey as a candidate country has committed itselfto progressively adjusting its labor market institu-tions and employment policies and coordinatingthem with those of the EU. Turkey and the Euro-pean Commission are expected to analyze the keychallenges for employment policies in a JointAssessment Paper, and the JAP commitments willbe monitored systematically. This process of coop-eration and coordination is likely to have two cru-cial effects on policymaking in Turkey.
First, Turkey must establish the institutionalframework needed to design and implement
employment policies. This step requires makingmajor improvements in the national statistical sys-tem, strengthening the Turkish EmploymentOrganization (ISKUR), and so forth.27 Second, it ishoped that Turkey will implement, after decadesof neglect and disorientation, consistent and sys-tematic employment policies that bring forwardlong-term objectives. These policies should be inconformity with the three objectives of the EES(full employment, quality and productivity atwork, and cohesion and an inclusive labor market)that are also priority issues for Turkey. The “10commandments” (especially the objectives ofmore and better investment in human capital,gender equality in employment and pay, the elim-ination of undeclared work, and the promotion ofoccupational mobility) are likely to cause anupsurge in the short-term adjustment costs of thecorporate sector, although they would beextremely beneficial in the medium and long run.New employment policies are likely to have a sig-nificant positive impact on productivity andgrowth in the long term, if they are accompaniedby coherent competition, technology, and innova-tion policies.
A Simulation Analysis
Because the implementation of laws and regula-tions that cover the informal sector is likely to leadto the most important effect by far in the accessionprocess, here we conduct a simple simulation exer-cise to measure the order of magnitude of theseeffects in the private manufacturing industry.
The first step in any analysis of the informal sec-tor is likely to start with an estimation of its sizeand characteristics. Because there are almost nodata available for the informal sector, we make thefollowing assumptions:
• The SIS’s Household Labour Force Survey meas-ures total manufacturing employment. Thenumber of “informal workers” is equal to thenumber of people employed in microenter-prises.
• The SIS’s Annual Survey of ManufacturingIndustries (ASMI) reflects the average character-istics of establishments categorized by size.
• Informal sector firms do not pay any tax(including the income tax for employees) andSSCs.
Labor Market Policies and EU Accession: Problems and Prospects for Turkey 253
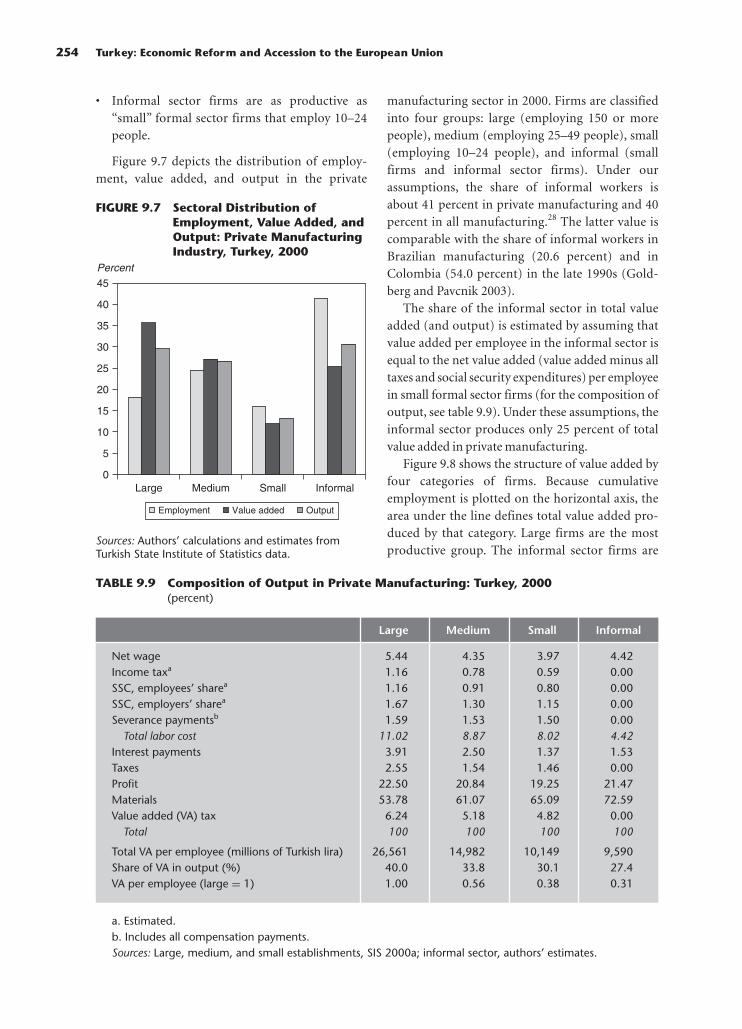
• Informal sector firms are as productive as“small” formal sector firms that employ 10–24people.
Figure 9.7 depicts the distribution of employ-ment, value added, and output in the private
manufacturing sector in 2000. Firms are classifiedinto four groups: large (employing 150 or morepeople), medium (employing 25–49 people), small(employing 10–24 people), and informal (smallfirms and informal sector firms). Under ourassumptions, the share of informal workers isabout 41 percent in private manufacturing and 40percent in all manufacturing.28 The latter value iscomparable with the share of informal workers inBrazilian manufacturing (20.6 percent) and inColombia (54.0 percent) in the late 1990s (Gold-berg and Pavcnik 2003).
The share of the informal sector in total valueadded (and output) is estimated by assuming thatvalue added per employee in the informal sector isequal to the net value added (value added minus alltaxes and social security expenditures) per employeein small formal sector firms (for the composition ofoutput, see table 9.9). Under these assumptions, theinformal sector produces only 25 percent of totalvalue added in private manufacturing.
Figure 9.8 shows the structure of value added byfour categories of firms. Because cumulativeemployment is plotted on the horizontal axis, thearea under the line defines total value added pro-duced by that category. Large firms are the mostproductive group. The informal sector firms are
254 Turkey: Economic Reform and Accession to the European Union
0
5
10
15
20
25
40
35
30
45
Large Medium Small Informal
Percent
Employment Value added Output
FIGURE 9.7 Sectoral Distribution ofEmployment, Value Added, andOutput: Private ManufacturingIndustry, Turkey, 2000
Sources: Authors’ calculations and estimates fromTurkish State Institute of Statistics data.
TABLE 9.9 Composition of Output in Private Manufacturing: Turkey, 2000(percent)
Large Medium Small Informal
Net wage 5.44 4.35 3.97 4.42Income taxa 1.16 0.78 0.59 0.00SSC, employees’ sharea 1.16 0.91 0.80 0.00SSC, employers’ sharea 1.67 1.30 1.15 0.00Severance paymentsb 1.59 1.53 1.50 0.00
Total labor cost 11.02 8.87 8.02 4.42Interest payments 3.91 2.50 1.37 1.53Taxes 2.55 1.54 1.46 0.00Profit 22.50 20.84 19.25 21.47Materials 53.78 61.07 65.09 72.59Value added (VA) tax 6.24 5.18 4.82 0.00
Total 100 100 100 100
Total VA per employee (millions of Turkish lira) 26,561 14,982 10,149 9,590Share of VA in output (%) 40.0 33.8 30.1 27.4VA per employee (large = 1) 1.00 0.56 0.38 0.31
a. Estimated.b. Includes all compensation payments.Sources: Large, medium, and small establishments, SIS 2000a; informal sector, authors’ estimates.

only 31 percent as productive as the larger firms.The share of labor costs, including severance pay-ments, in value added is 27.6 percent for largefirms, 26.3 percent for medium-size firms, and 26.6percent for small firms. The informal sector firmspay only 16.2 percent of value added as wages totheir employees.
If all informal sector firms and workers payincome and corporate taxes and SSCs, their salesprices will increase about 6 percent so that theyearn the same amount of profit and pay the samenet wage. The value added tax will add another 5percentage points. In other words, the benefit ofoperating in the informal sector is somewhathigher than 10 percent of the sales price (includingthe value added tax).
We conduct five simulations. In the first simula-tion (Case 1), we assume that all informal sectorfirms pay taxes and SSCs, but that there is nochange in the nominal output (size) of the manu-facturing industry. Therefore, an increase in pricescaused by the increase in the costs of informal sec-tor firms leads to a decline in demand of the sameproportion. We also assume that the market sharesof four categories of firms do not change.
When the informal sector firms pay taxes andSSCs, the total revenue of the government andsocial security institutions will increase to a largeextent. Therefore, we assume in Case 2 that the gov-
ernment reduces tax and social security rates sothat total tax and social security revenue remain thesame. This policy will help formal sector firms byreducing their costs.
Because the assumption on constant marketshares is not realistic given the fact that informalsector firms have to increase their prices, in thethird simulation (Case 3) we assume that the infor-mal sector firms lose half of their market shares.The next case (Case 4) adds a reduction in tax andsocial security rates to the Case 3 simulation.
Finally, in Case 5 we take into consideration thelong-term effects in Case 4 by assuming that totaloutput increases by 10 percent (as a result of pro-ductivity increases and other effects).
In all simulations, we assume that the structureand level of output remain the same for the for-merly formal sector firms. Nominal net wages andprofits for the informal sector firms are assumed toremain constant. Thus our analysis is limited to theeffects of reallocation of output between formaland informal sector firms within the same industry.
Table 9.10 summarizes the simulation results.The Base Case shows the current situation. Whenthe informal sector firms begin to pay taxes andSSCs (Case 1), the immediate impact will beobserved in a reduction in manufacturing employ-ment (4.3 percent; about 150,000 jobs are lost) afterthe decline in output. Total wage payments will also
Labor Market Policies and EU Accession: Problems and Prospects for Turkey 255
0
20,000
10,000
30,000
0 10 20 30 40 60 10050 80 9070
Millions of Turkish lira per employee
Cumulative employment (percent)
LARGE
MEDIUM
SMALLINFORMAL
Potential VA/actual VA � 1.63
Net wage Income tax SSC, employee’s share SSC, employer's share
Severance payments Taxes Profit Interest payments
FIGURE 9.8 Structure of Value Added in Private Manufacturing: Turkey, 2000
Source: Large, medium, and small establishments, SIS 2000a; informal sector, authors’ estimates.

decline (3.0 percent), but the average net wage willincrease, because the informal sector will experi-ence the highest employment loss. The share ofprofits in total output (the profit margin) willdecline by 3.2 percent. Meanwhile, there will be ahuge increase in tax and social security revenue(about 35 percent). In the second case, the govern-ment reduces the SSC rate by 28.5 percent, theincome tax rate by 26.4 percent, and the valueadded tax rate by 29.8 percent, so that total revenueremains at the base level. The reductions in tax andsocial security rates will help to moderate employ-ment losses (now only 1.5 percent) and the declinein the profit margin (0.2 percent).
If the informal sector firms exit en masse fromthe market because of their increasing costs (Case3), the impact on employment will be dramatic:although we assume there is no change in nominaloutput, the decline in employment will be 8.9 per-cent because of the lower output-to-labor ratio inthe informal sector. Because low-wage jobs will belost, there will be a substantial increase in the averagewage rate (8.7 percent) that will make employees as agroup not much worse off. In this case, tax and socialsecurity revenue will increase more than in Case 1because of higher average wages and income in theformal sector. A reduction in tax and social securityrates will again moderate employment losses.
If the manufacturing industry succeeds in grow-ing during this period (we assume 10 percentgrowth), then employment will increase 4.2 percenteven if half of the informal sector firms are elimi-nated, and the average wage rate and the profitmargin will increase by 9 percent and 2 percent,respectively. The government, to receive the sameamount of revenue that it receives in the Base Case,must cut tax and social security rates substantially(36–38 percent).
This simple simulation exercise shows that therecould be significant short-term transitory costs, interms of a loss in employment opportunities, ineliminating the informal sector. These costs couldbe reduced if the economy achieves a faster rate ofeconomic growth.
Conclusions and Policy Implications
Turkey has embarked on an effort to change itsinstitutional structure for employment and socialaffairs. The new labor law has introduced changesin accordance with the European Communitydirectives, mainly the provisions that help to estab-lish flexible employment relationships, but furtherreform is apparently needed in the labor law andother regulations to fully comply with the EU
256 Turkey: Economic Reform and Accession to the European Union
TABLE 9.10 Simulation Results
Case 1 Case 2 Case 3 Case 4 Case 5
Base
Constant + Tax 50% Lost + Tax +10%
Case
Mkt. Share Reduction in Informal Reduction Growth
Percentage Change Relative to Base Case
Employment 3,394,000 �4.3 �1.5 �8.9 �6.0 4.2Wage billa 6,433,657 �3.0 0.0 �0.9 2.4 13.5Social security contributionsa 2,331,012 35.7 0.0 39.2 0.0 0.0Income taxa 2,754,916 31.6 0.0 36.8 0.0 0.0Value added taxa 5,347,145 38.3 0.0 40.7 0.0 0.0Profita 29,538,664 �3.2 �0.2 �2.0 1.3 12.2Average net wageb 1,896 1.3 1.5 8.7 8.9 9.0Profit margin 21.3 �3.2 �0.2 �2.0 1.3 2.0Social sec. contribution ratec 5.1 0.0 �28.5 0.0 �30.5 �37.3Income tax ratec 6.0 0.0 �26.4 0.0 �29.4 �36.3Value added tax ratec 11.6 0.0 �29.8 0.0 �31.3 �38.0
a. Billions of Turkish lira.b. Millions of Turkish lira per employee.c. Share in value added.Source: Authors’ estimates.

acquis. Adoption of the remaining regulations ofthe acquis on employment and social affairs is likelyto raise the costs of adjustment, especially for infor-mal sector firms. Moreover, it also will require acomprehensive change in the mindset of employersif the regulations (such as those on equal treatmentof fixed-term and part-time workers and employeeparticipation and consultation) are to be imple-mented. Because Turkey needs to address all theseissues in its employment strategy while heeding theEU’s long-term objectives and targets (full employ-ment, quality and productivity at work, and cohe-sion and an inclusive labor market), it has anopportunity to solve underlying problems that haveplagued the processes of economic growth andemployment generation for decades. Four areas ofaction need special consideration:
1. Give priority to strengthening Turkey’s institu-tional capacity (such as the Turkish Employ-ment Organization, ISKUR) to develop andimplement employment strategies. Moreover,develop an institutional framework that guaran-tees commitment, consistency, and continuity inemployment policies.
2. Reduce the costs of adjustment for the successfulimplementation of new regulations and thegradual elimination of the informal sector. Tem-porarily reducing tax and social security ratesfor new firms and hiring new workers could behelpful in this regard.
3. Encourage, support, and even force firms toadopt competitive strategies based on employ-ing a “skilled, trained and adaptable workforce”in the spirit of Article 125 of the Treaty Estab-lishing the European Community. These strate-gies include various support schemes and initia-tives for on-the-job training29 and technologydevelopment, transfer, and diffusion programsespecially designed for SMEs.
4. Generate employment and match the demandand supply for skills—steps important to con-fronting the main challenges summarized ear-lier in this section. Special attention should bepaid to providing part-time jobs (for urbanwomen) by enforcing equal treatment for part-time workers and to strengthening and widen-ing the scope of active labor market policies. Theestablishment of a national qualification andcertification system could help to match thedemand and supply for skills.
Notes
1. An earlier version of this paper was presented at the Con-ference on Turkey: Towards EU Accession, Bilkent University,May 10–12, 2003. The authors would like to thank their discus-sant, Necdet Kenar, then president of the Turkish EmploymentOrganization, Cem Somel of Middle East Technical University,and three anonymous referees for their valuable comments andsuggestions.
2. For a synthesis of views on labor market flexibility, see theOECD’s influential Jobs Study (OECD 1994a, 1994b). For anoverview of the evolution of the concept of labor market flexi-bility, see Brodsky (1994).
3. Scarpetta and Tressel (2002) claim that “strict regulationmay hinder the adoption of existing technologies, possiblybecause it reduces competitive pressures or technologyspillovers.”
4. At the time this chapter was written (summer 2003), therewere 10 acceding countries (Cyprus, the Czech Republic, Esto-nia, Hungary, Latvia, Lithuania, Malta, Poland, Slovakia, andSlovenia) and three candidate countries (Bulgaria, Romania,and Turkey).
5. Here, part-time employed in Turkey is defined as thosewho work less than 25 hours a week. Casual employment (sea-sonal and temporary employment), as defined by the State Insti-tute of Statistics, is used for fixed-term employment.
6. “Long-term unemployed” refers to those unemployed atleast one year.
7. Except in areas where transitional arrangements will havebeen granted during the accession negotiations.
8. For detailed descriptions of the legal framework in Turkeyfor the labor market and social protection system, see compre-hensive studies by Tunalı and others (2003) and Adaman (2003).
9. Although the first pillar of the EU, the European Commu-nity, is analyzed in this study, only the term EU is used forconvenience.
10. This section is based on information provided on theWeb site of the European Commission DG for Employment andSocial Affairs, http://europa.eu.int/comm/dgs/employment_social/index_en.htm.
11. Falkner and others (2002) show how this process worksfor labor law.
12. For Council directives on employment, see http://europa.eu.int/comm/employment_social/soc-dial/labour/index_en.htm.
13. We also analyzed the draft law prepared by the ScientificCommittee formed by nine academicians appointed by the gov-ernment (the Ministry of Employment and Social Security) andthe social partners (the Confederation of Employers’ Unions,TISK, and three confederations of trade unions—Türk-Is, Hak-Is, and DISK). Because some minor modifications have beenmade in the draft, we use the one posted on the Web site ofthe confederation of the Turkish employers’ unions, http://www.tisk.org.tr (downloaded on February 22, 2003).
14. The directives usually set the minimum conditions, andthe member states may, therefore, introduce laws, regulations, oradministrative provisions more favorable for workers.
15. For example, the directive on fixed-term work defines“comparable worker” as a worker with “an employment contractof relationship of indefinite duration, in the same establishment,engaged in the same or similar work/occupation, due regardbeing given to qualifications/skills. Where there is no compara-ble permanent worker in the same establishment, the compari-son shall be made by reference to the applicable collectiveagreement, or where there is no applicable collective agreement,
Labor Market Policies and EU Accession: Problems and Prospects for Turkey 257

in accordance with national law, collective agreements or prac-tice” (emphasis added).
16. The draft law prepared by the Scientific Committeeenvisaged the establishment of a Wage Guarantee Fund (WGF)and required employers to contribute to the fund 0.5 percent ofthe gross wage. However, the new labor law adopted by Parlia-ment has transferred the financial burden of the WGF to theUnemployment Insurance Fund.
17. Under the parental leave directive (Directive 96/34 ofJune 3, 1996, on the framework agreement on parental leaveconcluded by UNICE, CEEP, and the ETUC), fathers and moth-ers have an individual right to at least three months of parentalleave to take care of their (natural or adopted) child. They havethe right to return to the same or an equivalent workplace.
18. These included (1) developing human resources throughvocational training, (2) promoting productive investmentsthrough moderate wage policies, (3) improving the efficiency oflabor market institutions, (4) identifying new sources of jobsthrough local initiatives, and (5) promoting access to the worldof work for some specific target groups such as young people,long-term unemployed people, and women.
19. The Turkish data were calculated from the HouseholdLabour Force Survey for the period 2000–02.
20. Unless otherwise stated, the data from the UnitedNations Industrial Development Organization (UNIDO) Indus-trial Statistics Database, at the International Standard IndustrialClassification (Rev. 2) three-digit level are used throughout thissection.
21. Interindustry wage differential is defined as the coeffi-cient of deviation of (log) industry wages.
22. As Agell and Bennmarker (2002) reveal for the Swedishcase, it is easier to achieve real wage flexibility in an inflationaryenvironment, even if nominal wages are “rigid.”
23. In this study, we focus our attention on the challengesduring the accession period. However, after the eventual mem-bership, the conditions in the labor market are expected to bequite different because of the provisions on free movement ofpeople at the EU level. Although it is difficult to predict theextent of migration dynamics under the conditions of stablegrowth in Turkey, one may expect a limited amount of emigra-tion toward other EU countries that could be mutually benefi-cial for Turkey and the host countries.
24. In the former labor law, the “weekly working time” was45 hours, which had to be distributed equally over the week. Thenew labor law (No. 4857) defines the “normal average weeklyworking time” for which the worker is paid at the “normal” wagerate (the average is calculated over two months) as 45 hours.The law sets the maximum annual limit for overtime work at270 hours. Thus if a worker works 50 weeks a year, the maxi-mum average weekly working time would be 50.4 hours.
25. In the Laeken Declaration of December 2001 (http://www.europa.eu.int/futurum/documents/contrib/cont071201_en.pdf), the European-level employers’ organizations UNICEand CEEP and the trade union confederation ETUC defined theconcepts of tripartite concertation, consultation, and social dia-logue as follows: tripartite concertation designates exchangesbetween the social partners and European public authorities;consultation of the social partners describes the activities ofadvisory committees and official consultations; social dialogue isdefined as the bipartite work by the social partners.
The distinction between tripartite concertation and bipartitesocial dialogue must be emphasized, because the tripartite con-certation between the social partners and public authorities(which, in many cases, is dominated by public authorities) is usu-ally confused with genuine bipartite social dialogue in Turkey.
Social dialogue can take place at different levels (company,sectoral, regional, national, and European). Social dialogue atthe European level has become more structured and hasincreased significantly in importance over time, especially since1991, when the Maastricht Treaty made it possible for the socialpartners to conclude European-level framework agreements inthe area of individual and collective employees’ rights. As aresult, agreements between the European-level social partners(UNICE, CEEP, and ETUC) on parental leave (1995), part-timework (1997) and fixed-term contracts (1999) have been imple-mented as European directives. However, the level of social dia-logue is far from uniform among the member states. For exam-ple, the current U.K. Labour government, which emphasizes theimportance of flexibility in labor markets, seems to be uneasyabout the way regulations are being implemented at the EU level(for details, see the European Industrial Relations ObservatoryWeb site, http://www.eiro.eurofound.ie). Moreover, as Keller(2003) explains, after the eastern enlargement of the EU, “thealready existing degree of diversity [in the EU] could evenincrease despite the fact that all existing regulations are part ofthe acquis communautaire that has to be adopted by all candi-date countries,” because the social partners are either weak or donot exist in the accession states (the “social dialogue gap”). Forthe level of social dialogue in accession countries, see Rychly andPritzer (2003) and EFILWC (2003).
26. This process may also help to fully implement Interna-tional Labour Organization (ILO) conventions. For the ILO con-ventions ratified by Turkey, see Bronstein (2003).
27. The law establishing the Turkish Employment Organiza-tion (No. 4904) was enacted by Parliament on June 25, 2003.
28. Because we assume that the number of workersemployed in the informal sector is equal to the number of peo-ple employed in microenterprises, the share of the informal sec-tor is likely to be overestimated.
29. Recall that the EU aims to increase the investment ofcompanies in the training of adults (on-the-job training) fromthe existing level of the equivalent of 2.3 percent of labor costsup to 5.0 percent of labor costs on average in the EU by 2010.Although no reliable data on firm-sponsored training in Turkeyare available, one could conjecture that the ratio of firm-sponsored training to labor cost is very small in Turkey.
References
Acemoglu, D., and J. Pischke. 1998. “Why Do Firms Train? The-ory and Evidence.” Quarterly Journal of Economics (113):79–119.
————. 1999. “Beyond Becker: Training in Imperfect LaborMarkets.” Economic Journal (109): 112–42.
Adaman, F. 2003. Study on the Social Protection Systems in the13 Applicant Countries: Turkey Country Study. Studyfinanced by the European Commission DG for Employmentand Social Affairs.
Addison, J. T., and P. Teixeira. 2001. “The Economics of Employ-ment Protection.” IZA Discussion Paper No. 381, Bonn.
Agell, J. 1999. “On the Benefits from Rigid Labour Markets:Norms, Market Failures, and Social Insurance.” EconomicJournal (109): 143–64.
Agell, J., and H. Bennmarker. 2002. “Wage Policy and Endoge-nous Wage Rigidity: A Representative View from the Inside.”Working Paper No. 2002:12, Institute for Labour MarketEvaluation (IFAU), Stockholm.
Algoé Consultans. 2002. The Construction of an Index of LabourMarket Adaptability for EU Member States. Report of a study
258 Turkey: Economic Reform and Accession to the European Union

funded by the European Commission and directed by AlgoéConsultans in conjunction with Alphametrics Limited.
Baker, D., A. Glyn, D. Howell, and J. Schmitt. 2002. “Labor Mar-ket Institutions and Unemployment: A Critical Assessmentof the Cross-Country Evidence.” Working Paper 2002-17,New School University Center for Economic Policy Analysis(CEPA), New York.
Ballot, G., and E. Taymaz. 2001.“Training Policies and EconomicGrowth in an Evolutionary World.” Structural Change andEconomic Dynamics (12): 311–29.
Bassanini, A., and E. Ernst. 2002. “Labour Market Regulation,Industrial Relations and Technological Regimes: A Tale ofComparative Advantage.” Industrial and Corporate Change(11): 391–426.
Belot, M. 2002. “Why Is the Employment Protection Stricter inEurope than in the US?” Unpublished paper, CentER,Tilburg University.
Belot, M., J. Boonez, and J. van Ours. 2002. “Welfare Effects ofEmployment Protection.” CentER Discussion Paper No.2002-48, Tilburg University.
Bertola, G., T. Boeri, and S. Cazes. 1999. “Employment Protec-tion and Labour Market Adjustment in OECD Countries:Evolving Institutions and Variable Enforcement.” ILO,Employment and Training Paper No. 48, InternationalLabour Organization, Geneva.
————. 2000. “Employment Protection in IndustrializedCountries: The Case for New Indicators.” Paper presented atthe EC workshop on “Concepts and Measurement of Euro-pean Labour Markets Flexibility/Adaptability Indices,” Brus-sels, October 26–27.
Betcherman, G., A. Luinstra, and M. Ogawa. 2001. “LaborMarket Regulation: International Experience in Promot-ing Employment and Social Protection.” World Bank SocialProtection Discussion Paper Series No. 128, Washington,DC.
Blanchard, O. 2000. “Employment Protection, Sclerosis, and theEffect of Shocks on Unemployment.” LSE Lionel RobbinsLectures, Lecture 3, London, October.
————. 2002. “Designing Labor Market Institutions.”Remarks at the conference Beyond Transition, Warsaw,April.
Brodsky, M. M. 1994. “Labor Market Flexibility: A ChangingInternational Perspective.” Monthly Labor Review (Novem-ber): 53–60.
Bronstein, A. 2003. “Labour Law Reform in EU CandidateCountries: Achievements and Challenges.” Paper presentedat the ILO High-Level Tripartite Conference on Social Dia-logue and Labour Law Reform in EU Accession Countries,Malta, February 28–March 1.
Cazes, S., and A. Nesporova. 2003. Labour Market Flexibility andEmployment Security in Transition Countries. Geneva: Inter-national Labour Organization.
EFILWC (European Foundation for the Improvement of Livingand Working Conditions. 2003. Social Dialogue and EMU inthe Acceding Countries. Dublin: European Commission.
European Commission. 2002a. Communication from the Com-mission on Streamlining the Annual Economic and Employ-ment Policy Co-Ordination Cycles. COM (2002) 487 final.Brussels: EC.
————. 2002b. Draft Joint Employment Report 2002. COM(2002) 621 final. Brussels: EC.
————. 2002c. Regular Report on Turkey’s Progress TowardsAccession. SEC (2002) 1412. Brussels: EC.
————. 2002d. Taking Stock of Five Years of the EuropeanEmployment Strategy. COM (2002) 416 final. Brussels: EC.
————. 2002e. Towards the Enlarged Union: Strategy Paperand Report of the European Commission on the Progresstowards Accession by Each of the Candidate Countries.COM(2002) 700 final. Brussels: EC.
————. 2003a. The Future of the European Employment Strat-egy (EES): “A Strategy for Full Employment and Better Jobs forAll.” COM (2003) 6 final. Brussels: EC.
————. 2003b. Progress on the Implementation of the JointAssessment Papers on Employment Policies in CandidateCountries. COM (2003) 37 final. Brussels: EC.
————. 2003c. Proposal for a Council Decision on Guidelinesfor the Employment Policies of the Member States. COM(2003)176 final. Brussels: EC.
————. 2003d. Recommendation for a Council Recommenda-tion on the Implementation of Member States EmploymentPolicies. COM (2003)177 final. Brussels: EC.
European Commission DG for Employment and Social Affairs2002. 2002. Employment in Europe 2002: Recent Trends andProspects. Brussels: EC.
Fabiani, S., and D. Rodriguez-Palenzuela. 2001. “Model-BasedIndicators of Labour Market Rigidity.” European CentralBank Working Paper No. 21, European Central Bank, Brussels.
Falkner, G., M. Hartlapp, S. Leiber, and O. Treib. 2002. Opposi-tion through the Backdoor? The Case of National Non-Compliance with EU Directives. Political Science SeriesNo. 83. Vienna: Institute for Advanced Studies.
Goldberg, P. K., and N. Pavcnik. 2003. “The Response of theInformal Sector to Trade Liberalization.” NBER WorkingPaper No. 9443, National Bureau of Economic Research,Cambridge, MA.
Heckman, J., and C. Pagés. 2004. “Introduction.” In Law andEmployment: Lessons from Latin America and the Caribbean,ed. J. Heckman and C. Pagés. Chicago: University of ChicagoPress.
Hermans, S. 2001. Avrupa Birlig i’nin Sosyal Politikası veTürkiye’nin Uyumu [Social Policy in the European Unionand Turkey’s Adaptation], Turkish translation by H.Cansevdi. Istanbul: Iktisadi Kalkınma Vakfı.
Ilkkaracan, I., and R. Selim. 2002. “The Role of Unemploymentin Wage Determination: Further Evidence on the WageCurve from Turkey.” Working Paper 2002-11, New SchoolUniversity Center for Economic Policy Analysis (CEPA),New York.
Jackman, R., R. Layard, and S. Nickell. 1996. “CombattingUnemployment: Is Flexibility Enough?” Discussion PaperNo. 293, Centre for Economic Performance, London Schoolof Economics.
Keller, B. 2003. “Social Dialogues—The State of the Art a Decadeafter Maastricht.” Industrial Relations Journal (34): 411–29.
Kleinknecht, A. 1998. “Is Labour Market Flexibility Harmful toInnovation?” Cambridge Journal of Eocnomics (22): 387–96.
Kugler, A. D. 1999. “The Impact of Firing Costs on Turnover andUnemployment: Evidence from the Colombian Labor Mar-ket Reform. International Tax and Public Finance Journal (6):389–410.
Kugler, A. D., and M. Cárdenas. 1999. The Incidence of Job Secu-rity Regulations on Labor Market Flexibility and Compliancein Colombia. Working Paper R-428, Inter-American Devel-opment Bank Research Network.
Michie, J., and M. Sheehan. 2003. “Labour Market Deregulation,‘Flexibility’ and Innovation.” Cambridge Journal of Econom-ics (27): 123–43.
Nickell, S., and R. Layard. 1999. “Labor Market Institutions andEconomic Performance.” In Handbook of Labor Economics,Vol. 3, ed. O. Ashenfelter and D. Card. Amsterdam: Elsevier.
Labor Market Policies and EU Accession: Problems and Prospects for Turkey 259

Nicoletti, G., S. Scarpetta, and O. Boylaud. 2000. “SummaryIndicators of Product Market Regulation with an Extensionto Employment Protection Legislation.” Economics Depart-ment Working Papers No. 226, Organisation for EconomicCo-operation and Development, Paris.
OECD (Organisation for Economic Co-operation and Develop-ment). 1994a. OECD Jobs Study, Evidence and Explanations,Part I: Labor Market Trends and Underlying Forces of Change.Paris: OECD.
————. 1994b. OECD Jobs Study, Evidence and Explanations,Part II: The Adjustment Potential of the Labor Market. Paris:OECD.
————. 1999. OECD Employment Outlook. Paris: OECD.————. 2002. Taxing Wages. Paris: OECD.Onaran, Ö. 2002. “Measuring Wage Flexibility: The Case of
Turkey before and after Structural Adjustment.” Applied Eco-nomics (34): 767–81.
Plasmans, J., H. Meersman, A. van Poeck, and B. Merlevede.2002. “The Unemployment Benefit System and Wage Flexi-bility in EMU: Time-varying Evidence in Five Countries.”Department of Economics Working Paper, University ofAntwerp.
Riboud, M., C. Sánchez-Páramo, and C. Silva-Jáuregui. 2002.“Does Eurosclerosis Matter? Institutional Reform and Labor
Market Performance in Central and Eastern EuropeanCountries in the 1990s.” World Bank Social Protection Dis-cussion Paper Series No. 0202, Washington, DC.
Rychly, L., and R. Pritzer. 2003. “Social Dialogue at NationalLevel in the EU Accession Countries.” Working Paper, Inter-national Labour Organization, Geneva.
Salvanes, K. G. 1997. “Market Rigidities and Labour MarketFlexibility: An International Comparison.” ScandinavianJournal of Economics (99): 315–33.
Scarpetta, S., and T. Tressel. 2002. “Productivity and Conver-gence in a Panel of OECD Industries: Do Regulations andInstitutions Matter?” Economics Department WorkingPaper No. 342, Organisation for Economic Co-operationand Development, Paris.
SIS (State Institute of Statistics). 2000a. Annual Survey of Manu-facturing Industries. Ankara: SIS.
————. 2000b. Household Labour Force Statistics. Ankara: SIS.Tunalı, I., H. Ercan, C. Baslevent, and O. Öztürk. 2003. “Back-
ground Study on Labor Market and Employment in Turkey.”Report prepared for European Training Foundation andpresented at the special seminar On the Way to Integrationwith the EU, Labor Market and Employment in Turkey,ISKUR, Ankara, February 27. http://www.iskur.gov.tr.
260 Turkey: Economic Reform and Accession to the European Union

and to the Middle East, northern Africa, andCentral Asia markets. The recent market–exportand domestic market–oriented investments in theautomobile industry are a clear indication ofTurkey’s attractiveness for FDI flows. However, overthe last decade, Turkey lost ground to the Centraland Eastern European (CEE) countries in attract-ing foreign investments, especially those fromEurope. Although Poland, the Czech Republic, andHungary together (three countries whose combinedpopulation is smaller than that of Turkey) receivedUS$71 billion1 in FDI flows between 1995 and 2000,Turkey received only $5.1 billion over the sameperiod, almost 14 times less. And it appears fromother countries’ experiences that, unless there is amajor paradigm shift in a country’s or its competi-tors’ FDI policies, there is likely to be very littlechange in FDI inflows.
This chapter explores how Turkey may bedifferent from most CEE countries, and what anydifferences imply for the appropriate FDI policy inlight of EU accession prospects. The chapter beginsby outlining the benefits of FDI through anoverview of the economic concepts, together withan assessment of the Turkish experience. FDI
After following inward-oriented developmentstrategies for 50 years, Turkey switched to outward-oriented policies in 1980. The policy of further open-ing up the economy was pursued with the aim ofeventually integrating Turkey into the EuropeanUnion (EU). The European Council’s Helsinkisummit, held on December 10–11, 1999, produced abreakthrough in EU-Turkey relations by officiallyrecognizing Turkey as an EU candidate state on anequal footing with other candidate states.With acces-sion, Turkey would become part of the European sin-gle market. In joining the EU, Turkey will have toadopt and implement the whole body of EU legisla-tion and standards—the acquis communautaire—and also participate eventually in the EuropeanEconomic and Monetary Union (EMU).
Over the past four years, Turkey has been under-going a series of serious social, economic, and insti-tutional transformations with the clear politicalobjective of EU membership. The definitiveprospect of EU membership should make Turkeyvery attractive for foreign direct investment (FDI),because, among its other strengths, it has a highlyskilled and adaptable labor force, a large domesticmarket, and geographic proximity both to Europe
261
10Turkey’s Foreign
Direct InvestmentChallenges:
Competition, theRule of Law, and EU
Accession
Mark Dutz, Melek Us, and Kamil Yılmaz

inflows are not generally considered to be an endgoal but rather an instrument to create a globallycompetitive economy. Through FDI-stimulatedincreases in productivity, Turkey seeks to bepositioned at the higher value added end of thefast-changing worldwide division of labor. In itsanalysis of obstacles to foreign investment, thischapter will emphasize competition-related andlegal and judicial barriers.
After analyzing the benefits from and impedi-ments to FDI, the chapter reviews what steps havebeen taken to improve the policy and regulatoryframework in Turkey and then analyzes whatTurkey has yet to do to meet EU requirements andto fully benefit from FDI. In summary, Turkeyshould benefit significantly from EU accession interms of a step change in sizable FDI inflows, largelybecause the accession process would help Turkey toovercome its rule of law and competition-relatedconstraints to foreign direct investment. The EUaccession process will encourage more rapid andconsistent implementation of the rules and regula-tions that ensure a level playing field for all compa-nies, which, in turn, would enable Turkey to takefull advantage of investment-related benefits.
The Benefits of FDI
As a capital-scarce country, Turkey can benefitsubstantially from injections of foreign capital thatwill expand productive capacity and stimulate jobcreation.
The Role of FDI in Economic Growth
Although foreign direct investment is beneficial,the type of capital inflows matters. Unlike portfolioinvestments and loans to the private sector, FDIinflows involve direct equity ownership plus signif-icant ownership control, and therefore they aremore stable. They do not easily flee in a domesticmarket downturn. Unlike loans, FDI inflows ensurethat business risks are borne by foreign investors.
FDI differs from other forms of capital flows inother crucial aspects. It does not just entail thetransfer of financial resources and the creation ofnew jobs; it is a bundle that involves the transfer offixed assets, technology, know-how, and interna-tional market access. FDI connects the recipientcountry to international best practices, helps to
upgrade the management and work force, andestablishes stronger ties between domestic andinternational markets.
Because FDI entails the transfer of technologyand know-how, it usually has both a direct and anindirect impact on the economic growth of acountry. And, because FDI involves significantownership control as well as the transfer of technol-ogy, its impact on economic growth takes placethrough increased productivity, human capitalaccumulation, research and development activity,and technological and productivity spillovers. Itsimpact on economic growth could be even greater ifthe types of FDI that the country receivesstimulate—in other words, crowd in—domesticinvestment activity.
Several studies have established a link betweenFDI and economic growth. Using data on FDI flowsfrom industrial countries to 69 developing coun-tries over 1970–89 and using a cross-countryregression framework, Borensztein, De Gregorio,and Lee (1998) show that FDI flows have a positiveimpact on economic growth. They also demon-strate that the impact of foreign investment exceedsthe impact of domestic investment on growth. Notall countries, however, benefit from FDI. Accordingto Borensztein, De Gregorio, and Lee, countriesrequire a minimum stock of human capital to real-ize the growth effects of FDI. In other studies,Zhang (1999) shows that FDI inflows helped tostimulate economic growth in several East Asiancountries, and Gruben and McLeod (1998) findthat in a sample of 18 countries, FDI had a signifi-cant impact on economic growth, especially inLatin American countries.
The Role of FDI in Raising Productivity and Stimulating Spillovers
One of the important contributions of FDI compa-nies is to enhance the transfer and diffusion of tech-nology to the host country. A multinational corpo-ration undertaking investment in a country bringsto that sector its production technology, its access toglobal production and distribution networks, andits know-how and experience. Being generally largercorporations, FDI companies have access to large,low-cost investment funds that could be used tofinance investment in more advanced technologythan is available and accessible in the host country.
262 Turkey: Economic Reform and Accession to the European Union

The direct technology transfer effect may not berealized in all FDI projects, however. If the FDI is anexport-oriented investment, the impact on technol-ogy diffusion will generally be more significantthan that made by a domestic market–orientedinvestment. The impact of FDI on technologydiffusion was rather limited in the import substitu-tion era, because the main incentive for a foreigncompany to undertake investment was the heavilyprotected domestic market. In such an environment,foreign companies preferred to transfer old andoutdated technology to their factories in developingcountries, creating little technology diffusion.
Today, however, FDI decisions cannot focus onlyon the domestic market. One result of the push formore liberal trade relations throughout the world isthat FDI companies face competition in the domes-tic markets of the host country through imports.Consequently, FDI decisions, especially in themanufacturing sector, are often made after seriouslyconsidering the international competitiveness ofthe affiliate firm. That firm must have the techno-logical capability and the resulting efficiency thatrender it flexible enough to target export markets aswell as the domestic market. Consequently, onewould expect to observe higher productivity inFDI companies when compared with domesticenterprises.
The impact of FDI on the host country economyis not limited to just the direct channels of technol-ogy transfer and diffusion; the presence of multina-tionals also may affect local companies throughseveral channels. One channel is intensified domes-tic market competition. As the FDI companiesbecome major players in the domestic market, localcompanies will be forced to adopt newer and moreadvanced technologies and to use the existingresources of the firm more efficiently in order tosurvive (see Blomström and Kokko 1998). Thischannel is similar to the effect of import liberaliza-tion, even though the impact on local companiesmay be more significant than imports. The technol-ogy transfer may take embodied (imports ofmachinery and equipment) or disembodied (know-how, knowledge, licenses) forms. Local enterpriseswill not find it difficult to organize the transferof embodied technology, but the transfer of disem-bodied technology requires absorption capacity.However, the workers and engineers employed byFDI companies will gain experience and accumulate
knowledge through their tenure there. In themedium to long run, these employees will have anopportunity to transfer this experience and knowl-edge to local enterprises.
Other channels through which the presence ofFDI companies affects the local companies mostlytake the form of spillovers. Productivity spilloversfrom FDI take place when the entry or presence ofmultinational corporations increases the produc-tivity of domestic firms in a host country and whenthe multinationals do not fully internalize the valueof these benefits. Spillovers may occur when localfirms improve their efficiency by copying technolo-gies of foreign affiliates operating in the localmarket either by observation or by hiring workerstrained by the affiliates. Horizontal spillovers toother firms in the same sector may be accompaniedby vertical spillovers—that is, the presence of FDIcompanies may affect local firms in other sectors ofthe economy. These vertical spillover effects maytake place through backward linkages (purchases ofinputs from local suppliers) and forward linkages(supply of outputs to local downstream purchasers).
In line with findings for other countries, inTurkey FDI companies have higher labor produc-tivity than local enterprises.2 In 1991 the averagelabor productivity of FDI companies was 35 per-cent higher than that of all manufacturing plants.Over time, the productivity gap between FDI com-panies and the sector average was closed slightly, to30 percent by 1996. The average labor productivityin foreign-owned plants increased from TL(Turkish lira) 4.1 million to TL 4.7 million (from$1,611 to $1,803) in 1990 prices. The average laborproductivity in all plants, by contrast, increasedfrom TL 3.1 million to TL 3.6 million (from $1,189to $1,550). These numbers are a clear indicationthat the labor productivity gap between foreign-and domestic-owned plants is significant and doesnot vanish over time.
These annual average values support the case forsignificant labor productivity differences betweenFDI and local enterprises, but the possibility cannotbe ruled out that these differences stem from plantcharacteristics other than foreign ownership. Basedon regression results using various measures of for-eign participation, Yılmaz and Ozler (2004) showthat plants with foreign partners have higher totalfactor productivity even after other plant character-istics and sector and time effects are taken into
Turkey’s Foreign Direct Investment Challenges: Competition, the Rule of Law, and EU Accession 263

account.3 Finally, Yılmaz and Ozler (2004) showthat domestic plants tend to have higher total factorproductivity (TFP) in sectors with greater FDIinvolvement than in sectors in which FDI involve-ment is low. All else being equal, as the foreignownership–weighted sectoral output share offoreign-affiliated plants increases by 1 percentagepoint, the total factor productivity of local plants inthe same sector increases by 0.82 percentage point.However, horizontal spillovers from all foreign-owned plants are not similar. As the output share ofFDI companies with less than 50 percent foreignparticipation increases by 1 percentage point, theTFP in local firms increases on average by 0.72 per-cent, and the spillover effect from plants withforeign share ownership greater than or equal to50 percent but less than full foreign ownershipjumps by 1.1 percentage point. Finally, fullyforeign-owned plants tend to generate externalbenefits that would increase the productivity oflocal plants in the same sector by 0.4 percent.
The Current State of FDI
Foreign direct investment can have strong, positiveeffects for national economies. The previous sectiondescribed how FDI in the Turkish manufactur-ing sector has had both direct and indirectproductivity-enhancing benefits. The evidence ofthese benefits, which is based on plant-level studies,can be viewed as the most reliable evidence avail-able. However, this finding and the results discussedestablish only that FDI is desirable for Turkey. Thenext step in the analysis is to characterize the leveland other features of FDI in Turkey relative to thoseof comparator countries and explore why FDI is solow despite being highly desirable for the country.
FDI in Turkey and in Central and Eastern Europe:A Comparison
The most striking feature of foreign investmentflows to Turkey is their low level relative to theflows of the comparator CEE countries’ emergingmarket economies (table 10.1). In terms of popula-tion in 2000, Turkey was larger than Poland, theCzech Republic, and Hungary combined. In termsof gross domestic product (GDP) in 2000, Turkey’seconomy was four times as large as that of theCzech Republic or Hungary and one-quarter larger
than Poland’s. And in terms of gross fixed capitalformation (GFCF)—the total value of producers’acquisitions of fixed assets—Turkey’s investmentsduring 2000 were three to four times as large asthose of the Czech Republic and Hungary androughly a sixth larger than Poland’s. As highlightedin table 10.1, however, in terms of average annualinflows of FDI during the 1990s, Turkey’s inflows($800 million) were roughly one-fifth of FDIinflows to Poland ($4.1 billion) and also signifi-cantly lower than those of the Czech Republic andHungary (about $2.1 billion per year).
A second striking feature in comparing Turkeywith Poland, the Czech Republic, and Hungary isthat the FDI gap did not close throughout the1990s. To the contrary, with the formal announce-ment at the December 1997 European Councilsummit in Luxembourg that EU accession negotia-tions would open with Poland, the Czech Repub-lic, and Hungary on March 31, 1998, these coun-tries appear to have benefited from a virtuouscycle. The enhanced likelihood of EU accessionand further FDI flows improved credit ratings and,in turn, attracted more FDI, thereby increasing thedifference between those countries and Turkey.Table 10.1 and figure 10.1 reveal that averageannual FDI inflows increased during 1997–2000
264 Turkey: Economic Reform and Accession to the European Union
2,000
3,000
1,000
0
4,000
5,000
6,000
7,000
9,000
8,000
10,000
1990
1991
1992
1993
1994
1995
1996
1997
1998
1999
2000
2001
US$ millions
TurkeyCzech RepublicHungaryPoland
FIGURE 10.1 FDI Inflows: Turkeyversus Comparator CEECountries, 1990–2001(millions of US$)
Source: United Nations Conference on Trade andDevelopment (UNCTAD), World Investment Report,selected years.
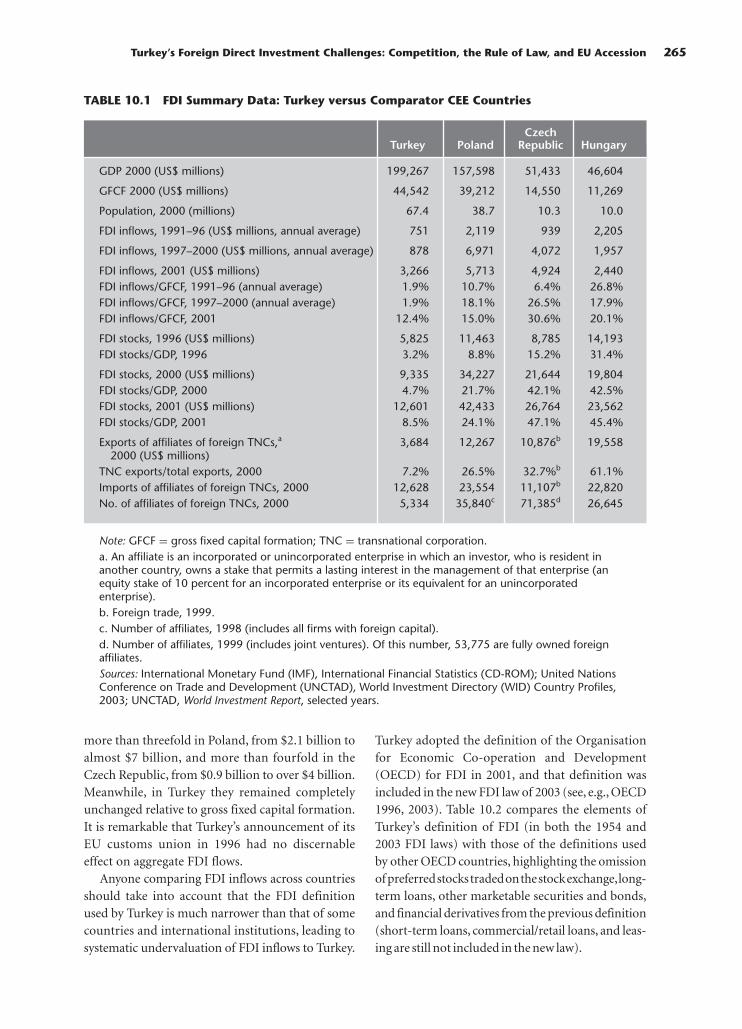
more than threefold in Poland, from $2.1 billion toalmost $7 billion, and more than fourfold in theCzech Republic, from $0.9 billion to over $4 billion.Meanwhile, in Turkey they remained completelyunchanged relative to gross fixed capital formation.It is remarkable that Turkey’s announcement of itsEU customs union in 1996 had no discernableeffect on aggregate FDI flows.
Anyone comparing FDI inflows across countriesshould take into account that the FDI definitionused by Turkey is much narrower than that of somecountries and international institutions, leading tosystematic undervaluation of FDI inflows to Turkey.
Turkey adopted the definition of the Organisationfor Economic Co-operation and Development(OECD) for FDI in 2001, and that definition wasincluded in the new FDI law of 2003 (see, e.g., OECD1996, 2003). Table 10.2 compares the elements ofTurkey’s definition of FDI (in both the 1954 and2003 FDI laws) with those of the definitions usedby other OECD countries, highlighting the omissionof preferredstockstradedonthestockexchange,long-term loans, other marketable securities and bonds,and financial derivatives from the previous definition(short-term loans, commercial/retail loans, and leas-ing are still not included in the new law).
Turkey’s Foreign Direct Investment Challenges: Competition, the Rule of Law, and EU Accession 265
TABLE 10.1 FDI Summary Data: Turkey versus Comparator CEE Countries
CzechTurkey Poland Republic Hungary
GDP 2000 (US$ millions) 199,267 157,598 51,433 46,604
GFCF 2000 (US$ millions) 44,542 39,212 14,550 11,269
Population, 2000 (millions) 67.4 38.7 10.3 10.0
FDI inflows, 1991–96 (US$ millions, annual average) 751 2,119 939 2,205
FDI inflows, 1997–2000 (US$ millions, annual average) 878 6,971 4,072 1,957
FDI inflows, 2001 (US$ millions) 3,266 5,713 4,924 2,440FDI inflows/GFCF, 1991–96 (annual average) 1.9% 10.7% 6.4% 26.8%FDI inflows/GFCF, 1997–2000 (annual average) 1.9% 18.1% 26.5% 17.9%FDI inflows/GFCF, 2001 12.4% 15.0% 30.6% 20.1%
FDI stocks, 1996 (US$ millions) 5,825 11,463 8,785 14,193FDI stocks/GDP, 1996 3.2% 8.8% 15.2% 31.4%
FDI stocks, 2000 (US$ millions) 9,335 34,227 21,644 19,804FDI stocks/GDP, 2000 4.7% 21.7% 42.1% 42.5%FDI stocks, 2001 (US$ millions) 12,601 42,433 26,764 23,562FDI stocks/GDP, 2001 8.5% 24.1% 47.1% 45.4%
Exports of affiliates of foreign TNCs,a 3,684 12,267 10,876b 19,5582000 (US$ millions)
TNC exports/total exports, 2000 7.2% 26.5% 32.7%b 61.1%Imports of affiliates of foreign TNCs, 2000 12,628 23,554 11,107b 22,820No. of affiliates of foreign TNCs, 2000 5,334 35,840c 71,385d 26,645
Note: GFCF = gross fixed capital formation; TNC = transnational corporation.a. An affiliate is an incorporated or unincorporated enterprise in which an investor, who is resident inanother country, owns a stake that permits a lasting interest in the management of that enterprise (anequity stake of 10 percent for an incorporated enterprise or its equivalent for an unincorporatedenterprise).b. Foreign trade, 1999.c. Number of affiliates, 1998 (includes all firms with foreign capital).d. Number of affiliates, 1999 (includes joint ventures). Of this number, 53,775 are fully owned foreignaffiliates.Sources: International Monetary Fund (IMF), International Financial Statistics (CD-ROM); United NationsConference on Trade and Development (UNCTAD), World Investment Directory (WID) Country Profiles,2003; UNCTAD, World Investment Report, selected years.

TABLE 10.2 FDI Definition in OECD Countries
Preferred Stocks Preferred Stocks Other Kinds of Indirectly Capital Long- Short- Bonds andTraded on Not Traded on Nonpreferred Reinvested Owned FDI in Term Term Commerce/ Marketable Financial
Stock Exchange Stock Exchange Stocks Earnings Enterprises Kind Loans Loans Retail Loans Leasing Securities Derivatives
Australia Yes Yes Yes Yes Yes No Yes Yes Yes — Yes YesAustria Yes Yes No — No Yes No No No No No NoBelgium Yes Yes Yes No No No Yes Yes No Yes No NoCanada Yes Yes Yes Yes Yes Yes Yes Yes Yes Yes Yes —Czech Rep. Yes Yes Yes Yes Yes — Yes No No — — —Denmark Yes Yes Yes Yes Yes Yes Yes Yes No No No NoFinland No Yes Yes Yes Yes Yes Yes Yes No Yes No NoFrance Yes Yes Yes Yes No Yes Yes Yes No No No NoGermany Yes Yes Yes Yes No Yes Yes No No No No NoGreece Yes Yes Yes Yes No No Yes Yes Yes Yes Yes —Hungary Yes Yes Yes No No No Yes Yes Yes Yes Yes YesIceland No Yes — Yes Yes — Yes Yes Yes — — —Ireland Yes Yes Yes Yes Yes Yes Yes Yes Yes Yes Yes —Japan Yes Yes Yes Yes Yes Yes Yes Yes No No Yes NoKorea, Rep. of Yes Yes Yes Yes No Yes Yes Yes No No No NoLuxembourg Yes Yes Yes Yes — No Yes Yes Yes No No NoMexico Yes Yes Yes Yes Yes Yes Yes Yes Yes Yes No NoNetherlands Yes Yes Yes Yes No Yes Yes Yes Yes No No —New Zealand Yes Yes Yes Yes Yes No Yes Yes Yes Yes Yes NoNorway Yes Yes Yes Yes Yes Yes Yes Yes No No Yes YesPoland Yes Yes Yes Yes Yes Yes Yes Yes Yes Yes Yes —Portugal Yes Yes Yes Yes No Yes Yes Yes Yes Yes Yes NoSpain Yes Yes Yes Yes No Yes Yes Yes Yes No No NoSweden Yes Yes Yes Yes Yes Yes Yes Yes Yes Yes Yes NoSwitzerland Yes Yes Yes Yes Yes Yes Yes Yes Yes Yes Yes YesTurkey (6224) No Yes Yes Yes
NoYes No No No No No No
Turkey (4875) Yes Yes Yes Yes Yes Yes No No No Yesa YesEngland Yes Yes Yes Yes Yes Yes Yes Yes Yes No No NoUnited States Yes Yes Yes Yes Yes Yes Yes Yes Yes Yes Yes Yes
— Not available.Note: Two sets of entries are given for Turkey: one for the 1954 FDI law (No. 6224) and one for the 2003 FDI law (No. 4875).a. Excluding state bonds.Source: OECD 2003.
266

Turkey’s Foreign Direct Investment Challenges: Competition, the Rule of Law, and EU Accession 267
2,000
3,000
1,000
0
4,000
5,000
6,000
7,000
9,000
8,000
10,000
1990
1991
1992
1993
1994
1995
1996
1997
1998
1999
2000
2001
US$ millions
TurkeyCzech RepublicHungaryPoland
FIGURE 10.2 M&A-Related Inflows:Turkey versusComparator CEECountries, 1990–2001(millions of US$)
Source: See figure 10.1.
4,000
6,000
2,000
0
8,000
10,000
12,000
14,000
1990
1991
1992
1993
1994
1995
1996
1997
1998
1999
2000
US$ millions
TurkeyCzech RepublicHungaryPoland
FIGURE 10.3 Privatization Revenues:Turkey versusComparator CEECountries, 1990–2000(millions of US$)
Source: See figure 10.1.
In addition, even though the new FDI law mayallow certain flows to be included, local statisticaldata collection and recording practices may pre-clude their inclusion in the official statistics. Capitalin-kind is one such example—statistics are gener-ally not calculated and therefore not included. Eventhough the precise figures are not available, forsome big projects Turkey’s previous narrowerdefinition and statistical processing can underesti-mate FDI inflows by significant orders of magni-tude. For example, Turkey has traditionally notrecorded long-term credits from foreign partners asFDI. It has included such flows only if the foreignpartners’ receivables are added to the company’scapital; otherwise, they are not recorded as anincrease in FDI but rather as an increase in externaldebt. For the first time, however, because of a par-ticularly large intracompany, long-term foreigncredit and in response to internal discussions onthe matter, in 2001 it was decided to classify suchcredits as an FDI flow in conformity with interna-tional norms. Therefore, the $1.4 billion creditprovided by the mobile phone arm of TelecomItalia, the foreign partner of the GSM I
.s-TIM
Telekomunikasyon Hizmetleri A.S. company, hasbeen included in 2001 inflows.
In terms of type of investment, most of thegrowth of FDI companies worldwide in the 1990swas by cross-border mergers and acquisitions(M&As), in particular the acquisitions by foreigninvestors of privatized state-owned enterprisesrather than greenfield investments. Less than 3 per-cent of the total number of global cross-borderM&As during the 1990s are officially classified asmergers; the rest are different types of acquisitions.In terms of ownership, roughly two-thirds of cross-border M&As were full acquisitions, and theremaining one-third were minority acquisitions(10–49 percent control). In terms of value, 70 per-cent of cross-border M&As are functionallyclassified as horizontal, between firms in the sameindustry.4 Figure 10.2 highlights how this globaltrend was especially critical in driving FDI inPoland, but also in the Czech Republic andHungary, in contrast to its significantly lesserinfluence in Turkey. Figure 10.3 presents evidencesuggesting the importance of privatization infueling M&A-related FDI inflows, and it highlightsthe much more important role of privatizationin the CEE countries throughout the 1990s in
contrast to Turkey. However, although a significantshare of FDI in transition economies may havebeen generated by the privatization process, theprivatization process in Poland has, notably,involved a sizable amount of stock market flota-tion, in which privatization-related capital inflows

would be reported as portfolio inflows rather thanFDI. The Czech Republic has actively promotedprivatization to local investors, which was usuallydebt financed and thus linked to either domestic orforeign credit rather than FDI.
In terms of industrial subsector allocation, amajority of FDI inflows to Turkey have been directedto the tertiary sector. Table 10.3 illustrates that by theend of 2000 over 57 percent of total FDI stocks inTurkey were dedicated to services, including three ofthe top five subsectors—transport and communica-tions, banking and other financial services, and tradeand repairs—in a pattern similar to that of Poland.The other major recipients of FDI inflows to Turkey
have been in the manufacturing sector—the auto-motive and auto parts subsector and the petroleum,chemicals, rubber, and plastic products subsector.The subsectoral pattern in the smaller countries, theCzech Republic and Hungary, which do not benefitfrom as large a domestic internal market, is evenmore concentrated in the tertiary sector, with all fivetop subsectors dedicated to producing servicesrather than manufacturing goods. Table 10.4 reportsthe identity of the largest FDI companies by world-wide sales in each of the four economies, highlight-ing the important role of the automotive and autoparts subsector and the petroleum, chemicals, andrubber and plastic sector in Turkey. Nine of the
268 Turkey: Economic Reform and Accession to the European Union
TABLE 10.3 FDI Stocks by Industrial Sector, 2000(percent)
Sector/Industry Turkey Poland Czech Republic Hungary
Primary Sector 1.5 0.9 2.0 1.5Agriculture, hunting, forestry, and fishing 0.8 0.5 0.2 1.1Mining, quarrying, and petroleum 0.7 0.4 1.9 0.4
Secondary Sector 41.3 38.6 38.1 36.8 Food, beverages, and tobacco 7.3 8.4 4.8 8.9Textiles, leather, and clothing 1.9 0.7 1.3 1.6Wood, paper, publishing, and printing 0.3 4.4 3.1 1.9Petroleum, chemicals, rubber and plastic products 9.5 6.5 6.5 6.8Nonmetallic mineral products 2.6 — 5.9 2.3Basic metal and metal products 2.6 2.0 3.6 2.2Machinery and equipment 0.2 1.3 1.7 1.9Electrical machinery and apparatus 3.7 1.2 3.3 7.2Motor vehicles and other transport equipment 12.1 6.4 6.5 3.6Precision instruments 0.4 — 0.7 —Other manufacturing 0.7 7.8 0.6 0.4Unspecified secondary 0.0 — 0.0 —
Tertiary Sector 57.3 60.5 59.8 61.7Electricity, gas, and water — 1.2 6.6 9.4Construction 0.8 6.6 1.5 1.2Trade and repairs 8.1 16.7 15.0 12.4Hotels and restaurants 4.4 0.5 0.3 1.8 Transport, storage, and communication 17.0 8.0 11.2 7.7Finance 16.6 20.0 14.7 11.3Real estate and business activities — 7.0 9.2 15.7Education 0.0 — — 0.0Health and social services 7.5 — — 0.1Other services 2.8 0.5 1.2 1.9
Total 100 100 100 100
— Not available.Sources: UNCTAD, World Investment Database (WID) Country Profiles, 2003; Turkey General Directorateof Foreign Investors (GDFI) database.

TABLE 10.4 Largest Affiliates of Foreign Transnational Corporations
SalesCompany Home Country Industry (US$ millions)
Turkey, 20011 Tofas Türk Otomobil Fabrikası Italy Motor vehicles 875.5
A.S.2 Oyak Renault Otomobil Fabrikaları France Motor vehicles 748.4
A.S.3 Vestel Elektronik San. ve Tic. A.S. Netherlands Electronics 690.24 Ipragaz A.S. France Petroleum products 375.55 Sasa Dupont Sabancı Polyester Netherlands Chemicals 333.3
Sanayi A.S.6 Mercedes Benz Türk A.S. Germany Motor vehicles 284.97 Philsa PhilipMorris Sabancı Sigara- Netherlands Tobacco 264.6
Tütün A.S.8 Bosch Sanayi ve Ticaret A.S. Germany Auto parts 245.79 Siemens Sanayi ve Ticaret A.S. Germany Electrical machinery 231.3
10 Pasabahçe Cam Sanayi Saudi Arabia Glass 223.011 Ford Otomotiv Sanayi A.S. United States Motor vehicles 212.912 Goodyear Lastikleri TA.S. United States Rubber 193.513 Trakya Cam Sanayii A.S. United States Glass 192.014 Profilo Telra Elektronik Sanayi ve France Electronics 189.0
Tic. A.S.15 BSH Profilo Elektrikli Gereçler Germany Electrical machinery 185.0
Sanayii A.S.16 Alcatel Teletas Telekomünikasyon Neth./Belgium Electronics 176.7
End. 17 Türk Pirelli Lastikleri A.S. Italy Rubber 173.718 Korsa Sabancı Dupont End. I
.plik Netherlands Textiles 173.2
San. A.S.19 JTI Tütün Ürünleri Sanayi A.S. Japan Tobacco 168.620 I
.zmir Demir Çelik Sanayi A.S. Saudi Arabia Iron, steel 161.0
Total 6,098.0
Poland, 19991 Fiat Auto Poland SA Italy Motor vehicles 1,844.12 Makro Cash and Cary Poland Germany Distributive trade 1,544.83 Centrum Daewoo Sp ZOO Rep. of Korea Motor vehicles 916.64 Volkswagen Poznan Sp ZOO Germany Motor vehicles 661.55 Reemtsma Polska SA Germany Tobacco 595.76 Thompson Polkolor Sp ZOO France Electrical equipment 439.37 Real Sp ZOO Germany Distributive trade 423.78 General Motors Poland Sp ZOO United States Motor vehicles 411.39 Procter and Gamble Polska United States Distributive trade 400.0
Sp ZOO10 Geant Polska Sp ZOO France Distributive trade 387.911 Unilever Polska SA Netherlands Distributive trade 383.612 International Paper Kwidzyn SA United States Paper products 360.713 Renault Polska Sp ZOO France Motor vehicles 360.714 Kulczyk Tradex Sp ZOO United Kingdom Distributive trade 304.815 Auchan Polska Sp ZOO France Distributive trade 297.516 Electrocieplownie Warszawkie SA Sweden Electricity 293.017 Frantschah Swiecie SA Germany Paper products 289.918 Philips Lighting Poland SA Netherlands Electrical equipment 289.419 Jeronimo Martins Dystrybucja Portugal Distributive trade 262.0
Sp ZOO20 British American Tobacco United Kingdom Tobacco 282.9
Polska SA
Total 10,749.4

270 Turkey: Economic Reform and Accession to the European Union
TABLE 10.4 (Continued)
SalesCompany Home Country Industry (US$ millions)
Czech Republic, 19991 Skoda Automobilovi AS Germany Motor vehicles 3,292.52 Makro Cr Spol SRO Germany Distributive trade 736.23 Rewe Spol. SRO Germany Mach. and equip. 509.24 Tabak AS United States Tobacco 416.25 Philip Morris United States Tobacco 402.56 Jihomoravska Energetica Germany Energy 382.27 Tesco Stores Cr AS United Kingdom Distributive trade 335.08 IPS AS Finland Construction 327.69 Delvita AS Netherlands Distributive trade 318.6
10 Penny Market SRO Germany Distributive trade 294.811 Severoceska Energetica Germany Energy 285.012 Julius Meinl AS Austria Distributive trade 218.413 Siemens Automobilova Germany Motor vehicles 208.6
Technika SRO14 Stavby Silnic A Zeleznic AS France Construction 207.915 Plzensky Prazdroj AS Netherlands Beverages 203.916 Autopal SRO United States Motor vehicles 201.317 Glaverbel Czech AS Belgium/Japan Nonmetal mineral 196.318 Robert Bosch Spol. SRO Germany Motor vehicles 162.619 Nestle Cokoladovny AS Switzerland Food 148.720 Siemens Elektromotory SRO Germany Mach. and equip. 147.5
Total 8,995.0
Hungary, 20001 Audi Hungaria Motor Kft. Germany Motor vehicles 3,190.62 Philips Magyarorszag Kft. Netherlands Electronics 2,266.33 IBM Storage Products Kft. United States Electronics 2,239.74 Matav Rt. Germany Telecom. 1,565.35 Panrusgaz Magyar-Orosz Russia Distributive trade 1,027.6
Gazipari Rt. 6 Flextronics International Kft. United States Electronics 868.17 Metro Holding Kft. Germany Distributive trade 715.18 GE Hungary Rt. United States Electronics 658.19 Opel Magyarorszag United States Motor vehicles 629.5
Jarmugyarto Kft.10 Kromberg Es Schubert Austria Basic metals 628.0
Kabeleket11 Vogel and Noot Mezogepgyar Kft. Austria Basic metals 584.412 Westel 900 Mobil Rt. United States Telecom. 541.913 Budapesti Elektromos Muvek Rt. Germany Electricity 483.614 Elmu Rt. Germany Electricity 483.615 Tesco Global Rt. United Kingdom Distributive trade 447.616 Suziki Rt. Japan Motor vehicles 446.417 Hungarotabak Tobaccoland Rt. Austria Trade 442.318 Shell Hungary Rt. Neth./U.K. Distributive trade 420.519 Alcoa Kofem Kft. United States Basic metals 395.120 BorsodChem Austria Chemical 393.5
Total 18,427.2
Sources: See table 10.3.

Turkey’s Foreign Direct Investment Challenges: Competition, the Rule of Law, and EU Accession 271
TABLE 10.5 FDI Stocks by Country of Origin, 2000(percent)
CzechCountry of Origin Turkey Poland Republic Hungary
Austria 0.5 3.2 11.1 12.2Belgium and Luxembourg 3.4 2.5 5.4 5.3Denmark 0.5 2.5 1.2 0.5Finland 0.1 0.6 0.6 1.6France 7.3 12.2 4.3 6.5Germany 14.1 18.9 25.5 25.8Ireland 0.2 1.2 0.0 0.7Italy 2.0 4.3 0.8 2.7Netherlands 31.4 24.6 30.1 22.5Spain 2.2 1.9 0.2 0.4Sweden 1.0 3.5 1.4 0.9United Kingdom 6.0 3.3 3.5 1.1
European Union, total 68.7 78.8 84.0 80.2Japan 4.4 0.4 0.5 2.1Korea, Rep. of 0.7 1.3 0.0 1.0Switzerland 5.4 2.5 4.0 2.1United States 8.7 9.5 6.5 8.2
Other OECD countries, total 19.2 13.7 11.0 13.4OECD, total 87.9 92.5 95.1 93.6
Other Eastern European countries 0.4 4.3 1.0 0.4Israel 0.1 0.0 0.0 0.0Saudi Arabia 1.1 0.0 0.0 0.0Panama 3.7 0.0 0.0 0.0Dutch Antilles 1.2 0.0 0.0 0.0Other countries 5.4 1.8 2.5 5.0
Total 100 100 100 100
Sources: See table 10.3.
top 20 Turkish FDI companies are in these two sub-sectors, followed by the electronics and electricalmachinery subsector. The absence of service sectorcompanies in the Turkish list is explained by theinvestment-to-sales profile typical of these subsec-tors, in which there usually is a lag between the large,lumpy up-front investments required and the subse-quent stream of sales revenues generated by theinstalled infrastructure service networks.
In terms of country of origin, a striking featureof FDI stocks is the significantly greater concentra-tion of investment going from EU countries to theofficially recognized EU accession countries thanto Turkey (table 10.5). In 2000, Turkey receivedonly 68.7 percent in FDI flows from EU countries,in contrast to Poland, Hungary, and the Czech
Republic, which received 79, 80, and 84 percent oftheir FDI flows, respectively, from EU countries.Turkey has, however, received significantly moreFDI inflows from Japan, Saudi Arabia, and offshorelocations such as Panama and the NetherlandsAntilles than the three CEE countries. Interestingly,in spite of important investments from the UnitedStates in the top 20 Turkish FDI companies (motorvehicles, rubber, and glass), the relative share ofU.S. investment is not significantly different inTurkey than in the CEE countries.
Determinants of FDI
Investment climate can be defined as the policy,institutional, and behavioral environment, present

and expected, that influences the perceived returnsand risks associated with investment in terms ofboth quantity and productivity of investmentflows.5 Investment climate depends on a wide arrayof factors that can be grouped under three broadheadings: macroeconomic and trade policies, infra-structure, and governance and institutions. Thesefactors help to explain both the strong potentialattractiveness of Turkey as a global location for FDIand the shortcomings that have led Turkey to fall sofar below its potential in this area.
Macro Policies, Infrastructure, and the Automotive SectorMacroeconomic and Trade Policies. Since the1980s, Turkey has undergone significant changes inits economic relations with the outside world involv-ing its macroeconomic and trade policies. After theJanuary 24, 1980, decision to open up Turkey’s econ-omy, the government put great emphasis on anexport orientation. This first step was followed bygradual import liberalization, which began in 1984and finally culminated in the customs union withthe EU in 1996. However, despite the gradualremoval of trade barriers and the greater export ori-entation, Turkey was unable to attract large FDI
inflows. One of the main culprits behind this failurewas the uncertain macroeconomic environment.With its heavy dose of patronage relations and rent-seeking activities, domestic politics never allowedthe creation of a stable macroeconomic environ-ment. Fiscal imbalances continued throughout the1990s, and were transformed into rather stark debtdynamics by the end of the decade (table 10.6).Public sector borrowing requirements increasedfrom 5 percent of the gross national product (GNP)in 1995 to as high as 15.5 percent in 1999 and 2001.Chronic budget deficits and the rapidly increasingpublic debt are at the root of the high and chronicinflation problem that Turkey has suffered over thelast 25 years. During that time, the average con-sumer price inflation rate was 63 percent, and overthe last two decades annual inflation has never beenlower than 30 percent. Through the second half of1990s and early 2000s, the real interest rate was quitehigh. With the exception of 1997 and 2000, the expost real interest rates on bonds and Treasury billswere above 20 percent, reaching as high as 36 per-cent. In addition to the high real interest rates thatinhibit domestic and foreign investment, theexchange rate devaluation risk created an extraburden on foreign investors who were willing toinvest in the country with a long-term perspective.
272 Turkey: Economic Reform and Accession to the European Union
TABLE 10.6 Macroeconomic Indicators, 1995–2001
1995 1996 1997 1998 1999 2000 2001
(percent of GNP)Public sector borrowing requirement 5.0 8.6 7.7 9.4 15.6 12.5 15.5Primary surplus 2.1 1.3 0.0 2.1 −1.9 3.8 6.5Interest expenditures (consolidated budget) 7.4 10.0 7.7 11.5 13.7 16.3 22.2Public sector debt stock 37.6 40.3 40.5 41.3 51.8 53.4 97.8
Domestic 14.6 18.5 20.2 21.7 29.3 29.0 66.3External 23.0 21.8 20.3 19.6 22.5 24.4 31.5
(percent per year)Interest rate on bonds and T-bills (average) 124.2 132.2 107.4 115.5 104.6 38.2 99.6Inflation (CPI, annual average) 89.0 80.2 85.7 84.6 64.9 54.9 54.4Ex post real interest rate (CPI-based) 24.4 25.0 12.4 30.7 32.1 −10.5 36.0GNP growth rate 8.0 7.1 8.3 3.9 −6.1 6.3 −8.5
Real exchange rate (CPI-based index) 100.0 102.7 109.4 118.5 123.1 136.5 112.5Real exchange rate (WPI-based index) 100.0 101.2 107.0 110.1 107.4 114.3 98.3Average maturity of borrowings (days) 188.0 186.6 393.5 235.1 502.3 426.8 146.3
Note: CPI = consumer price index; WPI = wholesale price index.Sources: Yılmaz, Akçay, and Alper 2002; Özatay and Sak 2002.

Turkey’s Foreign Direct Investment Challenges: Competition, the Rule of Law, and EU Accession 273
Because of the uncertainties stemming fromdomestic politics, the macroeconomic environ-ment, and the ensuing high real interest rates,Turkey experienced very erratic growth perform-ance. After the capital account liberalization in1989, it was able to attract foreign capital to financepublic sector borrowing requirements and generategrowth rates of about 5 percent. Yet because of theavailability of external funds, successive govern-ments were “unable” to bring budget deficits, andthus inflation, under control. As the country’sinability to cope with its economic woes becameevident toward the end of the 1990s, the externalfunds dried up and growth rates declined sharply.The 2001 economic crisis was the final blow thatunderlined the need for a new economic policyframework in Turkey.
Over the last two decades, Turkey put on holdmany decisions that could help foreign investorscope with high inflation. One of the critical meas-ures was an inflation accounting framework. In acountry that has lived with an average of 60 percentinflation, it is only now that an inflation accountingframework has been implemented.
Infrastructure-Related Factors. The quantity andquality of Turkey’s broadly defined infrastructure,
including its geographic and demographic endow-ments and its physical and financial infrastructure,help to position Turkey as a potentially powerfulmagnet for FDI inflows. Turkey enjoys a very spe-cial location at the crossroads between East andWest, overlapping Europe and Asia geographicallyand culturally. The proximity to the Balkans andthe rest of high-income Europe, as well as to theemerging markets in Russia, Caucasia, and CentralAsia and the expanding markets of the Middle Eastand North Africa, offers the potential of over 1 bil-lion consumers.
As highlighted in tables 10.7a and 10.7b,Turkey’s demographic endowments present bothstrengths and weaknesses to foreign investors whencompared with those of Poland, the Czech Republic,and Hungary. Turkey’s huge and growing domesticmarket compares favorably with those of the com-parator CEE countries. Turkey is projected to con-tinue to have one of the largest populations in theMiddle East and Eastern Europe. The domestic mar-ket is predominantly urban, and at least 17 majorcities have a population in excess of 1 million, led byIstanbul, Ankara, and I
.zmir. The population is
much younger than those of European countries;over 60 percent of the population is below the ageof 35. On the negative side, the purchasing power of
TABLE 10.7a Infrastructure-Related Factors—Strengths: Turkey versus ComparatorCEE Countries
CzechTurkey Poland Republic Hungary
Demography and business values
Population—market size (millions) 67.8 38.7 10.3 10.1Labor force growth (% change) 2.46 −0.33 −0.04 −0.47Avg. no. of working hours per year 2,074 1,870 1,976 1,988Flexibility and adaptability of people (survey) 7.53 4.77 5.83 6.74Entrepreneurship (survey) 7.03 4.12 6.44 6.74Availability of competent senior managers (survey) 6.5 5.21 4.92 6.37
Physical and financial infrastructureInternet costs for 20 hours (US$) 11.4 39.16 42.92 42.61Adequacy of communications (survey) 6.66 4.93 7.17 7.19Quality of air transport (survey) 7.44 4.55 7.00 5.93Adequacy of distribution infrastructure (survey) 6.06 3.68 5.67 4.89No. of credit cards issued (per capita) 0.57 0.13 0.21 0.29Availability of finance skills (survey) 6.88 5.26 4.78 6.52
Note: The survey measures are all reported on a 0–10 scale, with 10 indicating the most positiveperception.Source: All measures are from the Institute of Management Development (IMD) 2002.

the average citizen is still significantly lower thanthat in the CEE countries, with per capita GDP 30percent less than Poland’s and less than half that ofHungary and the Czech Republic. Yet Turkey’simproving consumption patterns and purchasingpower, along with its growing middle class, areimportant positive features of the domestic market.Because Turkey’s population growth rate has fallenfrom over 3 percent to under 2.5 percent, it is on theverge of entering a “golden demographic period”similar to that experienced by East Asia in the1980s, in which the productive working populationis largest relative to children and retirees, providinga critical ingredient for rapid income growth. Onlya few emerging markets in the world have thepotential to attract investment both for export andfor their domestic market. Turkey, however, is insuch a privileged position. It has the potential tocreate a “virtuous investment cycle,” in which amore competitive domestic business environmentfurther strengthens the country as a platform forexports, and the exports, in turn, stimulate firms toupgrade and better serve the domestic market.
In addition to geography and demography,another area in which Turkey compares favorably
with its comparator CEE countries is its highlyskilled, flexible, and business-oriented labor force.As reported in table 10.7a, Turkey’s work force isconsidered to be significantly more flexible, adapt-able, and entrepreneurial than those of its com-parator countries.6 Yet its levels of actual employ-ment, adult literacy, secondary school enrollment,and female labor force participation are low relativeto those of the CEE countries, indicating the strongpositive role still to be played by more widespreadand improved nationwide education services.Although Turkey scores comparatively well in termsof availability of competent senior managers, train-ing of employees is less of a priority in Turkishcompanies on average than in the CEE countries.
As for the traditional basic infrastructure meas-ures, Turkey is again characterized by areas ofstrength and weakness (tables 10.7a and 10.7b). Incommunications and transport, Turkey stands outfor its relatively low Internet costs—the cost ofInternet access in Turkey for a basket of 20 hours atpeak time is the lowest of all countries included inthe World Competitiveness Yearbook 2002 (IMD2002) and is perceived as providing adequatecommunications standards. Turkey also is rated
274 Turkey: Economic Reform and Accession to the European Union
TABLE 10.7b Infrastructure-Related Factors—Weaknesses: Turkey versus Comparator CEE Countries
CzechTurkey Poland Republic Hungary
Demography and business values
GDP per capita (US$ at PPP) 6,175.0 9,151.0 14,485.0 12,663.0Employment (% of population) 29.1 37.1 45.8 37.4Adult literacy (% of population over 15 years) 84.6 99.0 99.0 99.0Secondary school enrollment (% of relevant 51.0 87.0 100.0 97.0
age group)Female labor force (% of total labor force) 26.4 45.1 44.7 44.5Employee training in companies (survey) 4.03 3.74 5.61 5.78
Physical and financial infrastructureElectricity costs for industrial clients (US$/kWh) 0.082 0.037 0.043 0.050Adequacy of energy infrastructure (survey) 3.94 5.57 7.94 6.69Computers per capita (per 1,000 people) 53.0 122.0 179.0 176.0Technological cooperation between 4.00 4.03 6.17 5.19
companies (survey)Credit flows from banks to business (survey) 2.84 3.39 3.28 4.52Venture capital for business development (survey) 1.97 3.42 3.17 3.48
Note: The survey measures are all reported on a 0–10 scale, with 10 indicating the most positiveperception. PPP = purchasing power parity.Source: All measures are from IMD 2002.

Turkey’s Foreign Direct Investment Challenges: Competition, the Rule of Law, and EU Accession 275
highly for both air transport quality and internaldistribution infrastructure. Yet Turkey lags behindin its energy infrastructure. Although it recentlypassed new laws on its electricity and natural gasframework, which are designed to spur significantmarket-driven improvements in line with Turkey’sunderlying endowments, effective implementationto yield the expected results will take some time.Turkey also lags behind the CEE countries in com-puterization and technological cooperation. Finally,in finance, Turkey stands out in the breadth of itsprivate sector–relevant finance skills and access tocredit cards. But Turkey performs less well in areascritical to starting new indigenous businesses notconnected to existing industrial groups; venturecapital for business development is not so easilyavailable, and credit does not flow very easily frombanks to businesses.
The Automotive Industry. A natural implication ofTurkey’s large domestic market is the presence ofFDI directed largely toward the internal market.However, the automotive industry is a good exam-ple of how an initially protected home market canbe transformed into a competitive and increasinglyexport-oriented industry through FDI inflows.During the debate on the customs union, the auto-motive industry was expected to be the industryworst affected by lowering protections on EUimports. However, that prediction was provedwrong. Over the last few years, the automotiveindustry has become the second largest exporter.
By the mid-1990s, four FDI companies hadmore than 20 years of experience in the Turkishautomotive industry (Fiat, Ford, Mercedes, andRenault).7 In the mid-1990s, with the increasingprospects of a customs union agreement with theEU, Japanese and Korean companies (Honda,Hyundai, Isuzu, and Toyota) began investing inTurkey in joint ventures with Turkish industrial-ists.8 Perhaps because of the uncertain businessenvironment in Turkey, these companies did notinitially make substantial investments, and theybuilt plants with small production capacity. Oncethe customs union with the EU went into effect in1996, the domestic market gradually opened totough competition from the EU. Actually, in thefirst couple of years of the customs union, thesector struggled with wild fluctuations in domesticdemand as well as with competition from imports.
However, much was at stake. There was already asubstantial production capacity, coupled with acompetitive parts and accessories industry. Inaddition, domestic business establishments withyears of experience in the automotive industry andlow-cost but good quality labor induced FDIcompanies in the automotive sector to increasetheir investments in Turkey and build new capacityto produce motor vehicles for the European mar-ket. None of the companies just mentioned decidedto close shop in Turkey. Only Opel decided to closeits small assembly plant near I
.zmir.
In the meantime, the auto parts industry was alsoattracting foreign investors. Most of the world lead-ers in the sector have joint ventures with Turkishpartners. Some of them are big suppliers suchas Robert Bosch, Valeo, Delphi Packard, andMannesmann Sachs. Altogether, between 1992 and2000, the automotive industry realized a total of$3.4 billion in investment. Of this amount, theindustry used $750 million for capacity develop-ment, $976 million for new model development,$497 million for modernization, $300 million forlocalization, and $195 million for quality improve-ment. Moreover, because of the new investmentprojects directed at the production of new models,in 2000–02 this investment amount increased byalmost $1 billion.
The success of the automotive industry in attract-ing FDI flows, despite the continuing constraintsarising from macroeconomic and governance andinstitutional factors (see next section), is drivenlargely by the relevance of all the positive aspects oftrade and infrastructure for this industry—the rea-son automobile-related multinational corporations(MNCs) decided to invest in Turkey. If other obsta-cles were not present, the Turkish auto industrywould likely have attracted far more FDI inflowsthan current levels.
Governance and Institutions: Case Studies Bot-tlenecks related to insufficient respect for the ruleof law and to weak competition in local markets,reinforced by uneven application of bureaucraticred tape and of competition rules to all economicactors in the market, profoundly damage any coun-try’s investment climate. In these critical areasrequiring improved governance and more effectiveinstitutions, Turkey, unfortunately, compares unfa-vorably with the comparator CEE countries, as
276 Turkey: Economic Reform and Accession to the European Union
reflected in the perceptions of the global investorsand experts who compiled the following rankings.According to the Heritage Foundation’s economicfreedom index 2003, Turkey ranks 105th (with ascore of 3.3), in contrast to Poland, 45th (2.7), andthe Czech Republic and Hungary, both tied at 32nd(2.4). In PricewaterhouseCoopers’ opacity index2001, Turkey ranks 74th, compared with the CzechRepublic at 71st, Poland at 64th, and Hungary at50th. Finally, in Transparency International’s cor-ruption perception index 2002, Turkey ranks 64th(with a score of 3.2), in contrast to the CzechRepublic at 52nd (3.7), Poland at 45th (4.0), andHungary at 33rd (4.9).
To help illustrate what may be the central under-lying factors accounting for Turkey’s poor perform-ance in these widely cited indices, the rest of this sec-tion presents three case studies that reflect the recentexperiences of actual foreign investors. The casestudies represent the primary sector (Normandy’sexperience in gold mining), the secondary manufac-turing sector (Cargill’s experience in agroprocess-ing), and tertiary services (I
.s-TIM’s experience in the
mobile telecom market). Figure 10.4 summarizesthe main facts of the case studies. A discussion of thecommon elements across the case studies follows.
The Eurogold Investment. Because of its complexgeology, Turkey possesses a diverse and rich arrayof minerals. It is a major world producer of boronminerals (it has two-thirds of the world’s boratereserves), marble, copper and chrome ores,feldspar, magnesite, and others. Its total mineralindustry revenues (primary and secondary mineralproduction, including cement, glass, refined petro-leum products, steel, and certain inorganic chemi-cals) are estimated to account for roughly 10 per-cent of GDP. The mining sector is stilloverwhelmingly controlled by state-owned compa-nies, although some public companies have beenplaced in the privatization process. Since enact-ment of the mining law (No. 3213) in 1985, thepeak points in the value of FDI approvals in thesector have occurred with the following majorinvestments: in 1990 in the Omya calcite mine, ajoint venture involving the Swiss company of thesame name; in 1991 in the Ovacik gold deposit byEurogold; and in 1995 in an Eskisehir magnesitemine by Magnesit A.S., a subsidiary of the Dutch-based Société d’Interets Magnesiens.
Normandy Madencilik A.S. (formerly Eurogold,but later purchased by Australia-based NormandyMining Limited) was registered in 1989 as a 100 per-cent FDI company. It found total reported goldreserves of 24,000 metric tons (and another 24,000metric tons of silver) near the village of Ovacik,Bergama, in I
.zmir province. Under the initial appli-
cation, the mine was to be operated for eight years,if no more reserves were discovered in the interim.The ore would be mined by both open pit andunderground mining methods, followed by cyanideleaching. Gold and silver doré metal were to be thefinal products. In response to a request by the com-pany in August 1991, the Ministry of Environmentissued a letter of no objection in October 1994,indicating no health and environmental drawbacksand allowing the mining and processing facility tooperate. The company also secured the requiredpermit for mining activities from the Ministry ofEnergy and Natural Resources, and related permits,licenses, and investment certificates from relevantgovernment entities. The amount of total invest-ment was $100 million. As part of its application in1991, Normandy prepared an environmentalimpact assessment (EIA) report. After enactment ofa formal EIA regulation in 1993, Normandy agreedto meet the new discharge limits, even though itwas exempt from the EIA because the mining rightswere granted before the regulation took effect.Accordingly, the waste material from the facilitywould be stored in a water retention-type tailingsdam, lined with clay and geo-membrane liners,with no discharge to the environment.
The judicial problems facing Normandy beganwith a court case initiated by the inhabitants ofOvacik and some nongovernmental organizations(NGOs) in 1994, based on a suit to annul the origi-nal Ministry of Environment decision authorizingthe project. Long-lasting and repeated legal proce-dures followed. In 1997, after a long judicial processand just as construction of the facility had beencompleted and the mine was ready to operate,Turkey’s highest relevant court, the Council of State(Danıstay), overturned the initial governmentauthorization and ordered the mine and processingplant to be sealed by 1999. The ruling stated that thefacility’s proposed use of cyanide posed risks forhealth and environment and thereby violated Article17 of the constitution, which granted all citizens theright to live in a healthy and balanced environment.

Turkey’s Foreign Direct Investment Challenges: Competition, the Rule of Law, and EU Accession 277
Undercapacityproduction
Regulatory body unable tocreate a level playing field
Unpredictable introduction of quotas
The Eurogold Investment
EUROGOLD COMPANY
OPERATINGUNDER SPECIAL
PERMIT:Permanent solution
not achieved
Local inhabitants of Ovacikregion went to litigation.
Dynamics of Eurogold case
MARKET HISTORY
• Formerly Eurogold but subsequently purchased byNormandy Mining Ltd.
• Registered in 1989 as 100% FDI company
• Found gold reserves of 24,000 metric tons
• Licences granted in 1991
• Turkey possesses a rich and diverse array of minerals.
• Enactment of Mining Law in 1985
• Environmental Impact Assessment (EIA) regulationenacted in 1993
The Cargill Investment
CARGILL, Incorporated
OPERATINGUNDER SPECIAL
PERMISSION:Permanent legalsolution required
Dynamics of Cargill case
MARKET HISTORY• U.S.-based but Dutch registered
• Began starch-based sugar production in 1990
• US$90 million investment at Orhangazi, January 1998
• 29 companies in traditional beet sugar production
• 80% of beet sugar capacity state-owned
• 5 private companies in starch-based sugar production
• Lobbying from beet sugar producers
• Inappropriate permission of HighPlanning Board
ARBITRATIONRulemaker unable to create a
level playing field
Long-lasting and repeated legal procedures
4 pending court cases since 2001 on construction,
discharge, and emission
Roaming agreement could not be signed
Dynamics of Is-TIM case
IS-TIM ARIA COMPANY
• Third GSM operator of Turkey
• Consortium of Isbank and Telecom Italia Mobile
• Paid license fee of US$2.5 billion
• Began operations in March 2001
MARKET SHARES(by end of 2002)
• Turkcell 64.3%
• Telsim 30.2%
• Aria 4.7%
• Aycell 0.8%
MARKET HISTORY
• Revenue share agreements between TürkTelekom and Turkcell and Telsim in 1994
• Telecommunications Regulatory Authorityestablished by Law No. 4502 in 2000
• Third GSM license allocated to Is-TIM in 2000
• Another GSM license granted to Aycell(state-owned)
Is-TIM Mobile Telecom Investment˙
˙
˙
˙
˙
FIGURE 10.4 Case Studies
Source: The authors.

Some lawyers have criticized Danıstay’s decisionthat the technical method for mining was hazardousto human health. They argue that setting the ruleson such a technical issue and prohibiting the use of atechnical method are not the responsibility ofDanıstay; rather, that responsibility resides with therelated ministries or government institutions.
In response to this ruling, Normandy took addi-tional safety measures in 1998 and reapplied to theMinistry of Environment for administrativepermission, adding a cyanide destruction systemfor effluents from the facility, a sealed tailings pond,and a zero discharge system for wastewater. Withthese measures, the Ovacik facility became knownas one of the better examples of environmentalprotection in the world (see, e.g., Arol 2002). TheMinistry of Environment, in turn, consulted withthe Prime Ministry. The Prime Ministry appointeda team of scientists under the governance of theTurkish Scientific and Technical Research Institute(TUBITAK) to evaluate the process. Based on apositive report from TUBITAK, the company wasallowed to operate the facility for a one-year trialperiod, and it began operations in June 2001.Normandy has been operating the facility sincethen and publicizing the results of periodicindependent environmental monitoring showingresults well within national and internationallimits.
Project opponents have continued to challengegovernment decisions in various administrativecourts in I
.zmir, with at least 10 separate court cases
filed since August 2000 by local plaintiffs; defen-dants are the Prime Ministry, Ministry of Environ-ment, Ministry of Health, and Ministry of Forestry.In late February 2002, an administrative court inI.zmir ruled that the trial permit was violating the
public good and issued an injunction against thefacility, ordering it to close on April 2, 2002. How-ever, the government passed a special permit forNormandy to continue operations.
Normandy’s involvement in Turkey has benefitedthe Turkish mining sector in terms of improvingenvironmental standards in the sector, applyingstate-of-art technology in gold mining and process-ing, and improving local technical training. Sincethe start of operations in June 2001, the facility hasprovided direct employment for 250 persons andindirect employment for an additional 1,200,including through the formation of new businesses
in supporting industries. The acquisition ofNormandy Mining Limited by U.S.-based NewmontMining Corporation was completed in February2002.
This case study highlights the problems forinvestors arising from the insufficient clarity of andlack of respect for the rule of law in Turkey. In thisinstance, Normandy followed established rules andprocedures. The initial government authorization bythe Ministry of Environment based on Normandy’sadherence to the prescribed rules did not protect thecompany from successive legal challenges. After thefirst order for plant closure, subsequent authoriza-tions based on the company observing newlyprescribed rules (the new EIA regulation) by theMinistry of Environment, the Prime Ministry, andTUBITAK again were overturned, and the plant wasordered to be closed for a second time in August2004. Since the plant shut down, the government hasnot issued a technical standard on the permittedmethods for gold mining and specifically for cyanideleaching. Moreover, the government has adoptednew regulations on sectoral licensing authorizingthe Ministry of Health and the provincial governors,along with the Ministry of Environment, to issueoperating licenses. Faced with insurmountable legalproblems and the constantly changing regulations,the parent company, Newmont Mining Corpora-tion, sold Normany Mining to a Turkish company inearly February and withdrew from Turkey.
Cargill Starch-Based Sugar Investment. Turkey’ssugar production can be divided into traditionalbeet sugar (sucrose or ordinary table sugar)processed from crushed sugar beets and starch-based sugar (glucose and fructose), a lower-costalternative processed from maize. Althoughfructose can be used as a substitute for sucrose(because it is sweeter and metabolizes more slowly,it is often used in food products designed forpeople with diabetes), glucose cannot be used as asubstitute, even though both are used as importantsweetener inputs in food processing industries. Themore traditional beet sugar is produced by 29 com-panies in Turkey, with state-owned productioncapacity accounting for 80 percent of the total.Starch-based sugar is produced by five private com-panies, of which three are MNCs. In 2001 Turkeyproduced 2 million metric tons of beet sugar, overfive and a half times more than the privately
278 Turkey: Economic Reform and Accession to the European Union

Turkey’s Foreign Direct Investment Challenges: Competition, the Rule of Law, and EU Accession 279
produced 360,000 metric tons of starch-basedsugar (235,000 of fructose, 125,000 of glucose). Thesugar industry is characterized by substantial excesscapacity, with total production capacity of 2.25 mil-lion metric tons of beet sugar and 930,000 metrictons of starch-based sugar. However, given theuncompetitively high local production costs of beetsugar, even current levels of beet sugar productionare feasible only with extremely high nominal ratesof protection of 78.5 percent and effective rates ofprotection of 1,500 percent. The excess capacity ofstarch-based sugar is not market based, however.It was artificially created by the new sugar law(No. 4634) announced in April 2001, whichimposed a quota limiting starch-based sugarproduction to 10 percent of total beet sugar pro-duction in response to pressure from beet sugarfarmers and processors. (This quota can beincreased to 15 percent by the Council of Ministers.The actual quota has always been 15 percent.)
U.S.-based but Dutch-registered Cargill Incor-porated began starch-based sugar production inTurkey in 1990. It obtained the required investmentcertificates (10 separate certificates between 1990and 1997) for a wet corn milling (starch) process-ing plant in Pendik, Istanbul, with a capacity of220,000 metric tons. Based on the success of thatplant, Cargill obtained an additional investmentcertificate for a $90 million investment in a secondfacility at Orhangazi, in Bursa province in January1998, again with a capacity of 220,000 metric tons.Like the first facility, this plant was constructed infull compliance with all the relevant legislation inforce, and it has obtained all the necessary consents,permits, licenses, and authorizations (with a specialcondition within the foreign investment certificaterecognizing the High Planning Board decisiontransferring the former agricultural area land intoindustrial area land). Significantly, 800 families and4,000 people in the region were making their livingout of the Orhangazi facility between 1998 and2002, and 70 percent of the maize processed in thefacility in 2002 was purchased from domesticgrowers.
In response to intense lobbying from the moreexpensive beet sugar producers, the Orhangazifacility has, since 2001, faced two separate butrelated problems. First, four court cases, still pend-ing, commenced in 2001 challenging the govern-ment’s initial granting of construction, discharge,
and emission permits. The plaintiffs, supported bythe Bar Association of the city of Bursa, variousprofessional chambers of Bursa, and some nationalmembers of Parliament from Bursa, undertookthese actions against the Prime Ministry, theGovernorship of Bursa, and the Ministry of PublicWorks and Housing. Although a case in the SixthAdministrative Chamber of the Council of Statewas decided unanimously in favor of Cargill andthe government, it was appealed by the plaintiffs.Eventually, the initial decision was overruled, andthe plaintiffs then sought cancellation of theoriginal discharge and emission permits. A sepa-rate ruling found that the High Planning Boardgave inappropriate permission for facility con-struction on “first priority agricultural land”—that is, it was claimed that the permission was incontradiction of the constitution. It was, therefore,ruled that the Orhangazi facility must be torndown. For a while, the company operated underspecial permission by the government. Then, in2004, the government enacted a new law for theestablishment of “industrial zones.” The lawauthorizes the Council of Ministers to designatecertain regions or already existing plant locationsas industrial zones in which construction, dis-charge, and emission permits are not obligatory.Cargill has applied to the Industrial Zone Coordi-nation Board for industrial zone status for theOrhangazi facility, and it is likely to be granted.However, no one, including government officials,knows what will happen when the court cases arefinalized.
The second problem is related to the unpre-dictable introduction of quotas on starch-basedsugar production in 2001. The initial governmentpolicy was to create substantial additional capacityby promoting starch-based production to substitutefor higher-cost beet sugar. Although the initialquota for the period 2002–03 was restricted to234,000 metric tons, it was increased by 50 percentby a subsequent Council of Ministers decision.However, the government’s decision to increase theproduction quota has been ineffective so far,because it has not been implemented by the respon-sible independent regulatory board (the newly insti-tuted Sugar Board). To add to the already existingchaos, the government abolished some articles ofthe sugar law at the end of 2004. With this move, theSugar Administration was abolished. Now the Sugar

Board legally exists, but it does not have an institu-tion to represent. A lawsuit is being prepared forcancellation of the decree on the grounds that thegovernment does not have the authority to changethe law unless there are international commitments.
This case highlights problems for investors simi-lar to those encountered in the Eurogold invest-ment, again arising from insufficient clarity of andthe lack of respect for the rule of law. Cargill, too,followed the established rules and procedures. Theinitial government authorization granted in 1998(supported by a High Planning Board decision)after Cargill followed the prescribed rules again didnot protect the company from successive legal chal-lenges, nor did subsequent support by the govern-ment (Prime Ministry, Ministry of Public Worksand Housing, Governorship of Bursa) protect thecompany from plaintiffs eager to find legal loop-holes to force plant closure (and, again, the legalproblems have still not been solved permanently).In addition, this case highlights the negative impacton investments arising from the lack of a level play-ing field for all firms. In effect, unpredictable anduneven changes in rules with the introduction ofhighly restrictive quotas on some market playersand not on others, together with the biased andanticompetitive decision of the Sugar Board infavor of entrenched local incumbents, have anegative effect on investments not only by efficientcompanies in the sugar industry but also byefficient companies in all sectors.
I.s-TIM Mobile Telecom Investment. The move to
liberalize the Turkish telecommunications indus-try’s state-run monopoly began in 1994 with legis-lation to corporatize (as a state economic enter-prise) the sole fixed-line operator, Türk Telekom(TT) and remove telecom services from directgovernment involvement. Also in 1994, the mobiletelecommunications market was opened to limitedcompetition from two private operators, Turkcelland Telsim, which began business under revenue-sharing agreements with Türk Telekom. Theseduopoly providers were granted 25-year licenses in1998, although this initial assignment of spectrumwas not competitively determined. In January2000, new legislation (Law No. 4502) establishedan independent authority, the TelecommunicationsAuthority (TA), and Türk Telekom was grantedindependence in business operations, but it was to
end its monopoly in fixed-voice telephony byDecember 31, 2003. The third mobile license wasallocated on the basis of a competitive tender inApril 2000, with the condition that the minimumbid for a fourth license be equal to that paid bythe third operator. I
.s-TIM, a consortium of
domestic I.sbank and the mobile phone arm of
Telecom Italia Mobile (TIM) operating under theAria brand, won the third tender with an unex-pectedly high bid price of $2.525 billion, sus-pected to have been an attempt to prevent afourth operator from entering.9 The tender offerfor a fourth license failed, and the fifth license wasgranted to Türk Telekom (through a newlycreated subsidiary, Aycell) at the same price paidby I
.s-TIM. I
.s-TIM entered the market in March
2001 and Aycell in December 2001. By the end of2001, the mobile penetration rate had reached28.7 per 100 inhabitants, surpassing that in thefixed-telephony market. By the end of 2002,Turkcell had a market share of 64.3 percent,Telsim 30.2 percent, I
.s-TIM 4.7 percent, and
Aycell 0.8 percent. Unlike Eurogold and Cargill,which are 100 percent FDI companies, I
.s-TIM is a
joint venture investment in which TIM owns49 percent and the domestic partner is one of thelargest banks and holding companies in Turkey.
The main problem facing I.s-TIM since its entry
into the Turkish market has arisen from itsinability to conclude mutually acceptable roamingagreements with the incumbent competitors,Turkcell and Telsim. After the parties failed toresolve the tariff dispute among themselves, inMarch 2001 I
.s-TIM asked the TA to intervene. The
regulator determined the terms, conditions, andtariffs for roaming in October 2001, but Turkcelland Telsim obtained preliminary injunctiondecisions in November 2001 with the aim ofsuspending implementation of these terms andconditions, and they applied to international arbi-tration. In March 2002, the TA adopted the Regula-tion on the Procedures and Merits concerning theExecution of National Roaming Agreements, butTurkcell and Telsim again obtained preliminaryinjunction decisions and applied to internationalarbitration for a second time. I
.s-TIM raised an
objection against both injunction decisions as thethird party suffering from the decision, but itsobjections were rejected. I
.s-TIM sent a letter as a
last warning to the TA in February 2003 and filed a
280 Turkey: Economic Reform and Accession to the European Union

Turkey’s Foreign Direct Investment Challenges: Competition, the Rule of Law, and EU Accession 281
lawsuit against the TA with the International Courtof Arbitration of the Paris-based InternationalChamber of Commerce on March 31, 2003, seek-ing nearly $3 billion in damages as a result of thenegative response to its letter (the full value of thepaid license fee plus valued added tax, becauseTurkey did not make available the roaming rights ithad purportedly promised). On May 13, after nego-tiations involving Italian Prime Minister SilvioBerlusconi and Turkish Prime Minister YılmazErdogan, I
.s-TIM announced a merger with Aycell
(TIM and Türk Telekom each to hold 40 percent ofthe merged provider, with I
.sbank holding the
remaining 20 percent). With the announcement ofthe merger, I
.s-TIM withdrew its lawsuit, because
the merger is expected to furnish I.s-TIM with
national roaming capacity, given Aycell’s sizablenetwork of base stations. The Turkish governmentaccepted the merger of the two companies to pre-vent any further damage to Turkey’s already poorreputation with foreign investors. The merger wascompleted in February 2004. The new company iscalled TT-TIM and is operating under the Aveabrand, with a market share of 16 percent.
In the meantime, on June 9, 2003, Turkey’sCompetition Board fined Turkcell $15.4 millionand Telsim $6.1 million (1 percent of the compa-nies’ net sales in 2001) for refusing to allow I
.s-TIM
access to their networks. The Competition Boardruled that Turkcell and Telsim have been deliber-ately stifling competition in the mobile servicesmarket. The Competition Board also urged the TAto provide the requisite remedy by better regulatingthe market in order to end competition ruleviolations of this kind.
The request for arbitration arose out of the rightthat national operators have to national roamingand the presumption by I
.s-TIM that this right was
not adequately guaranteed by the TA. The right ofI.s-TIM to benefit from national roaming is included
in Article 6 of Law No. 4502, which requires mobileoperators “to satisfy reasonable, economicallyproportionate and technically feasible roamingrequests of other operators working in the samefield” and requires the regulator “to issue regula-tions setting out the principles of implementationof this provision and the details to which standardreference tariffs, interconnection and roamingagreements are subject.” National roaming rightsare also presumed to arise out of Article 35 of the
concession agreement between I.s-TIM and the TA.
The article requires the regulator “to provide anecessary, sufficient and fair competitive environ-ment since I
.s-TIM entered the market,” although it
also specifies that “the coverage area of the [new]companies should cover 50 percent of the popula-tion of the country in three years and 90 percent infive years by investments exclusively made by theoperators themselves without any national roamingsupport.” The presumed shortcoming of the TA isthat it has been late in coming up with its own regu-lations on roaming, that standard interconnectiontariffs based on the long-run incremental costaccounting methodology have not yet been estab-lished, and that no requirement is in place ensuringthat regulatory decisions remain in force whilecourt proceedings are undertaken.
The I.s-TIM case, like the Cargill case, highlights
the negative impact that lack of a level playing fieldfor all firms has on investments. Although the rele-vant regulatory body in the sugar industry made ananticompetitive decision in favor of entrenched localincumbent enterprises, the anticompetitive impactin this instance arose from the inability of the TA toimpose a pro-competitive decision about roamingrights on Turkcell and Telsim in a timely manner.The origins of the problem in this case are related tothe too-slow evolution of rules and regulations inthe telecommunications sector and the lack ofauthority of the regulatory body, driven no doubt atleast in part by a natural learning process of the TA.
Common Governance- and Institutions-RelatedConstraints. One of the common features of thethree cases examined is the lack of credible indus-trial policy framework statements that could giveinvestors confidence in the expected rules of thegame in each industry. In fact, no such document isavailable for any industry. Even the changes madein the legislative framework for telecommunica-tions in May 2001 that gave more power to the TAwere made without a clearly articulated policyframework. Thus, they hardly form the basis forgiving investors confidence about the government’slong-term vision for the industry and for the econ-omy as a whole. To help give credibility to suchpolicy framework statements, related legislation,including implementing decrees in line with thepolicy statements, are essential, as is the subsequentconsistent implementation of such legislation.
The case studies highlight two distinct butrelated classes of constraints that account forTurkey’s poor performance in attracting FDI: (a)the legal and judicial constraints related to theinsufficient clarity of and lack of respect for the ruleof law, and (b) competition constraints related tothe absence of a level playing field for all firms. Lackof clarity refers to insufficiently defined, missing,incoherent, or changing rules. Lack of respect forthe rule of law refers to the practice of decisionmaking based not on ex ante defined rules but onopportunistic motives irrespective of the prevailingrules. It also refers to both a reluctance to applyrules when they should be applied and a tendencyto allow loopholes and ambiguities to persist in thelegal framework. Lack of respect for the rule of lawcreates an environment in which multiple appealsare common and in which successive appealsattempt to overrule the previous court’s or publicauthority’s ruling. The ineffectiveness of many ofthe recently established regulatory boards intensi-fies the adverse effects of this constraint on foreigninvestors. In such an environment, it is only naturalfor investors to lack confidence that establishedrights will be respected by the courts.
In each of the presented cases, the governmentas rulemaker has not been able to solve the underly-ing problems in a timely manner. In those instancesin which the government has strived to help theinvestor, its attempts have been met with judicialchallenges. These judicial challenges, when circum-vented by the government such as in the Eurogoldand Cargill cases, were carried out without address-ing the underlying legal bottlenecks. This funda-mental problem of unaddressed underlying legalambiguities appears to be one of the most criticalproblems. It raises the question of whether lack ofclarity in the underlying rule of law is intentional,so that public decision makers have the freedomrequired to grant special treatment and exemptionswhenever politically convenient. Unfortunately,the substantial cost of such unpredictability in therule of law in terms of forgone current and futureinvestments amplifies the impact of distortionsstemming from government allocations based onpersonal connections.
In the face of competition-related constraints,state-owned, local, joint venture, and fully foreign-owned companies are not able to compete on anequal footing. In both the Cargill and I
.s-TIM cases,
the failure of the relevant regulatory body to rap-idly enforce a pro-competitive order has sent nega-tive signals for future investments by existing ornew, potentially efficient enterprises. It is, of course,natural for entrenched local incumbents, whetherin primary, secondary, or tertiary sectors, to seek tomaintain market power and prevent new investorsfrom challenging their local dominance. However,it is the role of properly enforced competitionpolicies, both through the independent regulatorybodies and through the Competition Board, toensure that incumbent companies only do so bylowering their costs and offering improved prod-ucts rather than by seeking to dull the competitivemarket process, either on their own or throughalliances with organs of government.
This analysis of governance- and institutions-related constraints in Turkey is consistent with abroader analysis of politics and democracy inTurkey as populist patronage—allowing peoplegreater access to the resources of the state throughthe help of political parties (see, e.g., Kalaycıoglu2001). In a cultural environment in which interper-sonal trust is low, regional solidarity ties, bloodrelations, clientelistic networks, favoritism, andnepotism have deeply influenced and molded thepolitical culture.10 For patronage to thrive, authori-ties must distribute favors to their clientele, whichis difficult to do if allocation of contracts and con-tract monitoring, recruitment, promotion, tariffdecisions, and expansion of new entrants are con-ducted purely on meritocratic grounds andthrough transparent procedures as required by EUstandards. Only when rules and laws are appliedevenly for all market participants (and not directlymodified for politically influential firms) will non-market-based favoritism be overcome and moresubstantial investments driven by underlying effi-ciencies be forthcoming.
FDI-Related Policies andInstitutions and EU Accession
Turkey scores better than its competitors alongmany of the dimensions of FDI just described (alsosee tables 10.7a and 10.7b). A huge and growingdomestic market, skilled and cost-effective labor,strong local companies, and access to other expand-ing markets are all strengths of Turkey. Further-more, Turkey has had a liberal legal framework for
282 Turkey: Economic Reform and Accession to the European Union
Turkey’s Foreign Direct Investment Challenges: Competition, the Rule of Law, and EU Accession 283
FDI since 1954 and a convertible currency foralmost 15 years, far earlier than its competitors.However, relatively low levels of FDI inflows overpast years reveal that Turkey has not been able totranslate these competitiveness-related strengthsinto a sufficiently large number of concrete FDIprojects. In comparison with other candidate coun-tries, Turkey’s EU candidacy has not positivelyaffected its inflow of FDI, and figures show that eventhe customs union has had a negligible effect.11
The policies Turkey must follow to foster itsfuture competitiveness have to include all the tradi-tional components needed to attract more FDI, suchas the further harmonization of trade and industrialpolicies and the adoption of related legislation andadministrative procedures. However, these compo-nents are not sufficient conditions for a more com-petitive economy and will not automatically result inincreased inflows of FDI. All EU candidate countrieshave applied the acquis, but each country also hascountry-specific rules, policies, and institutions toseek FDI. In addition to meeting EU requirementsin a broad range of traditional harmonization-related areas, Turkey must attempt to improve itslegal/judicial and competition-related environmentin order to ensure predictable respect for the rule oflaw and a level playing field for all firms, not only onpaper but also in terms of implementation.
EU Requirements
Turkey’s EU candidacy status and obligations as amember of the customs union do not directly imposeEU requirements on Turkey’s FDI policy. Until 2003,no explicit clause on FDI policy appeared in theaccession partnership (AP) report or the “RegularReport on Turkey’s Accession,” even though Turkey’slimits on foreign ownership for certain sectors werecriticized in the context of freer movement of capital(European Commission 2003, 2002). However, FDIas well as domestic investments are very much relatedto the overall business environment and policy deci-sions on taxes and state aids, intellectual propertyrights, sectoral licenses, customs, and standards.Furthermore, broader areas of competition policyhave a direct impact on how a country performs inattracting FDI. Thus the previous AP documents andthe national program of Turkey had included a longlist of legislation to be amended, which, in turn,could positively affect the investment climate.
The 2003 accession partnership report for Turkeyhas, for the first time, clauses related to FDI policy(European Commission 2003). The two require-ments, which are explicitly stated in the AP docu-ment, both as short-term priorities, are that Turkeyshould “facilitate and promote the inflow of FDI”(in the Economic Criteria section) and “remove allrestrictions affecting FDI [originating from the EU]in all sectors in Turkey” (in the Free Movement ofCapital section).
As for broader EU requirements for FDI, the2002 “Regular Report” contains criticism of the lim-itations on foreign ownership in some sectors, of theauthorization system for investment, and of theobligation to pay $50,000 to establish a company oropen a branch in Turkey (European Commission2002). As for the restrictions on foreign ownershipin certain sectors, such as civil aviation, maritimetransport, port enterprises, radio and televisionbroadcasting, telecommunications, and mining andenergy, the government argues that most of theother candidate countries still have similar restric-tions and that Turkey should not remove them untila more definite road map for EU accession is agreedon. However, it is also argued that these restrictionsshould be removed not only to comply with the EUacquis, but also to develop a more competitiveinvestment environment for Turkey.
Reform Efforts to Date
Turkey adopted an ambitious structural reformprogram in 2001 to lay the foundation for sustain-able growth, driven by private investments andsupported by a smaller but more effective govern-ment. The main pillars of the government’seconomic program related to development of theprivate sector include an improved investmentclimate; a smaller, more transparent, effective pub-lic sector; a sound and competitive financial sys-tem; accelerated privatization; and a more efficientbusiness infrastructure, with a particular focus oncommunications and energy. The ongoing reformefforts are closely linked to Turkey’s objective toaccede to the EU. The government realizes thatTurkey has fallen behind many other developingcountries in its effective liberalization, enforcementpractice, legal, and judicial reforms. Pushing aheadwith the ongoing reforms is crucial to the country’seconomic future.

Currently, Turkey is implementing a major fiscaladjustment program to increase the effectiveness ofthe public sector while reducing its size. Fiscal andpublic sector reforms are imperative to ensure asustainable domestic public debt profile, which isitself critical to establishing macroeconomic stabil-ity with low inflation. These actions are essential toallowing lower interest rates, facilitating long-terminvestment planning, and promoting more robustprivate sector growth. To complement thesereforms and ensure their sustainability, Turkey alsois undertaking fundamental reforms of its expendi-ture and taxation systems. The banks act in 1999established the Banking Regulation and Supervi-sion Agency (BRSA) as an independent authority toregulate and supervise the banking sector. TheBRSA has implemented a comprehensive bankingrestructuring program to promote more efficientfinancial intermediation for the enterprise sector.To strengthen the scope for private sectorinvestment in telecoms, Turkey passed an amend-ing law in 2000 to create, as noted earlier, theTelecommunications Authority, an independentregulatory body responsible for licensing, tariffs,spectrum allocation, and other supervisory activi-ties. Similarly, to strengthen the scope for privatesector investment in energy, separate electricity andnatural gas laws in 2001 established the independ-ent Energy Market Regulatory Authority. In August1999, Turkey’s constitution was amended to estab-lish the legal basis for privatization and to allowpublic services to be performed under private law.Importantly, the amendments also allow the inter-national arbitration of disputes. A new public pro-curement law also was enacted in 2002. Althoughall these policy announcements are desirable and inthe right direction, the government must ensurethat these policies will be implemented carefully,consistently, and promptly so that business expec-tations will not be adversely affected.
To address feedback received from internationalinvestors about Turkey’s troublesome investmentclimate, the government in 2001 launched a reformprocess to improve administrative procedures. Theidea behind the Reform Program for Improving theInvestment Climate was that administrative barri-ers can make the difference between the perceptionthat a location is an attractive one for investmentand the perception that it is not competitive.Indeed, complex and time-consuming administra-
tive procedures appear to be among the mostimportant disincentives to investment, and theycan discourage investors, despite other attractivefeatures that a country might have to offer. Takinginto account the findings and recommendations ofa diagnostic study and a project on administrativebarriers to investment, conducted jointly by thegovernment and the Foreign Investment AdvisoryService (FIAS, a joint facility of the InternationalFinance Corporation and the World Bank), the gov-ernment enacted a “Decree on Improving theInvestment Climate in Turkey” on December 11,2001, as part of a national strategy to increase theoverall level of income and productivity and toraise the level of competitiveness of firms operatingin Turkey (see FIAS 2001).
The challenge facing the government was how toimplement this reform vision in a manner thatwould streamline administrative procedures whileincorporating private sector feedback on the meas-ures to be taken. Within this framework, a three-phase strategy was designed and then launched tofacilitate the reform process. In the first phase, aclear vision and a consistent direction for thereform were embodied in the December 2001 min-isterial decree in order to demonstrate politicalcommitment and consensus behind the reformscheme. The decree established the CoordinationCouncil for the Improvement of the InvestmentClimate (YOIKK), a coordinating body composedof senior public and private sector decision makerswith the mandate to identify and remove regulatoryand administrative barriers to private investment.The second phase entailed formulating a clear andprecise action plan defining priorities, timing, andresponsibilities for attracting more FDI flows. Inthe third phase, YOIKK was scheduled to holdregular monthly meetings in order to monitorprogress made, with quarterly reports submitted tothe Council of Ministers.
As shown in figure 10.5, key areas of reform havebeen identified and grouped under nine technicalcommittees to deal with the following constraints:
• Company registration. The goal is to eliminatetime-consuming, unnecessary, and duplicativetransactions.
• Employment. Problems are related to short-termwork visas, employment of special groups, andhigh social contributions by employers.
284 Turkey: Economic Reform and Accession to the European Union

Turkey’s Foreign Direct Investment Challenges: Competition, the Rule of Law, and EU Accession 285
Councilof Ministers
Coordination Council forthe Improvement of the
Investment Climate (YOIKK)
MonthlyProgressReports
CompanyRegistration
Land AccessCustoms and
Technical Standards
Sectoral Licensing
EmploymentIntellectual
Property Rights
Taxation andIncentives
FDI Law
InvestmentPromotion
Small and Medium-Size Enterprises
QuarterlyProgressReports
FIGURE 10.5 Areas for Investment Climate Reform
Source: Undersecretariat of the Treasury.
• Sectoral licenses. Licensing procedures areunnecessarily complicated in various industries,primarily because of overlapping authorities,highly centralized approval procedures, andlittle involvement by the private sector.
• Location. Access to public lands and site devel-opment by the private sector are very time-consuming and subject to some restrictions.
• Taxes and incentives. The corporate income taxrate is comparatively high, and the system iscomplex. Incentives should be aligned with theEU state aids regime, and the process should besimplified and automatic where possible.
• Customs and standards. Despite major reforminitiatives, customs procedures still cause somedelays because of the significant documentationrequirements, lengthy testing procedures,delayed valued added tax (VAT) reimbursement,and discretionary decision making with inci-dences of corruption.
• Intellectual property rights. Protection of patents,trademarks, and copyrights is insufficient,mainly because of remaining gaps in the existinglegislation, weak implementation and enforce-ment of laws, and cumbersome procedures.
• Investment promotion. No one single entityeffectively conducts targeted investment promo-tion and policy advocacy.
• FDI legislation. Legislation on FDI at the timeof the formation of YOIKK was based on the1954 law.
The first YOIKK meeting, held in March 2002,set targets and timelines for these technical com-mittees. One core dimension of the reform processhas been private sector involvement in all effortsthrough disseminating the information and shar-ing the results obtained over time. This emphasis isin line with the government’s conviction that jointevaluation of the needs and identification of appro-priate solutions are of utmost importance for thesuccess of the reform initiative.
The reports of the technical committees havebeen quite positive. The government already hastaken several steps in compliance with the recom-mendations of the committees. Even though therewere elections and change in government, thereform program has proved to be effective, and var-ious legislative changes have been made and draftlaws prepared. After the November 2002 elections,the new government amended the Council of Min-ister’s decree to include another technical commit-tee on small and medium-size enterprises. Toincrease the influence of YOIKK, the governmentdecided to head it with a minister. Laws enacted as adirect result of the YOIKK process to date include

(1) a new, up-to-date FDI law that serves as adeclaration to foreign investors of their rights andthat will enable a shift from an ex ante, control-based “investment permission system” to a “promo-tion and facilitation approach” with minimal expost monitoring to continuously improve theinvestor climate in conformity with internationalbest practices; (2) a law that redesigns the companyregistration process by diminishing the prior 19required steps to three and by reducing turnaroundfrom two and a half months to one day; (3) a law onemployment of foreign personnel; and (4) a lawon the investment allowance system, which enablesa shift to an automatic state aids system in linewith EU requirements. Among the drafted laws thathave been sent either to the Prime Ministry or toParliament are a law on the duties and responsibitiesof the Patent Institute, which will enable the insti-tute to deal with intelllectual property rights issuesin a more professional way, and a law on the estab-lishment of an investment promotion agency.
Although some investment promotion initia-tives are being undertaken by several public andprivate institutions, Turkey at present does not havean agency that has a strong and clear mandate, setup,and budget to carry out effective investment pro-motion, including functions such as investor serv-icing, investment generation, and policy advocacy,and that is governed jointly by the public and pri-vate sectors. Work is still under way on establishingan appropriate institution to carry out these tasks.
YOIKK’s efforts also have borne fruit in severalother areas, such as recruitment of expatriates, sec-toral licensing, customs, and intellectual and indus-trial property rights. As for customs reform, theUndersecretariat of Customs has been implement-ing an ambitious reform program to improve itsadministrative efficiency and effectiveness. Thecustoms automated system has been rolled out to99 percent of all customs offices and has been fur-ther enhanced to assist customs in controlling move-ment of goods. Important steps taken include mod-ernizing customs laws, regulations, and proceduresin line with those of EU legislation and simplifyingand harmonizing forms, procedures, and controltechniques in line with those internationally rec-ommended by the World Customs Organization.The legislation necessary to strengthen the capacityand infrastructure of the Turkish Patent Institutehas been submitted to Parliament. The intent is to
ensure effective implementation of the regulationson the protection of intellectual and industrialproperty rights.
Finally, land acquisition and site developmentfor investment are critical issues for both local andforeign investors. A very useful discussion foruminvolving public and private sector representativeshas led to the creation of a priority list of problemsand measures to be taken in this field. The technicalcommittee working on this issue will begin by for-mulating solutions to the most urgent problems.
Outstanding Priorities
Although current efforts have focused largely onintroducing new laws in pre-identified areas to spuradministrative reforms, predictable implementa-tion of existing and new legislation is far moreimportant. As for competition-related reforms, it isvital that all investors—existing producers and newentrants, whether local, joint venture, or whollyforeign-owned—face a level playing field in the waythat laws, regulations, and administrative proce-dures are implemented. Certain critical problemsstill exist for investors in these areas, as highlightedby the case studies.
Legal and Judicial Reforms Improvements on thelegislative front, many of which were achieved in thelast few years, were necessary but not sufficient tocreate an attractive legal framework for foreigninvestors. Improvements in FDI legislation in thenarrow sense fall into this category of the necessarybut not sufficient changes required to generate sus-tainable increases in FDI inflows. One of the criticaloutstanding impediments to investment is thatimplementation of the laws in both the executiveand judicial branches of government is fraught withproblems for investors. The most important, butalso probably the most difficult, reforms needed inthis area are basic changes in the legal and judicialsystems and in the way that administrative proce-dures more generally are implemented.
The way in which the legal and judicial systemswork is a critical determinant of FDI—especiallyhigh-value FDI destined for export markets thatcan go anywhere and that need a reliable, hassle-free environment. Lengthy, nontransparent proce-dures, combined with unpredictable outcomes, inboth the executive branch of government and the
286 Turkey: Economic Reform and Accession to the European Union

Turkey’s Foreign Direct Investment Challenges: Competition, the Rule of Law, and EU Accession 287
courts, are among the main problems in this area.Incomplete reforms and poor implementation oflaws and regulations are the overarching issues.Adopted laws are often not implemented on time.All this contributes to the general perception of anunpredictable legal framework. Not only are theadministrative procedures time-consuming, butalso enforcement procedures for commercial casesin the courts take much longer than in many othercountries. The heavy workload of judges is themajor reason for these delays. Often, court cases inTurkey consume more than a year. In the surveycarried out by FIAS, another point frequentlyraised by investors was their lack of confidence inthe impartiality and quality of the commercialcourts (FIAS 2001). Even if the legal issue appearsclear, foreign investors routinely state that the judg-ments are still much more unpredictable than theywould be in their home country. Foreign compa-nies and larger companies are very visible, and lawsmay be applied more strictly to them than todomestic and smaller companies. Although thelaws themselves respect the principle of equal treat-ment stipulated in the 1954 law on foreign capitaland the new foreign direct investment law, imple-mentation often has been different.
The government is taking steps to reform thejudicial system and enhance its predictability as acomponent of Turkey’s EU accession program. Thecommitments made in this area, as well as theshort- to medium-term plans, are reflected in thenational program. These targets will require someyears to achieve; however, these reforms shouldhelp to improve the perception of Turkey in foreigninvestors’ eyes. One desirable step would be forTurkey to institute a comprehensive legal and judi-cial review to identify and address important itemsin existing private sector–related laws that are incontradiction or that are not clearly defined. Fur-thermore, a specific institution should be entrustedwith improved oversight responsibilities to reducethe likelihood of such recurrences in the future.Such a review should also include in its terms ofreference the removal of detailed sectoral issues—such as those related to the allocation of land, first-priority agricultural land, privatization, andarbitration—from the constitution and their intro-duction instead into the appropriate laws. Tworelated recommendations that could be acted onimmediately are to refrain from allowing so much
time to pass between the adoption of laws and theirimplementing legislation and to seek maximuminput from private sector participants, both localand foreign, at the legal preparation phase. Bestpractice would be to draft implementing regula-tions in parallel with the law, or at least to have adetailed draft ready at the time the law is adoptedon what the implementation will look like. Seekingsignificant input from business associations beforelaws and regulations are adopted will result inadequate legislation that reflects the concerns of theprivate sector. This procedure, common practice inmost OECD countries, increases the knowledgebase on which legislation is drafted.
Competition-Related Reforms The general goalof creating a more competitive environment inTurkey has been dealt with as part of the process ofmeeting basic EU accession requirements. Turkeydeveloped its competition law while negotiating itscustoms union with the EU. The law was adopted in1994, taking the EU treaty as its substantive basis.The Competition Board has been actively applyingTurkey’s competition law since the end of 1997.However, industrial policy, company law, free move-ment of goods, capital and service provision, taxa-tion, sectoral policies, regional policies, and policyon small and medium-size enterprises (SMEs) arealso all related to competition. Progress in all ofthese areas to comply with the EU acquis will helpTurkey to achieve a better competitive environment.
As for enforcing the competition law, a fewoutstanding issues are crucial to effective privatesector development. In particular, the current legis-lation does not allow the Competition Board toapply competition rules to all public undertakings,including those with special or exclusive rights, andto other entities of public administration. It is inTurkey’s interest to change this situation and toinclude the equivalent of Article 86 of the Treaty ofRome (1957), which established the EuropeanCommunity. As privatization progresses and publicparticipation withdraws, care should be given tobetter aligning the specific sectoral laws with the1997 Competition Act in order to ensure the effi-cient enforcement of competition rules. Therefore,it is essential that the government grant the Compe-tition Board enhanced powers to act during the pri-vatization process and in the regulated infrastruc-ture sectors. In this respect, closer coordination

should be secured between the Competition Boardand special sectoral regulatory authorities. The sec-toral regulatory authorities should focus more onex ante regulation, and the Competition Boardshould concentrate on ex post regulation. Aftersuch “specialization,” the current state of competi-tion between these two types of institutions willdiminish, laying a stable foundation for coopera-tion and coordination. This need for improvedcoordination is evident in the Cargill case, wherequotas imposed by the Sugar Board have adverselyaffected private sector parties by inhibiting compe-tition, and also in the I
.s-TIM case, where earlier
coordination would have helped to address thesituation sooner.
A recent study carried out by experts from theCompetition Board on legislation not compatiblewith competition supports the view that the gov-ernment is not consistent in its application of com-petition policy principles (Ekdi and others 2002).The study lists various laws and regulations fromdifferent sectors that contradict the enacted com-petition law, and almost all of these sectors aredominated by public enterprises. Although suchinconsistencies might be understandable for legis-lation that dates back to when the governmentapplied an import-substitution strategy and thepublic sector was the driving force of the economy,there is no economic rationale for such contradic-tions in legislation adopted after approval of theCompetition Act. Such contradictions are mostglaring for regulatory bodies. As discussed in theCargill case, the Sugar Board should not have uni-lateral authority to impose anticompetitive quotas.More generally, there should be enhanced oversightof competition policy to ensure that the decisionsof regulatory boards do not contradict competitionprinciples. A strong case can be made for the desir-ability of strengthening the traditional competitionadvocacy responsibilities of the CompetitionBoard, including granting the board the power tointroduce or amend new laws to promote competi-tion, the power to modify existing laws that areanticompetitive in their impact, the oversightresponsibility to ensure that relevant institutionsdo not perform an anticompetitive role, and thepower to review whether decisions of all regulatoryinstitutions are in the public interest, with the man-date to submit their reports to Parliament andother appropriate public oversight entities.
Another key area of competition policy with anunfinished agenda is state aids. Turkey has beencriticized by the EU for not aligning its state aidssystem with that of the EU, even though such a stephas been a commitment of Turkey under the cus-toms union. Progress has been made in this area,but legislative changes and an independent moni-toring authority have not yet been established.Moreover, the current attempts to align the stateaids rules cover only the aids given to the privatesector, whereas public sector incentives also shouldbe covered to ensure a competitive environment.
The broader EU requirements shed light onother issues on which Turkey should focus in seek-ing a more competitive environment. These includealignment with the acquis on intellectual andindustrial property rights (company law) and theremoval of limitations for foreign ownership incertain sectors (free movement of capital).
The Benefits of Full EU Accession Turkey’s even-tual EU membership is very crucial for FDI inflows.Regardless of the many characteristics that render itan attractive place for foreign investment, Turkeycannot attract as much FDI as its competitors inCentral and Eastern Europe unless the governmenttakes further steps toward full EU membership.Actually, Turkey would not have to wait very longto start reaping the benefits of an eventual EUaccession. With the opening of EU accession nego-tiations, Turkey is already likely to attract largersums of FDI, and there are many reasons to expectsuch a development to take place.
The opening of EU negotiations in October2005 is expected to act as a strong signal thatTurkey will eventually become a full member of theEU, assuming that the government continues onthe current path of structural reforms with a clearfocus on the sustainability of public debt. Such adecision would assure foreign investors that theTurkish economy will follow a stable growth pathfor the foreseeable future. Equally important, theopening of EU accession negotiations would pro-vide all investors with enhanced confidence that thelegal and judicial environment will improve acrossall relevant areas of the common acquis and thatimplementation of all required secondary legisla-tion also will improve, because the accessionprocess in Turkey’s case requires not only progressin enacting laws but also progress in implementing
288 Turkey: Economic Reform and Accession to the European Union

Turkey’s Foreign Direct Investment Challenges: Competition, the Rule of Law, and EU Accession 289
them. For Turkey, stability, together with institu-tional reforms that will improve application of therule of law and enhance competition, would havethe benefit of convincing foreign investors to chan-nel more funds to Turkey for domestic as well asexport market–oriented projects. Especially with itsdomestic market potential, Turkey would be veryattractive for FDI in nontraded sectors. Because theaverage size of investments in these sectors is ingeneral larger, it is likely that they would attractsignificant FDI inflows immediately after the open-ing of negotiations.
The attractiveness of Turkey for foreign investorswill continue to increase as the accession negotia-tions proceed, allowing it to close the gap with theCEE countries in attracting FDI. Meanwhile, Turkeywill continue to take steps toward harmonizationwith the EU framework. At one step, even beforebecoming a full member, Turkey will be in a posi-tion to accept the authority of EU agencies in theresolution of any problems that may arise betweenforeign investors and the Turkish government. Thisstep will further ease some of the reservations thatforeign investors may still have in relation to Turkey.After all, EU rules and regulations and the ways theyare implemented are well known and predictable toforeign investors. It is at this stage that one of themost important benefits from EU accession will berealized by Turkey: the rule of law and competition-related constraints will be eased even further, withconcomitant increases in private investment flows.
The Role of Proactive Investment PromotionPolicies In each of the anticipated stages in theaccession process, a critical question is what shapeshould the most appropriate set of investmentpromotion policies, best adapted to the evolvingTurkish reality, take? Another question is, inaddition to focusing on those elements of theinvestment climate most critical to moving fromone stage to the next in the accession process, whatelse should Turkey be doing on the policy side?
From these questions emerges one about thedesirability of more targeted FDI policies. Theexperiences of both developed and developingcountries demonstrate the potential benefits ofspecific policies to stimulate investment and of aninvestment promotion agency (IPA) that willengage in activities such as investment generation,policy advocacy, investor servicing, and image
building (see chapter annex, which describes thefunctions of an IPA). According to UNCTAD(2000), more than 160 national and over 250 sub-national IPAs are in place worldwide. A recentempirical study on the effectiveness of IPAs in58 countries revealed that FDI inflows arepositively correlated with investment promotionactivities, and that the quality of the investmentclimate and the level of development have a signif-icant effect on IPA performance (see Morisset2003). This finding suggests that countries are welladvised to focus on basic improvements in theinvestment climate first, and then consider intro-ducing an IPA, at a minimum, concurrently withserious efforts to improve the investment climate.Political visibility and participation of the privatesector appear to be two elements critical to the suc-cess of an IPA. Worldwide experience shows thatIPAs are more effective when they are autonomousfrom the government (though subject to policyoversight by the public sector) and when they are aproduct of a genuine joint effort by the private andpublic sectors.12
Turkey does not presently have an IPA. Thegovernment has been carrying out promotionactivities on a negligible budget. Those activitiesconsist mainly of publications, limited advertising,and participation in seminars and trade investmentfairs. It is difficult to claim that Turkey has a coher-ent promotion policy when it is compared withthose of many other countries. Nor is it possible toclaim that the budget allocated to promotion issufficient. Under the YOIKK reform program, theTechnical Promotion Committee is still working toset up an appropriate institution that couldperform the key IPA functions. In addition to thepublic sector’s oversight role in establishing anappropriate institutional framework, a governmentalso has a key role to play in articulating an overallinvestment policy and specific FDI policy actions.Ideally, a government should first decide on anoverall investment and FDI policy and then useincentives where appropriate as tools to achieve thestated objectives. The use of incentives will differ bycountry, but the World Trade Organization (WTO)has specified some general rules that each countryshould obey. For Turkey, additional rules stem fromthe customs union agreement with the EU. As partof cross-national efforts to abolish barriers toinvestment, bilateral or international agreements

are signed between countries to protect mutualinvestments, with clauses ranging from admissionand establishment to standards of treatment anddispute settlement mechanisms.
Attracting more FDI per se should not necessar-ily be the main target of a country’s FDI policy. Justas important are questions of how the country canbenefit more from any specific level of FDI and howto prevent any negative effects of FDI. Ideally, FDIpolicies should provide incentives for investors toact in ways that will contribute most to thecountry’s development process. In order to getthe most from FDI, countries can try to build localcapabilities, using local suppliers and upgradinglocal skills, technological capabilities, and infra-structure (UNCTAD 2003). Typically, policymakersattempt to understand the potential and attractive-ness of their country before designing a policyaccordingly. The sectoral and regional capabilities ofthe country, the needs of specific investors—be theymarket seeking or resource seeking—and the devel-opment level of specific sectors relative to globaltrends should all be taken into consideration. Evendeveloped countries apply specific policies to attractFDI, and Germany’s use of special incentives toattract investment in information-communicationtechnologies is an example of this practice.
Despite the general shift in attitudes in favor ofFDI, significant concerns remain about its possiblenegative effects. Crowding out of local firms andproducts, transfers of polluting activities or tech-nologies, and concessions made to investors inspecial zones that allow them to skirt labor andenvironmental regulations are examples of thesenegative effects (UNCTAD 2003: 88).
Given the benefits that could accrue to Turkeyfrom significantly higher levels of FDI, there isindeed more that Turkey could and should do onthe policy side—subject to WTO and EU customsunion constraints. Indeed, Turkey has negotiatedinvestment agreements with 79 countries andsigned 66 of these agreements, and it has signed“double taxation agreements” with 49 countries. Italso has taken part in the WTO negotiations for aninternational investment agreement, and it hasparticipated in FDI-related issues in platforms suchas UNCTAD, OECD, WTO, and the EuropeanCommission. However, a comparison of Turkey’spotential with its actual levels of FDI inflowssuggests that the policies implemented to date need
further strengthening. In addition to enhancedlegal/judicial implementation and more effectivecompetition across markets, Turkey would benefitfrom a coherent overall investment and FDI policythat clearly articulates how specific policies andmore activist promotion are intended to achievestated objectives.
Conclusion
This chapter has examined the main challengescurrently facing Turkey in attracting foreign directinvestment. The setting of the analysis is that FDIcan in principle be highly beneficial for a country’sgrowth and development prospects. The availableevidence suggests that FDI would indeed highlybenefit the Turkish economy as a whole, based onits significant direct and indirect benefits for pro-ductivity in the manufacturing sector.
Despite its beneficial effects, however, recordedFDI inflows to Turkey have been extremely lowcompared with those of the CEE countries. Themain FDI challenges facing Turkey, therefore, aredetermining why FDI inflows have remained so lowand how Turkey can increase the inflows to desir-able levels. But to what extent do recorded inflowsfully reflect actual inflows? This chapter providespreliminary evidence that understatements may besignificant in some years, though changes in thenew 2003 FDI law, coupled with improved statisti-cal recording, should help to alleviate discrepanciesfrom international common practice.
One of the major culprits behind Turkey’s laggardperformance in FDI inflows is the country’s long-running fiscal problems and the ensuing macroeco-nomic uncertainty. Turkey’s current efforts to imple-ment a major fiscal adjustment, if sustained, shouldhelp to achieve lower inflation and macroeconomicstability. The introduction of inflation accountingwill no doubt be a welcome interim measure for localand foreign investors alike. Besides macroeconomicuncertainty, specific infrastructure-related weak-nesses also continue to diminish Turkey’s attractive-ness to investors. Although Turkey benefits from itsskilled, adaptable, and entrepreneurial work force,and communications and transport do not appear tobe major problem areas, it lags behind in its energyinfrastructure, its level of computerization, andthe availability of credit for the private sector.Turkey’s recently passed electricity and natural gas
290 Turkey: Economic Reform and Accession to the European Union

Turkey’s Foreign Direct Investment Challenges: Competition, the Rule of Law, and EU Accession 291
framework laws, to the extent that they are effectivelyimplemented, should spur significant improvementsin line with Turkey’s underlying endowments in theenergy area. Successful implementation of theadjustment program will ensure that more fundswill be channeled to the private sector, rather than beused to fund the huge public sector deficit, at lowreal interest rates.
Perhaps the most important contribution of thischapter is its examination of the standing rule oflaw and competition-related impediments toinvestment through three detailed case studiesfrom the primary, secondary (manufacturing), andtertiary (services) sectors. Based on these studies,we argue that the main unaddressed obstacles toincreased FDI in Turkey are governance andinstitutions-related problems related to the rule oflaw and competition. The most important legal andjudicial constraints are the insufficient clarity ofand lack of respect for the rule of law. In each of theanalyzed cases, the government as rulemaker hasfailed to address the underlying legal ambiguities ina timely fashion, raising the question of whetherlack of clarity in the underlying rule of law is inten-tional in order to give public decisionmakers thedegrees of freedom needed to grant special treat-ment and exemptions whenever politically conven-ient. Unfortunately for the country as a whole, theresulting unpredictability has resulted in substantialforgone current and future investments. Competi-tion constraints, in turn, are related to the absenceof a level playing field for all companies. In two ofthe cases examined, the failure of the relevant regu-latory body to rapidly enforce a pro-competitiveruling also has sent negative signals for futureinvestments.
As for future policy priorities, we argue that pre-dictable and uniform implementation of existingand new legislation is of utmost importance. In thelegal and judicial area, reforms should focus onremoving legal ambiguities by addressing all pri-vate sector laws and their implementing regulationsthat are in contradiction or are not sufficientlyclearly defined. In the competition area, it is inTurkey’s interest to empower the Competition Boardto apply competition rules to all public undertak-ings, aligning its competition law to Article 86 of theTreaty of Rome and its state aids system to that ofthe EU. Improved coordination between the Com-petition Board and other independent regulatory
boards should yield more rapid pro-competitiveoutcomes.
The EU accession process itself should provideTurkey with significant benefits in the way of FDIinflows by helping to ease further the rule of lawand competition constraints. The expected EUdecision to begin negotiations on full membershipfor Turkey will be crucial to finally convincinglarger numbers of foreign investors to invest inTurkey. Finally, in addition to aligning Turkey’sinvestment climate more closely with that of theEU, Turkey also should follow a more proactiveapproach by implementing more specific FDI poli-cies and by undertaking active promotion.
Annex: Functions of an InvestmentPromotion Agency
The groupings of the different functions of an IPAcan differ for developed and developing countriesor from one country to another. The four-partgrouping proposed by Wells and Wint (2001) andused for the studies carried out for the Turkish IPAis described in this annex.
Image building is the function of creating the per-ception of a country that is an attractive site forinternational investment. Activities commonly asso-ciated with image building include focused advertis-ing, public relations events, and the generation offavorable news stories by cultivating journalists.
Investor servicing and facilitation refer to therange of services provided in a host country thatcan help an investor to analyze investment deci-sions, establish a business, and maintain it in goodstanding. Activities in this area include the provi-sion of information, one-stop shopping servicesaimed at expediting approval processes, andvarious forms of assistance in obtaining access tosites and utilities.
Generating investment entails targeting specificsectors and companies with a view toward creat-ing investment leads. Activities include identifyingpotential sectors and investors and undertakingdirect mailings, telephone campaigns, investorforums and seminars, and individual presentationsto targeted investors. These activities can be carriedout both at home and overseas.
Policy advocacy consists of the activities throughwhich the agency supports initiatives to improvethe quality of the investment climate and identifies

the views of the private sector on each relevanttopic. Activities include surveys of the privatesector, participation in task forces, policy and legalproposals, and lobbying.
The emphasis of the IPA facility depends on thepurpose of the FDI policy; how much promotion isneeded depends on the kind of FDI to be attractedand the basic attractions of the host country. Alarge and dynamic economy promotes itself lessthan a small one. The bulk of the massive inflows ofFDI to China were not the result of active FDI pro-motion. And promotion can only go so far. If theeconomic base is weak and unstable, no amount ofpersuasion can attract large and sustained FDIflows (UNCTAD 2003).
Of the main investment promotion functionsthat all countries consider, image building andinvestor servicing and facilitation are typically theones best left entirely to the separate public-privateIPA.
Notes
1. All dollar amounts are U.S. dollars unless otherwiseindicated.
2. This analysis is based on plant-level data collected by theTurkish State Institute of Statistics (SIS) through annual manu-facturing surveys. However, the data have limitations. They coveronly a small portion of the FDI companies active in the Turkisheconomy, and so reflect only a subset of manufacturing-relatedFDI. Although the records of the Undersecretariat of the Treasuryindicate that 581 FDI companies were active in the Turkishmanufacturing sector in 1991, increasing to 922 by 1996, the SISmanufacturing survey includes only 210 plants, increasing to 273plants by 1996, as partially or fully owned by foreigners.
3. Variables used to control for other characteristics thatcould affect productivity include firm size as measured byemployment, imported license use, percent share of outputexported, imported machinery and equipment use, whether thefirm is incorporated, subcontracted input use and subcon-tracted output sale, measures of agglomeration at the provinciallevel, and share of skilled production workers.
4. For a detailed description of this trend worldwide, seeUNCTAD (2000).
5. For this definition, see Stern (2002).6. Many of these measures are based on surveys, which in
this context are arguably the most appropriate measures,because they reflect the perceptions of actual investors. In 2002,3,532 executives responded to the World Competitiveness sur-vey, which gauges widespread business knowledge about eachcountry and cross-country international experience.
7. Other producers were, however, active in the domesticmarket. The four listed had the largest market presence in theautomotive industry at the time.
8. Of these four, Honda and Toyota became the sole ownersof their production units once they decided to direct their pro-duction toward the European rather than the domestic market.This situation is an example of the difficulty that foreign
investors face in entering the domestic market without aninsider on board. This argument is strengthened by the fact thatthe other two multinational corporations (MNCs) retained theirlocal partners, because they continued to target the local market.Anadolu Isuzu focuses on light trucks and midibuses and mainlytargets the local market. Hyundai Assan also sells half of its pro-duction to the local market.
9. It is known that as part of the final communications priorto the bid, I
.s-TIM received a verbal promise from the Ministry of
Tranport about roaming privileges.10. Among the 44 countries included in the World Values
Survey of 1989–90, Turkey ranks the lowest, with less than10 percent of its population believing that most fellow humanbeings are trustworthy. See Kalaycıoglu (2001).
11. The customs union agreement does not send as strong asignal to investors as the prospects of full EU membership,because it entails only market integration, without ensuring thedeeper political, social, and legal transformations that wouldbring greater comfort to investors.
12. The key functions of a well-designed IPA are summa-rized in the annex to this chapter.
References
Arol, Ali Ihsan. 2002. “Current Status of FDI and EnvironmentalIssues in Mining in Turkey.” Paper presented at the OECDGlobal Forum on FDI and the Environment, February.
Blomström, Magnus, and Ari Kokko. 1998. “Multinational Cor-porations and Spillovers.” Journal of Economic Surveys 12(2): 1–31.
Borensztein, Eduardo, Jose De Gregorio, and Jong-Wha Lee.1998.“How Does Foreign Direct Investment Affect EconomicGrowth?” Journal of International Economics 45:115–35.
Ekdi, Barıs, Ebru Öztürk, H. Hüseyin Ünlü, Kürsat Ünlüsoy, andSerpil Çınaroglu. 2002. “Rekabet Kuralları I
.le Uyumlu
Olmayan Mevzuat Listesi” [A List of Regulations Contra-dicting the Rules of Competition]. Rekabet Dergisi [TheCompetition Journal] 9 (March).
European Commission. 2002. “Regular Report on Turkey’sAccession.” COM 2002, 700 final, Brussels.
————. 2003. “Council Decision on Accession Partnershipwith Turkey.” COM 2003, Brussels.
FIAS (Foreign Investment Advisory Service). 2001. Turkey: ADiagnostic Study of the FDI Environment. Washington, DC:FIAS, February.
Gruben, William C., and Darryl McLeod. 1998. “Capital Flows,Savings, and Growth in the 1990s.” Quarterly Review of Eco-nomics and Finance 38 (fall).
IMD (Institute of Management Development). 2002. WorldCompetitiveness Yearbook 2002. Geneva: IMD.
Kalaycıoglu, Ersin. 2001. “Turkish Democracy: Patronage versusGovernance.” Turkish Studies 2 (spring): 54–70.
Morisset, Jacques. 2003. “Does a Country Need a PromotionAgency to Attract Foreign Direct Investment?” PolicyResearch Working Paper 3028, World Bank, Washington,D.C., April.
OECD (Organisation for Economic Co-operation and Develop-ment). 1996. OECD Benchmark Definition of FDI, 3d ed.Paris: OECD.
————. 2003 Foreign Direct Investment Statistics: How Coun-tries Measure FDI. Paris: OECD.
Özatay, Fatih, and Guven Sak. 2002. “The 2000–2001 FinancialCrisis in Turkey.” Central Bank of the Republic of Turkeyand Ankara University.
292 Turkey: Economic Reform and Accession to the European Union

Turkey’s Foreign Direct Investment Challenges: Competition, the Rule of Law, and EU Accession 293
Stern, Nicholas. 2002. “Dynamic Development: Innovation andInclusion.” Munich Lectures in Economics, Ludwig Maxim-ilian University, Munich, November 19.
UNCTAD (United Nations Conference on Trade and Develop-ment). 2000. World Investment Report: Cross-Border Mergersand Acquisitions and Development. New York: United Nations.
————. 2003. World Investment Report: FDI Policies for Devel-opment: National and International Perspectives. New York:United Nations.
————. World Investment Directory: Country Profiles. Accessi-ble at www.unctad.org.
Wells, Louis T., Jr., and Alvin G. Wint. 2001. “Marketing a Coun-try: Promotion as a Tool for Attracting Foreign Investment.”Occasional Paper 13, Foreign Investment Advisory Service(FIAS), Washington, D.C.
Yılmaz, Kamil, and S¸ule Özler. 2004. “Foreign Direct Invest-ment and Productivity Spillovers: Identifying Linkagesthrough Product-based Measures.” Koç University, Istanbul,Mimeograph.
Yılmaz, Kamil, Cevdet Akçay, and Emre Alper. 2002. Enflasyon veBüyüme Dinamikleri: Gelismekte Olan Ülke DeneyimleriIsıgında Türkiye Analizi [Inflation and Growth Dynamics: AnAnalysis of Turkey in the Light of Developing Country Experi-ences]. TUSIAD (Turkish Industrialists’ and Businessmen’sAssociation) Publication (December).
Zhang, Kevin H. 1999. “FDI and Economic Growth: Evidencefrom 10 East Asian Economies.” Economia Internationale(November).


15 years. Thus, the period of investment to meet therequired standards is long, and the fiscal implica-tions of accession depend significantly on the termsof derogation. The fiscal impacts are also sensitiveto which parties undertake the investments—thegreater the share that can be borne by the privatesector, the less the fiscal burden—and to how muchfunding can be obtained from EU sources.
This chapter looks at the likely costs to Turkey ofmeeting the environmental acquis, with specialfocus on the costs to the public sector. Fortunately,considerable data are available from the latestgroup of accession countries, and particularly fromlarge ones such as Poland, which has already metpart of the EU’s environmental requirements andhas prepared detailed plans to 2017 for the rest.These countries’ experiences also are good guidesto approximating how much support can beobtained from EU funds.
The chapter is structured as follows. The firstsection reviews the estimates from previous studiesof the costs of EU membership for Turkey andother countries, and on this basis some “best guess”estimates of meeting the environmental acquis arederived for Turkey. An important factor in makingsuch estimates is that these costs depend on thepolicies pursued, and the breakdown of the costsbetween the public and private sectors depends onthe extent to which key water and energy servicesare provided by the private sector.
In December 1999, the European Council con-firmed that Turkey is a candidate state destined tojoin the European Union (EU) on the basis of thesame criteria applied to the other candidate states.1
A precondition of membership is that candidatecountries must align their national laws, rules, andprocedures, including those relevant to the envi-ronmental sector, with those of the EU in order togive effect to the entire body of law contained in theacquis communautaire. In October 2004, the Euro-pean Commission recommended opening acces-sion talks with Turkey, which gives even moreimpetus to the alignment process.
This process, also known as the approximationprocess, requires that (1) all relevant EU require-ments be transposed into legal legislation (legaltransposition), (2) the appropriate institutionalstructures with sufficient budgets be established inorder to administer the national legislation (practi-cal implementation), and (3) the necessary controlsand penalties be put in place to ensure full compli-ance with the laws (enforcement). Most of thesesteps have to be undertaken prior to membershipin the EU. At the same time, public and privatesector entities in Turkey will have to undertake asignificant investment program to meet the EUrequirements for environmental protection andprovision of environmental services. This programtypically begins in earnest about three to four yearsprior to membership, and continues for up to
295
11Turkey on the Path
to EU Accession:The Environmental
Anil Markandya
Acquis

The second and third sections discuss how thetotal costs of compliance with the environmentalacquis can be kept to a minimum and how the bur-den on the state and local budgets can be reduced.
The fourth section gives a more detailed break-down of costs based on three scenarios: (1) a basecase in which no special reforms are made and thepublic sector remains much as it is today; (2) amedium reform case in which the private sector’sshare of the costs of compliance with the acquis isincreased modestly and in which reforms in pricingreduce the demand for some of the cleanup serv-ices; and (3) a high reform, or fast reform, case inwhich the private sector’s role is somewhat greater,and in which the reforms discussed in the first sec-tion are implemented more vigorously.
The fifth section compares the cost estimateswith some benefit estimates—that is, the possiblegains from implementation of the environmentaldirectives in terms of, among other things, reducedhealth problems, increased recreational use of thenatural environment, and less damage to ecosys-tems. This comparison will reveal where the casefor spending is strongest and where a case can bemade for delaying the investments on the groundsthat the benefits are considerably less than the costs.
The sixth section presents a more detailed,short-term assessment of the three scenarios pre-sented earlier, as well as a time profile of invest-ments by sector that covers the first six years of theprogram. As noted, the first three to four years ofthe program to comply with the environmentalacquis are typically implemented prior to member-ship. These investment needs are compared withcurrent environmental spending and with the cur-rent budgetary resources available. The final sec-tion looks at what mechanisms can be developedto mobilize more public sector financing for theenvironment.
Estimated Costs of the EnvironmentalAcquis: Turkey and Other Accession Countries
Estimates of the capital costs of the environmentalacquis have been made in the following studies:
• Those undertaken as part of the first assessmentof the costs for 10 potential candidate countries2
(Ifo Institute 1994; EDC 1997).
296 Turkey: Economic Reform and Accession to the European Union
• Further detailed studies undertaken by the 10countries that joined the EU in 2004. Of these,the estimates for Poland are given in table 11.1.
• Estimates for Turkey undertaken by Carl BroInternational as part of the EU-MEDA (Euro-Mediterranean Partnership) funded initiative(Carl Bro International 2002).3
The data from these disparate sources are sum-marized in table 11.1, presented as costs per capita.The following observations are worth noting:
• The range of estimates in the earlier studies (EDC1997) was quite wide in per capita terms. Thehighest estimates were five to 10 times higherthan the lowest estimates. This situation arises inpart from the fact that national programs tocomply with the acquis have a “fixed-cost” ele-ment, so smaller countries tend to have highercosts, and in part from the fact that countrieshave different gaps to fill in meeting the direc-tives. The average per capita cost is about €1,260,but the range is from €580 to €3,600.
• The estimates from more recent studies are notnotably lower than the earlier estimates. Forexample, the estimate for Poland in the studynoted earlier was €988, while the estimate in thenational calculations of costs was about €1,170.Part of the reason for the increase is the additionof the Integrated Pollution Prevention and Con-trol (IPPC), nitrate, and other directives, whichwere not covered in the first round of studies.After these are removed, the estimate for Polandin the national study is €878 versus €988, or areduction of about 11 percent.
• For Turkey, the figures in the Carl Bro studywere considerably lower. This difference reflectsin part the different situation in Turkey withrespect to some directives. For example, thewater supply directive will cost less in Turkey,because it mandates only an increase in qualityfor those who are already connected to a pipedwater system; it does not require an increase inconnections. Because in Turkey only 35 percentof the population is connected to piped water,the per capita costs of meeting the directiveacross the whole population are lower. The CarlBro study did not cover all directives, however.The notes to table 11.1 indicate which directiveswere not covered by the Carl Bro study. In those
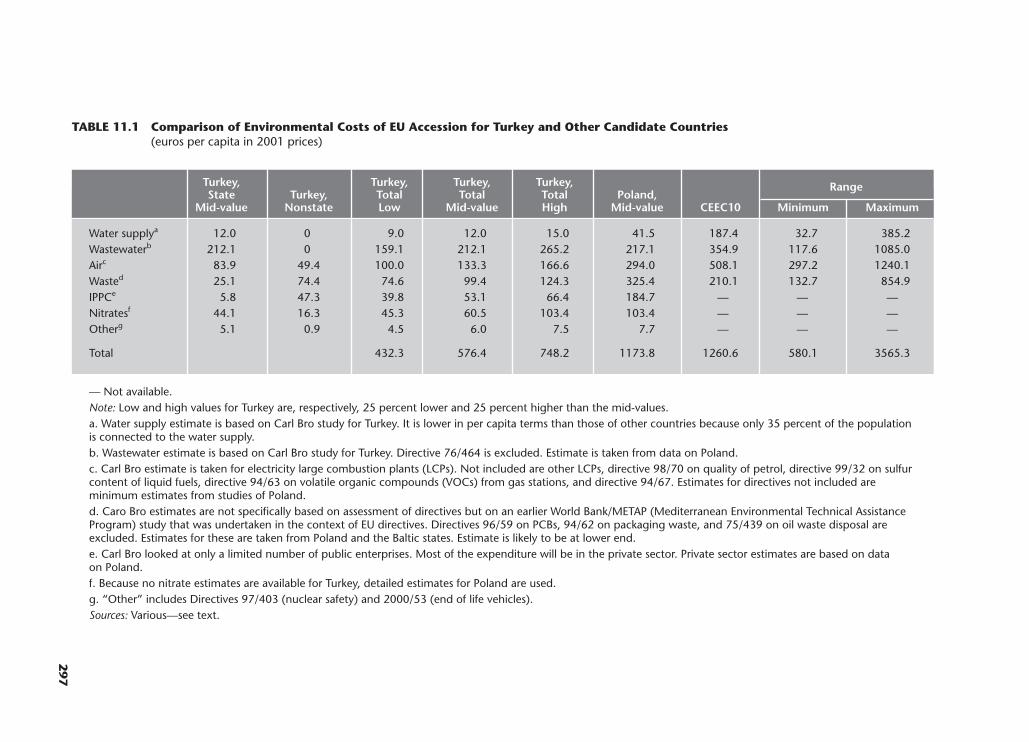
297
TABLE 11.1 Comparison of Environmental Costs of EU Accession for Turkey and Other Candidate Countries(euros per capita in 2001 prices)
Turkey,Turkey,
Turkey, Turkey, Turkey,Poland,
RangeState
NonstateTotal Total Total
Mid-value CEEC10 Minimum MaximumMid-value Low Mid-value High
Water supplya 12.0 0 9.0 12.0 15.0 41.5 187.4 32.7 385.2Wastewaterb 212.1 0 159.1 212.1 265.2 217.1 354.9 117.6 1085.0Airc 83.9 49.4 100.0 133.3 166.6 294.0 508.1 297.2 1240.1Wasted 25.1 74.4 74.6 99.4 124.3 325.4 210.1 132.7 854.9IPPCe 5.8 47.3 39.8 53.1 66.4 184.7 — — —Nitratesf 44.1 16.3 45.3 60.5 103.4 103.4 — — —Otherg 5.1 0.9 4.5 6.0 7.5 7.7 — — —
Total 432.3 576.4 748.2 1173.8 1260.6 580.1 3565.3
— Not available.Note: Low and high values for Turkey are, respectively, 25 percent lower and 25 percent higher than the mid-values.a. Water supply estimate is based on Carl Bro study for Turkey. It is lower in per capita terms than those of other countries because only 35 percent of the populationis connected to the water supply.b. Wastewater estimate is based on Carl Bro study for Turkey. Directive 76/464 is excluded. Estimate is taken from data on Poland.c. Carl Bro estimate is taken for electricity large combustion plants (LCPs). Not included are other LCPs, directive 98/70 on quality of petrol, directive 99/32 on sulfurcontent of liquid fuels, directive 94/63 on volatile organic compounds (VOCs) from gas stations, and directive 94/67. Estimates for directives not included areminimum estimates from studies of Poland.d. Caro Bro estimates are not specifically based on assessment of directives but on an earlier World Bank/METAP (Mediterranean Environmental Technical AssistanceProgram) study that was undertaken in the context of EU directives. Directives 96/59 on PCBs, 94/62 on packaging waste, and 75/439 on oil waste disposal areexcluded. Estimates for these are taken from Poland and the Baltic states. Estimate is likely to be at lower end.e. Carl Bro looked at only a limited number of public enterprises. Most of the expenditure will be in the private sector. Private sector estimates are based on data on Poland.f. Because no nitrate estimates are available for Turkey, detailed estimates for Poland are used.g. “Other” includes Directives 97/403 (nuclear safety) and 2000/53 (end of life vehicles).Sources: Various—see text.

instances, the estimates were based on previousstudies (mainly Poland, because that study hadthe best and most comprehensive data).
• Based on the data from the Carl Bro study, thecost of the environmental directives for Turkeyis between €432 and €748 per capita for the2000 population of 65.3 million. The range isbased on a middle value calculated from the esti-mates provided, a lower value that is 25 percentlower, and a higher value that is 25 percenthigher. This range represents the extent to whichcosts can be reduced, depending on adoption ofthe appropriate policies, or raised in the absenceof a shift to more efficient delivery systems forenvironmental services. It is based on previousstudies that have looked at the scope for reduc-ing costs. Note that the lower end of the costrange is from the studies for the 11 Central andEastern European (CEE) countries.
What do these per capita figures imply fortotal costs? The total amount is between €28 billionand €49 billion—an enormous sum. But the outlayis over some 17 years, so the annual amount is moremanageable. As noted later in this chapter, annualinvestments amount to about €2 billion to €3 bil-lion for the high reform, or fast reform, case (i.e.,low-cost case) and €3 billion to €5 billion for thebase case entailing slow reform (i.e., high-cost case).In the initial years, these investments would amountto 1–1.5 percent of GDP in the low-cost case and1.5–2.5 percent in the high-cost case. In addition,extra annual operating costs would be incurred,which are difficult to estimate for the early yearsbut would eventually be on the order of €80 billionto €120 billion per capita or €5 billion to €8 billion.To put these figures in perspective, the Organisationfor Economic Co-operation and Development(OECD) estimated Turkey’s capital spending on theenvironment in 1999 to be about $US1 billion, or0.5 percent of its GDP.4 At the very least, this spend-ing would have to double, or more likely increase bya factor of three or four once the EU accession pro-gram was initiated. In addition, a much higher levelof current spending would be required.
How to Reduce the TotalInvestment Costs
The total cost figure is useful only to get someidea of the overall size of the task. What is more
important for Turkey is to prepare detailed plans,covering periods of three to six years, that ensurecompliance with the agreements arrived at underthe environmental chapter and to do so in a waythat minimizes the costs and ensures that the under-lying financing arrangements are sustainable.Indeed, although the acquis communautaire is pre-scriptive on environmental standards, it leaves con-siderable latitude on how to meet them. The price ofcomplying varies accordingly.
Savings in investment costs can be achieved inseveral ways5:
• By following a least-cost investment plan, espe-cially in energy-related investments. This plancan, in turn, be promoted by the use of economicinstruments such as bubbles and permit trading.
• By increasing the efficiency with which munici-palities make investment decisions. Opening upprocurement to international tender and under-taking careful project appraisal in evaluating thedesign of schemes will reduce costs significantly.
• By designing investments to take account of thelower demand for some services when futureservice charges will have to recover capital andoperating costs. The World Bank has had starkexperience with such lower demand in thewastewater projects it has funded in the Balticstates. The level of capacity is turning out to besubstantially in excess of demand as a result ofthe large increase in volume-based charges (seebox 11.1).
• By allowing for the fact that new investments arelikely to reduce total operating costs, becausethe operation and maintenance costs of newequipment will be lower than those of theequipment it replaces. This gain has not beenfully accounted for in the current cost figurespresented earlier.
• By taking into account that the present value oftotal costs will fall if the more expensive itemsare scheduled later in time. This approach wouldbe all the more justifiable when the ensuing ben-efits are comparatively low.
• By accounting for the fact that environmentalmitigation costs may not expand at the samepace as income. With growth and convergence,countries should therefore be better able to meetthe acquis. The demand for services such asenergy and transport and the related costs arelikely to rise in tandem, but the demand for
298 Turkey: Economic Reform and Accession to the European Union

services such as water may not increase propor-tionately. The resulting increase in total costsmay therefore be substantially less than thegrowth in national income.
• By relaxing statutory standards (particularly forwater treatment), if it can be shown (1) that theinvestment is seriously uneconomical (e.g., ifthe community served will decline dramaticallyin the next few years) and (2) that the savings incosts that can be achieved by reducing theattainment level by a small percentage will allowmore plants to be built, thereby making a higheroverall contribution to meeting the ambient envi-ronmental goals.6
Reducing the Share of Costs Borneby the Public Sector
Although some CEE countries have now concludedthe environmental chapter of the negotiations, it isfair to say that they have not fully established howthese investments will be funded. Indeed, the front-line CEE countries have ongoing concerns aboutthe availability of co-financing from the national
budget to match the EU accession funds availableunder the Pre-Accession Structural Instrument(ISPA), PHARE, and the Special Accession Pro-gramme for Agriculture and Rural Development(SAPARD). Indeed, the slow rate of development ofprojects for such funding can be partly attributedto this factor (as well as to the lack of administra-tive capacity to implement the acquis).
The problem that many countries are having inmeeting the local cost share of investments isunlikely to be solved merely by increasing the allo-cation from the public budget for the environment.Other solutions also must be found.
The scope for moving some items out of thepublic budget is quite large.7 As for investment inthe manufacturing sector, the more of the sectorthat is privatized, the less will be the burden of theacquis on the public budget. Experience has shownthat successful privatization of some of the largerand more polluting industries requires a clearunderstanding of the liability for past environmen-tal damages through an internationally acceptableaudit, accompanied by a legal agreement with thegovernment on the new owner’s responsibility for
Turkey on the Path to EU Accession: The Environmental Acquis 299
BOX 11.1 The Experience of the World Bank with Water Utilities in the Baltic States
The World Bank has provided financing for fivewater and wastewater projects in the Baltics: onein Estonia, two in Latvia, and two in Lithuania, ata total cost of US$134 million. The upgradedplants are now in operation. The wastewaterplants meet Helsinki Commission standards(HELCOM protects the Baltic marine environ-ment as mandated under the Helsinki Conven-tion), and the drinking water plant also meetsthe highest standards. Although the projectshave met many criteria, one of the most seriousproblems has been the drop in demand forwater and in the generation of wastewater. Theprojects were planned under the assumptionthat demand would stabilize at a moderate levelof consumption similar to that in other compa-rable countries. Yet such consumption has notmaterialized, and the actual level has been asmuch as 50 percent lower than anticipated. Thisextreme decline in demand has led to:
• Overdimensioning of systems (i.e., makingthem larger than required)
• Overinvestment in systems• Higher than optional operations and mainte-
nance costs
• Water quality problems in potable water networks.
The central lesson learned is that, while draft-ing financial and economic forecasts, the projectteams should be conservative in their assump-tions of the critical variables that have the great-est impact on revenues and costs. These fore-casts tend to be too optimistic, and in the longrun the projects are likely to experience lowerthan anticipated economic and financial rates ofreturn. Project appraisal should ensure that theassumptions are realistic and that contingencyplans are drawn for coping with deviations fromthe most likely outcomes. The range of possibleoutcomes, with their respective probabilities,although subjective, should be listed in theappraisal document.
Price escalations also tend to be greater thanexpected (in real terms) because of the elimina-tion of existing market distortions and price dis-equilibria that were present in the economiesduring the early transition process. This situationis another important reason for the dramaticreduction in water sales. Tariffs have had toincrease more than anticipated.

cleanup. If internationally credible investors are tobe attracted to bidding for such enterprises, theseissues have to be addressed. Furthermore, the state’sresponsibilities have to be backed by a credible pro-gram of investment in remediation. Otherwise, theuncertainty of the private party will result in a fail-ure to bid, or in an offer that reflects the increasedrisk. This situation illustrates one in which it maypay for the state to undertake investment in reme-diation with a view toward making the privatiza-tion effort more successful and generating higherrevenues from the sale of state assets.
The same is true to a large extent of public utili-ties and infrastructure. A Czech study has shownthat as much as half of the big-ticket items could beshifted out of the public budget under certainassumptions (World Bank 1999). To date, however,the detailed national plans for adoption of theacquis have paid limited attention to the role of theprivate sector, and there has been mixed progresson the ground. Hungary has transferred all powergeneration to the private sector, Poland has moved9 of its 27 generation stations into private hands,and other countries have moved none.8
Privatization is not, however, the only way ofsharing the burden of upgrading environmentalstandards. Another is to commercialize the enter-prises even when they are nominally state-ownedand to raise the financing for the investmentthrough commercial loans. This strategy is beingfollowed widely in many of the candidate coun-tries. It was successfully adopted, for example, byPoland in the power generation sector. WhenPoland privatized nine generation stations, thefinancing for investing in pollution control equip-ment came from commercial loans, backed bypower purchasing agreements between the com-mercialized generating units and the state electric-ity authority. The same strategy has been adoptedin municipalities dealing with water supply andwastewater in various countries, including theBaltic states. Although it is successful in taking thedirect investment cost off the budget, this approachsuffers from the problem that the borrowing isinvariably guaranteed by the government andtherefore forms part of the consolidated nationaldebt. There is also the issue in such cases of subsi-dies to these enterprises, through working capitaland loans from state-owned banks, being given atbelow commercial rates. To the extent that these
practices prevail (and they are still quite common),the institutional mechanism of commercializationfor taking environmental costs off budget will stillleave some budgetary burden.
The commercialization of utilities has, however,opened the door to their raising charges for theirservices to a level that at least recovers the costs ofthe new investments. The higher charges will resultin reduced levels of demand, thus saving the budgetthe cost of the subsidies the utilities receive forongoing operations. The same increase in chargeswill also reduce the size of the investment needed(box 11.1).9 Another way in which commercializa-tion can save costs is through a rationalization ofprovision, because many utilities are currently toosmall to make cost-effective investments or manageoperations in an efficient manner.
Breakdown of the Share of Investmentsby Sector in Turkey
Based on the discussion in the two previous sec-tions, table 11.2 offers a more detailed descriptionof the three scenarios—base case, medium reform,and high reform. The changes in parameter valuesin the table are only rough estimates, based onjudgments about the scope for reform and thepotential impacts it would have. Nevertheless, theyoffer a useful guide to what can be expected if thereforms are made as indicated. The resulting costsfor the state and nonstate sectors are shown intable 11.3, which shows state expenditures rangingfrom €32 billion in the base case to €15 billion inthe high reform case, a fall of 52 percent. Of thisfall, 42 percent can be attributed to cost savings ingeneral from the reforms and 10 percent to theincreased share of the private sector in providingthe environmental services. The biggest shift arisesfor the water supply and wastewater sector, fol-lowed by the waste sector. In the base case, the shareof state expenditures is 65 percent, and in the highreform case it is 54 percent. In the medium reformcase, it is 59 percent.
Comparing the Costs and Benefitsof the Environmental Directives
In comparing the costs and benefits of the environ-mental directives,one can,fortunately,rely on a studyundertaken by the European Commission, whichmade initial estimates of these benefits (ECD 1997).
300 Turkey: Economic Reform and Accession to the European Union
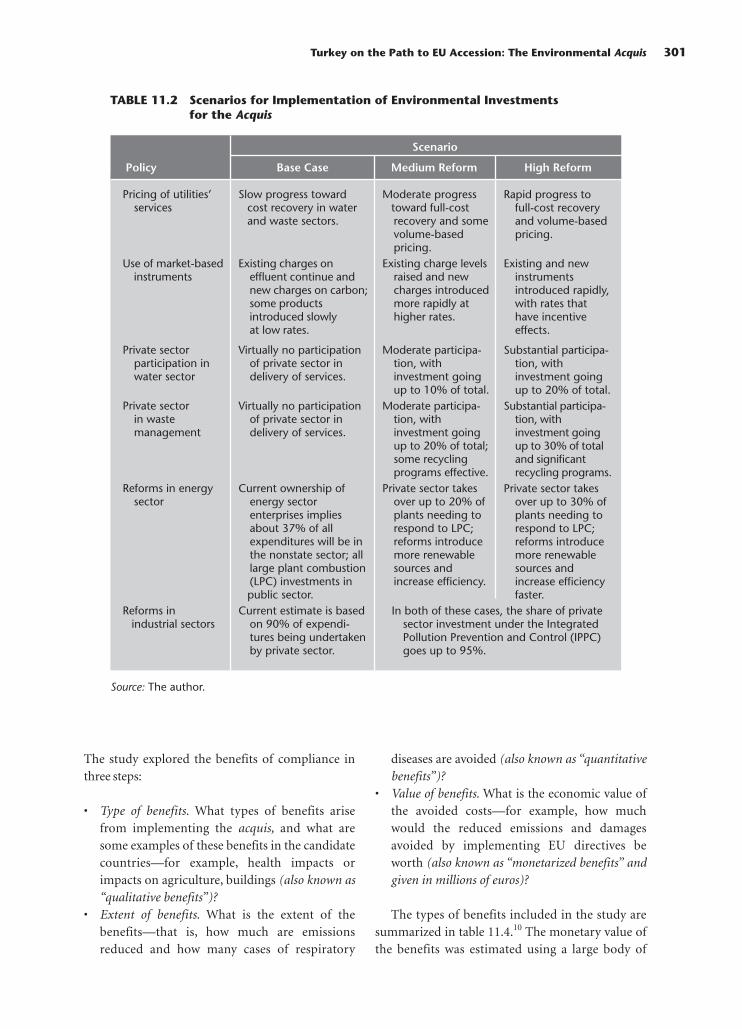
The study explored the benefits of compliance inthree steps:
• Type of benefits. What types of benefits arisefrom implementing the acquis, and what aresome examples of these benefits in the candidatecountries—for example, health impacts orimpacts on agriculture, buildings (also known as“qualitative benefits”)?
• Extent of benefits. What is the extent of thebenefits—that is, how much are emissionsreduced and how many cases of respiratory
diseases are avoided (also known as “quantitativebenefits”)?
• Value of benefits. What is the economic value ofthe avoided costs—for example, how muchwould the reduced emissions and damagesavoided by implementing EU directives beworth (also known as “monetarized benefits” andgiven in millions of euros)?
The types of benefits included in the study aresummarized in table 11.4.10 The monetary value ofthe benefits was estimated using a large body of
Turkey on the Path to EU Accession: The Environmental Acquis 301
TABLE 11.2 Scenarios for Implementation of Environmental Investmentsfor the Acquis
Scenario
Policy Base Case Medium Reform High Reform
Pricing of utilities’ services
Use of market-basedinstruments
Private sectorparticipation in water sector
Private sector in waste management
Reforms in energy sector
Reforms in industrial sectors
Slow progress toward cost recovery in water and waste sectors.
Existing charges oneffluent continue andnew charges on carbon;some productsintroduced slowlyat low rates.
Virtually no participation of private sector in delivery of services.
Virtually no participation of private sector in delivery of services.
Current ownership of energy sector enterprises implies about 37% of all expenditures will be in the nonstate sector; all large plant combustion (LPC) investments in public sector.
Current estimate is basedon 90% of expendi-tures being undertakenby private sector.
Moderate progress toward full-cost recovery and some volume-based pricing.
Existing charge levels raised and newcharges introducedmore rapidly athigher rates.
Moderate participa-tion, withinvestment goingup to 10% of total.
Moderate participa-tion, withinvestment goingup to 20% of total;some recyclingprograms effective.
Private sector takesover up to 20% ofplants needing torespond to LPC;reforms introducemore renewablesources andincrease efficiency.
Rapid progress tofull-cost recoveryand volume-basedpricing.
Existing and newinstrumentsintroduced rapidly,with rates thathave incentiveeffects.
Substantial participa-tion, withinvestment goingup to 20% of total.
Substantial participa-tion, withinvestment goingup to 30% of totaland significantrecycling programs.
Private sector takesover up to 30% ofplants needing torespond to LPC;reforms introducemore renewablesources andincrease efficiencyfaster.
Source: The author.
In both of these cases, the share of privatesector investment under the IntegratedPollution Prevention and Control (IPPC)goes up to 95%.

302 Turkey: Economic Reform and Accession to the European Union
TABLE 11.3 Environmental Accession Costs for Turkey(millions of euros, in 2001 prices)
State Nonstate Total
Base caseWater supply 976 0 976Wastewater 17,315 0 17,315Air 6,848 4,031 10,879Waste 2,046 6,071 8,117IPPC 474 3,860 4,334Nitrates 3,603 1,333 6,749Other 420 70 490Total 31,682 15,365 48,860
Medium reformWater supply 703 78 781Wastewater 12,467 1,385 13,852Air 4,382 4,320 8,703Waste 1,309 5,184 6,493IPPC 270 3,197 3,467Nitrates 2,882 1,066 3,948Other 336 56 392Total 22,350 15,287 37,637
High reformWater supply 469 117 586Wastewater 8,311 2,078 10,389Air 2,876 3,651 6,527Waste 859 4,011 4,870IPPC 205 2,395 2,600Nitrates 2,162 800 2,961Other 252 42 294Total 15,134 13,094 28,228
Sources: Author’s calculations.
TABLE 11.4 Types of Benefits of Compliance with Directives, Estimated for Candidate Countries
Type of Benefit Air Drinking Water Wastewater Solid Waste
Health benefits Avoided Household access Reduced risk of None respiratory to cleaner poisoning and assessedillnesses and drinking water accidents due topremature methane leakage fromdeaths landfills
Resource Avoided Cleaner bathing Reduced input of Nonebenefits damage to water and primary material assessed
buildings and cleaner watercrops for companies
Ecosystems Avoided global Improved river Avoided global Protectedwarming from water quality warming from areas and CO2 emissions methane emissions species
Source: ECOTEC and others 2001.

past and ongoing research on economic valuation.The results of the estimation for Turkey are given intable 11.5, where the benefits are compared withthe cost figures in table 11.3. The exercise is onlypossible for a few areas: air, drinking water, waste-water, and solid waste.
Although the data on benefits are subject to con-siderable uncertainties, table 11.5 neverthelessreveals some useful findings. First, investments inwater supply and reductions in air pollution areamply justified in terms of benefits, even taking theupper end of the costs and the lower end of thebenefits. Second, investments in wastewater are notjustifiable given the measurable benefits. This doesnot mean that all individual projects for buildingwastewater treatment have negative net benefits;some almost certainly will be of high priority. But itdoes mean that as a program, with a time profile forinvestments more or less like the one in the 2004candidate countries, the net benefits are likely to benegative. Because these results are based on Euro-pean Commission–supported data, they shouldprove useful in arguing for derogation for a largepart of the wastewater treatment directives. Third,for solid waste the question of whether benefitsexceed costs is unresolved; it depends on where thebenefits lie in the range that has upper values20 times the lower values.11
The Medium Reform Scenario for EU Accession for Turkey
Those countries that have closed the environmentalchapter have committed themselves to comply-ing with the acquis by the agreed-on dates. Thehighest priority in all cases is being given to legal
approximation, ensuring that the national legalframework is consistent with the EU legislation.Next in priority is the institutional strengthening ofsupervisory bodies and environmental agencies. Allthis is expected to be completed before accession.The investment program necessary for compliancefor those joining in 2004 has a completion date of2015, with interim targets for key directives. Forexample, Lithuania must comply with the directiveon the sulfur content of petrol and diesel by 2005,the large urban wastewater directive by 2010, andso on (Republic of Lithuania 2001). The Balticstates, Poland, and the other 2004 accession candi-dates commended their investment programs in1999/2000 (see World Bank 2002, 2003).
Taking the cue from these countries, Turkeywould have to start its program in earnest three tofour years before entry and negotiate the deroga-tion of the items that have a high cost but that gen-erate have relatively modest benefits, following theanalysis presented in the previous section.
The time profile that the present accessioncountries have negotiated indicates the costs ofaccession in the first six years of the program.Table 11.6 was derived from this profile (givingthe share of total costs in the first six years and theshare of the six-year total by year) and from thetotal estimated costs for Turkey. The table alsoincludes estimates of the external funding agreed tofor this period. It is reported separately and isassumed to reduce the part of state expenditurethat has to be financed from domestic sources.
The table reveals an important point, that fundssuch as ISPA and SAPARD will provide only between25 percent and 30 percent of the “state” spending—that is, the “state from domestic” plus the “state from
Turkey on the Path to EU Accession: The Environmental Acquis 303
TABLE 11.5 Estimated Benefits for Turkey from Compliance with Environmental Directives(millions of 2001 euros)
Directives Relating to Present Value of Costs Present Value of Benefits
Water supply 586–976 1,500–26,050Wastewater 10,400–17,300 7,140Air 6,500–10,900 > 21,000Waste 4,900–8,100 800–18,000
Source: ECOTEC and others 2001 and this study. Both benefits and costs arediscounted at 4 percent in real terms.

external.” Thus the domestic state sources will haveto undertake a significant expenditure; in table 11.6this expenditure increases from €1.2 billion in year1 to €2.8 billion in year 6 under the base case and€0.6 billion in year 1 to €1.2 billion in year 6 underthe high reform case.
The differences between the base case and theother cases depend on how much of the reformactions can be undertaken prior to the actual startof the formal program. Without prejudging thedate of accession for Turkey, it is possible to say thata rapid program of reform over the next five yearswould place it in a position in which the esti-mated state expenditures in table 11.6 could beconsidered realistic. If, however, reforms do nottake place prior to the accession period, whichstarts three to four years before the date of acces-sion, then the estimates under the reform scenarioswill be too low.
How do these estimates of environmentalspending compare with current spending on theenvironment? Unfortunately, data are availableonly for the period 1997–99 and then, except for1997, not for all the categories—see table 11.7. Thetable shows that
• Spending by government organizations wasabout €480 million in 1997, of which three-quarters was for investment. By 1999 the total hadfallen to €420 million, of which only 55 percent
was for investment. Total spending was about1 percent of government expenditure in 1997, butit had fallen to 0.6 percent in 1999.
• Spending by municipalities amounted to€1,200 million in 1997 and €1,500 million in1998. Of this, about 30–34 percent was forinvestment.
• Manufacturing sector environmental invest-ments (available only for 1997) were only€52 million.
• Investment by thermal power plants amountedto €294 million in 1997, €61 million in 1998,and €104 million in 1999.
• The total investment in all sectors amounted to€2.2 billion or 1.4 percent of GDP.
If municipalities and thermal power plants areincluded as part of public sector spending, the totalamount of investment by the state sector amountedto about €1 billion in 1997 and in 1998. The com-parison in table 11.6 of this figure with the requiredinvestment by the state sector reveals that, in fact,the amounts needed in state investments are notvery different from the actual levels in 1997–98.State investment, after accounting for EU funds,ranges from €0.6 billion to €1.3 billion in year 1,but rises sharply in the next six years (table 11.6).
Although this comparison does not establishfirmly that the actual investments in the environ-ment were of the right amount to meet the first year
304 Turkey: Economic Reform and Accession to the European Union
TABLE 11.6 Costs of Accession for Turkey in First Six Years(millions of 2001 euros)
Year 1 Year 2 Year 3 Year 4 Year 5 Year 6 Total
Base caseState 1,253 1,636 2,422 2,546 2,703 2,773 13,334Domestic nonstate 1,215 1,317 1,560 1,656 1,728 1,712 9,187External 474 617 822 853 910 938 4,613Total 2,942 3,571 4,804 5,054 5,340 5,423 27,134
Medium reformState 807 1,055 1,561 1,641 1,742 1,787 8,593Domestic nonstate 1,148 1,245 1,474 1,565 1,633 1,618 8,683External 332 433 576 598 638 658 3,235Total 2,288 2,732 3,611 3,804 4,013 4,063 20,511
High reformState 560 731 1,082 1,138 1,208 1,239 5,958Domestic nonstate 962 1,043 1,235 1,311 1,368 1,355 7,275External 221 288 383 397 424 437 2,150Total 1,743 2,062 2,700 2,846 3,000 3,032 15,383
Source: Author’s calculations.

of the EU accession investment program (the cover-age and priorities may not have been the same), itdoes suggest that if state investment spending couldbe maintained at 1997–98 levels and if the externalfunds are forthcoming, the amount will at least beenough to start the accession program. The big gapappears to be in private sector spending, which is very
much below what would be required. Table 11.6 givesa figure of €1 billion to €1.2 billion for the first year,whereas actual spending for the one year for whichdata are available (1997) was €52 million.
Finally, an allowance also must be made for anincrease in the budgets needed for monitoring andcompliance enforcement. Table 11.8 provides the
Turkey on the Path to EU Accession: The Environmental Acquis 305
TABLE 11.7 Environmental Expenditures in Turkey, 1997–99
1997 1998 1999 1997 1998 1999(TL billions) (€ millions)
Government organizations
Current 20,898 35,941 85,401 121.3 123.1 191.2Investment 62,602 115,342 105,989 363.5 395.0 237.2As % of budget 1.0% 0.9% 0.6% 1.0% 0.9% 0.6%
MunicipalitiesCurrent 147,576 287,864 — 856.9 985.8 —Investment 62,542 148,269 — 363.1 507.8 —
ManufacturingCurrent 11,499 — — 66.8 — —Investment 8,871 — — 51.5 — —
Thermal power plantsCurrent 26,913 4,455 — 156.3 15.3 —Investment 50,605 17,747 46,502 293.8 60.8 104.1
TotalCurrent 206,886 — — 1201.2 — —Investment 184,620 — — 1071.9 — —As % of GDP 1.4% — — 1.4% — —
— Not available.Note: Data for 1998 are not confirmed.Sources: Turkish State Institute of Statistics and International Monetary Fund.
TABLE 11. 8 Estimated Annual Spending on Monitoring and Enforcement, Turkey
Expenses of Regulator
Directive (€ millions) Comments
Integrated Pollution 2.2 Recoverable from industry on a Prevention and Control IPPC purchasing power parity (PPP) basisAir quality 19.6 Monitoring in 287 towns with more
than 25,000 inhabitantsWater quality 14.2 26 teams in each of 26 water basinsNitrates 2.2 4 teams, one for each affected
catchmentConservation of habitats 0.9 Monitoring of habitats of wild birds
and protection of animals used inexperiments
Total 39.1
Source: Carl Bro International 2001.

figures estimated by Carl Bro International for thispurpose, which amount to about €39 million ayear. This figure does not include an increase in theanalytical and management capacity of the Min-istry of Environment, which has not been estimatedbut requires an increase in the ministerial staff ofabout 20 percent.
Conclusions
This chapter has looked at the environmentaldimension of EU accession for Turkey. As a countrynow in accession talks with the EU, Turkey hasactively begun to prepare for the approximationprocess, and the environmental component is amajor part of the process. The time period requiredfor most of the approximation process is aboutthree to four years before accession and 15 yearsafter accession. Based on estimates of the invest-ment costs of accession made for other candidatecountries and (partly) for Turkey, the total costcomes out between €28 billion and €49 billion.This range looks frightening, but, spread over18–19 years, it amounts annually to 1–2.5 percentof GDP for Turkey. This amount is more than thecountry has been investing in the environmentalsector, which is about 0.5 percent of GDP. Theinvestment must come from various sources: thestate, municipalities, state enterprises, and the pri-vate sector. The analysis shows that, whereas thefirst three (which are consolidated into the statesector) have current investment at a level similar tothat required by the approximation, private sectorspending is woefully short. This situation impliesthat the appropriate regulations will have to be put inplace to ensure compliance by the private sector inaccordance with the agreement on investmentreached with the EU.
The costs of the environmental acquis are notpredetermined and depend on policy choices andreforms. This chapter has identified those actionsthat can, first, reduce the costs and, second, shift thecosts from the state sectors to the private sector.Reducing costs will require a more careful assess-ment of the least-cost options, better procurementin public spending, and better assessment of futuredemand as prices increase. The whole process ofcommercialization and privatization has a majorrole to play in shifting costs from the state sectors tothe private sector. This chapter has provided three
scenarios that reflect different rates of reform anddifferent rates of increase in the involvement of theprivate sector in the provision of environmentalservices. The resulting costs for the state sectorrange from €32 billion in the base case to €15 bil-lion in the high reform case, a drop of 52 percent.This drop is made up of 42 percent from cost sav-ings from the reforms and 10 percent from theincreased share of the private sector in providingthe environmental services.
The costs of accession can also be comparedwith its potential benefits by drawing on a majorEuropean Commission study that included Turkey.Although the data on the benefits of the water sup-ply, wastewater, air, and solid waste directives aresubject to considerable uncertainties, the resultsreveal the following:
• Investments in water supply and a reduction inair pollution are amply justified in terms of ben-efits, even taking the upper end of the costs andthe lower end of the benefits.
• Investments in wastewater are not justifiablegiven the measurable benefits. This finding doesnot mean that all individual projects for buildingwastewater treatment have negative net benefits;some almost certainly will be of high priority.But it does mean that as a program, with a timeprofile for investments more or less like that inthe 2004 candidate countries, the net benefits arelikely to be negative. Because these results arebased on European Commission–supporteddata, they should prove useful in arguing forderogation for a large part of the wastewatertreatment directives.
• For solid waste, the issue of the program is unre-solved; it depends on where the benefits lie in arange in which the upper values are 20 times thelower values.
This chapter has described a possible medium-term accession program for Turkey (i.e., coveringthe first six years). Based on the time profiles forinvestment in the candidate countries, externalfunds such as ISPA and SAPARD will provide onlybetween 25 and 30 percent of the “state” spending.Thus domestic state sources will have to provide asignificant amount of the expenditure, whichincreases from €1.2 billion in year 1 to €2.8 billionin year 6 under the base case and from €0.6 billion
306 Turkey: Economic Reform and Accession to the European Union

in year 1 to €1.2 billion in year 6 under the highreform case. There is also an urgent need toincrease the budget and resources available to theMinistry of Environment if the program is to berealized. An EU study has estimated this amount tobe about €39 million annually.
In summary, Turkey faces an enormous chal-lenge in meeting the environmental acquis, but notone that is beyond its capabilities. By adhering to avigorous reform program and adopting increasedincentives for the private sector to make the neces-sary investments, it should be able to achieve thegoals in much the same way as the other candidatecountries—by a combination of good manage-ment, good luck, and a little help from its friends.
Notes
1. The views in this paper are those of the author and do notnecessarily reflect the official position of the World Bank.
2. The countries are Bulgaria, the Czech Republic, Hungary,Poland, Romania, the Slovak Republic, Slovenia, Estonia, Latvia,and Lithuania.
3. The estimates by Carl Bro International are undiscountedcosts over the period of up to 18 years. In the figures presentedhere, a real rate of 4 percent has been applied to a typical profileof costs. For Turkey, this approach would imply a nominal ratetoday of about 35 percent.
4. Details of the OECD estimate were not obtainable, butearlier data confirm a similar figure for 1997 (see the finalsection of this chapter).
5. Total costs may also fall over time as manufacturers droptheir prices for capital equipment in response to the larger levelof production (Hager 2000).
6. The marginal costs of standards rise with the standardsthemselves, and this observation holds true particularly in thearea of wastewater treatment.
7. The increased level of private sector activity implies agreater effort by the state to ensure compliance. This effort, inturn, requires investment in capital equipment for monitoringand testing, among other things. Funding for this can beobtained from ISPA, if the demands can be bundled to meet the€5 million threshold.
8. A comprehensive status of privatization in the energy andutility sectors for the CEE countries does not appear to be avail-able and is being prepared by the World Bank.
9. The constraints on raising charges, however, are real andraise issues of affordability for the poorer customers. Mostcountries adopt some lifeline rates to get around such asituation, although adoption of the rates tends to be done in anad hoc fashion and is not based on a careful assessment of astructure that meets specified targets at least cost.
10. The results from the exercise are reported as the net pres-ent value of benefits, discounted at a real rate of 4 percent. Inactual practice, countries may use higher discount rates, if onlyto ensure that they give priority to those investments that willyield earlier benefits for the populations.
11. Benefits from the waste directives arise largely from thelandfill directive, which reduces methane emissions as well asamounts of waste subject to disposal. The benefit range is sowide because the benefits depend on how much recycling takesplace and how much incineration is carried out. The higher therecycling and the less the amount incinerated, the greater are thebenefits.
References
Adler, A., and others. 1994. Economic Costs and Legislation inWestern and Eastern Europe, Munich: Ifo Institute.
Carl Bro International. 2002. Analysis of Environmental Legisla-tion in Turkey. Project Number LOHAN-23-MEDA/TUR/ENLARG/D4-01. European Commission: DG Enlargement,Brussels.
ECOTEC, IEEP, Metroeconomica, TME, and Candidate CounterExperts. 2001. The Benefits of Compliance with the Environ-mental Acquis for the CEECs.Brussels: European Commission.
EDC (Environmental Development Consultants). 1997. Compli-ance Costing for Approximation of EU Legislation in theCEEC. European Commission: DG Environment, Brussels.
Hager, W. 2000. “Environmental Investment in the CEECPreparing for Accession.” World Bank, Washington, DC. (IfoInstitute 1994; EDC 1997).
Republic of Lithuania. 2001. “National ISPA Strategy: Environ-ment Sector.” Ministry of Environment, Vilnius.
World Bank. 1999.“Czech Republic: Towards EU Accession: Sum-mary Report.” World Bank Country Study, Washington, DC.
————. 2002. “Expenditure Policies toward EU Accession.”Technical Paper No. 533, Washington, DC.
————. 2003. “Poland: Toward a Fiscal Framework forGrowth.” Report No. 25033-POL, Washington, DC.
Turkey on the Path to EU Accession: The Environmental Acquis 307


309
Part IV
Implications ofEU Accession
for Turkey and the EU


the gains to Turkey will amount to 1.1 percent of itsgross domestic product (GDP) per year. If liberaliz-ing trade in industrial goods can affect the GDP,then there should be comparable gains from liber-alizing agriculture and also services.
Agriculture
Because Togan, Bayener, and Nash thoroughlystudy in chapter 2 of this volume the impact of EUenlargement to Turkey on Turkey’s agriculturalmarkets and incomes, this section only briefly sum-marizes the main points presented by the authors.According to Togan and his colleagues, adoption ofthe CAP will lead to substantial changes in the agri-cultural incomes of producers, the welfare levels ofconsumers, and the budget revenues of the govern-ment. Because the prices for many major agricul-tural products in Turkey will have to be reduced atsome point between now and accession, consumerswill derive great benefits. The authors estimate that,in the medium to long term, EU-like policies willlead to a 1.87 percent increase in real householdincomes in Turkey, which is equivalent to about€2.92 billion. Lower-income households (ruralhouseholds) will experience an even more signifi-cant increase in real income.
Yet adoption of the CAP will require substantialadjustments on the part of Turkish farmers, and theeffect on farmers’ incomes will be driven mainly by
With accession to the European Union (EU),Turkey will complete the harmonization of its tech-nical regulations, liberalize entry and exit into vari-ous sectors of its economy, impose hard budgetconstraints on all of its public and private enter-prises, adopt the EU’s Common Agricultural Policy(CAP), liberalize its trade with the EU in services,and join the European single market. Furthermore,joining the EU will require Turkey to adopt andimplement the whole body of EU legislation andstandards—the acquis communautaire. Accordingto the EU membership criteria, new members mustbe able to demonstrate the “ability to take on theobligations of membership including adherence tothe aims of political, economic and monetaryunion.” Thus Turkey is expected to adopt the eurowhen it is ready to do so, but not immediately uponaccession.
Welfare Effects of Integration
Any study of the effects of integration on theTurkish economy must keep in mind that the cus-toms union in industrial goods between the EU andTurkey was established in 1996 and that a period ofperhaps 10 years or more will precede full member-ship and Turkish participation in the internal mar-ket. Harrison, Rutherford, and Tarr (1997), whohave calculated the impact of the customs union inindustrial goods on Turkish welfare, estimate that
311
12Economic
Implications ofEU Accession
for Turkey
Sübidey Togan

the amount of CAP-like compensation paymentsgranted to farmers. Farmers’ incomes will decreaseconsiderably under Agenda 2000 policies withoutdirect payments and will increase under Agenda2000 policies with direct payments. Table 12.1shows that agricultural value added will increase by€2.15 billion under Agenda 2000 policies withdirect payments equal to those applied in the EUand by €0.34 billion under Agenda 2000 policieswith direct payments equal to 35 percent of pay-ments granted in the EU member countries.
The budgetary costs to Turkey of adopting EU-like agricultural policies will depend on whetherTurkey receives compensation from the EU budgetfor introducing these policies. If Turkey does notreceive any compensation from the EU budget, thecost will amount to €3 billion under Agenda 2000policies with direct payments equal to those appliedin the EU and to €1.2 billion under Agenda 2000policies with direct payments equal to 35 percent ofpayments granted in the EU member countries.
Services and Network Industries
To join the EU, Turkey must liberalize its services andnetwork industries. This section considers the bank-ing, telecommunications, transportation, electricity,and natural gas sectors as representative of thosemaking up Turkey’s services and network industries.
Banking Sector Before 1999, Turkey lacked thecrucial components of financial markets: compe-tent supervisory authorities, a regulatory frame-work, and a legal and institutional infrastructure.In addition, regulations in Turkey were lax andpoorly enforced. In February 2001, Turkey faced a
currency crisis. The cost of this crisis in terms of itseffect on the banking sector has been estimated atUS$46 billion,1 or about 27–30 percent of theTurkish GDP (the crisis and its effects are describedin more detail by Pazarbasıoglu in chapter 6). Afterthe crisis, Turkey changed its legislative, regulatory,and institutional framework. As of 2004, Turkishprudential requirements related to capital adequacystandards, loan classification and provisioningrequirements, limits on large exposures, limits onconnected lending, and requirements for liquidityand market risk management were generally inconformity with those of the EU.
The welfare effects of policies followed byTurkey in the banking sector are illuminated by com-paring a base case—the Turkish economy operat-ing under the rules and regulations that prevailedin the banking sector during the latter half of the1990s—with a case in which Turkey adopts andimplements in the banking sector all of the rulesand regulations of the EU.
The effects of the adoption of EU rules and regu-lations in the banking sector on the price of bank-ing services are illuminated by a study by McGuireand Schuele (2000) in which they develop indexvalues of restrictiveness in financial services for sev-eral countries. McGuire and Schuele, in extendingthe work of McGuire (1998), base their analysis on1997 data and distinguish between prudential andnonprudential requirements. The authors note thatprudential requirements aimed at ensuring the sta-bility of the banking system by preserving solvency,limiting risks, and protecting bank deposits are, ingeneral, similar across economies. Therefore, theyabstract from consideration of prudential require-ments and concentrate on nonprudential require-ments. The index values of the nonprudential vari-ables considered by McGuire and Schuele (2000)are shown in table 12.2; scores range from 0 (leastrestrictive) to 1 (most restrictive). In the table, therestrictions have been divided into two groups:those affecting “commercial presence” and “restric-tions on ongoing operations.” The first group indi-cates the restrictions on the movement of capital,and the second group is modeled as restrictions ontrade in banking services. The commercial presencerestrictions group covers restrictions on licensing,direct investment, joint venture arrangements, andthe permanent movement of people. The othergroup covers restrictions on raising funds, lending
312 Turkey: Economic Reform and Accession to the European Union
TABLE 12.1 Impact of Agenda 2000 Policies(millions of euros)
Effect on real income 2,916Effect on agricultural value added
Direct payments equal to 2,145those applied in the EU
Direct payments at 35 percent 341of payments granted in EU countries
Effect on government budget −2,998
Source: Chapter 2 of this volume.

funds, providing other lines of business, expandingbanking outlets, composition of the board of direc-tors, and the temporary movement of people. Basedon the scores shown in table 12.2 for each variableconsidered, the authors assign weights to the vari-ables and obtain first restrictiveness index values forthe two groups and then the overall restrictivenessindex values for the economies considered.
Table 12.2 reveals that the Turkish banking sys-tem is more restrictive than the banking system inthe EU. Kalirajan and others (2000) use this infor-mation to study the effects of restrictions in thebanking sector on performance indicators. Theauthors note that banks provide a wide range offinancial services, including deposit taking, lend-ing, insurance, and securities. But they emphasizethat, although banks are diversified entities, theircore business remains matching depositors andlenders. Thus the price of banking services can bemeasured by the net interest margin—that is, thedifference between the interest rate banks charge ontheir loans and the rate they pay on their deposits.Restrictions on trade in banking services isexpected to increase the interest margin. The effectof these restrictions in the banking sector on thenet interest margin is shown in the third and fourth
columns of table 12.2 for the EU countries andTurkey. The table reveals that, as a result of restric-tions in the banking sector, the net interest marginin the EU increases relative to the free trade netinterest margin by 5.32 percent, and that theincrease amounts to 31.54 percent for Turkey. Onecould thus infer that the net interest margin inTurkey will decrease by 26.22 percent when Turkeyadopts and implements the EU rules and regula-tions on banking services.
Telecommunications The telecommunicationsindustry in Turkey has been dominated by TürkTelekom, a national monopoly with exclusiverights to all fixed-line voice operations. It alsoprovides cable services, and so also has beenresponsible for the radio and television transmit-ters. Türk Telekom has a monopoly on the provi-sion of international calls, and prices for local callsthrough fixed lines were cross-subsidized bynational long-distance and international calls.Reforms since the early 1990s have led to theintroduction of four new mobile telephone com-panies and a series of private companies that pro-vide value added services such as Internet accessand cable television.
Economic Implications of EU Accession for Turkey 313
TABLE 12.2 Restrictiveness Index Scores and Price Effects for Banking Services,EU and Turkey
Restrictiveness Index Price Effect (%)
EU Turkey EU Turkey
Licensing of banks 0.0100 0.2000 0.7515 16.8479Direct investment 0.0100 0.0100 0.7515 0.8424Joint venture arrangements 0.0050 0.0525 0.3758 4.4226Permanent movement of people 0.0085 0.0119 0.6403 1.0025
Restrictions on establishment total 0.0335 0.2744 2.5191 23.1154
Raising funds by banks 0.0075 0.0075 0.5636 0.6318Lending funds by banks 0.0075 0.0075 0.5636 0.6318Other business of banks—insurance and 0.0050 0.0525 0.3758 4.4226
securities servicesExpanding the number of banking outlets 0.0025 0.0131 0.1879 1.1056Composition of board of directors 0.0119 0.0120 0.8973 1.0126Temporary movement of people 0.0028 0.0074 0.2131 0.6213
Restrictions on ongoing operations total 0.0373 0.1000 2.8013 8.4257
Index value 0.0708 0.3744 5.3203 31.5410
Source: Australian Productivity Commission (http://www.pc.gov.au).

Akdemir, Basçı, and Locksley note in chapter 5 ofthis volume that the Turkish Parliament approvedlegislation to reform the telecommunications sectorin 2000 and that the legislation was amended inMay 2001. The reform program was quite successfulin transforming the Turkish telecommunicationssystem into a modern one. The objective of the leg-islative and regulatory reform was to bring the regu-latory and supervisory regime for the Turkishtelecommunications sector up to the level of inter-national practice in line with EU standards. Theobjective has been achieved partially by opening themobile telecom market to competition. With acces-sion to the EU, Turkey will have to introduce fullcompetition in telecommunications, and it willhave to adopt and implement the EU legislativemeasures centering on liberalization of all telecom-munications services and infrastructures, adoptionof open network provision measures to the futurecompetitive environment, maintenance and devel-opment of a minimum supply of services, and defi-nition of common principles for financing the uni-versal service.
The welfare effects of policies followed by Turkeyin the telecommunications sector are studied here bycomparing the situation of the Turkish economyin the base case—the Turkish economy operatingunder the rules and regulations that prevailed in thetelecommunications sector during the latter half ofthe 1990s—with the case in which Turkey adopts andimplements in the telecommunications sector all ofthe rules and regulations of the EU. The effects ofadoption of EU rules and regulations in the telecom-munications sector on the price of telecommunica-tions services are examined as well. The telecommu-nications sector is a heterogeneous service industryjust like the banking sector, and its services includefixed-line voice services (e.g., local, domestic, andinternational long-distance telephony), mobile serv-ices (mobile access, calls, and messaging services),Internet services (e.g., dial-up and Web hosting),data services (e.g., leased lines, asynchronous trans-fer mode [ATM] services, and public data networkservices), and content services (e.g., pay TV andonline information and entertainment). Thus theprice of telecommunications will be an index of allthese prices.
Warren (2000a) considers four types of impedi-ments to trade in telecommunications services:restrictions on cross-border trade, restrictions on
establishment, restrictions on direct investment infixed and mobile network services, and restrictionson ongoing operations. For each type, Warrenderives index values, for which the higher valuesindicate greater restrictions. The index of restric-tions on cross-border trade captures policies thatdiscriminate against all potential entrants (domes-tic and foreign) seeking to supply cross-bordertelecommunications services, and the index ofrestrictions on establishment captures policies thatdiscriminate against all potential entrants (domesticand foreign) seeking to supply telecommunicationsservices via investment in the country. The index ofrestrictions on direct investment is designed to cap-ture policies that discriminate against potential for-eign entrants seeking to supply telecommunicationsservices via investment in the country. Finally, theindex of restrictions on ongoing operations cap-tures policies that discriminate against potentialforeign entrants seeking to supply cross-bordertelecommunications services. Based on the indexvalues derived from an international survey under-taken by the International TelecommunicationsUnion (1998) for 136 countries, Warren (2000b)estimates first the impact of impediments to tradeand investment in telecommunications services onthe penetration of fixed and mobile telecommuni-cations network and thereafter the price impact.
The results are shown in table 12.3. The tablereveals that Finland and the United Kingdom fol-low liberal trade and investment policies intelecommunications and that, as a result of restric-tions in the trade of telecommunications services,Turkish telecommunications prices are 33.53 per-cent higher than the prices in Finland and theUnited Kingdom.
Transportation In the transportation sector, onecan distinguish broadly between three differentmodes of transport: land transport (including railand road transport), maritime transport, and airtransport. In Turkey, road transport constitutes thesignificant portion of transport services. Roadscarry an estimated 90 percent of domestic freightvolumes and 40 percent of international freight val-ues. The sector is competitive domestically; thereare many competing firms; and access to the roadsis relatively simple. Conditions in the internationalsegment of the market are very different fromthose in the domestic freight segment, however.
314 Turkey: Economic Reform and Accession to the European Union

315
TABLE 12.3 Restrictiveness Index Scores for Telecommunications Services
Restrictiveness Index Price Effect (%)
Restrictions on Establishment Restrictions on Ongoing Operations Restrictions on Establishment Restrictions on Ongoing Operations
Restrictions Restrictions on Direct on Direct
Investment in InvestmentFixed and Restrictions in Fixed and Restrictions
Mobile Restrictions on Restrictions on Ongoing Mobile Restrictions on Restrictions on OngoingNetwork Establishment on Cross- Operations Index Network Establishment on Cross- Operations PriceServices Total Border Trade Total Value Services Total Border Trade Total Effect
Austria 0.1333 0.1333 0.0000 0.0000 0.1333 0.8480 0.8480 0.0000 0.0000 0.8480Belgium 0.1334 0.1334 0.0667 0.0667 0.2001 0.8710 0.8710 0.4353 0.4353 1.3063Denmark 0.0333 0.0333 0.0000 0.0000 0.0333 0.1985 0.1985 0.0000 0.0000 0.1985Finland 0.0000 0.0000 0.0000 0.0000 0.0000 0.0000 0.0000 0.0000 0.0000 0.0000France 0.2100 0.2100 0.0000 0.0000 0.2100 1.4298 1.4298 0.0000 0.0000 1.4298Germany 0.0493 0.0493 0.0000 0.0000 0.0493 0.3195 0.3195 0.0000 0.0000 0.3195Greece 0.1609 0.1609 0.3000 0.3000 0.4609 1.5778 1.5778 2.9424 2.9424 4.5202Ireland 0.3533 0.3533 0.0000 0.0000 0.3533 2.6655 2.6655 0.0000 0.0000 2.6655Italy 0.1369 0.1369 0.0000 0.0000 0.1369 1.0019 1.0019 0.0000 0.0000 1.0019Luxembourg 0.1667 0.1667 0.0000 0.0000 0.1667 1.0458 1.0458 0.0000 0.0000 1.0458Netherlands 0.0300 0.0300 0.0000 0.0000 0.0300 0.2025 0.2025 0.0000 0.0000 0.2025Portugal 0.1100 0.1100 0.4000 0.4000 0.5100 1.3473 1.3473 4.8992 4.8992 6.2465Spain 0.1793 0.1793 0.2333 0.2333 0.4127 1.7099 1.7099 2.2247 2.2247 3.9346Sweden 0.1000 0.1000 0.0000 0.0000 0.1000 0.6530 0.6530 0.0000 0.0000 0.6530U.K. 0.0000 0.0000 0.0000 0.0000 0.0000 0.0000 0.0000 0.0000 0.0000 0.0000
Turkey 0.3987 0.3987 0.4000 0.4000 0.7987 16.7384 16.7384 16.7944 16.7944 33.5328
Note: The restrictiveness index scores range from 0 to 1. The higher the score, the greater are the restrictions for an economy.Source: Australian Productivity Commission (http://www.pc.gov.au).

Operations between countries are regulated by aweb of bilateral and multilateral agreements thatrestrict quantity and capacity by limiting the num-ber of permits available for a truck to make a jour-ney between jurisdictions. Bilateral agreementsgenerally prohibit cabotage.2 Thus the domesticTurkish market is reserved for Turkish firms. Bycontrast, the road freight market within the EU forEU national firms is highly liberalized, includingcabotage freight. Effectively, it is a single market inwhich the only entrance requirement is a nationallicense from an EU country that permits unre-stricted international and domestic carriage withinthe EU irrespective of the country of origin of thecarrier within the EU. Ultimate access to the EUwould largely solve the access problems of theTurkish industry, but it would also lead to increasedcompetition from abroad.
As for rail transport, Turkish Railways is anational monopoly with exclusive rights to thetransport of passengers and freight by rail inTurkey. By contrast, the EU acquis in the rail trans-port sector has been designed to improve the com-petitiveness of the rail transport sector and toliberalize rail transport markets. Harmonization ofthe current rules in the rail transport sector withthe EU acquis requires that access rights beextended and that different organizational entitiesbe set up for rail operations and infrastructuremanagement in the rail transport sector. Functionssuch as rail capacity allocation, infrastructurecharging, and licensing will have to be separatedfrom rail operators. In addition, the financial rela-tions between different parties and activities mustbe clearly defined by separation of accounts toenable the cost of operations to be accurately estab-lished and to avoid cross-subsidization.
Maritime transport is another area in whichcompliance with the EU acquis requires majorchanges in the sector. The EU acquis covers freedomto supply services, the requirements for competition,pricing practices, and the conditions to be applied tovessels carrying dangerous or polluting goods. As inroad transportation, access to the Turkish maritimetransportation market is restricted. With accession,access problems will be solved, and the sector willface increased competition from abroad.
Finally, in the air transport sector Turkey hastaken major steps toward liberalizing air transportservices. Major reforms were introduced during the
1980s. In this sector, Turkey will need to harmonizeits regulations with those of the EU on civil avia-tion licenses, civil aviation rules and procedures, aircarrier liability in the event of accidents, allocationof slots, ground handling at airports, aviationsafety, and traffic management. But, overall, theexisting structure will satisfy the requirements ofthe acquis on air transport services with relativelylittle alignment.
Francois’s study in chapter 6 of this volume ishelpful in determining the tariff equivalent of tradebarriers in transportation services. Francois assertsthat the tariff equivalent is roughly 8.9 percent.
Electricity The Turkish electricity sector is domi-nated by state-owned enterprises. The two largestfirms are the Turkish Electricity and TransmissionCompany (TEAS) and the Turkish Electricity Dis-tribution Company (TEDAS). Recently, TEAS wasseparated into three companies covering generation,trading, and transmission activities. Some privatelyowned firms have entered the industry throughbuild-operate-transfer (BOT), build-operate-own(BOO), or auto-generator schemes. Today, thesefirms account for more than 21 percent of electric-ity generation. Under the regulations prevailing inTurkey, the private operators signed long-termpower purchase agreements with the state-ownedgeneration enterprise in which the enterprise com-mitted itself to buying the output of the plants for aperiod of, say, 20 years at a fixed price in foreign cur-rency. In these contracts, the price has been on aver-age between $.08 and $.09 per kilowatt-hour for thefirst 5–10 years of operation. These contracts, guar-anteed by the Treasury, assured investors that theprojects would be profitable irrespective of thedemand for power.
Recently, the government of Turkey passed, asnoted by Atiyas and Dutz in chapter 7 of this vol-ume, a new electricity law. The law provides for theestablishment of a new independent Energy MarketRegulatory Authority. With this law, the governmentis introducing a market model, like the one in theEU, that will transfer most of the task of supplyingand distributing electricity and the associated mar-ket risks to the private sector, eliminate the need foradditional state-guaranteed power purchase agree-ments, and minimize costs through competitivepressures on producers and distributors along theEU model.
316 Turkey: Economic Reform and Accession to the European Union

The welfare effects of policies followed byTurkey in the electricity sector are studied here bycomparing the situation of the Turkish economy inthe base case—the Turkish economy operatingunder the rules and regulations that prevailed inthe electricity sector during the latter half of the1990s—with the case in which Turkey adopts andimplements in the electricity sector all of the rulesand regulations of the EU. The effects of regulationon the price of electricity are examined by means oftable 12.4, which summarizes the status of the reg-ulatory environment and market structure in theelectricity sector in selected EU countries andTurkey as of 1998. In the electricity markets, com-petition can be secured as long as the principle ofthird party access (TPA) is observed. This principleis based on the idea that the owner of the networkis obliged to give access to all delivery requeststhrough the network by production and salesoperators. The table shows that by 1998 Finland,Germany, and the United Kingdom had liberalizedaccess to transmission and distribution networks,and that access liberalization in Finland and Britainhad taken the form of regulated TPA, which is alegal obligation to provide network access undernondiscriminatory conditions. Germany has cho-sen the negotiated TPA arrangement, in which con-sumers and producers contract directly with eachother and then negotiate with the transmission anddistribution companies for access to the network.Turkey, by contrast, had not observed the principleof TPA by 1998, and it introduced this principleonly in 2001 under the regulated TPA regime.
But TPA alone will not secure competition inthe electricity sector. The owner of the networkcould charge high access prices, which would putthe competitors in the final market at a disadvan-tage. The achievement of competition requires thatthe access charge be nondiscriminatory and cost-reflective and that it give the network owner theappropriate incentives to maintain and develop theinfrastructure so that the system avoids bottleneckproblems. The two dominant models for thisapproach are cost-based (rate of return) pricingand loosely regulated prices (the model moreprevalent in countries with a decentralized electric-ity supply industry and a tradition of regulationand control on a more local level). Under rate ofreturn regulation, the government sets the trans-mission prices so that they effectively guarantee a
firm and “fair” rate of return. By contrast, underprice cap regulation, prices are indexed to a movingindicator, such as the producer price index, less aportion that provides incentive for innovation andimproved efficiency. Under this type of regulation,firms could realize negative returns in the short runif they are operating inefficiently. Table 12.4 revealsthat Finland and Germany have introduced cost-based pricing and that the United Kingdomfavors price cap regulation, but that Turkey did nothave an explicit transmission pricing regulationduring 1998.
The separation of generation and transmission,in tandem with expanded TPA, is crucial to encour-age competition. Without separation, the networkowner has very high incentives to preclude, or atleast limit, the access of competitors in the down-stream market, thereby eliminating liberalization. Ifthe network owner does not participate in thedownstream markets, it is neutral toward the appli-cants. Thus “unbundling” is important. The alloca-tion of transmission rights must be separated fromtransactions between upstream and downstreamfirms. Where generation and transmission havebeen unbundled, there may be either an accountingseparation, a legal separation, or a propriety separa-tion into different companies. Accounting separa-tion is the weakest form of separation, and legalseparation is achieved through the creation ofdifferent companies under a common holding.Propriety separation is the preferred alternative.
Table 12.4 shows the degree of overallintegration—from generation through transmis-sion and distribution to supply—as well as the pres-ence and type of separation of generation fromtransmission in each of the countries considered.Finland and the United Kingdom have separatedgeneration and transmission into legally distinctfirms, whereas Germany has introduced accountingseparation. The table also shows that, distinct fromliberalization, countries vary as well in the degree ofprivate ownership that has developed over time, aswell as in the decision made about privatization atthe time of liberalization. Indeed, it reveals the cur-rent status of ownership in the generation segmentof the electricity sector, and it provides details aboutprivatization in electricity generation at the firmlevel for the countries selected. The decision to pri-vatize does not necessarily correlate with the degreeof liberalization. Germany has mixed ownership in
Economic Implications of EU Accession for Turkey 317

318
TABLE 12.4 Country Data on European and Turkish Electricity Sectors, 1998
Finland Germany United Kingdom Turkey
Regulatory reformThird party access (TPA) Regulated TPA Negotiated TPA Regulated TPA NoneElectricity market Finnish Electricity Exchange (1995) None English and Wales market (1990) NoneTransmission price regulation Cost-based Cost-based Price cap n.a.Consumer choice thresholds 1995, 500 kW; 1997, 0 kW 1998, 0 kW 1990, 1 MW; 1994, 100 kW; No choice
1998, 0 kW
Vertical integration in the industryDegree of vertical integration Unbundled Unbundled Unbundled IntegratedGeneration separate from Separate companies Accounting separation Separate companies Integrated
transmission
Ownership in the industry Mostly public Mixed Private Mostly public
Privatization in electricity generation 2/1/1997, Komijoki Oy, 25% 7/5/1994, Rhein-Main 3/6/1991, National Power, 60% Private participationDonau, 75.5% 3/6/1991, Power Gen, 60%
12/31/1995, Neckar, 99% 3/1/1995, National Power, 40%3/1/1995, Power Gen, 40%7/19/1996, British Energy, 87.73%
n.a. Not applicable.Sources: Steiner 2000 and the author.

the industry; the United Kingdom has made priva-tization a central feature of reform.
A further requirement for liberalization of elec-tricity markets is the “opening of the demand side.”This principle promotes the idea that eligible cus-tomers have the right to seek the most convenientsupplier. The table reveals that Finland and theUnited Kingdom introduced consumer choice ini-tially for large consumers and then graduallyphased in full consumer choice, that Germanyintroduced full consumer choice immediately in1998, and that Turkey had not opened the demandside by 1998.
Finally, competition requires the existence ofexchange markets, which should yield prices in linewith marginal costs covering fixed costs. By 1998Finland and the United Kingdom had introducedsuch markets for electricity and allowed the pricesand quantities traded to be determined by theequivalence of supply and demand. Germany andTurkey did not have such a market by 1998.
Steiner (2000), basically using the informationprovided in table 12.4, extends it to 19 Organisa-tion for Economic Co-operation and Development(OECD) economies over the period 1986–96 anddevelops indexes of regulatory indicators, which hethen uses to investigate empirically the linkagesamong regulatory regimes, market environments,and performance in electricity supply. Using theproductive efficiency of generation plants and retailelectricity prices as indicators of performance,Steiner concludes that unbundling of generationand transmission, expansion of the TPA, and intro-duction of electricity markets reduce the industrialend user prices. The results obtained by Steiner(2000) were later extended by Doove and others(2001) by increasing the number of countries con-sidered from 19 to 50. The results are shown intable 12.5. As a result of restrictions, Turkish elec-tricity prices are 20.7 percent higher than the pricesin Finland and the United Kingdom, which followliberal policies in the electricity sector.
Natural Gas The natural gas sector in Turkey isdominated by government-owned entities. ThePetroleum Pipeline Corporation (BOTAS) ownsthe pipeline infrastructure for oil and gas transmis-sion, liquefied natural gas (LNG) terminals, and thegas distribution network. BOTAS had monopolyrights for gas imports and exports and wholesale
trading. In 2000, domestic consumption was14.6 billion cubic meters, with imports accountingfor 96 percent of consumption. Demand growthwas about 17 percent a year between 1990 and1999. The distribution of natural gas is carried outby local companies that are owned either by themunicipalities or by BOTAS. Pricing was deter-mined by BOTAS, with indirect influence by thegovernment. In May 2001, the Turkish governmentpassed, as described by Mazzanti and Biancardi inchapter 8 of this volume, a new gas law. With thislaw, the government plans to establish a competi-tive market like the one in the EU and encourageprivate sector participation through a phased pol-icy. The Energy Market Regulatory Authority,which regulates both the gas industry and the elec-tricity industry, determines the transmission anddistribution access rules and tariffs and the methodfor regulating retail prices.
Competition in the electricity sector can beachieved as long as the competition upstream issufficiently developed and network access is open,but the situation is quite different in the natural gasindustry, where firms are burdened with long-terminvestments in the upstream phase (gas contracts
Economic Implications of EU Accession for Turkey 319
TABLE 12.5 Price Impact of Regulationin Electricity Supply, EUand Turkey(percent)
Impact on Price
Austria 13.2Belgium 15.4Denmark 8.5Finland 0.0France 16.0Germany 8.3Greece 16.6Ireland 13.9Italy 17.1Luxembourg 13.8Netherlands 15.5Portugal 17.9Spain 9.5Sweden 0.0U.K. 0.0
Turkey 20.7
Source: Doove and others 2001.

and infrastructures). They buy the gas from pro-ducers under long-term contracts with take-or-payclauses. Under these obligations, gas purchasersmust pay 70–90 percent of the contracted capacitywhether they receive the natural gas or not. Thusfirms have to sink huge investments in extractionfields and international pipelines, where they facehuge fixed costs and almost zero marginal costs.In those cases, the extractor needs coverage fromthe market risk. It is often claimed that verticalintegration is needed to cover firms’ take-or-payobligations. Table 12.6 describes the main featuresof the natural gas industry in EU countriesfor three main areas of interest: access to the net-work, the unbundling of monopolized activitiesfrom the competitive ones, and the opening of thedemand side.
According to Polo and Scarpa (2003), three mainissues must be determined for implementation ofthe TPA principle: (1) the technical and commercialconditions to be set for access (access price setting),(2) how disputes about access will be solved, and(3) the kind of regulatory regime to be used.According to the authors, a key aspect of the TPA isthe institution that deals with disputes and acts as anarbitrator. In most of the EU countries, the regula-tory authority intervenes in disputes in the natural
gas sector (table 12.6). In Ireland, Luxembourg, andSpain, the Ministry of Industry is in charge of dis-pute resolution in this sector, but the authorityis unspecified for France, Greece, and Portugal.3
Finally, the national liberalization plans also differin the kind of regulation that is adopted on theTPA. The majority of countries have chosen ex anteregulation in which the regulator sets the price andtechnical conditions in advance, rather than anex post regime in which the regulator intervenesex post on the tariffs communicated by firms.4
Table 12.6 shows that demand opening, the thirdelement to create a level playing field in the naturalgas sector, has been treated rather differently acrosscountries. Germany and the United Kingdom hadalready completed their process by 2000, and inmost other countries the complete opening will bereached by 2007 at the latest. However, in someimportant countries—Denmark, France, Greece,and Portugal—a final date for the process has notbeen set. In Turkey, the process of liberalizationbegan only in 2001 with the new gas law.
To weigh the overall effectiveness of the liberal-ization plans of the EU countries for the natural gassector, Polo and Scarpa (2003) use a scoring proce-dure in which higher scores correspond to a moreadvanced solution. The authors find that the more
320 Turkey: Economic Reform and Accession to the European Union
TABLE 12.6 EU Country Data on European Natural Gas Sectors
Third Party Access Demand Opening
Access Dispute Type of Percent CompletePrice Setting Solution Regulation Unbundling Eligible Opening Score
Austria Negotiated Regulator Ex post Accounting 49 2001 10Belgium Regulator Regulator Ex ante Legal 59 2005 16Denmark Regulator Regulator Ex post Legal 30 Unspecified 11Finland Regulator Regulator Ex post Proprietary 90 2003 21France Unspecified Unspecified Ex ante Accounting 20 Unspecified 4Germany Negotiated Antitrust Ex post Accounting 100 2000 12Greece Unspecified Unspecified Ex ante Unspecified Unspecified Unspecified 2Ireland Ministry Ministry Ex ante Legal 75 2005 14Italy Regulator Regulator Ex ante Legal 65 2003 17Luxembourg Ministry Ministry Ex ante Accounting 51 2007 11Netherlands Negotiated Regulator Ex ante Accounting 45 2004 10Portugal Unspecified Unspecified Ex ante Unspecified Unspecified Unspecified 2Spain Ministry Ministry Ex ante Legal 72 2003 15Sweden Regulator Regulator Ex post Accounting 47 2006 11U.K. Regulator Regulator Ex ante Proprietary 100 1998 23
Source: Polo and Scarpa 2003.

advanced solutions have been adopted by Finland,Sweden, and the United Kingdom.
Welfare Effects
This section examines the welfare effects of Turkishaccession to the EU by considering the 1996 input-output table of the Turkish economy. The table has97 sectors. Of these, banking is sector 84; telecom-munications, sector 83; transport via railways,sector 78; land transport, sector 79; water transport,sector 80; air transport, sector 81; electricity pro-duction, transmission, and distribution, sector 69;and natural gas, sector 70.
Consider the case in which Turkey adopts andimplements the EU rules and regulations in thebanking sector. A denotes the 97 × 97 matrix ofinput coefficients. Given A, the 96 × 96 inputmatrix B is formed by deleting the 84th columnand 84th row referring to the banking sector. The84th row where the 84th column element has beendeleted is denoted by e ; p denotes the 1 × 96 pricevector of the 96 commodities, excluding the bank-ing sector; and va denotes the corresponding1 × 96 unit gross value added vector. The priceequation can then be written as
(12.1) p = pB + pbe + va
where pb denotes the price of the banking services.From this equation follows
(12.2) p = pbe(I − B)−1 + va(I − B)−1
Thus, given the price of banking services thatwill prevail in Turkey after it adopts and imple-ments the EU rules and regulations, pb, the equilib-rium prices of the other 96 commodities can bedetermined from equation 12.2, assuming thatthere is no change in the unit gross value addedvector va . Given the equilibrium price vector p, the1 × 97 price vector can be formed as π= (p pb). IfCON denotes the 96 × 1 consumption expenditurevector obtained from the 1996 input-output tableby deleting the value of consumption of the bank-ing sector and if conb denotes the value of con-sumption of banking services, the 97 × 1 consump-tion vector can be formed as
(12.3) CONS =[
CON
conb
]
Initially, all base year prices equal unity. Thevalue of the total consumption expenditure
evaluated at the base prices of 1996 can beexpressed as
(12.4) C = u CONS
where u denotes the 1 × 97 unit vector. The valueof the total consumption expenditure evaluated atthe prices that will prevail after Turkey adopts andimplements the EU rules and regulations in thebanking sector is then given by
(12.5) C∗ = πCONS
The effect on consumer welfare5 can now be calcu-lated as
(12.6) (C − C∗) × 100/C∗
By construction, the prices of all commodities inthe base year equal unity. The previous sectionrevealed that adoption of the EU rules and regula-tions by the banking sector will decrease the netinterest margin by 26.22 percent. If the value of the26.22 percent decrease is taken as the percentagechange in the price of banking services stemmingfrom adoption of the EU rules and regulations bythe banking sector, it is possible to conclude thatthe welfare of society will increase by 1.36 percentafter adoption of the EU rules and regulations bythe banking sector. The change in consumer wel-fare will amount to about €2.12 billion.6
Assuming that with the adoption of EU rulesand regulations by the telecommunications, trans-portation, and electricity sectors prices will declineby 33.5 percent in the telecommunications sector,8.9 percent in transport services, and 20.7 percentin the electricity sectors, a study similar to that inthe banking sector reveals that adoption of the EUrules and regulations by the telecommunications,transportation, and electricity sectors will cause thewelfare of society to increase in those sectors by0.59 percent, 1.01 percent, and 0.53 percent, respec-tively. The effect of the adoption of EU rules andregulations by the telecommunications, transporta-tion, and electricity sectors thus amounts, respec-tively, to increases of €915 million, €1.57 billion,and €822 million in the real incomes of consumers.
Table 12.7 reveals that the natural gas prices inTurkey are considerably higher than those in someEU countries, which, as was determined earlier,have adopted more advanced regulatory solutionsin the sector. A weighted average of naturalgas prices for the industry in Finland and the
Economic Implications of EU Accession for Turkey 321

United Kingdom demonstrates that Turkish natu-ral gas prices are 48.9 percent higher than the aver-age price in those countries. Calculation thenshows that with the adoption of EU rules and regu-lations by the natural gas sector, the welfare of soci-ety will increase by 0.08 percent. This changeamounts to a €128 million increase in the realincome of consumers.
The findings described in this section thereforereveal that Turkey will benefit from adopting EUrules and regulations in the banking, telecommuni-cations, transportation, electricity, and natural gassectors, and that liberalization within the contextof EU integration in those sectors will lead to a3.56 percent increase in real household incomes.This increase is equivalent to a change in con-sumers’ welfare of €5.56 billion. During 1996, con-sumption was 72.95 percent of GDP, and thus thepercentage change in the welfare of the society isequivalent to a 2.6 percent increase in real GDP.
Because the estimates of the price wedges causedby service barriers are the key parameters deter-mining the welfare effects of services liberalizationand liberalization in the calculations just presented,the estimates made here of tariff equivalents arecompared with estimates from other sources. Fig-ures 12.1 and 12.2 show, respectively, the telecom-munications prices for business and residential cus-tomers in selected countries. By contrast, table 12.8presents the OECD basket of international tele-phone charges during November 2001. The figures
and the table reveal that the price wedge implicit inthese figures is much larger than the figure of33.5 percent used in the calculations made here.7
Thus the estimates presented of the price wedge inthe telecommunications sector are rather conserva-tive, and the estimate of the effects of liberalizationin telecommunications services gives the lowerbound of the welfare gains derived in the sector.
A look at the nominal prices for electricity overthe period 1990–2000 in Turkey reveals that elec-tricity prices for industrial customers have fluctu-ated between $.075 and $.095 per kilowatt-hourand prices for residential customers between $.045and $.10 per kilowatt-hour. The prices for indus-trial consumers are almost exactly as high as thosefor residential consumers. Because the cost of sup-plying residential consumers is much higher thanthat of supplying industry, there seems to be cross-subsidization in favor of residential consumers.According to TEAS, the state-owned generationand transmission company, the sales prices perkilowatt-hour at the end of 1999 for industrial cus-tomers was $.0687 for high-voltage customers,$.0715 for intermediate and low-voltage customers,and in the range of $.04 per kilowatt-hour for dis-tributors. However, the cost of producing electric-ity, as noted by OECD (2002), is much larger thanis suggested by these data. The cost of purchasingadditional electricity from BOT, BOO, and transferof operating rights (TOOR) contract generatorsreaches $.11–$.12 per kilowatt-hour. Atiyas and
322 Turkey: Economic Reform and Accession to the European Union
TABLE 12.7 Retail Prices of Natural Gas and Electricity, 2000
Natural Gas Natural Gasfor Industry for Households Electricity Electricity
(US$/107 kcal, (US$/107 kcal, for Industry for HouseholdsGCV basis) GCV basis) (US¢/kWh) (US¢/kWh)
Austria .. 348.40 3.80 11.80Finland 130.70 159.50 3.90 7.80France 167.80 347.50 3.60 10.20Germany 187.90 373.40 4.10 12.10Greece 216.10 287.20 4.20 7.10Ireland 145.00 345.80 4.90 10.10Spain 175.40 491.40 4.30 11.70U.K. 104.60 292.80 5.50 10.70
Turkey 175.20 259.60 8.00 8.50
.. Negligible.Note: GCV = gross calorific value.Source: International Energy Agency 2003.

Dutz point out in chapter 7 of this volume that theaverage cost of producing electricity will furtherincrease over time as new BOT, BOO, and TOORplants begin to produce electricity. Table 12.7,which presents the electricity prices in EU coun-
tries and Turkey, reveals that the electricity prices inTurkey are considerably higher than those in theEU countries where prices are the least expensive.Thus the price wedge implicit in these figures ismuch larger than the figure of 20.7 percent used
Economic Implications of EU Accession for Turkey 323
0
1,000
3,000
500
2,000
2,500
1,500
3,500
Icelan
d
Norway
Sweden
Luxe
mbo
urg
Denm
ark
Nethe
rland
s
Finlan
d
Irelan
d
Switzer
land
Canad
a
Germ
any
Franc
e
Belgium
Austri
a
United
Sta
tes
Spain
Japa
nU.K
.
New Z
ealan
dIta
ly
Greec
e
OECD ave
rage
Austra
lia
Rep. o
f Kor
ea
Portu
gal
Hunga
ry
Czech
Rep
.
Poland
Turke
y
Slovak
Rep
.
Mex
ico
US$ PPP
Fixed Usage
FIGURE 12.1 OECD Composite Telecommunications Business Basket, November 2001(US$ PPP)
Note: VAT is excluded; calls to mobile networks and international calls are included; PPP = purchasing powerparity.Source: OECD.
0
400
1,400
1,200
200
800
1,000
600
Icelan
d
Sweden
Denm
ark
Norway
Luxe
mbo
urg
Nethe
rland
s
Switzer
land
Germ
any
U.K.
Irelan
d
Finlan
d
Canad
a
Franc
e
Belgium
Austri
a
Japa
n
United
Sta
tes
Spain
Austra
lia
New Z
ealan
dIta
ly
OECD ave
rage
Rep. o
f Kor
ea
Greec
e
Portu
gal
Czech
Rep
.
Mex
ico
Hunga
ry
Turke
y
Slovak
Rep
.
Poland
US$ PPP
Fixed Usage
FIGURE 12.2 OECD Composite Telecommunications Residential Basket, November 2001(US$ PPP)
Note: VAT is included; calls to mobile networks and international calls are included.Source: OECD.

here in calculations, and the estimate made here ofthe price wedge in the electricity sector is thusrather conservative.
Table 12.9 shows the tariff equivalents of tradebarriers in traded services and network industriesestimated by different authors for Turkey. Researchinto the measurement of services trade barriers isfairly recent, and very few studies cover Turkey. Onesuch study was conducted by Hoekman (1996), whoused information from the country schedules of theGeneral Agreement on Trade in Services (GATS).Hoekman’s estimates for Turkey are shown in the
second column of table 12.9. According to the fig-ures, the tariff equivalent in the banking sector is9.2 percent, in the basic telecommunications sector92.9 percent, and in the value added telecommuni-cations sector 42.9 percent. But these estimateshave, as Hoekman notes, certain drawbacks.8 First,the method assumes that the absence of positivecountry commitments in the GATS schedules canbe interpreted as indicating the presence of restric-tions. Second, the different types of restrictions aregiven equal weight and are not distinguishedaccording to their economic impact. Finally, the
324 Turkey: Economic Reform and Accession to the European Union
TABLE 12.8 OECD Basket of International Telephone Charges, November 2001Hoekman Francois (1999)Current Study (1996) and Hoekman (2000)
Financial services 9.2 46.3Banking 31.54
Telecommunications 33.53Basic telecommunications 92.9Value added telecommunications 42.9
Source: The author.
TABLE 12.9 Estimated Tariff Equivalents in Traded Services and Network Industries
TABLE 12.8 OECD Basket of International Telephone Charges, November 2001Business, Excluding Tax Residential, Including Tax
(US$) (US$ PPP) (US$) (US$ PPP)
Austria 0.77 0.83 1.06 1.15Belgium 0.49 0.56 0.57 0.66Denmark 0.50 0.46 0.80 0.73Finland 0.78 0.74 1.00 0.95France 0.34 0.37 0.66 0.73Germany 0.42 0.45 0.62 0.67Greece 0.77 1.12 1.17 1.69Ireland 0.51 0.55 0.70 0.76Italy 0.90 1.16 1.32 1.69Luxembourg 0.37 0.41 0.49 0.55Netherlands 0.30 0.35 0.46 0.53Portugal 0.71 1.08 0.96 1.46Spain 0.78 1.01 1.12 1.46Sweden 0.34 0.34 0.53 0.54U.K. 1.18 1.16 1.61 1.58
Turkey 1.51 3.98 1.89 4.98
Note: PPP = purchasing power parity.Source: OECD 2002.
TABLE 12.8 OECD Basket of International Telephone Charges, November 2001
method assumes that market access restrictions arethe only type of barriers to trade in services.
Francois (1999) fits a gravity model to bilateraltrade in services between the United States and itsmajor trading partners, taking Hong Kong (China)and Singapore as free trade benchmarks. The inde-pendent variables are per capita income, grossdomestic product, and a Western Hemispheredummy variable. He interprets the differencesbetween actual and predicted imports as indicativeof the size of barriers to trade. These differencesbetween actual and predicted imports are thennormalized relative to the free trade benchmarks.These quantity measures also are converted intotariff equivalents by assuming a specific value ofdemand elasticity. Francois’s estimate for Turkey,reported in Hoekman (2000) and shown in thethird column of table 12.9, is 46.3 percent in finan-cial services. Finally, a comparison of the tariffequivalents for Tunisian financial services andtelecommunications sectors used by Konan andMaskus (2002) with the estimates made here of tar-iff equivalents reveals that the estimates used in thisstudy are rather reasonable.
Economic Challenges
This section considers issues related to Turkey’smembership in the European Economic and Mon-etary Union (EMU), labor markets, compliancewith EU environmental directives, and state aids.
Membership in the European Economic and Monetary Union
Participation in the European Economic and Mon-etary Union is a must for Turkey, because the acquisis expected to be adopted in full, including EMUparticipation, as well as, in due time, all the requi-site “Maastricht criteria” for Euro Area integration.Turkey is not expected to adopt the euro immedi-ately upon accession. According to Article 122 ofthe Treaty Establishing the European Community,upon accession Turkey will be treated as a “countrywith a derogation” until it fulfills the convergencecriteria, which involve conditions on price stability,interest rate convergence, the budget deficit, thegovernment debt, and exchange rate stability.
As emphasized by the European Commission(2003), during the preaccession period Turkey
must adopt the required EMU legislation in orderto acquire the status of “Member State with a dero-gation” for adoption of the euro. In particular,Turkey needs to take the relevant steps to liberalizecapital movements completely, prohibit the privi-leged access of financial institutions to the publicsector, and attain the political and economicindependence of the monetary authorities. Uponaccession, the common macroeconomic policyframework will become more constraining, withstrong reinforcement of fiscal discipline and theintegration of other economic policies. Budgetarypolicy and outcomes will become subject to theexcessive deficit procedure and the nonpunitiveparts of the Stability and Growth Pact (SGP). TheMaastricht Treaty specifies that the country willhave to progress toward fulfillment of the Maas-tricht criteria, and under the conditions of the SGPit will have to endeavor to avoid excessive deficits.Furthermore, exchange rate policy will become amatter of common interest. Finally, adoption of theeuro will require Turkey to become part of the sin-gle, stability-oriented monetary policy and of theensuing single exchange rate policy. Furthermore,Turkey will become subject to the sanction parts ofthe SGP. Once Turkey adopts the euro, it willreplace its domestic currency with the euro at anirrevocably fixed exchange rate, transfer the bulk ofits reserves to the European Central Bank, andagree to be bound by the SGP.
In addition to the legislative changes justdescribed and thorough implementation of this leg-islation, Turkey will face the problem of attainingover time sustainable development while simulta-neously satisfying the Maastricht criteria. The coun-try realizes that, in the long run, price stability andfiscal discipline create the best conditions for sus-tained, robust economic growth. But the current sit-uation is problematic. Turkey is not satisfying theMaastricht conditions. In 2003 the inflation rate was25.3 percent compared with 2.7 percent, the refer-ence value for inflation in the EU; public sector bor-rowing requirements as a percentage of GDP were8.8 percent compared with 3 percent, the referencevalue of the budget deficit in the EU; the debt-to-GDP ratio was 80.3 percent compared with 60 per-cent, the reference value of the debt-to-GDP ratio inthe EU; and the average interest rate was 28.5 per-cent compared with 6.2 percent, the reference valueof long-term interest rates in the EU. But as of the
Economic Implications of EU Accession for Turkey 325

end of 2004, the annual inflation rate had beenreduced to 9.2 percent, and the average interest rateon government debt during December 2004 to19.8 percent. During 2004, the growth rate of GDPis expected to be more than 8 percent, and theunemployment rate as of the second quarter of 2004had been reduced to 9.3 percent. Although these areall positive developments, the annual currentaccount deficit during 2004 amounted to $15.6 bil-lion, and the annual current account deficit-to-GDPratio for 2004 is expected to exceed 5 percent.
The challenge facing Turkey is how to movefrom the current state of affairs to a state in whichthe Maastricht criteria are satisfied. According toTogan and Ersel in chapter 1 of this volume, the fol-lowing issues are facing Turkey:
• Although the country has reduced the inflationrate considerably through strict implementationof the International Monetary Fund (IMF) eco-nomic program, the reduction was achievedpartially through decreases in the cost ofimported goods stemming from real apprecia-tion of the Turkish lira. But reducing the infla-tion rate through real appreciation of the cur-rency is not sustainable in the long run, becausesuch a measure will lead to problems of sustain-ability of the current account.
• Although the country has reduced the debt-to-GDP ratio substantially during the last few yearsby running primary surpluses amounting to6.3 percent, such as during 2003, the reductionwas achieved partially through real appreciationof the currency. However, reducing the debt-to-GDP ratio by this means is not sustainable in thelong run.
• Because the debt-to-GDP ratio can be reducedover time by achieving surpluses of govern-ment revenues over noninterest expendituresamounting to at least 6.5 percent of GDP, thegovernment will be constrained in its use of fis-cal policy to decrease the unemployment rate inthe economy, which in 2004 was still 9.3 percent.The constraint may have political implications.
• A close look at the issues related to the sustain-ability of the current account reveals that thechoice of exchange rate policy during the preac-cession period will be of prime importance forTurkey. The policy of real exchange rate appreci-ation pursued during the last two years is notsustainable in the long run under rather realistic
values of foreign real interest rates. Sustainabil-ity of the current account requires depreciationof the real exchange rate over time to its long-run equilibrium value.
Labor Markets
In chapter 9 of this volume, Taymaz and Özlerdescribe the flexibility of the Turkish labor market,which stems primarily from the fact that the labormarket is not homogeneous. It has different wage-setting mechanisms in its formal and informal sec-tors. The informal sector is largely free from mosttypes of labor regulation and pays few taxes andrelated charges. Activities in this sector rely mostlyon the provision of labor services without formalemployment contracts. Job insecurity is pervasive,and workers receive very few benefits from theiremployers. By contrast, the formal sector observeslabor regulations and pays all taxes and relatedcharges such as social security contributions andpayments to various funds. According to variousstudies, the share of the informal sector of totalemployment is about 60 percent.9 The reasons forthe relatively high share of the informal sector intotal employment are (1) the very high tax rates onwage income, the high tax-related charges, and thesubstantial payments to various funds that must bepaid by those working in the formal sector to com-ply with the social security law and the laws regulat-ing the taxation of personal incomes; (2) the rela-tively high firing costs imposed by the labor lawand the stringency of the various clauses of thelabor law; and (3) the lack of enforcement mecha-nisms for the respective laws in the economy.
The population of Turkey increases on averageat a rate of 1 million persons per year, and thus thecountry must continually create new jobs toaccommodate this growth. In addition, Turkeymust create jobs for those unemployed and mustincrease the labor force participation rate from itslow level of 48.3 percent. In the past, Turkey suc-cessfully managed the unemployment problemthrough its large, flexible informal sector wherewages are free to equilibrate demand and supplyand through labor migration from Turkey.
With its accession to the EU, Turkey will have toenforce the rule of law uniformly in the country. Itcan no longer tolerate the lack of enforcementmechanisms for different laws and regulations inthe economy. Yet such a shift will have to occur
326 Turkey: Economic Reform and Accession to the European Union

without increasing Turkey’s unemployment rate.Taymaz and Özler estimate that when all manufac-turing firms in the informal sector begin to paytaxes and social security contributions at the samerates as in the formal sector and when informalsector firms lose half of their market sharesbecause of the change, employment in the manu-facturing sector will decline by 8.9 percent. Thusabout 300,000 jobs will be lost. But the effect of thepolicy change on employment—when all informalsector firms in all sectors of the economy begin topay taxes and social security contributions at thesame rates as in the formal sector—will actually bemuch more drastic, because the effects on employ-ment in the agricultural and services sectors mustbe considered as well. In the end, the number ofjobs lost will far exceed the 300,000 estimated byTaymaz and Özler. Thus to avoid an increase inunemployment the country must introduce com-prehensive labor market reform. Such a reform willprobably entail substantial decreases in the taxrates on wage income, tax-related charges and pay-ments to various funds, decreases in the firingcosts, and changes in various clauses of the laborlaw so they are less stringent.
Complying with EU Environmental Legislation
To join the EU, Turkey must adopt and implementthe entire body of EU legislation and standards onenvironmental protection. Bringing its environ-mental protection system, infrastructure, and stan-dards up to Western European levels will require, inturn, substantial investments by the public and pri-vate sectors as well as changes in regulations andsupporting institutions.
Within the EU regulations on wastewater collec-tion and treatment, the urban wastewater directive(91/271/EEC) requires all urban areas with a totalwastewater discharge of 2,000 population equiva-lent to be connected to the sewer system, and thedischarges of sewers must receive at least secondarytreatment. The directive allows exceptions fortowns with a population of less than 10,000 whensewers would produce no environmental benefit orwould involve excessive cost.
In 1997 the population of Turkey was 62.87 mil-lion. Of this number, 13.75 million were living inareas with a population of 2,000 or less, 49.12 mil-lion in areas with more than 2,000, 22.57 million inareas with 10,000 and less, and 40.3 million in areas
with more than 10,000. In 1997 there were 2,835municipalities with a total population of 48.2 mil-lion; 7.3 million people were living in ruralmunicipalities. According to the State PlanningOrganization, 72 percent of the people living inmunicipalities were not connected to sewage treat-ment. For an additional 23 percent of population,sewer systems were under construction. Upon thecompletion of these systems, 51 percent of the pop-ulation living in municipalities (24.5 million out of48.2 million) will be connected to sewer systems,leaving 23.7 million with no connection. Two per-cent of municipalities have wastewater treatmentfacilities and 14 percent of people living in villageshave a sewer connection with septic tanks, but11.8 million people have no sewer connection.
The costs of meeting sewer needs will depend onthree parameters: (1) the proportion of the ruralpopulation living in towns that would be classifiedas agglomerations with a population of more than2,000 population equivalent; (2) the proportion oftowns with between 2,000 and 10,000 populationthat will be exempted from constructing sewer sys-tems on the grounds of no environmental benefitor excessive costs; and (3) the proportion of ruralpopulation that must have sewers. Once theEuropean Commission and Turkey agree on theseparameters during the negotiations, the cost ofcompliance with the EU directive would be deter-mined. The investment cost of complying with thedirective has been roughly estimated at more than$10 billion. Adding the additional operations,maintenance, and replacement costs wouldincrease this cost even further.
Environmental protection will therefore presentchallenges for Turkey. The costs will be substantialwhen, in addition to the costs of complying withEU regulations on wastewater collection andtreatment, the costs of complying with those ondrinking water, industrial pollution, dangerouschemicals, fuel standards, air quality, and wastemanagement are considered. In chapter 11 of thisvolume, Markandya estimates that the total costwould be between €28 billion and €49 billion.But he notes that because the outlay will be over along period (about 17 years), the annual amountwill be more manageable. Furthermore, he findsthat annual investments would amount to around€2 billion to €3 billion in the “fast reform”(low-cost) case and €3 billion to €5 billion in theslow reform (high-cost) case. In the initial years,
Economic Implications of EU Accession for Turkey 327

this investment would amount to 1–1.5 percent ofGDP in the low-cost case and 1.5–2.5 percent of GDPin the high-cost case. The extra annual operatingcosts also incurred would range from €5 to €8 bil-lion. Markandya reports that OECD has estimatedTurkey’s capital spending on the environment atabout 0.5 percent of GDP. Thus with accession, thisspending would have to double, or more likelyincrease by a factor of three or four. In addition, amuch higher level of current spending would berequired. These costs, although substantial by anystandards, could be considered the price for joiningthe EU. One could also argue that these investmentswould have been made in any case by Turkey. Onlythe timing of the investments would be different,because EU directives may not correspond toTurkey’s priorities at this stage of its development.
State Aid
During the 1980s, Turkey used three tools of indus-trial policy intensively: investment incentives,export incentives, and policy on state-owned enter-prises. In each case, the government tried to obtaina preferred allocation of resources through the useof subsidies. The investment incentives, regulatedby laws and decrees, have been directed towardreducing the cost of investment, reducing the needfor external financing, and increasing profitability.On the export side, the government’s use of varioustypes of export incentives during the 1980s in-creased the profitability of export activities. As forthe policy on state-owned enterprises in Turkey, theTurkish public enterprise sector has been and still isvery large. The state-owned enterprises have ingeneral exhibited poor economic performancebecause of the soft-budget constraints they havefaced. Public enterprises are not subject to com-mercial code and, as such, they escape bankruptcylaws. Moreover, they receive subsidies from the gov-ernment in the form of direct transfers, equityinjections, and debt consolidation.
Recently, Turkey eliminated most of the invest-ment and export incentives. Within this context,General Agreement on Tariffs and Trade (GATT)legal subsidies (e.g., research and developmentsubsidies and subsidies to facilitate the adaptationof plants to new environmental regulations) havebeen introduced. Export subsidies in Turkey arerestricted to those given to research and develop-
ment activities and environmental projects and toexport promotion activities. Although considerableprogress has been achieved in the fields of invest-ment and export incentives, similar progress hasnot been possible for public enterprises. Privatiza-tion has become a prominent part of the Turkishstructural adjustment program since 1983, but itdid not gain momentum until very recently. Turkeyrecognizes that it will have to stop subsidizing itspublic enterprises at the prevailing rates and that itwill have to take steps to align its state aid policieswith those of the EU, to apply the same competi-tion policies to all firms whether private or public,and to privatize public enterprises.10
Growth Effects
The preceding discussion of the welfare effects ofaccession reveals that Turkey’s integration withinthe EU will remove the distortions in the country’sprice system, which, in turn, will boost allocativeefficiency within the economy. The heightened effi-ciency also will make the country a better place inwhich to invest. Investment will therefore increase,as will foreign direct investment. Thus the allo-cative efficiency gains from integration will beboosted by induced capital formation. Wheninvestment rises above its normal level, the Turkisheconomy will experience a growth effect. All thismeans improved material well-being for theTurkish people in the long term.
The growth effects of accession will be studiedhere by first forecasting the volume of tradebetween Turkey and the EU15, under the assump-tion that it will reach the same level of intensity asthe present trade between the EU member states.The forecast is then used to study the growth effectsof accession.
The forecast of the volume of trade betweenTurkey and the EU is based on estimation of a grav-ity function for trade within the EU15. The gravityfunction, which has been used to explain the vol-ume of bilateral international trade since the 1960s,has proved remarkably successful. It postulates thatthe volume of trade between a pair of countries is afunction of (1) the size of the trading partners,measured by GDP, population, or geographic area;(2) their income level or capital abundance,measured by GDP per capita; and (3) trade costs,measured by a variety of factors such as tariffsand other administratively imposed trade barriers,
328 Turkey: Economic Reform and Accession to the European Union

geographic distance, common borders, commonlanguage, or common legal systems. The follow-ing standard version of the gravity function wasestimated:
(12.7) ln [(exports from country i to country j+ exports from country j to country i)/2]
= constant + β1 ln (GDP of country i× GDP of country j) + β2 ln (GDP percapita of country i × GDP per capitaof country j) + β3 ln (geographicdistance) + error term.
The dependent variable in the gravity equationis the logarithmic average of bilateral exports. It isexplained by the logarithmic product of GDP; thevolume of trade is simply assumed to rise in pro-portion to the combined economic size of the tradepartners. GDP per capita can be thought of as ameasure of product differentiation and specializa-tion. The higher the per capita income, the moredifferentiated are taste and production and thelarger is the volume of trade based on product dif-ferentiation and increasing returns to scale. A highper capita income is also an indication of abundantphysical and human capital relative to manuallabor. Thus the per capita variable should serve tocapture both the intraindustry trade produced byproduct differentiation and the increasing returnsto scale and interindustry trade produced by differ-ences in factor endowments. Trade costs arecontrolled by the inclusion of geographic distance,which is an indicator of transportation costs, but
also of the costs of cultural differences, which tendto increase with geographic distance.
The estimates of the gravity equation are pre-sented in table 12.10. The equation explains morethan 90 percent of the variation in the data. All coef-ficients are estimated with a very high level of statis-tical significance (less than 1 percent) and have theexpected sign, with one exception. The product ofreal per capita GDP is found to have an unexpectednegative effect on the volume of trade. The estimateof the gravity equation is then used to make fore-casts of bilateral trade for Turkey with the EU15.The forecasted value of Turkish–EU15 trade for2000 is $25.75 billion, which is almost 25.2 percenthigher than the actual average value of $18.55 bil-lion for the period 1999–2001. For that period, theaverage of Turkish exports to the EU was $14.99 bil-lion and of imports from the EU $22.1 billion.
Next, it is assumed that Turkey eventually willhave a share of EU trade to total trade that is equalto that of the four largest EU countries—58 per-cent. Then, the total trade of Turkey will increase to$44.4 billion. When this value is divided by theaverage value of GDP for the period 1999–2001, itproduces a ratio between the average of exports andimports to GDP of 25.2 percent. The actual value oftotal trade to GDP over the 1999–2001 period is, bycontrast, 20.67 percent. Noting the assertion byFrankel and Rose (2002) that every percent increasein the country’s overall trade relative to GDP raisesincome per capita by at least one-third of a percent,one then finds that, with EU accession, per capitaincome in Turkey will increase by about 1.5 percent.
Conclusion
To join the EU, Turkey must attain macroeconomicstability, adopt the EU’s Common Agricultural Pol-icy, and liberalize its services and also its networkindustries. Integration will be beneficial for Turkey,because it will remove the distortions in the pricesystem, thereby boosting allocative efficiency withinthe economy, which, in turn, will make the country abetter place to invest. Furthermore, with accessionTurkey will be eligible for EU structural funds. Theincrease in infrastructural investments will con-tribute to economic growth in Turkey. Turkey willalso reap benefits from monetary integration.
The welfare gains derived by Turkey from inte-gration will, however, have a price. The price will be
Economic Implications of EU Accession for Turkey 329
TABLE 12.10 Gravity Estimates for Intra-EU15 Trade
Estimate
Constant −3.884133(−3.193833)
ln real product GDP 0.81502652.1816
ln real product GDP per capita −0.145238(−2.705978)
ln distance −0.901144(−21.50092)
R-squared 0.622767
Source: The author.

the adjustment costs associated with the attainmentof macroeconomic stability, adoption of the CAP,adoption of the EU’s labor market rules and regula-tions, and compliance with EU environmentaldirectives.
Notes
1. All dollar amounts are U.S. dollars unless otherwiseindicated.
2. Cabotage refers to the carriage of freight within a countryor between two countries by a carrier that is from neithercountry.
3. Polo and Scarpa (2003) consider it more appropriate thatan independent regulatory authority devoted to the liberaliza-tion of the industry fill the delicate role of arbitrator rather thana ministry, which is typically responsible for a broader range ofpolitical objectives.
4. Although in both cases the regulator has the final word onthe access conditions, Polo and Scarpa (2003) argue that the exante regime, requiring the regulator to act as a first mover, forcesit to reach a better solution.
5. This approach determines the equivalent variation in con-sumer income.
6. When considering the welfare effects of integration, Iabstract from explicit consideration of problems of implemen-tation and assume that once the acquis is adopted liberalizationof the sector will be achieved. This is a simplification introducedin the analysis.
7. The implicit price wedge is derived from the relation p =p∗ (1 + t), where p refers to the Turkish price p∗ , the best prac-tice price in the EU, and t is the price wedge parameter.
8. See Stern (2002) and Whalley (2004) for further discus-sion of the state of knowledge on barriers to trade in servicesand the robustness of existing empirical research in this area.
9. Taymaz and Özler report that the share of the informalsector in manufacturing is 40 percent. Its share is much higher,however, in the agricultural and services sectors.
10. Turkish competition law is silent on the subject of publicundertakings. It does not contain a clause like Article 86 (exArticle 90) of the Treaty Establishing the European Community,which explicitly brings public undertakings within the scope ofcompetition policy. Recently, state aid in Turkey has taken theform of injections to private banks under the management ofSavings Deposit Insurance Fund (SDIF). These banks are largelythose hit by capital losses during the November 2000 and Febru-ary 2001 crises. The capital losses stemmed from the sharpdecline in the market value of government securities holdingsand the sharp increase in the foreign exchange rate. According toEU regulations, state aid to the banking sector is subject to thesame conditions as any other state aid and as such it should beavoided.
References
Doove, S., O. Gabbitas, D. Nguyen-Hong, and J. Owen. 2001.“Price Effects of Regulation: International Air PassengerTransport, Telecommunications and Electricity Supply.”Productivity Commission Staff Research Paper, ProductivityCommission, Canberra.
European Commission. 2003. 2003 Regular Report on Turkey’sProgress towards Accession. Brussels: EC.
Francois, J. 1999. “Estimates to Barriers to Trade in Services.”Erasmus University, Rotterdam.
Frankel, J., and A. Rose. 2002.“An Estimate of the Effect of Com-mon Currencies on Trade and Income.” Quarterly Journal ofEconomics 117: 437–66.
Harrison, G. W., T. F. Rutherford, and D. G. Tarr. 1997. “Eco-nomic Implications for Turkey of a Customs Union with theEuropean Union.” European Economic Review 41: 861–70.
Hoekman, B. 1996. “Assessing the General Agreement on Tradein Services.” In The Uruguay Round and the DevelopingEconomies, ed. W. Martin and L. A. Winters. Cambridge:Cambridge University Press.
————. 2000. “The Next Round of Services Negotiations:Identifying Priorities and Options.” Federal Reserve Bank ofSt. Louis Review 82: 31–47.
International Energy Agency. 2003. Energy Prices & Taxes: Quar-terly Statistics Fourth Quarter 2002. Paris: IEA.
International Telecommunications Union. 1998. Telecommuni-cations Reform. Geneva: ITU.
Kalirajan, K., G. McGuire, D. Nguyen-Hong, and M. Schuele.2000. “The Price Impact of Restrictions on Banking Ser-vices.” In Impediments to Trade in Services: Measurement andPolicy Implications, ed. C. Findlay and T. Warren. London:Routledge.
Konan, D. E., and K. E. Maskus. 2004. “Quantifying the Impactof Services Liberalization in a Developing Country.” Work-ing Paper No. 3193, World Bank, Washington, DC.
McGuire, G. 1998. “Australia’s Restrictions on Trade in FinancialServices.” Productivity Commission Staff Research Paper,Australian Productivity Commission, Melbourne.
McGuire, G., and M. Schuele. 2000. “Restrictiveness of Interna-tional Trade in Banking Services.” In Impediments to Trade inServices: Measurement and Policy Implications, ed. C. Findlayand T. Warren. London: Routledge.
OECD (Organisation for Economic Co-operation and Develop-ment). 2002. Turkey: Crucial Support for Economic Recovery.OECD Reviews of Regulatory Reform. Paris: OECD.
Polo, M., and C. Scarpa. 2003. “The Liberalization of EnergyMarkets in Europe and Italy.” Paper presented at the 4thMediterranean Social and Political Research Meeting,Florence, March 19–23.
Steiner, F. 2000. “Regulation, Industry Structure and Perfor-mance in the Electricity Supply Industry.” EconomicsDepartment Working Paper No. 238, Organisation for Eco-nomic Co-operation and Development, Paris.
Stern, Robert. 2002. “Quantifying Barriers to Trade in Services.”In Development, Trade and the WTO: A Handbook, ed. B.Hoekman, A. Mattoo, and P. English. Washington, DC:World Bank.
Warren, T. 2000a. “The Identification of Impediments to Tradeand Investment in Telecommunications Services.” InImpediments to Trade in Services: Measurement and PolicyImplications, ed. C. Findlay and T. Warren. London:Routledge.
————. 2000b. “The Impact on Output of Impedimentsto Trade and Investment in Telecommunications Services.”In Impediments to Trade in Services: Measurement andPolicy Implications, ed. C. Findlay and T. Warren. London:Routledge.
Whalley, John. 2004. “Assessing the Benefits to DevelopingCountries of Liberalisation in Services Trade.” World Econ-omy 27: 1223–53.
330 Turkey: Economic Reform and Accession to the European Union

Up to October 31, 2004, the pre–Treaty of Nicerules apply—that is, qualified majority voting withweighted votes and the old majority threshold of71 percent to win. The number of votes for theincumbent 15 are unchanged; those for the 10 new-comers are a simple interpolation of EU153 votes asspecified in the Accession Treaty.
From November 1, 2004, to October 31, 2009, theNice Treaty rules apply (as per the “Draft CouncilDecision relating to the implementation of ArticleI-24”). The Nice Treaty rules maintain the basic“qualified majority voting” framework, but add twoextra criteria for the number of yes voters and thepopulation they represent. Specifically, the votethreshold is 72.2 percent of Council votes (232 of321 votes); the member threshold is 50 percent ofmembers (13 members); and the populationthreshold is 62 percent of the EU population.4
As of November 1, 2009, the ConstitutionalTreaty rules apply, and thus weighted voting is outand a double majority is in. A winning coalitionmust represent at least 55 percent of EU membersand 65 percent of the EU population. A last-minutesummit compromise inserted the requirement thatat least 15 members vote yes, but this compromisewas irrelevant; 15 of 25 members is 60 percent andthus greater than 55 percent. By the time these rulestake effect, however, the EU should have 27members, and 55 percent of 27 is 15 (Bulgariaand Romania are tentatively slated for membershipin 2007). The 15-member rule will thereforebe redundant when it takes effect. Turkey’s and
The Treaty of Nice in 2001 and the ConstitutionalTreaty in 2004 radically reformed the voting rulesof the Council of the European Union (also knownas the Council of Ministers).1 The ConstitutionalTreaty rules were accepted politically at the Brusselssummit in June 2004. The Nice rules went intoeffect in November 2004. Implementation of thechanges was postponed by five years and made con-ditional on ratification of the constitution by all 25member states of the European Union (EU). Thenext EU enlargement (Bulgaria and Romania) istentatively scheduled for 2007. Thus Bulgaria andRomania will enter under the current Nice Treatyrules, but future new members are likely to joinunder the rules of the Constitutional Treaty.
This chapter evaluates the impact of Turkey’smembership on EU voting—specifically, decision-making efficiency and the distribution of power inthe EU’s leading decision-making body, the Councilof Ministers. The chapter compares two alternativeCouncil voting rules: those accepted in the Treaty ofNice and implemented by the Accession Treaty forthe 10 entrants in 2004 and the rules laid down inthe Constitutional Treaty.2
Council of Ministers VotingReforms
The Constitutional Treaty explicitly sets out twosets of voting procedures for the Council of Minis-ters and implicitly recognizes the current systemimplemented by the Accession Treaty (Article 24).
331
13The Impact of
Turkey’s Membershipon EU Voting
Richard Baldwin and Mika Widgrén

Croatia’s membership will, in any case, materializeafter that date.
To enter into force, the Constitutional Treatyrules must be ratified by all member states. The fall-back position is the Nice Treaty rules, which meansthat Turkey and Croatia may enter the EU underthose rules. Therefore, what follows is an evaluationof these two rules for the EU25 and EU29. It com-pares especially the impact of Turkey’s membershipon the countries of the EU25 that have the mostsubstantial say in the ratification process of theconstitution.
Tools of Assessment
“Capacity to act” and “decision-making efficiency”are slippery concepts. However, one quantitativetool in voting game theory will help to achieve pre-cision. Passage probability gauges how likely it isthat the Council would approve a randomlyselected issue—random in the sense that each EUmember would be equally likely to vote for oragainst it. The best way to describe this measure isto explain how it is calculated.
First, the researcher, with the help of a com-puter, calculates all possible coalitions among EUmembers—that is, every possible combination ofyes and no votes by EU members (134 millioncoalitions are possible in the EU27). Second, eachcoalition is evaluated to determine whether it is awinning coalition under the Nice Treaty votingsystem. This process is carried out using eachmember’s actual weight for three criteria (votes,members, and population) and the three thresh-olds. Passage probability is, then, the likelihood thata random proposal would attract a winningcoalition, assuming all coalitions are equally likely(random in the sense that member states do notknow what their stance would be). Admittedly,passage probability is a crude measure, but it isobjective and precise, and its strengths and short-comings are clear.
Even if the exact passage probability is meaning-less (the European Commission does not put forthrandom proposals), figure 13.1 reveals that the NiceTreaty fails on efficiency grounds, because itimplies a level of efficiency that is far, far below thatof the EU15. Indeed, the Nice Treaty reformsactually make matters worse. Admitting 12 new
members without any reforms would cut thepassage probability to 2.5 percent—a third of itsalready low level. With the Nice Treaty reforms, thefigure drops even further, to 2.1 percent. The mainsource of the lower efficiency is the high thresholdof the Nice Treaty rules for Council votes. An evencruder but more transparent efficiency-measuringtool—blocking-minority analysis—confirms theseefficiency findings.
No perfect measure of power exists, but evenimperfect measures are useful when consideringcomplex voting rules, because a voting scheme’spolitical acceptability turns almost completely onits power implications. The measures used here—the normalized Banzhaf index (NBI) and theShapley-Shubik index (SSI)—gauge how likely it isthat a nation finds itself in a position to “break” awinning coalition on a randomly selected issue.5
The NBI assumes that each possible coalition hasthe same probability of occurrence. Thus all coali-tions are equally likely to be winning ones, andpower is measured simply by calculating the scoreof breaking positions for each player. A relativemeasure of power is then obtained by dividing thisscore by the total of all of scores. On particularissues, some countries may be much more powerful
332 Turkey: Economic Reform and Accession to the European Union
0
5
10
15
20
25
EU6 EU29EU27EU25EU15EU12EU10EU9
Passage probability
HistoricalStatus quo: May 04 to Nov. 04Nice rules: Nov. 04 to Nov. 09CT rules: Nov. 09 onward
FIGURE 13.1 Passage Probabilities:European Council, 1957–2004,and after Entry of Bulgaria,Romania, Croatia, and Turkey
Note: Passage probability measures the likelihood thata randomly selected issue would pass in the Councilof Ministers.Source: Authors’ calculations.

or much less powerful than others, especially if theyare part of a like-minded group (see Baldwin andothers 2001 for details and simple numerical exam-ples), but the NBI has recently proved its worth,especially as an unbribable tool in assessing anddesigning voting rules.
What follows is a simple example of how theNBI works. Consider a three-person voting body,such as the Council of Ministers, in which the vot-ers are labeled A, B, and C. Suppose that A has fourvotes, B has two votes, and C has one vote, for atotal of seven votes. It is assumed that five votes areneeded to pass proposals. The three winning coali-tions are then
AB AC ABC
where underlining indicates the actors able to“break” a winning coalition. In this situation, A hasthree breaking positions, B has two, and C only one,for a total of six breaking positions. Thus the NBIof A is 1/2, whereas the NBIs of B and C are 1/3 and1/6, respectively.
The SSI tries to capture a different abstractvoting model. It assumes that voters have differentintensities in terms of accepting or rejecting aproposal. Suppose that these intensities can beexpressed as a continuum that extends between theextremes of more spending and less spending. Forexample, when the issue is the support for hillsidefarmers, A may be the most reluctant to increasespending, and B may be the second most reluctant,leaving C as the most favorably disposed towardincreasing support for this purpose. On anotherday, the issue might be the inclusion of reindeermeat in the price support mechanism of theCommon Agricultural Policy (CAP). This time, adifferent order of preferences might emerge.
In general, given a large enough number ofissues, all preference orders of A, B, and C are equallylikely. In the example used earlier, six orderings arepossible:
ABC ACB BAC BCA CAB CBA
where the critical voter is underlined. A criticalvoter exerts the power of being able to break a win-ning coalition. In the first order of ABC, B canbreak the winning coalition AB. Voter A favorsspending more on this issue than does B. Therefore,
A is not critical. Should voter A try to break thewinning coalition AB by voting against spending,voter B would have already broken that coalitionbecause B is less eagerly in favor of spending. In theexample, voter A has four pivotal positions,and voters B and C have one each. In relativeterms, winning probabilities (“power”) of 2/3 areobtained for A and 1/6 for both B and C. If SSI is ameaningful estimate of power and if power politicsis able to explain EU budget, then these fractionsshould represent the budget shares of A, B, and C,respectively.
Clearly, these measures of power do not providea detailed description of real-world voting proce-dures. For example, they lack all the strategicaspects, such as who makes the proposal to be votedon or the sequence of moves. They both contain,however, some information on voters’ preferences,understood as the intensities of holding a favorableposition. The measures also consider all possibleorderings of intensities (SSI) or presume the equallikelihood of all coalitions (NBI), and so they repre-sent a very long-term concept. For a general evalua-tion of voting rules, this is a desirable property.
The example just described demonstrates thatthe NBI and SSI can have very different values.Which one should then be chosen to assessdecision-making power? The answer is not clear,but a rough distinction can be made between thetwo measures. If one is interested in voting rules assuch, the NBI is more advantageous. If one is moreinterested in decision making and bargainingunder certain rules, knowing that actors communi-cate, then the SSI is a far more suitable tool.6
Impact of Turkey’s Membershipon EU Voting
Turkey’s accession to the EU would haveimplications for EU decision making. As a largecountry, Turkey would play a relatively bigger rolein the EU than many other entrants. To what extentwill accession change the balance of power?
Implications of Turkey’s Membership for EU’sCapacity to Act
Turkey’s membership would have only moderateimplications for the passage probabilities—see
The Impact of Turkey’s Membership on EU Voting 333

figure 13.1. This finding is not surprising, becausemoving from 27 members to 29 members doesnot change much. Although the addition ofCroatia increases the number of small nations inthe EU, Turkey’s large population means that effi-ciency suffers little. (Efficiency, if not legitimacy,tends to be higher when a large share of power isin the hands of just a few nations.) The votethresholds used in calculations of passage proba-bilities are extrapolations of the current NiceTreaty/Accession Treaty threshold. In EU29, it is276 out of a total of 381 votes, plus the two addi-tional criteria: at least 15 member states and62 percent of population. In EU27, it is 250 out ofa total of 345 votes, plus the two additional
criteria—at least 14 member states and 62 percentof population.
The Nice Treaty rules—which are essentiallyunworkable in an EU27—become even less viablein an EU29. The same does not hold for theConstitutional Treaty voting rules. The passageprobability jumps drastically from the low levels ofthe Nice Treaty rules up to the level of the EU12and even higher. Surprisingly, under the Constitu-tional Treaty rules the EU’s ability to act improveswhen its membership expands from 25 to 27 or 29.There is only a slight drop from EU27 to EU29from 12.9 to 12.2 percent.7
In summary, the passage probability calcula-tions demonstrate that Turkey’s membership in the
334 Turkey: Economic Reform and Accession to the European Union
Germany
Turkey
France
U.K.
Italy
Spain
Poland
Romania
Netherlands
Greece
Czech Rep.
Belgium
Hungary
Portugal
Sweden
Bulgaria
Slovakia
Austria
Denmark
Croatia
Finland
Ireland
Lithuania
Latvia
Slovenia
Estonia
Cyprus
Luxembourg
Malta
�0.04 �0.03 �0.02 �0.01 0.00 0.01 0.02 0.03 0.04 0.05 0.06 0.07
SSINBI
FIGURE 13.2 Change in Power for EU25, Nice Treaty to Constitutional Treaty Rules(percentage points)
Source: Authors’ calculations.

The Impact of Turkey’s Membership on EU Voting 335
EU does not erode the EU’s ability to act. Under theConstitutional Treaty rules, the effect of Croatiaand Turkey together is significantly smaller—onepercentage point—than Turkey’s alone. The mostimportant impact on the EU’s capacity to act stemsfrom the switch from the Nice Treaty rules to theConstitutional Treaty rules.
Impact of Turkey’s Membership on the Distributionof Power
The Constitutional Treaty and the Nice Treatyrules also differ substantially in power evaluation.Figure 13.2 shows the difference between theserules in terms of the NBI and SSI for the EU25,
and figure 13.3 reveals the same numbers for theEU29. The difference is measured in percentagepoints.
According to figure 13.2, before Turkey’s entrythe Constitutional Treaty rules favor the fourbiggest nations and the six smallest—that is,Latvia and smaller—if the comparison is madeusing the SSI. Based on the NBI, the conclusion issomewhat different: Germany and Slovakia andsmaller countries would gain from the Constitu-tional Treaty rules compared with the Nice Treatyrules. This result differs from that obtained byBaldwin and Widgrén (2004b) for EU27, in whichthe NBI produced exactly the same pattern as theSSI here.
�0.02 �0.01 0.00 0.01 0.02 0.03 0.04 0.05 0.06 0.07
SSINBI
Germany
Turkey
France
U.K.
Italy
Spain
Poland
Romania
Netherlands
Greece
Czech Rep.
Belgium
Hungary
Portugal
Sweden
Bulgaria
Slovakia
Austria
Denmark
Croatia
Finland
Ireland
Lithuania
Latvia
Slovenia
Estonia
Cyprus
Luxembourg
Malta
FIGURE 13.3 Power Difference between Nice Treaty and Constitutional TreatyRules for EU29(percentage points)
Source: Authors’ calculations.

After Turkey’s entry into the EU, the biggestnations gain more from the Constitutional Treatyrules than was the case for the EU25. This findingholds true for both power measures. For the small-est countries, the effect is ambiguous: the NBIshows gains for Latvia and smaller nations, whereasthe SSI shows small losses. Otherwise, both indicesshow consistent results.
Figure 13.4 explicitly compares the Nice Treatyand Constitutional Treaty rules by showing the NBIvalues under both rules. The message of the figure isvery clear. The countries that gain the most from theConstitutional Treaty rules are the biggest nations,Germany and Turkey. The biggest losers are Spainand Poland, as well as the medium-size countries,from the Netherlands to Austria. This finding couldaffect these countries’ attitudes toward either theratification of the Constitutional Treaty or Turkey’smembership. (The index values for both the EU25and EU29 are found in the annex to this chapter.)
Impact of EU Enlargement on Incumbent’sPower Figures 13.5 and 13.6 evaluate the impactof the EU25 to EU29 enlargement in terms of bothpower indices. Under the Nice Treaty rules, thecountries’ power losses are proportional to theirsizes. Thus Germany, the biggest country, loses the
most power, while the smaller nations lose less. Therelative losses are of the same magnitude. This find-ing reflects the fact that in weighted voting power,the indices tend to converge to voting weights if thenumber of actors increases and if the votingweights have relatively small variance.
In figure 13.6, the result is more interesting.When evaluated by the NBI, the enlargement fromEU25 to EU29 benefits France and the UnitedKingdom.8 The losses of the other large countries(the Netherlands and larger nations) are very small.For the countries smaller than Romania, the lossesincrease slightly as the nations become smaller. TheSSI, however, gives a somewhat different picture.The most notable exceptions are the biggestcountries, especially Germany. The power loss ofthe Netherlands remains small.
Conclusions
This chapter investigates the decision-makingimpact of expanding the EU from 25 members to29 members with the addition of Bulgaria,Romania, Turkey, and Croatia. The chapter focuseson a measure of the EU’s capacity to act—passageprobability—and the power distribution amongmembers.
336 Turkey: Economic Reform and Accession to the European Union
0.00
0.02
0.10
0.06
0.08
0.04
0.12
Germ
any
Turke
yU.K
.
Franc
eIta
ly
Spain
Poland
Roman
ia
Nethe
rland
s
Greec
e
Czech
Rep
.
Belgium
Hunga
ry
Portu
gal
Sweden
Bulgar
ia
Austri
a
Slovak
ia
Denm
ark
Finlan
d
Croat
ia
Irelan
d
Lithu
ania
Latvi
a
Sloven
ia
Estonia
Cypru
s
Luxe
mbo
urgM
alta
NBI
CT Nice
FIGURE 13.4 NBI Values under Nice Treaty and Constitutional Treaty Voting Rulesfor EU29
Source: Authors’ calculations.

The Impact of Turkey’s Membership on EU Voting 337
�0.016 �0.014 �0.012 �0.010 �0.008 �0.006 �0.004 �0.002 0.000
SSINBI
Germany
Turkey
France
U.K.
Italy
Spain
Poland
Romania
Netherlands
Greece
Czech Rep.
Belgium
Hungary
Portugal
Sweden
Bulgaria
Slovakia
Austria
Denmark
Croatia
Finland
Ireland
Lithuania
Latvia
Slovenia
Estonia
Cyprus
Luxembourg
Malta
FIGURE 13.5 Impact of Enlargement on EU25 Power, Nice Treaty Rules(percentage points)
Source: Authors’ calculations.
As for the capacity to act, the enlargement isprojected to have relatively little impact if theConstitutional Treaty voting rules take effect. Inparticular, Turkey’s membership would have onlya negligible effect on the EU’s capacity to act. Theanswer is quite different, however, if the Constitu-tional Treaty is rejected and the Nice Treaty rulesremain in place. Under the Nice Treaty votingrules, the EU25 to EU29 enlargement wouldsubstantially lower the ability of the EU25 to act.Thus our findings confirm that the enlarged EUcannot function well under the Nice Treaty rules.It also suggests that if the Constitutional Treaty isrejected, the Nice Treaty voting rules must bereformed before further enlargement.
As for power, Turkey’s membership in the EUwill have a big impact. Under either the NiceTreaty or Constitutional Treaty rules, Turkeywould be the second most powerful member ofthe EU29. Under the Constitutional Treaty rules,Turkey would be substantially more powerful thanFrance, Italy, and Britain, while under the NiceTreaty rules the power differences among themembers with more than 50 million populationwould be small. Plainly, this situation mightdecrease the acceptability of the ConstitutionalTreaty or Turkey’s membership.
The impact of the enlargement from EU25 toEU29 on the voting power of EU incumbentsdepends heavily on the rules. Under the

Constitutional Treaty rules, the enlargement lowersthe power of all incumbents on a fairly even basis,with the marked exception of Germany; Germanyloses more than twice as much power as any othermember. Under the Nice Treaty rules, the powerloss is more heavily skewed toward the big incum-
338 Turkey: Economic Reform and Accession to the European Union
Germany
Turkey
France
U.K.
Italy
Spain
Poland
Romania
Netherlands
Greece
Czech Rep.
Belgium
Hungary
Portugal
Sweden
Bulgaria
Slovakia
Austria
Denmark
Croatia
Finland
Ireland
Lithuania
Latvia
Slovenia
Estonia
Cyprus
Luxembourg
Malta
�0.025 �0.020 �0.015 �0.010 �0.005 0.000 0.005
SSINBI
FIGURE 13.6 Impact of Enlargement on EU25 Power, Constitutional Treaty Rules(percentage points)
Source: Authors’ calculations.
bents. Again, all incumbents are projected to losepower, but the power loss increases progressivelywith member size. For example, the power loss toFrance under the Nice Treaty rules is about seventimes larger than the power loss to Malta.

The Impact of Turkey’s Membership on EU Voting 339
Annex: Power Indices under the Constitutional Treaty Rules and Nice Treaty Rules
TABLE 13.1 Power Indices under Constitutional Treaty Rules
Member State NBI_EU29 NBI_EU25 SSI_EU29 SSI_EU25
Germany 0.10203 0.10407 0.13556 0.15816Turkey 0.09960 n.a. 0.13152 n.a.U.K. 0.07644 0.07614 0.09389 0.10332France 0.07611 0.07587 0.09339 0.10278Italy 0.07469 0.07475 0.09121 0.10041Spain 0.05491 0.05670 0.06313 0.06798Poland 0.05429 0.05602 0.06203 0.06694Romania 0.03786 n.a. 0.03664 n.a.Netherlands 0.03052 0.03715 0.02701 0.03440Greece 0.02495 0.03304 0.01991 0.02721Czech Rep. 0.02474 0.03287 0.01964 0.02693Belgium 0.02463 0.03279 0.01950 0.02680Hungary 0.02453 0.03271 0.01936 0.02666Portugal 0.02442 0.03262 0.01922 0.02651Sweden 0.02314 0.03162 0.01758 0.02489Bulgaria 0.02250 n.a. 0.01676 n.a.Austria 0.02239 0.03103 0.01663 0.02403Slovakia 0.01940 0.02870 0.01288 0.02000Denmark 0.01940 0.02870 0.01288 0.02000Finland 0.01918 0.02854 0.01261 0.01975Croatia 0.01886 n.a. 0.01221 n.a.Ireland 0.01768 0.02737 0.01077 0.01785Lithuania 0.01768 0.02737 0.01077 0.01785Latvia 0.01628 0.02630 0.00905 0.01631Slovenia 0.01585 0.02598 0.00853 0.01568Estonia 0.01521 0.02547 0.00774 0.01487Cyprus 0.01445 0.02490 0.00680 0.01384Luxembourg 0.01413 0.02465 0.00641 0.01342Malta 0.01413 0.02465 0.00641 0.01342
n.a. Not applicable.Source: Authors’ calculations.
TABLE 13.2 Power Indices under Nice Treaty Rules
Member State NBI_EU29 NBI_EU25 SSI_EU29 SSI_EU25
Germany 0.07189 0.08630 0.07814 0.09292Turkey 0.07189 n.a. 0.07814 n.a.U.K. 0.07189 0.08630 0.07814 0.09292France 0.07189 0.08630 0.07814 0.09292Italy 0.07189 0.08630 0.07814 0.09292Spain 0.06821 0.08159 0.07237 0.08613Poland 0.06821 0.08159 0.07237 0.08613Romania 0.03832 n.a. 0.03615 n.a.Netherlands 0.03565 0.04195 0.03340 0.03983Greece 0.03305 0.03881 0.03082 0.03648Czech Rep. 0.03305 0.03881 0.03082 0.03648

Notes
1. Legally, the Accession Treaty for the 10 new member statesin 2004 implemented the voting system agreed on politically inthe Treaty of Nice. The voting rules of the Constitutional Treatywill come into force on November 1, 2009, if it is ratified by allmember states.
2. This chapter draws on the methodology and resultsdescribed in Baldwin and Widgrén (2003a, 2004a, 2004b).
3. EU15 refers to the 15 members of the EU prior to the 2004enlargement in which 10 more countries joined the EU. The15 countries are Austria, Belgium, Denmark, Finland, France,Germany, Greece, Ireland, Italy, Luxembourg, the Netherlands,Portugal, Spain, Sweden, and the United Kingdom.
4. The rules that took effect in November 2004 were not thoseagreed on at the Nice summit in December 2000. The deal struckat 4 a.m.at the end of the longest EU summit in history was a polit-ical commitment. The legally binding changes are in the Acces-sion Treaty.Because EU leaders eventually realized how inefficientthe Nice rules were, they improved efficiency by lowering the votethreshold from the 74 percent mentioned in the Nice Treaty.
5. In the literature, the term swing is quite often used insteadof break.
6. See, for example, Widgrén (1994), Laruelle and Widgrén(1998), and Laruelle and Valenciano (2004). A recent empiricalapplication of the SSI can be found in Kauppi and Widgrén(2004).
7. Note that in EU28 (EU27 � Turkey), the passage probabil-ity is 11.2 percent, which is lower than it is in EU29 (see Baldwinand Widgrén 2003b). The reason is that the membershipquota—55 percent of membership—is 16 in both EU28 andEU29. It is thus closer to 55 percent in EU29 than in EU28—theexact numbers are 55.2 percent and 57.1 percent, respectively.
8. This phenomenon is often referred to as the paradox ofnew members.
References
Baldwin, R., and M. Widgrén. 2003a. “Decision-Making and theConstitutional Treaty: Will the IGC Discard Giscard?” CEPSPolicy Brief No. 37, Center for European Policy Studies,Brussels.
————. 2003b. “The Draft Constitutional Treaty’s VotingReform Dilemma?” CEPS Policy Brief No. 44, Center forEuropean Policy Studies, Brussels.
————. 2004a. “Winners and Losers under Various DualMajority Rules for the EU Council of Ministers.” In ReasonedChoices—Essays in Honor of Academy Professor HannuNurmi on the Occasion of His 60th Birthday, ed. M. Wiberg.Helsinki: Finnish Political Science Association.
————. 2004b. “Council Voting in the Constitutional Treaty:Devil in the Details.” CEPS Policy Brief No. 53, Center forEuropean Policy Studies, Brussels.
Baldwin, Richard, Erik Berglöf, Francesco Giavazzi, and MikaWidgrén. 2001. “Nice Try: Should the Treaty of Nice BeRatified?” Monitoring European Integration 11. London:Centre for Economic Policy Research.
Kauppi, H., and M. Widgrén. 2004. “What Determines EUDecision-Making: Needs, Power or Both. Economic Policy 39:221–66.
Laruelle, A., and F. Valenciano. 2004. “Bargaining in Committeesof Representatives: The Optimal Voting Rule.” DiscussionPaper 45/2004, Departamento de Economía Aplicada IV,Basque Country University, Bilbao, Spain.
Laruelle, A., and M. Widgrén. 1998. “Is the Allocation of VotingPower among EU States Fair?” Public Choice 94: 3–4, 317–39.
Widgrén, M. 1994. “Voting Power in the EU and the Conse-quences of Two Different Enlargements.” European EconomicReview 38: 1153–70.
340 Turkey: Economic Reform and Accession to the European Union
TABLE 13.2 (Continued)
Member State NBI_EU29 NBI_EU25 SSI_EU29 SSI_EU25
Belgium 0.03305 0.03881 0.03082 0.03648Hungary 0.03305 0.03881 0.03082 0.03648Portugal 0.03305 0.03881 0.03082 0.03648Sweden 0.02771 0.03246 0.02560 0.03024Bulgaria 0.02771 n.a. 0.02560 n.a.Austria 0.02771 0.03246 0.02560 0.03024Slovakia 0.01954 0.02291 0.01777 0.02099Denmark 0.01954 0.02291 0.01777 0.02099Finland 0.01954 0.02291 0.01777 0.02099Croatia 0.01954 n.a. 0.01777 n.a.Ireland 0.01954 0.02291 0.01777 0.02099Lithuania 0.01954 0.02291 0.01777 0.02099Latvia 0.01124 0.01324 0.00999 0.01190Slovenia 0.01124 0.01324 0.00999 0.01190Estonia 0.01124 0.01324 0.00999 0.01190Cyprus 0.01124 0.01324 0.00999 0.01190Luxembourg 0.01124 0.01324 0.00999 0.01190Malta 0.00841 0.00998 0.00755 0.00895
n.a. Not applicable.Source: Authors’ calculations.

recipient of transfers from the EU budget, at leastunder the present rules and policies.
As for trade, Turkey’s accession is not likely tohave any significant trade effects, and consequentlyany significant effects for EU industry, for tworeasons. First, Turkey is not an important tradingpartner of the EU countries, with the exception ofGreece. (The EU is, however, Turkey’s most impor-tant trading partner.) Second, Turkey has free com-modity trade with the EU under a customs union,except for agricultural commodities. By the timeTurkey becomes a member of the EU, the customsunion will have been in effect for more than adecade.
Migration
The PPP-adjusted per capita income of the EU153 isfour times higher than that of Turkey. BecauseTurkey has had about the same per capita growthrate as the EU15 since 1990, the probability thatTurkey will catch up in the foreseeable future seemsvery low. The income differential will therefore con-tinue to be a strong incentive for migration fromTurkey to the EU. Turkish migration to WesternEurope was particularly high in the 1960s, but itcontinues to be steady flow, particularly to Germanyand, to a lesser extent, the Netherlands. In the 1950sand 1960s, many of the present EU countriesactively recruited foreign labor, but that recruitmentended after the first oil crisis in 1973–74. Since then,immigration policies have become successively
From the perspective of the European Union (EU),which is considering the economic consequences ofaccepting Turkey as a member, the most importantfacts about Turkey are its size and its low per capitaincome.1
With a population of almost 70 million, Turkeywould, in terms of today’s population figures,become the second largest member of the EU.However, the population of Turkey is relativelyyoung, and it is likely to exceed Germany’s 82 mil-lion by 2020, if not earlier.
By comparison with the European countries,Turkey is poor. It has a PPP (purchasing powerparity)-adjusted per capita income of roughlyUS$7,000,2 which is equal to those of Bulgaria andRomania, countries slated to join the EU in 2007.The income disparities across Turkey are great; thepopulation in the southeast has less than half thenational average income, and the large rural popu-lation is generally much poorer than the urbanpopulation. Turkey’s relatively low level of develop-ment is evident in the share of the labor force inagriculture and in the sector’s share in value added.Only Bulgaria and Romania have a similar depend-ence on agriculture.
The descriptive statistics suggest that the impor-tant economic effects of Turkey’s accession to theEU should be related to its size, per capita income,and dependence on agriculture. For the EU, thesethree factors combine to create a huge immigrationpotential if migration is let free. Moreover, thesefactors indicate that Turkey may become the largest
341
Economic Effects ofTurkey’s Membership on
the European Union
Harry Flam
14

more restrictive, and immigrants have mostly con-sisted of relatives of former immigrants, refugees,and asylum seekers. Most migrants from Turkeyhave ended up in Germany, which has a populationof Turkish origin of 2.1 million. The second largestrecipient has been the Netherlands, which has250,000 immigrants and their descendants fromTurkey.
The prospect of large-scale immigration fromTurkey is a source of considerable concern amongthe EU15; they fear immigrants will depress wages,boost unemployment, and cause social frictionsand political upheavals. Free migration will surelynot be allowed immediately upon full membership.After the enlargement in the 1980s and the latestenlargement in 2004, old member countries wereallowed to restrict immigration from new membercountries for a period of seven years. It can there-fore be safely assumed that immigration fromTurkey will be subject to restrictions for severalyears.
Migration Theory
The effects of migration from Turkey to any of theEU15 member states are illustrated in figure 14.1.The horizontal axis measures the total supply oflabor in Turkey and, say, Germany. The simplifiedapproach used here first assumes that labor is ahomogeneous factor of production. Later, labor is
differentiated by education, training and experi-ence. The demand for labor by employers in Turkeyis shown by the demand curve DT. Likewise, thedemand for labor in Germany is shown by thedemand curve DG. The total supply of labor inGermany and Turkey is assumed to be fixed. Ini-tially, the total supply is divided so that the supplyof labor in Turkey is measured by the length of theline segment LTL0 and the supply of labor inGermany by the length of the line segment LGL0.The supply of labor in each country is assumed tobe inelastic. Before migration is allowed, the equi-librium wage in Germany is wG, which is muchhigher than the equilibrium wage in Turkey, wT.
When free migration is allowed, labor will movefrom Turkey to Germany to earn the higher wage.Migration stops when the wage is equalizedbetween the two countries, at w, and when L1L0 ofthe labor force has moved from Turkey to Germany.Thus one effect of migration is that it raises thewage in the sending country and reduces the wagein the receiving country. Migrants as well as thoseremaining in Turkey gain, while German workerslose. The effects for capital owners are the opposite;Turkish capital owners now earn the surplus TwEinstead of TwTC, and German capital ownersearn GwE instead of GwGA. (It is assumed thatcapital does not migrate in response to earningsdifferences.) The fact that part of the labor force hasmoved from Turkey to Germany also means adecline in the Turkish gross domestic product(GDP) and a rise in the German GDP. All thesechanges amount to an increase in the combinedsocial surplus or welfare. The increase is given by thearea ACE, and it is captured by German capitalowners and Turkish migrants. The welfare increasestems from a more efficient allocation of labor;Turkish laborers become more efficient when movedto Germany, and the optimal allocation is achievedwhen the marginal productivity of labor in Germanyand that in Turkey are equalized.
Figure 14.1 provides a simplistic but powerfulanalysis of the income, redistribution, output, andwelfare effects of migration. It builds on theassumption that migration is entirely driven by awage differential and that no unemployment exists.Unemployment can be easily added to the model.Assume that before migration is allowed, L1L0 ofthe Turkish labor force is unemployed. Thoseemployed now earn a higher wage—w instead of wT.
342 Turkey: Economic Reform and Accession to the European Union
Wage
A
C
B
Wage
LG
D
E
DT
LT
DG
wT
ww
wG
G
L1 L0
T
FIGURE 14.1 Effects of Migration
Source: The author.

Assume also that employment is decided periodi-cally by a lottery. Thus the expected wage (theactual wage w times the probability of winningemployment) is lower than the actual wage and liessomewhere between w and wT. The expected wagein Turkey is still below the certain wage wG inGermany. Consequently, labor will migrate toGermany once migration is allowed. Assume thatall the unemployed in Turkey migrate to Germany,that those who remain are employed, and that somefraction of the larger labor force in Germany can-not be employed because of a lack of new invest-ment. Employment in Germany is also decidedperiodically by a lottery, in which German andTurkish workers have equal probabilities of win-ning. The expected wage therefore falls below wG,but not all the way to w. Thus in the new equilib-rium, both the actual and the expected wage arehigher in Germany than the actual wage in Turkey.The expected wage can be higher in Germanybecause workers attach a negative value to the riskof becoming unemployed and demand a higherexpected wage to compensate for the risk. Theanalysis here captures an idea first expressed in amodel by Harris and Todaro (1970) of rural tourban migration in a developing country.
Turkish migration can, then, serve both todepress wages in the receiving country and to raiseunemployment. Changes in the assumptions made,such as allowing employment to increase inGermany or letting immigrant Turkish workershave a higher risk of becoming unemployed thannative German workers, would not change the basicconclusions. One assumption in the analysis isquestionable, however—that labor is homoge-neous. In reality, labor is highly differentiated byeducation, training, experience, and many othercharacteristics. Thus there are not just two factorsof production—labor and capital; there are manytypes of labor and many types of capital. As soon asthree factors or more are allowed for, the effects ofmigration on income distribution and social wel-fare become less clear-cut (see Borjas 1995). In gen-eral, its effects on native labor and capital becomemore favorable when immigrants are complementsto rather than substitutes for the native factors. Forexample, if German workers are skilled and Turkishimmigrants are unskilled, then immigrants tend toincrease the productivity and wages of Germanworkers. Likewise, the increase in social surplus
from migration tends to rise the more comple-mentary migrants and native workers are. In termsof figure 14.1, a smaller substitutability betweenlabor and capital means that the demand curvesbecome steeper and the size of the surplus trianglesbecomes greater (up to a point).
The decision to migrate depends not only onrelative wages and unemployment, but also onmany other factors. The early theoretical research(e.g., Berry and Soligo 1969) focused on incomedifferentials and individual decisions. Recentresearch stresses that migration is a householddecision and that social networks, culture, lan-guage, geographical distance, and other factors arealso important. For example, the adjustment costfor a migrant depends on the size of the migrantpopulation from the same source country in thereceiving country and on language and cultural dif-ferences. Turks are attracted to Germany in partbecause of the large Turkish immigrant populationthere, and Algerians are attracted to France partlybecause of their knowledge of French and familiar-ity with French culture (for a survey, see Ghatak,Levine, and Wheatley Price 1996).
Empirical Research Findings
Empirical research on immigration has focusedlargely on two questions (Borjas 1994). First, howdo immigrants perform in the host country? Sec-ond, what is the impact of immigration on thewages and employment of natives? Most of theresearch has been carried out on the United States,and it is therefore not fully relevant for Europe. Inthe past, immigration to the United States has beenmore permanent in nature than immigration inEurope, and permanence has an impact on the per-formance of immigrants. Furthermore, Europeanlabor markets are generally considered to be morerigid than those in the United States because oftheir stronger labor unions, more regulation, andimmigration policies.
The recent wave of immigration in the UnitedStates differs from past waves by the markedlylower level of education of immigrants comparedwith that of natives. Whereas earlier immigrantsreached the income and employment levels of nativesfairly soon, later immigrants do not. Moreover,there is a high correlation between first- and second-generation immigrants in terms of educational
Economic Effects of Turkey’s Membership on the European Union 343

attainment, and therefore a high probability thatthe second generation, too, will fall behind (Borjas1994). These findings for the United States may beapplicable to Europe and, in particular, to immigra-tion from Turkey, which mostly consists of peoplefrom rural areas with low levels of education.
There is little evidence that immigration has asignificant negative effect on the employmentopportunities of natives, either in the United Statesor in Europe. There is, however, some evidence ofsmall negative effects on the wage of unskilled laborin both. A positive effect on the wage of skilledlabor has been found in Germany, which can beexpected when unskilled immigrants are comple-ments to skilled native workers.4
A third question that has been the subject ofsome research and has received much attentionfrom policymakers and the general public iswhether immigrants are net recipients of or netcontributors to the public coffer. The problem withearlier studies is that they focus on a single year,neglecting the cost and expenditures for an immi-grant later in life, such as pensions, and they do notconsider some general equilibrium interactions,such as that between immigrants and an aging pop-ulation. The studies by Auerbach and Oreopoulos(1999) and Storesletten (2000) for the United Statestake a dynamic, life-cycle approach with partial orgeneral equilibrium interactions. They find nega-tive, but relatively small, fiscal effects for low-skilledimmigration. Storesletten estimates the average netpresent value of a representative low-skilled legalimmigrant to be −$36,000. A high-skilled immi-grant, by contrast, contributes $96,000 over his orher lifetime. A study of Germany by Bonin (2001)finds a significant positive effect for the averageimmigrant over his or her life cycle; net immigra-tion of 200,000 persons to Germany is estimated toyield natives €200 per capita per year. The positiveeffect stems from the fact that the average immi-grant has a younger working age and thus is obligedto participate in the repayment of the existinggovernment debt. The fiscal impact of immigrationis bound to differ among European countries,depending on the structure and level of taxes andbenefits.
The relatively scant empirical research on theeconomic effects of immigration to Germany, hostto the largest immigrant population among theEU15 and the largest population of Turkish immi-
grants by far, seems to indicate fairly small andmixed effects: employment opportunities are notmuch affected; the wage of low-skilled labor issomewhat depressed but that of skilled labor israised; and the net present value of public transfersis positive. It is more difficult to evaluate the socialcosts and benefits of immigration. Immigrant ghet-tos with high unemployment, crime rates, andsocial problems loom large in the minds of thenative population in many countries, although theimmediate costs are mostly borne by the immi-grants themselves.
Estimated Model of Migration to Germany from Southern Europe
The forecast of free Turkish migration to Germanypresented in this section is based on an estimatedmodel of immigration to Germany from the EU15,Norway, Turkey, the United States, and formerYugoslavia by Boeri and Brücker (2000) in a reportto the European Commission. The choice ofGermany is dictated by the facts: first, Germany ishome to the largest population of Turkish immi-grants among the EU15 countries by far, and it cantherefore be expected to attract the largest numbersof future immigrants; and second, there is a paucityof data on migration flows and stocks before the1990s for most of the EU15 countries.
Boeri and Brücker estimated how the flow ofmigration depends on the wage differential, employ-ment rates in the home and host countries, thestock of migrants from the home country, restric-tions on migration, and country specifics, such aslanguage differences, distance, and institutions. Themigration decision is assumed to be dependent onexpectations about the following factors: the futurewage differential, based on present and past valuesof the differential, conditioned by the individualprobability of finding employment in the hostcountry relative to the home country, which isassumed to be based on present and past averageemployment rates; the ease of adjustment, proxiedby the number of migrants in the host country; thedifference in development between the home andhost country and language differences; and theagreements regulating migration, such as guestworker agreements. Migration flows are viewed asshort-run adjustments to a long-run equilibriumin which migration has ceased and the migrant
344 Turkey: Economic Reform and Accession to the European Union

population relative to the source country popula-tion has attained an equilibrium level dependenton the wage differential, the employment rate dif-ferential, restrictions on migration, and country-specific factors. The long-run equilibrium is alsoestimated, thereby producing long-run relationsbetween the ratio of migrants to the source countrypopulation and the explanatory variables.5 Theexistence of a long-run equilibrium builds on theassumption that the propensity to migrate has acertain distribution over individuals in the homecountry; the equilibrium is reached when thosewith the highest propensity have emigrated for thegiven long-run values of the explanatory variablesand those remaining do not find emigrationworthwhile.6
As expected, the migrant population as a pro-portion of the source country population is in thelong run positively related to the income differen-tial between the receiving and the source country,the employment rate in the receiving country, andfree migration and guest worker agreements, and isnegatively related to the employment rate in thesource country.
Forecast of Migration from Turkey to Germany
Boeri and Brücker’s estimates are used here to fore-cast free migration from Turkey to Germany from2000 to 2030. Making such a forecast requiresassumptions about population and GDP growthrates and employment rates for the whole period.Population growth is based on forecasts by theWorld Bank in its World Development Indicatorsdatabase. It is assumed that the employment ratesin 2000 remain constant during the period underconsideration. German GDP growth is assumed tobe the average for 1990–2000. The GDP and popu-lation growth rates yield a GDP per capita growthrate of 1.7 percent. For Turkey, a higher GDPgrowth rate is assumed. The forecasts are based onthe admittedly optimistic assumption that, alterna-tively, 1, 2, or 3 percent of the per capita income gapis closed every year. This assumption means, inturn, that GDP per capita in Turkey is assumed togrow at (a very high) 9, 12, or 15 percent at thebeginning of the period and at about 3 percent atthe end. The assumption of a 2 percent yearlyreduction of the per capita income gap implies anaverage GDP per capita growth rate of 5.5 percent.
This rate can be compared with the average GDPper capita growth rate of about 3 percent over thelast five decades.
The results of the forecast are shown in fig-ure 14.2. In the figure, the Turkish immigrant pop-ulation starts out at about 2.2 million in 2000 andreaches about 3.5 million in 2030 under theassumption that no restrictions are placed onmigration. This forecast, however, is highly uncer-tain. It depends on the specification of the migra-tion model, the precision of the estimates, andheroic assumptions about GDP and populationgrowth rates. Furthermore, it is assumed that esti-mates made for a group of countries can be appliedto a different country pair and a different timeperiod. If anything, the assumed rates of conver-gence may be overly optimistic, considering the factthat no convergence has taken place since 1990.The rate of migration is about 80,000 per year inthe beginning of the forecast period, when littleconvergence has taken place. This finding impliesthat in the extreme case of no convergence, about2.5 million Turks would migrate to Germany overa 30-year period compared with about 1.3 millionin the case in which 2 percent of the income gap isclosed every year.
Although forecasts of Turkish migration to allEU15 countries are desirable, lack of data makes it
Economic Effects of Turkey’s Membership on the European Union 345
2
2.5
3
3.5
1%2%3%
4
2000 2010 2020 2030
Million
FIGURE 14.2 Forecast of Turkish ImmigrantPopulation in Germany,2000–30
Note: Figure shows forecasts for a 1, 2, and 3 percentconvergence rate of per capita income betweenGermany and Turkey. Source: Author’s calculations based on Boeri andBrücker 2000.

impossible to estimate the flow of migration alongthe lines of Boeri and Brücker for more than oneor two countries. However, Germany is by far themost important target country of migration fromTurkey, and it would dominate any estimate ofimmigration to the whole of the EU.
The EU Budgetary Effects ofTurkey’s Membership
The structure of the present system of EU revenueand expenditure is such that rich member statestransfer resources to poor members, but the rela-tion between income per capita and net transfer isfar from straightforward.7 Some rich countries giveproportionately more than others, and some poorcountries receive a disproportionate share of thetransfer. The countries that joined the EU in 2004and Turkey are all poor relative to the EU15. Muchattention has therefore been given to the effects ofEU enlargement on the EU budget, assuming thatenlargement will be very costly for the EU15. Thepresent net recipients from the EU budget fear thatthey will be the ones to bear a disproportionateshare of the cost, and the net contributors fear thatthey will be required to raise their contributions.
The major items on the revenue and expendituresides of the budget in 2002 are shown in table 14.1.Revenues are collected from three sources: memberstates’ valued added tax (VAT) revenues, customsduties collected by member states, and a tax relatedto member states’ gross national product (GNP).
The total contribution by a member state to the EUbudget is, by decision, capped at an annual amountequal to 1.27 percent of GNP until 2006, when thepresent budget ends.
Expenditures have two main destinations: theCommon Agricultural Policy (CAP) and StructuralOperations, aimed at disadvantaged countries andregions. Until recently, the CAP focused on pricesupports. The prices of many agricultural productswere kept above world market prices by purchasingexcess supplies at administratively determinedminimum prices and by protecting EU marketsfrom low world market prices by imposing dutieson imports. Excess supplies were disposed of at aloss in the EU and on the world market. Since 1993,the CAP has gradually shifted away from pricesupport to income support. Prices in the EU havebeen reduced so that they are more in line withworld market prices, and farmers are increasinglyreceiving support payments based on their hold-ings of land and animals. The CAP favors farmersand the main agricultural products—grains, sugarbeet, dairy products, and beef—of the original EU6(Belgium, Federal Republic of Germany, France,Italy, Luxembourg, and the Netherlands). Fruits,vegetables, poultry, and pork, important productsof the newer, southern members, receive less or nosupport.
Structural Operations are based on criteria ofunderdevelopment and the structural disadvan-tages of particular regions and countries. Regionalsupport is furnished through the EU’s Structural
346 Turkey: Economic Reform and Accession to the European Union
TABLE 14.1 EU Budget, 2002
Revenues Expenditures
Amount Share Amount Share (€ millions) (%) (€ millions) (%)
Duties and levies 15,267 17.3 Agriculture 40,506 48.6Value added tax 35,193 40.0 Structural operations 27,591 33.1GNP 37,580 42.7 Internal policies 5,361 6.4Correctiona −71 External expenditure 5,231 6.3Total 87,969 100.0 Administrative Other revenueb 4,755 expenditure 4,643 5.6Total 92,724 Total 83,331 100.0
a. Does not add up to zero because of exchange rate differences. b. Consists of interest, surplus from previous years, fines, taxes on salaries of employees of Europeaninstitutions, and so forth.Source: European Commission 2001.

Funds. For example, to be eligible for support underthe classification of Objective 1, a region must havea per capita income that is less than 75 percent ofthe EU average. About 55 percent of the StructuralOperations expenditure falls under this classifica-tion. By construction, the Cohesion Fund is exclu-sively directed at Greece, Ireland, Portugal, andSpain. The Cohesion Fund expenditure is modest,or about 2 percent of the total budget, but it isimportant for the recipient countries.
Turkey’s contributions to and receipts from theEU budget can be calculated by estimating the “taxbase”—that is, VAT and tariff revenue and GNP—and the extent to which Turkish agriculture andregions are eligible for support from the CAP,Structural Funds, and Cohesion Fund. Such acalculation is likely to produce a large net transferto Turkey, both because of the size of the agricul-tural sector and because Turkey is relatively poor. Itis unlikely that the EU will accept Turkey as a mem-ber if this transfer proves to be very costly. More-over, the enlargement in 2004 included countrieswith relatively large agricultural sectors that willput a heavy demand on the EU budget once thepresent transition period has come to an end.Negotiations are presently under way on the EUbudget for 2007–13. It is expected that the EU15,which is a large net contributor to the budget, willtry to modify the rules for contributions to andreceipts from the budget in order to reduce theamount of redistribution from rich to poor mem-ber states.
Under past enlargements, rules were changed ifan acceding country became a disproportionatelylarge net contributor or was a disadvantaged recip-ient of CAP or Structural Funds support under theexisting rules. For example, the United Kingdomhas a relatively small agricultural sector andreceives modest CAP support. After a long struggle,it won a permanent rebate—a “correction of budg-etary imbalances”—on its contribution. Portugaland Spain also receive modest CAP funding,because their agriculture produces relatively littlegrain. After Portugal and Spain acceded to the EU,the member states decided to limit the aggregateCAP spending in favor of Structural Funds spend-ing, which benefited both countries. The CohesionFund, established in 1993 ostensibly to help thepoor members cope with the European Economicand Monetary Union (EMU), can be viewed as well
as a form of compensation to Greece, Ireland,Portugal, and Spain. Austria, Finland, and Swedendo not have poor regions eligible for much supportfrom the Structural Funds. Objective 6 of thosefunds (later included in Objective 1) was tailoredfor support to the northernmost parts of Finlandand Sweden and the mountainous areas of Austriaas compensation.
The present rules for contributions to andreceipts from the EU budget favor poor countries,because contributions are more or less propor-tional to income per capita. Meanwhile, StructuralOperations are targeted at poor countries andregions to raise their incomes relative to those ofthe richer countries and regions. The CAP has abias toward temperate climates and therefore thericher members, but not enough to overturn theredistributive effects of Structural Operations. Inthe final instance, the rules in a future EU29 (i.e., anEU that includes Bulgaria, Croatia, Romania, andTurkey) will depend on whether the decision rulesunder the new Constitutional Treaty will come intoforce in 2009 and what strategy the countries thatentered in 2004 and the four candidate countriesare going to follow.
The old pre–Nice Treaty rules gave small coun-tries much more voting power per capita than largecountries (see chapter 13). This situation producedthese extremes: Germany, with a population of82 million, had 10 votes in the Council of Ministers,while Luxembourg, with a population of 400,000,had two, giving voters in Luxembourg 42 times thevoting power of voters in Germany. The Nice Treatyrules modified the inequality, giving Luxembourgvoters 22 times more weight than German voters.The Constitutional Treaty rules, which are sup-posed to take effect in 2009, do away with weightedvoting and introduce a double majority rule: for adecision to pass, it has to be supported by 55 per-cent of EU members and 65 percent of the EU pop-ulation. A coalition of the 14 countries that enteredthe EU in 2004 or will enter later would comprise48 percent of EU members and 28 percent of thepopulation. Thus such a coalition could be power-ful and even decisive in a future EU that includesTurkey.8
The present redistribution of funds betweenmember countries through the EU budget reflectsthe pre–Nice Treaty distribution of votes in theCouncil of Ministers. Calculation of the transfers to
Economic Effects of Turkey’s Membership on the European Union 347

the countries that entered the EU in 2004 and toTurkey if these rules were unchanged would indi-cate what incentive the EU15 has to alter the rulesin order to reduce the transfer of funds to the newmembers.
The contribution per capita to the EU budget isexplained by regressing contribution per capita onGDP per capita, and the receipts per capita areexplained by regressing receipts per capita on thenumber of Council votes per capita plus the level ofdevelopment as defined by eligibility for CohesionFund status.9 The results are shown in table 14.2.
The table reveals that GDP per capita alone canexplain 78 percent of the variation in contributionsper capita among the EU15. The estimated coeffi-cient is highly significant. As for receipts per capita,the number of votes per capita and Cohesion Fundstatus can explain as much as 86 percent of thevariation in the data. The effect of voting power isborderline significant (it is significant at the 10 per-cent confidence level, but not at the 5 percent confi-dence level), whereas the effect of Cohesion Fundstatus is highly significant.
The estimates in table 14.2 were then used toestimate the contributions and receipts of each newmember country, plus Bulgaria, Romania, andTurkey, on the assumption that each country wouldreceive a number of votes consistent with pre–NiceTreaty rules (table 14.3). The exact number of votes
that each country will have is, of course, somewhatuncertain, but it is known that each country willreceive a number of votes equal to that of an EU15country with a population of similar size. Whethera country will have Cohesion Fund status is alsouncertain. The assumption is that all countriesexcept Cyprus have such status.
348 Turkey: Economic Reform and Accession to the European Union
TABLE 14.3 Estimated EU Budget Contributions and Receipts
GDP Assumed Cohesion Contribution Total Receipts TotalPopulation (€ Number Fund per Capita Contribution per Capita Receipts(millions) billions) of Votes Status (euros) (€ millions) (euros) (€ millions)
Poland 38.7 174 8 1 90 3,472 297 11,505Romania 22.4 39 6 1 67 1,499 337 7,544Czech Rep. 10.3 55 5 1 96 992 477 4,917Hungary 10.0 49 5 1 93 930 487 4,868Bulgaria 8.2 13 4 1 65 536 479 3,927Slovak Rep. 5.4 21 3 1 84 453 523 2,823Lithuania 3.7 12 3 1 79 293 688 2,544Latvia 2.4 8 3 1 79 190 971 2,331Slovenia 2.0 19 3 1 133 266 1,133 2,266Estonia 1.4 5 3 1 84 118 1,548 2,168Cyprus 0.8 10 2 0 159 128 212 170Malta 0.4 4 2 1 133 53 3,394 1,358
Turkey 65.3 215 10 1 80 5,200 263 17,152
Total 14,130 63,572
Source: World Bank 2001 and author’s estimates.
TABLE 14.2 Estimates of EU Budget Contributions/Receipts Equations
Receipts Contributionsper Capita per Capita
GNP per capita 0.008(0.00)
Votes per capita 19.3(0.067)
Cohesion dummya 629.9(0.00)
Adjusted R2 0.86 0.78No. of observations 30 15
Note: P values appear in parentheses. Receiptsper capita are based on for 1999 and 2000 data,and contributions per capita are based on 2000data.a. Interacted with votes per capita.Source: European Commission 2001.
The total net transfer to the 13 countries is quitelarge, €49 billion, which is more than half of thepresent budget of the EU15. Turkey would receive anet transfer of about €12 billion and Poland a net ofabout €8 billion. The smaller countries receive nettransfers that are much larger per capita than thoseof the larger countries because of their greater vot-ing power. The extreme cases are Malta and Turkey,with net transfers of €3,400 and €263 per capita,respectively.
It is clear that balancing the EU budget willrequire changes in the EU budget rules and in theCAP. The calculations in table 14.3 assume full CAPsubsidies to the new members, but, at present, thecountries that entered in 2004 receive 25 percent ofCAP subsidies. Such changes must take effectbefore the new members are eligible for full CAPand Structural Operations support. (The latter aremore redistributive than the CAP.)
Trade
Commodity trade between Turkey and the EU hasbeen practically free since the late 1990s, except foragricultural commodities. The pattern of trade isnot expected to change substantially as a result offull EU membership for Turkey, but the volumeof trade could increase considerably. The 2004entrants have experienced substantial increases intrade volumes as a result of large investments byfirms from Western Europe and elsewhere, whichcombine their technical, managerial, and marketingassets with a generally well-educated and skilledlabor force at low wages. Turkey has a long way to gobefore it can hope to attract the same level of foreigndirect investment (FDI) as some of the more suc-cessful countries in Central and Eastern Europe. Forexample, Turkey attracted $15 in foreign directinvestment per capita in 2000 compared withPoland’s $256 per capita. FDI in Turkey is hamperedby political and economic uncertainty, bureaucracy,detailed regulation, and—by rumor—corruption.Indeed, according to UNCTAD (2002), Turkey hasone of the lowest rankings in terms of FDI potentialand performance. EU membership and adoption ofthe acquis communautaire will go some way towardestablishing a better investment climate, which, inturn, should lead to higher volumes of trade.
What follows is a forecast of the volume of tradebetween Turkey and the EU15 under the assumption
that trade will reach the same level of intensity astrade between the EU member states at present.The forecast is based on estimation of a gravityequation for trade within the EU15.10 In the gravityequation, the trade between a pair of countries isexplained by the size of their GDP and their GDPper capita, as well as the geographical distancebetween them and whether they share a commonland border. GDP captures the effect of countrysize; a large country typically has more trade thana smaller country. GDP per capita is a measureof product differentiation and specialization. Thehigher the per capita income, the more differenti-ated are taste and production, and the larger is thevolume of trade based on product differentiationand increasing returns to scale. A high per capitaincome is also an indication of abundance of phys-ical and human capital relative to manual labor.Thus the per capita variable should serve to captureboth intraindustry trade caused by product differ-entiation and increasing returns to scale andinterindustry trade caused by differences in factorendowments. Trade costs are controlled for by theinclusion of geographical distance and a commonland border. Geographical distance is an indicatorof transportation costs, but also of the costs ofcultural differences, which tend to increase withgeographical distance. Finally, a common landborder is considered to have a level effect on thevolume of trade. The ordinary least squares (OLS)estimates of the gravity equation are presented intable 14.4.
In the column OLS (1), the estimated coefficienton GDP per capita has an unexpected negative sign.Leaving out distance as an explanatory variablein the specification OLS (2) yields the expectedpositive sign. Apparently, the effects of GDP percapita and distance are confounded in the originalspecification because of a high positive correlationbetween distance and differences in GDP percapita; the poorest countries are on the peripheryof Europe. (The correlation between distance andthe log of the product of GDP per capita is –0.51.)
The OLS (1) estimates were then used to forecastthe bilateral trade of each of the 2004 entrants andTurkey with the EU15, notwithstanding the negativesign on GDP per capita. For one thing, distance is amore important factor between the candidate coun-tries and the EU15 than between the EU15 coun-tries and should therefore be included. Second, both
Economic Effects of Turkey’s Membership on the European Union 349

specifications have about the same explanatorypower. The results are presented in table 14.5. In thetable, the forecast value of Turkish–EU15 trade is$26.3 billion in 2000, which is much higher than theactual value of $18 billion. Most of the 2004
entrants are also projected to increase their tradewith the EU15, some of them considerably morethan Turkey, and two countries—Estonia andHungary—actually have higher actual trade thanprojected trade. However, the point estimatesobtained with this forecast method are highlyuncertain, as shown by the 95 percent confidenceintervals for the point estimates.
Conclusion
Turkey’s membership in the EU is not expected tohave significant economic effects on the presentEU members, with the possible exception of immi-gration and EU budget transfers. Turkey has alarge population, a low level of income, and a largeagricultural sector. These facts could stimulatesubstantial migration from Turkey to Germanyand other West European countries and makeTurkey a recipient of large transfers from the richerEU members.
Provided that migration from Turkey to the EUis free, it is estimated that about 1.3 million peoplewould migrate to Germany—the country withthe largest Turkish immigrant population—over a30-year period and thus increase its population by1.5 percent. However, this estimate is highly uncer-tain; it rests on heroic assumptions about relativegrowth rates and parameters in the estimatingequation, among other things.
350 Turkey: Economic Reform and Accession to the European Union
TABLE 14.4 Pooled Panel Gravity Estimatesfor Intra-EU15 Trade
OLS (1) OLS (2)
Log real product GDP 0.8577 0.8818(0.0098) (0.0120)
Log real product GDP −0.2802 0.2439per capita (0.0362) (0.0384)
Log distance −0.8819(0.0326)
Common border 0.4000 1.2557(0.0516) (0.0673)
R2-adjusted 0.9249 0.8797
Note: Estimates are based on 1,155 observations,annual data for 15 countries, 1990–2000.Intercept and year controls are not recorded.Standard errors are in parentheses. All estimatesare significant at less than 1 percent.Sources: GDP and population: OECD 2001; trade:OECD Monthly Statistics of International Trade,CD-ROM, June 2001; great circle distancesbetween capitals: U.S. Department ofAgriculture, http://www.wcrl.ars.usda.gov/cec/java/lat-long.htm.
TABLE 14.5 Forecast of Trade with EU15
95% Confidence Interval
Forecast, 2000 Lower Upper Forecast/Actual Country (€ billions) Bound Bound Trade, 2000
Bulgaria 4.4 1.6 12.3 1.82Czech Rep. 24.4 9.0 65.3 1.29Estonia 1.8 0.7 5.1 0.69Hungary 15.0 5.5 40.4 0.80Lithuania 3.5 1.3 9.4 1.82Latvia 2.5 1.0 6.7 1.59Poland 42.0 15.6 112.8 1.75Romania 10.4 3.9 28.4 1.63Slovak Rep. 11.1 4.1 30.4 2.02Slovenia 7.3 2.7 19.5 1.26Turkey 26.3 10.5 76.3 1.46
Sources: GDP and population data: World Bank, World Development Indicators; trade: OECD MonthlyStatistics of International Trade, CD-ROM, June 2001; great circle distances between capitals: U.S.Department of Agriculture, http://www.wcrl.ars.usda.gov/cec/java/lat-long.htm.

If present rules for contributions to and receiptsfrom the EU budget were unchanged—includingthe Common Agricultural Policy—it is estimatedthat Turkey would receive a net transfer of €12 bil-lion, which corresponds to about 14 percent of thepresent EU budget. The overall net contribution tothe 2004 entrants and Turkey was projected to cor-respond to about 60 percent of the present budget.The EU budget for 2006–13 is now under negotia-tion. It is unlikely that present rules will not changein the face of such large increases in net transfersfrom richer to poorer countries.
Turkey has had free trade with the EU since thelate 1990s, except in agricultural products. The pat-tern of trade should therefore not change as a resultof membership, but there is the potential for ahigher volume of trade should Turkey becomemore attractive for foreign direct investment. Ifthe volume of trade between Turkey and the EUwere to reach the same level as that of trade amongthe EU15—controlling for differences in incomelevels, geographical distance, and the absence ofcommon land borders—it would be about 50 per-cent higher than at present, according to theestimates presented in this chapter.
Notes
1. The author is grateful for comments on earlier versions ofthis chapter by Refik Erzan and Sübidey Togan, for researchassistance by José Mauricio Prado Jr., and for editorial work byChristina Lönnblad.
2. All dollar amounts are U.S. dollars unless otherwiseindicated.
3. EU15 refers to the 15 members of the EU prior to the 2004enlargement in which 10 more countries joined the EU. The15 countries are Austria, Belgium, Denmark, Finland, France,Germany, Greece, Ireland, Italy, Luxembourg, the Netherlands,Portugal, Spain, Sweden, and the United Kingdom.
4. For the United States, see Friedberg and Hunt (1995); forEurope, see Zimmerman (1995); for Germany, see Haisken-DeNew and Zimmerman (1996); and for Germany and Austria, seeWinter-Ebner and Zimmerman (1998).
5. Boeri and Brücker estimate an error-correction model.The assumptions and the model are described in detail in Boeriand Brücker (2000).
6. A common approach to explaining migration is to esti-mate a gravity equation. Yearly migration is explained by wageand employment rate differentials, distance, language, regula-tion, and the stock of earlier migrants in the host country—thatis, much the same variables as in the present error-correctionmodel. A problem with this approach is the long-run implica-tion that the entire population will leave for a sufficiently largeincome differential. The error-correction model tests for theexistence of a long-run equilibrium in which only a (small) partof the population has emigrated. Technically, it tests for co-integration between the variables. I estimated a gravity equation
of migration between Germany as the host country and Greece,Portugal, and Spain as the home countries with disappointingresults—most of the coefficients were insignificant or verysmall. An examination of the time-series data makes it clear thatother factors not accounted for, such as political developments,played a major role.
7. This section draws on the corresponding discussion inBaldwin, Francois, and Portes (1997).
8. In chapter 13 of this volume, Baldwin and Widgrén ana-lyze various aspects of the different sets of rules for decisionmaking in the EU.
9. This approach was taken in Baldwin, Francois, and Portes(1997).
10. A fixed-effects estimation is preferable, but it cannot beused to make out of sample forecasts. Standard versions of thegravity equation can be derived from all three basic trademodels—that is, the Ricardian, Heckscher-Ohlin, and increas-ing returns to scale models, as well as from other models,as demonstrated by Anderson (1979), Bergstrand (1990),Deardorff (1998), and Helpman (1998). Recent research hassought to ascertain to what extent the various models con-tribute to the empirical success of the gravity equation andthereby to evaluate their empirical relevance—see Feenstra,Markusen, and Rose (2001) and Evenett and Keller (2002). Atentative conclusion is that models based on increasing returnsand product differentiation are more successful in explainingintraindustry trade, whereas trade in homogeneous goods isbetter explained by differences in factor endowment ordifferentiation of goods by country of origin (Armingtonassumption).
References
Anderson, J. 1979. “A Theoretical Foundation for the GravityEquation.” American Economic Review 69: 106–16.
Auerbach, A., and P. Oreopoulos. 1999. “Analyzing the FiscalImpact of U.S. Immigration.” AER Papers and Proceedings89: 176–80.
Baldwin, R., J. Francois, and R. Portes. 1997. “The Costs andBenefits of Eastern Enlargement: The Impact on the EU andCentral Europe.” Economic Policy 24: 127–76.
Bergstrand, J. 1990. “The Heckscher-Ohlin-Samuelson Model,the Linder Hypothesis and the Determinants of BilateralIntra-industry Trade.” Economic Journal 100: 1216–29.
Berry, R. A., and R. Soligo. 1969. “Some Welfare Effects ofInternational Migration.” Journal of Political Economy 77:778–94.
Boeri, T., and H. Brücker. 2000. “The Impact of EasternEnlargement on Employment and Labour Markets in theEU Member States.” European Integration Consortium2000, Berlin.
Bonin, H. 2001. “Fiskalische Effekte der Zuwanderung nachDeutschland: Eine Generationenbilanz.” IZA DiscussionPaper No. 305, Institute for the Study of Labor, Bonn.
Borjas, G. 1994. “The Economics of Immigration.” Journal ofEconomic Literature 32: 1667–17.
————. 1995. “The Economic Benefits from Immigration.”Journal of Economic Perspectives 9: 3–22.
Deardorff, A. 1998. “Determinants of Bilateral Trade: DoesGravity Work in a Neoclassical World?” In The Regionaliza-tion of the World Economy, ed. J. A. Frankel. Chicago: Univer-sity of Chicago Press.
European Commission. 2001. “Allocation of 2000 EU OperatingExpenditure by Member State.” European Commission,Brussels.
Economic Effects of Turkey’s Membership on the European Union 351

Evenett, S. J., and W. Keller. 2002. “On Theories Explaining theSuccess of the Gravity Equation.” Journal of Political Econ-omy 110: 281–316.
Feenstra, R. C., J. A. Markusen, and A. K. Rose. 2001. “Usingthe Gravity Equation to Differentiate among AlternativeTheories of Trade.” Canadian Journal of Economics 34:430–47.
Friedberg, R. M., and J. Hunt. 1995. “The Impact of Immigrantson Host Country Wages, Employment and Growth.” Journalof Economic Perspectives 9: 23–44.
Ghatak, S., P. Levine, and S. Wheatley Price. 1996. “MigrationTheories and Evidence: An Assessment.” Journal of EconomicSurveys 10: 159–98.
Haisken-De New, J., and K. F. Zimmerman. 1996. “Wage andMobility Effects of Trade and Migration.” CEPR DiscussionPaper No. 1318, Centre for Economic Policy Research,London.
Harris, J., and M. Todaro. 1970. “Migration, Unemployment andDevelopment: A Two-Sector Analysis.” American EconomicReview 60: 126–77.
Helpman, E. 1998. “The Structure of Foreign Trade.” NBERWorking Paper No. 6752, National Bureau of EconomicResearch, Cambridge, MA.
OECD (Organisation for Economic Co-operation and Develop-ment). 2001. Economic Outlook No. 70. Paris: OECD,December.
Storesletten, K. 2000. “Sustaining Fiscal Policy through Immi-gration.” Journal of Political Economy 108: 300–23.
UNCTAD (United Nations Conference on Trade and Develop-ment). 2002. World Investment Report 2002. Geneva:UNCTAD.
Winter-Ebner, R., and K. F. Zimmerman. 1998.“East-West Tradeand Migration: The Austro-German Case.” IZA DiscussionPaper No. 2, Institute for the Study of Labor, Bonn.
World Bank. 2001. World Development Report 2000/2001:Attacking Poverty. Washington, DC: Oxford University Press.
Zimmerman, Klaus. 1995. “Tackling the European MigrationProblem.” Journal of Economic Perspectives 9: 45–62.
352 Turkey: Economic Reform and Accession to the European Union

Index
farmer registry, 73farmer’s income, 70food safety and quality standards, 73–74IACS of payments, 72–73, 75institutional development and EU accession, 70–75market-oriented sustainable agriculture, 55output price supports, input subsidies, and supply
control measures, 44–45policies, 41, 44–49, 71–72preferential trade regime for, 128–29, 128–29tstate budget effects of EU integration, 67–69,
68–69t, 70trade policy and border control, 45–48, 46–47t,
74–75, 76–80twelfare effects of EU integration, 69–70, 70t,
311–12, 312tAgricultural Reform Implementation Project (ARIP),
48–49, 49t, 71, 72, 73, 75agricultural sales cooperative unions (ASCUs), 44, 48,
71, 72agriculture acquis, status of implementation, 72–75Algeria’s natural gas sector, 212, 219Amsterdam, Treaty of, 230–31Ankara, Treaty of, 124antidumping measures, 103, 104t, 114antisubsidy measures, 103, 114AP. See Accession Partnershipapproximation process, 295ARIP. See Agricultural Reform Implementation ProjectArticle 122 of Treaty Establishing European Community,
14, 325Article 125 of Treaty Establishing the European
Community, 223, 224–25, 230, 257ASCUs. See agricultural sales cooperative unionsAustralia’s energy sector, 204, 212Austria
natural gas sector, 211, 218tax wedge, 229, 229t
authorization directive for electronic communicationnetworks, 54–155
automotive industry and FDI, 275Azerbaijan’s natural gas industry, 212, 213
Baltic states’ water utilities, 299b, 300Banking Regulation and Supervision Agency (BRSA),
xxv, 161, 162, 166, 170, 171, 284
References to boxes, figures, tables, and notes are denoted respectively by b, f, n, and t.
access directive for electronic communications, 155–56accession countries
Central and Eastern European countries, 19environmental acquis, estimated cost of, 296–98, 297teuro, adoption of single currency, 18–19, 29–30, 325macroeconomic framework for, 17–19preaccession phase, 17–18
Accession Partnership (AP), xvii, 223, 283ACCs (agricultural credit cooperatives), 71acquis communautaire
See also specific subject of legislationadoption of, xvii, 17–19, 127, 223, 230, 261, 295, 349composition of, 230costs of accession, 23macroeconomic policy framework for accession
countries, 17–19manufacturing, 109monetary policy, 14–15
administrative procedures, reform of, 284age demographics, 226, 273–74, 341Agenda 2000 reform of CAP. See Common Agricultural
Policy (CAP) of European Union (EU)agricultural credit cooperatives (ACCs), 71agricultural markets and incomes, xxi–xxii, 39–85
acquis in agriculture, status of implementation, 72–75adoption of Common Market Organization, 72alternative policy options for Turkey, 58–59,
60–62t, 64tARIP and, 48–49, 49t, 71, 72, 73, 75background, 39–41, 40–43tCOM, adoption of, 72common agricultural policy of EU, 49–70, 127, 129
See also Common Agricultural Policy (CAP) ofEuropean Union (EU)
common organization of market (COM), 50–54impact of introducing in Turkey, xxi, 56–70, 57t,
60–62t, 64–66t, 68–70tproducers, impact on, 46–47t, 57t, 58, 59, 62–63,
64t, 70consumers, impact of EU integration on, 63, 65–66t,
65–67, 81–82tcosts of accession, 23customs union agreements and, 127, 128, 129dependence on, 341employment, 12, 13t, 226–27estimates of support in agriculture, 49, 49t
353

banking sector, xxiv–xxvi, 161–85asset, deposit, and loan indicators, 166–67, 167fasset quality, 168–69, 169faverage bank size, 166, 166fBRSA. See Banking Regulation and Supervision
AgencyCapital Adequacy Directive, adoption of, 170–72, 171tcomparison of EU and Turkish structural indicators,
164–70, 165–70fcompliance with EU banking regulations, 170–73,
181–85concentration ratio, entry to sector, public share, and
capital adequacy, 164–66, 165fdeposit insurance, 166, 166feconomic implications of EU accession, 313t, 321–22EU banking regulations, compliance with, 181–85financial strength ratings, 169, 170fforeign bank entry, 169–70government debt securities and, 169, 169fincome, expenditure, and cost structure, 167–68, 168f“Member State with a derogation” status and, 17microeconomic policy framework for EMU members
and, 14–17number of banks, average size, and staff employed,
166–67f, 174–80tprofitability, 167, 168f, 174–80trestructuring in Turkey, 162–64, 163f, 163t, 284welfare effects of integration, 312–13
Basel II, 170–72BEPG (Broad Economic Policy Guidelines), 18BIPS (border inspection points), 74–75birthrate, 226border control. See trade and border controlborder inspection points (BIPs), 74–75BOTAS, xxviii, 210–14, 217–19, 319
See also natural gas sectorBroad Economic Policy Guidelines (BEPG), 18BRSA. See Banking Regulation and Supervision AgencyBulgaria
agriculture, 341budgetary effects of EU membership, 348electricity industry, 203exchange rate policy, 20t, 30natural gas sector, 211unemployment, 227, 227t
California electricity crisis, 204, 205bCapital Adequacy Directive (CAD), 170–72, 171tCassis de Dijon judgment (1979), 105CCT. See Common Customs TariffCE (Conformité Européne) conformity marking,
107, 109CEN (Comité Européen de Normalisation), xxiii, 106–7CENELEC (Comité Européen de Normalisation
Electrotechnique), xxiii, 106–7Central and Eastern European (CEE) countries
accession prospects for, 19, 20t
agriculture in Turkey compared, 75, 83nn8–10CAP and, xxi–xxii, 55convergence criteria, fulfilling, 14environmental acquis, estimated cost of, 297t,
298, 299exchange rate policy, 20t, 29–30FDI in, xxxiv, 261, 264f, 264–71, 265–66t, 267f,
268–71t, 275–76, 289, 349foreign bank entry, 169privatization, 267f, 267–68trade issues, xxxiii–xxxivwater utilities in Baltic states, 299b, 300
child labor, 223, 235Chile’s labor market, 248collective redundancies, 234–35Colombia’s labor market, 248COM (Common Organization of Market).
See Common Agricultural Policy (CAP) ofEuropean Union (EU)
Common Agricultural Policy (CAP) of European Union(EU), 39, 49–56
adoption of, xxi, 311–12, 329alternative options for Turkey, 58–59, 60–62t, 64tCommon Organization of Market (COM), 50–54, 72
for beef and veal, 53–54for cereals, 50–51for fruits and vegetables, 52for milk and dairy products, 52–53for oilseeds, 51for ovine meat, 54for sugar beets, 51–52for wine-growing sector, 52
consumers, impact of EU integration on, 63, 65–66t,65–67, 81–82t
costs of, xxxv, 346, 347, 348food safety and quality standards, 73–74free trade agreements (FTAs), 124future evolution of, 54–56impact of introducing CAP in Turkey, 56–70, 57t,
60–62t, 64–66t, 68–70tinstitutional development and EU accession, 70–75mid-term review and future directions, 54–56producers, 46–47t, 57t, 58, 59, 62–63, 64t, 70state budget effects of EU integration, 67–69,
68–69t, 70status of implementation of acquis in agriculture,
72–75trade and border control, 74–75
Common Customs Tariffs (CCTs), xvii, 87, 124Common Organization of Market (COM). See
Common Agricultural Policy (CAP) of EuropeanUnion (EU)
Competition Act, 287–88Competition Authority, 114Competition Board, xvii, 287–88Constitutional Treaty voting rules, xxxii, 331–32,
334–36, 334–36t, 347
354 Index

consumersSee also householdsagriculture and impact of EU integration on, 63,
65–66t, 65–67, 81–82telectricity industry and, 198–99
contingent protectionism, 102–3, 104tconvergence criteria for Turkey, 19, 20tCoordination Council for the Investment Climate
(YOIKK), 284–86, 285t, 289Copenhagen criteria for membership, 17, 230, 253costs
of accession, 23, 67bank sector restructuring, 162–63, 163tCAP, 346, 347, 348of environmental acquis. See environmental acquis
Council Directive 93/104, 234Council Directive 98/59, 234–35Council for Economic and Financial Affairs
(ECOFIN), 16Council of Ministers voting reforms, 331–32crawling peg regime, abandonment of, xix, 3, 6, 34n48Croatia and EU voting rules, 332CUD. See Customs Union Decisioncurrent account
real exchange rate and, 6–7, 7tsustainability of, 23–28, 25–26t, 326
customs union, 123–27, 125–27tcreation of, 87effect of, 94, 103, 230, 341quantitative assessment of, 127–32, 128–30t
Customs Union Decision (CUD), 87, 102–3Czech Republic
exchange rate policy, 20t, 30FDI in, 27, 264f, 264–65, 265t, 267, 267f, 268, 270t,
271, 273–74tprivatization, 268
Decision No. 2/97 of EC-Turkey Association Council,108, 120
Decision Nos. 1/72, 1/80, and 1/98 of EC-TurkeyAssociation Council, 45
“Delors’ White Book” on Growth, Competitiveness andEmployment (EU), 236
Denmarknatural gas sector, 320, 320ttax wedge, 229, 229t
deposit insurance, 166, 166fdeveloping countries, implications for, xxxiii–xxxvdirect income support (DIS) for farmers, 48, 68, 70,
73, 75See also agricultural markets and incomes
Directive 80/987, 235Directive 91/533, 235Directive 94/33, 235Directive 97/81, 234Directive 99/70, 234Directive 2001/23, 235
Directive 2002/14, 235–36Directive 2002/74, 235Directorate General for the Tobacco Products, Salt and
Alcohol Industry (TEKEL), 72direct payments as agricultural support, 44, 62
See also agricultural markets and incomesdirect technology transfers, 263DIS. See direct income support for farmersdisinflation programs. See inflationDoha Round Agreement, 55dumping, 103, 104t, 114
EAGGF (European Agricultural Guidance andGuarantee Fund), 50
earthquakes, effect of, 3, 6, 162Eastern Europe. See Central and Eastern European
(CEE) countriesECB. See European Central BankECOFIN (Council for Economic and Financial
Affairs), 16economic effects of EU accession for Turkey, xxx–xxxi,
311–30agriculture, 311–12banking sector, 312–13, 313t, 321–22challenges of, 325–28electricity, 316–19, 318–19t, 321–23, 322tEMU membership and, 325–26environmental compliance, 327–28growth effects, 328–29, 329tlabor markets, 326–27natural gas, 319–22, 320t, 322tservice and network industries, 312–21, 324t, 324–25state aid, 328telecommunications sector, 313–14, 315t,
322–25, 324ttransportation, 314, 316welfare effects, 311–25, 312–13t, 315t, 318–20t, 322t,
323f, 324t, 329economic effects of Turkey’s membership on EU, 341–52
budgetary effects, 346–49, 346t, 348tmigration, xxxii–xxxiii, 341–46trade, 349–50, 350t
Economic Partnership Agreements, 56ECSC. See European Coal and Steel Communityeducation, 28, 343–44EES. See European Employment StrategyeEurope+2003 Action Plan, xxiv, 147, 150, 151, 154EFTA (European Free Trade Association), 106Egypt’s natural gas industry, 21283/189 procedures, 105Electricity Directive of 1996, 189–90electricity industry, xxvi–xxviii, 187–208
background of current structure, 191–92California electricity crisis, 204, 205bchallenges for, 196t, 196–200, 198f, 199t, 205bcharacteristics and evolution of industry, 187–88competition-enhancing solutions, 200–07
Index 355

electricity industry (continued)cross-border trade and benefits of EU accession,
202–3current model, 193–96developing competition, 204Electricity Directive of 1996, 189–90facilitating effective regulation, 204, 206–7implementation and proposed amendment to
directive, 190–92Independent Regulatory Authority, 196interinstitutional coordination and national
electricity policy, 200market design, 194f, 194–95market opening, 189, 190, 193mitigating wholesale price risk, 204privatization and entry promotion strategies for
generation and distribution assets, 192, 195,203–4, 206–7
public service obligations (PSOs), 189–90, 191, 195regulatory reform in EU, 188–91revenue deficits, technical loans, and private
participation in distribution, 198, 198f, 199tstranded costs and competition in generation
markets, 196t, 196–98, 200–02structure of, 191–96, 194ttariff rebalancing, social protection, and industrial
competitiveness, 198–99third party access, 189, 194, 200, 317, 319transitional regimes for stranded costs, 200–02unbundling regulations, 189, 190, 191, 193–94,
200, 204universal service and tariffs, 202vesting contracts, 195welfare effects of integration, 316–19, 318–19t,
321–23wholesale market concentration and role of TETAs,
199–200El Salvador, electricity industry, 204employment
See also labor market policiesacquis, 223, 252–53growth and, 12–14, 13t, 28–29immigration and. See migrationprotection. See labor market policiesrate, 226, 227t
EMRA. See Energy Market Regulatory AuthorityEMU. See European Economic and Monetary Unionenergy, xxvi–xxviii
See also electricity industry; natural gas sectorEnergy Market Regulatory Authority (EMRA), 192, 193,
217–18, 319England. See United Kingdomenvironmental acquis, xxix–xxx, 295–307
breakdown by share of investment by sector, 300, 301tcost-benefit analysis of environmental directives,
300–03, 302–3tcosts of complying with, 295, 296–98, 297t, 327–28
medium reform scenario for EU accession, 303–6,304–5t
pollution reduction investment, 306public sector’s costs, 299–300, 299breducing total investment costs, 298–99, 299bwater utilities in Baltic states, 299b, 300wetlands regulation, 71–72
EONIA (European Over-Night Index Average), 15ESBC. See European System of Central BanksEstonia
exchange rate policy, 20t, 30trade, 350
EU. See European UnionEUAS. See Turkish Electricity Generation Companyeuro, adoption of, 18–19, 29–30, 325Eurogold investment, 276–78, 277tEurope Agreements on Conformity Assessment and
Acceptance of Industrial Products (PECAs), 106European Agricultural Guidance and Guarantee Fund
(EAGGF), 50European Central Bank (ECB), 14, 15European Coal and Steel Community (ECSC), 87, 94European Commission, 105, 107European Council Summits, 16, 236–37European Economic and Monetary Union (EMU), 347
convergence criteria, 14, 18, 19–21, 20teconomic challenges of, 325–26exchange rate policy, 17, 31fiscal policy, 15–17macroeconomic policy framework for EMU
members, 14–17, 31monetary policy, 14–15, 30participation in, xx, 261
European Economic Area (EEA) Agreement, 106European Employment Strategy (EES), 223, 236–40European Free Trade Association (EFTA), 106European Neighborhood Policy, xxxivEuropean System of Central Banks (ESCB), 14, 18European Union (EU)
access directive, 155–56authorization directive, 154–55budget for, 15case law, 231Central and Eastern European (CEEC) countries,
prospects for, 19, 20tCommon Agricultural Policy. See Common
Agricultural Policy (CAP) of European Union (EU)
costs of accession, 23, 67Council of Ministers voting reforms, 331–32coverage of EC technical regulations, 107, 108tcustoms union between Turkey and, 87, 94, 103,
123–27, 125–27t, 128f, 128–30, 129–30t,230, 341
distribution of power, 334–35f, 335–36, 339–40tEC technical regulation, coverage of, 107, 108tElectricity Directive of 1996, 189–90
356 Index

employment and Turkish labor law. See labor market policies
enlargement’s impact on incumbents’ power, 336euro area phase, 19European Council Summits, 236–37European Employment Strategy, 223, 236–40harmonization of national regulations and standards,
106–7, 109, 120impact of EU enlargement on incumbent’s power,
337–38flabor market policies. See labor market policiesmigration. See migrationmutual recognition principle, 105–6preaccession phases, 17–18, 20t, 29–30primary legislation of, 230–31secondary legislation of, 231status upon accession, 14taxes, structure of, 11–12, 11–13ttechnical barriers to trade, 103, 105–12, 111t, 113ttelecommunications sector, 153–57tools of assessment, 332f, 332–33treaties, 230–31Turkey’s membership’s impact on, 332f, 334–35f,
339–40tbudgetary effects, xxxii–xxxiii, 346t, 346–49, 348tdecision making and, 333–36economic effects, xxxi–xxxiii, 341–52migration and, xxxii–xxxiii, 341–46trade effects, 349–50, 350tvoting effects, 331–40
Eurosystem’s monetary policy, 14–15, 30“Everything But Arms,” 56Exchange Rate Mechanism (ERM II), xxexchange rate policy
debt-GDP ratio and, 22–23for EMU members, 17macroeconomic challenges facing Turkey, 20t,
29–31real exchange rate (RER) and current account, 6–7, 7f,
26t, 26–28, 31, 326
FDI. See foreign direct investmentFinland’s energy sector, 317, 320t, 321flat tax, 23, 28, 34n35
See also taxationfood prices, 63, 65–66t, 65–67, 70food safety and quality standards, 73–74foreign direct investment (FDI), xxix, 27, 261–93
automotive industry, 275benefits of, xxviii, 262–64Cargill starch-based sugar investment, 277t, 278–80case studies, 275–82comparison between Turkey and Eastern Europe,
264–71, 264f, 265–66t, 267f, 268–71tcompetition-related reforms, 287–88current state of, xx, xxxiv, 264–82, 349determinants of, 271–72
economic growth and, 262electricity industry, 201EU requirements, 283Eurogold investment, 276–78, 277tfull EU accession’s effect on, 288–89governance and institution related-constraints,
275–82, 277finfrastructure-related factors, 27, 273–75, 273–74tinvestment climate, 271–72investment promotion agency, 289, 291–92is-TIM Mobile Telecom Investment, 277t, 280–81legal and judicial reforms, 286–87macroeconomic and trade policies, 272–73, 272tpolicies and institution and EU accession, 273–74t,
282–90priorities in future reforms, 286–90proactive investment promotion policies, role of,
289–90raising productivity and stimulating spillovers, role in,
262–64reform efforts, 283–86, 285fsustainability of current account, 23–28,
25–26t, 326France
electrical industry, 188, 190excessive deficit proceedings, 33n31natural gas sector, 320, 320t
free-floating exchange rate, 30–31free trade agreements (FTAs), 87, 124, 125–27t
GATTArticle XXIV, 124, 129free trade, 124legal subsidies, 87, 328
Geographic Information System (GIS), 73, 75Germany
electricity industry, 190, 191, 317, 319excessive deficit proceedings, 33n31FDI in, 290migration and, xxxiii, 341–46, 345fnatural gas sector, 218, 320, 320ttax structure, 11–13t, 12
“Good Agricultural Practices,” 74Greece
electricity industry, 203labor market flexibility, 247natural gas sector, 211, 214–15, 320, 320ttax wedge, 228–29, 229ttrade with, 341
growth effects of accession, 328–29, 329tGSM. See mobile phone (GSM) serviceGuatemala’s electricity industry, 204
Harmonised Index of Consumer Prices (HICP),14–15
harmonization of national regulations and standards,106–7, 109, 120
Index 357

Hazard Analysis and Critical Control Point (HACCP), 74
Helsinki Council and recognition of Turkey as EUcandidate, xvii, 127, 223, 261
householdsSee also consumerselectricity costs, 198–99, 199t, 202expenditures, 63, 64, 65–66, 65–66t, 70, 81–82t
human capital formation, investment in, 28, 29Hungary
exchange rate policy, 20t, 30FDI in, 27, 264f, 264–65, 265t, 267, 267f, 268, 270–71t,
273–74tlabor cost for employers, 228labor market flexibility, 247natural gas industry, 211trade, 350unemployment, 227, 227t
IMF. See International Monetary Fund assistance to Turkey
immigration. See migrationindependent floating, 34n48Independent Regulatory Authority, 196inflation
FDI and, 27IMF program to reduce, xix–xx, 161macroeconomic challenges facing Turkey and,
21–22, 21tmonetary developments and, 3–6, 4f, 5treducing and disinflation, 21–22, 21t, 161, 162,
224, 326informal employment, 32n14infrastructure
See also specific type of energyFDI and, 27, 273–75, 273–74tquality, 108–9
insolvency of employers, 235Integrated Administration and Control System (IACS)
of payments, 72–73, 75intellectual property rights, 28, 285, 285finterconnection and roaming, 156International Monetary Fund (IMF) assistance to
Turkey, xix–xx, 3, 7, 21, 48, 161, 216Internet service and facilities, 150–51, 150–51f, 313investment climate, 271–72investment incentives, 112, 114investment promotion agency (IPA), 289, 291–92investment ratio, 28, 29Investment Service Directive (ISD), 170Iran’s natural gas sector, 210, 212–13Ireland’s tax structure, 11–13t, 12irrigation projects, 44, 72is-TIM Mobile Telecom Investment, 277t, 280–81Italy’s energy sector, 190, 215–16, 218, 219
judicial system reforms, 286–87
labor cost for employers, 228–29, 228–29tlabor market policies, xxviii–xxix, 223–60
child labor, 223, 235collective redundancies, 234–35coordinating employment policies, impact of, 253disinflation and, 22employment acquis, impact of adopting and
implementing, 223, 252–53employment and growth, 12–14, 13t, 128–29employment protection, 224, 225, 240–46, 241–44t,
245–46f, 252EU labor market policies, 230–40European Council directives on employment and
Turkish labor law, 231–36, 232–33tEuropean Employment Strategy (EES), 223, 236–40flexibility of market, 224–25, 226, 240, 246–51,
247–50f, 326immigration and. See migrationimplications of EU accession, 256–57, 326–27informal employment, 32n14labor market indicators, 226–30, 227–29tnew labor law, impact of, 251–52problems and prospects, 251–56safety and health requirements, 234, 251simulation analysis, 253–56, 254t, 254–55f, 256tunemployment, 12, 14, 23, 28, 224, 225, 227, 227t,
327, 342, 343working conditions, 234, 251
land database, 73Latin America’s electricity industry, 204layoffs, 251licensing, 28, 147, 154–55Lithuania’s exchange rate policy, 20t, 30Luxembourg’s tax structure, 11–13t, 12
Maastricht Treaty criteria, xx–xxi, 15–16, 18, 29,325–26
macroeconomic policies, xix–xxi, 3–35accession countries, macroeconomic framework for,
17–19challenges, 19–31, 20–21t, 25–26tdevelopments, 3–14, 4f, 5t, 7f, 8t, 9f, 10–13temployment and, 12–14, 13t, 28–29EMU members, macroeconomic policy framework
for, 14–19exchange rate policy, 20t, 29–31fiscal developments, 7–12, 8t, 9f, 10t, 11, 12t, 22–23inflation, 3–6, 4f, 5t, 21–22, 21tpublic sector borrowing and, 9–11, 9f, 10–11treal exchange rate and current account, 6–7, 7fsustainability of current account, 23–28, 25–26ttaxes, structure of, 11–12, 11–13t
Malaysia, electricity industry, 204manufacturing industry, xxii–xxiii, 87–121
applied tariff structure, 99–102, 100–02tconditions of competition, 112–20, 115t, 116f,
117–19t
358 Index

conformity assessment and market surveillance, 107,109–10
contingent protectionism, 102–3, 104tdevelopment in Turkey’s trade regime, 87–98, 88–89t,
91–93t, 95–98tEC technical regulations and, 107, 108tharmonization of national regulations and standards,
106–7, 109, 120markups in, 116, 116f, 117, 117t, 120mutual recognition principle, 105–6structure of protection, 99–102, 100–02ttechnical barriers to trade, 103, 105–12, 111t, 113t
map of Turkey, 1MARA. See Ministry of Agricultural and Rural Affairsmarket access and regulatory issues, xxiii–xxiv,
123–45See also trade and border controlcustoms union, 87, 94, 103, 123–30, 125–30t, 132,
230, 341developing countries, implications for, xxxiii–xxxvfactor analysis of regulatory structures, 132–39,
133–38t, 138f, 139fglobal general equilibrium, application of, 127–32,
128–31t, 140–44, 141t, 142–43fmodel of study, 140–44, 143fquantitative assessment, 127–32, 128–31ttariff equivalents for transport services,
139–40, 140t“Member State with a derogation” status, 14, 17, 18,
19, 325mergers and acquisitions (M&As), 267, 267fMFN. See most-favored nation tariff ratesMiddle Eastern countries and trade policy, xxxivmigration, xxxii–xxxiii, 341–46
effects of, 342f, 342–43empirical research findings, 343–44EU budget, xxxii–xxxiiifiscal impact of, 344forecast of migration from Turkey to Germany, 345f,
345–46model of migration to Germany from Southern
Europe, 344–45restrictions from new member countries, 342theory, 342–43, 342f
Ministry of Agricultural and Rural Affairs (MARA),71, 72
mobile phone (GSM) service, 147, 149–50, 150f, 153,157, 313
monetary developments and inflation, 3–6,4f, 5t
monetary policy for EMU members, 14–15monetary union, 14most-favored nation (MFN) tariff rates, xxxiii, 45,
46–47tmotor vehicle sector, 131–32, 275
See also transportation sectormutual recognition principle, 105–6
NACE (Nomenclature Générale des ActivitésÉconomiques dans les CommunautésEuropéennes), 110
NAFTA (North American Free Trade Agreement), 132national central banks (NCBs), 14, 15national regulatory agency (NRA), 155, 156natural gas sector, xxvi–xxviii, 209–20
comparative analysis of Turkey’s gas legislation,218–19
emerging gas markets in EU, 214–15import and export infrastructure and future
developments, 210–11long-term purchase contracts, 211–13mature gas markets in EU, 215national networks and future development, 213–14ownership and industry structure, 214–16present Turkish gas market, 209–14regulatory reform, 216–19third party access, 320welfare effects of integration on, 319–22, 320t, 322t
Netherlands and migration, 342New Basel Accord (Basel II), 170–72Nice Treaty voting rules, xxxii, 331–32, 332f, 334–36,
334–35t, 336f, 339–40t, 347nominal exchange rate (NER), 31
On the Prevention of Unfair Competition inImportation (Turkey 1989), 114
Organisation for Economic Co-operation andDevelopment (OECD)
agriculture, estimates of support, 49on CAP program, 50competition policy, 114electricity industry and, 198, 200factor analysis of regulatory structures, 132–39,
133–38t, 138–39fFDI and, 265, 266tinflation and unemployment, 224labor market data of, 240on telecommunications sector, 148
part-time and fixed term employment, 226, 227t,234, 251
PECAs (Europe Agreements on Conformity Assessmentand Acceptance of Industrial Products), 106
PEP (Preaccession Economic Programme), 17–18personal computer (PC) usage, 150–51, 151fPoland
budgetary effects of EU membership, 349environmental acquis, estimated cost of, 296,
297t, 298exchange rate policy, 20t, 30FDI in, 264f, 264–65, 265t, 267, 267f, 269t, 271t,
273–74tlabor issues, 228, 247privatization, 267–68unemployment, 227, 227t
Index 359

Portugalelectrical industry, 190excessive deficit proceedings, 33n31natural gas sector, 215, 320, 320t
Preaccession Economic Programme (PEP), 17–18price
agriculture supports, 44–45electricity and wholesale price risk, 204food. See food pricesHarmonised Index of Consumer Prices, 14–15stability in Eurosystem, 15telecommunications regulation, 156–57
privatizationagriculture, 72banking sector, xxv–xxvi, 162, 164, 165CEE countries, 267, 267tcompetition-related reforms, 287–89electricity industry, xxvi, 192, 195, 200, 203–4, 206–7environmental acquis and, 299–300manufacturing, 114, 120telecommunications sector, 147, 148
Privatization Agency, 72public sector
borrowing requirements and public debt, 9–11,9f, 10–11t
deficits, 4–5environmental acquis, costs of, 299–300, 299bpublic debt and fiscal policy, 22–23reforms, 284revenues and expenditures, 7, 8t, 9state aid, 328
public service obligations (PSOs), 189–90, 191, 195
railways, xxiii, 123, 132, 134–35t, 137, 137t, 138fSee also market access and regulatory issues;
transportation sectorreal exchange rate (RER) and current account, xx, 6–7,
7t, 26t, 26–28, 31, 326Resolution No. 1466/97, 16Resolution No. 1467/97, 16–17Restructuring Law of 1996 (U.S.), 205bRomania
agriculture, 341budgetary effects of EU membership, 348exchange rate policy, 20t, 30natural gas sector, 211unemployment, 227, 227t
Rome, Treaty of, 105, 287rural communities, 55, 148
See also agricultural markets and incomesRussia
flat tax, 34n35natural gas sector, 210, 212
safety and health requirements for labor, 234, 251SAPARD. See Special Accession Programme for
Agriculture and Rural Development
Savings Deposit Insurance Fund (SDIF), xxv,163–64, 330n10
savings rate, domestic, xx, 28, 29SDIF. See Savings Deposit Insurance Fundsectoral reform challenges, xxi–xxiiiself-employment rates, 226, 227tservice and network industries, 312–21, 324t, 324–25
See also specific industriesSGP. See Stability and Growth Pactshort-term interest rates, 15Slovakia’s exchange rate policy, 20t, 30Slovak Republic’s labor costs, 228Slovenia’s exchange rate policy, 20t, 30SMP (significant market power), 156social security taxes, 11–12, 12–13t, 227–28, 228tSOEs (state-owned enterprises), 44Spain
labor market flexibility, 247natural gas sector, 218, 219tax structure, 11–13t, 12
Special Accession Programme for Agriculture and RuralDevelopment (SAPARD), 299, 303–4, 306
spillovers, 263–64Stability and Growth Pact (SGP), 15–16, 18, 19, 325Structural and Cohesion Fund (EU), xxxv, 67, 68–69,
247, 347, 348subsidies, 44–45, 67–69, 328
See also GATTantisubsidy measures, 103, 114
Sweden’s natural gas sector, 320t, 321
tariffs. See trade and border controltaxation
costs of accession, 23EU budget and, 347flat tax, 23, 28, 34n35labor market policies and, 327labor taxes, 28reforms, 28, 285, 285fstructure of taxes, 11–12, 11–13ttax wedge, 228–29, 228–29tvalue added tax (VAT) systems, 11, 12, 13t, 67–68, 69t,
285, 346, 347TEAS. See Turkish Electricity and Transmission
Companytechnology, 28, 262–63TEDAS. See Turkish Electricity Distribution CompanyTEKEL (Directorate General for the Tobacco Products,
Salt and Alcohol Industry), 72telecommunication acquis, 147, 153, 156telecommunications sector, xxiv, 147–59
access directive, 155–56authorization directive, 154–55competition policy and regulation, 152–53framework of EU legislation, 153–54legal and institutional comparison with EU, 153–57price regulation, 156–57
360 Index

privatization, 153quantitative comparison, 148–52, 148–52f, 158trecommendations, 157, 157funbundling regulation, 155–56universal service, 156welfare effects of integration on, 313–14, 315t
TETAS. See Turkish Electricity Wholesale Companythird party access (TPA) in energy industry, 189, 194,
200, 317, 319, 320TMO. See Turkish Grain BoardTokyo Round Agreement, 87total factor productivity (TFP) growth, 28–29TPRB (Trade Policy Review Board), 129trade and border control
agricultural commodities, 40–41, 42–43t,45–48, 46–47t
agriculture acquis, status of implementation,74–75
applied tariff structure, 99–102, 100–02tbeef and veal, 54cereals, 51conditions of competition, 112–20, 115t, 116f,
117–19tconformity assessment and market surveillance,
107, 109–10contingent protectionism, 102–3, 104tcoverage of EC technical regulations, 108tcustoms union between Turkey and EU, 87, 94, 103,
123–29, 125–30t, 132developing countries, implications for, xxxiii–xxxvdevelopment in Turkey’s trade regime, 87–98, 88–89t,
91–93t, 95–98teconomic effects of Turkey’s membership on EU,
349–50, 350tEC technical regulations and, 107electricity industry, 202–3growth effects of accession, 328–29, 329tharmonization of regulations and standards, 106–7,
109, 120liberalization, effect of, 28, 285, 285tmacroeconomic and trade policies, 272–73, 272tmost-favored nation (MFN) tariff rates, 45,
46–47tmutual recognition principle, 105–6protectionism, 99–102, 100–02tservice and network industries, 324t, 324–25sugar beets, 52tariff binding commitments under WTO, 83n5technical barriers to trade, 103, 105–12, 111t, 113twines, 52
Trade Policy Review Board (TPRB), 129transportation sector
See also market access and regulatory issuescustoms union and, 132direct trade in, 132economic implications of EU accession, 314motor vehicle sector, 131–32, 275
regulatory structures, 123, 134, 135–38t, 137,138–39f
tariff equivalents for, 139–40, 140fwelfare effects of integration on, 316
Treaty of. See specific nameTSE. See Turkish Standards InstituteTURKAK. See Turkish National Accreditation BodyTurkish Bank of Agriculture, 44, 71Turkish Electricity and Transmission Company (TEAS),
191, 193–94, 316Turkish Electricity Distribution Company (TEDAS),
191, 194, 198, 199, 200, 316Turkish Electricity Wholesale Company (TETAS),
193–95, 197, 198, 199–200, 201, 207See also electricity industry
Turkish Grain Board (TMO), 71, 72Turkish National Accreditation Body (TURKAK),
xxiii, 109Turkish “National Program,” 161Turkish Standards Institute (TSE) certification,
xxii–xxiii, 109, 110Turkish State Railways (TCDD), xxiiiTurkmenistan’s natural gas sector, 210–11, 212, 213Türk Telecom, xxiv, 148–49, 151, 153, 156–57, 313
See also telecommunications sector
UCPTE (Union for the Coordination of Production andTransmission of Electricity), 203
unbundling regulationselectricity industry, 189, 190, 191, 193–94,
200, 204natural gas sector, 214, 217, 218telecommunications sector, 155, 193–94
unemployment. See labor market policiesUnited Kingdom
electricity industry, 204, 317, 319natural gas sector, 204, 219, 320, 320t, 321, 322, 322ttax structure, 11–13t, 12
United Statesimmigration, 343–44labor market flexibility, 247, 248
universal serviceelectricity industry, 202telecommunications sector, 156
Uruguay Round commitments, 124
value added tax (VAT) systems, 11, 12, 13t, 67–68, 69t,285, 346, 347
veterinary border inspections, 74–75voting, impact of Turkey’s membership on EU,
xxxi–xxxii, xxxv, 331–40Council of Ministers voting reforms, xxxii, 331–32decision making, impact on, xxxii, 333–36enlargement’s effect on incumbents’ power, xxxii, 336,
337–38f, 347passage probabilities of various voting scenarios,
332–33, 332f
Index 361

Wales’ electricity industry, 204welfare effects
agricultural markets and incomes, 69–70, 70t,311–12, 312t
banking sector, 312–13CAP, impact of introducing, 69–70, 70tof integration, 311–25, 329natural gas sector, 319–22, 320t, 322ttelecommunications sector, 313–14, 315t, 322–25,
323–24ttransportation sector, 316
wetlands regulation, 71–72working conditions, 234, 251World Trade Organization (WTO), 83n5, 87, 124,
152, 289
YOIKK. See Coordination Council for the Investment Climate
362 Index


T R A D E A N D D E V E L O P M E N T S E R I E S
™xHSKIMBy359327zv":;:*:$:-0-8213-5932-0
What requirements must Turkey—the largest country among the candidateand accession countries—meet to join the European Union? Whatprogress has been made toward meeting them?
This timely volume analyzes the economic challenges confronting Turkey in its questto accede to the European Union (EU). It focuses on the extent to which Turkey isready to join the Single Market; comply with the EU’s body of economic regulationsand directives, the Acquis Communautaire; and meet the Maastricht criteria for fiscal,monetary, and exchange rate policies.
This book also provides an assessment of Turkey’s national program to meet theaccession requirements. It describes briefly what Turkey needs to achieve on theeconomic policy front to satisfy the conditions for accession, the progress to date,and the likely consequences of implementing the full body of EU requirements.
The book is divided into four parts:
aa An analysis of the macroeconomic policies for EU accessiona An analysis of the effects of integration on key sectors: agriculture;
manufacturing; services industries, including banking, telecommunications,transportation, and natural gas; and network industries
a An exploration of key economic policy challenges, including labor marketregulation, foreign direct investment challenges, and the costs and benefits ofmeeting the EU environmental Acquis
a The quantification of the impact of EU accession and consideration of thewelfare effects of integration
Although the focus is on the specific situation of Turkey, the subject will be of valueto all researchers with an interest in the challenges of deeper integration throughregional agreements.
The Centre for Economic Policy Research (CEPR), established in 1983, is a network of over 600 Research Fellows andAffiliates, based primarily in European universities. The Centre coordinates the research activities of its Fellowsand Affiliates and communicates the results to the public and private sectors. CEPR is an entrepreneur, developingresearch initiatives with the producers, consumers, and sponsors of research.
THE WORLD BANK
CENTRE FOR ECONOMIC POLICY RESEARCH