CONSIDERATION OF HOT-MIX ASPHALT THERMAL PROPERTIES DURING COMPACTION
Upload
khangminh22Category
view
2download
0
HKIE TRANSACTIONS, 2016VOL. 23, NO. 3, 157–170http://dx.doi.org/10.1080/1023697X.2016.1204702
Parameters affecting compaction in Hong Kong soils
Hong-yau Wong
Technical Director, Geotech Engineering Ltd, Hong Kong, People’s Republic of China
ABSTRACTFor landfilling work in Hong Kong, the normal acceptance criterion is to compact the filling to95%of the respective Proctormaximumdry bulk density of soil (τd)max, irrespective of the actual(τd)max. This practice was acceptable in the past years when the more coarse-grained soils ingranitic areas were mostly used. Recently however, with the use of more fine-grained soils fromvolcanic areas, the (τd)max can vary very considerably. Accordingly, a complete experimentalstudy of the effect of the various soil parameters on (τd)max is necessary. The study comprisesmore than 400 sets of Proctor plus a full particle size distribution (PSD) test. A detailed analysisdoes indicate that (τd)max is not dependent on fines content (F) alone but also on the PSD. Byadopting a uniformity parameter Ur to quantify PSD, a new lumped parameter Fe (= F/Ur) canbe introduced to replace F. It is most encouraging to note that Fe is closely related to (τd)max formost of the present test results in granitic areas. More importantly, these test results also havevery significant implications on the current practices in filling works regarding the soil types thatcan be adopted as well as the adequacy of the compaction requirement as required by GeneralSpecification for Civil Engineering Works 2006 issued by the HKSAR Government.
ARTICLE HISTORYReceived 24 December 2015Accepted 13 June 2016
KEYWORDSProctor compaction;maximum density;uniformity coefficient;particle size; landfill; graniticsoil; volcanic soil
Notation
ASTM American Society for Testing andMaterials
BS British StandardsC Clay content (% by mass)C/HDG Completely/highly decomposed gran-
iteC/HDV Completely/highly decomposed vol-
canicsD10, D60 Particle size which has 10%, 60% by
weight of the sample finer (mm)D25, D50, D75 Particle size which has 25%, 50% and
75% of the weight of the sample finer,respectively (mm)
F Fines (silt+ clay) content (% by mass)Fe Equivalent fines content = F/Ur (% by
mass)(Fe)a Equivalent fines content after com-
paction (% by mass)(Fe)act Estimated actual equivalent fines con-
tent at (τd)max (% by mass)(Fe)b Equivalent fines content before com-
paction (% by mass)G Particle density (Mg/m3)GEO Geotechnical Engineering OfficeGr Gravel content (% by mass)HKSAR Hong Kong Special Administration
RegionPSD Particle size distributionPWCL Public Works Central Laboratory
CONTACT Hong-yau Wong [email protected]
S Silt content (% by mass)Sa Sand content (% by mass)U Coefficient of uniformity (= D60/D10)Ur Uniformity factor for weathered soils
in Hong Kong (= log10(D75/D25))V Total volumeW Total dry massWL Total mass of considerably larger soil
particlesWS Total mass of isolated small soil parti-
clesx Percentage by mass of large soil parti-
cles considered as inertτd Dry bulk density of soil as measured
(Mg/m3)(τ d)eff Effective dry bulk density of soil (Mg/m3)(τd)max Proctor maximum dry bulk density of
soil (Mg/m3)
Introduction
In civil engineering, the maximum dry density of agiven soil sample is defined, in general, as the maxi-mumdry density determined in the laboratory in accor-dance with a test method as specified by the nationalstandard in that particular area. In Hong Kong, thisis normally determined in accordance with the testmethods specified by either the British Standards Insti-tution (BSI) [1] or the ASTM, each of which has atleast three test methods available. However, the BSI andASTM methods are practically identical. For most of
© 2016 The Hong Kong Institution of Engineers
158
the landfilling works in Hong Kong, the 2.5 kg Ram-mer method – commonly referred to as the “Proctortest” – is found to be quite adequate, and the maximumdry density thus obtained is referred to as the Proctormaximum dry density, (τ d)max.
Theoretically, the maximum dry density that can beattained in either the laboratory or in situ depends onthe following parameters:
(1) The compactive effort applied per unit of soil vol-ume which, for a given applied energy, depends interms of:(a) The boundary conditions.(b) The thickness of the soil layer that is to be
compacted.(c) The thickness of the soil layer that has been
compacted.(2) Soil type, which in this case, ismostly affected by:
(a) G of the soil particles.(b) The shapes (e.g. whether angular or rounded)
of the soil particles.(c) The sizes of the soil particles.(d) The PSD or soil uniformity in the case of
granular soils.(e) The susceptibility of the soil particles to
crushing.
In the laboratory determination of the maximumdry density using a certain testing method, the com-pactive effort, boundary conditions and thicknesses ofthe soil layers are always the same, as these are allspecified by the selected test method. Accordingly, themaximum dry density thus determined is only affectedby the soil type. The present work therefore carries out acomprehensive experimental study of the effect of eachof the above soil parameters on (τd)max, together withthe support of a theoretical analysis of the probablemechanisms.
Hong Kong soils and their properties affectingsoil compaction
The soil materials employed for most of the fillingworks in the developed areas in Hong Kong are theproduct of the weathering of two major rock types(granite and volcanics) as well as the fill and collu-viumdeposits derived from them.Accordingly, only theabove-mentioned properties of these soils, includingG,shape, size, PSD and susceptibility to crushing need tobe considered in studying the effect of soil properties onsoil compaction.
With regard to G, it can be seen from Wong [2]that most of the soils in the developed areas in HongKong have the G values in the range of 2.60 Mg/m3 to2.70Mg/m3 and therefore, the effect of such variationon (τd)max is not quite significant. Occasionally, fillingmaterials might be obtained from less developed areas
with such minor types as granodiorite, sedimentary ormetamorphic rock. The soil materials thus derived, ingeneral, have a higher G value in the range of 2.63Mg/m3 to 2.87Mg/m3.[2]
With regard to the particle shape, most of the weath-ered soils and fill/colluvium derived from them arebasically fairly angular in nature and should there-fore be quite similar. However, for marine and alluvialdeposits, the erosive action of water during transporta-tion results in a less angular and more rounded particleshape, which is quite different from those of the abovesoil types. Nevertheless, marine and alluvial depositsare not normally used for landfilling in Hong Kong,with the exception of marine sand, which is often usedas filling material in reclamation works.
In view of the above considerations, the (τ d)max thusdetermined for the weathered soils in Hong Kong andfill/colluvium derived from them depends majorly onthe particle size, PSD and susceptibility to crushing. Insoil mechanics practice, the particle size is normallyquantified by the term fines content, F, which is definedas the sum (in percentage by mass) of the silt size con-tent and the clay size content. The PSD is normallyquantified by a soil uniformity parameter; for a granularsoil, this uniformity parameter, U, is defined as:
U = D60/D10,
whereD60 andD10 are particle size which has 60%, 10%by weight of the sample finer (mm).
However, for weathered soils in Hong Kong, theclay content, C, can often exceed 10%, thus yielding aD10 value below 0.002mm, which is of colloidal sizenot measurable by the sedimentation test. Taking intoaccount the fact that the maximum C of the weath-ered soils in Hong Kong seldom exceed 35%, it appearsthat the following parameter Ur is a more appropriateuniformity parameter:
Ur = log10D75/D25,
whereD75 andD25 are particle size which has 75%, 25%by weight of the sample finer (mm).
As the D75/D25 ratio can easily be 1000 or more, theintroduction of the logarithmic scale tends to limit Urto the range of 1 to 3. In fact, Ur was introduced byLumb [3] as one of the three parameters used to char-acterise the composition of Hong Kong soils. In Lumb’swork, this parameter was termed:
Deviation,Dv = 1/2 log10(D75/D25).
Methods and scope of testing
In Hong Kong, the methods of various compactiontests were in accordance with BS 1377:1975 in the early1980s. In the early 1990s, a new version of this BS wasissued, and then in the early 2000s, Hong Kong issuedits own version. Nevertheless, the respective testing
H. Y. WONG

159
methods are still essentially the same. A more detaileddescription of the various testing methods for deter-mining the Proctor density is given in sections 10.1,10.2, 10.3 and 10.4 of Geospec 3 [4], with sections 10.1and 10.2 being for the 1000 cc mould, with section 10.1for non-crushable soils and section 10.2 for crushablesoils. Similarly, sections 10.3 and 10.4 are for the Cali-fornia bearing ratio test (CBR)mould, with section 10.3for non-crushable soils and section 10.4 for crushablesoils.
The present testing programme comprises morethan 400 Proctor tests, carried out by four groups oflaboratories designated for easy reference as Laborato-ries A, B, C and D. The testing also covers a very longtime period, from the early 1980s to the early 2000s,with the testing mostly conducted either by the Pub-lic Works Central Laboratory (PWCL) or governmentcontract laboratories.
In order to study the effect of the soil particle sizeand PSD on (τd)max, a full PSD test is carried out foreach Proctor test. As for the effect of soil crushing,most Proctor tests were carried out in Laboratories B,C and D on a single sample and in Laboratory A onseparate samples.Moreover, an additional PSDwas car-ried out on some of the soil samples after the completecompaction test.
Soil test results and analysis
Soil test results and preliminary analysis
The variation of (τ d)max with F for all soil typesfrom Laboratories A, B, C and D are summarised in
Figure 1. The following additional features are alsoidentified:
(1) Compaction testing on separate samples or on asingle sample.
(2) Samples with a particle size > 37.5mm removedbefore compaction.
(3) Samples with F > 50% but C < 25%.(4) Samples with C > 25%.(5) Samples with PSD determined after compaction.
It can be seen from Figure 1 that there is only a verygeneral trend for (τ d)max to increase with the decreasein F. Moreover, for a given F, the scattering in (τ d)maxis fairly large, with values ranging from 1.6 Mg/m3 to2.0Mg/m3 for the values of F of around 25%. In thesame manner, for the same (τ d)max of 1.80 Mg/m3
attained, F can range from 20% to 50%.From the more than 400 sets of data collected so far,
it is quite obvious that (τd)max is not a function of Falone. The impact of other factors such as soil unifor-mity and susceptibility to crushing must be consideredcarefully. Moreover, these tests have been carried out byfour different laboratories, and the possible differencesbetween their processes and equipment must also beconsidered.
Further critical analysis of soil test results
To illustrate the effect of the soil uniformity factorwhich quantifies the PSD parameter, reference can bemade to Table 1, in which the F and Ur values for
Figure 1. Variation of (τ d)max with F (percentage silt plus clay) for all soil materials.Notes:1. The tests carried out by all four laboratories are included.2. Unless otherwise stated, all PSDs were determined before compaction and all compaction tests were carried on a single sample.
HKIE TRANSACTIONS

160
different (τd)max values from the compaction tests car-ried out in one of the laboratories have been listed. It canbe seen that in a large number of cases, the followinggeneral trends can be observed:
(1) Samples of similar (τ d)max can have a fairly largedifference in F as well as Ur. The general trend isan increase in Ur with the increase in F.
(2) For samples with similar values of F, (τd)maxtends to increase with an increase in Ur. On theother hand, for samples with similar values of Ur,(τ d)max tends to increase with a decrease in F.
It is obvious from the test results as shown in Figure 1and Table 1 that (τd)max is not defined by the particlesize and uniformity factor alone. To take the above intoconsideration, a new parameter, Fe, should be intro-duced such that Fe = F/Ur, wherein Fe can be termedas the equivalent fines content. By plotting (τ d)maxversus Fe as in Figure 2, it is encouraging to findthat (τd)max appears to have a better general trend ofincreasing with the decrease in Fe, in comparison withthat between (τ d)max and F.
Nevertheless, a further critical examination ofFigure 2 indicates that there are still some irregularresults within the samples:
(1) For those samples with high values of Gr, the Fevalue tends to be lower than those normal ones
with a similar (τd)max. This is probably due to thepresence of isolated large soil particles.
(2) For those samples with low values of Fe, the(τd)max value case tends to be lower than thosenormal ones with similar values of Fe. This isprobably due to the presence of isolated small soilparticles.
(3) For those samples where F > 50% but C < 25%,some of the test results do not follow the normalpattern. For the same (τd)max, Fe tends to be con-siderably higher. This is probably due to the veryhigh S, thus resulting in a relatively lower value ofUr and hence a higher value of Fe.
(4) For those with C > 25%, some of the test resultsalso do not follow the normal pattern. This is tobe expected since D25 in this case has to be deter-mined by extrapolation and, as a result, the value ofUr (= log10(D75/D25)) and hence Fe determinedtend to be very unreliable.
(5) For those with PSD determined after compaction,the Fe value tends to be generally higher for thesame (τd)max (Table 1).
After removing those irregular data resulting fromsuch factors as high values ofF (F > 50%butC < 25%)or high C (C > 25%), it can be seen from Figure 3that the results are less scattered. Nevertheless, in somecases, the scattering is still somewhat too wide. Accord-ingly, there must be other factors affecting (τ d)max.
Figure 2. Variation of (τ d)max with Fe for all soil materials.Notes:1. The tests carried out by all four laboratories are included.2. Unless otherwise stated, all PSDs were determined before compaction and all compaction tests were carried on a single sample.
H. Y. WONG

161
Table 1. Effect of the particle size, PSD and Fe on (τ d)max.
HKIE
TRANSA
CTIONS

162
Figure 3. Variation of (τ d)max with Fe for all soil materials after excluding those with high F or high C.Notes:1. The tests carried out by all four laboratories are included.2. Unless otherwise stated, all PSDs were determined before compaction and all compaction tests were carried on a single sample.
At present, the following factors are the most obviousones:
(1) Soil crushing.(2) Isolated large soil particles.(3) Isolated small soil particles.(4) Testing laboratories.
Discussion of the various parameters affectingsoil compaction
It can be seen that soil crushing affects both the particlesize (i.e. F) as well as the PSD (i.e. Ur). As for isolatedlarge (or small) particles, these are probably the resultof changing the mode of soil particle packing and theirpresence will affect both the effective value of F (Feff )and the effective dry density ((τ d)eff ). As for testing lab-oratories, this might result from a difference in practiceamong testing laboratories.
Effect of soil crushing
In Hong Kong, in determining (τ d)max in the labo-ratory, it is sometimes impractical to obtain a largequantity of soil sample, especially when samples aretaken from drill holes. Accordingly, the “single sam-ple” method is often adopted whereby a large portionof the same sample is used for repeated compaction. Ifthe soil is susceptible to crushing, then the particle sizedecreases with each compaction point and is thereforequite different at the end of the test.
A total of around 40 (τ d)max tests have been executedin which the PSD test was carried out before and after
the complete compaction test, with the values of F, Urand Fe summarised in Table 1. It can be seen that practi-cally in all cases, there is a crushing of the soil particlesafter compaction, thus resulting in an increase in thevalue of F. On the other hand, only about 70% of theUr values increase. Since Fe = F/Ur, it follows that withsoil crushing, the increase in Fe is on average smallerthan the increase in F.
Moreover, in carrying out the laboratory compactiontest, it is practically impossible to use the same sin-gle sample at all stages of compaction. This is becauseafter completing each compaction point, part of thecompacted sample is taken out for moisture contentdetermination. Then fresh soil samples are added fromthe bulk sample together with the addition of waterbefore being thoroughlymixed for the next compactionpoint. Normally, more soil particles need to be addedbefore reaching the (τ d)max.
Another important point to note is that there areonly five to six compaction points in a complete com-paction test, with (τd)max occurring at around the thirdcompaction point. It follows that when carrying out thecompaction for the (τd)max point, parts of the sam-ple have only been compacted twice and rarely threetimes, compared with five to six compactions at the endof a complete compaction test. With all the above fac-tors taken into consideration, the amount of crushingat (τd)max is probably at most about one third of thatdetermined after compaction. In equation form, if:
(Fe)b = Fe before compaction,
H. Y. WONG
163
(Fe)a = Fe after compaction, and
(Fe)act = estimated actual Fe at (τd)max,
then:
(Fe)act = (Fe)b + [(Fe)a − (Fe)b]/3.
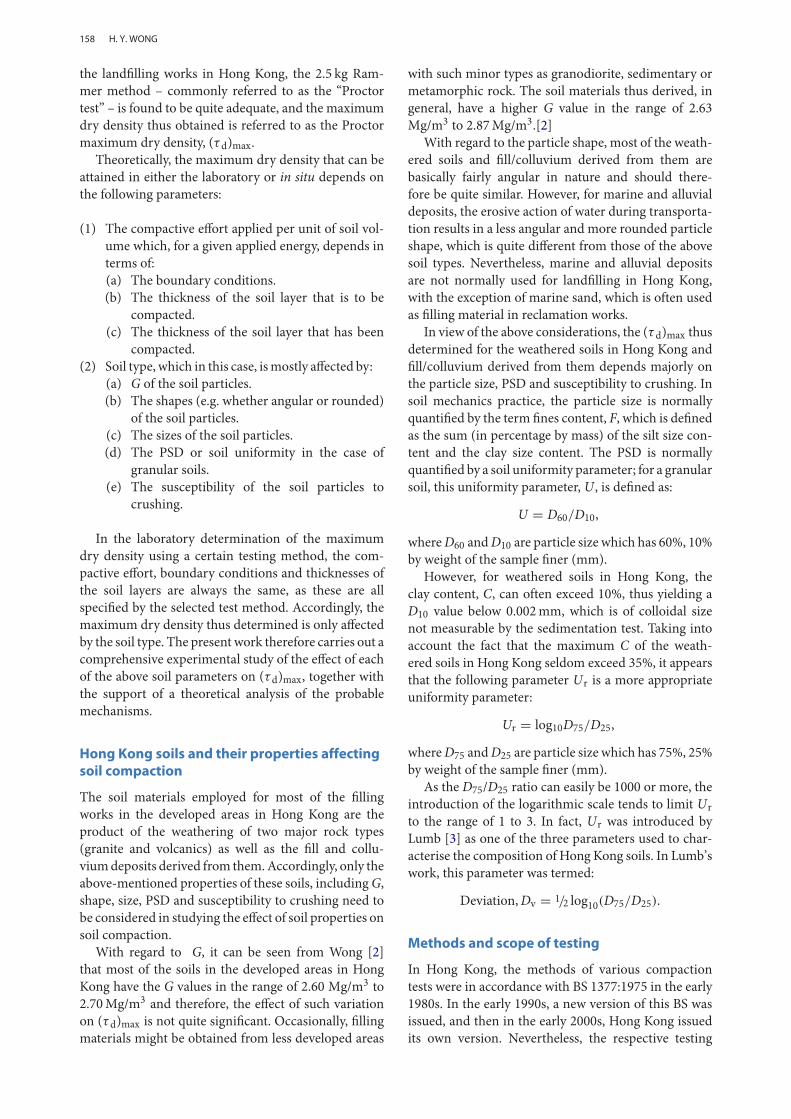
(Fe)act can be calculated from the (Fe)b and (Fe)aresults in Table 1. Plotting (Fe)act against (Fe)b indicatesthat the effect of crushing is relatively small (Figure 4).This can be further supported by plotting (τ d)maxagainst (Fe)act and (τd)max against (Fe)b in the same
Figure 4. Effect of susceptibility to crushing observed by com-paring estimated actual Fe at (τ d)max with Fe determinedbeforecompaction.Note: All compaction tests carried out on a single sample at Laboratory D.
Figure 5. Effect of susceptibility to crushing observed by com-paring (τ d)max versus the estimated actual Fe at (τ d)max with(τ d)max versus the Fe determined before compaction.Note: All compaction tests carried out on a single sample at Laboratory D.
figure, which indicates a fairly small difference in thetwo groups of results (Figure 5).
Effect of isolated large particles
This effect is most dominant in coarse soil sampleswhen a few of the extra large particles are isolated fromeach other. Under this condition, these large particlescan be considered as inert and the rest of the soil parti-cles are effectively occupying a larger volume. Consideras in Figure 6(a), the “idealised actual arrangement” ofsuch a type of soil with x%bymass of large soil particlesconsidered as inert. The above can be further simpli-fied by dividing the soil particles schematically into aninert portion and an effective portion, as in Figure 6(b).After excluding the weight and volume of the inert soilparticles in the effective portion, the (τ d)eff and Feff ofthis portion are shown in Figure 6(b) and calculated asfollows:
(τd)eff = (1 − x/100)(τd)/{1 − (x/100)(τd)/G}, (1)
Feff = F/{(1 − x/100)}, (2)
where x is the percentage by mass of large soil particlesconsidered as inert, and τd = W/V = dry density asmeasured = total mass/total volume. From the aboveequations, this effect results in a lower (τ d)eff but ahigher Feff . As expected, this effect is most likely tooccur in samples with very high gravel content.
However, it is not limited to coarse soil samples;when some relatively large isolated soil particles arepresent in a relatively fine soil sample, then even soilswith a fairly high value of F can have a (τ d)max valuethat is measured as fairly high. As demonstrated fromTable 2, for isolated large soil particles of 20%, (τ d)eff isonly 1.667Mg/m3 when (τd)max as measured is as highas 1.800Mg/m3. This phenomenon tends to explain theexperimental fact in Figure 3 in which for some of thesoil samples with fairly high F, the (τd)max obtainedin the Procter test is still fairly high. This is becausethe isolated large soil particles do not require any com-pactive effort and therefore, the amount of compactionachieved in any compaction test is basically controlledby (τd)eff . Unfortunately, it is the higher τ d that is actu-ally measured and thus reported as (τ d)max. As for(τd)eff , this normally cannot be determined as the per-centage of isolated large soil particles is very difficult, ifnot impossible, to measure.
Effect of isolated small particles
In contrast to the isolated large soil particles, a largeportion of the soil particles in this case are consider-ably larger and are bridgingwell with each other to forma stable soil skeleton. The remaining portion of soilparticles is thus considerably smaller and might effec-tively become isolated if they cannot completely fill the
HKIE TRANSACTIONS

164
Figure 6. Effect of different modes of soil particle packing on (τ d)max resulting from isolated large soil particles: (a) idealised actualarrangement; and (b) idealised effective arrangement.
Table 2. Variation of (τ d)eff with x (percentage of isolated large soil particles).
τ d = 1.80Mg/m3 and G = 2.65Mg/m3
x(%) 2.500 5.000 10.000 15.000 20.000 25.000 30.000(τ d)eff/τ d(Mg/m3) 0.992 0.983 0.966 0.946 0.926 0.903 0.879(τ d)eff(Mg/m3) 1.786 1.769 1.739 1.703 1.667 1.625 1.582
voids thus formed by the considerably larger soil par-ticles, as indicated schematically in Figure 7(a). In thiscase, as far as the soil shear strength and compressibil-ity are concerned, the effective soil density behaves asif these considerably smaller soil particles are absent.Accordingly, (τ d)eff is given by:
(τd)eff = WL/V , (3)
where WL is the total mass of considerably larger soilparticles. This is related to τ d by the following equation:
τd = (τd)eff + XS/V , (4)
where XS is the total mass of isolated small soil par-ticles = 0 to WS, and WS is the maximum soil masspossible for smaller soil particles to remain isolated.
It can be seen from Equation (4) above that τ d has alower bound value as well as an upper one (Figures 7(b)and (c), respectively). As τd is reported as (τd)max, it fol-lows that in the lower bound case in Figure 7(b), whenvoids formed by considerably larger soil particles arenot filled at all by considerably smaller soil particles(i.e. XS = 0), (τ d)max is fairly low and F is also fairlylow. A careful examination as shown in Table 1 indi-cates that this type of packing is most likely to occur
when the total gravel plus sand content is in the order of70% ormore. Moreover, the percentage of gravel is nor-mally lower than that of sand, as can be seen from themore detailed description of the various particle sizes inTable 3.
On the other hand, in the upper bound case inFigure 7(c), when voids formed by considerably largersoil particles are completely filled by considerablysmaller soil particles, τ d and hence (τ d)max are higher.Under such conditions, the (τ d)max versus Fe plot doesnot normally show irregular results.
Effect of testing laboratories
So far the test results from Figures 1 and 3 are fromfour different laboratories, designated A, B, C and D.Accordingly, the testing equipment and practice as wellas the testing staff are somewhat different in each lab-oratory, despite the fact that all of these tests havebeen carried out based on the same standard. Fromthe combined plot of all the laboratory testing resultsin Figure 8, it can be seen that despite of some localscattering, there is no significant difference among thevarious laboratories.
H. Y. WONG

165
Figure 7. Effect of different modes of soil particle packing on (τ d)max resulting from isolated small soil particles: (a) normal case; (b)lower bound case; and (c) upper bound case.
Summary of soil test results analysis
A detailed study of the test results in Table 1 and Fig-ures 1 to 8 indicates the following general findings:
(1) In the (τ d)max versus Fe plot, samples with iso-lated large soil particles normally have a (τ d)maxthat is higher than the normal trend, while Fe canbe lower or higher. In contrast, in samples withisolated small soil particles, the values of Fe and(τd)max are always lower than the normal trend.
(2) In the case of isolated large soil particles, shearstrength, compressibility and permeability remainthe same with or without these isolated large soilparticles and these properties are controlled by(τd)eff rather than by (τ d)max, the latter beingthe dry density as measured in the Proctor test.On the other hand, for the case of isolated small
soil particles, only the shear strength and com-pressibility remain the same and the permeabilitydecreases with the addition of isolated small soilparticles.
(3) By excluding such test results with (a) F > 50%and C < 25% or (b) C > 25% as in Figure 3, a lotof the irregular results in Figure 2 are removed.Under such conditions, there is a far superior trendof increasing (τ d)max with a decrease in Fe. A fre-quency plot of (τd)max results as in Figure 9(a)yields a mean of 1.792Mg/m3, and 90% of theresults are within the range of 1.607 Mg/m3 to1.962Mg/m3.
(4) For those test results with (a) F > 50% andC < 25% or (b) C > 25%, there is no close cor-relation between (τ d)max and Fe (Figure 2). Thisimplies that the proposed uniformity factor Ur
HKIE TRANSACTIONS

166
Table 3. Sand and gravel content of samples with low (τ d)maxand low F.
(τ d)max(Mg/m3) Gr(%) Sa(%) S(%) C(%) F (%)
1.64 32 48 18 2 201.63 59 26 7 8 151.63 52 31 9 9 181.63 27 42 16 15 311.62 64 30 5 1 61.62 58 35 6 1 241.62 30 48 14 8 221.61 50 30 13 7 201.61 41 35 16 8 241.61 32 42 20 6 261.57 30 50 19 1 201.55 31 34 53 8 91.51 40 43 16 1 171.51 23 48 21 8 291.49 20 58 12 10 221.48 16 63 14 7 21
Note: All data are percentage content by weight.
Figure 8. Effect of different laboratories on the variation of the(τ d)max with Fe.
in weathered soils cannot be applied to thesesoils. A frequency plot of (τ d)max results as shownin Figure 9(b), yielding a mean of 1.636Mg/m3,and 90% of the results are within the range of1.393Mg/m3 to 1.786Mg/m3.
(5) Figures 4 and 5 demonstrate that the effect ofcrushing on (τd)max is not very significant. Theabove is further supported by comparing theresults from Laboratory A with other laboratories(Figure 8).
(6) Most of the irregular test results still existing inFigure 3 can be explained quite satisfactorily in aqualitativemanner by the presence of isolated largeor small soil particles, as schematically presented inFigures 6 and 7, respectively.
Summing up the above findings, it is clear that thesoil materials adopted for Proctor test in Hong Kongcan be classified into two distinct groups:
Group A: Soil materials excluding those witheither (a) F > 50% andC < 25%or (b)C > 25%,these being the test results in Figure 3.
Group B: Soil materials including only thosewith either (a) F > 50% and C < 25% or (b)C > 25%, these beingmost of the irregular resultsin Figure 2.
More importantly, when comparing the Group Aand Group B materials with the weathered soils of thetwo major rock types in Hong Kong, it can be seen thatC/HDG can be classified as Group A materials whilstC/HDV can be classified as Group B materials. Theabove conclusions can be substantiated by the followingexperimental data:
(1) From the limited data available in Hong Kongso far as reported by Ng and Lumb [5], (τd)maxvalues range from 1.55 Mg/m3 to 1.95Mg/m3 for
Figure 9. Frequency plots of the (τ d)max values for (a) soil materials excluding those with high F or high C; and (b) soil materialsincluding only those with high F or high C.
H. Y. WONG

167
C/HDG and from 1.35 Mg/m3 to 1.80Mg/m3
for C/HDV. These are surprisingly close to thepresent test results for materials from GroupA (1.607Mg/m3 to 1.963Mg/m3) and Group B(1.393Mg/m3 to 1.786Mg/m3), as shown in Fig-ures 9(a) and (b), respectively.
(2) From the laboratory testing results collected sys-tematically by the author, it can be seen from F ver-sus in situ dry density τ d as plotted in Figure 10(a)for C/HDG and Figure 10(b) for C/HDV thatmost C/HDG soil samples have F < 50% andmostC/HDV samples have F > 50%. In fact, some of
Figure 10. Relationship between F and in situ dry density for (a) C/HDG in Hong Kong; and (b) C/HDV in Hong Kong.
HKIE TRANSACTIONS

168
these test results have been reported elsewhere byWong [6].
Implications of compaction results on fillingworks in Hong Kong
The compaction test results considered so far have avery significant effect on filling works in Hong Kong.These filling works can be classified in accordance withthe General Specification for Civil Engineering Works(2006 Edition) (GS 2006) issued by the Civil Engi-neering and Development Department (CEDD) of theHKSAR Government [7] into two general categories:(a) marine filling which normally does not require anycompaction except above the mean sea level; and (b)landfilling for road embankments, slopes and founda-tion for structures, all of which requiring very stringentcompaction control. It is the latter type of filling worksthat are of primary concern in Hong Kong.
As for the type of fill material that can be adopted,this is specified in Clause 6.09 and Table 6.1 of GS 2006[7] (Table 6.1 is reproduced in Table A1 of this paper).In general, there are six types of fillmaterial,[7] ofwhichonly three types (fine fill, general fill and special fill)require the Proctor compaction test, and these are thematerials adopted in most landfilling works. The otherthree types: granular fill, rock fill (grade 200) and rockfill (grade 400) are often employed formarine filling, forwhich the Proctor compaction test is not well suited.
For landfilling work in Hong Kong, the type ofsoil normally adopted is either C/HDG, C/HDV orfill/colluviumderived from them, and these can inmostcases satisfy the requirements of GS 2006, [7] probably
with the exception of either one of the following twocases: (1) the coefficient of uniformity requirementexceeding 50 as specified in Clause 6.09(4) or (2)F<45% in Table 6.1 for the special fill, in particularfor the uniformity requirement. This is because the claycontent in these soils, in particular inC/HDV, can easilyexceed 10%, as shown in Figure 10(b). Accordingly,D10can only be obtained by extrapolation and this is highlyunreliable, also bearing inmind that particle sizes of theorder of 0.002mmare approaching colloidal size. As forthe F < 45% requirement,most C/HDVmaterials haveF > 45% (Figure 10(b)) and this can also occur in someof the C/HDG samples (Figure 10(a)).
As for the compaction control of the filling materi-als, this is specified in by Clause 6.48(3) of GS 2006 [7].Normally, it is necessary for the filling materials to becompacted to a relative compaction of 95% (i.e. 95%of the (τd)max) irrespective of the type of soil materialadopted. However, Clause 6.81(5) of GS 2006 allows thelocation of an in situ density test to be different fromthat for (τd)max (Clause 6.75(2)), in spite of the fact thatthey must be from the same batch.
The experimental evidence so far indicates that(τd)max is not controlled by the soil PSD alone. In thepresent case, for weathered soils, PSD is quantified bythe uniformity parameter Ur. As demonstrated pre-viously, (τd)max is controlled by the combined effectof the particle size F and the PSD Ur. As 90% of theGroup A soil materials are within the range from about1.60 Mg/m3 to 1.95Mg/m3 (Figure 9(a)), such densityvalues should satisfy the engineering requirements formost special fill materials, probably with some near thelower limit.
Table 4. Limitations of using C/HDG or C/HDV as landfill material in accordance with GS 2006 [7].
Limitations of use
aType of landfill materialGS 2006 requirementsthat might be violated bC/HDG fill cC/HDV fill
Fine fill material Table 6.1: 100% passing 75-mm sieve In general no limitations as far as theparticle size and PSD are concerned
In general no limitations as far as theparticle size and PSD are concerned
General fill material Table 6.1: 100% passing 200-mm sieve;75% to 100% passing 75-mm sieve
In general no limitations as far as theparticle size and PSD are concerned
In general no limitations as far as theparticle size and PSD are concerned
Special fill material Table 6.1: 100% passing 75-mm sieve;0% to 45% passing 0.063-mmsieve; Clause 6.09(4): U > 50 (i.e.D60/D10 > 50); when C > 10%,D10 is obtained by extrapolation
Majority of samples have F < 45%; alot of samples have dC > 10%
Majority of samples have F > 45%; alot of samples have dC > 10%
Granular fill material Table 6.1: 100% passing 75-mm sieve;0% to 5% passing 0.6-mm sieve
The particle size in general too fine;Proctor test normally not applicable.
The particle size in general too fine;Proctor test normally not applicable.
Fine fill material, Clause 6.48(3): relative compactionat least 95%, except as stated inClauses 6.50(2), 6.52(1), 6.54(2), 6.57and 6.66
From Figures 3 and 9 (a), most(τ d)max results > 1.65Mg/m3areacceptable
From Figures 2 and 9 (b), most(τ d)max results < 1.65Mg/m3areunacceptable
general fill material,special fill material
Note: aAccording to Table 6.1 of GS 2006, there are six types of landfill; however, only the (τ d)max of fine fill, general fill and special fill can be determined usingthe Proctor test;
bFigure 10(a) for variations of F with τ d for C/HDG fill;cFigure 10(b) for variations of F with τ d for C/HDV fill;dClay has an upper particle size limit of 0.002mm – in routine testing, particles of size < 0.002mm are not determined as this is approaching colloidal sizeand cannot be measured in a routine test.
H. Y. WONG

169
Group B soil materials are in general too fine forthe special fill materials. However, as both fine fill andgeneral fill materials have not placed any limits onthe particle size F or PSD Ur, it follows that bothGroup A and Group B soil materials can be adoptedstrictly in accordance with GS 2006. [7] However, themean (τd)max value of Group B soil materials is con-siderably lower at about 1.65Mg/m3, and 90% of thetest results are within the range of about 1.40 Mg/m3
to 1.80Mg/m3 (Figure 9(b)). About half of the densityvalues are somewhat on the low side for a lot of the engi-neering works. Moreover, the uniformity of the GroupB soil materials cannot be represented by neither Unor Ur.
From a critical review of the compaction and PSDtest results, the limitations of using C/HDG fill orC/HDV fill as landfill material in accordance with GS2006 [7] are summarised in Table 4. It should be notedthat the following items of the fillingwork requirementsas specified byGS 2006 [7]might be violated andwouldrequire further attention:
(1) U requirement exceeding 50, as specified byClause6.09(4).
(2) F < 45%, as specified in Table 6.1 of GS 2006 [7]for the special fill.
(3) Relative compaction requirement > 95%, as spec-ified in Clause 6.48(3).
Conclusions and recommendations
General conclusions
From more than 400 (τd)max tests together with thedetailed PSDs for each of these tests, the followinggeneral conclusions can be drawn:
(1) For the soil in Hong Kong, the (τ d)max attainedin a Proctor compaction test can vary very con-siderably from less than 1.600 Mg/m3 to over2.000Mg/m3, and this has only a very generaltrend of increasingwith a decrease in F (Figure 1).
(2) Introducing an equivalent fines content parame-ter Fe ( = F/Ur) which represents the combinedeffect of the particle size F and PSD Ur, there isa far more consistent trend of (τ d)max increasingwith a decrease in Fe (Figure 2).
(3) Removing from Figure 2, those values with highF where either (a) F > 50% and C < 25% or (b)C > 25% results in some of the irregular resultsbeing eliminated (Figure 3).
(4) Susceptibility to crushing has no significant effecton (τ d)max (Figures 4 and 5).
(5) Most of the remaining irregular results in Figure 3can be explained quite successfully in a qualita-tive manner through the difference in the modeof particle packing due to the presence of isolatedlarge soil particles (Figure 6) or the presence ofisolated small soil particles (Figure 7).
(6) No significant difference was found among thedifferent laboratories that conducted the tests(Figure 8).
(7) Of the two common types of soil material inHong Kong, C/HDG and C/HDV – as well as thefill/colluvium derived from the erosion of thesematerials – only C/HDG and the fill/colluviumthus derived are suitable for most engineeringworks when the (τd)max attained during com-paction work is also considered (Figure 9(a)).
(8) Strictly in accordance with GS 2006 [7] as sum-marised in Table 4, most of the C/HDV and thefill/colluvium thus derived are suitable for the finefill material and general fill material. These arealso suitable for part of the special fill material,provided that F < 45% and C < 10%. However,the very low (τd)max attained during compactionwork render them unsuitable for most engineer-ing works (Figure 9(b)).
(9) The uniformity requirement of U > 50 as spec-ified in Clause 8.09 of GS 2006 [7] should bemore critically reviewed, as this is basically onlysuitable for purely granular material. For mostC/HDV and quite a portion of C/HDG, the Ccan easily exceed 10% and therefore D10 andhence U = D60/D10 cannot be calculated. Theuniformity term as proposed in the present papershould be considered, since this is a more usefulparameter forHongKong soils, as first introducedby Lumb [3].
(10) Finally, it should be noted that the number ofsamples tested might not be large enough to pro-vide very conclusive results for all soil types inHong Kong. Nevertheless, the results so far areacceptable for the two common soil types ofC/HDG and C/HDV. With more test results, thegeneral trend for all soil types could be estab-lished. Another point to note is that all of thesetests were carried out by well-established govern-ment or commercial laboratories and thereforethe results can be considered reliable.
Recommendations for future works
Based on the present test results, some general recom-mendation for future works are as follows:
(1) The normal practice of adopting acceptance crite-rion of 95% relative compaction, irrespective of theactual dry density achieved, should be more criti-cally reviewed, in particular for more fine-grainedsoils.
(2) As the Group B soil materials primarily comprisethose fill materials from volcanic areas and someof the (τd)max values are unacceptably low, it fol-lows that soil materials from these areas should,whenever possible, not be used in landfilling forcivil engineering works.
HKIE TRANSACTIONS
170
(3) In order to ensure that the (τ d)max results are ofthe correct order, each test should be accompaniedby a complete PSD test. This is because (τd)max isclosely related to Fe for most soils in Hong Kong.
(4) As most of the present test results are for soilsfrom the more developed granitic and volcanicareas which have more or less the same G valuesas reported byWong [2], it follows that any correc-tion of (τd)max forG is not necessary in these areas.Nevertheless, for the less developed areas whichprobably have higher G values, additional deter-mination of the G values for these soils has to becarried out in order to assess any necessity for thecorrection of (τ d)max.
Acknowledgements
The author would like to thank all those who have taken partin the testing work referenced in the present paper, in partic-ular those working in the Hong Kong PWCL, as a very largeportion of this testing work was carried out by them. How-ever, in view of the very large number of tests carried out overan extremely long time span, it is impossible as well as unfairjust tomention a few names. The author also offers his thanksto the whole soil testing industry in Hong Kong, as most ofthe major soil testing laboratories have taken part, to variousextents, in these tests.
Notes on contributor
Ir Dr Hong-yau Wong received hisB.Sc.(Eng) andM.Sc.(Eng) degrees fromThe University of Hong Kong, and hisPh.D. degree from McGill University,Canada, after which he worked in theUK in the early 1970s as a Research andDevelopment Engineer in various engi-neering fields such as piling, founda-tion, tunnelling, ground improvement
and instrumentation. Since the late 1970s, he has workedin Hong Kong in the field of Civil Engineering involvingpiling, foundation, geotechnical engineering and laboratorytesting. Moreover, he has engaged in various disciplines suchas consultant, specialist contractor, checking authority andpart-time university lecturer. At present, he is a ConsultingCivil Engineer.
References
[1] BSI. Methods of test for soils for engineering purposes(BS 1377: 1990, Parts 1 to 9). British Standards Institute;1990. p. 406.
[2] Wong HY. Particle density of Hong Kong soils –a theoretical and experimental study. HKIE Trans.2013;20(2):79–91.
[3] Lumb P. The variability of natural soils. Selected topicsin geotechnical engineering-lumb volume. Canberra:University College, University of New South Wales;1991. p. 89–115.
[4] Geospec 3. Model specification for soil testing. HongKong: Geotechnical Engineering Office (GEO), CivilEngineering andDevelopmentDepartment, theHKSARGovernment; 2001.
[5] Ng BWY, Lumb P. Compaction requirement for fillslopes. Hong Kong Engineer. 1980;8(9):27–29.
[6] Wong HY. Discussion on “Long term durability of steelsoil nails in Hong Kong by Herman Y K Shiu & Ray-mond WM Cheung. HKIE Trans. 15(3):24–32”. HKIETrans. 2009;16(1):45–47.
[7] CEDD. General specification for civil engineeringworks (GS 2006). Civil Engineering and DevelopmentDepartment, the HKSAR Government; 2006.
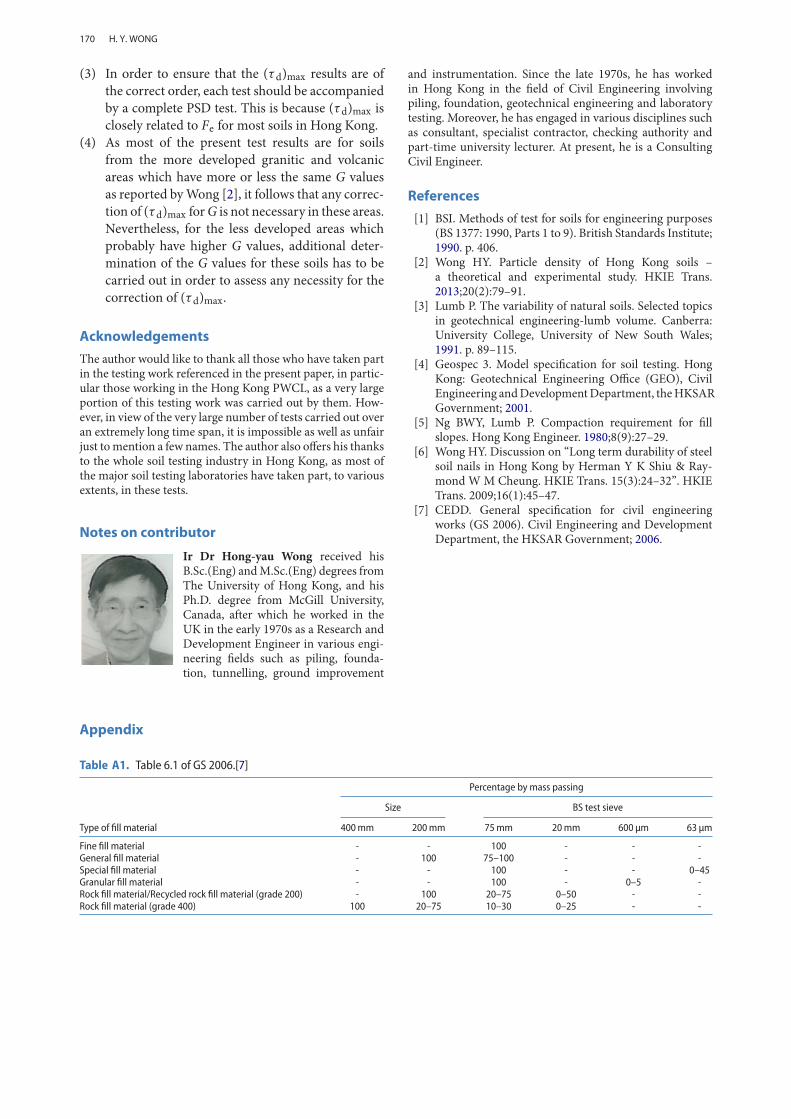
Appendix
Table A1. Table 6.1 of GS 2006.[7]
Percentage by mass passing
Size BS test sieve
Type of fill material 400mm 200mm 75mm 20mm 600 μm 63 μm
Fine fill material - - 100 - - -General fill material - 100 75–100 - - -Special fill material - - 100 - - 0–45Granular fill material - - 100 - 0–5 -Rock fill material/Recycled rock fill material (grade 200) - 100 20–75 0–50 - -Rock fill material (grade 400) 100 20–75 10–30 0–25 - -
H. Y. WONG
Copyright © 2022 FDOKUMEN