Chemical compaction of illite shale An experimental study
211
ETH Library Chemical compaction of illite shale An experimental study Doctoral Thesis Author(s): Bruijn, Rolf H.C. Publication date: 2012 Permanent link: https://doi.org/10.3929/ethz-a-007303652 Rights / license: In Copyright - Non-Commercial Use Permitted This page was generated automatically upon download from the ETH Zurich Research Collection . For more information, please consult the Terms of use .
-
Upload
khangminh22 -
Category
Documents
-
view
2 -
download
0
Transcript of Chemical compaction of illite shale An experimental study

ETH Library
Chemical compaction of illite shaleAn experimental study
Doctoral Thesis
Author(s):Bruijn, Rolf H.C.
Publication date:2012
Permanent link:https://doi.org/10.3929/ethz-a-007303652
Rights / license:In Copyright - Non-Commercial Use Permitted
This page was generated automatically upon download from the ETH Zurich Research Collection.For more information, please consult the Terms of use.
Chemical Compaction of Illite Shale:An Experimental Study
byRolf H.C. Bruijn
2012Zurich, Switzerland

Cover image: a broken surface SE image of PAT1 (C) sample P1328. It shows a
high magnification of the characteristic, yet complex microstructure of synthesized
metapelite comprised of silty and clayey quartz clasts and occasionally folded
ultrafine mica and illite crystals as matrix material.
Chemical compaction of illite shale: An
experimental study
ETH ZURICH
Prof. Dr. Jean-Pierre Burg examiner
Dr. Philip M. Benson co-examiner
Dr. Dan Faulkner co-examiner
2012
Date of birth 05.05.1983
Citizen of the Netherlands
accepted on the recommendation of
ROLF HENDRIK CORNELIS BRUIJN
DISS. ETH NO. 20144
A dissertation submitted to
for the degree of
Doctor of Sciences
presented by
M.Sc. Earth Sciences,
Utrecht University, the Netherlands

This work was financially supported by the Swiss National Science Foundation
grants 200020-132772 and 200021-116153, awarded to Prof. Dr. J-P. Burg, Dr. L.
Burlini and Dr. S. Misra.
On this thesis rests copyright.
The entire thesis except chapter 4
Copyright © 2012, R.H.C. Bruijn, following ‘Ordinance on Doctoral Studies, art.
34’, issued by ETH Zurich, Switzerland.
Chapter 4
Copyright © 2011, Elsevier B.V., following ‘Journal Publishing Agreement’ issued
by Elsevier B.V., the Netherlands, for article “Mechanical and microstructural
development of Carrara marble with pre-existing strain variation”, with
PII-number: S0040-1951(10)00390-2.
Cover and book design: R.H.C. Bruijn
Printed by printenbind.nl, Amsterdam

Dedicated to Luigi Burlini
may he rest in peace,
and my mother and sisters,
for allowing me to go on this adventure
far away from home


Table of contents
Abstract 1 Kurzfassung 3
Chapter 1: Introduction 7 ____________________________________________________________________________________________________
1.1: Literature background 8 1.2: Problem statement 10
1.3: Rationale 11 1.4: Thesis outlook 12
Chapter 2: Sediment compaction 15 ____________________________________________________________________________________________________
2.1: Compaction kinetics in nature and experiments 16
2.2: Shale/mudstone compaction 24 2.3: Sandstone compaction 28 2.4: Limestone compaction 30 2.5: Very low-grade metamorphism 31 2.6: Rock magnetism 33
Chapter 3: Methods and analytical tools 35 ____________________________________________________________________________________________________
3.1: Sample preparation and experiments 36 3.2: Compaction apparatus 38 3.3: Data recording and processing for compaction stage 3b 44 3.4: Methods for chemical analysis 47 3.5: Porosity and density measurements 49 3.6: SEM imaging 50
3.7: Magnetic properties 53
Chapter 4: Evaluation of instrumentation precision 57 ____________________________________________________________________________________________________
Mechanical and microstructural development of Carrara marble with pre-existing strain variation 4.1: Introduction 59 4.2: Method 61
4.3: Results 65 4.4: Discussion 78 4.5: Conclusions 89 4.6: Acknowledgements 90

Chapter 5: Material: illite shale 91 ____________________________________________________________________________________________________
5.1: Illite shale selection 92 5.2: Physical state of the shales 92 5.3: Mineral phases and microstructure 94
5.4: Porosity/density and pores 98 5.5: Major element composition 100 5.6: Powder grain size 103 5.7: Choice of Maplewood Shale 105 5.8: Geological setting of Maplewood Shale 106
Chapter 6: Chemical model 109 ____________________________________________________________________________________________________
6.1: Phase stability modeling 110
6.2: Pseudosection 110 6.3: Water dependency 112 6.4: Dehydration and dehydroxylation 114 6.5: Summary 115
Chapter 7: Results 117 ____________________________________________________________________________________________________
7.1: Porosity and density 118 7.2: Finite volumetric strain 119 7.3: Finite sample deformation 120 7.4: Mechanical data and rheology 121 7.5: Chemistry 125 7.6: SEM mineral phase characterization 127 7.7: Microstructures 130
7.8: Pores 132
Chapter 8: Magnetism 135 ____________________________________________________________________________________________________
Chemical compaction of illite shale powder: magnetic characterization 8.1: Introduction 137 8.2: Method 137
8.3: Results 139 8.4: Discussion and conclusions 143 8.5: Acknowledgements 145
Chapter 9: Discussion 147 ____________________________________________________________________________________________________
9.1: Porosity and density 148 9.2: Accommodation of finite volumetric strain 150 9.3: Sample deformation path 151 9.4: Deformation mechanisms 153 9.5: Chemistry 156 9.6: Microfabric elements 157
Chapter 10: Conclusions and outlook 161 ____________________________________________________________________________________________________
10.1: Problem statement 162 10.2: Main findings 163 10.3: Conclusions 164
10.4: Recommendation for further research 165 References 169 Appendix A: List of physical quantities and established constants 187 Appendix B: List of compaction stage 3b experiments 190 Appendix C: Sample properties after compaction stage 2 and 3a 192
Appendix D: Sample properties after compaction stage 3b experiments 194 Appendix E: KFT water content 196 Acknowledgements 199 Curriculum Vitae 201

1
Abstract
Sediment diagenesis has been classified nearly a century ago as a key process for the
formation of rocks. In response to burial by overlying younger deposits, both mechanical and
chemical processes contribute to the compaction and consolidation of sediments, the degree of which
is controlled by both intrinsic and extrinsic parameters such as time, effective pressure, temperature,
mineral composition and grain size distribution. Rock physical properties are strongly affected by clay
diagenesis. So far, only the mechanical processes during clay diagenesis that dominate in the top 2-3
km of the sedimentary column have been simulated in the laboratory. However, studies on natural
shales and mudstones have also emphasized the importance of chemical processes for diagenesis,
although occurring in deeper domains and controlled more by temperature than by effective stress.
Foreland basins are typical examples of a tectonic setting where sediments are buried deep enough for
the activation of chemical processes. The effect of tectonic forces (deformation) on diagenesis is
however enigmatic and to date poorly constrained by experimental simulation. The present study
simulates the chemical processes in the laboratory and examines how tectonic forces affect
compaction processes that transform porous illite shale powder into compact crystalline metapelite.
The experimental compaction procedure consists of three stages. In the first compaction
stage, dry illite shale powder (originating from Maplewood Shale, New York, USA) was
mechanically compacted in a hydraulic cold-press with a vertical load of 200 MPa. The second stage
employed a hot isostatic press (HIP) set at 170 MPa confining pressure and 590 °C, and ensured
powder lithification. In the final stage, further compaction was achieved by either repeating HIP
treatment or by performing confined deformation tests in a Paterson-type gas-medium apparatus.
During the second HIP event temperature and pressure were set at 490 °C and 172 MPa. In the
Paterson apparatus three different stress regimes were applied: confined compression, confined
torsion or isostatic stress. For the first two regimes, deformation was enforced by applying a constant
strain rate ranging from 7×10⁻⁶ to 7×10⁻⁴ s-1. Experiments were performed at 300 MPa confining
pressure and a fixed temperature of 500 °C, 650 °C, 700 °C or 750 °C. These conditions were chosen
from a thermodynamic forward simulation of the stability of mineral phases. In some Paterson
apparatus tests, the effects of fluid availability and effective pressure were tested by respectively
venting the sample or applying a 50 MPa argon pore pressure.
Lithified samples were analyzed for their microstructural, chemical and physical development
with compaction using scanning electron microscopy, Karl Fisher Titration, X-ray diffraction and gas
pycnometry. Sample strength evolution was recorded during Paterson apparatus tests and strain
measured afterwards. The magnetic signature of the compacting metapelites was quantified by
measuring low and high-field anisotropy of magnetic susceptibility (AMS), and the ferrimagnetic
contributions were identified using rock magnetic methods.
2
The three-stage compaction resulted in synthetic metapelites ranging in porosity from 1.0 %
to 17.1 %. Linear increase in density and strong correlation between volumetric strain and pore
reduction indicate that compaction was accommodated primarily by pore space closing. In
deformation experiments axial strain was accommodated first by uniaxial shortening following pore
collapse and later by radial extension, which in some cases resulted in total decompaction. Illite
transformation to phengite and fluid assisted mass transfer resulted in diffusion creep type strain
accommodation. Mechanical pore closing is characterized by pronounced compaction hardening and
partial pore recovery upon unloading. Porosity reflects the progress of illite transformation, which is
accompanied by enhanced mica alignment and shape preferred authigenic quartz. The AMS signal
carried by the phyllosilicates increases linearly with compaction, quantifying the development of
texture and reflecting illite preservation. Deformation structures accommodate strain as alternative to
exhausted or delayed pore space reduction processes. The smallest visible pores in SEM, associated
with illite flakes, diminished as compaction progressed; larger pores were preserved.
Chemical compaction can be simulated in the laboratory provided mineral transformation
processes are sufficiently enhanced. In this, differential stress (tectonic force) acts merely as
accelerant. There is no evidence for otherwise altered fabric and porosity/density development with
the application of differential stress, in comparison with isostatically compacted metapelites.

3
Kurzfassung
Die Sedimentdiagenese gilt schon seit fast einem Jahrhundert als Schlüsselfaktor für die
Gesteinsbildung. Mechanische und chemische Prozesse führen zu einer Kompaktion und
Konsolidation der Sedimente aufgrund von Überlagerung durch jüngere Sedimente. Dieser Prozess
wird durch innere und äussere Parameter wie effektiver Druck, Temperatur, Mineralzusammensetzung
und Korngrössenverteilung kontrolliert. Die physikalischen Eigenschaften toniger Sedimente
verändern sich während der Diagenese sehr stark. Bis anhin wurde im Labor nur die mechanischen
Prozesse während der Diagenese von Tonsedimente simuliert. Studien über natürliche Tonsteine
jedoch heben die Wichtigkeit chemischer Prozesse während der Diagenese vor allem in tieferen Lagen
hervor, welche hauptsächlich von der Temperatur und weniger vom effektiven Druck kontrolliert wird.
Vorlandbecken sind typische Beispiele für tektonische Settings, wo Sedimente tief genug versenkt
werden, um chemische Prozesse zu aktivieren. Der Einfluss tektonischer Kräfte (Deformation) auf die
Diagenese ist jedoch weitgehend unbekannt und bis jetzt experimentell nur wenig untersucht. Diese
Studie simuliert die chemischen Prozesse der Diagenese im Labor und untersucht, wie sich tektonische
Kräfte auf Kompaktionsprozesse auswirken, bei denen porenreiches Illitpulver in kompakte kristalline
Metapelite umgewandelt wird.
Die experimentelle Kompaktion besteht aus drei Schritten: Im ersten Kompaktionsschritt
wurde das trockene Illitpulver (Material aus Maplewood Shale, New York, USA) mechanisch in einer
hydraulischen Presse bei Raumtemperatur mit einer vertikalen Belastung von 200 MPa verdichtet. Für
den zweiten Schritt wurde eine Sinter-HIP-Kompaktanlage (HIP) mit 170 MPa Druck und 590 °C
verwendet. Dieser Schritt garantiert die Lithifizierung des Pulvers. Eine stärkere Kompaktion im
letzten Schritt wurde entweder durch Wiederholung des zweiten Schrittes mit der HIP oder durch
Deformationstests in einem Apparat vom Typ Paterson erreicht. Im zweiten HIP-Durchgang wurden
Temperatur und Druck auf 490 °C und 172 MPa eingestellt. Mit dem Paterson-Apparat wurden drei
verschiedene Belastungszustände getestet: Kompression, Torsion oder Druck. Die Proben wurden für
die ersten beiden Zustände mit einer konstanten Verformungsrate zwischen 7×10⁻⁶ s-1 und 7×10⁻⁴ s-1
deformiert. Die Experimente wurden bei 300 MPa Druck und bei konstanten Temperaturen von 500
°C, 650 °C, 700 °C oder 750 °C durchgeführt. Diese Bedingungen wurden aufgrund eines
thermodynamischen Modells gewählt, das die Stabilitäten der Mineralphasen berechnet. Bei einigen
Tests mit dem Paterson-Apparat wurde der Einfluss von Fluiden und effektivem Druck getestet.
Die lithifizierten Proben wurden auf mikrostrukturelle, chemische und physikalische
Veränderungen mit zunehmender Kompaktion analysiert. Die Analysen wurden mit dem
Rasterelektronenmikroskop, Karl-Fischer-Titration, Röntgenbeugung und einem Pyknometer
durchgeführt. Die Veränderung der Probenfestigkeit wurde während der Tests im Paterson-Apparat
ermittelt und die Deformation jeweils nachträglich bestimmt. Das magnetische Gefüge des kompakten
4
Metapelites wurde als magnetische Anisotropie (AMS) in hohem und tiefem magnetischem Feld
gemessen und der ferromagnetische Beitrag mit Hilfe von petromagnetischen Methoden identifiziert.
Mit diesem Drei-Schritte-Kompaktionsverfahren wurden Metapelite mit einer Porosität von
1.0% bis 17.1% hergestellt. Die lineare Zunahme der Dichte und eine starke Korrelation zwischen
Volumenänderung und Porenreduktion weist darauf hin, dass die Kompaktion primär auf
Porenschliessung zurückzuführen ist. In den Deformationsexperimenten ging die axiale Belastung
anfänglich mit uniaxialer Verkürzung einher, gefolgt vom Schliessen der Poren und anschliessender
radialer Extension, die in einigen Fällen in totaler Dekompaktion resultierte. Die Transformation von
Illit zu Phengit und der fluid-unterstützte Massentransfer resultierten in Verformung durch
Diffusionskriechen. Die mechanische Porenschliessung hingegen ist charakterisiert durch starke
Kompaktionsverfestigung und teilweise Porenerholung nach der Entlastung. Die Porosität spiegelt den
Prozess der Illittransformation wider, welche von erhöhter Glimmereinregelung und Neuwachstum
von Quarz mit Kornformregelung begleitet wird. Das AMS-Signal der Phyllosilikate steigt linear mit
zunehmender Kompaktion an, quantifiziert die Entwicklung der Struktur und gibt die Illiterhaltung
wieder. Die Deformationsstrukturen entstehen als Alternative zu abgeschlossenen oder verzögerten
Poren-Reduktionsprozessen.
Die kleinsten unter dem SEM erkennbaren, mit Illitplättchen assoziierten Poren verringerten sich
während des Kompaktionsprozesses; grössere Poren blieben erhalten.
Die chemische Kompaktion kann im Labor unter der Voraussetzung simuliert werden, dass die
Mineraltransformationsprozesse genügend beschleunigt werden. Die Anlegung einer differentiellen
(tektonischen) Spannung wirkt dabei beschleunigend. Es gibt keinerlei Anzeichen dafür, dass sich
davon abgesehen das Gefüge und die Porosität/Dichte unter differentieller Belastung anders
entwickeln als bei isostatischer Kompaktion.

5

6

7
Chapter 1
Introduction
________________________________________________________________
James Oppenheim once said, “The foolish man seeks happiness in the distance, the wise grows it
under his feet.”
Preface
This first chapter sets the stage on which this thesis is based, describing the study undertaken to better understand the compaction of illite shale, an important sedimentary rock type. I begin by providing a historical overview of past studies on this topic followed by formulation of the main questions and rationale for the designed approach. In the literature background subchapter (1.1) the reader is acquainted with the 19th century work of Sorby, the importance of multi-disciplinary collaboration and exchange of knowledge, exemplified by the application of theories developed in soil mechanics (e.g. by Terzaghi; Casagrande; Skempton and Burland) for understanding clay compaction,
and the coupling between clay diagenesis and oil migration. The second subchapter (1.2) describes the problem addressed in the present study in the form of two questions that arose from the present day limitations of experimental and numerical models. Previous work has shown that the correlation between nature and laboratory analogues is generally good in the case of purely mechanical compaction. However, chemical processes, despite numerous natural studies that demonstrate their importance, are poorly known, and with few- if any laboratory controls. In a different view, numerical models that have incorporated tectonic non-vertical stresses show best correlation with nature. In particular, experimentally-derived constraints of rheological parameters routinely included in basin
models are under developed. Subchapter 1.3 concludes with the rationale for the experimental set-up and chosen conditions to test gaps in the current state of knowledge. Specifically, chemical compaction within laboratory timescales is achieved by thermally accelerated clay transformation rates. The illite-phengite transition is favored as reaction of interest over the smectite-illite transformation because of the larger extent of phengite stability. The applied pressures were chosen to avoid brittle failure during compression tests and prevent unwanted slip in torsion tests. The chosen deformation styles are inspired by sandstone compaction studies and add a new approach to
experimental clay compaction.
8
1.1: Literature background
One of the fundamental and oldest questions in geology deals with the genesis of rocks.
Rocks are classified into three categories: 1) sedimentary, formed after lithification of deposited loose
material, 2) igneous, formed from the cooling of magma and 3) metamorphic, sedimentary and
igneous rocks modified to be adapted to altered environmental conditions. In this thesis, the kinetics
and chemical processes leading to the lithification of clay-rich sedimentary rocks are addressed. Such
rocks and the structures they exhibit, have inspired scientists for centuries to unravel their origin. The
earliest laboratory based experiments date back to 1859, when Sorby simulated the deposition of sand
and mica flakes in a jar filled with water [Sorby, 1908]. He stated that water expulsion may reduce the
volume fraction by a factor of 9 for shales and slates to form, but only slightly reduce in the case of
the compaction of sandstone and siltstone. He recognized that compaction of sediments is primarily
due to the change in porosity and linked pressure and porosity reduction. Herein lies the key
observation that founded the principles behind many laboratory and field-based studies investigating
the origin of sedimentary rocks. More recently, some structures in sediments were attributed to
sediment compaction [e.g. Shaw and Munn, 1911; Shaw, 1918; Blackwelder, 1920; Powers, 1920;
1922; Monnett, 1922; Teas, 1923]. Among the first to provide experimental data on factors that
influence clay compaction, such as water content, permeability, shrinkage, swelling, plasticity,
elasticity and compressibility was Charles Terzaghi [Terzaghi, 1925]. His experimental work
[Terzaghi, 1925; 1927] and that of others [Sorby, 1908; Casagrande, 1932a; Skempton and Jones,
1944], and porosity data obtained from well log data [Hedberg, 1926; Athy, 1930] inspired the
development of clay compaction models [Athy, 1930; Hedberg, 1936; Weller, 1959; Vassoevich,
1960; Aoyagi and Asakawa, 1980] and best fits mathematical compaction curves [Hedberg, 1927;
Rubey, 1927; Athy, 1930]. However, the reliability of the latter was questioned due to the complex
nature of compaction processes [Hedberg, 1936; Velde, 1996] and the importance of mineral
composition on compaction curves in the laboratory [Skempton and Jones, 1944]. In compaction
models, porosity decreases when free adsorbed water is expelled from the pore space and solid
particles rearrange and pack more closely. Below approximately 10 % porosity, further compaction is
required, either by solution and recrystallization [Hedberg, 1936; Aoyagi and Asakawa, 1980] or solid
grain deformation of non-clay particles [Weller, 1959]. It took some decades and the advent of
advanced equipment for chemical analysis before the chemical processes in Hedberg’s compaction
model were coupled to the smectite to illite transition and associated water release [Powers, 1967;
Burst, 1969]. Poor correlation between empirical and natural compaction curves called for
compaction tests at pressure conditions comparable with nature, tests on undisturbed samples rather
than slurries, and technological advances in porosimetry [Jones, 1944; Skempton and Jones, 1944;
Hubbert and Rubey, 1959; Rubey and Hubbert, 1959].

9
Previously, the Atterberg limits, named after the Swedish chemist, were introduced for the
characterization of the plasticity and quantification of compositional variation among soils [Kinnison,
1915; Casagrande, 1932b]. The liquid limit (LL) is the moisture content at which the soil flows
viscously when agitated. Similarly, the plastic limit (PL) defines the moisture content above which
clay behaves plastically. Combining these yields the plasticity index (PI) that defines the difference
between the Atterberg limits. Clays typically have PI values of 20 to > 40, whereas lower PI values
are found for sands and silts [after Skempton and Jones, 1944; White, 1949]. At the time of deposition,
clays are typically at, or very close to, their liquid limit [Terzaghi, 1927; Skempton and Jones, 1944].
With increasing overburden load, water is expelled and the clay becomes plastic; further
pressurization causes the material to become brittle below its PL. This behavior is directly related to
the porosity evolution with depth. Empirically derived compaction curves and those obtained from
well logs display a first order dependence on the Atterberg limits, confirming the coupling between
compaction and the clay-size fraction and clay species [e.g. Skempton and Jones, 1944; Skempton,
1953; 1970; Olson and Mitrovas, 1962]. However, Weller [1959] argued that the standardized tests
for the determination of the Atterberg limits may not represent salt-water-submerged clay deposits.
High-pressure clay compaction studies showed the importance of saline solution on compaction [von
Engelhardt and Gaida, 1963; Warner, 1964], confirming Weller’s earlier hypothesis, and revealing
that the salinity of expelled fluids changes with overburden pressure [Chilingar and Knight, 1960;
Chilingar et al., 1963; Rieke et al., 1964; Chilingarian and Rieke, 1968; Chilingar et al., 1969; 1973;
Rosenbaum, 1976]. At about the same time, the link between fluid expulsion during compaction and
petroleum migration [e.g. Chilingar, 1961; McAuliffe, 1966; Chilingarian and Rieke, 1968; Dickey,
1975] was also proposed. Two requirements for petroleum migration into reservoir rocks were
identified: 1) the release of interlayer water during smectite illitization and 2) effective pressures
should be high enough for fluid flow in low permeability source rock [e.g. Chilingar and Knight,
1960; Powers, 1967; Burst, 1969; Perry and Hower, 1972]. Despite this advance, however, the
precise mechanism of petroleum migration out of clay-rich source rocks remained enigmatic [Aoyagi
et al., 1985].
The development of physical properties during clay diagenesis remained somewhat enigmatic
and further experimental clay compaction studies were undertaken, addressing not only the
development of rheological, thermal and hydraulic properties [e.g. Jones and Addis, 1986; Vasseur et
al., 1995; Dewhurst et al., 1998; 1999; Pouya et al., 1998; Mondol et al., 2007; Schneider et al.,
2011], but also that of microstructure [Djéran-Maigre et al., 1998; Fawad et al., 2010] and texture
[Baker et al., 1993; Voltolini et al., 2009]. In the meantime, chemical and physical characterization
and microstructural imaging of natural mudstones and shales continued to stress the importance of the
smectite-illite transformation during diagenesis of clay-rich sediments [e.g. Tribble et al., 1991; Lynch
et al., 1997; Kim et al., 1999; Aplin et al., 2003; 2006; Charpentier et al., 2003; Thyberg et al., 2010;
Day-Stirrat et al., 2010].
10
Since the mid-1980’s, advances in basin modeling shifted the focus from well log and
laboratory studies to computer simulations [e.g. Bethke, 1985; England et al., 1987; Ungerer et al.,
1990; Audet and Fowler, 1992; Audet and McConell, 1992; Hart et al., 1995; Luo et al., 1998; Pouya
et al., 1998; Suetnova and Vasseur, 2000] that were primarily based on 1) mathematical relationships
between porosity and effective pressure derived by Athy, [1930] subsequently improved by Smith
[1971], Shi and Wang [1986] and Schneider et al. [1996], 2) soil consolidation equations and critical
state theory in Lambe and Withman [1969], 3) Biot’s theory of poro-elasto-plasticity [1941] as
developed by Coussy [1991], 4) the Cam-Clay elasto-plastic model [Burland, 1990] or 5) visco-elastic
rheology. Karig and Hou [1992], Luo et al. [1998] and Pouya et al. [1998] questioned the accuracy of
these predominantly one-dimensional models, and stated the importance of non-vertical tectonic stress
for accurate modeling of compaction down to a few kilometers depth (or 50 MPa effective pressure).
1.2: Problem statement
More than fifty years of experimental clay compaction has resulted in a general agreement
between nature and models, regarding the mechanical aspects of compaction (i.e. up to 50 MPa
effective stress or 2-3 km depth) [e.g. Shi and Wang, 1986; Vasseur et al., 1995; Mondol et al., 2007;
Peltonen et al., 2009]. However, processes occurring in the deeper levels of sedimentary basins are
dominated by chemical processes such as illitization and dissolution/precipitation, rather than grain
rearrangement and orientation (i.e. mechanical processes) [e.g. Van der Pluijm et al., 1998; Ho et al.,
1999; Aplin et al., 2006; Day-Stirrat et al., 2008; Thyberg et al., 2010]. To date, the problem of deep
clay compaction is mostly addressed in the light of burial and vertical overburden loads.
Discrepancies between nature and 1-D numerical simulations demonstrate the limits of this perhaps
overly-simplistic approach [e.g. Aplin and Vasseur, 1998; Luo et al., 1998]. Puoya et al. [1998]
demonstrated the power of 3-D models that implement horizontal (tectonic) stress in their
calculations, albeit restricted to mechanical compaction in the top 3 km of the basin infill.
These processes are clearly not well understood. However, they are crucial to improve
modeling/simulation of basin development and diagenesis. As an example, the increasing awareness
of the influence of illitization upon the development of physical properties and fabric during clay
diagenesis emphasizes the scientific necessity for laboratory simulation of chemical compaction
[Bjørlykke and Høeg, 1997]. It was previously believed that the reaction kinetics for clay
transformation were too slow for laboratory simulations [Nygård et al., 2004; Mondol et al., 2007;
Fawad et al., 2010].

11
This thesis reports the first experiments designed to replicate mechanical and chemical
compaction of illite-rich sediment under conditions typical of deep sedimentary systems. Two main
questions are posed:
1. Can chemical compaction of clay sediments be simulated in the laboratory?
2. How does the stress regime affect clay compaction?
1.3: Rationale
Chemical compaction of clay-rich sediments is achieved by accelerating the transformation of
illite to phengite. Experiments performed at conditions beyond the stability field of illite are therefore
required.
Firstly, phase stability modeling of the phyllosilicates is used to select the temperature
conditions during compaction tests. In the chosen temperature range (500-750 °C), stability fields for
illite (< 300 °C) and phengite (< 675 °C) are traversed and partial melting is even expected (at > 710
°C). In terms of equilibrium mineral assemblages and reactions, these temperatures represent lower
crustal conditions. However, as experimental compaction tests are relatively short (timescale of
hours), phase equilibrium will not be achieved and several reactions are active simultaneously. The
activity of chemical reactions typically increases with temperature. Hence, reactions that occur at low
temperatures are more active (i.e. higher rates) and progress further than reactions that depend on high
temperature. The high temperatures employed in this study, although not strictly realistic, speed up
those reactions most relevant for the simulation of deep basinal processes, so that they can be studied
in the laboratory. Other reactions may be triggered as well, but will be too slow to have a significant
impact in the short-lived experiments.
This experimental study utilizes the illite to phengite transition over the smectite to illite
transition as the reaction of interest. The temperature range for which illite and phengite are stable is
much wider for phengite than for illite. For smectite illitization to proceed with laboratory time scales
temperature well within the phengite stability field are deemed necessary. Simultaneous illite and
phengite formation would unnecessarily complicate the analysis and interpretation of the effect of
chemical processes on shale burial.
Finally, although the effective pressures applied in this study (170-300 MPa) exceed those
typically associated with ~10-18 km deep basins, such pressures were needed to avoid brittle failure
during deformation tests. From the Mohr-Coulomb criterion, it is generally accepted that rocks
strengthen with increasing pressure. Moreover, higher pressure prevents unwanted slip between
assembly spacers in torsion tests. It is justified to work with such pressures for two reasons. 1) The
rate of mechanical compaction (i.e. porosity/stress) decreases logarithmically with stress [e.g. Rieke
and Chilingarian, 1974; Mondol et al., 2007]; beyond 170 MPa, hardly any mechanical compaction is
12
expected. 2) Phase stability modeling revealed that the mineral reactions of interest are mostly
temperature dependent. Downscaling of the experiment conditions to basin settings is therefore only
needed for the temperature, and can be done in a trade-off with geological time over laboratory time.
Depressurization is not expected to result in new mineral reactions. Working at higher confining
pressures than 170 and 300 MPa with the available machinery is technically challenging due to an
increased likelihood for jacket failure or puncture, as well as machine pressure vessel and load cell
limits.
Ideally, the effect of tectonic stress on compaction is addressed by applying a true triaxial
stress field (σ1 > σ2 > σ3 > 0), where the overburden load is either one of the principal stress
directions. Regrettably, machinery capable of such stress regime combined with a high temperature
furnace is not available. Instead, different stress regimes were chosen for the compaction of illite
shale. The significance of the orientation of the stress field can then be evaluated directly by
comparing the end products. In analogue with sandstone compaction tests [e.g. Wong et al., 1997; Wu
et al., 2000], compaction by isostatic stress and by confined compression was compared. Compaction
by high strain twisting of the sample in confined torsion [e.g. Paterson and Olgaard, 2000] was
attempted to address the effect of shear geometry (simple vs. pure shear).
1.4: Thesis outlook
The thesis is organized in ten chapters and includes 5 appendices. After the introduction
chapter (1), an overview of the state of knowledge of sediment compaction is presented in chapter 2.
The kinetics of compaction in both nature and experiments are discussed. A short description of the
complexity of the Appalachian foreland basin in the U.S.A. is presented as example of a tectonic
setting in which sediment compaction plays an important role. The illite shale used in this study
originates from this basin. Compaction of different sedimentary rock types is separately discussed in
following subchapters, focusing on shales and mudstones, and demonstrating that compaction is
different for these lithologies. Other topics discussed in the background chapter are low-grade
metamorphism and rock magnetism.
This study employed a range of compaction apparatus and analytical devices. Chapter 3
describes the used methods, analytical techniques, preparation procedures, and data processing
calculations. In addition, the three-stage compaction procedure is described. Chapter 4 presents a
paper on the precision of one of the employed instruments. The main topic of this paper is the effect
of pre-existing strain on calcite flow behavior, but essentially incorporates an evaluation on machine
precision.
13
The natural illite shale used in this study is presented in chapter 5. Argumentation is given for
why Maplewood Shale was ultimately selected over two other shales. The microstructure and
geological setting of Maplewood Shale is presented as example of natural shale.
The following chapter (6) deals with the chemical model that was developed to forecast the
mineral reactions during the experiments. The chapter focuses on the constructed pseudosections, and
discusses the role of phyllosilicate dehydration and dehydroxylation.
Chapter 7 presents the results of the compaction tests. First, porosity and density data are
presented, followed by strain measurements, strength evolution and rheological data. Chemical
observations are then presented, as are SEM images, microstructures and pores. Chapter 8 presents the
paper that was submitted to Geology in October 2011. This paper deals with the development of
magnetic properties during the experimental compaction of illite shale.
Chapter 9 discusses the results of the compaction experiments. In six subchapters, porosity
and density, volumetric strain, deformation paths and mechanisms, chemistry and microfabric
elements are discussed. The final chapter (10) concludes the thesis by providing the conclusions and
by describing recommendations for further research.
In the five appendices, a list of physical quantities and constants (A) is given, as are lists of
the compaction stage 3b experiments (B). Sample properties such as porosity, density, strain and
water content, after various compaction stages and experiments are presented in appendices C, D and
E.

14
15
Chapter 2
Sediment compaction
________________________________________________________________
Gerry Spence once said, “I would rather have a mind opened by wonder than one closed by belief.”
Preface
To follow a discussion on clay compaction it is imperative to understand how sediment
compaction in general works. This chapter provides the required basic knowledge. Subchapter 2.1 discusses the kinetics of compaction in both nature and experiments, including those performed in this study. Compaction is inherently related to sedimentary basins and tectonics. The Appalachian Basin in New York state (USA) is a classic example of a sedimentary basin that is strongly influence by orogenies, sea level fluctuations and changes in sediment influx. The complex basin infill exemplifies the necessity for a good understanding of the diagenesis processes that affect all sorts of sediments. A summary of the state of knowledge of shale/mudstone compaction follows in subchapter 2.2, of sandstone compaction in subchapter 2.3 and of limestone compaction in subchapter 2.4. This chapter
concludes with a short discussion on very low-grade metamorphism (2.5) and rock magnetism (2.6). As pressure and temperature conditions change with depth, so do minerals, especially the phyllosilicate clays. Diagenesis is typically classified in metapelitic zones, based on the progress of clay transformation reactions derived from classic sedimentary sequences. Rock magnetism provides alternative method to quantify texture development in rocks. In this study, two techniques to measure the anisotropy of magnetic susceptibility were performed. Additionally, the identification of ferrimagnetic mineral phases was attempted using techniques that measures remanence magnetization.
In the final subchapter theory behind rock magnetism is presented.
16
2.1: Compaction kinetics in nature and experiments
Compaction affects porous materials, in particular sediments. Due to strong significance in
hydrocarbon exploration and production, most studies dealing with sediment compaction are
performed in, or in the context of sedimentary basins [e.g. Rieke and Chilingarian, 1974; Lerche,
1990; Hantschel and Kauerauf, 2009]. As such, natural compaction is typically associated with
kinetics found in sedimentary basins. Compaction is more complex at active plate boundaries where
crustal thickening or thinning imposes tectonic forces. In for example foreland basins compaction is
expected to be controlled by both by burial-related kinetics and by active tectonics.
Nature:
Stress fields within sedimentary basins are controlled by sedimentation, erosion and tectonics.
Sediments impose a gravity load on older buried deposits, represented by lithostatic pressure (p l).
With depth lithostatic pressure increases linearly following equation 2.1:
(eq. 2.1)
See table A1 for a description of the involved quantities. Sea level defines zero depth. As a scalar,
lithostatic pressure has no direction. The stress resulting from gravity load is directed vertically (σv)
and horizontally (σh), when considering fixed side boundaries to a body of compacting sediments (i.e.
no free surface). The material constant Poisson ratio (ν) relates σh to σv through equation 2.2:
(eq. 2.2)
Poisson ratio values for sediments range from 0.1 to 0.4, which yields a stress ratio of 0.11 to 0.67,
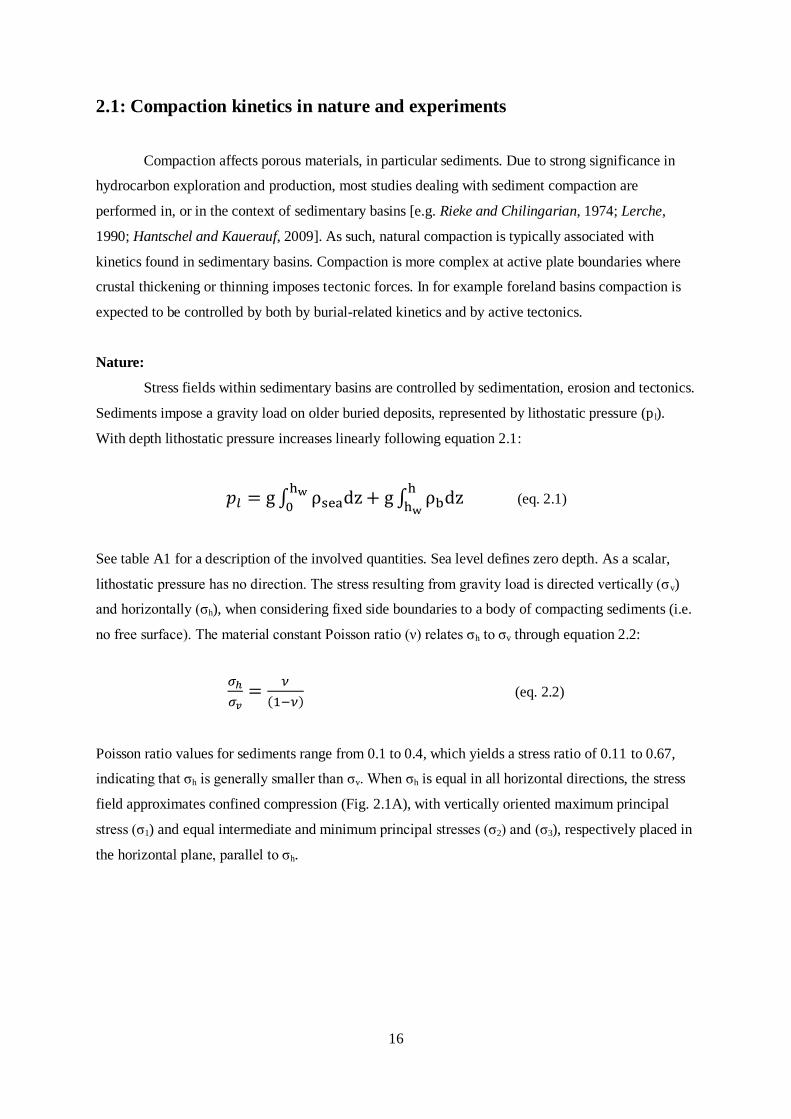
indicating that σh is generally smaller than σv. When σh is equal in all horizontal directions, the stress
field approximates confined compression (Fig. 2.1A), with vertically oriented maximum principal
stress (σ1) and equal intermediate and minimum principal stresses (σ2) and (σ3), respectively placed in
the horizontal plane, parallel to σh.
17
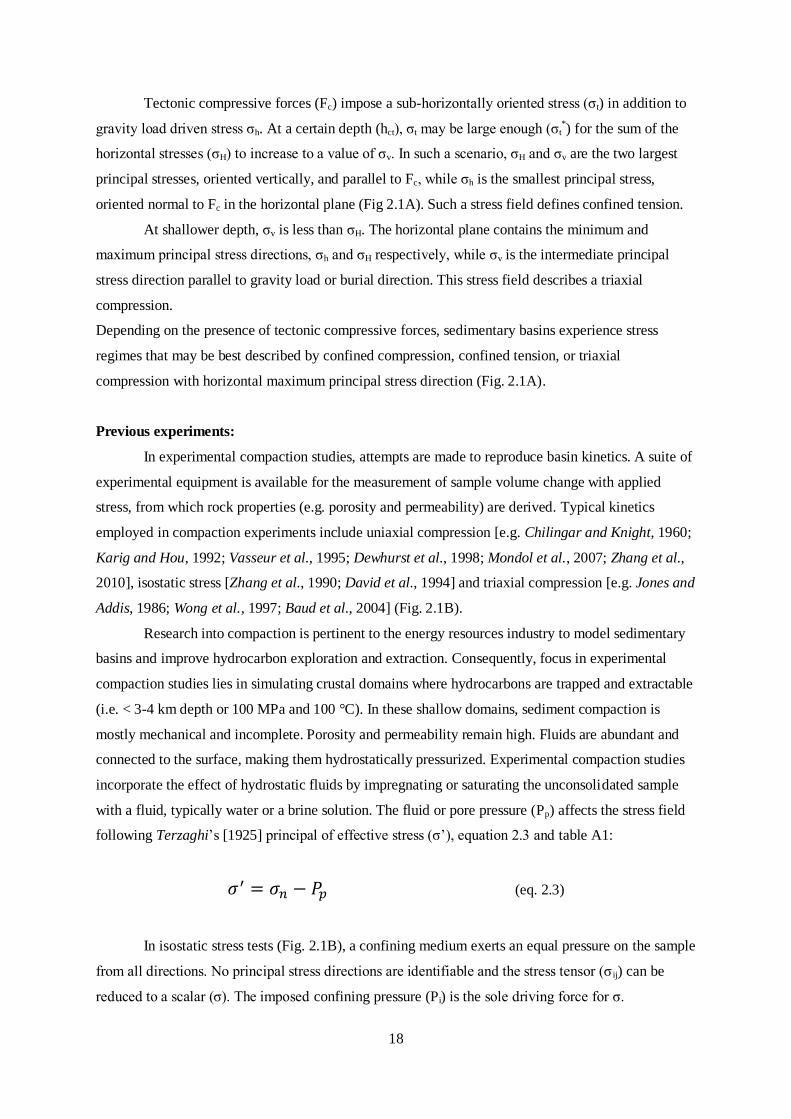
Figure 2.1: A) 2D representation of the kinetics of natural compaction in sedimentary basins. B) Typical
stress field employed in experimental compaction studies. C) Three types of stress fields used in this
research.
18
Tectonic compressive forces (Fc) impose a sub-horizontally oriented stress (σt) in addition to
gravity load driven stress σh. At a certain depth (hct), σt may be large enough (σt*) for the sum of the
horizontal stresses (σH) to increase to a value of σv. In such a scenario, σH and σv are the two largest
principal stresses, oriented vertically, and parallel to Fc, while σh is the smallest principal stress,
oriented normal to Fc in the horizontal plane (Fig 2.1A). Such a stress field defines confined tension.
At shallower depth, σv is less than σH. The horizontal plane contains the minimum and
maximum principal stress directions, σh and σH respectively, while σv is the intermediate principal
stress direction parallel to gravity load or burial direction. This stress field describes a triaxial
compression.
Depending on the presence of tectonic compressive forces, sedimentary basins experience stress
regimes that may be best described by confined compression, confined tension, or triaxial
compression with horizontal maximum principal stress direction (Fig. 2.1A).
Previous experiments:
In experimental compaction studies, attempts are made to reproduce basin kinetics. A suite of
experimental equipment is available for the measurement of sample volume change with applied
stress, from which rock properties (e.g. porosity and permeability) are derived. Typical kinetics
employed in compaction experiments include uniaxial compression [e.g. Chilingar and Knight, 1960;
Karig and Hou, 1992; Vasseur et al., 1995; Dewhurst et al., 1998; Mondol et al., 2007; Zhang et al.,
2010], isostatic stress [Zhang et al., 1990; David et al., 1994] and triaxial compression [e.g. Jones and
Addis, 1986; Wong et al., 1997; Baud et al., 2004] (Fig. 2.1B).
Research into compaction is pertinent to the energy resources industry to model sedimentary
basins and improve hydrocarbon exploration and extraction. Consequently, focus in experimental
compaction studies lies in simulating crustal domains where hydrocarbons are trapped and extractable
(i.e. < 3-4 km depth or 100 MPa and 100 °C). In these shallow domains, sediment compaction is
mostly mechanical and incomplete. Porosity and permeability remain high. Fluids are abundant and
connected to the surface, making them hydrostatically pressurized. Experimental compaction studies
incorporate the effect of hydrostatic fluids by impregnating or saturating the unconsolidated sample
with a fluid, typically water or a brine solution. The fluid or pore pressure (Pp) affects the stress field
following Terzaghi’s [1925] principal of effective stress (σ’), equation 2.3 and table A1:
(eq. 2.3)
In isostatic stress tests (Fig. 2.1B), a confining medium exerts an equal pressure on the sample
from all directions. No principal stress directions are identifiable and the stress tensor (σ ij) can be
reduced to a scalar (σ). The imposed confining pressure (Pi) is the sole driving force for σ.
19
Equation 2.3 can be rewritten for the case of isostatic stress resulting in equation 2.4A. To avoid
hydrostatic fracturing Pi is typically greater than Pp.
In uniaxial compression tests (Fig. 2.1B), gravity load or overburden pressure is modeled with
a mechanical load, resulting in a vertical normal stress (σn), that forces a sample to compact in the
vertical direction. Low friction walls of the sample chamber inside such an oedometer, keep
horizontal stresses at a minimum. Upon compression, the highly porous, fluid-filled and soft nature of
the typical sample material allows fluids to extrude through a perforated cap, resulting in a volume
loss proportional to compaction or porosity reduction. Imposed Pp reduces σn through equation 2.3,
with the restriction that Pp < σn.
In triaxial compression tests (Fig. 2.1B), horizontal stresses result from either a vertical load
(σh) or a pressurized confining medium (Pc). Strictly speaking, the term triaxial is misleading, since
the minimum and intermediate principal stresses are equal, as for confined compression. Pore pressure
reduces σn and σh to σ’. This is expressed in equation 2.4B, where σii represents the principal stresses
or diagonal components in the stress tensor matrix with i allowing values of 1, 2 or 3.
(eq. 2.4A)
(eq. 2.4B)
This study:
This experimental compaction study reports compaction tests with three distinct stress
regimes: isostatic stress, confined compression and confined torsion (Fig. 2.3C). The latter regime is
new compared to previous experimental compaction studies and allows simulation of simple shear
deformation in a tectonically active sedimentary basin.
The kinetics of isostatic stress tests (Fig. 2.3C) in this study are comparable with previous
experimental compaction studies (i.e. stress has equal magnitude in all directions and stress is a
scalar). The here labeled confined compression tests (Fig. 2.3C) are essentially identical to what is
commonly perceived as triaxial tests. By the addition of a mechanically induced vertical stress, the
direction and magnitude of principal stress axes are defined; σ1 is vertically oriented, while σ2 and σ3
act in the horizontal plane and are equal in magnitude, but greater than zero.
Confined torsion tests (Fig. 2.3C) require a more elaborate description due to their complex
kinetics. Instead of a mechanical load, a torque (M) is applied to a confined sample. M acts on the
horizontal plane in the sample, normal to the sample radius (r), which implies that the direction of M
changes along the circle described by r. Moreover the magnitude of torque varies with r; zero in the
centre and maximum at the rim of the sample. Rheological behavior of the sample material controls
the torque distribution with r. Newtonian flow yields a linear torque increase with r, whereas non-
Newtonian flow yields an exponential increase of M with r [Paterson and Olgaard, 2000]. In terms of

20
stress, torque relates directly to shear stress (τ), which is described in matrix notation by the off-
diagonal components of the stress tensor. In a 2D cross section at any value for r, M is approximately
parallel to σ31. The existence of a non-zero off-diagonal stress tensor component automatically sets the
direction of the normal stress components (i.e. diagonal components, σ ii) and principal stress axes.
Values for σ1, σ2 and σ3 are equal and greater than zero, since no mechanical load as in confined
compression was applied, instead samples were placed in confined medium.
Confining pressure was applied in this study to provide for σ3 in all employed stress regimes.
Practically, confining pressure is equal in these cases, yet mathematically differences exist. Unique
subscripts distinguish between the different confining pressures. Pi, Pc and Pt, respectively denote
confining pressure in isostatic stress, confined compression and confined torsion.
Foreland basins: Case study of the Appalachian Basin in Western New York:
This Laurentian continental foreland basin is filled with Paleozoic sediments that show a
characteristic sedimentary repetition linked to several orogenic events within the Pangaea-forming
Wilson-cycle such as Taconic, Acadian and Alleghenian orogenies [e.g. Wilson, 1966; Faill, 1997;
Ettensohn, 2008]. In fact, the Appalachian Basin has formed a cornerstone for the identification and
modeling of characteristic foreland basin infill dynamics. A sequence of seven characteristic
stratigraphic features in such a system have been coupled to lithosphere processes such as isostatic
loading and unloading, and flexural bulging [e.g. Quinlan and Beaumont, 1984; Beaumont et al.,
1988; Ettensohn, 2008], and are summarized here following Ettensohn [2008]: 1) basal unconformity
due to flexural bulging of the lithosphere, 2) shallow-water transgressive deposits formed at the onset
of rapid basin subsidence, comprising either transgressive carbonates or reworked shoreface sand
deposits, 3) dark-mud sedimentation as a result of limited sediment influx and oxygen-deprived
deepwater environments, 4) flysch-like sedimentation in deepening basin, after development of a
drainage network in the sediment source following build-up of a subaerial relief (fold-thrust belt), 5)
thin, regressive, shallow-water, carbonate or shale blanket, forming after the basin overflows and
sediment influx ceases due to lowered source area, 6) thin, transgressive, marine, precursor sequence,
formed in the anti-peripheral bulge that formed due to isostatic rebound of the eroded orogen, and 7)
marginal-marine and terrestrial clastic wedge comprised of re-deposited basin sediments and material
from the rebounded orogen and formed in a terrestrial delta-like environment.
Stratigraphic features of this foreland basin infill model can be identified in the Middle
Ordovician to Early Silurian sediments of the Northern Central Appalachian Basin of Western New
York State (Figs. 2.2 and 2-3), coupled to the Taconic orogeny. The basal unconformity is represented
by the erosional contact between Trenton group platform/lagoonal carbonates and underlying
crystalline basement of the Greenville craton (now exposed in the Adirondack Mountains) [Jacobi,
1981; Ettensohn, 2008]. Trenton group carbonates (Middle Ordovician) themselves represent the first
deposits in shallow water in the newly formed Taconic peripheral foreland basin [Rowley and Kidd,
21
1981; Bradley and Kidd, 1991; Brett and Baird, 2002; Ettensohn, 2008]. Maximum burial depth
estimates for Trenton group carbonates in northeastern New York State yielded values of 5.0 km
[Friedman, 1987]. Overlying the Trenton group are siliciclastic deposits of the Late Ordovician
Lorraine group, which includes the Eastern New York Utica black shales and Martinsburg slate,
coupling the Lorraine group to the third characteristic foreland basin infill feature of dark-mud
sedimentation [Ettensohn, 1991; Lehmann et al., 1995]. Deposited directly above the Lorraine group
are fluvio-deltaic sediments of the sandy Oswego [Fichter and Diecchio, 1986] and red beds of the
Late Ordovician Queenston Formation [Brogly et al., 1998], attributed to the final stage clastic wedge
feature in the foreland basin infill model of Ettensohn [2008]. Late Ordovician to Early Silurian
clastic wedge deposits, containing 1200-950 Ma detrital zircons, have been traced back to the
Grenville craton, indicating its exposure since at least the Late Ordovician [Gray and Zeitler, 1997;
Park et al., 2010].
By Late Ordovician, the main phase of the Taconian orogeny had waned. Yet, rejuvenation of
the Taconic orogeny occurred in the Early Silurian, and is visualized by the regionally extensive, low-
angle Cherokee Unconformity at the Ordovician-Silurian boundary, followed by thick clastic wedge
deposits of the Medina and Lower Clinton group (including Maplewood Shale) [Brett et al., 1990]
(Figs 2.2 and 2.3). These two groups form a sequence that onlaps on the Cherokee Unconformity in
eastward direction, indicating renewed basin subsidence [Brett et al., 1990].
Around the Early-Late Silurian boundary, a phase of tectonic inactivity or quiescence
commenced [Brett et al., 1990], which would last until the Devonian Acadian orogeny. Basin
subsidence and sediment influx reached a state of equilibrium, making the depositional system most
sensitive to eustatic and regional sea-level variation [Johnson et al., 1985; Cotter, 1988; Brett et al.,
1990]. Basin wide repetitive contemporaneous facies of the Silurian Medina, Lower and Upper
Clinton, and Lockport groups have been correlated using 3rd order (2-3 myr) and superimposed 6th
order (~ 100 kyr) sea level cycles [Johnson et al., 1985; Cotter, 1988; Brett et al., 1990]. Despite
ongoing subsidence, alternating shale and limestones formation in the Lower Clinton group of
Western New York (Figs. 2.2 and 2.3) display 3rd order sea level cycles, which is explained by
eustatic sea level fluctuations associated with Gondwana glaciation [Johnson et al., 1985; Brett et al.,
1990].
The Paleozoic infill of the Appalachian basin in Western New York clearly demonstrates the
complexity of foreland basin deposition and its sensitivity to changes in sedimentation influx and
accommodation space, brought about by eustatic sea-level and tectonic activity. A third factor that
controls accommodation space, especially in deep systems such as foreland basins, is sediment
compaction. Space is generated when porosity is reduced. Knowledge of the compaction behavior of
clay, sand and lime is essential to understand foreland basin evolution.
22
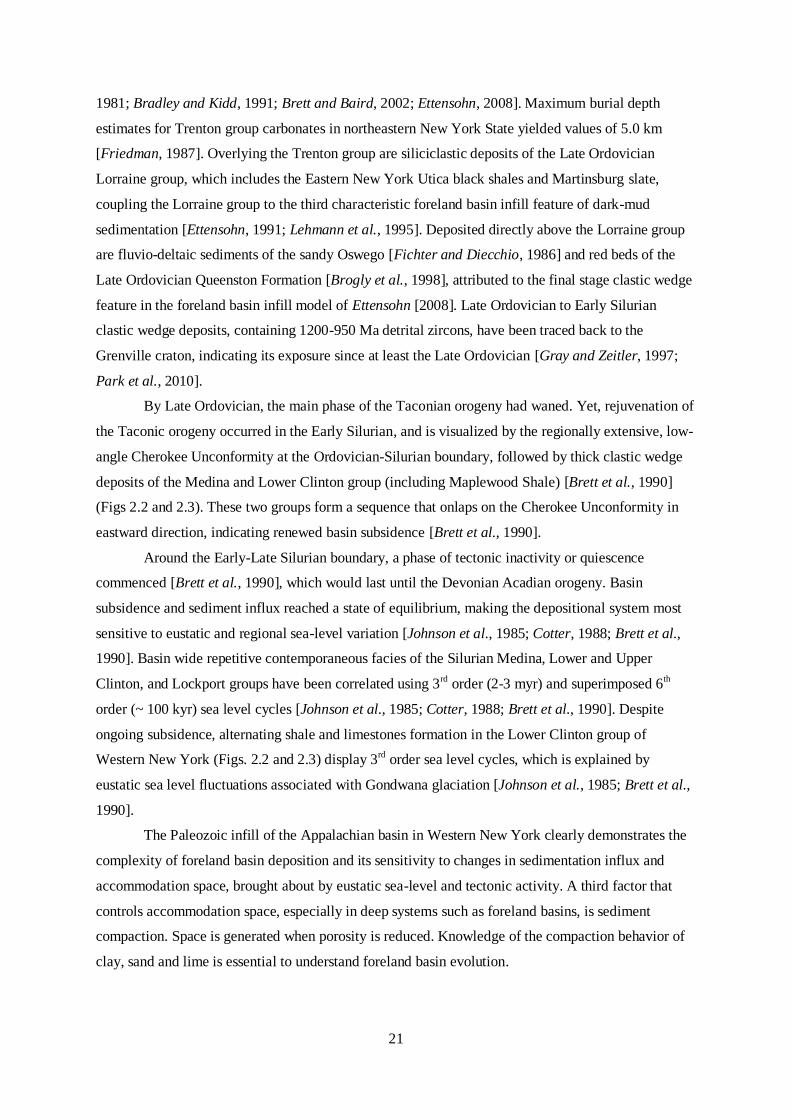
Figure 2.2: Geological map of the Northern Central Appalachian Basin of western New York State
(digitized after Rogers et al. [1990]). The red circle highlights the type locality for the Maplewood Shale.
The legend for this map is presented in figure 2.3 as a map-wide stratigraphic correlation chart.
23
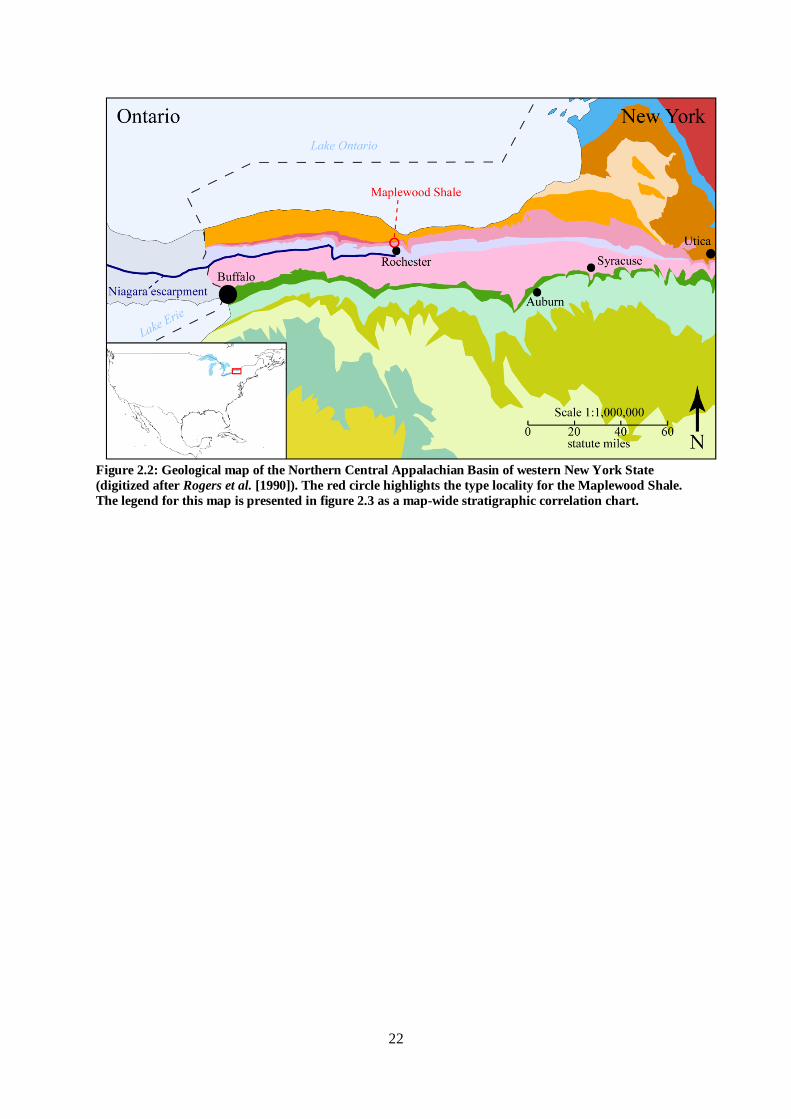
Figure 2.3: Stratigraphic correlation chart for geological map of figure 2.2 (digitized after Rogers et al.
[1990]). The red ellipse highlights the stratigraphic position of Maplewood Shale. Colors and
stratigraphic group names form the legend for figure 2.2. Beige colors represent periods of erosion and/or
non-deposition.
24
2.2: Clay/mudstone compaction
Mudstones and shales are the most common sedimentary rocks [Tucker, 1981]. They are
formed during the various stages of clay diagenesis, which commences immediately after deposition
in low energetic marine environments. Burial initiates clay compaction by expelling free water and
reducing the intergranular spacing. Rearrangement of particles and grain alignment then reduces
porosity further. Increasing loads (deeper burial) forces more fluids out of the mud, thus reducing the
ratio between solid grain (Vg) and liquid or pore (Vp) volume fraction (void ratio). The void ratio
relates porosity and bulk volume (Vb), following equation 2.5:
(eq. 2.5)
Void ratio and porosity are commonly applied parameters to quantify the degree of compaction, and
are frequently coupled to hydraulic and seismic properties of clay-rich sediments [e.g. Neuzil, 1994;
Vasseur et al., 1995; Dewhurst et al., 1998; Nygård et al., 2004; Mondol et al., 2007; Schneider et al.,
2011]. The compaction behavior of argillaceous sediments in nature and laboratory is complex and
controlled by both intrinsic parameters such as mineral composition, clay fraction and fluid salinity,
and extrinsic parameters such as temperature, effective pressure, time and compaction rate [e.g. Rieke
and Chilingarian, 1974; Bjørlykke and Høeg, 1997]. The complexities are exemplified by the spread
of compaction curves (porosity/depth relationships) obtained from natural shales and argillaceous
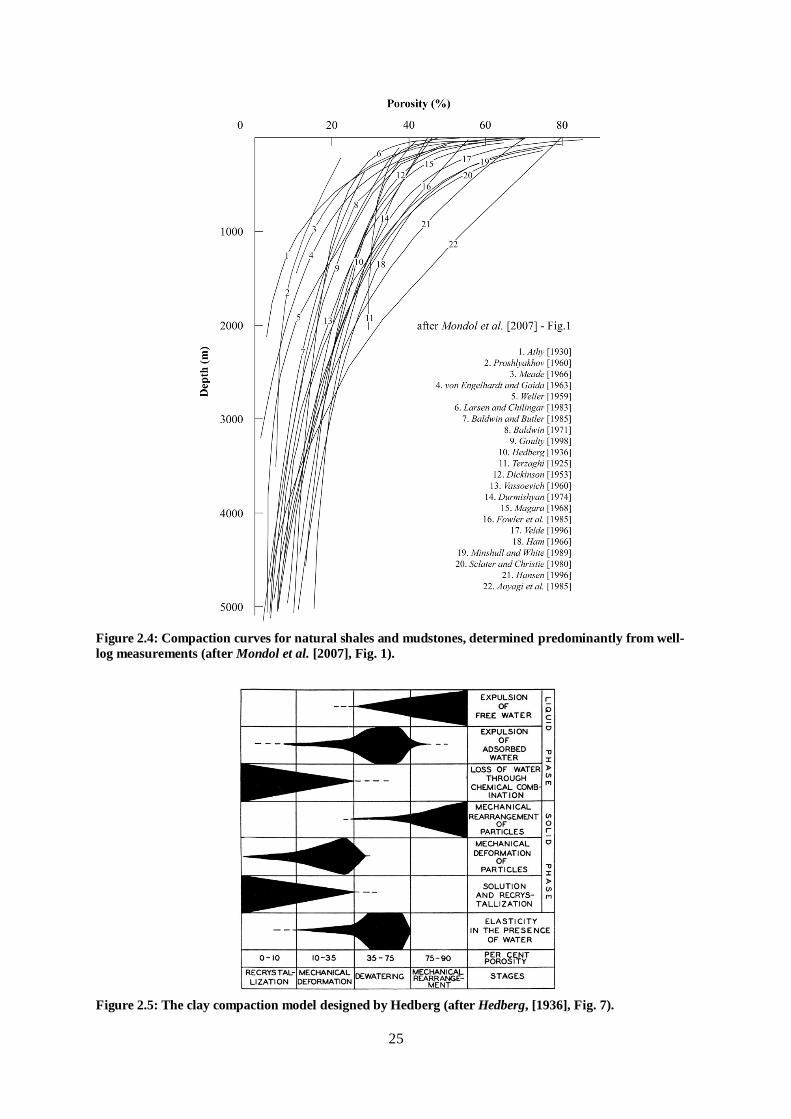
sediments (Fig. 2.4 - after Mondol et al. [2007]). Three general observations are made: 1) initial
porosity (depth = 0) is 40-80 %, 2) rate of compaction per meter decreases with depth and 3)
compaction curves converge < 2.5 km at 10-15 % porosity. In the top 2.5 km of the sedimentary
column, mechanical processes such as grain rotation, alignment and close packing, are responsible for
the compaction, whereas in deeper domains thermally activated mineral reactions and mass transfer
dominate the compaction processes [e.g. Athy, 1930; Hedberg, 1936; Weller, 1959; Rieke and
Chilingarian, 1974; Velde, 1996; Aplin et al., 2003; Charpentier et al., 2003; Worden et al., 2005;
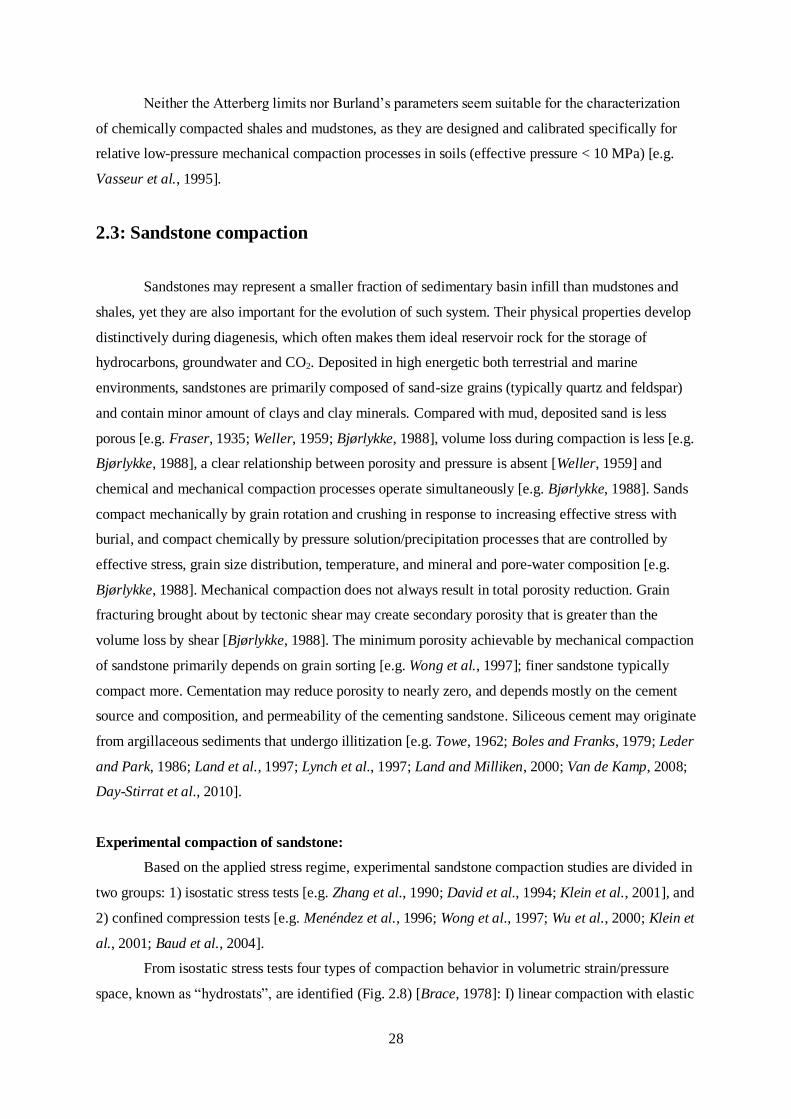
Peltonen et al., 2009; Day-Stirrat et al., 2010]. Based also on microstructural observations, several
conceptual compaction models have been designed, of which Hedberg’s 1936 model is most elaborate
(Fig. 2.5) [e.g. Athy, 1936; Hedberg, 1936; Weller, 1959; Vassoevich, 1960].
25
Figure 2.4: Compaction curves for natural shales and mudstones, determined predominantly from well-
log measurements (after Mondol et al. [2007], Fig. 1).
Figure 2.5: The clay compaction model designed by Hedberg (after Hedberg, [1936], Fig. 7).

26
To study the effect of mechanical compaction on rock physical properties, clay compaction
has frequently been simulated in the laboratory by mimicking the kinetic and chemical conditions of
the shallow portions of basins (i.e. effective pressure < 50 MPa or depth < 3 km) [e.g. Chilingarian
and Knight, 1960; Rieke and Chilingarian, 1974; Vasseur et al., 1995; Dewhurst et al., 1998; Mondol
et al., 2007; Voltolini et al., 2009; Schneider et al., 2011]. Resulting compaction curves (Fig. 2.6)
show a good agreement with natural curves; initial porosity is 45-80 % and compaction hardens with
increasing pressure. There is however, no convergence of compaction curves observed for effective
pressure ≤ 50 MPa. In fact, porosity at 50 MPa ranges from 11 to 44 %.
Figure 2.6: Selection of experimental clay compaction curves plotted in one figure to visualize the
variation in porosity at each pressure resulting from compositional heterogeneities and saturation-state.
The transition in Hedberg’s model (Fig. 2.5) from mechanical deformation (φ = 10-35 %) to
recrystallization is (φ = 0-10 %) marks the transition also from mechanical to chemical compaction.
Smectite illitization occurring between 60 °C and 110 °C, is frequently associated with chemical
compaction [e.g. Towe, 1962; Perry and Hower, 1970; Hower et al., 1976; Eberl, 1993; Bjørlykke and
Høeg, 1997]. The effect of illitization on chemical and physical properties is described in numerous
natural studies [e.g. Hower et al., 1976; Ho et al., 1999; Land and Milliken, 2000; Aplin et al., 2003;
2006; Peltonen et al., 2009; Thyberg et al., 2010], and exemplified in figure 2.7. For depth < 1700 m,

27
the correlation with experimental compaction curves and well-log data from natural mudstones is
reasonable. However for deeper intervals, natural porosity is lower than experimental porosity
(Fig. 2.7A), whereas the compression wave velocity is faster in nature than in the laboratory
(Fig. 2.7B).
Figure 2.7: Effect of chemical compaction for A) compaction curves and B) compressional wave velocity
(after Peltonen et al. [2009], Fig. 9)
Despite the complexity, clay compaction by mechanical processes is often characterized by
one of two sets of parameters that are based on principles from soil mechanics. The plastic (PL) and
liquid (LL) Atterberg limits [Kinnison, 1915; Casagrande, 1932b] mark the moisture content of a soil
at the transition from brittle to plastic (PL) and plastic to liquid (LL) flow behavior. The range for
which flow is plastic is termed the plasticity index (PI). [after Skempton and Jones, 1944; White,
1949]. Uncertainties with the validity of using reconstituted material in clay compaction experiments
for the simulation of natural clay compaction led Burland [1990] to introduce alternative parameters.
He introduced the void index (Iv) and intrinsic compression index (Cc) as two parameters, independent
from the Atterberg limits, that can be used to express the relationship between pressure and void ratio
for any reconstituted material. Equations 2.6A and 2.6B define Iv and Cc respectively.
(eq. 2.6A)
(eq. 2.6B)
Where e100 and e1000 are the void ratio at a specific pressure of 100 kPa and 1000 kPa, respectively.
28
Neither the Atterberg limits nor Burland’s parameters seem suitable for the characterization
of chemically compacted shales and mudstones, as they are designed and calibrated specifically for
relative low-pressure mechanical compaction processes in soils (effective pressure < 10 MPa) [e.g.
Vasseur et al., 1995].
2.3: Sandstone compaction
Sandstones may represent a smaller fraction of sedimentary basin infill than mudstones and
shales, yet they are also important for the evolution of such system. Their physical properties develop
distinctively during diagenesis, which often makes them ideal reservoir rock for the storage of
hydrocarbons, groundwater and CO2. Deposited in high energetic both terrestrial and marine
environments, sandstones are primarily composed of sand-size grains (typically quartz and feldspar)
and contain minor amount of clays and clay minerals. Compared with mud, deposited sand is less
porous [e.g. Fraser, 1935; Weller, 1959; Bjørlykke, 1988], volume loss during compaction is less [e.g.
Bjørlykke, 1988], a clear relationship between porosity and pressure is absent [Weller, 1959] and
chemical and mechanical compaction processes operate simultaneously [e.g. Bjørlykke, 1988]. Sands
compact mechanically by grain rotation and crushing in response to increasing effective stress with
burial, and compact chemically by pressure solution/precipitation processes that are controlled by
effective stress, grain size distribution, temperature, and mineral and pore-water composition [e.g.
Bjørlykke, 1988]. Mechanical compaction does not always result in total porosity reduction. Grain
fracturing brought about by tectonic shear may create secondary porosity that is greater than the
volume loss by shear [Bjørlykke, 1988]. The minimum porosity achievable by mechanical compaction
of sandstone primarily depends on grain sorting [e.g. Wong et al., 1997]; finer sandstone typically
compact more. Cementation may reduce porosity to nearly zero, and depends mostly on the cement
source and composition, and permeability of the cementing sandstone. Siliceous cement may originate
from argillaceous sediments that undergo illitization [e.g. Towe, 1962; Boles and Franks, 1979; Leder
and Park, 1986; Land et al., 1997; Lynch et al., 1997; Land and Milliken, 2000; Van de Kamp, 2008;
Day-Stirrat et al., 2010].
Experimental compaction of sandstone:
Based on the applied stress regime, experimental sandstone compaction studies are divided in
two groups: 1) isostatic stress tests [e.g. Zhang et al., 1990; David et al., 1994; Klein et al., 2001], and
2) confined compression tests [e.g. Menéndez et al., 1996; Wong et al., 1997; Wu et al., 2000; Klein et
al., 2001; Baud et al., 2004].
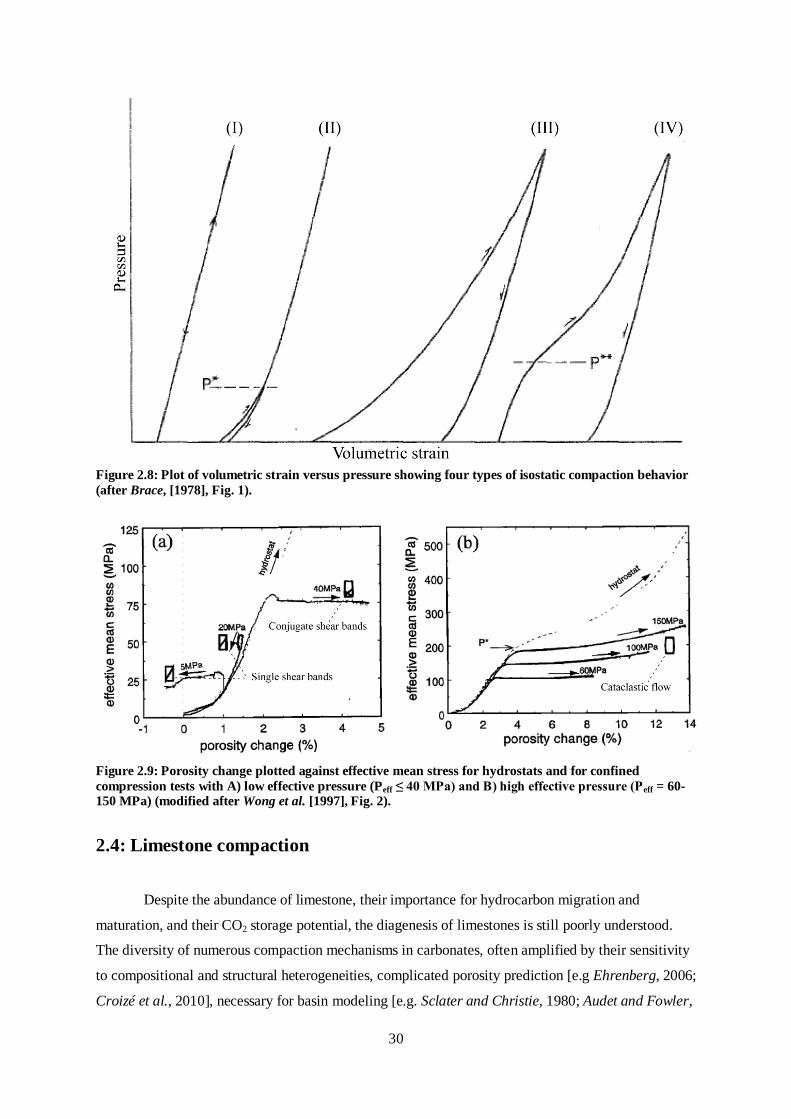
From isostatic stress tests four types of compaction behavior in volumetric strain/pressure
space, known as “hydrostats”, are identified (Fig. 2.8) [Brace, 1978]: I) linear compaction with elastic

29
loading of the framework, leading to full recovery after unloading, II) non-linear compaction induced
by crack closing until P*, followed by elastic frame loading. Minor hysteresis is displayed below P*,
yielding some permanent deformation, III) continuous crack closing with major hysteresis starting
immediately after unloading, reflecting pore collapse and (IV) elastic loading (type I), followed by
type III non-linear loading and unloading. The inflection point is denoted as P**. Porous sandstones
(φ > 20 %) in isostatic stress tests compact by type IV behavior. Initial porosity and grain size
distribution control P**. In lower porosity sandstones, compaction follows a type III behavior [Zhang
et al., 1990]. The commonly observed permanent deformation is typically the result of two types of
cataclastic flow: 1) dilatant flow with positive pressure dependency of the yield stress for low-
porosity rocks [Fredrich et al., 1989; Fischer and Paterson, 1989] and 2) compactive flow with
negative yield stress effective pressure dependency for high-porosity sandstones [Wong et al., 1992]
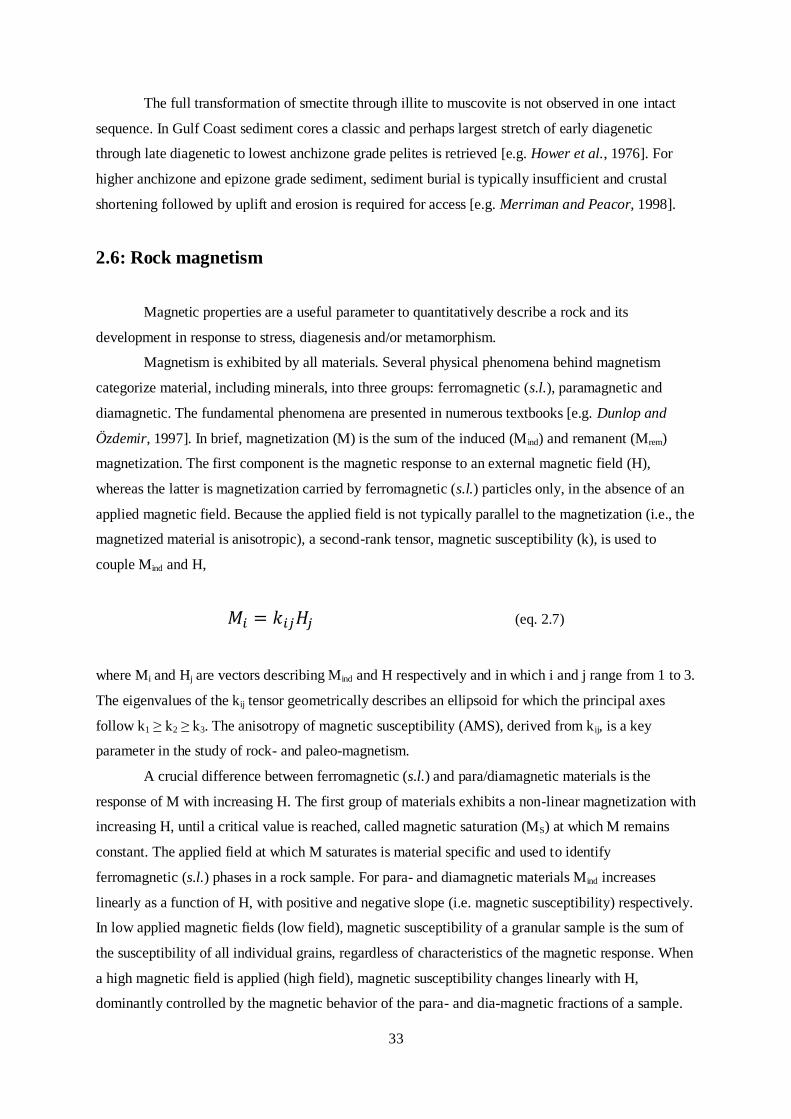
In confined compression tests sandstone compact differently. In comparison with clay-rich
sediments, the accommodation of axial strain in sandstone is rapidly exhausted and inelastic failure by
brittle faulting or cataclastic flow, depending on effective pressure, initiated [e.g. Menéndez et al.,
1996; Wong et al., 1997; Wu et al., 2000; Klein et al., 2001; Bésuelle et al., 2003]. In the case of
brittle faulting, total porosity may even enhance when dilative shear bands are produced (Fig. 2.9A)
[e.g. Ord et al., 1991; Menéndez et al., 1996; Wong et al., 1997; El Bied et al., 2002; Sulem and
Ouffroukh, 2006]. When axial strain is accommodated by cataclastic flow, a phenomenon known as
“shear-enhanced compaction” occurs. Shear-enhanced compaction is defined as accelerated porosity
reduction with the application of differential stress (σdiff = σ1 - σ3) in comparison with hydrostats.
[Curran and Carroll, 1979; Wong et al., 1992; 1997]. With increasing effective pressure, shear-
enhanced compaction commences for higher effective mean stress and greater porosity changes
(Fig. 2.9B). Furthermore, the efficiency of compaction increases as well with higher effective pressure
(Fig. 2.9B) [Wong et al., 1997]. In the transition zone from localized brittle failure to distributed
cataclastic flow a hybrid mechanism displaying both shear-enhancing compaction and localization
producing high-angle shear bands and discrete low-angle compaction bands [Klein et al., 2001; Wong
et al., 2001; Bésuelle et al., 2003; Baud et al., 2004].
30
Figure 2.8: Plot of volumetric strain versus pressure showing four types of isostatic compaction behavior
(after Brace, [1978], Fig. 1).
Figure 2.9: Porosity change plotted against effective mean stress for hydrostats and for confined
compression tests with A) low effective pressure (Peff ≤ 40 MPa) and B) high effective pressure (Peff = 60-150 MPa) (modified after Wong et al. [1997], Fig. 2).
2.4: Limestone compaction
Despite the abundance of limestone, their importance for hydrocarbon migration and
maturation, and their CO2 storage potential, the diagenesis of limestones is still poorly understood.
The diversity of numerous compaction mechanisms in carbonates, often amplified by their sensitivity
to compositional and structural heterogeneities, complicated porosity prediction [e.g Ehrenberg, 2006;
Croizé et al., 2010], necessary for basin modeling [e.g. Sclater and Christie, 1980; Audet and Fowler,

31
1992]. The realization that, unlike for clays, even in shallow domains, cementation is an important
compaction process is decades old [e.g. Athy, 1930; Weller, 1959; Fruth et al., 1966; Moore, 2001;
Ehrenberg, 2006]. Observations on natural limestone occurrences led to the conclusion that
dissolution of unstable carbonate minerals, followed by precipitation of dolomite and calcite can only
provide a fraction of the required cement to chemically compact a porous (φ = 40-70 %) lime deposit
to zero porosity limestone [e.g. Weller, 1959; Bathurst, 1971]. However, the over two decades long
search for different cement sources, ironically led to the realization that, unlike commonly perceived,
under certain conditions mechanical compaction of limestone can accommodate substantial volumes
without completely disrupting depositional structures and fossil remains [Shinn et al., 1977; Shinn and
Robbin, 1983]. In the case of exhausted mechanical compaction, further porosity loss is accomplished
by pressure solution [e.g. Baker et al., 1980; Zhang et al., 2010], and leads to the formation of
stylolites, solution seams and fitted fabric [e.g. Sorby, 1908; Stockdale, 1943; Dunnington, 1954;
Wanless, 1979; Buxton and Sibley, 1981].
Experiments show that in the absence of creep, shear-enhanced compaction in porous
limestones occurs in a fashion comparable with sandstones [Baud et al., 2000; Vajdova et al., 2004].
In the presence of creep, changes in pore geometry, pore throat radius and connectivity bring about a
kink (crossover porosity) in the permeability evolution with porosity loss [e.g. Bernabé et al., 1982;
Zhang et al., 1994; Zhu et al., 1999].
2.5: Very low-grade metamorphism
As sediments are buried by younger overlying deposits, surrounding pressure and temperature
increase and the chemical environment alters. In response to the changed conditions notably clay
phyllosilicate such as smectite, illite and kaolinite react and transform to thermodynamically stable
mineral species [e.g. Frey and Robinson, 1998]. Two phyllosilicate reaction series involving
dioctahedral and trioctahedral clays have been frequently observed in relation to diagenesis and burial
[Merriman and Peacor, 1998]:
1. dioctahedral 2 : 1 clays
smectite mixed-layer illite/smectite (I/S) illite muscovite
2. trioctahedral 2 : 1 clays
Smectite mixed-layer chlorite/smectite (C/S) chlorite
Mineralogical quantification of the progress in the smectite-illite/smectite (I/S)-illite-
muscovite series has led to a classification of diagenesis and very low-grade metamorphism in
metapelites (Fig. 2.10, after Merriman and Peacor, [1998], Fig. 2.1). The Kübler index (KI)
quantifies the illite crystallinity, defined as the width of the illite (001) peak in a Cu-kα XRD

32
spectrum [Kübler, 1968]. With increasing transformation of smectite into illite and muscovite, the
Kübler index decreases. In the early diagenetic zone, KI < 1, and the percentage of illite-muscovite in
I/S is below 60 % (Fig. 2.1). The main stable clays are dioctahedral and trioctahedral smectite and
kaolinite. With increasing temperature and depth, smectite transforms to illite (reaction 1), giving rise
to lower KI values. The late diagenetic zone is defined for 0.42 > KI < 1 and contains a larger illite-
muscovite fraction in I/S (< 90 %). In this zone, the illite thickness, measured by transmission electron
microscopy < 22 nm, and foliation is parallel to bedding (Fig. 2.1). The low anchizone is
characterized by KI = 0.30-0.42, up to 95 % illite-muscovite fraction in I/S, and larger illite thickness.
A slaty or crenulated develops in the low anchizone resulting in pencilled mudstones or slates.
Furthermore, illite muscovite polytype changes from 1Md to 2M1 (Fig. 2.1). In the high anchizone,
smectite is nearly absent, with KI = 0.25-0.30, and over 95 % illite-muscovite in I/S. Additionally,
illite flakes typically range in thickness from 38 to 52 nm and a well-developed cleavage (S1)
emerges, creating roofing-grade slates (Fig. 2.1). The high anchizone marks the boundary between
sediment diagenesis and rock metamorphism. The epizone (KI < 0.25) metapelitic zone corresponds
to lower-greenschist facies metamorphism.
Figure 2.10: Classification for metapelitic zones in diagenetic to low-grade metamorphic argillaceous
sediments, showing mineralogical and microstructural characteristics (after Merriman and Peacor, [1998],
Fig. 2.1).
33
The full transformation of smectite through illite to muscovite is not observed in one intact
sequence. In Gulf Coast sediment cores a classic and perhaps largest stretch of early diagenetic
through late diagenetic to lowest anchizone grade pelites is retrieved [e.g. Hower et al., 1976]. For
higher anchizone and epizone grade sediment, sediment burial is typically insufficient and crustal
shortening followed by uplift and erosion is required for access [e.g. Merriman and Peacor, 1998].
2.6: Rock magnetism
Magnetic properties are a useful parameter to quantitatively describe a rock and its
development in response to stress, diagenesis and/or metamorphism.
Magnetism is exhibited by all materials. Several physical phenomena behind magnetism
categorize material, including minerals, into three groups: ferromagnetic (s.l.), paramagnetic and
diamagnetic. The fundamental phenomena are presented in numerous textbooks [e.g. Dunlop and
Özdemir, 1997]. In brief, magnetization (M) is the sum of the induced (M ind) and remanent (Mrem)
magnetization. The first component is the magnetic response to an external magnetic field (H),
whereas the latter is magnetization carried by ferromagnetic (s.l.) particles only, in the absence of an
applied magnetic field. Because the applied field is not typically parallel to the magnetization (i.e., the
magnetized material is anisotropic), a second-rank tensor, magnetic susceptibility (k), is used to
couple Mind and H,
(eq. 2.7)
where Mi and Hj are vectors describing Mind and H respectively and in which i and j range from 1 to 3.
The eigenvalues of the kij tensor geometrically describes an ellipsoid for which the principal axes
follow k1 ≥ k2 ≥ k3. The anisotropy of magnetic susceptibility (AMS), derived from k ij, is a key
parameter in the study of rock- and paleo-magnetism.
A crucial difference between ferromagnetic (s.l.) and para/diamagnetic materials is the
response of M with increasing H. The first group of materials exhibits a non-linear magnetization with
increasing H, until a critical value is reached, called magnetic saturation (MS) at which M remains
constant. The applied field at which M saturates is material specific and used to identify
ferromagnetic (s.l.) phases in a rock sample. For para- and diamagnetic materials Mind increases
linearly as a function of H, with positive and negative slope (i.e. magnetic susceptibility) respectively.
In low applied magnetic fields (low field), magnetic susceptibility of a granular sample is the sum of
the susceptibility of all individual grains, regardless of characteristics of the magnetic response. When
a high magnetic field is applied (high field), magnetic susceptibility changes linearly with H,
dominantly controlled by the magnetic behavior of the para- and dia-magnetic fractions of a sample.

34
Similarly, low-field AMS (LF-AMS) represents the sum of AMS in all phases, whereas in high-field
AMS (HF-AMS), ferrimagnetic (s.l.) contribution to AMS on one hand can be separated from the
para- and dia-magnetic on the other hand.
As a key-parameter in rock- and paleomagnetic studies, AMS is often strongly coupled with
rock fabric [e.g. Tarling and Hrouda, 1993; Borradaile and Henry, 1997; Almqvist et al., 2009]. The
development of AMS with compaction or porosity has been described for a range of experimental
clays and natural slates [e.g. Deamer and Kodama, 1990; Kodama and Sun, 1990; Hirt et al., 1995].

35
Chapter 3
Methods and analytical tools
________________________________________________________________
Thomas Berry once said, “If the earth does grow inhospitable toward human presence, it is primarily
because we have lost our sense of courtesy toward the earth and its inhabitants.”
Preface
This chapter deals with the methods and analytical tools employed in this research. The first
subchapter introduces the experimental procedure, and discusses the illite shale powder preparation procedure. It also explains the three-stage compaction procedure developed for this study. Operating conditions, such as temperature, pressure and duration are also presented. Chapter 3 focuses on a detailed description and discussion of the compaction apparatuses. The three machines are (a), a hydraulic cold press, (b) Hot Isostatic Press (HIP), and (c), a ’Paterson’ apparatus; named after its developer. Subchapter 3.2 describes these machines in detail. Of the three, the Paterson apparatus is the most complex and the most widely used. A vital part of any experiment is the data recording and
subsequent processing. Chosen tools and experimental procedure behind the post-experimental data calculations are presented in subchapter 3.3. In this study, a wide range of analytical tools was used to investigate the chemical and physical changes occurring in the successive compaction stages. These analytical tools are briefly described and their working conditions presented in subchapters 3.4 to 3.7. Tools for chemical analysis are discussed in section 3.4; rock properties such as density and porosity form the main topic of section 3.5. SEM imaging plays a major role in the investigation of the compacted illite shale powder. The SEM method and operating conditions are briefly discussed in
subchapter 3.6. Chapter 3 concludes with a description of the tools used to investigate rock magnetic properties (subchapter 3.7). This topic includes three common methods dealing with the magnetic susceptibility and its anisotropy, and remanent magnetization for identification of remanence-carrying minerals.

36
3.1: Sample preparation and experiments
Powder preparation:
Illite shale fragments have been crushed in tungsten shakers. The resulting powder was oven
dried at 110 °C for at least 24 hr before being sieved in two stages using 250 and 125 μm mesh sieves.
The < 125 µm powder was then stored in hermetically sealed plastic canisters until usage for
experimental compaction tests.
The grain size distribution of the crushed and sieved illite shale powder was determined by
laser diffraction using a Malvern Mastersizer 2000. Ultrasonic agitation was applied during the
analysis in order to separate flocculated (clay) particles using water as a dispersant (refractive index of
1.33). A particle refractive index of 1.52 was applied. These data, shown in subchapter 5.6, represent
averaged values of three runs of grain size analysis.
Experimental procedure: 3-stage re-compaction:
Illite shale powder was compacted in three stages, utilizing three methods. In the first stage
(1), powders were compacted inside a stainless steel canister (220 mm long and of 51mm diameter)
within a bolted steel housing using a hydraulic press operated at room temperature. A load of 40 tons,
corresponding to ± 200 MPa was applied for about 6 s per loading step. Two spoonful amounts of
Illite shale powder was added and pressed in a stepwise sequence to insure homogeneous fabric, until
the canister was nearly filled. Finally, a 2-4 cm thick layer of alumina powder was placed at the
bottom and top of the canisters for capturing potential water vapor released during subsequent
compaction stages at elevated temperature. Due to elevated vapor pressures, canister caps may bulge
and potentially rupture upon decompression. As many canisters as possible were prepared to have as
much material available for later tests. It was clear from visual inspection that even after this process,
powders were compacted, yet unconsolidated; care was taken not to disturb the produced fabric. The
grain size of the sheet silicates was found to be too small to develop a pronounced foliation by grain
alignment [Misra et al., 2009]. Trace and major element contamination of the illite shale powder by
the stainless steel canister was considered negligible. Filled canisters were then prepared for the next
stage (HIP) via the following steps: 1) canisters were sealed by arc welding a stainless steel cap, 2)
checked for punctures by submerging them in a water bath, 3) vacuum immersion, 4) sandblasted to
remove surface rust and 5) stored in a 110 °C drying oven. Canisters remained there until the next
compaction stage 2.
Compaction stage 2 was performed in the HIP machine. Several hermetically sealed powder-
filled canisters were placed in the pressure vessel at a confining pressure of 160-170 MPa and at a
temperature of 590 °C after repeated flushing sequences. The applied stress field was isostatic
(Fig. 2.1B-C). Duration of this compaction stage varied between 24 and 30 hrs. The resulting powder
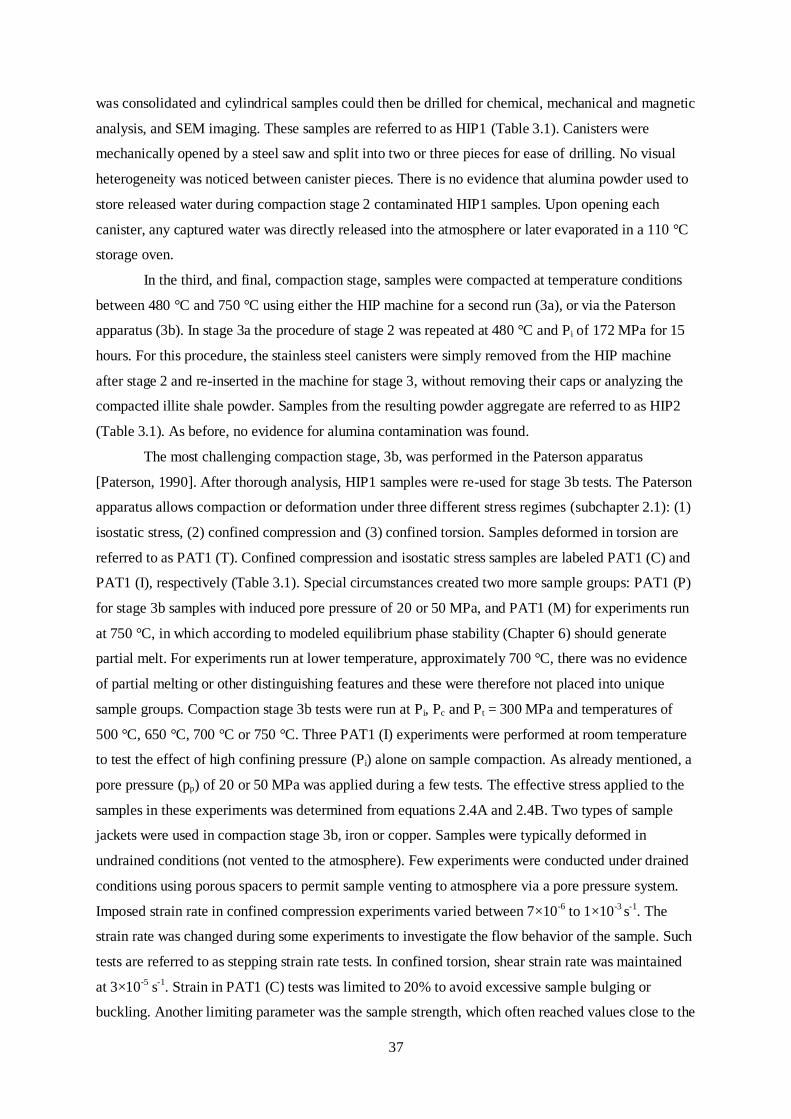
37
was consolidated and cylindrical samples could then be drilled for chemical, mechanical and magnetic
analysis, and SEM imaging. These samples are referred to as HIP1 (Table 3.1). Canisters were
mechanically opened by a steel saw and split into two or three pieces for ease of drilling. No visual
heterogeneity was noticed between canister pieces. There is no evidence that alumina powder used to
store released water during compaction stage 2 contaminated HIP1 samples. Upon opening each
canister, any captured water was directly released into the atmosphere or later evaporated in a 110 °C
storage oven.
In the third, and final, compaction stage, samples were compacted at temperature conditions
between 480 °C and 750 °C using either the HIP machine for a second run (3a), or via the Paterson
apparatus (3b). In stage 3a the procedure of stage 2 was repeated at 480 °C and Pi of 172 MPa for 15
hours. For this procedure, the stainless steel canisters were simply removed from the HIP machine
after stage 2 and re-inserted in the machine for stage 3, without removing their caps or analyzing the
compacted illite shale powder. Samples from the resulting powder aggregate are referred to as HIP2
(Table 3.1). As before, no evidence for alumina contamination was found.
The most challenging compaction stage, 3b, was performed in the Paterson apparatus
[Paterson, 1990]. After thorough analysis, HIP1 samples were re-used for stage 3b tests. The Paterson
apparatus allows compaction or deformation under three different stress regimes (subchapter 2.1): (1)
isostatic stress, (2) confined compression and (3) confined torsion. Samples deformed in torsion are
referred to as PAT1 (T). Confined compression and isostatic stress samples are labeled PAT1 (C) and
PAT1 (I), respectively (Table 3.1). Special circumstances created two more sample groups: PAT1 (P)
for stage 3b samples with induced pore pressure of 20 or 50 MPa, and PAT1 (M) for experiments run
at 750 °C, in which according to modeled equilibrium phase stability (Chapter 6) should generate
partial melt. For experiments run at lower temperature, approximately 700 °C, there was no evidence
of partial melting or other distinguishing features and these were therefore not placed into unique
sample groups. Compaction stage 3b tests were run at Pi, Pc and Pt = 300 MPa and temperatures of
500 °C, 650 °C, 700 °C or 750 °C. Three PAT1 (I) experiments were performed at room temperature
to test the effect of high confining pressure (Pi) alone on sample compaction. As already mentioned, a
pore pressure (pp) of 20 or 50 MPa was applied during a few tests. The effective stress applied to the
samples in these experiments was determined from equations 2.4A and 2.4B. Two types of sample
jackets were used in compaction stage 3b, iron or copper. Samples were typically deformed in
undrained conditions (not vented to the atmosphere). Few experiments were conducted under drained
conditions using porous spacers to permit sample venting to atmosphere via a pore pressure system.
Imposed strain rate in confined compression experiments varied between 7×10⁻⁶ to 1×10⁻³ s-1. The
strain rate was changed during some experiments to investigate the flow behavior of the sample. Such
tests are referred to as stepping strain rate tests. In confined torsion, shear strain rate was maintained
at 3×10⁻⁵ s-1. Strain in PAT1 (C) tests was limited to 20% to avoid excessive sample bulging or
buckling. Another limiting parameter was the sample strength, which often reached values close to the
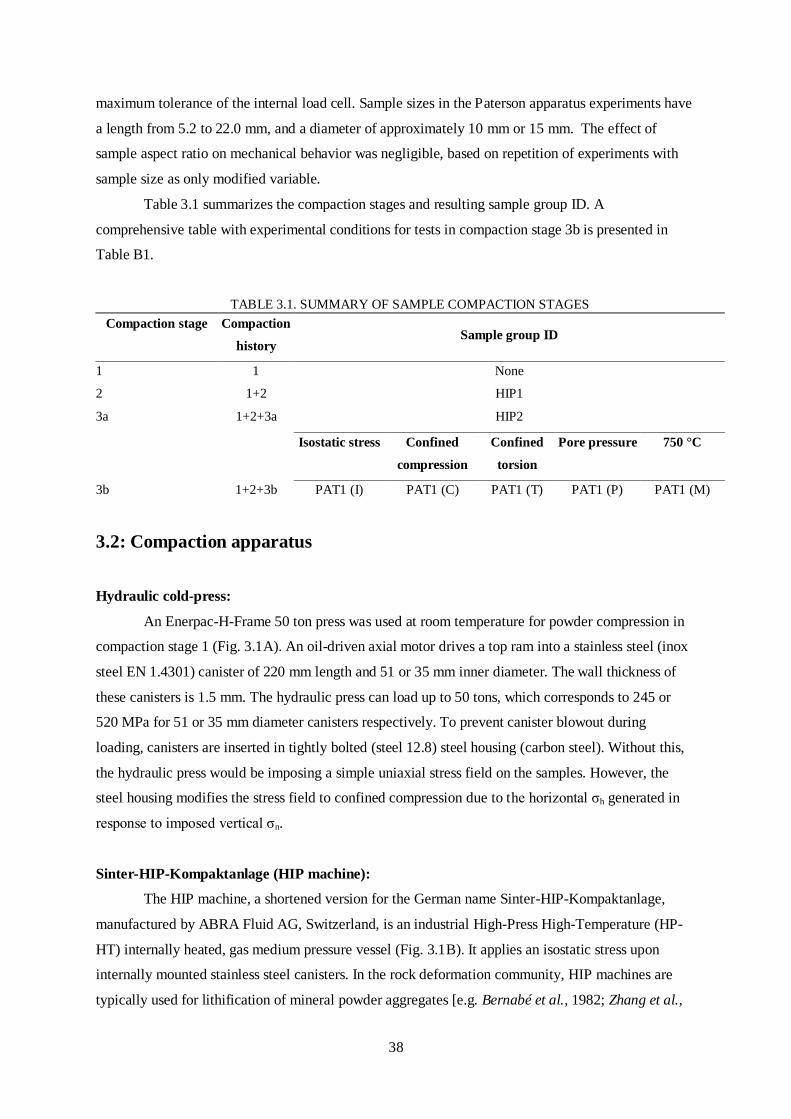
38
maximum tolerance of the internal load cell. Sample sizes in the Paterson apparatus experiments have
a length from 5.2 to 22.0 mm, and a diameter of approximately 10 mm or 15 mm. The effect of
sample aspect ratio on mechanical behavior was negligible, based on repetition of experiments with
sample size as only modified variable.
Table 3.1 summarizes the compaction stages and resulting sample group ID. A
comprehensive table with experimental conditions for tests in compaction stage 3b is presented in
Table B1.
TABLE 3.1. SUMMARY OF SAMPLE COMPACTION STAGES
Compaction stage Compaction
history Sample group ID
1 1 None
2 1+2 HIP1
3a 1+2+3a HIP2
Isostatic stress Confined
compression
Confined
torsion
Pore pressure 750 °C
3b 1+2+3b PAT1 (I) PAT1 (C) PAT1 (T) PAT1 (P) PAT1 (M)
3.2: Compaction apparatus
Hydraulic cold-press:
An Enerpac-H-Frame 50 ton press was used at room temperature for powder compression in
compaction stage 1 (Fig. 3.1A). An oil-driven axial motor drives a top ram into a stainless steel (inox
steel EN 1.4301) canister of 220 mm length and 51 or 35 mm inner diameter. The wall thickness of
these canisters is 1.5 mm. The hydraulic press can load up to 50 tons, which corresponds to 245 or
520 MPa for 51 or 35 mm diameter canisters respectively. To prevent canister blowout during
loading, canisters are inserted in tightly bolted (steel 12.8) steel housing (carbon steel). Without this,
the hydraulic press would be imposing a simple uniaxial stress field on the samples. However, the
steel housing modifies the stress field to confined compression due to the horizontal σh generated in
response to imposed vertical σn.
Sinter-HIP-Kompaktanlage (HIP machine):
The HIP machine, a shortened version for the German name Sinter-HIP-Kompaktanlage,
manufactured by ABRA Fluid AG, Switzerland, is an industrial High-Press High-Temperature (HP-
HT) internally heated, gas medium pressure vessel (Fig. 3.1B). It applies an isostatic stress upon
internally mounted stainless steel canisters. In the rock deformation community, HIP machines are
typically used for lithification of mineral powder aggregates [e.g. Bernabé et al., 1982; Zhang et al.,
39
1994; Barnhoorn et al., 2005b; Schmidt et al., 2008; Misra et al., 2009; Tumarkina et al., 2011].
Isostatic stress is achieved by compressing argon gas to a confining pressure of < 200 MPa. Gas is
compressed via a manually operated air-driven compressor (Schorch). Before introduction of argon
gas into the pressure vessel, a vacuum pump lowers confining pressure to 4 kPa to minimize humidity
and limit argon-air mixing.
A large internal furnace consisting of series of molybdenum coils was used to increase
temperature up to 2000 °C, measured by a set of three W-Re thermocouples. Temperature and heating
and cooling rates were both programmed using a ‘ramp-flat’ protocol and also monitored by a
Eurotherm controller. A cooling water circuit prevents the pressure vessel from overheating.
Maximum pressure (Pmax) depends on maximum temperature (Tmax), following the universal
gas-law that relates gas temperature and pressure and assumes argon as ideal compressible gas.
Depending on the temperature desired, gas is compressed first to a pre-calculated pressure; the
furnace is then used to increase the temperature, thus pressure to the eventual target pressure. During
HIP experiments, pressure and temperature remain constant. Afterwards, the furnace cools down
following a pre-set program. Compressed gas is vented out until room pressure is achieved. A chart
recorder collects and stores data on cooling water parameters, operating pressure and pressure vessel
temperatures at the sealing cap, near the bottom and at the inner hull.
The large pressure vessel (170 mm inner diameter and 500 mm length) allows space for 14
stainless steel canisters of 51 mm or 24 canisters of 35 mm inner diameter, including a 2 x 5 mm
safety margin for protecting the furnace windings and thermocouples.
HPT gas-medium testing machine (Paterson apparatus):
The rock deformation Paterson apparatus (designed by Prof. Mervyn Paterson at Australia
Scientific Instruments Pty Ltd) uses compressed argon gas as confining medium (Fig. 3.1C)
[Paterson, 1990]. Confining pressures up to 500 MPa are achievable. Pressure is usually increased
over several stages by manually operating a series of valves connected to a gas plumbing system: 1)
equilibration up to ~40 MPa of argon bottle pressure and pressurized argon gas in the secondary
pressure vessel or intensifier with the cylindrical main pressure vessel, 2) gas booster pump (Haskel)
increases confining pressure up to ~ 105 MPa and 3) intensifier oil-pump further increases pressure to
300-400 MPa. Re-stroking of the intensifier pump is required to reach higher pressures at room
temperature. Otherwise, gas pressure can be further increased by thermal expansion following
temperature rise. A stabilization time of at least 10 minutes is often required to cool-down pressurized
argon gas back to room temperature.
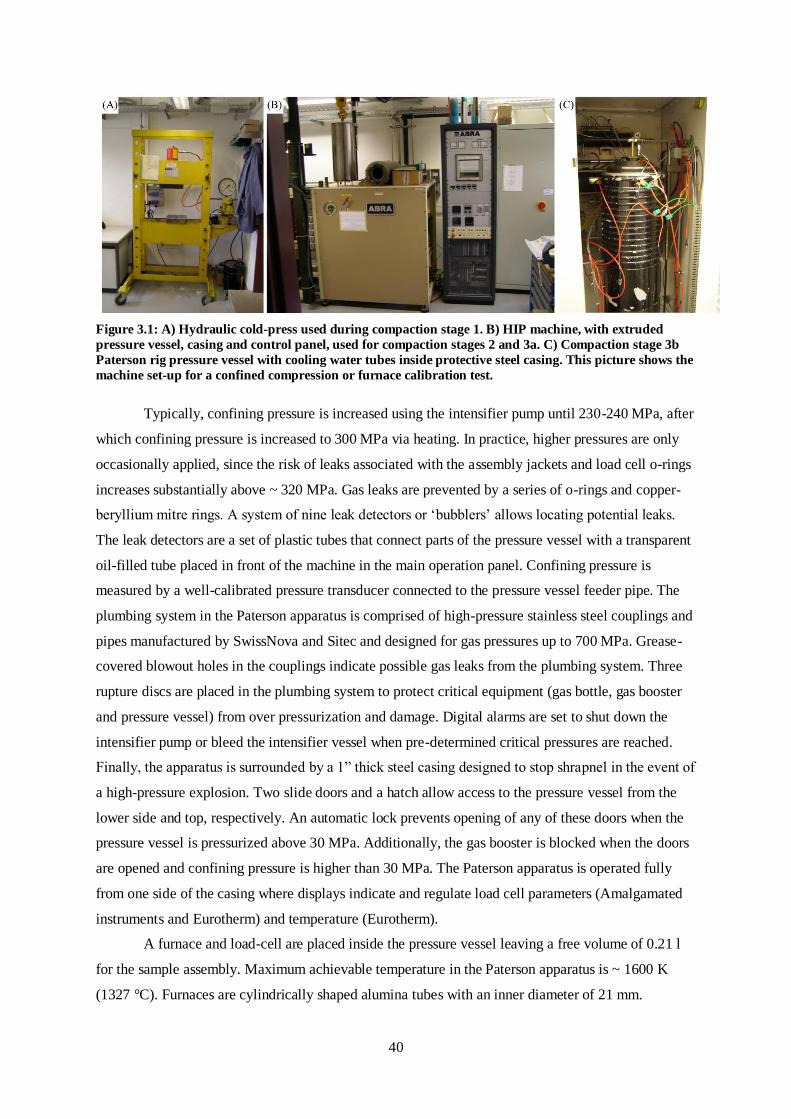
40
Figure 3.1: A) Hydraulic cold-press used during compaction stage 1. B) HIP machine, with extruded
pressure vessel, casing and control panel, used for compaction stages 2 and 3a. C) Compaction stage 3b
Paterson rig pressure vessel with cooling water tubes inside protective steel casing. This picture shows the
machine set-up for a confined compression or furnace calibration test.
Typically, confining pressure is increased using the intensifier pump until 230-240 MPa, after
which confining pressure is increased to 300 MPa via heating. In practice, higher pressures are only
occasionally applied, since the risk of leaks associated with the assembly jackets and load cell o-rings
increases substantially above ~ 320 MPa. Gas leaks are prevented by a series of o-rings and copper-
beryllium mitre rings. A system of nine leak detectors or ‘bubblers’ allows locating potential leaks.
The leak detectors are a set of plastic tubes that connect parts of the pressure vessel with a transparent
oil-filled tube placed in front of the machine in the main operation panel. Confining pressure is
measured by a well-calibrated pressure transducer connected to the pressure vessel feeder pipe. The
plumbing system in the Paterson apparatus is comprised of high-pressure stainless steel couplings and
pipes manufactured by SwissNova and Sitec and designed for gas pressures up to 700 MPa. Grease-
covered blowout holes in the couplings indicate possible gas leaks from the plumbing system. Three
rupture discs are placed in the plumbing system to protect critical equipment (gas bottle, gas booster
and pressure vessel) from over pressurization and damage. Digital alarms are set to shut down the
intensifier pump or bleed the intensifier vessel when pre-determined critical pressures are reached.
Finally, the apparatus is surrounded by a 1” thick steel casing designed to stop shrapnel in the event of
a high-pressure explosion. Two slide doors and a hatch allow access to the pressure vessel from the
lower side and top, respectively. An automatic lock prevents opening of any of these doors when the
pressure vessel is pressurized above 30 MPa. Additionally, the gas booster is blocked when the doors
are opened and confining pressure is higher than 30 MPa. The Paterson apparatus is operated fully
from one side of the casing where displays indicate and regulate load cell parameters (Amalgamated
instruments and Eurotherm) and temperature (Eurotherm).
A furnace and load-cell are placed inside the pressure vessel leaving a free volume of 0.21 l
for the sample assembly. Maximum achievable temperature in the Paterson apparatus is ~ 1600 K
(1327 °C). Furnaces are cylindrically shaped alumina tubes with an inner diameter of 21 mm.
41
Molybdenum windings are wound around the top, center and bottom of the core insulated with sheets
of hot isostatically pressed alumina paper around the windings. A metallic casing holds the
components in place. Temperature in the three-zone furnace is monitored by three R-type
thermocouples; each one situated a few mm away from the corresponding winding. Inside the
pressure vessel, the furnace is placed on top of the internal load cell. Power is supplied to each
winding via a sealed plug-head positioned on the top of the furnace. A pressure of at least 50 MPa is
required before power supply to the furnace can be applied. Furnace design is optimized for high-
pressure (> 100 MPa) operation.
By adjusting the relative power sent to each of the three coils, a stable temperature profile is
set. Specifically a thermal plateau where temperature varies by less than 2 °C is desired. Such a
plateau represents the constant temperature hot spot where the sample is positioned. The location of
the plateau within the furnace is recorded by a travelling K-type (chromel-alumel) thermocouple
through a furnace ‘calibration assembly’ where temperature can be measured at intervals of typically
1 cm over an 8 cm range.
Calibrations were regularly performed to verify furnace performance and maintain optimal
temperature conditions. Calibration settings are controlled by three parameters: 1) temperature, 2)
confining pressure, 3) type of metallic calibration assembly sleeve or jacket. Usually, relatively more
power is required from center and top windings if temperature is increased. Furnace calibration
changes noticeably when confining pressure is changed by more than 100 MPa; a few percent less
power is required for furnace calibration at lower confining pressure. Comparing iron and copper
jacket furnace calibration reveals a prominent difference in plateau length; ~ 2 cm for copper and 4-5
cm for iron. The difference in thermal conductivity between iron (at 27 °C: 80 W m-1 K-1) and copper
(at 27 °C: 401 Wm-1K-1) explains the recorded behavior.
The heart of the Paterson apparatus is the load cell at the bottom of the pressure vessel. It is
enclosed in a protective casing and rests on a 6 cm thick nut. The internal load cell contains a set of
linear variable differential transducers (LVDT) used to record axial displacement over a range of 3
cm. The internal load cell also contains an elastic element with a capacitance displacement transducer
attached to it and electric resistance strain gauges for monitoring axial force (kN). The maximum
force that can be applied in both extension and compression is 100 kN. An internal capacitor-type
torque cell is used for recording internal torque (Nm). Between the pressure vessel and axial actuator
an external load cell is situated to record external force (kN), which encompasses load cell internal
force and friction. The pre-calibrated external load cell is used as reference for internal force
calibration. A spring with known elasticity is axially compressed under confined conditions to load
both load cells. Friction caused by the internal load cell results in a nearly constant offset between
linearly increasing internal and external force. After friction correction, internal load cell settings are
fine-tuned to match external force data. Axial displacement readings are calibrated by comparing
42
them with an external displacement gauge mounted to the top of the axial actuator, and adjusting the
load cell settings accordingly.
In confined experiments with the Paterson apparatus, compression is achieved by driving a
piston upwards from below the pressure vessel, using an axial actuator powered by a Printed Motors
Works Ltd servomotor through reduction gearing. The actuator is operated and monitored through a
Eurotherm type 2604 controller. The piston can travel over 50 mm at maximum displacement rates of
0.55 mm s-1. A stirrup connects the external axial actuator piston with the internal compensating
piston, located inside the load cell casing, below the actual core of the load cell. The sample assembly
is inserted inside the furnace and pressure vessel, with its bottom anvil mounted inside the load cell.
Upwards movement of the axial actuator piston forces the sample assembly to move up towards the
fixed closure nut for the pressure vessel. The axial position and internal and external force data
recorded at the moment of touch between sample assembly and the closure nut (a.k.a. ‘touch point’ or
‘hit point) make zero-reference values to correct the subsequently collected data. Experiments carried
out in isostatic stress mode require that the sample remains continuously at touch point conditions to
ensure isostatic stress. The same applies to confined torsion tests. Combining compression and torsion
yields unreliable load cell data because zero-reference data for internal torque drift significantly with
internal force, and vice versa.
In confined torsion tests, the torque is generated by rotating or twisting the sample assembly
in a clock- or counterclockwise direction. A Berger Lahr servomotor provides the rotation through a
belt and gearbox system (54600 : 1), which is mounted on top of the pressure vessel as part of a
specially designed torsion module for the Paterson apparatus [Paterson and Olgaard, 2000]. A
rotating member transmits the rotation from the gearbox to the assembly. A Schaevitz rotary variable
differential transducer (RVDT) records angular displacement of the rotating member. The servomotor
is operated through a Berghof control panel. It can be operated up to 1000 Nm at velocities from 1 to
2000 rpm, which corresponds to a twist rate range of 3×10⁻⁷ to 6×10⁻⁴ rev s-1. The torque value at the
equivalent torsion touch-point is used for zeroing torque data recorded in the subsequent experiment.
The RVDT is manually reset to zero angular displacement at the start of an experiment.
A standard Paterson apparatus sample assembly consists of cylindrical 15 mm diameter
ceramic rods with a 2 mm diameter through-going hole (1), and intact 3 mm thick ceramic spacers (2)
that sandwich a rock specimen (3). Ceramic rods and spacers are made of either partially stabilized
zirconia (PSZ) (dark) or alumina (Al2O3) (beige), and have characteristic low thermal conductivity
(Fig. 3.2A-D). This, and their high strength and toughness, make them ideal assembly material for
high temperature experiments. A specially designed anvil, situated at the base of the column, fits
inside the internal load cell. Depending on the choice of experiment kinetics, an anvil for transmitting
torsion (5) or axial force (6) is placed on top of the assembly column. Both top and bottom anvils
have an axial hole. In the top part of the assembly, the holes align to form a channel used to place the
tip of a k-type thermocouple 3 mm above the specimen. A similarly connected channel in the bottom
43
part of the assembly is aligned with a tube that goes through the internal load cell casing and forms
the load cell pipe. In standard Paterson apparatus tests, these assembly channels are vented to the
atmosphere. A copper or iron jacket (7) in combination with a set of nitrile rubber o-rings (8) is used
to separate the pressure vessel argon gas from the vented assembly channels. At room temperature,
high-pressure experiments employing polyolefin shrink tubes as jacketing material have been
successful. The compression anvil (6) has a concealed o-ring that prevents gas from escaping the
pressure vessel. The asymmetric assembly column of ceramic rods and spacers places the specimen
about 5 mm above the center of the furnace such that the specimen in the sample assembly matches
the furnace temperature ‘plateau’ inside the pressure vessel. Typically, the temperature plateau is
offset to the top by 5-10 mm with respect to the furnace center. Alumina rods can be modified to
accommodate 10 mm diameter specimens (10).
The Paterson apparatus is also equipped with a pore pressure system comprised of two
reservoirs connected to the top and bottom ends of the sample assembly. The sample assembly used
for pore pressure experiments is characterized by a feed through pipe (12) attached to a modified top
anvil (9) and by ceramic spacers (11) having five holes to allow an even distribution of the pore
medium into the specimen. Figure 3.2C shows the pore pressure top anvil and a small part of the feed
through pipe. The top pore pressure or upstream reservoir consists of a volumometer, high-pressure
pipe and a tee-piece above the pressure vessel that serves as a connection between the top anvil feed
through pipe and the volumometer pipe. The volumometer is a small pressure vessel with 7 mm
diameter piston that can move over 50 mm. The maximum volumometer volume is ~ 1900 mm3. The
piston is driven by a Printed Motor Works Ltd GM9 servomotor and its position monitored by a
Schaevitz LVDT. Directly connected to the volumometer is a Stellar Technology Inc. pressure
transducer. The tee-piece allows a thin k-type thermocouple to be positioned inside the top anvil feed
through pipe. The bottom pore pressure or downstream reservoir is comprised of the assembly
channel, a pore pressure pipe inside the load cell casing and the load cell pipe that runs through the
compensating piston and exits the load cell casing. A pressure transducer and tee-piece close the
reservoir. A high-pressure pipe and valve connect the intensifier pressure vessel with the
volumometer. The pore pressure system is designed to withstand pressures of 500 MPa and to use
both liquids and gas as pore medium.

44
Figure 3.2A-D: Typical sample assemblies and parts for Paterson apparatus experiments in confined
compression and isostatic stress mode (A), confined torsion mode (B) and confined compression or
isostatic stress mode with imposed pore pressure (C). D) Alumina rods used for 10 mm samples (10) and
alumina spacer with five pore-pressure holes (11) used in pore pressure assembly.
3.3: Data recording and processing for compaction stage 3b
The Paterson apparatus is equipped with various sensors to monitor and record sample
displacement, applied forces, temperature and pressure. The calibrated and amplified signals are
collected in an 18-channel Eurotherm Chessel 6100A chart recorder. Care was taken to ensure that
recorded values match those shown by respective panels and displays. The chart recorder is connected
to a Eurotherm developed data collection software called iTools OPC scope, version 7.60. This
software writes recorded data to an ASCII based text file, which can be imported by spreadsheet
software for processing and visualization. The following quantities are logged in order of their
channel input: assembly temperature (in °C), confining pressure (in MPa), internal force (in kN),

45
torque position (in rad), internal torque (in Nm), internal position (in mm), external force (in kN),
downstream pressure (in MPa), volumometer position (in mm) and upstream pressure (in MPa). A
selection out of these ten quantities is usually made, based on experimental set-up and specific needs.
Sampling rate is selectable, but varies from every 3 s for short experiment and dynamic scenarios to
every 5 mn for steady state sample behavior. Absolute time is always logged.
Post-experimental data processing includes the calculations and corrections that are now
discussed. In confined compression experiments, sample cylinder length (L) at any point in time
during the experiment is derived from the displacement of the load cell with respect to its initial
position at ‘touch-point’, eq. 3.1A:
(eq. 3.1A)
(eq. 3.1B)
Where l is the original sample length (in mm), D and D0 are the internal position (in mm) of the load
cell during an experiment and at the start of the experiment (touch-point), respectively. Normalization
over original length gives the total axial strain (εtot) in % (eq. 3.1b), and includes elastic (recoverable)
strain.
Similarly, recorded internal or external force data are corrected for initial values at the start of the
experiment and converted to σdiff using equation 3.2A, representing sample strength (S):
(eq. 3.2A)
(eq. 3.2B)
Where A is the linearly corrected sample cross-sectional area in m2, Fi is internal force (in kN), F0 is
internal force at ‘touch-point’ (in kN). The multiplication factor 0.001 converts the unit kPa to MPa.
A0 and Af are the initial and final cross section area of the sample, respectively. Af represents the area
change following permanent deformation only. Elastic strain is neglected. Consequently, the rate of
area change is underestimated. The term (tf - t0) represents the duration of the experiment, where tf and
t0 are the absolute time (in s) at the end and the beginning of the experiment, respectively. The
absolute time during an experiment is expressed by t. Table A1 summarizes the terms used in
equations 3.2A and 3.2B.
As data quality check, corrected internal force is compared with external force. On average,
external force is 3 % higher than internal. Among experiments, the average external over internal
force ratio ranges between 0.97 and 1.08, with periods of better and poorer agreement. Since there is

46
no systematic deviation between internal and external force data, no further corrections to internal
force data, for example for machine compliance, were applied.
The load borne by the iron or copper jacket was not corrected for. At 500 °C for a strain rate
of 1×10⁻⁴ s-1, a 250 μm wall thickness iron jacket with 15 mm inner diameter contributes ~ 13 MPa.
At 750 °C the contribution is reduced to ~ 3 MPa. For copper the jacket load at 500 °C and 700 °C,
for a strain rate of 1×10⁻⁴ s-1 is ~ 8 and ~ 2 MPa. Calculations were based on rheological and
thermodynamical data from Frost and Ashby [1982] and are in agreement with jacket load values
reported by Chopra and Paterson [1981] and Chopra [1997].
No displacement data was recorded during isostatic stress tests. Instead, axial, radial and
volumetric finite strain was derived from the sample geometry by comparing data before and after
experiments.
After confined torsion experiments, acquired raw torque data was corrected for the ‘touch
point’ value at the onset of the experiment. The conversion from torque (M) to shear stress (τ) is given
by Paterson and Olgaard [2000], equation 10, which after rearranging gives:
(eq. 3.3)
Table A1 describes the quantities used. The stress exponent characterizes the rheological behavior of
stressed material and is 1 for Newtonian fluids, > 1 for non-Newtonian fluids, with values for rocks of
1-3 for flow by diffusion creep and 4-10 for flow by dislocation creep processes. The slope of a best-
fit line in a log stress vs. log strain rate plot gives the value of n. Equation 3.3 is valid for power-law
creep (i.e. 1 < n < 10). Calculated values for τ only have meaning within the sample group. However,
torque values are normalized for sample diameter, which allows comparison of different samples. A
value of 1 is assumed for n.
Shear strain (γ) is the product of experiment time (in s) and the applied strain rate (in s-1),
which is derived from sample geometry and rotary motor speed (v), eq. 3.4:
(eq. 3.4)
The multiplication factors of 54600 and 60 convert v (in RPM) to sample twist rate (υ) in rev s-1.
After experiments, shear strain is verified from the shear angle (ψ) described by strain
markers grooved in the jacket before the experiment. Shear strain is calculated from ψ (in rad) using
equation 3.5:
(eq. 3.5)
47
3.4: Methods for chemical analysis
To monitor compositional and mineral phase changes a suite of qualitative and quantitative
chemical analysis techniques was applied. Thermogravimetry (TGA) and Karl Fischer Titration
(KFT) analysis gave insight into the dehydration and dehydroxylation processes. X-ray fluorescence
(XRF) analysis was performed to investigate major element behavior. Mineral phases were monitored
with X-ray diffraction (XRD) analysis. General advantages of the chosen analytical methods include
the bulk sample nature of the analysis and relative ease of the sample preparation.
Thermogravimetry:
During thermogravimetry analysis, mass loss is continuously measured. A wide range of
chemical processes, such as dehydration, decomposition and oxidation are identified in a material
characteristic ‘TGA curve’ in which mass losses at process-specific temperature intervals are
identified. For geological materials, mineral reactions and transformations are normally too slow to be
captured in TGA curves. However, dehydration reactions, and reactions producing for example, CO
or CO2 gas are faster and clearly identifiable. In this study, phyllosilicate dehydration is considered to
be the only source for mass loss.
TGA has been applied to several pelitic samples and post compaction stage 2 HIP1 synthetic
metapelites. Their comparison provides a quantitative measure for the effect of hot isostatic pressing
in compaction stage 2 on water content and further dehydration behavior. TGA of other shales mostly
reflects variation in clay content.
A Netzsch STA 409 C/CD thermobalance, with top-loaded samples and digital balance, was
used for the TGA. A linear heating program with a rate of 10 K/min from room temperature to 1500
°C was applied. Sample powders were placed in alumina crucibles of known mass. Simultaneously, a
reference alumina crucible (1400 mg) with 50 mg alumina powder was measured to obtain sample
holder correction values. Initial mass of sample powders varied between 50 and 230 mg. Resolution
of the mass balance system is 2 μg. To avoid reactions between sample and air, analyses were
performed in an inert argon-gas atmosphere, maintained with an input flow rate of 40 ml/min. Data
were collected and processed using proprietary Proteus® software.
X-ray powder diffraction:
XRD is a family of non-destructive analytical techniques that yield information about the
crystallographic structures of minerals. An X-ray detector records the scattered intensity of X-rays as
a function of incident angle (θ). Results are displayed in a diffractograph with 2θ versus intensity.
Crystallographic planes of minerals peak at a characteristic 2θ angle, which allows their identification
using the database of diffraction data maintained by the International Centre for Diffraction Data.
48
XRD measurements were performed on a range of natural shales to identify mineral content and clay
crystallinity. Maplewood Shale samples after compaction stages 2, 3a and a selection of 3b were
analyzed to identify any growth of new mineral phases.
The employed diffractometer is a Bruker AXS D8 Advance, equipped with a Lynxeye
superspeed detector and automatic 9-slot sample changer. Powder samples were measured between 4
and 89.9° 2θ angle, with 0.025° step size per second. Glass discs were used to hold a few milligram of
sample material. Scans were performed in locked coupled mode with a divergence and antiscattering
slit of 20 mm, while rotating samples. Position of the Lynx-iris was at 12 mm. Scan settings were set
and adjusted using templates constructed with Bruker AXS XRD Wizard version 2.4.3 software.
Scans were performed using Bruker AXS DIFFRAC plus XRD Commander 2.4.3. The proprietary
software package ‘EVA 2’ (developed by SOCABIM, now Bruker AXS), version 11.0.03 was used to
correct XRD diffractographs for background noise and to apply curve smoothing as well as
establishing a link to the database.
X-ray fluorescence:
Bulk major element composition of several natural shales including Maplewood Shale was
determined using XRF. Upon excitement from high-energy X-ray bombardment, sample material
emits a characteristic X-rays spectrum, which is detected by a photomultiplier that counts the number
of photons passing through as a measure of element quantity.
XRF analysis was performed using a wavelength dispersive X-ray fluorescence spectrometer
(Axios PANanalytical) equipped with five diffraction crystals. Analysis was performed on fused glass
beads prepared from sample powder mixed with dilithium-tetroborate in a 1:5 ratio using a Claisse
M4® fluxer. Glass bead preparation includes loss on ignition (LOI) measurements calculated from the
weight loss of a ~ 2 g powder during a 2 hr exposure to 1050 °C. The calculated LOI should be
similar to the TGA weight loss up to 1050 °C. Like in the interpretation of TGA curves, water content
in a sample is assumed to be equal to the LOI value.
Karl Fischer Titration:
Water content was determined using KFT [e.g. Behrens et al., 1996]. The advantages of this
technique include high accuracy and precision, selectivity for water, small sample quantity
requirement, short analysis duration and easy sample preparation. Unlike water content determination
by TGA or loss on ignition calculations, KFT directly measures bulk sample water loss. No
assumption about the contribution of dehydration to total mass loss has to be made. KFT works on the
basis that water released from the sample upon heating is captured and diverted to a reagent. This
reagent is designed to have all reaction species in excess, water excepted. The rate of the reaction is
monitored by a voltmeter; voltage is a function of reaction products.

49
After each compaction stage, except stage 1, a representative part of a sample was removed,
crushed and ground into a powder. About 30 to 40 mg of powder was then placed in a platinum
capsule and heated in a platinum furnace following a fixed program called ‘mica-test’. This program
controls an initial 2 minute of heating period to 300 °C. After 60 seconds, the software starts
recording titration values. This one-minute delay is designed to allow free water to be released before
it is included in the total water content analysis. Temperature is held at 300 °C for 3 minutes and
followed by 8 minutes of further heating. Temperature is increased to a constant value of 1200 °C is
reached. Typically, water release starts at ~ 700 °C and continues until the maximum temperature has
been established. Titration recording is aborted when the rate of water release decreases to 0.40 mg/s
or less. Background values for water release (i.e. < 0.40 mg/s) are subtracted from the total water
release value. Water content is the sum of the water release rate at each time step. Normalization over
sample mass gives water content. Before each batch of KFT samples was analyzed, blanks were
measured to ensure the absence of free water inside the KFT set-up. KFT calibration and reliability
were checked using single crystal muscovite with known water content. Samples were analyzed two
or three times when sufficient sample powder was available to get insight in reproducibility and
errors. Resolution of the KFT method is within 0.01 wt %, but precision is estimated at 0.2 wt. %.
3.5: Porosity and density measurements
Porosity and density are key parameters describing the compaction grade of buried sediments.
Numerous studies have been devoted to the relationship between porosity and fluid- or heat-flow
parameters like permeability and thermal conductivity. In this study, a helium pycnometer was
employed to measure grain density and porosity after each step of the experimental compaction
procedure, except for step 1.
Helium pycnometer:
Connected porosity and grain density were measured indirectly by a Micromeritics AccuPyc
1330 helium pycnometer. The pycnometer uses pressurized (~ 1.44 MPa) helium gas to determine the
grain volume of the solid material that occupies one of two chambers of calibrated space. Connected
porosity (φc) is calculated using equation 3.6:
(eq. 3.6)
Similarly, grain density is defined as the ratio of mass (m) over Vg in g cm-3 or kg m-3. Bulk density
was calculated as the ratio of mass over bulk volume (Vb) in g cm-3 or kg m-3. Vb was determined
from 10-micrometer resolution caliper measurements of cylinder diameter and length.

50
The pycnometer chambers were calibrated with industry-certified standards. Detailed analysis
of pycnometer accuracy, precision and resolution yielded working values of 0.01 %, 0.20 % and 0.001
cm3 respectively, for the smallest and the most commonly used calibrated chamber of 10 cm3, using
an iron cylinder of known grain volume. The offset caused by accuracy is manually corrected by
applying a multiplication factor of 0.993 to grain volume determinations. Room temperature
variations have a noticeable effect on volume estimates. Error analysis on an iron cylinder of known
volume and zero porosity revealed a slope of 0.0017 cm3/°C. Sample volume estimates were corrected
linearly for temperature effects using this slope value and a reference temperature of 29.0 °C. The
pycnometer was set to automatically repeat volume measurements seven times to improve statistics
and to rule out gas pressure effects on the sample’s pore structure. Data were accepted only when two
requirements were met: 1) a robust difference between minimum and maximum values within seven
runs of less than 0.01 cm3, and 2) volume estimates 1 to 7 that do not describe a systematically
increasing or decreasing volume, which would indicate an unstable pore structure. Corrected average
grain volume values (Vg) were used to determine sample porosity following equation 3.5. Volume
correction habitually decreases porosity estimates by 0.6-7 %, while temperature corrections can yield
a 1 % porosity estimation adjustment. Before pycnometer analysis, samples were oven dried at 110 °C
for at least 1 hour to remove free water from the pores.
3.6: SEM imaging
Microstructural analysis provides key insight into compaction processes. The study of shales
mostly involves material (clay and fine silt) that is very fine-grained, such that optical light
microscopy is ineffective. Scanning Electron Microscopy (SEM) permits a magnification of over
100,000 and to sub-micron resolution. In this study, microstructural visualization is performed by
SEM and is undertaken to inspect the behavior of fabric and mineral phases during compaction.
Emphasis was placed upon microstructural parameters such as foliation, grain shape and size, mineral
phase transformation, pore structure, deformation structures (e.g. micro-fractures and cracks, micro-
folds, recrystallization, and signs of crystal lattice defects) and melt. SEM analysis was performed on
both polished and broken surface samples, employing backscatter electron (BSE) and secondary
electron (SE) detecting techniques. Mineral phases were identified using their grayscale contrast in
BSE images and their major element distribution obtained from the semi-quantitative energy
dispersive X-ray (EDX) technique.
The SEM used for this study is a FEI Quanta 200 FEG. FEG stands for field emission gun, a
specialist electron gun that generates an electron beam by using emitters of zirconium oxide; known
as Schottky type FEG. Employed SEM settings are highly variable and depend on sample type and
coating conditions in terms of quality, polish grade and cleanliness, purpose (semi-quantitative
51
chemical analysis versus, high-resolution imaging). The SEM is operated at high vacuum (< 10-4 Pa)
but low vacuum (30-100 Pa) was applied for samples with a particular poor electron conduction due
to, for instance, damaged or thin coating. The electron beam is usually operated with a high voltage of
10 kV, but deflections to 5 kV to avoid sample charging, or 20 kV to improve particle emission from
the sample were used as required. Beam spot size varied between 4 and 6 units and beam aperture was
set at 30 μm for high vacuum or 40 μm for EDX analysis. Working distance (i.e. distance between
objective lens and sample surface) was maintained around 10 mm.
Samples in this study are mostly cylindrical. Sample surfaces created for SEM analysis
generally originate from cutting the cylindrical sample parallel to the axis at distance R’ (2-3 mm)
away from the sample periphery or distance R away from the axis (Fig. 3.3A). This cut produced two
surfaces, an inner cut plane and outer cut plane. Inner cut planes are vertically mirrored copies of the
outer cut planes (Fig. 3.3B-C). Large samples (l > 10 mm) are cut normal to the cylinder axis at length
L to minimize SEM sample size and preserve sample material for further analysis.
Polished surface BSE imaging and EDX analysis:
Polished surface samples are obtained from the exterior plane of a sample cut (Fig. 3.3C). To
avoid loss of quartz grains during fine-polishing, samples were impregnated with cold mounting
epoxy resin (Struers) to close pore space and support soft clay/mica matrix. The resin was prepared by
mixing EpoFix resin and hardener (25:3). A desiccator with vacuum pump was used to force the
EpoFix resin mixture into sample pore space, followed by > 6hr drying in a 60 °C oven. Samples were
then included in a transparent epoxy (Struers) using SpeciFast acrylic hot mounting resin and a
Struers LaboPress-3 with 5-minute heating time at 180 °C and force of 15 kN and 8-minutes cooling.
Resulting samples were subsequently polished using wet abrasive papers with increasing grits until
the original sample was exposed again. Then diamond paste (Struers) polishing was applied to remove
scratches generated during the wet abrasive paper polishing, employing decreasing particle sizes (6, 3
and 1 μm).
After thorough cleaning with alcohol, a carbon coating of 15-20 nm thickness was applied using a
self-made graphite-electrode coating machine, which uses Edwards vacuum pumps and a Bal-tec
QSG 060 quartz thickness and rate monitor. The sample was then mounted on an aluminum SEM
stage holder and silver-painted to improve electric conductivity of the sample. Inside the SEM sample
chamber, sample cylinder planes or their parallel equivalents were rotated to a horizontal orientation.
Samples were particularly well observed in BSE mode, which yields an atomic number- or Z-contrast
imaging. Back-scattered electrons are beam electrons that have been reflected back from the sample
by elastic scattering (i.e. no energy exchange between electron and atom). As the primary electron
beam scans the sample surface, heavier elements, backscatter more electrons and thus appear brighter.
52
BSE images were primarily used to distinguish mineral phases, though sample topography at
irregularities like pores and grain boundaries is also imaged due to electron beam shadow effects.
An EDAX Pegasus detector was used to perform energy-dispersive X-ray spectroscopy (EDX) on
selected sample sites. The detector measures the energy of element-specific X-rays emitted from the
sample after interaction with the high-voltage electron beam. EDX spectra plot X-ray energy versus
intensity. Peaks correspond with element orbitals from where the X-rays originated.
Broken surface SE imaging:
Broken surface samples were obtained by fracturing the sample near its periphery (Fig. 3.3A).
In most cases, the interior plane is used for broken surface imaging (Fig. 3.3B). No polish or epoxy
impregnation was required. A flat base was created by either fast polish on low-grit abrasive paper or
automated diamond saw cutting. Loose material on the surface was removed by blowing compressed
air before coating sample with gold, using a Bal-tec SCD 500 sputter instrument equipped with Bal-
tec QSG 100 Quartz film thickness monitor. Gold coating was 8-10 nm thick. The coated samples
were then attached to an aluminum SEM stage holder and their sides were silver painted for better
electric conductivity. Once inside the SEM sample chamber, samples were rotated to ensure optimum
image quality. This implies that fabric elements are not imaged in a consistent framework.
The preferred SEM detection mode to image broken surfaces records the current of incoming
secondary electrons (SE). The SE detector (a scintillator-photomultiplier) collects low-energy (< 50
eV) secondary electrons that originate from the k-orbitals of atoms through inelastic scattering
processes as the primary electron beam passes. Because of their low energy, secondary electrons
originate from the top few nm of the sample. This allows high resolution. SE intensity strongly
depends on surface topography and slope angles. Grayscale contrast in SE images thus represents
mostly grain and pore shapes. Broken surface SE imaging allows the visualization of intact grains,
voids and apparent 3D fabric elements for the evaluation of the dependence of varying experimental
conditions on compaction processes.
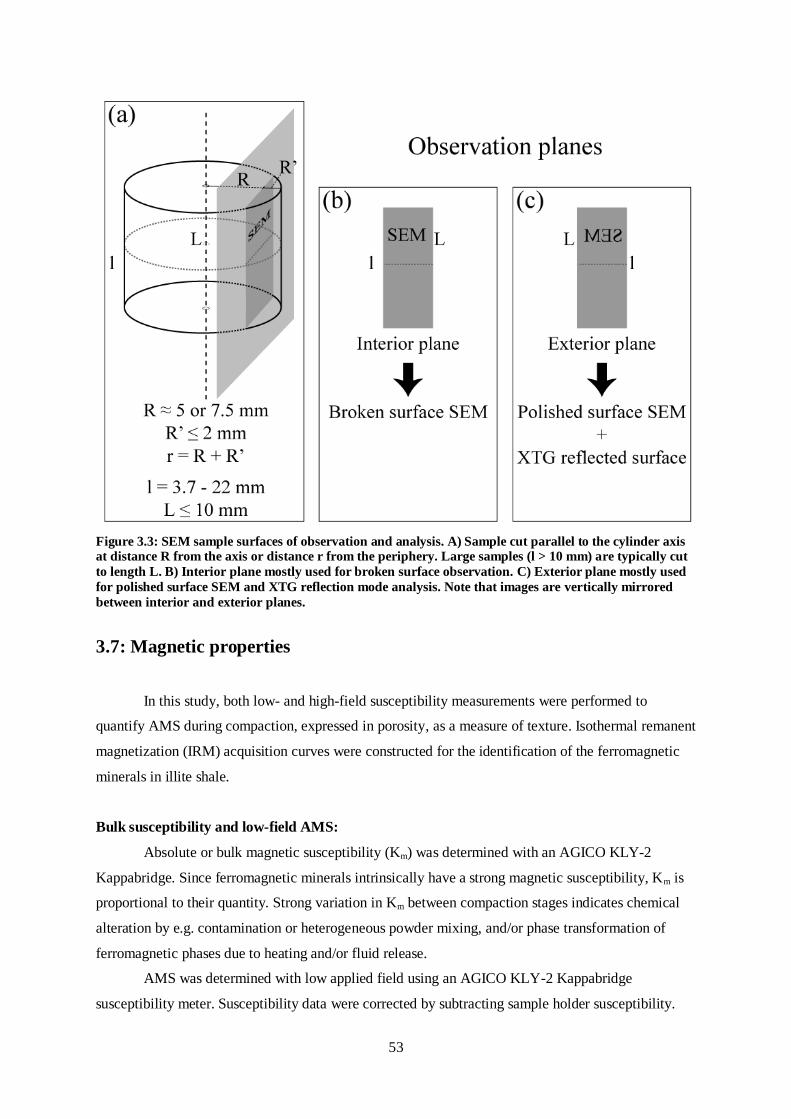
53
Figure 3.3: SEM sample surfaces of observation and analysis. A) Sample cut parallel to the cylinder axis at distance R from the axis or distance r from the periphery. Large samples (l > 10 mm) are typically cut
to length L. B) Interior plane mostly used for broken surface observation. C) Exterior plane mostly used
for polished surface SEM and XTG reflection mode analysis. Note that images are vertically mirrored
between interior and exterior planes.
3.7: Magnetic properties
In this study, both low- and high-field susceptibility measurements were performed to
quantify AMS during compaction, expressed in porosity, as a measure of texture. Isothermal remanent
magnetization (IRM) acquisition curves were constructed for the identification of the ferromagnetic
minerals in illite shale.
Bulk susceptibility and low-field AMS:
Absolute or bulk magnetic susceptibility (Km) was determined with an AGICO KLY-2
Kappabridge. Since ferromagnetic minerals intrinsically have a strong magnetic susceptibility, Km is
proportional to their quantity. Strong variation in Km between compaction stages indicates chemical
alteration by e.g. contamination or heterogeneous powder mixing, and/or phase transformation of
ferromagnetic phases due to heating and/or fluid release.
AMS was determined with low applied field using an AGICO KLY-2 Kappabridge
susceptibility meter. Susceptibility data were corrected by subtracting sample holder susceptibility.
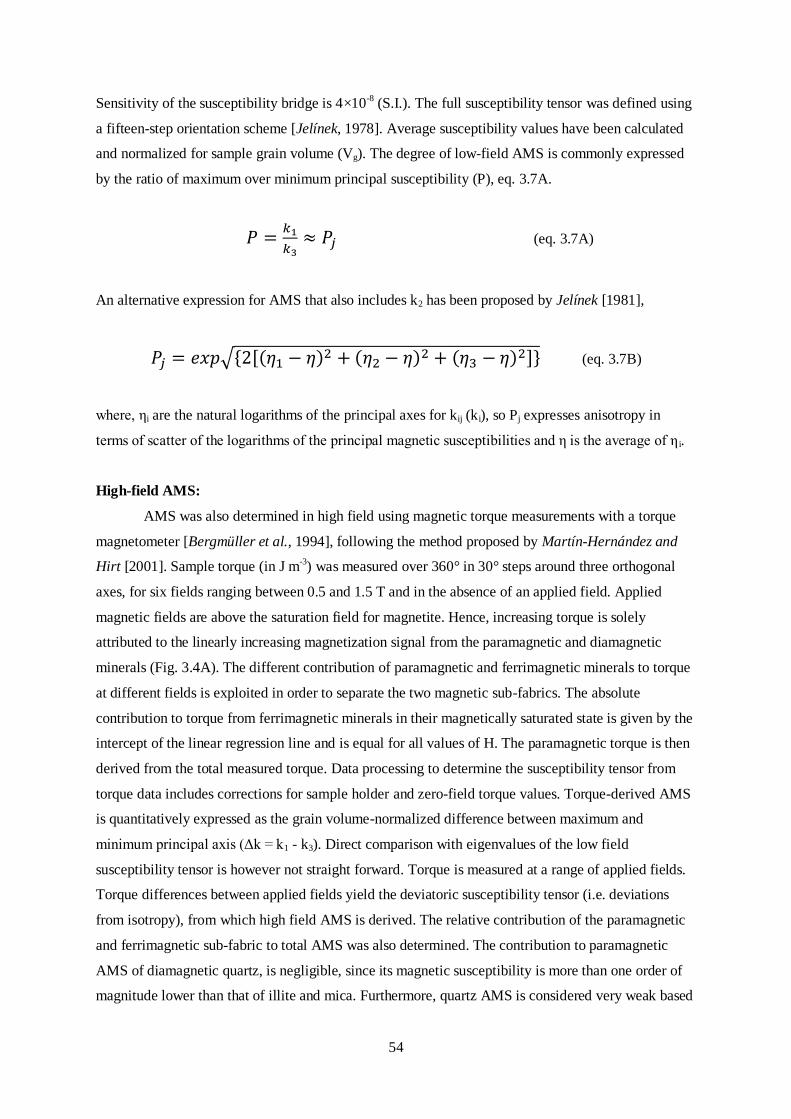
54
Sensitivity of the susceptibility bridge is 4×10⁻⁸ (S.I.). The full susceptibility tensor was defined using
a fifteen-step orientation scheme [Jelínek, 1978]. Average susceptibility values have been calculated
and normalized for sample grain volume (Vg). The degree of low-field AMS is commonly expressed
by the ratio of maximum over minimum principal susceptibility (P), eq. 3.7A.
(eq. 3.7A)
An alternative expression for AMS that also includes k2 has been proposed by Jelínek [1981],
(eq. 3.7B)
where, ηi are the natural logarithms of the principal axes for kij (ki), so Pj expresses anisotropy in
terms of scatter of the logarithms of the principal magnetic susceptibilities and η is the average of η i.
High-field AMS:
AMS was also determined in high field using magnetic torque measurements with a torque
magnetometer [Bergmüller et al., 1994], following the method proposed by Martín-Hernández and
Hirt [2001]. Sample torque (in J m-3) was measured over 360° in 30° steps around three orthogonal
axes, for six fields ranging between 0.5 and 1.5 T and in the absence of an applied field. Applied
magnetic fields are above the saturation field for magnetite. Hence, increasing torque is solely
attributed to the linearly increasing magnetization signal from the paramagnetic and diamagnetic
minerals (Fig. 3.4A). The different contribution of paramagnetic and ferrimagnetic minerals to torque
at different fields is exploited in order to separate the two magnetic sub-fabrics. The absolute
contribution to torque from ferrimagnetic minerals in their magnetically saturated state is given by the
intercept of the linear regression line and is equal for all values of H. The paramagnetic torque is then
derived from the total measured torque. Data processing to determine the susceptibility tensor from
torque data includes corrections for sample holder and zero-field torque values. Torque-derived AMS
is quantitatively expressed as the grain volume-normalized difference between maximum and
minimum principal axis (Δk = k1 - k3). Direct comparison with eigenvalues of the low field
susceptibility tensor is however not straight forward. Torque is measured at a range of applied fields.
Torque differences between applied fields yield the deviatoric susceptibility tensor (i.e. deviations
from isotropy), from which high field AMS is derived. The relative contribution of the paramagnetic
and ferrimagnetic sub-fabric to total AMS was also determined. The contribution to paramagnetic
AMS of diamagnetic quartz, is negligible, since its magnetic susceptibility is more than one order of
magnitude lower than that of illite and mica. Furthermore, quartz AMS is considered very weak based
55
on its stiffness and shape preferred orientation in Maplewood Shale (quartz aspect ratio << clay and
mica aspect ratio), which makes it magnetically nearly isotropic.
Samples were prepared from natural illite shale (NAT), HIP1, HIP2 and PAT1 sample groups
(Table 3.1). Some ferrimagnetic phases such as hematite and iron-sulphides, are notoriously difficult
to separate with the high field method because their saturation magnetization is very high (H > 1 T).
They cause deviations from linearity, which affect the error of the intercept determination. These
phases were not accounted for in the AMS separation (Fig. 3.4A). The validity of this omission
depends largely on which ferrimagnetic minerals are preserved or formed.
Isothermal Remanent Magnetization:
Isothermal remanent magnetization (IRM) curves were acquired to identify which
ferromagnetic (s.l.) mineral phases occur. IRM acquisition was imparted either in a random direction
for compacted samples or on a powder, using a vibrating sample magnetometer (VSM). IRM
acquisition curves show the measured magnetic remanence (Mr) of the sample, carried by the
ferromagnetic (s.l.) fraction of the minerals, at increasing applied magnetic field (0 to 1000 mT) and
normalized over the saturation remanence (Ms). The average of three runs was used. Saturation
remanent magnetization occurs at mineral specific values for H. IRM provides further quantitative
data on remanent coercivity (Hcr) (Fig. 3.4B-C). Preceding IRM acquisition, hysteresis loops of Mr as
a function of H were performed using the same VSM. From such loops, characteristic parameters such
as initial slope (KM), magnetization saturation (Ms), remanence (Mr) and coercivity (Hc) were
determined (Fig. 3.4B). The ratios Mr/Ms and Hcr/Hc are useful material characteristic parameters.
One sample at each compaction stage, except after stage 1, was analyzed using IRM
acquisition and hysteresis loops. Differences in shape and rate of saturation of the acquisition curves
indicate that the magnetic remanence carrying minerals in the sample underwent alteration, which
gives insight in the chemical processes occurring during individual compaction stages.
Figure 3.4: A) Magnetic field versus torque-plot, showing the linear increase of torque used in high field
AMS. Three lines comprised of six data points correspond to orthogonal sample orientations. B) Magnetic
hysteresis loop comprised of ascending and descending magnetization curves. Specific magnetic properties such as remanence (Mr), saturation (Ms) and coercivity (Hc and Hc’) are displayed [Tauxe,
2010]. C) ΔM curve gives remanent coercivity (Hcr) at half the maximum value for ΔM [Tauxe, 2010].

56
57
Chapter 4
Evaluation of instrumentation precision
________________________________________________________________
Glenn Turner once said, “Worrying is like a rocking chair, it gives you something to do, but it gets
you nowhere.”
Preface
The Paterson apparatus is well-known and widely applied by the experimental rock
deformation community to solve a range of geological problems. In fact, it is one of the few types of high pressure and temperature deformation machines that are commercially sold to several rock physics labs worldwide. Furthermore, since the first model Paterson apparatus was made available in the late nineteen eighties, its designer and his support team at Australian Scientific Instruments Pty Ltd in Canberra (Australia) have always been deeply involved in machine maintenance and revisions, and have been available for troubleshooting on any technical level. One of the advantages of the Paterson apparatus over other deformation machines is the high sensitivity and accuracy of the load-cell,
provided sample material is rheologically homogeneous and sensor and furnace calibration was performed sensibly. To scientifically verify and quantify the load-cell performance in terms of data reproducibility a series of repeated-torsion tests on pure calcite Carrara marble was performed in the first year of my PhD (2008). This small project served secondly as the tutorial on how to operate and maintain the Paterson apparatus. The rheological flow behavior of Carrara marble has been investigated earlier in previous PhD studies at the rock deformation laboratory of the Geological Institute at ETH Zurich. Findings from these studies served as basis for this 2008 follow-up study with a tutorial character. In April 2011 the results were published in the special volume of the peer-
reviewed journal Tectonophysics, on the thermo-hydro-chemo-mechanical couplings in rock physics and rock mechanics. This volume was dedicated to the late Dr. Luigi Burlini, at the time lab manager and supervisor for my PhD project. The text, tables and figures in this chapter are directly taken from the original manuscript of the published paper, minor lay-out and formatting modifications to ensure homogeneity in this thesis. Bruijn, R. H. C., K. Kunze, D. Mainprice, and L. Burlini (2011), Mechanical and microstructural
development of Carrara marble with pre-existing strain variation, Tectonophysics, 503, 75-91, doi:10.1016/j.tecto.2010.09.029.

58
Mechanical and microstructural development of Carrara marble with pre-
existing strain variation
Rolf H.C. Bruijn1*
, Karsten Kunze2, David Mainprice
3 and Luigi Burlini
1 Geological Institute, ETH Zurich, Sonneggstrasse 5, CH-8092 Zurich Switzerland
2 Electron Microscopy, ETH Zurich, Wolfgang-Pauli-Strasse 16, CH-8093 Zurich Switzerland
3 Géosciences Montpellier, CNRS and Université Montpellier 2, Place Eugène Bataillon, 34095
Montpellier, France
* Corresponding author: [email protected]
Abstract
A series of two-stage torsion experiments on Carrara marble were conducted to constrain the influence of known prior deformation on rheological response and microstructural evolution. Comparison with previous experimental data on Carrara marble flow and fabric evolution during single-stage torsion deformation experiments provided direct insights into the significance of initial deformation at various
conditions. Our experiments were conducted at 727 °C temperature and 300 MPa confining pressure, while maintaining a constant strain rate of 3x10⁻⁴ s-1 on the periphery of the cylindrical samples. Under these conditions, the marble is known to deform in power-law (n = 6-10) ductile flow. All torsion experiments were performed with a Paterson type gas-medium testing machine equipped with a torsion actuator module. Prior (D1) and subsequent (D2) deformation are accomplished by two torsion experiments in sequence on same sample segments. The effect of D1 strain history is investigated during D2 by applying
counter-clockwise torsion to a sandwich sample consisting of three segments with different D1 rotation sense. D2 samples experienced continued, first and reversed shearing deformation in top, centre and bottom segments, respectively. D2 bulk strain was chosen equal to D1 strain in top and bottom segments. D1 experiments followed the typical single-stage deformation behaviour of Carrara marble under the applied experimental conditions. Yielding was followed by strain hardening until a peak stress was reached at a shear strain around 1, after which work softening occurred. Weakening gradually evolved into a constant stress regime. During hardening, a shear microstructure and crystallographic preferred
orientation (CPO) developed. Afterwards the volume fraction of smaller dynamic recrystallised grains increased continuously, resulting in a recrystallisation microstructure and CPO at shear strains of 5 and higher. The new D2 experiments displayed a strain variation between homogeneously deformed sample segments that increased with increasing D1 strain. The stress-strain behaviour of the D2 bulk sandwich samples showed less pronounced work -hardening and -softening when compared with single-stage deformation experiments. Furthermore, constant flow stress was attained at increasingly lower strain with increasing D1 strain. In most D2 segments, fabric development is equivalent to
single-stage experiments at corresponding absolute strain. The fabrics differed markedly from those in single-stage experiments in the case of reversed two-stage deformation at moderate strain (D1 shear strain 1 and 2.6). Experiments show that grain shape by shearing of relict grains is defined by finite strain and thus affected by strain reversal. Recrystallisation is controlled by absolute strain and not influenced by strain reversal.
59
4.1: Introduction
Modeling of lithosphere strength is based on the observed flow behaviour of rock-forming
minerals in lab experiments extrapolated to natural geological conditions [e.g. Kirby, 1983; Carter and
Tsenn, 1987; Kohlstedt et al., 1995]. The aim of most rock deformation studies is to find parameters
that describe the flow behaviour of samples under steady state conditions (i.e. constant stress and
strain rate, and completed microstructure and texture development). It is common belief that most
significant lithosphere deformation is accommodated by high strain shear zones that have reached such
steady state.
Calcite single crystals, limestones and marbles are at present, and have been historically,
among the most commonly studied rock type in experimental deformation studies [e.g. Adams and
Nicolson, 1901; Griggs, 1936; Griggs and Miller, 1951; Rutter, 1974; 1995; 1998; Schmid et al.,
1977; 1980; 1987; Walker et al., 1990; De Bresser and Spiers, 1993; Covey-Crump, 1998; Pieri et al.,
2001a; b; Barnhoorn et al., 2004; Barber et al., 2007]. Their widespread appearance, low stress plastic
flow behaviour at low temperature and lab strain rates, monomineralic composition make them ideal
for rock deformation studies. In addition, limestones and marbles are frequently associated with upper
crustal shear zones [e.g. Schmid, 1975; Pfiffner, 1982; Bestmann et al., 2000; Herwegh and Kunze,
2002; Austin et al., 2008].
High temperature (T ≥ 500°C) and pressure (Pconf ≥ 200 MPa) pure shear tests on Solnhofen
limestone, Yule Marble, Carrara marble and synthetic calcite aggregates revealed three distinct plastic
flow regimes separated by differential stress: 1) At high stresses, flow is best described by an
exponential law, while deformation is accommodated primarily by e-twinning and intracrystalline slip
[Turner et al., 1954; Heard, 1963; Heard and Raleigh, 1972; Rutter, 1974; Schmid, 1976; Schmid et
al., 1977; 1980]. 2) At intermediate stresses, power law flow behaviour with stress exponent n ≥ 4,
associated with dislocation creep processes and dynamic recrystallisation by subgrain rotation and
grain bulging dominates [Heard and Raleigh, 1972; Schmid, 1976; Schmid et al., 1977; 1980; Walker
et al., 1990; Rutter, 1995]. 3) At low stresses, observed flow behaviour is strongly grain size
dependent. For fine grained limestone flow is best characterised by a power law with n ≤ 2, related to
grain boundary sliding aided by diffusion creep processes [Schmid, 1976; Schmid et al., 1977; Walker
et al., 1990]. Whereas, for coarse-grained Carrara marble flow behaviour follows a power law with n ≤
4 associated with dislocation creep processes and dynamic recrystallisation by grain boundary
migration [Schmid et al., 1980; Rutter, 1995].
These pure shear experiments are limited in strain and reliable for ε < 25%. Their validity
became questionable when simple shear experiments to initially γ = 2.5 and later γ > 5 revealed work
softening in Carrara marble deforming in the dislocation creep field, related to dynamic
recrystallisation [Schmid et al., 1987; Paterson and Olgaard, 2000; Pieri et al., 2001a; Barnhoorn et
al., 2004]. New notion of steady state in calcite was established when constant strain rate torsion
60
experiments revealed a constant flow stress without discernable fabric changes for shear strain > 5.
This strain value, though, decreases with increasing temperature and lower strain rates [Casey et al.,
1998; Paterson and Olgaard, 2000; Pieri et al., 2001a; Barnhoorn et al., 2004]. Three explanations
for work softening related to dynamic recrystallisation have been proposed: 1) grain refinement
leading to an increased contribution of grain size sensitive flow (diffusion creep controlled) at the cost
of grain size insensitive flow (dislocation creep controlled) [e.g. Poirier, 1980; De Bresser et al.,
2001; Ter Heege et al., 2002], provided grain growth is suppressed [Olgaard, 1990], 2) geometrical or
fabric softening (i.e. crystal preferred orientation (CPO) development leading to crystal alignment in
easy slip orientations) [e.g. Poirier, 1980; Rutter, 1998; Pieri et al., 2001a; b] and 3) grain boundary
migration recrystallisation replacing grains with high dislocation density [Poirier, 1985; Rutter, 1998].
Although the latter was disputed by Ter Heege et al. [2002] for Carrara marble.
In parallel, Covey-Crump [1998] evaluated the alleged low strain steady state and concluded
that the associated microstructural development, unlike previously considered, had not completed yet.
A different train of thought was followed by a group of researchers that continued to investigate flow
behaviour of calcite aggregates, limestone and marble in uniaxial compression. Intrigued by observed
work softening in Carrara marble simple shear experiments, Rutter [1999] proposed a modification of
the power law equation by adding a strain exponent term. In comparison with dislocation climb
controlled creep in other rock-forming minerals [e.g. Evans and Kohlstedt, 1995] extraordinary high
values for stress exponent n are reported for marble (i.e. n ≥ 7, [Schmid et al., 1980; 1987; Pieri et al.,
2001a]). De Bresser [2002] proposed dislocation cross-slip as dominant recovery mechanism for
regime 2 instead of classic dislocation climb controlled recovery mechanism. Renner et al. [2002]
concluded that a Peierls relation [e.g. Weertman, 1957; Frost and Ashby, 1982] better described their
data on dislocation creep flow in calcite. The apparent power law parameters (stress exponent and
activation energy) were found to be stress, grain size and temperature dependent [Renner et al., 2002].
Rybacki et al. [2003] also found a stress dependence of n in Solnhofen limestone torsion experiments
where dislocation creep dominated. While most of these proposed model flow laws match
approximately with the available experimental data, which are restricted to a small range in strain rate,
their prediction very largely when extrapolated to natural strain rates [Barnhoorn et al., 2004].
Rock deformation studies are not limited to supplying lithosphere models the appropriate flow
parameters. Fabrics in natural mylonitic shear zones are commonly interpreted in terms of shear sense
and strain magnitude based on experimentally derived microstructures and textures [e.g. Ramsay and
Huber, 1983]. In doing so geologists typically assume that strain features observed in natural rock
represent the latest deformation phase. Inferences about earlier deformation phases are often
unavailable due to thermal or tectonic overprint of the fabric. Experimental studies focussing on fabric
overprint primarily investigated grain growth dynamics [e.g. Covey-Crump, 1997; Barnhoorn et al.,
2005a] and fabric development with strain during constant experimental conditions. However, natural
deformation is typically more complex with multiple deformation phases under variable conditions.
61
Consequently, the role of tectonic overprint in nature from an experimental point of view is poorly
constrained.
A series of specially designed torsion experiments on Carrara marble was developed with the
aim to understand the rheological and microstructural consequences of multi-stage deformation. By
deforming a sandwich sample consisting of three Carrara marble segments with different deformation
history and shear sense, complexities like interruption of deformation, strain reversal, and pre-existing
strain gradient were investigated. Bulk flow behaviour was simultaneously recorded, allowing the
investigation of rheological consequences. This study extended primarily on the work of Delle Piane
and Burlini [2008], but also built on the already extensive database of single-stage Carrara marble
torsion experiments [Pieri et al., 2001a; b; Barnhoorn et al., 2004; 2005a]. Some researchers reported
two-stage or multiple stage uniaxial compression tests on Carrara marble [Rutter and Rusbridge, 1977;
Covey-Crump 1994; 1998], and calcite aggregates [Renner et al., 2002]. In these studies, samples were
re-loaded under identical kinematics and strain magnitude was small compared to the high strains
possible in torsion tests. Strain reversal in torsion tests have also been performed by Rybacki et al.
[2008], who used hot-pressed anorthite glass powder as sample material.
4.2: Method
Starting material and sample preparation:
Sample material was drilled from the same block of Carrara marble (type Lorrano Bianco) as
described and used by Pieri et al., [2001a; b] and Barnhoorn et al. [2004; 2005a]. Drilling direction
was arbitrarily chosen but consistent for all cores. Carrara marble is a well-investigated natural marble
from Tuscany (Italy) with an isotropic fabric, nearly pure calcite composition (98% calcite, and traces
of quartz, mica and dolomite). Grain size has a nearly normal distribution with an arithmetic mean 2D
grain size of 150 μm. Any shape (SPO) or crystal preferred orientation (CPO) is very weak [Pieri et
al., 2001a, b].
Drilled cylindrically shaped cores were sawed and polished and then oven dried at
approximately 110 °C for at least 24 h. Together with alumina spacers and partially stabilized zirconia
pistons, they were placed inside a polished and cleaned iron jacket with a wall thickness of 0.25 mm.
The jacket separated samples from the confining gas inside the pressure vessel. Straight and parallel
groves were scratched gently into the exterior of the iron jackets to record strain development at the
periphery of the sample. In addition, the groves allowed for checking whether slip along sample,
segments, or spacer interfaces occurred.
Experiments:
Multi-stage deformation was achieved by exposing Carrara marble samples to two torsion
tests. During the second test, the sample was comprised of three segments with different deformation
62
history. For the first deformation event (D1), six sample cylinders were twisted either clockwise or
counter-clockwise to reach a shear strain at the sample periphery of γ = 1, 2.6 or 5 (Fig. 4.1A). These
samples were then cut, and ends polished parallel to create cylindrical segments with a length of 5 mm
that would be used as samples for the second deformation event (D2) (Fig. 4.1B). After D1 no surface
irregularities or deviations from cylindrical symmetry related to volumetric strain or strain localisation
were observed. Some surface damage related to jacket peel-off occurred. Zones with the least surface
damage were selected for re-sampling, without re-machining the cylindrical sample periphery
(Fig. 4.2A).
Re -sampling and -jacketing has been shown to have no effect on subsequent deformation
behaviour. From our experience, we infer that the mechanical and microstructural state of the samples
was hardly altered during this pause between experiments. The time during which annealing could
potentially alter the fabric was limited to 20 minutes. This annealing time is derived from furnace
heating and cooling rates (20 and >30°C/min, respectively, and minimum temperature for annealing of
600°C) as well as furnace stabilization time. Grain growth due to annealing is time, pressure and
temperature dependent and becomes noticeable after 1 hour at our deformation conditions [Covey-
Crump, 1997; Barnhoorn et al., 2005a], whereas mechanical strength is not affected by annealing until
75 minutes [personal communication De Raadt, 2009].
D2 sample assemblies consisted of three polished cylindrical segments each with a different
D1 history, placed on top of each other like a sandwich (Figs. 4.1C and 2A). The total length of these
assemblies was 15 mm and their diameter was approximately 15 mm. D2 was imposed by a counter-
clockwise torsion, producing top to the right shear. The amount of imposed bulk shear during D2 was
always equal to that in D1, meaning when γD1 = 1, then γD2 = 1, when γD1 = 2.6, then γD2 = 2.6 and
when γD1 = 5, then γD2 = 5. Consequently, during D2 tests top and bottom segments were deforming in
a continued and reversed sense of shear, respectively, while the centre segment was deforming for the
first time. It has been shown before that friction between segments exceeds flow strength [Delle Piane
and Burlini, 2008].
Data acquisition and processing:
All experiments were conducted with an internally heated Paterson gas-medium testing
machine equipped with an external torsion actuator [Paterson and Olgaard, 2000], in the rock
deformation laboratory at ETH Zurich. Pure inert argon gas was used as a confining medium. During
experiments, confining pressure was maintained within 1% variation around 300 MPa. Temperature
distribution within the furnace was set-up in such a way that around the sample a constant temperature
profile within 2 K accuracy existed. A K-type thermocouple was used to measure the temperature at
3 mm above the sample, but within the constant temperature profile. All samples were deformed at
1000 K (727 °C). Experimental conditions (Table 4.1) were chosen in such a way that they correspond
with previous constant twist-rate torsion experiments on Carrara marble, comprised of one
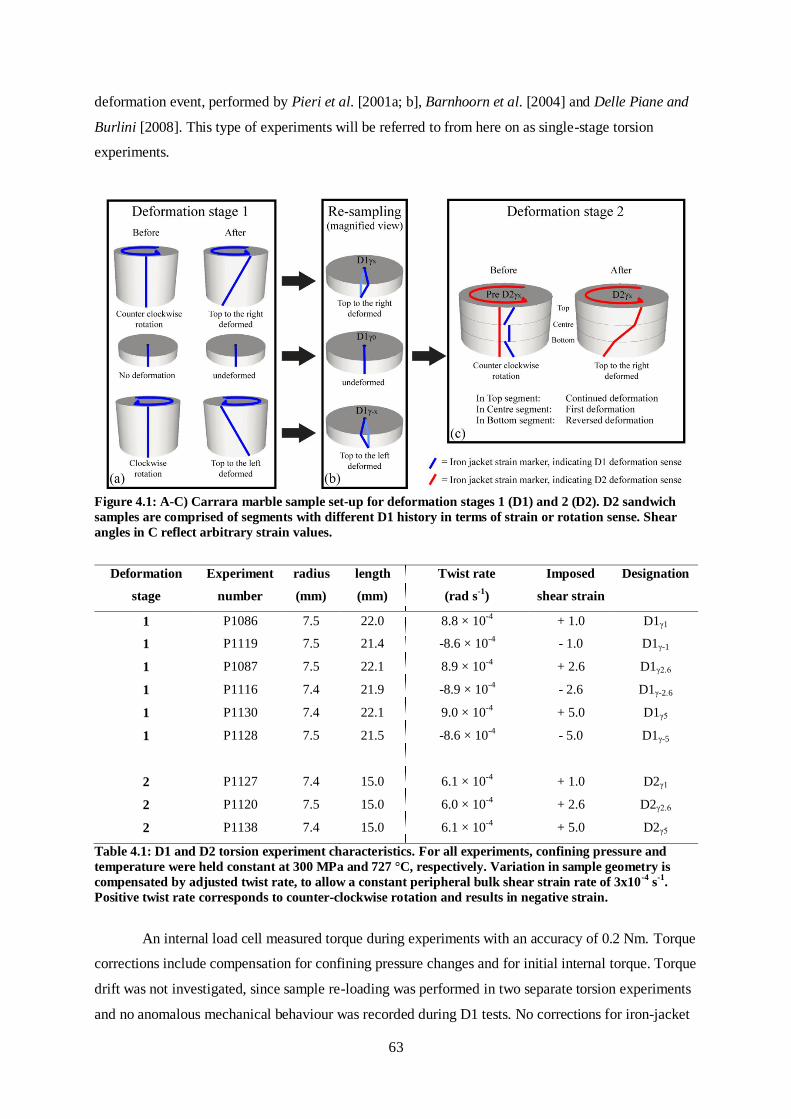
63
deformation event, performed by Pieri et al. [2001a; b], Barnhoorn et al. [2004] and Delle Piane and
Burlini [2008]. This type of experiments will be referred to from here on as single-stage torsion
experiments.
Figure 4.1: A-C) Carrara marble sample set-up for deformation stages 1 (D1) and 2 (D2). D2 sandwich
samples are comprised of segments with different D1 history in terms of strain or rotation sense. Shear
angles in C reflect arbitrary strain values.
Deformation
stage
Experiment
number
radius
(mm)
length
(mm)
Twist rate
(rad s-1
)
Imposed
shear strain
Designation
1 P1086 7.5 22.0 8.8 × 10⁻⁴
+ 1.0 D1γ1
1 P1119 7.5 21.4 -8.6 × 10⁻⁴
- 1.0 D1γ-1
1 P1087 7.5 22.1 8.9 × 10⁻⁴
+ 2.6 D1γ2.6
1 P1116 7.4 21.9 -8.9 × 10⁻⁴
- 2.6 D1γ-2.6
1 P1130 7.4 22.1 9.0 × 10⁻⁴
+ 5.0 D1γ5
1 P1128 7.5 21.5 -8.6 × 10⁻⁴
- 5.0 D1γ-5
2 P1127 7.4 15.0 6.1 × 10⁻⁴
+ 1.0 D2γ1
2 P1120 7.5 15.0 6.0 × 10⁻⁴
+ 2.6 D2γ2.6
2 P1138 7.4 15.0 6.1 × 10⁻⁴
+ 5.0 D2γ5
Table 4.1: D1 and D2 torsion experiment characteristics. For all experiments, confining pressure and
temperature were held constant at 300 MPa and 727 °C, respectively. Variation in sample geometry is
compensated by adjusted twist rate, to allow a constant peripheral bulk shear strain rate of 3x10⁻⁴
s-1
.
Positive twist rate corresponds to counter-clockwise rotation and results in negative strain.
An internal load cell measured torque during experiments with an accuracy of 0.2 Nm. Torque
corrections include compensation for confining pressure changes and for initial internal torque. Torque
drift was not investigated, since sample re-loading was performed in two separate torsion experiments
and no anomalous mechanical behaviour was recorded during D1 tests. No corrections for iron-jacket
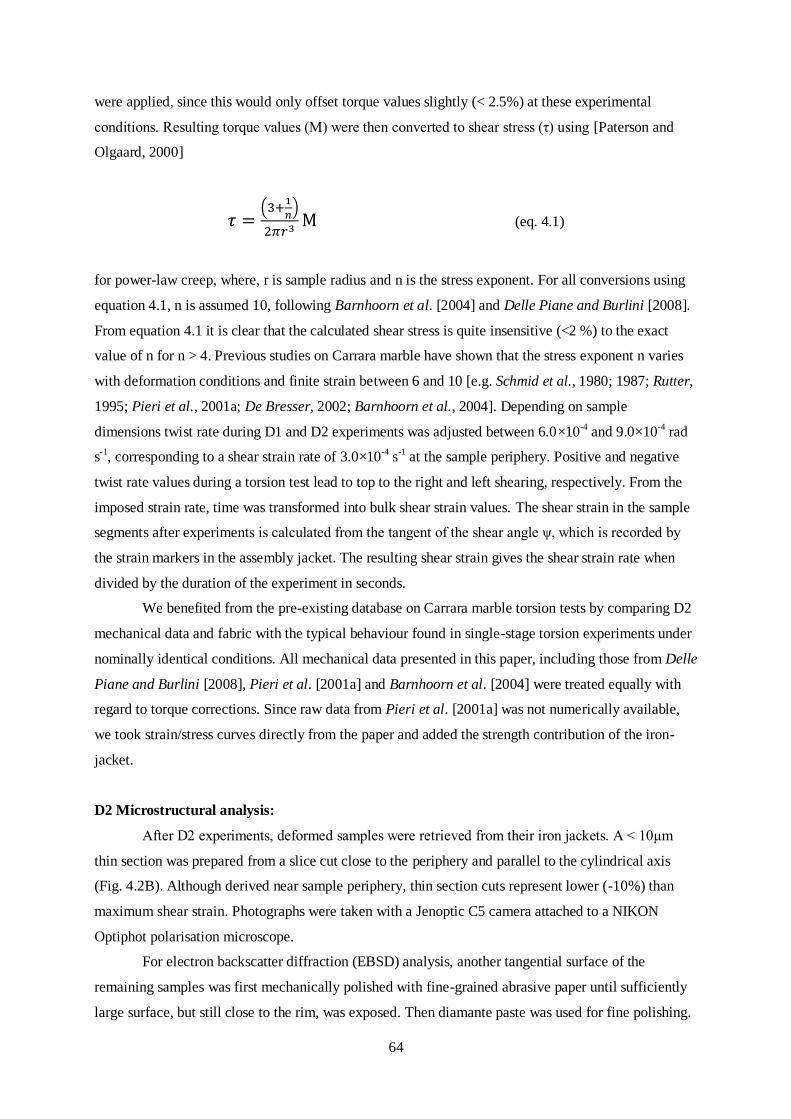
64
were applied, since this would only offset torque values slightly (< 2.5%) at these experimental
conditions. Resulting torque values (M) were then converted to shear stress (τ) using [Paterson and
Olgaard, 2000]
(eq. 4.1)
for power-law creep, where, r is sample radius and n is the stress exponent. For all conversions using
equation 4.1, n is assumed 10, following Barnhoorn et al. [2004] and Delle Piane and Burlini [2008].
From equation 4.1 it is clear that the calculated shear stress is quite insensitive (<2 %) to the exact
value of n for n > 4. Previous studies on Carrara marble have shown that the stress exponent n varies
with deformation conditions and finite strain between 6 and 10 [e.g. Schmid et al., 1980; 1987; Rutter,
1995; Pieri et al., 2001a; De Bresser, 2002; Barnhoorn et al., 2004]. Depending on sample
dimensions twist rate during D1 and D2 experiments was adjusted between 6.0×10⁻⁴ and 9.0×10⁻⁴ rad
s-1, corresponding to a shear strain rate of 3.0×10⁻⁴ s-1 at the sample periphery. Positive and negative
twist rate values during a torsion test lead to top to the right and left shearing, respectively. From the
imposed strain rate, time was transformed into bulk shear strain values. The shear strain in the sample
segments after experiments is calculated from the tangent of the shear angle ψ, which is recorded by
the strain markers in the assembly jacket. The resulting shear strain gives the shear strain rate when
divided by the duration of the experiment in seconds.
We benefited from the pre-existing database on Carrara marble torsion tests by comparing D2
mechanical data and fabric with the typical behaviour found in single-stage torsion experiments under
nominally identical conditions. All mechanical data presented in this paper, including those from Delle
Piane and Burlini [2008], Pieri et al. [2001a] and Barnhoorn et al. [2004] were treated equally with
regard to torque corrections. Since raw data from Pieri et al. [2001a] was not numerically available,
we took strain/stress curves directly from the paper and added the strength contribution of the iron-
jacket.
D2 Microstructural analysis:
After D2 experiments, deformed samples were retrieved from their iron jackets. A < 10μm
thin section was prepared from a slice cut close to the periphery and parallel to the cylindrical axis
(Fig. 4.2B). Although derived near sample periphery, thin section cuts represent lower (-10%) than
maximum shear strain. Photographs were taken with a Jenoptic C5 camera attached to a NIKON
Optiphot polarisation microscope.
For electron backscatter diffraction (EBSD) analysis, another tangential surface of the
remaining samples was first mechanically polished with fine-grained abrasive paper until sufficiently
large surface, but still close to the rim, was exposed. Then diamante paste was used for fine polishing.
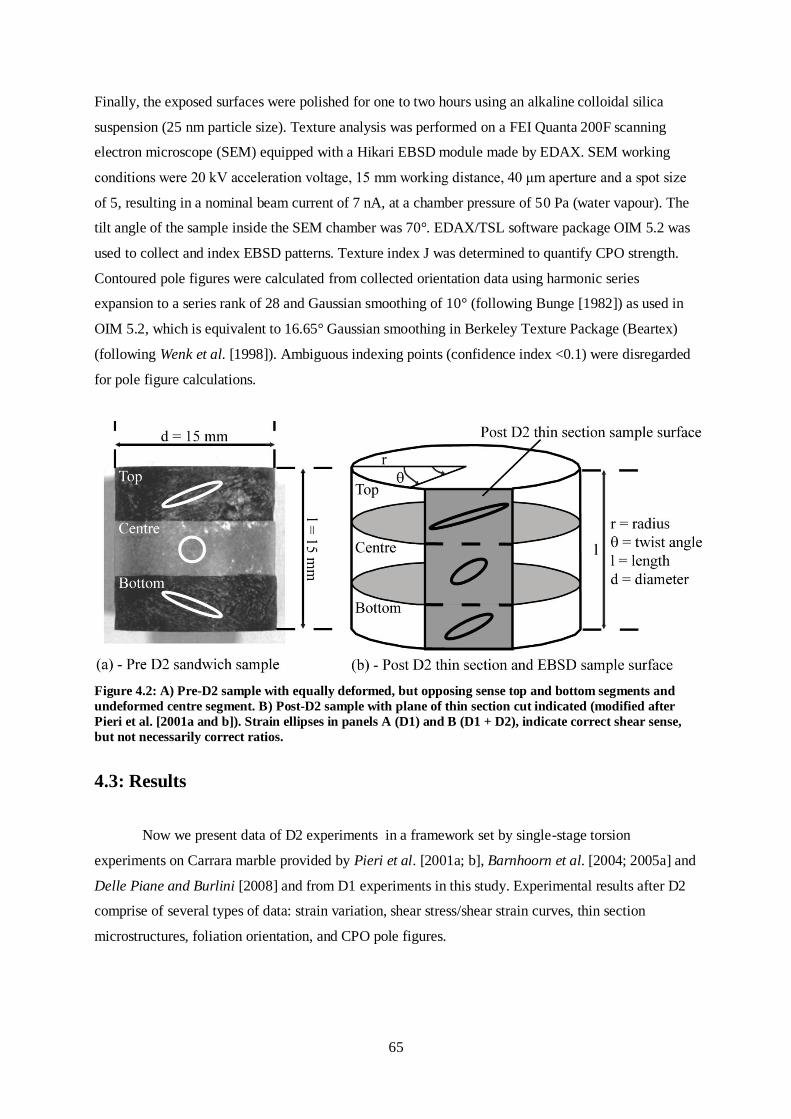
65
Finally, the exposed surfaces were polished for one to two hours using an alkaline colloidal silica
suspension (25 nm particle size). Texture analysis was performed on a FEI Quanta 200F scanning
electron microscope (SEM) equipped with a Hikari EBSD module made by EDAX. SEM working
conditions were 20 kV acceleration voltage, 15 mm working distance, 40 μm aperture and a spot size
of 5, resulting in a nominal beam current of 7 nA, at a chamber pressure of 50 Pa (water vapour). The
tilt angle of the sample inside the SEM chamber was 70°. EDAX/TSL software package OIM 5.2 was
used to collect and index EBSD patterns. Texture index J was determined to quantify CPO strength.
Contoured pole figures were calculated from collected orientation data using harmonic series
expansion to a series rank of 28 and Gaussian smoothing of 10° (following Bunge [1982]) as used in
OIM 5.2, which is equivalent to 16.65° Gaussian smoothing in Berkeley Texture Package (Beartex)
(following Wenk et al. [1998]). Ambiguous indexing points (confidence index <0.1) were disregarded
for pole figure calculations.
Figure 4.2: A) Pre-D2 sample with equally deformed, but opposing sense top and bottom segments and
undeformed centre segment. B) Post-D2 sample with plane of thin section cut indicated (modified after
Pieri et al. [2001a and b]). Strain ellipses in panels A (D1) and B (D1 + D2), indicate correct shear sense,
but not necessarily correct ratios.
4.3: Results
Now we present data of D2 experiments in a framework set by single-stage torsion
experiments on Carrara marble provided by Pieri et al. [2001a; b], Barnhoorn et al. [2004; 2005a] and
Delle Piane and Burlini [2008] and from D1 experiments in this study. Experimental results after D2
comprise of several types of data: strain variation, shear stress/shear strain curves, thin section
microstructures, foliation orientation, and CPO pole figures.
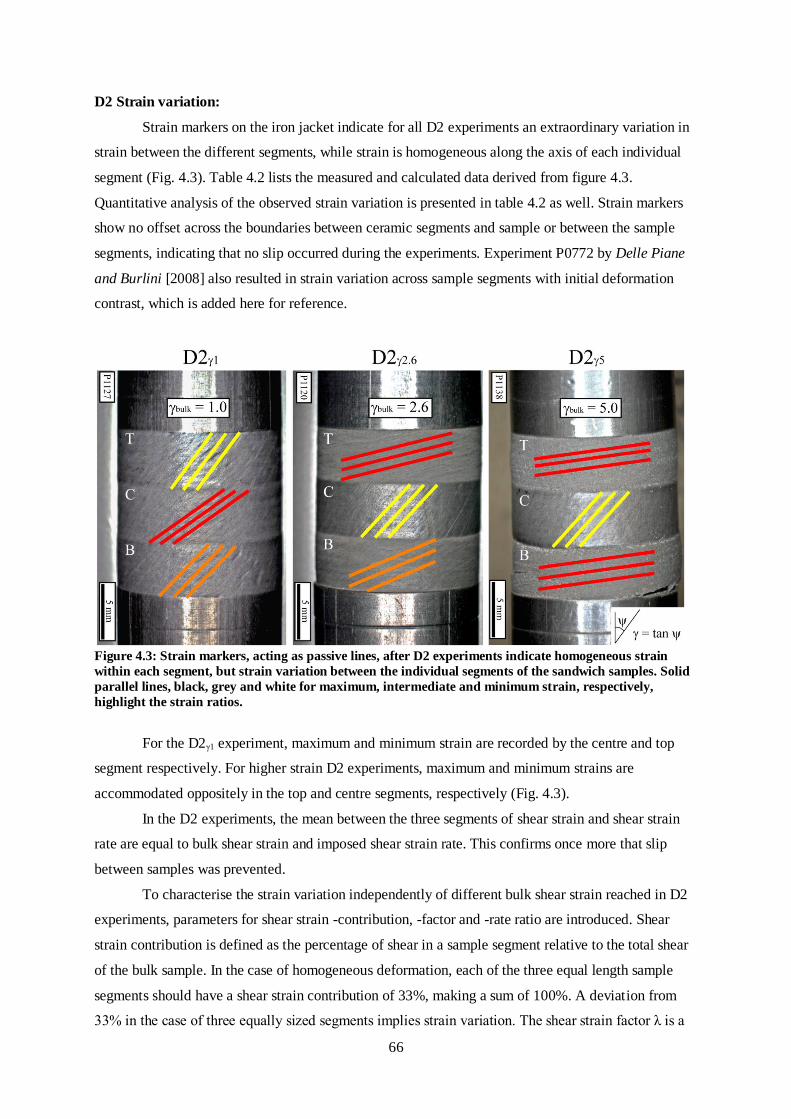
66
D2 Strain variation:
Strain markers on the iron jacket indicate for all D2 experiments an extraordinary variation in
strain between the different segments, while strain is homogeneous along the axis of each individual
segment (Fig. 4.3). Table 4.2 lists the measured and calculated data derived from figure 4.3.
Quantitative analysis of the observed strain variation is presented in table 4.2 as well. Strain markers
show no offset across the boundaries between ceramic segments and sample or between the sample
segments, indicating that no slip occurred during the experiments. Experiment P0772 by Delle Piane
and Burlini [2008] also resulted in strain variation across sample segments with initial deformation
contrast, which is added here for reference.
Figure 4.3: Strain markers, acting as passive lines, after D2 experiments indicate homogeneous strain
within each segment, but strain variation between the individual segments of the sandwich samples. Solid
parallel lines, black, grey and white for maximum, intermediate and minimum strain, respectively,
highlight the strain ratios.
For the D2γ1 experiment, maximum and minimum strain are recorded by the centre and top
segment respectively. For higher strain D2 experiments, maximum and minimum strains are
accommodated oppositely in the top and centre segments, respectively (Fig. 4.3).
In the D2 experiments, the mean between the three segments of shear strain and shear strain
rate are equal to bulk shear strain and imposed shear strain rate. This confirms once more that slip
between samples was prevented.
To characterise the strain variation independently of different bulk shear strain reached in D2
experiments, parameters for shear strain -contribution, -factor and -rate ratio are introduced. Shear
strain contribution is defined as the percentage of shear in a sample segment relative to the total shear
of the bulk sample. In the case of homogeneous deformation, each of the three equal length sample
segments should have a shear strain contribution of 33%, making a sum of 100%. A deviation from
33% in the case of three equally sized segments implies strain variation. The shear strain factor λ is a

67
strain independent measure for the strain variation applicable to three equally sized-segmented
samples following:
(eq. 4.2)
where, γ1 > γ2 > γ3. The expression is derived as a dimensionless parameter, in analogy to the k-
parameters for characterisation of strain ellipsoids in a Flinn-diagram [Ramsay and Huber, 1983].
Since λ is calculated from strain ratios, and therefore dimensionless, it applies to shear strain -rate and
-contribution as well. For λ = 1, no strain variation exists. For λ < 1, lowest and intermediate strain are
more similar than intermediate and highest strain. The opposite is true for λ > 1.
It is more appropriate to use the shear strain rate ratio, γ1/γ2, in the case of two-segmented samples, for
example, P0772 in Delle Piane and Burlini [2008].
Shear strain
Segment Angle (⁰) Value Mean rate (s-1
) Contributio
n Factor
Rate ratio
(max/min)
D2
γ1 (
P1
12
7)
Top 36.6 ± 0.7 0.74 ± 0.02 2.2x10⁻⁴ 24 %
0.9 1.9 Centre 54.8 ± 0.3 1.42 ± 0.02 4.1x10⁻⁴ 45 %
Bottom 44.1 ± 1.2 0.97 ± 0.04 2.8x10⁻⁴
31 %
Bulk 1.04 3.0x10⁻⁴
100 %
D2
γ2.6
(P
11
20
) Top 76.9 ± 1.3 4.46 ± 0.5 5.1x10⁻⁴ 58 %
1.3 4.7 Centre 42.7 ± 0.4 0.92 ± 0.01 1.1x10⁻⁴ 12 %
Bottom 66.2 ± 0.6 2.28 ± 0.07 2.6x10⁻⁴
30 %
Bulk 2.56 3.0x10⁻⁴
100 %
D2
γ5 (
P1
13
8)
Top 81.9 ± 0.4 6.99 ± 0.3 4.2x10⁻⁴ 47 %
8.0 7.9 Centre 41.5 ± 0.5 0.89 ± 0.02 5.3x10⁻⁵ 6 %
Bottom 81.9 ± 0.5 7.02 ± 0.5 4.2x10⁻⁴
47 %
Bulk 4.97 3.0x10⁻⁴
100 %
P0772
[Del
le P
ian
e an
d
Bu
rlin
i, 2
008
]
Top 61.3 ± 1.1 1.83 ± 0.09 1.8x10⁻⁴ 88 %
N.A. 7.2
Bottom 14.1 ± 0.4 0.26 ± 0.01 2.6x10⁻⁵ 12 %
Bulk 1.04 1.0x10⁻⁴
100 %
Table 4.2: Quantitative description of strain variation after D2. Errors in shear angle estimates are
propagated to errors in shear strain, but subsequent errors are omitted for all the other entities for
reasons of simplification. Shear strain factor (λ) cannot be calculated for two segmented samples.
68
D1 and D2 mechanical behaviour:
Figure 4.4A shows a diagram with shear stress plotted against shear strain for all D1
experiments that yielded reliable mechanical data. Additionally, results from single-stage torsion
experiments, equal in principal and experimental conditions to D1 tests, on Carrara marble using the
same deformation apparatus are plotted. D1 curves, despite of considerable scattering between the
experiments, follow a similar behaviour as in previous studies and fit within the general trend.
This trend is summarized by a rather wide envelope of stress-strain curves, related to
experiment reproducibility and sample variability. What remains clear is the typical hardening
behaviour after yielding up to γ = 0.5-0.8. Peak stresses are maintained until γ = 1, after which work
softening initiates. By γ = 5, most curves have reach steady state flow conditions. The envelope of
curves is transferred to figure 4.4B as best representative of general D1 stress behaviour with strain.
Regrettably, individual D1 curves show a considerable variability within the envelope. This is one
reason why we did not attempt to follow individual runs from D1 to D2 in their stress-strain curves.
The other reason for this lies in the nature of D2 sandwich samples, which originate from three
different D1 experiments and not just one.
The D2γ1 experiment (P1127) shows a slightly different mechanical behaviour than the range
of single-stage torsion experiments for Carrara marble. The yield stress falls well within that broad
range, but the peak stress is relatively low, thereby indicating limited work hardening. Both peak
stresses are recorded at similar shear strain values (γ = 0.8). Strain softening initiated quickly after
peak stress, but as the experiment was stopped shortly afterwards at γ = 1, it could not be decided
whether constant stress condition was reached.
The D2γ2.6 experiment (P1120) initially shows a very similar mechanical behaviour compared
with D2γ1. Peak stress however, is reached earlier at γ = 0.6. Work softening persists until γ = 1.5,
where constant stress condition is reached at a flow stress of 45 MPa.

69
Figure 4.4: A) Collection of shear stress-shear strain curves for single-stage torsion deformation tests,
including D1, with identical experimental conditions as in this study. B) Curves of figure 4.4A represented
by light grey band in comparison with bulk D2 sample stress-strain behaviour. Experimental
reproducibility for D1-like curves is expressed by the width of the light grey band and error of values in
the table. The high strain D2 experiment, D2γ5 (P1138) yields at a significantly lower flow stress and
work hardens 4-8 %. From γ = 0.5, peak stress was reached and flow continued at little over 40 MPa
without significant work softening.
D1 Microstructures:
Figure 4.5 displays cross-polarized light micrographs of Carrara marble at different stages of
shear deformation, corresponding to the amount of deformation produced during D1 experiments in
this study. In the figure, micrographs are placed in such a format that they schematically represent the
starting set-up for D2 experiments. Bottom segment micrographs are flipped versions of the top, and
for the three centre segments the same micrograph is used repeatedly. Sources for the micrographs
were previously prepared thin sections from experiments P089 (γ = 1) and P143 (γ = 2.3) performed
by Pieri et al. [2001a] and P267 (γ = 5.3) performed by Barnhoorn et al. [2004]. In figure 4.5, from
left to right in both top and bottom segments shear strain changes from 1.0 to 2.3 to 5.3. The
micrographs are oriented in such a way that the shear zone boundary is horizontal. Centre images
represent a piece of undeformed Carrara marble and lack any reference orientation. D1 samples were
not always available for thin sectioning as most of the material was used for D2 experiments.
Experimental conditions in P089, P143 and P267 were nominally identical to ours, such that their
fabric is equivalent to respective D1 fabric, as was the mechanical behaviour.
Solid white lines and ellipses in figure 4.5 represent the shear angle and strain ellipse,
respectively, corresponding to the finite shear strain in the respective segment. Strain ellipses are
constructed by graphically shearing a circle to the shear of the related segment. Dashed and dotted
white lines represent the visually estimated traces of foliation Sa and Sb, respectively, defined by grain
70
stretching, alignment of grain boundaries and/or aggregates of recrystallised grains. Similar, but
coloured lines are used in figure 4.6, for microstructures after D2 experiments. The foliation subscripts
a and b are chosen instead of the more common use of 1 and 2 to avoid confusion regarding relative
timing of the two deformation stages. Sa and Sb are believed to have developed simultaneously and are
therefore not necessarily associated with either D1 or D2. All mentioned foliation orientations are
measured with respect to the normal of the shear zone boundary (SZB) and thus directly comparable
with the shear angle ψ.
Past studies described the progressive change of microstructure in Carrara marble deformed to
high strains in detail already [Pieri et al., 2001a; Barnhoorn et al., 2004]. At low strain, grains are
dominantly deforming by twinning and dislocation creep processes, producing rather homogeneously
stretched elongate grains with twins and patchy extinction patterns in the form of undulose extinction
and deformation bands. Subgrains and later recrystallised grains can be identified, especially near
grain rims, producing a core-mantle like structure. Above a shear strain of around 1, recrystallisation
becomes more dominant with strain. Relict grains continue stretching, but the amount of subgrains and
recrystallised grains is increasing rapidly. Hardly any new twins are recognizable. The amount of
elongated primary grains decreases with increasing strain. At the strain where constant stress is
reached (γ ≈ 5), elongated relict grains are barely visible and the sample appears pervasively
recrystallised. Details on grain size distribution, orientation angle of SPO and foliation, grain aspect
ratios and recrystallisation fractions are presented by Pieri et al. [2001a], Ter Heege et al. [2002] and
Barnhoorn et al. [2004].
D2 Microstructures:
After the D2 experiments, the sandwich samples experienced two deformation stages in the
top and bottom segments and one deformation stage in the centre segment. The developed
microstructure is different for nearly each segment and experiment.
Figure 4.6 displays micrographs of the characteristic microstructure in each sample segment
after D2 experiments. White lines and ellipses indicate shear angle and maximum principal axes,
associated with the finite shear strain of the respective segment. Red and green lines represent traces of
Sa and Sb foliation, respectively, defined by grain stretching, grain boundary alignment and/or
aggregates of recrystallised grains, as in figure 4.5.
The microstructure for the top segment of the D2γ1 experiment (γ = 1.7) is characterized by a
bi-modal grain size distribution with large, elongated and internally deformed old grains, and very fine
and less deformed recrystallised grains. The stretched old grains display thin twins, undulose
extinction, deformation bands and subgrains. The recrystallised grains make up about 10 vol. %, and
dominate along former grain boundaries at the rims of the stretched old grains, producing an elongated
core and mantle structure. Traces of the e-twinning planes appear preferentially sub-parallel to the

71
stretching direction of the grain. Grain stretching defines a continuous foliation (Sa) at flat angle with
respect to the shear zone boundary.
The centre segment experienced a lower finite shear strain (γ = 1.4) than in the top. Still, a bi-
modal grain size distribution is produced by fine recrystallised grains and big stretched old grains.
Volumetrically, less recrystallised grains appear, about 5%. The centre segment shows twinned grains
and grains with undulose extinction. Twin planes are parallel to the stretching direction of grains. In
comparison with the top segment, foliation Sa is 6° steeper with respect to the SZB.
Remarkably different is the microstructure in the bottom segment in D2γ1 (γ = 0). Relict grains
lost the typical stretching related SPO, but a core- and rim-like microstructure is clearly present. Relict
grain shape is equant with serrated grain boundaries. Recrystallised fine grains make up 5 vol.%.
Evidence for internal deformation includes high concentration of thin twins and presence of some
lensoidal twins, undulose extinction and deformation bands. Occasionally, multiple sets of twins are
recognizable, and two orientations dominate. Often, bends in twins correlate with crosscutting
deformation bands. No foliation plane could be identified, due to lack of SPO.
Top segment of the D2γ2.6 sample (γ = 6.9) is characterized by a microstructure best described
as a highly stretched and recrystallised calcite aggregate. Former grains are faintly recognizable by
zones with similar extinction colour. Within these former grains, small differences in extinction colour
indicate recrystallised grains with an average size of 5 to 10 μm. The former grains are strongly
stretched, but with lobate to serrated boundaries, whereas the fine recrystallised grains are equant and
their boundaries are smooth. Rare twin traces appear parallel to the long axis of the former grain
relicts. Two foliation planes are recognized, a high-angle Sa and low-angle Sb, separated by about 43°.
The centre segment realized the least shear strain during D2γ2.6 (γ = 0.9). Old grains are
slightly stretched, intensely twinned and occasionally contain deformation bands and undulose
extinction. Some of the twins are bent. Rarely, grains are surrounded by a thin layer of fine-grained
recrystallised calcite, forming a core-mantle like structure and serrated grain boundaries. The
recrystallised grains make up for around 2 vol.%. The trace of the twins is often parallel to the
direction of maximum stretching of the grain. A near 45° Sa foliation is marked by weak grain SPO.
The bottom segment for the D2γ2.6 (γ = -0.3) experiment has a distinctive microstructure. Two
deformation stages of roughly equal shear strain magnitude, but opposite sense produced a well-
developed bi-modal grain size distribution. The volume percentage of large relict grains (70-120 μm)
and recrystallised grains (3-10 μm) is about equal. Nearly all large grains are stretched in the direction
of D2 shearing. Grain boundaries of large grains are serrated. Stretched grains display the highest
abundance of twinning and undulose extinction. Twins are occasionally bent, but primarily oriented
towards the direction of maximum D2 strain. In some large grains, a second set of twins is present. Sa
foliation is recognizable from grain SPO of stretched grains. A weak Sb foliation with low-angle
orientation is identifiable as well. The angle between Sa and Sb is around 34°.

71
Figure 4.5: Starting material microstructure of D2 sandwich samples. The cross-polarized light
micrographs originate from thin sections from torsion tests by Pieri et al. [2001a] and Barnhoorn et al.
[2004]. Thin sections that best represent D1 microstructure (i.e. experimental conditions were identical to those used in this study) were chosen. Top segment images were artificially mirrored to represent D2
bottom segment starting fabric. For all centre segments, one micrograph representing undeformed
Carrara marble was used. Note the change of magnification for micrographs that display a dominantly
recrystallised microstructure.

72
Figure 4.6: Cross-polarized light micrographs of thin sections from the rim of D2 sandwich segments,
after D2. The ellipse for top segment of D2γ5 is too stretched for display. D2 shear strain values displayed
in this figure are rounded up in comparison with the associated values in table 2. For each micrograph finite strain (calculated as sum of γD1 and γD2, with top to the right shearing taken as positive strain) is
indicated. Note the change of magnification for micrographs that display a dominantly recrystallised
microstructure.

73
The microstructure of the top segment in the D2γ5 experiment (γ = 12), is characterized by a
completely dynamically recrystallised microstructure. New grains are small and nearly equant. They
show little sign for internal deformation and contain few twins. Hardly any traces from relict grains
survived. Two foliation planes are apparent: 1) an almost flat primary foliation Sa, defined by SPO of
clusters of recrystallised grains with similar crystal orientation, inherited from former relict grains. 2)
A poorly developed steep secondary foliation Sb, defined by trails of recrystallised grains and subgrain
boundaries. The angle between Sa and Sb is around 55⁰.
The centre segments for both the D2γ5 and D2γ2.6 experiments were deformed to equally small
shear strain, γ = 0.9, although at different strain rates. Grain size and shape is similar and both
segments show the same evidence for internal deformation, without significant contributions from
dynamic recrystallisation.
In the bottom segment for the D2γ5 experiment (γ = 2.0), microstructure appears strongly
deformed with nearly pervasive recrystallisation to fine grains. In fact, the microstructure is similar to
that of the top segments of the D2γ5 and D2γ2.6 experiments. The matrix of fine-grained recrystallised
grains contains irregularly shaped and strongly stretched clusters of similarly oriented recrystallised
grains that represent former relict grains. However, Sa and Sb orientation angles are smaller (72⁰ vs.
78⁰), and (19° vs. 24°), respectively.
Foliation development:
Microstructural development is quantified by measuring foliation orientation with respect to
the normal to the SZB, changing with strain. Undeformed Carrara marble lacks any foliation. At the
onset of torsion deformation, grain shape changes according to the simple shear strain ellipse, with the
infinitesimal principal strain axes at 45°, producing a SPO defined foliation.
The reference for foliation orientations after D2 is provided by single-stage torsion
experiments on Carrara marble, including Pieri et al. [2001a], Barnhoorn et al. [2004] and Delle
Piane and Burlini [2008] and D2 centre segments from this study. Figure 4.7 plots Sa (circles) and Sb
(triangles) orientations from single-stage (black), continued (grey) and reversed (open) torsion tests, as
a function of (finite) shear strain. Also included are theoretical curves for passive line rotation (ψ, solid
line, after Ramsay [1967], Eq. 3.71) and principal axis of strain ellipse rotation (β = 90 – θ’, dashed,
after Ramsay and Huber [1983], Eq. 2.4), in simple shear.
Data points from single-stage torsion experiments indicate a rapid increase in Sa orientation
with strain from 45⁰ onwards. As strain increases Sa rotates gradually towards the SZB. The
reproducibility associated with this trend is expressed by a light grey band. Initially this band includes
both theoretical curves. At larger strain, Sa-orientation increases more slowly with strain in
comparison with the curves. For γ > 7, inclination of main foliation is systematically lower than of

74
theoretical curves. However, foliation orientation is more difficult to determine at high strain, since
elongated relict grains are removed by dynamic recrystallisation.
Sa orientation in continued torsion experiments plots without exception within the trend for
single-stage experiments. Whereas Sa orientations from reversed torsion tests are systematically below
that trend.
The angle of Sb foliation develops in strongly recrystallised Carrara marble (i.e. γ > 5) [Pieri
et al., 2001a; Barnhoorn et al., 2004; Delle Piane and Burlini, 2008] and Solnhofen limestone
[Rybacki et al., 2003; Barnhoorn et al., 2005a]. Sb orientation data from this study alone (i.e. open and
grey triangles in figure 4.7) suggest a gradually decreasing angle with strain between γ = 5 and 12.
This trend is highlighted by a grey envelope. Data from single-stage torsion tests by Pieri et al.
[2001a], Barnhoorn et al. [2004] and Delle Piane and Burlini [2008] partly fit this trend. A data point
at γ = 10.5 clearly plots outside the envisaged trend.
Figure 4.7: Sa- and Sb-orientation development with shear strain. Sa foliation development with strain
from single-stage torsion experiments is represented by the light grey bounded grey band. Sb-orientation
data suggest, a trend, which is highlighted by a dark grey bounded grey band.
CPO development:
The CPO development in single-stage torsion experiments is well known for the experimental
conditions of this study [Pieri et al., 2001a; b; Barnhoorn et al., 2004], and thus suitable as reference
for the textural data from D2 experiments in this study. The left part of figure 4.8 displays that texture
evolution in basal and r-plane pole figures with grey-level contours.
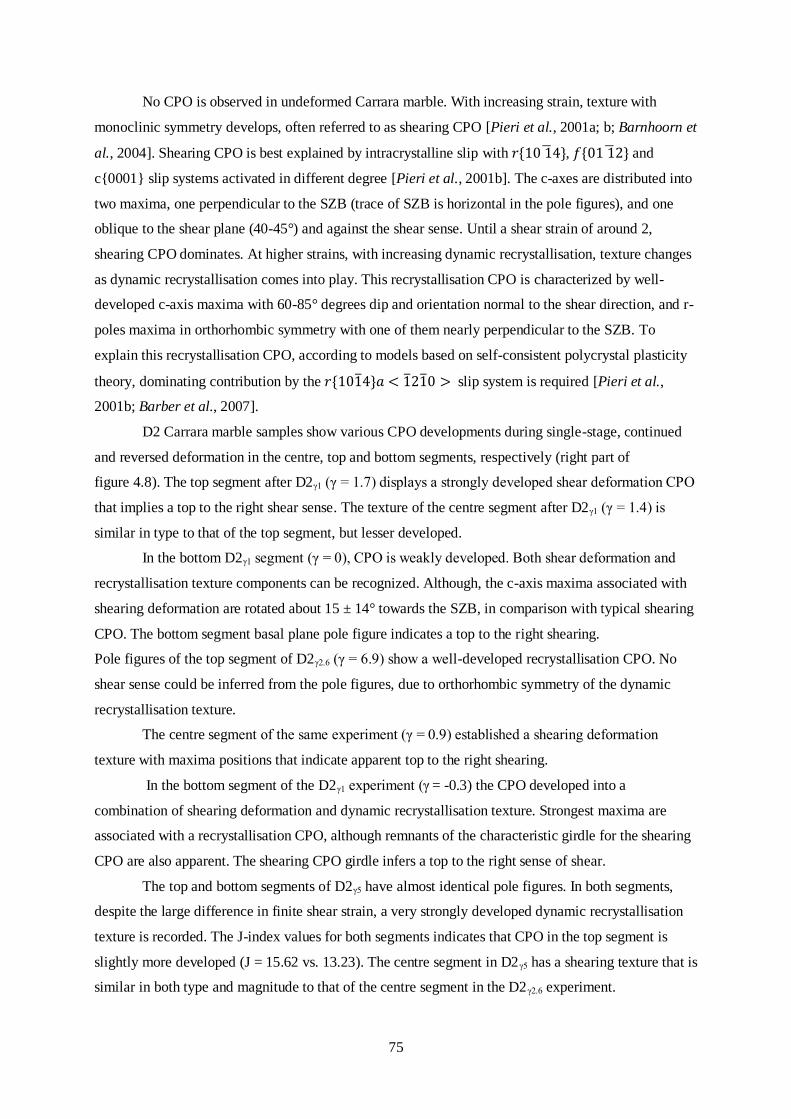
75
No CPO is observed in undeformed Carrara marble. With increasing strain, texture with
monoclinic symmetry develops, often referred to as shearing CPO [Pieri et al., 2001a; b; Barnhoorn et
al., 2004]. Shearing CPO is best explained by intracrystalline slip with , and
c{0001} slip systems activated in different degree [Pieri et al., 2001b]. The c-axes are distributed into
two maxima, one perpendicular to the SZB (trace of SZB is horizontal in the pole figures), and one
oblique to the shear plane (40-45°) and against the shear sense. Until a shear strain of around 2,
shearing CPO dominates. At higher strains, with increasing dynamic recrystallisation, texture changes
as dynamic recrystallisation comes into play. This recrystallisation CPO is characterized by well-
developed c-axis maxima with 60-85° degrees dip and orientation normal to the shear direction, and r-
poles maxima in orthorhombic symmetry with one of them nearly perpendicular to the SZB. To
explain this recrystallisation CPO, according to models based on self-consistent polycrystal plasticity
theory, dominating contribution by the slip system is required [Pieri et al.,
2001b; Barber et al., 2007].
D2 Carrara marble samples show various CPO developments during single-stage, continued
and reversed deformation in the centre, top and bottom segments, respectively (right part of
figure 4.8). The top segment after D2γ1 (γ = 1.7) displays a strongly developed shear deformation CPO
that implies a top to the right shear sense. The texture of the centre segment after D2γ1 (γ = 1.4) is
similar in type to that of the top segment, but lesser developed.
In the bottom D2γ1 segment (γ = 0), CPO is weakly developed. Both shear deformation and
recrystallisation texture components can be recognized. Although, the c-axis maxima associated with
shearing deformation are rotated about 15 ± 14° towards the SZB, in comparison with typical shearing
CPO. The bottom segment basal plane pole figure indicates a top to the right shearing.
Pole figures of the top segment of D2γ2.6 (γ = 6.9) show a well-developed recrystallisation CPO. No
shear sense could be inferred from the pole figures, due to orthorhombic symmetry of the dynamic
recrystallisation texture.
The centre segment of the same experiment (γ = 0.9) established a shearing deformation
texture with maxima positions that indicate apparent top to the right shearing.
In the bottom segment of the D2γ1 experiment (γ = -0.3) the CPO developed into a
combination of shearing deformation and dynamic recrystallisation texture. Strongest maxima are
associated with a recrystallisation CPO, although remnants of the characteristic girdle for the shearing
CPO are also apparent. The shearing CPO girdle infers a top to the right sense of shear.
The top and bottom segments of D2γ5 have almost identical pole figures. In both segments,
despite the large difference in finite shear strain, a very strongly developed dynamic recrystallisation
texture is recorded. The J-index values for both segments indicates that CPO in the top segment is
slightly more developed (J = 15.62 vs. 13.23). The centre segment in D2γ5 has a shearing texture that is
similar in both type and magnitude to that of the centre segment in the D2γ2.6 experiment.
77
Figure 4.8: Pole figures (lower hemisphere, equal area projection) for single-stage deformation (left) and
D2 (right) experiments. Legends for grey scale, and coloured pole figures are aligned for quick comparison. Grey scale pole figures originate from Pieri et al. [2001a]; Barnhoorn et al. [2004] and
represent deformation experiments run under similar conditions as in this study.

78
4.4: Discussion
We followed up on and extended work by Delle Piane and Burlini [2008], who first explored
rheological and microstructural consequences of complex deformation history in Carrara marble. Our
observations after two-stage torsion experiments are discussed in light of results from single-stage
torsion experiments under nominally identical experimental conditions. A rheological interpretation
for observed D2 strain variation is given, followed by a discussion on developed fabrics. We conclude
with a discussion on geological implications.
Strain variation:
Single-stage torsion experiments [Pieri et al., 2001a; Barnhoorn et al., 2004; 2005a] always
resulted in strain distributions that are homogeneous along any profiles parallel to the cylinder axis.
Iron jacket strain markers for D2 experiments in this study clearly show that the strain is homogeneous
within, but variable between sample segments. Such a variation was expected to occur during D2, in a
way similar to the type 2 experiment P0772 by Delle Piane and Burlini [2008]. Type 2 refers to a
special torsion experiment on Carrara marble, with a sample comprised of two segments, one with pre-
existing strain of γ = 5 and one undeformed. Strain variation was observed after the torsion
experiment, with the highest strain achieved in the previously deformed segment [Delle Piane and
Burlini, 2008].
The observed strain variation in this study is not to be confused with strain localisation or
strain partitioning; terms that are commonly used in relationship with heterogeneous strain. Strain
localisation refers to a zone of higher strain in otherwise homogeneous material. Strain partitioning is
often linked with compositional variation within a deforming sample [e.g. Ji et al., 2004; Bystricky et
al., 2006; Holtzman and Kohlstedt, 2007]. Strain partitioning has been defined before as the scheme of
partition of finite bulk strain into components based on different deformation mechanisms
[Mitra, 1976]. Neither strain terms apply to the strain variation observed in this study.
Sample scale strain variation in solid rock experimental deformation is typically associated with
rheological variation induced by compositional differences [e.g. Bons and Urai, 1996; Barnhoorn et
al., 2005b; Bystricky et al., 2006; Holtzman and Kohlstedt, 2007; Delle Piane et al., 2009a; 2009b].
Macro-scale strain variation in torsion experiments is reported for synthesized quartz and anorthite [Ji
et al., 2004], and diopside and anorthite layers [Rybacki and Dresen, 2006], and composite segments
of Carrara marble [Delle Piane and Burlini, 2008]. For the first two, strain variation was caused by
rheological segregation related to the compositional layering [Ji et al., 2004; Rybacki and Dresen,
2006].
In our D2 experiments, samples contained microstructural heterogeneity related to variation in
deformation history from undeformed to steady state strains. Our results show that strain variation
within a sample expresses a rheological contrast for non-steady state strains. The individual D1
79
deformation history of each D2 segment, reflected in a specific mechanical and microstructural state,
is primarily responsible for the variation in rheological response and the microstructure produced by
D2. In torsion experiments, torque is equal for any circular plane of the cylinder. This applies to shear
stress as well, under the reasonable assumption, that the conversion from torque to shear stress
following equation 4.1 can be based on the same rheology, without major switches in deformation
mechanism throughout the segments. Therefore, when considering that the D2 bulk samples
experienced relatively homogeneous stress, the observed strain (rate) variability between segments can
only be explained by different flow strength in each segment. At each increment of time, the weaker
sample segments deformed at higher strain rate and vice versa. With ongoing deformation, the relative
strength ratios changed. Consequently, strain (rate) was different between, but homogeneous in each
segment during a D2 experiment.
As there is no record of segment strain rate during D2 experiments, the reported strain rates
are averages derived from strain markers and run times. To understand the observed strain variation
during D2 experiments, we need to know the strength (i.e. strain rate) evolution with strain of each
sample segment individually. There are two approaches to estimate the required stress-strain
behaviour: 1) borrow stress-strain behaviour from single-stage torsion experiments at similar
experimental conditions or 2) apply relevant flow laws for coarse-grained calcite using bulk sample
flow stress. The first method has the advantage that a rich database of stress-strain curves is directly
available (Fig. 4.4A-B); even for the case of strain reversal in the bottom segments of D2 samples
[Delle Piane and Burlini, 2008]. The disadvantage is the inability of quantifying strain rates for the
individual segments, as the borrowed stress-strain curves apply to a fixed strain rate only. In D2
segments, strain rates are changing continuously as relative strength between sample segments evolves
with strain until all segments have reached mechanical steady state. The second method has the
advantage that strain rates are quantitatively determined. The accuracy of the modelled strain rates is
easily tested by taking the average of the three sample segments at a given D2 strain. This average
strain rate should be equal to the bulk sample or imposed strain rate. A major disadvantage is the lack
of accurate strain dependency term(s), which incorporate both low-strain hardening and higher-strain
weakening. Furthermore, to our knowledge strain reversal effects have never been incorporated in
flow laws. The essence of flow laws is usually to model strain rate-stress relationships at steady state
conditions for arbitrary strains. Steady state implies an independency of strain history and deformation
path. Strain reversal should therefore have no effect.
We chose to follow the first method, primarily because it accounts to some degree for the
mechanical effect of strain reversal. However regrettably, at best a qualitative description of strength
and strain rate evolution with D2 strain of the individual segments can be inferred from that method.

80
Strain rate evolution in D2 sample segments:
The stress-strain curve from single-stage torsion experiments are used to predict the strength
evolution during D2 of individual D2-sample segments under the following necessary assumptions:
1. Strain interruption and reversal have no influence on flow strength evolution with strain. As
such, total shear strain in each segment defines the momentary flow strength and consequently
strain rate.
2. Within the range of strain rates covered in D2 tests, shape of stress-strain curves remains
similar. In other words, regime 2 of Schmid et al. [1980] with dislocation creep flow is the
only regime addressed.
Since microstructure and texture development are strongly linked with finite strain, fabric analysis
adds further evidence to justify the above assumptions.
Stress-strain curves for single-stage torsion experiments cover a range in flow stress (Fig. 4.4A-B)
due to sample variability and experiment reproducibility. The common trend of these curves is
generalized by an envelope. A schematic strain rate-strain plot for constant stress was derived from
this trend and extended to γ = 10 (Fig. 4.9C) using the assumption that for γ > 5 no mechanical
changes occurred. For each D2 experiment, such a strain rate-strain curve is used as template for strain
rate evolution with strain for each D2 sample segment.
In the top part of figure 4.9A, the suspected strain rate evolution for individual D2γ1 segments is
shown.
At the onset of D2γ1, the top and bottom segments were already deformed to γ = 1 and remained
close to their peak shear stress state. The still undeformed centre segment started at lower strength.
Consequently, top and bottom segments start D2 deformation at a much lower strain rate than the
centre segment. As the centre segment was work hardening and the others were work softening with
strain, flow strength contrast was reducing and thus strain rates homogenized, as is conceptually
illustrated in the top part of the diagram. Total work hardening requires four times less strain than total
work softening (Fig. 4.9C). The top and bottom segments thus remained harder than the centre
segment during most of the D2γ1 experiment. Hence, most shear strain was accommodated by the
centre segment.
A small difference in D2 strain exists between top and bottom D2γ1 segments. Apparently, total
flow strength between γ = 1 and 1.7 is lower for reversed than for continued strain. This observation
will be discussed later in section 4.4.
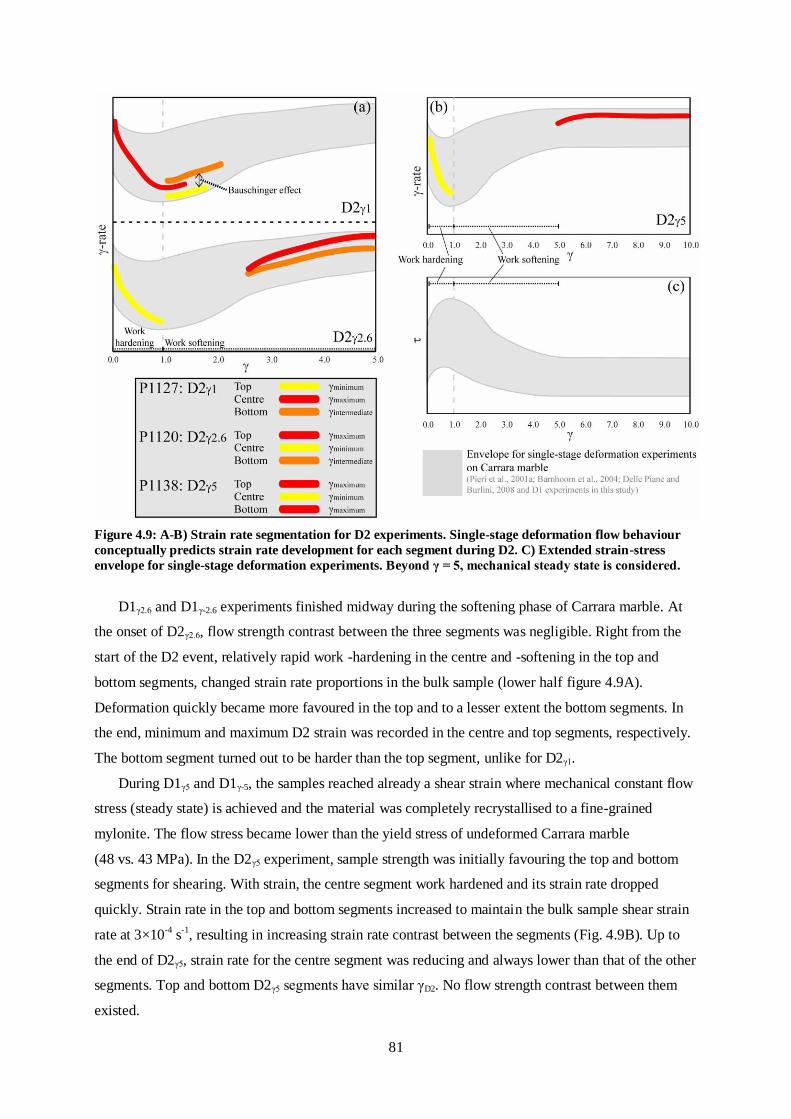
81
Figure 4.9: A-B) Strain rate segmentation for D2 experiments. Single-stage deformation flow behaviour
conceptually predicts strain rate development for each segment during D2. C) Extended strain-stress
envelope for single-stage deformation experiments. Beyond γ = 5, mechanical steady state is considered.
D1γ2.6 and D1γ-2.6 experiments finished midway during the softening phase of Carrara marble. At
the onset of D2γ2.6, flow strength contrast between the three segments was negligible. Right from the
start of the D2 event, relatively rapid work -hardening in the centre and -softening in the top and
bottom segments, changed strain rate proportions in the bulk sample (lower half figure 4.9A).
Deformation quickly became more favoured in the top and to a lesser extent the bottom segments. In
the end, minimum and maximum D2 strain was recorded in the centre and top segments, respectively.
The bottom segment turned out to be harder than the top segment, unlike for D2γ1.
During D1γ5 and D1γ-5, the samples reached already a shear strain where mechanical constant flow
stress (steady state) is achieved and the material was completely recrystallised to a fine-grained
mylonite. The flow stress became lower than the yield stress of undeformed Carrara marble
(48 vs. 43 MPa). In the D2γ5 experiment, sample strength was initially favouring the top and bottom
segments for shearing. With strain, the centre segment work hardened and its strain rate dropped
quickly. Strain rate in the top and bottom segments increased to maintain the bulk sample shear strain
rate at 3×10⁻⁴ s-1, resulting in increasing strain rate contrast between the segments (Fig. 4.9B). Up to
the end of D2γ5, strain rate for the centre segment was reducing and always lower than that of the other
segments. Top and bottom D2γ5 segments have similar γD2. No flow strength contrast between them
existed.

82
Bulk sample D2 flow behaviour:
The D2 stress/strain curves show markedly different flow behaviour compared with single-
stage deformation experiments (Fig. 4.4A-B). Hardening after yielding is less pronounced and with the
exception of D2γ1, peak stress is reached at lower strain (γ = 0.5-0.6, vs. γ = 0.8-1.0). Work softening
after peak stress is nearly negligible and constant stress flow is reached at lower strain (γ = 1-1.5).
Apparently, pre-existing strain variation within the D2 samples results in stress-strain curve levelling
during subsequent deformation. This phenomenon becomes more apparent with greater D1 strain. We
believe that the strain rate ratio or strength contrast between the individual segments controls the bulk
sample flow stress. Soft segments deform at relatively fast strain rate and therefore accommodate most
of the strain.
In D2γ1, the centre segment had the highest shear strain contribution (Table 4.2). This relates
well with the observed bulk sample hardening and peak stress at γ = 0.8. The limited hardening is then
explained by the slowly recrystallising top and bottom segments, which gradually become weaker due
to the increasing appearance of dislocation free recrystallised grains. Since these sample segments
overall had a smaller shear strain contribution their influence was only minor.
Due to negligible strength contrast at the onset of D2γ2.6, the bulk sample behaved as a
mechanically uniform specimen. Yield stress was then comparable with the trend from single-stage
torsion experiments. As the strength contrast between the individual segments increased with strain,
flow became more dominated by the recrystallising, and thus work softening, top and bottom segments
(Fig. 4.9A). Bulk sample hardening is minimized and peak stress reached at slightly lower strain than
typical (γ = 0.6 vs. 0.8-1.0). Recrystallisation in the top and bottom D2 segments continued, while the
centre hardened due to dislocation entanglement, allowing the bulk sample to soften. The relatively
elevated bulk sample steady state stress is explained by cancelling out effects of the weakening bottom
and hardening centre segment, weighted by the shear strain contribution (Table 4.2). At this bulk D2
strain, complete recrystallisation is achieved within the top segment alone.
The strength contrast between top and bottom on one side, and centre segment on the other in
the D2γ5 experiment lowered the bulk sample yield stress and reduced hardening considerably. The
steady state flow in fully recrystallised top and bottom segments clearly dominated the bulk sample
flow behaviour. The bulk sample steady state flow stress matches well with that associated with
single-stage torsion experiments (Fig. 4.4A-B).
Mechanical effect of strain reversal:
The relative strength contrast between top and bottom segments is different in all three D2
experiments. In D2γ1, the bottom segment is slightly softer. Unlike in D2γ2.6, where the bottom
segment is clearly harder. However, In D2γ5, the top and bottom segments appear equally strong.
In metallurgy, the behaviour in D2γ1 is known as the Bauschinger effect [Bauschinger, 1881], which
has been topic of much follow up research [e.g. Abel and Muir, 1972; Stoltz and Pelloux, 1976; Bate
83
and Wilson, 1986; Stout and Rollett, 1990]. The Bauschinger effect refers to commonly observed
behaviour of polycrystalline metals and alloys upon stress reversal in the plastic range. After re-
loading up to tens of percentages of straining, yield stress and work hardening are reduced over an
amount of strain one to two times that of pre-straining, in comparison with the forward loading
behaviour. Deformation in that kind of material is accommodated by movement of dislocations,
creating dislocation density heterogeneities. During work hardening, dislocations develop and migrate
until they encounter obstacles, like grain boundaries or precipitates, and create tangles, which in the
third dimension results into tangled walls. Although, tangled walls and cells are the pre-cursors for
subgrain walls and subgrains, respectively, they are metastable and less sharply bounded. With
reverted loading, these tangled walls disintegrate and new dislocations are formed in the low
dislocation density cells [e.g. Hasegawa et al., 1986]. The relatively ‘fresh’ start for the deforming
material explains the lower yield and flow stresses observed even though the average dislocation
density might have been nearly constant.
In rocks, the Bauschinger effect has been proposed by Delle Piane and Burlini [2008] to
understand yield strength reduction in reversed deformation of Carrara marble. Similarly, the
observation of the higher strain in the bottom compared with the top sample in the D2γ1 experiment is
explained by the Bauschinger effect. At the onset of D2γ1, the bottom and top segments are both at
peak stress conditions (Figs. 4.4A-B and 4.9), indicating high dislocation entanglement.
Alternatively, anisotropic slip in calcite might explain the higher strain in de D2γ1 bottom
segment. However, critical resolved shear stress (CRSS) estimations by De Bresser and Spiers [1997]
show no evidence for glide sense anisotropy along and slip systems. Basal
plane slip system c<a> has been postulated and confirmed as important for the experimental
conditions of this study [De Bresser and Spiers, 1993; 1997; Barber et al., 2007]. By definition though
[Turner et al., 1954], the basal slip systems are symmetric with respect to glide sense.
On the other hand, the pole figures for bottom segments in D2γ1 and D2γ2.6 indicate slightly
rotated shear texture maxima, which suggests some contribution by geometric (CPO induced)
weakening.
For D2γ2.6 the Bauschinger effect clearly does not hold anymore. Instead, we observe that
dynamic recrystallisation proceeded faster in the top than bottom segment (Fig. 4.6). As work
softening is correlated with increasing recrystallisation [Schmid et al., 1987; Pieri et al., 2001a;
Barnhoorn et al., 2004], delay in the bottom segment lead to relative hardening compared with the top
segment.
Strain reversal does not affect recrystallisation rates directly. In D2γ5, fabric and strength of
top and bottom segments are similar again. We relate the delayed progress of recrystallisation in the
D2γ2.6 bottom segment to the shape recovery of stretched relict grains. Apparently, because of
Bauschinger effect it was energetically favoured to restore their shape than to pursue dynamic

84
recrystallisation. Actual recrystallisation leads however to more weakening than the Bauschinger
effect does. Hence, D2γ2.6 bottom segment was relatively harder than the top.
Microstructural consequences of deformation history:
Microstructure analysis in this study serves four purposes: 1) to verify the assumption that
total strain in each segment defines the momentary flow strength or strain rate (all D2 segments), 2) to
investigate the effect of the interruption of deformation (D2 top segments), 3) to detect possibly
changes in deformation mechanism due to segment strain rate deviation from the bulk strain rate (D2
centre segments), and 4) to reveal the microstructural consequences of shear sense reversal (D2 bottom
segments).
In continued shearing (top segments, Fig. 4.6), microstructure development is similar to that
for single-stage deformation (top segments, Fig. 4.5). In addition, Sa-orientation data from top
segments (grey circles Fig. 4.7) plots into the trend set by Sa-foliation obtained from single-stage
deformation experiments. Interruption of deformation without change of shear sense at comparable
stress but slightly altered strain rates (2-5×10⁻⁴ s-1) has no major effect on microstructural development
of Carrara marble.
In the centre segments, low strain microstructures that developed during D2 show no evidence
for other deformation mechanisms than dislocation creep and e-twinning. Despite a strain rate ratio of
5 between D2γ2.6 and D2γ5 centre segments, fabrics, including Sa foliation angles, are similar. In
general, almost one order of magnitude strain rate difference (5×10⁻⁵ – 4×10⁻⁴ s-1) did not affect
shearing microstructure development.
The microstructural effect of strain reversal can be studied in the three bottom segments of the
D2 experiments. The microstructures of D2γ1 and D2γ2.6 bottom segments are markedly different from
any other D2 segment or single-stage deformation experiment. The presence of fine recrystallised
grains, twin planes, undulose extinction and deformation bands indicates that also in these segments
dislocation creep is accompanied by dynamic recrystallisation. From comparison between top and
bottom segments, which were deformed to almost the same absolute strain, it is obvious again that the
presence of large stretched relict grains has a retarding effect on the progress of dynamic
recrystallisation upon strain reversal.
In the bottom segment of D2γ1 initially strongly elongated grains are recovered in shape and
appear equant and similar to grains in undeformed Carrara marble. The strain history is still
recognizable, though, by a high concentration of twins, undulose extinction and deformation bands.
Furthermore, the large grains have a weakly developed rim of small recrystallised grains, a feature that
is associated with an absolute strain of γ = 1.5-2. Similar behaviour is reported by Delle Piane and
Burlini [2008] for torsion tests on Carrara marble with strain reversal (γ = 1 + -1).
The bottom segment of D2γ2.6 is strongly recrystallised, but also contains sheared relict grains.
The amount of recrystallisation is comparable with that in single-stage deformation experiments to
85
γ = 4-5. The absolute shear strain of the bottom segment of D2γ2.6 is 4.9. The progress of
recrystallisation appears to be merely depending on γabs, meaning plastic work in the segment, rather
than finite strain. We interpret this observation in terms of total strain energy (being about proportional
to absolute strain as long as stress remains in the same magnitude) which is recorded in the defect
structure of the material and which is primarily driving recrystallisation.
Two observations regarding the relict grains in bottom segment of D2γ2.6 are noteworthy: 1)
they have a strong elongation, which forms a SPO-derived Sa foliation, but despite γD2 < γD1, foliation
indicates top to the right shear. 2) Comparison with sheared grains in single-stage deformation
experiment to γ = 2.3 (Fig. 4.5) reveals that grain size is 2-4 times smaller. Points 1 and 2 are linked
by the grain size reducing effect of recrystallisation. Relict grain aspect ratio is a function of strain.
Non-isotropic recrystallisation of rims of sheared relict grains reduces grain size and aspect ratio. The
resulting grain shapes are typically associated with lower shear strain. Consequently, during strain
reversal and with dynamic recrystallisation, less strain is required to recover a strongly sheared relict
grain back to spherical shape. When excess strain is available during the reversal, grain shearing can
continue into the direction of the reversed strain, as is the case for the bottom segment of D2γ2.6.
The type 1 strain reversal experiment on Carrara marble reported by Delle Piane and Burlini
[2008] where the sample was deforming first to γ = 2 and secondly to γ = -2, also shows a weak SPO
indicating the shear sense of the last deformation.
The microstructures for the top and bottom segment of D2γ5 are identical, with the exception
of the Sa and Sb orientations, which are 6° and respectively 4° steeper in the bottom. For both
segments, the microstructure is completely reworked to a fine-grained matrix by dynamic
recrystallisation. Strain reversal and interruption of deformation have no visible microstructural effect
on this recrystallisation process.
Foliation development:
Figure 4.7 shows that, 1) Sa-orientation follows similar development in continued deformation
and single-stage deformation, 2) the range of strain rates in D2 centre segments has no influence on Sa-
orientation development, and 3) Sa orientation with respect to SZB is systematically steeper in
reversed deformation than in equivalent single-stage deformation.
In the D2 segments in this study (γabs < 12), Sa is primarily defined by SPO of relict grains.
Clearly, the pre-existing relict grain SPO in opposite orientation retards the development of the final
foliation in reversed deformation. Aspect ratio reduction in relict grains by dynamic recrystallisation,
however, counteracts the retardation effect of pre-existing SPO. The decreasing difference between
reversed and single-stage Sa orientations reduces with strain (Fig. 4.7, open circles in comparison with
general trend).
Sb foliation is primarily caused by grain boundary alignment of fine recrystallising grains
[Pieri et al., 2001a; Barnhoorn et al., 2004] and reported constant with strain up to γ = 50 [Barnhoorn

86
et al., 2004]. In similarly fine-grained carbonates (Solnhofen limestone), Sb inclination angle increased
between γ = 15 and 19 from 18 to 31° [Rybacki et al., 2003: their figure 16A]. Constant orientation
with strain is explained by cyclic recrystallisation, resetting foliation planes and keeping Sb steep with
respect to SZB. Temperature strongly controls recycle frequency and thus the angle or steepness. With
decreasing temperature, recrystallisation is slower and Sb-orientation on average becomes flatter
[Barnhoorn et al., 2004].
Based on new data from this study and Della Piane and Burlini [2008], between γ = 5 and 12,
Sb-orientation appears to have steepened. Though we interpreted the rock to be almost completely
recrystallised at γ = 5, here we have to consider that a few highly sheared relict grains are still present
at much larger strain. The observed non-equilibrium of the recrystallisation process is explained by
incomplete recrystallisation of the sample. This implies that microstructural steady state is not reached
before γ = 12 under the experimental conditions of this study.
Texture development:
Single-stage deformation experiments on Carrara marble in regime 2 [Schmid et al., 1980]
develop initially a shearing and later a recrystallisation CPO [Pieri et al., 2001a; b; Barnhoorn et al.,
2004]. Texture consequences of deformation interruption, strain rate changes and deformation reversal
are discussed here.
The pole figures for D2 experiments (Fig. 4.8) indicate that continued deformation develops
texture similarly as single-stage deformation. Low strain CPO development in D2 centre segments is
insensitive of strain rate within nearly one order of magnitude difference. Similar conclusions were
drawn from microstructural observations.
All three D2 bottom segments have some degree of texture. In the D2γ1 bottom segment, a
slightly modified shearing deformation CPO is easily recognized, despite the nearly zero finite shear
strain. CPO in the bottom segment of D2γ2.6 resembles the transition to the recrystallisation texture
known from the intermediate strain samples (left part Fig. 4.8). The sense of shear derived from the
associated pole figures indicates for both segments, top to the right (i.e. D2) shearing. Despite a clear
SPO, CPO identifies the latest deformation stage. SPO follows more strictly the finite shear strain.
CPO is easier to overprint and develop during strain reversal than SPO is.
In comparison with texture derived from single-stage torsion tests, c-axes are slightly rotated
towards the SZB in reversed segments of D2γ1 and D2γ2.6 (Fig. 4.8). Low strain reversal tests by Delle
Piane and Burlini [2008, their figure 7A] shows similar behaviour.
The well-developed recrystallisation texture of top and bottom segments in D2γ5 are nearly
indistinguishable. This implies that recrystallisation has completely overprinted the shearing texture,
independent of shear sense, as was previously concluded based on microstructural observations. The
previously discussed delay of dynamic recrystallisation on shear reversal is reflected here in slightly
lower texture strength in the bottom compared to the top segment.

87
Justification of earlier assumptions:
To understand qualitatively the observed D2 strain variation, we used stress-strain curves from
single-stage torsion tests. Two assumptions were made (section 4.2). Now, we justify using these
assumptions.
No fabric element seems to have been affected by strain interruption. There is no evidence for
deformation outside regime 2 of Schmid et al. [1980], despite a strain rate range of more than one
order of magnitude. Strain variation data shows that for D2γ1 and D2γ2.6 strain reversal has a significant
effect. For D2γ5 there is no effect. Therefore, only for low to intermediate strain reversed deformation
the use of stress-strain curves from single-stage torsion tests is not justified. Hence, alternative curves
for that situation are required.
Delle Piane and Burlini [2008] reported Carrara marble strain reversal experiments in torsion
(their results are reproduced in modified form in figure 4.10). For comparison, the envelope for stress
development with strain from single-stage experiments is plotted there as well. In P0577 (γ = 1 + -1),
flow stress upon reversal remained similar and work softening occurred at similar rate. In experiments
P0583 (γ = 2 + -2) and P0638 (γ = 4 + -4), strain reversed samples weakened at similar rate, but
overall 5-7 MPa higher flow stress. In experiment P0586 (γ = 5 + -5), the deformation progressed
upon reversal at nearly constant, but 3 MPa higher flow stress.
Figure 4.10: Delle Piane and Burlini [2008], Fig. 2A-B, modified to show the mechanical effect of strain
reversal at strains between γ = 1 and 5.
None of the curves by Delle Piane and Burlini [2008] displayed a lowered flow stress upon
shear reversal, meaning no indication for Bauschinger effect at shear strain of 1 to 5. However, the
curves plotted in figure 4.10 were not corrected for torque drift during the tests. Recent re-loading tests
under similar conditions with Carrara marble by De Raadt [pers. comm. De Raadt, 2009], revealed a
torque drift upon re-loading of ± 3 Nm, which is equivalent to ± 2.5-3.6 MPa. Only in P0583 and
P0638 of Delle Piane and Burlini [2008] re-loaded shear stresses were greater than potential drift.
The effect of torque drift might also be larger than the Bauschinger effect. We can estimate the
Bauschinger effect by comparing D2γ1 top and bottom segments. The observed strain rate ratio of 1.3
88
correlates to a flow stress ratio between 1.04 and 1.02 for n = 6 to 10, respectively. For an absolute
flow stress of 45 MPa this ratio yields a flow stress difference of 1 to 2 MPa. The Bauschinger effect is
thus smaller than the variability of torque due to drift.
By first approximation, hardening upon reversal for intermediate strain in Delle Piane and
Burlini [2008] is in agreement with the strain reversal behaviour recorded by the D2γ2.6 bottom
segment in this study. The strain/stress curves from Delle Piane and Burlini [2008] can thus at least be
used as support for the slightly larger flow stress in the D2γ2.6 bottom segment. For understanding the
slightly weaker D2γ1 bottom segment, new strain reversal tests with accurate torque drift corrections
are required.
Geological consequences:
Deformed coarse-grained marble that has not yet reached steady state flow conditions shows
clear evidence for strain reversal. Grain shearing is reversible, but recrystallisation continues at
seemingly comparable rate after strain reversal, resulting in unique microstructures of equant relict
grains within a fine-grained matrix. Texture is unique in having a slightly offset shearing texture.
Sense of shear from this texture relates to the latest deformation stage, even when magnitude of strain
during the last stage are equal (D2γ1) or less (D2γ2.6).
Calcite twinning is used for paleostress [e.g. Jamison and Spang, 1976; Rowe and Rutter,
1990; Ferrill, 1998] and paleostrain estimates [e.g. Groshong et al., 1984 and references therein;
González-Casado et al., 2003]. Strain reversal in principle allows more twins to be activated compared
to continued deformation, as is demonstrated by D2γ1 and D2γ2.6 top and bottom segments (Fig. 4.6).
Simply speaking, finite strain will be overestimated when reverted strain is not considered. Paleostress
estimates using twins are for example based on twin density [Rowe and Rutter, 1990; Ferrill, 1998]. In
D2 experiments stress is considered similar for any circular plane of the cylinder. Despite comparable
absolute strain in D2γ1 and D2γ2.6 top and bottom segments twin density is different. Strain reversal
clearly affects twin density.
Texture of (ultra-)mylonitic marble (i.e. steady state conditions) develops with absolute strain,
regardless of shear sense. Sense of shear cannot be derived from such recrystallised material and no
evidence for strain reversal is visible. No effect of strain reversal on mechanical strength in well-
developed mylonite marbles is observed.
Crustal domains with a homogeneous lithology, but heterogeneous strain history, develop
strain variation when fabric heterogeneities result in rheological contrast (e.g. shear zone reactivation).
D2 experiments show that an initial small rheological contrast leads to large strain variation when
segments develop differently (i.e. hardening vs. softening or constant flow stress) during subsequent
deformation.
89
4.5: Conclusions
High temperature and pressure torsion experiments on sandwich Carrara marble samples with
pre-existing strain variation were performed to study the rheological, microstructural and textural
consequences of multi-stage deformation. Complexities like strain interruption, reversal and pre-
existing strain variation have been investigated. Strain history was produced by torsion experiments,
representing deformation stage 1 (D1). Sandwich samples are then deformed by counter-clockwise
torsion during deformation stage 2 (D2).
The rheological consequences are summarized as follows:
In all D2 experiments, shear strain is homogeneous within, but variable between sample
segments. Pre-existing strain variation has a significant effect on strength and rate of
subsequent deformation.
Bulk D2 sample flow stress is more constant compared with single-stage deformation
experiments. Work hardening and work softening cancel each other mostly and apparent
steady state stress is achieved at increasingly lower strain with increasing D1 strain, i.e.
increasing variation in strength and fabric.
Bulk D2 sample flow behaviour is mostly defined by the softest D2 segment. This
phenomenon becomes the more pronounced the larger the D1 strain (i.e. the larger the strength
contrast between segments).
Flow strength contrast is responsible for the observed strain rate variation. A small variation in
flow stress varies strain rate by magnitudes, as would be expected for power law flow
behaviour with high stress exponent n between 6 and 10.
Total strain in each segment defines the momentary flow strength only for, 1) continued
deformation (i.e. strain interruption has no effect on flow stress behaviour with strain) and 2)
high strain deformation with complete recrystallisation, when flow stress is independent on
shear sense.
Strain reversal leads to modified flow stress behaviour when relict grains are still present in
the sample after the first deformation stage (i.e. γ < 5 for the conditions in this study).
The microstructural and textural consequences are summarized as follows:
Finite strain relates to the grain shape of relict grains, if still existing. Shearing of grains is
complemented by grain size reduction due to dynamic recrystallisation leading to aspect ratio
equilibration.
Total or absolute strain controls the amount of recrystallisation and strength of
recrystallisation CPO, which are independent of shear sense, but represent total amount of
work and strain energy in the material.
Compared with SPO, CPO requires less strain to be overprinted on reversal.

90
Reversed deformation is recognized at low strain in microstructural characteristics like SPO
and CPO, and orientation of foliation planes. At high strain, where dynamic recrystallisation
dominates, the indications of pre-strain in reversed sense become much more subtle and fade
out eventually. Those indicators are Sa foliation angle, CPO strength, and degree of
recrystallisation.
In the absence of recrystallisation (γ < 1), flow stress is lower for reversed than for continued
deformation (Bauschinger effect). Delayed recrystallisation during strain reversal at
intermediate strains (1 < γ < 5) reduces work softening. Consequently, in this strain range
reversed deformation is harder than continued. Full recrystallisation (γ > 5) leads to a CPO
without shear sense sensitivity and flow stress for reversed deformation is similar to that for
continued deformation.
Between γabs = 5 and 12, orientation of Sb is steepening with respect to the SZB.
Consequently, microstructural steady state is not reached before γabs = 12.
4.6: Acknowledgements
This research was financially supported by ETH grant: TH 1/03-3/2704.5 as part of the PhD
project of R.H.C. Bruijn. We greatly appreciate the technical and educational support from R.
Hoffmann, S. Misra and F. Ornelas Marques in the laboratory and with servicing the experimental
apparatus. F. Pirovino is thanked for preparing <10 μm thin sections. We were please to have valuable
discussions with N. Mancktelow, J-P. Burg, W.S. de Raadt, C. Delle Piane, B.S.G. Almqvist and N.
Tisato. The Centre of Electron Microscopy ETH Zürich (EMEZ) is gratefully acknowledged for
providing the EBSD-SEM facility. Thanks to insightful commentary from reviewers Eric Rybacki and
Alexandre Dimanov, the manuscript could be greatly improved.
91
Chapter 5
Material: illite shale
________________________________________________________________
Oscar Wilde once said, “We live in an age when unnecessary things are our only necessities.”
Preface
This chapter deals with two linked topics, 1) rationale for the choice of source material and 2) presentation of the naturally compacted Maplewood Shale. To understand the selection of Maplewood Shale, a detailed description in terms of mineral and chemical composition is required. The first subchapter introduces the illite shale model and explains why clays used in previous experiments are unsuitable. The chapter then continues with a detailed description of Maplewood Shale. Sample fragments are described in subchapter 5.2, followed by a discussion on microstructure and mineral composition as determined by SEM BSE imaging and XRD analysis. Then, physical properties are discussed and a description of the pore types is presented in subchapter 5.4. After that, a new
subchapter discusses bulk composition of three pre-selected shales (Maplewood Shale, Argiletz shale (France) and Silver Hill shale (Montana)) as determined by XRF and places them in the context of geochemical shale standards. The overall description is concluded by a subchapter on the grain size distribution of Maplewood and Silver Hill shales. The physical and chemical rationales for ultimately choosing Maplewood Shale as best source for illite clay are then presented (subchapter 5.7). The chapter concludes with the geological history of the Early Silurian Maplewood Shale. Its stratigraphic position in the Paleozoic sediments of the Appalachian foreland basin and regional evidence for
deformation are the topic of the concluding subchapter.
92
5.1: Illite shale selection
Shales are notorious for their wide range of composition and fabric. Resulting physical
properties are highly scattered, often because of a complex diagenetic history. In the simplest
configuration, a model for shale is a mixture of clast-forming silt and matrix-forming clay. To address
the problems in this study, silty quartz clasts in clay-matrix of pure illite should be used. Although
monophase silty quartz is commercially available, clay-sized pure illite is not. A compromise was
therefore needed for the matrix-forming fraction of a simulated illite shale powder. Previous clay and
shale compaction and resedimentation experiments have used natural shale [Nygård et al., 2004],
commercially available silt and clays such as quartz, kaolinite and smectite [Vasseur et al., 1995;
Mondol et al., 2007; Fawad et al., 2010] or worked with a mixture of natural clay and commercial silt
[Schneider et al., 2011]. Though illite is present, none of the previously used clay-rich materials are
suitable as matrix-forming illite clay, due to their high smectite and/or illite-smectite content.
Alternative natural illite-rich shales were thus required.
Natural occurrence of illite shale is common and well documented. Three illite shales have
been pre-selected based on direct availability: Maplewood Shale, Argiletz shale and Silver Hill shale.
Maplewood Shale was ultimately selected as most suitable. Reasons for this choice follow description
of Maplewood Shale fragments, microstructure and mineral composition, bulk rock composition and
grain size distribution. Simultaneously, its fabric is given as an example of the type of fabric produced
by natural (chemical) compaction of clay-rich sediments. The physical state of Argiletz shale
(powder) and Silver Hill (< 1mm thin rock fragments) did not allow conventional preparation of a
SEM sample. Consequently, as a shale reference Argiletz shale is only included in the discussion of
Maplewood Shale bulk rock composition, whereas Silver Hill shale is only part of the discussion of
bulk rock composition and grain size distribution.
5.2: Physical state of the shales
Maplewood Shale:
Fragments of Maplewood Shale have been donated by WARD’s natural science, in Rochester
(NY), United States of America. The rock type is otherwise sold as hand specimen #52 in a rock
collection kit marketed for teaching purposes. The olive green to greenish-gray fragments range in
size from 3 to 10 cm with thickness of less than 3 cm (Fig. 5.1A). Color variation within and between
fragments is minimal and no veins or lenses of coarser particles are visible by the unaided eye,
indicating rather homogeneous composition and fabric.
Well-developed cleavage resulted in platy and fissile fragments. Bedding and cleavage are
(sub)parallel, therefore no intersection lineation is perceptible. Larger fragments exhibit irregular

93
bedding planes. No sedimentary features or fossil remains are visible. Other larger samples show
evidence of exposure; millimeter sized lichens or fungi, and discoloration due to weathering reactions.
Weathered surfaces display a more brownish color.
The fissile nature of the fragments complicates drilling of cylindrical samples that would have
been useful for analysis or deformation experiments. When wet, the fragments easily split along their
cleavage plane. Samples are very soft and easy to polish on high-grit abrasive paper. Dry polishing
leaves a white-to- greenish-white residue, characteristic of illite.
Argiletz shale:
Argiletz shale (also known as French green clay) is supplied by the French company
Laboratoire ARGILETZ S.A. It is sold as illite shale powder, although advertized as finely ground
green clay. The creamy light-green powder (Fig. 5.1B) is mostly sandy and originates from the Paris
Basin (France).
Silver Hill shale:
Olive-green thin (< 2 mm) rock slices of Silver Hill shale (Silver Hill Formation) were
collected from a small outcrop in the Flint Creek Range of Granite County, Montana (USA). High
fissility reflects cleavage development. Color of the shale fragments is consistent, indicating
homogeneous composition and no weathering-related alteration. Fragments are too thin for drilling or
surface polishing.
Figure 5.1: pre-selected illite shales. A) Small pile of Maplewood Shale fragments. B) Small pile of
Argiletz shale powder.

94
5.3: Mineral phases and microstructure
Maplewood Shale:
SEM BSE imaging and EDX analysis of Maplewood Shale fragments revealed that the main
mineral phases are illite, phengite, clinochlore and quartz (Fig. 5.2A-F). The phyllosilicates and
quartz represent roughly 60-75 % and 20-30 % of image area, respectively, based on grid-point
analysis. Quartz distribution is heterogeneous within a cm-sized sample, thereby defining high and
low clay-content zones or alternatively matrix and grain-supported zones (Fig. 5.2A-B). Quartz
distribution is homogeneous in such zone of few mm2.
Secondary phases, with on average less than 2 area %, include coarse detrital biotite, pyrite,
apatite, rutile and K-feldspar. Distribution of some of these secondary phases is heterogeneous; within
a SEM-prepared sample, zones enriched (> 5 area %) in biotite, rutile or apatite may exist.
Minerals are very fine-grained matrix particles, rigid clasts (sub-micron to > 100 μm in size),
or both. Regardless of clay amount, the matrix is primarily comprised of clay-sized flakes with aspect
ratio (i.e. λ = length/width) ≥ 2, such as the clays and some of the finest grains of secondary phases.
Most rigid clasts in both low and high clay-content zones are detrital quartz. Those clasts have
irregular and angular grain boundaries. Quartz is visually coarser in clay-poor than clay-rich zones
(Fig 5.2A-B), possibly reflecting variations in water-current energy during deposition. The aspect
ratio of quartz clasts is variable (1 < λ < 5). Occasionally, quartz grains are irregularly surrounded by
an apatite-rim (red-ellipse Fig. 5.2A). No authigenic quartz that may have formed during smectite to
illite transformation [Peltonen et al., 2009; Thyberg et al., 2010] has been identified, suggesting an
open system during burial [Day-Stirrat et al., 2010]. Detrital biotite and phengite (silt-size) in the
matrix have very high aspect ratios (λ > 5). Equant and non-equant secondary phase particles > 2 µm
form rigid clasts in the clay-dominated matrix, with pyrite occurring also in framboidal configuration,
sized 40-60 µm (Fig. 5.2B).
The degree of alignment of clays and high λ secondary minerals between low and high clay-
content matrices is markedly different. Matrix-supported parts of the sample, with high clay-content,
exhibit up to two foliations (Fig. 5.2A, E-F), both of which are interpreted to be of diagenetic origin.
In fact, also λ > 1 quartz clasts are frequently aligned to one of the matrix foliations. In grain-
supported parts of Maplewood Shale, where quartz content is markedly higher (> 40 area %), the clay
matrix displays no foliation (Fig. 5.2B-C).
Inspired by a recent clay-silt compaction studies by Schneider et al. [2011] and Fawad et al.
[2010] a conceptual model is designed that describes the origin of both strongly foliated matrix-
supported domains and grain-supported domains without clay alignment (Fig. 5.3). Before natural
(mechanical) compaction of matrix-supported zones, when porosity was high and fluids abundant,
clays were likely randomly oriented and together with dispersed rigid clasts were not displaying a
95
foliation (Fig. 5.3 high porosity state). During diagenesis, as fluids are expulsed from the pores,
represented in figure 5.3 by 20 % vertical shortening, floating clay particles align to the flow
direction. Rigid silt clasts force fluid flow around the clasts. After fluid expulsion, clay particles
wrapped around silt clasts indicate the previous flow pattern.
In 2D, assuming fluid flow in a horizontal direction, the appearance of one or two clay-matrix
foliations depends on the amount of silt clasts. In the absence of clasts, horizontal foliation develops
upon gravity-driven compaction. With increasing amount of rigid particles, clay wrapping becomes
more dominant. For a certain amount of silt clast, the two dominant orientations, equally tilted with
respect to the loading direction, resulting from clay wrapping, dominate the overall microstructure as
is evident from figure 5.2A.
For grain-supported quartz-rich domains of Maplewood Shale, it is inferred from the lack of
foliation that the matrix experienced a lesser degree of (mechanical) compaction. Pressure shadowing
by the abundant and touching quartz clasts could then explain the limited compaction (Fig. 5.3). In a
high porosity state before compaction and fluid expulsion, it is likely that silty clasts were randomly
distributed, floating in a matrix of saturated mud. During compaction, as fluids are expulsed, rigid
clasts move closer. Upon touching of rigid clasts (green ellipses), provided sufficient clasts are
present, pressure shadows are formed and fluids become trapped and create an overpressure. Nearby
clays are then protected from diagenesis by surrounding rigid particles and the local overpressure.
Porosity remains high in these areas as compaction is prohibited. Clay foliation does develop as fluid
flow is absent and clays are not aligning to flow (Fig. 5.3 red ellipses). In this conceptual model for
grain-supported domains, a local clay alignment may develop between rigid clasts when spacing is
wide (Fig. 5.3 blue ellipse). Such alignment, however, rarely extents to neighboring grains and is not
necessarily oriented normal to the burial direction. Local clay alignment in grain-supported domains
thus seldom qualifies as foliation. In quartz-rich parts of Maplewood Shale, matrix foliation is
lacking, even though locally, on the scale of 3-6 μm, pockets of illite flake appear aligned (Fig. 5.2C
orange circles).
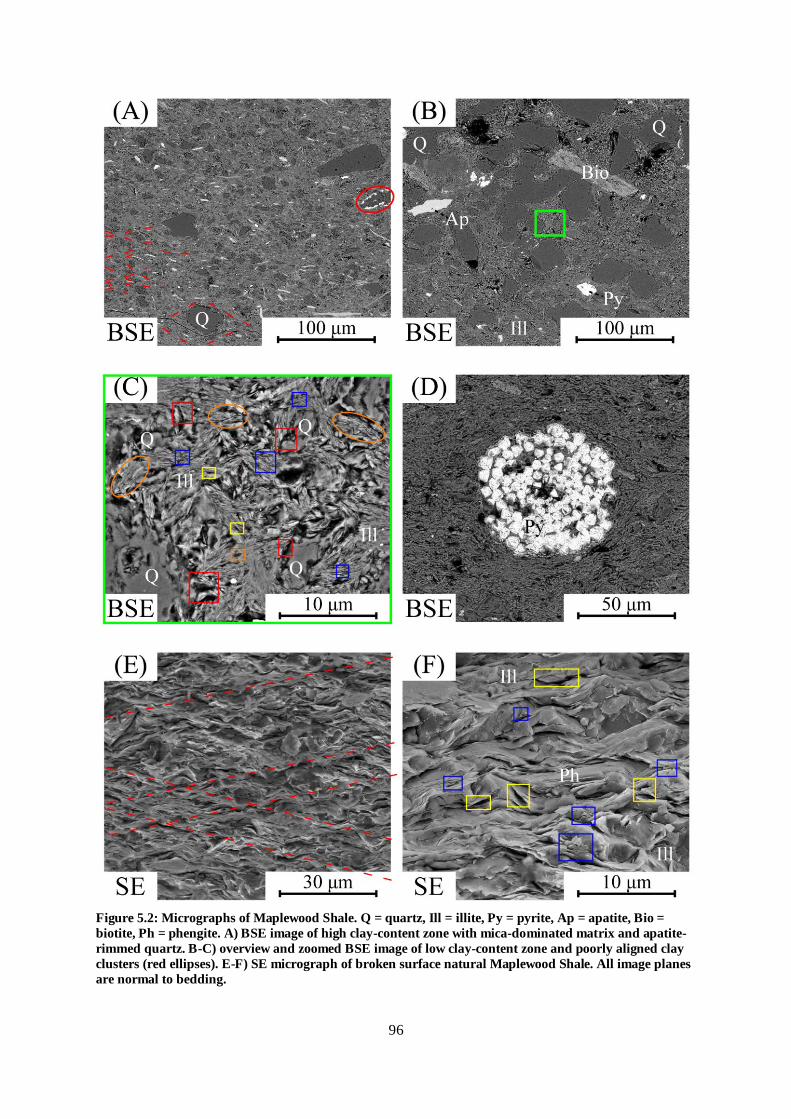
96
Figure 5.2: Micrographs of Maplewood Shale. Q = quartz, Ill = illite, Py = pyrite, Ap = apatite, Bio =
biotite, Ph = phengite. A) BSE image of high clay-content zone with mica-dominated matrix and apatite-
rimmed quartz. B-C) overview and zoomed BSE image of low clay-content zone and poorly aligned clay
clusters (red ellipses). E-F) SE micrograph of broken surface natural Maplewood Shale. All image planes
are normal to bedding.
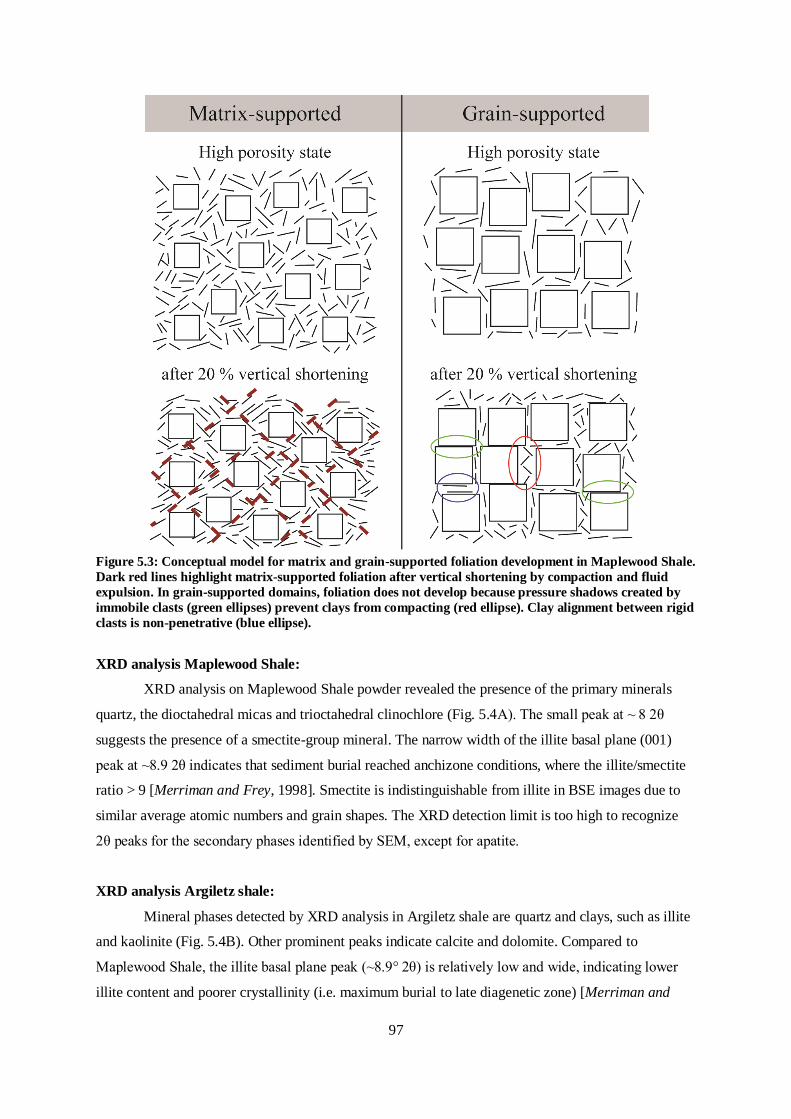
97
Figure 5.3: Conceptual model for matrix and grain-supported foliation development in Maplewood Shale.
Dark red lines highlight matrix-supported foliation after vertical shortening by compaction and fluid
expulsion. In grain-supported domains, foliation does not develop because pressure shadows created by
immobile clasts (green ellipses) prevent clays from compacting (red ellipse). Clay alignment between rigid
clasts is non-penetrative (blue ellipse).
XRD analysis Maplewood Shale:
XRD analysis on Maplewood Shale powder revealed the presence of the primary minerals
quartz, the dioctahedral micas and trioctahedral clinochlore (Fig. 5.4A). The small peak at ~ 8 2θ
suggests the presence of a smectite-group mineral. The narrow width of the illite basal plane (001)
peak at ~8.9 2θ indicates that sediment burial reached anchizone conditions, where the illite/smectite
ratio > 9 [Merriman and Frey, 1998]. Smectite is indistinguishable from illite in BSE images due to
similar average atomic numbers and grain shapes. The XRD detection limit is too high to recognize
2θ peaks for the secondary phases identified by SEM, except for apatite.
XRD analysis Argiletz shale:
Mineral phases detected by XRD analysis in Argiletz shale are quartz and clays, such as illite
and kaolinite (Fig. 5.4B). Other prominent peaks indicate calcite and dolomite. Compared to
Maplewood Shale, the illite basal plane peak (~8.9° 2θ) is relatively low and wide, indicating lower
illite content and poorer crystallinity (i.e. maximum burial to late diagenetic zone) [Merriman and

98
Frey, 1998]. Smectite group minerals are not directly recognized, but can be inferred from the illite
basal plane peak. Smectite in the form of illite-smectite is likely present.
XRD analysis Silver Hill shale:
XRD analysis of Silver Hill shale (Fig. 5.4C) shows that the primary mineral phases are quartz,
phengite, illite, kaolinite and biotite. High counts for the basal plane of the illite, phengite and biotite
at around 2θ = 9° indicate a relative higher clay/mica content than Maplewood Shale. The crystallinity
of illite, especially, is poorly developed, as indicated by the peak width [Merriman and Frey, 1998].
As burial to late diagenetic zone does not result in biotite or phengite crystallization, these mineral in
Silver Hill shale are detrital.
5.4: Porosity/density and pores
Maplewood Shale:
The connected helium porosity for Maplewood Shale is 2.7 ± 0.2 %. Bulk and grain density
are 2.60 ± 0.02 and 2.68 ± 0.02 g cm-3, respectively. Based on grain density of the primary mineral
phases, quartz (2.62 ± 0.02 g cm-3), clinochlore (2.65 ± 0.1 g cm-3), illite (2.75 ± 0.15 g cm-3) and
phengite (2.82 ± 0.05 g cm-3), the phengite fraction is estimated ≤ 10 wt. %, the quartz + clinochlore
fraction combined is estimated 20-30 wt. % and the illite fraction is estimated 60-70 wt.%.
Several pore types have been identified in mudstones and shales using recently developed
focus ion beam SEM (FIB-SEM) [Desbois et al., 2009; Heath et al., 2011] and Ar-ion-beam- milling
SEM [Loucks et al., 2009] imaging techniques.
Based on SEM broken and polished surface imaging, pores in Maplewood Shale are
categorized into four generic types: 1) fractures, 2) matrix-clast-voids, 3) clay-micropores and 4)
matrix-pores. Fractures form thin tabular planes, usually parallel to foliation (Fig 5.2A bottom left).
No distinction was possible between natural and unloading fractures. Matrix-clast-voids are pores at
the contact between matrix material and coarser clasts and originate from geometrical misfits between
different mineral shapes (Fig. 5.2C red boxes). Typically, their 2D cross section is triangular or
elongated, with size usually < 2 µm. Clay-micropores exist within stacked illite flakes and represent
planar, slit-like voids between irregular clay surfaces (Fig. 5.2C, F blue boxes). The thickness of these
micro voids is usually < 100 nm. Matrix-pores are 1-3 µm sized voids inside the matrix, which
originate from geometric misfits between matrix-forming minerals (Fig. 5.2C, F yellow boxes).
Matrix pores are differently shaped, i.e. tabular, pyramidal or spherical and are sometimes
geometrically similar to clay micropores or matrix-clast-voids.

99
Figure 5.4: XRD spectra for A) Maplewood Shale, B) Argiletz shale and C) Silver Hill shale with
interpreted mineral phases after 2θ peaks. XRD quartz pattern after Antao et al. [2008], illite after Drits et
al. [2010], phengite after Pavese et al. [1999], clinochlore after Welch and Marshall [2001], apatite after
Hughes et al. [1989], dolomite after Ross and Reeder [1992], calcite after Antao and Hassan [2010],
kaolinite after Bish and Von Dreele [1989], and biotite after Bohlen et al. [1980].
Fractures in Maplewood Shale relate to pore-types VI of Heath et al. [2011]. Kwon et al.
[2004] pore-types I and II, and Desbois et al. [2009] and Heath et al. [2011] pore-type I show strong
correlation with Maplewood Shale clay-micropores. Matrix-clast-voids relate to type III pores of
Desbois et al. [2009] and type V pores of Kwon et al., [2004]. Matrix-pores show the best
morphological correlation with Kwon et al. [2004] types III and IV, Heath et al. [2011] types II and
III, and Desbois et al. [2009] type II pores.
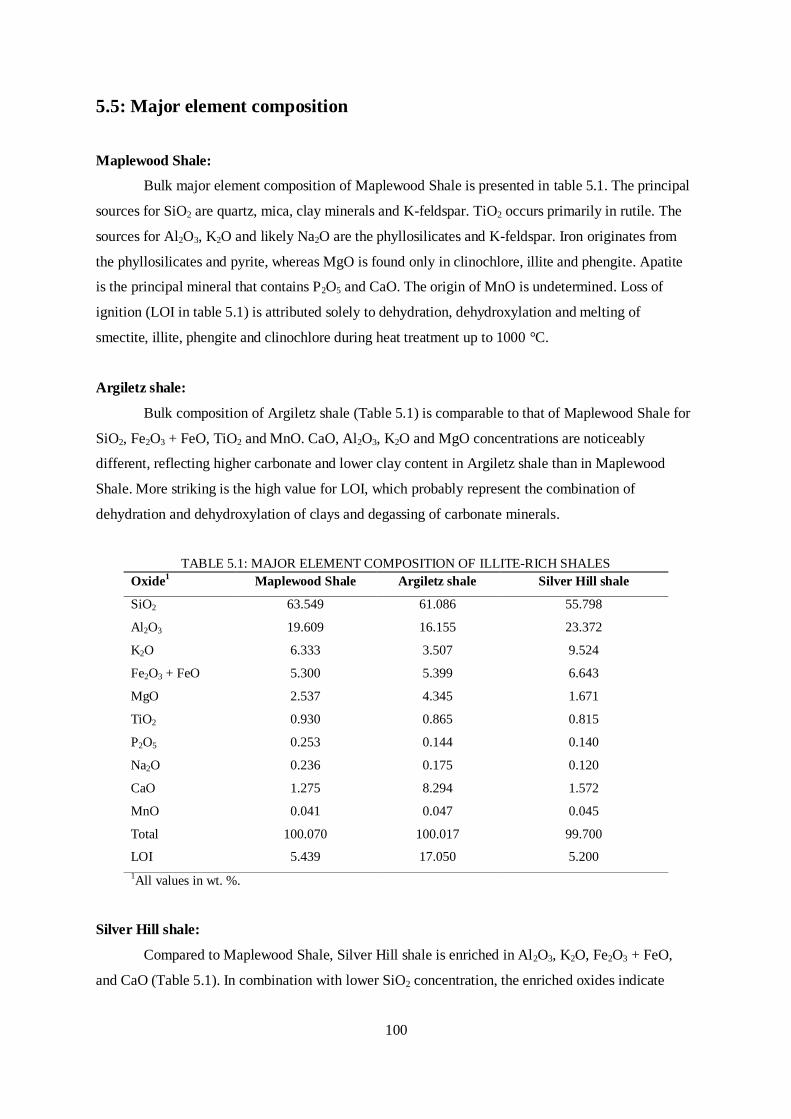
100
5.5: Major element composition
Maplewood Shale:
Bulk major element composition of Maplewood Shale is presented in table 5.1. The principal
sources for SiO2 are quartz, mica, clay minerals and K-feldspar. TiO2 occurs primarily in rutile. The
sources for Al2O3, K2O and likely Na2O are the phyllosilicates and K-feldspar. Iron originates from
the phyllosilicates and pyrite, whereas MgO is found only in clinochlore, illite and phengite. Apatite
is the principal mineral that contains P2O5 and CaO. The origin of MnO is undetermined. Loss of
ignition (LOI in table 5.1) is attributed solely to dehydration, dehydroxylation and melting of
smectite, illite, phengite and clinochlore during heat treatment up to 1000 °C.
Argiletz shale:
Bulk composition of Argiletz shale (Table 5.1) is comparable to that of Maplewood Shale for
SiO2, Fe2O3 + FeO, TiO2 and MnO. CaO, Al2O3, K2O and MgO concentrations are noticeably
different, reflecting higher carbonate and lower clay content in Argiletz shale than in Maplewood
Shale. More striking is the high value for LOI, which probably represent the combination of
dehydration and dehydroxylation of clays and degassing of carbonate minerals.
TABLE 5.1: MAJOR ELEMENT COMPOSITION OF ILLITE-RICH SHALES
Oxide1 Maplewood Shale Argiletz shale Silver Hill shale
SiO2 63.549 61.086 55.798
Al2O3 19.609 16.155 23.372
K2O 6.333 3.507 9.524
Fe2O3 + FeO 5.300 5.399 6.643
MgO 2.537 4.345 1.671
TiO2 0.930 0.865 0.815
P2O5 0.253 0.144 0.140
Na2O 0.236 0.175 0.120
CaO 1.275 8.294 1.572
MnO 0.041 0.047 0.045
Total 100.070 100.017 99.700
LOI 5.439 17.050 5.200
1All values in wt. %.
Silver Hill shale:
Compared to Maplewood Shale, Silver Hill shale is enriched in Al2O3, K2O, Fe2O3 + FeO,
and CaO (Table 5.1). In combination with lower SiO2 concentration, the enriched oxides indicate

101
lower quartz and higher phyllosilicate content. Lower P2O5 concentrations suggest a low apatite
presence. Water content in Silver Hill shale is consistent with illite-rich shales.
Comparison with geochemical standards:
Maplewood Shale bulk composition is used as input for the chemical model discussed in
chapter 6 and as a representative shale type. For the latter purpose, the bulk composition is compared
with that of commonly used geochemical standard for shale (Table 5.2) and Argiletz and Silver Hill
shales (Fig. 5.5). Oxide concentrations are normalized over the average value of 11 geochemical shale
standards (Table 5.2). Oxides in both tables 5.1 and 5.2 and figure 5.5 are sorted by increasing
variation in concentration among the geochemical standards (i.e. increasing range of occurrence). The
concentration of SiO2, Fe2O3 + FeO, MgO, TiO2 and P2O5 in Maplewood Shale plots within the range
of the geochemical shale standards and also within 20 % of their average (Fig. 5.5). The concentration
of Al2O3 (1.10) is also close to the standards’ average, but outside their range (0.93-1.09). K2O
concentration (1.71) is markedly higher than the average and normalized maximum concentration
(1.35) of the standards. Conversely, Na2O and MnO concentrations (0.14 and 0.25, respectively) are
significantly lower than both the average and normalized minimum values (0.51 and 0.46,
respectively) for the shale standards. Finally, while CaO concentration in Maplewood Shale (0.22) is
noticeably lower than the average, it is still higher than the normalized minimum value (0.14) of
standards.
For nearly all oxides, Argiletz shale fits within the general range of geochemical shale
standards. One low-importance oxide, Na2O is severely depleted. Other more important oxides, such
as SiO2, Al2O3 and K2O are below average. These oxides are important for shale composition, roughly
representing quartz and clay content. Argiletz shale therefore represents a rather exotic shale
composition, one that makes its use as illite shale source particularly impractical.
Silver Hill shale represents a different shale composition. It is enriched in Al2O3, K2O, Fe2O3
+ FeO and CaO compared to the average composition of the geochemical shale standards. On the
other hand, Silver Hill shale is depleted in SiO2, MgO, Na2O, CaO and MnO. The overall composition
and pattern hints at a phyllosilicate-richer type of shale than on average. Based on its composition,
Silver Hill shale is a suitable candidate to provide illite clay for the modeled illite-quartz shale.

102
TABLE 5.2: MAJOR ELEMENT COMPOSITION OF GEOCHEMICAL SHALE STANDARDS AND THEIR
AVERAGES
Oxide1 P
AA
S2
NA
SC
3
AS
4
AN
AP
S5
AR
PS
6
AN
AM
CS
7
AR
MC
S8
AC
PS
9
AR
PS
10
AC
AS
11
AA
S1
2
Aver
age
SiO2 62.8 64.80 64.21 59.75 56.78 67.78 64.09 66.90 63.04 62.13 65.47 63.43
Al2O3 18.90 16.90 17.02 17.79 16.89 16.59 16.65 16.67 18.63 18.11 16.11 17.30
K2O 3.70 3.99 3.58 4.82 4.38 2.44 2.73 4.97 4.57 2.92 2.37 3.68
Fe2O3 or FeO 6.50 5.66 6.71 5.59 6.56 4.11 6.03 5.87 7.66 7.33 5.85 6.17
MgO 2.20 2.86 2.70 4.02 4.56 3.38 2.54 2.59 2.60 3.57 2.50 3.05
TiO2 1.00 0.70 0.72 0.98 0.92 0.70 0.82 0.78 0.94 0.78 0.49 0.80
P2O5 0.16 0.13 0.19 0.12 0.13 0.10 0.12 0.14 0.10 0.17 0.14 0.14
Na2O 1.20 1.14 1.44 0.72 0.77 0.98 1.27 1.50 1.02 2.68 2.80 1.41
CaO 1.30 3.63 3.44 6.10 8.91 3.91 5.65 0.53 1.31 2.22 4.10 3.74
MnO 0.11 0.06 0.50 0.08 0.07 0.06 0.12 0.10 0.07 0.13
Total 97.87 99.87 100.51 99.89 99.98 99.99 99.97 100.01 99.99 100.01 99.90 99.84
1All values in wt. %.
2 PAAS = Post-Archean Australian Shale [Taylor and McLennan, 1985]
3 NASC = North America shale composite [Gromet et al., 1984]
4 AS = Average shale [Clarke, 1924]
5 ANAPS = Average North American Paleozoic shale [Ronov and Migdisov, 1971]
6 ARPS = Average Russian Paleozoic shale [Ronov and Migdisov, 1971]
7 ANAMCS = Average North American Mesozoic/Cenozoic shale [Ronov and Migdisov, 1971]
8 ARMCS = Average Russian Mesozoic/Cenozoic shale [Ronov and Migdisov, 1971]
9 ACPS = Average Canadian Proterozoic shale [Cameron and Garrels, 1980]
10 ARPS = Average Russian Proterozoic shale [Ronov and Migdisov, 1971]
11 ACAS = Average Canadian Archean shale [Cameron and Garrels, 1980]
12 AAS = Average Archean shale [Ronov and Migdisov, 1971]
Figure 5.5 shows the relative bulk composition of Maplewood Shale after compaction stage 2
(HIP1). The oxide pattern is identical to natural Maplewood Shale, except for P2O5. No contamination
or depletion of elements occurred during sample preparation or compaction stage 2. Major element
concentration in Maplewood Shale determined by Kaszuba et al., [2005] is identical, except for
slightly lower P2O5 and CaO values. The fact that different studies, samples and measurement
techniques detected no variation in composition for Maplewood Shale, except for P2O5, suggests that
apatite distribution is heterogeneous.

103
Figure 5.5: Major element concentrations of Maplewood Shale, Argiletz and Silver Hill shales normalized
over the average of geochemical shale standards listed in Table 5.2. Dashed MAX and MIN lines
represent normalized maximum and minimum values among the shale standards of Table 5.2,
respectively.
5.6: Powder grain size
Maplewood Shale:
Maplewood Shale powder used for experimental re-compaction tests has a mean grain size of
21.1 µm, and contains 15.1 vol. % clay (< 2 µm), 79.5 vol. % silt (2-63 µm) and 5.4 vol. % sand (> 63
µm) (Table 5.3). Grain size distribution is visualized in figure 5.6 (MwS<125), together with the
result of grain size analysis of coarser Maplewood Shale powders. The grain size distributions of
crushed Silver Hill Shale powders, which have received identical crushing and sieving treatment, are
plotted for comparison.
Despite sieving, Maplewood Shale (MwS) powders show similar grain size distributions. This
was found to be the result of the initial crushed material containing only a relatively small grain
fraction > 100 µm, rendering sieving unnecessary. Grain flocculation explains why 125 and 250 µm
mesh sieves filtered apparent coarse grains. Electrostatic forces act to cluster fine clay and quartz
particles, resulting in coarse-grained aggregates. Ultrasonic agitation during the grain size analysis
disintegrated these aggregates.
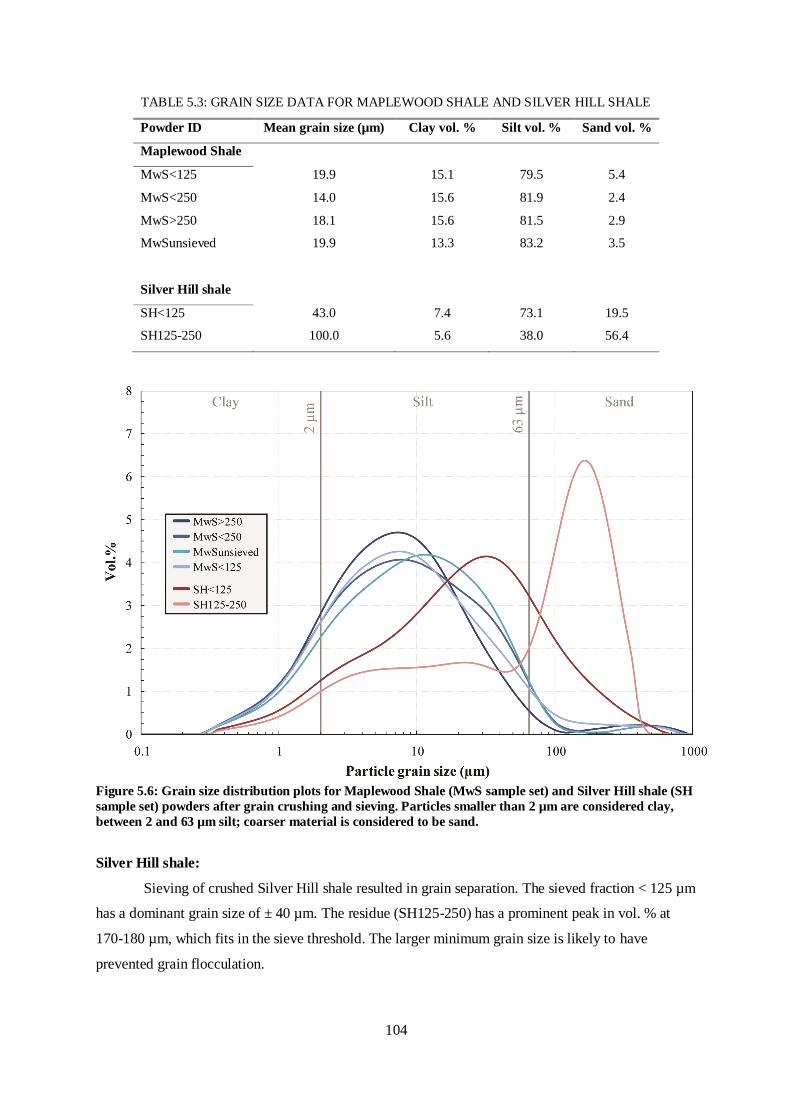
104
TABLE 5.3: GRAIN SIZE DATA FOR MAPLEWOOD SHALE AND SILVER HILL SHALE
Powder ID Mean grain size (µm) Clay vol. % Silt vol. % Sand vol. %
Maplewood Shale
MwS<125 19.9 15.1 79.5 5.4
MwS<250 14.0 15.6 81.9 2.4
MwS>250 18.1 15.6 81.5 2.9
MwSunsieved 19.9 13.3 83.2 3.5
Silver Hill shale
SH<125 43.0 7.4 73.1 19.5
SH125-250 100.0 5.6 38.0 56.4
Figure 5.6: Grain size distribution plots for Maplewood Shale (MwS sample set) and Silver Hill shale (SH
sample set) powders after grain crushing and sieving. Particles smaller than 2 µm are considered clay,
between 2 and 63 µm silt; coarser material is considered to be sand.
Silver Hill shale:
Sieving of crushed Silver Hill shale resulted in grain separation. The sieved fraction < 125 µm
has a dominant grain size of ± 40 µm. The residue (SH125-250) has a prominent peak in vol. % at
170-180 µm, which fits in the sieve threshold. The larger minimum grain size is likely to have
prevented grain flocculation.
105
5.7: Choice of Maplewood Shale
This chapter started with the dilemma which of three natural illite shale, Maplewood Shale,
Argiletz shale and Silver Hill shale, to select as most appropriate source for illite clay. Now follows
the explanation why Maplewood Shale was ultimately selected.
Maplewood Shale:
Maplewood Shale contains impurities such as smectite, phengite, clinochlore, non-silicates
and K-feldspar. These impurities are however not conflicting with illite and quartz as explained
below.
XRD analysis (Fig. 5.4A) revealed that smectite content is low, which confirms estimated
burial conditions of late diagenetic zone to anchizone [Friedman, 1987]. The smectite to illite
transformation during compaction stages 2 and 3 plays a marginal role in the total chemical
compaction process. All chemical activity in high-temperature compaction tests could be attributed to
the illite to phengite transformation. Detrital phengite is thermodynamically stable during all
experiments, except those at 750 °C (Chapter 6), and will not interfere with the formation of
authigenic phengite. The presence of clinochlore in Maplewood Shale is in fact beneficial because it
facilitates tracing the progress of mineral reactions during the high temperature compaction tests. The
stability field of chlorite extends to higher temperature than that of illite (Chapter 6). Secondary
phases such as biotite and K-feldspar represent a negligible fraction in terms of chemistry and
mechanics. Biotite is morphologically and mechanically similar to phengite, while K-feldspar behaves
like quartz. Moreover, both biotite and K-feldspar are stable throughout the full range of experiments
(Chapter 6). Other secondary phases such as the non-silicates represent such a small fraction, as
illustrated by the TiO2 and P2O5 normalized concentrations in figure 5.5 that their chemical and
mechanical effects are negligible. No chemical reaction involving pyrite, apatite and rutile is expected
and, in terms of mechanics, they will act as rigid clasts. In summary, albeit an impure illite shale,
Maplewood Shale is a suitable candidate for representing the illite-fraction in the modeled illite shale.
In fact, since the silt fraction of Maplewood Shale is dominantly quartz only crushing of rock
fragments and subsequent powder mixing is required to eliminate microstructural and chemical
heterogeneities.
Argiletz shale:
With Argiletz shale, which is available as powder, a chemical treatment and probable
subsequent clay filtering are required to eliminate carbonates. The bulk rock composition and XRD
analysis further hint at relatively low clay and mica content (Fig. 5.4B and 5.5). For these reasons,
Argiletz shale was found less suitable as source for illite clay than Maplewood Shale.

106
Silver Hill shale:
Silver Hill shale is dissimilar in mineral and major element composition to Maplewood Shale.
Higher Al2O3 and K2O, but lower SiO2 concentrations (Fig. 5.5) as well as the XRD spectrum (Fig.
5.4C) suggest higher phyllosilicate and lower quartz content. Carbonates are also absent. As for
Maplewood Shale, other non-silicate impurities in Silver Hill shale can be ignored. The reason that
Maplewood Shale was preferred to Silver Hill shale is based primarily on grain size distribution (Fig.
5.6). The clay content is much lower and the dominant grain size much coarser than for Maplewood
Shale. The fact that sieving affects grain size distribution in Silver Hill shale suggests that clay
flocculation did not occur, reflecting higher mica content and smaller amount of clay compared with
Maplewood Shale.
5.8: Geological setting of Maplewood Shale
Stratigraphy:
Maplewood Shale is an Early Silurian (Llandoverian, ~ 430 Ma) green shale unit in the
Northern Central Appalachian Basin, exposed in Western New York State (Fig. 2.2). In Rochester
(NY), the Genesee river gorge provided Maplewood Shale exposure of 7 m thickness [Chadwick,
1918]. Together with the Neagha Shale that outcrops northeast of Buffalo (NY) and Webster
conglomerate Bed that outcrops east of Rochester (NY), Maplewood Shale forms the base of the
Lower Clinton Group (Fig. 2.3). The westward thinning Lower Clinton Group unconformably
overlies the Medina Group clastic wedge shales and sandstones and represents a tectonically
controlled fluctuating eastward transgression across the basin. The onset of a transgression cycle is
marked by hematitic, phosphatic beds: 1) Densmore Creek beds and Webster conglomerates at the
Medina-Lower Clinton contact [LoDuca and Brett, 1994; Brett et al., 1990] and 2) Budd Road
Phosphate Bed (or Furnaceville Member) of the Reynales Limestone Formation that overlies
Maplewood Shale [LoDuca and Brett, 1994; Brett et al., 1995]. Regional relative sea-level fluctuation
is expressed also by repetition of lithologies (e.g. shales of the Bear Creek and Sodus Formation, and
limestones of the Wolcott Formation as well as coarser clastic wedge deposits of the Sauquoit
Formation (Fig. 2.2). A widespread, angular unconformity attributed to global sea level low defines
the contact with the overlying Upper Clinton group [Johnson et al., 1985].
Structures:
Deformation structures are scarce throughout most of the Paleozoic sediments in the Northern
Appalachian Basin. The Ordovician and Silurian sediments form a gently southward dipping sequence
of weakly deformed rocks, exposing underlying rocks. Deformation is manifested in residual elastic

107
strain, elastic anisotropy, mechanical twinning and cleavage formation associated with pressure
solution [Engelder, 1979]. Minor folds and stylolites have been identified in the Onondaga Formation
in the eastern margin of the geological map of figure 2.2 [Groshong, 1975]. 30-40 km west of
Rochester (NY), in Silurian and Late Ordovician sediments, the Clarendon-Lindin fault system forms
a N-S striking monocline with 3° dip to the west [Engelder, 1979]. Systematic deformation structures
are found more to the south in Middle to Late Devonian sediments, and form the outermost major
folds of the Appalachian fold and thrust belt [Engelder, 1979].

108
109
Chapter 6
Chemical model
________________________________________________________________
The fiction character Kelvin R. Throop once said, “Isn’t it interesting that the same people who laugh
at science fiction listen to weather forecasts and economists?”
Preface
This chapter presents a model that describes the equilibrium mineral phase stability at the
experimental conditions for Maplewood Shale. The chapter commences with explaining why such a chemical model is required to understand compaction processes occurring during experiments, and introduces a number of commercially available software packages for numerically simulating mineral
phase stability. The results of the thermodynamic phase equilibrium modeling are discussed in subchapter 6.2. The importance of water content is discussed, ultimately leading to the construction of an xH2O/T diagram in subchapter 6.3. Such a diagram visualizes the water dependency of the modeled equilibrium mineral assemblages. The chapter then discusses in subchapter 6.4 the results of thermogravimetry analysis. Obtained data are used to compare modeled dehydration and dehydroxylation reactions with observed water loss during room pressure heating of sample material. The chapter concludes with a short summary on the findings and conclusions from the performed
petrological analysis.

110
6.1: Phase stability modeling
Illite shale powder is subjected to temperature conditions higher than those marking the
stability field of illite (80 - 200 °C), during compaction stages 2 and 3. Although, the durations of
these stages are hours to days, which is some orders of magnitude shorter than in a natural setting, the
mineral assemblage of the illite shale samples are affected. Chemical equilibrium cannot be assumed,
due to the very short duration of the exposure to elevated temperatures. Chemical models that predict
non-equilibrium mineral assemblages are up to date unavailable. Predictions of mineral reactions
progress were attempted here using equilibrium phase stability modeling. Out of four well-known and
applied software packages, Perple_X [Connolly, 1990], THERMOCALC [Powell and Holland, 1988;
Powell et al., 1998], Theriak-Domino [de Capitani and Brown, 1987; de Capitani and Petrakakis,
2010] and TWQ [Berman, 1991; 2007] Perple_X version 6.5.0 [Connolly, 2009] was ultimately
selected. The choice for Perple_X is explained now. In terms of thermodynamic calculation and input
database, the four thermodynamic calculation packages are principally identical, and resulting
pseudosections are similar. The key advantage of Perple_X over THERMOCALC is the shorter
calculation time and limited required input data. THERMOCALC requires pre-existing knowledge of
expected mineral reactions for backward phase equilibrium modeling. In this study, such knowledge
is missing because the illite shale powder has not experienced metamorphism.
For the Perple_X modeling, the 2002 update of the thermodynamic dataset of Holland and
Powell [1998] was used together with the NCFKMASH system (i.e. Na2O, CaO, FeO/Fe2O3, K2O,
MgO, Al2O3, SiO2 weight percent composition data obtained by XRF analysis (Table 5.1)). Titanium
and manganese were found to have no visible effect on location of phase stability fields in the
modeled pseudosection. Solid solution calculations were calculated for phengite, staurolite, chlorite,
chloritoid, K-feldspar, biotite, garnet and melt. No phases were excluded from thermodynamic
minimum Gibb’s free energy calculations. Input values for major element concentrations are reported
in table 5.1, although for water a value of 5.18 wt. % was used.
6.2: Pseudosection
A simplified pseudosection based on Maplewood Shale composition is shown in figure 6.1.
For purpose of clarity, small fields were merged and reactions that do not involve mica or clay were
omitted. Ultimately, five principal equilibrium stability fields were identified, based chiefly on
phyllosilicate content. The fields, labeled I-V, are dominantly temperature controlled, especially
above 50 MPa. Differing confining pressure between compaction stages 2 and 3a, and 3b thus has
little effect on mineral reactions and stability. Quartz is stable in fields I to IV whereas water is in
excess.
111
Illite, chlorite and phengite are stable in field I bounded at about 350 °C by the disappearance
of illite and introduction of biotite as a stable mineral phase. Based on maximum burial depth
estimates of 5 km for New York Trenton Group carbonates that underlies the Maplewood Shale
[Friedman, 1987], peak equilibrium conditions for illite shale powder before experimental
compaction tests are estimated at 125-145 MPa and 145-180 °C. These conditions plot outside the
pseudosection of figure 6.1, but agree with field I mineral phases. Compaction experiments performed
under the operating conditions of field I are unlikely to trigger clay mineral reactions and will
therefore only activate mechanical compaction.
Chlorite, biotite and phengite are stable in field II whose upper boundary at 450 to 550 °C is
the disappearance of chlorite. Compaction tests of stage 3a as well as stage 3b performed at 500 °C
both plot in this field. Equilibrium phyllosilicate assemblage in HIP2 and a selection of PAT1 (CIP)
samples is expected to be chlorite, biotite and phengite. If in these samples illite is present or
authigenic biotite absent, then equilibrium was not achieved.
Biotite and phengite are stable in field III, which includes the operating conditions of
compaction stage 2 (HIP1 samples) and 650 °C compaction stage 3b tests (some PAT1 CIP samples).
No chlorite or illite is thus expected in equilibrium mineral assemblage of these samples. The
phengite dehydroxylation reaction (phengite + quartz K-feldspar + Al-silicate + H2O) marks the
boundary between field III and IV.
Stable mineral phases in Field IV are the reaction products of the phengite dehydroxylation
reaction and biotite. 700 °C experiments in compaction stage 3b are performed at operating conditions
of field IV. Equilibrium mineral assemblages in associated PAT1 (CIPT) samples contain only K-
feldspar, an aluminosilicate (most probably sillimanite), and biotite. The presence of phengite,
chlorite or illite, or absence of authigenic feldspar and sillimanite indicates non-equilibrium mineral
assemblages. The transition from field IV to V is the wet-solidus.
In field V, partial melt is generated at the expense of quartz, biotite and water. Sillimanite also
contributes to melt at higher temperature. Absence of melt (glass after quenching) is indicative for
non-equilibrium, as is the occurrence of phengite, biotite, quartz, chlorite, or illite.
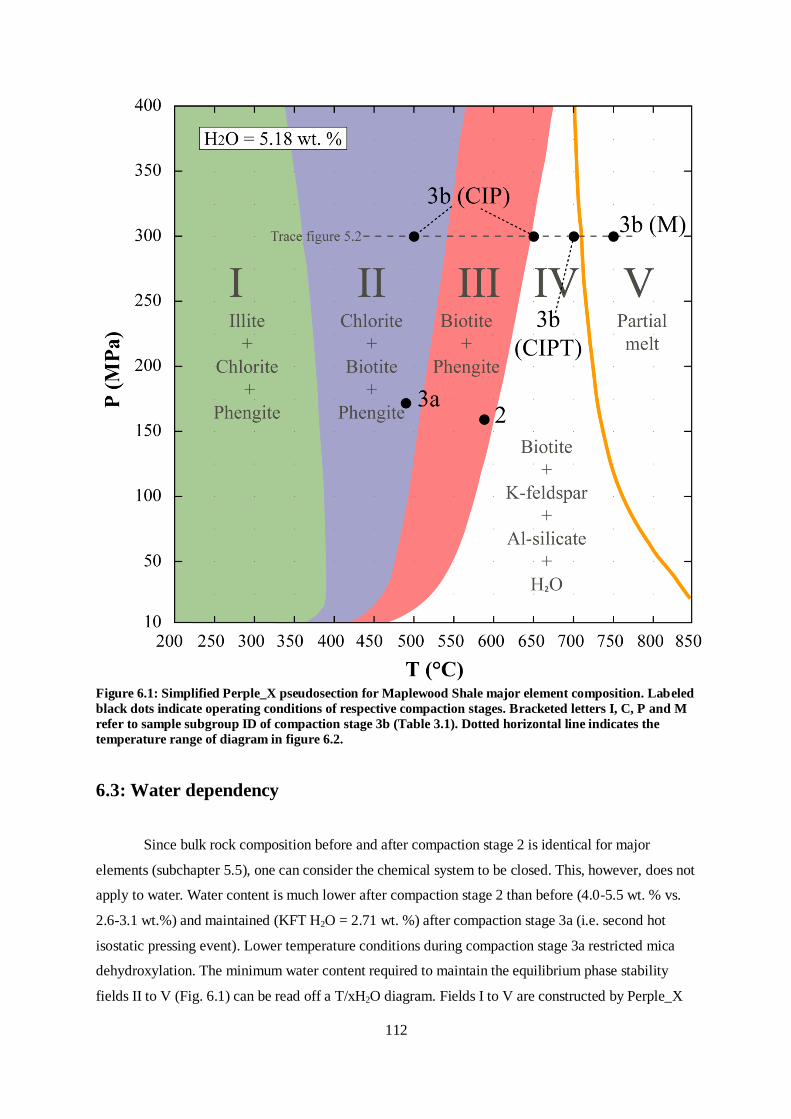
112
Figure 6.1: Simplified Perple_X pseudosection for Maplewood Shale major element composition. Labeled
black dots indicate operating conditions of respective compaction stages. Bracketed letters I, C, P and M
refer to sample subgroup ID of compaction stage 3b (Table 3.1). Dotted horizontal line indicates the
temperature range of diagram in figure 6.2.
6.3: Water dependency
Since bulk rock composition before and after compaction stage 2 is identical for major
elements (subchapter 5.5), one can consider the chemical system to be closed. This, however, does not
apply to water. Water content is much lower after compaction stage 2 than before (4.0-5.5 wt. % vs.
2.6-3.1 wt.%) and maintained (KFT H2O = 2.71 wt. %) after compaction stage 3a (i.e. second hot
isostatic pressing event). Lower temperature conditions during compaction stage 3a restricted mica
dehydroxylation. The minimum water content required to maintain the equilibrium phase stability
fields II to V (Fig. 6.1) can be read off a T/xH2O diagram. Fields I to V are constructed by Perple_X
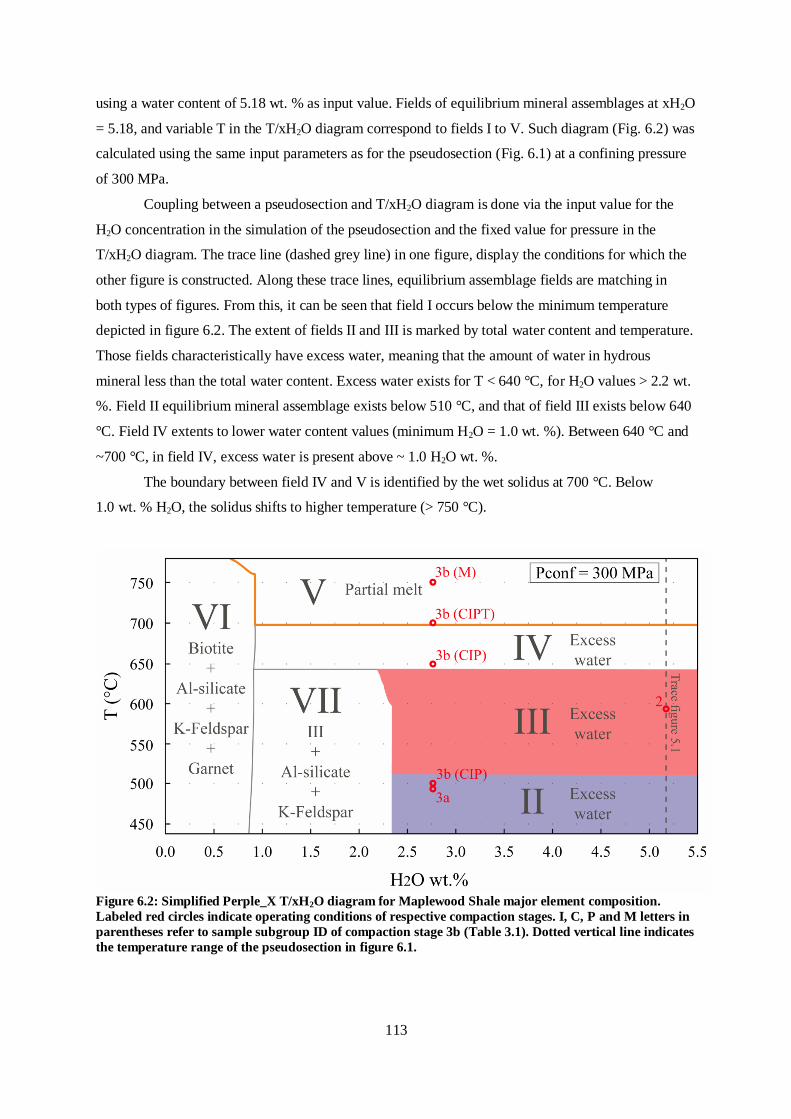
113
using a water content of 5.18 wt. % as input value. Fields of equilibrium mineral assemblages at xH2O
= 5.18, and variable T in the T/xH2O diagram correspond to fields I to V. Such diagram (Fig. 6.2) was
calculated using the same input parameters as for the pseudosection (Fig. 6.1) at a confining pressure
of 300 MPa.
Coupling between a pseudosection and T/xH2O diagram is done via the input value for the
H2O concentration in the simulation of the pseudosection and the fixed value for pressure in the
T/xH2O diagram. The trace line (dashed grey line) in one figure, display the conditions for which the
other figure is constructed. Along these trace lines, equilibrium assemblage fields are matching in
both types of figures. From this, it can be seen that field I occurs below the minimum temperature
depicted in figure 6.2. The extent of fields II and III is marked by total water content and temperature.
Those fields characteristically have excess water, meaning that the amount of water in hydrous
mineral less than the total water content. Excess water exists for T < 640 °C, for H2O values > 2.2 wt.
%. Field II equilibrium mineral assemblage exists below 510 °C, and that of field III exists below 640
°C. Field IV extents to lower water content values (minimum H2O = 1.0 wt. %). Between 640 °C and
~700 °C, in field IV, excess water is present above ~ 1.0 H2O wt. %.
The boundary between field IV and V is identified by the wet solidus at 700 °C. Below
1.0 wt. % H2O, the solidus shifts to higher temperature (> 750 °C).
Figure 6.2: Simplified Perple_X T/xH2O diagram for Maplewood Shale major element composition.
Labeled red circles indicate operating conditions of respective compaction stages. I, C, P and M letters in
parentheses refer to sample subgroup ID of compaction stage 3b (Table 3.1). Dotted vertical line indicates
the temperature range of the pseudosection in figure 6.1.

114
Besides fields I to V, two additional fields are identified, at low H2O values (< 2.2-2.3 wt. %).
Field VI exists below 0.9-1.0 wt. % H2O. Total water content is too low to maintain phengite as a
stable phase. Instead, the mineral assemblage in equilibrium consists of biotite, an aluminosilicate
(andalusite or sillimanite), K-feldspar and garnet. At higher water contents, between 0.9 and
2.3 wt. % H2O but below 650 °C, field VII accepts the stable mineral assemblage of biotite, phengite,
andalusite or sillimanite and K-feldspar; quartz is also stable in this field. Water in fields VI and VII is
incorporated in the phyllosilicates; no excess free water exists.
It is important to note that water loss during compaction stage 2 has no consequence for
mineral stability. During compaction stage 3, water loss is most crucial for experiments performed at
temperature < 650 °C, as the transition from field II and III to field VII occurs at H2O wt. % of 2.3.
However, since phyllosilicates dehydroxylated to 590 °C during compaction stage 2, subsequent
heating below that temperature yields no further dehydroxylation. Dehydroxylation is expected for
compaction stage 3b experiments (temperature ≥ 650 °C). But the transition from field IV and V to VI
occurs at much lower water content (1.0 wt. H2O). Hence there is a substantial margin until
equilibrium mineral assemblages move outside the pseudosection of figure 6.1.
6.4: Dehydration and dehydroxylation
Thermogravimetry (TGA) analysis of illite shale powder before compaction stage 1 and after
compaction stage 2 are presented in figure 6.3. Data from NAT (P) TGA shows the anticipated
smectite dehydration at low temperatures (50-150 °C), as well as illite and phengite dehydroxylation
at intermediate temperature (450-750 °C). The TGA curve for HIP1 indicates the onset of
dehydroxylation at 550 °C, which is complete by 1000 °C. For reference, mineral characteristic
curves for illite, Clay Mineral Society illite specimen from Silver Hill, Montana by Earnest [1991],
and muscovite by Mariani et al. [2006] were added. Considering only the dehydration and
dehydroxylation behavior, NAT (P) best compares with Silver Hill-illite. The higher water content of
Silver Hill-illite is explained by its larger smectite and illite fraction than in Maplewood Shale. The
onset of dehydroxylation in HIP1 is thus comparable with that of muscovite. Prolonged
dehydroxylation until 1000 °C is more compatible with Silver Hill-illite, indicating the presence of
illite in HIP1 samples. Different TGA behavior for NAT (P) and HIP1 is explained by complete
smectite to illite transformation and partial illite to phengite transformation during hot isostatic
pressing in compaction stage 2.
The thermogravimetry analysis is also a test for the accuracy of the pseudosection. For
correlation between TG curves (Fig. 6.3) and the pseudosection mineral assemblage fields (Fig. 6.1),
pressure sensitivity of phyllosilicate reactions at low pressure should be taken into consideration.
Equilibrium mineral assemblage fields I to III in the pseudosection are predominantly temperature

115
controlled, except at low pressure. With pressure below 50 MPa, boundaries for fields I to III shift to
lower temperatures. Field I is barely affected; its boundary is situated at ~ 370 °C at 10 MPa. The
transition from field II to III at 10 MPa occurs at ~ 420 °C, instead of > 500 °C at P = 300 MPa. The
phengite dehydroxylation boundary of field III is most pressure sensitive. At 10 MPa, field III is
bounded at ~ 470 °C. The wet solidus shows opposite behavior. The boundary from field IV to V
shifts to higher temperature at low pressure (> 850 °C at 10 MPa).
Correlation between TGA and mineral reactions is best performed using the phengite
dehydroxylation reaction. This marks the boundary between fields III and IV and is identified in the
TGA curve for NAT (P) at 450-500 °C. This temperature range coincides with the boundary between
fields III and IV in the pseudosection at low pressure. On the other hand, onset of the phengite
dehydroxylation reaction for HIP1 samples is identified in the TGA curve at 550 °C. When
extrapolated from 170 to 300 MPa this reaction is expected between 650 and 700 °C. The Perple_X
pseudosection (Fig. 6.1) is most accurate for compaction stage 2 modeling of mineral assemblages.
Despite closed system chemistry and water loss without chemical consequences, the pseudosection is
less accurate for compaction stage 3 tests, as at least the phengite dehydroxylation reactions seems to
occur at 50-100 °C higher temperature.
Figure 6.3: Thermogravimetry curves for illite shale powder before compaction stage 1 (NAT (P)) and
after compaction stage 2 (HIP1). Blue and red areas denote NAT (P) and HIP1 dehydration, respectively.
For comparison, mineral characteristic TG curves for illite and muscovite were added.
6.5: Summary
In summary, the chemical model, as visualized by a pseudosection, xH2O/T diagram, and
TGA curves constrains the uncertainties associated with compaction tests performed at pelite
disequilibrium experimental conditions. The pseudosections identified five fields of equilibrium

116
mineral assemblages. Field I represents the illite shale stability. Other fields are addressed in one or
more compaction stages. As the targeted mineral assemblages are known for each experiment, the
progress of mineral reactions towards equilibrium can be monitored. Mica dehydration and
dehydroxylation affects the position of the fields. So caution is required when water content decreases
below threshold values and one of two additional fields, characterized by the absent or low amount of
hydrous minerals, is addressed instead. TGA curves provided information on the actual water loss
expected with heating. However, KFT H2O measurements will be pivotal to verify precisely which
field of equilibrium mineral assemblages was in fact addressed during notably compaction stage 3b
tests.
117
Chapter 7
Results
________________________________________________________________
Harry S. Truman once said, “It is amazing what you can accomplish if you do not care who gets the
credit.”
Preface
This chapter presents the products of the experimental high temperature and pressure
compaction of illite shale powder and the mechanical and rheological data from compaction stage 3b tests in the Paterson apparatus. The synthetic metapelites are characterized by porosity, bulk density and strain behavior (subchapter 7.1), which provided important information for the quantification and understanding of compaction mechanisms. Two sample subsets are identified based on density development. Strain was found to be primarily accommodated by porosity reduction, with
temperature playing a key role in the amount of compaction. Mechanical data represent the sample strength evolution with strain (subchapter 7.2). In 500 °C, 650 °C and some 700 °C tests, samples experienced rapid hardening, without reaching steady state flow, whereas at higher temperatures steady state flow is achieved. Rheological data obtained during steady state flow is then used to characterize the flow (subchapter 7.2).
Chemical changes during compaction are monitored using XRD analysis and water content measurements based on KFT analysis (subchapter 7.3). Phengite crystallinity enhanced and biotite
content grew at the expense of the clay minerals originally present in the illite shale powder. Furthermore, water loss is used to compare and contrast the modeled mineral assemblage fields during the compaction stages (subchapter 7.3). High-magnification SEM BSE and SE images were used to visualize the development of mineral content, microstructure and pores, confirming the findings from XRD analysis (subchapter 7.4). Microstructures revealed that porous domains are illite-rich and display no foliation, whereas crystalline domains are illite-poor and exhibit a strong foliation (subchapter 7.5). Also, quartz grains were found to be affected by compaction and authigenic grains were formed. A new generic pore-type, associated with fractured quartz grains, is identified
(subchapter 7.6); clay micropores are identified as the principal pore type that accommodates compaction.

118
7.1: Porosity and density
Two of the most fundamental and basic rock parameters are porosity and bulk density. The
properties of argillaceous sediments, such as those of interest, are likewise related to porosity and bulk
density [e.g. Rieke and Chilingarian, 1974; Vasseur et al., 1995; Mondol et al., 2007]. In general,
natural shales and mudstones with porosity < 15 % exhibit evidence for illitization of smectite and
silica cementation and/or texture enhancement [e.g. Kim et al., 1999; Aplin et al., 2003; 2006; Worden
et al., 2005; Peltonen et al., 2009; Thyberg et al., 2010; Day-Stirrat et al., 2010]. Porosity and bulk
density are parameters controlling the dominant mode of compaction in compaction stages 2 and 3. In
addition, the effect of stress field on compaction processes is potentially expressed by density
development, through the consideration of the effect of different mineral reactions or reaction rates.
The two- and three-stage compaction of illite shale powder resulted in lithified aggregates
with connected porosity ranging from 1 to 17 % and bulk density ranging from 2.35 g cm-3 to
2.69 g cm-3 (Fig. 7.1AB and Appendices C-D). Based on the density-porosity data two sample subsets
can be identified (Fig. 7.1A). The synthetic metapelites in both subsets represent a linear density
increase with porosity reduction. Assuming all porosity is connected, extrapolation of the best fit
curves for the subsets to zero porosity gives the average grain density. For subsets 1 and 2 grain
density is estimated at 2.73 g cm-3 and 2.63 g cm-3, respectively. Each of two Maplewood Shale
measurements fit with one subset (Fig. 7.1A).
Repetition of hot isostatic pressing (HIP2) and Paterson apparatus tests (PAT1) reduced
porosity to the measured minimum value of ~ 1 %, corresponding to maximum bulk density of
2.69 g cm-3 (Fig. 7.1B). Subset 2 is mostly comprised of HIP2 samples (Fig. 7.1AB). PAT1 (C)
and (I) exhibit comparable trends, in which other PAT1 samples also plot. To a degree, the trend from
PAT1 samples overlaps with HIP1 samples, but is denser than HIP2 samples (Fig. 7.1B). A small
number of PAT1 samples are noticeably more porous than HIP1 samples, but have similar density
(Fig. 7.1B).
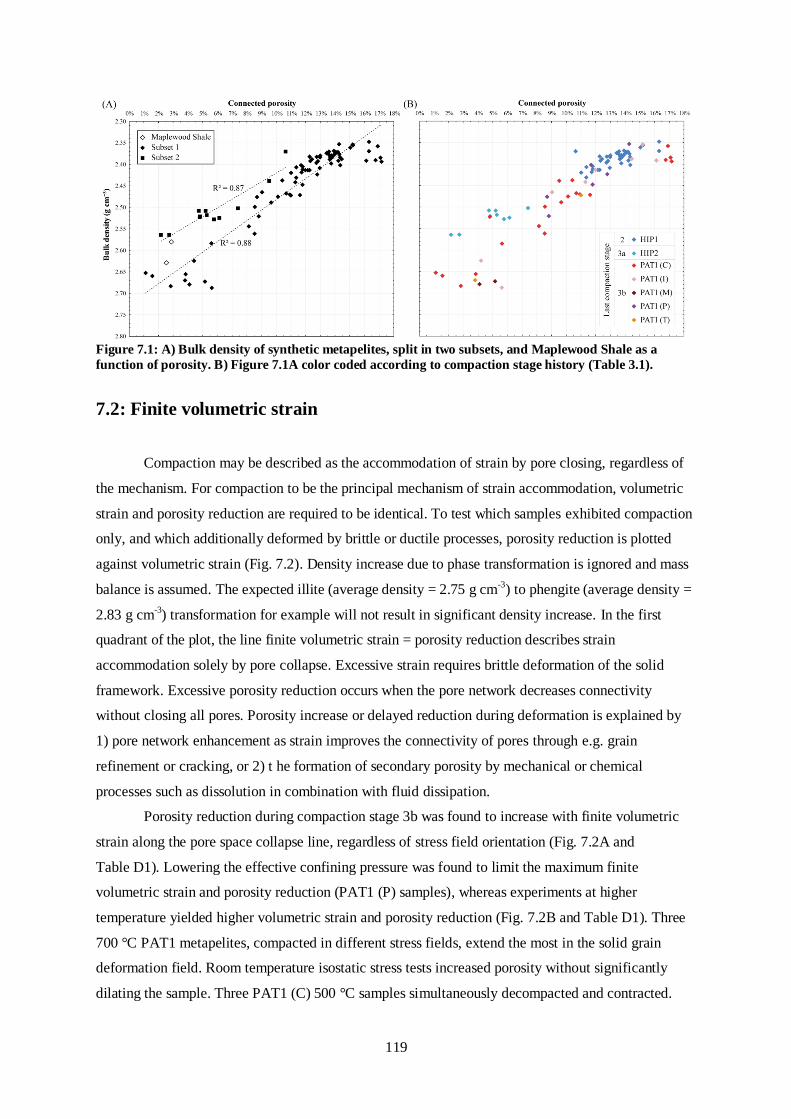
119
Figure 7.1: A) Bulk density of synthetic metapelites, split in two subsets, and Maplewood Shale as a
function of porosity. B) Figure 7.1A color coded according to compaction stage history (Table 3.1).
7.2: Finite volumetric strain
Compaction may be described as the accommodation of strain by pore closing, regardless of
the mechanism. For compaction to be the principal mechanism of strain accommodation, volumetric
strain and porosity reduction are required to be identical. To test which samples exhibited compaction
only, and which additionally deformed by brittle or ductile processes, porosity reduction is plotted
against volumetric strain (Fig. 7.2). Density increase due to phase transformation is ignored and mass
balance is assumed. The expected illite (average density = 2.75 g cm-3) to phengite (average density =
2.83 g cm-3) transformation for example will not result in significant density increase. In the first
quadrant of the plot, the line finite volumetric strain = porosity reduction describes strain
accommodation solely by pore collapse. Excessive strain requires brittle deformation of the solid
framework. Excessive porosity reduction occurs when the pore network decreases connectivity
without closing all pores. Porosity increase or delayed reduction during deformation is explained by
1) pore network enhancement as strain improves the connectivity of pores through e.g. grain
refinement or cracking, or 2) t he formation of secondary porosity by mechanical or chemical
processes such as dissolution in combination with fluid dissipation.
Porosity reduction during compaction stage 3b was found to increase with finite volumetric
strain along the pore space collapse line, regardless of stress field orientation (Fig. 7.2A and
Table D1). Lowering the effective confining pressure was found to limit the maximum finite
volumetric strain and porosity reduction (PAT1 (P) samples), whereas experiments at higher
temperature yielded higher volumetric strain and porosity reduction (Fig. 7.2B and Table D1). Three
700 °C PAT1 metapelites, compacted in different stress fields, extend the most in the solid grain
deformation field. Room temperature isostatic stress tests increased porosity without significantly
dilating the sample. Three PAT1 (C) 500 °C samples simultaneously decompacted and contracted.

120
Figure 7.2: Porosity reduction plotted against finite volumetric strain for PAT1 samples, color coded
according to A) compaction stage history (Table 3.1) or B) temperature. Both horizontal and vertical
error bars (estimated in both cases at 0.2-3 %) are comparable in size with the data point symbols.
7.3: Finite sample deformation
Further compaction of porous synthetic metapelites (HIP1) in the Paterson apparatus is
achieved by applying deformation in different stress regimes and under varying pressure and
temperature conditions. The permanent deformation of the sample is described by finite axial (εax) and
radial axial (εrd) strain. In an εax/εrd diagram (Fig. 7.3), fields and lines define characteristic strain
modes such as simple flattening, uniform and non-uniform contraction, pure shear and uniaxial strain.
In the field of non-uniform contraction (including the uniform contraction line) the volumetric strain
is seen to be contractive. The field of simple flattening is separated in a contractive (upper) and
dilative (lower) part by the line for pure shear (no volume change).
Plotting εax and εrd for PAT1 samples gives insight in the strain development during the
compaction tests. Within a sample group and for each unique temperature, εax-εrd data points describe
a sample deformation path. When finite and total axial strain compare, these paths may be coupled to
sample strength development during confined compression tests. Using this method, nearly all PAT1
samples plot between the lines for pure shear and uniform contraction (Fig. 7.3A). In fact, most
metapelites experienced biaxial strain, so that volumetric strain and axial strain are not necessarily
related. PAT1 (I) and PAT1 (T) samples plot nearest to the uniform dilation line (Fig. 7.3A).
Scattering between non-uniform contraction and pure shear occurs for PAT1 (P) and PAT1 (C)
samples. Nearly half of the PAT1 (C) samples show an overall uniaxial straining, whereas both
PAT1 (M) samples exhibit simple flattening.
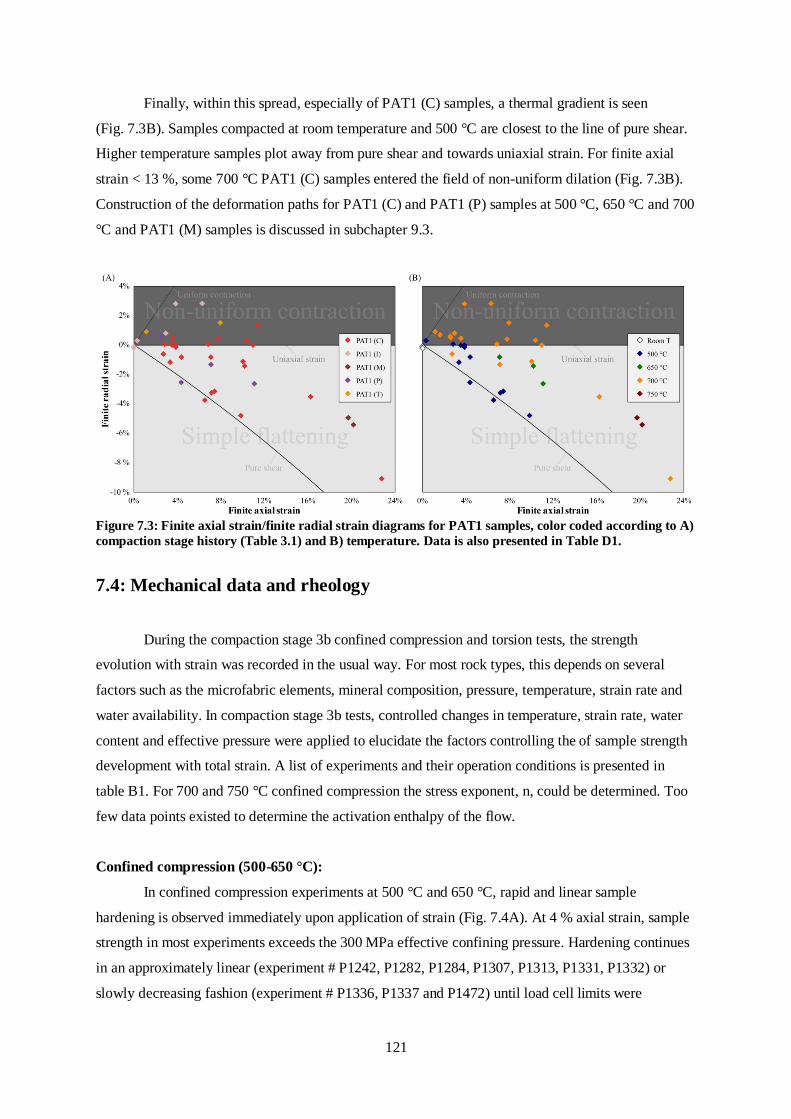
121
Finally, within this spread, especially of PAT1 (C) samples, a thermal gradient is seen
(Fig. 7.3B). Samples compacted at room temperature and 500 °C are closest to the line of pure shear.
Higher temperature samples plot away from pure shear and towards uniaxial strain. For finite axial
strain < 13 %, some 700 °C PAT1 (C) samples entered the field of non-uniform dilation (Fig. 7.3B).
Construction of the deformation paths for PAT1 (C) and PAT1 (P) samples at 500 °C, 650 °C and 700
°C and PAT1 (M) samples is discussed in subchapter 9.3.
Figure 7.3: Finite axial strain/finite radial strain diagrams for PAT1 samples, color coded according to A)
compaction stage history (Table 3.1) and B) temperature. Data is also presented in Table D1.
7.4: Mechanical data and rheology
During the compaction stage 3b confined compression and torsion tests, the strength
evolution with strain was recorded in the usual way. For most rock types, this depends on several
factors such as the microfabric elements, mineral composition, pressure, temperature, strain rate and
water availability. In compaction stage 3b tests, controlled changes in temperature, strain rate, water
content and effective pressure were applied to elucidate the factors controlling the of sample strength
development with total strain. A list of experiments and their operation conditions is presented in
table B1. For 700 and 750 °C confined compression the stress exponent, n, could be determined. Too
few data points existed to determine the activation enthalpy of the flow.
Confined compression (500-650 °C):
In confined compression experiments at 500 °C and 650 °C, rapid and linear sample
hardening is observed immediately upon application of strain (Fig. 7.4A). At 4 % axial strain, sample
strength in most experiments exceeds the 300 MPa effective confining pressure. Hardening continues
in an approximately linear (experiment # P1242, P1282, P1284, P1307, P1313, P1331, P1332) or
slowly decreasing fashion (experiment # P1336, P1337 and P1472) until load cell limits were
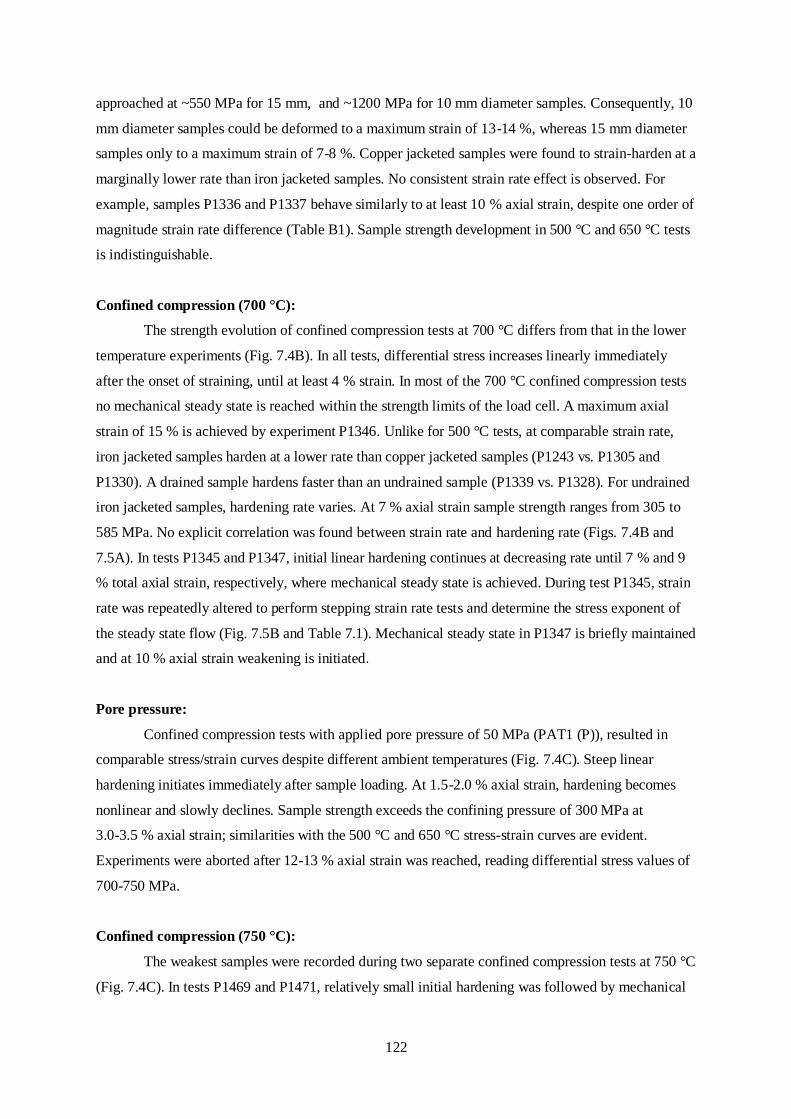
122
approached at ~550 MPa for 15 mm, and ~1200 MPa for 10 mm diameter samples. Consequently, 10
mm diameter samples could be deformed to a maximum strain of 13-14 %, whereas 15 mm diameter
samples only to a maximum strain of 7-8 %. Copper jacketed samples were found to strain-harden at a
marginally lower rate than iron jacketed samples. No consistent strain rate effect is observed. For
example, samples P1336 and P1337 behave similarly to at least 10 % axial strain, despite one order of
magnitude strain rate difference (Table B1). Sample strength development in 500 °C and 650 °C tests
is indistinguishable.
Confined compression (700 °C):
The strength evolution of confined compression tests at 700 °C differs from that in the lower
temperature experiments (Fig. 7.4B). In all tests, differential stress increases linearly immediately
after the onset of straining, until at least 4 % strain. In most of the 700 °C confined compression tests
no mechanical steady state is reached within the strength limits of the load cell. A maximum axial
strain of 15 % is achieved by experiment P1346. Unlike for 500 °C tests, at comparable strain rate,
iron jacketed samples harden at a lower rate than copper jacketed samples (P1243 vs. P1305 and
P1330). A drained sample hardens faster than an undrained sample (P1339 vs. P1328). For undrained
iron jacketed samples, hardening rate varies. At 7 % axial strain sample strength ranges from 305 to
585 MPa. No explicit correlation was found between strain rate and hardening rate (Figs. 7.4B and
7.5A). In tests P1345 and P1347, initial linear hardening continues at decreasing rate until 7 % and 9
% total axial strain, respectively, where mechanical steady state is achieved. During test P1345, strain
rate was repeatedly altered to perform stepping strain rate tests and determine the stress exponent of
the steady state flow (Fig. 7.5B and Table 7.1). Mechanical steady state in P1347 is briefly maintained
and at 10 % axial strain weakening is initiated.
Pore pressure:
Confined compression tests with applied pore pressure of 50 MPa (PAT1 (P)), resulted in
comparable stress/strain curves despite different ambient temperatures (Fig. 7.4C). Steep linear
hardening initiates immediately after sample loading. At 1.5-2.0 % axial strain, hardening becomes
nonlinear and slowly declines. Sample strength exceeds the confining pressure of 300 MPa at
3.0-3.5 % axial strain; similarities with the 500 °C and 650 °C stress-strain curves are evident.
Experiments were aborted after 12-13 % axial strain was reached, reading differential stress values of
700-750 MPa.
Confined compression (750 °C):
The weakest samples were recorded during two separate confined compression tests at 750 °C
(Fig. 7.4C). In tests P1469 and P1471, relatively small initial hardening was followed by mechanical

123
steady state flow at 2.5 % and ~4 % axial strain respectively. To determine the stress exponent of the
flow, steady state stress levels were recorded at different strain rates (Fig. 7.5C and Table 3.1).
Figure 7.4: Stress/strain curves for compaction stage 3b tests. Colors of the curves represent strain rate.
A) Confined compression tests performed at 500 °C and 650 °C. B) Confined compression tests
performed at 700 °C. C) Confined compression tests performed at 750 °C and 500 to 650 confined
compression with pore pressure tests. D Confined torsion tests performed at 700 °C.

124
Figure 7.5: Logarithm plots of stress versus strain rate showing strain rate dependency of sample
strength, measured A) at 7 % axial strain for hardening samples, and B-C) at mechanical steady state in
B) 700 °C and C) 750 °C confined compression tests. The linear correlations found in B and C, are
evaluated with the coefficient of determination (R2).
TABLE 7.1. STRESS EXPONENT DATA FROM STEPPING STRAIN RATE TESTS
Experiment Group Temperature Stress exponent number of data points R2
P1345 PAT1 (C) 700 °C 1.2 7 0.68
P1469 PAT1 (M) 750 °C 2.0 3 -
P1471 PAT1 (M) 750 °C 1.7 5 0.97
Confined torsion (700 °C):
Nearly linear hardening is different for confined torsion tests, P1211, P1212 and P1216
(Fig. 7.4D). Constant sample strength commences for P1211 at γ = 0.05 and continues until γ ≈ 0.07.
Steady hardening follows, until peak strength is reached at γ = 0.12 where weakening initiates. At γ =
0.16, the confining pressure and shear stress suddenly decreased, indicating sample slip and jacket
failure. No strain was visible on the jacket strain markers. Slip occurred along assembly spacers and
pistons (Fig. 7.6). In the case of experiment P1212, steady state was reached at γ = 0.10, but slipped
immediately after without rupturing the assembly jacket and continued with resistant slip along
assembly interfaces. During test P1216 the re-jacketed P1212 sample deformed by a further γ = 0.08
before failure occurred and resistant slip was subsequently recorded (Figs. 7.4D and 7.6). No jacket
failure occurred. Due to repeated slip along assembly interfaces at relatively low strain, no more
confined torsion tests were attempted.

125
Figure 7.6: Assembly pictures showing the copper jacket strain markers after confined torsion tests. Red
circles indicate slip along assembly spacer and piston interfaces. Yellow dotted lines highlight the strain
markers used to determine the shear angle.
7.5: Chemistry
Mineral composition of synthetic metapelites is in non-equilibrium during compaction stage 2
and 3 (Chapter 5). The progress of activated mineral reactions transforming illite assemblages to
targeted equilibrium metapelitic assemblages was monitored by XRD analysis. Mineral identification
is essential for evaluating the compaction processes that created the synthetic metapelites. In
particular, water content of samples after compaction stage 3b was measured to verify whether or not
reactions towards stability fields VI and VII (Fig. 5.2) were activated.
XRD spectra:
XRD spectra from all synthetic metapelite groups show a transformation of the original illite
assemblage (NAT) into a more crystalline phengite, biotite and quartz dominated assemblage
(Fig. 7.7). The synthetic metapelites show no characteristic peaks for clinochlore basal (001) and
(002) planes, smectite basal (001) and apatite (144) and (414) planes anymore. Instead, sharp peaks
associated with the phengite (114) planes and biotite (020) and (110), and (131) and ( 02) planes are
observed. Additionally, copper jacketed samples yield copper oxide peaks at 2θ = 43.4° (Fig. 7.7),
indicating some jacket contamination. Other peaks in the metapelite spectra are comparable with
Maplewood Shale and represent quartz and detrital phyllosilicates. Overall, a variation in peak height
associated with mica and quartz crystal planes is observed. Noticeable compositional heterogeneities
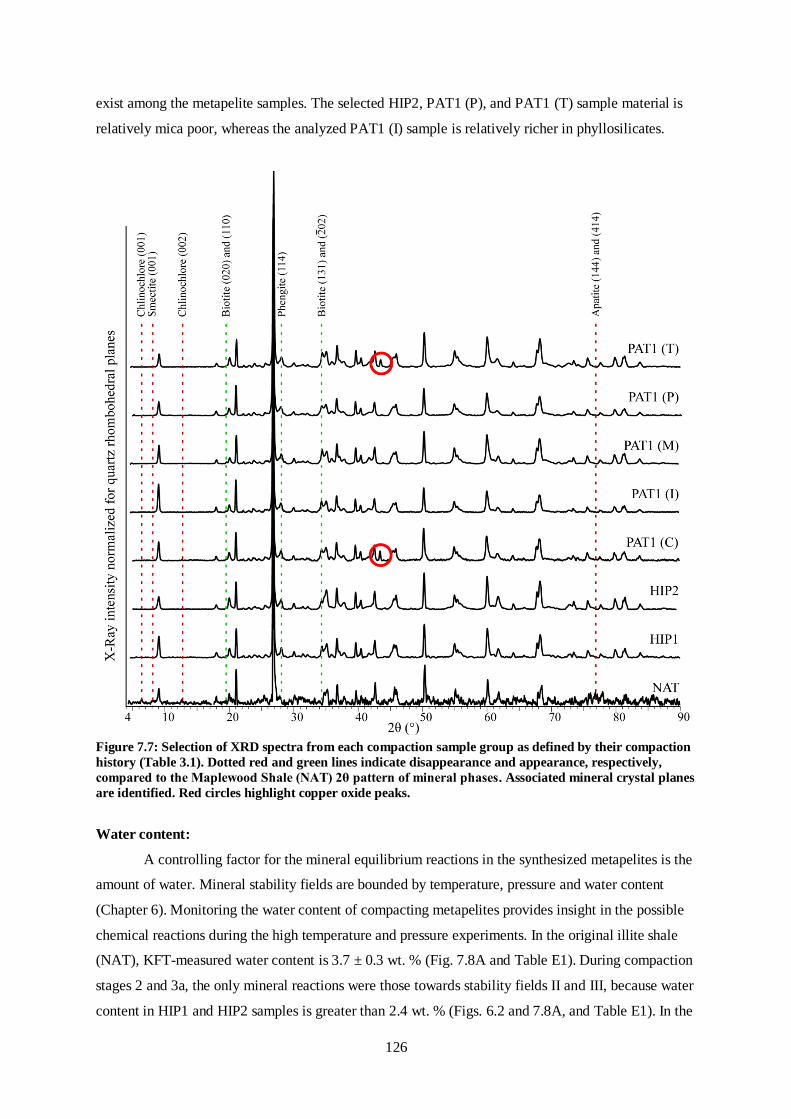
126
exist among the metapelite samples. The selected HIP2, PAT1 (P), and PAT1 (T) sample material is
relatively mica poor, whereas the analyzed PAT1 (I) sample is relatively richer in phyllosilicates.
Figure 7.7: Selection of XRD spectra from each compaction sample group as defined by their compaction
history (Table 3.1). Dotted red and green lines indicate disappearance and appearance, respectively,
compared to the Maplewood Shale (NAT) 2θ pattern of mineral phases. Associated mineral crystal planes
are identified. Red circles highlight copper oxide peaks.
Water content:
A controlling factor for the mineral equilibrium reactions in the synthesized metapelites is the
amount of water. Mineral stability fields are bounded by temperature, pressure and water content
(Chapter 6). Monitoring the water content of compacting metapelites provides insight in the possible
chemical reactions during the high temperature and pressure experiments. In the original illite shale
(NAT), KFT-measured water content is 3.7 ± 0.3 wt. % (Fig. 7.8A and Table E1). During compaction
stages 2 and 3a, the only mineral reactions were those towards stability fields II and III, because water
content in HIP1 and HIP2 samples is greater than 2.4 wt. % (Figs. 6.2 and 7.8A, and Table E1). In the
127
Paterson apparatus experiments, synthetic metapelites experienced various water loss (0.6-2.9
remaining H2O wt. %) (Table E1 and Fig. 7.8A-B).
Figure 7.8: A) Column graph showing KFT water content data for synthetic metapelites and Maplewood
Shale (summary of Table E1). B) Water content as a function of compaction stage 3b duration. Labels are
differentiated according to experiment operating parameters temperature, drainage system and stress
regime.
Temperature, drainage conditions and duration are controlling parameters (Fig. 7.8B). The
water content of half of the 500 °C PAT1 metapelites lowered below the boundary of stability fields II
and VII at 2.4 wt. % (Figs. 6.2 and 7.8B, and Table E1). For 650 °C, 700 °C and 750 °C PAT1
samples, the boundary between mineral stability fields IV and V, and field VI occurs at
1.0 H2O wt. %. All of these samples, except for the drained 700 °C PAT1 (C) sample, have higher
water content (Figs. 6.2 and 7.8B, and Table E1). No reaction that would produce field VI minerals is
therefore expected for these samples.
7.6: SEM mineral phase characterization
As an alternative to XRD analysis, BSE images of polished surfaces permits the identification
of mineral phases. Contrary to XRD, authigenic minerals can be distinguished from detrital minerals,
and low-volume-percentage phases are visualized in BSE images. These advantages allow easier
distinction between compaction by isostatic stress and by differential stress. Synthetic metapelites are
divided into three porosity groups: 1) high porosity (φ > 10 %), 2) intermediate porosity (φ = 5-10 %)
and 3) low porosity (φ < 5 %).
Isostatic compaction:
In high porosity metapelites, the primary mineral phases are detrital illite (Ill), detrital quartz
(dQ), and transition illite-phengite material (I/Ph) (Fig. 7.9A). Illite occurs as submicron flaky

128
minerals whereas quartz grains are silty and have angular grain boundaries. The transitional illite-
phengite material is characterized by diffusive compositional variation and poorly developed grain
boundaries.
In low porosity metapelites, the main phases are quartz, phengite and biotite (Fig. 7.9C).
Quartz is present as silty detrital and clayey authigenic grains. Authigenic grains (aQ) are not only
finer, but also more elongated and rounded than detrital grains. Detrital micas are silty flakes, whereas
both authigenic phengite (aPh) and biotite (aBt) are clayey flakes. Transitional illite-phengite material
is also present, albeit in lower quantity than in higher porosity metapelites (Fig. 7.9C).
Intermediate porosity metapelites contain domains of relatively high and low porosity
(Fig. 7.9D). In porous domains, illite is preserved in flocculated clusters. In compacted domains,
nearly all illite is replaced by phengite and biotite. Both angular detrital and rounded authigenic quartz
are recognized. The boundary between these domains is sharp (Fig. 7.9D).
Deformation-induced compaction:
Compaction by confined compression or torsion was performed on samples that previously
experienced isostatic compaction to 13 ± 3 % porosity. If present, the effect of deformation-induced
compaction on mineral phases is probably most pronounced in low-porosity metapelites. High-
porosity samples (φ > 10 %) are similarly abundant in illite and transitional illite-phengite material
(Fig. 7.10A-B) compared with HIP1 samples. Micas and quartz are present only as detrital material.
The presence of some fractured detrital quartz grains is the only compositional difference.
In samples with an intermediate porosity, clayey authigenic biotite, phengite and quartz are
present and more detrital quartz grains are fractured (Fig. 7.10D). Illite is predominantly present in
relatively porous and clast-rich domains.
In low-porosity metapelites authigenic biotite, phengite and quartz and their detrital
equivalents are abundant (Fig. 7.9E). Silty quartz grains are angular, but display more rounding than
in porous metapelites and detrital K-feldspar (dKfs) (Fig. 7.9E). Clayey quartz are rounded and
elongated.

129
Figure 7.9: BSE and SE images of isostatically compacted metapelites. Sample cylinder axis is vertical for
all images. Colored boxes highlight examples of pore types (red = matrix-clast voids, blue = clay
micropores, yellow = matrix pores and orange = intragranular fractures). Colored ellipses exemplify
structural features (blue = complex authigenic biotite clusters, red = authigenic quartz aligned to
foliation, and yellow = mica-kinks or microfolds). Dashed red lines denote traces of the foliation and
dotted blue line highlight the boundary between different porosity domains. A-B) High-porosity HIP1
samples. C and F) Low-porosity HIP2 samples. D) Intermediate porosity PAT1 (I) sample. E) Low-
porosity PAT1 (I) sample.
130
7.7: Microstructures
Microstructural elements such as foliation, microfolds and fractures are commonly used to
characterize deformation phases in rocks [e.g. Passchier and Trouw, 1996]. In this study,
microstructures are used to compare metapelites compacted by isostatic and by differential stress.
SEM imaging in BSE and SE modes allow visualizing the interaction of the clay-silt particles. As in
subchapter 7.4, the synthetic metapelites are divided in three groups of different porosity domains.
The synthetic metapelites are composed of predominantly clayey to fine silty matrix minerals,
typically with elongated shapes, and more equant silty to sandy clasts (Figs. 7.9-10).
Isostatic compaction:
In high-porosity samples, randomly oriented illite flakes and unorganized illite-phengite
transitional material make up most of the matrix (Fig. 7.9A). Illite flakes are aligned in micro-clusters
of 1-3 μm size. These flocculated clays have a random orientation. Quartz clasts are unaffected by the
compaction processes. Non-equant clasts are common, yet no persistent shape preferred orientation
(SPO) is identifiable (Fig. 7.9A) and no sample-scale penetrative structures were identified.
In intermediate porosity metapelites, the porous domains display a microstructure that is
comparable to that of high-porosity samples (Fig. 7.9D). A relatively higher content of clasts is
observed in porous domains. In more crystalline domains, porosity is lower and alignment of clayey
and silty mica gives rise to a weak foliation, consistent over at least 100 μm (Fig. 7.9D). The foliation
is irregular due to mica-wrapping around clasts, and is frequently interrupted or diverted by patches of
complexly shaped submicron biotite grains (Fig. 7.9D). Quartz SPO is weak in silty particles, but
stronger in clay-sized particles.
In metapelites with low porosity (φ < 5 %), compacted phengite-biotite matrix dominates
(Fig. 7.9C, E-F). The foliation is more pronounced and continuous, than in higher porosity samples.
Mica-wrapping around quartz clasts is common. Open and isoclinal micro-folds (1-3 μm) and mica
kinks fold the foliation (Fig. 7.9F). The SPO of detrital quartz is weak but aligned with the matrix
foliation (Fig. 7.9E).
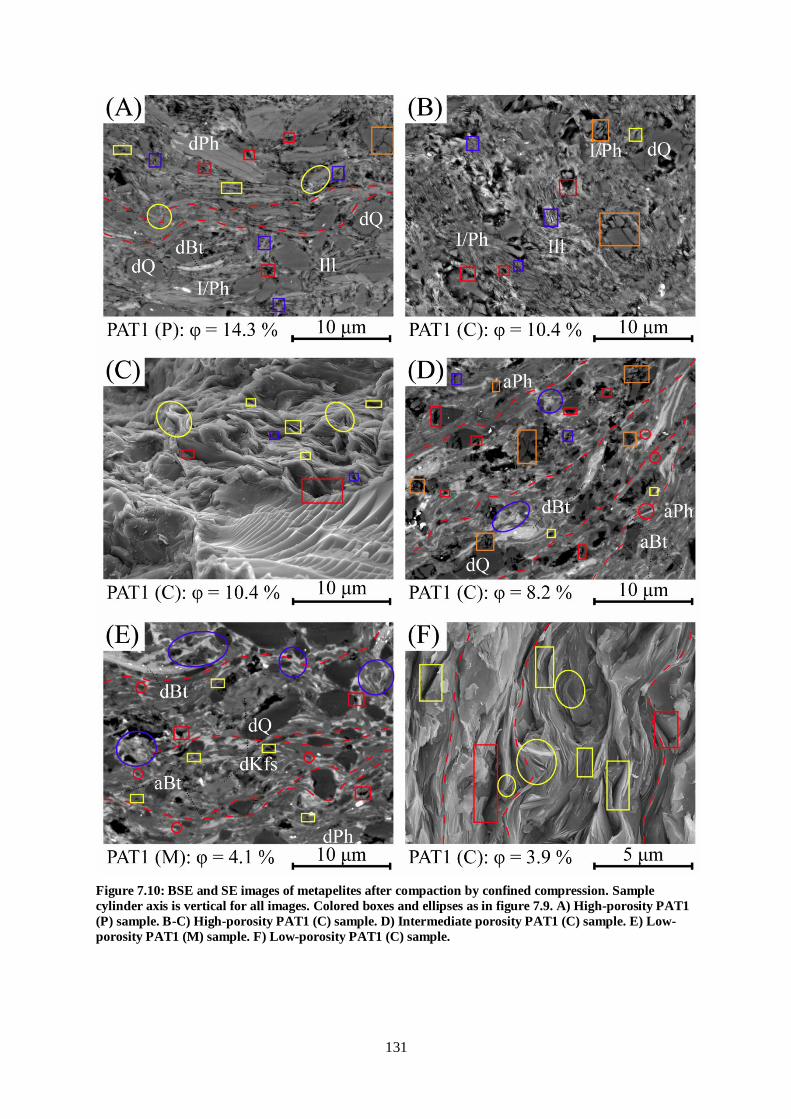
131
Figure 7.10: BSE and SE images of metapelites after compaction by confined compression. Sample
cylinder axis is vertical for all images. Colored boxes and ellipses as in figure 7.9. A) High-porosity PAT1
(P) sample. B-C) High-porosity PAT1 (C) sample. D) Intermediate porosity PAT1 (C) sample. E) Low-
porosity PAT1 (M) sample. F) Low-porosity PAT1 (C) sample.

132
Deformation-induced compaction:
Detrital micas in high-porosity metapelites that experienced confined compression possess a
weak, irregular and folded foliation (Fig. 7.10A). Micro-folds and kinks are occasionally observed in
detrital and authigenic micas (Fig. 7.10A, C). Illite-rich patches in the matrix are not foliated
(Fig. 7.10B), and the silty quartz grains in the matrix do not display a SPO.
Intermediate porosity metapelites have a more pronounced foliation, defined by detrital and
authigenic micas (Fig. 7.10D). The foliation is diverted by micas wrapping around clasts and is
interrupted by patches of complexly organized authigenic biotite (Fig. 7.10D) or underdeveloped
phengite. Both detrital and authigenic quartz grains are frequently aligned to the foliation
(Fig. 7.10D).
In low-porosity synthetic metapelites, few illite-rich patches remain. The foliation is well-
developed (Fig. 7.10E-F), but occasionally interrupted by patches of distorted ultrafine biotite (Fig.
7.10E). Micas display 1-3 μm open and isoclinal folds or kinks (Fig. 7.10F). Micro-folds and mica-
wrapping fold the main foliation. Quartz has a weak SPO for detrital grains and strong SPO for
authigenic grains (Fig. 7.10E). Both SPO types are aligned to the local foliation.
7.8: Pores
Pores are a key feature in rocks, coupling microstructural observations to quantifiable flow-
related properties. The development of pores in the synthetic metapelites is recorded by BSE and SE
imaging. As compaction progresses pores are deformed and ultimately closed. Information on the
type, shape, size and distribution of remaining pores gives insight in compaction processes.
Some of the pore types found in Maplewood Shale (section 5.4), clay-micropores, matrix-clast-voids
and matrix-pores are observed in the synthetic metapelites (Figs. 7.9-10). Intragranular fractures
(pore-type VI in Kwon et al. [2004]) form an additional generic pore type.
The submicron clay micropores separate illite flakes, and allow recognition of individual clay
particles (Figs. 7.9 and 7.10). Clay-micropores are typically parallel to illite flakes. As porosity
decreases illite becomes less abundant (Section 7.4). Consequently, the amount of clay-micropores
decreases with porosity, regardless of the stress field during compaction. Phengites in both fully and
partially crystallized state are pore-free to at least 500 nm resolution (Figs. 7.9F and 7.10F).
Ultimately, phengite is distinguished in broken surface SE images from illite by tight stacking of
ultrathin mineral sheets. Clay micropores identified may also be used to distinguish illite from
phengite in polished surfaces.
Matrix-clast-voids and matrix-pores represent open spaces generated by geometric misfits
between angular clasts and fine-grained matrix material and among matrix-forming minerals
(Figs. 7.9 and 7.10). Both pore-types range in length from submicron to 2-3 μm. Matrix-clast-voids

133
and matrix-pores are frequently found in high-porosity metapelites (Figs. 7.9A-B and 7.10A-C).
Importantly, however, compaction does not eliminate them. The two pore types are frequently
observed in both the isostatically compacted HIP2 and PAT1 (I) metapelites (Fig. 7.9C-F), and high-
strain PAT1 (C) and PAT1 (M) samples (Fig. 7.10E-F).
Intragranular fractures represent the openings created by the fracturing of rigid (quartz) clasts
(Figs. 7.9 and 7.10). These fractures either transect or die out within quartz grains. Consequently, a
range of shapes from slit-like to tabular to irregular pyramidal and semi-spherical is observed.
Intragranular fractures are frequent in PAT1 (C) and PAT1 (P) samples of diverse porosities
(Fig. 7.10A-B, D), but rare to absent in PAT1 (M) samples (Fig. 7.10E). In isostatically compacted
metapelites, intragranular fractures first appear in intermediate porosity samples (Fig. 7.9D) and are
more frequent in low porosity samples (Fig. 7.9E). There is no evidence for healing of intragranular
fractures or filling in with authigenic minerals.

134

135
Chapter 8
Magnetism
________________________________________________________________
Richard Bach once said, “The more I want to get something done, the less I call it work.”
Preface
In the previous chapter, the magnetic properties of the synthetic metapelites were not mentioned. The reason for this is that the acquired magnetic data deserve an entire chapter devoted to them. The complexity of the magnetic development is such that it does not directly provide an answer to the main problem addressed in this thesis. Therefore, magnetic properties are not primarily considered a useful tool to describe compacting shale. Instead, the roles are reversed and chemical compaction of illite shale powder in the laboratory is considered a useful tool for the simulation of rock magnetic processes. In this view a manuscript for a letter-format paper was prepared. On October 26th 2011 this manuscript was submitted to the peer-reviewed journal Geology. The text, tables and
figures in this chapter are directly taken from the submitted manuscript, minor lay-out and formatting modifications to ensure homogeneity in this thesis.

136
Chemical compaction of shales: clay transformation recorded by magnetic
fabric
Rolf H.C. Bruijn1*
, Bjarne S.G. Almqvist1, Ann M. Hirt
2 and Philip M. Benson
1
1 Geological Institute, ETH Zurich, Sonneggstrasse 5, CH-8092 Zurich Switzerland
2 Geophysical Institute, ETH Zurich, Sonneggstrasse 5, CH-8092 Zurich Switzerland
* Corresponding author: [email protected]
Bruijn, R. H. C., B. S. G. Almqvist, A. M. Hirt, and P. M. Benson (2011), Chemical compaction shale: clay transformation recorded by magnetic fabric, Geology, submitted October 26th 2011.
Abstract
Understanding the compaction of clay rich sediments is fundamental for exploring how key diagenetic processes and other rock physical parameters influence the deposition and burial of basin
sediments. Natural observation of chemical compaction, following mineral transformation and dissolution/precipitation processes is rarely addressed in experiments. Here we report, for the first time, on the development of magnetic susceptibility in a chemically compacted illite shale powder of natural origin that was experimentally subjected to temperatures of 500 to 750 °C and confining pressure of 170 or 300 MPa. The experimental procedure comprised of three compaction stages, involving dry triaxial compression (resembling mechanical compaction), hot isostatic pressing (chemical compaction by burial), and Paterson apparatus compaction in confined compression, torsion
or isostatic stress (chemical compaction by deformation or burial). Magnetic properties were characterized by magnetic susceptibility and its anisotropy (AMS) in both high- and low-applied field. Isothermal remanent magnetization and first-order reversal curves were used to characterize the remanence-bearing minerals. Results suggest that during hot isostatic pressing ferrimagnetic iron-sulfides form after reduction of magnetite and detrital pyrite in combination with lower sulfur fugacity. The degree of low-field AMS is unaffected by porosity reduction from 15 to ~1 %, regardless of operating conditions and compaction history. High-field paramagnetic AMS increases with compaction, for all employed stress regimes and conditions, and is attributed to clay
transformation to iron-bearing mica. AMS of authigenic iron-sulfide minerals remains constant during compaction, indicating non-dependence on clay transformation.
137
8.1: Introduction
Experimental compaction of argillaceous material provides key insights into the development
of geophysical parameters important for basin exploration, nuclear waste repositories, CO2
sequestration and seismic modeling [e.g. Vasseur et al., 1995; Nygård et al., 2004; Mondol et al.,
2007; Voltolini et al., 2009; Fawad et al., 2010; Schneider et al., in press]. Additionally, in
paleomagnetism such experiments have proved to be essential for better understanding inclination
shallowing recorded in deep marine sedimentary sections [Blow and Hamilton, 1978; Anson and
Kodama, 1987; Arason and Levi, 1990; Deamer and Kodama, 1990; Lu et al., 1990; Jackson et al.,
1991; Sun and Kodama, 1992]. Nonetheless, clay compaction experiments have mostly addressed
mechanical compaction processes under operating conditions that suppress clay transformation, thus
avoiding chemical compaction, which is an important aspect of diagenesis in deep basins. Compaction
by mechanical processes alone results in porosity > 15 %. This threshold marks the onset of
divergence from natural compaction trends where chemical compaction is evident [Mondol et al.,
2007; Crawford et al., 2008].
Here we report on the evolution of magnetic fabrics in an experimentally compacted illite
shale powder under operating conditions favoring mica formation and phyllosilicate dehydroxylation.
Samples are characterized by their bulk magnetic susceptibility (Km), and anisotropy of magnetic
susceptibility (AMS) in both low- and high-fields. Additionally, magnetic remanence is described
using acquisition of isothermal remanent magnetization (IRM) and construction of first-order reversal
curves (FORC) diagrams [Pike et al., 1999; Roberts et al., 2000]. We place particular emphasis upon
defining subfabrics of the paramagnetic (phyllosilicates) and ferromagnetic (s.l.) phases, to define
how these develop in response to chemical compaction by clay transformation.
8.2: Method
Source material:
Source material is Maplewood Shale from the Lower Clinton Group (Llandoverian) in the
Appalachian basin of Western New York, supplied by Ward’s Natural Science®. The mineral
composition consists of illite, clinochlore, quartz, and phengite as primary phases (> 5 vol. %) with
smectite, pyrite, rutile, apatite and biotite as secondary phases (< 5 vol. %). For our experiments, illite
shale powder was produced by crushing fragments of Maplewood Shale using a high power tungsten
‘shaker’. Resulting powder has 15 vol. % clay, 80 vol. % silt and 5 vol. % sand by size fraction, and
an average grain size of 20 μm, as determined by laser diffraction using a Malvern Mastersizer 2000
with ultrasonic agitation.

138
Compaction stages:
Illite shale powder was compacted in three stages: 1, 2, and either 3a or 3b. For stage 1
compaction, dry powder was compressed inside stainless steel canisters enclosed within a heavy steel
casing using a ram to provide ~200 MPa of vertical stress. In this stage, compaction is solely
mechanical without lithification. In stage 2, illite shale powders are further compacted isostatically for
24 hrs inside the canisters by pressurized argon gas (170 MPa and 590 °C), using a hot isostatic press
(HIP) apparatus. Stage 2 lithifies the illite shale powder into a porous (porosity 11-15 %) synthetic
metapelite. The resulting canisters are then split into two groups. The first of which is further
compacted in the HIP to yield compaction stage 3a. From the second group cylindrical samples are
prepared for stage 3b, by drilling with a hollow diamond coring drill to yield samples of 10 mm or 15
mm diameter and of 5-20 mm length via wet abrasive paper polishing.
In stage 3b, further compaction was achieved using a Paterson-type HPT gas-medium testing
machine equipped with axial and torsion actuators and pore-pressure system [Paterson, 1990; Paterson
and Olgaard, 2000]. A constant confining pressure of 300 MPa was applied, while temperatures were
fixed at 500, 650, 700 or 750 °C. Stage 3b tests were performed in isostatic stress, confined
compression or confined torsion. The range of applied constant strain rate in both torsion and
compression was 10-6-10-4 s-1. A maximum axial strain and shear strain of 20% and respectively 0.3
was achieved. A selection of confined compression tests at each temperature was performed (with the
exception of 750 °C) using either 20 or 50 MPa pore pressure (argon gas). Samples are labeled
according to their compaction stage history (Table 8.1-2).
TABLE 8.1. SAMPLE GROUPS ACCORDING TO COMPACTION HISTORY
Compaction stage
Compaction
history Sample group ID
1 1 None
2 1+2 HIP1
3a 1+2+3a HIP2
3b 1+2+3b PAT1*
*Further subdivision is given in Table 8.2.
TABLE 8.2. SAMPLE SUBGROUPS FOR COMPACTION STAGE 3B TESTS
Confined
compression Isostatic stress
confined
torsion
Pore
pressure 750 °C
PAT1 (C) PAT1 (I) PAT1 (T) PAT1 (P) PAT1 (M)
139
Sample analysis:
The degree of compaction is evaluated by porosity, measured with a Micromeritics AccuPyc
1330 helium pycnometer; to ensure accuracy the calculations are based on an average of seven
volume determinations of cylindrical samples.
Bulk magnetic susceptibility was determined with a low-field AGICO KLY-2 kappabridge
(300 Am-1 applied field at 875 Hz frequency). Degree of low-field AMS is expressed by Pj [Jelínek,
1981], which was derived from the eigenvalues (k1 ≥ k2 ≥ k3) of the symmetric second rank magnetic
susceptibility tensor. High-field AMS, expressed by Δk (i.e. k1 – k3), was measured using a torque
magnetometer [Bergmüller et al., 1994], following the method proposed by Martín-Hernández and
Hirt [2001]. Sample torque was measured over 360° in 30° steps about three orthogonal axes, for six
fields ranging between 0.5 and 1.5 T, as well as in the absence of an applied field. IRM and FORC
data were acquired to characterize the ferromagnetic (s.l.) mineral phases present during various
stages of the compaction procedure. IRM acquisition was imparted with a Princeton Measurements
Corporation Vibrating Sample Magnetometer (VSM) (Model 3900). The FORC measurements used a
saturating field of 1.0 T, with 100 ms averaging time and 130 reversal curves. A FORC diagram is a
contour plot of the FORC distribution with coercive force (Hc) on the horizontal axis and interaction
field (Hu) on the vertical axis [e.g. Pike et al., 1999].
8.3: Results
The three-stage compaction of illite shale powder resulted in synthetic metapelites with a
porosity range from 16 to 1 %. For Maplewood Shale, the mean Km increases by one order of
magnitude subsequent to crushing (NAT (P)); however, variation exists among batches of the powder
(Table 8.3). The highest susceptibility is recorded in illite shale powder that were compacted into
HIP2 synthetic metapelites. During compaction stage 2 and 3a, susceptibility decreased. PAT1
sampled display smaller values for Km in comparison with HIP1 samples. Km for crushed Silver Hill
shale (SH-NAT) is at least 973 μSI lower than for crushed Maplewood Shale.
IRM for powdered Maplewood Shale (NAT (P)) closely resembles the typical behavior of
magnetite/maghemite (Fig. 8.1). The synthetic metapelites of HIP1, HIP2 and PAT1 (C) sample
groups, however, have different IRM acquisition with an unsaturated component. Minimal variation
in IRM acquisition is observed among the synthetic metapelites (Fig. 8.1).
Two distinct FORC distribution types emerged from the analysis of HIP1, PAT1 (C) and
HIP2 samples (Fig. 8.2). Type 1 shows a broad coercivity distribution between 20 and 90 mT with a
maximum between 40 to 55 mT, and a distribution in interaction fields that centers around -6 mT
(Fig. 8.2A). This FORC distribution is typical for greigite (Fe3S4) [Roberts et al., 2006; 2011]. Type 2
also shows a broad coercivity distribution up to 150 mT, with a peak distribution between 25 and 35

140
mT. The distribution in interaction fields is narrower and centered around Hc = 0 (Fig. 8.2B). This
FORC distribution is more difficult to ascribe simply to a single phase. The tail in the distribution
suggests the presence of a higher coercivity phase, such as pyrrhotite (Fe7S8) or possibly hematite (α-
Fe2O3) [Roberts et al., 2006]. The high susceptibility, IRM acquisition curve, and FORC behavior are
more compatible with an iron sulfide.
TABLE 8.3. BULK SUSCEPTIBILITY VALUES
Sample group Mean Km
(μSI)
Min Km
(μSI)
Max Km
(μSI) n
* Standard error
†
Maplewood
Shale
NAT 223 200 266 11 7.5
NAT (P)§
2516 1341 3938 13 323.4
Synthetic
metapelites
HIP1 497 473 547 10 7.6
HIP2 967 559 1122 10 70.2
PAT1 (C) 421 209 709 21 31.2
PAT1 (I) 367 234 469 4 58.6
PAT1 (M) 455 442 469 2 13.5
PAT1 (P) 333 255 408 5 24.2
PAT1 (T) 846 262 1430 2 584.1
Silver Hill
shale
SH-NAT (P)# 359 347 368 6 2.8
*n = number of measurements.
† Standard error = (σn
-1)
0.5, where σ is standard deviation
§ (P) refers to crushed shale (i.e. illite shale powder before compaction stage 1)
# SH = Silver Hill
Low-field AMS values for Pj vary in the range of 1.05 to 1.14, with an average value of 1.09,
regardless of porosity and compaction history (Fig. 8.3).
High-field AMS measurements permit the separation of ferrimagnetic AMS from
paramagnetic and diamagnetic AMS [Martín-Hernández and Hirt, 2001]. Ferrimagnetic AMS (Δkf) is
systematically smaller than paramagnetic AMS (Δkp). All sample groups except HIP2 exhibit
comparable Δkf (trend (1) in figure 8.4A). HIP2 samples have relatively higher ferrimagnetic AMS
(Fig. 8.4A). Lack of data points, permits correlation between porosity and HIP2 Δkf.
With the exception of the one PAT1 (T) outlier data point, all metapelites plot in a trend of increasing
AMS as function of Km (Fig. 8.4B). The trend is adequately described by a linear regression with a
coefficient of determination (R2) of 0.91.
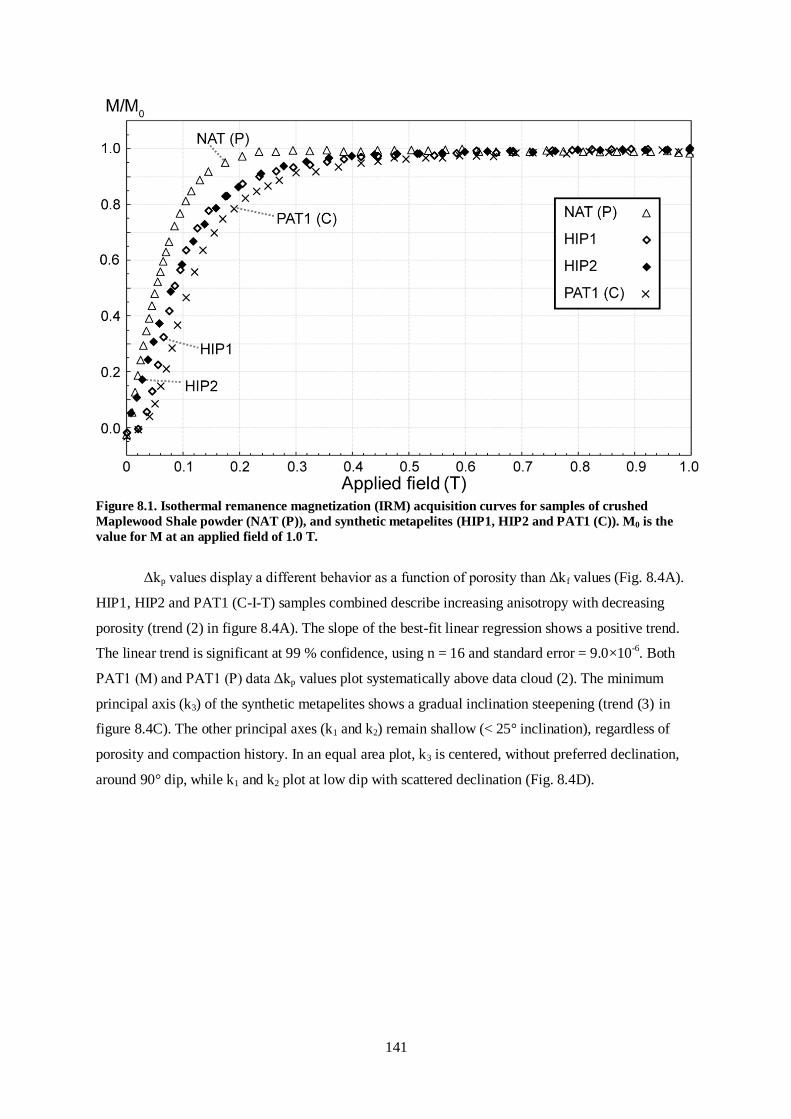
141
Figure 8.1. Isothermal remanence magnetization (IRM) acquisition curves for samples of crushed
Maplewood Shale powder (NAT (P)), and synthetic metapelites (HIP1, HIP2 and PAT1 (C)). M0 is the
value for M at an applied field of 1.0 T.
Δkp values display a different behavior as a function of porosity than Δkf values (Fig. 8.4A).
HIP1, HIP2 and PAT1 (C-I-T) samples combined describe increasing anisotropy with decreasing
porosity (trend (2) in figure 8.4A). The slope of the best-fit linear regression shows a positive trend.
The linear trend is significant at 99 % confidence, using n = 16 and standard error = 9.0×10⁻⁶. Both
PAT1 (M) and PAT1 (P) data Δkp values plot systematically above data cloud (2). The minimum
principal axis (k3) of the synthetic metapelites shows a gradual inclination steepening (trend (3) in
figure 8.4C). The other principal axes (k1 and k2) remain shallow (< 25° inclination), regardless of
porosity and compaction history. In an equal area plot, k3 is centered, without preferred declination,
around 90° dip, while k1 and k2 plot at low dip with scattered declination (Fig. 8.4D).

142
Figure 8.2. First-order reversal curves (FORC) diagrams computed with FORCinel v.1.17 [Harrison and
Feinberg, 2008] obtained from a HIP1, HIP2 and PAT1 (C) sample showing A) FORC distribution type 1
and B) FORC distribution type 2.
Figure 8.3. Low-field anisotropy of magnetic susceptibility (AMS) as a function of porosity of synthetic
metapelites, color-coded according to compaction history (Table 8.1-2).
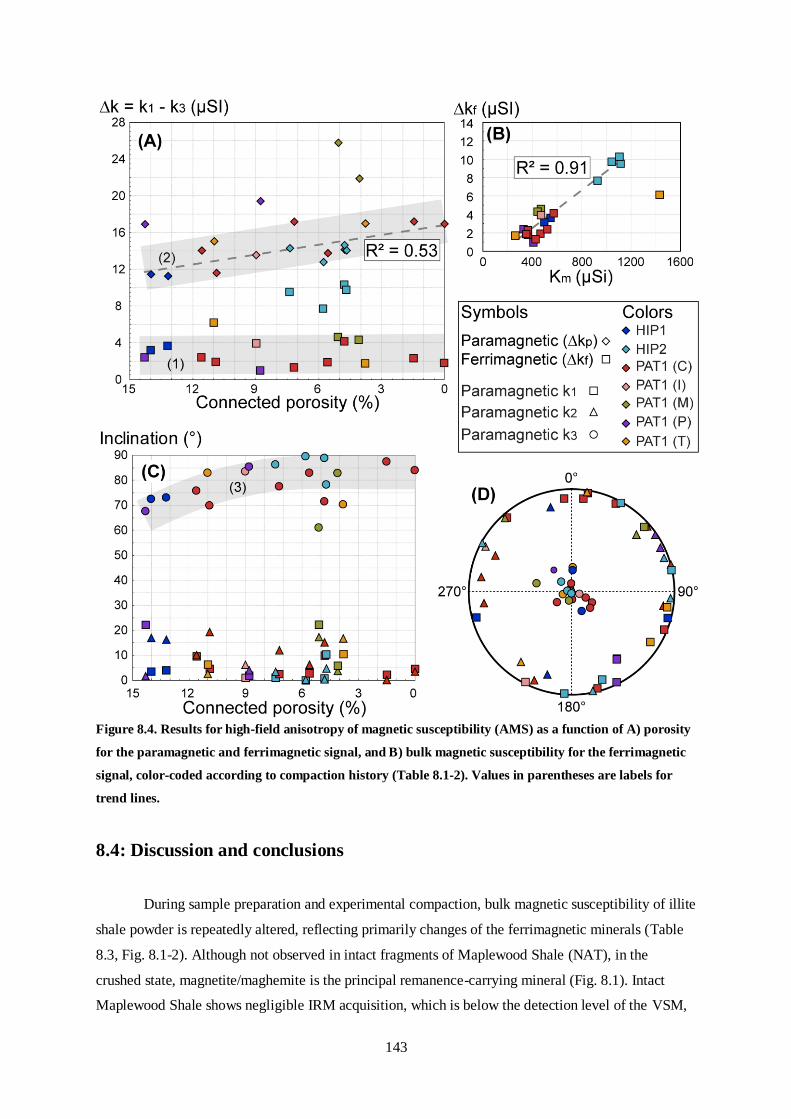
143
Figure 8.4. Results for high-field anisotropy of magnetic susceptibility (AMS) as a function of A) porosity
for the paramagnetic and ferrimagnetic signal, and B) bulk magnetic susceptibility for the ferrimagnetic
signal, color-coded according to compaction history (Table 8.1-2). Values in parentheses are labels for
trend lines.
8.4: Discussion and conclusions
During sample preparation and experimental compaction, bulk magnetic susceptibility of illite
shale powder is repeatedly altered, reflecting primarily changes of the ferrimagnetic minerals (Table
8.3, Fig. 8.1-2). Although not observed in intact fragments of Maplewood Shale (NAT), in the
crushed state, magnetite/maghemite is the principal remanence-carrying mineral (Fig. 8.1). Intact
Maplewood Shale shows negligible IRM acquisition, which is below the detection level of the VSM,
144
and has considerably lower magnetic susceptibility (Table 8.3). The suspected addition of
magnetite/maghemite to Maplewood Shale powder (NAT (P)) is attributed to inadvertent admixing of
concretions or iron-oxide-bearing veins. Magnetite/maghemite particles are heterogeneously
distributed among the powder batches, as evidenced by the considerably varying bulk susceptibility of
NAT (P) (Table 8.3). Contamination during the crushing procedure from an external source is
excluded, because powder of similarly treated Silver Hill shale has lower values for Km (Table 8.3).
Reduced susceptibility in the synthesized metapelites is attributed to the combination of oxidation-
reduction reactions and lowered sulfur fugacity during compaction stages 2 and 3, during which
remanence-bearing iron-sulfides formed at the expense of magnetite/maghemite and pyrite [cf.,
Rochette, 1987]. The IRM acquisition curves and FORC distributions for synthetic metapelites
indicate the dominant presence of high coercivity phases such as greigite and pyrrhotite, and confirm
the disappearance of magnetite. Comparable susceptibility values for PAT1 and HIP1 samples (Table
8.3) suggests that the redox reactions completed during compaction stage 2. Higher susceptibility for
HIP2 samples is attributed to higher initial magnetite/maghemite content, which resulted in a higher
concentration of ferrimagnetic iron-sulfides after compaction stage 3a.
Both low-field and the ferrimagnetic AMS of all synthetic metapelite groups are unaffected
by compaction (Fig. 8.3, 4A). As for bulk susceptibility, the signal of total AMS is explained by the
dominant contribution of the ferrimagnetic minerals. Δkf remains constant at a relative low value
during compaction from 15 % to nearly 0 % porosity. The apparent higher Δk f for HIP2 samples (Fig.
8.4A) is rather a consequence of higher bulk magnetic susceptibility than of enhanced preferred
magnetocrystalline orientation for greigite and pyrrhotite, as indicated by the good matching of HIP2
samples to the best-fit linear line in the Km-Δkf diagram (Fig. 8.4B).
In this study, paramagnetic AMS increases with compaction (Fig. 8.4A trends (1) and (2)).
Simultaneously as porosity decreases, the short axis of the paramagnetic susceptibility ellipsoid
rotates towards steeper inclination without alignment of its declination, while the intermediate and
long axes remain at shallow inclination with scattered declination (Fig. 8.4C-D). Recorded Δkp values
for PAT1 (CIT) samples plot within trend (2) of figure 8.4A, which also includes HIP1 and HIP2
samples. This behavior is explained by transformation of clay into mica. Compared with clay, mica
has higher crystallinity and single crystal AMS [Hrouda, 1993]. As such, porosity and paramagnetic
AMS are first-order measures of the progress of illite to phengite transformation. Higher Δkp for
PAT1 (M) metapelite is explained by enhanced anisotropic biotite formation, which is not
accompanied by pore closure. Addition of gaseous pore pressure in compaction stage 3b tests
enhanced Δkp for PAT1 (P) samples compared with trend (2) (Fig. 8.4A), without affecting the
mechanism behind AMS development. Fluids hamper (magnetic) foliation development, as they
facilitate phengite nucleation and growth in random orientations away from illite grains. Pore pressure
restricts phyllosilicate dehydroxylation and thus phengite mobility. Grain rotation as the primary
mechanism of paramagnetic AMS development is excluded on two grounds. Firstly, sample
145
compaction by isostatic stress, confined torsion or compression yields a comparable Δkp trend. Grain
rotation, on the other hand, is a consequence of strain pathways (e.g. pure and simple shear), which in
essence is the response of a material to applied stress fields. Distinctly different stress fields are likely
to produce characteristic AMS during deformation or compaction. Secondly, grain rotation is a
process primarily associated with mechanical compaction and is typically exhausted in argillaceous
sediments below ~15 % porosity [e.g. Vasseur et al., 1995; Nygård et al., 2004; Mondol et al., 2007;
Fawad et al., 2010]. The non-linear increase of strength of clays during mechanical compaction is the
consequence of rapidly increasing resistance to clay rotation. Chemical compaction in clays by clay
recrystallization and dissolution/precipitation processes is required to lower porosity below ~15 %.
From the distinctly different paramagnetic and ferrimagnetic AMS development it is inferred that
remanence-bearing minerals behave independent from clay and mica minerals during chemical
compaction below 15 % porosity.
8.5: Acknowledgements
We thank S. Misra for running the HIP apparatus during compaction stage 2 and 3a
experiments, and R. Hofmann for technical support. This research was funded by SNF projects
200020-132772 and 200021-116153.

146

147
Chapter 9
Discussion
________________________________________________________________
Bertrand Russell once said, “The fundamental cause of trouble in the world is that the stupid are
cocksure while the intelligent are full of doubt.”
Preface
Chapters 7 and 8 presented data and images on compacted synthetic metapelites. This chapter
discusses these results by relating the observations to clay transformation leading to chemical
compaction. The data show that chemical compaction is the main compaction mechanism in all samples, regardless of compaction history. A technique for the chemical compaction of illite shale was for the first time established, offering new opportunities for further experimental research on the development of chemical and physical properties in clay-rich sediments buried to late-diagenetic/anchizone conditions. The first section discusses the evidence for chemical compaction in the porosity and density data (subchapter 9.1). A density trend is identified and explanations given for samples that do not fit this trend. The second subchapter focuses on the relationship between volumetric strain and porosity reduction in such a way that it becomes possible to ascribe a
mechanism to the accommodation of volumetric strain (subchapter 9.2). Data from the metapelites is also compared with data from compacted sandstones. The discussion continues with the construction and interpretation of the sample deformation path from radial and axial strain data (subchapter 9.3). Plotted against each other, these properties give insight in the compaction efficiency during axial straining. It is subsequently shown that dilation by radial extension occurred for most metapelites after a certain axial strain, which resulted in decompaction. The topic of subchapter (9.4) is sample strength behavior. The wide range of sample strength in confined compression and torsion tests is discussed in
light of the dominant deformation mechanism. Compaction hardening is associated with pore-space reduction, which is influenced mostly by the variations in pore compressibility due to anisotropy and varying pore alignment. Strain rate and temperature sensitive steady state flow and compaction weakening are associated with ductile flow by diffusion creep. Sample drainage and pore pressure restrict diffusion creep. Combined ductile flow and pore-space reduction resulted in strain rate sensitive compaction hardening. Confined torsion experiments suffered from reduced friction of the assembly interfaces, which resulted in localized slip at low shear strain values. As a consequence,
deformation of metapelites by sample twist was not possible. Chemical processes during the compaction stages are addressed in subchapter 9.5. The progress of the mineral reactions for the various sample groups is discussed in pseudosections of the chemical model (Chapter 6). The discussion focuses on the progress of the reactions towards the expected equilibrium phase assemblages. When linked to the heating of hydrous minerals, fluids play an important role. The precise role of fluids in the accommodation of strain in the Paterson apparatus tests is discussed. The chapter continues with a discussion on the produced microfabrics (subchapter 9.6). Addressed subtopics include the illite-phengite transformation, pores, deformation structures, and authigenic
biotite and quartz. A link with chapter 8 on the magnetic response to chemical compaction is made by relating magnetic fabric development to microstructures and phengite content. As quartz cementation
148
is source for recent debates in the sedimentary petrology and petroleum geology community, the subchapter is concluded with a short discussion on the presence of authigenic quartz. The final subchapter attempts to answer the main question in this investigation: how do variations in the stress field influence chemical compaction? Presented arguments are based on the points made in the
previous subchapters and chapter 8.
9.1: Porosity and density
Porosity and density data permit to verify the dominant compaction mode in synthetic
metapelites. This is important, as the density development trends provide a first insight into the effects
of stress fields on compaction processes.
Due to predominantly lower porosities of HIP1, HIP2 and PAT1 samples (less than 15%),
chemical compaction is considered the dominant compaction mode in all the synthetic metapelites
used. To achieve this degree of compaction, two or three compaction stages were required. The
majority of PAT1 and all HIP2 samples are more compacted than HIP1 samples. This implies that
further compaction was achieved during most compaction stage 3 tests. As the porosity of most of the
HIP1 samples is below 15 %, porosity reduction in subsequent stages 3a or 3b is primarily the result
of chemical compaction processes. The porosity after compaction stage 1 in the hydraulic cold-press
was likely greater than 15 %. It therefore seems that during compaction stage 2 HIP1 samples
compacted by both mechanical and chemical processes. However, the confining pressure during
compaction stage 2 in the hot isostatic press was smaller than the vertical load in stage 1
(subchapter 3.2). As mechanical compaction is a function of effective stress/pressure [e.g. Hedberg,
1936; Rieke and Chilingarian, 1974], mechanical compaction during the hot isostatic pressing is
improbable, excluding the compensation for the minor decompaction after load removal in stage 1.
During cold pressing in compaction stage 1, only mechanical processes are activated; reversed illite to
smectite transformation can be excluded on the time scale of hours to days. HIP1 samples exhibit a
combination of mechanical and chemical compaction processes. In HIP2 and PAT1 samples,
chemical compaction is more dominant but not solely responsible for the end product metapelites. The
effect of chemical compaction is isolated by considering the differences between HIP1, and HIP2 and
PAT1 metapelites.
Maplewood Shale has porosity between 2.7 and 2.9 % (Fig. 7.1A). The high illite and low
smectite content, together with the estimated burial depth of 5 km [Friedman, 1987] suggest that
smectite transformation to illite was nearly completed when exhumation started. The fact that an illite-
rich shale and synthetic metapelite have comparable density and porosity is explained by the presence
of detrital micas in the former and by the small grain density contrast between illite (average
2.75 g cm-3) and phengite (average 2.82 g cm-3). The two subsets in density data of the metapelites,
therefore, indicate variable mineral content or composition heterogeneities in Maplewood Shale,
perhaps reflecting lateral changes in deposition conditions in the Appalachian Basin during Early

149
Silurian. HIP2 samples of subset 2 are quartz-richer than metapelites of subset 1. The inferred grain
density is higher for metapelites of subset 1 than of subset 2 (Fig. 7.1A).
Having concluded that chemical processes dominated compaction of the illite shale powder in
HIP2 and PAT1 samples, the question on how compaction conditions affect porosity and density can
be addressed. Within subset 1 (Fig. 7.1A) metapelites a trend that describes the density development
during compaction is identified (Fig. 9.1). This trend includes data points from all PAT1 sample
groups. Hence, the stress field in compaction stage 3b tests hardly affected density development
during compaction. Two sets of PAT1 samples deviate from this trend; six high porosity and two low
porosity metapelites are denser than the trend at equivalent porosity (Fig. 9.1). For five of the six high
porosity samples, dilation occurred during compaction stage 3b, which decompacted the samples
(Fig. 7.2 and Table D1). Since samples are confined and/or compressed, pores are elastically strained.
Upon pressure and stress release, strained pores, unaffected by chemical compaction, are restored.
During restoration, pore throats and channels are potentially modified to create a more efficient pore
network. Porosity measurements afterwards yield a greater value, because the connected porosity
increased. Chemical compaction densified the solid framework while pore unloading enhanced
porosity.
Figure 9.1: Porosity-density plot for subset 1 samples, with interpreted density development trend and
recognition of out-of-sequence compacted samples.
The higher density of two low-porosity PAT1 (I) and PAT1 (M) metapelites results from
mica transformation. The grain density of biotite (average 3.09 g cm-3) contrasts more with phengite
than illite. Consequently, biotite production has a relatively larger effect on sample density than illite
transformation. In mineral stability field IV (Fig. 6.1), biotite is stable, while phengite and illite are

150
not. Biotite formation at the expense of phengite results in metapelite densification, but is not
necessarily accompanied by effective porosity reduction. This will be discussed in subchapter 9.6.
9.2: Accommodation of finite volumetric strain
The relationship between volumetric strain and porosity reduction gives a first insight in the
strain accommodation mechanism. Compaction is directly related to pore-space collapse, whereas
deformation of the solid grains leads to relatively low porosity reduction, and blocking of pore
channels results in enhanced porosity reduction (Fig 7.2).
Most synthetic metapelites in this study predominantly accommodate strain by pore-space
collapse, regardless of finite strain, temperature or stress kinetics (Fig. 7.2). For three samples with
10 % to 12 % volumetric strain, porosity reduction is relatively low (Fig. 7.2). These 700 °C samples
were deformed by a combination of pore-space collapse and appreciable amount of solid grain
deformation, but do not relate to a particular compaction stage 3b stress field (Fig. 7.2A). Quartz
fracturing is observed in samples that were compacted isostatically and by confined compression
(Fig. 7.9-10). It is probable that in these 700 °C samples, grain fracturing brought about sufficient
grain rearrangement to accommodate measurable strain. Interestingly, for sandstones, comparable
deviations from pore-space collapse are reported for room temperature shear-enhanced compaction
(Fig. 9.2) [Wong et al., 1997]. Solid grain deformation in these sandstones was accommodated by
compactive cataclastic flow [Wong et al., 1997]. Deformation features associated with cataclasis are
not observed in any of the synthetic metapelites.
The volumetric strain-porosity reduction plot (Fig. 7.2) also shows the extent and controlling
parameters of volumetric strain and compaction. The amount of finite volumetric strain (i.e. pore-
space collapse) is evidently temperature controlled (Fig. 7.2B). The broad range of 700 °C PAT1
metapelites reflects not only experiment duration but also strain rate (or compaction rate) and
effective pressure. The amount of compaction and strain in long-duration 700 °C isostatic stress tests
is comparable with that in shorter 700 °C confined compression tests (Fig. 7.2). However, samples in
700 °C confined compression experiments with lower effective pressure (PAT1 (P)), compact and
strain less (Fig. 7.2). Therefore, deformation (i.e. strain rate) and temperature promotes, but pore
pressure restricts porosity reduction.

151
Figure 9.2: Finite volumetric strain/porosity reduction plot for room temperature shear-enhanced compaction of Adamswiler Sandstone (after Wong et al. [1997]).
9.3: Sample deformation path
From the relation between volumetric strain and porosity reduction it is clear that contraction
is required for compaction of synthetic metapelites to take place. In a diagram of axial strain versus
radial strain, compaction occurs anywhere in the strain field that satisfies this condition; for simple
flattening this occurs above the line that denotes pure shear (Fig. 7.3) (i.e. critical state line of constant
volume deformation). The deformation path describes the shape change and volumetric strain
evolution during axial straining in εax/εrd-space. With axial strain, the line for continued pure shear
(i.e. division between compaction and decompaction) shifts to higher axial strain values. Sample
deformation paths are constructed from grouped data points in a εax-εrd plot (Fig. 9.3). Grouping is
based on temperature, with PAT1 (I) and PAT1 (T) samples excluded in this case. Deformation paths
represent the best-fit lines through the data points. Key points for the deformation paths are their
(extrapolated) intersections with the line of 0 % finite radial strain (i.e. uniaxial strain). These
intersection points mark the axial strain beyond which no sample plots in the field of non-uniform
contraction, and where axial strain is compensated by radial extension (Fig. 9.3). The intersection
point moves to higher axial strain values for higher temperature, with a major change evident between
650 °C and 700 °C, although a large undefined error exists for T ≥ 650 °C, possibly due to a change in
deformation mechanism (discussed in subchapter 9.4). From each intersection point, a new critical
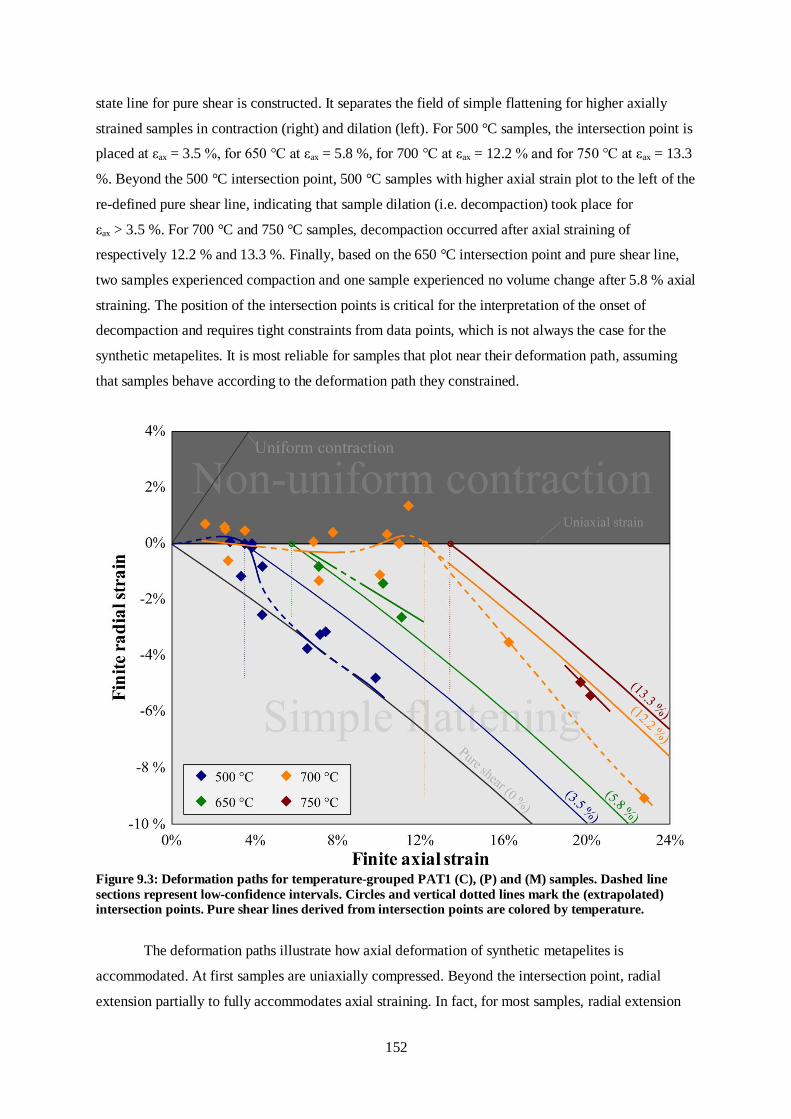
152
state line for pure shear is constructed. It separates the field of simple flattening for higher axially
strained samples in contraction (right) and dilation (left). For 500 °C samples, the intersection point is
placed at εax = 3.5 %, for 650 °C at εax = 5.8 %, for 700 °C at εax = 12.2 % and for 750 °C at εax = 13.3
%. Beyond the 500 °C intersection point, 500 °C samples with higher axial strain plot to the left of the
re-defined pure shear line, indicating that sample dilation (i.e. decompaction) took place for
εax > 3.5 %. For 700 °C and 750 °C samples, decompaction occurred after axial straining of
respectively 12.2 % and 13.3 %. Finally, based on the 650 °C intersection point and pure shear line,
two samples experienced compaction and one sample experienced no volume change after 5.8 % axial
straining. The position of the intersection points is critical for the interpretation of the onset of
decompaction and requires tight constraints from data points, which is not always the case for the
synthetic metapelites. It is most reliable for samples that plot near their deformation path, assuming
that samples behave according to the deformation path they constrained.
Figure 9.3: Deformation paths for temperature-grouped PAT1 (C), (P) and (M) samples. Dashed line
sections represent low-confidence intervals. Circles and vertical dotted lines mark the (extrapolated) intersection points. Pure shear lines derived from intersection points are colored by temperature.
The deformation paths illustrate how axial deformation of synthetic metapelites is
accommodated. At first samples are uniaxially compressed. Beyond the intersection point, radial
extension partially to fully accommodates axial straining. In fact, for most samples, radial extension

153
leads to decompaction. Therefore, deformation paths and the related intersection points offer an
explanation for the observation that compaction is not directly related to axial strain (Table D1).
9.4: Deformation mechanisms
Confined compression Paterson apparatus tests were performed under different conditions to
investigate the effects of axial strain, temperature, strain rate, sample drainage, pore pressure and
jacket material on synthetic metapelite compaction. From the obtained data (Fig. 7.4) it is evident that
all these parameters have measurable effects. Two deformation mechanisms dominate the compaction
of synthetic metapelites during compaction stage 3b confined compression tests. Compaction
hardening during axial straining is ascribed to pore-space reduction. Steady state stress and
compaction weakening are linked to ductile flow by diffusion creep.
Compaction hardening:
As metapelites compact in response to axial compression, their strength increases in a linear
or near linear fashion; a behavior termed “compaction hardening”. The reduction of compressible
pores and simultaneous increase of the stiff ‘solid’ framework with axial straining result in
compaction hardening, without localized failure of the sample within an axial strain of 15 %.
Comparable stress-strain behavior, albeit with lower σdiff values, was recorded during high strain
confined compression tests at room temperature on London clay and fluvio-marine shale [Jones and
Addis, 1986, Fig. 4]. More recently, strain hardening ascribed partially to compaction was observed in
300 °C to 600 °C shearing of synthetic pure muscovite gouges [Van Diggelen et al., 2010].
Experimental compaction by pore space reduction in sandstones results in permanent deformation by
grain crushing [Zhang et al., 1990; David et al., 1994; Menéndez et al., 1996; Klein et al., 2001],
cataclastic flow [Menéndez et al., 1996; Wong et al., 1997; Wu et al., 2000], or compaction bands and
shear fractures [Menéndez et al., 1996; Wu et al., 2000; Wong et al., 2001; Klein et al., 2001],
depending on initial porosity, effective pressure and stress regime. The strength of compacting
metapelites essentially reflects the pore-space/solid-space ratio (porosity). In this concept and by
allowing for radial extension (Fig. 7.3 and Table D1), more than 14 % axial straining should lead to
very low porosity metapelites. This concept is valid for the T ≥ 700 °C tests, but does not hold for 650
°C and 500 °C tests (Fig. 7.2-3 and Table D1). Strain recovery and pore elasticity explain this
conundrum. At the lower temperature range, the finite axial strain of a sample is much lower than the
total axial strain during the compaction test. Axial strain is (partially) recovered upon unloading. The
solid framework of the compacted metapelites can only partially account for observed strain recovery
of up to 12 %. Previous experiments under similar conditions show that the inelastic yield point of
natural mica schist is smaller than 1.7 % [Shea and Kronenberg, 1992; 1993]. The remaining

154
recoverable strain is ascribed to pores. Pore annihilation by chemical processes is required to keep
synthetic metapelites compacted after unloading, and was more successful in tests in the higher than
in the lower temperature range. For example, SEM data revealed that in 500 °C and 650 °C
metapelites, the amount of clay micropores is much higher than in higher temperature PAT1 samples
(Fig. 7.10). Strong elastic rebound has been reported for illite compaction tests before and was
ascribed to illite flocculation [Olson and Mitronovas, 1962].
Most of the tests at 500 °C and 650 °C (confined compression) and some 700 °C experiments
share a common sample strength evolution of unfinished compaction hardening (Fig. 7.4A). This
behavior implies that strain rate and temperature have a negligible influence on strength development
during pore space reduction.
During three tests (P1336, P1337 and P1346), a different strength evolution was recorded.
After the first two tests, the samples were more porous than before. This decompaction was discussed
in subchapter 9.1. The finite radial strain in these samples is smallest, whereas their finite axial strain
is largest of all 500 °C samples. After P1346, the metapelite was still relatively porous considering its
compaction temperature and total axial strain (Table D1). These observations and the realization that
500 °C samples have the strongest tendency to recover axial strain imply that pore elasticity recovered
strain in both directions. Such isotropic behavior is typically associated with spherical pores, or in the
case of phyllosilicate-rich material, with random distribution of sheet-like pores. The compressibility
of pores is shape dependent. In 2D, depending on the pore aspect ratio elliptical pores have a two or
more times lower compressibility than circular pores [Zimmerman, 1991, p. 91]. Aligned sheet-like
pores, such as the abundant clay micropores in HIP1 samples (Fig. 7.9AB), are therefore much
weaker than spherical pores or randomly oriented sheet-like pores. The stiffer sample behavior during
P1336, P1337 and P1346 (Fig. 7.4A-B) supports the proposed poro-elastic response, and implies that
the degree of compaction hardening is influenced by microfabric elements such as pores and pore
shapes.
The application and increase of pore pressure (which has the effect of lowering effective
pressure) has negligible effect on pore-space reduction and compaction hardening. Stress-strain
curves for PAT1 (P) samples show a compaction hardening behavior (Fig. 7.4C) comparable to that in
compression tests without pore pressure (Fig. 7.4A-B). In contrast, Jones and Addis [1986] reports
faster compaction hardening with axial strain between 14 and 70 MPa confining pressure tests.
Sample drainage experiments conducted at 700 °C (P1339) resulted in compaction hardening
(Fig. 7.4B), low finite axial strain and volumetric strain, and limited compaction (see Table D1 for
details). These observations imply that elastic pore space reduction dominates strain accommodation
in open systems up to higher temperatures.
155
Steady state flow and compaction weakening:
Compaction weakening, reduction of sample strength during constant strain rate compaction
and steady state flow behavior were observed in four experiments at 700 °C and 750 °C (Fig. 7.4B-C).
The stress sensitivity to the applied strain rate suggests that the dominant deformation mechanism
during steady state flow is diffusion creep (Table 7.1 and Fig. 7.5B-C). Diffusion creep is a constant
volume deformation mechanism and as such requires radial extension of the samples to counter
balance the axial deformation. The deformation paths for 700 °C and 750 °C PAT1 (C) samples
(Figure 9.3) show exactly that, with the samples plotting close to a shifted critical state line for pure
shear, indicating that after 12.2 % and 13.3 % axial straining, respectively, the condition of constant
volume deformation is met. Diffusion creep is temperature sensitive. Compared with 700 °C tests,
750 °C samples are weaker and reach mechanical steady state at lower strain values.
Strain rate sensitive compaction hardening:
The spread in compaction hardening rates in 700 °C tests is ascribed to varying contributions
of diffusion creep and pore-space reduction. The 700 °C stress/strain curves, experiments P1339,
P1345, P1346 and P1347 excluded, indicate stiffer behavior for higher strain rates (Fig. 7.4B), which
is explained by a decreasing contribution of diffusion creep. The stress-strain curve for P1472
(650 °C) can also be interpreted as being slightly influenced by diffusion creep (Fig. 7.4A).
In recent experimental shearing of pure muscovite, 700 °C was found to mark the temperature where a
change in deformation mechanism from a mixture of brittle/frictional and crystal plastic processes to
linear-viscous dislocation creep occurs at strain rates of approximately 10-5 s-1 [Mariani et al., 2006].
In addition, from deformation studies on kaolinite and halite/kaolinite gouges, strain weakening was
coupled with the activation of pressure solution processes solely in the polymineralic gouge
[Bos et al., 2000].
Effect of jacket material:
Copper-jacketed samples were found to be slightly weaker than iron-jacketed samples in the
experiments conducted at 500 °C (Fig. 7.4A). At 700 °C, the unique copper-jacketed sample is stiffer
than most iron-jacketed samples. This contradicting behavior suggests that the effect of jacket
material on sample stiffness cannot be ascribed solely to the flow strength of the jackets. Also
porosity, density and strain data show no evidence for jacket material effects (Table D1). Instead,
variations in compaction hardening rates are attributed to sample-to-sample variations and related
experiment reproducibility.
Confined torsion tests:
Slip along assembly pistons and spacer interfaces prevented confined torsion tests from
reaching appreciable values for shear strain (Fig. 7.6). Such slip is commonly attributed to reduced
156
friction because of water vapor. Using a coefficient of friction (μ) of 0.67, the shear stress required to
slip along alumina-alumina interfaces, compressed by 300 MPa normal stress, is approximately
200 MPa. This is supported by data comparing water content of samples before and after experiment
P1211 (Fig. 7.8B and Table E1).
Sample P1211 displayed no permanent strain, because twist was primarily by slip on
assembly interfaces (Fig. 7.6A). Torque data > 0 throughout the experiment indicate that minor
deformation was however achieved. Assuming a minimum observable shear strain of 0.02, the actual
sample strain rate must have been lower than 4×10⁻⁶ s-1. This strain rate approaches the minimum
strain rate achievable by the torsion motor of the Paterson apparatus (2×10⁻⁶ s-1).
During experiments P1212 and P1216, twist was accommodated solely by the sample until
slip along assembly interfaces occurred. The permanent shear strain in the samples (Fig. 7.6B-C)
matches with the strain values at the moment of slip (Fig. 7.4D). Shear stress values at the moment of
slip are much lower than 200 MPa, so the slipped interfaces must have experienced some sort of
lubrication to reduce the friction.
9.5: Chemistry
Mineral reactions:
As predicted by the pseudosection for Maplewood Shale (Fig. 6.1-2) and shown by XRD
patterns (Fig. 7.7) and on SEM images (Fig. 7.9-10), the mineral content of the illite shale powder
changed during compaction stages 2 and 3. It is evident that in none of the experiments sufficient time
was available to reach the mineral equilibrium assemblage predicted for the experimental conditions.
In PAT1 (M) samples, no partial melt was observed (Fig. 7.10E) and in 700 °C PAT1 samples there is
no sign of authigenic K-feldspar, aluminosilicates or garnet (Fig. 7.10D). Instead, the nearly complete
disappearance of illite and the presence of authigenic biotite and phengite suggest that mineral
equilibrium field III was almost achieved (Fig. 7.10D, F). In lower temperature PAT1 and HIP1
samples illite is better preserved (Figs. 7.9A-B and 7.10A-C), albeit still in reduced quantities in favor
of phengite formation. No authigenic biotite is observed, so at best the boundary between fields I and
II was reached. There is no risk that water loss resulted in mineral reactions towards field VII, as no
field VII minerals were observed. In HIP2 samples authigenic biotite and phengite was found, and
illite content was found to be severely diminished (Fig. 7.9C), corresponding to the mineral
assemblage for field II (Fig. 6.1).
Based also on XRD-patterns and SEM images, there is no evidence that different stress fields
influence mineral reactions and reaction rates. Nevertheless, deformation-induced compaction
resulted in lower porosities in shorter amount of time, but this was not achieved by different mineral
reactions. In fact, compaction primarily reflects the transformation of illite into phengite. As porosity

157
decreases in the synthetic metapelites, the illite content seems to decrease in favor of authigenic
phengite. This is best seen in the SEM images of figures 7.9 and 7.10.
Fluids:
The role of fluids in the chemical compaction of metapelites is best demonstrated by
experiment P1339 during compaction stage 3b. Sample drainage limited diffusion creep, leaving pore
space reduction the sole deformation mechanism. The activation or rate of diffusion creep depends on
the fluid availability. Fluids likely originated from the dehydroxylation of phyllosilicates. TG analysis
on HIP1 metapelites demonstrates that mica dehydroxylation occurs in a temperature range from 550
°C to 1000 °C (Fig. 6.3). KFT water content measurements indicate that water loss is a function of
maximum temperature (Fig. 7.8 and Table E1). Phyllosilicates barely dehydroxylate when re-heated
at lower temperatures, as is the case for 500 °C compaction stage 3b tests. During 650 °C to 750 °C
tests, a sufficient amount of lattice water is released to facilitate diffusion creep.
The reliability of diffusion creep on fluid offers an alternative explanation for the strain rate
sensitivity of mixed diffusion creep and pore space reduction. During compaction permeability of the
system lowers. For faster compaction, faster diffusion creep is needed, while less time for fluid
migration is available. Permeability of illite shale is strongly dependent of effective pressure and
porosity. In general, clay/mudstones permeability data, derived from experiments, nature and
theoretical considerations, show a decrease with compaction extending to porosity < 15 % [Neuzil,
1994; Yang and Aplin, 1998; 2007; 2010; Kwon et al., 2004]. For example in illite-rich Wilcox Shale,
water permeability decreases more than one order of magnitude in an effective pressure interval from
3 to 8 MPa [Kwon et al., 2004].
9.6: Microfabric elements
Illite-phengite transformation:
The transformation of illite into phengite readily alters the microstructure of the synthetic
metapelites. The porosity decreases as flocculated illite is replaced by tightly stacked phengite and
biotite (Fig. 7.9-10). Simultaneously, isotropic illite orientations are transformed into anisotropic mica
alignment that gives rise to foliation (Fig. 7.9-10). Anisotropic fabric development is frequently
described in natural mudstones affected by the smectite to illite transformation and is believed to
depend on temperature and thermal history rather than depth and effective stress [e.g. Bowles et al.,
1969; Ho et al., 1999; Aplin et al., 2003; 2006; Charpentier et al., 2003; Worden et al., 2005]. The
paramagnetic AMS increase as a function of decreasing porosity (chapter 8) quantifies the
development of the anisotropic phyllosilicate fabric.
158
Mica wrapping:
Detrital and authigenic mica wrapping around silt clasts render the foliation irregular in
appearance (Fig. 7.9C-F and 7.10A, D-F). Clay particle alignment and clay wrapping have been
proposed as porosity reducing mechanisms in experimental mechanical compaction tests on clay-silt
mixtures [e.g. Vasseur et al., 1995; Fawad et al., 2010]. However, if this is applicable to mica as well,
it implies that compaction occurred mechanically in the synthetic metapelites, which is improbable for
all compaction stages except the first one. The origin of the irregular foliation, marked by authigenic
mica, is believed to be related to fluid-driven mica nucleation and growth. As fluids are flowing
through a sample, their flow direction is controlled by pressure gradients and permeability. The
permeability in clay/mica-rich samples quickly becomes more anisotropic as phyllosilicates align
themselves by compaction [Vasseur et al., 1995]. Therefore, local enhanced phyllosilicate alignment
essentially means permeability anisotropy, which determines the direction of fluid flow. As mica
minerals precipitate from the solution, they orient according to the flow direction. Obstacles in the
flow path, such as rigid silt clasts, force fluids to go around them. Authigenic micas mark the fluid
flow path of fluid, resulting in “wavy” foliation.
Pores:
Clay micropores disappear, within the resolution of the SEM, as the illite fraction diminishes,
but the amount of intragranular fractures in detrital clasts increases with compaction. Collapse of
matrix-clast voids and matrix pores contributed least to compaction. Conversely, during mechanical
compaction tests on clay-silt mixtures the pores most frequently collapsed are matrix-clast voids or
related [e.g. Fawad et al., 2010; Schneider et al., 2011].
Some matrix-clast voids and the majority of intragranular fractures are not filled by
authigenic mica. This implies that either they were formed in the absence of phyllosilicate
dehydroxylation, or that they were not connected with the pore network, throughout the experiment.
Intragranular fractures are related to stress-induced grain crushing. Due to unfavorable orientation,
shape or pore space-solid space ratios, local stress values could overcome the cohesion and shear
strength of the quartz grains, which led to fracturing, in a fashion comparable with what is commonly
reported for sandstone [Zhang et al., 1990; David et al., 1994; Menéndez et al., 1996; Klein et al.,
2001]. As the metapelites compact, more stress is transmitted to the quartz grains. Therefore, grain
crushing likely occurs at or near the end of a test. In PAT1 (M) samples, despite the low porosity,
intragranular fractures are seldom observed (Fig. 7.9E). This suggests that stress variations were
relatively small and quartz grains were homogeneously loaded. If the pore-space solid-space ratio
controls quartz fracturing, it can be inferred that diffusion creep reduces pore space relatively evenly.
Alternatively if grain orientation or shape, are most important, diffusion creep leads to detrital quartz
SPO or grain shape homogenization, respectively.

159
Deformation structures:
In low-porosity HIP2 and PAT1 (I) metapelites (Fig. 7.9C-D, F) and for the full porosity
range for PAT1 (C), (P) and (M) metapelites (Fig. 7.10A,C-F), local space deficiency problems were
overcome by mica folding and kinking. The absence of such deformation structures in HIP1 samples
suggests that strain rate was higher than the rate at which pore space reduction could accommodate
strain during confined compression tests at 500 °C. When sufficient time was available, spatial
problems that arose during compaction could be overcome by clay transformation, leading to patches
of illite-phengite transition material (Fig. 7.9A). This notion indirectly implies that the illite-phengite
transformation is pressure sensitive. Illite preserved in pressure shadows of quartz clasts provides
evidence (Fig. 7.9D) for this. Other indirect evidence comes from the PAT1 (P) samples, as lowered
effective pressure results in lesser compaction (Fig. 7.1-2).
Authigenic biotite:
Authigenic biotite is frequently organized in complex patterns (Figs. 7.9C-D and 7.10D-E).
This is believed to reflect nucleation from a trapped fluid. As authigenic biotite is mostly found in the
metapelites with the lowest porosity, average and local permeability within the samples are very low.
Fluids migrate through connected pores, but get increasingly more confined as compaction reduces
the porosity. Remaining pores are mostly matrix-clast voids and matrix pores. The complex shape of
some authigenic biotite patches reflects the triangular and sheet-like matrix pores. Phengite
dehydroxylation is then a prerequisite for authigenic biotite.
Quartz precipitation:
Quartz precipitation is subject of debate in the study of sediment diagenesis. Silica released
during the smectite to illite transformation is considered an important source for both sandstone [e.g.
Towe, 1962; Boles and Franks, 1979; Leder and Park, 1986; Land et al., 1997; Lynch et al., 1997;
Land and Milliken, 2000; Van de Kamp, 2008; Day-Stirrat et al., 2010] and mudstone cementation
[Hower et al., 1976; Yeh and Savin, 1977; Small, 1994; Peltonen et al., 2009; Thyberg et al., 2010],
depending on the permeability of the system. The illite-phengite transformation is less studied but also
associated with silica release [Van de Kamp, 2008]. In the synthetic metapelites with porosity < 7 %,
released silica is recognized in the form of clay-sized authigenic quartz, comparably with observations
by Thyberg et al. [2010]. The elongated shape and alignment with the mica matrix suggests that the
quartz precipitated from a silica-rich fluid. The correlation between temperature, porosity and
occurrence of authigenic quartz strengthens the previously discussed importance of fluid availability
for compaction by diffusion creep.
The presence of authigenic quartz occurs simultaneously with smoothing of detrital quartz
grains. It was however not yet possible to distinguish whether the smoothing is the result of
precipitation or dissolution processes.

160

161
Chapter 10
Conclusions ________________________________________________________________
Mark Twain once said, “A banker is a fellow who lends you his umbrella when the sun is shining, but
wants it back the minute it begins to rain.”
Preface
This chapter summarizes the study and presents conclusions. The problem statement and
related questions, discussed in chapter 1 are re-iterated in subchapter 10.1. The most important findings, presented in chapters 7 and 8, are summarized in bullet form in subchapter 10.2. The next subchapter summarizes the discussion of chapter 9 and draws conclusions. This chapter concludes with a short outlook for research on chemical compaction of clay-rich sediments.
162
10.1: Problem statement
The fact that clay transformation and dissolution/precipitation processes greatly influence
rock physical properties during mudstone/shale burial has been extensively demonstrated [e.g. Van
der Pluijm et al., 1998; Ho et al., 1999; Aplin et al., 2006; Day-Stirrat et al., 2008; Thyberg et al.,
2010] . Implementation in modeling of basin evolution has been advocated by e.g. Bjørlykke and
Høeg [1997]. Nevertheless, experimental simulation of clay diagenesis has previously focused almost
exclusively on mechanical compaction, while chemical compaction was considered to be too slow for
reliable laboratory simulations of diagenesis [e.g. Nygård et al., 2004; Mondol et al., 2007; Fawad et
al., 2010].
Numerical simulations of basin evolution have been shown to be accurate, especially when
non-vertical tectonic stresses, as argued by Aplin and Vasseur [1998] and Luo et al. [1998], are
incorporated [Pouya et al., 1998]. However, experimental compaction studies supporting the
theorized role of tectonic stress and providing an important opportunity to calibrate and validate such
models are scarce [Jones and Addis, 1986; Nygård et al., 2004].
This thesis reports the first laboratory simulations of mechanical and chemical compaction
designed to replicate the conditions typical in deep sedimentary systems, using natural illite-rich
sediment. Two main questions were posed:<
1. Can chemical compaction of clay be simulated in the laboratory?
2. How does the stress regime affect clay compaction?
To address these questions, experiments were designed along a three-stage compaction
procedure. In the first compaction stage, natural illite shale powder, derived from Maplewood Shale
(New York, USA), was compacted in a hydraulic cold-press with a vertical load of 200 MPa. Further
compaction was achieved during the second compaction stage in a hot isostatic press with applied
temperature of 590 °C and isostatic stress of 170 to 172 MPa. In the third and final stage, compaction
was continued either in the hot isostatic press for a second run, or in a Paterson apparatus. In the latter
case, an isostatic stress, confined compression or confined torsion stress regime at 300 MPa confining
pressure, and a temperature of 500 °C, 650 °C, 700 °C or 750 °C were applied. The effect of other
extrinsic parameters such as strain rate, fluid venting and effective pressure were also tested.
Forward modeling of the anticipated mineral reactions was done using a PERPLE_X build
phase stability diagram for Maplewood Shale composition, taking into consideration water content,
temperature and pressure.
163
10.2: Main findings
The progress and mechanism of compaction during the various stages of the experimental
procedure were monitored by measuring porosity, density and magnetic properties after each
compaction stage. Detailed chemical analysis was performed using XRD and KFT methods, while
SEM imaging was used for mineral and pore identification, and fabric development during
compaction. In Paterson apparatus tests, sample strength was monitored and when applicable, the
stress exponent of the flow was determined. Sample strain (radial, axial and volumetric) was
measured for the construction of deformation paths, which gave insight in the compaction efficiency
during axial straining. A summary of the main findings follows:
Experimental compaction of illite shale powder results in porous metapelites, with connected
porosity ranging from 1.0 % to 17.1 %. Two sample subsets are identified from bulk density-
porosity data, related to quartz/mica fractions in the samples. Density increases approximately
linearly as a function of porosity reduction, regardless of the stress regime during compaction.
Finite volumetric strain in relation to porosity reduction shows that strain is primarily
accommodated by pore space collapse. A gradient of compaction increasing with temperature
is identified. Room temperature tests result in nearly zero finite volumetric strain and porosity
increase.
Finite axial and radial strains confirm a stress regime dependency. The strain character of
samples compacted in confined torsion and isostatic stress is described as non-uniform
contraction, whereas that of confined compression samples is better described as flattening.
The style of flattening of samples during confined compression tests is controlled by
temperature and axial strain.
Three types of strength evolution with axial straining are identified. Continuous nearly linear
hardening, with no strain rate dependence, is displayed by all porous metapelites compressed
at 500 °C and 650 °C, and by 700 °C metapelites when effective pressure is lowered or the
sample is drained during the experiment. In other confined compression tests performed at
700 °C, strain-rate dependent continuous hardening is seen. The third deformation behavior is
observed during confined compression experiments conducted between 700 °C and 750 °C.
These stress/strain curves initially display hardening, but reach steady state flow or even
strain weakening within 10 % axial strain. Calculated values for the stress exponent indicated
diffusion creep flow behavior.
The monitoring of sample strength during confined torsion tests is hampered by unwanted slip
along assembly spacers or pistons. The maximum strain achieved during a single test is γ =
0.10.

164
XRD spectra of synthetic metapelites of all samples groups reveal an enhanced phengite and
biotite crystallinity, and the disappearance of smectite, clinochlore and apatite.
The amount of dehydration and dehydroxylation of original Maplewood Shale is controlled
by the maximum temperature during the experimental compaction stages. For half of the 500
°C PAT1 samples the remaining water content is lower than the critical value that marks the
boundary of the modeled phase stability fields II and VII. For none of the higher temperature
PAT1 metapelites, except for the single drained sample, the water content after compaction
stage 3b is below 1.0 wt. %, which marks the boundary between fields IV and V, and field VI.
SEM analysis on both isostatically compacted metapelites and those compacted by
differential stress show a correlation between illite and mica content, and porosity. Porosity
decreases as more illite is transformed to phengite.
The illite to phengite transformation is accompanied by 1) enhanced grain alignment seen in
SEM images and quantified by paramagnetic AMS, and 2) authigenic quartz formation.
(Semi)-ductile deformation structures such as microfolds and mica kinks are observed in 1)
low- to high-porosity metapelites that are compacted by differential stress, and 2) the low-
porosity (< 5 %) isostatically compacted metapelites.
As porosity decreases, clay micropores start to disappear. Other pore types are preserved and
a new type of pores (intragranular fractures) associated with rigid clasts is generated.
10.3: Conclusions
In this study, mechanical and chemical compaction of clay-rich sediments was successfully
simulated in the laboratory. In the first of three stages compaction was achieved by mechanical
processes whereas in subsequent stages chemical compaction dominated. The transformation of illite
into phengite, closing clay micropores, and mineral precipitation from fluids accounted for the
chemical compaction. It is demonstrated that fluid availability, for which temperature and pressure are
key parameters, is a prerequisite for chemical compaction. Heat is required to drive water molecules
out of the crystal lattice, whereas fluid release is restricted by pore pressure, and illite is preserved in
pressure shadows. Deformation enhances chemical compaction. Deformation structures appear locally
when strain accommodation by clay transformation and mass transfer is exhausted (isostatic
compaction) or too slow (deformation-induced compaction).
Deformation of compacting metapelites is described by a temperature controlled deformation
path in radial and axial strain space. These paths give insight in the accommodation of axial strain.
Strain is first accommodated by closure of pore space. Beyond the intersection point of the
deformation path with the line for uniaxial strain (i.e. zero radial strain), axial straining is
accommodated by radial extension. Radial extension is often associated with sample dilation and
165
preserves a minimum porosity. The onset of radial extension moves to higher axial strain for higher
temperatures, and is coupled to the ability of diffusion creep to accommodate strain. Radial extension
of the sample is organized predominantly, by diffusion creep that allows mass transfer along a
pressure gradient. Pore space collapse is independent of strain rate or temperature and results in nearly
linear compaction hardening; leading to sample strengths ≥ 500 MPa at 8 % axial strain. Diffusion
creep weakens the sample by at least 50 %, depending on the strain rate and temperature. Strain rate
sensitive hardening is the result of the combined effects of pore space closing and diffusion creep. The
switch in dominant deformation mechanism, brought about by dehydroxylation and/or axial strain, is
not accompanied by solid grain deformation. Permanent compaction is finally achieved only by clay
transformation and mass transfer. However, pore space closure is temporary and reversed after
unloading, leading, for some low-temperature experiments, to eventual decompaction and higher
porosity.
The degree of compaction in the synthetic metapelites is controlled primarily by the progress
of the illite to phengite transformation. The linear increase of the paramagnetic AMS with decreasing
porosity reflects the gradual phengitization of the compacting metapelites. Biotite forms at the
expense of phengite, without closing pores, but with greater AMS. Fluids hamper foliation
development, as precipitation is steered by pressure gradients reflecting sample heterogeneities.
Restricted fluid flow and on site illite to phengite transformation results in enhanced paramagnetic
AMS.
This study demonstrates that chemical compaction processes can be simulated in the
laboratory. To make this happen elevated temperature and pressure conditions are required. Forward
phase stability modeling is useful for selecting these conditions. Furthermore, this study shows that,
besides temperature and pressure, differential stress also is an actor of chemical compaction
processes. To conclude, in deep basin systems, tectonic stress is unlikely to have a dramatic effect on
the intrinsic properties of compacted argillaceous sediments.
10.4: Recommendations for further research
Now that chemical compaction of illite shale in the laboratory has been achieved, a wide
range of follow-up studies may be developed, from detailed microstructural investigations, to physical
properties measurements, and other compaction tests using specifically chosen source material. The
following is a description of a small number of key questions worth investigating.
Authigenic quartz:
The origin of quartz cement in both sandstones and mudstones is poorly understood if not
controversial. Detailed knowledge about the controlling parameters and boundary conditions are

166
essential for the correct interpretation of naturally occurring authigenic quartz and sediment
cementation. Simulation of chemical compaction can provide that required knowledge.
To solve the uncertainties about the origin of the smoothing of detrital quartz, two methods
are proposed. First, detailed image analysis may provide sufficient information on the grain size
distribution of detrital quartz before and after compaction tests. Alternatively, high-resolution
cathodoluminescence (CL) SEM analysis, (as used in e.g. Peltonen et al. [2009] and Thyberg et al.
[2010]) can be used to discriminate authigenic from detrital quartz, provided the detrital quartz grains
contain lattice defects.
Clay/mica texture development:
The smectite to illite transformation marks a prominent increase in crystal alignment [e.g.
Bowles et al., 1969; Ho et al., 1999; Aplin et al., 2003; Charpentier et al., 2003; Worden et al., 2005].
Similar observations are made with the illite to phengite transformation. Measurements of the
magnetic fabric provided a first quantitative description of the texture development. However, it is
recommended that quantitative texture analysis is performed on the synthetic metapelites. X-ray
texture goniometry (XTG) [e.g. Van der Pluijm et al., 1994; Ho et al., 1999; Day-Stirrat et al., 2011]
and the recently developed synchrotron diffraction technique [e.g. Bäckstrøm et al., 1996; Heidelbach
et al., 1999, Wenk et al., 2004; Voltolini et al., 2009] are useful techniques for detailed quantification
of phyllosilicates texture.
Silver Hill shale powder compaction tests:
Shales are notorious for their diversity. The effect of intrinsic parameters on chemical
compaction should be investigated by applying the experimental procedure of this study to, for
example, Silver Hill shale. It is expected that mica kinking and folding are more common in the silty
Silver Hill shale than in the clayey Maplewood Shale. The formation conditions for ferrimagnetic
iron-sulphides can be tested and constrained by compacting Silver Hill shale powder using the hot
isostatic press.
Detailed SEM pore analysis on enhanced polished surfaces and mercury porosimetry analysis:
SEM image quality at high-resolution is strongly affected by the quality of the polish.
Topographic effects severely affect the BSE images, especially in high-porosity synthetic metapelites,
complicating mineral identification. Recent developments in SEM technology permit, very high
quality sample polishing by argon milling [e.g. Loucks et al., 2009] or focus-ion-beam (FIB) [e.g.
Desbois et al., 2009; Heath et al., 2011]. Applying one of these polishing techniques to the synthetic
metapelites and imaging in SEM will provide a clearer view of the pore types and their development
during chemical compaction. Enhanced polish will also provide better chemical information.

167
Finally, a quantitative description of pore throat development further enhances the
understanding of chemical compaction processes. Mercury porosimetry analysis can determine the
contribution of each pore throat radius to the total connected porosity. Changes in pore throat radii
contribution gives insight in which pore types during compaction are closing or remaining [e.g.
Armitage et al., 2010]. Such information is essential for permeability modeling [e.g. Bernabé et al.,
1982; Yang and Aplin, 1998; Dewhurst et al., 1999; Zhu et al., 1999], which, with the future
continuous use of enhanced hydrocarbon extraction technologies from shales (such as hydraulic
fracturing in shale gas), is likely to become a major goal.

168
169
References
Abel, A., and Muir, H., 1972, The Bauschinger effect and discontinuous yielding: Philosophical Magazine, v. 26, no.
2, p. 489-504, doi: 10.1080/14786437208227444.
Adams, F.D., and Nicolson, J.T., 1900, An experimental investigation into the flow of marble: Philosophical
Transactions of the Royal Society of London, v. 195, p. 363-U80.
Almqvist, B.S.G., Hirt, A.M., Schmidt, V., and Dietrich, D., 2009, Magnetic fabrics of the Morcles Nappe complex: Tectonophysics, v. 466, no. 1-2, p. 89-100, doi: 10.1016/j.tecto.2008.07.014.
Anson, G.L., and Kodama, K.P., 1987, Compaction-induced inclination shallowing of the post-depositional remanent
magnetization in a synthetic sediment: Geophysical Journal of the Royal Astronomical Society, v. 88, no. 3, p.
673-692, doi: 10.1111/j.1365-246X.1987.tb01651.x.
Antao, S.M., and Hassan, I., 2010, Temperature dependence of the structural parameters in the transformation of
aragonite to calcite, as determined from in situ synchrotron powder X-ray-diffraction data: The Canadian
Mineralogist, v. 48, no. 5, p. 1225-1236, doi: 10.3749/canmin.48.5.1225.
Antao, S.M., Hassan, I., Wang, J., Lee, P.L., and Toby, B.H., 2008, State-of-the-art high-resolution powder X-ray
diffraction (HRPXRD) illustrated with Rietveld structure refinement of quartz, sodalite, tremolite, and meionite:
The Canadian Mineralogist, v. 46, no. 6, p. 1501-1509, doi: 10.3749/canmin.46.5.1501.
Aoyagi, K., and Asakawa, T., 1980, Primary migration theory of petroleum and its application to petroleum
exploration: Organic Geochemistry, v. 2, p. 33-43, doi: 10.1016/0146-6380(80)90018-2.
Aoyagi, K., Kazama, T., Sekiguchi, K., and Chilingarian, G.V., 1985, Experimental compaction of Na-
montmorillonite clay mixed with crude oil and seawater: Chemical Geology, v. 49, p. 385-392, doi:
10.1016/0009-2541(85)90170-6.
Aplin, A.C., and Vasseur, G., 1998, Some new developments for modelling the geological compaction of fine-grained
sediments: introduction: Marine and Petroleum Geology, v. 15, p. 105-108, doi: 10.1016/S0264-8172(98)00007-5.
Aplin, A.C., Matenaar, I.F., and Van der Pluijm, B.A., 2003, Influence of mechanical compaction and chemical
diagenesis on the microfabric and fluid flow properties of Gulf of Mexico mudstones: Journal of Geochemical
Exploration, v. 78-79, p. 449-451, doi: 10.1016/S0375-6742(03)00035-9.
Aplin, A.C., Matenaar, I.F., McCarty, D.K., and Van der Pluijm, B.A., 2006, Influence of mechanical compaction and
clay mineral diagenesis on the microfabric and pore-scale properties of deep-water Gulf of Mexico mudstones:
Clays and Clay Minerals, v. 54, p. 500-514, doi: 10.1346/CCMN.2006.0540411.
Arason, P., and Levi, S., 1990, Compaction and inclination shallowing in deep-sea sediments from the Pacific Ocean:
Journal of Geophysical Research, v. 95, no. B4, p. 4501-4510, doi: 10.1029/JB095iB04p04501.
Armitage, P.J., Worden, R.H., Faulkner, D.R., Aplin, A.C., Butcher, A.R., and Iliffe, J., 2010, Diagenetic and
sedimentary controls on porosity in Lower Carboniferous fine-grained lithologies, Krechba field, Algeria: A
petrological study of a caprock to a carbon capture site: Marine and Petroleum Geology, v. 27, p. 1395-1410,
doi: 10.1016/j.marpetgeo.2010.03.018.
Athy, L.F., 1930, Density, porosity, and compaction of sedimentary rocks: American Association of Petroleum
Geologists Bulletin, v. 14, no. 1, p. 25-35.
Audet, D.M., and Fowler, A.C., 1992, A mathematical model for compaction in sedimentary basins: Geophysical
Journal International, v. 110, p. 577-590, doi: 10.1111/j.1365-246X.1992.tb02093.x.
Audet, D.M., and McConnell, J.D.C., 1992, Forward modelling of porosity and pore pressure evolution in sedimentary basins: Basin Research, v. 4, p. 147-162, doi: 10.1111/j.1365-2117.1992.tb00137.x.
Austin, N., Evans, B., Herwegh, M., and Ebert, A., 2008, Strain localization in the Morcles nappe (Helvetic Alps,
Switzerland): Swiss Journal of Geosciences, v. 101, no. 2, p. 341-360, doi: 10.1007/s00015-008-1264-2.
Bäckstrøm, S.P., Riekel, C., Abel, S., Lehr, H., and Wenk, H.-R., 1996, Microtexture analysis by synchrotron-
radiation X-ray diffraction of nickel–iron alloys prepared by microelectroplating: Journal of Applied
Crystallography, v. 29, p. 118-124, doi: 10.1107/S0021889895009733.
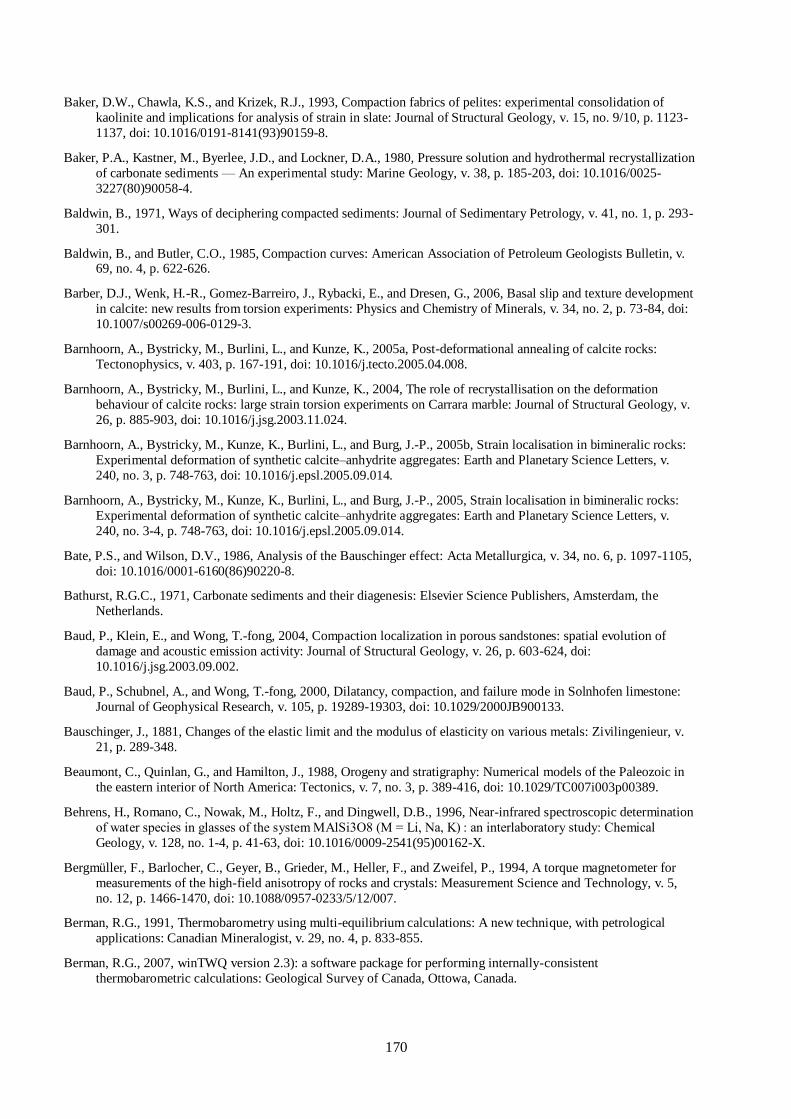
170
Baker, D.W., Chawla, K.S., and Krizek, R.J., 1993, Compaction fabrics of pelites: experimental consolidation of
kaolinite and implications for analysis of strain in slate: Journal of Structural Geology, v. 15, no. 9/10, p. 1123-
1137, doi: 10.1016/0191-8141(93)90159-8.
Baker, P.A., Kastner, M., Byerlee, J.D., and Lockner, D.A., 1980, Pressure solution and hydrothermal recrystallization
of carbonate sediments — An experimental study: Marine Geology, v. 38, p. 185-203, doi: 10.1016/0025-
3227(80)90058-4.
Baldwin, B., 1971, Ways of deciphering compacted sediments: Journal of Sedimentary Petrology, v. 41, no. 1, p. 293-
301.
Baldwin, B., and Butler, C.O., 1985, Compaction curves: American Association of Petroleum Geologists Bulletin, v. 69, no. 4, p. 622-626.
Barber, D.J., Wenk, H.-R., Gomez-Barreiro, J., Rybacki, E., and Dresen, G., 2006, Basal slip and texture development
in calcite: new results from torsion experiments: Physics and Chemistry of Minerals, v. 34, no. 2, p. 73-84, doi:
10.1007/s00269-006-0129-3.
Barnhoorn, A., Bystricky, M., Burlini, L., and Kunze, K., 2005a, Post-deformational annealing of calcite rocks:
Tectonophysics, v. 403, p. 167-191, doi: 10.1016/j.tecto.2005.04.008.
Barnhoorn, A., Bystricky, M., Burlini, L., and Kunze, K., 2004, The role of recrystallisation on the deformation
behaviour of calcite rocks: large strain torsion experiments on Carrara marble: Journal of Structural Geology, v.
26, p. 885-903, doi: 10.1016/j.jsg.2003.11.024.
Barnhoorn, A., Bystricky, M., Kunze, K., Burlini, L., and Burg, J.-P., 2005b, Strain localisation in bimineralic rocks:
Experimental deformation of synthetic calcite–anhydrite aggregates: Earth and Planetary Science Letters, v.
240, no. 3, p. 748-763, doi: 10.1016/j.epsl.2005.09.014.
Barnhoorn, A., Bystricky, M., Kunze, K., Burlini, L., and Burg, J.-P., 2005, Strain localisation in bimineralic rocks:
Experimental deformation of synthetic calcite–anhydrite aggregates: Earth and Planetary Science Letters, v.
240, no. 3-4, p. 748-763, doi: 10.1016/j.epsl.2005.09.014.
Bate, P.S., and Wilson, D.V., 1986, Analysis of the Bauschinger effect: Acta Metallurgica, v. 34, no. 6, p. 1097-1105,
doi: 10.1016/0001-6160(86)90220-8.
Bathurst, R.G.C., 1971, Carbonate sediments and their diagenesis: Elsevier Science Publishers, Amsterdam, the
Netherlands.
Baud, P., Klein, E., and Wong, T.-fong, 2004, Compaction localization in porous sandstones: spatial evolution of
damage and acoustic emission activity: Journal of Structural Geology, v. 26, p. 603-624, doi:
10.1016/j.jsg.2003.09.002.
Baud, P., Schubnel, A., and Wong, T.-fong, 2000, Dilatancy, compaction, and failure mode in Solnhofen limestone:
Journal of Geophysical Research, v. 105, p. 19289-19303, doi: 10.1029/2000JB900133.
Bauschinger, J., 1881, Changes of the elastic limit and the modulus of elasticity on various metals: Zivilingenieur, v.
21, p. 289-348.
Beaumont, C., Quinlan, G., and Hamilton, J., 1988, Orogeny and stratigraphy: Numerical models of the Paleozoic in
the eastern interior of North America: Tectonics, v. 7, no. 3, p. 389-416, doi: 10.1029/TC007i003p00389.
Behrens, H., Romano, C., Nowak, M., Holtz, F., and Dingwell, D.B., 1996, Near-infrared spectroscopic determination
of water species in glasses of the system MAlSi3O8 (M = Li, Na, K) : an interlaboratory study: Chemical
Geology, v. 128, no. 1-4, p. 41-63, doi: 10.1016/0009-2541(95)00162-X.
Bergmüller, F., Barlocher, C., Geyer, B., Grieder, M., Heller, F., and Zweifel, P., 1994, A torque magnetometer for
measurements of the high-field anisotropy of rocks and crystals: Measurement Science and Technology, v. 5,
no. 12, p. 1466-1470, doi: 10.1088/0957-0233/5/12/007.
Berman, R.G., 1991, Thermobarometry using multi-equilibrium calculations: A new technique, with petrological
applications: Canadian Mineralogist, v. 29, no. 4, p. 833-855.
Berman, R.G., 2007, winTWQ version 2.3): a software package for performing internally-consistent
thermobarometric calculations: Geological Survey of Canada, Ottowa, Canada.

171
Bernabé, Y., Brace, W.F., and Evans, B., 1982, Permeability, porosity and pore geometry of hot-pressed calcite:
Mechanics of Materials, v. 1, p. 173-183, doi: 10.1016/0167-6636(82)90010-2.
Bestmann, M., Kunze, K., and Matthews, A., 2000, Evolution of a calcite marble shear zone complex on Thassos
Island, Greece: microstructural and textural fabrics and their kinematic significance: Journal of Structural
Geology, v. 22, p. 1789-1807, doi: 10.1016/S0191-8141(00)00112-7.
Bésuelle, P., Baud, patrick, and Wong, T.-F., 2003, Failure mode and spatial distribution of damage in Rothbach
sandstone in the brittle-ductile transition: Pure and Applied Geophysics, v. 160, p. 851-868, doi:
10.1007/PL00012569.
Bethke, C.M., 1985, A numerical model of compaction-driven groundwater flow and heat transfer and its application to the paleohydrology of intracratonic sedimentary basins: Journal of Geophysical Research, v. 90, no. B8, p.
6817-6828, doi: 10.1029/JB090iB08p06817.
Biot, M.A., 1941, General Theory of Three-Dimensional Consolidation: Journal of Applied Physics, v. 12, p. 155, doi:
10.1063/1.1712886.
Bish, D.L., and Von Dreele, R.B., 1989, Rietveld refinement of non-hydrogen atomic positions in kaolinite: Clays and
Clay Minerals, v. 37, no. 4, p. 289-296, doi: 10.1346/CCMN.1989.0370401.
Bjørlykke, K., 1988, Sandstone diagenesis in relation to preservation, destruction and creation of porosity, in
Chilingarian, G.V. and Wolf, K.H. eds., Diagenesis I, Developments in sedimentology 41, Elsevier Science
Publishers, Amsterdam, the Netherlands, p. 555-588.
Bjørlykke, K., and Høeg, K., 1997, Effects of burial diagenesis on stresses, compaction and fluid flow in sedimentary
basins: Marine and Petroleum Geology, v. 14, no. 3, p. 267-276, doi: 10.1016/S0264-8172(96)00051-7.
Blackwelder, E., 1920, The origin of the central Kansas oil domes: American Association of Petroleum Geologists
Bulletin, v. 4, no. 10, p. 39-94.
Blow, R.A., and Hamilton, N., 1978, Effect of compaction on the acquisition of a detrital remanent magnetization in
fine-grained sediments: Geophysical Journal of the Royal Astronomical Society, v. 52, no. 1, p. 13-23, doi:
10.1111/j.1365-246X.1978.tb04219.x.
Bohlen, S.R., Peacor, D.R., and Essene, E.J., 1980, Crystal chemistry of a metamorphic biotite and its significance in water barometry: American Mineralogist, v. 65, no. 1-2, p. 55-62.
Boles, J.R., and Franks, S.G., 1979, Clay diagenesis in Wilcox sandstones of southwest Texas: Implications of
smectite diagenesis on sandstone cementation: Journal of Sedimentary Petrology, v. 49, no. 1, p. 55-70, doi:
10.1306/212F76BC-2B24-11D7-8648000102C1865D.
Bons, P.D., and Urai, J.L., 1996, An apparatus to experimentally model the dynamics of ductile shear zones:
Tectonophysics, v. 256, p. 145-164, doi: 10.1016/0040-1951(95)00161-1.
Borradaile, G.J., and Henry, B., 1997, Tectonic applications of magnetic susceptibility and its anisotropy: Earth-
Science Reviews, v. 42, no. 1-2, p. 49-93, doi: 10.1016/S0012-8252(96)00044-X.
Bos, B., Peach, C.J., and Spiers, C.J., 2000, Frictional-viscous flow of simulated fault gouge caused by the combined
effects of phyllosilicates and pressure solution: Tectonophysics, v. 327, p. 173-194, doi: 10.1016/S0040-
1951(00)00168-2.
Bowles, F.A., Bryant, W.R., and Wallin, C., 1969, Microstructure of unconsolidated and consolidated marine
sediments: Journal of Sedimentary Petrology, v. 39, no. 4, p. 1546-1551, doi: 10.1306/74D71E7E-2B21-11D7-
8648000102C1865D.
Brace, W.F., 1978, Volume changes during fracture and frictional sliding: A review: Pure and Applied Geophysics, v.
116, no. 4-5, p. 603-614, doi: 10.1007/BF00876527.
Bradley, D.C., and Kidd, W.S.F., 1991, Flexural extension of the upper continental crust in collisional foredeeps: Geological Society of America Bulletin, v. 103, no. 11, p. 1416-1438, doi: 10.1130/0016-
7606(1991)103<1416:FEOTUC>2.3.CO;2.
Brett, C.E., and Baird, G.C., 2002, Revised stratigraphy of the Trenton Group in its type area, central New York State:
sedimentology and tectonics of a Middle Ordovician shelf-to-basin succession: Physics and Chemistry of the
Earth, v. 27, p. 231-263, doi: 10.1016/S1474-7065(01)00007-9.
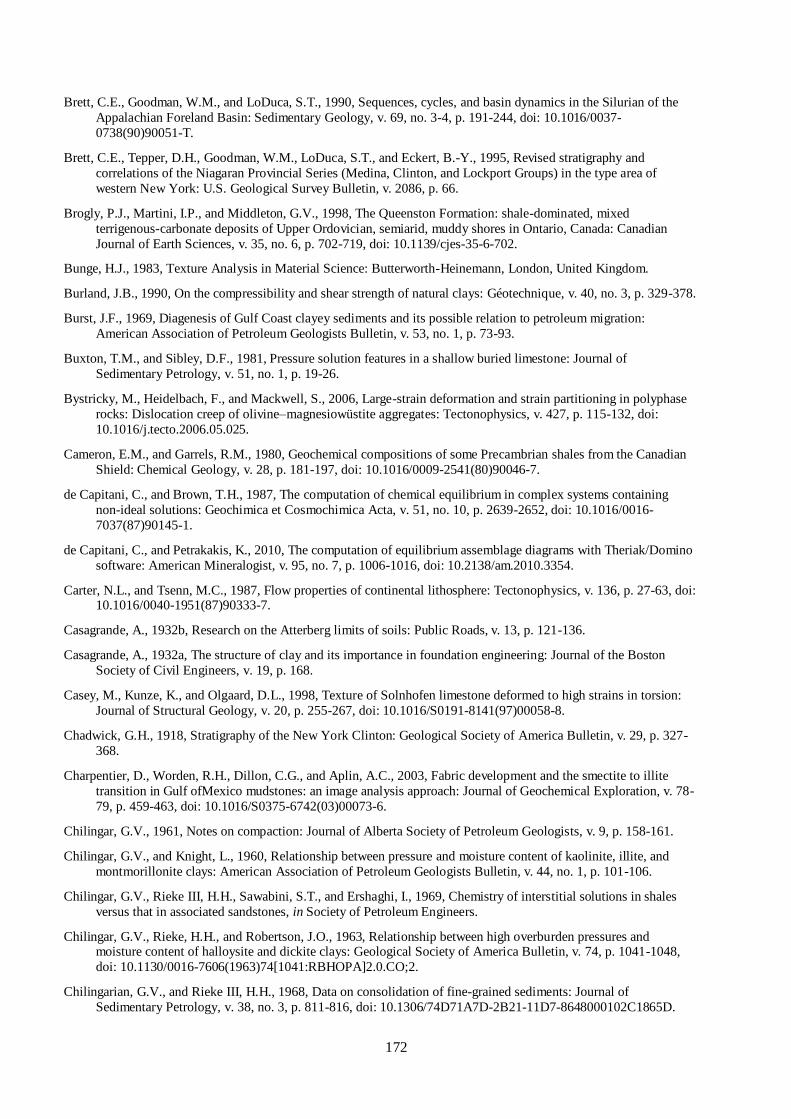
172
Brett, C.E., Goodman, W.M., and LoDuca, S.T., 1990, Sequences, cycles, and basin dynamics in the Silurian of the
Appalachian Foreland Basin: Sedimentary Geology, v. 69, no. 3-4, p. 191-244, doi: 10.1016/0037-
0738(90)90051-T.
Brett, C.E., Tepper, D.H., Goodman, W.M., LoDuca, S.T., and Eckert, B.-Y., 1995, Revised stratigraphy and
correlations of the Niagaran Provincial Series (Medina, Clinton, and Lockport Groups) in the type area of
western New York: U.S. Geological Survey Bulletin, v. 2086, p. 66.
Brogly, P.J., Martini, I.P., and Middleton, G.V., 1998, The Queenston Formation: shale-dominated, mixed
terrigenous-carbonate deposits of Upper Ordovician, semiarid, muddy shores in Ontario, Canada: Canadian
Journal of Earth Sciences, v. 35, no. 6, p. 702-719, doi: 10.1139/cjes-35-6-702.
Bunge, H.J., 1983, Texture Analysis in Material Science: Butterworth-Heinemann, London, United Kingdom.
Burland, J.B., 1990, On the compressibility and shear strength of natural clays: Géotechnique, v. 40, no. 3, p. 329-378.
Burst, J.F., 1969, Diagenesis of Gulf Coast clayey sediments and its possible relation to petroleum migration:
American Association of Petroleum Geologists Bulletin, v. 53, no. 1, p. 73-93.
Buxton, T.M., and Sibley, D.F., 1981, Pressure solution features in a shallow buried limestone: Journal of
Sedimentary Petrology, v. 51, no. 1, p. 19-26.
Bystricky, M., Heidelbach, F., and Mackwell, S., 2006, Large-strain deformation and strain partitioning in polyphase
rocks: Dislocation creep of olivine–magnesiowüstite aggregates: Tectonophysics, v. 427, p. 115-132, doi:
10.1016/j.tecto.2006.05.025.
Cameron, E.M., and Garrels, R.M., 1980, Geochemical compositions of some Precambrian shales from the Canadian
Shield: Chemical Geology, v. 28, p. 181-197, doi: 10.1016/0009-2541(80)90046-7.
de Capitani, C., and Brown, T.H., 1987, The computation of chemical equilibrium in complex systems containing
non-ideal solutions: Geochimica et Cosmochimica Acta, v. 51, no. 10, p. 2639-2652, doi: 10.1016/0016-
7037(87)90145-1.
de Capitani, C., and Petrakakis, K., 2010, The computation of equilibrium assemblage diagrams with Theriak/Domino
software: American Mineralogist, v. 95, no. 7, p. 1006-1016, doi: 10.2138/am.2010.3354.
Carter, N.L., and Tsenn, M.C., 1987, Flow properties of continental lithosphere: Tectonophysics, v. 136, p. 27-63, doi: 10.1016/0040-1951(87)90333-7.
Casagrande, A., 1932b, Research on the Atterberg limits of soils: Public Roads, v. 13, p. 121-136.
Casagrande, A., 1932a, The structure of clay and its importance in foundation engineering: Journal of the Boston
Society of Civil Engineers, v. 19, p. 168.
Casey, M., Kunze, K., and Olgaard, D.L., 1998, Texture of Solnhofen limestone deformed to high strains in torsion:
Journal of Structural Geology, v. 20, p. 255-267, doi: 10.1016/S0191-8141(97)00058-8.
Chadwick, G.H., 1918, Stratigraphy of the New York Clinton: Geological Society of America Bulletin, v. 29, p. 327-
368.
Charpentier, D., Worden, R.H., Dillon, C.G., and Aplin, A.C., 2003, Fabric development and the smectite to illite
transition in Gulf ofMexico mudstones: an image analysis approach: Journal of Geochemical Exploration, v. 78-
79, p. 459-463, doi: 10.1016/S0375-6742(03)00073-6.
Chilingar, G.V., 1961, Notes on compaction: Journal of Alberta Society of Petroleum Geologists, v. 9, p. 158-161.
Chilingar, G.V., and Knight, L., 1960, Relationship between pressure and moisture content of kaolinite, illite, and
montmorillonite clays: American Association of Petroleum Geologists Bulletin, v. 44, no. 1, p. 101-106.
Chilingar, G.V., Rieke III, H.H., Sawabini, S.T., and Ershaghi, I., 1969, Chemistry of interstitial solutions in shales
versus that in associated sandstones, in Society of Petroleum Engineers.
Chilingar, G.V., Rieke, H.H., and Robertson, J.O., 1963, Relationship between high overburden pressures and moisture content of halloysite and dickite clays: Geological Society of America Bulletin, v. 74, p. 1041-1048,
doi: 10.1130/0016-7606(1963)74[1041:RBHOPA]2.0.CO;2.
Chilingarian, G.V., and Rieke III, H.H., 1968, Data on consolidation of fine-grained sediments: Journal of
Sedimentary Petrology, v. 38, no. 3, p. 811-816, doi: 10.1306/74D71A7D-2B21-11D7-8648000102C1865D.
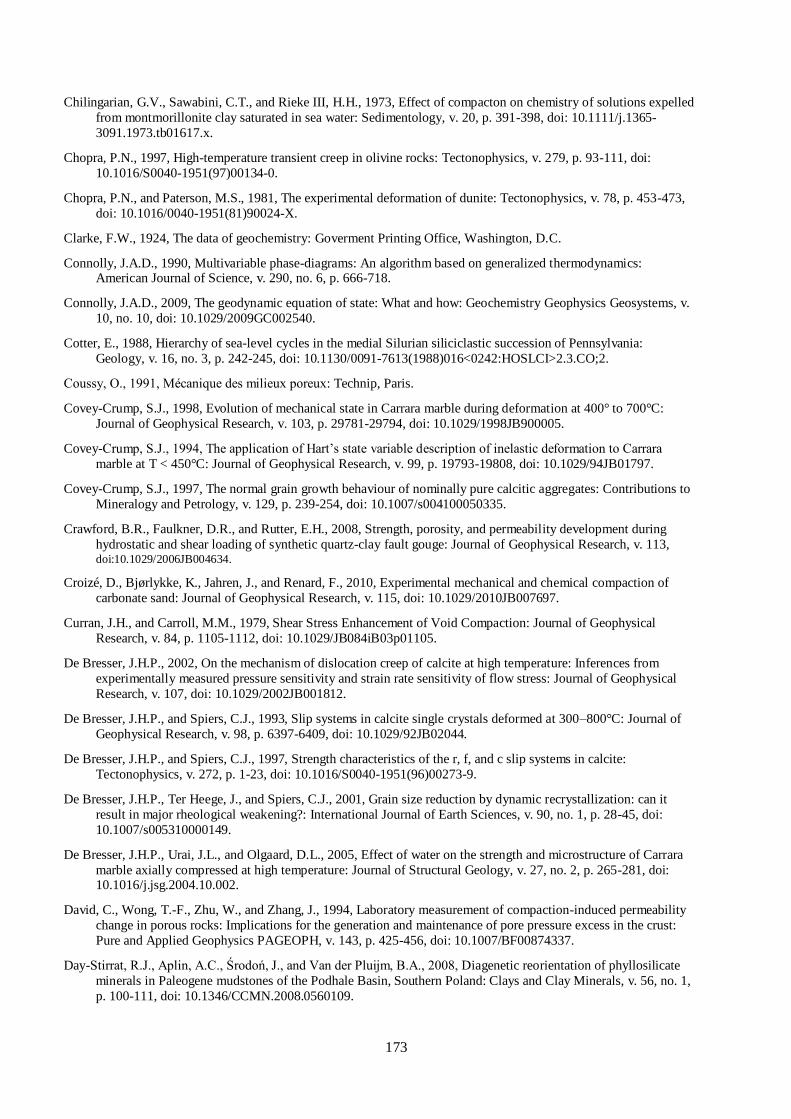
173
Chilingarian, G.V., Sawabini, C.T., and Rieke III, H.H., 1973, Effect of compacton on chemistry of solutions expelled
from montmorillonite clay saturated in sea water: Sedimentology, v. 20, p. 391-398, doi: 10.1111/j.1365-
3091.1973.tb01617.x.
Chopra, P.N., 1997, High-temperature transient creep in olivine rocks: Tectonophysics, v. 279, p. 93-111, doi:
10.1016/S0040-1951(97)00134-0.
Chopra, P.N., and Paterson, M.S., 1981, The experimental deformation of dunite: Tectonophysics, v. 78, p. 453-473,
doi: 10.1016/0040-1951(81)90024-X.
Clarke, F.W., 1924, The data of geochemistry: Goverment Printing Office, Washington, D.C.
Connolly, J.A.D., 1990, Multivariable phase-diagrams: An algorithm based on generalized thermodynamics: American Journal of Science, v. 290, no. 6, p. 666-718.
Connolly, J.A.D., 2009, The geodynamic equation of state: What and how: Geochemistry Geophysics Geosystems, v.
10, no. 10, doi: 10.1029/2009GC002540.
Cotter, E., 1988, Hierarchy of sea-level cycles in the medial Silurian siliciclastic succession of Pennsylvania:
Geology, v. 16, no. 3, p. 242-245, doi: 10.1130/0091-7613(1988)016<0242:HOSLCI>2.3.CO;2.
Coussy, O , , M cani ue des milieu poreu : Technip, Paris.
Covey-Crump, S.J., 1998, Evolution of mechanical state in Carrara marble during deformation at 400° to 700°C:
Journal of Geophysical Research, v. 103, p. 29781-29794, doi: 10.1029/1998JB900005.
Covey-Crump, S J , 4, The application of Hart’s state variable description of inelastic deformation to Carrara
marble at T < 450°C: Journal of Geophysical Research, v. 99, p. 19793-19808, doi: 10.1029/94JB01797.
Covey-Crump, S.J., 1997, The normal grain growth behaviour of nominally pure calcitic aggregates: Contributions to
Mineralogy and Petrology, v. 129, p. 239-254, doi: 10.1007/s004100050335.
Crawford, B.R., Faulkner, D.R., and Rutter, E.H., 2008, Strength, porosity, and permeability development during
hydrostatic and shear loading of synthetic quartz-clay fault gouge: Journal of Geophysical Research, v. 113, doi:10.1029/2006JB004634.
Croizé, D., Bjørlykke, K., Jahren, J., and Renard, F., 2010, Experimental mechanical and chemical compaction of
carbonate sand: Journal of Geophysical Research, v. 115, doi: 10.1029/2010JB007697.
Curran, J.H., and Carroll, M.M., 1979, Shear Stress Enhancement of Void Compaction: Journal of Geophysical
Research, v. 84, p. 1105-1112, doi: 10.1029/JB084iB03p01105.
De Bresser, J.H.P., 2002, On the mechanism of dislocation creep of calcite at high temperature: Inferences from
experimentally measured pressure sensitivity and strain rate sensitivity of flow stress: Journal of Geophysical
Research, v. 107, doi: 10.1029/2002JB001812.
De Bresser, J.H.P., and Spiers, C.J., 1993, Slip systems in calcite single crystals deformed at 300–800°C: Journal of
Geophysical Research, v. 98, p. 6397-6409, doi: 10.1029/92JB02044.
De Bresser, J.H.P., and Spiers, C.J., 1997, Strength characteristics of the r, f, and c slip systems in calcite:
Tectonophysics, v. 272, p. 1-23, doi: 10.1016/S0040-1951(96)00273-9.
De Bresser, J.H.P., Ter Heege, J., and Spiers, C.J., 2001, Grain size reduction by dynamic recrystallization: can it
result in major rheological weakening?: International Journal of Earth Sciences, v. 90, no. 1, p. 28-45, doi:
10.1007/s005310000149.
De Bresser, J.H.P., Urai, J.L., and Olgaard, D.L., 2005, Effect of water on the strength and microstructure of Carrara
marble axially compressed at high temperature: Journal of Structural Geology, v. 27, no. 2, p. 265-281, doi: 10.1016/j.jsg.2004.10.002.
David, C., Wong, T.-F., Zhu, W., and Zhang, J., 1994, Laboratory measurement of compaction-induced permeability
change in porous rocks: Implications for the generation and maintenance of pore pressure excess in the crust:
Pure and Applied Geophysics PAGEOPH, v. 143, p. 425-456, doi: 10.1007/BF00874337.
Day-Stirrat, R J , Aplin, A C , Środoń, J , and Van der Pluijm, B A , 2008, Diagenetic reorientation of phyllosilicate
minerals in Paleogene mudstones of the Podhale Basin, Southern Poland: Clays and Clay Minerals, v. 56, no. 1,
p. 100-111, doi: 10.1346/CCMN.2008.0560109.
174
Day-Stirrat, R.J., Milliken, K.L., Dutton, S.P., Loucks, R.G., Hillier, S., Aplin, A.C., and Schleicher, A.M., 2010,
Open-system chemical behavior in deep Wilcox Group mudstones, Texas Gulf Coast, USA: Marine and
Petroleum Geology, v. 27, no. 9, p. 1804-1818, doi: 10.1016/j.marpetgeo.2010.08.006.
Day-Stirrat, R.J., Schleicher, A.M., Schneider, J., Flemings, P.B., Germaine, J.T., and van der Pluijm, B.A., 2011,
Preferred orientation of phyllosilicates: effects of composition and stress on resedimented mudstone
microfabrics: Journal of Structural Geology, v. 33, p. 1347-1358, doi: 10.1016/j.jsg.2011.06.007.
Deamer, G.A., and Kodama, K.P., 1990, Compaction-induced inclination shallowing in synthetic and natural clay-rich
sediments: Journal of Geophysical Research, v. 95, no. B4, p. 4511-4529, doi: 10.1029/JB095iB04p04511.
Delle Piane, C., and Burlini, L., 2008, Influence of strain history on the mechanical and micro-fabric evolution of calcite rocks: insights from torsion experiments: Swiss Journal of Geosciences, v. 101, no. 2, p. 361-375, doi:
10.1007/s00015-008-1257-1.
Delle Piane, C., Burlini, L., and Kunze, K., 2009, The influence of dolomite on the plastic flow of calcite: rheological,
microstructural and chemical evolution during large strain torsion experiments: Tectonophysics, v. 467, p. 145-
166, doi: 10.1016/j.tecto.2008.12.022.
Delle Piane, C., Wilson, C.J.L., and Burlini, L., 2009, Dilatant plasticity in high-strain experiments on calcite–
muscovite aggregates: Journal of Structural Geology, v. 31, p. 1084-1099, doi: 10.1016/j.jsg.2009.03.005.
Desbois, G., Urai, J.L., and Kukla, P.A., 2009, Morphology of the pore space in claystones – evidence from BIB/FIB
ion beam sectioning and cryo-SEM observations: eEarth, v. 4, no. 1, p. 15-22, doi: 10.5194/ee-4-15-2009.
Dewhurst, D.N., Aplin, A.C., and Sarda, J.-P., 1999, Influence of clay fraction on pore-scale properties and hydraulic
conductivity of experimentally compacted mudstones: Journal of Geophysical Research, v. 104, p. 29261-
29274, doi: 10.1029/1999JB900276.
Dewhurst, D.N., Aplin, A.C., Sarda, J.-P., and Yang, Y., 1998, Compaction-driven evolution of porosity and
permeability in natural mudstones: An experimental study: Journal of Geophysical Research, v. 103, p. 651-661,
doi: 10.1029/97JB02540.
Dickey, P.A., 1975, Possible primary migration of oil from source rock in oil phase: American Association of
Petroleum Geologists Bulletin, v. 59, no. 2, p. 337-345.
Dickinson, G., 1953, Geological aspects of abnormal reservoir pressures in the Gulf Coast Louisiana: American
Association of Petroleum Geologists Bulletin, v. 37, no. 2, p. 410-432.
Djéran-Maigre, I., Tessier, D., Grunberger, D., Velde, B., and Vasseur, G., 1998, Evolution of microstructures and of
macroscopic properties of some clays during experimental compaction: Marine and Petroleum Geology, v. 15,
p. 109-128, doi: 10.1016/S0264-8172(97)00062-7.
Drits, V.A., Zviagina, B.B., McCarty, D.K., and Salyn, A.L., 2010, Factors responsible for crystal-chemical variations
in the solid solutions from illite to aluminoceladonite and from glauconite to celadonite: American Mineralogist,
v. 95, no. 2-3, p. 348-361, doi: 10.2138/am.2010.3300.
Dunlop, D.J., and Özdemir, Ö., 1997, Rock Magnetism: Fundamentals and frontiers: Cambridge University Press,
Cambridge, United Kingdom.
Dunnington, H.V., 1954, Stylolite development post-dates rock induration: Journal of Sedimentary Petrology, v. 24,
no. 1, p. 27-49, doi: 10.1306/D4269648-2B26-11D7-8648000102C1865D.
Durmishyan, A.G., 1974, Compaction of argillaceous rocks: International Geology Review, v. 16, no. 6, p. 650-653.
Earnest, C.M., 1991, Thermal analysis of selected illite and smectite clay minerals. Part I. Illite clay specimens, in
Smykatz-Kloss, W. and Warne, S.S.J. eds., Thermal Analysis in the Geosciences, Springer-Verlag,
Berlin/Heidelberg, p. 270-286.
Eberl, D.D., 1993, Three zones for illite formation during burial diagenesis and metamorphism: Clays and Clay Minerals, v. 41, no. 1, p. 26-37, doi: 10.1346/CCMN.1993.0410103.
Ehrenberg, S.N., 2006, Porosity destruction in carbonate platforms: Journal of Petroleum Geology, v. 29, p. 41-52,
doi: 10.1111/j.1747-5457.2006.00041.x.

175
El Bied, A., Sulem, J., and Martineau, F., 2002, Microstructure of shear zones in Fontainebleau sandstone:
International Journal of Rock Mechanics and Mining Sciences, v. 39, p. 917-932, doi: 10.1016/S1365-
1609(02)00068-0.
Engelder, T., 1979, The nature of deformation within the outer limits of the central appalachian foreland fold and
thrust belt in New York state: Tectonophysics, v. 55, no. 3-4, p. 289-310, doi: 10.1016/0040-1951(79)90181-1.
von Engelhardt, W., and Gaida, K.H., 1963, Concentration changes of pore solutions during the compaction of clay
sediments: Journal of Sedimentary Petrology, v. 33, no. 4, p. 919-930.
England, W.A., Mackenzie, A.S., Mann, D.M., and Quigley, T.M., 1987, The movement and entrapment of petroleum
fluids in the subsurface: Journal of the Geological Society, London, v. 144, p. 327-347, doi: 10.1144/gsjgs.144.2.0327.
Ettensohn, F.R., 1991, Flexural interpretation of relationships between Ordovician tectonism and stratigraphic
sequences, central and southern Appalachians, U.S.A., in Barnes, C.R. and Williams, S.H. eds., Advances in
Ordovician geology, Energy, Mines, and Resources Canada, Ottowa, Canada, p. 213-224.
Ettensohn, F.R., 2008, The Appalachian Foreland Basin in Eastern United States, in Miall, A. ed., Sedimentary Basins
of the United States and Canada, Sedimentary Basins of the World, Elsevier, Amsterdam, the Netherlands, p.
105-179.
Evans, B., and Kohlstedt, D., 1995, Rheology of rock, in Ahrends, T.J. ed., Rock Physics and Phase Relations: A
Handbook of Physical Constants, AGU Reference Shelf 3, AGU, Washington, D.C., p. 148-165.
Faill, R.T., 1997, A geological history of the north-central Appalachians, Part 2: The Appalachian basin from the
Silurian through the Carboniferous: American Journal of Science, v. 297, no. 7, p. 729-761.
Fawad, M., Mondol, N.H., Jahren, J., and Bjørlykke, K., 2010, Microfabric and rock properties of experimentally
compressed silt-clay mixtures: Marine and Petroleum Geology, v. 27, p. 1698-1712, doi:
10.1016/j.marpetgeo.2009.10.002.
Ferrill, D.A., 1998, Critical re-evaluation of differential stress estimates from calcite twins in coarse-grained
limestone: Tectonophysics, v. 285, p. 77-86, doi: 10.1016/S0040-1951(97)00190-X.
Fichter, L.S., and Diecchio, R.J., 1986, Stratigraphic model for timing the opening of the Proto–Atlantic Ocean in northern Virginia: Geology, v. 14, no. 4, p. 307-309, doi: 10.1130/0091-
7613(1986)14<307:SMFTTO>2.0.CO;2.
Fischer, G.J., and Paterson, M.S., 1989, Dilatancy during rock deformation at high temperatures and pressures:
Journal of Geophysical Research, v. 94, p. 17607-17618, doi: 10.1029/JB094iB12p17607.
Fowler, S.R., White, R.S., and Louden, K.E., 1985, Sediment dewatering in the Makran accretionary prism: Earth and
Planetary Science Letters, v. 75, no. 4, p. 427-438, doi: 10.1016/0012-821X(85)90186-4.
Fraser, H.J., 1935, Experimental Study of the porosity and permeability of clastic sediments: The Journal of Geology,
v. 43, no. 8, p. 910-1010, doi: 10.1086/624388.
Fredrich, J.T., Evans, B., and Paterson, T.-F., 1989, Micromechanics of the brittle to plastic transition in Carrara
marble: Journal of Geophysical Research, v. 94, p. 4129-4145, doi: 10.1029/JB094iB04p04129.
Frey, M., and Robinson, D., 1998, Low-Grade Metamorphism: Blackwell Science Ltd., Oxford, United Kingdom.
Friedman, G.M., 1987, Vertical movements of the crust: Case histories from the northern Appalachian Basin:
Geology, v. 15, no. 12, p. 1130-1133, doi: 10.1130/0091-7613(1987)15<1130:VMOTCC>2.0.CO;2.
Frost, H.J., and Ashby, M.F., 1982, Deformation-Mechanism Maps: The Plasticity and Creep of Metals and Ceramics:
Pergamon Press, Oxford, United Kingdom.
Fruth Jr., L.S., Orme, G.R., and Donath, F.A., 1966, Experimental compaction effects in carbonate sediments: Journal
of Sedimentary Petrology, v. 36, no. 3, p. 747-754, doi: 10.1306/74D7155F-2B21-11D7-8648000102C1865D.
González-Casado, J.M., Jiménez-Berrocoso, Á., García-Cuevas, C., and Elorza, J., 2003, Strain determinations using
inoceramid shells as strain markers: a comparison of the calcite strain gauge technique and the Fry method:
Journal of Structural Geology, v. 25, p. 1773-1778, doi: 10.1016/S0191-8141(03)00040-3.
Goultry, N.R., 1998, Relationships between porosity and effective stress in shales: First Break, v. 16, no. 12, p. 413-
419.
176
Gray, M.B., and Zeitler, P.K., 1997, Comparison of clastic wedge provenance in the Appalachian foreland using U/Pb
ages of detrital zircons: Tectonics, v. 16, no. 1, p. 151-160, doi: 10.1029/96TC02911.
Griggs, D., 1936, Deformation of rocks under high confining pressures: I. Experiments at room temperature: The
Journal of Geology, v. 44, no. 5, p. 541-577.
Griggs, D., and Miller, W.B., 1951, Deformation of Yule marble: part I – compression and extension experiments on
dry Yule marble at 10,000 atmospheres confining pressure, room temperature: Geological Society of America
Bulletin, v. 62, p. 853-862, doi: 10.1130/0016-7606(1951)62[853:DOYMPI]2.0.CO;2.
Gromet, L.P., Dymek, R.F., Haskin, L A , and Korotev, R L , 84, The “North American shale composite”: Its
compilation, major and trace element characteristics: Geochimica et Cosmochimica Acta, v. 48, no. 12, p. 2469-2482, doi: 10.1016/0016-7037(84)90298-9.
Groshong, R H , 75, “Slip” cleavage caused by pressure solution in a buckle fold: Geology, v 3, no 7, p 4 -413,
doi: 10.1130/0091-7613(1975)3<411:SCCBPS>2.0.CO;2.
Groshong, R.H., Teufel, L.W., and Gasteiger, C., 1984, Precision and accuracy of the calcite strain-gage technique:
Geological Society of America Bulletin, v. 95, no. 3, p. 357-363, doi: 10.1130/0016-
7606(1984)95<357:PAAOTC>2.0.CO;2.
Ham, H.H., 1966, New charts help estimate formation pressures: Oil and Gas Journal, v. 65, no. 51, p. 58-63.
Hansen, S., 1996, A compaction trend for Cretaceous and Tertiary shales on the Norwegian shelf based on sonic
transit times: Petroleum Geoscience, v. 2, no. 2, p. 159-166, doi: 10.1144/petgeo.2.2.159.
Hantschel, T., and Kauerauf, A.I., 2009, Fundamentals of Basin and Petroleum Systems Modeling: Springer-Verlag,
Berlin Heidelberg.
Harrison, R.J., and Feinberg, J.M., 2008, FORCinel: An improved algorithm for calculating first-order reversal curve
distributions using locally weighted regression smoothing: Geochemistry Geophysics Geosystems, v. 9, no. 5,
doi: 10.1029/2008GC001987.
Hart, B.S., Flemings, P.B., and Deshpande, A., 1995, Porosity and pressure: Role of compaction disequilibrium in the
development of geopressures in a Gulf Coast Pleistocene basin: Geology, v. 23, p. 45, doi: 10.1130/0091-
7613(1995)023<0045:PAPROC>2.3.CO;2.
Hasegawa, T., Yakou, T., and Kocks, U., 1986, Forward and reverse rearrangements of dislocations in tangled walls:
Materials Science and Engineering, v. 81, p. 189-199, doi: 10.1016/0025-5416(86)90262-4.
Heard, H.C., 1963, Effects of large changes in strain rate in the experimental deformation of Yule marble: The Journal
of Geology, v. 71, no. 2, p. 162-195.
Heard, H.C., and Raleigh, C.B., 1972, Steady-state flow in marble at 500° to 800°C: Geological Society of America
Bulletin, v. 83, no. 4, p. 935, doi: 10.1130/0016-7606(1972)83[935:SFIMAT]2.0.CO;2.
Heath, J.E., Dewers, T.A., McPherson, B.J.O.L., Petrusak, R., Chidsey, T.C., Rinehart, A.J., and Mozley, P.S., 2011,
Pore networks in continental and marine mudstones: Characteristics and controls on sealing behavior:
Geosphere, v. 7, no. 2, p. 429-454, doi: 10.1130/GES00619.1.
Hedberg, H.D., 1936, Gravitational compaction of clays and shales: American Journal of Science, v. 31, no. 184, p.
241-287.
Hedberg, H.D., 1926, The effect of gravitational compaction on the structure of sedimentary rocks: American
Association of Petroleum Geologists Bulletin, v. 10, no. 10, p. 1035-1072.
Hedberg, H.D., 1927, The effect of gravitational compaction on the structure of sedimentary rocks: a reply to a
discussion by W. W. Rubey: American Association of Petroleum Geologists Bulletin, v. 11, p. 875-886.
Heidelbach, F., Riekel, C., and Wenk, H.-R., 1999, Quantitative texture analysis of small domains with synchrotron
radiation X-rays: Journal of Applied Crystallography, v. 32, p. 841-849, doi: 10.1107/S0021889899004999.
Herwegh, M., and Kunze, K., 2002, The influence of nano-scale second-phase particles on deformation of fine grained
calcite mylonites: Journal of Structural Geology, v. 24, no. 9, p. 1463-1478, doi: 10.1016/S0191-
8141(01)00144-4.
177
Hirt, A.M., Evans, K.F., and Engelder, T., 1995, Correlation between magnetic anisotropy and fabric for Devonian
shales on the Appalachian Plateau: Tectonophysics, v. 247, no. 1-4, p. 121-132, doi: 10.1016/0040-
1951(94)00176-A.
Ho, N.-C., Peacor, D.R., and Van der Pluijm, B.A., 1999, Preferred orientation of phyllosilicates in Gulf Coast
mudstones and relation to the smectite-illite transition: Clays and Clay Minerals, v. 47, no. 4, p. 495-504.
Holland, T.J.B., and Powell, R., 1998, An internally consistent thermodynamic data set for phases of petrological
interest: Journal of Metamorphic Geology, v. 16, no. 3, p. 309-343, doi: 10.1111/j.1525-1314.1998.00140.x.
Holtzman, B.K., and Kohlstedt, D.L., 2007, Stress-driven melt segregation and strain partitioning in partially molten
rocks: effects of stress and strain: Journal of Petrology, v. 48, no. 12, p. 2379-2406, doi: 10.1093/petrology/egm065.
Hower, J., Eslinger, E.V., Hower, M.E., and Perry, E.A., 1976, Mechanism of burial metamorphism of argillaceous
sediment: 1. Mineralogical and chemical evidence: Geological Society of America Bulletin, v. 87, no. 5, p. 725,
doi: 10.1130/0016-7606(1976)87<725:MOBMOA>2.0.CO;2.
Hrouda, F., 1993, Theoretical models of magnetic anisotropy to strain relationship revisited: Physics of the Earth and
Planetary Interiors, v. 77, no. 3-4, p. 237-249, doi: 10.1016/0031-9201(93)90101-E.
Hubbert, M.K., and Rubey, W.W., 1959, Role of fluid pressure in mechanics of overthrust faulting: I. Mechanics of
fluid-filled porous solids and its application to overthrust faulting: Geological Society of America Bulletin, v.
70, no. 2, p. 115-166.
Hughes, J., M, Cameron, M., and Crowley, K.D., 1989, Structural variations in natural F, OH, and Cl apatites:
American Mineralogist, v. 74, no. 7-8, p. 870-876.
Jackson, M.J., Banerjee, S.K., Marvin, J.A., Lu, R., and Gruber, W., 1991, Detrital remanence, inclination errors, and
anhysteretic remanence anisotropy: quantitative model and experimental results: Geophysical Journal
International, v. 104, no. 1, p. 95-103, doi: 10.1111/j.1365-246X.1991.tb02496.x.
Jacobi, R.D., 1981, Peripheral bulge—a causal mechanism for the Lower/Middle Ordovician unconformity along the
western margin of the Northern Appalachians: Earth and Planetary Science Letters, v. 56, p. 245-251, doi:
10.1016/0012-821X(81)90131-X.
Jamison, W.R., and Spang, J.H., 1976, Use of calcite twin lamellae to infer differential stress: Geological Society of
America Bulletin, v. 87, no. 6, p. 868-872, doi: 10.1130/0016-7606(1976)87<868:UOCTLT>2.0.CO;2.
Jelínek, V., 1981, Characterization of the magnetic fabric of rocks: Tectonophysics, v. 79, no. 3-4, p. T63-T67, doi:
10.1016/0040-1951(81)90110-4.
Jelínek, V., 1978, Statistical processing of anisotropy of magnetic susceptibility measured on groups of specimens:
Studia Geophysica et Geodaetica, v. 22, p. 50-62, doi: 10.1007/BF01613632.
Ji, S., Jiang, Z., Rybacki, E., Wirth, R., Prior, D., and Xia, B., 2004, Strain softening and microstructural evolution of
anorthite aggregates and quartz–anorthite layered composites deformed in torsion: Earth and Planetary Science
Letters, v. 222, no. 2, p. 377-390, doi: 10.1016/j.epsl.2004.03.021.
Johnson, M.E., Jia-Yu, R., and Xue-Chang, Y., 1985, Intercontinental correlation by sea-level events in the Early
Silurian of North America and China (Yangtze Platform): Geological Society of America Bulletin, v. 96, no. 11,
p. 1384, doi: 10.1130/0016-7606(1985)96<1384:ICBSEI>2.0.CO;2.
Jones, O.T., 1944, The compaction of muddy sediments: Quarterly Journal of the Geological Society, v. 100, p. 137-
160, doi: 10.1144/GSL.JGS.1944.100.01-04.09.
Jones, M.E., and Addis, M.A., 1986, The application of stress path and critical state analysis to sediment deformation:
Journal of Structural Geology, v. 8, no. 5, p. 575-580, doi: 10.1016/0191-8141(86)90006-4.
Van de Kamp, P.C., 2008, Smectite-illite-muscovite transformations, quartz dissolution, and silica release in shales: Clays and Clay Minerals, v. 56, no. 1, p. 66-81, doi: 10.1346/CCMN.2008.0560106.
Karig, D.E., and Hou, G., 1992, High-stress consolidation experiments and their geologic implications: Journal of
Geophysical Research, v. 97, p. 289-300, doi: 10.1029/91JB02247.

178
Kaszuba, J.P., Janecky, D.R., and Snow, M.G., 2005, Experimental evaluation of mixed fluid reactions between
supercritical carbon dioxide and NaCl brine: Relevance to the integrity of a geologic carbon repository:
Chemical Geology, v. 217, no. 3-4, p. 277-293, doi: 10.1016/j.chemgeo.2004.12.014.
Kim, J.-W., Bryant, W.R., Watkins, J.S., and Tieh, T.T., 1999, Electron microscopic observations of shale diagenesis,
offshore Louisiana, USA, Gulf of Mexico: Geo-Marine Letters, v. 18, p. 234-240, doi: 10.1007/s003670050073.
Kinnison, C.S., 1915, A Study of the Atterberg Plasticity Method: U.S. Government Printing Office, Washington,
D.C.
Kirby, S.H., 1983, Rheology of the lithosphere: Reviews of Geophysics, v. 21, no. 6, p. 1458-1487, doi:
10.1029/RG021i006p01458.
Kittel, C., 2005, Introduction to solid state physics: Wiley, Hoboken NJ, United States.
Klein, E., Baud, P., Reuschle, T., and Wong, T.-F., 2001, Mechanical behaviour and failure mode of bentheim
sandstone under triaxial compression: Physics and Chemistry of the Earth, Part A: Solid Earth and Geodesy, v.
26, p. 21-25, doi: 10.1016/S1464-1895(01)00017-5.
Kodama, K.P., and Sun, W.W., 1990, SEM and magnetic fabric study of a compacting sediment: Geophysical
Research Letters, v. 17, no. 6, p. 795, doi: 10.1029/GL017i006p00795.
Kohlstedt, D.L., Evans, B., and Mackwell, S.J., 1995, Strength of the lithosphere: constraints imposed by laboratory
experiments: Journal of Geophysical Research, v. 100, p. 17587-17602, doi: 10.1029/95JB01460.
Kübler, B , 68, Evaluation uantitative du m tamorphism par la cristallinit de l’illite: Bulletin Centre Recherche
Pau-SNPA, v. 2, p. 385-397.
Kwon, O., Kronenberg, A.K., Gangi, A.F., Johnson, B., and Herbert, B.E., 2004, Permeability of illite-bearing shale:
1. Anisotropy and effects of clay content and loading: Journal of Geophysical Research, v. 109, no. B10205,
doi: 10.1029/2004JB003052.
Lambe, T.W., and Whitman, R.V., 1969, Soil Mechanics: Wiley, New York.
Land, L.S., and Milliken, K.L., 2000, Regional loss of SiO2 and CaCO3, and gain of K2O during burial diagenesis of
Gulf Coast mudrocks, USA, in Worden, R.H. and Morad, S. eds., Quartz Cementation in Sandstones, Special
Publication Internationl Association of Sedimentologist 29, Blackwells, Oxford, United Kingdom.
Land, L.S., Mack, L.E., Milliken, K.L., and Lynch, F.L., 1997, Burial diagenesis of argillaceous sediment, south
Texas Gulf of Mexico sedimentary basin: A reexamination: Geological Society of America Bulletin, v. 109, no.
1, p. 2-15, doi: 10.1130/0016-7606(1997)109<0002:BDOASS>2.3.CO;2.
Larsen, G., and Chilingar, G.V., 1983, Diagenesis in Sediments and Sedimentary Rocks, 2: Elsevier Science
Publishers, Amsterdam, the Netherlands.
Leder, F., and Park, W.C., 1986, Porosity reduction in sandstone by quartz overgrowth: American Association of
Petroleum Geologists Bulletin, v. 70, no. 11, p. 1713-1728.
Lehmann, D., Brett, C.E., Cole, R., and Baird, G., 1995, Distal sedimentation in a peripheral foreland basin:
Ordovician black shales and associated flysch of the western Taconic foreland, New York State and Ontario:
Geological Society of America Bulletin, v. 107, no. 6, p. 708-724, doi: 10.1130/0016-
7606(1995)107<0708:DSIAPF>2.3.CO;2.
Lerche, I , 0, Basin analysis : uantitative methods: Academic press, San Diego ;;New York ;;Boston [etc ]
LoDuca, S.T., and Brett, C.E., 1994, Revised stratigraphic facies relationships of the lower part of the Clinton Group
(Middle Llandoverian) of western New York State, in Landing, E. ed., Studies in stratigraphy and paleontology
in honor of Donald W. Fisher, New York State Museum Bulletin, New York State Museum, Albany, New York,
p. 161-182.
Loucks, R.G., Reed, R.M., Ruppel, S.C., and Jarvie, D.M., 2009, Morphology, genesis, and distribution of nanometer-scale pores in siliceous mudstones of the Mississippian Barnett Shale: Journal of Sedimentary Research, v. 79,
no. 12, p. 848-861, doi: 10.2110/jsr.2009.092.
Lu, R., Banerjee, S.K., and Marvin, J.A., 1990, Effects of clay mineralogy and the electrical conductivity of water on
the acquisition of depositional remanent magnetization in sediments: Journal of Geophysical Research, v. 95,
no. B4, p. 4531-4538, doi: 10.1029/JB095iB04p04531.

179
Luo, X., Vasseur, G., Pouya, A., Lamoureux-Var, V., and Poliakov, A., 1998, Elastoplastic deformation of porous
media applied to the modelling of compaction at basin scale: Marine and Petroleum Geology, v. 15, p. 145-162,
doi: 10.1016/S0264-8172(97)00061-5.
Lynch, F.L., 1997, Frio Shale Mineralogy and the Stoichiometry of the Smectite-to-Illite Reaction: The Most
Important Reaction in Clastic Sedimentary Diagenesis: Clays and Clay Minerals, v. 45, no. 5, p. 618-631, doi:
10.1346/CCMN.1997.0450502.
Lynch, F.L., Mack, L.E., and Land, L.S., 1997, Burial diagenesis of illite/smectite in shales and the origins of
authigenic quartz and secondary porosity in sandstones: Geochimica et Cosmochimica Acta, v. 61, no. 10, p.
1995-2006, doi: 10.1016/S0016-7037(97)00066-5.
Magara, K., 1968, Compaction and migration of fluids in Miocene mudstones, Nagaoka plain, Japan: American
Association of Petroleum Geologists Bulletin, v. 52, no. 12, p. 2466-2501.
Mariani, E., Brodie, K.H., and Rutter, E.H., 2006, Experimental deformation of muscovite shear zones at high
temperatures under hydrothermal conditions and the strength of phyllosilicate-bearing faults in nature: Journal
of Structural Geology, v. 28, no. 9, p. 1569-1587, doi: 10.1016/j.jsg.2006.06.009.
Martín-Hernández, F., and Hirt, A.M., 2001, Separation of ferrimagnetic and paramagnetic anisotropies using a high-
field torsion magnetometer: Tectonophysics, v. 337, no. 3-4, p. 209-221, doi: 10.1016/S0040-1951(01)00116-0.
McAuliffe, C., 1966, Solubility in water of paraffin, cycloparaffin, olefin, acetylene, cycloolefin, and aromatic
hydrocarbons: Journal of Physical Chemistry, v. 70, p. 1267-1275, doi: 10.1021/j100876a049.
Meade, R.H., 1966, Factors influencing the early stages of the compaction of clays and sands: Journal of Sedimentary
Petrology, v. 36, p. 1085-1101, doi: 10.1306/74D71604-2B21-11D7-8648000102C1865D.
Menéndez, B., Zhu, W., and Wong, T.-F., 1996, Micromechanics of brittle faulting and cataclastic flow in Berea
sandstone: Journal of Structural Geology, v. 18, no. 1, p. 1-16, doi: 10.1016/0191-8141(95)00076-P.
Merriman, R.J., and Frey, M., 1998, Patterns of very low-grade metamorphism in metapelitic rocks, in Frey, M. and
Robinson, D. eds., Low-Grade Metamorphism, Blackwell Science, p. 61-107.
Merriman, R.J., and Peacor, D.R., 1998, Very Low-Grade Metapelites: Mineralogy, Microfabrics and Measuring
Reaction Progress, in Frey, M. and Robinson, D. eds., Low-Grade Metamorphism, Blackwell Science Ltd., Oxford, UK, p. 10-60.
Minshull, T., and White, R.S., 1989, Sediment compaction and fluid migration in the Makran accretionary prism:
Journal of Geophysical Research, v. 94, p. 7387-7402, doi: 10.1029/JB094iB06p07387.
Misra, S., Burlini, L., and Burg, J.-P., 2009, Strain localization and melt segregation in deforming metapelites: Physics
of the Earth and Planetary Interiors, v. 177, no. 3-4, p. 173-179, doi: 10.1016/j.pepi.2009.08.011.
Mitra, S., 1976, A quantitative study of deformation mechanisms and finite strain in quartzites: Contributions to
Mineralogy and Petrology, v. 59, p. 203-226, doi: 10.1007/BF00371309.
Mondol, N.H., Bjørlykke, K., Jahren, J., and Høeg, K., 2007, Experimental mechanical compaction of clay mineral
aggregates—Changes in physical properties of mudstones during burial: Marine and Petroleum Geology, v. 24,
no. 5, p. 289-311, doi: 10.1016/j.marpetgeo.2007.03.006.
Monnett, V.E., 1922, Possible origin of some of the structures of the Mid-Continent oil field: Economic Geology, v.
17, p. 194-200, doi: 10.2113/gsecongeo.17.3.194.
Moore, C.H., 2001, Carbonate Reservoirs: Porosity Evolution and Diagenesis in a Sequence Stratigraphic Framework:
Elsevier Science Publishers, Amsterdam, the Netherlands.
Neuzil, C.E., 1994, How permeable are clays and shales?: Water Resources Research, v. 30, no. 2, p. 145-150, doi:
10.1029/93WR02930.
Nygård, R., Gutierrez, M., Gautam, R., and Høeg, K., 2004, Compaction behavior of argillaceous sediments as function of diagenesis: Marine and Petroleum Geology, v. 21, no. 3, p. 349-362, doi:
10.1016/j.marpetgeo.2004.01.002.
Olgaard, D.L., 1990, The role of second phase in localizing deformation, in Knipe, R.J. and Rutter, E.H. eds.,
Deformation Mechanisms, Rheology and Tectonics, Special Publications 54, Geological Society, London,
United Kingdom, p. 175-181.

180
Olson, R.E., and Mitronovas, F., 1962, Shear strength and consolidation characteristics of calcium and magnesium
illite: Clays and Clay Minerals, v. 9, p. 162-184.
Ord, A., Vardoulakis, I., and Kajewski, R., 1991, Shear band formation in Gosford Sandstone: International Journal of
Rock Mechanics and Mining Sciences & Geomechanics Abstracts, v. 28, no. 5, p. 397-409, doi: 10.1016/0148-
9062(91)90078-Z.
Park, H., Barbeau Jr., D.L., Rickenbaker, A., Bachmann‐Krug, D., and Gehrels, G., 2010, Application of foreland
basin detrital‐zircon geochronology to the reconstruction of the southern and central Appalachian orogen:
Journal of Geology, v. 118, no. 1, p. 23-44, doi: 10.1086/648400.
Passchier, C.W., and Trouw, R.A.J. (Eds.), 2005, Microtectonics: Springer Verlag, Berlin/Heidelberg.
Paterson, M.S., 1990, Rock deformation experimentation, in Duba, A.G. ed., The Brittle-Ductile Transition in Rocks.
The Heard Volume, Geophysical Monograph, AGU, Washington, D.C., p. 187-194.
Paterson, M.S., and Olgaard, D.L., 2000, Rock deformation tests to large shear strains in torsion: Journal of Structural
Geology, v. 22, no. 9, p. 1341-1358, doi: 10.1016/S0191-8141(00)00042-0.
Pavese, A., Ferraris, G., Pischedda, V., and Ibberson, R., 1999, Tetrahedral order in phengite 2M(1) upon heating,
from powder neutron diffraction, and thermodynamic consequences: European Journal of Mineralogy, v. 11, no.
2, p. 309-320.
Peltonen, C., Marcussen, Ø., Bjørlykke, K., and Jahren, J., 2009, Clay mineral diagenesis and quartz cementation in
mudstones: The effects of smectite to illite reaction on rock properties: Marine and Petroleum Geology, v. 26,
no. 6, p. 887-898, doi: 10.1016/j.marpetgeo.2008.01.021.
Perry Jr., E.A., and Hower, J., 1972, Late-stage dehydration in deeply buried pelitic sediments: Clays and Clay
Minerals, v. 56, no. 10, p. 2013-2021, doi: 10.1346/CCMN.1970.0180306.
Pfiffner, O.A., 1982, Deformation mechanisms and flow regimes in limestones from the Helvetic zone of the Swiss
Alps: Journal of Structural Geology, v. 4, no. 4, p. 429-442, doi: 10.1016/0191-8141(82)90034-7.
Pieri, M., Burlini, L., Kunze, K., Stretton, I., and Olgaard, D.L., 2001, Rheological and microstructural evolution of
Carrara marble with high shear strain: results from high temperature torsion experiments: Journal of Structural
Geology, v. 23, p. 1393-1413, doi: 10.1016/S0191-8141(01)00006-2.
Pieri, M., Kunze, K., Burlini, L., Stretton, I., Olgaard, D.L., Burg, J.-P., and Wenk, H.-R., 2001, Texture development
of calcite by deformation and dynamic recrystallization at 1000K during torsion experiments of marble to large
strains: Tectonophysics, v. 330, p. 119-140, doi: 10.1016/S0040-1951(00)00225-0.
Pike, C.R., Roberts, A.P., and Verosub, K.L., 1999, Characterizing interactions in fine magnetic particle systems using first order reversal curves: Journal of Applied Physics, v. 85, no. 9, p. 6660, doi: 10.1063/1.370176.
Poirier, J.-P., 1985, Creep of Crystals: High-temperature Deformation Processes in Metals, Ceramics and Minerals:
Cambridge University Press, Cambridge, United Kingdom.
Poirier, J.-P., 1980, Shear localization and shear instability in materials in the ductile field: Journal of Structural
Geology, v. 2, p. 135-142, doi: 10.1016/0191-8141(80)90043-7.
Pouya, A., Djéran-Maigre, I., Lamoureux-Var, V., and Grunberger, D., 1998, Mechanical behaviour of fine grained
sediments: experimental compaction and three-dimensional constitutive model: Marine and Petroleum Geology,
v. 15, p. 129-143, doi: 10.1016/S0264-8172(98)00011-7.
Powell, R., and Holland, T.J.B., 1988, An internally consistent dataset with uncertainties and correlations: 3.
Applications to geobarometry, worked examples and a computer program: Journal of Metamorphic Geology, v.
6, no. 2, p. 173-204, doi: 10.1111/j.1525-1314.1988.tb00415.x.
Powell, R., Holland, T.J.B., and Worley, B., 1998, Calculating phase diagrams involving solid solutions via non-linear
equations, with examples using THERMOCALC: Journal of Metamorphic Geology, v. 16, no. 4, p. 577-588,
doi: 10.1111/j.1525-1314.1998.00157.x.
Powers, M.C., 1967, Fluid-release mechanisms in compacting marine mudrocks and their importance in oil
exploration: American Association of Petroleum Geologists Bulletin, v. 51, no. 7, p. 1240-1254.
Powers, S., 1922, Reflected buried hills and their importance in petroleum geology: Economic Geology, v. 17, p. 233-
259, doi: 10.2113/gsecongeo.17.4.233.
181
Powers, S., 1920, The Sabine uplift, Louisiana: American Association of Petroleum Geologists Bulletin, v. 4, p. 117-
136.
Proshlyakov, B.K., 1960, Reservoir properties of rocks as a function of their depth and lithology: Geol. Nefti i Gaza,
v. 12, p. 24-29.
Quinlan, G.M., and Beaumont, C., 1984, Appalachian thrusting, lithospheric flexure, and the Paleozoic stratigraphy of
the Eastern Interior of North America: Canadian Journal of Earth Sciences, v. 21, no. 9, p. 973-996, doi:
10.1139/e84-103.
Ramsay, J.R., and Huber, M.I., 1984, The Techniques of Modern Structural Geology, Volume 1: Strain Analyses:
Academic Press, London, United Kingdom.
Renner, J., Evans, B., and Siddiqi, G., 2002, Dislocation creep of calcite: Journal of Geophysical Research, v. 107,
doi: 10.1029/2001JB001680.
Rieke III, H.H., and Chilingarian, G.V. (Eds.), 1974, Compaction of argillaceous sediments.: Elsevier Scientific Pub.
Co., Amsterdam, the Netherlands.
Rieke III, H.H., Chilingar, G.V., and Robertson Jr., J.O., 1964, High-pressure (up to 500,000 p.s.i.) compaction
studies on various clays, in 15, New Delhi, p. 22-38.
Roberts, A.P., Chang, L., Rowan, C.J., Horng, C.-S., and Florindo, F., 2011, Magnetic properties of sedimentary
greigite (Fe3S4): An update: Reviews of Geophysics, v. 49, no. 1, doi: 10.1029/2010RG000336.
Roberts, A.P., Liu, Q., Rowan, C.J., Chang, L., Carvallo, C., Torrent, J., and Horng, C.-S., 2006, Characterization of
hematite (α-Fe2O3), goethite (α-FeOOH), greigite (Fe3S4), and pyrrhotite (Fe7S8) using first-order reversal
curve diagrams: Journal of Geophysical Research, v. 111, doi: 10.1029/2006JB004715.
Roberts, A.P., Pike, C.R., and Verosub, K.L., 2000, First-order reversal curve diagrams: A new tool for characterizing
the magnetic properties of natural samples: Journal of Geophysical Research, v. 105, no. B12, p. 28461-28475,
doi: 10.1029/2000JB900326.
Rochette, P., 1987, Metamorphic control of the magnetic mineralogy of black shales in the Swiss Alps: toward the use
of “magnetic isogrades:” Earth and Planetary Science Letters, v. 84, no. 4, p. 446-456, doi: 10.1016/0012-
821X(87)90009-4.
Rogers, W.B., Isachsen, Y.W., Mock, T.D., and Nyahay, R.E., 1990, New York State Geological Highway Map: New
York State Museum/Geological Survey.
Ronov, A.B., and Migdisov, A.A., 1971, Geochemical history of the crystalline basement and the sedimentary cover
of the Russian and North American platforms: Sedimentology, v. 16, no. 3-4, p. 137-185, doi: 10.1111/j.1365-
3091.1971.tb00227.x.
Rosenbaum, M.S., 1976, Effect of compaction on the pore fluid chemistry of montmorillonite: Clays and Clay
Minerals, v. 24, p. 118-121.
Ross, N., L., and Reeder, R.J., 1992, High-pressure structural study of dolomite and ankerite: American Mineralogist,
v. 77, no. 3-4, p. 412-421.
Rowe, K.J., and Rutter, E.H., 1990, Palaeostress estimation using calcite twinning: experimental calibration and
application to nature: Journal of Structural Geology, v. 12, p. 1-17, doi: 10.1016/0191-8141(90)90044-Y.
Rowley, D.B., and Kidd, W.S.F., 1981, Stratigraphic relationships and detrital composition of the medial Ordovician
flysch of western New England: implications for the tectonic evolution of the Taconic orogeny: Journal of
Geology, v. 89, p. 199-218.
Rubey, W.W., 1927, The effect of gravitational compaction on the structure of sedimentary rocks: American
Association of Petroleum Geologists Bulletin, v. 11, p. 621-633.
Rubey, W.W., and Hubbert, M.K., 1959, Role of fluid pressure in mechanics of overthrust faulting: II. Overthrust belt in geosynclinal area of western Wyoming in light of fluid-pressure hypothesis: Geological Society of America
Bulletin, v. 70, no. 2, p. 167-206.
Rutter, E.H., 1995, Experimental study of the influence of stress, temperature, and strain on the dynamic
recrystallization of Carrara marble: Journal of Geophysical Research, v. 100, no. B12, p. 24651-24663, doi:
10.1029/95JB02500.

182
Rutter, E.H., 1999, On the relationship between the formation of shear zones and the form of the flow law for rocks
undergoing dynamic recrystallization: Tectonophysics, v. 303, p. 147-158, doi: 10.1016/S0040-1951(98)00261-
3.
Rutter, E.H., 1974, The influence of temperature, strain rate and interstitial water in the experimental deformation of
calcite rocks: Tectonophysics, v. 22, p. 311-334, doi: 10.1016/0040-1951(74)90089-4.
Rutter, E.H., 1998, Use of extension testing to investigate the influence of finite strain on the rheological behaviour of
marble: Journal of Structural Geology, v. 20, p. 243-254, doi: 10.1016/S0191-8141(97)00060-6.
Rutter, E.H., and Rusbridge, M., 1977, The effect of non-coaxial strain paths on crystallographic preferred orientation
development in the experimental deformation of a marble: Tectonophysics, v. 39, p. 73-86, doi: 10.1016/0040-1951(77)90089-0.
Rybacki, E., and Dresen, G., 2006, Strength and ductile failure of homogeneously mixed and layered two-phase
anorthite-diopside aggregates, in American Geophysical Union, San Francisco, California USA.
Rybacki, E., Paterson, M.S., Wirth, R., and Dresen, G., 2003, Rheology of calcite–quartz aggregates deformed to
large strain in torsion: Journal of Geophysical Research, v. 108, doi: 10.1029/2002JB001833.
Rybacki, E., Wirth, R., and Dresen, G., 2008, High-strain creep of feldspar rocks: implications for cavitation and
ductile failure in the lower crust: Geophysical Research Letters, v. 35, no. 4, doi: 10.1029/2007GL032478.
Schmid, S.M., 1976, Rheological evidence for changes in the deformation mechanism of Solenhofen limestone
towards low stresses: Tectonophysics, v. 31, p. T21-T28, doi: 10.1016/0040-1951(76)90160-8.
Schmid, S.M., 1975, The Glarus Overthrust: field evidence and mechanical model: Eclogae Geologicae Helvetiae, v.
68, p. 247-280.
Schmid, S.M., Boland, J.N., and Paterson, M.S., 1977, Superplastic flow in finegrained limestone: Tectonophysics, v.
43, p. 257-291, doi: 10.1016/0040-1951(77)90120-2.
Schmid, S.M., Panozzo, R., and Bauer, S., 1987, Simple shear experiments on calcite rocks: rheology and microfabric:
Journal of Structural Geology, v. 9, p. 747-778, doi: 10.1016/0191-8141(87)90157-X.
Schmid, S.M., Paterson, M.S., and Boland, J.N., 1980, High temperature flow and dynamic recrystallization in carrara
marble: Tectonophysics, v. 65, p. 245-280, doi: 10.1016/0040-1951(80)90077-3.
Schmidt, V., Burlini, L., Hirt, A.M., and Leiss, B., 2008, Fabrication of synthetic calcite–muscovite rocks with
variable texture — an analogue to cataclasite fabrics?: Tectonophysics, v. 449, p. 105-119, doi:
10.1016/j.tecto.2007.11.055.
Schneider, J., Flemings, P.B., Day-Stirrat, R.J., and Germaine, J.T., 2011, Insights into pore-scale controls on
mudstone permeability through resedimentation experiments: Geology, v. 39, no. 11, p. 1011-1014, doi:
10.1130/G32475.1.
Schneider, F., Potdevin, J.L., Wolf, S., and Faille, I., 1996, Mechanical and chemical compaction model for
sedimentary basin simulators: Tectonophysics, v. 263, p. 307-317, doi: 10.1016/S0040-1951(96)00027-3.
Sclater, J.G., and Christie, P.A.F., 1980, Continental stretching: an explanation of the post-mid-Cretaceous subsidence
of the central North Sea Basin: Journal of Geophysical Research, v. 85, p. 3711-3739, doi:
10.1029/JB085iB07p03711.
Shaw, E.W., 1918, Anomalous Dips: Economic Geology, v. 13, p. 598-610.
Shaw, E.W., and Munn, M.J., 1911, Coal, oil, and gas of the Foxburg Quadrangle, Pa.: United States Geological
Survey Bulletin, v. 454.
Shea, W.T., and Kronenberg, A.K., 1992, Rheology and deformation mechanisms of an isotropic mica schist: Journal
of Geophysical Research, v. 97, no. B11, p. 15201-15237, doi: 10.1029/92JB00620.
Shea, W.T., and Kronenberg, A.K., 1993, Strength and anisotropy of foliated rocks with varied mica contents: Journal of Structural Geology, v. 15, no. 9/10, p. 1097-1121, doi: 10.1016/0191-8141(93)90158-7.
Shi, Y., and Wang, C.-Y., 1986, Pore pressure generation in sedimentary basins: overloading versus aquathermal:
Journal of Geophysical Research, v. 91, no. B2, p. 2153-2162, doi: 10.1029/JB091iB02p02153.
183
Shinn, E.A., and Robbin, D.M., 1983, Mechanical and chemical compaction in fine-grained shallow-water limestones:
Journal of Sedimentary Petrology, v. 53, no. 2, p. 595-618, doi: 10.1306/212F8242-2B24-11D7-
8648000102C1865D.
Shinn, E.A., Halley, R.B., Hudson, J.H., and Lidz, B.H., 1977, Limestone compaction: An enigma: Geology, v. 5, no.
1, p. 21-24, doi: 10.1130/0091-7613(1977)5<21:LCAE>2.0.CO;2.
Skempton, A.W., 1953, Soil mechanics in relation to geology: Proceedings of the Yorkshire Geological Society, v. 29,
p. 33-62.
Skempton, A.W., and Jones, O.T., 1944, Notes on the compressibility of clays: Quarterly Journal of the Geological
Society, v. 100, p. 119-135, doi: 10.1144/GSL.JGS.1944.100.01-04.08.
Small, J.S., 1994, Fluid Composition, mineralogy and morphological changes associated with the smectite-to-illite
reaction: an experimental investigation of the effect of organic acid anions: Clay Minerals, v. 29, no. 4, p. 539-
554, doi: 10.1180/claymin.1994.029.4.11.
Smith, J.E., 1971, The dynamics of shale compaction and evolution of pore-fluid pressures: Journal of the
International Association for Mathematical Geology, v. 3, no. 3, p. 239-263, doi: 10.1007/BF02045794.
Sorby, H.C., 1908, On the application of quantitative methods to the study of the structure and history of rocks:
Quartenary Journal of the Geological Society of London, v. 64, p. 171-232.
Stockdale, P.B., 1943, Stylolites, primary or secondary?: Journal of Sedimentary Petrology, v. 13, no. 1, p. 3-12, doi:
10.1306/D4269175-2B26-11D7-8648000102C1865D.
Stoltz, R.E., and Pelloux, R.M., 1976, The Bauschinger effect in precipitation strengthened aluminum alloys:
Metallurgical Transactions A: Physical Metallurgy and Material Sciences, v. 7, no. 9, p. 1295-1306, doi:
10.1007/BF02658814.
Stout, M.G., and Rollett, A.D., 1990, Large-strain Bauschinger effects in fcc metals and alloys: Metallurgical
Transactions A: Physical Metallurgy and Material Sciences, v. 21, no. 12, p. 3201-3213, doi:
10.1007/BF02647315.
Suetnova, E., and Vasseur, G., 2000, 1-D Modelling rock compaction in sedimentary basins using a visco-elastic
rheology: Earth and Planetary Science Letters, v. 178, p. 373-383, doi: 10.1016/S0012-821X(00)00074-1.
Sulem, J., and Ouffroukh, H., 2006, Shear banding in drained and undrained triaxial tests on a saturated sandstone:
Porosity and permeability evolution: International Journal of Rock Mechanics and Mining Sciences, v. 43, p.
292-310, doi: 10.1016/j.ijrmms.2005.07.001.
Sun, W.W., and Kodama, K.P., 1992, Magnetic snisotropy, scanning electron microscopy, and X-ray pole figure
goniometry study of inclination shallowing in a compacting clay-rich sediment: Journal of Geophysical
Research, v. 97, no. B13, p. 19599-19615, doi: 10.1029/92JB01589.
Tarling, D.H., and Hrouda, F., 1993, The Magnetic Anisotropy of Rocks: Chapman & Hall, London, United Kingdom.
Tauxe, L., 2010, Essentials of paleomagnetism: University of California Press, Berkeley (Ca), United States.
Taylor, S.R., and McLennan, S.M., 1985, The Continental Crust: Its Composition and Evolution: An Examination of
the Geochemical Record Preserved in Sedimentary Rocks: Blackwell Scientific Publications, Oxford, United
Kingdom.
Teas, L.P., 1923, Differential compacting the cause of certain Clairborne dips: American Association of Petroleum
Geologists Bulletin, v. 9, p. 370-373.
Ter Heege, J.H., De Bresser, J.H.P., and Spiers, C.J., 2002, The influence of dynamic recrystallization on the grain
size distribution and rheological behaviour of Carrara marble deformed in axial compression, in De Meer, S.,
Drury, M.R., De Bresser, J.H.P., and Pennock, G.M. eds., Deformation Mechanisms, Rheology and Tectonics:
Current Status and Future Perspectives, Geological Society Special Publications, Geological Society, London, United Kingdom, p. 331-353.
Terzaghi, K., 1925, Erdbaumechanik auf bodenphysikalischer Grundlage: F. Deuticke, Leipzig Vienna.
Terzaghi, K., 1927, Principles of final soil classification: Public Roads, v. 8, p. 41-53.
Thyberg, B., Jahren, J., Winje, T., Bjørlykke, K., Faleide, J.I., and Marcussen, Ø., 2010, Quartz cementation in Late
Cretaceous mudstones, northern North Sea: Changes in rock properties due to dissolution of smectite and

184
precipitation of micro-quartz crystals: Marine and Petroleum Geology, v. 27, no. 8, p. 1752-1764, doi:
10.1016/j.marpetgeo.2009.07.005.
Towe, K.M., 1962, Clay mineral diagenesis as a possible source of silica cement in sedimentary rocks: Journal of
Sedimentary Petrology, v. 32, no. 1, p. 26-28, doi: 10.1306/74D70C3B-2B21-11D7-8648000102C1865D.
Tribble, J.S., Mackenzie, F.T., and Urmos, J., 1991, Physical property changes accompanying deep burial of clay-rich
sediments, Barbados convergent margin, in Bennett, R.H., Bryant, W.R., and Hulbert, M.H. eds., Microstructure
of Fine-Grained Sediments: From Mud To Shale, Frontiers in Sedimentary Geology, Springer-Verlag, New
York, p. 93-99.
Tucker, M.E., 1981, Sedimentary Petrology: an Introduction: Blackwell Science Ltd., Oxford, United Kingdom.
Tumarkina, E., Misra, S., Burlini, L., and Connolly, J.A.D., 2011, An experimental study of the role of shear
deformation on partial melting of a synthetic metapelite: Tectonophysics, v. 503, no. 1-2, p. 92-99, doi:
10.1016/j.tecto.2010.12.004.
Turner, F.J., Griggs, D.T., and Heard, H., 1954, Experimental deformation of calcite crystals: Geological Society of
America Bulletin, v. 65, no. 9, p. 883-934, doi: 10.1130/0016-7606(1954)65[883:EDOCC]2.0.CO;2.
Ungerer, P., Burrus, J., Doligez, B., Chenet, P.Y., and Bessis, F., 1990, Basin evaluation by integrated two-
dimensional modeling of heat transfer, fluid flow, hydrocarbon generation, and migration: American
Association of Petroleum Geologists Bulletin, v. 74, no. 3, p. 309-335.
Vajdova, V., Baud, P., and Wong, T.-fong, 2004, Compaction, dilatancy, and failure in porous carbonate rocks:
Journal of Geophysical Research, v. 109, doi: 10.1029/2003JB002508.
Van der Pluijm, B.A., Ho, N.-C., and Peacor, D.R., 1994, High-resolution X-ray texture goniometry: Journal of
Structural Geology, v. 16, no. 7, p. 1029-1032, doi: 10.1016/0191-8141(94)90084-1.
Van der Pluijm, B.A., Ho, N.-C., Peacor, D.R., and Merriman, R.J., 1998, Contradictions of slate formation resolved?:
Nature, v. 392, no. 6674, p. 348.
Van Diggelen, E.W.E., De Bresser, J.H.P., Peach, C.J., and Spiers, C.J., 2010, High shear strain behaviour of
synthetic muscovite fault gouges under hydrothermal conditions: Journal of Structural Geology, v. 32, p. 1685-
1700, doi: 10.1016/j.jsg.2009.08.020.
Vasseur, G., Djéran-Maigre, I., Grunberger, D., Rousset, G., Tessier, D., and Velde, B., 1995, Evolution of structural
and physical parameters of clays during experimental compaction: Marine and Petroleum Geology, v. 12, no. 8,
p. 941-954, doi: 10.1016/0264-8172(95)98857-2.
Vassoevich, N.B., 1960, Experiment in constructing typical curve of gravitational compaction of clayey sediments:
Nov. Neft. Tekh, Geol. Ser., v. 1960, no. 4, p. 11-15.
Velde, B., 1996, Compaction trends of clay-rich deep sea sediments: Marine Geology, v. 133, p. 193-201, doi:
10.1016/0025-3227(96)00020-5.
Voltolini, M., Wenk, H.-R., Mondol, N.H., Bjørlykke, K., and Jahren, J., 2009, Anisotropy of experimentally
compressed kaolinite-illite-quartz mixtures: Geophysics, v. 74, no. 1, p. D13, doi: 10.1190/1.3002557.
Walker, A.N., Rutter, E.H., and Brodie, K.H., 1990, Experimental study of grain-size sensitive flow of synthetic, hot-
pressed calcite rocks, in Knipe, R.J. and Rutter, E.H. eds., Deformation Mechanisms, Rheology and Tectonics,
Geological Society Special Publications, Geological Society, London, United Kingdom, p. 259-284.
Wanless, H.R., 1979, Limestone response to stress: pressure solution and dolomitization: Journal of Sedimentary
Petrology, v. 49, no. 2, p. 437-462, doi: 10.1306/212F7766-2B24-11D7-8648000102C1865D.
Warner, D.L., 1964, An Analysis of the Influence of Physical-Chemical Factors Upon the Consolidation of Fine-
Grained Clastic Sediments: University of California Press, Berkeley (Ca), United States.
Weertman, J., 1957, Steady-state creep of crystals: Journal of Applied Physics, v. 28, no. 10, p. 1185-1189, doi: 10.1063/1.1722604.
Welch, M.D., and Marshall, W.G., 2001, High-pressure behavior of clinochlore: American Mineralogist, v. 86, no.
11-12, p. 1380-1386.
Weller, J.M., 1959, Compaction of sediments: American Association of Petroleum Geologists Bulletin, v. 43, no. 2, p.
273-310.
185
Wenk, H.-R., Lonardeli, I., Pehl, J., Devine, J., Prakapenka, V., Shen, G., and Mao, H.-K., 2004, In situ observation of
texture development in olivine, ringwoodite, magnesiowüstite and silicate perovskite at high pressure: Earth and
Planetary Science Letters, v. 226, p. 507-519, doi: 10.1016/j.epsl.2004.07.033.
Wenk, H.-R., Matthies, S., Donovan, J., and Chateigner, D., 1998, BEARTEX: a Windows-based program system for
quantitative texture analysis: Journal of Applied Crystallography, v. 31, p. 262-269, doi:
10.1107/S002188989700811X.
White, W.A., 1949, Atterberg plastic limits of clay minerals: American Mineralogist, v. 34, p. 508-512.
Wilson, J.T., 1966, Did the Atlantic Close and then re-open?: Nature, v. 211, p. 676-681, doi: 10.1038/211676a0.
Wong, T.-F., Baud, P., and Klein, E., 2001, Localized failure modes in a compactant porous rock: Geophysical Research Letters, v. 28, no. 13, p. 2521-2524, doi: 10.1029/2001GL012960.
Wong, T.-F, David, C., and Zhu, W., 1997, The transition from brittle faulting to cataclastic flow in porous
sandstones: Mechanical deformation: Journal of Geophysical Research, v. 102, p. 3009-3025, doi:
10.1029/96JB03281.
Wong, T.-F, Szeto, H., and Zhang, J., 1992, Effect of loading path and porosity on the failure mode of porous rocks:
Applied Mechanics Reviews, v. 45, no. 8, p. 281-293, doi: 10.1115/1.3119759.
Worden, R.H., Charpentier, D., Fisher, Q.J., and Aplin, A.C., 2005, Fabric development and the smectite to illite
transition in Upper Cretaceous mudstones from the North Sea: an image analysis approach, in Shaw, R.P. ed.,
Understanding the Micro to Macro Behaviour of Rock-Fluid Systems, Geological Society Special Publication
249, The Geological Society, London, United Kingdom, p. 167.
Wu, X.Y., Baud, P., and Wong, T.-F., 2000, Micromechanics of compressive failure and spatial evolution of
anisotropic damage in Darley Dale sandstone: International Journal of Rock Mechanics and Mining Sciences, v.
37, p. 143-160, doi: 10.1016/S1365-1609(99)00093-3.
Yang, Y., and Aplin, A.C., 2010, A permeability–porosity relationship for mudstones: Marine and Petroleum
Geology, v. 27, p. 1692-1697, doi: 10.1016/j.marpetgeo.2009.07.001.
Yang, Y., and Aplin, A.C., 1998, Influence of lithology and compaction on the pore size distribution and modelled
permeability of some mudstones from the Norwegian margin: Marine and Petroleum Geology, v. 15, p. 163-175, doi: 10.1016/S0264-8172(98)00008-7.
Yang, Y., and Aplin, A.C., 2007, Permeability and petrophysical properties of 30 natural mudstones: Journal of
Geophysical Research, v. 112, doi: 10.1029/2005JB004243.
Yeh, H.-W., and Savin, S.M., 1977, Mechanism of burial metamorphism of argillaceous sediments: 3. O-isotope
evidence: Geological Society of America Bulletin, v. 88, no. 9, p. 1321, doi: 10.1130/0016-
7606(1977)88<1321:MOBMOA>2.0.CO;2.
Zhang, S., Paterson, M.S., and Cox, S.F., 1994, Porosity and permeability evolution during hot isostatic pressing of
calcite aggregates: Journal of Geophysical Research, v. 99, p. 15741-15760, doi: 10.1029/94JB00646.
Zhang, X., Spiers, C.J., and Peach, C.J., 2010, Compaction creep of wet granular calcite by pressure solution at 28°C
to 150°C: Journal of Geophysical Research, v. 115, doi: 10.1029/2008JB005853.
Zhang, J., Wong, T.-F., and Davis, D.M., 1990, Micromechanics of pressure-induced grain crushing in porous rocks:
Journal of Geophysical Research, v. 95, no. B1, p. 341-352, doi: 10.1029/JB095iB01p00341.
Zhu, W., Evans, B., and Bernabé, Y., 1999, Densification and permeability reduction in hot-pressed calcite: a kinetic
model: Journal of Geophysical Research, v. 104, p. 25501-25511, doi: 10.1029/1999JB900230.
Zimmerman, R.W., 1991, Compressibility of sandstones: Elsevier Science Publishers, Amsterdam, the Netherlands.

186
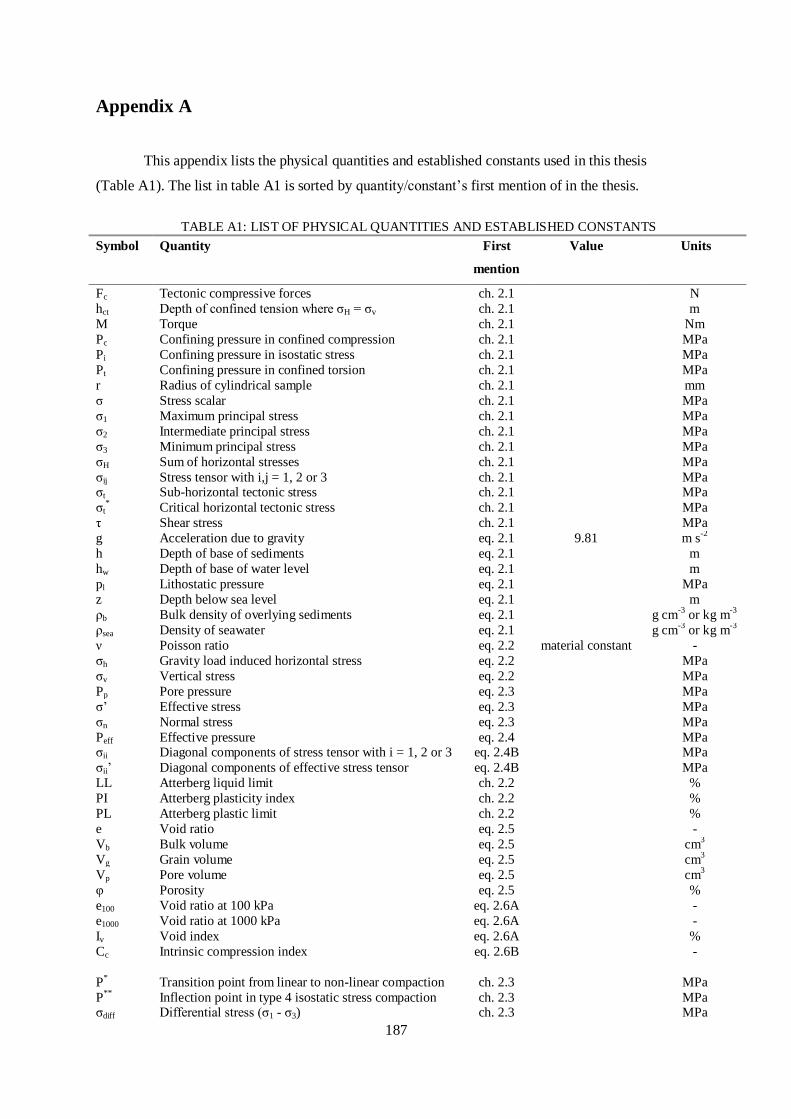
187
Appendix A
This appendix lists the physical quantities and established constants used in this thesis
(Table A1). The list in table A1 is sorted by quantity/constant’s first mention of in the thesis.
TABLE A1: LIST OF PHYSICAL QUANTITIES AND ESTABLISHED CONSTANTS
Symbol Quantity First
mention
Value Units
Fc Tectonic compressive forces ch. 2.1 N
hct Depth of confined tension where σH = σv ch. 2.1 m
M Torque ch. 2.1 Nm
Pc Confining pressure in confined compression ch. 2.1 MPa
Pi Confining pressure in isostatic stress ch. 2.1 MPa
Pt Confining pressure in confined torsion ch. 2.1 MPa
r Radius of cylindrical sample ch. 2.1 mm
σ Stress scalar ch. 2.1 MPa
σ1 Maximum principal stress ch. 2.1 MPa
σ2 Intermediate principal stress ch. 2.1 MPa
σ3 Minimum principal stress ch. 2.1 MPa
σH Sum of horizontal stresses ch. 2.1 MPa
σij Stress tensor with i,j = 1, 2 or 3 ch. 2.1 MPa σt Sub-horizontal tectonic stress ch. 2.1 MPa
σt* Critical horizontal tectonic stress ch. 2.1 MPa
τ Shear stress ch. 2.1 MPa
g Acceleration due to gravity eq. 2.1 9.81 m s-2
h Depth of base of sediments eq. 2.1 m
hw Depth of base of water level eq. 2.1 m
pl Lithostatic pressure eq. 2.1 MPa
z Depth below sea level eq. 2.1 m
ρb Bulk density of overlying sediments eq. 2.1 g cm-3
or kg m-3
ρsea Density of seawater eq. 2.1 g cm-3
or kg m-3
ν Poisson ratio eq. 2.2 material constant -
σh Gravity load induced horizontal stress eq. 2.2 MPa
σv Vertical stress eq. 2.2 MPa
Pp Pore pressure eq. 2.3 MPa
σ’ Effective stress eq. 2.3 MPa
σn Normal stress eq. 2.3 MPa
Peff Effective pressure eq. 2.4 MPa σii Diagonal components of stress tensor with i = 1, 2 or 3 eq. 2.4B MPa
σii’ Diagonal components of effective stress tensor eq. 2.4B MPa
LL Atterberg liquid limit ch. 2.2 %
PI Atterberg plasticity index ch. 2.2 %
PL Atterberg plastic limit ch. 2.2 %
e Void ratio eq. 2.5 -
Vb Bulk volume eq. 2.5 cm3
Vg Grain volume eq. 2.5 cm3
Vp Pore volume eq. 2.5 cm3
φ Porosity eq. 2.5 %
e100 Void ratio at 100 kPa eq. 2.6A -
e1000 Void ratio at 1000 kPa eq. 2.6A -
Iv Void index eq. 2.6A %
Cc Intrinsic compression index eq. 2.6B -
P* Transition point from linear to non-linear compaction ch. 2.3 MPa
P**
Inflection point in type 4 isostatic stress compaction ch. 2.3 MPa σdiff Differential stress (σ1 - σ3) ch. 2.3 MPa
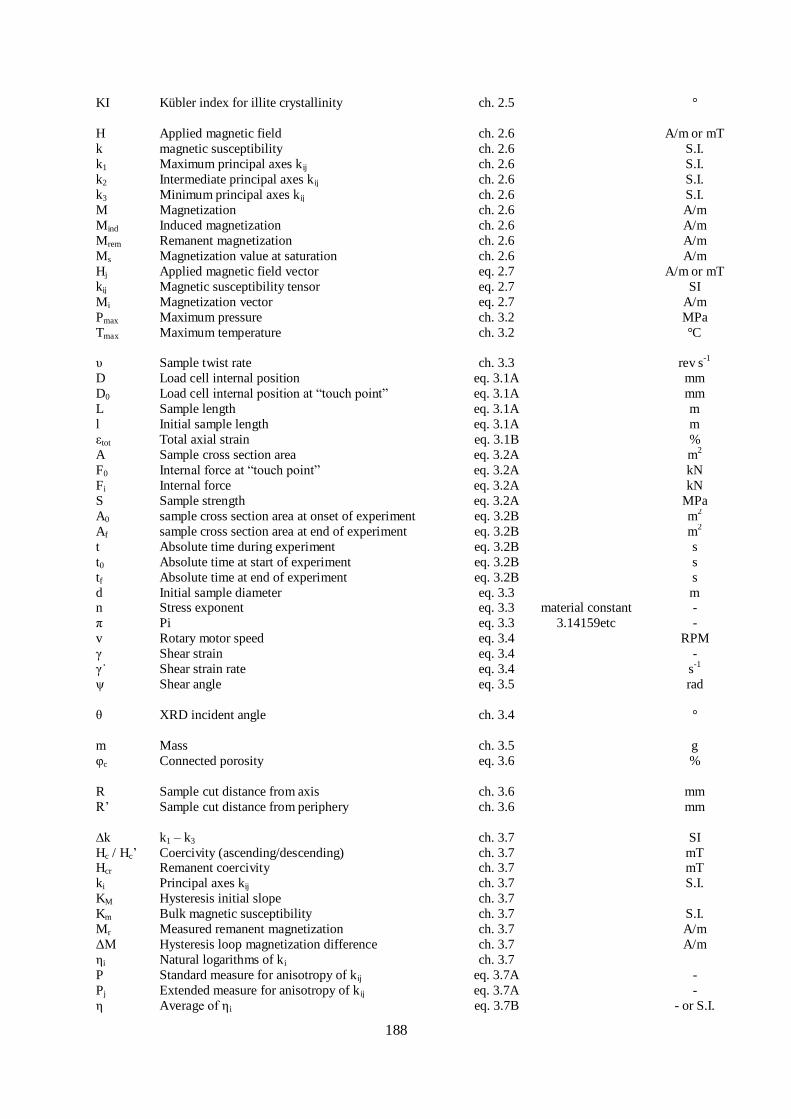
188
KI Kübler index for illite crystallinity ch. 2.5 °
H Applied magnetic field ch. 2.6 A/m or mT
k magnetic susceptibility ch. 2.6 S.I.
k1 Maximum principal axes kij ch. 2.6 S.I.
k2 Intermediate principal axes kij ch. 2.6 S.I.
k3 Minimum principal axes kij ch. 2.6 S.I.
M Magnetization ch. 2.6 A/m
Mind Induced magnetization ch. 2.6 A/m
Mrem Remanent magnetization ch. 2.6 A/m
Ms Magnetization value at saturation ch. 2.6 A/m
Hj Applied magnetic field vector eq. 2.7 A/m or mT
kij Magnetic susceptibility tensor eq. 2.7 SI
Mi Magnetization vector eq. 2.7 A/m
Pmax Maximum pressure ch. 3.2 MPa
Tmax Maximum temperature ch. 3.2 °C
υ Sample twist rate ch. 3.3 rev s-1
D Load cell internal position eq. 3.1A mm
D0 Load cell internal position at “touch point” eq. 3.1A mm
L Sample length eq. 3.1A m
l Initial sample length eq. 3.1A m
εtot Total axial strain eq. 3.1B %
A Sample cross section area eq. 3.2A m2
F0 Internal force at “touch point” eq. 3.2A kN
Fi Internal force eq. 3.2A kN
S Sample strength eq. 3.2A MPa
A0 sample cross section area at onset of experiment eq. 3.2B m2
Af sample cross section area at end of experiment eq. 3.2B m2
t Absolute time during experiment eq. 3.2B s
t0 Absolute time at start of experiment eq. 3.2B s
tf Absolute time at end of experiment eq. 3.2B s
d Initial sample diameter eq. 3.3 m n Stress exponent eq. 3.3 material constant -
π Pi eq. 3.3 3.14159etc -
v Rotary motor speed eq. 3.4 RPM
γ Shear strain eq. 3.4 -
γ˙ Shear strain rate eq. 3.4 s-1
ψ Shear angle eq. 3.5 rad
θ XRD incident angle ch. 3.4 °
m Mass ch. 3.5 g
φc Connected porosity eq. 3.6 %
R Sample cut distance from axis ch. 3.6 mm
R’ Sample cut distance from periphery ch. 3.6 mm
∆k k1 – k3 ch. 3.7 SI
Hc / Hc’ Coercivity (ascending/descending) ch. 3.7 mT Hcr Remanent coercivity ch. 3.7 mT
ki Principal axes kij ch. 3.7 S.I.
KM Hysteresis initial slope ch. 3.7
Km Bulk magnetic susceptibility ch. 3.7 S.I.
Mr Measured remanent magnetization ch. 3.7 A/m
ΔM Hysteresis loop magnetization difference ch. 3.7 A/m
ηi Natural logarithms of ki ch. 3.7
P Standard measure for anisotropy of kij eq. 3.7A -
Pj Extended measure for anisotropy of kij eq. 3.7A -
η Average of ηi eq. 3.7B - or S.I.

189
η1 Natural logarithm of k1 eq. 3.7B - or S.I.
η2 Natural logarithm of k2 eq. 3.7B - or S.I.
η3 Natural logarithm of k3 eq. 3.7B - or S.I.
λ Grain aspect ratio (length / width) ch. 5.3 -
εax Finite axial strain ch. 7.2 %
εrd Finite radial strain ch. 7.2 %
μ Coefficient of friction ch. 9.4 -

190
Appendix B
This appendix lists the working conditions of compaction stage 3b experiments in the Paterson
apparatus (Table 1). Experiments are sorted in groups, temperature and total axial strain. Group codes
reflect compaction stage 3b operation conditions other than those mentioned in the table already: (C) =
confined compression, (I) = isostatic stress, (IP) = isostatic stress and applied pore pressure, (M) =
confined compression with suspected partial melting, (P) = confined compression and applied pore
pressure, (T) = confined torsion. Assembly codes refer to the jacket material and drained (open) or
undrained (closed) sample conditions. Strain rate values are those imposed on the sample calculated
using motor speed, and are slightly higher than strain rate values measured from rate of internal
position change. Three room-temperature tests were performed in isostatic stress mode to verify the
effect of sample pressurization on sample.
Strain rate and strain values for PAT1 (T) tests are in fact shear strain rate and shear strain. The sample
in experiment P1212 was re-jacketed and compacted further in experiment P1216.
TABLE B1: LIST OF COMPACTION STAGE 3B EXPERIMENTS
Ex
per
imen
t
Gro
up
Len
gth
(mm
)
Dia
met
er
(mm
)
Ass
emb
ly
Tem
per
atu
re
(°C
)
Pc
(MP
a)
Pp
(M
Pa
)
Du
rati
on
(min
)
Str
ain
ra
te
(s-1
)
To
tal
ax
ial
stra
in (
%)
P1307 PAT1 (C) 12.47 14.87 Fe-closed 500 300 - 181 1 x 10⁻⁵
6.9% P1282 PAT1 (C) 14.77 14.86 Cu-closed 500 300 - 2 1 x 10
-3 7.5%
P1284 PAT1 (C) 12.52 14.86 Cu-closed 500 300 - 190 1 x 10⁻⁵
8.1%
P1242 PAT1 (C) 15.03 14.9 Cu-closed 500 300 - 20 1 x 10⁻⁴
8.3%
P1331 PAT1 (C) 7.1 9.84 Fe-closed 500 300 - 377 7 x 10⁻⁶
10.4%
P1313 PAT1 (C) 7.49 9.89 Fe-closed 500 300 - 263 1 x 10⁻⁵
11.0%
P13361 PAT1 (C) 19.14 9.8 Fe-closed 500 300 - 245 1 x 10
-5 12.3%
P1336a PAT1 (C) 6.52 9.8 Fe-closed 500 300 - 245 1 x 10⁻⁵
12.3%
P1336b PAT1 (C) 6.88 9.86 Fe-closed 500 300 - 245 1 x 10⁻⁵
12.3%
P1336c PAT1 (C) 5.74 9.86 Fe-closed 500 300 - 245 1 x 10⁻⁵
12.3%
P1337 PAT1 (C) 8.28 9.88 Fe-closed 500 300 - 35 1 x 10⁻⁴
13.9%
P1472 PAT1 (C) 18.67 9.86 Fe-closed 650 300 - 224 1 x 10⁻⁵
12.6%
P1332 PAT1 (C) 6.78 9.83 Fe-closed 650 300 - 320 1 x 10⁻⁵
13.1%
P1243 PAT1 (C) 11.64 14.93 Cu-closed 700 300 - 22 1 x 10⁻⁴
8.2%
P1306 PAT1 (C) 10.99 14.81 Fe-closed 700 240 - 2 1 x 10⁻³
8.3% P1330 PAT1 (C) 6.83 9.85 Fe-closed 700 300 - 25 1 x 10
-4 10.8%
P1328 PAT1 (C) 9.5 9.9 Fe-closed 700 300 - 178 2 x 10⁻⁵
11.6%
P1305 PAT1 (C) 10.9 14.85 Fe-closed 700 300 - 30 1 x 10⁻⁴
13.1%
P1339 PAT1 (C) 7 9.9 Fe-open 700 300 - 311 1 x 10⁻⁵
13.3%
P1304 PAT1 (C) 11.4 14.8 Fe-closed 700 300 - 150 2 x 10⁻⁵
14.4%
P1346 PAT1 (C) 10.28 9.89 Fe-closed 700 300 - 158 2 x 10⁻⁵
14.5%
P1347 PAT1 (C) 11.4 9.95 Fe-closed 700 300 - 199 2 x 10⁻⁵
15.8%
P1345 PAT1 (C) 21.1 9.9 Fe-closed 700 300 - 136 Stepping 20.2%
P1317 PAT1 (I) 6.32 9.89 Fe-open 500 300 - 20 - -
P1302 PAT1 (I) 5.53 9.9 Fe-open 700 300 - 25 - -
P1312 PAT1 (I) 10.57 14.8 Fe-closed 700 300 - 0 - -
P1320 PAT1 (I) 5.72 9.95 Fe-closed 700 300 - 600 - -
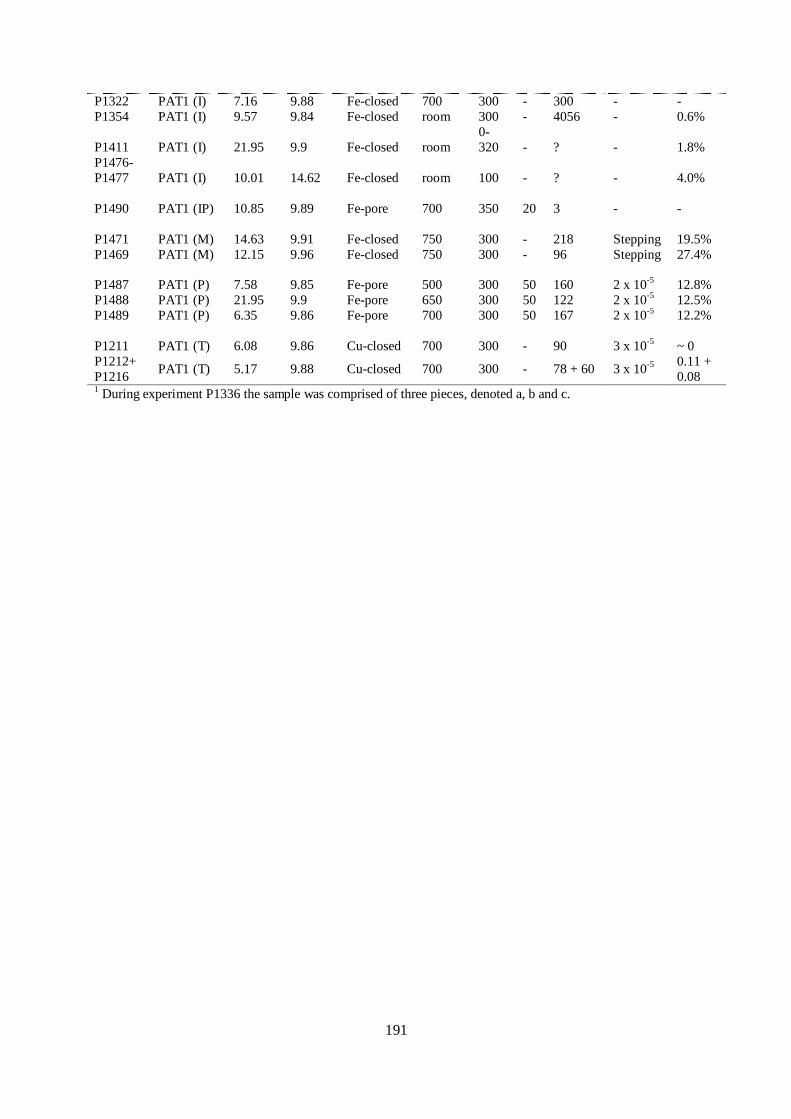
191
P1322 PAT1 (I) 7.16 9.88 Fe-closed 700 300 - 300 - -
P1354 PAT1 (I) 9.57 9.84 Fe-closed room 300 - 4056 - 0.6%
P1411 PAT1 (I) 21.95 9.9 Fe-closed room
0-
320 - ? - 1.8%
P1476-
P1477 PAT1 (I) 10.01 14.62 Fe-closed room 100 - ? - 4.0%
P1490 PAT1 (IP) 10.85 9.89 Fe-pore 700 350 20 3 - -
P1471 PAT1 (M) 14.63 9.91 Fe-closed 750 300 - 218 Stepping 19.5%
P1469 PAT1 (M) 12.15 9.96 Fe-closed 750 300 - 96 Stepping 27.4%
P1487 PAT1 (P) 7.58 9.85 Fe-pore 500 300 50 160 2 x 10
-5 12.8%
P1488 PAT1 (P) 21.95 9.9 Fe-pore 650 300 50 122 2 x 10⁻⁵
12.5%
P1489 PAT1 (P) 6.35 9.86 Fe-pore 700 300 50 167 2 x 10⁻⁵
12.2%
P1211 PAT1 (T) 6.08 9.86 Cu-closed 700 300 - 90 3 x 10⁻⁵
~ 0
P1212+
P1216 PAT1 (T) 5.17 9.88 Cu-closed 700 300 - 78 + 60 3 x 10
-5
0.11 +
0.08 1 During experiment P1336 the sample was comprised of three pieces, denoted a, b and c.

192
Appendix C
This appendix lists the compaction-related rock physical properties of synthetic metapelites
after their stage 2 or stage 3a compaction in the hot isostatic press (Table C1). Samples are sorted in
groups and sample ID. When the sample was further compacted in the Paterson apparatus during stage
3b, the number of the experiment is presented.
TABLE C1: SAMPLE PROPERTIES AFTER COMPACTION STAGES 2 AND 3A
Experiment Sample ID Group Bulk density (g cm-3
) Porosity (%)
P1211 WS_HIP_01 HIP1 2.422 -
P1212 WS_HIP_02
1 HIP1 2.42 11
b
P1216
P1242 WS_HIP_03 HIP1 2.4 14.0
P1243 WS_HIP_04 HIP1 2.41 11.8
P1282 WS_HIP_05 HIP1 2.4 13.9
P1284 WS_HIP_06 HIP1 2.4 12.7
P1305 WS_HIP_07 HIP1 2.39 12.4
P1306 WS_HIP_08 HIP1 2.41 11.4
P1304 WS_HIP_09 HIP1 2.39 12.3
P1307 WS_HIP_10 HIP1 2.40 11.8 P1469 WS_HIP_11 HIP1 2.36 15.0
P1490 WS_HIP_11AB HIP1 2.36 16.3
P1302 WS_HIP_12a HIP1 - -
P1339
P1322
P1317
WS_HIP_12b HIP1 - -
WS_HIP_12c HIP1 2.38 13.7
WS_HIP_12d
WS_HIP_13a
HIP1
HIP1
2.40
2.43
14.3
11.3 P1330
P1313 WS_HIP_13b HIP1 2.42 11.7
P1320 WS_HIP_13c HIP1 2.39 12.8
WS_HIP_13d HIP1 2.38 13.0
P1331 WS_HIP_14a HIP1 2.41 12.1
P1328 WS_HIP_14b HIP1 2.37 10.6
P1489 WS_HIP_15a HIP1 2.38 14.3
P1332 WS_HIP_15b HIP1 2.37 14.2
P1337 WS_HIPc_16 HIP1 2.39 14.2
P1336 WS_HIP_17a3 HIP1 2.4 13.7
WS_HIP_17b3 HIP1 2.37 13.4
WS_HIP_17c3 HIP1 2.38 13.6
P1345 WS_HIPc_18 HIP1 - -
P1411 WS_HIPc_20
4 HIP1 2.38 13.7
P1488
P1472 WS_HIPc_21 HIP1 2.37 14.0
P1471 WS_HIPc_22 HIP1 2.39 13.6
P1347 WS_HIPc_23 HIP1 2.41 12.3
P1346 WS_HIPc_24 HIP1 2.36 15.2
P1354 WS_HIPc_25 HIP1 2.40 13.7
- WS_HIPc_30 HIP1 2.38 13.0
- WS_HIPc_31 HIP1 2.37 13.6
- WS_HIPc_32 HIP1 2.38 12.7
- WS_HIPc_33 HIP1 2.38 12.3
- WS_HIPc_34 HIP1 2.38 14.3
- WS_HIPc_35 HIP1 2.38 13.8
P1477 WS_HIPc_X1 HIP1 2.37 13.9
193
- RS_01_01 HIP2 2.53 5.8
- RS_01A HIP2 2.52 5.3
- RS_01B HIP2 2.50 7.4
- RS_01C HIP2 2.52 6.1
- RS_02 HIP2 2.52 4.8
- RS_02_02 HIP2 2.51 5.0
- RS_03A HIP2 2.56 2.2
- RS_03B HIP2 2.56 2.7
- RS_01_01 HIP2 2.53 5.8
- RS_01A HIP2 2.52 5.3
- RS_01B HIP2 2.50 7.4
- RS_01C HIP2 2.52 6.1 - RS_02 HIP2 2.52 4.8
- RS_02_02 HIP2 2.51 5.0 1 re-jacketed sample, affected by first test
2 assumed value
3 part of stacked sample
4 re-used sample, unaffected by first test
194
Appendix D
This appendix lists compaction-related rock physical properties of synthetic metapelites after
their stage 3b experiments in the Paterson apparatus. Samples are sorted in groups, temperature and
total axial strain (Table B1). Group codes reflect compaction stage 3b operation conditions other than
those mentioned in the table already: (C) = confined compression, (I) = isostatic stress, (IP) = isostatic
stress and applied pore pressure, (M) = confined compression with suspected partial melting, (P) =
confined compression and applied pore pressure, (T) = confined torsion.
TABLE D1: SAMPLE PROPERTIES AFTER COMPACTION STAGE 3B EXPERIMENTS
Exp
erim
ent
Gro
up
Tem
per
atu
re
(°C
)
Bu
lk d
ensi
ty
(g c
m-3
)
Poro
sity
(%
)
Poro
sity
red
uct
ion
(%)
Fin
ite
axia
l
stra
in (
%)
Fin
ite
rad
ial
stra
in (
%)
Fin
ite
volu
met
ric
stra
in (
%)
P1307 PAT1 (C) 500 2.48 10.1 1.7 2.8 0.1 2.9
P1282 PAT1 (C) 500 2.5 10.9 3.0 3.9 -0.1 3.6
P1284 PAT1 (C) 500 2.49 9.6 3.1 3.5 0.0 3.5
P1242 PAT1 (C) 500 2.5 11.6 2.4 3.9 0.0 3.9
P1331 PAT1 (C) 500 2.47 10.7 1.5 4.4 -0.8 2.8 P1313 PAT1 (C) 500 2.44 10.4 1.3 3.3 -1.2 1.1
P1336 PAT1 (C) 500 2.4 17.2 -3.4 9.8 -4.8 1.0
P1336 PAT1 (C) 500 2.38 17.1 -3.7 7.4 -3.1 1.5
P1336 PAT1 (C) 500 2.39 16.8 -3.2 7.1 -3.2 1.0
P1337 PAT1 (C) 500 2.36 16.9 -2.7 6.5 -3.7 -0.6
P1472 PAT1 (C) 650 2.56 8.5 5.5 10.2 -1.4 7.6
P1332 PAT1 (C) 650 2.50 8.5 5.6 7.1 -0.8 5.6
P1243 PAT1 (C) 700 2.52 4.8 7.0 3.5 0.5 4.4
P1306 PAT1 (C) 700 2.58 5.6 5.7 6.8 0.1 7.0
P1330 PAT1 (C) 700 2.65 1.1 10.2 7.8 0.4 8.5
P1328 PAT1 (C) 700 2.66 3.9 6.8 10.9 0.0 10.9
P1305 PAT1 (C) 700 2.66 1.5 10.9 10.4 0.3 1.0
P1339 PAT1 (C) 700 2.4 9.5 3.7c 2.7 -0.6 1.5
P1304 PAT1 (C) 700 2.76b 0.0
a 12.3 11.4 1.4 13.8
P1346 PAT1 (C) 700 2.55 8.2 7.0 10.0 -1.1 8.0
P1347 PAT1 (C) 700 2.68 2.8 9.4 16.2 -3.5 10.2
P1345 PAT1 (C) 700 5.0c 7.5 22.7 -9.1 8.1
P1317 PAT1 (I) 500 2.41 12.0 2.4 0.3 0.3 0.9
P1302 PAT1 (I) 700 2.44 11.3c 2.0 1.6 0.7 3.0
P1312 PAT1 (I) 700 2.46 9.0 4.3 2.9 0.8 4.5
P1320 PAT1 (I) 700 2.62 4.5 8.4 3.8 2.8 9.2
P1322 PAT1 (I) 700 2.7 5.6 8.1 6.3 2.8 11.5
P1354 PAT1 (I) room 2.39 16.1 -2.4 0.0 -0.1 -0.2
P1411 PAT1 (I) room 2.39 14.4c -0.7
c -0.1 0.1 0.1
P1476+P
1477 PAT1 (I) room 2.35 15.2 -1.3 0.0 -0.2 -0.4
P1490 PAT1 (IP) 700 2.45 11.8 4.5 2.5 0.6 3.7
P1490 PAT1 (IP) 700 2.40 11.7 4.6 1.6 0.7 3.0
P1490 PAT1 (IP) 700 2.42 12.8 3.5 2.6 0.5 3.6
P1471 PAT1 (M) 750 2.68 4.1 9.5 19.7 -4.9 11.5
P1469 PAT1 (M) 750 2.67 5.1 9.9 20.2 -5.4 11.3

195
P1487 PAT1 (P) 500 2.35 14.3 -0.6 4.4 -2.5 -0.6
P1488 PAT1 (P) 650 2.52 8.8 4.9 11.1 -2.6 6.3
P1489 PAT1 (P) 700 2.48 8.7 5.6 7.1 -1.3 4.6
P1211 PAT1 (T) 700 2.47 11.0 2.2c 1.2 0.9 2.9
P1212+P
1216 PAT1 (T) 700 2.67 3.8 7.2 7.9 1.5 10.7
a measurements yielded negative value for porosity. Data not included in figure 7.1
b unrealistic value for density
c assumed value
196
Appendix E
This appendix lists the water content of synthetic metapelites and Maplewood Shale, measured
by Karl-Fischer-Titration (KFT) technique (Table E1). Samples are sorted in groups, temperature and
duration. Group codes reflect compaction history (Table 3.1). For Paterson apparatus experiments in
compaction stage 3b, (C) = confined compression, (I) = isostatic stress, (M) = confined compression
with suspected partial melting, (P) = confined compression and applied pore pressure, (T) = confined
torsion. Data is summarized and graphically represented in figure 7.8AB.
TABLE E1: KFT WATER CONTENT DATA
Sample ID Group Experiment Temperature (°C)
Drainage Duration (hrs) Average water content (wt. %)
R07a NAT 3.79 R07b NAT 4.04
R39 NAT 3.41
R05 HIP1 590 Closed 24 2.56
R11 HIP1 590 Closed 24 2.85
R06 HIP1 590 Closed 24 2.65
RS HIP2 480 Closed 15 2.71
R03 PAT1 (C) P1282 500 Closed < 0.1 2.56
R01 PAT1 (C) P1242 500 Closed 0.3 2.61
R27 PAT1 (C) P1337 500 Closed 2.6 2.34
R14 PAT1 (C) P1307 500 Closed 3.0 2.62
R04 PAT1 (C) P1284 500 Closed 3.2 2.39
R24 PAT1 (C) P1336 500 Closed 4.1 2.34
R25 PAT1 (C) P1336 500 Closed 4.1 2.48
R26 PAT1 (C) P1336 500 Closed 4.1 2.19
R16 PAT1 (C) P1313 500 Closed 4.4 2.54
R22 PAT1 (C) P1331 500 Closed 6.3 2.07
R38 PAT1 (C) P1472 650 Closed 3.7 2.22
R23 PAT1 (C) P1332 650 Closed 5.3 1.98
R12 PAT1 (C) P1306 700 Closed < 0.1 2.53
R02 PAT1 (C) P1243 700 Closed 0.4 2.17
R21 PAT1 (C) P1330 700 Closed 0.4 2.13
R09 PAT1 (C) P1305 700 Closed 0.5 2.68
R29 PAT1 (C) P1345 700 Closed 2.3 2.05
R13 PAT1 (C) P1304 700 Closed 2.5 2.56
R30 PAT1 (C) P1346 700 Closed 2.6 1.72
R20 PAT1 (C) P1328 700 Closed 3.0 2.33
R31 PAT1 (C) P1347 700 Closed 3.3 2.31
R28 PAT1 (C) P1339 700 Open 5.2 0.64
R17 PAT1 (I) P1317 500 Open 0.3 2.83
R10 PAT1 (I) P1302 700 Open 0.4 1.88
R15 PAT1 (I) P1312 700 Closed 0.3 2.31
R19 PAT1 (I) P1322 700 Closed 5.0 2.31
R18 PAT1 (I) P1320 700 Closed 10.0 2.40
R35 PAT1 (M) P1469 750 Closed 1.6 2.23
R33 PAT1 (M) P1471 750 Closed 3.6 1.87

197
R36 PAT1 (P) P1487 500 Closed 2.7 2.44
R37 PAT1 (P) P1488 650 Closed 2.0 2.15
R34 PAT1 (P) P1489 700 Closed 2.8 1.85
R32 PAT1 (T) P1211 700 Closed 1.5 1.69

198

199
Acknowledgements
It is hard to believe that after nearly 4 years of living, working and experiencing the PhD-life,
it has come to an end. They say that all things good and bad end sometime. I guess now it is time to
finish the Zurich chapter of my life. When I look back to the past years in Switzerland, I look back
feeling proud of what I could accomplish, learn and overcome in this time. A whole new world
opened up for me when I met people from all continents, hiked in the majestic Swiss Alps, skied on
the snow-covered valley plains and biked through the forests and farmland of the Swiss countryside. I
am grateful to all people that helped me accomplish this. The list of people is too great to mention
everyone, but there are some people that deserve my gratitude more than anyone. First, I would like to
thank Luigi and Jean-Pierre for giving me the chance to do a PhD with them in the Rock Deformation
Laboratory, and allowing me to learn from my mistakes. It has been almost two years since Luigi
passed away, but no day goes by without thinking of how wonderful a person he was, not only as lab
manager and supervisor, but also as family man and friend of everyone. He showed me his vision of
the world and people; a vision I admire and will always keep in mind. The PhD life, and especially the
one in a busy and crowded lab such as the rock deformation lab, is full of social events and
interactions, most of them memorable, some of them forgettable. I would like to thank the students,
post-docs and staff at ETH for sharing their world with me. This applies foremost to my rock def lab
colleagues Barbara, Liza, Sebastien, Santanu, Claudio and Alba, my office mates Vangelis and
Daniel, but especially to my close friends Bjarne, Nicola, Marilu, Luca, Jara, Mattia, Michaela and
Sifra. Without you guys and girls my life would not have been the same. Thank you all, you are the
best!
That said the work of few people and institutes deserve proper acknowledgement. I thank
Robert and Reto for their essential technical support in the lab. Your magical fingers and impressive
machines saved my project at least a couple of times. I am furthermore grateful to the doctoral
examination committee, comprised of Prof. Jean-Pierre Burg, Dr. Phil Benson and Dr. Dan Faulkner,
for their efforts in reviewing my thesis and providing valuable suggestions for improvements. I can
say with certainty that I’ve learned a great deal thanks to your efforts to support me in whatever way.
To conclude I would like to thank the Institute of Geochemistry and Petrology for teaching me the use
of and allowing me to run some of their machines, Karsten Kunze of the Electron Microscopy Center
for teaching me how to operate the SEM and for providing scientific suggestions, Frowin Pirovino of
the Geological Institute for always preparing excellent quality thin sections and polished rock slices,
Christian Mensing of the Laboratory of Inorganic Chemistry for performing the TG analyses, Lydia
Zehnder of the Institute of Geochemistry and Petrology for performing the XRF analyses, Prof. Ann
Hirt of the Institute of Geophysics for letting me use the sensitive equipment in her Laboratory of
Natural Magnetism, and Jan Pleuger, Daniel Egli and Michaela Erni for translating the abstract into

200
German. Last but not least many thanks go out to Regula and Ingrid. Their work on the often
underappreciated duty of administration kept me out of the blue on many occasions.