Cadherin-dependent filopodia control preimplantation embryo compaction
19
ARTICLES Cadherin-dependent filopodia control preimplantation embryo compaction Juan Carlos Fierro-González 1,2 , Melanie D. White 1,2 , Juan Carlos Silva 1 and Nicolas Plachta 1,3 Compaction of the preimplantation embryo is the earliest morphogenetic process essential for mammalian development, yet it remains unclear how round cells elongate to form a compacted embryo. Here, using live mouse embryo imaging, we demonstrate that cells extend long E-cadherin-dependent filopodia on to neighbouring cells, which control the cell shape changes necessary for compaction. We found that filopodia extension is tightly coordinated with cell elongation, whereas retraction occurs before cells become round again before dividing. Laser-based ablations revealed that filopodia are required to maintain elongated cell shapes. Moreover, molecular disruption of the filopodia components E-cadherin, α- and β-catenin, F-actin and myosin-X prevents cells from elongating and compacting the embryo. Finally, we show that early filopodia formation triggered by overexpressing myosin-X is sufficient to induce premature compaction. Our findings establish a role for filopodia during preimplantation embryonic development and provide an in vivo context to investigate the biological functions of filopodia in mammals. Following fertilization, mouse and human embryos undergo a series of cleavage divisions producing relatively round cells. Starting at the 8-cell stage, compaction marks the beginning of a morphogenetic process essential to prepare the embryo for implantation 1,2 . During compaction, cells flatten their membranes against each other, allowing them to increase cell–cell contact and establish the first epithelium-like structure. Failure of compaction results in non-viable embryos and the timing of compaction is inversely correlated with implantation success of human embryos derived from in vitro fertilization 3–5 . Despite signif- icant progress in understanding how cells acquire lineage identities in compacted embryos 6,7 , the mechanisms controlling earlier morpholog- ical changes required for compaction remain poorly understood. As preimplantation embryos are encapsulated by the zona pellucida, compaction is thought to depend on cell–cell interactions mediated by adhesion molecules such as E-cadherin 8,9 (E-cad). Mouse embryos show compaction defects following treatment with E-cad antibodies 10 or E-cad (Cdh1) deletion 8,9 . Through dynamic interactions with intracellular catenins, E-cad regulates actin filaments (F-actin) and cell shape in various contexts 11,12 . Here, to investigate how E-cad dynamics relate to cell shape changes during compaction we used confocal time-lapse imaging to follow E-cad fused to GFP (E-cad–GFP) in intact preimplantation mouse embryos. This approach allowed us to identify E-cad-dependent filopodia and we demonstrate an unknown role for these structures in controlling cell shape during compaction. 1 European Molecular Biology Laboratory, Australian Regenerative Medicine Institute, Level 1 Building 75, Monash University, Victoria 3800, Australia. 2 These authors contributed equally to this work. 3 Correspondence should be addressed to N.P. (e-mail: [email protected]) Received 16 May 2013; accepted 8 October 2013; published online 24 November 2013; DOI: 10.1038/ncb2875 RESULTS Identification of E-cad-expressing filopodia during mouse embryo compaction To follow E-cad dynamics in living embryos undergoing compaction we microinjected RNA encoding E-cad–GFP into one cell at the 2-cell stage (Fig. 1a). The resultant mosaic embryos enabled us to visualize E-cad–GFP-labelled cellular structures interacting with unlabelled cells. Four-dimensional (4D) imaging (x , y , z and time) was performed using sensitive light detectors and optimized confocal spatiotemporal sampling conditions to reduce laser intensity (see Supplementary Information) as embryos underwent compaction. E-cad–GFP was present throughout the cell membrane, including the apical domain, and was enriched at regions of cell–cell contacts, typically referred to as adherens junctions. Analysis of 4D reconstructions, led to the identification of long filopodia-like cell protrusions containing E-cad–GFP (Fig. 1b,c). These structures were on average 10.9 ± 0.8 μm long (Supplementary Fig. 1). They extended from the border between the adherens junctions and apical membrane (hereafter referred to as apical border) onto the apical membrane of neighbouring cells (Fig. 1b–d and Supplementary Fig. 1). E-cad filopodia were undetectable before embryos reached the 8-cell stage and started compaction, and were absent during the 16- to 32-cell stage when embryos appeared fully compacted (Supplementary Fig. 1). NATURE CELL BIOLOGY ADVANCE ONLINE PUBLICATION 1 © 2013 Macmillan Publishers Limited. All rights reserved.
-
Upload
independent -
Category
Documents
-
view
0 -
download
0
Transcript of Cadherin-dependent filopodia control preimplantation embryo compaction

ART I C L E S
Cadherin-dependent filopodia control preimplantationembryo compactionJuan Carlos Fierro-González1,2, Melanie D. White1,2, Juan Carlos Silva1 and Nicolas Plachta1,3
Compaction of the preimplantation embryo is the earliest morphogenetic process essential for mammalian development, yet itremains unclear how round cells elongate to form a compacted embryo. Here, using live mouse embryo imaging, we demonstratethat cells extend long E-cadherin-dependent filopodia on to neighbouring cells, which control the cell shape changes necessary forcompaction. We found that filopodia extension is tightly coordinated with cell elongation, whereas retraction occurs before cellsbecome round again before dividing. Laser-based ablations revealed that filopodia are required to maintain elongated cell shapes.Moreover, molecular disruption of the filopodia components E-cadherin, α- and β-catenin, F-actin and myosin-X prevents cellsfrom elongating and compacting the embryo. Finally, we show that early filopodia formation triggered by overexpressing myosin-Xis sufficient to induce premature compaction. Our findings establish a role for filopodia during preimplantation embryonicdevelopment and provide an in vivo context to investigate the biological functions of filopodia in mammals.
Following fertilization, mouse and human embryos undergo a seriesof cleavage divisions producing relatively round cells. Starting at the8-cell stage, compaction marks the beginning of a morphogeneticprocess essential to prepare the embryo for implantation1,2. Duringcompaction, cells flatten their membranes against each other, allowingthem to increase cell–cell contact and establish the first epithelium-likestructure. Failure of compaction results in non-viable embryos and thetiming of compaction is inversely correlated with implantation successof human embryos derived from in vitro fertilization3–5. Despite signif-icant progress in understanding how cells acquire lineage identities incompacted embryos6,7, the mechanisms controlling earlier morpholog-ical changes required for compaction remain poorly understood.As preimplantation embryos are encapsulated by the zona pellucida,
compaction is thought to depend on cell–cell interactions mediatedby adhesion molecules such as E-cadherin8,9 (E-cad). Mouse embryosshow compaction defects following treatment with E-cad antibodies10
or E-cad (Cdh1) deletion8,9. Through dynamic interactions withintracellular catenins, E-cad regulates actin filaments (F-actin) andcell shape in various contexts11,12. Here, to investigate how E-caddynamics relate to cell shape changes during compaction we usedconfocal time-lapse imaging to follow E-cad fused to GFP (E-cad–GFP)in intact preimplantation mouse embryos. This approach allowed us toidentify E-cad-dependent filopodia and we demonstrate an unknownrole for these structures in controlling cell shape during compaction.
1European Molecular Biology Laboratory, Australian Regenerative Medicine Institute, Level 1 Building 75, Monash University, Victoria 3800, Australia. 2These authorscontributed equally to this work.3Correspondence should be addressed to N.P. (e-mail: [email protected])
Received 16 May 2013; accepted 8 October 2013; published online 24 November 2013; DOI: 10.1038/ncb2875
RESULTSIdentification of E-cad-expressing filopodia during mouseembryo compactionTo follow E-cad dynamics in living embryos undergoing compactionwe microinjected RNA encoding E-cad–GFP into one cell at the2-cell stage (Fig. 1a). The resultant mosaic embryos enabled usto visualize E-cad–GFP-labelled cellular structures interacting withunlabelled cells. Four-dimensional (4D) imaging (x, y, z and time)was performed using sensitive light detectors and optimized confocalspatiotemporal sampling conditions to reduce laser intensity (seeSupplementary Information) as embryos underwent compaction.E-cad–GFP was present throughout the cell membrane, includingthe apical domain, and was enriched at regions of cell–cellcontacts, typically referred to as adherens junctions. Analysis of4D reconstructions, led to the identification of long filopodia-likecell protrusions containing E-cad–GFP (Fig. 1b,c). These structureswere on average 10.9± 0.8 µm long (Supplementary Fig. 1). Theyextended from the border between the adherens junctions andapical membrane (hereafter referred to as apical border) onto theapical membrane of neighbouring cells (Fig. 1b–d and SupplementaryFig. 1). E-cad filopodia were undetectable before embryos reachedthe 8-cell stage and started compaction, and were absent duringthe 16- to 32-cell stage when embryos appeared fully compacted(Supplementary Fig. 1).
NATURE CELL BIOLOGY ADVANCE ONLINE PUBLICATION 1
© 2013 Macmillan Publishers Limited. All rights reserved.

ART I C L E S
E-cad IF (fixed embryo)
2-cell 8-cell non-compacted 8-cell compacted
memb-mCherry + DIC
0 min
E-cad–GFPRNA
88 min 220 min 440 min
mem
b-m
Che
rry
Fil.
352 min
E-cad–GFPa b
ec'
d
c
f
E-cad–GFP + DIC
Figure 1 E-cad filopodia form during mouse embryo compaction.(a) Microinjection of RNA into one cell at the 2-cell stage allowsvisualization of E-cad–GFP in half of the cells of the embryo duringcompaction. (b,c) Microinjected live 8-cell stage embryos expressingE-cad–GFP. In b, E-cad–GFP-labelled filopodia (arrow) extend from theapical border membrane region of a filopodia-forming cell (left) on topof the neighbouring cell apical membrane (right). In c, two cells show
E-cad–GFP-labelled filopodia (white and yellow arrowheads distinguishfilopodia from each cell). (c’) Schematic diagram of the embryo from c.(d) Detection of filopodia using E-cad antibodies. IF, immunofluorescence.(e) Membrane-targeted mCherry (memb-mCherry) labels bona fideE-cad filopodia extending from two cells (white and yellow arrowheads).(f) Selected time frames show extension and retraction of filopodia overtime. Orthogonal scale bars, 5 µm.
The specificity of E-cad filopodia was confirmed in non-microinjected freshly isolated embryos immunolabelled with E-cad antibodies (Fig. 1d). Furthermore, bona fide E-cad filopodiawere also detectable in live embryos microinjected with RNAencoding membrane-targeted mCherry (memb-mCherry; Fig. 1eand Supplementary Fig. 1), expressing memb-mCherry and E-cad–GFP, or by differential interference contrast (DIC; SupplementaryFig. 1). In agreement with classic descriptions of filopodia as F-actin-rich structures13,14, an F-actin-binding domain fused to GFP(Lifeact–GFP; ref. 15) labelled filopodia in live embryos, and infixed embryos E-cad-immunolabelled filopodia co-localized withrhodamine–phalloidin revealing F-actin (Supplementary Fig. 1). Wedid not detect microtubules in filopodia in live embryos expressingGFP–α-tubulin, nor in fixed embryos immunolabelled with E-cad andα-tubulin antibodies (Supplementary Fig. 1).
Time-lapse imaging of embryo compaction (8- to 16-cell stage)revealed stereotypical patterns of filopodia distribution: 61 ± 6%of cells per embryo extended filopodia at varying times throughoutcompaction (hereafter referred to as filopodia-forming cells); these cellsextended 5.6± 0.2 filopodia per neighbouring cell and they targeted2.4 ± 0.3 neighbouring cells simultaneously (Figs 1b,c,e and 2 andSupplementary Fig. 1); filopodia extended and remained elongated over303± 46min (n= 7 embryos) and retracted over 60± 9min (n= 7embryos; Fig. 1f and Supplementary Videos 1 and 2). To assess theproportion and distribution of filopodia-forming cells relative to eachother and to the rest of the cells within the same embryo, we usedtwo-photon excitation (2PE) microscopy in embryos microinjectedwith E-cad–GFP at the 1-cell stage (Fig. 2). This approach allowed us toimage the filopodia of every cell in the same embryo and confirmed aproportion of filopodia-forming cells per embryo of 56± 2% (Fig. 2g).
2 NATURE CELL BIOLOGY ADVANCE ONLINE PUBLICATION
© 2013 Macmillan Publishers Limited. All rights reserved.

ART I C L E S
Top 3D view Bottom 3D view 16 µm
56 µm55 µm
54 µm
64 µm
0° 5° 10°
0
20
40
60
80
NS
1PE
2PE
0
1
2
3
4
5
6 NS
0
1
2
3NS
1PE 2PE 1PE 2PE 1PE 2PE 1PE 2PE
NS
0
2
4
6
Filo
pod
ia le
ngth
(µm
)
Per
cent
age
of c
ells
with
filop
odia
per
em
bry
o
Num
ber
of f
ilop
odia
per
nei
ghb
ourin
g ce
ll
Nei
ghb
ourin
g ce
lls t
arge
ted
per
filo
pod
ia-f
orm
ing
cell
8
10
12
8-cell-stage embryo 10-cell-stage embryo 12-cell-stage embryo
E-c
ad–G
FP D
IC
a
b c
d
e
f g h i
Top cell
Bottom cellCell interactionFilopodia orientation
5 µm 15 µm 30 µm 45 µm 60 µm 65 µm 70 µm
Figure 2 Filopodia distribution patterns imaged with two-photon excitation(2PE) microscopy. (a) 2PE microscopy allows visualization of every cell in alive 8-cell-stage embryo microinjected with E-cad–GFP RNA at the 1-cellstage. Images are selected Z scans with their approximate distance from thetop of the same embryo using confocal (one-photon excitation, 1PE, top row)and 2PE (bottom row). With 1PE it is difficult to detect fluorescence beyond∼60 µm in depth, but not with 2PE: the white arrowhead shows filopodiadetected at >60 µm from the top of the embryo. (b) Selected top and bottom2PE 3D reconstructions of the embryo shown in a. Only the proximal ∼60%of the embryo is shown in each view to minimize noise. (c) Colour-codedinsets show higher-magnification views of the filopodia shown by arrows in b.Their approximate distance from the top of the embryo is indicated. (d) Thethree images are examples of the same 3D reconstruction: cropped along theZ axis, rotated and viewed from different angles. Filopodia originating from acell on the right side of the image are clearly visible in the left panel (arrow).
Rotating the 3D reconstruction slightly allows visualization of filopodiaoriginating from a cell on the left side. (e) Schematic representations showthe distribution patterns of filopodia-forming cells in the same embryo. Thethree examples show embryos at the 8-, 10- and 12-cell stages imaged andanalysed as described above. Circles depict cells. Grey lines depict directcell–cell contact with neighbouring cells. Green arrows depict filopodiaextensions and their orientation. The distribution patterns of filopodia ineach embryo are in agreement with the main stereotypical patterns offilopodia formation described in our study (see Results). (f–i) Quantitativeanalysis of filopodia length (f), the percentage of filopodia-forming cellsper embryo (g), number of filopodia per neighbouring cell (h) and numberof neighbouring cells per filopodia-forming cell (i) obtained using 1PE or2PE. NS, not significant by t -test. Error bars represent s.e.m. Statisticssource data and sample sizes for f–i can be found in the Methods andSupplementary Table 1. Horizontal and orthogonal scale bars, 5 µm.
NATURE CELL BIOLOGY ADVANCE ONLINE PUBLICATION 3
© 2013 Macmillan Publishers Limited. All rights reserved.

ART I C L E S
1.0
1.2
1.4
1.6
1.8
Asp
ect
ratio
Filopodia retracted Cell divisionFilopodia extended
mem
b-m
Che
rry
mem
b-m
Che
rry
Filopodia extendedBefore filopodia extention
ExtendedBefore
1.0
1.2
1.4
1.6
1.8
Asp
ect
ratio
Retracted
Extended
**
***
Aspect ratio =dmax
dmin
dm
in
dmax
Fil.
Fil.
Fil.
0 min 48 min 64 min
280 min0 min
a
d
b c
e
Figure 3 Filopodia extension–retraction dynamics are tightly coordinatedwith cell shape changes during compaction. (a) Selected time framesof a live embryo expressing memb-mCherry in half of its cells. Twocells show elongation of their apical border membrane followingfilopodia extension. (b) dmax and dmin are used to measure changes inaspect ratio. (c) Aspect ratio changes after filopodia extension (n =7
cells). (d) Selected time frames show complete retraction of filopodiaby an elongated cell, which becomes round before undergoing celldivision. (e) Aspect ratio changes after filopodia retraction (n = 9cells). ∗∗∗P <0.001, ∗∗P <0.01 by t -test. Error bars represent s.e.m.Statistics source data for c and e can be found in SupplementaryTable 1. Orthogonal scale bars, 5 µm.
In addition, cell distribution analyses revealed heterogeneous patternsin the distribution of filopodia-forming cells, without clustering offilopodia-forming cells in the same region of the embryo (Fig. 2b–e).We also observed that cells never extended reciprocal filopodia on
top of each other. The lack of reciprocal filopodia was confirmedby analysis of the 2PE data (Fig. 2b–e) and by experiments usingconfocal imaging, in which each cell of a 2-cell-stage embryo wasmicroinjected with E-cad–GFP or memb-mCherry (SupplementaryFig. 2). In addition, we found that filopodia-forming cells alwaysretracted their filopodia before undergoing cell division (n = 20cells; Supplementary Video 3) and filopodia retraction was neverobserved without subsequent cell division (Supplementary Fig. 2).Moreover, cells receiving filopodia never divided when filopodiawere extended over their membranes. Live embryo imaging furtherrevealed that 69% of cells with filopodia underwent symmetricdivisions, in which both daughter cells were allocated to the outerextraembryonic regions of the embryo, whereas the remaining 31%underwent asymmetric divisions, allocating one daughter cell to theouter and the other to the inside pluripotent region (SupplementaryFig. 3). This 7:3 ratio between symmetric/asymmetric divisions isexpected during compaction16–18 and thus, our experiments suggest noa priori bias between the presence of filopodia and cell lineage allocation.Furthermore, tracking the progeny of a single cell microinjected atthe 2-cell stage with memb-mCherry revealed that early blastomerescontribute a variable proportion of filopodia-forming cells duringcompaction (Supplementary Fig. 3), further indicating no obviousbias of 2-cell-stage blastomeres towards the generation of filopodia-forming cells. Together, these results established E-cad filopodia as amorphological feature of mouse embryo compaction.
Filopodia control cell shape during compactionAs E-cad filopodia appeared specifically during compaction, wereasoned that they may be associated with cell shape changes duringthis process. To test this, we microinjected memb-mCherry into onecell at the 2-cell stage, and followed filopodia dynamics and cell shapeduring compaction. Before extending filopodia, cells were relativelyround, as demonstrated by aspect ratio measurements (dmax/dmin)close to 1 (Fig. 3a–c). However, following extension of filopodia, theapical border became elongated and the cell’s aspect ratio increased(Fig. 3a–c). During compaction, cells became rounded again beforedivision and retracted their filopodia as they reverted to a roundedshape (Fig. 3d,e). These experiments demonstrated a tight temporalcoordination between filopodia extension–retraction dynamics andcell shape changes during compaction.We next predicted that filopodia may provide tension to maintain
the elongation of the apical border of filopodia-forming cells fromwhich they extend. To address this, we expressed memb-mCherryin half of the embryo and performed multiphoton laser ablationstargeting the initial 5 µm from the base of filopodia. Following filopodiaablation, the angle of the apical border membrane adjacent to thefilopodia base widened (mean angle of 81.6◦ ± 5.5◦ pre-ablation,131.9◦±5.0◦ post-ablation) and the region of membrane overlayingthe neighbouring cell retracted (Fig. 4a–c). These changes were visibleimmediately after ablation, supporting the idea that ablating filopodiareleased tension maintaining the two neighbouring cells in closeapposition. In these experiments we selected pairs consisting ofa filopodia-forming cell expressing memb-mCherry and a memb-mCherry-negative neighbouring cell. This facilitated detection oflabelled filopodia on top of non-fluorescent neighbouring structures.
4 NATURE CELL BIOLOGY ADVANCE ONLINE PUBLICATION
© 2013 Macmillan Publishers Limited. All rights reserved.

ART I C L E S
Pre adherens junction ablationPost filopodia ablationPre filopodia ablation Post adherens junction ablation
mem
b-m
Che
rry
mem
b-m
Che
rry
mem
b-m
Che
rry
+ T
L
mem
b-m
Che
rry
+ T
LAbl.
Fil.
Abl.
Angle Angle
Fil.
0° 0° 0° 0°
90° 90° 90° 90°
180° 180° 180° 180°
Post adherens junction ablationPre adherens junction ablationPost filopodia ablationPre filopodia ablation
***NS
0 s 26 s 0 s 28 s
d
e
f
a
b
c
Figure 4 Filopodia laser-ablation perturbs cell shape. (a) Single focalplane of a cell expressing memb-mCherry in a live embryo. Immediatelyfollowing filopodia laser-based ablation, the angle of the cell membrane inthe apical border region widens (blue angle). (b) Transmitted light imagingshows a wider gap (arrow) between the two cells following filopodia laserablation. (c) Apical border membrane angles before and after filopodia
laser ablations (n =11 cells). (d–f) Unlike filopodia laser ablations, similarablations performed along the adherens junction between filopodia-formingand neighbouring cells do not cause immediate changes in apical bordermembrane angles (n =5 cells). ∗∗∗P <0.001; NS, not significant by t -test.Statistics source data for c,f can be found in Supplementary Table 1.Scale bars, 5 µm.
Nevertheless, using transmitted light we observed that followingablation the membrane region of the neighbouring cell where thefilopodium attached also retracted and became rounded (arrow inFig. 4b), further indicating a release of tension between cells. Adherensjunctions are implicated in maintaining cell–cell adhesion12,19. Unlikethe effects of ablating filopodia, similar ablations performed at adherensjunctions between filopodia-forming and neighbouring cells didnot perturb the angle of the membrane border regions adjacentto filopodia (mean angle of 92.9◦± 6.5◦ pre-ablation, 95.3◦± 5.4◦
post-ablation; Fig. 4d–f), even when ablations caused fusion of thecells (Supplementary Fig. 4), suggesting that adherens junctions andfilopodia affect different aspects of cell shape. Together, our time-lapseimaging and ablation experiments indicate that filopodia are importantfor cell shape changes during compaction.
Disrupting molecular components of filopodia affects cell shapeand compactionAs physically disrupting filopodia indicated that these structures sup-port the elongation of the cell’s apical border, we predicted that molec-ular manipulations of filopodia components would affect cell shapeduring compaction. To test this we microinjected memb-mCherrywith E-cad short interfering RNAs (siRNAs) into one cell at the 2-cellstage, to reduce E-cad expression in half of the embryo. By the onset ofcompaction, E-cad knockdown caused a reduction in the number of
filopodia per cell (Fig. 5a,c and Supplementary Fig. 5). Although E-cadknockdown cells formed fewer filopodia, these structures exhibitedlengths of 9.6±0.9 µm (n=14 filopodia), extended and remained elon-gated over 256±57min (n=6 embryos) and retracted over 53±14min(n= 6 embryos; Supplementary Fig. 5), similarly to control filopodia.Furthermore, knockdown cells failed to change shape, remainingrounded, as assessed by their aspect ratio, and did not integrate into therest of the compacting embryo, formed by non-injected cells (Fig. 5b,dand Supplementary Fig. 5). We confirmed the specificity of the E-cadsiRNAphenotype by a rescue experiment (Supplementary Fig. 5).As it is well documented that interactions with α- and β-catenin
(α-/β-cat) control E-cad function19, we imaged live embryos co-expressing fusion proteins of either GFP–α-cat or β-cat–GFP, withE-cad–RFP, and found that both catenins co-localized with E-cad–RFP in filopodia (Supplementary Fig. 1). Moreover, similarlyto inhibiting E-cad function, knockdown of endogenous α- andβ-cat in half of the embryo led to reduced filopodia numbersand the knockdown cells remained rounded and did not integrateinto the compacting embryo (Fig. 5a,b and Supplementary Fig. 5).Immunolabelling showed that both α- and β-cat siRNA downregulatedE-cad membrane expression in regions filopodia normally extendedfrom (Supplementary Fig. 5). These catenin results further supportthe view that an E-cad-dependent mechanism controls filopodiaduring compaction. Although manipulation of E-cad and catenins
NATURE CELL BIOLOGY ADVANCE ONLINE PUBLICATION 5
© 2013 Macmillan Publishers Limited. All rights reserved.

ART I C L E S
***
***
**
*
******
***** *** ***
*** *** ****** ***
***
******
2
4
Num
ber
of f
ilop
odia
per
nei
ghb
ourin
g ce
ll
6
0
Contro
l siR
NA
Contro
l siR
NA
E-cad
siRNA
α-cat
siRNA
β-ca
t siR
NA
Myo
10 si
RNA
E-cad
ΔECD–RFP
E-cad
–RFP
Contro
l Ab
E-cad
Ab
4 h
CD (0.5
μg m
l–1 )
4 h
wash
GFP–M
yo10
GFP–H
eadles
s
E-cad
siRNA
α-cat
siRNA
β-ca
t siR
NA
Myo
10 si
RNA
E-cad
–RFP
E-cad
ΔECD–RFP
GFP–M
yo10
GFP–H
eadles
s
Asp
ect
ratio
1.0
1.2
1.4
1.6
1.8m
emb
-mC
herr
y
mem
b-m
Che
rry
+ D
IC
E-c
ad–G
FP
Control siRNA E-cad siRNA Control siRNA E-cad siRNA E-cad–RFP E-cadΔECD–RFP
mem
b-m
Che
rry
0
10
Filo
pod
ia le
ngth
(μm
)
Det
ache
d fi
lop
odia
(%)
20
0
20
40
60
80
mem
b-m
Che
rry
+ D
IC
Control Ab
E-cad Ab
Control Ab
E-cad Ab
4 h CD (0.5 μg ml–1 )
4h wash
Control Ab
E-cad Ab
4 h CD (0.5 μg ml–1 )
4 h wash
mem
b-m
Che
rry
mem
b-m
Che
rry
+ D
IC
4 h CD (0.5 μg ml–1)
4 h wash
mem
b-m
Che
rry
b
d e
l
Control AbE-cad Ab
(60% of cases)E-cad Ab
(40% of cases)g h i
a
c
f
12 h wash 4 h CD (0.5 μg ml–1) 1 h wash 4 h wash4 h CD (3 μg ml–1) kj
Figure 5 Molecular disruption of filopodia perturbs cell shape andcompaction. (a) Molecular manipulation of filopodia componentsdecreases filopodia number during compaction. (b) Manipulated cellsremain rounded as assessed by their aspect ratio. CD, cytochalasin D.(c,d) Representative examples of reduced filopodia number (c) andfailure to integrate into the compacting embryo (d) for cells microinjectedwith E-cad siRNAs and memb-mCherry (Fig. 6 and SupplementaryFig. 5 for the other examples of perturbed filopodia number andcompaction). In d, white arrows show compacted and elongated cells,and the black arrow depicts a round cell that fails to integrate intothe embryo. (e) E-cad–RFP is detected in filopodia (arrowhead), butE-cad1ECD–RFP fails to localize to the few filopodia that still form.(f–i) Blocking E-cad trans interactions with the DECMA-1 antibody
leads to no filopodia, or abnormally long (green arrowhead) anddetached (pink arrowhead) filopodia. Arrowheads in control embryosshow normal filopodia. (j) Cytochalasin D treatment at 3 µgml−1 robustlyprevents filopodia formation and compaction in all of the embryosanalysed (n = 11 embryos) even after 12 h cytochalasin D washout(12 h wash). (k,l) Treatment with a lower cytochalasin D concentration(0.5 µgml−1) results in abnormally long (green arrowhead) and detached(pink arrowhead) filopodia, and cells remain rounded. Following 4 hcytochalasin D washout, cells extend normal filopodia and becomeelongated (see also h,i, and Supplementary Fig. 5). ∗∗∗P < 0.001,∗∗P < 0.01, ∗P < 0.05 by t -test. Error bars indicate s.e.m. Statisticssource data and exact sample sizes for a,b,h,i can be found in Methodsand Supplementary Table 1. Horizontal and orthogonal scale bars, 5 µm.
prevented embryos from compacting normally, some embryoseventually compacted after a varying delay of 6–36 h, possibly owingto compensatory mechanisms regulating compaction, which is in linewith previous observations8,9.We reasoned that one function for E-cad in filopodia might be to
mediate attachment to the neighbouring cell membrane through transinteractions. To test this, we used a dominant-negative E-cad proteinwith a truncated extracellular domain fused to RFP (E-cad1ECD–RFP),previously shown to interfere with trans interactions20. We co-injectedequal amounts of E-cad–GFP and E-cad1ECD–RFP RNA into one cellat the 2-cell stage and determined the effects on filopodia formation,
cell shape and compaction. Similarly to E-cad knockdown, expressionof E-cad1ECD–RFP reduced the number of filopodia by the 8-cellstage and these cells also remained rounded with aspect ratios close to1, and were unable to integrate into the compacting embryo (Fig. 5a,b,eand Supplementary Fig. 5). Unlike E-cad–GFP, E-cad1ECD–RFPfailed to localize to the few filopodia that still form in these embryos(Fig. 5e) and was not enriched at adherens junctions (SupplementaryFig. 5), suggesting that trans interactions are required for E-cadaccumulation in filopodia and adherens junctions. Control embryosin which E-cad–GFP was co-expressed with E-cad–RFP did notshow defects in E-cad localization, filopodia number, cell shape or
6 NATURE CELL BIOLOGY ADVANCE ONLINE PUBLICATION
© 2013 Macmillan Publishers Limited. All rights reserved.

ART I C L E S
0
200
400
6002–7 cell
8–16 cell
Myo10 IF E-cad IF
***
**In
tens
ity c
hang
e (%
)
Myo
10 IF
2–7 cell 8–16 cell
E-c
ad IF
2–7 cell 8–16 cell
mem
b-m
Che
rry
mem
b-m
Che
rry
DIC
mem
b-m
Plu
m
GFP–Myo10E
-cad
–RFP
mem
b-m
Che
rry
mem
b-m
Che
rry
DICGFP–Myo10
mem
b-m
Che
rry
GFP–Myo10 GFP–Headless GFP–Myo10 GFP–Headless GFP–Myo10 GFP–Headless
Control siRNA Myo10 siRNA Control siRNA Myo10 siRNA
a
c
f g h
d e
b
Figure 6 Myo10 is required for filopodia formation during compaction.(a) Endogenous Myo10 and E-cad fluorescence intensity increases atmembrane regions where filopodia normally extend during compaction(8- to 16-cell stage) relative to earlier stages (2- to 7-cell stage;n = 28 membrane regions for Myo10 immunofluorescence at 2–7cell, 28 for Myo10 immunofluorescence at 8–16 cell, 21 for E-cadimmunofluorescence at 2–7 cell, 25 for E-cad immunofluorescence at8–16 cell). ∗∗∗P < 0.001; ∗∗P < 0.01 by t -test. Error bars represents.e.m. (b) Selected rainbow images represent the changes shown in a.(c) High-magnification view of filopodia in a live embryo microinjectedwith GFP–Myo10, memb-mPlum and E-cad–RFP. GFP–Myo10 puncta
localize along filopodia (arrow) and at their tips (arrowheads, see also f,g).(d,e) Myo10 knockdown causes a reduction in filopodia number (d) andprevents memb-mCherry-labelled cells from integrating into the rest ofthe compacting embryo (e). (f) GFP–Myo10 localizes along filopodia andtheir tips (arrowhead). GFP–Headless fails to localize to the few filopodiathat still form. (g) GFP–Myo10, but not GFP–Headless, is enriched inmembrane regions where filopodia normally extend (open arrowhead).(h) Cells microinjected with GFP–Headless fail to integrate into thecompacting embryo and remain rounded. Statistics source data for acan be found in Supplementary Table 1. Horizontal and orthogonal scalebars, 5 µm.
compaction (Fig. 5a,b,e and Supplementary Fig. 5). In agreementwith these findings, acute extracellular treatment of 8-cell embryoswith DECMA-1 E-cad antibodies previously shown to block transinteractions21 prevented filopodia formation in 60% of the embryos(Fig. 5f), and the remaining 40% formed abnormal filopodia that werelonger and detached from the neighbouring cell apical membrane(Fig. 5f–i). Cells in antibody-treated embryos remained roundedexhibiting aspect ratios close to 1, and the embryos failed to compactcompared with control embryos (Fig. 5b and Supplementary Fig. 5).This set of experiments shows that filopodia formation requires E-cad,and that filopodia length and attachment to the neighbouring cellmembrane are probablymediated by E-cad trans interactions.As F-actin regulates the filopodia cytoskeleton19, we determined the
effect of treatment of 8-cell embryos with cytochalasin D on filopodiaand compaction. Cytochalasin D treatment at 3 µgml−1 depletedLifeact–GFP fluorescence along the cell membrane and preventedfilopodia formation completely (Fig. 5j). Cells remained roundedexhibiting an aspect ratio of 1.06±0.02 (n= 17 cells from 6 embryos)and these embryos failed to compact (Fig. 5j and Supplementary Fig. 5),even following cytochalasin D washout (12 h wash). Treatment with a6-fold lower cytochalasin D concentration (0.5 µgml−1) reduced, butdid not completely deplete, Lifeact–GFP fluorescence (SupplementaryFig. 6). These embryos extended a similar number of filopodia,
yet the treated filopodia were abnormally long and detached fromthe neighbouring cell membrane (Fig. 5h,i,k,l and SupplementaryFig. 6). In line with defects in filopodia, cells in embryos treated with0.5 µgml−1 cytochalasin D maintained aspect ratios close to 1 andthe embryos failed to compact (Fig. 5b and Supplementary Fig. 5).This effect is consistent with earlier observations on mouse embryostreated with the same cytochalasin D concentration, which showedabnormal localization and length of microfilament structures andcompaction defects22,23. Following one hour of 0.5 µgml−1 cytochalasinD washout, most filopodia fragmented, and 4 h later the cellsextended filopodia showing normal length and attachment, exhibitedsignificantly higher aspect ratios and formed a compacted embryo(Fig. 5b,h,i,k,l and Supplementary Figs 5 and 6). It is possible that thedefects in filopodia length and attachment result from aberrant E-cadfunction or localization, because E-cad–GFP exhibited an abnormaldistribution pattern in embryos treatedwith 0.5 µgml−1 cytochalasinD,which was reverted following cytochalasin D washout (SupplementaryFig. 6). Finally, in agreement with filopodia not expressing α-tubulin,nocodazole-treated embryos formed filopodia and underwent normalcompaction (Supplementary Fig. 6), in line with previous studies24.Our results thus show that compaction is associated with the formationof filopodia exhibiting normal length and attachment and normaldistribution of filopodia components such as E-cad.
NATURE CELL BIOLOGY ADVANCE ONLINE PUBLICATION 7
© 2013 Macmillan Publishers Limited. All rights reserved.

ART I C L E S
Fil.
Fil.
II
III
Embryo 1
II
III Embryo 2
II
III Embryo 3
II
III Embryo 4
II
III Embryo 5
II
III Embryo 6
II
III Embryo 7
II
II
II
III
IIIm
emb
-mC
herr
y
Fil. Fil.
mem
b-m
Che
rry
mem
b-m
Che
rry
+ D
IC
II
III
100
0
20
40
Per
cent
age
of fi
lop
odia
-fo
rmin
g ce
lls
60
80
GFP–Myo10 OE
GFP–Myo10 OE + E-cad siRNA
GFP–Myo10 OE + control siRNA
GFP–Headless OE
GFP–Myo10 control
0 0 0 0 0 0
a
b
d
GFP–Myo10 OE GFP–Myo10 control GFP–Headless OEGFP–Myo10 OE+ E-cad siRNA
GFP–Myo10 OE+ control siRNA
6-cell compacted 7-cell non-compacted 7-cell non-compacted 7-cell non-compacted 6-cell compacted
Non-microinjected cell
Microinjected cell
Microinjected cell with filopodia
Cells comprising prematurely compacting embryo
0 min 320 minc
Figure 7 Premature filopodia formation induces early compaction.(a) Microinjection of a high concentration of GFP–Myo10 (overexpression,OE) with memb-mCherry RNA into one cell at the 2-cell stage inducespremature filopodia formation (arrowhead) and embryo compaction (visibleby DIC imaging) at the 5- to 7-cell stage. Lower GFP–Myo10 concentrationsor GFP–Headless cannot induce filopodia and compaction. Co-injectionwith E-cad siRNAs suppresses the effect of GFP–Myo10 overexpression onfilopodia formation and compaction. Insets show GFP–Myo10 expressionalong the prematurely induced filopodia (n = 7 embryos for GFP–Myo10OE; 15 for GFP–Myo10 control; 11 for GFP–Headless OE; 20 forGFP–Myo10 OE +E-cad siRNA; 7 for GFP–Myo10 OE + control siRNA).(b–d) Overexpression of GFP–Myo10 can trigger filopodia formation inboth second- and third-cleavage stage cells. (b) Schematic chart ofseven representative embryos analysed for the experiments overexpressingGFP–Myo10 shown in a. We scored memb-mCherry-positive cells extendingfilopodia from 2-cell stage onwards, and determined whether these cellscorrespond to a second- or third-cleavage stage blastomere. During 5- to
7-cell stages, the embryos contain a mixture of second- and third-cleavagecells. Areas outlined in orange show the stage at which premature compactionwas observed. Circles show all cells imaged. Colour codes indicate whethercells are non-microinjected (grey), microinjected (red) and extendingfilopodia (green–red circles). (c) Representative examples of embryo 5(from b) at different time points. At time 0min, the embryo contains twomemb-mCherry-positive cells; both of these correspond to a second-cleavagestage and one of them is extending filopodia (arrow). At time 320min, thesecond-stage cell has retracted its filopodia. The upper cell has divided intotwo third-cleavage stage cells. One of these cells is now extending filopodia(arrow). These examples show that both second- and third-cleavage stagecells can extend filopodia in the same embryo. Non-injected cells are notvisualized in these examples. Roman numbers indicate cells correspondingto second- (II) or third- (III) cleavage stage. (d) Analysis of all embryosused in a confirms the ability of both second- and third-cleavage stagecells to extend filopodia when overexpressing GFP–Myo10. Horizontal andorthogonal scale bars, 5 µm.
8 NATURE CELL BIOLOGY ADVANCE ONLINE PUBLICATION
© 2013 Macmillan Publishers Limited. All rights reserved.

ART I C L E S
Early filopodia formation causes premature compactionTo identify molecules required for induction of filopodia formationduring compaction, we investigated myosin-X (Myo10). In culturedcells, this myosin localizes to filopodia and is important for theirformation25. Immunolabelling at different developmental stagesrevealed that Myo10 is expressed in embryos and its levels increased atapical border regions just before compaction (Fig. 6a,b). Furthermore,co-injection of Myo10 fused to GFP (GFP–Myo10), memb-mPlumand E-cad–RFP into one cell at the 2-cell stage revealed GFP–Myo10puncta distributed along filopodia and enriched at filopodia tips(Fig. 6c), similarly to previous work in cultured cells26. To testwhether endogenous Myo10 is necessary for filopodia formation,we microinjected memb-mCherry with Myo10 siRNAs into onecell at the 2-cell stage. Similarly to reducing E-cad (Fig. 5a–d),knockdown of Myo10 decreased filopodia numbers and knockdowncells remained rounded and could not integrate into the compactingembryo (Figs 5a,b and 6d,e). We confirmed the specificity of theMyo10 siRNA phenotype by a rescue experiment (SupplementaryFig. 5). Moreover, a dominant-negative mutant Myo10 lacking themotor domain fused to GFP (GFP–Headless) failed to localize tofilopodia tips, similarly to previous observations27 (Fig. 6f), and showedreduced expression at apical border regions (Fig. 6g). In line withthe knockdown approach, GFP–Headless also disrupted filopodianumbers and perturbed cell shape and compaction (Figs 5a,b and6f–h). Although it remains unclear howMyo10 participates in filopodiaformation25, we noticed that 80% of GFP–Myo10 puncta co-localizedwith E-cad–RFP in apical border regions near the filopodia base (n=13filopodia), whereas only 11% of GFP–Myo10 puncta co-localizedwith E-cad–RFP along filopodia (n= 22 filopodia; Fig. 6c), suggestingthat most Myo10 functions in filopodia are independent of directinteraction with E-cad. These experiments indicate that Myo10 isnormally required for filopodia formation during compaction.As disrupting filopodia by ablation and molecular manipulation
prevented cell shape changes and compaction, we reasoned thatinducing filopodia formation prematurely could promote earlycompaction. Expression of Myo10 at high concentration has beenshown to induce filopodia formation in cultured cells28. Overexpressionof GFP–Myo10 in half of the embryo, but not of GFP–Headless,was sufficient to induce the premature formation of filopodia in 5-to 7-cell-stage embryos, and these embryos compacted prematurely(Fig. 7a). This effect was suppressed by co-injecting E-cad siRNAs witha high concentration of GFP–Myo10, suggesting a requirement forboth molecules in filopodia formation and compaction (Fig. 7a). Atthe 5- to 7-cell stage, mouse embryos contain a mixture of second- andthird-cleavage blastomeres6,7. Overexpression of GFP–Myo10 couldinduce filopodia in both cell types (Fig. 7b–d), indicating that thepotential to form filopodia is present before cells adopt a third-cleavageidentity. These results indicate that Myo10 is essential for filopodiaformation and support the view that E-cad-dependent filopodia playan active role in reshaping the embryo during compaction.
DISCUSSIONStudies from the late 1970s first noted diverse cell membraneprotrusions in fixed preimplantation embryos23,29,30. Here, we nowdemonstrate the presence of long filopodia that extend duringcompaction and are required for cell shape changes central to
this developmental process. These protrusions contain E-cad andcomponents typically present in filopodia13,14, including F-actin andMyo10. We propose an initial working model in which cells usefilopodia to attach to the neighbouring cell apical membrane throughE-cad trans interactions. Filopodia then maintain tension to elongatethe apical membrane border over neighbouring cells, bringing the cellscloser and facilitating compaction.We found that ∼60% of cells per embryo form filopodia. It is
possible that these cells use filopodia to elongate their membraneand help neighbouring cells change shape by pulling the two cellscloser. This idea is supported by our laser-ablation experimentsthat caused changes not only in filopodia-forming cells, but alsoin the adjacent cells, which became more rounded and separated(Fig. 4b). Similarly, when overexpressing GFP–Myo10, on average40% of cells in each embryo formed filopodia, and the entire embryodeveloped a compacted morphology. This is in line with the ideathat filopodia formation by some, but not all, cells in the embryocan promote compaction. In embryos where E-cad was disruptedin half of the cells using siRNAs, or by expression of an RFP-taggeddominant-negative E-cad proteinwith a truncated extracellular domain(E-cad1ECD–RFP), DIC imaging revealed normal elongation andflattening of the non-injected cells, and the region occupied bythese cells exhibited a classic compacted morphology1,2 (Fig. 5d). Itis likely that the non-injected cells can form normal filopodia andE-cad trans interactions with each other that help them undergocompaction, but not with the knockdown cells. Furthermore, wefound that cells never extend reciprocal filopodia on top of eachother, and filopodia-forming cells always retract their filopodia beforedividing. Together, these patterns of filopodia formation could helpprevent conflicting tension forces between neighbouring cells duringcompaction and facilitate membrane remodelling in cytokinesis. Wealso found that cells never divide while filopodia are extended on top ofthem. This suggests that in addition to maintaining tension, filopodiacould further participate in compaction by enabling spatially restrictedsignalling to neighbouring cells, as reported forDrosophila cytonemes31.For example, signalling from filopodia could preclude simultaneousdivision of the filopodia-forming and neighbouring cells, which maybe important to preserve packing of cells during compaction. Althoughit remains debated when and how cells adopt distinct developmentalfates in the preimplantation embryo6,7,32, our experiments revealed aheterogeneous distribution of filopodia-forming cells in the embryoand no direct association between filopodia formation and theallocation of cells to the pluripotent and extraembryonic lineages.Revealing mechanisms controlling whether or not cells form filopodia,and their relationship with cell division during compaction, is animportant task for future investigation.Thus far, filopodia have been implicated in key biological processes
including morphogen signalling in Drosophila and avian embryos31,33,cell migration, axonal pathfinding and cancer cell invasion13,14. Ourstudy establishes a role for filopodia in controlling cell shape duringmouse embryo compaction and provides an in vivo context toinvestigate the roles of filopodia in mammals. Furthermore, asthe timing of compaction in human embryos is associated withimplantation success4,5, a greater understanding of the role of filopodiain compaction may be clinically relevant for reproductive strategiesbased on in vitro fertilization. �
NATURE CELL BIOLOGY ADVANCE ONLINE PUBLICATION 9
© 2013 Macmillan Publishers Limited. All rights reserved.

ART I C L E S
METHODSMethods and any associated references are available in the onlineversion of the paper.
Note: Supplementary Information is available in the online version of the paper
ACKNOWLEDGEMENTSWe thank A. Yap, E. Jesudason, A. Fouras and J. Polo for comments on themanuscript; T. Bell for advice on laser ablations; S. Firth and I. Harper for help withimaging experiments; and R. Cheney, A. Yap and B. Henderson for sharing DNAconstructs. N.P. is supported by ARC DP120104594 and DE120100794, NHMRCAPP1052171 and Monash University Strategic and Interdisciplinary grants, andJ.C.F-G. by Wenner-Gren Foundations and Swedish Society for Medical ResearchPostdoctoral Fellowships.
AUTHOR CONTRIBUTIONSJ.C.F-G. and M.D.W. designed and performed the experiments. J.C.S. performedembryo microinjections and manipulations. N.P. supervised the project. J.C.F-G.,M.D.W. and N.P. wrote the paper.
COMPETING FINANCIAL INTERESTSThe authors declare no competing financial interests.
Published online at www.nature.com/doifinder/10.1038/ncb2875Reprints and permissions information is available online at www.nature.com/reprints
1. Johnson, M. H., Maro, B. & Takeichi, M. The role of cell adhesion in thesynchronization and orientation of polarization in 8-cell mouse blastomeres. J.Embryol. Exp. Morphol. 93, 239–255 (1986).
2. Johnson, M. H. & Ziomek, C. A. Induction of polarity in mouse 8-cell blastomeres:specificity, geometry, and stability. J. Cell Biol. 91, 303–308 (1981).
3. Landry, D. W., Zucker, H. A., Sauer, M. V., Reznik, M. & Wiebe, L. Hypocellularityand absence of compaction as criteria for embryonic death. Regen. Med. 1,367–371 (2006).
4. Le Cruguel, S. et al. Early compaction at day 3 may be a useful additional criterionfor embryo transfer. J. Assist. Reprod. Genet. 30, 683–690 (2013).
5. Skiadas, C. C., Jackson, K. V. & Racowsky, C. Early compaction on day 3may be associated with increased implantation potential. Fertil. Steril. 86,1386–1391 (2006).
6. Rossant, J. & Tam, P. P. Blastocyst lineage formation, early embryonic asymmetriesand axis patterning in the mouse. Development 136, 701–713 (2009).
7. Zernicka-Goetz, M., Morris, S. A. & Bruce, A. W. Making a firm decision: multifacetedregulation of cell fate in the early mouse embryo. Nat. Rev. Genet. 10,467–477 (2009).
8. Larue, L., Ohsugi, M., Hirchenhain, J. & Kemler, R. E-cadherin null mutantembryos fail to form a trophectoderm epithelium. Proc. Natl Acad. Sci. USA 91,8263–8267 (1994).
9. Stephenson, R. O., Yamanaka, Y. & Rossant, J. Disorganized epithelial polarityand excess trophectoderm cell fate in preimplantation embryos lacking E-cadherin.Development 137, 3383–3391 (2010).
10. Dietrich, J. E. & Hiiragi, T. Stochastic patterning in the mouse pre-implantationembryo. Development 134, 4219–4231 (2007).
11. Michael, M. & Yap, A. S. The regulation and functional impact of actin assembly atcadherin cell–cell adhesions. Semin. Cell Dev. Biol. 24, 298–307 (2013).
12. Cavey, M. & Lecuit, T. Molecular bases of cell–cell junctions stability and dynamics.Cold Spring Harb. Persp. Biol. 1, a002998 (2009).
13. Gupton, S. L. & Gertler, F. B. Filopodia: the fingers that do the walking. Sci. STKE2007, re5 (2007).
14. Mattila, P. K. & Lappalainen, P. Filopodia: molecular architecture and cellularfunctions. Nat. Rev. Mol. Cell Biol. 9, 446–454 (2008).
15. Riedl, J. et al. Lifeact: a versatile marker to visualize F-actin. Nat. Methods 5,605–607 (2008).
16. Kaur, G. et al. Probing transcription factor diffusion dynamics in the livingmammalian embryo with photoactivatable fluorescence correlation spectroscopy.Nat. Commun. 4, 1637 (2013).
17. Morris, S. A. et al. Origin and formation of the first two distinct cell types of the innercell mass in the mouse embryo. Proc. Natl Acad. Sci. USA 107, 6364–6369 (2010).
18. Plachta, N., Bollenbach, T., Pease, S., Fraser, S. E. & Pantazis, P. Oct4 kineticspredict cell lineage patterning in the early mammalian embryo. Nat. Cell Biol. 13,117–123 (2011).
19. Ratheesh, A. & Yap, A. S. A bigger picture: classical cadherins and the dynamicactin cytoskeleton. Nat. Rev. Mol. Cell Biol. 13, 673–679 (2012).
20. Nieman, M. T., Prudoff, R. S., Johnson, K. R. & Wheelock, M. J. N-cadherinpromotes motility in human breast cancer cells regardless of their E-cadherinexpression. J. Cell Biol. 147, 631–644 (1999).
21. Kobayashi, N., Ikesue, A., Majumdar, S. & Siahaan, T. J. Inhibition of E-cadherin-mediated homotypic adhesion of Caco-2 cells: a novel evaluation assay forpeptide activities in modulating cell–cell adhesion. J. Pharmacol. Exp. Ther. 317,309–316 (2006).
22. Johnson, M. H. & Maro, B. The distribution of cytoplasmic actin in mouse 8-cellblastomeres. J. Embryol. Exp. Morphol. 82, 97–117 (1984).
23. Sutherland, A. E. & Calarco-Gillam, P. G. Analysis of compaction in thepreimplantation mouse embryo. Dev. Biol. 100, 328–338 (1983).
24. Maro, B. & Pickering, S. J. Microtubules influence compaction in preimplantationmouse embryos. J. Embryol. Exp. Morphol. 84, 217–232 (1984).
25. Kerber, M. L. & Cheney, R. E. Myosin-X: a MyTH-FERMmyosin at the tips of filopodia.J. Cell Sci. 124, 3733–3741 (2011).
26. Berg, J. S., Derfler, B. H., Pennisi, C. M., Corey, D. P. & Cheney, R. E. Myosin-X, anovel myosin with pleckstrin homology domains, associates with regions of dynamicactin. J. Cell Sci. 113, 3439–3451 (2000).
27. Sousa, A. D., Berg, J. S., Robertson, B. W., Meeker, R. B. & Cheney, R. E. Myo10 inbrain: developmental regulation, identification of a headless isoform and dynamicsin neurons. J. Cell Sci. 119, 184–194 (2006).
28. Bohil, A. B., Robertson, B. W. & Cheney, R. E. Myosin-X is a molecularmotor that functions in filopodia formation. Proc. Natl Acad. Sci. USA 103,12411–12416 (2006).
29. Ducibella, T., Ukena, T., Karnovsky, M. & Anderson, E. Changes in cell surface andcortical cytoplasmic organization during early embryogenesis in the preimplantationmouse embryo. J. Cell Biol. 74, 153–167 (1977).
30. Calarco, P. G. & Epstein, C. J. Cell surface changes during preimplantationdevelopment in the mouse. Dev. Biol. 32, 208–213 (1973).
31. Roy, S., Hsiung, F. & Kornberg, T. B. Specificity of Drosophila cytonemes for distinctsignaling pathways. Science 332, 354–358 (2011).
32. Wennekamp, S., Mesecke, S., Nedelec, F. & Hiiragi, T. A self-organization frameworkfor symmetry breaking in the mammalian embryo. Nat. Rev. Mol. Cell Biol. 14,454–461 (2013).
33. Sanders, T. A., Llagostera, E. & Barna, M. Specialized filopodia direct long-rangetransport of SHH during vertebrate tissue patterning. Nature 497, 628–632 (2013).
10 NATURE CELL BIOLOGY ADVANCE ONLINE PUBLICATION
© 2013 Macmillan Publishers Limited. All rights reserved.

DOI: 10.1038/ncb2875 METHODS
METHODSDNA and RNAwork. The original sequence for mouse E-cad–GFP was- providedby A. Yap, University of Queensland, mouse β-catenin by B. Henderson, Universityof Sydney, Lifeact–GFP by T. Hall, University of Queensland and bovine myosin-Xby R. Cheney, UNC at Chapel Hill. Mouse α-catenin was obtained from Addgene(20139). All complementary DNA sequences were cloned into a pCS2-based vectorand tagged constructs were generated by inserting full-length or deleted forms ofthe respective gene upstream or downstream of EGFP or mRFP. The truncatedmutant E-cad1ECD–RFP contains a deletion of amino acids 107–625 of E-Cad(AAH98501) and Headless Myosin-X contains amino acids 641–2,062 of Myo10(NP_062345). pCS2-membrane-mPlum was made by substituting mPlum formCherry in pCS2-membrane-mCherry. RNA transcription and purification wasperformed using DNA constructs linearized with appropriate restriction enzymesand the mMESSAGE mMACHINE SP6 kit (Ambion) and RNAeasy kit (Qiagen)following the manufacturer’s instructions. RNA transcripts derived from each ofthe constructs described above were microinjected at the following concentrations:H2B–Cerulean at 15 ng µl−1; Lifeact–GFP (ref. 15) at 20 ng µl−1; memb-mCherry ormemb-mPlum at 40 ng µl−1; GFP–α-tubulin, GFP–α-cat, β-cat–GFP, E-cad–GFP,E-cad–RFP or E-cad1ECD–RFP at 50 ng µl−1; GFP–Myo10 or GFP–Headless at100 ng µl−1. For filopodia induction experiments, GFP–Myo10 or GFP–Headlessoverexpression was performed at 200 ng µl−1, and GFP–Myo10 control was injectedat 100 ng µl−1. siRNA molecules (QIAGEN) for Scrambled (Ctrl_Allstars_1), E-cad(Mm_Cdh1_1 andMm_Cdh1_6),α-cat (Mm_Catna1_1 andMm_Catna1_6), β-cat(Mm_Catnb_2 andMm_Catnb_3) andMyo10 (Mm_Myo10_1 andMm_Myo10_4)were microinjected at a final concentration of 200 nM. For the rescue experiments,E-cad–GFP or GFP–Myo10 was microinjected at 100 ng µl−1, together with theircorresponding siRNAs.
The siRNA sequences used were as follows: Ctrl_Allstars_1 (undis-closed by QIAGEN), Mm_Cdh1_1 (5′-ACGGAGGAGAACGGTGGTCAA-3′),Mm_Cdh1_6 (5′-CCGGGACAATGTGTATTACTA-3′), Mm_Catna1_1 (5′-CAGA-TGGAATTAAATGACCAA-3′), Mm_Catna1_6 (5′-CTGGTAAACACCAATAGT-AAA-3′), Mm_Catnb_2 (5′-CAGATAGAAATGGTCCGATTA-3′), Mm_Catnb_3(5′-CTCACTTGCAATAATTACAAA-3′),Mm_Myo10_1 (5′-CAGGACGAAGCCA-TCAAGATA-3′), Mm_Myo10_4 (5′-AAGCACCAAGCTGATCCTCAA-3′).
Mouse embryo work. C57BL/6 wild-type females at 28–32 days of age weresuperovulated, mated and euthanized by cervical dislocation. Embryos were flushedfrom oviducts with M2 medium (Merck) and cultured in KSOM+AA (Merck) at37 ◦C and 5% CO2 covered by mineral oil (Sigma). All experiments were performedwith preimplantation mouse embryos following Monash University Animal Ethicsguidelines. Embryos showing clear signs of abnormal or arrested development wereexcluded from our experiments following previous criteria1,2,16–18. Purified RNAwas diluted in injection buffer (5mM Tris, 5mM NaCl and 0.1mM EDTA) and0.1–0.3 pl was microinjected using a FemtoJet (Eppendorf). Embryos were culturedin LabTek chambers (Nunc) at 37 ◦C and 5% CO2 in an incubator adapted for themicroscope system (Zeiss). To produce mosaic embryos comprising cells expressingtwo different fluorescent proteins that label filopodia, one cell of a 2-cell-stageembryo was microinjected with memb-mCherry together with Patent Blue V(0.4%, Sigma, 21605) and then the other cell with E-cad–GFP (SupplementaryFig. 2). Patent Blue V allowed visualization of the initially microinjected cell. Forimmunolabelling, embryos were fixed in 4% paraformaldehyde in DPBS for 30min,washed in DPBS containing 0.1% Triton X-100, permeabilized for 30min in DPBScontaining 0.25% Triton X-100, incubated in blocking solution (10% fetal bovineserum in DPBS) for 2 h, incubated with primary antibodies in blocking solutionovernight at 4 ◦C, rinsed in DPBS, incubated with Alexa-conjugated species-specificsecondary antibodies (Invitrogen) in blocking solution (1:500) for 2 h and rinsedin DPBS. Antibodies used include rat anti-E-cad DECMA-1 (1:100, Sigma, U3254),rabbit anti-α-cat (1:2,000; SigmaC2081),mouse anti-β-cat (1:100, BDTransductionLabs 610154), rabbit anti-Myo10 (1:500, Novus Biologicals, 22430002) and mouseanti-α-tubulin DM1a (1:200, Abcam ab7291). To label F-actin, fixed embryoswere incubated with rhodamine–phalloidin (1:500, Molecular Probes, R415) withsecondary antibodies in blocking solution, as specified above. For function blocking,we treated non-compacted 8-cell-stage embryos with the DECMA-1 antibody(1:1,500) or control IgG antibody at the same concentration in KSOM + AA.Cytochalasin D (Sigma, C8273) was used at 3 µgml−1 or 0.5 µgml−1 and nocodazole(Sigma, M1404) at 3 µgml−1 in KSOM+AA; control embryos were treated withdimethylsulphoxide in KSOM+AA at 1:1,300 for cytochalasin D and 1:8,000 fornocodazole experiments. No differences in filopodia formation and compactionphenotypes were found between embryos treated with dimethylsulphoxide inKSOM+AA at the specified concentrations and those cultured in KSOM+AA alone.
Cell shape and compaction analysis. To quantify the number of cells per embryothat extend filopodia throughout compaction, and the number of neighbouring cellstargeted with each filopodia set, we analysed embryos that had been microinjected
with E-cad–GFP and memb-mCherry at the 1-cell stage. To quantify filopodia-related changes in whole cell shape, we first selected time series in which theentire apical surface of a membrane-labelled cell of interest could be visualizedthroughout. As the embryos spin inside the zona pellucida, it was not possible tofollow a single cell long enough tomeasure aspect ratio changes throughout an entirecycle of filopodia extension and retraction. Therefore, a 3D reconstruction of theembryo was created using Zen software (Zeiss) and individual frames were selectedimmediately before and after filopodia extension or retraction. The circumferenceof the filopodia-forming cell was traced at each time point using ImageJ softwareand the aspect ratio was calculated by dividing the maximum diameter of the cellby the minimum diameter of the cell (dmax/dmin). We determined the ability of acell to integrate into the compacting embryo by analysing differential interferencecontrast (DIC) images following previous criteria16,18. Under normal conditions,cells in compacting embryos appear flattened with partially obscured cell outlinesthat become fully obscured as compaction completes. Simultaneously, the aspectratio of a compacting cell increases as it elongates its apical membrane and integratesinto the compacted mass. We measured the aspect ratio of membrane-labelled cellsin treated and control embryos at the 12- to 16-cell stage, when normal embryosbecome fully compacted.
Confocal and two-photon excitation imaging of filopodia in live embryos.We imaged live embryos using a Zeiss LSM 780 laser scanning confocal microscopeand avalanche photodiodes of the Confocor 3 module (Zeiss) to avoid unwantedphototoxicity and photobleaching. A water-immersion C-Apochromat×40/1.2NAobjective was used for all experiments except for laser ablations, where a×63/1.4NAobjective was used. Fusion proteins containing Cerulean were imaged with 458 nmlight; GFP with 488 nm light; and RFP, mCherry and mPlum with 561 nmand appropriate filter combinations. DIC was performed using the appropriateslider/prism. Pinhole sizes were adjusted to obtain 2 µm confocal Z planes. 3D viewsof the embryos were obtained using Zen (Zeiss) and Imaris (Bitplane) software.We determined whether cells divided symmetrically, allocating daughter cells to theouter and inner positions of the embryo, or asymmetrically, contributing daughtercells only to outer positions, using previously established criteria16–18. Briefly, outercells have larger membrane regions exposed to the zona pellucida surrounding theembryo, whereas inner cells are internalized within the embryo and are not exposedto the zona pellucida. To visualize all cells of the same live embryo, we used a ZeissLSM 780 laser scanning microscope with a reflected light BiG GaAsP NDD module(Zeiss) and a water-immersion C-Apochromat ×40/1.2 NA objective. We excitedthe E-cad–GFP fusion protein expressed by all cells using a multiphoton Ti:sapphirelaser (Chameleon, Coherent) tuned to 920 nm and set to ∼3% transmission, andcollected emitted light with a 500–550 nm filter, with 1 µm intervals along the zaxis. We analysed the distribution of filopodia extended by individual cells of theembryos using 3D views of the confocal and two-photon excitation (2PE) data. Tovisualize all filopodia in the same embryo we generated several cropped versionsof the 3D 2PE data, which allowed us to rotate and determine the presence anddistribution pattern of all filopodia in each cropped data set. For the experimentsin Fig. 5a, we excluded from the analysis cells showing no filopodia because wecannot distinguish whether these cells lack filopodia as a result of the effect of amolecular manipulation, or because of the natural lack of filopodia by 39–44% ofcells in the embryo. For the experiments in Fig. 5i and Supplementary Figs 5 and 6,detached filopodia were scored by comparative analysis of 3D reconstructions forboth DIC and fluorescence channels, with their matching single plane series alongthe Z stack. Detached filopodia were readily distinguishable when rotating the 3Dviews because under normal conditions filopodia are completely attached to theneighbouring cell membrane throughout their entire length. For the experimentsin Fig. 7, we determined whether cells extending filopodia belonged to a second-or third-cleavage blastomere type by performing confocal time-lapse imaging witha 30min interval from the 4- to the 8- cell stage. Second- and third-cleavagecells were readily distinguished by tracking all cells throughout divisions and alsoby size differences, as second-cleavage cells are approximately twice larger thanthird-cleavage cells and this difference can be readily observed in 3D views of theembryos. For the rescue experiments in Supplementary Fig. 5, the fluorescenceintensity of E-cad–GFP and GFP–Myo10 were detectable in the injected cells, but atreduced levels compared with untreated embryos expressing equal concentrations.This suggests that despite the fact that the siRNAs target some of the E-cad–GFP andGFP–Myo10 used to rescue the compaction phenotype, there remains some proteinto obtain a rescue effect.
Laser ablations. Laser ablations were performed using a Zeiss oil-immersionultraviolet–visible–infrared Plan-Apochromat ×63/1.4 NA objective at 2× digitalmagnification on embryos expressing memb-mCherry to visualize the cellmembrane and filopodia. Fluorescence and transmitted light images were acquiredusing one-photon excitation (561 nm light) before and after ablation with aninterval of <30 s. A multiphoton Ti:sapphire laser (Chameleon, Coherent) tuned
NATURE CELL BIOLOGY
© 2013 Macmillan Publishers Limited. All rights reserved.

METHODS DOI: 10.1038/ncb2875
to 790 nm was used to perform ablations. For technical reasons we were unableto ablate all of the filopodia extended by a cell. Thus, we selected single filopodiaextending orthogonal to the plane of imaging. For filopodia ablation, a rectangularregion of interest (ROI) of 3 × 1 µm lateral dimensions was targeted to thefilopodium and scanned twice with the multiphoton laser set at 20% transmission(76mW as measured at the back end of the objective) with a pixel dwell timeof 12.6 µs. In some cases, embryo movement caused mistargeting of the ablationand/or damage to the neighbouring cell and these experiments were excludedfrom analysis. For adherens junction ablations, a ROI of similar dimensions waspositioned along the adherens junction. We confirmed that the use of 20% lasertransmission was sufficient to produce an ablation by the lack of fluorescencerecovery within the ROI (Supplementary Fig. 4). Using 5% laser transmission didnot cause an ablation, just photobleaching, and accordingly mCherry fluorescencerecovered over time within the ROI. The normalized fluorescence recovery graphwas generated using ImageJ and GraphPad Prism 5 software. For the analysis, rawdata were first adjusted by background subtraction at each time point, correctedto a time-matched ROI in the same embryo that had not been ablated and thennormalized to the background-subtracted pre-ablation values. To determine localchanges in cell shape we used single confocal planes of memb-mCherry-labelledcells extending filopodia. Images were taken immediately before and within 30 sfollowing ablation. The membrane region adjacent to the filopodia base was tracedusing two straight lines and the angle between these lines was calculated using ImageJsoftware.
Statistical analyses. All statistical analyses were performed with GraphPad Prism5 software. A paired or unpaired, two-tailed Student’s t -test was used as appropriate,with data presented as mean± standard error of the mean (s.e.m.); for the strengthof the P value estimates, we always assumed unequal variances. For analysis ofdefects in compaction phenotypes (Supplementary Fig. 5), all embryos derived fromat least 3 experimental replicates were combined and divided into two phenotypicgroups for each treatment, as either undergoing normal or abnormal compaction.
We compared a specific treatment with its corresponding control by creating a2× 2 contingency table, consisting of the two phenotypic groups and the twotreatments, to be able to calculate the corresponding P value by Fisher’s exacttest. The investigators were blinded to the group allocation (that is, test versuscontrol) during all experiments, and also for all outcome assessments during thedata analysis process. In brief, different treatments or conditions were marked withneutral labels, which were not known to the investigator at the time of performingthe experiments or the analysis. The exception was for the data shown in Fig. 4,because for this experiment we knew a priori through observation whether wewere analysing changes in membrane angles resulting from laser ablation of eitherthe filopodium or the adherens junction. For Fig. 2f, the number of filopodia (n)used per condition was: 21 for 1PE, and 17 for 2PE. For Fig. 2g, the number ofembryos (n) used per condition was: 10 for 1PE, and 12 for 2PE. For Fig. 2h,the number of cells (n) used per condition was: 18 for 1PE, and 15 for 2PE. ForFig. 2i, the number of cells (n) used per condition was: 23 for 1PE, and 24 for2PE. For Fig. 5a, the number of cells (n) used per treatment was: 61 for controlsiRNA, 18 for E-cad siRNA, 20 for α-cat siRNA, 29 for β-cat siRNA, 18 for Myo10siRNA, 11 for E-cad–RFP, 16 for E-cad1ECD–RFP, 15 for GFP–Myo10, and 24 forGFP–Headless. For Fig. 5b, the number of cells (n) used per treatment was: 17 forcontrol siRNA, 18 for E-cad siRNA, 19 for α-cat siRNA, 14 for β-cat siRNA, 21 forMyo10 siRNA, 7 for E-cad–RFP, 20 for E-cad1ECD–RFP, 9 for control antibody,17 for E-cad antibody, 13 for 4 h cytochalasin D (0.5 µgml−1), 12 for 4 h wash, 16for GFP–Myo10, and 23 for GFP-Headless. For Fig. 5h, the number of filopodia(n) used per treatment was: 14 for control antibody, 21 for E-cad antibody, 23 for4 h cytochalasin D (0.5 µgml−1), and 22 for 4 h wash. For Fig. 5i, the number offilopodia (n) used per treatment was: 24 for control antibody, 46 for E-cad antibody,111 for 4 h cytochalasin D (0.5 µgml−1), and 36 for 4 h wash. The experimentswere not randomized, and no statistical method was used to predetermine samplesize. Reproducibility of all results was confirmed by independent experiments. Allexperiments shown in all figures were repeated at least 3 times (there were nolimitations in repeatability).
NATURE CELL BIOLOGY
© 2013 Macmillan Publishers Limited. All rights reserved.

S U P P L E M E N TA RY I N F O R M AT I O N
WWW.NATURE.COM/NATURECELLBIOLOGY 1
DOI: 10.1038/ncb2875
e 3D external view
mem
b-m
Che
rryE-
cad-
GFP
memb-mCherry + DICDIC3D internal view
c
f
a
2
4
6
Num
ber o
f filo
podi
ape
r nei
ghbo
ring
cell
0
E-cad-GFP
memb-mCherry
n.s.
0
4
12
Filo
podi
a le
ngth
(μm
)
E-cad-GFP
memb-mCherry
8
n.s.b d 2–7 cell 8–16 cell 17–32 cell
mem
b-m
Che
rryD
ICm
emb-
mC
herry
E-cad-RFP GFP-α-tubulinE-cad-RFP
GFP-α-tubulin
g
j E-cad-RFPβ-cat-GFP
E-cad-RFPGFP-α-catE-cad-RFP GFP-α-cat E-cad-RFP β-cat-GFP
h
i
E-cad IFE-cad IF
PhalloidinPhalloidin
E-cad IFE-cad IF
α-tubulin IFα-tubulin IF
Lifeact-GFPE-cad-RFPLifeact-GFP
(lower-magnification 3D)
lk
E-cad-RFPLifeact-GFP
Supplementary Figure 1 Characterization of filopodia with membrane-targeted mCherry, DIC, F-actin, α-cat and β-cat. a, b, Filopodia length and number in embryos microinjected with E-cad-GFP or memb-mCherry RNA. In a, n = 21 filopodia for E-cad-GFP; 23 for memb-mCherry. In b, n = 18 cells for E-cad-GFP; 12 for memb-mCherry. c, E-cad-GFP colocalizes with memb-mCherry in filopodia. d, Representative example of live embryos labelled with memb-mCherry in half of the cells at different developmental stages. Filopodia (arrowheads) are only detectable during compaction (8- to 16-cell stage). n = 20 embryos. e, Three-dimensional surface renders of embryo from Fig. 1e. Filopodia extend from the border membrane region between the AJ and apical domain of the filopodia-forming cells on top of the neighbouring cell apical membrane (not labelled in this example). f, Visualization of filopodia (arrowheads) by DIC. Images in g, i, j and k are from live 8-cell stage embryos microinjected into one cell at the 2-cell stage with RNAs to express
E-cad-RFP and Lifeact-GFP (g), GFP-α-cat (i), β-cat-GFP (j) and GFP-α-tubulin (k). Images in h, l are from non-injected, fixed 8-cell stage embryos, double-stained with E-cad antibodies (E-cad IF) and rhodamine-phalloidin (h) or α-tubulin antibodies (l). g, E-cad-RFP-labelled filopodia are enriched in F-actin revealed by Lifeact-GFP fluorescence in a live embryo. Arrow shows detection of filopodia in a low-magnification 3-dimensional view of the embryo. Yellow-boxed image shows higher-magnification view of the filopodia. h, Co-localization of E-cad and rhodamine-phalloidin. i–k E-cad-RFP also co-localizes with α- and β-cat fused to GFP (i, j), but not with GFP-α-tubulin (k) in filopodia. l, E-cad does not co-localize with α-tubulin in filopodia. Yellow-boxed images in g, h and l show higher-magnification views to better visualize some of the filopodia. n.s., not significant by t test. Error bars represent s.e.m. Statistics source data for a and b can be found in Supplementary Table S1. Horizontal and orthogonal scale bars, 5 μm.
© 2013 Macmillan Publishers Limited. All rights reserved.
S U P P L E M E N TA RY I N F O R M AT I O N
2 WWW.NATURE.COM/NATURECELLBIOLOGY
b E-cad-GFP memb-mCherry
E-cad-GFPmemb-mCherry E-cad-GFP memb-mCherry
2-cell stage double cell injection
E-cad-GFPRNA
a
memb-mCherryRNA
c d E-cad-GFPmemb-mCherry E-cad-GFP memb-mCherry
0 min 45 min 90 min
E-ca
d-G
FP H
2B-R
FP
e
f 0 min 240 min 320 min210 min 300 min
E-ca
d-G
FPm
emb-
mC
herry
mem
b-m
Che
rryE-
cad-
GFP
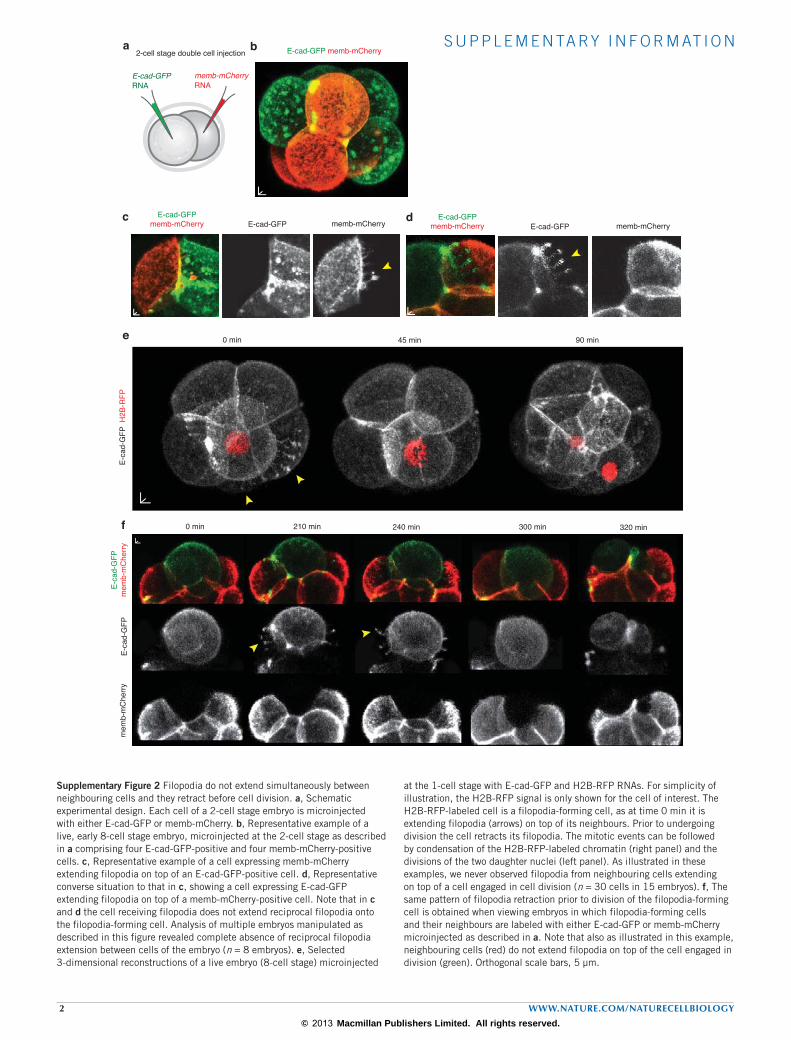
Supplementary Figure 2 Filopodia do not extend simultaneously between neighbouring cells and they retract before cell division. a, Schematic experimental design. Each cell of a 2-cell stage embryo is microinjected with either E-cad-GFP or memb-mCherry. b, Representative example of a live, early 8-cell stage embryo, microinjected at the 2-cell stage as described in a comprising four E-cad-GFP-positive and four memb-mCherry-positive cells. c, Representative example of a cell expressing memb-mCherry extending filopodia on top of an E-cad-GFP-positive cell. d, Representative converse situation to that in c, showing a cell expressing E-cad-GFP extending filopodia on top of a memb-mCherry-positive cell. Note that in c and d the cell receiving filopodia does not extend reciprocal filopodia onto the filopodia-forming cell. Analysis of multiple embryos manipulated as described in this figure revealed complete absence of reciprocal filopodia extension between cells of the embryo (n = 8 embryos). e, Selected 3-dimensional reconstructions of a live embryo (8-cell stage) microinjected
at the 1-cell stage with E-cad-GFP and H2B-RFP RNAs. For simplicity of illustration, the H2B-RFP signal is only shown for the cell of interest. The H2B-RFP-labeled cell is a filopodia-forming cell, as at time 0 min it is extending filopodia (arrows) on top of its neighbours. Prior to undergoing division the cell retracts its filopodia. The mitotic events can be followed by condensation of the H2B-RFP-labeled chromatin (right panel) and the divisions of the two daughter nuclei (left panel). As illustrated in these examples, we never observed filopodia from neighbouring cells extending on top of a cell engaged in cell division (n = 30 cells in 15 embryos). f, The same pattern of filopodia retraction prior to division of the filopodia-forming cell is obtained when viewing embryos in which filopodia-forming cells and their neighbours are labeled with either E-cad-GFP or memb-mCherry microinjected as described in a. Note that also as illustrated in this example, neighbouring cells (red) do not extend filopodia on top of the cell engaged in division (green). Orthogonal scale bars, 5 µm.
© 2013 Macmillan Publishers Limited. All rights reserved.

S U P P L E M E N TA RY I N F O R M AT I O N
WWW.NATURE.COM/NATURECELLBIOLOGY 3
inside
d
b
outside
outside
Filopodia extended Filopodia retracted Asymmetric division
Filopodia extended Filopodia retracted Symmetric division
0 min 250 min 450 min 500 min
0 min 200 min 300 min 400 min
mem
b-m
Che
rrym
emb-
mC
herry
inside
outside
outsideoutside
mem
b-m
Che
rry +
DIC
mem
b-m
Che
rry +
DIC
500 min
400 min
e
cFil.
Fil.
100
Perc
ent c
ells
with
filo
podi
a
80
60
40
20
0
Single cell injected at 2-cell stagea
memb-mCherryRNA
Supplementary Figure 3 Two-cell stage blastomeres contribute filopodia-forming cells to variable extents. a, Schematic representation of the experimental approach (left panel). Only one cell was microinjected at the 2-cell stage with memb-mCherry and the contribution of filopodia-forming cells by that single cell was then assessed during compaction. Each data point in the graph represents a single embryo. The scattered distribution pattern of the data suggests no obvious systematic contribution of filopodia-forming cells by the original 2-cell stage blastomeres. Individual 2-cell
stage blastomeres can contribute filopodia-forming cells to variable extents (n = 24 embryos). b–e, Selected frames over time show a filopodia-forming cell (in white) undergoing symmetric (b) or asymmetric (d) division (n = 13 cells in 11 embryos). During symmetric division the two daughter cells are allocated to the outer, extraembryonic regions (c), while in asymmetric division, one of the daughter cells becomes internalized to the pluripotent region (e). Embryos were microinjected with memb-mCherry as described in a. Arrowheads depict filopodia. Horizontal and orthogonal scale bars, 5 μm.
© 2013 Macmillan Publishers Limited. All rights reserved.

S U P P L E M E N TA RY I N F O R M AT I O N
4 WWW.NATURE.COM/NATURECELLBIOLOGY
Pre AJ ablation Post AJ ablation
mem
b-m
Che
rry +
TL
mem
b-m
Che
rry
b
mem
b-m
Che
rry
a
Angle
Fil.
Abl.
Fusion
c
20% laser
5% laser
Nor
mal
ized
fluo
resc
ence
d
Supplementary Figure 4 Extensive AJ ablations do not alter the shape of the apical border adjacent to filopodia. a, Immediately following AJ laser ablation (yellow brackets in b), the angle of the cell membrane (blue angle) in the apical border region where filopodia extended (yellow arrowheads) remains unchanged. b, A different focal plane of the same cell shown in a depicts the AJ region where laser ablation was performed (yellow brackets). c, Transmitted light imaging at the same focal plane as b shows that the two adjacent cells
fused (white arrow) following ablation. Embryos were microinjected with memb-mCherry into one cell at the 2-cell stage. d, Lack of fluorescence recovery following laser ablation. Cells expressing memb-mCherry were ablated at the AJ with 20% laser intensity transmission. Fluorescence recovery in the irradiated region is observed with 5%, but not 20% transmission indicating complete ablation is achieved with 20%. Vertical lines represent mean ± s.e.m (n = 3 cells from 3 different embryos per treatment). Scale bars, 5 μm.
© 2013 Macmillan Publishers Limited. All rights reserved.
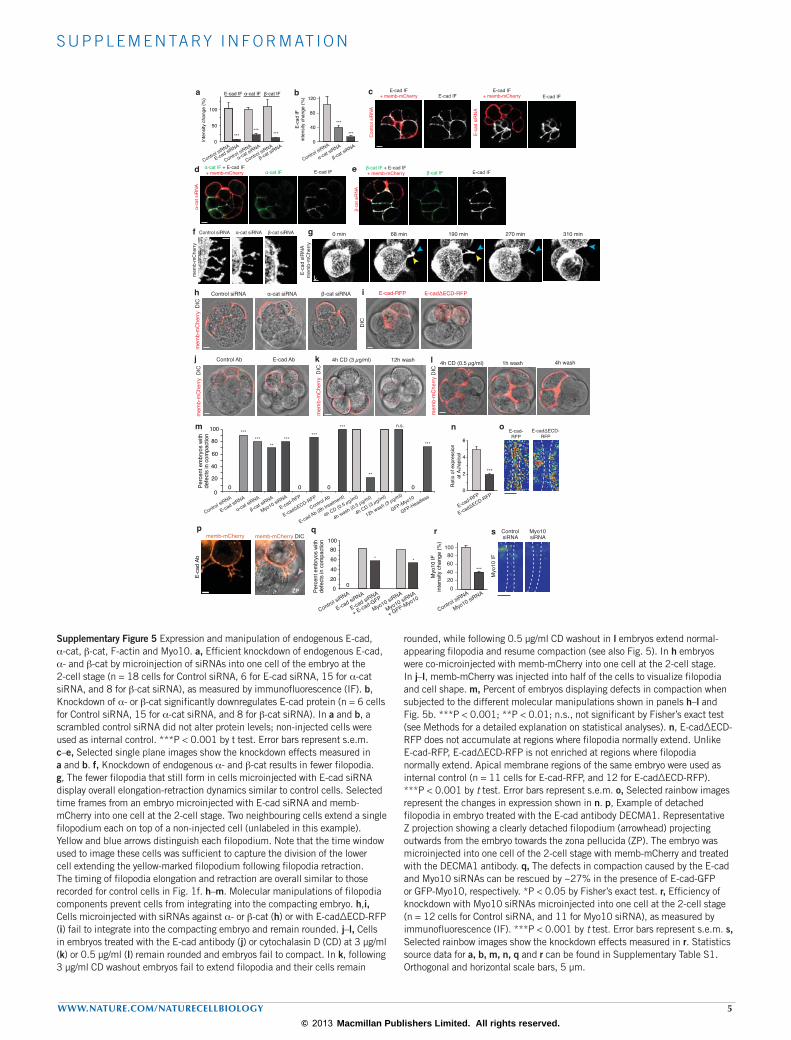
S U P P L E M E N TA RY I N F O R M AT I O N
WWW.NATURE.COM/NATURECELLBIOLOGY 5
0
50
100
E-cad IF
0
40
80
120
α-cat siRNAControl siRNA β-cat siRNA
α-ca
t siR
NA
α-cat IF + E-cad IF+ memb-mCherry α-cat IF
β-cat IF + E-cad IF+ memb-mCherry β-cat IF
β-ca
t siR
NA
E-ca
d si
RN
A
E-cad IF+ memb-mCherry E-cad IF
Con
trol s
iRN
A
E-cad IFE-cad IF
+ memb-mCherry
E-cad IF E-cad IF
mem
b-m
Che
rry
***
Inte
nsity
cha
nge
(%)
α-cat IF
******
β-cat IF
Control siRNA
E-cad siRNA
α-cat siRNA
β-cat siRNA
***
Control siRNA
α-cat siRNA
β-cat siRNA
E-ca
d IF
inte
nsity
cha
nge
(%)
***
c
f
ba
Control siRNA
Control siRNA
mem
b-m
Che
rry
0 min 68 min 190 min 310 min270 min
E-cad-RFP E-cadΔECD-RFP
DIC
i
Control Ab E-cad Ab
mem
b-m
Che
rry D
IC
j
α-cat siRNAControl siRNA β-cat siRNA
mem
b-m
Che
rry D
IC
mem
b-m
Che
rry D
IC
4h CD (0.5 μg/ml) 1h wash 4h wash
h
k
mem
b-m
Che
rry D
IC
4h CD (3 μg/ml) 12h wash l
0
2
4
6
***
E-cad-RFP
E-cadΔECD-RFP
Rat
io o
f exp
ress
ion
at A
J/ap
ical
E-cad-RFP
E-cadΔECD-RFP
on
memb-mCherry DIC
ZP
memb-mCherry
0
20
40
60
80
100
Perc
ent e
mbr
yos
with
defe
cts
in c
ompa
ctio
n ***
Control siRNA
E-cad siRNA
E-cad-RFP
E-cadΔECD-RFP
Control Ab
E-cad Ab (8h treatment)
α-cat siRNA
β-cat siRNA
4h CD (0.5 μg/ml)
4h wash (0.5 μg/ml)
Myo10 siRNA
GFP-Myo10
GFP-Headless
4h CD (3 μg/ml)
12h wash (3 μg/ml)
*****
******
**
*** n.s.
***
m
0 0 0 0
p
g
d e
Perc
ent e
mbr
yos
with
defe
cts
in c
ompa
ctio
n
02040
6080
100
0
Control siRNA
E-cad siRNA
E-cad siRNA
+ E-cad-GFP
Myo10 siRNA
Myo10 siRNA
+ GFP-Myo10
q
* *
ControlsiRNA
Myo
10 IF
Myo10siRNA
r s
10080604020
0
***
Control siRNA
Myo10 siRNA
Myo
10 IF
inte
nsity
cha
nge
(%)
E-ca
d si
RN
A
E-ca
d Ab
Supplementary Figure 5 Expression and manipulation of endogenous E-cad, α-cat, β-cat, F-actin and Myo10. a, Efficient knockdown of endogenous E-cad, α- and β-cat by microinjection of siRNAs into one cell of the embryo at the 2-cell stage (n = 18 cells for Control siRNA, 6 for E-cad siRNA, 15 for α-cat siRNA, and 8 for β-cat siRNA), as measured by immunofluorescence (IF). b, Knockdown of α- or β-cat significantly downregulates E-cad protein (n = 6 cells for Control siRNA, 15 for α-cat siRNA, and 8 for β-cat siRNA). In a and b, a scrambled control siRNA did not alter protein levels; non-injected cells were used as internal control. ***P < 0.001 by t test. Error bars represent s.e.m. c–e, Selected single plane images show the knockdown effects measured in a and b. f, Knockdown of endogenous α- and β-cat results in fewer filopodia. g, The fewer filopodia that still form in cells microinjected with E-cad siRNA display overall elongation-retraction dynamics similar to control cells. Selected time frames from an embryo microinjected with E-cad siRNA and memb-mCherry into one cell at the 2-cell stage. Two neighbouring cells extend a single filopodium each on top of a non-injected cell (unlabeled in this example). Yellow and blue arrows distinguish each filopodium. Note that the time window used to image these cells was sufficient to capture the division of the lower cell extending the yellow-marked filopodium following filopodia retraction. The timing of filopodia elongation and retraction are overall similar to those recorded for control cells in Fig. 1f. h–m. Molecular manipulations of filopodia components prevent cells from integrating into the compacting embryo. h,i, Cells microinjected with siRNAs against α- or β-cat (h) or with E-cadΔECD-RFP (i) fail to integrate into the compacting embryo and remain rounded. j–l, Cells in embryos treated with the E-cad antibody (j) or cytochalasin D (CD) at 3 µg/ml (k) or 0.5 µg/ml (l) remain rounded and embryos fail to compact. In k, following 3 µg/ml CD washout embryos fail to extend filopodia and their cells remain
rounded, while following 0.5 µg/ml CD washout in l embryos extend normal-appearing filopodia and resume compaction (see also Fig. 5). In h embryos were co-microinjected with memb-mCherry into one cell at the 2-cell stage. In j–l, memb-mCherry was injected into half of the cells to visualize filopodia and cell shape. m, Percent of embryos displaying defects in compaction when subjected to the different molecular manipulations shown in panels h–l and Fig. 5b. ***P < 0.001; **P < 0.01; n.s., not significant by Fisher’s exact test (see Methods for a detailed explanation on statistical analyses). n, E-cadΔECD-RFP does not accumulate at regions where filopodia normally extend. Unlike E-cad-RFP, E-cadΔECD-RFP is not enriched at regions where filopodia normally extend. Apical membrane regions of the same embryo were used as internal control (n = 11 cells for E-cad-RFP, and 12 for E-cadΔECD-RFP). ***P < 0.001 by t test. Error bars represent s.e.m. o, Selected rainbow images represent the changes in expression shown in n. p, Example of detached filopodia in embryo treated with the E-cad antibody DECMA1. Representative Z projection showing a clearly detached filopodium (arrowhead) projecting outwards from the embryo towards the zona pellucida (ZP). The embryo was microinjected into one cell of the 2-cell stage with memb-mCherry and treated with the DECMA1 antibody. q, The defects in compaction caused by the E-cad and Myo10 siRNAs can be rescued by ~27% in the presence of E-cad-GFP or GFP-Myo10, respectively. *P < 0.05 by Fisher’s exact test. r, Efficiency of knockdown with Myo10 siRNAs microinjected into one cell at the 2-cell stage (n = 12 cells for Control siRNA, and 11 for Myo10 siRNA), as measured by immunofluorescence (IF). ***P < 0.001 by t test. Error bars represent s.e.m. s, Selected rainbow images show the knockdown effects measured in r. Statistics source data for a, b, m, n, q and r can be found in Supplementary Table S1. Orthogonal and horizontal scale bars, 5 μm.
© 2013 Macmillan Publishers Limited. All rights reserved.

S U P P L E M E N TA RY I N F O R M AT I O N
6 WWW.NATURE.COM/NATURECELLBIOLOGY
a
Life
act-G
FP
4h wash0.5 μg/ml CD3 μg/ml CD
Lifeact-GFPLifeact-GFP memb-mCherry
4h w
ash
0.5 μg
/ml C
D
e
f E-cad-GFPE-cad-GFP memb-mCherry
4h w
ash
0.5 μg
/ml C
D
ZP
ZP
cb ***
4h wash
0.5 μg/ml CD3 μg/ml CD
020406080
100
**
0
2
4
6
8
4h wash
Num
ber o
f filo
podi
ape
r nei
ghbo
ring
cell
n.s.d
mem
b-m
Che
rry D
IC
Single plane
3D view
4h CD(0.5 μg/ml)
Lifeact-GFP
E-cad-GFP E-cad-GFP
Lifeact-GFP
E-cad-GFP E-cad-GFP
GFP-α-tubulin GFP-α-tubulinmemb-mCherry memb-mCherry memb-mCherry DICmemb-mCherry DIC
Con
trol
noco
dazo
le
g
Life
act-G
FPin
tens
ity c
hang
e (%
)
0.5 μg
/ml C
D
Supplementary Figure 6 Effects of cytochalasin D and nocodazole treatments. a, Representative images of Lifeact-GFP fluorescence following treatment with Cytochalasin D (CD). CD at 3 µg/ml largely depletes Lifeact-GFP fluorescence. CD at 0.5 µg/ml reduces, but does not completely deplete Lifeact-GFP fluorescence. A 4-hour incubation in KSOM+AA (4h wash) restores Lifeact-GFP expression only in embryos treated with 0.5 µg/ml CD. b, Quantification of Lifeact-GFP fluorescence along the cell membrane. In b, n = 22 cells for 3 µg/ml CD; 15 for 0.5 µg/ml CD; 19 for 4h wash. ***P < 0.001; **P < 0.01 by t test. Error bars represent s.e.m. c, Filopodia number per neighbouring cell is not significantly higher in embryos treated with 0.5 µg/ml CD, when compared to that observed after 4h wash. (see Fig. 2 and Supplementary Fig. 1 for comparison with untreated embryos). In c, n = 17 cells for 4h CD (0.5 µg/ml); 7 cells for 4h wash. n.s., not significant by t test. d, Representative examples of detached filopodia in embryos treated with 0.5 µg/ml CD. Upper panel shows a single focal plane, lower panel shows 3-dimensional view. Detached filopodia (arrowheads) often extend away from the embryo and contact the zona pellucida (ZP). e, Representative examples of a cell in an embryo treated with 0.5 µg/ml CD
showing Lifeact-GFP in the abnormally long and detached filopodia (shown by arrow). Four hours following CD washout cells extend new filopodia showing normal Lifeact-GFP fluorescence. Insets show higher-magnification views of the filopodia indicated by arrows, which are comparable to the control situation in Supplementary Fig. 1g. f, Representative examples of E-cad-GFP distribution pattern following 0.5 µg/ml CD. E-cad-GFP displays a more punctated clustered pattern throughout the cell membrane and along filopodia. Four hours following CD washout cells extend new filopodia showing normal E-cad-GFP fluorescence distribution. Insets show higher-magnification views of the filopodia indicated by arrows. g, Embryos treated with 3 µg/ml nocodazole for 4 hours form normal filopodia and undergo compaction. Images show representative examples of embryos treated with nocodazole, which are indistinguishable from control embryos and undergo normal compaction (n = 12 embryos). Note the marked decrease in GFP-α-tubulin fluorescence in the nocodazole-treated embryos. Single focal planes are shown for DIC to appreciate compacted morphology. Statistics source data for b and c can be found in Supplementary Table S1. Horizontal and orthogonal scale bars, 5 μm.
© 2013 Macmillan Publishers Limited. All rights reserved.

S U P P L E M E N TA RY I N F O R M AT I O N
WWW.NATURE.COM/NATURECELLBIOLOGY 7
Supplementary Video Legends
Supplementary Video 1 Filopodia dynamics during mouse embryo compaction. Time-lapse imaging of a representative embryo during compaction shows two cells extending filopodia, which then fully retract before cell division. The embryo was microinjected with memb-mCherry into one cell at the 2-cell stage. Orthogonal scale bar, 5 μm.
Supplementary Video 2 E-cad-labelled filopodia retract to the filopodia-forming cell. Time-lapse imaging of a representative embryo during compaction shows a cell (left) with E-cad-GFP-expressing filopodia extended onto its E-cad-GFP-labelled neighbouring cell (right). The long finger-like processes clearly retract and return to the membrane apical border region where filopodia initially attached (left). Orthogonal scale bar, 5 µm.
Supplementary Video 3 Filopodia retraction occurs before cell division. Time-lapse imaging of a representative embryo during compaction shows two cells retracting their memb-mCherry-labelled filopodia just prior to division. H2B-Cerulean-labelled nuclei show chromatin condensation and chromosome separation at the time when filopodia start to retract. Orthogonal scale bar, 5 μm.
© 2013 Macmillan Publishers Limited. All rights reserved.