Gas Flow Behavior of Nanoscale Pores in Shale Gas Reservoirs
12
energies Article Gas Flow Behavior of Nanoscale Pores in Shale Gas Reservoirs Weijun Shen 1,2, *, Xizhe Li 3 , Yanmei Xu 3 , Yuping Sun 3 and Weigang Huang 3 1 Institute of Mechanics, Chinese Academy of Sciences, Beijing 100190, China 2 School of Engineering Science, University of Chinese Academy of Sciences, Beijing 100049, China 3 PetroChina Research Institute of Petroleum Exploration and Development, Beijing 100083, China; [email protected] (X.L.); [email protected] (Y.X.); [email protected] (Y.S.); [email protected] (W.H.) * Correspondence: [email protected]; Tel.: +86-10-8254-4017 Academic Editor: Moran Wang Received: 5 April 2017; Accepted: 22 May 2017; Published: 27 May 2017 Abstract: The gas transport in shale nanopores is always one of the major concerns in terms of the development of shale gas reservoirs. In this study, the gas flow regimes in shale nanopores were classified and analyzed according to Knudsen number. Then the gas flow model considering Darcy flow, slip flow, transition flow, molecular free flow and adsorption effect was proposed to evaluate the gas flow behavior in shale nanopores. The result shows that the contributions of Darcy flow, slip flow and transition flow in shale nanopores are reciprocal, and are mainly dominated by pore radius and pressure. The adsorption effect greatly influences the total mass flux. The total mass flux will increase as Langmuir pressure and temperature increase while it will decrease with reservoir pressure and the adsorption thickness. These results can provide insights for a better understanding of gas flow in the shale nanopores so as to optimize the production performance of shale gas reservoirs. Keywords: shale gas reservoirs; nanoscale pores; Knudsen number; mathematical model; flow behavior 1. Introduction In the last few years, shale gas is playing an important role among energy sources and has attracted wide attention [1,2]. According to a survey from U.S. Energy Information Administration, 34% of gas production in 2011 in the U.S.A is from shale and the proportion will reach 45% by 2035. Unlike conventional gas reservoirs, shale gas reservoirs are characterized by extremely low porosity, ultra-low permeability and high clay content [3,4]. Moreover, the pore structures in shale gas reservoirs are varied and heterogeneous, including organic matter, nonorganic matrix, natural fractures and pore space induced by hydraulic fractures [5–7]. The giant variation of pores scales makes gas flow in shale gas reservoirs very complex. Thus an understanding of gas flow and transport in shale pores is great significance for gas productivity and for optimizing the hydraulic-fracturing design in shale gas reservoirs. The gas in shale gas reservoirs includes gas adsorbed on organic matter and inorganic mineral surfaces and free gas in fractures and pores [8,9]. Using Scanning Electron Microscopy (SEM) methods Javadpour et al. [10], Locks et al. [11] found that the main pore size of shale matrix is in the range from 1 to 200 nm. Due to the existence of nanopores, the widely used Darcy’s law cannot accurately describe gas flow in shales. Based on the work from Beskok and Karniadakis [12], Swami et al. [13] divided gas flow in shales into four regimes, including viscous flow (K n ≤ 0.001), slip flow (0.001 ≤ K n ≤ 0.1), transition flow (0.1 ≤ K n ≤ 10) and Knudsen flow (K n ≥ 10). The gas transport in shale nanopores is a complex combination of all these flow mechanisms, which cannot be described by Darcy’s law [14]. Energies 2017, 10, 751; doi:10.3390/en10060751 www.mdpi.com/journal/energies
-
Upload
khangminh22 -
Category
Documents
-
view
0 -
download
0
Transcript of Gas Flow Behavior of Nanoscale Pores in Shale Gas Reservoirs

energies
Article
Gas Flow Behavior of Nanoscale Pores in ShaleGas Reservoirs
Weijun Shen 1,2,*, Xizhe Li 3, Yanmei Xu 3, Yuping Sun 3 and Weigang Huang 3
1 Institute of Mechanics, Chinese Academy of Sciences, Beijing 100190, China2 School of Engineering Science, University of Chinese Academy of Sciences, Beijing 100049, China3 PetroChina Research Institute of Petroleum Exploration and Development, Beijing 100083, China;
[email protected] (X.L.); [email protected] (Y.X.);[email protected] (Y.S.); [email protected] (W.H.)
* Correspondence: [email protected]; Tel.: +86-10-8254-4017
Academic Editor: Moran WangReceived: 5 April 2017; Accepted: 22 May 2017; Published: 27 May 2017
Abstract: The gas transport in shale nanopores is always one of the major concerns in terms of thedevelopment of shale gas reservoirs. In this study, the gas flow regimes in shale nanopores wereclassified and analyzed according to Knudsen number. Then the gas flow model considering Darcyflow, slip flow, transition flow, molecular free flow and adsorption effect was proposed to evaluate thegas flow behavior in shale nanopores. The result shows that the contributions of Darcy flow, slip flowand transition flow in shale nanopores are reciprocal, and are mainly dominated by pore radius andpressure. The adsorption effect greatly influences the total mass flux. The total mass flux will increaseas Langmuir pressure and temperature increase while it will decrease with reservoir pressure and theadsorption thickness. These results can provide insights for a better understanding of gas flow in theshale nanopores so as to optimize the production performance of shale gas reservoirs.
Keywords: shale gas reservoirs; nanoscale pores; Knudsen number; mathematical model;flow behavior
1. Introduction
In the last few years, shale gas is playing an important role among energy sources and hasattracted wide attention [1,2]. According to a survey from U.S. Energy Information Administration,34% of gas production in 2011 in the U.S.A is from shale and the proportion will reach 45% by 2035.Unlike conventional gas reservoirs, shale gas reservoirs are characterized by extremely low porosity,ultra-low permeability and high clay content [3,4]. Moreover, the pore structures in shale gas reservoirsare varied and heterogeneous, including organic matter, nonorganic matrix, natural fractures andpore space induced by hydraulic fractures [5–7]. The giant variation of pores scales makes gas flow inshale gas reservoirs very complex. Thus an understanding of gas flow and transport in shale poresis great significance for gas productivity and for optimizing the hydraulic-fracturing design in shalegas reservoirs.
The gas in shale gas reservoirs includes gas adsorbed on organic matter and inorganic mineralsurfaces and free gas in fractures and pores [8,9]. Using Scanning Electron Microscopy (SEM) methodsJavadpour et al. [10], Locks et al. [11] found that the main pore size of shale matrix is in the range from1 to 200 nm. Due to the existence of nanopores, the widely used Darcy’s law cannot accurately describegas flow in shales. Based on the work from Beskok and Karniadakis [12], Swami et al. [13] dividedgas flow in shales into four regimes, including viscous flow (Kn ≤ 0.001), slip flow (0.001 ≤ Kn ≤ 0.1),transition flow (0.1 ≤ Kn ≤ 10) and Knudsen flow (Kn ≥ 10). The gas transport in shale nanopores is acomplex combination of all these flow mechanisms, which cannot be described by Darcy’s law [14].
Energies 2017, 10, 751; doi:10.3390/en10060751 www.mdpi.com/journal/energies

Energies 2017, 10, 751 2 of 12
In addition, the adsorption and desorption process also exist in the pores with adsorbed gas on organicmatter and inorganic mineral surfaces.
Some transport models have been developed to understand and quantify gas flow in shale gasreservoirs over the past years. Javadpour [15] and Ozkan et al. [16] proposed a gas transport model inshales including viscous flow and Knudsen flow. Moridis et al. [17] and Freeman et al. [18] presenteda very comprehensive review of flow models in shale gas reservoirs considering the four regimes.In order to analyze production dynamics in shale gas reservoirs, an extended dynamic-slippage modelwas put forward by Clarkson et al. [19,20]. Civan et al. [21], Sakhaee and Bryant [22] extended Knudsendiffusion into slippage factor to describe gas transport in shales. Anderson et al. [23] proposed amodel to describe the transport mechanisms, which is related to the experiment empirical coefficients.Although there are lots of models proposed to describe gas transport in shale nanopores, a detailedcomparison and analysis of different flow patterns is lacking. Moreover, the effects of these parameterson gas flow patterns, such as pressure, temperatures, and adsorption parameters, were also not studiedsystematically. Therefore, it is extremely necessary to understand gas flow behavior in shale nanoporesand the effects on different flow patterns so as to predict gas production and optimize the fracturingtreatment for shale gas reservoirs.
In this work, the gas flow regimes were described according to Knudsen number in shale gasreservoirs. The gas flow mathematical models under different flow patterns were analyzed andproposed to understand the flow behavior. Then the effects of pressure and temperature on flowpattern versus pore diameters were analyzed. Besides, a series of sensitivity studies to quantify theeffects of these parameters such as adsorption, adsorption thickness, Langmuir pressure, temperature,pressure on the gas flow behavior were performed. This work should provide insights for a betterunderstanding of gas flow behavior in shale nanopores.
2. Gas Flow Regimes
2.1. Knudsen Number
Compared with conventional gas reservoirs, shale gas reservoirs are characterized by low porosityand ultra-low permeability. With decreasing shale pore radius, the gas transport in shales will changefrom Darcy flow to other flow patterns. Thus the Darcy flow equation does not correctly describegas transport in shale gas reservoirs. When the shale pore radius is less than the gas molecularmean free path, the collisions between gas molecules and hole-walls are more frequent than thosebetween gas molecules, and the Knudsen diffusion will occur. In order to divide gas flow patterns,Hadjiconstanttinou [24] used Knudsen number (Kn) to distinguish gas flow regions in the process ofmicro-nano pipe flow. It can be expressed as follows:
Kn =λ
r(1)
where Kn is Knudsen number; λ is mean free path of gas molecular; and r is pore radius.Knudsen number is a characteristic parameter of gas flow in different scale channels [25]. It is
very important to correctly determine the mean free path of gas molecules. The mean free path of gasmolecules can be written as:
λ =kBT√2πδ2P
(2)
where kB is the Boltzmann constant, kB = 1.3805 × 10⁻²³ J/K; T is temperature; P is pressure; and δ iscollision diameter.
2.2. Gas Flow Regimes
According to Knudsen number, the gas flow in shales can be divided four regimes, includingcontinuous flow (known as Darcy flow), slip flow, transition flow and molecular free flow, as shown
Energies 2017, 10, 751 3 of 12
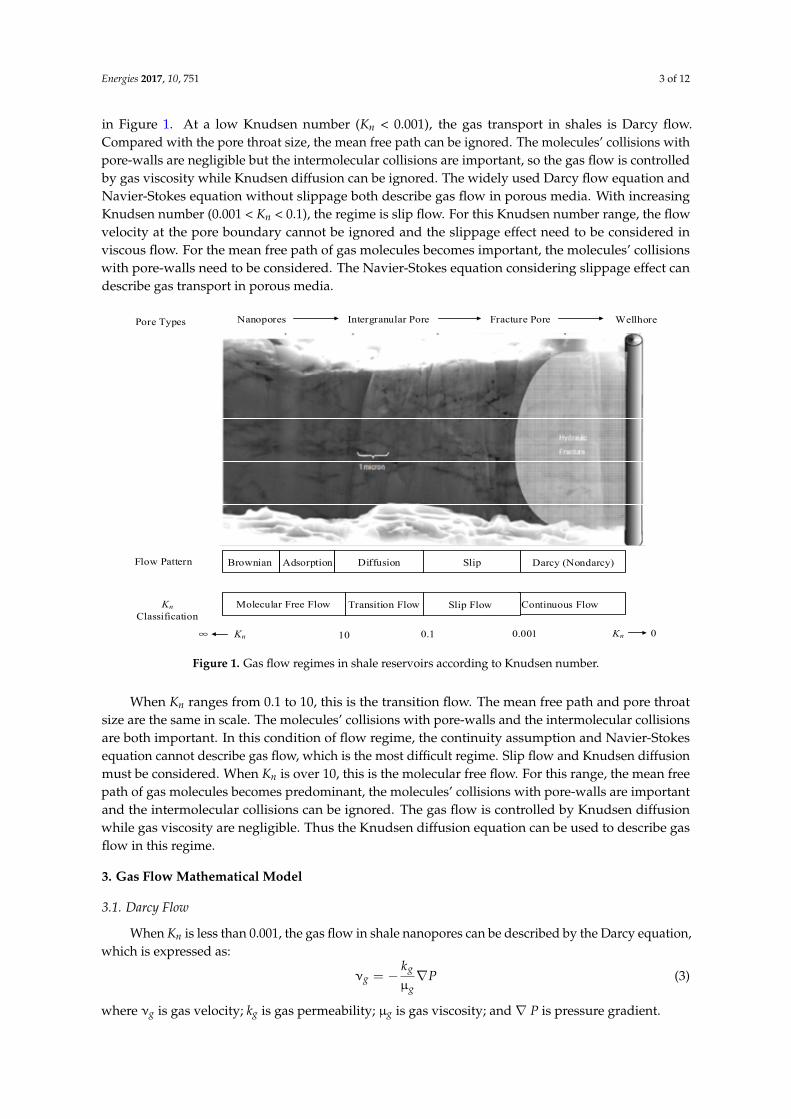
in Figure 1. At a low Knudsen number (Kn < 0.001), the gas transport in shales is Darcy flow.Compared with the pore throat size, the mean free path can be ignored. The molecules’ collisions withpore-walls are negligible but the intermolecular collisions are important, so the gas flow is controlledby gas viscosity while Knudsen diffusion can be ignored. The widely used Darcy flow equation andNavier-Stokes equation without slippage both describe gas flow in porous media. With increasingKnudsen number (0.001 < Kn < 0.1), the regime is slip flow. For this Knudsen number range, the flowvelocity at the pore boundary cannot be ignored and the slippage effect need to be considered inviscous flow. For the mean free path of gas molecules becomes important, the molecules’ collisionswith pore-walls need to be considered. The Navier-Stokes equation considering slippage effect candescribe gas transport in porous media.
Energies 2017, 10, 751 3 of 12
in Figure 1. At a low Knudsen number (Kn < 0.001), the gas transport in shales is Darcy flow. Compared with the pore throat size, the mean free path can be ignored. The molecules’ collisions with pore-walls are negligible but the intermolecular collisions are important, so the gas flow is controlled by gas viscosity while Knudsen diffusion can be ignored. The widely used Darcy flow equation and Navier-Stokes equation without slippage both describe gas flow in porous media. With increasing Knudsen number (0.001 < Kn < 0.1), the regime is slip flow. For this Knudsen number range, the flow velocity at the pore boundary cannot be ignored and the slippage effect need to be considered in viscous flow. For the mean free path of gas molecules becomes important, the molecules’ collisions with pore-walls need to be considered. The Navier-Stokes equation considering slippage effect can describe gas transport in porous media.
Nanopores
Kn Classification
Flow Pattern
Fracture PoreIntergranular Pore
Molecular Free Flow Transition Flow
0.1 10 ∞ Kn Kn 0
Wellhore
Slip Flow Continuous Flow
Darcy (Nondarcy)Slip DiffusionAdsorptionBrownian
0.001
Pore Types
Figure 1. Gas flow regimes in shale reservoirs according to Knudsen number.
When Kn ranges from 0.1 to 10, this is the transition flow. The mean free path and pore throat size are the same in scale. The molecules’ collisions with pore-walls and the intermolecular collisions are both important. In this condition of flow regime, the continuity assumption and Navier-Stokes equation cannot describe gas flow, which is the most difficult regime. Slip flow and Knudsen diffusion must be considered. When Kn is over 10, this is the molecular free flow. For this range, the mean free path of gas molecules becomes predominant, the molecules’ collisions with pore-walls are important and the intermolecular collisions can be ignored. The gas flow is controlled by Knudsen diffusion while gas viscosity are negligible. Thus the Knudsen diffusion equation can be used to describe gas flow in this regime.
3. Gas Flow Mathematical Model
3.1. Darcy Flow
When Kn is less than 0.001, the gas flow in shale nanopores can be described by the Darcy equation, which is expressed as:
νμg
g
g
kP= − ∇ (3)
where νg is gas velocity; kg is gas permeability; μg is gas viscosity; and ∇ P is pressure gradient. According to the Hagen-Poiseuille equation, the Darcy permeability can be expressed as:
Figure 1. Gas flow regimes in shale reservoirs according to Knudsen number.
When Kn ranges from 0.1 to 10, this is the transition flow. The mean free path and pore throatsize are the same in scale. The molecules’ collisions with pore-walls and the intermolecular collisionsare both important. In this condition of flow regime, the continuity assumption and Navier-Stokesequation cannot describe gas flow, which is the most difficult regime. Slip flow and Knudsen diffusionmust be considered. When Kn is over 10, this is the molecular free flow. For this range, the mean freepath of gas molecules becomes predominant, the molecules’ collisions with pore-walls are importantand the intermolecular collisions can be ignored. The gas flow is controlled by Knudsen diffusionwhile gas viscosity are negligible. Thus the Knudsen diffusion equation can be used to describe gasflow in this regime.
3. Gas Flow Mathematical Model
3.1. Darcy Flow
When Kn is less than 0.001, the gas flow in shale nanopores can be described by the Darcy equation,which is expressed as:
νg = −kg
µg∇P (3)
where νg is gas velocity; kg is gas permeability; µg is gas viscosity; and ∇ P is pressure gradient.
Energies 2017, 10, 751 4 of 12
According to the Hagen-Poiseuille equation, the Darcy permeability can be expressed as:
kg =r2
8(4)
Substituting Equation (4) into Equation (3), the mass flux in Darcy flow can be expressed as:
JV =ρgr2
8µg∇P (5)
where ρg is gas density; and r is radius.
3.2. Slip Flow
When Kn ranges from 0.001 to 0.1, the molecules’ collisions with pore-walls are not negligible andthere exists slip flow. The gas velocity along pore-walls is not zero, so the slippage effect needs to beconsidered. An equation proposed by Klinkenberg [26] can be expressed as:
kg = kl(1 +4cλ
r) = kl(1 +
bkP) (6)
where kl is equivalent liquid permeability; c is constant; P is pore pressure; and bk is Klinkenbergcoefficient.
For the slip flow regime, Roy et al. [25] presented a similar equation as follows:
kg = kl [1 + 4(2− σv
σv)λ
D] (7)
where σv is tangential momentum coefficient, σv ≈ 0.9; and D is pore diameter.Then the permeability in slip flow can be expressed as:
kg = kl(1 + 5Kn) (8)
Thus the mass flux in the slip flow regime can be written as:
Js = Fρgr2
8µg∇P (9)
where F is slip flow coefficient, F = 1 + 5Kn.
3.3. Transition Flow
When Kn is in the range between 0.1 and 10, the mean free path of gas molecules is the same orderas the pore size of porous media. The regime is the transition flow. It not only considers the slippageeffect, but also includes the Knudsen diffusion, which is a complex flow process. For the transitionflow regime, Ho and Webb [27] used the dusty gas model to describe gas flow, which is expressed as:
kg = kl(1 +bkP) = kl(1 +
µDkkl
1P) (10)
Dk =ϕ
τh
2r3(
8RTπM
)0.5
(11)
where Dk is the Knudsen diffusion coefficient.Based on the model from Beskok and Karniadakis [28], Civan [29] revised the rarefaction
coefficient to describe the gas flow in this regime as follows:
Energies 2017, 10, 751 5 of 12
kt =
[(1 + αKn)(1 +
4Kn
1− bKn)
]kl (12)
α =1.358
1 + 0.17Kn
0.4348
(13)
where α is the rarefaction coefficient; and b is the slip coefficient.Shi et al. [30] used a ratio coefficient to describe the slippage and diffusion effect in the transient
gas flow, and the mass flux can be expressed as:
Jt = f Js + (1− f )JKn (14)
where f is the ratio coefficient; Js and JKn are the mass flux in the slip and Knudsen diffusion, separately.
3.4. Molecular Free Flow
When Kn exceeds 10, the gas transport is the molecular free flow. This regime is controlled byKnudsen diffusion. For this regime, the mass flux can be expressed as:
JM = −DKn∇ni (15)
∇ni =−M
103RT∇P (16)
where DKn is the Knudsen diffusivity; and ∇ ni is the gas density gradient of gas component i.Based on a circular tube, Roy et al. [25] proposed the Knudsen diffusivity which can be written
as follows:
DKn =d3(
8RTπM
)0.5
(17)
Thus the mass flux in the molecular free flow can be expressed as:
JM =2rM
3× 10³RT(
8RTπM
)0.5∇P (18)
4. Mathematical Model with Multi-Flow Regimes
4.1. Gas Mathematical Model
According to the above analytical result, the gas flow in shale gas reservoirs is a complex flowprocess, including the Darcy flow, slip flow, transition flow and molecular free flow. For the gastransport in shale nanopores, these flow patterns may exist at the same time, and it is not comprehensiveto consider one or two flow process. Thus the total mass flux with multi-flow regimes may beexpressed as:
J = JV + JS + JT + JM (19)
Substituting Equations (5), (9), (14), (18) and (19), we obtain:
J =
1 +
2 +(
Kn4.5
)4
1 +(
Kn4.5
)4 · (1 + 5Kn)
ρgr2
8µg+
1 + 2(
Kn4.5
)4
1 +(
Kn4.5
)42rM
3× 10³RT(
8RTπM
)0.5
∇p (20)
When considering the effect of gas adsorption, the adsorption thickness based on the Langmuirequation can be expressed as:
d = d0P
P + PL(21)
where d is the adsorption thickness; d0 is the max adsorption thickness; and PL is Langmuir pressure.

Energies 2017, 10, 751 6 of 12
And the effective radius in the shale nanopores and Knudsen number considering the adsorptioneffect can be written as:
re = r− d = r− d0P
P + PL(22)
Kne =λ
re(23)
Thus the total mass flux with multi-flow regimes and adsorption effect can be written as:
J =
1 +
2 +(
Kne4.5
)4
1 +(
Kne4.5
)4 · (1 + 5Kne)
ρgr2e
8µg+
1 + 2(
Kne4.5
)4
1 +(
Kne4.5
)42re M
3× 10³RT(
8RTπM
)0.5
∇P (24)
4.2. Case Study
According to the Equations (20) and (24), it can be seen that the total mass flux in shale gas flowis influenced by lots of properties and parameters, such as Knudsen number, gas density, pore size,gas viscosity temperature, gas molar mass and pressure gradient. In order to understand the gas flowbehavior in shale nanopores, here we will analyze different flow patterns under different conditions.Table 1 presents the mole fraction, mole mass and collision diameter for each component in a typicalshale gas reservoir. Table 2 shows the properties of gas flow in shale nanopores. According to thecalculations, the ratio mass flux in different flow patterns versus pore size is illustrated in Figure 2.From the result of Figure 2, with increasing pore size, the mass flux ratio of Darcy flow rises while thatof slip flow slows down. The transition flow increases firstly, and then decreases after the pore sizereaches 10 nm. When the pore size is less than 10 nm, the slip flow is predominant. In the range from10 nm and 1000 nm, the slip and transient flow dominate the gas transport, and the Darcy flow plays arole in the process. It is noteworthy although the molecular free flow has an effect on gas flow, its massflux is very small.
Table 1. Mole fraction, mole mass and collision diameter for each component in typical shalegas reservoir.
Gas Components Mole Fraction (%) Mole Mass (kg/kmol) Collision Diameter (δ, ×10−9 m)
CH4 87.4 16 0.40C2H6 0.12 30 0.52CO2 12.48 44 0.45
Average 19.50 0.41
Table 2. Properties of gas flow in shale nanopores.
Property Value Unit
Gas density (ρg) 8.03 kg/m3
Gas viscosity (µg) 0.12 ×10⁻⁴ Pa·sAverage mean-free-path (λ) 5.55 nm
Maximum adsorption thickness (d0) 0.50 nmKnudsen number (Kn) 5.55 1
Temperature (T) 300 KPressure (P) 10 MPa
Pressure gradient (∇ P) 5 MPaLangmuir pressure (PL) 10 MPa
Universal gas constant (R) 8.31 Pa·m3/(mol·K)Gas mole mass (M) 19.50 ×10⁻³ kg/kmol

Energies 2017, 10, 751 7 of 12Energies 2017, 10, 751 7 of 12
Figure 2. Gas flow fraction versus pore radius.
5. Sensitivity Analysis
5.1. Effect of Pressure on Flow Regimes
Figure 3 presents the effects in different pressures where four cases were calculated by varying pressure from 5 MPa to 40 MPa to study different flow patterns in shale nanopores. From the results of Figure 3, it is known that the flow fraction of Darcy and molecular free flow increases with increasing pressure, but the slip and transition flow decreases. When pressures are constant, with increasing pore radius, the slip and transition flow slows down while the Darcy and molecular free flow gradually rise.
(a) (b)
(c) (d)
Figure 3. Gas flow fraction versus pore radius for various pressures. (a) The fraction of Darcy flow; (b) the fraction of Slip flow; (c) the fraction of Transition flow; and (d) the fraction of Diffusion flow.
Figure 2. Gas flow fraction versus pore radius.
5. Sensitivity Analysis
5.1. Effect of Pressure on Flow Regimes
Figure 3 presents the effects in different pressures where four cases were calculated by varyingpressure from 5 MPa to 40 MPa to study different flow patterns in shale nanopores. From the results ofFigure 3, it is known that the flow fraction of Darcy and molecular free flow increases with increasingpressure, but the slip and transition flow decreases. When pressures are constant, with increasing poreradius, the slip and transition flow slows down while the Darcy and molecular free flow gradually rise.
Energies 2017, 10, 751 7 of 12
Figure 2. Gas flow fraction versus pore radius.
5. Sensitivity Analysis
5.1. Effect of Pressure on Flow Regimes
Figure 3 presents the effects in different pressures where four cases were calculated by varying pressure from 5 MPa to 40 MPa to study different flow patterns in shale nanopores. From the results of Figure 3, it is known that the flow fraction of Darcy and molecular free flow increases with increasing pressure, but the slip and transition flow decreases. When pressures are constant, with increasing pore radius, the slip and transition flow slows down while the Darcy and molecular free flow gradually rise.
(a) (b)
(c) (d)
Figure 3. Gas flow fraction versus pore radius for various pressures. (a) The fraction of Darcy flow; (b) the fraction of Slip flow; (c) the fraction of Transition flow; and (d) the fraction of Diffusion flow.
Figure 3. Gas flow fraction versus pore radius for various pressures. (a) The fraction of Darcy flow;(b) the fraction of Slip flow; (c) the fraction of Transition flow; and (d) the fraction of Diffusion flow.

Energies 2017, 10, 751 8 of 12
5.2. Effect of Temperature on Flow Regimes
The relationship between different flow patterns and pore radius for different temperatures from320 K to 400 K is shown in Figure 4 where it is seen that as temperatures increase, the ratio of the Darcy,slip, transition and molecular free flow changes little at given pore radius. When temperatures aregiven, with the increasing of pore radius, the Darcy and molecular free flow increases while the slipand transition flow decreases.
Energies 2017, 10, 751 8 of 12
5.2. Effect of Temperature on Flow Regimes
The relationship between different flow patterns and pore radius for different temperatures from 320 K to 400 K is shown in Figure 4 where it is seen that as temperatures increase, the ratio of the Darcy, slip, transition and molecular free flow changes little at given pore radius. When temperatures are given, with the increasing of pore radius, the Darcy and molecular free flow increases while the slip and transition flow decreases.
(a) (b)
(c) (d)
Figure 4. Gas flow fraction versus pore radius for various temperatures. (a) The fraction of Darcy flow; (b) the fraction of Slip flow; (c) the fraction of Transition flow; and (d) the fraction of Diffusion flow.
5.3. Effect of Langmuir Pressure
Four cases of the Langmuir pressure values from 10 MPa to 25 MPa are selected to study the gas flow in shale nanopores, as shown in Figure 5. The result shows the Jad/Jno-ad (Jad and Jnon-ad are the mass flux with adsorption and without adsorption, respectively) ratio will increase with Langmuir pressure when the pore radius is constant. That means that the total mass flux rises with increasing Langmuir pressure. For a given Langmuir pressure, with the pore radius increasing, the Jad/Jno-ad ratio will rise. It says that the total mass flux increases with the pore radius.
Figure 4. Gas flow fraction versus pore radius for various temperatures. (a) The fraction of Darcy flow;(b) the fraction of Slip flow; (c) the fraction of Transition flow; and (d) the fraction of Diffusion flow.
5.3. Effect of Langmuir Pressure
Four cases of the Langmuir pressure values from 10 MPa to 25 MPa are selected to study the gasflow in shale nanopores, as shown in Figure 5. The result shows the Jad/Jno-ad (Jad and Jnon-ad are themass flux with adsorption and without adsorption, respectively) ratio will increase with Langmuirpressure when the pore radius is constant. That means that the total mass flux rises with increasingLangmuir pressure. For a given Langmuir pressure, with the pore radius increasing, the Jad/Jno-adratio will rise. It says that the total mass flux increases with the pore radius.

Energies 2017, 10, 751 9 of 12Energies 2017, 10, 751 9 of 12
Figure 5. Jad/Jnon-ad ratio versus pore radius for various Langmuir pressures.
5.4. Effect of Adsorption Thickness
The adsorption thickness values from 0.3 nm to 1 nm are chosen to study the effect of adsorption thickness on gas flow in shale nanopores. The Jad/Jno-ad ratio versus pore radius is illustrated in Figure 6. From the results of Figure 6, it is seen that the Jad/Jno-ad ratio will decrease with adsorption thickness for a given pore size. In other words, with increasing adsorption thickness, the total mass flux will decrease. When pressure is constant, the Jad/Jno-ad ratio will increase with the rising pore radius. It means that the total mass flux will increase as the pore radius increases.
Figure 6. Jad/Jnon-ad ratio versus pore radius for various adsorption thickness.
5.5. Effect of Pressure
Figure 7 shows the effects in different pressures where four cases from 5 MPa to 40 MPa are considered to study gas flow in shale nanopores. From the result of Figure 7, with increasing pressure in shale nanopores, the Jad/Jno-ad ratio will decrease when the pore radius is constant. The total mass flux decreases as pressure increases. However, for a given pressure the Jad/Jno-ad ratio will increase with the increasing pore radius. It means that the total mass flux will increase as pore size increases when pressure is given.
Figure 5. Jad/Jnon-ad ratio versus pore radius for various Langmuir pressures.
5.4. Effect of Adsorption Thickness
The adsorption thickness values from 0.3 nm to 1 nm are chosen to study the effect of adsorptionthickness on gas flow in shale nanopores. The Jad/Jno-ad ratio versus pore radius is illustrated inFigure 6. From the results of Figure 6, it is seen that the Jad/Jno-ad ratio will decrease with adsorptionthickness for a given pore size. In other words, with increasing adsorption thickness, the total massflux will decrease. When pressure is constant, the Jad/Jno-ad ratio will increase with the rising poreradius. It means that the total mass flux will increase as the pore radius increases.
Energies 2017, 10, 751 9 of 12
Figure 5. Jad/Jnon-ad ratio versus pore radius for various Langmuir pressures.
5.4. Effect of Adsorption Thickness
The adsorption thickness values from 0.3 nm to 1 nm are chosen to study the effect of adsorption thickness on gas flow in shale nanopores. The Jad/Jno-ad ratio versus pore radius is illustrated in Figure 6. From the results of Figure 6, it is seen that the Jad/Jno-ad ratio will decrease with adsorption thickness for a given pore size. In other words, with increasing adsorption thickness, the total mass flux will decrease. When pressure is constant, the Jad/Jno-ad ratio will increase with the rising pore radius. It means that the total mass flux will increase as the pore radius increases.
Figure 6. Jad/Jnon-ad ratio versus pore radius for various adsorption thickness.
5.5. Effect of Pressure
Figure 7 shows the effects in different pressures where four cases from 5 MPa to 40 MPa are considered to study gas flow in shale nanopores. From the result of Figure 7, with increasing pressure in shale nanopores, the Jad/Jno-ad ratio will decrease when the pore radius is constant. The total mass flux decreases as pressure increases. However, for a given pressure the Jad/Jno-ad ratio will increase with the increasing pore radius. It means that the total mass flux will increase as pore size increases when pressure is given.
Figure 6. Jad/Jnon-ad ratio versus pore radius for various adsorption thickness.
5.5. Effect of Pressure
Figure 7 shows the effects in different pressures where four cases from 5 MPa to 40 MPa areconsidered to study gas flow in shale nanopores. From the result of Figure 7, with increasing pressurein shale nanopores, the Jad/Jno-ad ratio will decrease when the pore radius is constant. The total massflux decreases as pressure increases. However, for a given pressure the Jad/Jno-ad ratio will increasewith the increasing pore radius. It means that the total mass flux will increase as pore size increaseswhen pressure is given.

Energies 2017, 10, 751 10 of 12Energies 2017, 10, 751 10 of 12
Figure 7. Jad/Jnon-ad ratio versus pore radius for various pressures.
5.6. Effect of Temperature
The values of different temperatures between 320 K and 400 K are conducted to investigate the effect of adsorption thickness on the gas flow in shale pores. The variation of the Jad/Jno-ad ratio versus pore radius is shown in Figure 8. As illustrated in Figure 8, it is seen that as temperatures increase, the Jad/Jno-ad ratio increases for a given pore radius. It means that the elevated temperature favors total mass flux. When pressure is constant, the Jad/Jno-ad ratio rises with increasing pore radius. That is, the corresponding total mass flux increases as the pore radius increases.
Figure 8. Jad/Jnon-ad ratio versus pore radius for various temperatures.
6. Conclusions
Based on Knudsen number, the gas flow regimes in shale nanopores were classified. Then the gas flow model considering Darcy flow, slip flow, transition flow, molecular free flow and adsorption effect was proposed to describe the gas flow behavior in shale nanopores. The proportion of flow patterns and the effects on flow patterns in shale pores were analyzed. According to the above analytical results, the following conclusions can be drawn: (1) As the pore radius increases, the Darcy flow rises steadily in shale nanopores while the slip flow decreases. The transition flow increases, and then decreases after the pore radius reaches 10 nm. When the pore radius is less than 10 nm, the slip flow is predominant. In the range from 10 nm and 1000 nm, the slip and transient flow dominates the gas transport, and the Darcy flow plays a role in the process. It is noteworthy although the molecular free flow has an effect on gas flow, its mass flux is very small; (2) For a given pore radius, with increasing pressure, the Darcy and mole free flow will increase while the slip and transition flow will decrease. The temperature has little effect on the four flows in shale nanopores; (3) The adsorption process has a strong influence on the total mass flux in shale pores. When the pore radius
Figure 7. Jad/Jnon-ad ratio versus pore radius for various pressures.
5.6. Effect of Temperature
The values of different temperatures between 320 K and 400 K are conducted to investigate theeffect of adsorption thickness on the gas flow in shale pores. The variation of the Jad/Jno-ad ratio versuspore radius is shown in Figure 8. As illustrated in Figure 8, it is seen that as temperatures increase,the Jad/Jno-ad ratio increases for a given pore radius. It means that the elevated temperature favorstotal mass flux. When pressure is constant, the Jad/Jno-ad ratio rises with increasing pore radius. That is,the corresponding total mass flux increases as the pore radius increases.
Energies 2017, 10, 751 10 of 12
Figure 7. Jad/Jnon-ad ratio versus pore radius for various pressures.
5.6. Effect of Temperature
The values of different temperatures between 320 K and 400 K are conducted to investigate the effect of adsorption thickness on the gas flow in shale pores. The variation of the Jad/Jno-ad ratio versus pore radius is shown in Figure 8. As illustrated in Figure 8, it is seen that as temperatures increase, the Jad/Jno-ad ratio increases for a given pore radius. It means that the elevated temperature favors total mass flux. When pressure is constant, the Jad/Jno-ad ratio rises with increasing pore radius. That is, the corresponding total mass flux increases as the pore radius increases.
Figure 8. Jad/Jnon-ad ratio versus pore radius for various temperatures.
6. Conclusions
Based on Knudsen number, the gas flow regimes in shale nanopores were classified. Then the gas flow model considering Darcy flow, slip flow, transition flow, molecular free flow and adsorption effect was proposed to describe the gas flow behavior in shale nanopores. The proportion of flow patterns and the effects on flow patterns in shale pores were analyzed. According to the above analytical results, the following conclusions can be drawn: (1) As the pore radius increases, the Darcy flow rises steadily in shale nanopores while the slip flow decreases. The transition flow increases, and then decreases after the pore radius reaches 10 nm. When the pore radius is less than 10 nm, the slip flow is predominant. In the range from 10 nm and 1000 nm, the slip and transient flow dominates the gas transport, and the Darcy flow plays a role in the process. It is noteworthy although the molecular free flow has an effect on gas flow, its mass flux is very small; (2) For a given pore radius, with increasing pressure, the Darcy and mole free flow will increase while the slip and transition flow will decrease. The temperature has little effect on the four flows in shale nanopores; (3) The adsorption process has a strong influence on the total mass flux in shale pores. When the pore radius
Figure 8. Jad/Jnon-ad ratio versus pore radius for various temperatures.
6. Conclusions
Based on Knudsen number, the gas flow regimes in shale nanopores were classified. Then the gasflow model considering Darcy flow, slip flow, transition flow, molecular free flow and adsorption effectwas proposed to describe the gas flow behavior in shale nanopores. The proportion of flow patternsand the effects on flow patterns in shale pores were analyzed. According to the above analytical results,the following conclusions can be drawn: (1) As the pore radius increases, the Darcy flow rises steadilyin shale nanopores while the slip flow decreases. The transition flow increases, and then decreases afterthe pore radius reaches 10 nm. When the pore radius is less than 10 nm, the slip flow is predominant.In the range from 10 nm and 1000 nm, the slip and transient flow dominates the gas transport, and the

Energies 2017, 10, 751 11 of 12
Darcy flow plays a role in the process. It is noteworthy although the molecular free flow has an effecton gas flow, its mass flux is very small; (2) For a given pore radius, with increasing pressure, the Darcyand mole free flow will increase while the slip and transition flow will decrease. The temperature haslittle effect on the four flows in shale nanopores; (3) The adsorption process has a strong influence onthe total mass flux in shale pores. When the pore radius is constant, the total mass flux will increasewith increasing Langmuir pressure and temperature. However, it will decrease as reservoir pressureand the adsorption thickness increase.
Acknowledgments: This work was supported by the Youth Foundation of Key Laboratory for Mechanics in FluidSolid Coupling Systems, Chinese Academy of Sciences, and by National Science and Technology Major Project ofthe Ministry of Science and Technology of China Project (NO. 50150503-12 and NO. 2016ZX05037006), and by theProject of PetroChina Research Institute of Petroleum Exploration & Development (NO. RIPED-LFFY-2017-5S-118).We thank the support from the Foundation of China Scholarship Council (CSC).
Author Contributions: Weijun Shen, Xizhe Li and Yanmei Xu analyzed and proposed the mathematical models;Weijun Shen, Yuping Sun and Weigang Huang performed and analyzed the result; Weijun Shen wrote the paper.
Conflicts of Interest: The authors declare no conflict of interest.
References
1. Shen, W.J.; Zheng, L.G.; Oldenburg, C.M.; Cihan, A.; Wan, J.M.; Tokunaga, T.K. Methane diffusion andadsorption in shale rocks—A numerical study using the dusty gas model in Tough2/EOS7C-ECBM.In Proceedings of the TOUGH Symposium, Lawrence Berkeley National Laboratory, Berkeley, CA, USA,28–30 September 2015.
2. Sutton, R.P.; Cox, S.A.; Barree, R.D. Shale gas plays: A performance perspective. In Proceedings of the SPETight Gas Completions Conference, San Antonio, TX, USA, 2–3 November 2010.
3. Shen, W.J.; Wan, J.M.; Kim, Y.; Li, X.Z. Porosity calculation, pore size distribution and mineral analysis withinshale rocks: Application of scanning electron microscopy. Electron. J. Geotech. Eng. 2015, 20, 11477–11490.
4. Shen, W.J.; Xu, Y.M.; Li, X.Z.; Huang, W.G.; Gu, J.R. Numerical simulation of gas and water flow mechanismin hydraulically fractured shale gas reservoirs. J. Nat. Gas Sci. Eng. 2016, 35, 726–735. [CrossRef]
5. Davies, D.K.; Bryant, W.R.; Vessel, R.K.; Burkett, P.J. Porosity, Permeabilities and Microfabrics of DevonianShales. In Microstructure of Fine-Grained Sediments; Bennett, R.H., Bryant, W.R., Hulbert, M.H., Eds.;Springer Verlag: New York, NY, USA, 1991; pp. 109–119.
6. Bustin, R.M.; Bustin, A.M.; Cui, X.; Ross, D.; Pathi, V.M. Impact of Shale Properties on Pore Structure andStorage Characteristics. In Proceedings of the SPE Shale Gas Production Conference, Fort Worth, TX, USA,16–18 November 2008.
7. Reed, R.M.; Loucks, R.G.; Ruppel, S.C. Comment on “Formation of nanoporous pyrobitumen residuesduring maturation of the Barnett Shale (Fort Worth Basin)” by Bernard et al. (2012). Int. J. Coal Geol. 2014,127, 111–131. [CrossRef]
8. Hill, C.K.; Nelson, C.R. Gas Productive Fractured Shales: An Overview and Update; Gas Tips of Gas ResearchInstitute: Des Plaines, IL, USA, 2010; Volume 6, pp. 4–13.
9. Strapoc, D.; Mastalerz, M.; Schimmelmann, A.; Drobniak, A.; Hasenmueller, N.R. Geochemical constrainson the origin and volume of gas in the New Albany Shale (Devonian-Mississippian), eastern Illinois Basin.AAPG Bull. 2010, 94, 1713–1740. [CrossRef]
10. Javadpour, F.; Fisher, D.; Unsworth, M. Nanoscale gas flow in shale gas sediments. J. Can. Pet. Technol. 2007,46, 16–21. [CrossRef]
11. Loucks, R.G.; Reed, R.M.; Ruppel, S.C.; Jarvie, D.M. Morphology, genesis and distribution of nano-scalepores in siliceous mudstones of the Mississippian Barnett Shale. J. Sed. Res. 2009, 79, 848–861. [CrossRef]
12. Beskok, A.; Karniadakis, G.E. Simulation of heat and momentum transfer in complex micro geometries.J. Thermophys. Heat Transf. 1994, 8, 647–653. [CrossRef]
13. Swami, V.; Clarkson, C.R.; Settari, A. Non-darcy flow in shale nanopores: Do we have a final answer.In Proceedings of the SPE Canadian Unconventional Resources Conference, Calgary, AB, Canada,30 October–1 November 2012.
14. Bird, R.B.; Stewart, W.E.; Lightfoot, E.N. Transport Phenomenon, 2nd ed.; John Wiley & Sons, Inc.: New York,NY, USA, 2012.

Energies 2017, 10, 751 12 of 12
15. Javadpour, F. Nanopores and apparent permeability of gas flow in mudrocks (shales and siltstone). J. Can.Pet. Technol. 2009, 48, 16–21. [CrossRef]
16. Ozkan, E.; Brown, M.; Raghavan, R.; Kazemi, H. Comparison of fractured horizontal-well performance inconventional and unconventional reservoirs. SPE Reserv. Eval. Eng. 2009, 14, 248–259. [CrossRef]
17. Moridis, G.J.; Blasingame, T.A.; Freeman, C.M. Analysis of mechanisms of flow in fractured tight gas andshale gas reservoirs. In Proceedings of the SPE Latin American and Caribbean Petroleum EngineeringConference, Lima, Peru, 1–3 December 2010.
18. Freeman, C.M.; Moridis, G.J.; Blasingame, T.A. A Numerical study of microscale flow behavior in tight gasand shale gas reservoir systems. Transp. Porous Media 2011, 90, 253–268. [CrossRef]
19. Clarkson, C.R.; Nobakht, M.; Kaviani, D.; Ertekin, T. Production analysis of tight gas and shale gas reservoirsusing the dynamic-slippage concept. SPE J. 2012, 17, 230–242. [CrossRef]
20. Clarkson, C.R.; Qanbari, F.; Nobakht, M.; Heffner, L.E. Incorporating geomechanical and dynamic hydraulicfracture property changes into rate-transient analysis: Example from the haynesville shale. SPE Reserv.Eval. Eng. 2013, 16, 303–316. [CrossRef]
21. Civan, F.; Rai, C.S.; Sondergeld, C.H. Shale-gas permeability and diffusivity inferred by improvedformulation of relevant retention and transport mechanisms. Transp. Porous Media 2011, 86, 925–944.[CrossRef]
22. Sakhaee, P.A.; Bryant, S.L. Gas permeability of shale. SPE Reserv. Eval. Form. Eval. 2012, 8, 401–409.[CrossRef]
23. Anderson, J.M.; Moorman, M.W.; Brown, J.R.; Hochrein, J.M.; Thornberg, S.M. Isothermal massflow measurements in microfabricated rectangular channels over a very wide knudsen range.J. Micromech. Microeng. 2014, 24, 055013. [CrossRef]
24. Hadjiconstantinou, N.G. The limits of navier-stokes theory and kinetic extensions for describing small-scalegaseous hydrodynamics. Phys. Fluids 2006, 18, 111301–111320. [CrossRef]
25. Roy, S.; Raju, R.; Chuang, H.F.; Cruden, B.A.; Meyyappan, M. Modeling gas flow through microchannels andnanopores. J. Appl. Phys. 2003, 93, 4870–4879. [CrossRef]
26. Klinkenberg, L.J. The Permeability of Porous Media to Liquids and Gases. Drilling and Production Practice;American Petroleum Institute: Washington, DC, USA, 1941; pp. 200–213.
27. Ho, C.K.; Webb, S. Gas Transport in Porous Media; Springer Netherlands: Houten, The Netherlands, 2006.28. Beskok, A.; Karniadakis, G.E. A model for flows in channels, pipes, and ducts at micro and nano scales.
Microscale Thermophys. Eng. 1999, 3, 43–77.29. Civan, F. Effective correlation of apparent gas permeability in tight porous media. Transp. Porous Media 2010,
82, 375–384. [CrossRef]30. Shi, J.T.; Zhang, L.; Li, Y.S.; Wang, T. Diffusion and flow mechanisms of shale gas through matrix pores and
gas production forecasting. In Proceedings of the SPE Unconventional Resources Conference, Calgary, AB,Canada, 5–7 November 2013.
© 2017 by the authors. Licensee MDPI, Basel, Switzerland. This article is an open accessarticle distributed under the terms and conditions of the Creative Commons Attribution(CC BY) license (http://creativecommons.org/licenses/by/4.0/).