“COOL” SHALE IN THE UDANG FORMATION, SOUTH BELUT SUB-BASIN
15
________________________________________________________________________________ * ConocoPhillips Indonesia Inc. Ltd. IPA15-G-033 PROCEEDINGS, INDONESIAN PETROLEUM ASSOCIATION Thirty-Ninth Annual Convention & Exhibition, May 2015 “COOL” SHALE IN THE UDANG FORMATION, SOUTH BELUT SUB-BASIN Budi R Permana* Miftahul Firdaus* Retno Wijayanti* Lukman Hidayat* ABSTRACT In normal clastic environments, the gamma ray log is fundamentally used as a sand or shale lithology indicator. This is due to the fact that shales usually emit more radiation than other sedimentary rocks – they are “radioactively hot” compared to “radioactively cool” sand. However, in certain circumstance shales will have low radioactivity. This phenomenon is observed in the Late Oligocene to Early Miocene Udang Formation at the South Belut sub-basin and surrounding area in the West Natuna Sea. Integrated log analysis and test information from the South Belut and West Belut fields has shown a prior misinterpretation and miscalculation of shale volumes in the Udang resulting in an inaccurate estimation of hydrocarbon in place. “Cool” shale may occur when clay minerals in the shale interval are dominated by constituent minerals with low radioactivity such as kaolinite or chlorite. Investigations including petrographic analysis, XRD, and SEM of side wall cores acquired in the offset wells show high kaolinite with subordinate chlorite content within the Udang Formation in the South Belut Sub-Basin. Understanding this occurrence, we introduce special methods that we used to analyze and estimate shale volume in the Udang Formation when the gamma ray response due to low radioactivity is not suitable for lithology indication. Several VShale calculation equations that could solve this problem are based on consideration of multiple “clay indicators” evaluated statistically. These log-based clay indicators include the single neutron log, density log, resistivity log and the combination of neutron- density logs (neutron-density crossplot technique) where each indicator is calibrated to the borehole environment. Further investigations on the “cool” shale were conducted to analyze the phenomenon in the regional context, suggesting that the kaolinite clays are likely coming from sediments in exposed Sundaland basement rocks. This observation helps to constrain the provenance drainage system of the Early Miocene South Belut sub-basin. INTRODUCTION South Belut and West Belut fields contain several stacked hydrocarbon reservoirs from the Miocene Upper Arang, Lower Arang, and latest Oligocene Udang sand formation. In the subsurface evaluation and development of these fields, the key to identifying the top of the Udang sand formation during drilling is the presence of a low and monotonous gamma ray log pattern below a high gamma ray log pattern from the overlying and pervasive Barat Shale. The low gamma ray log from the Udang Formation is not definitive for lithology interpretation. From wellbore cuttings descriptions the Udang zone is usually a mixed sand and shale interval. The shale with low gamma ray in this Udang formation is called the “cool” shale. The gamma ray log response in the Udang formation cannot be used for lithology identification or shale volume estimation or effective porosity in the typical petrophysical workflow. Using the gamma ray response directly as a sand indicator without understanding the true lithology will lead to overestimation of the pore volume. In place of the gamma-ray log response, the neutron-density log response is used as the primary log suite for calculating petrophysical inputs for reservoir characterization. The first well in the sub-basin was the Belut-1 (in the current South Belut field), drilled in 1975. Based on the results of this well, the Udang zone was seen as a secondary objective in the South Belut field area. Therefore data acquisition such as
-
Upload
conocophillips -
Category
Documents
-
view
4 -
download
0
Transcript of “COOL” SHALE IN THE UDANG FORMATION, SOUTH BELUT SUB-BASIN

________________________________________________________________________________
* ConocoPhillips Indonesia Inc. Ltd.
IPA15-G-033
PROCEEDINGS, INDONESIAN PETROLEUM ASSOCIATION
Thirty-Ninth Annual Convention & Exhibition, May 2015
“COOL” SHALE IN THE UDANG FORMATION, SOUTH BELUT SUB-BASIN
Budi R Permana*
Miftahul Firdaus*
Retno Wijayanti*
Lukman Hidayat*
ABSTRACT
In normal clastic environments, the gamma ray log
is fundamentally used as a sand or shale lithology
indicator. This is due to the fact that shales usually
emit more radiation than other sedimentary rocks –
they are “radioactively hot” compared to
“radioactively cool” sand. However, in certain
circumstance shales will have low radioactivity.
This phenomenon is observed in the Late Oligocene
to Early Miocene Udang Formation at the South
Belut sub-basin and surrounding area in the West
Natuna Sea. Integrated log analysis and test
information from the South Belut and West Belut
fields has shown a prior misinterpretation and
miscalculation of shale volumes in the Udang
resulting in an inaccurate estimation of hydrocarbon
in place.
“Cool” shale may occur when clay minerals in the
shale interval are dominated by constituent minerals
with low radioactivity such as kaolinite or chlorite.
Investigations including petrographic analysis,
XRD, and SEM of side wall cores acquired in the
offset wells show high kaolinite with subordinate
chlorite content within the Udang Formation in the
South Belut Sub-Basin.
Understanding this occurrence, we introduce special
methods that we used to analyze and estimate shale
volume in the Udang Formation when the gamma
ray response due to low radioactivity is not suitable
for lithology indication. Several VShale calculation
equations that could solve this problem are based on
consideration of multiple “clay indicators”
evaluated statistically. These log-based clay
indicators include the single neutron log, density
log, resistivity log and the combination of neutron-
density logs (neutron-density crossplot technique)
where each indicator is calibrated to the borehole
environment.
Further investigations on the “cool” shale were
conducted to analyze the phenomenon in the
regional context, suggesting that the kaolinite clays
are likely coming from sediments in exposed
Sundaland basement rocks. This observation helps
to constrain the provenance drainage system of the
Early Miocene South Belut sub-basin.
INTRODUCTION
South Belut and West Belut fields contain several
stacked hydrocarbon reservoirs from the Miocene
Upper Arang, Lower Arang, and latest Oligocene
Udang sand formation. In the subsurface evaluation
and development of these fields, the key to
identifying the top of the Udang sand formation
during drilling is the presence of a low and
monotonous gamma ray log pattern below a high
gamma ray log pattern from the overlying and
pervasive Barat Shale. The low gamma ray log from
the Udang Formation is not definitive for lithology
interpretation. From wellbore cuttings descriptions
the Udang zone is usually a mixed sand and shale
interval. The shale with low gamma ray in this
Udang formation is called the “cool” shale.
The gamma ray log response in the Udang
formation cannot be used for lithology identification
or shale volume estimation or effective porosity in
the typical petrophysical workflow. Using the
gamma ray response directly as a sand indicator
without understanding the true lithology will lead to
overestimation of the pore volume. In place of the
gamma-ray log response, the neutron-density log
response is used as the primary log suite for
calculating petrophysical inputs for reservoir
characterization.
The first well in the sub-basin was the Belut-1 (in
the current South Belut field), drilled in 1975.
Based on the results of this well, the Udang zone
was seen as a secondary objective in the South
Belut field area. Therefore data acquisition such as

core and detailed evaluation of the mineralogy for
the Udang was not carried out in the South and
West Belut exploration wells. Because of this lack
of data regarding the unique Udang formation clay
mineralogy, geoscientists were unable to prove the
hypothesis that the observed “cool” shale from logs
may be related to an abundance of low radioactivity
clay minerals such as kaolinite or chlorite. In 2014,
during the rotary sidewall core acquisition and
laboratory analysis of the SB-06 development well,
several shale plugs were taken and analyzed for
mineralogy using XRD, SEM, and petrographic
analysis. The data confirmed the presence of an
abundance of low radioactivity clay minerals in the
Udang Formation at South Belut.
After confirming the presence of abundant kaolinite
and chlorite in the Udang Formation at South Belut,
the regional extent of this phenomena and the
provenance for the clays were investigated.
REGIONAL GEOLOGY
Based on Manur and Jacques (2014) nomenclature
and description of the regional geology of the West
Natuna Basin (WNB), initial basin formation due to
rifting began in Eocene-Early Oligocene in N-S
directed extension that utilised existing fabrics in
the basement. Resultant structures in the WNB
formed under transtensional conditions, consisting
of NE-SW trending half grabens with NW-SE
striking sinistral wrench zones. This phase of early
extension resulted in highly dissected half grabens
and grabens with many small fault bounded blocks
and local depocentres, often with an original E-W
trend reflecting the overall regional N-S extensional
direction (Figure 1). The main sub-basins that
ConocoPhillips Indonesia (COPI) operates in the
Block B PSC is the Bawal Graben, Gabus Sub-
Basin, North Belut Sub-Basin, and the South Belut
Sub-Basin (Figure 2). These basins collectively fit
within what is called the Anambas Graben by
Manur and Jacques, 2014.
Following the timing of Manur and Jacques (2014)
the initiation of inversion was diachronous, varying
from ~27 Ma to ~18 Ma across the basin, with peak
inversion timing from ~21 to 15 Ma. This resulted
in the modification of many of the original E-W
trending half grabens by shortening and rotation.
The resultant E-W to NE-SW trending fault
propagation folds (“Sunda Folds”) and the N-S
directed structures provide the traps for the majority
of plays in the basin to date (Manur and Jacques,
2014).
These tectonic events mark four
tectonostratigraphic mega-sequences in the basin:
syn-rift, post-rift deposit, syn-inversion, and post-
inversion. During the syn-rift phase, lacustrine and
fluvial sediment were deposited (Lama, Benua, and
Belut Formations). During the post-rift subsidence
dominated phase, the fluvial to marginal lacustrine
shoreface Gabus Formation was deposited. The
Gabus Formation became the main reservoir target
in the early stages of the Block B development.
During early syn-inversion, a transitional to parallic
system was deposited in the Barat/Udang, and
Arang Formations. The current post-inversion stage
contains dominantly shelfal marine sediments of the
Muda Formation. (Figure 3) shows the illustration
of this tectonostratigraphy and (Figure 4) shows the
comparison between Manur-Jacques and COPI
stratigraphy.
UDANG RESERVOIR IN SOUTH-WEST
BELUT FIELDS
Three exploration wells were drilled in South Belut
field (Belut-1, Belut-5, and Belut-6) and three
exploration wells were drilled in the saddle
separated West Belut field (Belut-2, Belut-3, and
West Belut-2). (Figure 5) shows the location of
South and West Belut fields. The exploration wells
penetrated the Udang Formation with similar low
gamma ray log patterns but with different actual net
sand presence (Figure 6). All exploration wells in
South Belut field found a high net to gross (NTG)
reservoir in the Udang after inspection of the
cuttings. However, two of the West Belut
exploration wells found a low NTG reservoir in the
Udang despite a low gamma ray response, with only
Belut-2 finding a developed sand in the Udang
(cuttings lithology confirmation). Geophysical
attributes and seismic geomorphologic trends
indicate that only Belut-2 is within the trend of the
Udang shoreface at the West Belut sub-culmination
(Figures 7, 8, 9).
During the drilling campaign of the South Belut
development wells, a rotary sidewall core
acquisition program was proposed for the SB-06
well. The data acquisition was directed mainly for
the mineralogic analysis of the low resistivity gas
pay zones of the Arang Formation for porosity-
permeability calibration. Clay mineral identification
using XRD and SEM in the Udang Formation was
an additional objective to clarify the hypothesis
about the effects of low radioactive clay mineralogy
on the gamma ray tool response. There are 6 core
plugs that consist of four sandstone and two clay
stone (Figure 10). Based on petrographic, XRD, and

SEM analysis of four sandstones and two claystone
rotary sidewall cores from the Udang, kaolinite is
the dominant clay mineral (~20% weight), with
chlorite (~10% weight), and illite (2-5% weight).
(Figure 10) shows the analyses.
PETROPHYSICAL ANALYSIS IN COOL
SHALE
A deterministic shaly sand petrophysical model was
used to re-analyze the Udang Formation log data for
this study. This model was derived from analysis
conducted in the analog Udang Formation Belut
exploration wells. The petrophysical analysis for
was performed using the windows-based Interactive
Petrophysics (IP) software application.
Clay Volumes (Vcl) were calculated using multiple
shale indicators, including gamma ray and
neutron/density cross-plots. As discussed, the
gamma ray (GR) is often non-representative of the
sand quality and shale volume in this region
because of the presence of low radioactivity clay
mineral such as kaolinite and chlorite. However,
neutron porosity is unaffected by the common low
radioactive-clay minerals such as kaolinite and
chlorite. Therefore, a petrophysical approach for
calculating Vcl from neutron and density porosity
logs was implemented.
The calculated Vcl is shown in the lithology track
with a green colored shale symbol and sand in a
yellow colored sand symbol (Figure 11). Multiple
shale indicators are dependent on the wireline suite
available and log quality, with the final shale
volume being the most logical shale volume
indicator given the borehole conditions and tool
availability. Combined neutron-density is the most
common shale indicator in Udang Formation, using
a Neutron-Density cross-plot with wet clay and dry
clay point identifiers. This method combined with
the Neutron-Density cross-plot technique usually
offers the best result, although it is altered slightly
by the presence of gas. The gas effect can be
minimized by calculating shale volume from the gas
corrected neutron-density (Figure 11).
A conventional Vcl equation is shown below:
NDVcl = (PhiN-PhiD)/(PhiNsh-PhiDsh)
Where:
NDVcl = volume of clay from Neutron density logs
PhiN = neutron porosity
PhiD = density porosity
PhiNsh = neutron porosity of shale
PhiDsh = density porosity of shale
Vcl for the Udang Formation “cool” shale bearing
interval was calculated using a combination of
density-neutron logs and the resistivity log. This
technique was applied for all West Belut (WB-2,
Belut-2 and Belut-3) and South Belut wells (Belut-
1, 5 and 6) which Udang section. At South Belut,
the Udang Formation shows a monotonous low
gamma ray reading and hydrocarbon-bearing zones
are found at the top of the zone. Resistivity logs in
the hydrocarbon column indicate low readings at
Belut-1 and Belut-6 that are consistent with clay
resistivity. The neutron and density logs are also
showing expected normal cross-over where the
neutron log deflects to the right and density log to
the left. However at some particular intervals, when
the gamma ray log shows a low reading,
anomalously the neutron log deflects to the left and
density log to the right, coinciding with the low
resistivity and low gas chromatograph log reading,
suggesting the logs are responding to a shale-rich
interval.
Porosity was calculated primarily from the neutron-
density cross-plot method when the borehole
condition was adequate and where there was no
significant gas effect to the neutron response. There
was little to no washout observed in the West Belut
wells. The total porosity value was corrected for gas
effect and clay volume resulting in effective
porosity (PHIE) and also verified and confirmed by
core (SCAL) data taken from the WB-2. Effective
porosity was determined by correcting the
appropriate porosity at each sample increment for
the effect of porosity reduction from shale using the
calculated shale volume and the tool’s response in
shale, corrected for any hydrocarbon response. An
example of the Belut-3 Udang Formation interval
petrophysical assessment is shown in (Figure 12).
Water saturation (Sw) was calculated using the
Indonesian equation (modified Archie method) to
compensate the clay effect from any shaly sand
intervals. Therefore, a shaly sand SW equation
(Indonesian equation) should be used to compute
more correctly the estimated water saturation (Sw).
The Indonesian equation is standard practice for
COPI in Block B to calculate Sw as below:
1/Rt0.5
= ((Phim/(a.Rw))
0.5 + Vcl
(1-
(Vcl/2))/Rcl
0.5).Sw
(n/2)
Where:
m = Cementation factor

n = Saturation exponent
a = Tortuosity factor
Vcl = Wet clay volume (clay content)
Sw = Effective water saturation
Rw = Formation water resistivity
Rcl = Resistivity of the clay
Rt = True resistivity
In the Udang zone interval the Rw of 0.49 ohm @
125ºF was used. It was derived from a water sample
analysis from the Belut-6 (~6,989 ppm NaCl)
collected at a water leg below the hydrocarbon
section in the Udang at 4,973 ft. (Figure 13). The
tortuosity index “a” is set to 1, the cementation
exponent m = 1.64 and saturation exponent n =
1.75 were taken from a nearby well.
The log estimated porosity was an important output
of the petrophysical analysis in Udang Formation
and will have a major impact on the well completion
decision and subsequent reservoir productivity
expectation. The permeability was predicted using a
modified Timur equation. The permeability was
controlled and calibrated by permeability (mobility)
from MDT data (Figure 14).
Timur equation K = a. (Phieb/Sw
c)
Where,
K = Permeability, mD
Phie = Effective porosity, pu
Sw = Water saturation (fraction)
‘a’ constant = 8581
‘b’ constant = 4.8
‘c’ constant = 1
COOL SHALE DISTRIBUTION AROUND
SOUTH BELUT SUB-BASIN
During the early Block B exploration period after
Belut-1 was drilled in1974, several exploration
wells were drilled including the Udang-1 (1974).
The Udang-1 well is about 46 km southwest of the
Belut-1 well, (Udang field is no longer being
operated by COPI) and probably has the same
“cool” shale lithofacies in the Udang Formation.
This prediction is based on the adjacent Block B
PSC wells Tiram-1, Udang-5, and Udang-6 wells
which penetrate the Udang Formation.
For this study, additional well correlations focused
on the Udang Formation presence of “cool” shale
were conducted to determine the extent of this
lithofacies. In the southern part of the South and
West Belut fields vicinity, there are two exploration
wells with Udang penetrations (Piranha-1 and
Kodok-1), and to the southwest there are the
mentioned Tiram-1, Udang-5, and Udang-6 wells.
(Figure 15) shows the fields and wells surrounding
the center of the study area (South and West Belut
Fields). (Figure 16) shows the well correlation with
the “cool” Udang shale lithofacies in the South
Belut Sub-Basin and how it decreases in presence
towards the north.
Weaver (1958) concluded that great majority of
clay minerals in sedimentary rocks are detrital in
origin, and that they strongly reflect the character of
their source material and are only slightly modified
in their depositional environment. However, based
on laboratory analysis the clay minerals in the
Udang “cool’ shale were precipitated during
deposition replacing unstable minerals and filling
the pores. Based on Emery et al. (1990) this
eogenetic kaolinite is formed under humid climatic
conditions in continental sediments. These humid
climate conditions are normally related to relative
sea-level lowstands, when large areas of marine
sediment are exposed and subjected to flushing by
meteoric water (Allen and Allen, 2005). (Figure 17)
shows clay mineral formation in a warm wet
eogenetic environment.
It is proposed that the kaolinite clay precursor
minerals and any associated transported clay is most
likely sourced from the southeast exposed highlands
of the Sundaland margin, where weathered granitic
rocks and volcanics would be able to provide
abundant kaolinitic input to the drainage system.
(Figure 18) shows an interpretation of the Udang
“cool” shale lithofacies distribution sub-regionally.
CONCLUSIONS
The gamma ray log pattern in the South Belut sub-
basin Udang Formation shows a low radioactive
response and monotonous gamma ray log pattern.
This response is described as a “cool shale”. XRD
and SEM analysis was used to confirm the clay
mineralogy causing the “cool” shale phenomenon.
For the Udang Formation in the South Belut sub-
basin, abundant kaolinite and chlorite clays are the
main factors causing a lower than expected gamma
ray pattern in the shale sections due to their low
radioactivity.
The gamma-ray log cannot be used to differentiate
sand shale lithologies in a “cool” shale setting.
Therefore, other tool suites utilizing neutron-density
logs and special methods as described in the paper
are necessary to calculate petrophysical parameters

such as volume of clay/shale, porosity, and water
saturation.
The distribution of “cool” shale lithofacies in the
sub-basin indicates it is pervasive to the south and
southeast of this South and West Belut Fields. A
likely source terrain for the abundant kaolinite
precursor minerals and chlorite clays is the
Sundaland Pre-Tertiary basement which was
exposed during Udang deposition, nearby the South
Belut sub-basin.
ACKNOWLEDGEMENTS
We acknowledge ConocoPhillips Indonesia Inc.
Ltd. and the Block B co-venturers (Chevron South
Natuna B Inc. and Inpex Natuna, Ltd.) for
permission to publish this paper. We would like to
acknowledge SKK Migas for their contributions and
support in the Block B area, and also MIGAS for
their permission to publish this paper. The information contained herein is for presentation
and discussion purposes only. ConocoPhillips does
not make any representations or warranties
regarding content accuracy.
REFERENCES
Allen, P.A, and Allen, J.R, 2005, Basin Analysis
Principles and Applications, Second Edition
Blackwell Publishing.
Emery, D., Myers, R.J., Young, R, 1990, Ancient
Subaerial Exposure and Freshwater Leaching in
Sandstone, Geology 18.
Manur, H., Jacques, J.M, 2014, Deformation
Characteristic of West Natuna Basin with regards to
Its Remaining Exploration Potential, Proceedings of
Indonesian Petroleum Association, 38th Annual
Convention.
Morley, R.J., 2003, Sequence Biostratigraphic
Study of Udang and Gabus formation. North Belut
Field, West Natuna Basin, Indonesia, Internal COPI
report.
Weaver, C.E., 1958, A Discussion on The Origin of
Clay Minerals in Sedimentary Rocks, Fifth National
Conference on Clay and Clays Mineral, National
Academy of Science-National Research Council.

Figure 1 - Basin configuration in West Natuna Basin (after Manur and Jacques, 2014)
Figure 2 - Basin and Sub-basin which COPI operates the Block B including South Belut Sub-basin

Figure 3 - Tectonostratigraphical packages illustration (after Morley 2003)
Figure 4 - Stratigraphy comparison between the latest publication and COPI

Figure 5 - Structural map of South-West Belut fields
Figure 6 - Well correlation South-West Belut Fields that shows low monotonous gamma ray log pattern in
Udang Formation

Figure 7 - Rock physics analysis for the AVA response of the Udang Formation
Figure 8 - Amplitude extraction on angle stack cubes

Figure 9 - Seismic attribute in order to interpret stratigraphical pattern of Udang reservoir
Figure 10 - Petrography, XRD, and SEM analysis of Udang Formation in SB-06
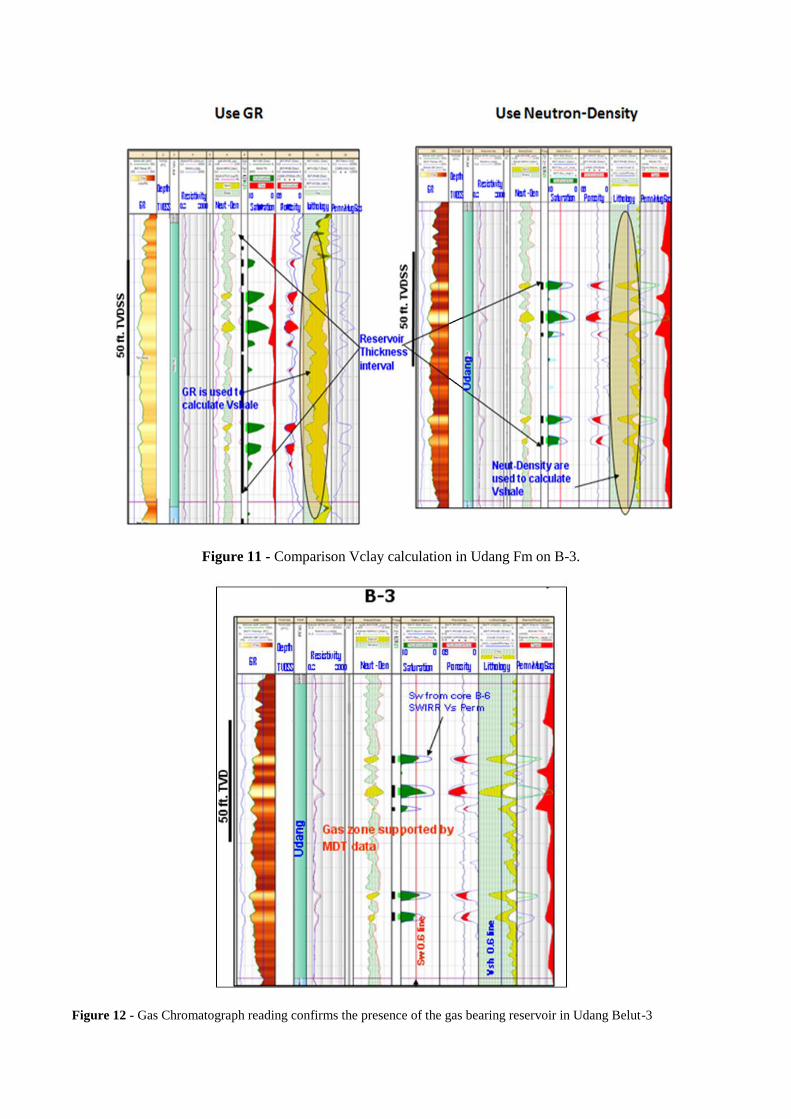
Figure 11 - Comparison Vclay calculation in Udang Fm on B-3.
Figure 12 - Gas Chromatograph reading confirms the presence of the gas bearing reservoir in Udang Belut-3

Figure 13 - Water Sample Analysis in Udang Fm

Figure 14 - SB-01 Petrophysical Analysis

Figure 15 - Wells surrounding South-West Belut fields
Figure 16 - Well correlation with surrounding wells that show cool shale distribution in Udang Fm

Figure 17 - Warm, wet eogenetic environment of river channel, crevasse, splays, and interdistributary bay
(after Allen and Allen, 2005)
Figure 18 - Hypothetic interpretation about cool shale distribution in Udang Fm


![[Cool] Gas Chromatography and Lipids](https://static.fdokumen.com/doc/165x107/6325a4b1852a7313b70e98e9/cool-gas-chromatography-and-lipids.jpg)