A novel method to quantify tablet disintegration
8
A novel method to quantify tablet disintegration Xavier Mesnier a , Tim O. Althaus b , Laurent Forny b , Gerhard Niederreiter b , Stefan Palzer c , Mike J. Hounslow a , Agba D. Salman a, ⁎ a Department of Chemical and Biological Engineering, University of Sheffield, Mappin Street, Sheffield, S1 3JD, UK b Food Science and Technology Department, Nestlé Research Centre, Vers-Chez-Les-Blanc CH-1000 Lausanne 26, Switzerland c Nestlé Product Technology Centre York, Haxby Road, York, YO91 1XY, UK abstract article info Available online 23 June 2012 Keywords: Disintegration Food tablets Dissolution Image analysis Flow cell Glucose syrup One of the aims in the food industry is to produce fast dissolving products. The dissolution of tablets in water is often accompanied with disintegration which is the process of breaking up the tablet into smaller fragments. Disintegration increases the dissolution rate by increasing the surface area available for dissolution to occur. Such a process is helped by the use of disintegrants which are widely used in the pharmaceutical industry. The aim of this work is to investigate whether disintegrants could be introduced in a food system to improve the overall reconstitution of food powders. For this purpose, a food grade disintegrant was selected to be introduced into tablets of maltodextrin which is a food model product. To provide further understanding of the disintegra- tion process, a novel characterization method has been developed. It combines the implementation of a new experimental setup based on a flow cell, where images of the disintegration process are captured, together with the use of an image analysis programme. This approach allows the determination of both the tablet dimen- sions and the size of the disintegrates, i.e. the particles released during disintegration, with time. Such knowledge is important in identifying the stages of the reconstitution process when the disintegrant's action becomes effective. The results based on the system described above show that particles released in the presence of disintegrants are not only more important in number, but also their mean size is larger. This results in the fact that maltodextrin tablets are reduced in size faster in presence of disintegrants, up to 20% in this case. © 2012 Elsevier B.V. All rights reserved. 1. Introduction In the food industry the consumers' expectations regarding product quality is extremely high. It is required that the complete reconstitution of the product in water is fast. Thus research and development in the food industry have focused on how to reduce the dissolution time. The dissolution is a multistep process starting with wetting and followed by a combination of transport of water and solid material into and out of the tablet resulting in the transformation of the solid into a solute state [1,2]. The dissolution is often accompanied by disinte- gration which is the process of breaking up the tablet into smaller pieces. This process increases the dissolution rate by increasing the surface area available for dissolution to occur. Such a process is supported by the use of disintegrants. Disintegrants have been lately introduced to the food industry, mainly in the formulation of nutraceu- tical products. Disintegration has been extensively studied in the pharmaceutical in- dustry. However, these studies have mainly focused on quantifying the time required for a particular formulation to disintegrate as a function of different parameters: tablet strength, disintegrant concentration and porosity [3,4]. Few papers relate the mechanisms involved in the disinte- gration process and try to understand the type of forces which are implied to overcome the bonding force inside a tablet. Several mechanisms of disintegrants have been postulated, but their effect is still not well understood [3]. The different possible mechanisms which have been reported are: Swelling: disintegrant particles swell in contact with water and in- duce stress inside the matrix causing it to break down [3,5,6]. This mechanism is apparently the most widely accepted for tablet dis- integration as most of the disintegrants swell in contact with water but to different degrees [7,8]. Wicking: The definition of this possible mechanism differs from different authors and is thus still not very clear. Krausbauer et al. [9] describes the wicking effect as the creation of a path by the dis- integrant grains for water to penetrate the tablet. Luginbuhl and Leuenberger [10] explain that water would be pulled into pores by disintegrant but do not explain the reasons why. Melia and Davis [11] suggest that wicking results from the fibrous structure of some type of disintegrants which would conduct the water within the tablet. The resulting capillary forces would separate the particles apart by overcoming the adhesions forces. Powder Technology 238 (2013) 27–34 ⁎ Corresponding author. E-mail address: a.d.salman@sheffield.ac.uk (A.D. Salman). 0032-5910/$ – see front matter © 2012 Elsevier B.V. All rights reserved. doi:10.1016/j.powtec.2012.06.038 Contents lists available at SciVerse ScienceDirect Powder Technology journal homepage: www.elsevier.com/locate/powtec
Transcript of A novel method to quantify tablet disintegration

Powder Technology 238 (2013) 27–34
Contents lists available at SciVerse ScienceDirect
Powder Technology
j ourna l homepage: www.e lsev ie r .com/ locate /powtec
A novel method to quantify tablet disintegration
Xavier Mesnier a, Tim O. Althaus b, Laurent Forny b, Gerhard Niederreiter b, Stefan Palzer c,Mike J. Hounslow a, Agba D. Salman a,⁎a Department of Chemical and Biological Engineering, University of Sheffield, Mappin Street, Sheffield, S1 3JD, UKb Food Science and Technology Department, Nestlé Research Centre, Vers-Chez-Les-Blanc CH-1000 Lausanne 26, Switzerlandc Nestlé Product Technology Centre York, Haxby Road, York, YO91 1XY, UK
⁎ Corresponding author.E-mail address: [email protected] (A.D. Salm
0032-5910/$ – see front matter © 2012 Elsevier B.V. Alldoi:10.1016/j.powtec.2012.06.038
a b s t r a c t
a r t i c l e i n f oAvailable online 23 June 2012
Keywords:DisintegrationFood tabletsDissolutionImage analysisFlow cellGlucose syrup
One of the aims in the food industry is to produce fast dissolving products. The dissolution of tablets in water isoften accompanied with disintegration which is the process of breaking up the tablet into smaller fragments.Disintegration increases the dissolution rate by increasing the surface area available for dissolution to occur.Such a process is helped by the use of disintegrants which are widely used in the pharmaceutical industry.The aim of this work is to investigate whether disintegrants could be introduced in a food system to improve theoverall reconstitution of food powders. For this purpose, a food grade disintegrant was selected to be introducedinto tablets of maltodextrin which is a food model product. To provide further understanding of the disintegra-tion process, a novel characterization method has been developed. It combines the implementation of a newexperimental setup based on a flow cell, where images of the disintegration process are captured, togetherwith the use of an image analysis programme. This approach allows the determination of both the tablet dimen-sions and the size of the disintegrates, i.e. the particles released during disintegration, with time. Such knowledgeis important in identifying the stages of the reconstitution processwhen the disintegrant's action becomes effective.The results based on the system described above show that particles released in the presence of disintegrants arenot only more important in number, but also their mean size is larger. This results in the fact that maltodextrintablets are reduced in size faster in presence of disintegrants, up to 20% in this case.
© 2012 Elsevier B.V. All rights reserved.
1. Introduction
In the food industry the consumers' expectations regarding productquality is extremely high. It is required that the complete reconstitutionof the product in water is fast. Thus research and development in thefood industry have focused on how to reduce the dissolution time.The dissolution is a multistep process starting with wetting andfollowed by a combination of transport of water and solid materialinto and out of the tablet resulting in the transformation of the solidinto a solute state [1,2]. The dissolution is often accompanied by disinte-gration which is the process of breaking up the tablet into smallerpieces. This process increases the dissolution rate by increasing thesurface area available for dissolution to occur. Such a process issupported by the use of disintegrants. Disintegrants have been latelyintroduced to the food industry, mainly in the formulation of nutraceu-tical products.
Disintegration has been extensively studied in the pharmaceutical in-dustry. However, these studies have mainly focused on quantifying thetime required for a particular formulation to disintegrate as a function
an).
rights reserved.
of different parameters: tablet strength, disintegrant concentration andporosity [3,4]. Few papers relate the mechanisms involved in the disinte-gration process and try to understand the type of forceswhich are impliedto overcome the bonding force inside a tablet.
Several mechanisms of disintegrants have been postulated, buttheir effect is still not well understood [3]. The different possiblemechanisms which have been reported are:
Swelling: disintegrant particles swell in contact with water and in-duce stress inside the matrix causing it to break down [3,5,6]. Thismechanism is apparently the most widely accepted for tablet dis-integration as most of the disintegrants swell in contact withwater but to different degrees [7,8].Wicking: The definition of this possible mechanism differs fromdifferent authors and is thus still not very clear. Krausbauer et al.[9] describes the wicking effect as the creation of a path by the dis-integrant grains for water to penetrate the tablet. Luginbuhl andLeuenberger [10] explain that water would be pulled into poresby disintegrant but do not explain the reasons why. Melia andDavis [11] suggest that wicking results from the fibrous structureof some type of disintegrants which would conduct the waterwithin the tablet. The resulting capillary forces would separatethe particles apart by overcoming the adhesions forces.
28 X. Mesnier et al. / Powder Technology 238 (2013) 27–34
Deformation: When exposed to moisture, particles in the tabletswell to precompression size leading to localised stresses. Thismechanism differs from swelling by the fact that the stress is notonly due to the use of disintegrants [10].Repulsion: when water is drawn into pores, due to capillary actionor due to the disintegrant, repulsive electrical forces would be cre-ated which lead to particle repulsion [10]. However, this lastmechanism has not been well supported by researchers as pointedout by Zhao and Augsburger [8].
It can be assumed that not only one of these mechanisms is takingpart in the disintegration process but also several acting simulta-neously. Despite all the theories which have been proposed, there isstill a lack of understanding of the mechanism of disintegration.
When comparing and studying the efficiency of different types ofdisintegrants, two main techniques have been used. Firstly, the disin-tegration time is determined using a tablet disintegration tester unitaccording to the US or European pharmacopoeia method [10,12]. Inthis test tablets are placed on a mesh at different temperatures andagitation intensity in a fixed volume of liquid. The disintegrationtime is determined as the time for the tablet to disintegrate andpass through the mesh screen. This technique provides a disintegra-tion time which is useful when comparing different formulations.However, it does not provide any explanation on the mechanisms im-plied in the disintegration of tablets.
Secondly, many authors tried to relate the disintegration processwith the amount of water penetrating into the tablet with time[10,13,14]. Tablets are located on a porous holder above a liquid.The liquid penetration from the bottom is followed with time byuse of an image system (water is usually dyed to help the image anal-ysis) or by weighing the amount of water leaving the solution whenpenetrating the tablet. Usually, data is analysed using the Washburnequation to describe the capillary flow in the tablet pores. The deter-mination of the wetting kinetics has been reported to depend on theporosity of the tablet and wettability of the pores for non dissolvingmaterial [10].
Experimental techniques used to study disintegration providevery little information on the physics behind the process. In addition,dissolution and disintegration have been mainly studied separatelywhereas they should be considered together as they are happening si-multaneously and affecting each other.
One of themost intrinsic characteristics of the disintegration processis the breaking up of the tablet into pieces, which does not always cor-respond to the primary particles which have been compressed. The sizeand number of these fragments will determine the dissolution speed incase of a surface limited dissolution process. Moreover, the number andsize of the fragments will be dependent on several parameters such astablet strength, porosity, disintegrant concentration and type. However,such data were experienced to be difficult to gather by other authors. Itwas reported by Zhao and Augsburger [8] that they have made severalunsuccessful attempts to obtain direct measurements of the size distri-bution of particles during disintegration. Methods such as opticalmicroscopy, laser scattering and sieving were tried in the case of anon dissolving matrix.
The aim of this paper is to introduce a novel method to investigatethe disintegration of food tablets. By being able to quantify the sizedistribution of the disintegrates, i.e. particles released during tabletdisintegration, it is foreseen that further knowledge of this processwill be gained.
This paper is separated in two parts. Firstly the type of dis-integrant chosen in this study is characterised in order to determineand understand the mechanisms by which it induces tablet disinte-gration. The second part introduces a new approach to study disinte-gration by the analysis of the size distributions of the particlesreleased as a function of time. The methods and image analysis arepresented together with the first results.
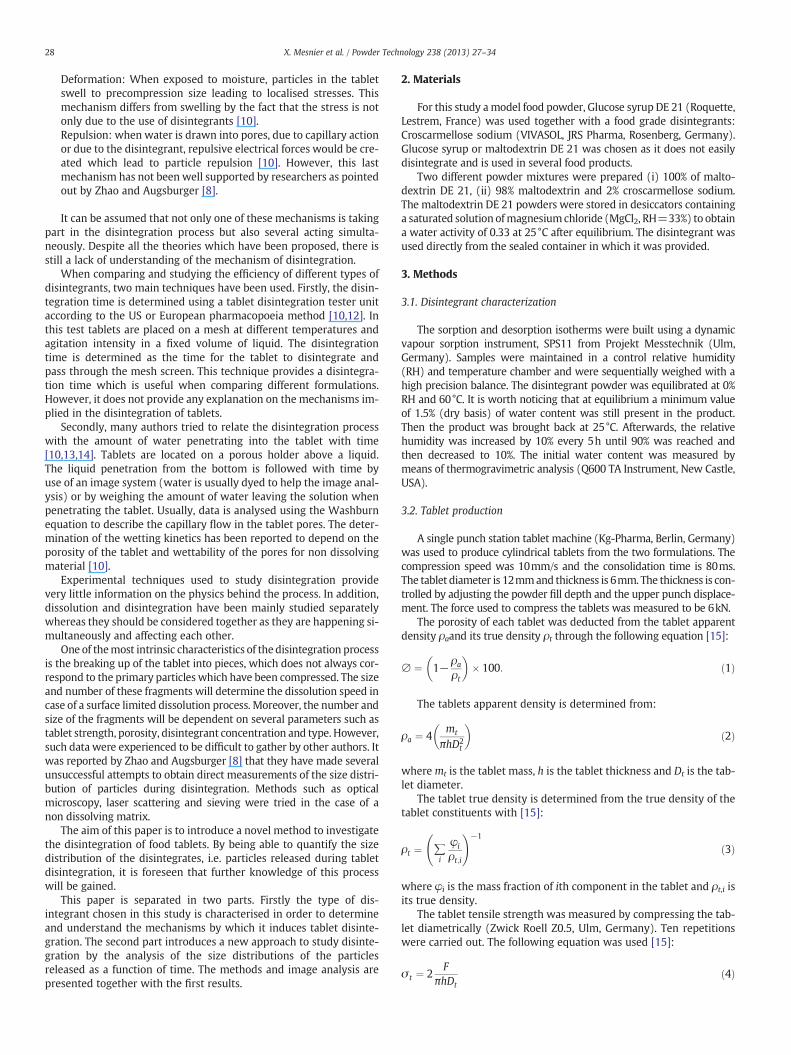
2. Materials
For this study amodel food powder, Glucose syrup DE 21 (Roquette,Lestrem, France) was used together with a food grade disintegrants:Croscarmellose sodium (VIVASOL, JRS Pharma, Rosenberg, Germany).Glucose syrup or maltodextrin DE 21 was chosen as it does not easilydisintegrate and is used in several food products.
Two different powder mixtures were prepared (i) 100% of malto-dextrin DE 21, (ii) 98% maltodextrin and 2% croscarmellose sodium.The maltodextrin DE 21 powders were stored in desiccators containinga saturated solution ofmagnesiumchloride (MgCl2, RH=33%) to obtaina water activity of 0.33 at 25°C after equilibrium. The disintegrant wasused directly from the sealed container in which it was provided.
3. Methods
3.1. Disintegrant characterization
The sorption and desorption isotherms were built using a dynamicvapour sorption instrument, SPS11 from Projekt Messtechnik (Ulm,Germany). Samples were maintained in a control relative humidity(RH) and temperature chamber and were sequentially weighed with ahigh precision balance. The disintegrant powder was equilibrated at 0%RH and 60°C. It is worth noticing that at equilibrium a minimum valueof 1.5% (dry basis) of water content was still present in the product.Then the product was brought back at 25°C. Afterwards, the relativehumidity was increased by 10% every 5h until 90% was reached andthen decreased to 10%. The initial water content was measured bymeans of thermogravimetric analysis (Q600 TA Instrument, New Castle,USA).
3.2. Tablet production
A single punch station tablet machine (Kg-Pharma, Berlin, Germany)was used to produce cylindrical tablets from the two formulations. Thecompression speed was 10mm/s and the consolidation time is 80ms.The tablet diameter is 12mmand thickness is 6mm. The thickness is con-trolled by adjusting the powder fill depth and the upper punch displace-ment. The force used to compress the tablets was measured to be 6kN.
The porosity of each tablet was deducted from the tablet apparentdensity ρaand its true density ρt through the following equation [15]:
∅ ¼ 1−ρa
ρt
� �� 100: ð1Þ
The tablets apparent density is determined from:
ρa ¼ 4mt
πhD2t
� �ð2Þ
wheremt is the tablet mass, h is the tablet thickness and Dt is the tab-let diameter.
The tablet true density is determined from the true density of thetablet constituents with [15]:
ρt ¼ ∑i
φi
ρt;i
!−1
ð3Þ
where φi is the mass fraction of ith component in the tablet and ρt,i isits true density.
The tablet tensile strength was measured by compressing the tab-let diametrically (Zwick Roell Z0.5, Ulm, Germany). Ten repetitionswere carried out. The following equation was used [15]:
σ t ¼ 2F
πhDtð4Þ

Fig. 2. Typical image generated using the flow cell during tablet dissolution in water.
29X. Mesnier et al. / Powder Technology 238 (2013) 27–34
where σt is the tablet tensile strength, and F is the tablet crushingforce.
3.3. Dissolution time
The tablet dissolution time was measured by means of electricalconductivity in 40ml of distilled water at 50°C. A magnetic stirrer at700rpm was used to agitate the solution. The tablet was placed in amini basket to maintain its position constant from measurement tomeasurement. The time at which 90% of the tablet is dissolved t90 isused to compare the dissolution time of the different tablets. Theaverage of 5 repetitions is presented as well as the standard deviation.
3.4. Novel technique to study tablet disintegration and dissolution
The technique which was designed for this study is able to captureon-line the size of particles and their number instantaneously afterbeing released due to disintegration of tablets in water.
A flow cell was designed and built specifically for this study, asshown in Fig. 1. The flow cell is constituted of a cylindrical shape con-taining a mesh on which the tablet rests during dissolution. A flatimaging window was built as shown in Fig. 1 by polishing the roundsurface. In front of the imaging window a camera was placed and cap-tured images of both the tablet and the particles being detachedduring the dissolution. The water is introduced from the bottom andexit by the upper part. Different flow rates can be applied. The factthat the water is directed from the bottom of the tablet ensures thatall the particles which are being released are directed in the same direc-tion to guarantee that particles do not repass in front of the imagingwindow and are not counted several times. The lower part is filledwith 1mm glass beads to allow a uniform flow to be created aroundthe tablet. The overall system is placed in a light box with uniformand constant lighting.
The optical system is able to take images of 16Mpixel at a rate of10images per second. With such a system, particles whose diameter is100μm can be characterised with 80pixels. Fig. 2 shows an exampleof a typical image which is generated during the disintegration process.
3.5. Image analysis
A programme based on the Matlab image toolbox was written tofollow the tablet size reduction and the size distributions of the parti-cles released from the tablet as a function of time.
Fig. 1. Flow cell.
A colour image is obtained from the digital camera and then trans-formed into an 8bit grayscale image. The image is then thresholded toobtain a binary representation of the image (see Fig. 3). From thebinary image, single objects can be separated from each other. Oneobject is recognised as a connection of pixels with a value of one (0 isthe background). The area of each object in pixels square is obtained.Knowing the translation from pixel to μm obtained from the use of aruler (in mm) within the flow cell, the area can be easily converted toμm2. The conversion was checked by inserting non dissolving particles(glass beads) of a known size in the flow cell.
In addition the perimeter of each object is determined and com-pared to the object area to ensure that bubbles which are formedfrom the gas entrapped in the tablet matrix are not considered asparticles.
After selecting the tablet boundaries as shown in Fig. 4, the foursides of the tablets (top, bottom, left and right) are separated. Thelimits of the four sides are determined at the inflexion of the frequen-cy curves of the number of pixels along the X and Y axes. The tabletwidth and thickness are determined as the distance between theaverage coordinates of respectively the left and right sides (width),and the top and bottom (thickness).
4. Results and discussion
4.1. Disintegrant characterization
Fig. 5 shows the evolution of the size of a granule of croscarmellosesodiumwhen a droplet of diedwater is added. First the water is quicklyabsorbed (less than a 1s) which is followed by the fast swelling of theparticle. It can be seen from this images that swelling is going to bethe main mechanisms by which croscarmellsoe sodium is going toinduce tablet disintegration. In addition, the fast absorption of watermay favour a quick penetration of water within the tablet.
Fig. 6 shows the sorption and desorption isotherms of croscarmellosesodium. A hysteresis can be seen between the sorption and desorption ofwater. Several reasons can be formulated to explain this difference.Kachrimanis et al. [16] summarised the hysterisis phenomenon to be
Fig. 3. Binary image obtained from Fig. 2 after thresholding (white— tablet and particlesand black — background).

Fig. 6. Sorption and desorption isotherms of water at 25°C.Fig. 4. Description of the determination of the tablet side limits.
30 X. Mesnier et al. / Powder Technology 238 (2013) 27–34
due to two possible effects; the ink bottle effect and swelling. The inkbottle effect, which happens with small pore entrance and large volumebeyond the entrance, is typically used to explain hysteresis at relativehumidities higher than 75%, whilst at lower water activities swellingwould be the reason. In addition it can be thought that a possiblecollapse of the microstructure, a change in supramolecular structure(crystallisation) or structural relaxations can lead to such hysteresis.
After observation under polarised light, croscarmellose sodiumshows birefringence which is a characteristic of a crystalline struc-ture. In addition, swelling of the powder was observed visuallywhich shows that the powder is semi-crystalline confirming theproperties of crystalline and amorphous materials.
A close look at the chemical structure of croscarmellose sodium(Fig. 7) shows that it is a crosslinked derivative of cellulose. Cross-linkingprovides the non-dissolving capacity to the molecule by hindering thechain separation and polymer diffusion into the solvent. However, the
Fig. 5. Evolution of the size of a croscarmellose sodium g
swelling of croscarmellose sodium is made possible due to the bondingof water in between the polymer chains [17]. The carboxyl groups offermore sites for water to bond with the molecule. This increases its affin-ity with water over a typical cellulose molecule. During the sorption ofwater, bonds are created and the system passes to the rubbery state.However, when desorbing water, the outer layer endures a phase tran-sition back to the glassy state. In the glassy state, the diffusion rate ofwater is slower. Thus more time would be needed to reach the sameequilibrium level as during sorption. It leads to the fact that less wateris removed for a same water activity.
The fact that a semi-crystalline material absorbs a large amount ofwatermay be also explained by the presence ofmicropores at the surfaceof the particles. Scanning electron microscopy (SEM) was conducted onthe powders to have a better understanding of themacroscopic structureof the powders. As seen in Fig. 8, croscarmellose sodium has a fibrous
ranule with time when a droplet of water is added.

Fig. 7. Chemical structure of croscarmellose sodium (JRS Pharma, Rosenberg, Germany).
31X. Mesnier et al. / Powder Technology 238 (2013) 27–34
structure, i.e. straw-like particles. Similar structure was mentioned byThibert and Hancock [18]. It was expected that the particles contain mi-cropores inwhichwaterwould be absorbed. However, a close inspectionat higher magnification shows that the particle surface is rather uniformand does not seem to contain pores of micrometre size. Nevertheless,when looking at the ends of the straw-like fibres, a different structurecan be noticed as shown in Fig. 9. It appears that pores orientated parallelto the length of the fibres are present. It can be assumed that waterwould penetrate the particles from these straw ends. In addition, itwould be possible that nanopores could be present but not visible atsuch magnification. Pores of nanosize were discovered by Faroongsarngand Peck [19] through the use of differential scanning calorimetry.
4.2. Disintegration and dissolution studies
The tablet strength for both tablet formulations (with or withoutdisintegrant) was determined to ensure that no difference in strengthwould affect the dissolution behaviour. For both formulations thetablet strength was similar; a value of 2.3 (±0.7)MPa was obtainedin the case of pure maltodextrin tablet and a value of 2.3MPa (±0.9)when 2% of disintegrant was incorporated. This is not a significantdifference and it should not have any influence on the dissolution be-haviour. For both formulations the calculated porosities are very similarand are close to 0.27. Indeed, the fraction of disintegrant in the formula-tion is low, only 2% which did not seem to have an impact on thecompactability of the powder, and the true density of the twomaterialsare similar as presented in Table 1.
Fig. 8. SEM picture of croscarmellose sodium particles.
The dissolution profiles of the two types of tablets obtained fromconductivity measurements are presented in Fig. 10. The curvesrepresent the average of five repetitions and the error bars show thestandard deviation. It can be clearly seen that the tablets containing2% of croscarmellose sodium dissolve faster. The dissolution time t90for tablets of pure maltodextrin is 201s whereas the dissolution timet90 for tablets containing the disintegrants is 230s.
However, very few information about the reasons for the fasterdissolution can be deducted from Fig. 10. The results obtained fromthe novel technique developed for this study can provide us moreunderstanding of both dissolution and disintegration processes.
The evolution of the normalised tablets thickness and width withtime (during dissolution) is plotted in Fig. 11a and b. Each pointrepresents the average of 5 repetitions and the calculated standarddeviation is represented by the error bars. It can be clearly seen thatthe dimensions of the tablets containing disintegrant are decreasingfaster than the dimensions of tablets made of pure maltodextrin. Itseems, in the case where disintegrant is included in the tablets, thatthe rate at which the thickness is decreasing is constant up to a point(around 90s) where another regime starts. In this second part,the slope increases which could be the result of the action of thedisintegrants.
It is important to notice that no swelling (increase in size) wasmeasured. It has been mentioned by Papedimitriou et al. [20] thatmaltodextrin is a polymer which does not swell in contact withwater. Even in the presence of a disintegrant, which has swellingproperties the thickness of the tablet does not increase, for the usedconcentration of disintegrant.
Fig. 11b presents the evolution of the tablet width with time. Inthis case, again, the rate of change in size is faster for the tablets con-taining disintegrants. When looking carefully at the curves it seemsthat in both cases after a certain period of time (around 120s) theslopes tend to slightly increase. This phenomenon seems to be dueto the fact that the tablet structure is collapsing under its own weight.It could be a result of the increase in weight of the tablet resultingfrom the penetration of water inside the structure, linked to the rup-ture of interparticulate bonding due to internal dissolution. It seemsto indicate that from a cylindrical form at the beginning the shapetransforms into a disc with similar diameter but very low thickness.
Further insight into the dissolution process can be achievedthrough the study of the disintegration process. The disintegrationis followed, as previously explained, by analysing the size distributionof the particles leaving the tablet.
The particle size distributions obtained from the disintegration ofthe pure maltodextrin tablet and of the tablet containing disintegrantare presented in Fig. 12.
The first important result to notice is that even if no disintegrant isintroduced in the tablets, particles are being detached from the tablet.This phenomenon is termed erosion. In this paper erosion refers tothe process of material loss from the surface of the tablet due to

Fig. 9. SEM of the straw ends of croscarmellose sodium particles.
32 X. Mesnier et al. / Powder Technology 238 (2013) 27–34
rupture of particle bonding and rupture of polymer chains, asexplained by Siepman et al. [21].
As shown in Fig. 12, in the case where the tablet was made of puremaltodextrin, the diameter of the particles released during disinte-gration is comprised of between about 50 and 225μm. However,most of the particles are below 150μm. In the case of the tablets
Fig. 10. Dissolution profiles of tablets made of 100% maltodextrin DE 21 and maltodex-trin DE 21 containing 2% of disintegrant (croscarmellose sodium).
containing 2% of disintegrant, the diameter of the particles comprisesbetween 50 and 300μm.
The main difference obtained from the comparison of particle sizedistributions in the presence or absence of disintegrant is the highernumber of particles in the large size classes in the presence ofdisintegrants.
In addition, the frequency distribution of the maltodextrin prima-ry particles stored at aw=0.3 is plotted as shown in Fig. 12. 80% of theprimary particles have a diameter less than 50μm which seems to bethe smallest particle size detected in the experimental work. Trialson particles of 20 and 30μm diameters were carried out during thesetting up of the experimental technique to ensure the possibledetection of small particles. It confirms that such small particles couldbe detected, but were not in these experiments.
It appears then to indicate that for both type of tablets, largeraggregates than the primary particles are liberated. Those aggregatesmight result from the compression where different types of bondingare created. The exact type of bonding is not known, but accordingto Pitt and Sinka [22], the most important bonding forces in tablettingare Van der Waals forces. In addition, it can be thought that liquidbridges and sintering might occur as suggested by Palzer [23]. Thus,
Table 1True densities of glucose syrup DE21 and croscarmellose sodium.
Materials True densities (g·cm−3)
Glucose syrup DE21 1.534Croscarmellose sodium 1.5940

Fig. 11. a. Variation of tablet thickness with time for tablets made of 100% maltodextrinDE 21 and maltodextrin DE 21 containing 2% of disintegrant (croscarmellose sodium).b. Variation of tablet diameter with time for tablets made of 100% maltodextrin DE 21and maltodextrin DE 21 containing 2% of disintegrant (croscarmellose sodium).
33X. Mesnier et al. / Powder Technology 238 (2013) 27–34
depending on the type of bonding present in the tablet, it is possiblethat the stress created by disintegrant will lead to the breakage intodifferent sizes of particles.
Fig. 12. Density distribution of the particles liberated during the disintegration of tabletsof maltodextrin DE21 and tablets of maltodextrin DE21 containing 2% of disintegrants(croscarmellose sodium) obtained for the first 150s.
In the presence of disintegrants, the number of particles which arereleased after 150s is higher. 2500 particles were counted in the casedisintegrants were included in the tablet against 1950 particles in theabsence of disintegrant. In addition the mean size of the particlereleased in presence of disintegrant is bigger as seen in Fig. 12. Thiscould be explained by the fact that during disintegration, the stresscreated inside the tablet allows larger particles to be detached fromthe tablet.
As it can be seen in Fig. 13, the disintegration in presence ofdisintegrant leads to the liberation of large particles in the timescale 90–150s. This corresponds to the period of time where a differ-ent regime in the thickness reduction was observed (Fig. 11a). Severalreasons could be formulated to explain this phenomenon. Firstly, thediffusion coefficient of water would increase as more and more waterpenetrates the tablet. Secondly, it is well known that the tablet densi-ty is not uniform within a tablet [24]. There is a gradient of densityalong the height of the tablet. Further away from the top and bottomsurface the density decreases. This results in a superior porosityfavourable for water penetration. Finally, one of the main reasonscould be that water finally reaches the disintegrant particles insidethe tablet and their mechanism can be activated.
It is possible to determine the rate of change in volume of thetablet with time and compare it with the sum of the volume of particleswhich are released from the tablet. This comparison can provide infor-mation on what role the disintegration has on the decrease in tabletvolume and the overall dissolution process.
The variation of tablet volume (V) with time can be determined asfollow:
dVdt
¼d πr2h 1−εð Þ� �
dtð5Þ
with ε the tablet porosity and radius r.The sum of the volume of the particles Vparticles,tot leaving the tablet
can be expressed as follow:
Vparticles; tot ¼XNn¼1
Vn: ð6Þ
Fig. 14 shows the ratio of tablet volume reduction due to the dis-integration of the tablets. The ratio was plotted for four differenttimes; 37.5, 75, 112.5 and 150s. It can be seen that for the first two
Fig. 13. Variation of the number of the particles liberated during the disintegration oftablets of maltodextrin DE21 containing 2% of disintegrant (croscarmellose sodium)plotted for two different times: particles liberated from the start to 90s, and particleliberated after 90s to 150s.

Fig. 14. Evolution of ration of tablet volume reduction due to disintegration with timefor tablets of maltodextrin DE21 and tablets of maltodextrin DE21 containing 2% ofdisintegrants (croscarmellose sodium).
34 X. Mesnier et al. / Powder Technology 238 (2013) 27–34
times, 37.5 and 75s, the ratio of volume reduction due to disintegra-tion is similar and close to 0, in presence or absence of disintegrant inthe formulation. It can be supposed for this period only erosionhappens at the surface of the tablets for both types of formulations.However, for times 75 and 150s, the proportion of volume reductiondue to disintegration increases for both formulation. In the case wheredisintegrant is used, up to 30% of the volume reduction is due to disin-tegration after 150s whilst only 15% is for pure tablets of maltodextrin.The fact that disintegration and erosion increase might be linked tothe water penetration within the tablet matrix. Water starts to breakbonds between particles and they can be released. In the case wheredisintegrants are present in the matrix, water can access them andtheir disintegrating action is activated. It means that more bondsbetween particles are broken and thus more particles are released.This idea is supported by the fact that more particles are released inthe timescale of 75 to 150s than between 0 and 75s, as shown in Fig. 13.
Finally, it should be mentioned that those results are specific tothe tabletting parameters used in this study. Indeed, parameterssuch as compression force, dwelling time, and water content willinfluence both the ability of water to reach the disintegrants withinthe tablets and also inter-particle bond strength.
5. Conclusion
In this paper, a novel method to study tablet disintegration hasbeen presented. At this stage it shows that it is possible to determinethe size distribution of the particles liberated during the disintegra-tion of food tablets. Thus, it has been shown that different particlesize distributions were obtained in the presence or absence ofdisintegrants. In addition, by plotting the size distribution at differenttimes of the disintegration process, it can be seen that different sizesof particles are released.
It is hypothesised that the action of the disintegrant is activatedafter a specific lapse of time which is required for water to penetratethe tablet and reach the disintegrant particles. In addition, it was pro-posed that the water would penetrate the disintegrants particles bypores present at the ends of the particles, as seen on the scanningelectron images.
Further work including the use of different disintegrant concen-trations and types will be carried out to gain additional knowledgeabout the action of the disintegrants on the disintegration process.
Acknowledgements
The authors would like to thank Martine Rouvet from the NestleResearch Centre in Lausanne, Switzerland for taking the SEM images.Thanks goes to the technicians of the Department of Chemical andBiological Engineering of the University of Sheffield; Stuart Richards,Mark McIntosh, Oz McFarlane and Clifton Wray, for building theflow cell.
References
[1] Marabi, A, 2008. Dissolution of food powders Processes and modeling. PhD thesis.Hebrew University of Jerusalem.
[2] M. Lazghab, K. Saleh, I. Pezron, P. Guigon, L. Komunjer, Wettability assessment offinely divided solids, Powder Technology 157 (2005) 79–91.
[3] J. Fukami, E. Yonemochi, Y. Yoshihashi, K. Terada, Evaluation of rapidly dis-integrating tablets containing glycine and carboxymethylcellulose, InternationalJournal of Pharmaceutics 310 (2006) 101–109.
[4] Å.E.K. Lundqvist, F. Podczeck, J.M. Newton, Influence of disintegrant type andproportion on the properties of tablets produced from mixtures of pellets, Inter-national Journal of Pharmaceutics 147 (1997) 95–107.
[5] C.D. Melia, S.S. Davis, Review article: mechanisms of drug release from tablets andcapsules. 2. Dissolution, Alimentary Pharmacology & Therapeutics 3 (1989)513–525.
[6] W. Weitschies, V. Hartmann, R. Grützmann, J. Breitkreutz, Determination of thedisintegration behavior of magnetically marked tablets, European Journal ofPharmaceutics and Biopharmaceutics 52 (2001) 221–226.
[7] R.K. Chang, M. Shinwari, M. Leonzio, L.S. Wu, J. Pang, M.A. Hussain, Evaluation ofthe disintegrant properties for an experimental, crosslinked polyalkylammoniumpolymer, International Journal of Pharmaceutics 173 (1998) 87–92.
[8] N. Zhao, L.L. Augsburger, The influence of granulation on super disintegrantperformance, Pharmaceutical Development and Technology 11 (2006) 47–53.
[9] E. Krausbauer, M. Puchkov, G. Betz, H. Leuenberger, Rational estimation of theoptimumamount of non-fibrous disintegrant applying percolation theory for binaryfast disintegrating formulation, Journal of Pharmaceutical Sciences 97 (2008)529–541.
[10] R. Luginbühl, H. Leuenberger, Use of percolation theory to interpret water uptake,disintegration time and intrinsic dissolution rate of tablets consisting of binarymixtures, Pharmaceutica Acta Helvetiae 69 (1994) 127–134.
[11] C.D. Melia, S.S. Davis, Review article: mechanisms of drug release from tablets andcapsules. I: disintegration, Alimentary Pharmacology & Therapeutics 3 (1989)223–232.
[12] C. Ferrero, N. Muñoz, M.V. Velasco, A. Muñoz-Ruiz, R. Jiménez-Castellanos,Disintegrating efficiency of croscarmellose sodium in a direct compressionformulation, International Journal of Pharmaceutics 147 (1997) 11–21.
[13] T. Pesonen, P. Paronen, J. Ketolainen, Disintegrant properties of an agglomeratedcellulose powder, International Journal of Pharmaceutics 57 (1989) 139–147.
[14] N. Brielles, F. Chantraine, M. Viana, D. Chulia, P. Branlard, G. Rubinstenn, et al.,Dissolution of a surfactant-containing active porous material, Journal of Colloidand Interface Science 328 (2) (2008) 344–352.
[15] V. Chouk, B. Gururajan, G. Reynolds, M. Hounslow, A. Salman, Effect of internal lubri-cant on granule and tablet properties, In: International SymposiumonAgglomeration.Sheffield, UK, 2009.
[16] K. Kachrimanis, M.F. Noisternig, U.J. Griesser, S. Malamataris, Dynamic moisture sorp-tion and desorption of standard and silicified microcrystalline cellulose, EuropeanJournal of Pharmaceutics and Biopharmaceutics 64 (2006) 307–315.
[17] H. Schott, Kinetics of swelling of polymers and their gels, Journal of PharmaceuticalSciences 81 (5) (1992) 467–470.
[18] R. Thibert, B.C. Hancock, Direct visualization of superdisintegrant hydration usingenvironmental scanning electron microscopy, Journal of Pharmaceutical Sciences85 (1996) 1255–1258.
[19] D. Faroongsarng, G. Peck, Thermal porosity analysis of croscarmellose sodium andsodium starch glycolate by differential scanning calorimetry, AAPS PharmSciTech4 (2003) 531–538.
[20] E. Papadimitriou, M. Efentakis, N.H. Choulis, Evaluation of maltodextrins as excipientsfor direct compression tablets and their influence on the rate of dissolution, Interna-tional Journal of Pharmaceutics 86 (1992) 131–136.
[21] J. Siepmann, F. Siepmann, Mathematical modelling of drug delivery, InternationalJournal of Pharmaceutics 364 (2008) 328–343.
[22] K. Pitt, C. Sinka, Tabletting, In: in: A.D. Salman, M.J. Hounslow, J.P.K. Seville (Eds.),Granulation, Elsevier, Amsterdam, 2007, pp. 591–672.
[23] S. Palzer, Agglomeration of dehydrated consumer foods, In: in: A.D. Salman, M.J.Hounslow, J.P.K. Seville (Eds.), Granulation, Elsevier, Amsterdam, 2007, pp. 591–672.
[24] I.C. Sinka, S.F. Burch, J.H. Tweed, J.C. Cunningham,Measurement of density variationsin tablets using X-ray computed tomography, International Journal of Pharmaceutics271 (2004) 215–224.