Microstructural Characterization of Alkali-Activated ... - MDPI
14
Citation: Traven, K.; Wisniewski, W.; ˇ Cešnovar, M.; Ducman, V. Microstructural Characterization of Alkali-Activated Composites of Lightweight Aggregates (LWAs) Embedded in Alkali-Activated Foam (AAF) Matrices. Polymers 2022, 14, 1729. https://doi.org/10.3390/ polym14091729 Academic Editors: Ildiko Merta and José Ignacio Velasco Received: 22 March 2022 Accepted: 19 April 2022 Published: 23 April 2022 Publisher’s Note: MDPI stays neutral with regard to jurisdictional claims in published maps and institutional affil- iations. Copyright: © 2022 by the authors. Licensee MDPI, Basel, Switzerland. This article is an open access article distributed under the terms and conditions of the Creative Commons Attribution (CC BY) license (https:// creativecommons.org/licenses/by/ 4.0/). polymers Article Microstructural Characterization of Alkali-Activated Composites of Lightweight Aggregates (LWAs) Embedded in Alkali-Activated Foam (AAF) Matrices Katja Traven 1 , Wolfgang Wisniewski 1 , Mark ˇ Cešnovar 1,2 and Vilma Ducman 1, * 1 Slovenian National Building and Civil Engineering Institute (ZAG), Dimiˇ ceva 12, 1000 Ljubljana, Slovenia; [email protected] (K.T.); [email protected] (W.W.); [email protected] (M. ˇ C.) 2 International Postgraduate School Jožef Stefan, Jamova 39, 1000 Ljubljana, Slovenia * Correspondence: [email protected] Abstract: Alkali-activated composites of lightweight aggregates (LWAs, with beneficial insulating properties) and alkali-activated foams (AAFs, higher added value products due to their production from waste materials at well below 100 ◦ C) allow for the expectation of superior properties if a chemical bonding reaction or mechanical interlocking occurs during production. However, the interfaces between LWAs and an AAF have not been studied in detail so far. Chemical reactions are possible if the LWA contains an amorphous phase which can react with the alkaline activators of the AAF, increase the bonding, and thus, also their mechanical strengths. These, in turn, allow for an improvement of the thermal insulation properties as they enable a further density reduction by incorporating low density aggregates. This work features a first-detailed analyses of the interfaces between the LWAs’ expanded polystyrene, perlite, expanded clay and expanded glass, and the alkali-activated foam matrices produced using industrial slags and fly ash. Some are additionally reinforced by fibers. The goal of these materials is to replace cement by alkali-activated waste as it significantly lowers the environmental impact of the produced building components. Keywords: alkali-activated foam (AAF); lightweight aggregate (LWA); mechanical properties; ther- mal insulation; LWA–AAF interface 1. Introduction Because the building sector has been recognized to be one of the major contributors to global warming, finding alternatives to conventional building materials is receiving increasing attention. Alkali-activated materials (AAMs) present promising substitute materials as their lower energy demand during production causes a smaller CO 2 footprint. In the most general description, AAMs are inorganic systems consisting of two main components: a reactive solid precursor such as metakaolin, slags or ashes, and an alkaline activator solution such as Na 2 SiO 3 ,K 2 SiO 3 , NaOH, or KOH [1]. Adding a foaming agent to this basic mixture leads to materials denoted as alkali-activated foams (AAFs) [2,3]. AAFs represent higher added value products due to their low production temperature of well below 100 ◦ C, but still show properties comparable to foamed glasses or ceramics which are produced at above 900 ◦ C. AAFs can find various applications as catalysts, adsorbents, bone scaffold materials, filtration membranes, or thermal/acoustic insulators [2,4] and can be produced by different routes [2]. Of these, direct foaming is most commonly applied; here foaming agents such as Al, SiC, Si, NaOCl, FeSi alloys, NaBO 3 , or H 2 O 2 are added to the alkali-activated slurry to trigger a chemical reaction which releases gaseous products. The gasses are trapped in the material’s structure during hardening which results in a highly porous material [5,6]. Surfactants or stabilizing agents such as sodium oleate, sodium dodecyl sulfate, triton, or stearic acid are added to the slurry to stabilize the pores and control their size [7,8]. Polymers 2022, 14, 1729. https://doi.org/10.3390/polym14091729 https://www.mdpi.com/journal/polymers
-
Upload
khangminh22 -
Category
Documents
-
view
0 -
download
0
Transcript of Microstructural Characterization of Alkali-Activated ... - MDPI

Citation: Traven, K.; Wisniewski, W.;
Cešnovar, M.; Ducman, V.
Microstructural Characterization of
Alkali-Activated Composites of
Lightweight Aggregates (LWAs)
Embedded in Alkali-Activated Foam
(AAF) Matrices. Polymers 2022, 14,
1729. https://doi.org/10.3390/
polym14091729
Academic Editors: Ildiko Merta and
José Ignacio Velasco
Received: 22 March 2022
Accepted: 19 April 2022
Published: 23 April 2022
Publisher’s Note: MDPI stays neutral
with regard to jurisdictional claims in
published maps and institutional affil-
iations.
Copyright: © 2022 by the authors.
Licensee MDPI, Basel, Switzerland.
This article is an open access article
distributed under the terms and
conditions of the Creative Commons
Attribution (CC BY) license (https://
creativecommons.org/licenses/by/
4.0/).
polymers
Article
Microstructural Characterization of Alkali-ActivatedComposites of Lightweight Aggregates (LWAs) Embeddedin Alkali-Activated Foam (AAF) MatricesKatja Traven 1, Wolfgang Wisniewski 1 , Mark Cešnovar 1,2 and Vilma Ducman 1,*
1 Slovenian National Building and Civil Engineering Institute (ZAG), Dimiceva 12, 1000 Ljubljana, Slovenia;[email protected] (K.T.); [email protected] (W.W.); [email protected] (M.C.)
2 International Postgraduate School Jožef Stefan, Jamova 39, 1000 Ljubljana, Slovenia* Correspondence: [email protected]
Abstract: Alkali-activated composites of lightweight aggregates (LWAs, with beneficial insulatingproperties) and alkali-activated foams (AAFs, higher added value products due to their productionfrom waste materials at well below 100 ◦C) allow for the expectation of superior properties if achemical bonding reaction or mechanical interlocking occurs during production. However, theinterfaces between LWAs and an AAF have not been studied in detail so far. Chemical reactions arepossible if the LWA contains an amorphous phase which can react with the alkaline activators ofthe AAF, increase the bonding, and thus, also their mechanical strengths. These, in turn, allow foran improvement of the thermal insulation properties as they enable a further density reduction byincorporating low density aggregates. This work features a first-detailed analyses of the interfacesbetween the LWAs’ expanded polystyrene, perlite, expanded clay and expanded glass, and thealkali-activated foam matrices produced using industrial slags and fly ash. Some are additionallyreinforced by fibers. The goal of these materials is to replace cement by alkali-activated waste as itsignificantly lowers the environmental impact of the produced building components.
Keywords: alkali-activated foam (AAF); lightweight aggregate (LWA); mechanical properties; ther-mal insulation; LWA–AAF interface
1. Introduction
Because the building sector has been recognized to be one of the major contributorsto global warming, finding alternatives to conventional building materials is receivingincreasing attention. Alkali-activated materials (AAMs) present promising substitutematerials as their lower energy demand during production causes a smaller CO2 footprint.In the most general description, AAMs are inorganic systems consisting of two maincomponents: a reactive solid precursor such as metakaolin, slags or ashes, and an alkalineactivator solution such as Na2SiO3, K2SiO3, NaOH, or KOH [1]. Adding a foaming agent tothis basic mixture leads to materials denoted as alkali-activated foams (AAFs) [2,3]. AAFsrepresent higher added value products due to their low production temperature of wellbelow 100 ◦C, but still show properties comparable to foamed glasses or ceramics whichare produced at above 900 ◦C.
AAFs can find various applications as catalysts, adsorbents, bone scaffold materials,filtration membranes, or thermal/acoustic insulators [2,4] and can be produced by differentroutes [2]. Of these, direct foaming is most commonly applied; here foaming agents suchas Al, SiC, Si, NaOCl, FeSi alloys, NaBO3, or H2O2 are added to the alkali-activated slurryto trigger a chemical reaction which releases gaseous products. The gasses are trapped inthe material’s structure during hardening which results in a highly porous material [5,6].Surfactants or stabilizing agents such as sodium oleate, sodium dodecyl sulfate, triton,or stearic acid are added to the slurry to stabilize the pores and control their size [7,8].
Polymers 2022, 14, 1729. https://doi.org/10.3390/polym14091729 https://www.mdpi.com/journal/polymers
Polymers 2022, 14, 1729 2 of 14
However, several studies have shown that the compressive strength of AAFs, usuallyranging from 1 MPa–10 MPa with densities of 360–1400 kg/m3, decreases with a densityreduction independent of the production method or used additives [9,10]. Lightweightaggregates (LWAs) are construction materials with a reduced bulk density, and their keyphysical properties are their bulk density, specific gravity, unit weight, porosity, and waterabsorption [11]. They are widely applied for geotechnical fills, insulation products, soilengineering, hydroculture, drainage, roof gardens, or filters in several industries [12]. LWAscan either be produced using natural rock by crushing and sieving scoria, pumice, breccias,tuff, or volcanic cinders or by thermally treating naturally occurring materials (e.g., vermi-culite, clay, perlite, shale, slate) or industrial by-products (e.g., fly ash, blast furnace slag,industrial waste, sludge) [11]. Artificial LWAs can be manufactured by either expansionor agglomeration. Expansion, as in expanded glass, occurs when a material is heated to afusion temperature where it becomes pyro-plastic with a simultaneous formation of gas,released from added or intrinsic foaming agents. During agglomeration, the powderedmaterial is bound together by either sintering mechanisms or cold bonding processesincluding additive binders [13–16]. Currently, the most used and valued manufacturedLWAs from natural source materials are shale and expanded clay. However, LWAs can alsobe produced by applying the alkali-activation process to industrial waste such as fly ash,ground granulated blast slag, or rice husk ash [17]. A polymer LWA extensively used inbuilding and construction is expanded polystyrene (EPS). Its manufacturing process beginswith small polystyrene beads ca. 200 µm in diameter which are permeated with a foamingagent, most commonly pentane, and expanded using steam [15]. EPS is widely used inconstruction for external thermal insulation panels due to its energy efficiency, but it alsofinds application as the aggregate in lightweight concrete, decorative tiles and molding,panels, and embankment backfilling [16,18].
Several LWAs, such as recycled lightweight blocks [19], Petrit T [20], pumice aggre-gates [21], vermiculite [22], cork [23], Etna volcanic aggregates [24], and water reservoirsediments [25] have been combined with AAMs. Optimized foamed thermal insulationmaterials produced by the alkali-activation process using Na2SiO3 and unexpanded groundwaste, perlite, and rock wool showed a low thermal conductivity of 0.040–0.060 W/mK,a low density of 0.1–0.2 g/cm3, and compressive strengths from 0.09 to 0.60 MPa [26].Foamy alkali-activated materials have been produced from nonexpanded perlite and showa thermal conductivity of 0.030 W/mK, a compressive strength of 0.78 MPa, and superiorfire resistant properties, i.e., they are 100% noncombustible and categorized as the fireclass A1 [27]. A similar material (density 0.46 g/cm3, thermal conductivity 0.084 W/mK,compressive strength 1.6 MPa) was produced using expanded perlite and K2SiO3 as theactivator [28].
Environmentally friendly, lightweight foamed geopolymer composites have alsobeen produced as a thermal insulating material using H2O2 as the foaming agent, flyash and metakaolin as precursors, and expanded polystyrene as LWAs [29]. They showeddensities of 0.30 to 0.65 g/cm3, compressive strengths of 2.0 to 5.5 MPa, and thermalconductivities of 0.122 to 0.195 W/mK. [30]. Exposing fly ash-based geopolymer concretescontaining quartz aggregates or expanded clay to temperatures of up to 750 ◦C showedthat the dehydration of capillary water caused cracking accompanied by a loss of strengthbelow 300 ◦C whereas temperatures above 500 ◦C caused a sintering-promoted strengthincrease [31]. Monolithic geopolymer-expanded glass composites have been prepared forthe methylene blue removal from wastewaters [32]. Here, adding expanded glass positivelyaffected the removal efficiency.
Although composites of LWAs and cement are being applied on an industrial scale,composites of LWAs and AAMs are still under development. Adding LWAs to cementshas been shown to counteract shrinkage [33] and comparable benefits are to be expected inLWA–AAF composites. Replacing cements by AAMs and using waste materials as LWAssignificantly lowers the environmental impact of these materials. Superior properties canbe expected if a chemical bonding reaction or mechanical interlocking occurs between

Polymers 2022, 14, 1729 3 of 14
their components. This should increase their relative mechanical strength, allowing lowerdensities and with that, enhanced thermal isolation and lighter building components.
The interface between AAMs and aggregates has barely been analyzed and the litera-ture presenting such interfaces usually features dense AAMs and relatively dense aggre-gates as their interfacial transition zone (ITZ) is easier to analyze. Just as cements, AAMscan form a chemically and structurally modified ITZ to aggregates they are in contact with.The ITZ in an AAM was found to be comparably dense, free of unreacted binder grainsdue to the “wall effect” and composed of a Na2O–CaO–Al2O3–SiO2–H2O (N–C–A–S–H)gel [34]. A gradual enrichment of Si and Na has been measured at the interface to quartzsand aggregates spanning 20–50 µm [34]. Low Ca alkali-activated cements where the rawmaterials contained less than 4 wt% Ca did not form a discernible Ca-enriched ITZ [35].Another alkali-activated cement did contain high levels of Ca, but an enrichment at the ITZwas not detected [36].
The work presented here is aimed at developing and characterizing LWA–AAMcomposite materials competitive to some commercially available products. They areenergetically advantageous as they are manufactured below 100 ◦C and based on wastematerials instead of cement. The LWAs expanded glass (EG), expanded clay (EC), expandedpolystyrene (EPS), and expanded perlite (P) are included to reduce their overall densitiesand increase insulation while ensuring a sufficient mechanical strength. The performedanalyses provide a first insight of the detailed microstructure at the interface between thewell-known LWAs and an AAF. Furthermore, possible chemical interactions are analyzedand discussed.
2. Materials and Methods
Electric arc furnace slag (slag A), ladle slag (slag R), and fly ash (FA) were used asraw materials. The slags were received as aggregates from Slovenian metallurgical steeland iron plants and milled into powders with a grain size of less than 63 µm. Previouslycharacterized FA from a Slovenian thermal power plant containing akermanite-gehlenite,quartz, anhydrite, hematite, magnesioferrite, and mullite [37] was also used. It containedmore than 70 ma% of an amorphous phase suitable for alkali activation [37]. These rawmaterials were weighed using scale 1 (XPE205, Mettler-Toledo, Trzin, Slovenia, ±0.0001 g),heated to 950 ◦C for 1 h in a 25 mL Pt crucible and then weighed again to determine theirloss on ignition (LOI) components, which amounted to 14.15 ma% for slag A, 20.47 ma%for slag R, and 0.51 ma% for the FA.
The precursors “slag A-p”, “slag R-p” and “FA-p” were produced in batches containing0.946(9) g of the respective raw material and 9.469(0) g of the flux agent FX-X50-2 (i.e., 50%Li-tetraborate and 50% Li-metaborate, Fluxana GmbH & Co. KG, Bedburg-Hace, Germany)weighed using scale 1. Some of the mixture was placed in a 25 mL Pt crucible and heatedto 1100 ◦C in an XRF xrFuse1 electric furnace (Thermo Fisher Scientific Inc., Ecublens,Switzerland), where it was held for 5 min and shaken for another 8 min before the furnacewas turned off, allowing the batches to cool. Then, the chemical compositions of the rawmaterials were determined using a ARL PERFORM’X sequential X-ray fluorescence (XRF)Spectrometer (Thermo Fisher Scientific Inc., Ecublens, Switzerland) using the UniQuant5.00 software (Thermo Fisher Scientific Inc., Walthem, MA, USA).
The preparation of these composites is also described in the Slovenian patent No. SI26042 (A) [38]. Dry mixtures of slag powders (grain size < 90 µm) with the optimizedslag A-p/slag R-p = 1/1 ratio reported in Ref. [39], FA-p and sometimes polypropylenefibers (Belmix, Mouscron, Belgium) with an average length of 11 mm and a density of0.94 g/cm3 were added. These were mixed with sodium water glass Crystal 0112 (Na2SiO2containing 30.4 ma% SiO2, 15.4 ma% Na2O, and 54.2 ma% H2O, Tennants distribution, Ltd.,Manchester, UK) and solid NaOH (Donau Chemie, Vienna, Austria) before stirring thebatch to homogenize it as well as possible. Then the foaming agent, solid sodium perborate(Belinka Perkemija, Dol, Slovenia), or liquid H2O2 (Belinka Perkemija, Dol, Slovenia), andthe stabilizing agent liquid Triton™ X-100 (Merck, Darmstadt, Germany) were added.

Polymers 2022, 14, 1729 4 of 14
Finally, the LWAs expanded clay (Glinopor Vetisa d.o.o., Zalec, Slovenia), perlite (Njivad.o.o., Zalec, Slovenia), expanded polystyrene (JUB, Dol, Slovenia) or expanded glass(Glasopor AS, Oslo, Norway) presented in Figure 1 was mixed into each batch.
Polymers 2022, 14, x FOR PEER REVIEW 4 of 15
(Belinka Perkemija, Dol, Slovenia), or liquid H2O2 (Belinka Perkemija, Dol, Slovenia), and
the stabilizing agent liquid Triton™ X-100 (Merck, Darmstadt, Germany) were added. Fi-
nally, the LWAs expanded clay (Glinopor Vetisa d.o.o., Zalec, Slovenia), perlite (Njiva
d.o.o., Zalec, Slovenia), expanded polystyrene (JUB, Dol, Slovenia) or expanded glass
(Glasopor AS, Oslo, Norway) presented in Figure 1 was mixed into each batch.
Figure 1. Photographs of the applied LWAs: (a) expanded clay, (b) perlite, (c) expanded polystyrene
and (d) expanded glass.
Samples were produced by casting these mixtures into silicone molds and drying
them for three days in a WTB laboratory dryer chamber (Binder, Tuttlingen, Germany) at
70 °C and ambient humidity. The components were weighed using scale 2 (Exacta 2200
EB, Tehtnica, Trzin, Slovenia, ±0.01 g) and combined to produce each sample according to
Table 1.
Table 1. Composition of the prepared samples in [g] with H = hydrogen peroxide and PB = sodium
perborate. They are denoted according to the applied LWA: EC-expanded clay (EC), perlite (P),
expanded polystyrene (EPS) or expanded glass (EG).
Sample FA-p Slag Precursor Mix Na2SiO3 NaOH Triton Foaming Agent / Type PP-Fibers LWA
EC 1 110.0 / 37.4 4.0 1.5 1.5/H / 58.0
EC 2 110.0 / 37.4 4.0 1.5 1.5/H 0.5 58.0
EC 3 / 132.0 72.0 2.0 2.0 4.6/H / 58.0
EC 4 / 132.0 72.0 2.0 2.0 4.6/H 0.5 58.0
EC 5 50.0 50.0 54.0 0.6 0.8 0.5/PB 0.5 70.0
EC 6 50.0 50.0 54.0 0.6 0.8 2.0/H 0.5 100.0
P1 / 132.0 72.0 2.0 2.0 4.6/H / 11.8
P2 50.0 50.0 54.0 0.6 0.8 0.7/PB 0.5 30.0
P3 50.0 50.0 54.0 0.6 0.8 2.0/H 0.5 40.0
EPS1 50.0 50.0 55.0 0.6 0.8 1.5/H 0.5 4.0
EPS2 50.0 50.0 55.0 0.6 0.8 1.0/PB 0.5 4.0
EPS3 50.0 50.0 55.0 0.6 0.8 1.0/PB 0.5 4.0
EG1 / 132.0 72.0 2.0 2.0 4.6/H / 10.0
EG2 50.0 50.0 54.0 0.6 0.8 0.5/PB 0.5 60.0
EG3 50.0 50.0 54.0 0.6 0.8 2.0/H 0.5 80.0
Figure 1. Photographs of the applied LWAs: (a) expanded clay, (b) perlite, (c) expanded polystyreneand (d) expanded glass.
Samples were produced by casting these mixtures into silicone molds and dryingthem for three days in a WTB laboratory dryer chamber (Binder, Tuttlingen, Germany) at70 ◦C and ambient humidity. The components were weighed using scale 2 (Exacta 2200 EB,Tehtnica, Trzin, Slovenia, ±0.01 g) and combined to produce each sample according toTable 1.
Table 1. Composition of the prepared samples in [g] with H = hydrogen peroxide and PB = sodiumperborate. They are denoted according to the applied LWA: EC-expanded clay (EC), perlite (P),expanded polystyrene (EPS) or expanded glass (EG).
Sample FA-p Slag PrecursorMix Na2SiO3 NaOH Triton Foaming
Agent/Type PP-Fibers LWA
EC1 110.0 / 37.4 4.0 1.5 1.5/H / 58.0EC2 110.0 / 37.4 4.0 1.5 1.5/H 0.5 58.0EC3 / 132.0 72.0 2.0 2.0 4.6/H / 58.0EC4 / 132.0 72.0 2.0 2.0 4.6/H 0.5 58.0EC5 50.0 50.0 54.0 0.6 0.8 0.5/PB 0.5 70.0EC6 50.0 50.0 54.0 0.6 0.8 2.0/H 0.5 100.0
P1 / 132.0 72.0 2.0 2.0 4.6/H / 11.8P2 50.0 50.0 54.0 0.6 0.8 0.7/PB 0.5 30.0P3 50.0 50.0 54.0 0.6 0.8 2.0/H 0.5 40.0
EPS1 50.0 50.0 55.0 0.6 0.8 1.5/H 0.5 4.0EPS2 50.0 50.0 55.0 0.6 0.8 1.0/PB 0.5 4.0EPS3 50.0 50.0 55.0 0.6 0.8 1.0/PB 0.5 4.0
EG1 / 132.0 72.0 2.0 2.0 4.6/H / 10.0EG2 50.0 50.0 54.0 0.6 0.8 0.5/PB 0.5 60.0EG3 50.0 50.0 54.0 0.6 0.8 2.0/H 0.5 80.0
The flexural and compressive strength were determined using a Toninorm press(Toni Technik, Berlin, Germany, force detection limit 100 N) with a force application rate

Polymers 2022, 14, 1729 5 of 14
of 0.05 kN/s by the standard method [40] and averaged from four test specimens of20 × 20 × 80 mm3. Geometrical densities were determined by weighing individual samples(size of 20 × 20 × 80 mm3) and dividing their weight by their volume. Sample dimensionswere measured using a Vernier Calliper (Mitutoyo, Neuss, Germany) with a precisionof ±0.01 mm. Thermal conductivities were measured using a HFM 446 (Lambda Small,Stirolab, Sezana d.o.o., Slovenia, ±1%), according to EN 12667 and ASTM C518 in ISO 8301.
Optical microscopy of the material cross-sections was performed using a SMZ25/SMZ18stereo microscope (Nikon, Minato, Japan) at a working distance of 60 mm, images werecaptured using a digital MikroCamII Microscope Camera (Leica, Wetzlar, Germany). Cross-sections of selected samples were cut and embedded in EpoThin resin (Buehler, Leinfelden-Echterdingen, Germany), cured at 50 ◦C, and polished using decreasing grain sizes to afinal step of ca. 10 min on a SiC Buehler Micro Cut plate 30-10-4000 (Buehler, Leinfelden-Echterdingen, Germany, ca. 5 µm grain size). Scanning electron microscopy (SEM) wasperformed using a JSM-IT500 (Jeol, Tokyo, Japan) in low vacuum mode. Energy dispersiveX-ray spectroscopy (EDXS) was performed using an Ultim Max 65 detector (Oxford Instru-ments, Abingdon, UK) and the software Aztec 5.0 (Oxford Instruments, Abingdon, UK).SEM figures and EDXS maps were acquired using an acceleration voltage of 15 kV whereasEDXS spot measurements were performed using 10 kV to reduce the information volume.
3. Results and Discussion
The compositions of the prepared precursors were determined using XRF and arestated in Table 2.
Table 2. Chemical composition of the precursors in mass%.
Component SiO2 Al2O3 Fe2O3 CaO MgO Na2O K2O Cr2O3 MnO Others
slag A-p 24.53 9.95 13.25 24.32 17.33 0.15 0.20 4.38 2.61 3.26slag R-p 17.05 6.48 5.78 34.69 28.96 0.35 0.17 0.22 0.77 5.52
FA 44.83 22.98 10.65 12.38 2.80 1.19 2.20 0.02 0.26 2.68
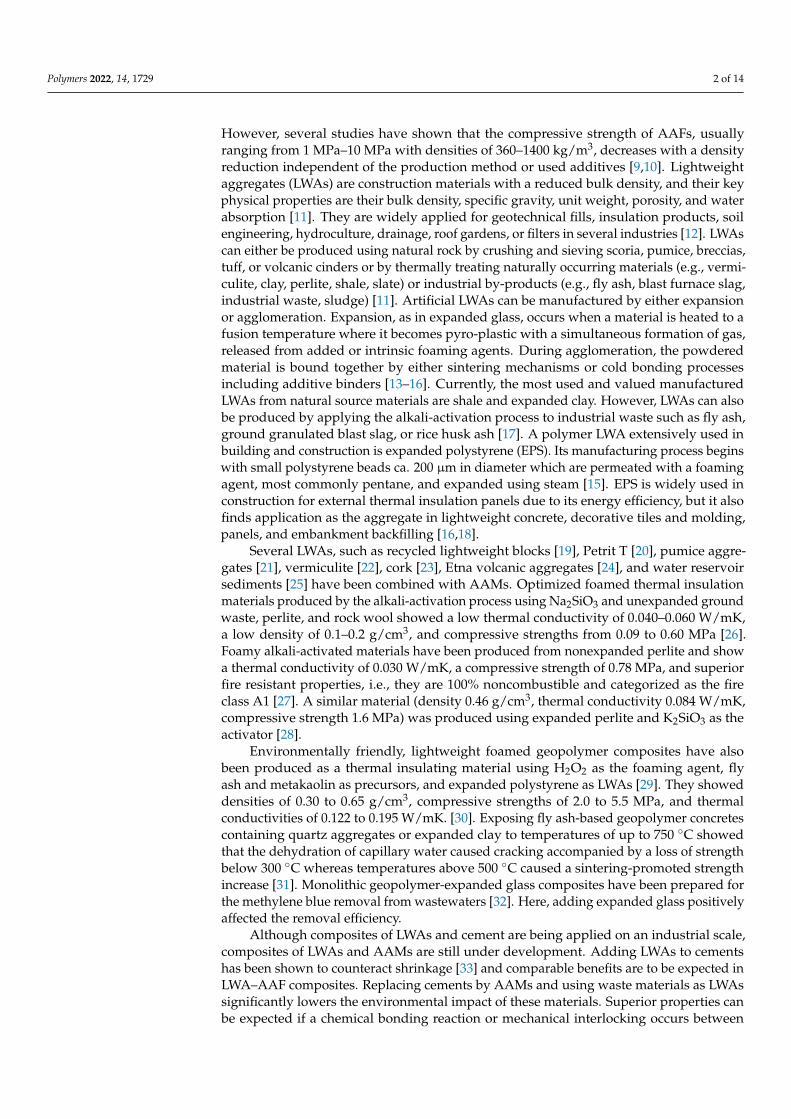
Photographs of selected basic LWA–AAF composites are presented in Figure 2 contain-ing the LWAs (a) expanded polystyrene, (b) perlite, (c) expanded clay, and (d) expandedglass. They are distributed relatively homogeneous in the AAF matrix but the larger LWAsize in Figure 2d also leads to larger areas only filled with AAF. Optical micrographs ofcross sections prepared through comparable composites reinforced by fibers are presentedin the Figure 2e–h; they imply a good adhesion between all LWAs and their AAF matrix. Itseems the large LWA size note above also allows for the formation of large pores such asthose in Figure 2h exceeding ca. 200 µm in diameter.
3.1. Mechanical Properties
The flexural (σFS) and compressive (σCS) strengths listed in Table 3 were measured forthe respective materials and the respective standard deviations are stated. The compositescontaining expanded clay or expanded glass showed higher flexural and compressivestrengths than the composites containing smaller LWAs. Although the flexural strengthof the fiber-free sample EG1 is below the detection limit and adding fibers would seemto improve this, the sample EC4 also shows a flexural strength below the detection limitalthough it contains fibers. Perhaps the lower performance of the samples EC4, P3, andEG1 was caused by some random weakness (e.g., a crack) in the samples rather than theirmicrostructure. The measured compressive strengths of the composites were lower thanthose reported for the respective LWAs [33] except for expanded glass containing samplesEG2 and EG3. Assuming the applied LWAs are comparable, this indicates that the matrixcan have a stabilizing effect if the LWA is especially brittle.
Polymers 2022, 14, 1729 6 of 14Polymers 2022, 14, x FOR PEER REVIEW 6 of 15
Figure 2. Photographs of LWA–AAF composites containing (a) EPS, (b) perlite, (c) EC, and (d) EG.
Optical micrographs of cross sections prepared from the composites containing (e) EPS, (f) perlite,
(g) EC, and (h) EG reinforced by fibers are presented below.
3.1. Mechanical Properties
The flexural (σFS) and compressive (σCS) strengths listed in Table 3 were measured for
the respective materials and the respective standard deviations are stated. The composites
containing expanded clay or expanded glass showed higher flexural and compressive
strengths than the composites containing smaller LWAs. Although the flexural strength
of the fiber-free sample EG1 is below the detection limit and adding fibers would seem to
improve this, the sample EC4 also shows a flexural strength below the detection limit alt-
hough it contains fibers. Perhaps the lower performance of the samples EC4, P3, and EG1
was caused by some random weakness (e.g., a crack) in the samples rather than their mi-
crostructure. The measured compressive strengths of the composites were lower than
those reported for the respective LWAs [33] except for expanded glass containing samples
EG2 and EG3. Assuming the applied LWAs are comparable, this indicates that the matrix
can have a stabilizing effect if the LWA is especially brittle.
Table 3. Flexural and compressive strengths of selected samples. Standard deviations (std) are
stated in brackets.
Sample σFS [MPa] (std) σCS [MPa] (std)
EC2 0.82 * 2.72 (0.00)
EC4 b.d.l. 1.04 (0.12)
EC5 0.90 * 2.95 (0.26)
EC6 0.39 * 1.31 (0.01)
P2 0.29 * 0.61 (0.05)
P3 b.d.l. 0.95 (0.07)
EPS1 0.34 (0.10) 0.55 (0.09)
EPS2 0.15 (0.01) 0.69 (0.42)
EG1 b.d.l. 0.85 (0.01)
EG2 0.77 * 4.44 (0.28)
EG3 0.62 * 3.62 (1.08)
b.d.l. = below detection limit, * single value or b.d.l.
Figure 2. Photographs of LWA–AAF composites containing (a) EPS, (b) perlite, (c) EC, and (d) EG.Optical micrographs of cross sections prepared from the composites containing (e) EPS, (f) perlite,(g) EC, and (h) EG reinforced by fibers are presented below.
Table 3. Flexural and compressive strengths of selected samples. Standard deviations (std) are statedin brackets.
Sample σFS [MPa] (std) σCS [MPa] (std)
EC2 0.82 * 2.72 (0.00)EC4 b.d.l. 1.04 (0.12)EC5 0.90 * 2.95 (0.26)EC6 0.39 * 1.31 (0.01)
P2 0.29 * 0.61 (0.05)P3 b.d.l. 0.95 (0.07)
EPS1 0.34 (0.10) 0.55 (0.09)EPS2 0.15 (0.01) 0.69 (0.42)
EG1 b.d.l. 0.85 (0.01)EG2 0.77 * 4.44 (0.28)EG3 0.62 * 3.62 (1.08)
b.d.l. = below detection limit, * single value or b.d.l.
3.2. SEM Analysis
Figure 3 presents optical micrographs visualizing the LWA–AAF interfaces in crosssections through prepared composites reinforced with fibers. There were no discernibleshrinkage gaps between the LWAs and their matrix.
SEM analyses were applied to gain further insight into selected LWA–AAF interfaces.Figure 4 presents results obtained from the polystyrene–AAF composite after embedding.The C-map of the scanned area enables to conclude that the spherical domains in the SEMmicrograph represent the expanded polystyrene, probably saturated with the embeddingpolymer, which also contains areas of elevated oxygen content. The AAF matrix shows acomparably complex microstructure in the SEM micrograph, but contains a recognizabledistribution of Si and Ca with particles enriched in the respective elements distributedthroughout its microstructure. The Ca-rich particles can be assumed to represent unreactedslag [34]. A discernible gap between the polystyrene and the AAF is highlighted by arrows,

Polymers 2022, 14, 1729 7 of 14
which could indicate that these components neither formed a chemical bond nor a me-chanical interlock during production. However, a comparable gap is not discernible inFigure 3a, so it is possible that these gaps are an artifact introduced by preparing the samplefor analysis in the SEM.
Polymers 2022, 14, x FOR PEER REVIEW 7 of 15
3.2. SEM Analysis
Figure 3 presents optical micrographs visualizing the LWA–AAF interfaces in cross
sections through prepared composites reinforced with fibers. There were no discernible
shrinkage gaps between the LWAs and their matrix.
Figure 3. Optical micrographs of selected fiber-reinforced LWA–AAF composite cross sections con-
taining the LWAs (a) expanded polystyrene, (b) perlite, (c) expanded clay, and (d) expanded glass.
The LWA is always at the top of the image and the dashed line in (c) is inserted as a guide for the
eye, outlining the circular boundary of an expanded clay particle.
SEM analyses were applied to gain further insight into selected LWA–AAF inter-
faces. Figure 4 presents results obtained from the polystyrene–AAF composite after em-
bedding. The C-map of the scanned area enables to conclude that the spherical domains
in the SEM micrograph represent the expanded polystyrene, probably saturated with the
embedding polymer, which also contains areas of elevated oxygen content. The AAF ma-
trix shows a comparably complex microstructure in the SEM micrograph, but contains a
recognizable distribution of Si and Ca with particles enriched in the respective elements
distributed throughout its microstructure. The Ca-rich particles can be assumed to repre-
sent unreacted slag [34]. A discernible gap between the polystyrene and the AAF is high-
lighted by arrows, which could indicate that these components neither formed a chemical
bond nor a mechanical interlock during production. However, a comparable gap is not
discernible in Figure 3a, so it is possible that these gaps are an artifact introduced by pre-
paring the sample for analysis in the SEM.
Figure 4. SEM micrograph featuring a cross section though the expanded polystyrene-AAF compo-
site presented in Figure 2a. Arrows highlight a gap between the LWA and its matrix. The framed
area was scanned by EDXS and element maps of C, O, Si, and Ca are presented.
Figure 3. Optical micrographs of selected fiber-reinforced LWA–AAF composite cross sectionscontaining the LWAs (a) expanded polystyrene, (b) perlite, (c) expanded clay, and (d) expanded glass.The LWA is always at the top of the image and the dashed line in (c) is inserted as a guide for the eye,outlining the circular boundary of an expanded clay particle.
Polymers 2022, 14, x FOR PEER REVIEW 7 of 15
3.2. SEM Analysis
Figure 3 presents optical micrographs visualizing the LWA–AAF interfaces in cross
sections through prepared composites reinforced with fibers. There were no discernible
shrinkage gaps between the LWAs and their matrix.
Figure 3. Optical micrographs of selected fiber-reinforced LWA–AAF composite cross sections con-
taining the LWAs (a) expanded polystyrene, (b) perlite, (c) expanded clay, and (d) expanded glass.
The LWA is always at the top of the image and the dashed line in (c) is inserted as a guide for the
eye, outlining the circular boundary of an expanded clay particle.
SEM analyses were applied to gain further insight into selected LWA–AAF inter-
faces. Figure 4 presents results obtained from the polystyrene–AAF composite after em-
bedding. The C-map of the scanned area enables to conclude that the spherical domains
in the SEM micrograph represent the expanded polystyrene, probably saturated with the
embedding polymer, which also contains areas of elevated oxygen content. The AAF ma-
trix shows a comparably complex microstructure in the SEM micrograph, but contains a
recognizable distribution of Si and Ca with particles enriched in the respective elements
distributed throughout its microstructure. The Ca-rich particles can be assumed to repre-
sent unreacted slag [34]. A discernible gap between the polystyrene and the AAF is high-
lighted by arrows, which could indicate that these components neither formed a chemical
bond nor a mechanical interlock during production. However, a comparable gap is not
discernible in Figure 3a, so it is possible that these gaps are an artifact introduced by pre-
paring the sample for analysis in the SEM.
Figure 4. SEM micrograph featuring a cross section though the expanded polystyrene-AAF compo-
site presented in Figure 2a. Arrows highlight a gap between the LWA and its matrix. The framed
area was scanned by EDXS and element maps of C, O, Si, and Ca are presented.
Figure 4. SEM micrograph featuring a cross section though the expanded polystyrene-AAF compositepresented in Figure 2a. Arrows highlight a gap between the LWA and its matrix. The framed areawas scanned by EDXS and element maps of C, O, Si, and Ca are presented.
An overview of the perlite-AAF composite microstructure is presented in Figure 5a.The large, dark structures in the SEM micrograph are pores filled with the embeddingpolymer. The boundary between perlite and the AAF is marked by arrows as it is nottrivial to discern. However, the presented element maps show that perlite contains moreSi than the AAF and no Ca. This interface is so irregular due to the huge pores in boththe LWA and the AAF that a ITZ analysis comparable to denser materials [34–36] is notfeasible. It also shows wide gaps, but there are areas where the components seem to be indirect contact. One such area is highlighted by frame 2 and presented in greater detail inFigure 5b. The SEM micrograph shows a clearly discernible gap between the AAF (top)and perlite (middle).

Polymers 2022, 14, 1729 8 of 14
Polymers 2022, 14, x FOR PEER REVIEW 8 of 15
An overview of the perlite-AAF composite microstructure is presented in Figure 5a.
The large, dark structures in the SEM micrograph are pores filled with the embedding
polymer. The boundary between perlite and the AAF is marked by arrows as it is not
trivial to discern. However, the presented element maps show that perlite contains more
Si than the AAF and no Ca. This interface is so irregular due to the huge pores in both the
LWA and the AAF that a ITZ analysis comparable to denser materials [34–36] is not fea-
sible. It also shows wide gaps, but there are areas where the components seem to be in
direct contact. One such area is highlighted by frame 2 and presented in greater detail in
Figure 5b. The SEM micrograph shows a clearly discernible gap between the AAF (top)
and perlite (middle).
Figure 5. (a) SEM micrograph featuring a cross section though the perlite-AAF composite presented
in Figure 2b. The area in frame 1 was scanned by EDXS and element maps of Si and Ca are presented.
Arrows highlight the boundary between perlite and the AAF. (b) The area in frame 2 presented in
greater detail along with EDXS element maps of Si and Ca of this area.
On the other hand, this microstructure also contained interface domains similar to
those presented in Figure 6, where an apparently compact feature forms this interface in
the SEM micrograph. The presented element maps indicate that this feature contains
higher amounts of Si and K whereas Ca and Na occur in smaller amounts. As perlite is
not prone to shape changes under the given conditions, the Ca-rich domain at the interface
could have resulted from a chemical reaction between filler and matrix. EDXS spot meas-
urements were performed along three such interfaces and the resulting composition is
stated in Table 4. The compositions are comparable considering the margin of error (as-
suming to range from ±1–2wt% given an accuracy of 2–5% for the standardless quantifi-
cation, an unknown sample homogeneity and data acquisition under low vacuum condi-
tions).
Table 4. Chemical composition determined at three interfaces comparable to that featured in Figure
6a. Only the stated elements were included in the analysis and the values were averaged from at
least five spots analyzed at each interface. The average Ca/Si ratio is also stated for each interface.
in wt % O Na Mg Al Si K Ca Fe Si/Ca
interface 1 48 12 1 5 29 2 3 1 10:1
interface 2 50 5 0 6 34 3 2 1 20:1
Interface 3 50 5 0 6 33 2 1 1 27:1
Figure 5. (a) SEM micrograph featuring a cross section though the perlite-AAF composite presentedin Figure 2b. The area in frame 1 was scanned by EDXS and element maps of Si and Ca are presented.Arrows highlight the boundary between perlite and the AAF. (b) The area in frame 2 presented ingreater detail along with EDXS element maps of Si and Ca of this area.
On the other hand, this microstructure also contained interface domains similar tothose presented in Figure 6, where an apparently compact feature forms this interface in theSEM micrograph. The presented element maps indicate that this feature contains higheramounts of Si and K whereas Ca and Na occur in smaller amounts. As perlite is not proneto shape changes under the given conditions, the Ca-rich domain at the interface couldhave resulted from a chemical reaction between filler and matrix. EDXS spot measurementswere performed along three such interfaces and the resulting composition is stated inTable 4. The compositions are comparable considering the margin of error (assuming torange from ±1–2wt% given an accuracy of 2–5% for the standardless quantification, anunknown sample homogeneity and data acquisition under low vacuum conditions).
Polymers 2022, 14, x FOR PEER REVIEW 9 of 15
Figure 6. SEM micrograph containing a feature parallel to the perlite (bottom)—AAF (top) interface
and highlighted by arrows. The framed area was scanned by EDXS and element maps of Si, K, Ca,
and Na are presented.
An overview of the expanded clay-AAF composite microstructure is presented in
Figure 7a. As noted above, the comparably large LWA particle size allowed for the for-
mation of huge pores in the AAF. A slightly rounded, rather compact interface was dis-
cernible between the AAF and the LWA, also containing very large pores. The framed
area is presented in greater detail in Figure 7b and the element maps of this area presented
below show that the expanded clay contains Si-enriched particles, but otherwise produces
a very similar Si signal. The element map of Ca allowed for a clear identification as the
Ca-enriched particles characteristic of the AAF only occurred on top of this interface, iden-
tifying this microstructure as the AAF.
Figure 7. (a) SEM micrograph featuring a cross section through the expanded clay-AAF composite
presented in Figure 2c. (b) The framed area in in greater detail. EDXS element maps of Si and Ca are
presented.
Two detailed SEM and EDXS analyses of the expanded clay-AAF interface are pre-
sented in Figure 8a,b. Although the SEM micrograph clearly shows that the AAF was in
direct contact with the expanded clay, only the element map of Ca shows a systematically
enhanced signal along this interface, which could indicate a chemical reaction between
filler and matrix in this composite. In combination with the interface morphology, the de-
tected Ca enrichment implies that a Ca-enriched zone comparable to the gel noted in Ref.
[34] was formed. EDXS spot measurements were performed along three such interfaces
and the resulting composition is stated in Table 5. Noteworthy differences are an elevated
amount of Si in Figure 8a, and clear variations in the measured Ca content.
Figure 6. SEM micrograph containing a feature parallel to the perlite (bottom)—AAF (top) interfaceand highlighted by arrows. The framed area was scanned by EDXS and element maps of Si, K, Ca,and Na are presented.

Polymers 2022, 14, 1729 9 of 14
Table 4. Chemical composition determined at three interfaces comparable to that featured in Figure 6a.Only the stated elements were included in the analysis and the values were averaged from at leastfive spots analyzed at each interface. The average Ca/Si ratio is also stated for each interface.
in wt % O Na Mg Al Si K Ca Fe Si/Ca
interface 1 48 12 1 5 29 2 3 1 10:1interface 2 50 5 0 6 34 3 2 1 20:1interface 3 50 5 0 6 33 2 1 1 27:1
An overview of the expanded clay-AAF composite microstructure is presented inFigure 7a. As noted above, the comparably large LWA particle size allowed for the forma-tion of huge pores in the AAF. A slightly rounded, rather compact interface was discerniblebetween the AAF and the LWA, also containing very large pores. The framed area ispresented in greater detail in Figure 7b and the element maps of this area presented belowshow that the expanded clay contains Si-enriched particles, but otherwise produces a verysimilar Si signal. The element map of Ca allowed for a clear identification as the Ca-enrichedparticles characteristic of the AAF only occurred on top of this interface, identifying thismicrostructure as the AAF.
Polymers 2022, 14, x FOR PEER REVIEW 9 of 15
Figure 6. SEM micrograph containing a feature parallel to the perlite (bottom)—AAF (top) interface
and highlighted by arrows. The framed area was scanned by EDXS and element maps of Si, K, Ca,
and Na are presented.
An overview of the expanded clay-AAF composite microstructure is presented in
Figure 7a. As noted above, the comparably large LWA particle size allowed for the for-
mation of huge pores in the AAF. A slightly rounded, rather compact interface was dis-
cernible between the AAF and the LWA, also containing very large pores. The framed
area is presented in greater detail in Figure 7b and the element maps of this area presented
below show that the expanded clay contains Si-enriched particles, but otherwise produces
a very similar Si signal. The element map of Ca allowed for a clear identification as the
Ca-enriched particles characteristic of the AAF only occurred on top of this interface, iden-
tifying this microstructure as the AAF.
Figure 7. (a) SEM micrograph featuring a cross section through the expanded clay-AAF composite
presented in Figure 2c. (b) The framed area in in greater detail. EDXS element maps of Si and Ca are
presented.
Two detailed SEM and EDXS analyses of the expanded clay-AAF interface are pre-
sented in Figure 8a,b. Although the SEM micrograph clearly shows that the AAF was in
direct contact with the expanded clay, only the element map of Ca shows a systematically
enhanced signal along this interface, which could indicate a chemical reaction between
filler and matrix in this composite. In combination with the interface morphology, the de-
tected Ca enrichment implies that a Ca-enriched zone comparable to the gel noted in Ref.
[34] was formed. EDXS spot measurements were performed along three such interfaces
and the resulting composition is stated in Table 5. Noteworthy differences are an elevated
amount of Si in Figure 8a, and clear variations in the measured Ca content.
Figure 7. (a) SEM micrograph featuring a cross section through the expanded clay-AAF compositepresented in Figure 2c. (b) The framed area in in greater detail. EDXS element maps of Si and Caare presented.
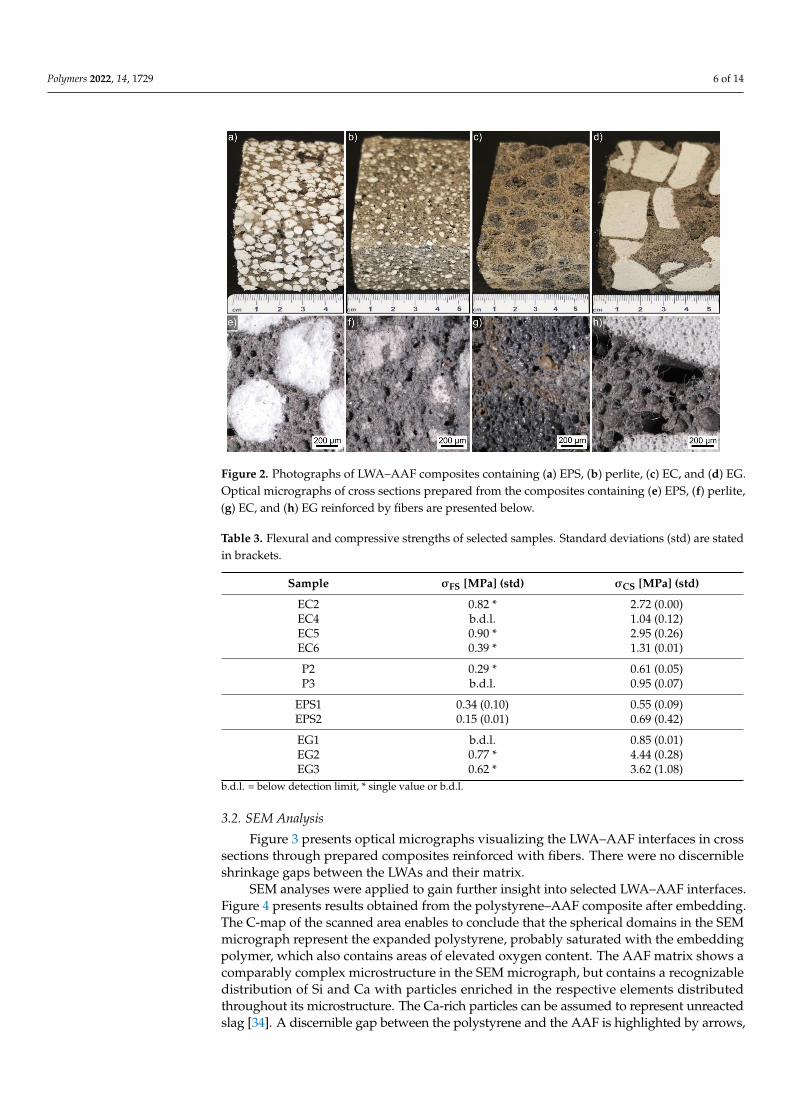
Two detailed SEM and EDXS analyses of the expanded clay-AAF interface are pre-sented in Figure 8a,b. Although the SEM micrograph clearly shows that the AAF was indirect contact with the expanded clay, only the element map of Ca shows a systematicallyenhanced signal along this interface, which could indicate a chemical reaction between fillerand matrix in this composite. In combination with the interface morphology, the detectedCa enrichment implies that a Ca-enriched zone comparable to the gel noted in Ref. [34]was formed. EDXS spot measurements were performed along three such interfaces and theresulting composition is stated in Table 5. Noteworthy differences are an elevated amountof Si in Figure 8a, and clear variations in the measured Ca content.
Polymers 2022, 14, 1729 10 of 14Polymers 2022, 14, x FOR PEER REVIEW 10 of 15
Figure 8. (a) SEM micrograph of the AAF (top)—expanded clay (bottom) interface, element maps
of an EDXS scan performed on the framed area are presented below. (b) The same, but at a different
location.
Table 5. Chemical composition determined at the interfaces featured in Figure 8 and one compara-
ble interface. Only the stated elements were included into the analysis and the values were averaged
from at least five spots per interface. The respective average Ca/Si ratio is also stated.
in wt % O Na Mg Al Si K Ca Fe Si/Ca
Figure 9a 48 3 4 7 28 2 5 3 6:1
Figure 9b 45 3 5 6 21 1 14 6 3:2
Comparable interface 44 1 4 6 20 0 20 5 1:1
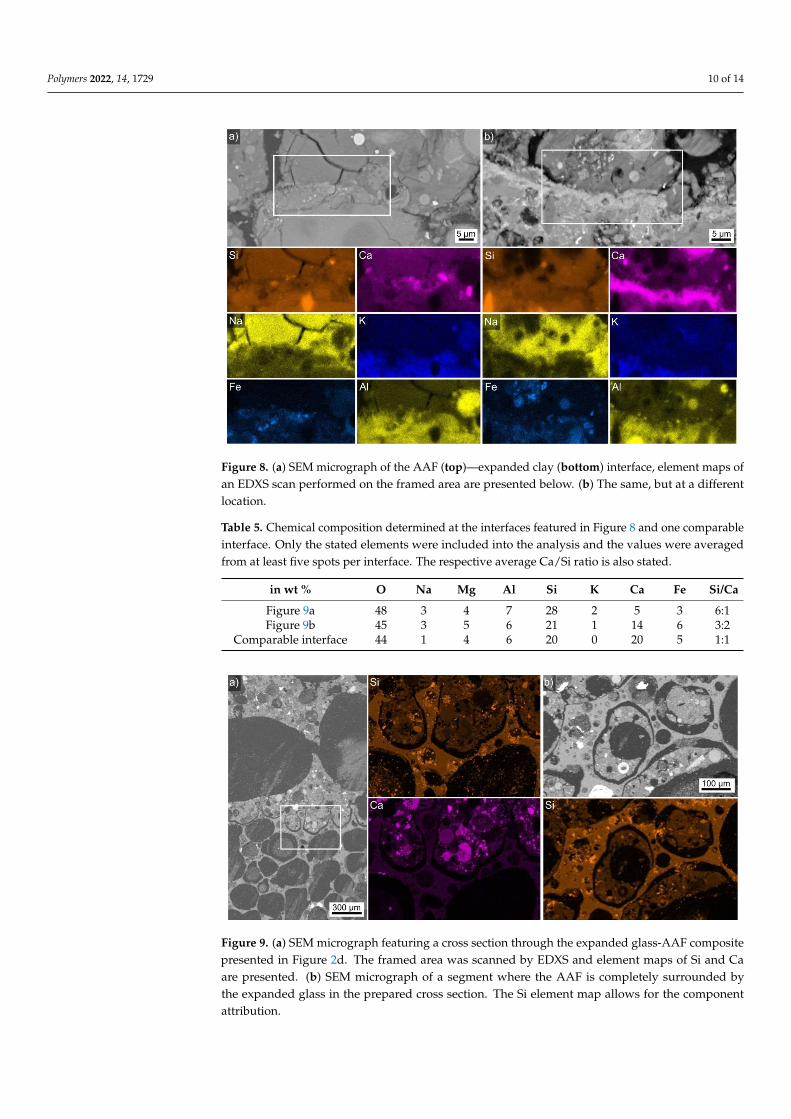
An overview of the expanded glass–AAF composite microstructure is presented in
Figure 9a; the AAF amongst these very large LWA particles contains the largest pores of
all presented materials. Element maps of Si and Ca acquired in the framed area are pre-
sented, and they show that the expanded glass (bottom) contains more Si but less Ca than
the AAF (top). It is also very clear that these components are usually separated by a rather
wide gap. However, the AAF expanded into the pores of the expanded glass very well,
mechanically interlocking their microstructures. This is illustrated by Figure 9b, which
features two AAF segments completely surrounded by expanded glass in the prepared
cross section, as visualized by the presented element map of Si.
Figure 8. (a) SEM micrograph of the AAF (top)—expanded clay (bottom) interface, element maps ofan EDXS scan performed on the framed area are presented below. (b) The same, but at a differentlocation.
Table 5. Chemical composition determined at the interfaces featured in Figure 8 and one comparableinterface. Only the stated elements were included into the analysis and the values were averagedfrom at least five spots per interface. The respective average Ca/Si ratio is also stated.
in wt % O Na Mg Al Si K Ca Fe Si/Ca
Figure 9a 48 3 4 7 28 2 5 3 6:1Figure 9b 45 3 5 6 21 1 14 6 3:2
Comparable interface 44 1 4 6 20 0 20 5 1:1Polymers 2022, 14, x FOR PEER REVIEW 11 of 15
Figure 9. (a) SEM micrograph featuring a cross section through the expanded glass-AAF composite
presented in Figure 2d. The framed area was scanned by EDXS and element maps of Si and Ca are
presented. (b) SEM micrograph of a segment where the AAF is completely surrounded by the ex-
panded glass in the prepared cross section. The Si element map allows for the component attribu-
tion.
3.3. Thermal Conductivity
The thermal conductivity of materials is affected by a wide range of parameters rang-
ing from the atomistic scale, i.e., the dominant atomic bonding type, over the µm-scale,
via the degree of crystallinity, to macroscopic parameters such as the porosity and its type
as well as the overall density. If, for example, materials of a different “nature” such as
“clay brick”, a “Ca-silicate unit”, or a “densely aggregated concrete” all show matching
densities of 1600 kg/m3, then their respective thermal conductivities amount to 410, 550,
or 690 mW/mK according to the tables A.1, A.2, and A.3 in EN 1745 [41].
Thermal conductivities for the produced materials were assessed based on EN 1745
[41], which contains tables with generic values for masonry materials in dependence on
their density. If the measured densities did not match those in the selected tables A.4, A.5,
or A.6 of EN 1745 [41], the values of the most comparable materials were linearly extrap-
olated based on the density. The thermal conductivities of the samples EC1–EC4 were
measured for comparison; the maximum difference to the assessed values is 27 mW/mK
for sample EC3. The respective sample dimensions, weight, calculated density, and ther-
mal conductivity are stated in Table 6. The density of the produced materials is generally
somewhat higher than comparable materials prepared using cement [33].
Table 6. Sample dimensions, weight, calculated density, and assessed values of the thermal conduc-
tivity of the prepared LWA–AAF composites. Measured values for the thermal conductivity are
stated in brackets.
Sample Width [mm] Length [mm] Height [mm] Weight [g] Density [kg/m³] Thermal Conductivity [mW/mK]
EC1 90.80 90.60 28.49 128.87 549.8 140 (134)
EC2 70.50 76.30 21.03 64.23 567.8 148 (140)
EC3 86.60 84.00 35.95 100.45 384.1 96 (123)
EC4 91.80 68.30 27.21 81.20 475.9 114 (130)
EC5 101.95 21.50 20.13 30.79 700 190
EC6 100.50 21.70 29.23 30.19 470 114
P2 102.00 26.00 21.43 33.62 590 129
P3 103.80 21.35 25.77 25.10 440 98
EPS1 99.70 18.23 25.65 17.01 360 116
EPS2 97.44 22.83 20.86 14.88 320 112
Figure 9. (a) SEM micrograph featuring a cross section through the expanded glass-AAF compositepresented in Figure 2d. The framed area was scanned by EDXS and element maps of Si and Caare presented. (b) SEM micrograph of a segment where the AAF is completely surrounded bythe expanded glass in the prepared cross section. The Si element map allows for the componentattribution.

Polymers 2022, 14, 1729 11 of 14
An overview of the expanded glass–AAF composite microstructure is presented inFigure 9a; the AAF amongst these very large LWA particles contains the largest pores of allpresented materials. Element maps of Si and Ca acquired in the framed area are presented,and they show that the expanded glass (bottom) contains more Si but less Ca than the AAF(top). It is also very clear that these components are usually separated by a rather wide gap.However, the AAF expanded into the pores of the expanded glass very well, mechanicallyinterlocking their microstructures. This is illustrated by Figure 9b, which features twoAAF segments completely surrounded by expanded glass in the prepared cross section, asvisualized by the presented element map of Si.
3.3. Thermal Conductivity
The thermal conductivity of materials is affected by a wide range of parametersranging from the atomistic scale, i.e., the dominant atomic bonding type, over the µm-scale,via the degree of crystallinity, to macroscopic parameters such as the porosity and its typeas well as the overall density. If, for example, materials of a different “nature” such as“clay brick”, a “Ca-silicate unit”, or a “densely aggregated concrete” all show matchingdensities of 1600 kg/m3, then their respective thermal conductivities amount to 410, 550, or690 mW/mK according to the tables A.1, A.2, and A.3 in EN 1745 [41].
Thermal conductivities for the produced materials were assessed based on EN 1745 [41],which contains tables with generic values for masonry materials in dependence on theirdensity. If the measured densities did not match those in the selected tables A.4, A.5, or A.6of EN 1745 [41], the values of the most comparable materials were linearly extrapolatedbased on the density. The thermal conductivities of the samples EC1–EC4 were measuredfor comparison; the maximum difference to the assessed values is 27 mW/mK for sampleEC3. The respective sample dimensions, weight, calculated density, and thermal conduc-tivity are stated in Table 6. The density of the produced materials is generally somewhathigher than comparable materials prepared using cement [33].
Table 6. Sample dimensions, weight, calculated density, and assessed values of the thermal con-ductivity of the prepared LWA–AAF composites. Measured values for the thermal conductivity arestated in brackets.
Sample Width[mm]
Length[mm]
Height[mm]
Weight[g]
Density[kg/m3]
ThermalConductivity
[mW/mK]
EC1 90.80 90.60 28.49 128.87 549.8 140 (134)EC2 70.50 76.30 21.03 64.23 567.8 148 (140)EC3 86.60 84.00 35.95 100.45 384.1 96 (123)EC4 91.80 68.30 27.21 81.20 475.9 114 (130)EC5 101.95 21.50 20.13 30.79 700 190EC6 100.50 21.70 29.23 30.19 470 114
P2 102.00 26.00 21.43 33.62 590 129P3 103.80 21.35 25.77 25.10 440 98
EPS1 99.70 18.23 25.65 17.01 360 116EPS2 97.44 22.83 20.86 14.88 320 112
EG2 101.95 20.40 21.60 29.93 670 151EG3 100.25 21.30 22.37 23.38 490 108
Figure 10 presents the assessed thermal conductivity and measured strengths ofselected materials correlated to their density, and confirms the expected correlation betweenthem: a lower density is accompanied by lower strengths and usually also a lower thermalconduction, although it must be noted that samples P3, EG3, and EG6 have lower valuesthan EPS1, which has a much lower density. Here the “nature” of the materials comesinto play as EPS1 and 2 contain organic polymers whereas all other samples only containinorganic-nonmetallic compounds which should show a much better fire resistance than

Polymers 2022, 14, 1729 12 of 14
polystyrene. The latter should simply burn in case of a fire, and the formed CO2 gas couldreduce the mechanical strength significantly by producing internal cracks.
Polymers 2022, 14, x FOR PEER REVIEW 12 of 15
EG2 101.95 20.40 21.60 29.93 670 151
EG3 100.25 21.30 22.37 23.38 490 108
Figure 10 presents the assessed thermal conductivity and measured strengths of se-
lected materials correlated to their density, and confirms the expected correlation between
them: a lower density is accompanied by lower strengths and usually also a lower thermal
conduction, although it must be noted that samples P3, EG3, and EG6 have lower values
than EPS1, which has a much lower density. Here the “nature” of the materials comes into
play as EPS1 and 2 contain organic polymers whereas all other samples only contain in-
organic-nonmetallic compounds which should show a much better fire resistance than
polystyrene. The latter should simply burn in case of a fire, and the formed CO2 gas could
reduce the mechanical strength significantly by producing internal cracks.
Figure 10. Thermal conductivity and flexural as well as compressive strength correlated to the den-
sity of selected samples.
In summary, large LWA particle sizes allow for the formation of larger pores in the
AAF, probably because of larger gaps. If the strength of the AAF defined the mechanical
properties of the produced composites, such large pores should decrease the overall per-
formance of the material, and adding fibers could be expected to compensate such weak
links in the system. Although the optical micrographs in Figure 3 imply a good adhesion
between all LWAs and their AAF matrix, the detailed SEM analysis reveals that gaps less
than 50 µm wide usually occur between these components. Such small gaps should be
difficult to discern in optical micrographs and also occur between cement and polystyrene
[42,43], but could also form during sample preparation for SEM analysis. Mechanical in-
terlocking of the AAF with the LWA of course depends on the LWA structure, but the
large pores in the expanded glass allow for the AAF to expand into them, causing the
obvious interlock discernible in Figure 9.
Direct contacts between LWA and AAF were found in the composites containing
perlite or expanded clay. In the case of perlite, the features morphologically most likely to
have formed at the interface contained elevated levels of Si and K whereas Ca and Na
occur less often. The low Ca content in these features caused strong variations in the cal-
culated Ca/Si ratio and indicate that these interfaces are perhaps more comparable to those
featured in Ref. [36] where a Ca enrichment was not detected despite high Ca concentra-
tions in the alkali-activated cement.
The mechanical properties of composites containing the large, rather coarse LWAs
expanded glass and expanded clay are superior, probably due to a better mechanical in-
terlocking with the AAF matrix. The thermal insulation properties could be improved by
a further density reduction, but sufficient compressive (and bending) strengths must be
provided to allow for the material to be manipulated during installation and use. Further-
more, other relevant factors such as fire resistance should not be ignored.
Figure 10. Thermal conductivity and flexural as well as compressive strength correlated to the densityof selected samples.
In summary, large LWA particle sizes allow for the formation of larger pores in theAAF, probably because of larger gaps. If the strength of the AAF defined the mechanicalproperties of the produced composites, such large pores should decrease the overall perfor-mance of the material, and adding fibers could be expected to compensate such weak linksin the system. Although the optical micrographs in Figure 3 imply a good adhesion be-tween all LWAs and their AAF matrix, the detailed SEM analysis reveals that gaps less than50 µm wide usually occur between these components. Such small gaps should be difficultto discern in optical micrographs and also occur between cement and polystyrene [42,43],but could also form during sample preparation for SEM analysis. Mechanical interlockingof the AAF with the LWA of course depends on the LWA structure, but the large pores inthe expanded glass allow for the AAF to expand into them, causing the obvious interlockdiscernible in Figure 9.
Direct contacts between LWA and AAF were found in the composites containingperlite or expanded clay. In the case of perlite, the features morphologically most likelyto have formed at the interface contained elevated levels of Si and K whereas Ca andNa occur less often. The low Ca content in these features caused strong variations in thecalculated Ca/Si ratio and indicate that these interfaces are perhaps more comparableto those featured in Ref. [36] where a Ca enrichment was not detected despite high Caconcentrations in the alkali-activated cement.
The mechanical properties of composites containing the large, rather coarse LWAsexpanded glass and expanded clay are superior, probably due to a better mechanicalinterlocking with the AAF matrix. The thermal insulation properties could be improvedby a further density reduction, but sufficient compressive (and bending) strengths mustbe provided to allow for the material to be manipulated during installation and use.Furthermore, other relevant factors such as fire resistance should not be ignored.
4. Conclusions
LWA–AAF composites incorporating expanded polystyrene, perlite, expanded clay, orexpanded glass were produced. Large LWA particle sizes led to large gaps, which allowedfor larger pores in the AAF. Large, open pores in the LWA allowed for the AAF to expandinto them, mechanically interlocking the fillers with their matrix. The AAF matrix probablyhad a stabilizing effect on the brittle LWAs. The huge pores in both the matrix and thefiller make comparable analyses of the very inhomogeneous ITZ in these highly porouscomposites almost impossible. Nevertheless, some chemical interactions were indicatedand a Ca enrichment was detected at an expanded clay—AAF interface.

Polymers 2022, 14, 1729 13 of 14
Furthermore, achieving waste-based materials comparable to cement-based compos-ites contributes to the field of environmental protection as well as that of sustainabledevelopment in construction.
Author Contributions: Conceptualization, V.D., K.T. and W.W.; methodology, V.D., K.T., M.C. andW.W.; formal analysis, K.T., W.W. and M.C.; writing—original draft preparation, K.T.; writing—reviewand editing, W.W.; supervision, V.D.; funding acquisition, V.D. All authors have read and agreed tothe published version of the manuscript.
Funding: This research was funded by the Slovenian Research Agency (ARRS) via program P2-0273“Building structures and materials”.
Informed Consent Statement: Not applicable.
Data Availability Statement: All final data can be provided by authors.
Acknowledgments: We thank our colleagues at the ZAG Laboratory for Cements, Mortars andCeramics for their technical support.
Conflicts of Interest: The authors declare no conflict of interest.
References1. Provis, J.L.; van Deventer, J.S.J. (Eds.) Alkali Activated Materials: State-of-the-Art Report; RILEM TC 224-AAM; Springer/RILEM:
Berlin, Germany, 2013.2. Bai, C.Y.; Colombo, P. Processing, properties and applications of highly porous geopolymers: A review. Ceram. Int. 2018, 44,
16103–16118. [CrossRef]3. Papa, E.; Landi, E.; Miccio, F.; Medri, V. K2O-Metakaolin-Based Geopolymer Foams: Production, Porosity Characterization and
Permeability Test. Materials 2022, 15, 1008. [CrossRef] [PubMed]4. Prud’homme, E.; Joussein, E.; Rossignol, S. Use of silicon carbide sludge to form porous alkali-activated materials for insulating
application. Eur. Phys. J. Spec. Top. 2015, 224, 1725–1735. [CrossRef]5. Ducman, V.; Korat, L. Characterization of geopolymer fly-ash based foams obtained with the addition of Al powder or H2O2 as
foaming agents. Mater. Charact. 2016, 113, 207–213. [CrossRef]6. Rao, P.R.; Muralidharan, K.; Momayez, M.; Runge, K.A.; Loy, D.A. Direct foaming driven synthesis and thermophysical
characterization of silica-alumina foams: Applications for thermal insulation. Ceram. Int. 2020, 46, 10431–10441. [CrossRef]7. Korat, L.; Ducman, V. The influence of the stabilizing agent SDS on porosity development in alkali-activated fly-ash based foams.
Cem. Concr. Comp. 2017, 80, 168–174. [CrossRef]8. Traven, K.; Cešnovar, M.; Škapin, S.D.; Ducman, V. Mechanical and Microstructural Properties of Fly Ash-Based Alkali-Activated
Foams Exposed to Room and Elevated Temperatures. In Sheffield, United Kingdom, Book of abstracts of the 74th RILEM Annual Week& the 40th Cement and Concrete Science Conference [Elektronski vir]; The University of Sheffield: Sheffield, UK, 2020.
9. Zhang, Z.H.; Provis, J.L.; Reid, A.; Wang, H. Geopolymer foam concrete: An emerging material for sustainable construction.Constr. Build. Mater. 2014, 56, 113–127. [CrossRef]
10. Hajimohammadi, A.; Ngo, T.; Mendis, P. Enhancing the strength of pre-made foams for foam concrete applications. Cem. Concr.Compos. 2018, 87, 164–171. [CrossRef]
11. Chandra, S.; Berntsson, L. Lightweight Aggregate Concrete; Elsevier: London, UK, 2002. [CrossRef]12. Cheeseman, C.R.; Makinde, A.; Bethanis, S. Properties of lightweight aggregate produced by rapid sintering of incinerator bottom
ash. Resour. Conserv. Recycl. 2005, 43, 147–162. [CrossRef]13. Frankovic, A.; Bokan-Bosiljkov, V.; Ducman, V. Lightweight aggregates made from fly ash using the cold-bond process and their
use in lightweight concrete. Mater. Tehnol. 2017, 51, 267–274. [CrossRef]14. Korat, L.; Ducman, V.; Legat, A.; Mirtic, B. Characterisation of the pore-forming process in lightweight aggregate based on
silica sludge by means of X-ray micro-tomography (micro-CT) and mercury intrusion porosimetry (MIP). Ceram. Int. 2013, 39,6997–7005. [CrossRef]
15. Howard, K. Method for Manufacturing Expanded Polystyrene Foam Components from Used Polystyrene Materials.USO05217660A. 1993. Available online: https://patentimages.storage.googleapis.com/38/74/c0/e31dc824c43b22/US5217660.pdf (accessed on 22 April 2022).
16. Sulong, N.H.R.; Mustapa, S.A.S.; Rashid, M.K.A. Application of expanded polystyrene (EPS) in buildings and constructions: Areview. J. Appl. Polym. Sci. 2019, 136, 47529. [CrossRef]
17. Bui, L.A.; Hwang, C.; Chen, C.; Lin, K.; Hsieh, M. Manufacture and performance of cold bonded lightweight aggregate usingalkaline activators for high performance concrete. Constr. Build. Mater. 2012, 35, 1056–1062. [CrossRef]
18. Uttaravalli, A.N.; Dinda, S.; Gidla, B.R. Scientific and engineering aspects of potential applications of post-consumer (waste)expanded polystyrene: A review. Process Saf. Environ. Prot. 2020, 137, 140–148. [CrossRef]

Polymers 2022, 14, 1729 14 of 14
19. Posi, P.; Teerachanwit, C.; Tanutong, C.; Limkamoltip, S.; Lertnimoolchai, S.; Sata, V.; Chindaprasirt, P. Lightweight geopolymerconcrete containing aggregate from recycle lightweight block. Mater. Des. 2013, 52, 580–586. [CrossRef]
20. Mastali, M.; Kinnunen, P.; Isomoisio, H.; Karhu, M.; Illikainen, M. Mechanical and acoustic properties of fiber-reinforcedalkali-activated slag foam concretes containing lightweight structural aggregates. Constr. Build. Mater. 2018, 187, 371–381.[CrossRef]
21. Wongsa, A.; Sata, V.; Nuakiong, P.; Chindaprasirt, P. Use of crushed clay brick and pumice aggregates in lightweight geopolymerconcrete. Constr. Build. Mater. 2018, 188, 1025–1034. [CrossRef]
22. Medri, V.; Papa, E.; Mazzocchi, M.; Laghi, L.; Morganti, M.; Francisconi, J.; Landi, E. Production and characterization oflightweight vermiculite/geopolymer-based panels. Mater. Des. 2015, 85, 266–274. [CrossRef]
23. Novais, R.M.; Senff, L.; Carvalheiras, J.; Seabra, M.P.; Pullar, R.C.; Labrincha, J.A. Sustainable and efficient cork-inorganic polymercomposites: An innovative and eco-friendly approach to produce ultra-lightweight and low thermal conductivity materials. Cem.Concr. Compos. 2019, 97, 107–117. [CrossRef]
24. Contrafatto, L.; Danzuso, C.L.; Gazzo, S.; Greco, L. Physical, mechanical and thermal properties of lightweight insulating mortarwith recycled Etna volcanic aggregates. Constr. Build. Mater. 2020, 240, 117917. [CrossRef]
25. Liao, Y.C.; Huang, C.Y.; Chen, Y.M. Lightweight aggregates from water reservoir sediment with added sodium hydroxide. Constr.Build. Mater. 2013, 46, 79–85. [CrossRef]
26. Gao, H.; Liu, H.; Liao, L.B.; Mei, L.F.; Lv, G.C.; Liang, L.M.; Zhu, G.D.; Wang, Z.J.; Huang, D.L. Improvement of performance offoam perlite thermal insulation material by the design of a triple-hierarchical porous structure. Energy Build. 2019, 200, 21–30.[CrossRef]
27. Vaou, V.; Panias, D. Thermal insulating foamy geopolymers from perlite. Miner. Eng. 2010, 23, 1146–1151. [CrossRef]28. Papa, E.; Medri, V.; Murri, A.N.; Laghi, L.; De Aloysio, G.; Bandini, S.; Landi, E. Characterization of alkali bonded expanded
perlite. Constr. Build. Mater. 2018, 191, 1139–1147. [CrossRef]29. Duan, P.; Song, L.X.; Yan, C.J.; Ren, D.M.; Li, Z. Novel thermal insulating and lightweight composites from metakaolin geopolymer
and polystyrene particles. Ceram. Int. 2017, 43, 5115–5120. [CrossRef]30. Shi, J.Y.; Liu, B.J.; Liu, Y.C.; Wang, E.L.; He, Z.H.; Xu, H.J.; Ren, X.D. Preparation and characterization of lightweight aggregate
foamed geopolymer concretes aerated using hydrogen peroxide. Constr. Build. Mater. 2020, 256, 119442. [CrossRef]31. Rickard, W.D.A.; Gluth, G.J.G.; Pistol, K. In-situ thermo-mechanical testing of fly ash geopolymer concretes made with quartz
and expanded clay aggregates. Cem. Concr. Res. 2016, 80, 33–43. [CrossRef]32. Rozek, P.; Krol, M.; Mozgawa, W. Lightweight geopolymer-expanded glass composites for removal of methylene blue from
aqueous solutions. Ceram. Int. 2020, 46, 19785–19791. [CrossRef]33. Schumacher, K.; Saßmannshausen, N.; Pritzel, C.; Trettin, R. Lightweight aggregate concrete with an open structure and a porous
matrix with an improved ratio of compressive strength to dry density. Constr. Build. Mater. 2020, 264, 120167. [CrossRef]34. Nicolas, R.S.; Provis, J.L. The interfacial Transition Zone in alkali-activated slag Mortars. Front. Mater. 2015, 2, 70. [CrossRef]35. Lee, W.K.W.; van Deventer, J.S.J. Chemical interactions between siliceous aggregates and low-Ca alkali-activated cements. Cem.
Conc. Res. 2007, 37, 844–855. [CrossRef]36. Fang, G.; Zhang, M. The evolution of interfacial transition zone in alkali-activated fly ash-slag Concrete. Cem. Conc. Res. 2020,
129, 105963. [CrossRef]37. Traven, K.; Cešnovar, M.; Škapin, S.D.; Ducman, V. Evaluation of Fly Ash Based Alkali-Activated Foams at Room and Elevated
Temperatures; Bogataj, M., Kravanja, Z., Novak-Pintaric, Z., Eds.; University of Maribor Press: Portorož, Slovenia, 2020; pp. 75–84.[CrossRef]
38. Ducman, V.; Traven, K.; Cešnovar, M. Alkali-Activated Lightweight Composites Based on Alkali-Activated Foams and Man-ufacturing Process. Slovenian Patent SI 26042 (A), 28 February 2022. Available online: www3.uil-sipo.si/PublicationServer/documentpdf.jsp?iDocId=50296&iepatch=.pdf (accessed on 22 April 2022).
39. Cešnovar, M.; Traven, K.; Horvat, B.; Ducman, V. The Potential of Ladle Slag and Electric Arc Furnace Slag use in SynthesizingAlkali Activated Materials; The Influence of Curing on Mechanical Properties. Materials 2019, 12, 1173. [CrossRef] [PubMed]
40. Method of Testing Cement—Part 2: Chemical Analysis of Cement. EN 196-2; European Committee for Standardization: Bruxelles,Belgium, 2013.
41. Masonry and Masonry Products—Methods for Determining Thermal Properties. EN 1745; European Committee for Standardiza-tion: Bruxelles, Belgium, 2020.
42. Petrella, A.; de Mundo, R.; Notarnicola, M. Recycled Expanded Polystyrene as Lightweight Aggregate for EnvironmentallySustainable Cement Conglomerates. Materials 2020, 13, 988. [CrossRef] [PubMed]
43. Maaroufi, M.; Belarbi, R.; Abahri, K.; Benmahiddine, F. Full characterization of hygrothermal, mechanical and morphologicalproperties of a recycled expanded polystyrene-based mortar. Constr. Build. Mater. 2021, 301, 124310. [CrossRef]