Sintering behavior and microstructural evolution of NbC-Ni ...
184
HAL Id: tel-03116918 https://tel.archives-ouvertes.fr/tel-03116918 Submitted on 20 Jan 2021 HAL is a multi-disciplinary open access archive for the deposit and dissemination of sci- entific research documents, whether they are pub- lished or not. The documents may come from teaching and research institutions in France or abroad, or from public or private research centers. L’archive ouverte pluridisciplinaire HAL, est destinée au dépôt et à la diffusion de documents scientifiques de niveau recherche, publiés ou non, émanant des établissements d’enseignement et de recherche français ou étrangers, des laboratoires publics ou privés. Sintering behavior and microstructural evolution of NbC-Ni cemented carbides. Mathilde Labonne To cite this version: Mathilde Labonne. Sintering behavior and microstructural evolution of NbC-Ni cemented carbides.. Materials Science [cond-mat.mtrl-sci]. Université Grenoble Alpes [2020-..], 2020. English. NNT : 2020GRALI056. tel-03116918
-
Upload
khangminh22 -
Category
Documents
-
view
0 -
download
0
Transcript of Sintering behavior and microstructural evolution of NbC-Ni ...

HAL Id: tel-03116918https://tel.archives-ouvertes.fr/tel-03116918
Submitted on 20 Jan 2021
HAL is a multi-disciplinary open accessarchive for the deposit and dissemination of sci-entific research documents, whether they are pub-lished or not. The documents may come fromteaching and research institutions in France orabroad, or from public or private research centers.
L’archive ouverte pluridisciplinaire HAL, estdestinée au dépôt et à la diffusion de documentsscientifiques de niveau recherche, publiés ou non,émanant des établissements d’enseignement et derecherche français ou étrangers, des laboratoirespublics ou privés.
Sintering behavior and microstructural evolution ofNbC-Ni cemented carbides.
Mathilde Labonne
To cite this version:Mathilde Labonne. Sintering behavior and microstructural evolution of NbC-Ni cemented carbides..Materials Science [cond-mat.mtrl-sci]. Université Grenoble Alpes [2020-..], 2020. English. �NNT :2020GRALI056�. �tel-03116918�

THÈSE
Pour obtenir le grade de
DOCTEUR DE L’UNIVERSITE GRENOBLE ALPES
Spécialité : 2MGE : Matériaux, Mécanique, Génie civil, Electrochimie
Arrêté ministériel : 25 mai 2016
Présentée par
Mathilde LABONNE Thèse dirigée par Jean-Michel MISSIAEN, Professeur, Grenoble-INP et codirigée par Sabine LAY, Directrice de Recherche, CNRS préparée au sein du Laboratoire Science et Ingénierie des Matériaux et Procédés dans l'École Doctorale I-MEP2 – Ingénierie – Matériaux, Mécanique, Environnement, Energétique, Procédés, Production
Frittage et évolution microstructurale de carbures cémentés NbC-Ni. Sintering behavior and microstructural evolution of NbC-Ni cemented carbides. Thèse soutenue publiquement le 20 novembre 2020, devant le jury composé de :
Monsieur, Hans-Olof ANDREN Professeur, Chalmers University of Technology, Suède, Rapporteur
Monsieur, Jozef VLEUGELS Professeur, KU Leuven, Belgique, Rapporteur
Monsieur, Luis Fernando GARCIA Docteur Ingénieur, Hyperion Materials & Technologies, Espagne, Examinateur
Monsieur, Damien FABREGUE Professeur, INSA Lyon, France, Président du jury
Monsieur, Jean-Michel MISSIAEN Professeur, Grenoble INP, Directeur de thèse
Madame, Sabine LAY Directeur de recherche, CNRS, invité


THÈSE
Pour obtenir le grade de
DOCTEUR DE LA COMMUNAUTÉ UNIVERSITÉ GRENOBLE ALPES
Spécialité : 2MGE : Matériaux, Mécanique, Génie civil, Electrochimie
Arrêté ministériel : 25 mai 2016
Présentée par
Mathilde LABONNE
Thèse dirigée par Jean-Michel MISSIAEN, et codirigée par Sabine LAY
Au sein du Laboratoire Science et Ingénierie des Matériaux et Procédés dans l'École
Doctorale I-MEP2 - Ingénierie - Matériaux, Mécanique, Environnement, Energétique, Procédés,
Production
Sintering behavior and microstructural
evolution of NbC-Ni cemented carbides
Thèse soutenue publiquement le 20 novembre 2020
Jury :
M. Hans-Olof Andrén, Professeur, Chalmers university of technology, Rapporteur
M. Jozef Vleugels, Professeur, KU Leuven, Rapporteur
M. Luis Fernando García, Docteur ingénieur, Hyperion Materials & Technologies, Examinateur
M. Damien Fabrègue, Professeur, INSA Lyon, Examinateur
M. Jean-Michel Missiaen, Professeur, Grenoble INP, Directeur de thèse
Mme. Sabine Lay, Directrice de Recherche, CNRS, Invité


This work was carried out at SIMAP laboratory, part of Grenoble INP, Grenoble, France, in
collaboration with Hyperion Materials & Technologies in Martorelles, Spain.

1

2
This thesis is the result of three years of experimental and intellectual work than could not have been
carried out without the help of many great people. In this part, I will try my best to give them the proper
acknowledgement they deserve.
Many ingredients are necessary to complete three years of hard work with a smile on your face. Beyond
any doubt, the most important one is the supervisors. Not only are Jean-Michel and Sabine remarkable
scientists, with an incredibly rich background, but they are also wonderful people. I will miss the long
TEM hours with Sabine discussing a little bit of science and a lot of life, interrupting Jean-Michel
working in his secret office (most PhD students ignore its existence) to tell him about my latest
experimental disaster, and most of all our regular meetings. I have no word to thank you enough for all
you have taught me.
However, I would not have gotten the chance to work with them without the collaboration that was
developed with Hyperion Materials & Technologies in Martorelles, Spain. I am especially grateful to
Nerea García, Olivier Lavigne, Luis García and Elena Tarrés for the time they have dedicated to my
work, always with enthusiasm and remarkable relevance, and for their warm welcome at each of my
visits. I also would like to thank the Hyperion Materials & Technologies team in Grenoble, which
allowed me to perform some experimental work in their facility. A great thank you to Maxime Pellan
who shared is industrial experience with me, and whose thesis work became a great inspiration.
As a great part of my work involved material characterization, I got the chance to work closely with
many engineers and researchers from the CMTC technological platform. All cumulated, I probably have
spent a few weeks working on the Ultra 55 SEM device, and therefore regularly bothered Frédéric and
Rachel. Thank you for your patience and your numerous advices and ideas, which greatly improved my
work. I have equally often worked with Stéphane and Thierry for XRD measurements. There always
were one more sample (or ten more) to analyze, but they have always helped me greatly. At the end of
my first year, we started discussing making a few EBSD measurements to complete my study. It ended
up representing a huge part of my PhD, and none of it would have been possible without Florence.
Thank you for all the time you have dedicated to analyzing my samples, right until the end when it had
gotten so complicated, but also for our talks that I will miss greatly. Finally, a great thank you to the
other members of the team who have helped me occasionally.
Many thanks to the members of my PhD committee. Thank you to Jozef Vleugels and Hans-Olof for
thoroughly reading and correcting my manuscript. Thank you to Luis Fernando García for its great help
throughout the years and for being here for my defense. And finally thank you so much to Damien
Fabrègue for agreeing to chair the jury and for coming in person to the defense.
All things considered, this PhD work was a wonderful experience for me and that is for the most part
thanks to the wonderful SIMaP laboratory people, especially the GPM2 group team. First, a huge thanks
to the researchers for creating an atmosphere where PhD students feel welcomed and included. I never
once hesitated to ask for help from anyone of you, and I had a wonderful time drinking coffee in your
company. A special thank you for Annie Antony who helped greatly with the thermodynamical
calculations.
Acknowledgements

Acknowledgements
3
Secondly, I want to acknowledge the great help and knowledge I received from the technical support
team. Thank you to Franck for trusting me with many experimental devices, and for always welcoming
with a smile my many requests. Now has come the time for me to thanks Xavier. Our first proper
encounter was standing in front of a capricious dilatometry device, and at that time I had no idea that he
would become the great friend he is to me now. Thank you for the tremendous amount of help you gave
me, and I hope from the bottom of my heart that we will remain close friends for many years to come.
Last from the lab, but clearly not least, I would like to thank all the PhD student and Post-docs students
that I had the chance to encounter during those three years. To begin with, the first reason I ended up in
SIMaP is Zoé. As I was considering leaving my job in Paris to start a PhD, she kindly offered to present
my resumé to her supervisors, who are now my supervisors. She is a wonderful friend, and I am
immensely grateful we worked together for two years. Then, there is Jessica who left me little drawings
on my desk to cheer me up, Guillaume C. my green room comrade who never left my side, Tristan who
somehow became one of my best friends in a matter of seconds, Pauline who gave me climbing spots
ideas at parties while joyfully singing along Celine Dion, Kaoutar who taught me how to be strong,
Loicia who has been pushing me to become a better climber and Sims 2 house builder, Eliott my future
dog-sitter, Hélène who has a heart so big it sometimes crumbles, Emeric who taught me so many time-
saving things, Bruno who has the spiciest sense of humor, Sarah who has bravely tried to teach me how
to dance, Corentin with whom I love arguing, especially about movies, Maxime thanks to whom I got
abs at the end of the confinement, Alizée who is a great pirate, Nicolas who has a wonderful sense of
curiosity when he is not grumbling around, Guillaume H. without whom I would never have finished
Hollow Knight, Joe who is speaking a way better French that what he is going to pretend at his defense,
Alexis L. who loves Top Chef has much has I do, Alexis B. who made me somehow fascinated with ice
cubes, Thibault who is always supporting me and my sushi cravings, Mathis who is a hair genius, Arthur
who loves defending the indefensible and Maxence whose enthusiasm will lead to greatness. And so
many others, that made the SIMaP lab a great place to work. Thank you to all of you, you are wonderful
people. I wish you the best for many years to come and hope our paths will cross again.
Finally, a huge thanks to my family and friends for supporting me during those three years, especially
during these last months where I was not always the most charming person. I was born with a wonderful
brother, François, and I got a sister at age 3, Hélène, even though she first appeared as just a friend. They
are pillars in my life, and I will never crumble as long as they stand. Thank you for your infinite kindness.
I would also like to give a big thanks to my parents, Véronique and Jean-Philippe, even if they did not
quite understand what my work was about, they have always encouraged me to reach higher and to
become an accomplished person. I would also like to have a tender thought toward my grandparents,
Jean-Emile and Jeanine, whose light will always warm my heart.
I got the chance to become part of a great group of friends during my engineering study in Phelma, and
even if I do not see them as much as I would like, they give me infinite amounts of joy and support.
Thank you to Julie, Marie, Solenne, Thibault, Warren, Adrien, Audrey, Julien, Lois, Justin and Alexis.
I hope we get to share many more memories together.
Last but not least, I want to thank my partner in crime, Guillaume. I have not always been the loveliest
person in the last few months, I even have had little crazy moments, but he has been there for me no
matter what. I am the luckiest of girls to have him around. Thank you, and I can’t wait to face the rest
of life with you.
Acknowledgements
4
Table of content Introduction ................................................................................................................................................... 9
I. Bibliography ............................................................................................................................................. 13
I.A. Cemented carbides ............................................................................................................................. 13
I.A.1 Context ......................................................................................................................................... 13
I.A.1.a History of hardmetals ............................................................................................................ 13
I.A.1.b Present economical context for WC-Co materials and NbC based alternative ..................... 13
I.A.2 Niobium based cemented carbides............................................................................................... 14
I.A.2.a Production of niobium carbides ............................................................................................ 14
I.A.2.b General properties of NbC .................................................................................................... 15
I.A.3 NbC-M cemented carbides .......................................................................................................... 17
I.A.4 The NbC-Ni system ..................................................................................................................... 18
I.A.4.a Phase diagrams ..................................................................................................................... 18
I.A.4.b Effect of the carbon content .................................................................................................. 19
I.B Sintering of cemented carbides ........................................................................................................... 20
I.C Grain growth ....................................................................................................................................... 24
I.C.1 Grain growth mechanism ............................................................................................................. 25
I.C.1.a Ostwald ripening (LSW theory) ............................................................................................ 25
I.C.1.b Abnormal grain growth and 2D nucleation on faceted grains .............................................. 26
I.C.1.c Binder volume fraction & contiguity .................................................................................... 28
I.C.2 Grain growth in NbC based cemented carbides ........................................................................... 31
I.C.2.a Microstructure & kinetics ..................................................................................................... 31
I.C.2.b Temperature .......................................................................................................................... 34
I.C.2.c Carbon content ...................................................................................................................... 36
I.C.2.d Effect of secondary carbide additions ................................................................................... 37
I.D Mechanical properties ......................................................................................................................... 41
I.D.1 Hardness & Toughness in NbC based materials .......................................................................... 41
I.D.2 Other mechanical properties in NbC based materials .................................................................. 45
II. Method & Materials ............................................................................................................................... 47
II.A. Sample preparation ........................................................................................................................... 47
II.A.1 Compositions .............................................................................................................................. 47
II.A.2 Raw materials ............................................................................................................................. 49
II.A.3 Powder mixing ........................................................................................................................... 50
II.A.3 Powder compaction .................................................................................................................... 51

Acknowledgements
5
II.B Thermal cycles ................................................................................................................................... 53
II.B.1 Thermal cycle atmospheres ........................................................................................................ 53
II.B.2 Two-step thermal cycles ............................................................................................................. 58
II.B.2.a Debinding cycle ................................................................................................................... 58
II.B.2.b Sintering cycles ................................................................................................................... 59
II.B.3 Industrial cycle ........................................................................................................................... 61
II.C Experimental characterization techniques ......................................................................................... 62
II.C.1 Sintering study ............................................................................................................................ 62
II.C.1.a Thermogravimetric Analysis ............................................................................................... 62
II.C.1.b Dilatometry .......................................................................................................................... 63
II.C.2 Carbon content measurements .................................................................................................... 64
II.C.3 Microstructural study .................................................................................................................. 65
II.C.3.a Sample preparation .............................................................................................................. 65
II.C.3.b XRD ..................................................................................................................................... 66
II.C.3.c SEM & EDS ........................................................................................................................ 66
II.C.3.d TEM & EDS ........................................................................................................................ 67
II.C.3.e EBSD ................................................................................................................................... 68
II.C.4 Mechanical Study ....................................................................................................................... 68
II.D EBSD Image analysis ........................................................................................................................ 68
II.D.1 Data acquisition .......................................................................................................................... 69
II.D.2 Data cleaning and pre-processing ............................................................................................... 70
II.D.3 Processing and Grain size distribution ....................................................................................... 71
II.D.4 Contiguity ................................................................................................................................... 74
III. Sintering & microstructure evolution of NbC-0.5vol%WC-12vol%Ni ........................................... 75
III.A. Physical and chemical transformations during heating ................................................................... 75
III.A.1 Mass loss during debinding and sintering ................................................................................. 75
III.A.2 Carbon loss ................................................................................................................................ 76
III.B Sintering ........................................................................................................................................... 77
III.C Microstructure characteristics........................................................................................................... 77
III.D Discussion ........................................................................................................................................ 80
IV. Effect of the carbon content in (NbC-3%Mo2C)-0.5vol%WC-12vol%Ni ....................................... 83
IV.A. Physical and chemical transformations during heating ................................................................... 84
IV.A.1 Mass loss during sintering ........................................................................................................ 84
IV.A.2 Carbon content after sintering ................................................................................................... 85
IV.B Sintering ........................................................................................................................................... 86

Acknowledgements
6
IV.C Microstructural evolutions ............................................................................................................... 88
IV.C.1 Microstructural analysis ............................................................................................................ 88
IV.C.2 Effect of decarburizing on graphite distribution in C-rich compositions .................................. 92
IV.D Mechanical properties ...................................................................................................................... 94
IV.E Discussion ........................................................................................................................................ 94
IV.E.1 General discussion ..................................................................................................................... 94
IV.E.2 Localization of the studied compositions with respect to the phase diagram ............................ 98
V. Effect of Mo2C addition in NbC-0.5vol%WC-12vol%Ni addition effect ........................................ 103
V.A Physical and chemical transformations during heating ................................................................... 103
V.A.1 Mass loss .................................................................................................................................. 103
V.A.2 Carbon content after sintering .................................................................................................. 104
V.B Sintering .......................................................................................................................................... 104
V.C Microstructural evolutions ............................................................................................................... 105
V.C.1 Effect of Mo2C addition ........................................................................................................... 106
V.C.2 Grain boundary and phase boundary analysis .......................................................................... 110
V.C.3 Temperature dependent microstructural evolution ................................................................... 113
V.D Mechanical properties ..................................................................................................................... 116
V.E Discussion ........................................................................................................................................ 117
VI. Grain growth in NbC-12vol%Ni – Effect of Mo2C and WC additions .......................................... 121
VI.A. Studied compositions .................................................................................................................... 121
VI.B Microstructure ................................................................................................................................ 121
VI.B.1 NbC-12vol%Ni ....................................................................................................................... 121
VI.B.2 NbC-12vol%Ni with WC and Mo2C additions ....................................................................... 123
VI.C Evolution of grain size ................................................................................................................... 124
VI.C.1 NbC-12vol%Ni ....................................................................................................................... 124
VI.C.2 NbC-12vol%Ni with WC and Mo2C additions ....................................................................... 127
VI.D Contiguity ...................................................................................................................................... 130
VI.D.1 NbC-12vol%Ni ....................................................................................................................... 130
VI.D.2 NbC-12vol%Ni with WC and Mo2C additions ....................................................................... 131
VI.E Discussion ...................................................................................................................................... 132
VI.E.1 Grain growth mechanisms in NbC-12vol%Ni ......................................................................... 132
VI.E.2 Modelling of grain growth in systems with cooperative migration ......................................... 137
VI.E.3 Grain growth in NbC-12vol%Ni with WC or Mo2C additions ............................................... 141
Conclusion & Perspectives ....................................................................................................................... 143
References .................................................................................................................................................. 147

Acknowledgements
7
Appendix 1 – Literature summary table ................................................................................................. 153
Appendix 2 – Toughness from Vickers indentations .............................................................................. 157
Appendix 3 – Thermodynamic calculations ............................................................................................ 159
Appendix 4 – EBSD data treatment ........................................................................................................ 161
A4.1 Data cleaning and pre-processing .............................................................................................. 161
A4.2 Processing and Grain size distribution ....................................................................................... 162
A4.3 Aphelion code for processing ..................................................................................................... 163
Appendix 5 – 3D size distribution reconstruction .................................................................................. 169
A5.1 Saltykov method ........................................................................................................................ 169
A5.2 Regression method ..................................................................................................................... 170
Appendix 6 – Nickel grain size ................................................................................................................. 171
Appendix 7 – Effect of decarburizing on graphite distribution in C-rich compositions - Calculations
..................................................................................................................................................................... 173
Appendix 8 – Chemical effect on interface energy for systems with mutual solubility ....................... 175

Acknowledgements
8
9
Introduction
For more than 70 years, WC-Co materials have been used worldwide for numerous applications in
tooling, mining equipment, wear parts and many other industrial applications. Their strong hardness and
wear resistance, combined with an overall good toughness, and their relative cheapness, especially
compared to diamond tooling, have made them a major industrial material. Therefore, many studies
have been carried out over the years to understand their properties, and to develop WC-Co materials
adapted for every application. To only state a few, mixed WC-Co materials with secondary carbides
such as TiC, NbC or VC were developed, alternative binders were investigated, such as nickel and iron,
and the effect of the size distribution of WC powder particles was analyzed, leading to the development
of bimodal distributions materials. However, in most applications, tungsten carbide remains the main
ingredient in cemented carbides.
Unfortunately, it has been recently determined that the cobalt and tungsten oxides present risks and
health issues. Notably, the European commission classified cobalt as a carcinogenic component in 2013,
strongly advising industries to find alternatives to this element. Furthermore, the worldwide demand for
tungsten and cobalt has been continuously increasing, although the mining stocks of both elements are
limited, which led to regular price increases over the years. This global context has led industrial
companies to investigate alternative carbide based materials.
Niobium carbides are increasingly considered to replace tungsten carbides for specific applications.
Although those carbides present a slightly lower hardness, they have remarkable wear properties and
are twice less dense than WC. Furthermore, no particular health hazards were identified for the use of
bulk metallic niobium, niobium carbides and niobium oxides (mostly Nb2O5), and those components are
fully REACH-registered [1]. In the 60’s and 70’s, NbC based cemented carbides were already
investigated, alongside tungsten carbides. However, the prohibitive availability of niobium and the
resulting high prices at the time led researchers and companies to focus their attention on WC-Co
materials. The situation has changed in the last 40 years, since large stocks of niobium have been
discovered in Brazil, which led to a price drop, and made it economically competitive in comparison
with tungsten.
Different binders were tested to be combined with niobium carbides in recent years, to compensate for
their brittleness. Good properties were obtained with nickel and cobalt binders, both classically used
with WC. However, as previously stated, the use of cobalt presents significant health hazard, and thus
the use of this binder should be avoided. Iron based binders such has steel were also investigated with
mitigated results.
Previous studies of NbC based materials have mostly focused on the microstructures and the resulting
mechanical properties, notably the hardness, toughness and wear properties. However, the sintering
process of niobium carbide based cemented carbides and the grain growth mechanism involved have
not yet been fully investigated. The present study aims to analyze the sintering behavior and grain
growth of NbC-Ni materials. Different secondary carbides are added to limit the grain size. The effect
of addition of different quantities of Mo2C will notably be investigated. A particular focus will also be
made on the grain growth in such materials. Furthermore, the effect of carbon content will be

Introduction
10
investigated, as the carbon window for the two-phase (NbC + Ni) domain is much wider than for WC +
Co.
The first chapter aims to give the necessary background to understand this study, and a general overview
of what has been done regarding NbC-based materials in the literature in the last 70 years. The context
for NbC based materials is presented, with a comparison of the NbC and WC general properties. Then,
the thermodynamic behavior of a NbC-Ni system is introduced. In a second part, a general presentation
of sintering and grain growth mechanisms is given, and then linked to the sintering and grain growth
behavior observed so far in NbC based materials. The effects of the temperature, the carbon content and
the addition of secondary carbides are detailed. Finally, the mechanical behavior of NbC based materials
is discussed, and compared to what is obtained for WC based materials.
In a second chapter, the materials, processing methods and characterization techniques are detailed. The
compositions and the processing of the raw powders up to compression, debinding and sintering are
presented. A thermodynamic analysis is introduced to justify the thermal cycles used in this study. Then,
the characterization techniques to track the sintering process and to analyze the microstructures are
listed. Finally, the image analysis method used to process EBSD maps is explained, from the acquisition
method and image cleaning, up to the grain size quantification and contiguity measurements.
A NbC-0.5vol%WC-12vol%Ni reference composition was chosen for this study, and is analyzed and
compared to other compositions in the following chapters. The third chapter presents its debinding and
sintering behavior, microstructure and mechanical properties. The debinding process is particularly
investigated.
The carbon content in carbides can have a significant impact on the microstructures and the resulting
mechanical properties. Its impact on the sintering behavior, microstructures and mechanical properties
of NbC-Ni materials is studied in chapter IV. A range of compositions was chosen with different carbon
contents, with the help of a thermodynamic phase diagram. The relationship between the measured
carbon contents in sintered materials, the observed microstructures and properties, and the
thermodynamic phase diagram is then discussed.
The fifth chapter focuses on the effect of secondary carbides addition to the reference mix NbC-
0.5vol%WC-12vol%Ni studied in chapter III. Mo2C is added in different quantities to this mix. The
sintering behavior, microstructures and mechanical properties with different Mo2C content are analyzed.
The effect of addition of the secondary carbide on grain growth is particularly investigated. To
understand the impact of this addition on the sintering process, interrupted test are performed. A low
scale microstructural study of the interfaces is also carried out to localize the repartition of Mo after the
dissolution of Mo2C carbides.
The last chapter focuses on the grain growth behavior of NbC based materials. For this study, samples
of a NbC-12vol%Ni composition, without WC, are sintered with different dwelling times at 1360°C.
2D and 3D grain size distributions as well as the contiguity of the carbide phase and the binder volume
fraction are determined from EBSD maps. To determine the grain growth mechanisms involved, grain
growth constants are estimated from literature data and from microstructural parameters. The
experimental growth rates are then compared to the theoretical growth rate derived from these constants.
Finally, a model is proposed to analyze the respective contributions of phase boundary migration and

Introduction
11
grain boundary migration on grain growth, and to explain the discrepancy between our experimental
growth rate results and the predictions of simple models from the literature.

Introduction
12
13
I. Bibliography
I.A. Cemented carbides
I.A.1 Context
I.A.1.a History of hardmetals
The first hardmetals were developed after the First World War to replace diamond drawing dies which
were very costly [2]. Tungsten carbide was considered due to its high hardness. To reduce its brittleness,
it was first combined with Fe or Ni, but results were inconclusive. Combined with cobalt, it however
gave impressive results and thus a first patent was filed by Schröter in 1923 [3]. The first production of
such material was made by the Krupp Company in 1926 under the trade name “WIDIA”, created from
the German word “wie” and “diamant”, meaning literally diamond-like [2].
During the Second World War, Germany and Austria both suffered severe shortages of tungsten, leading
to researches for tungsten-free hardmetals [4]. In the late 60s and early 70s, other carbides were
considered to produce hardmetals by Warren, including NbC combined with Co [5], Ni or Fe [6], but
also VC [7], TaC or Mo2C, and mixed carbides [8]. However, no industrial interest emerged for these
materials as the properties of WC-Co materials were constantly improved by secondary carbide
additions as grain growth inhibitors [2] or by refining the initial powders grain size [4], combined with
new sintering processes.
I.A.1.b Present economical context for WC-Co materials and NbC based alternative
Both cobalt and tungsten were classified as CRM (Critical Raw Materials) by the European commission
in 2014 [9] and again in 2017 [10]. The demand for both those elements is strong although the mining
stocks of virgin materials are limited, leading to regular prices increase over the last 50 years [11].
In addition, it was determined in the last 20 years that the use of cobalt and tungsten oxides presents
risks and health issues [12][13]. The exposition to metallic dust is indeed a major issue in the processing
of hardmetals. Recently, the tungsten trioxide (WO3) and the tricobalt tetraoxide (Co3O4) have been
identified as having a mutagenic, carcinogenic and reproductive toxicity in the frame of the European
‘Registration, Evaluation, Authorization and Restriction of Chemical Substances Program’, also known
under the acronym REACH [14]. Both those oxides can be secondary products of the WC-Co cemented
carbides production. Tungsten carbide and bulk cobalt metal have however not yet been restricted by
any important classifications.
Consequently to those limitations, alternative materials to WC-Co are investigated, among which WC
combined with an alternative binder [15] or NbC based materials. Niobium is also from the groups IVB
to VIB in the periodic table that is known to give very hard carbides, superior to that of most minerals.

I. Bibliography
14
Its density is half the tungsten carbide density, which could be advantageous for a number of
applications. It also presents an impressive wear resistance [1]. However, little attention has been drawn
to the niobium carbide in the past by industrials, probably because of the prohibitive availability and
prices at the time.
Nowadays, stocks and resources of niobium are significant: up to 3.8 billion tons in 2009, mainly from
Brazil [16]. This lead to a drop of the metallic niobium price compared to tungsten in the 80s [11]. It is
therefore more and more attractive for companies to consider niobium containing materials. Bulk
niobium, niobium carbides and niobium oxides (mostly Nb2O5) are fully REACH-registered and so far
no particular hazards or critical notifications were filed [1]. Although niobium is considered as a CRM
by the European commission, it is mostly for its ferroniobium form [11], not its metallic or carbide form.
NbC is preferentially combined with a nickel binder because nickel does not have hazardous
classification contrary to cobalt [9], and because of its significantly lower price [17].
I.A.2 Niobium based cemented carbides
I.A.2.a Production of niobium carbides
Niobium, also known as columbium, is extracted at 96% from a specific ore: The pyrochlor of formula
(Na,Ca,Ba)(Nb,Ta)2O6Z (where Z = O, OH, F), a cubic mineral that is combined with microlite
(tantalum) in solid solution. This ore is found in geological formation called “carbonites” which contains
from 0,5% to 5% of Nb2O5 (niobium pentoxide). The remaining 4% comes from Columbite
(Fe,Mn)(Nb,Ta)2O6 [18] [16].
At first, pyrochlor is scattered in a carbonated gangue with other minerals (sulfides…). To extract
niobium from it, the following process is generally applied [18]: Rocks are crushed to separate different
minerals. Then, a first flotation eliminates the carbonates, then the magnetic minerals are separated, and
then a second flotation in oxalic acid and H2SiF6 leads to the extraction of pyrochlor and sulfides.
Finally, a leaching with hydrochloric acid is performed to eliminate the last traces of carbonates &
sulfides. The obtained product contains 60-65wt.% Nb2O5, 10-15wt.% CaO or BaO and traces of Na2O,
SiO2 and Fe2O3.
Nb2O5 is the raw material for niobium carbide production. It is reduced to obtain either metallic niobium
or niobium carbides. One process to obtain NbC is the carbo-thermal reduction of Nb2O5 under vacuum
at high temperature (above 800°C), see formula (I-1) [1].
Nb2O5 + 7C → 2NbC + 5CO (I-1)
However, those reactions do not represent the actual steady state reaction since the process is controlled
by gas-solid phase reaction. The correct reactions to take into account to describe the carbo-thermal
reduction of Nb2O5 into NbC are formulas (I-2) and (I-3) [1].
Nb2O5 + 9CO → 2NbC + 7CO2 (I-2)
7CO2 + 7C → 14CO (I-3)
I. Bibliography
15
I.A.2.b General properties of NbC
Niobium corresponds to the chemical element with atomic number 41, one of the transition elements
from the Vth column. It is one of the lightest refractory element. It conducts heat and electricity, is
highly resistant to chemical environments and can be very hard.
In order to elaborate a NbC-based hard material as an alternative to WC-based hardmetals for specific
applications, it is essential to describe what are the advantages and disadvantages of both carbides.
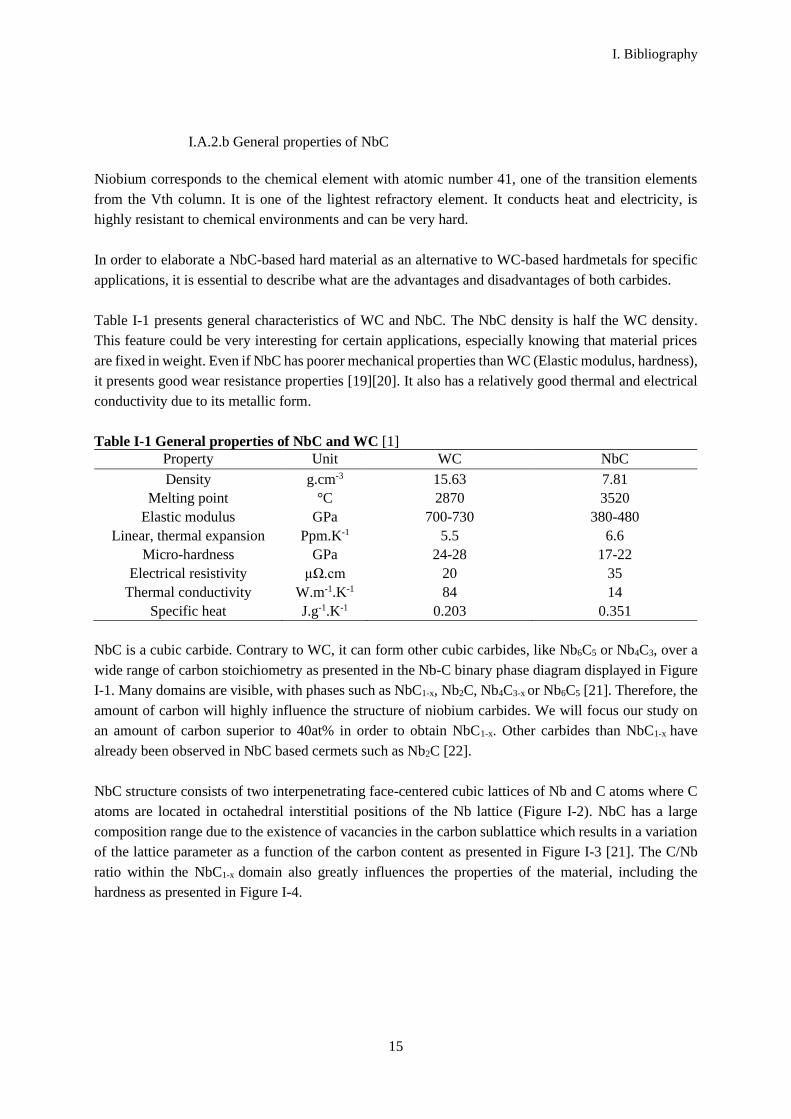
Table I-1 presents general characteristics of WC and NbC. The NbC density is half the WC density.
This feature could be very interesting for certain applications, especially knowing that material prices
are fixed in weight. Even if NbC has poorer mechanical properties than WC (Elastic modulus, hardness),
it presents good wear resistance properties [19][20]. It also has a relatively good thermal and electrical
conductivity due to its metallic form.
Table I-1 General properties of NbC and WC [1]
Property Unit WC NbC
Density g.cm-3 15.63 7.81
Melting point °C 2870 3520
Elastic modulus GPa 700-730 380-480
Linear, thermal expansion Ppm.K-1 5.5 6.6
Micro-hardness GPa 24-28 17-22
Electrical resistivity µΩ.cm 20 35
Thermal conductivity W.m-1.K-1 84 14
Specific heat J.g-1.K-1 0.203 0.351
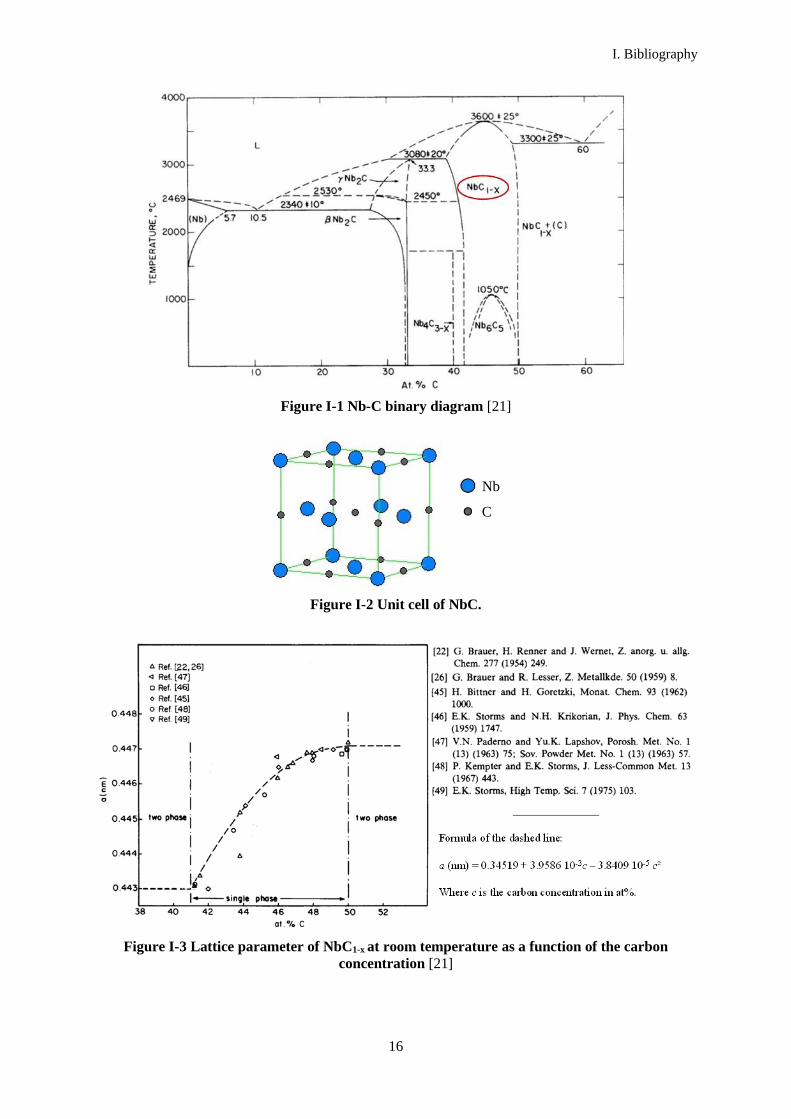
NbC is a cubic carbide. Contrary to WC, it can form other cubic carbides, like Nb6C5 or Nb4C3, over a
wide range of carbon stoichiometry as presented in the Nb-C binary phase diagram displayed in Figure
I-1. Many domains are visible, with phases such as NbC1-x, Nb2C, Nb4C3-x or Nb6C5 [21]. Therefore, the
amount of carbon will highly influence the structure of niobium carbides. We will focus our study on
an amount of carbon superior to 40at% in order to obtain NbC1-x. Other carbides than NbC1-x have
already been observed in NbC based cermets such as Nb2C [22].
NbC structure consists of two interpenetrating face-centered cubic lattices of Nb and C atoms where C
atoms are located in octahedral interstitial positions of the Nb lattice (Figure I-2). NbC has a large
composition range due to the existence of vacancies in the carbon sublattice which results in a variation
of the lattice parameter as a function of the carbon content as presented in Figure I-3 [21]. The C/Nb
ratio within the NbC1-x domain also greatly influences the properties of the material, including the
hardness as presented in Figure I-4.
I. Bibliography
16
Figure I-1 Nb-C binary diagram [21]
Figure I-2 Unit cell of NbC.
Figure I-3 Lattice parameter of NbC1-x at room temperature as a function of the carbon
concentration [21]
Nb
C

I. Bibliography
17
Figure I-4 Hardness of niobium carbides as a function of the C/Nb ratio [23].
I.A.3 NbC-M cemented carbides
NbC-M cemented carbides can be obtained by adding to NbC a metallic binder M, to compensate for
the brittleness of NbC. The metallic phase spreads into the microstructure during the sintering process,
filling pores and wetting carbides. The formation of a eutectic liquid during the process leads to fully
dense samples after liquid phase sintering (LPS). The choice of the binder is therefore essential to obtain
fully dense materials with good mechanical properties.
The binder must have a good wettability toward the carbide grains to ensure a good cohesion of the
material, and therefore good mechanical properties, and to facilitate solid state and liquid phase
spreading into the porosity [24]. It can indeed be shown that the driving force for the densification during
sintering is a function of the surface energy of the binder or liquid phase and of its contact angle on the
carbide surface, which characterizes the wettability [8]. Experimental values of wetting angles θ and
adhesion energies Wad for Ni or Co binders are presented in Table I-2.
Table I-2 Experimental values of wetting angles θ (°) and adhesion energies Wad (J/m²) for a range
of carbides bonded with Co or Ni [25].
WC TiC TaC VC NbC Mo2C
Co wetting θ (°) 0a 25a / 26 ± 2b 13a 13a,b 14a / 11.5 ± 1b 0a
Wad (J/m²)a 3.82 3.64 3.77 3.77 3.76 3.82
Ni wetting θ (°)a 0 23 16 17 18 0
Wad (J/m²)a 3.62 3.47 3.55 3.54 3.53 3.62 a performed at 1420°C for Co and 1380°C for Ni [26]. b performed at 1380°C for VC, 1420°C for WC, 1450°C for TiC, TaC and NbC [8].
The solubility is also a key factor in the choice of a binder. First, a high solubility of the binder phase in
the carbides must be avoided as it can lead to the formation of porosities and to a swelling [24]. On the
contrary, a high solubility of the carbide in the binder facilitates LPS. It also enhances grain growth by
solution-reprecipitation [24]. Finally, for a material with secondary carbide addition, the solubility of
carbides in the binder and in the carbides impacts significantly the microstructure (grain size, formation
of core-rim structures [27]) and thus the final mechanical properties of the material [28]. Table I-3
presents the solubility of different carbides in two binders, nickel and cobalt.

I. Bibliography
18
Table I-3 Solubility of carbides and TiN in liquid binder metals at 1400°C in wt% [29]
Binder Co Ni
Compound TiC TiN VC NbC TaC Mo2C WC TiC TiN VC NbC TaC Mo2C WC
Solubility at% 10 <0.5 18 4.8 1.9 11 12 11 <0.5 13 3.9 1.9 10 8
The most used binders combined with WC are cobalt, nickel and iron [30] and can also be considered
for NbC-based cemented carbides. Both Co and Ni binders have a good wettability for NbC (Table I-2)
and can dissolve a significant amount of carbide in the liquid state (Table I-3). As previously mentioned,
cobalt has been classified as carcinogenic by the REACH program and iron is known for its poor
resistance toward corrosion. Therefore, a nickel binder is chosen and will be investigated in the rest of
this study. It can nevertheless be noted that other iron-based materials were also considered as potential
binders in the literature, such as stainless steel (316L) [31], Fe3Al [32][22] or high speed steel [33][34].
I.A.4 The NbC-Ni system
I.A.4.a Phase diagrams
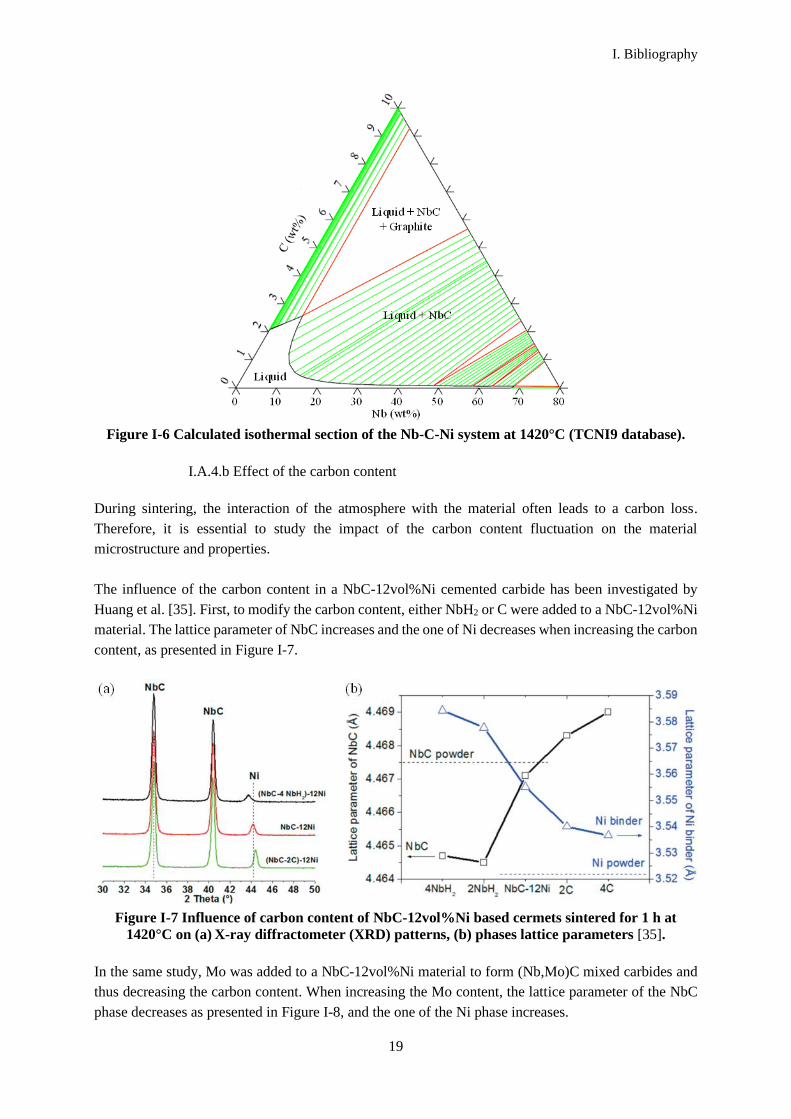
Figure I-5 presents an isopleth section of the ternary Nb-C-Ni phase diagram at 12vol%Ni, calculated
with Thermocalc from the database TCNI9. Figure I-6 presents a 1420°C isothermal section of this
ternary diagram. These diagrams show that the domain of existence of nickel and NbC is rather large in
term of carbon content, which is consistent with the possibility to have a non-stoichiometric NbC
carbide, as discussed previously.
Figure I-5 Calculated isopleth section of the ternary Nb-C-Ni phase diagram for a NbC-
12vol%Ni system (TCNI9 database).
I. Bibliography
19
Figure I-6 Calculated isothermal section of the Nb-C-Ni system at 1420°C (TCNI9 database).
I.A.4.b Effect of the carbon content
During sintering, the interaction of the atmosphere with the material often leads to a carbon loss.
Therefore, it is essential to study the impact of the carbon content fluctuation on the material
microstructure and properties.
The influence of the carbon content in a NbC-12vol%Ni cemented carbide has been investigated by
Huang et al. [35]. First, to modify the carbon content, either NbH2 or C were added to a NbC-12vol%Ni
material. The lattice parameter of NbC increases and the one of Ni decreases when increasing the carbon
content, as presented in Figure I-7.
Figure I-7 Influence of carbon content of NbC-12vol%Ni based cermets sintered for 1 h at
1420°C on (a) X-ray diffractometer (XRD) patterns, (b) phases lattice parameters [35].
In the same study, Mo was added to a NbC-12vol%Ni material to form (Nb,Mo)C mixed carbides and
thus decreasing the carbon content. When increasing the Mo content, the lattice parameter of the NbC
phase decreases as presented in Figure I-8, and the one of the Ni phase increases.

I. Bibliography
20
Figure I-8 Influence of Mo content on the phases lattice parameter of NbC-12vol%Ni based
cermets sintered for 1 h at 1420°C. [35].
In both cases, the decrease of the carbon content increases the metallic solubility in the binder and thus
a swelling of the nickel lattice parameter is observed. As previously stated for pure NbC in part I.A.2.b,
the lattice parameter of NbC decreases when decreasing the carbon content, due to the formation of sub-
stoichiometric carbides (see Figure I-3).
I.B Sintering of cemented carbides
Sintering of cemented carbides usually occurs with two main steps. During this solid state sintering step,
the binder spreads into the porosity resulting in particle rearrangement and densification. A solution-
reprecipitation process also takes place which modifies the grain shape and the grain size distribution
and assists particle rearrangement. Then, the formation of a eutectic liquid results from the dissolution
of carbide atoms in the binder. Particle rearrangement and solution-precipitation mechanisms are then
strongly accelerated, filling the remaining large porosities. The microstructure evolution during solid
state and liquid phase sintering is summarized in Figure I-9.

I. Bibliography
21
Figure I-9 Microstructure evolution during sintering in cemented carbides [36].
Major porosities often remain after solid state sintering as presented in Figure I-10, which are eliminated
during liquid phase sintering.
Figure I-10 Schematic of the solid state sintering mechanism, (a-d) Solid state sintering of
carbide particles (white) with a binder phase (grey) into agglomerates, (e) The resulting
structure consists of a network of dense carbide-binder agglomerates that sinter as large
particles. A large peripheral porosity exists between the agglomerates [37].
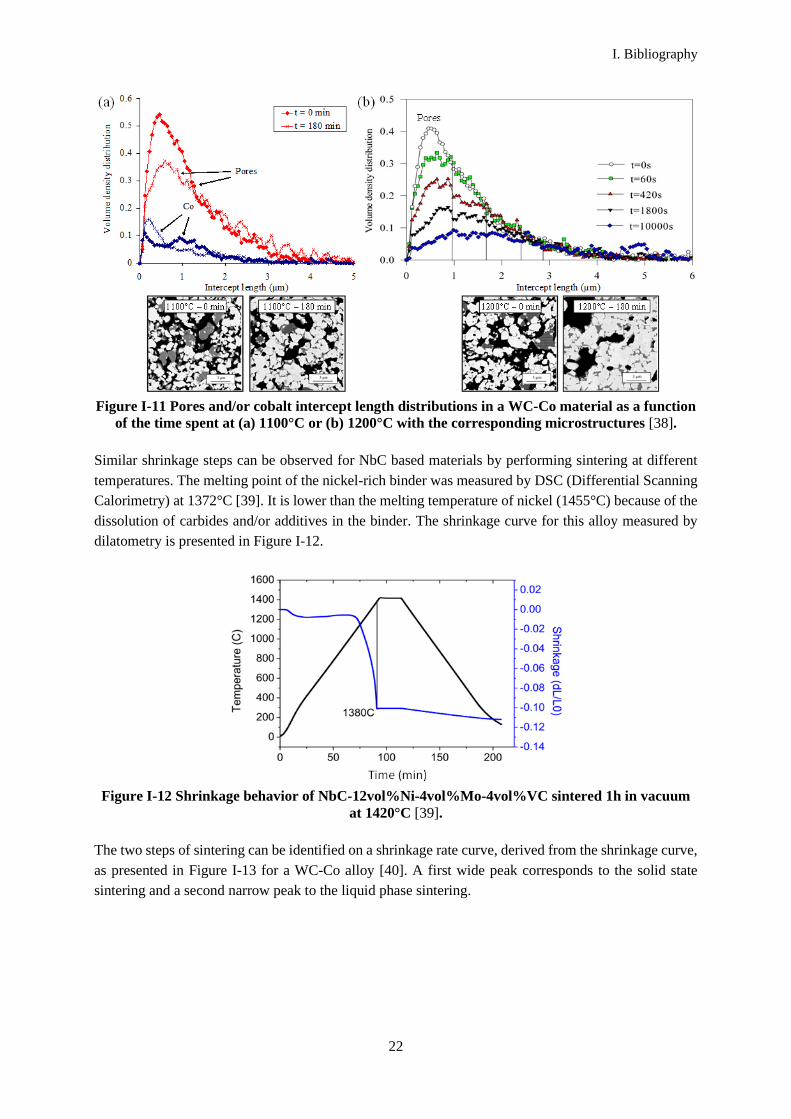
These large pores have been observed during solid state sintering in WC-Co alloys as presented in Figure
I-11. The finest pores are filled with cobalt, and pores of increasing size disappear when increasing the
sintering time. A population of large pores remains even after a few hours at high temperature in solid
state sintering.
I. Bibliography
22
Figure I-11 Pores and/or cobalt intercept length distributions in a WC-Co material as a function
of the time spent at (a) 1100°C or (b) 1200°C with the corresponding microstructures [38].
Similar shrinkage steps can be observed for NbC based materials by performing sintering at different
temperatures. The melting point of the nickel-rich binder was measured by DSC (Differential Scanning
Calorimetry) at 1372°C [39]. It is lower than the melting temperature of nickel (1455°C) because of the
dissolution of carbides and/or additives in the binder. The shrinkage curve for this alloy measured by
dilatometry is presented in Figure I-12.
Figure I-12 Shrinkage behavior of NbC-12vol%Ni-4vol%Mo-4vol%VC sintered 1h in vacuum
at 1420°C [39].
The two steps of sintering can be identified on a shrinkage rate curve, derived from the shrinkage curve,
as presented in Figure I-13 for a WC-Co alloy [40]. A first wide peak corresponds to the solid state
sintering and a second narrow peak to the liquid phase sintering.

I. Bibliography
23
Figure I-13 Shrinkage (%) and shrinkage rate (%/min) of a WC-Co alloy [40].
Sintering starts after all surface metallic oxides have been reduced since oxides prevent wetting by the
binder phase. It has been observed in WC-Co alloys as presented in Figure I-14 [41]. There are three
peaks of oxide reduction on the mass loss rate curve, identified as such because of CO and CO2
emissions. As soon as all oxides are reduced, a shrinkage is observed on the shrinkage rate curve,
corresponding to the beginning of solid state sintering.
Figure I-14 Sintering of WC-Co material doped with C and Cr [41].
An example of the obtained microstructures for a NbC-12vol%Ni-4vol%Mo-4vol%VC sintered at
different temperatures is presented in Figure I-15. The final material is composed of two phases, a
carbide and a binder phase, respectively light grey and dark grey on Figure I-15 (d).

I. Bibliography
24
Figure I-15 Microstructures of NbC-12vol%Ni-4vol%Mo-4vol%VC sintered 1h in vacuum at
(a) 1300°C, (b) 1340°C, (c) 1380°C, (d) 1420°C [39].
I.C Grain growth
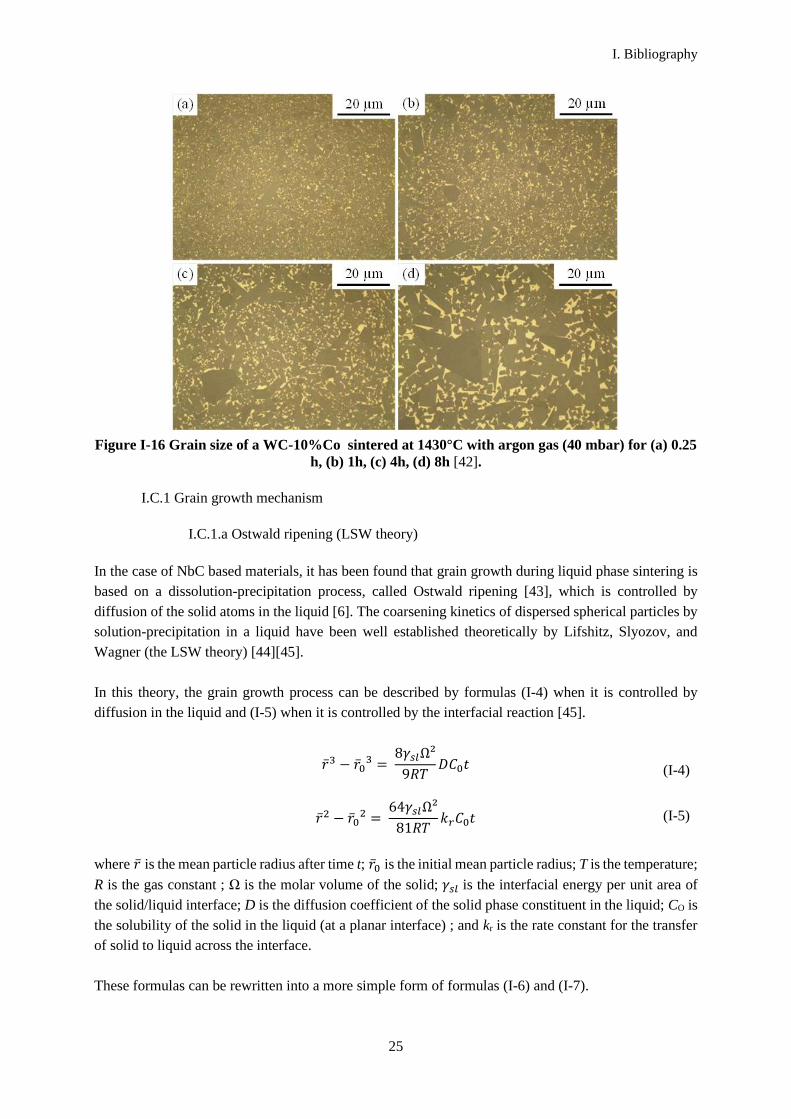
Sintering is usually accompanied by grain growth which is detrimental for the mechanical properties.
An example of grain size with different time spent at sintering temperature for a WC-Co material is
presented in Figure I-16. Grain growth mechanisms must therefore be investigated in order to control
the microstructure evolution. This part aims to first present grain growth mechanisms from a literature
analysis and then to link these mechanisms to experimental observations made on NbC based cemented
carbides. Then, the effect of secondary carbides addition to limit grain growth will be described.
I. Bibliography
25
Figure I-16 Grain size of a WC-10%Co sintered at 1430°C with argon gas (40 mbar) for (a) 0.25
h, (b) 1h, (c) 4h, (d) 8h [42].
I.C.1 Grain growth mechanism
I.C.1.a Ostwald ripening (LSW theory)
In the case of NbC based materials, it has been found that grain growth during liquid phase sintering is
based on a dissolution-precipitation process, called Ostwald ripening [43], which is controlled by
diffusion of the solid atoms in the liquid [6]. The coarsening kinetics of dispersed spherical particles by
solution-precipitation in a liquid have been well established theoretically by Lifshitz, Slyozov, and
Wagner (the LSW theory) [44][45].
In this theory, the grain growth process can be described by formulas (I-4) when it is controlled by
diffusion in the liquid and (I-5) when it is controlled by the interfacial reaction [45].
�̅�3 − �̅�03 =
8𝛾𝑠𝑙Ω²
9𝑅𝑇𝐷𝐶0𝑡
(I-4)
�̅�2 − �̅�02 =
64𝛾𝑠𝑙Ω²
81𝑅𝑇𝑘𝑟𝐶0𝑡 (I-5)
where �̅� is the mean particle radius after time t; �̅�0 is the initial mean particle radius; T is the temperature;
R is the gas constant ; Ω is the molar volume of the solid; 𝛾𝑠𝑙 is the interfacial energy per unit area of
the solid/liquid interface; D is the diffusion coefficient of the solid phase constituent in the liquid; CO is
the solubility of the solid in the liquid (at a planar interface) ; and kr is the rate constant for the transfer
of solid to liquid across the interface.
These formulas can be rewritten into a more simple form of formulas (I-6) and (I-7).
I. Bibliography
26
�̅�3 − �̅�0
3 = 𝐾𝐷𝑡 (I-6)
�̅�2 − �̅�02 = 𝐾𝑅𝑡 (I-7)
where KD and KR are temperature-dependent constants for the diffusion-controlled and for the reaction-
controlled kinetics.
I.C.1.b Abnormal grain growth and 2D nucleation on faceted grains
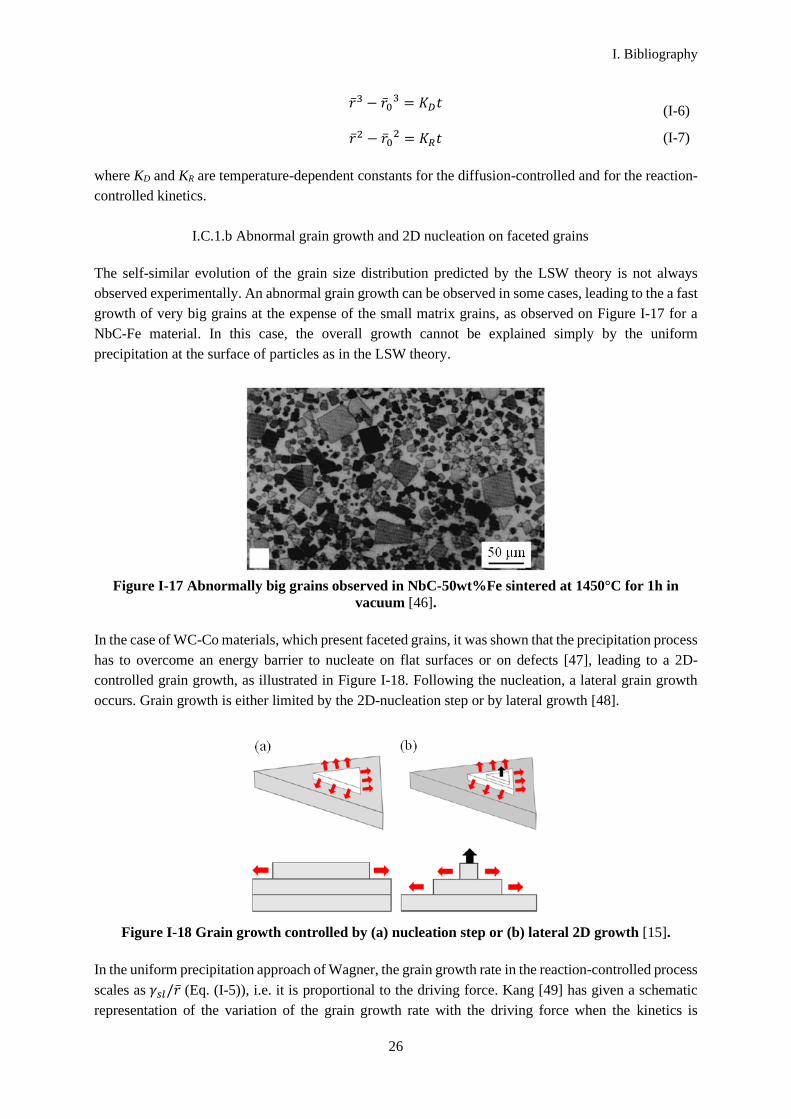
The self-similar evolution of the grain size distribution predicted by the LSW theory is not always
observed experimentally. An abnormal grain growth can be observed in some cases, leading to the a fast
growth of very big grains at the expense of the small matrix grains, as observed on Figure I-17 for a
NbC-Fe material. In this case, the overall growth cannot be explained simply by the uniform
precipitation at the surface of particles as in the LSW theory.
Figure I-17 Abnormally big grains observed in NbC-50wt%Fe sintered at 1450°C for 1h in
vacuum [46].
In the case of WC-Co materials, which present faceted grains, it was shown that the precipitation process
has to overcome an energy barrier to nucleate on flat surfaces or on defects [47], leading to a 2D-
controlled grain growth, as illustrated in Figure I-18. Following the nucleation, a lateral grain growth
occurs. Grain growth is either limited by the 2D-nucleation step or by lateral growth [48].
Figure I-18 Grain growth controlled by (a) nucleation step or (b) lateral 2D growth [15].
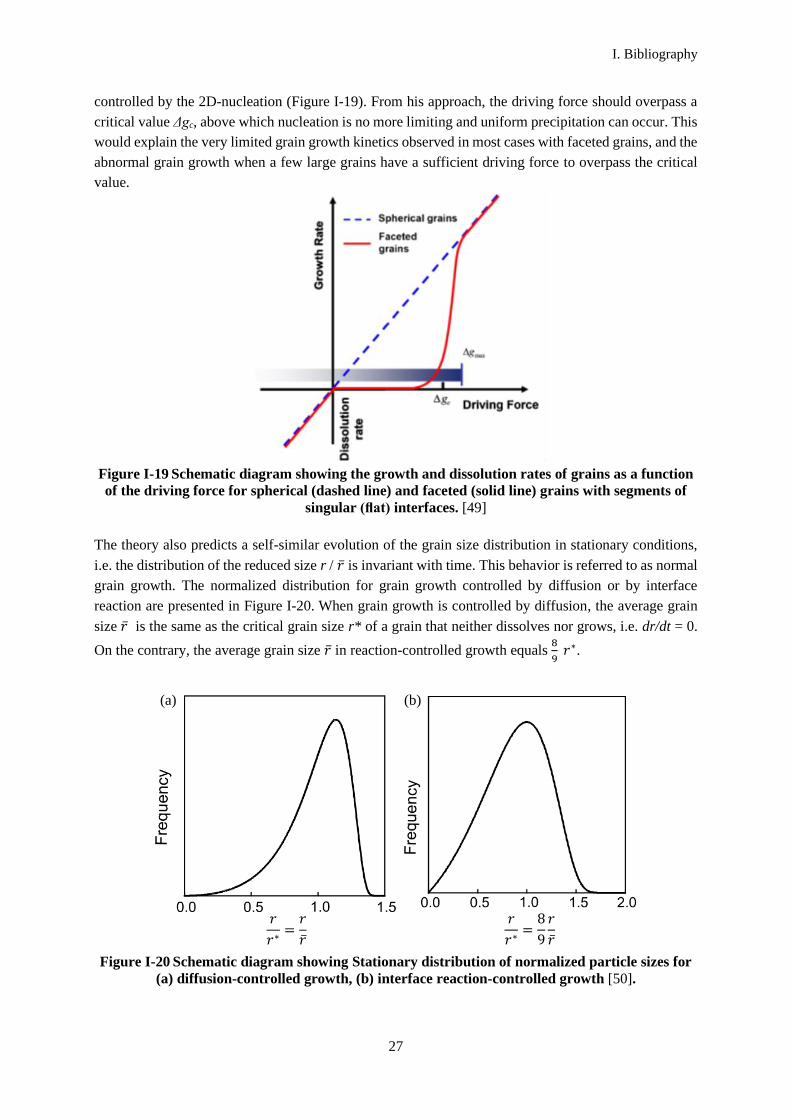
In the uniform precipitation approach of Wagner, the grain growth rate in the reaction-controlled process
scales as 𝛾𝑠𝑙/�̅� (Eq. (I-5)), i.e. it is proportional to the driving force. Kang [49] has given a schematic
representation of the variation of the grain growth rate with the driving force when the kinetics is
I. Bibliography
27
controlled by the 2D-nucleation (Figure I-19). From his approach, the driving force should overpass a
critical value Δgc, above which nucleation is no more limiting and uniform precipitation can occur. This
would explain the very limited grain growth kinetics observed in most cases with faceted grains, and the
abnormal grain growth when a few large grains have a sufficient driving force to overpass the critical
value.
Figure I-19 Schematic diagram showing the growth and dissolution rates of grains as a function
of the driving force for spherical (dashed line) and faceted (solid line) grains with segments of
singular (flat) interfaces. [49]
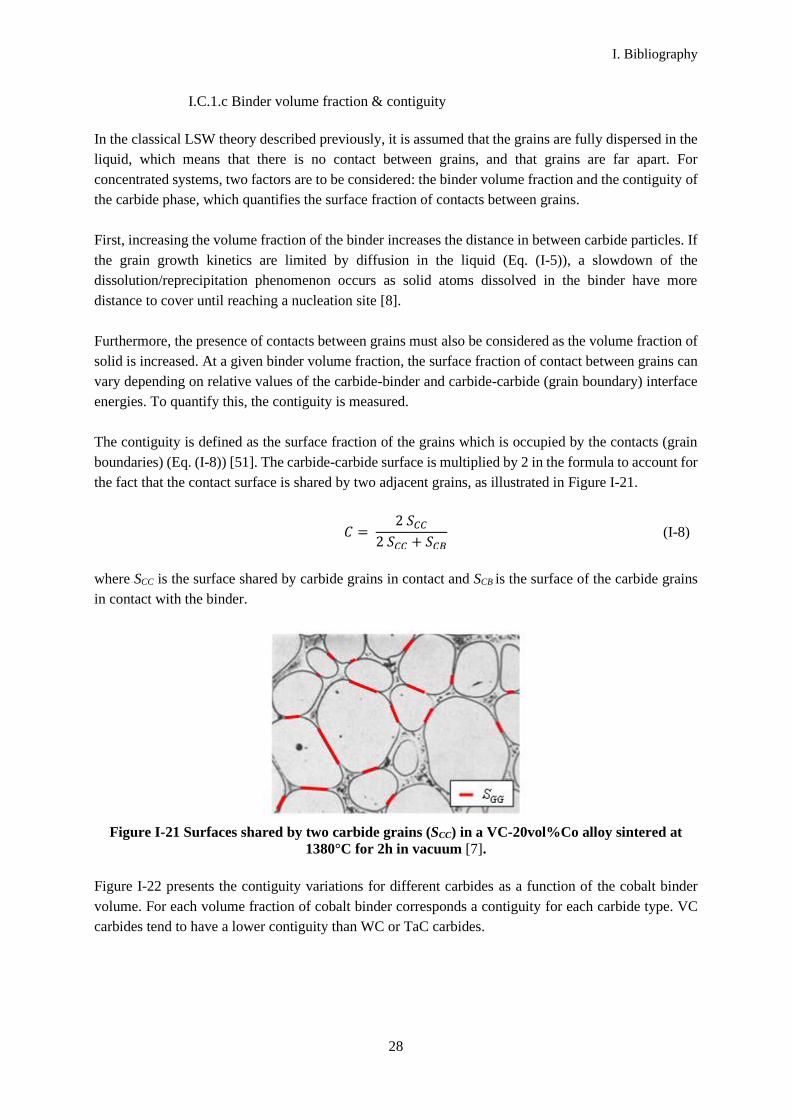
The theory also predicts a self-similar evolution of the grain size distribution in stationary conditions,
i.e. the distribution of the reduced size r / �̅� is invariant with time. This behavior is referred to as normal
grain growth. The normalized distribution for grain growth controlled by diffusion or by interface
reaction are presented in Figure I-20. When grain growth is controlled by diffusion, the average grain
size �̅� is the same as the critical grain size r* of a grain that neither dissolves nor grows, i.e. dr/dt = 0.
On the contrary, the average grain size �̅� in reaction-controlled growth equals 8
9 𝑟∗.
Figure I-20 Schematic diagram showing Stationary distribution of normalized particle sizes for
(a) diffusion-controlled growth, (b) interface reaction-controlled growth [50].
(a) (b)
𝑟
𝑟∗=𝑟
�̅�
𝑟
𝑟∗=8
9
𝑟
�̅�
I. Bibliography
28
I.C.1.c Binder volume fraction & contiguity
In the classical LSW theory described previously, it is assumed that the grains are fully dispersed in the
liquid, which means that there is no contact between grains, and that grains are far apart. For
concentrated systems, two factors are to be considered: the binder volume fraction and the contiguity of
the carbide phase, which quantifies the surface fraction of contacts between grains.
First, increasing the volume fraction of the binder increases the distance in between carbide particles. If
the grain growth kinetics are limited by diffusion in the liquid (Eq. (I-5)), a slowdown of the
dissolution/reprecipitation phenomenon occurs as solid atoms dissolved in the binder have more
distance to cover until reaching a nucleation site [8].
Furthermore, the presence of contacts between grains must also be considered as the volume fraction of
solid is increased. At a given binder volume fraction, the surface fraction of contact between grains can
vary depending on relative values of the carbide-binder and carbide-carbide (grain boundary) interface
energies. To quantify this, the contiguity is measured.
The contiguity is defined as the surface fraction of the grains which is occupied by the contacts (grain
boundaries) (Eq. (I-8)) [51]. The carbide-carbide surface is multiplied by 2 in the formula to account for
the fact that the contact surface is shared by two adjacent grains, as illustrated in Figure I-21.
𝐶 = 2 𝑆𝐶𝐶
2 𝑆𝐶𝐶 + 𝑆𝐶𝐵 (I-8)
where SCC is the surface shared by carbide grains in contact and SCB is the surface of the carbide grains
in contact with the binder.
Figure I-21 Surfaces shared by two carbide grains (SCC) in a VC-20vol%Co alloy sintered at
1380°C for 2h in vacuum [7].
Figure I-22 presents the contiguity variations for different carbides as a function of the cobalt binder
volume. For each volume fraction of cobalt binder corresponds a contiguity for each carbide type. VC
carbides tend to have a lower contiguity than WC or TaC carbides.
I. Bibliography
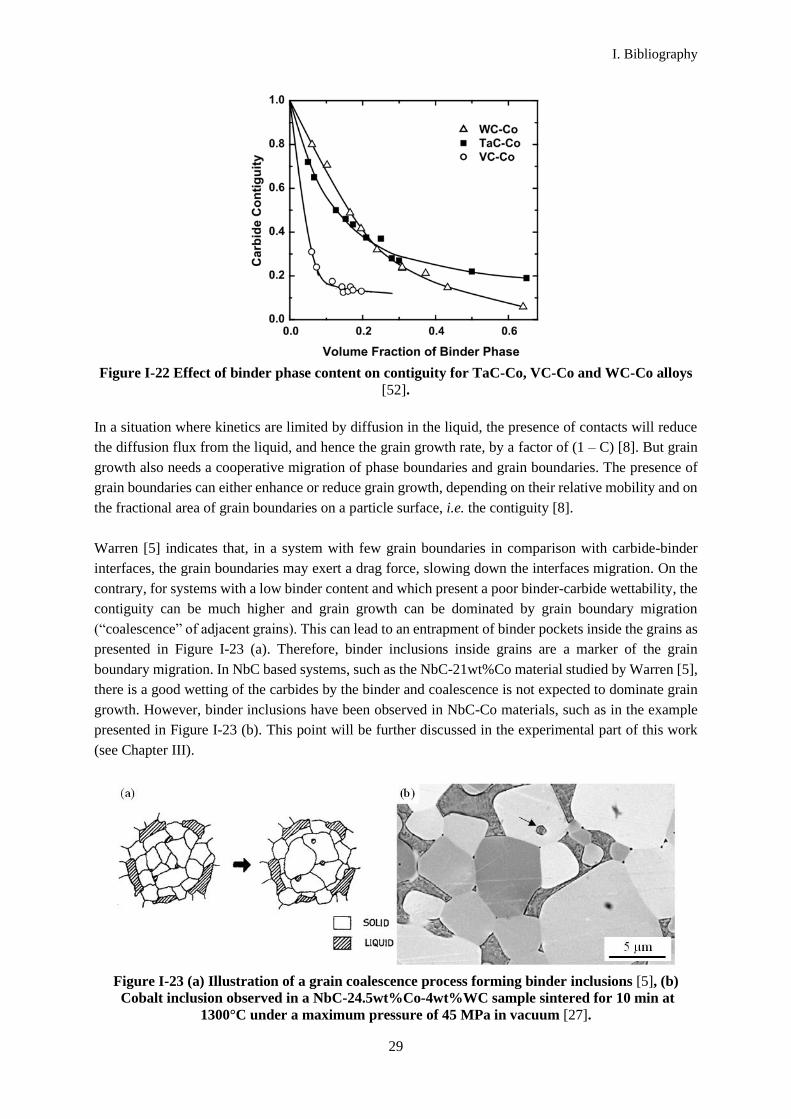
29
Figure I-22 Effect of binder phase content on contiguity for TaC-Co, VC-Co and WC-Co alloys
[52].
In a situation where kinetics are limited by diffusion in the liquid, the presence of contacts will reduce
the diffusion flux from the liquid, and hence the grain growth rate, by a factor of (1 – C) [8]. But grain
growth also needs a cooperative migration of phase boundaries and grain boundaries. The presence of
grain boundaries can either enhance or reduce grain growth, depending on their relative mobility and on
the fractional area of grain boundaries on a particle surface, i.e. the contiguity [8].
Warren [5] indicates that, in a system with few grain boundaries in comparison with carbide-binder
interfaces, the grain boundaries may exert a drag force, slowing down the interfaces migration. On the
contrary, for systems with a low binder content and which present a poor binder-carbide wettability, the
contiguity can be much higher and grain growth can be dominated by grain boundary migration
(“coalescence” of adjacent grains). This can lead to an entrapment of binder pockets inside the grains as
presented in Figure I-23 (a). Therefore, binder inclusions inside grains are a marker of the grain
boundary migration. In NbC based systems, such as the NbC-21wt%Co material studied by Warren [5],
there is a good wetting of the carbides by the binder and coalescence is not expected to dominate grain
growth. However, binder inclusions have been observed in NbC-Co materials, such as in the example
presented in Figure I-23 (b). This point will be further discussed in the experimental part of this work
(see Chapter III).
Figure I-23 (a) Illustration of a grain coalescence process forming binder inclusions [5], (b)
Cobalt inclusion observed in a NbC-24.5wt%Co-4wt%WC sample sintered for 10 min at
1300°C under a maximum pressure of 45 MPa in vacuum [27].
I. Bibliography
30
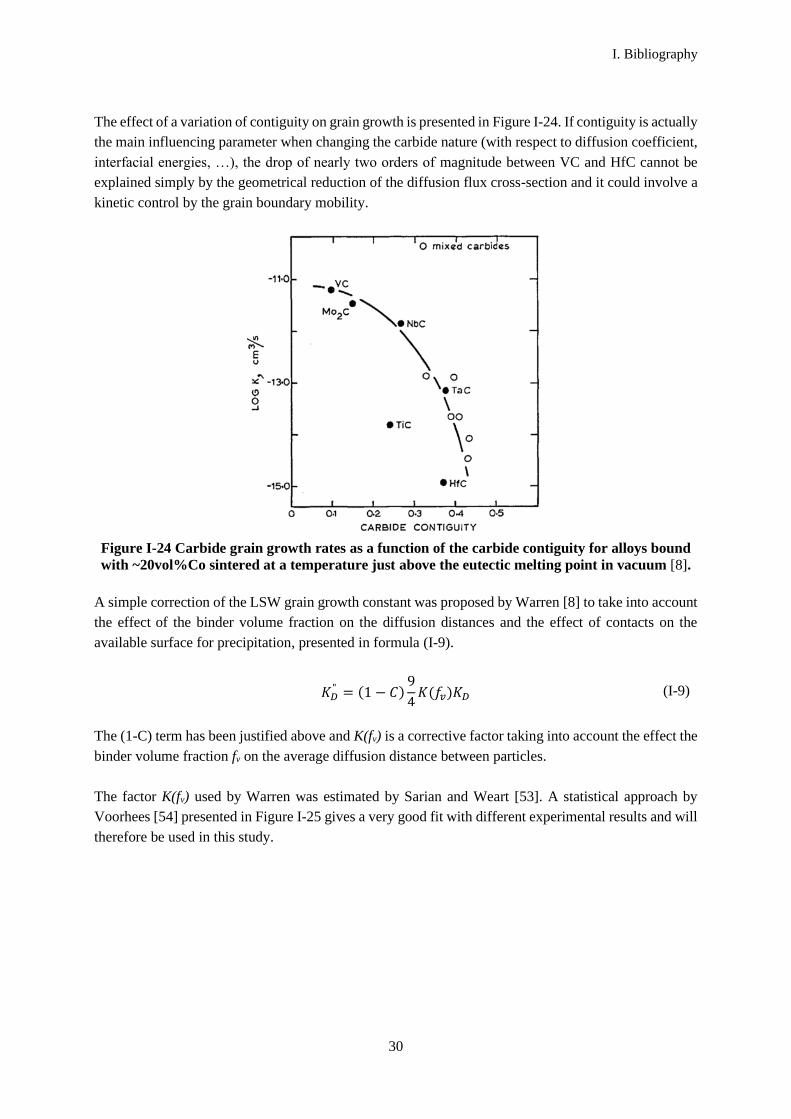
The effect of a variation of contiguity on grain growth is presented in Figure I-24. If contiguity is actually
the main influencing parameter when changing the carbide nature (with respect to diffusion coefficient,
interfacial energies, …), the drop of nearly two orders of magnitude between VC and HfC cannot be
explained simply by the geometrical reduction of the diffusion flux cross-section and it could involve a
kinetic control by the grain boundary mobility.
Figure I-24 Carbide grain growth rates as a function of the carbide contiguity for alloys bound
with ~20vol%Co sintered at a temperature just above the eutectic melting point in vacuum [8].
A simple correction of the LSW grain growth constant was proposed by Warren [8] to take into account
the effect of the binder volume fraction on the diffusion distances and the effect of contacts on the
available surface for precipitation, presented in formula (I-9).
𝐾𝐷" = (1 − 𝐶)
9
4𝐾(𝑓𝑣)𝐾𝐷 (I-9)
The (1-C) term has been justified above and K(fv) is a corrective factor taking into account the effect the
binder volume fraction fv on the average diffusion distance between particles.
The factor K(fv) used by Warren was estimated by Sarian and Weart [53]. A statistical approach by
Voorhees [54] presented in Figure I-25 gives a very good fit with different experimental results and will
therefore be used in this study.

I. Bibliography
31
Figure I-25 K(fv) normalized to the LSW rate constant K(0) = 4/9 as a function of the binder
volume fraction. Data point derived from multiparticle diffusion problem (MDP) simulation;
solid curve predicted from mean-field theory [54].
I.C.2 Grain growth in NbC based cemented carbides
I.C.2.a Microstructure & kinetics
In NbC based materials, grain growth is due to a dissolution-precipitation process controlled by diffusion
in the liquid according to Warren [6][8] (formula (I-4)(I-5)): small grains dissolve into the matrix and
the solute atoms re-precipitate on large grains which grow. An example of grain growth is presented in
Figure I-26 for a NbC-Co-B material which forms spheroidal grains.
Figure I-26 Grain growth phenomenon in a NbC-30wt%Co-2.3wt%B material sintered for 2h in
vacuum at (a) 1400°C, (b) 1550°C [55].
As previously detailed, the dissolution-precipitation process is also significantly influenced by the
presence of facets, as more energy is required for a nucleus to form on a planar surface. As illustrated

I. Bibliography
32
in Figure I-27, rounded grains will dissolve and grow equally in all directions whereas partially faceted
grains will dissolve and grow preferentially at their rounded edges, where there is no nucleation barrier
[55]. In the case of NbC-based materials, different grain shapes can be observed depending on the binder
and on secondary carbide additions. One example is presented on Figure I-28 where the addition of
boron to a NbC-Fe material changes the grain shape from faceted to rounded. The grain shapes observed
so far for NbC based alloys are listed in Appendix 1.
Figure I-27 Schematic showing solubility changes in a liquid matrix between two grains in a
dissolution-precipitation process depending on the grain shape, (a) spherical grains, (b) faceted
with round edges grains [55].
Figure I-28 Micrographs showing the microstructures of samples sintered at 1450°C for 1h in
vacuum (13 Pa), (a) NbC-30wt%Fe, (b) NbC-30wt%Fe-3wt%B [46].
NbC based cemented carbides however often tend to form cuboidal grains, which presents planar facets
and this can lead to abnormal grain growth, as observed in WC-Co materials. It was observed in NbC-
Fe material as previously presented in Figure I-28, but also in NbC-Co materials as in Figure I-29, and
probably in NbC-Ni although it was not clearly stated in the literature. This abnormal grain growth can
be explained by the effect of 2D-nucleation on the precipitation kinetics described in part I.C.1.

I. Bibliography
33
Figure I-29 Abnormal grain growth phenomenon in a NbC-21wt%Co material sintered 2h in
vacuum at 1420°C [5].
It is experimentally observed that increasing the volume fraction of binder leads to a reduction of the
grain size, as presented in Figure I-30. This confirms the assumption that the kinetics should be limited
by diffusion in the liquid and that contiguity should not significantly impede grain growth [8].
Figure I-30 NbC bonded with steel 316 L vacuum sintered at 1420°C for 1h, (a) NbC-
15vol%316L, (b) NbC-30vol%316L [31].
Figure I-31 presents the grain-growth behavior of NbC, liquid phase sintered with either Fe, Co or Ni,
as a function of the sintering time and the sintering temperature. NbC-Co has the highest grain growth
rate whatever the sintering parameters. It therefore may not be the best candidate as a binder for NbC
based cemented carbides.
I. Bibliography
34
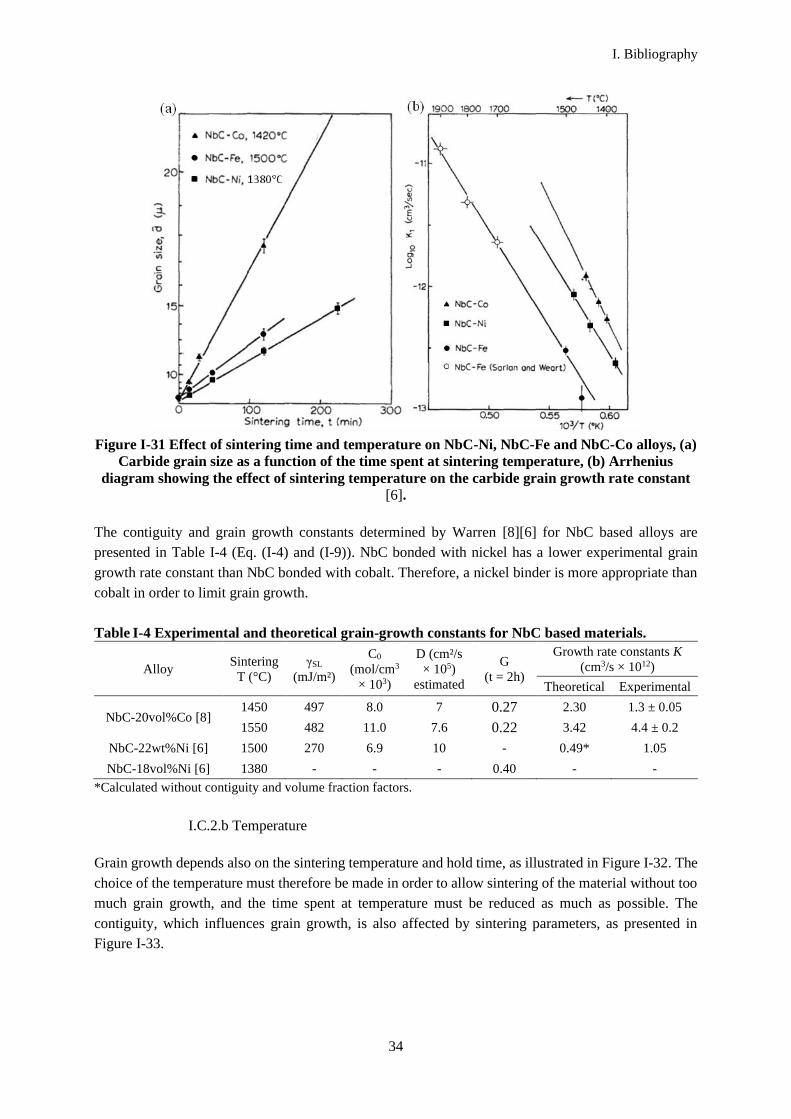
Figure I-31 Effect of sintering time and temperature on NbC-Ni, NbC-Fe and NbC-Co alloys, (a)
Carbide grain size as a function of the time spent at sintering temperature, (b) Arrhenius
diagram showing the effect of sintering temperature on the carbide grain growth rate constant
[6].
The contiguity and grain growth constants determined by Warren [8][6] for NbC based alloys are
presented in Table I-4 (Eq. (I-4) and (I-9)). NbC bonded with nickel has a lower experimental grain
growth rate constant than NbC bonded with cobalt. Therefore, a nickel binder is more appropriate than
cobalt in order to limit grain growth.
Table I-4 Experimental and theoretical grain-growth constants for NbC based materials.
Alloy Sintering
T (°C)
γSL
(mJ/m²)
C0
(mol/cm3
× 103)
D (cm²/s
× 105)
estimated
G
(t = 2h)
Growth rate constants K
(cm3/s × 1012)
Theoretical Experimental
NbC-20vol%Co [8] 1450 497 8.0 7 0.27 2.30 1.3 ± 0.05
1550 482 11.0 7.6 0.22 3.42 4.4 ± 0.2
NbC-22wt%Ni [6] 1500 270 6.9 10 - 0.49* 1.05
NbC-18vol%Ni [6] 1380 - - - 0.40 - -
*Calculated without contiguity and volume fraction factors.
I.C.2.b Temperature
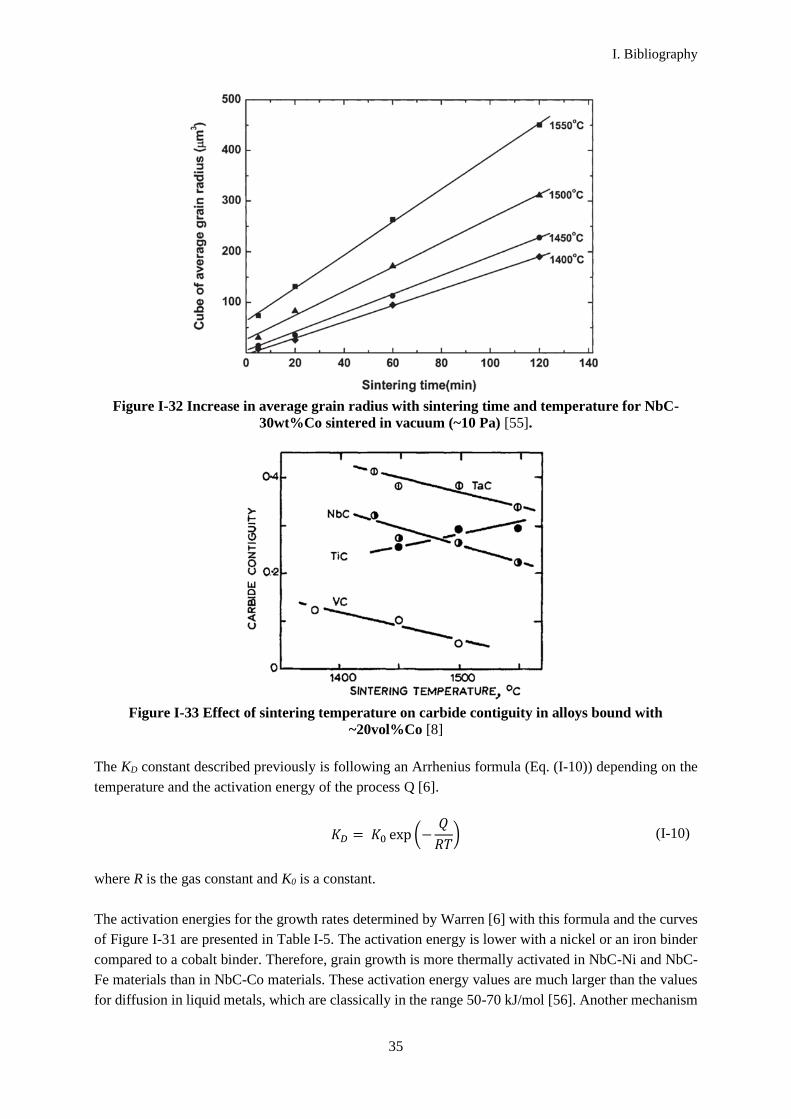
Grain growth depends also on the sintering temperature and hold time, as illustrated in Figure I-32. The
choice of the temperature must therefore be made in order to allow sintering of the material without too
much grain growth, and the time spent at temperature must be reduced as much as possible. The
contiguity, which influences grain growth, is also affected by sintering parameters, as presented in
Figure I-33.
I. Bibliography
35
Figure I-32 Increase in average grain radius with sintering time and temperature for NbC-
30wt%Co sintered in vacuum (~10 Pa) [55].
Figure I-33 Effect of sintering temperature on carbide contiguity in alloys bound with
~20vol%Co [8]
The KD constant described previously is following an Arrhenius formula (Eq. (I-10)) depending on the
temperature and the activation energy of the process Q [6].
where R is the gas constant and K0 is a constant.
The activation energies for the growth rates determined by Warren [6] with this formula and the curves
of Figure I-31 are presented in Table I-5. The activation energy is lower with a nickel or an iron binder
compared to a cobalt binder. Therefore, grain growth is more thermally activated in NbC-Ni and NbC-
Fe materials than in NbC-Co materials. These activation energy values are much larger than the values
for diffusion in liquid metals, which are classically in the range 50-70 kJ/mol [56]. Another mechanism
𝐾𝐷 = 𝐾0 exp (−𝑄
𝑅𝑇) (I-10)
I. Bibliography
36
is therefore expected to play a role on the activation of grain growth kinetics. This point will be discussed
in the experimental part of this work (see Chapter VI).
Table I-5 Activation energies for growth rates of NbC-Ni, NbC-Co and NbC-Fe [6].
Alloy NbC-22wt%Fe NbC-22wt%Ni NbC-21wt%Co
Activation Energy (kJ/mol) 306 ± 42 306 ± 42 398 ± 63
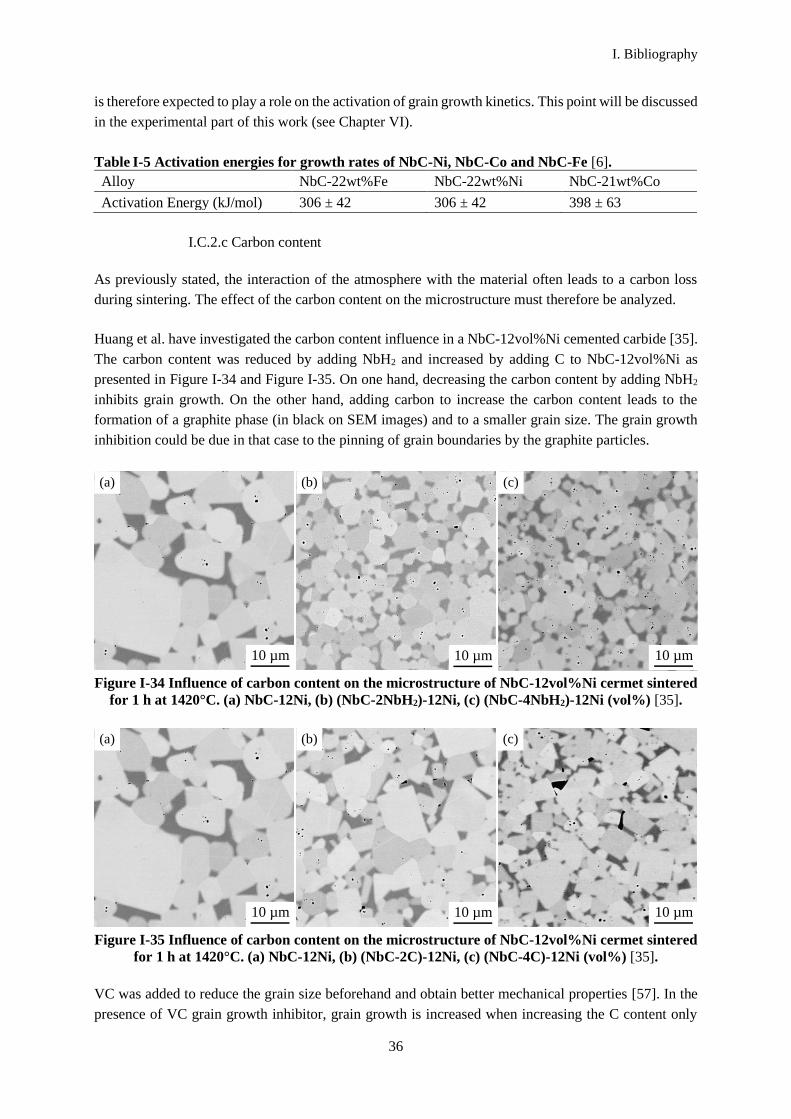
I.C.2.c Carbon content
As previously stated, the interaction of the atmosphere with the material often leads to a carbon loss
during sintering. The effect of the carbon content on the microstructure must therefore be analyzed.
Huang et al. have investigated the carbon content influence in a NbC-12vol%Ni cemented carbide [35].
The carbon content was reduced by adding NbH2 and increased by adding C to NbC-12vol%Ni as
presented in Figure I-34 and Figure I-35. On one hand, decreasing the carbon content by adding NbH2
inhibits grain growth. On the other hand, adding carbon to increase the carbon content leads to the
formation of a graphite phase (in black on SEM images) and to a smaller grain size. The grain growth
inhibition could be due in that case to the pinning of grain boundaries by the graphite particles.
Figure I-34 Influence of carbon content on the microstructure of NbC-12vol%Ni cermet sintered
for 1 h at 1420°C. (a) NbC-12Ni, (b) (NbC-2NbH2)-12Ni, (c) (NbC-4NbH2)-12Ni (vol%) [35].
Figure I-35 Influence of carbon content on the microstructure of NbC-12vol%Ni cermet sintered
for 1 h at 1420°C. (a) NbC-12Ni, (b) (NbC-2C)-12Ni, (c) (NbC-4C)-12Ni (vol%) [35].
VC was added to reduce the grain size beforehand and obtain better mechanical properties [57]. In the
presence of VC grain growth inhibitor, grain growth is increased when increasing the C content only
(a) (b) (c)
10 µm 10 µm 10 µm
10 µm 10 µm 10 µm
(a) (b) (c)
I. Bibliography
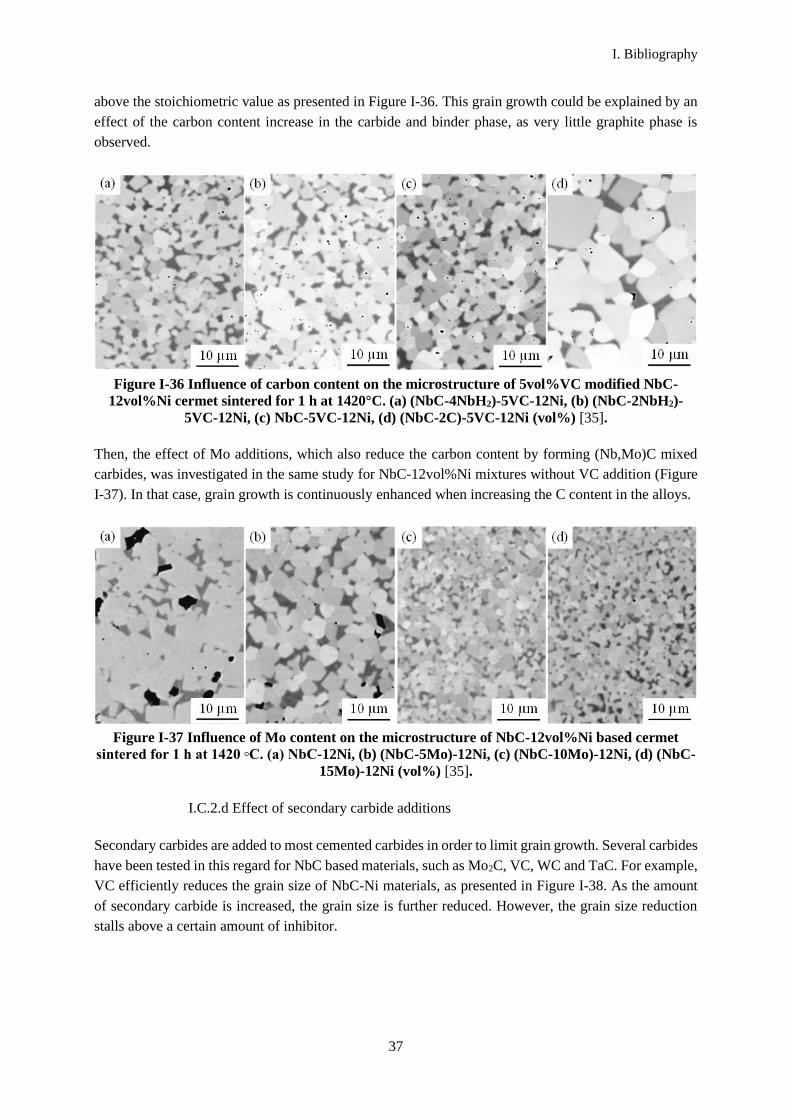
37
above the stoichiometric value as presented in Figure I-36. This grain growth could be explained by an
effect of the carbon content increase in the carbide and binder phase, as very little graphite phase is
observed.
Figure I-36 Influence of carbon content on the microstructure of 5vol%VC modified NbC-
12vol%Ni cermet sintered for 1 h at 1420°C. (a) (NbC-4NbH2)-5VC-12Ni, (b) (NbC-2NbH2)-
5VC-12Ni, (c) NbC-5VC-12Ni, (d) (NbC-2C)-5VC-12Ni (vol%) [35].
Then, the effect of Mo additions, which also reduce the carbon content by forming (Nb,Mo)C mixed
carbides, was investigated in the same study for NbC-12vol%Ni mixtures without VC addition (Figure
I-37). In that case, grain growth is continuously enhanced when increasing the C content in the alloys.
Figure I-37 Influence of Mo content on the microstructure of NbC-12vol%Ni based cermet
sintered for 1 h at 1420 ◦C. (a) NbC-12Ni, (b) (NbC-5Mo)-12Ni, (c) (NbC-10Mo)-12Ni, (d) (NbC-
15Mo)-12Ni (vol%) [35].
I.C.2.d Effect of secondary carbide additions
Secondary carbides are added to most cemented carbides in order to limit grain growth. Several carbides
have been tested in this regard for NbC based materials, such as Mo2C, VC, WC and TaC. For example,
VC efficiently reduces the grain size of NbC-Ni materials, as presented in Figure I-38. As the amount
of secondary carbide is increased, the grain size is further reduced. However, the grain size reduction
stalls above a certain amount of inhibitor.

I. Bibliography
38
Figure I-38 Microstructure of a NbC-12vol%Ni material sintered 1h at 1420°C in vacuum with
(a) 0vol%VC, (b) 5vol%VC, (c) 10vol%VC, (d) 15vol%VC [57].
In the literature, the grain growth inhibiting effect of secondary carbide addition could be explained by
a reduction of the driving force for NbC dissolution-reprecipitation due to the presence of metallic
elements which would lower the interfacial energy of the binder toward NbC [58].
The addition of secondary carbides impacts the affinity of the carbide phase toward the liquid. As
detailed in [59] for pseudo-binary systems, a better affinity of the carbide phase with the liquid usually
leads to a comparatively lower value of interfacial energy and to a higher value of solubility in the liquid,
having antagonist effects on grain growth kinetics. However, the solubility effect may be negligible
compared to the interfacial energy effect for low amounts of additive. Considering for example WC and
Mo2C, their higher solubility in liquid Ni suggests a higher affinity for Ni than NbC (Table I-3). An
important aspect is also the solubility of the secondary carbide in NbC (Table I-6). For WC or Mo2C
addition, the solubility in NbC is high and a uniform carbide composition is expected at equilibrium but
two-phased carbides can be observed if other situations. A small amount of WC or Mo2C addition to
NbC is then expected to decrease the interface energy with the liquid and then to slow grain growth
kinetics (see Eq. I-4). The impact of secondary addition on grain growth will be investigated in chapters
V and VI.
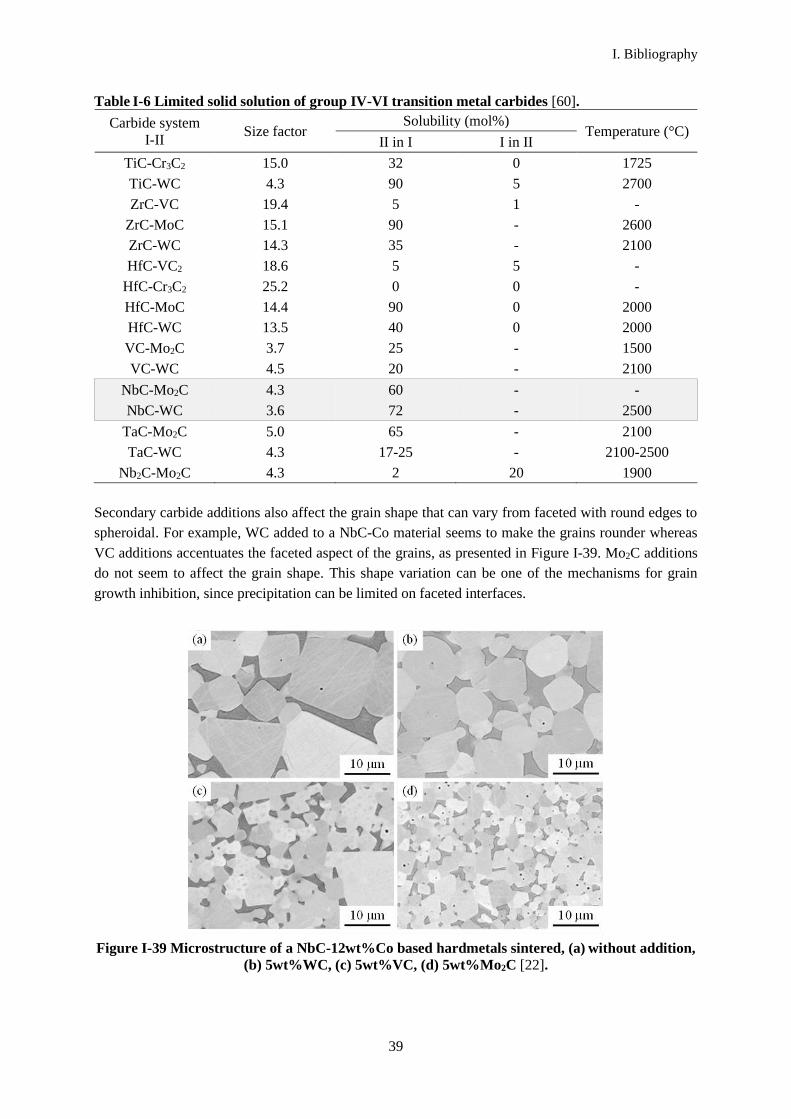
I. Bibliography
39
Table I-6 Limited solid solution of group IV-VI transition metal carbides [60].
Carbide system
I-II Size factor
Solubility (mol%) Temperature (°C)
II in I I in II
TiC-Cr3C2 15.0 32 0 1725
TiC-WC 4.3 90 5 2700
ZrC-VC 19.4 5 1 -
ZrC-MoC 15.1 90 - 2600
ZrC-WC 14.3 35 - 2100
HfC-VC2 18.6 5 5 -
HfC-Cr3C2 25.2 0 0 -
HfC-MoC 14.4 90 0 2000
HfC-WC 13.5 40 0 2000
VC-Mo2C 3.7 25 - 1500
VC-WC 4.5 20 - 2100
NbC-Mo2C 4.3 60 - -
NbC-WC 3.6 72 - 2500
TaC-Mo2C 5.0 65 - 2100
TaC-WC 4.3 17-25 - 2100-2500
Nb2C-Mo2C 4.3 2 20 1900
Secondary carbide additions also affect the grain shape that can vary from faceted with round edges to
spheroidal. For example, WC added to a NbC-Co material seems to make the grains rounder whereas
VC additions accentuates the faceted aspect of the grains, as presented in Figure I-39. Mo2C additions
do not seem to affect the grain shape. This shape variation can be one of the mechanisms for grain
growth inhibition, since precipitation can be limited on faceted interfaces.
Figure I-39 Microstructure of a NbC-12wt%Co based hardmetals sintered, (a) without addition,
(b) 5wt%WC, (c) 5wt%VC, (d) 5wt%Mo2C [22].

I. Bibliography
40
The addition of secondary carbides also affects the contiguity. For example, the addition of TaC or VC
to a NbC-Co alloy increases the carbide contiguity, as presented in Table I-7. According to the
previously described laws, an increased contiguity can reduce grain growth if the kinetics is controlled
by diffusion (see Eq. (I-9)), or by interfacial reaction (drag force exerted by the grain boundaries).
Therefore, this contiguity increase can also be one of the mechanisms explaining the grain size reduction
when adding secondary carbides.
Table I-7 NbC carbide contiguity G in a NbC-20vol%Co alloy sintered at 1450°C in vacuum with
TaC or VC additions [8].
Alloy bound with
20vol%Co
Carbide contiguity G (± 0.02) at t (min)
0 48 120 240
NbC 0.32 0.26 0.27 0.28
NbC-5at%TaC 0.40 - 0.32 -
NbC-18.5at%TaC 0.47 - 0.37 -
NbC-62at%TaC 0.46 - 0.38 -
NbC-27at%VC - - 0.41 -
NbC-43at%VC - - 0.43 -
NbC-80at%VC - - 0.40 -
In some cases, a core-rim structure of carbides is observed when adding a secondary carbide. For
example, this structure is observed with WC (Figure I-40) or TiC added to a NbC-9wt%Ni material
where carbide grains have a Nb-rich core and a W/Ti-containing rim. Huang explained it by an interface
energy reduction between the carbides and the binder [61]. However, no core-rim structure was observed
with VC and Mo2C additions, even though these carbides have a very good solubility in Ni and so
probably also a good affinity for the liquid [57]. The reason for the formation of this core-rim structure
is complex and also dependent on the solubility and diffusion coefficient of the secondary carbide in the
major carbide [25].
Figure I-40 Core-rim structure in a NbC-9wt%Ni-18wt%WC alloy sintered at 1450°C for 90min
[61].
Table I-8 presents all the secondary carbide additions tested for NbC based materials. For more details
on those experiments, see Appendix 1. Their effect on the mechanical properties is described in part I.D.
Table I-8 Secondary carbide additions in the literature.
NbC-Co NbC-Ni
Secondary carbide Source Secondary carbide Source
TiC [5] TiC [39][61][58]

I. Bibliography
41
WC [5][27][22] WC [62][61][58]
VC [22][63] VC [63][62][39][35]
Mo2C [22][63] Mo2C [63][62][39][58]
I.D Mechanical properties
I.D.1 Hardness & Toughness in NbC based materials
Two properties are generally used to characterize the mechanical behavior of cemented carbides. The
Vickers hardness and the toughness, determined from the length of cracks formed at the angles of the
indentation, as presented in Figure I-41. These cracks are called Palmqvist cracks, and the toughness
was calculated by a method derived from the work of Shetty et al [64], detailed in Appendix 2. Any
composition modification has a direct effect on hardness and fracture toughness.
Figure I-41 Vickers indentation (HV30) with cracks forming at its edges in a NbC-12vol%Ni with
Mo2C addition material.
First, increasing the binder content causes a drop of the hardness and an increase of the toughness as
presented in Figure I-42 for a NbC-Co material. The presence of the ductile binder indeed facilitates
plastic deformation of the material and it also hinders the crack propagation between the grains.
Depending on the binder, the crack propagation mechanism can vary. The cracks propagation is inter-
granular for a nickel [65] or cobalt binder [27], along the grain boundaries and carbide-binder interfaces,
whereas it is intra-granular for a steel binder [34], as visible on Figure I-43. In the case of inter-granular
propagation, the binder slows the crack spread [66].
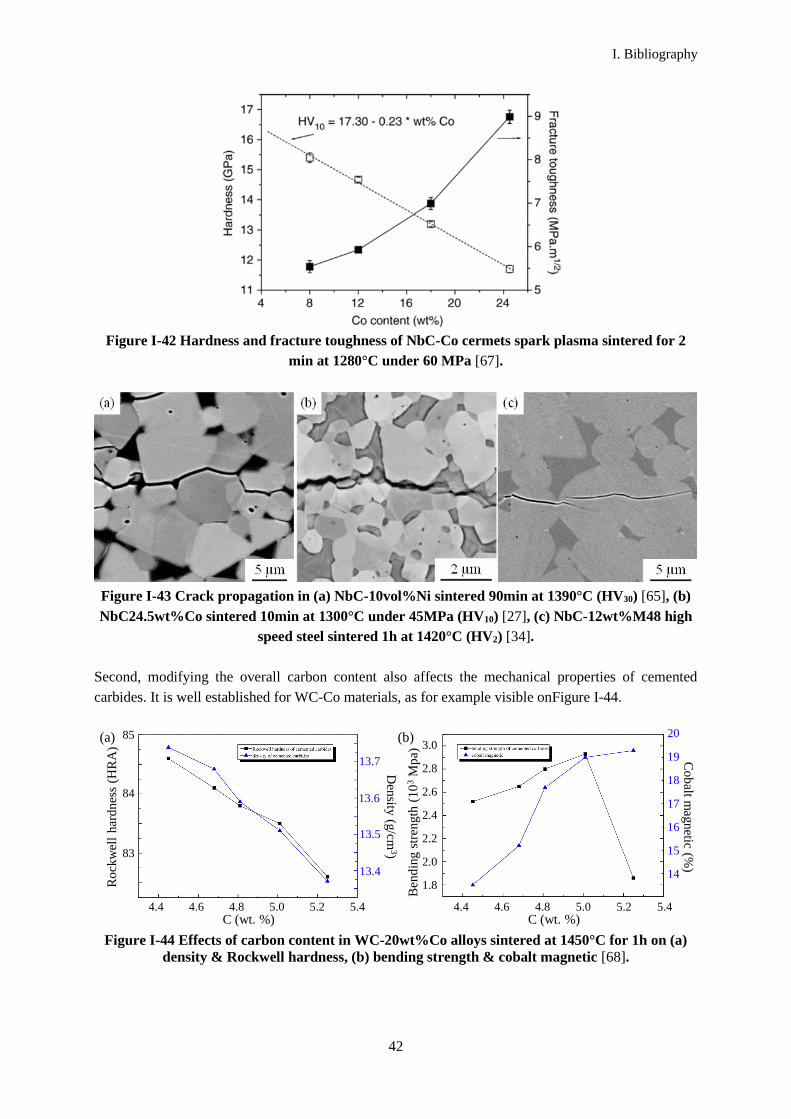
I. Bibliography
42
Figure I-42 Hardness and fracture toughness of NbC-Co cermets spark plasma sintered for 2
min at 1280°C under 60 MPa [67].
Figure I-43 Crack propagation in (a) NbC-10vol%Ni sintered 90min at 1390°C (HV30) [65], (b)
NbC24.5wt%Co sintered 10min at 1300°C under 45MPa (HV10) [27], (c) NbC-12wt%M48 high
speed steel sintered 1h at 1420°C (HV2) [34].
Second, modifying the overall carbon content also affects the mechanical properties of cemented
carbides. It is well established for WC-Co materials, as for example visible onFigure I-44.
Figure I-44 Effects of carbon content in WC-20wt%Co alloys sintered at 1450°C for 1h on (a)
density & Rockwell hardness, (b) bending strength & cobalt magnetic [68].
Ro
ckw
ell
har
dnes
s (H
RA
)
85
84
83
Den
sity (g
/cm3)
13.7
13.6
13.5
13.4
C (wt. %)
(a)
C (wt. %)4.4 4.6 4.8 5.0 5.2 5.4
Ben
din
g s
tren
gth
(1
03
Mp
a)
(b)3.0
2.8
2.6
2.4
2.2
2.0
1.8
20
19
18
17
16
15
14
Co
balt m
agnetic (%
)
4.4 4.6 4.8 5.0 5.2 5.4

I. Bibliography
43
As previously explained, Huang et al investigated the effect of the carbon content in a NbC-12vol%Ni
material by adding NbH2 or C, or by adding different amount of Mo [35]. VC was added to reduce the
initial grain size [57].
The hardness and toughness variations with NbH2 or C additions are presented in Figure I-45. Without
VC addition, an increase of the carbon content leads to decrease of hardness and toughness. With VC
addition, the hardness still drops when increasing the carbon content, but the toughness increases up to
a maximum value of 0.94, then decreases. The drop in hardness was explained by the intrinsic hardness
of NbC which varies with the C/Nb ratio as presented in Figure I-4 and by the grain size effect.
Figure I-45 Mechanical properties of the NbC-12vol%Ni and NbC-5vol%VC-12vol%Ni based
cermets, (a) Vickers hardness (HV30) and (b) Indentation fracture toughness (KIc) [35].
In the same study [35], Mo was added to a NbC-12vol%Ni to reduce the carbon content by forming
mixed carbides (Nb,Mo)C. The effect of this addition on the hardness and toughness is presented in
Figure I-46. When adding Mo, the hardness increases while the toughness decreases. The modification
of mechanical properties are justified by the grain size variation and by the formation of a solid solution
(Nb,Mo)C, in addition to the intrinsic effect of the C/Nb ratio described previously.
Figure I-46 Mechanical properties of (NbC- x vol%Mo)-12 vol%Ni cermets [35].
Finally, secondary carbide additions globally lead to an increase of hardness, and most often a decrease
of toughness, as presented in Figure I-47 for Mo2C additions [57] and WC additions [65]. However, for

I. Bibliography
44
a small Mo2C addition of 5vol% to a NbC-12vol%Ni material, both the hardness and toughness are
improved. Therefore, by adjusting the secondary carbide content, the couple hardness/toughness can be
optimized.
Figure I-47 Hardness and fracture toughness of (a) NbC-12vol%Ni with 0 to 15vol%Mo2C
additions sintered 1h at 1420°C [57], (b) NbC-10vol%Ni with 0 to 15vol%WC additions sintered
90 min at 1390°C [65].
The hardness, toughness and grain size values reported in the literature for NbC based materials (see
summary table in Appendix 1) are compiled in comparative graphs in Figure I-48, and compared to the
performances of WC-Co materials. A thorough study on the comparison of these parameters was
realized by Woydt et al [23] with other compositions as presented in Figure I-49. Although WC-Co
materials can reach better hardness/toughness couple, as represented on Figure I-48 with WC-12vol%Co
materials, NbC-Ni materials combined with secondary carbides such as Mo2C or VC have sufficiently
good hardness and toughness for some applications, like wear as presented in part I.D.2.
Figure I-48 Hardness-Toughness map of cemented NbC carbides from the literature (see
Appendix 1).
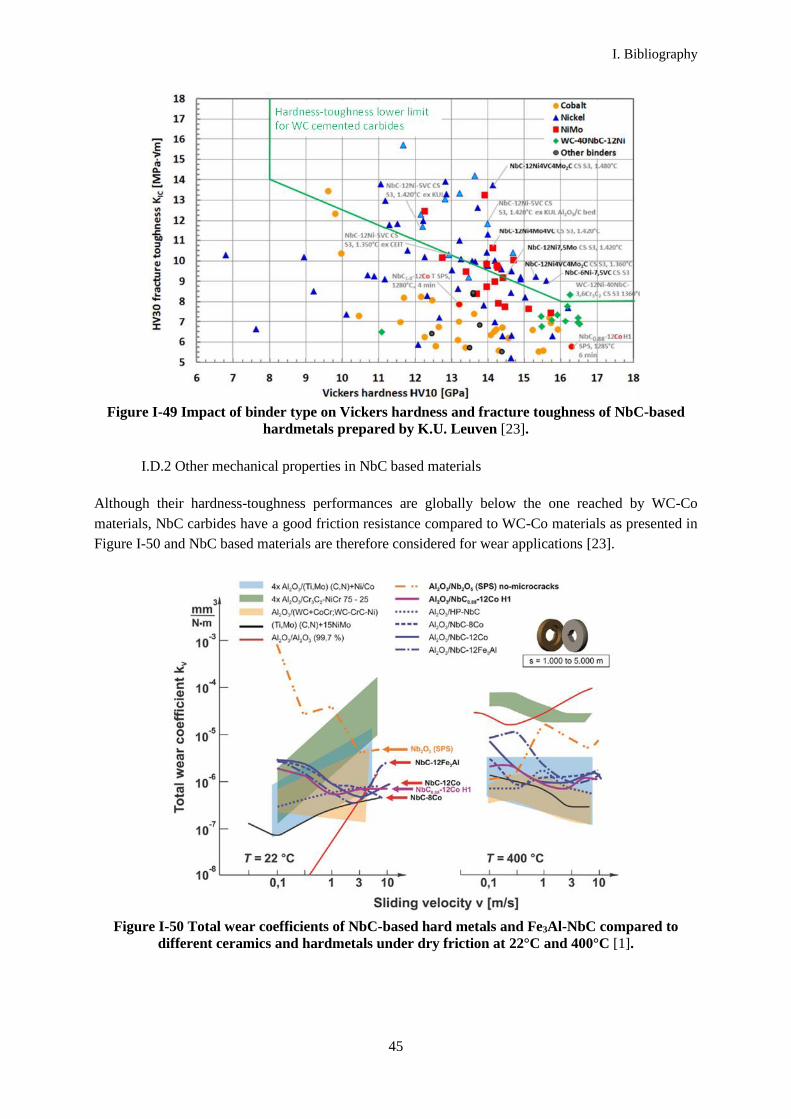
I. Bibliography
45
Figure I-49 Impact of binder type on Vickers hardness and fracture toughness of NbC-based
hardmetals prepared by K.U. Leuven [23].
I.D.2 Other mechanical properties in NbC based materials
Although their hardness-toughness performances are globally below the one reached by WC-Co
materials, NbC carbides have a good friction resistance compared to WC-Co materials as presented in
Figure I-50 and NbC based materials are therefore considered for wear applications [23].
Figure I-50 Total wear coefficients of NbC-based hard metals and Fe3Al-NbC compared to
different ceramics and hardmetals under dry friction at 22°C and 400°C [1].

I. Bibliography
46

47
II. Method & Materials
II.A. Sample preparation
II.A.1 Compositions
Two aspects will be studied: the effect of the secondary carbide Mo2C addition and the effect of the
carbon content. In order to do so, different compositions are prepared.
First, a simple mix is defined with only niobium carbides, 12 vol% of pure nickel and 0.5 vol% of
tungsten carbide. Then, to study the effect of a secondary carbide addition, a defined volume fraction of
niobium carbide is replaced by Mo2C: 3%, 6% or 9% of the carbide volume. These compositions are
presented in Table II-1.
Table II-1 Nominal compositions to study the effect of secondary carbide addition (Mo2C).
Name % NbC Ni Mo2C WC Total
0%Mo2C
vol 87.50 12.00 0 0.50 100,00
wt 85.65 13.37 0 0.98 100,00
at 87.29 12.18 0 0.53 100,00
3%Mo2C
vol 84.86 12.00 2.64 0.50 100,00
wt 82.72 13.32 2.99 0.97 100,00
at 84.88 12.21 2.37 0.54 100,00
6%Mo2C
vol 82.22 12.00 5.28 0.50 100,00
wt 79.81 13.26 5.96 0.97 100,00
at 82.46 12.25 4.76 0.54 100,00
9%Mo2C
vol 79.58 12.00 7.92 0.50 100,00
wt 76.92 13.20 8.91 0.97 100,00
at 80.03 12.28 7.15 0.54 100,00
To study the carbon content effect, a reference composition is chosen among the previously chosen
mixes. The simplest composition (0%Mo2C) was not chosen as the absence of grain growth inhibitor
leads to the formation of big grains and thus to poor mechanical properties. Instead, the 3%Mo2C mix
is chosen.
Then, in three mixes, molybdenum is added to reduce the C/(Nb+Mo+W) ratio (1, 2 or 3at%Mo) and,
in three other mixes, carbon is added to increase the C/(Nb+Mo+W) ratio (1.5, 3 or 4.5at%C). Mo is
added rather than Nb because Nb cannot easily be found as a metallic powder. It is assumed that
substitution of Nb by Mo in small quantities does not affect too much the phase equilibrium and the
material properties. The compositions for the carbon window study are presented in Table II-2.
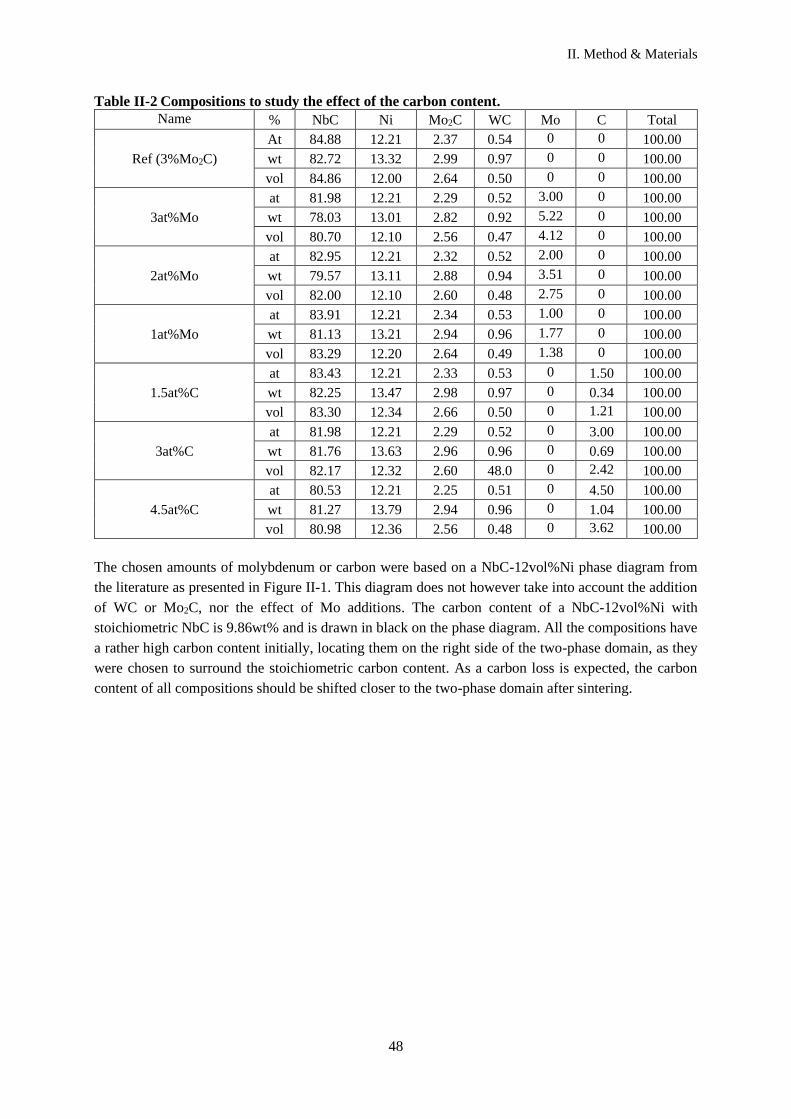
II. Method & Materials
48
Table II-2 Compositions to study the effect of the carbon content.
Name % NbC Ni Mo2C WC Mo C Total
Ref (3%Mo2C)
At 84.88 12.21 2.37 0.54 0 0 100.00
wt 82.72 13.32 2.99 0.97 0 0 100.00
vol 84.86 12.00 2.64 0.50 0 0 100.00
3at%Mo
at 81.98 12.21 2.29 0.52 3.00 0 100.00
wt 78.03 13.01 2.82 0.92 5.22 0 100.00
vol 80.70 12.10 2.56 0.47 4.12 0 100.00
2at%Mo
at 82.95 12.21 2.32 0.52 2.00 0 100.00
wt 79.57 13.11 2.88 0.94 3.51 0 100.00
vol 82.00 12.10 2.60 0.48 2.75 0 100.00
1at%Mo
at 83.91 12.21 2.34 0.53 1.00 0 100.00
wt 81.13 13.21 2.94 0.96 1.77 0 100.00
vol 83.29 12.20 2.64 0.49 1.38 0 100.00
1.5at%C
at 83.43 12.21 2.33 0.53 0 1.50 100.00
wt 82.25 13.47 2.98 0.97 0 0.34 100.00
vol 83.30 12.34 2.66 0.50 0 1.21 100.00
3at%C
at 81.98 12.21 2.29 0.52 0 3.00 100.00
wt 81.76 13.63 2.96 0.96 0 0.69 100.00
vol 82.17 12.32 2.60 48.0 0 2.42 100.00
4.5at%C
at 80.53 12.21 2.25 0.51 0 4.50 100.00
wt 81.27 13.79 2.94 0.96 0 1.04 100.00
vol 80.98 12.36 2.56 0.48 0 3.62 100.00
The chosen amounts of molybdenum or carbon were based on a NbC-12vol%Ni phase diagram from
the literature as presented in Figure II-1. This diagram does not however take into account the addition
of WC or Mo2C, nor the effect of Mo additions. The carbon content of a NbC-12vol%Ni with
stoichiometric NbC is 9.86wt% and is drawn in black on the phase diagram. All the compositions have
a rather high carbon content initially, locating them on the right side of the two-phase domain, as they
were chosen to surround the stoichiometric carbon content. As a carbon loss is expected, the carbon
content of all compositions should be shifted closer to the two-phase domain after sintering.
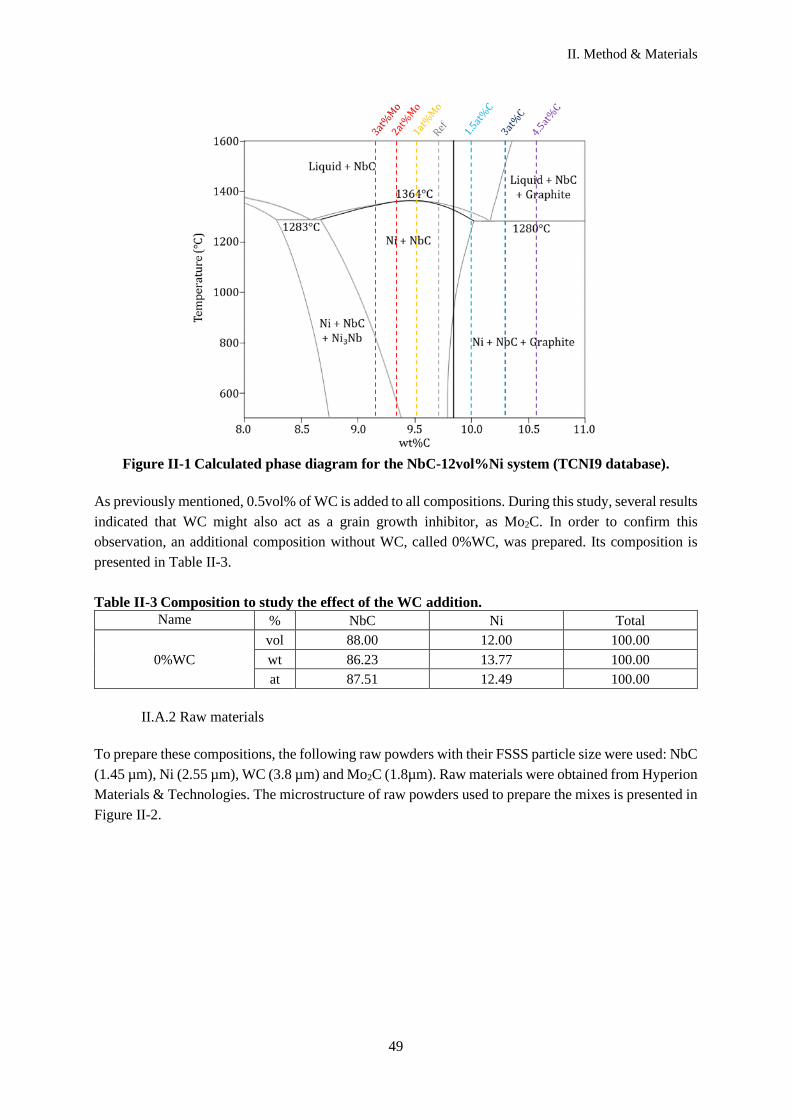
II. Method & Materials
49
Figure II-1 Calculated phase diagram for the NbC-12vol%Ni system (TCNI9 database).
As previously mentioned, 0.5vol% of WC is added to all compositions. During this study, several results
indicated that WC might also act as a grain growth inhibitor, as Mo2C. In order to confirm this
observation, an additional composition without WC, called 0%WC, was prepared. Its composition is
presented in Table II-3.
Table II-3 Composition to study the effect of the WC addition.
Name % NbC Ni Total
0%WC
vol 88.00 12.00 100.00
wt 86.23 13.77 100.00
at 87.51 12.49 100.00
II.A.2 Raw materials
To prepare these compositions, the following raw powders with their FSSS particle size were used: NbC
(1.45 µm), Ni (2.55 µm), WC (3.8 µm) and Mo2C (1.8µm). Raw materials were obtained from Hyperion
Materials & Technologies. The microstructure of raw powders used to prepare the mixes is presented in
Figure II-2.

II. Method & Materials
50
Figure II-2 SEM image (secondary electrons) of raw powders used to prepare the mixes.
II.A.3 Powder mixing
For each composition, raw materials and organic polymer pressing agent (2wt%) were ball milled, dried
and sieved at lab scale. An example of a mixed powder is presented in Figure II-3 a EDS mapping of
the NbC-0.5vol%WC-12vol%Ni powder mix is presented in Figure II-4. Agglomerates of nickel are
visible, indicating a bad mixing of the nickel. WC particles are evenly distributed.
Figure II-3 SEM images of the NbC-0.5vol%WC-12vol%Ni powder mix, (a) Secondary electron
image, 10kV, (b) Backscattered electron image, 10kV.

II. Method & Materials
51
Figure II-4 SEM image and corresponding 8 kV EDS maps of NbC-0.5vol%WC-12vol%Ni
mixed powders agglomerated with pressing agents.
II.A.3 Powder compaction
For every composition, pellets are pressed by uniaxial compaction in an 8 mm diameter die (see Figure
II-5 (b)(c)). The compaction forces presented in Table II-4 were determined after drawing
compressibility curves for each mix and selecting the force corresponding to a 55% relative density.
Table II-4 Forces applied to compress the samples. Study Name Pressure (MPa)
Effect of Mo2C additions
0%Mo2C 90
3%Mo2C (Ref) 130
6%Mo2C 100
9%Mo2C 80
Effect of the carbon content
3at%Mo
130
2at%Mo
1at%Mo
1.5at%C
3at%C
4.5at%C
Effect of WC addition NbC-12vol%Ni 90
The relative density ρr is defined as:
𝜌𝑟 =𝜌
𝜌𝑡ℎ (II-1)
where ρth is the theoretical density and ρ is the sample’s density.
The theoretical densities of each composition, presented in Table II-5, have been estimated from the
densities of each component according to the following formula:
𝜌𝑡ℎ = ∑𝑓𝑣𝑜𝑙𝑖
𝑖
𝜌𝑖 (II-2)

II. Method & Materials
52
where i = NbC, Ni, WC, Mo2C, C, Mo. In this calculation, dissolution effects are neglected, i.e. the
volume of each element in the final material is assumed to be similar to its value in the constituents of
the initial powder mixture, which usually gives a good first order approximation of the density.
Table II-5 Theoretical densities at 20°C.
Name 𝜌𝑡ℎ
0%Mo2C 7.93
3%Mo2C 7.96
6%Mo2C 7.99
9%Mo2C 8.02
3at%Mo 8.06
2at%Mo 8.02
1at%Mo 8.00
1.5at%C 7.88
3at%C 7.83
4.5at%C 7.76
NbC-12vol%Ni 7.89
In the rest of the study, the sample’s density is determined either by measurements of the sample mass
and geometrical dimensions (Eq. II-3) or by Archimedes’ principle method (Eq. II-4). Both method
should give similar results. In case of green compacts, only the geometrical method is used and the
pressing agent mass is subtracted to get the relative density of the carbide material.
𝜌 =4 𝑚
ℎ 𝜋 𝑑2 (II-3)
where m is the mass of the sample, h is the height and d the diameter of the cylindrical sample.
𝜌𝐴 =
𝜌𝑒𝑡ℎ
1 −𝑚𝑒𝑡ℎ𝑚𝑎𝑖𝑟
(II-4)
where ρeth is the density of ethanol at room temperature, meth is the mass of the sample in ethanol and
mair is the mass of the samples in air.
The method of uniaxial compaction is presented in Figure II-5. The powder compacts weigh about 1.3g
and measure about 6 mm in height. They will be sintered according to the thermal cycles presented in
part II-B, and then characterized with techniques described in part II-C.
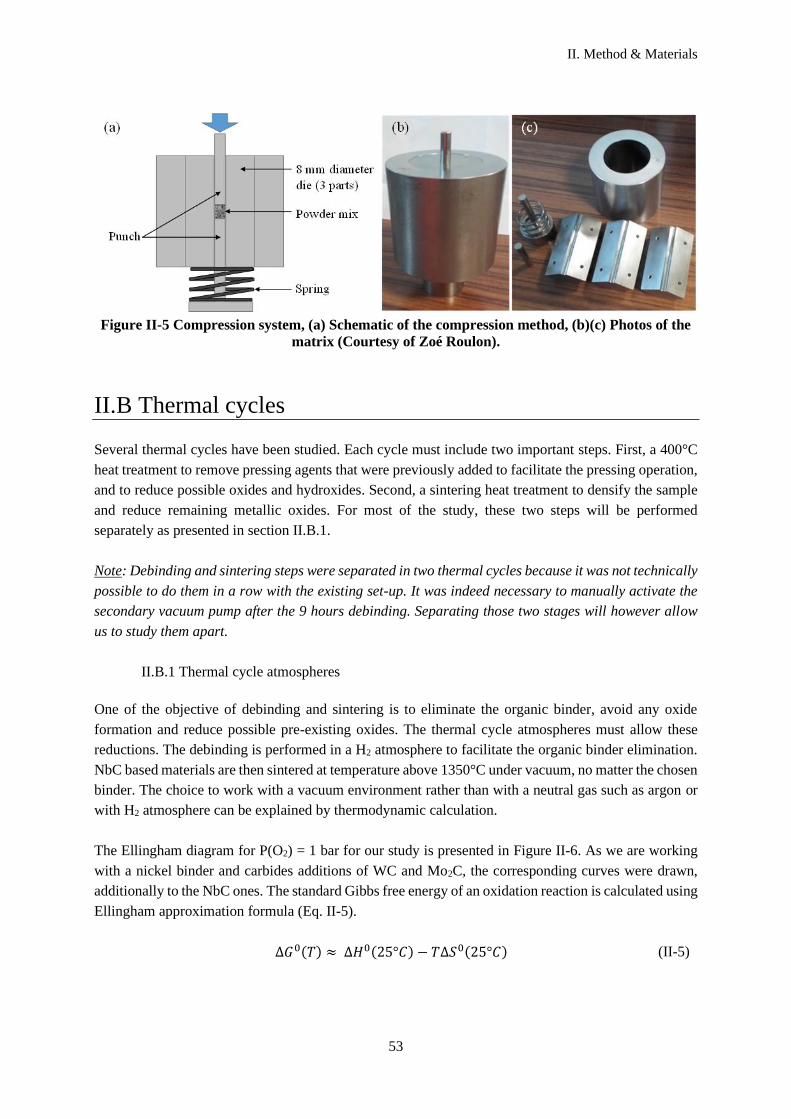
II. Method & Materials
53
Figure II-5 Compression system, (a) Schematic of the compression method, (b)(c) Photos of the
matrix (Courtesy of Zoé Roulon).
II.B Thermal cycles
Several thermal cycles have been studied. Each cycle must include two important steps. First, a 400°C
heat treatment to remove pressing agents that were previously added to facilitate the pressing operation,
and to reduce possible oxides and hydroxides. Second, a sintering heat treatment to densify the sample
and reduce remaining metallic oxides. For most of the study, these two steps will be performed
separately as presented in section II.B.1.
Note: Debinding and sintering steps were separated in two thermal cycles because it was not technically
possible to do them in a row with the existing set-up. It was indeed necessary to manually activate the
secondary vacuum pump after the 9 hours debinding. Separating those two stages will however allow
us to study them apart.
II.B.1 Thermal cycle atmospheres
One of the objective of debinding and sintering is to eliminate the organic binder, avoid any oxide
formation and reduce possible pre-existing oxides. The thermal cycle atmospheres must allow these
reductions. The debinding is performed in a H2 atmosphere to facilitate the organic binder elimination.
NbC based materials are then sintered at temperature above 1350°C under vacuum, no matter the chosen
binder. The choice to work with a vacuum environment rather than with a neutral gas such as argon or
with H2 atmosphere can be explained by thermodynamic calculation.
The Ellingham diagram for P(O2) = 1 bar for our study is presented in Figure II-6. As we are working
with a nickel binder and carbides additions of WC and Mo2C, the corresponding curves were drawn,
additionally to the NbC ones. The standard Gibbs free energy of an oxidation reaction is calculated using
Ellingham approximation formula (Eq. II-5).
∆𝐺0(𝑇) ≈ ∆𝐻0(25°𝐶) − 𝑇∆𝑆0(25°𝐶) (II-5)

II. Method & Materials
54
where, for an oxidation reaction, ∆𝐺0(𝑇) is the standard Gibbs free energy of the reaction, ∆𝐻0(25°𝐶)
is the standard enthalpy and ∆𝑆0(25°𝐶) is the standard entropy of the reaction at room temperature. The
values used to calculate the enthalpy and entropy variations are presented in Table II-6.
Table II-6 Enthalpy of formation and free entropy at room temperature [69]
Substance ∆𝐻𝑓0(25°𝐶) 𝑆0(25°𝐶) Substance ∆𝐻𝑓
0(25°𝐶) 𝑆0(25°𝐶)
Unit kJ/mol J/mol.K Unit kJ/mol J/mol.K
(O2) 0 205.2 ± 0.04 ⟨NbH2⟩ -175.6
(H2) 0 130.7 ± 0.08 ⟨Mo2C⟩ -46.1 ± 2.9 65.7 ± 0.8
⟨C⟩ Graphite 0 5.74 ± 0.02 ⟨MoO2⟩ -588.2 ± 1.7 50.0 ± 1.3
(CO) -110.6 ± 0.2 197.7 ± 0.04 ⟨MoO3⟩ -745.7 ± 0.8 77.8 ± 0.6
(CO2) -393.8 ± 0.1 213.8 ± 0.04 ⟨WC⟩ -38.1 ± 10.5 41.9 ± 4.2
(H2O) -242.0 188.8 ⟨WO2⟩ -590.1 ± 6.3 50.7 ± 1.7
⟨NbC⟩ -138.2 ± 4.2 35.1 ± 0.4 ⟨WO3⟩ -843.4 ± 2.9 77.0 ± 1.3
⟨NbO⟩ -419.9 ± 12.6 46.1 ± 8.4 ⟨Ni⟩ 0 29.9 ± 0.4
⟨NbO2⟩ -795.5 ± 8.4 54.6 ± 0.3 ⟨NiO⟩ -240.7 ± 2.1 38.1 ± 0.4
⟨Nb2O5⟩ -1900.8 ± 5.0 137.3 ± 1.3
( ) gas, ⟨ ⟩ solid

II. Method & Materials
55
Figure II-6 Ellingham diagram at P(O2) = 1 bar.

II. Method & Materials
56
In our study, every sample is first debinded for 1h at 400°C in hydrogenated helium He-4%H2. The
oxygen content in the commercial gas mixture is specified between 1 and 10 ppm, corresponding to a
vapor partial pressure P(H2O) ≤ 10-5 bar. However, in practical situations, oxygen from degassing the
device surfaces and possible micro-leaks may increase this partial pressure. The value was estimated in
our TGA device as P(H2O) ≤ 10-5 bar, in a previous work on active oxidation of silicon [70] and different
works in the lab tend to conclude that P(H2O) is in the range 10-4-10-5 bar in our experimental conditions.
Therefore, the dihydrogen has a pressure of P(H2) = 4.10-2 bar and P(H2O) is assumed to be in the range
10-4-10-5 bar.
In a H2 rich atmosphere, the nickel oxides are easily reduced for any ratio P(H2O)/P(H2) < 1, no matter
the temperature according to formula (II-6).
𝑁𝑖𝑂 + 𝐻2 → 𝑁𝑖 + 𝐻2𝑂 (II-6)
Other oxides can by reduced by H2 for P(H2O)/P(H2) < 1 but only above a certain temperature depending
on the pressure ratio. For example, for P(H2O)/P(H2) = 1, WO3 is reduced above 320°C and WO2 above
400°C. MoO2 is reduced above 580°C and MoO3 is reduced no matter the temperature. NbO is reduced
above 700°C, Nb2O5 above 1160°C and NbO2 above 1620°C. But these temperatures are reduced for
lower P(H2O)/P(H2) ratios. To deal with the problem, the water vapor pressure P(H2O) was calculated
for each oxidation reaction with P(H2) = 4.10-2 bar (see Appendix 3) and is presented in Figure II-7. It
is assumed that there is an equilibrium between the metallic nickel, the oxides, the refractory element
carbides, free carbon and the gases (O2, H2 and H2O), and therefore that metallic Nb, W and Mo are not
involved.
It can be seen that the equilibrium water partial pressure becomes larger than the actual partial pressure
in the furnace (P(H2O) = 10-4-10-5 bar) above a certain temperature no matter the oxide considered. It
means that there is a transition from an oxidizing to a reducing atmosphere. The most stable oxide NbO2
is reduced above 750°C, and thus all the considered oxides are reduced above that temperature.

II. Method & Materials
57
Figure II-7 P(H2O) at oxidation-reduction equilibrium as a function of the temperature.
The Ellingham diagram indicates that carbon would be a more efficient reducing agent than H2 above
approximately 700°C. In order for carbon to be able to reduce oxides, the total equilibrium partial
pressure of carbon monoxide and dioxide must be larger than the value due to the oxygen pressure P(O2)
in the furnace, i.e. ½ P(CO) + P(CO2) > P(O2). In our study, a secondary vacuum of 5.10-6 bar is applied
during sintering, which leads to P(O2) = 10-6 bar if pumping air.
Figure II-8 presents the value of ½ P(CO)+P(CO2) at equilibrium for each oxide. It is assumed that there
is an equilibrium between the metallic nickel, the oxides, the refractory element carbides, free carbon
and the gases (O2, CO and CO2) and therefore that metallic Nb, W and Mo are not involved.
P(CO)+P(CO2) is superior to P(O2) = 10-6 bar above 430°C for the most stable Nb oxides (Nb2O5 and
NbO2). Therefore, the furnace atmosphere becomes reducing above this temperature. Use of secondary
vacuum involving oxide reduction by carbon is then more efficient than standard H2 atmosphere. In this
work, a temperature of more than 1000°C is always reached during sintering, allowing the reduction of
all the metallic oxides.

II. Method & Materials
58
Figure II-8 ½ P(CO)+P(CO2) at oxidation-reduction equilibrium as a function of the
temperature.
An argon atmosphere could also be considered, but with a P(O2) of approximately 10-5 bar, the oxide
reduction would be less effective than in vacuum.
Although both a He-H2 and vacuum atmospheres allow the reduction of Nb/Mo/W oxides, the use of
hydrogenated helium at high temperature can damage the Pt thermocouples and lead to the formation of
CH4 and thus to an uncontrolled decarburization. The use of vacuum as a reductive medium induces
decarburization since carbon is a reactant to form CO or CO2, but this can be anticipated by the addition
of extra C in relation with the expected quantity of refractory oxides to eliminate. However, evaporation
of metallic elements at high temperature should be avoided, which will be investigated in this study.
II.B.2 Two-step thermal cycles
II.B.2.a Debinding cycle
The debinding is performed in a helium – 4% dihydrogen atmosphere in order to eliminate the organic
binder. The temperature increases at 1°C/min until 400°C, then is constant for 1h at 400°C, then
decreases at 20°C/min until room temperature. This thermal cycle is presented in Figure II-9.
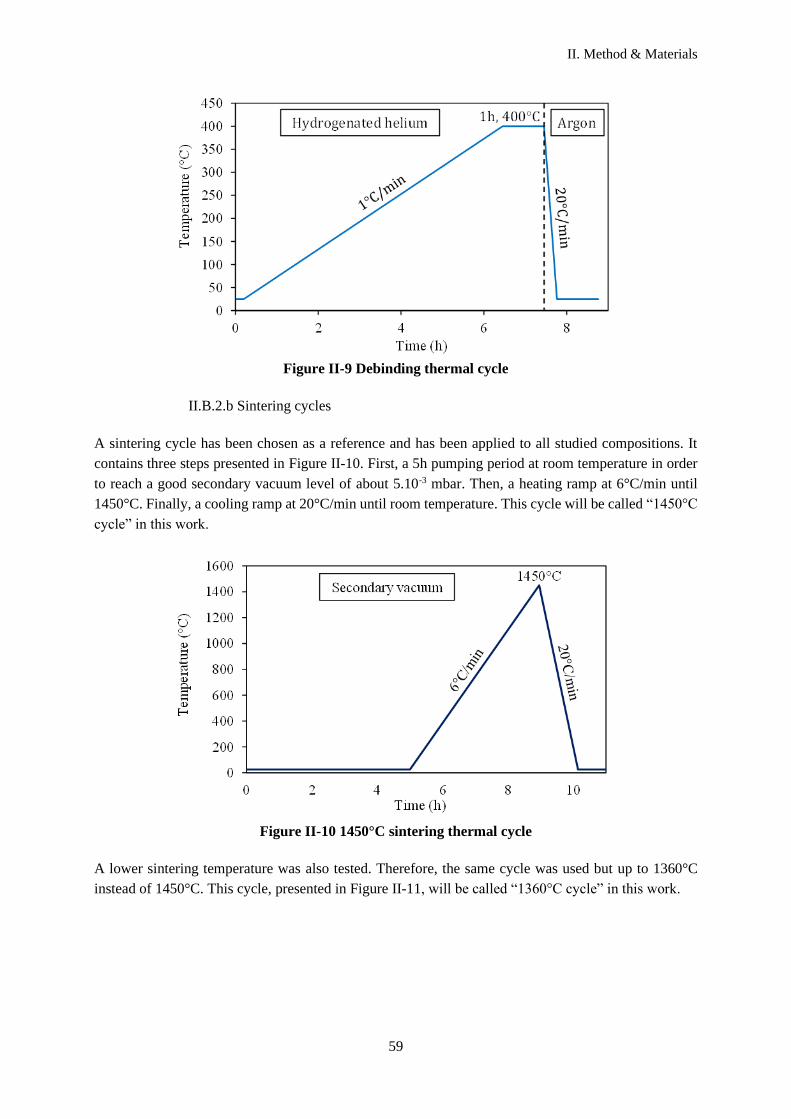
II. Method & Materials
59
Figure II-9 Debinding thermal cycle
II.B.2.b Sintering cycles
A sintering cycle has been chosen as a reference and has been applied to all studied compositions. It
contains three steps presented in Figure II-10. First, a 5h pumping period at room temperature in order
to reach a good secondary vacuum level of about 5.10-3 mbar. Then, a heating ramp at 6°C/min until
1450°C. Finally, a cooling ramp at 20°C/min until room temperature. This cycle will be called “1450°C
cycle” in this work.
Figure II-10 1450°C sintering thermal cycle
A lower sintering temperature was also tested. Therefore, the same cycle was used but up to 1360°C
instead of 1450°C. This cycle, presented in Figure II-11, will be called “1360°C cycle” in this work.

II. Method & Materials
60
Figure II-11 1360°C sintering thermal cycle
In order to study the kinetics of grain growth, the cycle at 1360°C was extended with a temperature
plateau at 1360°C of 1h, 2h or 4h. When referring to this thermal cycles, the length of this step will be
specified. For example, the cycle presented in Figure II-12 will be called “1360°C 1h cycle”.
Figure II-12 Example of a sintering thermal cycle with an extended time at 1360°C of 1h.
Several interrupted tests were performed in order to analyze the sintering mechanisms. The chosen
temperatures correspond to specific sintering steps determined by dilatometry (see part V), such as the
beginning of liquid phase sintering. Those temperatures also vary with the composition. An example of
an interrupted test at 1080°C is presented in Figure II-13 and all the studied interruption temperatures
are presented in Table II-7.

II. Method & Materials
61
Figure II-13 Example of an interrupted sintering thermal cycle at 1080°C.
Table II-7 Interruption temperatures.
0%Mo2C 3%Mo2C
Solid state sintering beginning 1080°C 1080°C
Acceleration of solid state sintering - 1180°C
Liquid phase sintering beginning 1310°C 1320°C
Finally, the heating rate influence was studied with a longer cycle. The heating ramp is 3°C/min and there
is a maintaining of 1h at 1450°C as presented in Figure II-14. If needed, this longer cycle will be referred
to as “1450°C long cycle”.
Figure II-14 1450°C long sintering thermal cycle
II.B.3 Industrial cycle
In order to compare with the samples prepared in lab equipment, an industrial cycle presented in Figure
II-15 was performed on every composition in an industrial furnace in Hyperion Materials &
Technologies. This cycle includes both the debinding and the sintering steps.
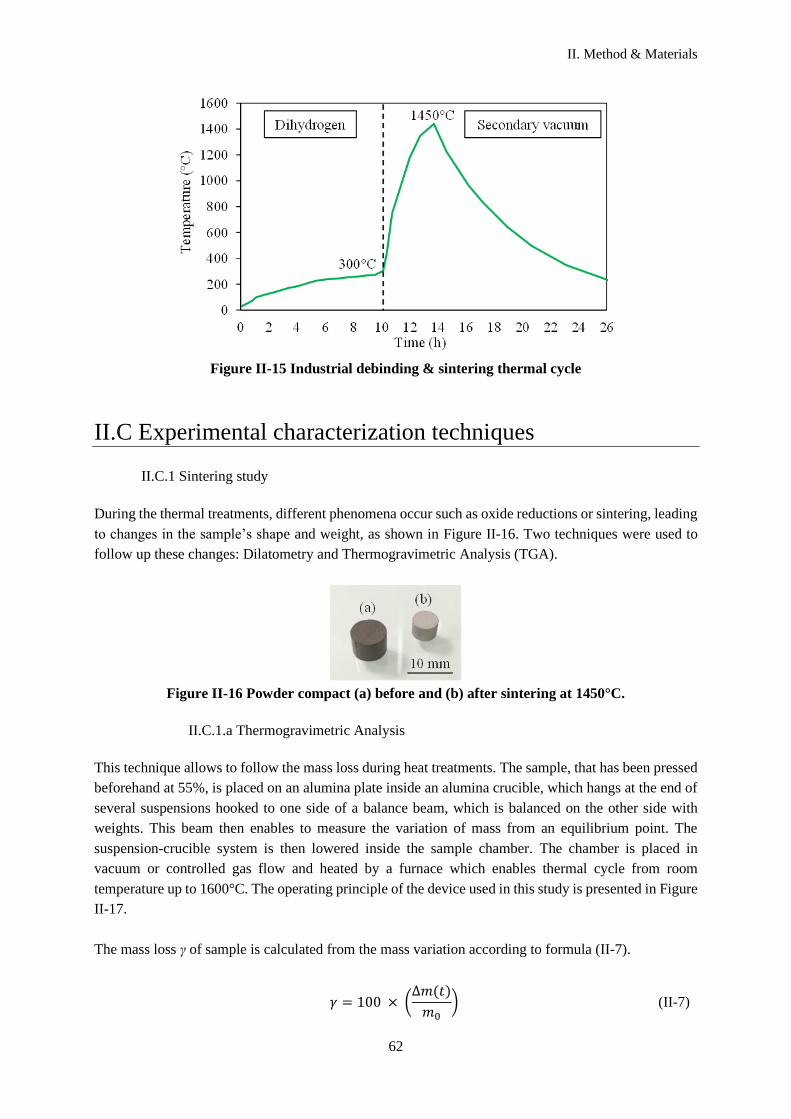
II. Method & Materials
62
Figure II-15 Industrial debinding & sintering thermal cycle
II.C Experimental characterization techniques
II.C.1 Sintering study
During the thermal treatments, different phenomena occur such as oxide reductions or sintering, leading
to changes in the sample’s shape and weight, as shown in Figure II-16. Two techniques were used to
follow up these changes: Dilatometry and Thermogravimetric Analysis (TGA).
Figure II-16 Powder compact (a) before and (b) after sintering at 1450°C.
II.C.1.a Thermogravimetric Analysis
This technique allows to follow the mass loss during heat treatments. The sample, that has been pressed
beforehand at 55%, is placed on an alumina plate inside an alumina crucible, which hangs at the end of
several suspensions hooked to one side of a balance beam, which is balanced on the other side with
weights. This beam then enables to measure the variation of mass from an equilibrium point. The
suspension-crucible system is then lowered inside the sample chamber. The chamber is placed in
vacuum or controlled gas flow and heated by a furnace which enables thermal cycle from room
temperature up to 1600°C. The operating principle of the device used in this study is presented in Figure
II-17.
The mass loss γ of sample is calculated from the mass variation according to formula (II-7).
𝛾 = 100 × (∆𝑚(𝑡)
𝑚0) (II-7)

II. Method & Materials
63
where mo is the initial sample’s mass and Δm(t) is the mass difference measured at time t.
The thermogravimetric analysis was performed on a Setaram Setsys 16/18 device with the software
Setsoft 2000 for the acquisition.
Figure II-17 Thermogravimetric analysis device
II.C.1.b Dilatometry
A dilatometer enables to follow the variation of height along a vertical axis z during a thermal cycle.
The sample, that has been pressed beforehand at a 55% relative density, is placed on a sample holder
between two alumina plates. An alumina push-rod, which is mechanically linked to a displacement
sensor, is then lowered down until it barely touches the upper alumina plate. To hold the push-rod against
the upper alumina plate, and to avoid any shift of the sample, a 2g charge is applied. The system is then
lowered into the sample chamber. The chamber is placed in vacuum or controlled gas flow and heated
by a furnace which enables thermal cycle from ambient temperature up to 1600°C. Figure II-18
illustrates the dilatometry device used in this study.
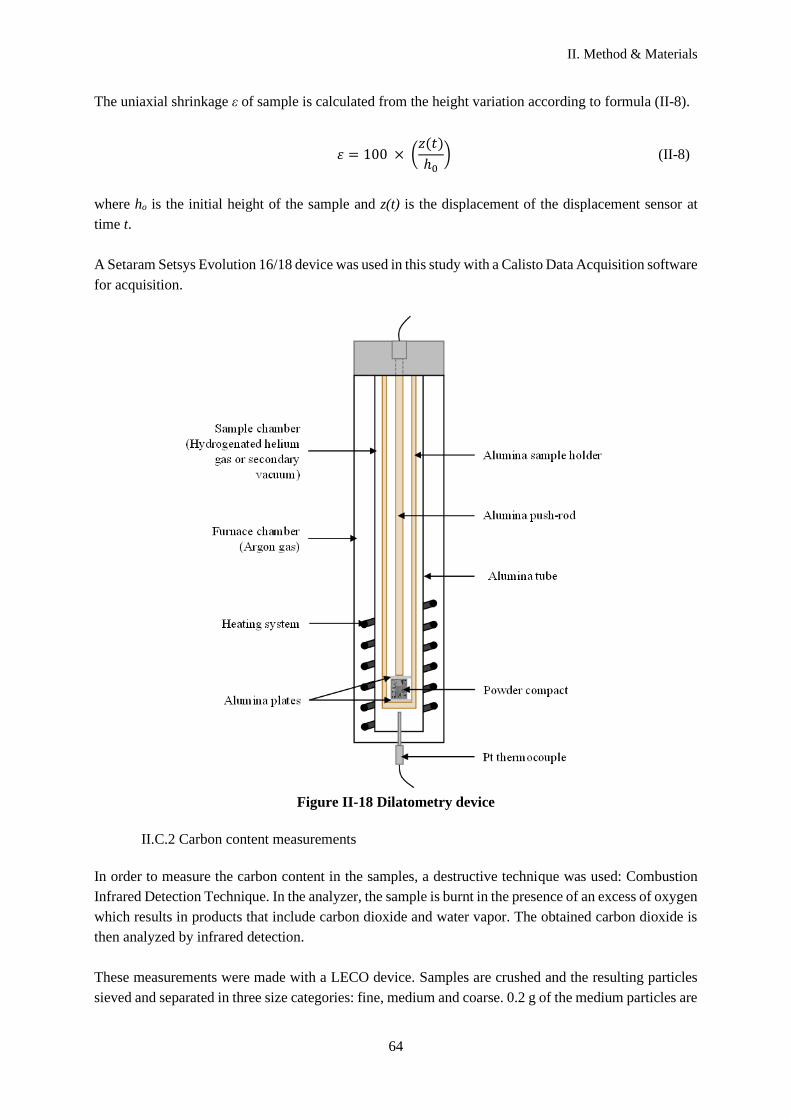
II. Method & Materials
64
The uniaxial shrinkage ε of sample is calculated from the height variation according to formula (II-8).
𝜀 = 100 × (𝑧(𝑡)
ℎ0) (II-8)
where ho is the initial height of the sample and z(t) is the displacement of the displacement sensor at
time t.
A Setaram Setsys Evolution 16/18 device was used in this study with a Calisto Data Acquisition software
for acquisition.
Figure II-18 Dilatometry device
II.C.2 Carbon content measurements
In order to measure the carbon content in the samples, a destructive technique was used: Combustion
Infrared Detection Technique. In the analyzer, the sample is burnt in the presence of an excess of oxygen
which results in products that include carbon dioxide and water vapor. The obtained carbon dioxide is
then analyzed by infrared detection.
These measurements were made with a LECO device. Samples are crushed and the resulting particles
sieved and separated in three size categories: fine, medium and coarse. 0.2 g of the medium particles are
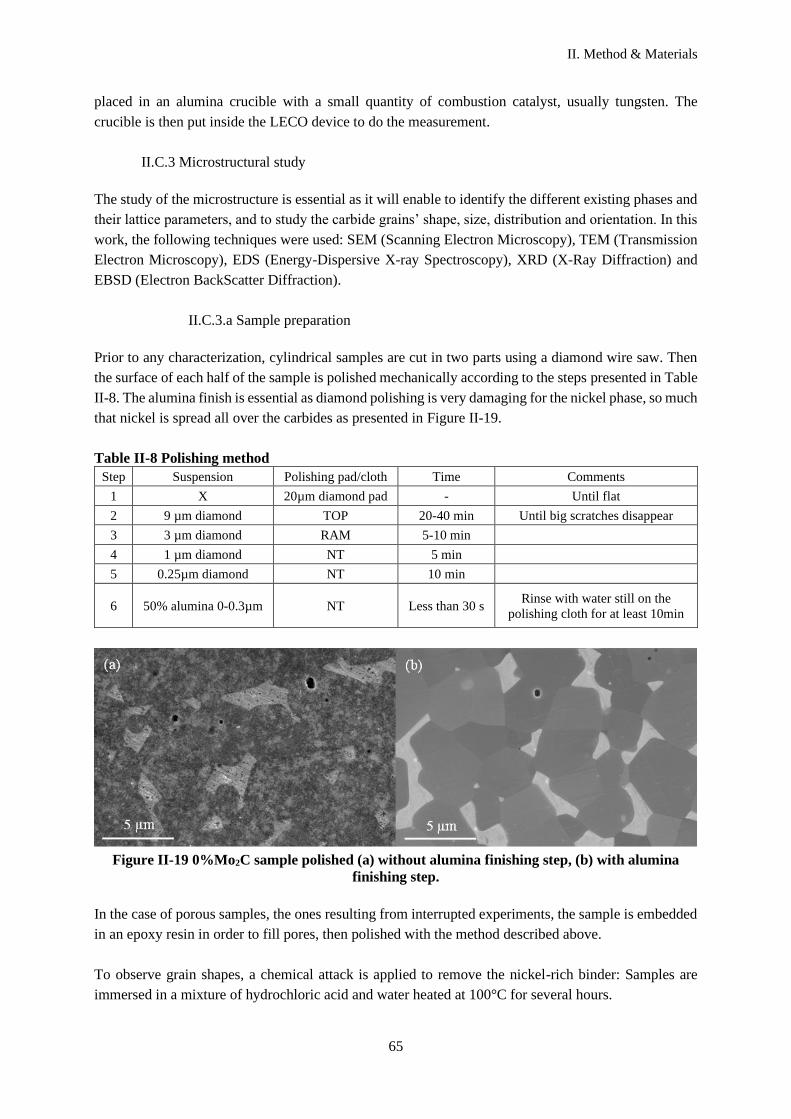
II. Method & Materials
65
placed in an alumina crucible with a small quantity of combustion catalyst, usually tungsten. The
crucible is then put inside the LECO device to do the measurement.
II.C.3 Microstructural study
The study of the microstructure is essential as it will enable to identify the different existing phases and
their lattice parameters, and to study the carbide grains’ shape, size, distribution and orientation. In this
work, the following techniques were used: SEM (Scanning Electron Microscopy), TEM (Transmission
Electron Microscopy), EDS (Energy-Dispersive X-ray Spectroscopy), XRD (X-Ray Diffraction) and
EBSD (Electron BackScatter Diffraction).
II.C.3.a Sample preparation
Prior to any characterization, cylindrical samples are cut in two parts using a diamond wire saw. Then
the surface of each half of the sample is polished mechanically according to the steps presented in Table
II-8. The alumina finish is essential as diamond polishing is very damaging for the nickel phase, so much
that nickel is spread all over the carbides as presented in Figure II-19.
Table II-8 Polishing method
Step Suspension Polishing pad/cloth Time Comments
1 X 20µm diamond pad - Until flat
2 9 µm diamond TOP 20-40 min Until big scratches disappear
3 3 µm diamond RAM 5-10 min
4 1 µm diamond NT 5 min
5 0.25µm diamond NT 10 min
6 50% alumina 0-0.3µm NT Less than 30 s Rinse with water still on the
polishing cloth for at least 10min
Figure II-19 0%Mo2C sample polished (a) without alumina finishing step, (b) with alumina
finishing step.
In the case of porous samples, the ones resulting from interrupted experiments, the sample is embedded
in an epoxy resin in order to fill pores, then polished with the method described above.
To observe grain shapes, a chemical attack is applied to remove the nickel-rich binder: Samples are
immersed in a mixture of hydrochloric acid and water heated at 100°C for several hours.
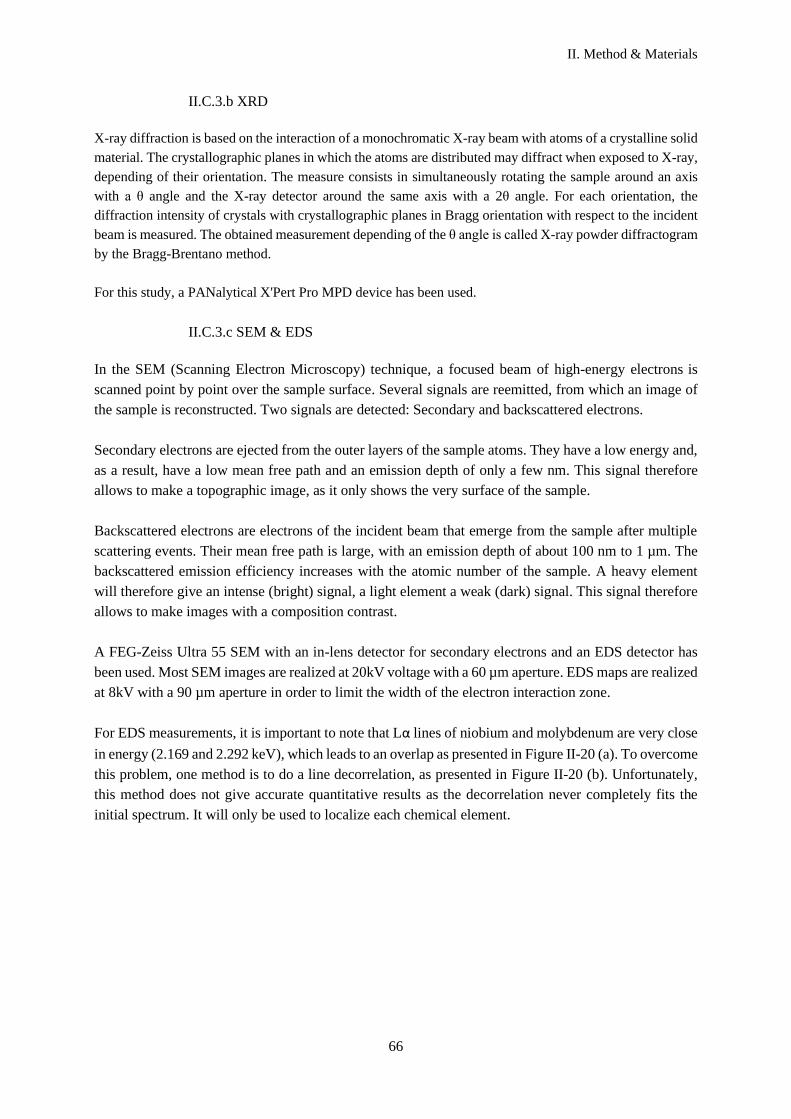
II. Method & Materials
66
II.C.3.b XRD
X-ray diffraction is based on the interaction of a monochromatic X-ray beam with atoms of a crystalline solid
material. The crystallographic planes in which the atoms are distributed may diffract when exposed to X-ray,
depending of their orientation. The measure consists in simultaneously rotating the sample around an axis
with a θ angle and the X-ray detector around the same axis with a 2θ angle. For each orientation, the
diffraction intensity of crystals with crystallographic planes in Bragg orientation with respect to the incident
beam is measured. The obtained measurement depending of the θ angle is called X-ray powder diffractogram
by the Bragg-Brentano method.
For this study, a PANalytical X'Pert Pro MPD device has been used.
II.C.3.c SEM & EDS
In the SEM (Scanning Electron Microscopy) technique, a focused beam of high-energy electrons is
scanned point by point over the sample surface. Several signals are reemitted, from which an image of
the sample is reconstructed. Two signals are detected: Secondary and backscattered electrons.
Secondary electrons are ejected from the outer layers of the sample atoms. They have a low energy and,
as a result, have a low mean free path and an emission depth of only a few nm. This signal therefore
allows to make a topographic image, as it only shows the very surface of the sample.
Backscattered electrons are electrons of the incident beam that emerge from the sample after multiple
scattering events. Their mean free path is large, with an emission depth of about 100 nm to 1 µm. The
backscattered emission efficiency increases with the atomic number of the sample. A heavy element
will therefore give an intense (bright) signal, a light element a weak (dark) signal. This signal therefore
allows to make images with a composition contrast.
A FEG-Zeiss Ultra 55 SEM with an in-lens detector for secondary electrons and an EDS detector has
been used. Most SEM images are realized at 20kV voltage with a 60 µm aperture. EDS maps are realized
at 8kV with a 90 µm aperture in order to limit the width of the electron interaction zone.
For EDS measurements, it is important to note that Lα lines of niobium and molybdenum are very close
in energy (2.169 and 2.292 keV), which leads to an overlap as presented in Figure II-20 (a). To overcome
this problem, one method is to do a line decorrelation, as presented in Figure II-20 (b). Unfortunately,
this method does not give accurate quantitative results as the decorrelation never completely fits the
initial spectrum. It will only be used to localize each chemical element.

II. Method & Materials
67
Figure II-20 (a) EDS spectrum of a 3%Mo2C sample sintered at 1450°C, (b) Example of
deconvolution of the niobium and molybdenum Lα lines.
Another method to avoid the overlapping lines of Mo and Nb is to work at high voltage (30 kV) and to
use Kα lines (Nb: 16.615 keV, Mo: 17.480 keV, see Figure II-20 (a)) instead of Lα lines. However, this
method leads to a very wide electron interaction zone, which is inadequate to localize phases on a map
as presented in Figure II-21, and it will therefore not be used in SEM. This method will nevertheless be
used in TEM where the electron beam is more localized in order to make quantitative composition
estimations.
Figure II-21 EDS mapping of niobium in a 9%Mo2C sample sintered at 1450°C, (a) 30kV map
(Kα line) and (b) 8kV map (Lα line)
II.C.3.d TEM & EDS
The transmission electron microscope provides a projection image of the thin slice area of material
which is irradiated by an electron beam. Image contrasts are based on inelastic and elastic scattering,
the latter being responsible for the diffraction in a crystallized material. Transmission electron
microscopy (TEM) allows to visualize the information either in real space (image with contrasts
representative of the localized crystalline structure) or in reciprocal space (spots constituting the
diffraction pattern). It is therefore a good technique for high resolution imaging and local identification
of crystalline phases. It can be combined with EDS (see below) to obtain composition map.
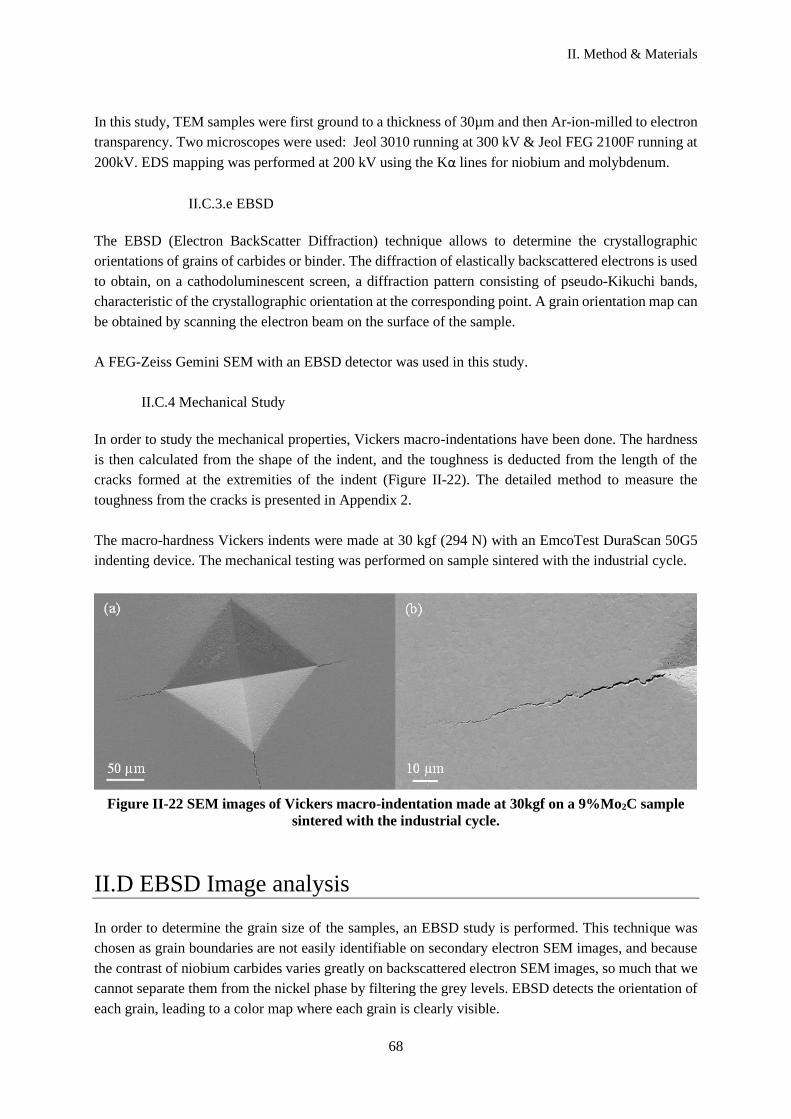
II. Method & Materials
68
In this study, TEM samples were first ground to a thickness of 30µm and then Ar-ion-milled to electron
transparency. Two microscopes were used: Jeol 3010 running at 300 kV & Jeol FEG 2100F running at
200kV. EDS mapping was performed at 200 kV using the Kα lines for niobium and molybdenum.
II.C.3.e EBSD
The EBSD (Electron BackScatter Diffraction) technique allows to determine the crystallographic
orientations of grains of carbides or binder. The diffraction of elastically backscattered electrons is used
to obtain, on a cathodoluminescent screen, a diffraction pattern consisting of pseudo-Kikuchi bands,
characteristic of the crystallographic orientation at the corresponding point. A grain orientation map can
be obtained by scanning the electron beam on the surface of the sample.
A FEG-Zeiss Gemini SEM with an EBSD detector was used in this study.
II.C.4 Mechanical Study
In order to study the mechanical properties, Vickers macro-indentations have been done. The hardness
is then calculated from the shape of the indent, and the toughness is deducted from the length of the
cracks formed at the extremities of the indent (Figure II-22). The detailed method to measure the
toughness from the cracks is presented in Appendix 2.
The macro-hardness Vickers indents were made at 30 kgf (294 N) with an EmcoTest DuraScan 50G5
indenting device. The mechanical testing was performed on sample sintered with the industrial cycle.
Figure II-22 SEM images of Vickers macro-indentation made at 30kgf on a 9%Mo2C sample
sintered with the industrial cycle.
II.D EBSD Image analysis
In order to determine the grain size of the samples, an EBSD study is performed. This technique was
chosen as grain boundaries are not easily identifiable on secondary electron SEM images, and because
the contrast of niobium carbides varies greatly on backscattered electron SEM images, so much that we
cannot separate them from the nickel phase by filtering the grey levels. EBSD detects the orientation of
each grain, leading to a color map where each grain is clearly visible.

II. Method & Materials
69
II.D.1 Data acquisition
For each sample, three maps are made; one at the center of the sample, and two in different corners (see
Figure II-23). The size of the map and resolution are chosen depending on the sample and its grain size,
with the objective of having more than 1000 grains per sample. Table II-9 presents all the maps made
with the chosen map size and resolution. An example of a raw map is presented in Figure II-24.
Figure II-23 EBSD localization of the three maps. Blue arrows indicate the compression
direction.
Table II-9 Map size and resolution of EBSD maps.
Sample Temperature Time at T Map size Resolution Total number of grains
0%Mo2C 1450°C 0h 175x175 µm 0.1 µm/px 3291
3%Mo2C 1450°C 0h 70x70 µm 0.05 µm/px 3027
6%Mo2C 1450°C 0h 70x70 µm 0.05 µm/px 5295
9%Mo2C 1450°C 0h 45x45 µm 0.03 µm/px 3312
3at%Mo 1450°C 0h 45x45 µm 0.03 µm/px 2954
3at%C 1450°C 0h 125x125 µm 0.08µm/px 3065
0%Mo2C 1360°C 0h 175x175 µm 0.1 µm/px 6490
0%Mo2C 1360°C 4h 175x175 µm 0.1 µm/px 3297
0%WC 1360°C 0h 125x125 µm 0.08µm/px 3126
0%WC 1360°C 1h 175x175 µm 0.1µm/px 1697
0%WC 1360°C 2h 245x245 µm 0.15µm/px 2208
0%WC 1360°C 4h 245x245 µm 0.2µm/px 1497
Note: To avoid distortion at low magnification, 5 maps at high magnification instead of 3 were measured
for the 0%WC sample sintered 4h at 1360°C.
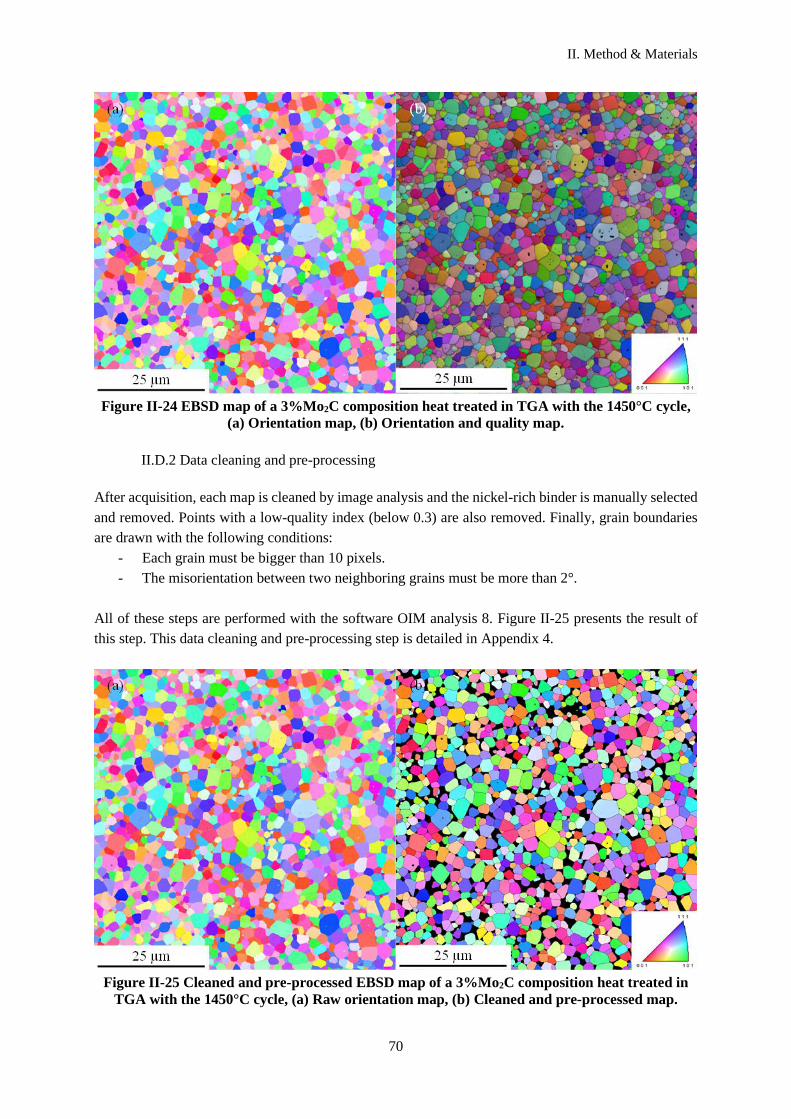
II. Method & Materials
70
Figure II-24 EBSD map of a 3%Mo2C composition heat treated in TGA with the 1450°C cycle,
(a) Orientation map, (b) Orientation and quality map.
II.D.2 Data cleaning and pre-processing
After acquisition, each map is cleaned by image analysis and the nickel-rich binder is manually selected
and removed. Points with a low-quality index (below 0.3) are also removed. Finally, grain boundaries
are drawn with the following conditions:
- Each grain must be bigger than 10 pixels.
- The misorientation between two neighboring grains must be more than 2°.
All of these steps are performed with the software OIM analysis 8. Figure II-25 presents the result of
this step. This data cleaning and pre-processing step is detailed in Appendix 4.
Figure II-25 Cleaned and pre-processed EBSD map of a 3%Mo2C composition heat treated in
TGA with the 1450°C cycle, (a) Raw orientation map, (b) Cleaned and pre-processed map.
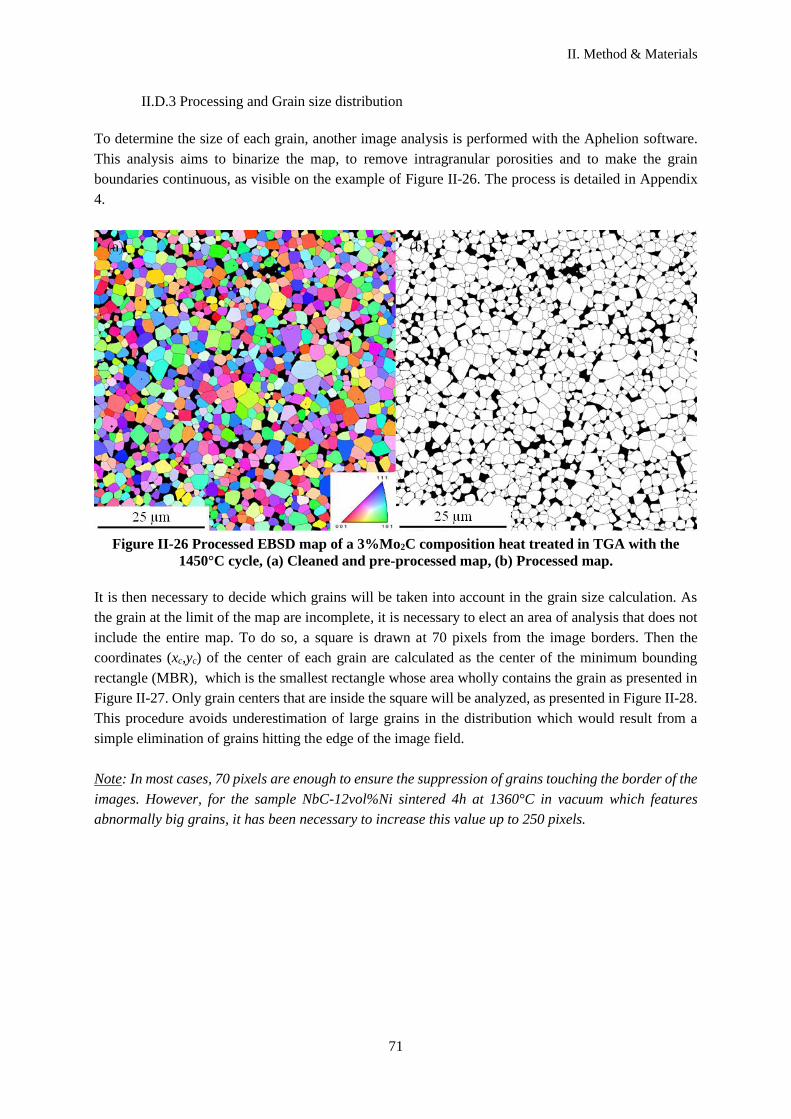
II. Method & Materials
71
II.D.3 Processing and Grain size distribution
To determine the size of each grain, another image analysis is performed with the Aphelion software.
This analysis aims to binarize the map, to remove intragranular porosities and to make the grain
boundaries continuous, as visible on the example of Figure II-26. The process is detailed in Appendix
4.
Figure II-26 Processed EBSD map of a 3%Mo2C composition heat treated in TGA with the
1450°C cycle, (a) Cleaned and pre-processed map, (b) Processed map.
It is then necessary to decide which grains will be taken into account in the grain size calculation. As
the grain at the limit of the map are incomplete, it is necessary to elect an area of analysis that does not
include the entire map. To do so, a square is drawn at 70 pixels from the image borders. Then the
coordinates (xc,yc) of the center of each grain are calculated as the center of the minimum bounding
rectangle (MBR), which is the smallest rectangle whose area wholly contains the grain as presented in
Figure II-27. Only grain centers that are inside the square will be analyzed, as presented in Figure II-28.
This procedure avoids underestimation of large grains in the distribution which would result from a
simple elimination of grains hitting the edge of the image field.
Note: In most cases, 70 pixels are enough to ensure the suppression of grains touching the border of the
images. However, for the sample NbC-12vol%Ni sintered 4h at 1360°C in vacuum which features
abnormally big grains, it has been necessary to increase this value up to 250 pixels.
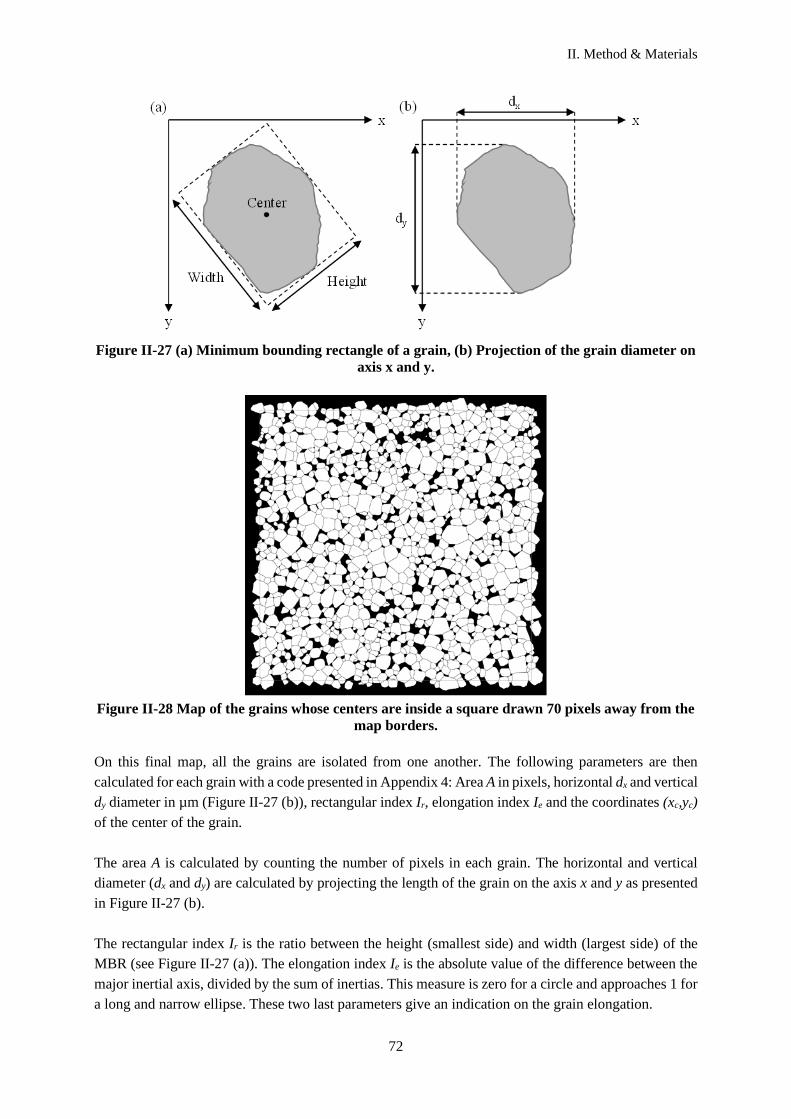
II. Method & Materials
72
Figure II-27 (a) Minimum bounding rectangle of a grain, (b) Projection of the grain diameter on
axis x and y.
Figure II-28 Map of the grains whose centers are inside a square drawn 70 pixels away from the
map borders.
On this final map, all the grains are isolated from one another. The following parameters are then
calculated for each grain with a code presented in Appendix 4: Area A in pixels, horizontal dx and vertical
dy diameter in µm (Figure II-27 (b)), rectangular index Ir, elongation index Ie and the coordinates (xc,yc)
of the center of the grain.
The area A is calculated by counting the number of pixels in each grain. The horizontal and vertical
diameter (dx and dy) are calculated by projecting the length of the grain on the axis x and y as presented
in Figure II-27 (b).
The rectangular index Ir is the ratio between the height (smallest side) and width (largest side) of the
MBR (see Figure II-27 (a)). The elongation index Ie is the absolute value of the difference between the
major inertial axis, divided by the sum of inertias. This measure is zero for a circle and approaches 1 for
a long and narrow ellipse. These two last parameters give an indication on the grain elongation.
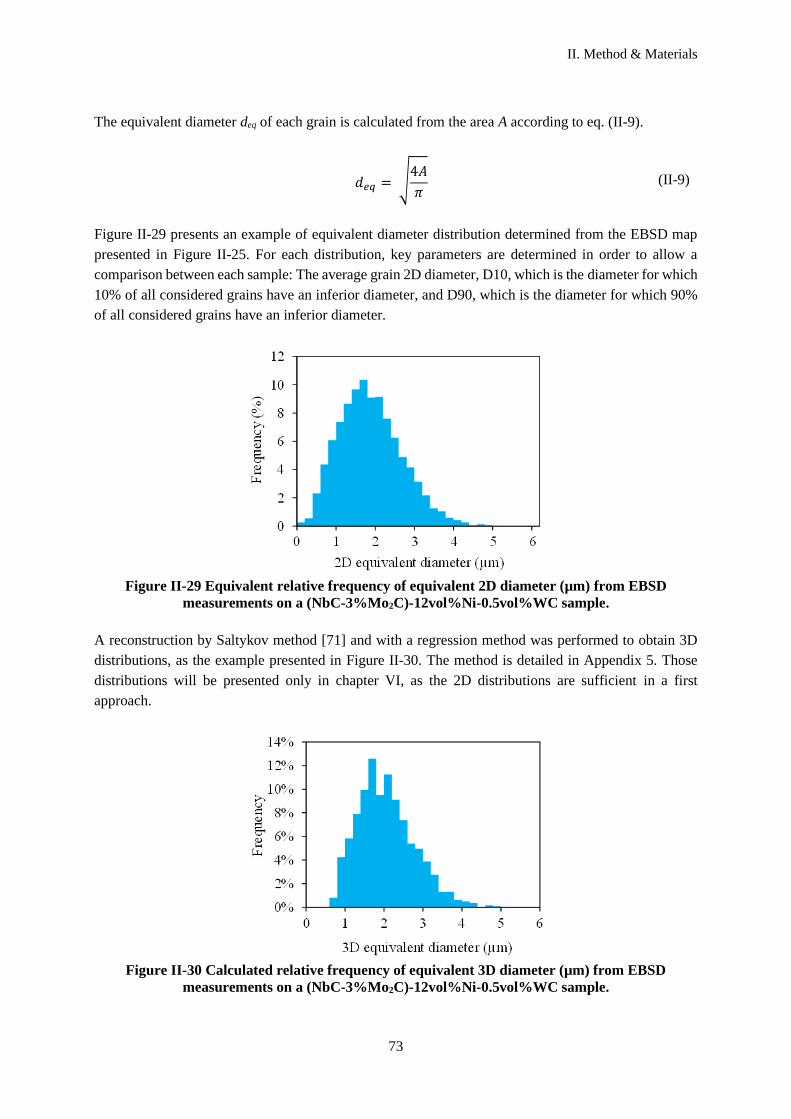
II. Method & Materials
73
The equivalent diameter deq of each grain is calculated from the area A according to eq. (II-9).
𝑑𝑒𝑞 = √4𝐴
𝜋 (II-9)
Figure II-29 presents an example of equivalent diameter distribution determined from the EBSD map
presented in Figure II-25. For each distribution, key parameters are determined in order to allow a
comparison between each sample: The average grain 2D diameter, D10, which is the diameter for which
10% of all considered grains have an inferior diameter, and D90, which is the diameter for which 90%
of all considered grains have an inferior diameter.
Figure II-29 Equivalent relative frequency of equivalent 2D diameter (µm) from EBSD
measurements on a (NbC-3%Mo2C)-12vol%Ni-0.5vol%WC sample.
A reconstruction by Saltykov method [71] and with a regression method was performed to obtain 3D
distributions, as the example presented in Figure II-30. The method is detailed in Appendix 5. Those
distributions will be presented only in chapter VI, as the 2D distributions are sufficient in a first
approach.
Figure II-30 Calculated relative frequency of equivalent 3D diameter (µm) from EBSD
measurements on a (NbC-3%Mo2C)-12vol%Ni-0.5vol%WC sample.

II. Method & Materials
74
II.D.4 Contiguity
The software program to measure contiguity was developed by Pellan [72]. It is based on counting the
fraction of entry points in the NbC rich phase along horizontal lines which are at grain boundaries, as
presented in Figure II-31. Entry points are arbitrarily considered from the left to the right but this has no
incidence on the result. From stereology, the fraction of entry points at grain boundaries is an estimate
of the fraction of surface area of the carbide phase which is at the grain boundary, i.e. the contiguity.
Contiguity is then calculated with formula (II-10). Basically, in the software, the separators between
grains should be lines of thickness 1 pixel. Due to the imperfections of our images, the separators were
reconstructed by skeletonization of the boundaries separating grains at a distance lower than 6 pixels.
𝐶 = 𝑁𝐶𝐶
𝑁𝐶𝐶 + 𝑁𝐵𝐶 (II-10)
where NBC are the binder-carbide entry points and NCC are the carbide-carbide entry points.
Figure II-31 Contiguity measurement by counting entry points in carbides from the binder
(blue) or from one carbide to another (red).
𝐶 =
+
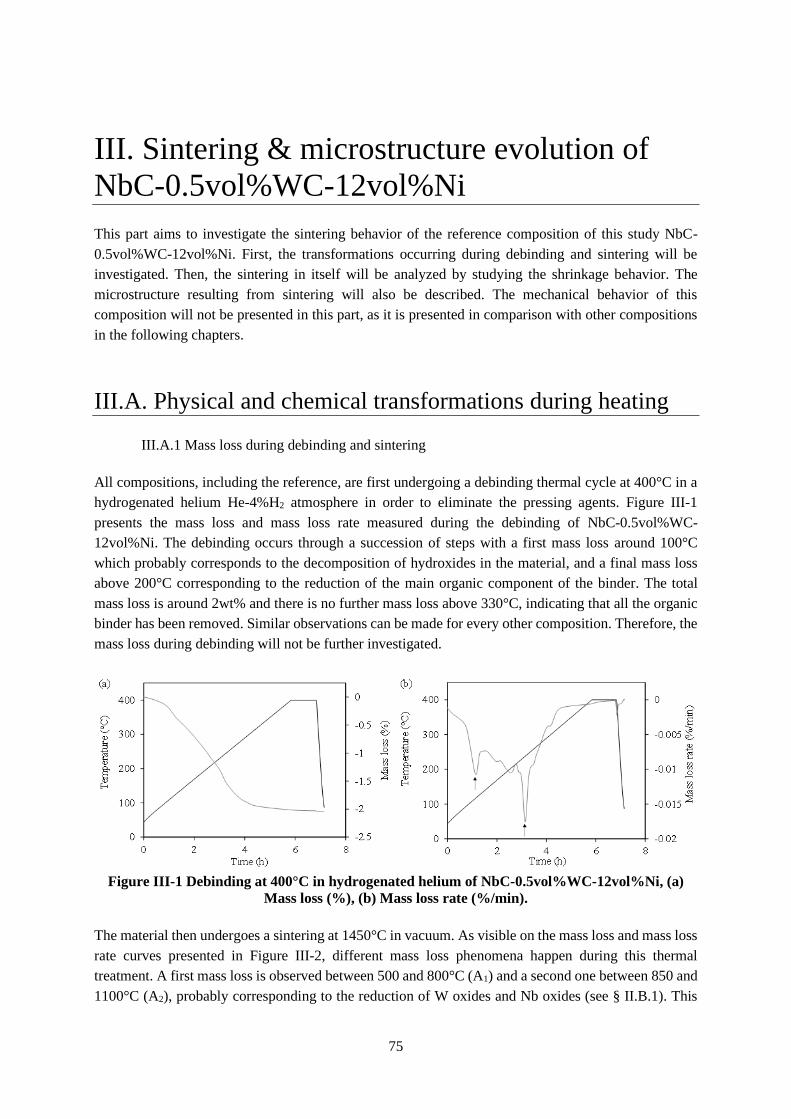
75
III. Sintering & microstructure evolution of
NbC-0.5vol%WC-12vol%Ni
This part aims to investigate the sintering behavior of the reference composition of this study NbC-
0.5vol%WC-12vol%Ni. First, the transformations occurring during debinding and sintering will be
investigated. Then, the sintering in itself will be analyzed by studying the shrinkage behavior. The
microstructure resulting from sintering will also be described. The mechanical behavior of this
composition will not be presented in this part, as it is presented in comparison with other compositions
in the following chapters.
III.A. Physical and chemical transformations during heating
III.A.1 Mass loss during debinding and sintering
All compositions, including the reference, are first undergoing a debinding thermal cycle at 400°C in a
hydrogenated helium He-4%H2 atmosphere in order to eliminate the pressing agents. Figure III-1
presents the mass loss and mass loss rate measured during the debinding of NbC-0.5vol%WC-
12vol%Ni. The debinding occurs through a succession of steps with a first mass loss around 100°C
which probably corresponds to the decomposition of hydroxides in the material, and a final mass loss
above 200°C corresponding to the reduction of the main organic component of the binder. The total
mass loss is around 2wt% and there is no further mass loss above 330°C, indicating that all the organic
binder has been removed. Similar observations can be made for every other composition. Therefore, the
mass loss during debinding will not be further investigated.
Figure III-1 Debinding at 400°C in hydrogenated helium of NbC-0.5vol%WC-12vol%Ni, (a)
Mass loss (%), (b) Mass loss rate (%/min).
The material then undergoes a sintering at 1450°C in vacuum. As visible on the mass loss and mass loss
rate curves presented in Figure III-2, different mass loss phenomena happen during this thermal
treatment. A first mass loss is observed between 500 and 800°C (A1) and a second one between 850 and
1100°C (A2), probably corresponding to the reduction of W oxides and Nb oxides (see § II.B.1). This
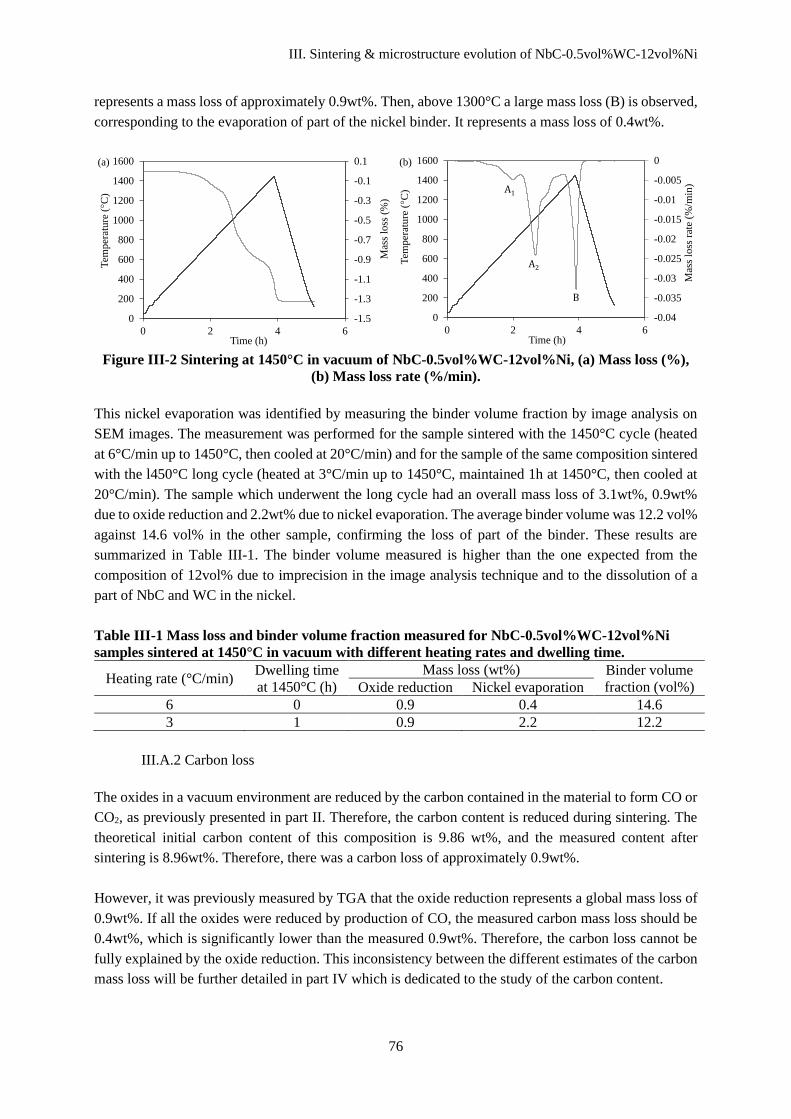
III. Sintering & microstructure evolution of NbC-0.5vol%WC-12vol%Ni
76
represents a mass loss of approximately 0.9wt%. Then, above 1300°C a large mass loss (B) is observed,
corresponding to the evaporation of part of the nickel binder. It represents a mass loss of 0.4wt%.
Figure III-2 Sintering at 1450°C in vacuum of NbC-0.5vol%WC-12vol%Ni, (a) Mass loss (%),
(b) Mass loss rate (%/min).
This nickel evaporation was identified by measuring the binder volume fraction by image analysis on
SEM images. The measurement was performed for the sample sintered with the 1450°C cycle (heated
at 6°C/min up to 1450°C, then cooled at 20°C/min) and for the sample of the same composition sintered
with the l450°C long cycle (heated at 3°C/min up to 1450°C, maintained 1h at 1450°C, then cooled at
20°C/min). The sample which underwent the long cycle had an overall mass loss of 3.1wt%, 0.9wt%
due to oxide reduction and 2.2wt% due to nickel evaporation. The average binder volume was 12.2 vol%
against 14.6 vol% in the other sample, confirming the loss of part of the binder. These results are
summarized in Table III-1. The binder volume measured is higher than the one expected from the
composition of 12vol% due to imprecision in the image analysis technique and to the dissolution of a
part of NbC and WC in the nickel.
Table III-1 Mass loss and binder volume fraction measured for NbC-0.5vol%WC-12vol%Ni
samples sintered at 1450°C in vacuum with different heating rates and dwelling time.
Heating rate (°C/min) Dwelling time
at 1450°C (h)
Mass loss (wt%) Binder volume
fraction (vol%) Oxide reduction Nickel evaporation
6 0 0.9 0.4 14.6
3 1 0.9 2.2 12.2
III.A.2 Carbon loss
The oxides in a vacuum environment are reduced by the carbon contained in the material to form CO or
CO2, as previously presented in part II. Therefore, the carbon content is reduced during sintering. The
theoretical initial carbon content of this composition is 9.86 wt%, and the measured content after
sintering is 8.96wt%. Therefore, there was a carbon loss of approximately 0.9wt%.
However, it was previously measured by TGA that the oxide reduction represents a global mass loss of
0.9wt%. If all the oxides were reduced by production of CO, the measured carbon mass loss should be
0.4wt%, which is significantly lower than the measured 0.9wt%. Therefore, the carbon loss cannot be
fully explained by the oxide reduction. This inconsistency between the different estimates of the carbon
mass loss will be further detailed in part IV which is dedicated to the study of the carbon content.
(b)
-1.5
-1.3
-1.1
-0.9
-0.7
-0.5
-0.3
-0.1
0.1
0
200
400
600
800
1000
1200
1400
1600
0 2 4 6
Mas
s lo
ss (
%)
Tem
per
ature
(°C
)
Time (h)
(a)
-0.04
-0.035
-0.03
-0.025
-0.02
-0.015
-0.01
-0.005
0
0
200
400
600
800
1000
1200
1400
1600
0 2 4 6
Mas
s lo
ss r
ate
(%/m
in)
Tem
per
ature
(°C
)
Time (h)
A2
B
A1

III. Sintering & microstructure evolution of NbC-0.5vol%WC-12vol%Ni
77
III.B Sintering
The shrinkage Δh/ho during the sintering process was followed by dilatometry. The shrinkage and
shrinkage rate curves are presented in Figure III-3. The height and the diameter, which were measured
geometrically before and after sintering, are reduced by 20 %. The sintered sample is globally dense,
with a density of 7.848 g/cm3 measured by Archimede’s method, which corresponds to a density of
99.0% if compared to the theoretical density presented in part II (7.93 g/cm3). Solid state sintering starts
around 950°C and is characterized by two broad peaks (IA and IB) on the shrinkage rate curves. Spreading
of the binder induces a rearrangement of the carbide particles and the densification of the compact as
detailed in part I.B. The narrow peak observed at higher temperature on the shrinkage rate curve (II) is
associated to liquid phase sintering, the metallic binder forming a eutectic liquid with the carbides
around 1315°C. A last peak is also visible during cooling below 1350°C, which corresponds to the
solidification of the liquid phase.
Figure III-3 Sintering at 1450°C in vacuum of NbC-0.5vol%WC-12vol%Ni, (a) Shrinkage (%),
(b) Shrinkage rate (%/min).
III.C Microstructure characteristics
For NbC-12vol%Ni-0.5vol%WC, two phases are visible as presented in Figure III-4 (a). A NbC-rich
carbide phase (dark) and a nickel-rich binder (bright). The carbide grain shape is cuboidal with rounded
edges. Smaller grains are more spheroidal and bigger grains are more cuboidal. At the center of grains,
small holes and binder inclusions are visible, probably entrapped during sintering. The thin white
particles visible on secondary electron images are alumina particles remaining from the polishing.
The corresponding backscattered electron image is presented in Figure III-4 (b). A contrast is visible
from one carbide grain to another, induced by the crystallographic orientation of each grain. Small
porosities are visible at carbide-binder interfaces, most often at triple lines between grain boundaries
and the binder.
-22
-19
-16
-13
-10
-7
-4
-1
2
0
200
400
600
800
1000
1200
1400
1600
0 2 4 6
Shri
nk
age
(%)
Tem
per
atu
re (
°C)
Time (h)
(a)
-0.8
-0.6
-0.4
-0.2
0.0
0.2
600
800
1000
1200
1400
1600
2 3 4
Shri
nk
age
rate
(%
/min
)
Tem
per
atu
re (
°C)
Time (h)
(b)
IB
II
IA
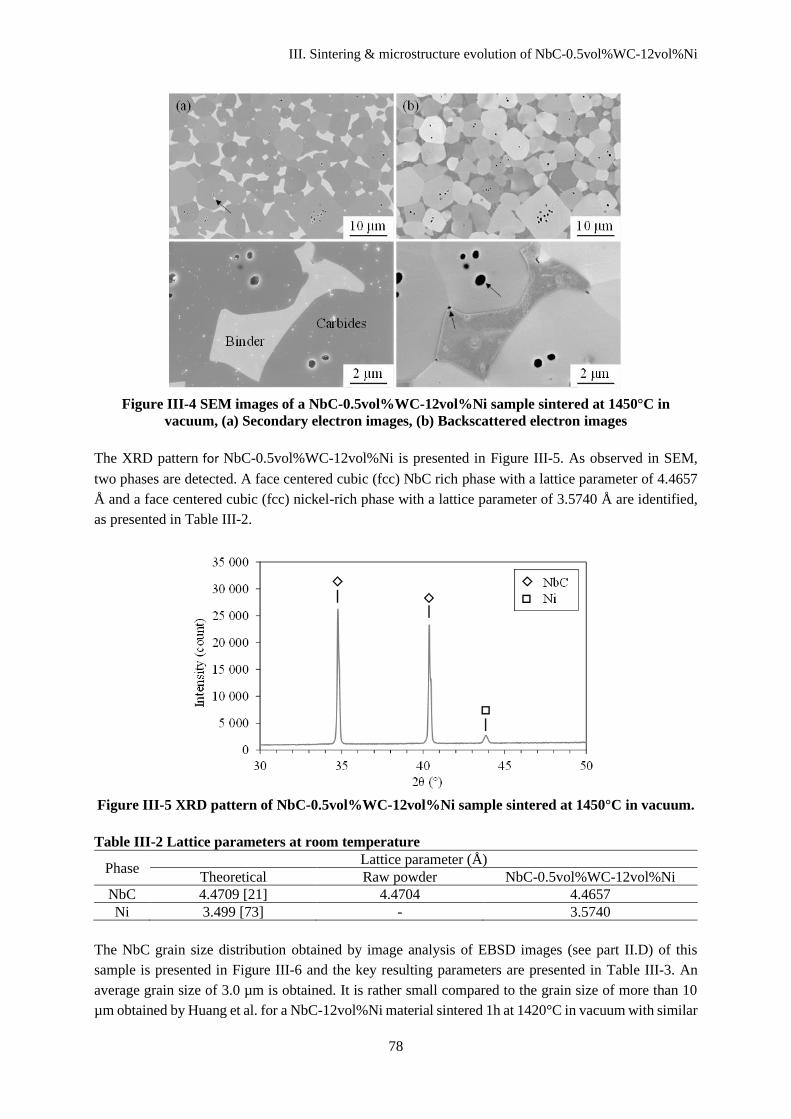
III. Sintering & microstructure evolution of NbC-0.5vol%WC-12vol%Ni
78
Figure III-4 SEM images of a NbC-0.5vol%WC-12vol%Ni sample sintered at 1450°C in
vacuum, (a) Secondary electron images, (b) Backscattered electron images
The XRD pattern for NbC-0.5vol%WC-12vol%Ni is presented in Figure III-5. As observed in SEM,
two phases are detected. A face centered cubic (fcc) NbC rich phase with a lattice parameter of 4.4657
Å and a face centered cubic (fcc) nickel-rich phase with a lattice parameter of 3.5740 Å are identified,
as presented in Table III-2.
Figure III-5 XRD pattern of NbC-0.5vol%WC-12vol%Ni sample sintered at 1450°C in vacuum.
Table III-2 Lattice parameters at room temperature
Phase Lattice parameter (Å)
Theoretical Raw powder NbC-0.5vol%WC-12vol%Ni
NbC 4.4709 [21] 4.4704 4.4657
Ni 3.499 [73] - 3.5740
The NbC grain size distribution obtained by image analysis of EBSD images (see part II.D) of this
sample is presented in Figure III-6 and the key resulting parameters are presented in Table III-3. An
average grain size of 3.0 µm is obtained. It is rather small compared to the grain size of more than 10
µm obtained by Huang et al. for a NbC-12vol%Ni material sintered 1h at 1420°C in vacuum with similar
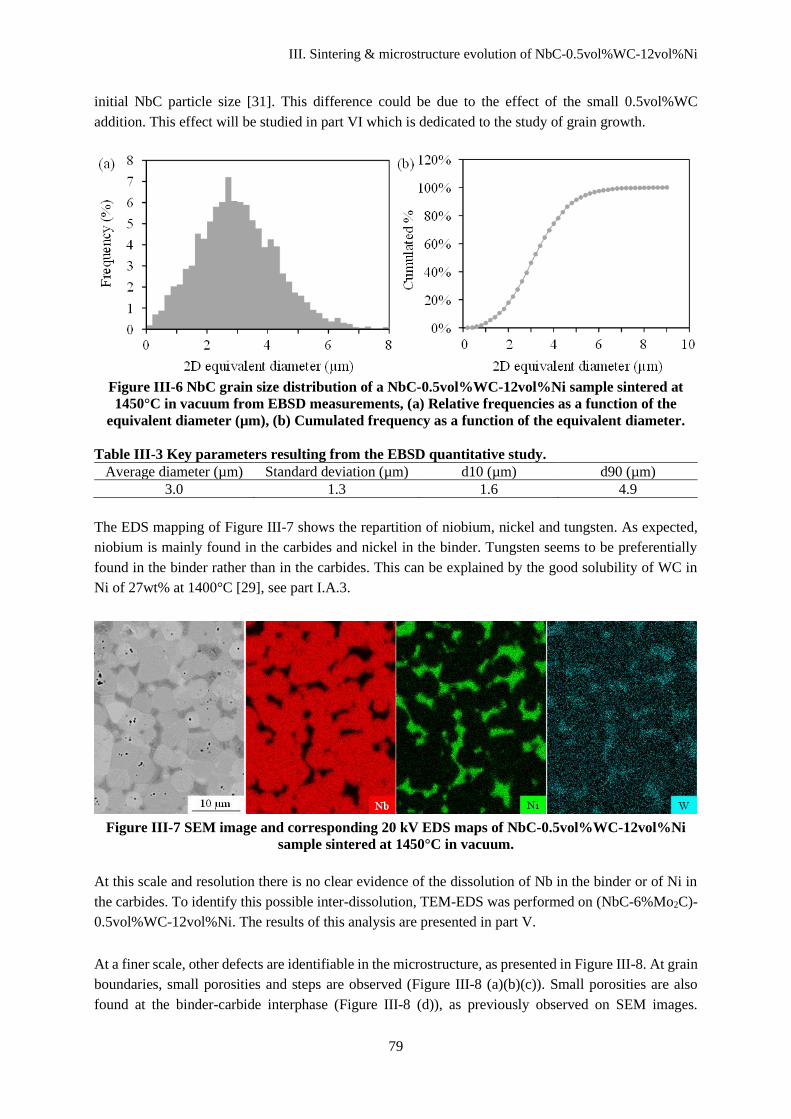
III. Sintering & microstructure evolution of NbC-0.5vol%WC-12vol%Ni
79
initial NbC particle size [31]. This difference could be due to the effect of the small 0.5vol%WC
addition. This effect will be studied in part VI which is dedicated to the study of grain growth.
Figure III-6 NbC grain size distribution of a NbC-0.5vol%WC-12vol%Ni sample sintered at
1450°C in vacuum from EBSD measurements, (a) Relative frequencies as a function of the
equivalent diameter (µm), (b) Cumulated frequency as a function of the equivalent diameter.
Table III-3 Key parameters resulting from the EBSD quantitative study.
Average diameter (µm) Standard deviation (µm) d10 (µm) d90 (µm)
3.0 1.3 1.6 4.9
The EDS mapping of Figure III-7 shows the repartition of niobium, nickel and tungsten. As expected,
niobium is mainly found in the carbides and nickel in the binder. Tungsten seems to be preferentially
found in the binder rather than in the carbides. This can be explained by the good solubility of WC in
Ni of 27wt% at 1400°C [29], see part I.A.3.
Figure III-7 SEM image and corresponding 20 kV EDS maps of NbC-0.5vol%WC-12vol%Ni
sample sintered at 1450°C in vacuum.
At this scale and resolution there is no clear evidence of the dissolution of Nb in the binder or of Ni in
the carbides. To identify this possible inter-dissolution, TEM-EDS was performed on (NbC-6%Mo2C)-
0.5vol%WC-12vol%Ni. The results of this analysis are presented in part V.
At a finer scale, other defects are identifiable in the microstructure, as presented in Figure III-8. At grain
boundaries, small porosities and steps are observed (Figure III-8 (a)(b)(c)). Small porosities are also
found at the binder-carbide interphase (Figure III-8 (d)), as previously observed on SEM images.
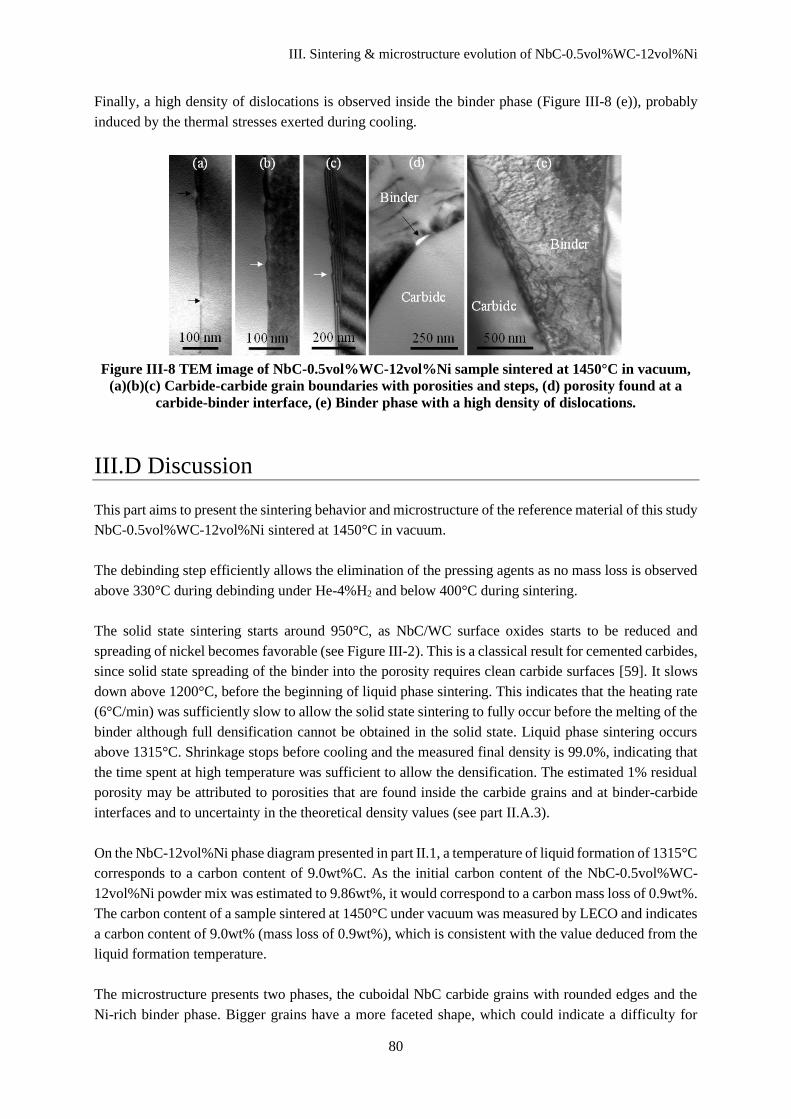
III. Sintering & microstructure evolution of NbC-0.5vol%WC-12vol%Ni
80
Finally, a high density of dislocations is observed inside the binder phase (Figure III-8 (e)), probably
induced by the thermal stresses exerted during cooling.
Figure III-8 TEM image of NbC-0.5vol%WC-12vol%Ni sample sintered at 1450°C in vacuum,
(a)(b)(c) Carbide-carbide grain boundaries with porosities and steps, (d) porosity found at a
carbide-binder interface, (e) Binder phase with a high density of dislocations.
III.D Discussion
This part aims to present the sintering behavior and microstructure of the reference material of this study
NbC-0.5vol%WC-12vol%Ni sintered at 1450°C in vacuum.
The debinding step efficiently allows the elimination of the pressing agents as no mass loss is observed
above 330°C during debinding under He-4%H2 and below 400°C during sintering.
The solid state sintering starts around 950°C, as NbC/WC surface oxides starts to be reduced and
spreading of nickel becomes favorable (see Figure III-2). This is a classical result for cemented carbides,
since solid state spreading of the binder into the porosity requires clean carbide surfaces [59]. It slows
down above 1200°C, before the beginning of liquid phase sintering. This indicates that the heating rate
(6°C/min) was sufficiently slow to allow the solid state sintering to fully occur before the melting of the
binder although full densification cannot be obtained in the solid state. Liquid phase sintering occurs
above 1315°C. Shrinkage stops before cooling and the measured final density is 99.0%, indicating that
the time spent at high temperature was sufficient to allow the densification. The estimated 1% residual
porosity may be attributed to porosities that are found inside the carbide grains and at binder-carbide
interfaces and to uncertainty in the theoretical density values (see part II.A.3).
On the NbC-12vol%Ni phase diagram presented in part II.1, a temperature of liquid formation of 1315°C
corresponds to a carbon content of 9.0wt%C. As the initial carbon content of the NbC-0.5vol%WC-
12vol%Ni powder mix was estimated to 9.86wt%, it would correspond to a carbon mass loss of 0.9wt%.
The carbon content of a sample sintered at 1450°C under vacuum was measured by LECO and indicates
a carbon content of 9.0wt% (mass loss of 0.9wt%), which is consistent with the value deduced from the
liquid formation temperature.
The microstructure presents two phases, the cuboidal NbC carbide grains with rounded edges and the
Ni-rich binder phase. Bigger grains have a more faceted shape, which could indicate a difficulty for
III. Sintering & microstructure evolution of NbC-0.5vol%WC-12vol%Ni
81
grain growth due to a 2D-nucleation step, as presented in part I.C.1.b. This aspect will be investigated
in part VI which is dedicated to grain growth.
A good wetting of carbide grains by the nickel binder is observed. However, inclusions or holes are
observed inside the NbC grains, which is usually the mark of a bad wetting of the carbides by the binder
and can be associate to coalescence of carbide grains, as described by Warren [5] and detailed in part
I.C.1.c of this work. In our case, the formation of these inclusions by coalescence could be due to the
bad repartition of the nickel binder in the powder mix (see Figure II-2), which forms Ni-rich
agglomerates of a few µm. The local lack of binder may lead to the coalescence of carbide grain clusters
and thus to the entrapment of holes or binder inclusions. In the future, to avoid such defects, the mixing
of the powder should be improved to allow a good repartition of the nickel binder.
The composition of the carbide and binder phases evolves during sintering. WC carbides are dissolved
into the microstructure during sintering and W is preferentially found in the binder phase after
dissolution, although it is also detected in the NbC phase. This can be explained by the good solubility
of WC in nickel (27w%t, see Table I-3). A small quantity of NbC also dissolves into the binder despite
its lower solubility (7.0wt%, see Table I-3). As NbC and WC dissolve in the binder, the lattice parameter
of the binder phase is affected. The atomic radius of tungsten (193 pm) is smaller than the atomic radius
of niobium (198 pm) but bigger than the atomic radius of nickel (149 pm) [74]. Therefore, the lattice
parameter of the nickel-rich phase increases as WC and NbC dissolve. This is consistent with the
measured value of the nickel-rich phase lattice parameter, which is higher than the value for pure nickel
(Table III-2).
The measured lattice parameter of NbC phase is lower than the lattice parameter of the NbC pure powder
used to prepare the mix. This difference could partly be explained by the dissolution of tungsten in this
phase. However, the WC content in our powder mixtures is rather low and the atomic radius of W is not
so different from the atomic radius of NbC. Also, W preferentially dissolves in the binder. Therefore,
the difference is probably related to the non-stoichiometry of the NbC carbides. As presented in Figure
I-3, a lattice parameter of 0.4466 nm approximately corresponds to a Nb0.53C0.47 stoichiometry.
Therefore, the low measured lattice parameter could partly be explained by a carbon loss leading to the
formation of sub-stoichiometric carbides, with a carbon content between 47 and 50 at%. This point is to
be taken into account when evaluating the different sources of mass loss and will be further addressed
in chapter IV, which is dedicated to the study of the carbon content.
Other defects are observed in the microstructure at a smaller scale. First, small pores are often found at
the binder-carbide interface, or at the junction of a grain boundary and the binder as visible in Figure
III-4. Moreover, at a smaller scale, a great density of dislocations is observed in the binder, especially
close to the interface with NbC grains. These defects are likely due to the difference in thermal
contraction between Ni and NbC during cooling. This difference of thermal contraction leads to a
compressive stress acting on NbC grains and in a tensile stress on binder regions as observed for WC-
Ni alloys [75]. The interfacial pores can then be due to a de-cohesion of the binder induced by the
thermal stresses exerted during cooling. The binder deformation can be estimated to 1% for a cooling
from T = 1300°C to T+ΔT = 20°C, with formula (I-6), assuming that the binder withstands all the
deformation (Figure III-9). The linear thermal expansions αB of Ni and αC of NbC carbides are 13.4 10-
6 K-1 [76] and 6.6 10-6 K-1 respectively (see Table I-1).
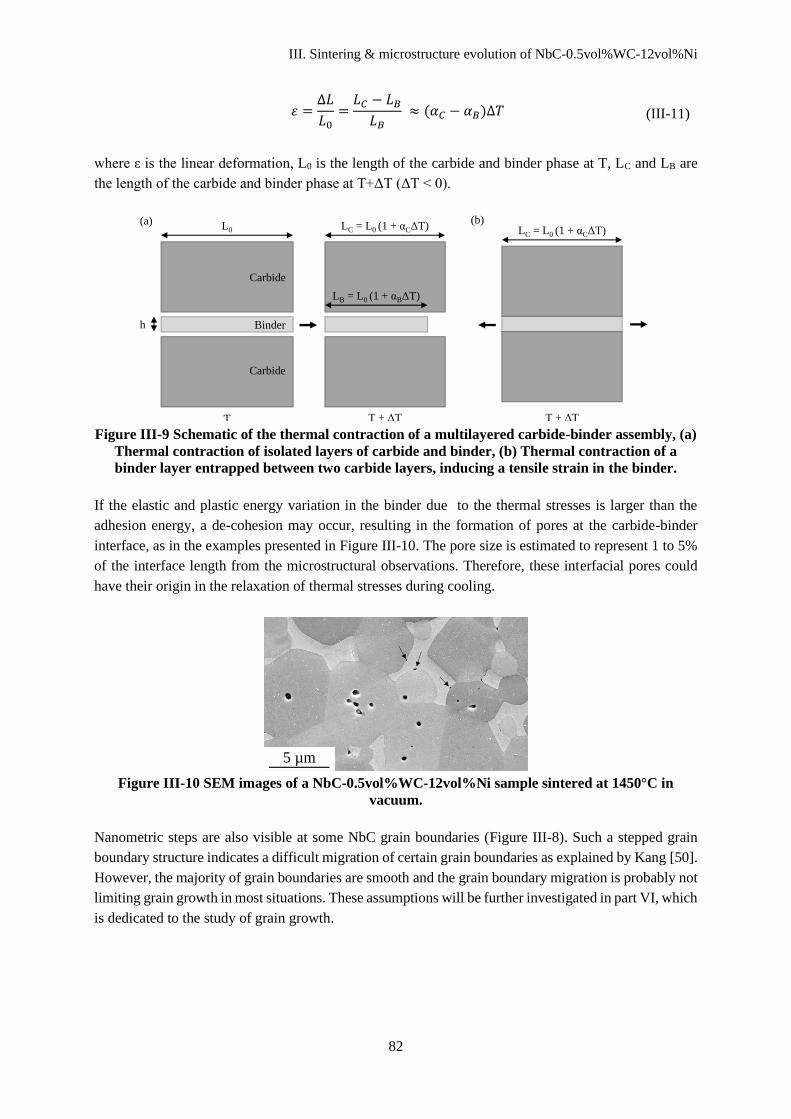
III. Sintering & microstructure evolution of NbC-0.5vol%WC-12vol%Ni
82
𝜀 =∆𝐿
𝐿0=𝐿𝐶 − 𝐿𝐵𝐿𝐵
≈ (𝛼𝐶 − 𝛼𝐵)∆𝑇 (III-11)
where ε is the linear deformation, L0 is the length of the carbide and binder phase at T, LC and LB are
the length of the carbide and binder phase at T+ΔT (ΔT < 0).
Figure III-9 Schematic of the thermal contraction of a multilayered carbide-binder assembly, (a)
Thermal contraction of isolated layers of carbide and binder, (b) Thermal contraction of a
binder layer entrapped between two carbide layers, inducing a tensile strain in the binder.
If the elastic and plastic energy variation in the binder due to the thermal stresses is larger than the
adhesion energy, a de-cohesion may occur, resulting in the formation of pores at the carbide-binder
interface, as in the examples presented in Figure III-10. The pore size is estimated to represent 1 to 5%
of the interface length from the microstructural observations. Therefore, these interfacial pores could
have their origin in the relaxation of thermal stresses during cooling.
Figure III-10 SEM images of a NbC-0.5vol%WC-12vol%Ni sample sintered at 1450°C in
vacuum.
Nanometric steps are also visible at some NbC grain boundaries (Figure III-8). Such a stepped grain
boundary structure indicates a difficult migration of certain grain boundaries as explained by Kang [50].
However, the majority of grain boundaries are smooth and the grain boundary migration is probably not
limiting grain growth in most situations. These assumptions will be further investigated in part VI, which
is dedicated to the study of grain growth.
h
L0
T T + ΔT
Binder
Carbide
Carbide
LC = L0 (1 + αCΔT)
LB = L0 (1 + αBΔT)
LC = L0 (1 + αCΔT) (a) (b)
T + ΔT
5 µm

83
IV. Effect of the carbon content in (NbC-
3%Mo2C)-0.5vol%WC-12vol%Ni
In this part, the effect of the carbon content on the sintering behavior and resulting properties will be
investigated. To do so, carbon or molybdenum were added in different quantities to the (NbC-3%Mo2C)-
0.5vol%WC-12vol%Ni reference composition to adjust the carbon content. Three compositions with an
excess of carbon (1.5, 3 and 4.5 at%) or with an addition of molybdenum (1, 2 or 4.5 at%) were
investigated (Table IV-1). It was assumed that a small quantity of Mo substitutes Nb and decreases the
carbon content without impacting the phase equilibrium and material properties. This aspect will be
discussed at the end of this part. The carbon content of the seven studied composition is presented on
the phase diagram of Figure IV-1. The effect of decarburizing on the position of this experimental carbon
window in the phase diagram will also be discussed at the end of this part.
First, the global mass loss and more specifically the carbon loss will be investigated. The effect of carbon
content on the solid state and liquid phase sintering will also be considered. Then, its effect on the
microstructure and the mechanical properties will be studied.
Table IV-1 Nominal compositions (at%) and corresponding calculated carbon content (wt%)
Alloy at% wt%
NbC Ni Mo2C WC Mo C Carbon content
Reference 84.9 12.2 2.37 0.540 0 0 9.70
3at%Mo 82.0 12.2 2.29 0.520 3.00 0 9.15
2at%Mo 83.0 12.2 2.32 0.520 2.00 0 9.33
1at%Mo 83.9 12.2 2.34 0.530 1.00 0 9.51
1.5at%C 83.4 12.2 2.33 0.530 0 1.50 9.98
3at%C 82.0 12.2 2.29 0.520 0 3.00 10.3
4.5at%C 80.5 12.2 2.25 0.510 0 4.50 10.6

IV. Effect of the carbon content in (NbC-3%Mo2C)-0.5vol%WC-12vol%Ni
84
Figure IV-1 Calculated phase diagram for the NbC-12vol%Ni system (TCNI9 database) with the
carbon content of the studied compositions, in black is the stoichiometric NbC-12vol%Ni
composition.
IV.A. Physical and chemical transformations during heating
IV.A.1 Mass loss during sintering
The mass loss due to the elimination of hydroxides and to the decomposition of the organic binder agents
is presented in part III as it is similar for every composition of this work.
When undergoing a sintering at 1450°C, two mass loss phenomena are detected in the samples, as
presented in part III.A.1. A first mass loss is observed between 500 and 800°C (A1) and a second one
between 850 and 1200°C (A2), probably corresponding to the reduction of W oxides, Mo oxides and Nb
oxides (see § II.B.1). It represents a mass loss of 0.9wt%. Then, the nickel evaporation (B) above 1300°C
induces a mass loss of 0.4wt%.
The TGA curves for Mo additions and C additions are presented respectively in Figure IV-2 and Figure
IV-3. When adding molybdenum, the peak (A2) is slightly reduced and happens at a higher temperature,
and the nickel evaporation (B) is significantly reduced, and happens at a higher temperature. When
adding carbon, the peak (A2) is slightly increased but remains at the same temperature. Moreover, the
second peak (B) of nickel evaporation is significantly reduced. It is nearly suppressed for the sample
with 4.5at%C.
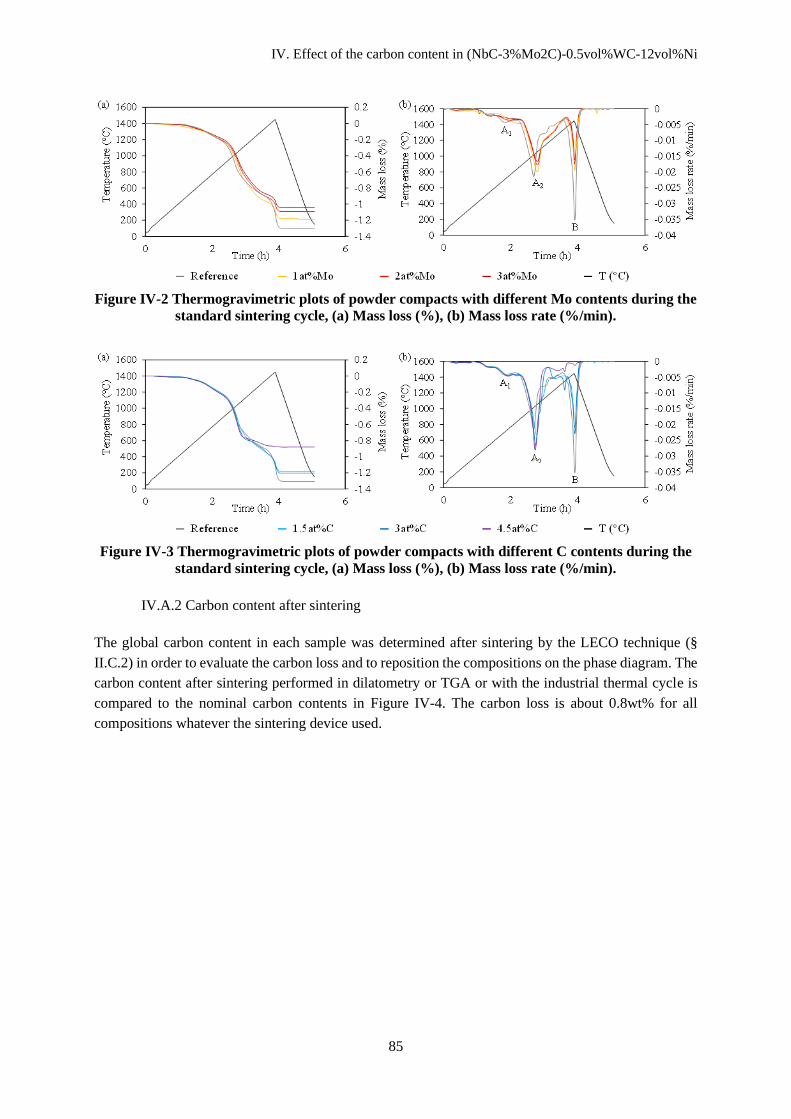
IV. Effect of the carbon content in (NbC-3%Mo2C)-0.5vol%WC-12vol%Ni
85
Figure IV-2 Thermogravimetric plots of powder compacts with different Mo contents during the
standard sintering cycle, (a) Mass loss (%), (b) Mass loss rate (%/min).
Figure IV-3 Thermogravimetric plots of powder compacts with different C contents during the
standard sintering cycle, (a) Mass loss (%), (b) Mass loss rate (%/min).
IV.A.2 Carbon content after sintering
The global carbon content in each sample was determined after sintering by the LECO technique (§
II.C.2) in order to evaluate the carbon loss and to reposition the compositions on the phase diagram. The
carbon content after sintering performed in dilatometry or TGA or with the industrial thermal cycle is
compared to the nominal carbon contents in Figure IV-4. The carbon loss is about 0.8wt% for all
compositions whatever the sintering device used.
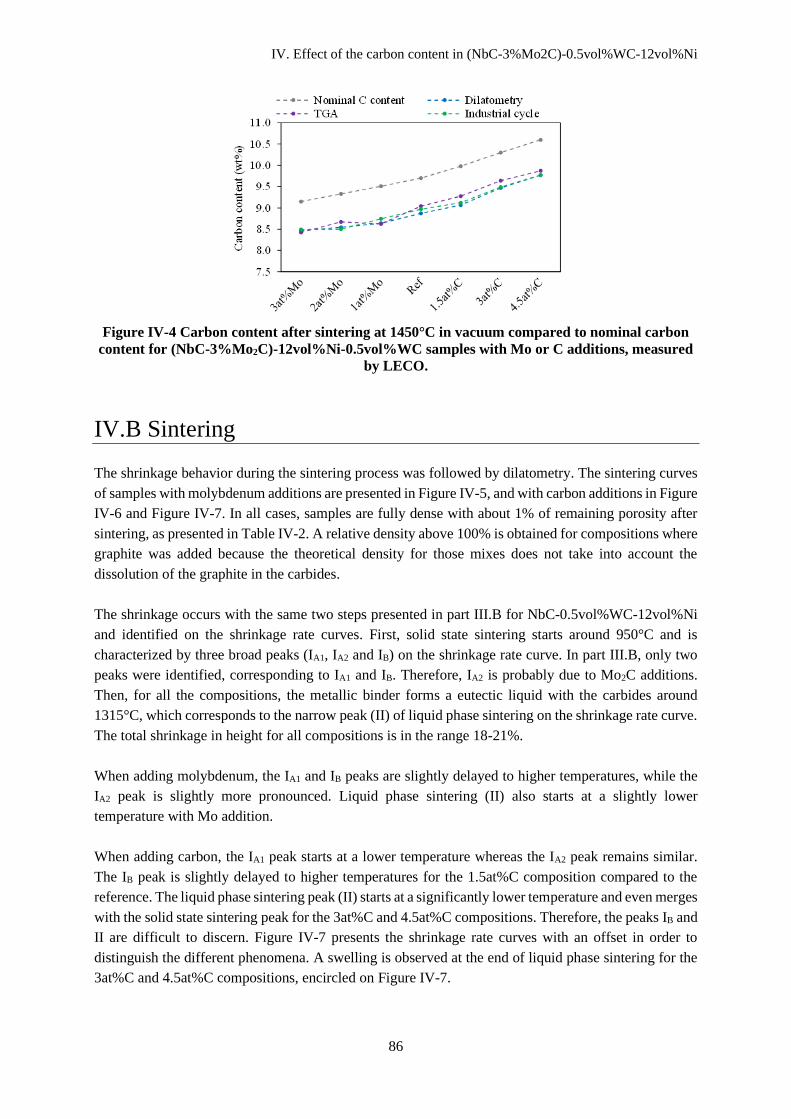
IV. Effect of the carbon content in (NbC-3%Mo2C)-0.5vol%WC-12vol%Ni
86
Figure IV-4 Carbon content after sintering at 1450°C in vacuum compared to nominal carbon
content for (NbC-3%Mo2C)-12vol%Ni-0.5vol%WC samples with Mo or C additions, measured
by LECO.
IV.B Sintering
The shrinkage behavior during the sintering process was followed by dilatometry. The sintering curves
of samples with molybdenum additions are presented in Figure IV-5, and with carbon additions in Figure
IV-6 and Figure IV-7. In all cases, samples are fully dense with about 1% of remaining porosity after
sintering, as presented in Table IV-2. A relative density above 100% is obtained for compositions where
graphite was added because the theoretical density for those mixes does not take into account the
dissolution of the graphite in the carbides.
The shrinkage occurs with the same two steps presented in part III.B for NbC-0.5vol%WC-12vol%Ni
and identified on the shrinkage rate curves. First, solid state sintering starts around 950°C and is
characterized by three broad peaks (IA1, IA2 and IB) on the shrinkage rate curve. In part III.B, only two
peaks were identified, corresponding to IA1 and IB. Therefore, IA2 is probably due to Mo2C additions.
Then, for all the compositions, the metallic binder forms a eutectic liquid with the carbides around
1315°C, which corresponds to the narrow peak (II) of liquid phase sintering on the shrinkage rate curve.
The total shrinkage in height for all compositions is in the range 18-21%.
When adding molybdenum, the IA1 and IB peaks are slightly delayed to higher temperatures, while the
IA2 peak is slightly more pronounced. Liquid phase sintering (II) also starts at a slightly lower
temperature with Mo addition.
When adding carbon, the IA1 peak starts at a lower temperature whereas the IA2 peak remains similar.
The IB peak is slightly delayed to higher temperatures for the 1.5at%C composition compared to the
reference. The liquid phase sintering peak (II) starts at a significantly lower temperature and even merges
with the solid state sintering peak for the 3at%C and 4.5at%C compositions. Therefore, the peaks IB and
II are difficult to discern. Figure IV-7 presents the shrinkage rate curves with an offset in order to
distinguish the different phenomena. A swelling is observed at the end of liquid phase sintering for the
3at%C and 4.5at%C compositions, encircled on Figure IV-7.
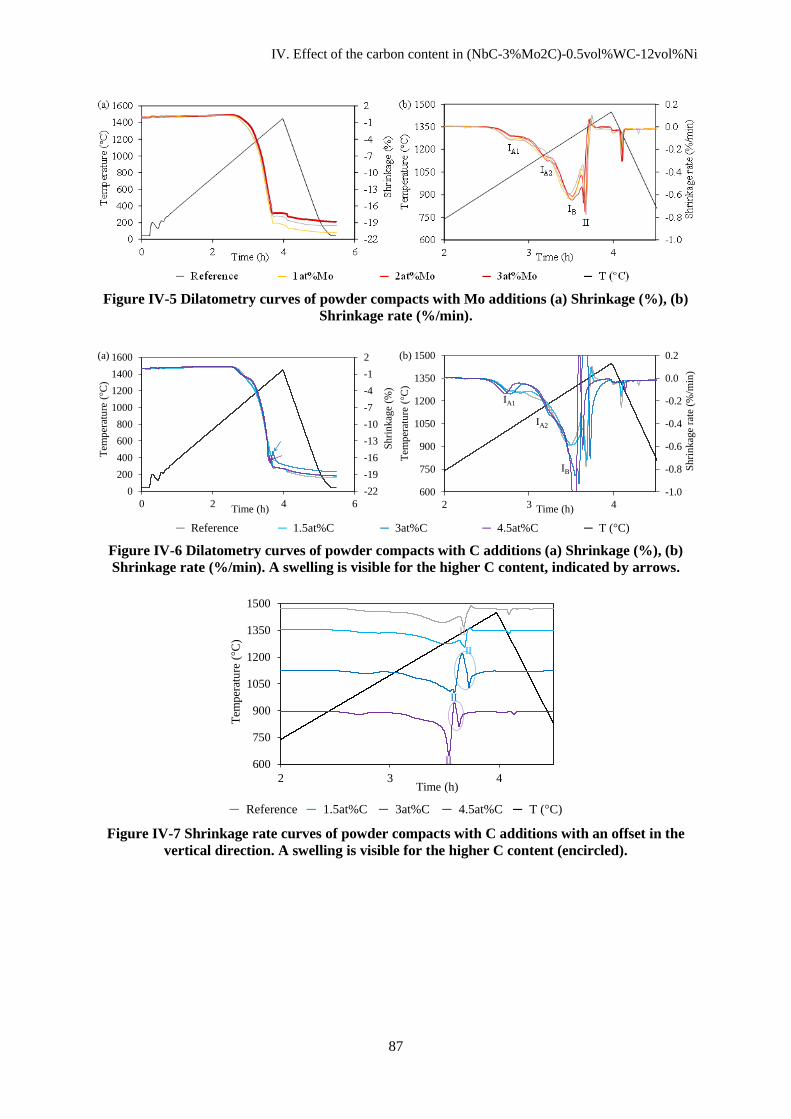
IV. Effect of the carbon content in (NbC-3%Mo2C)-0.5vol%WC-12vol%Ni
87
Figure IV-5 Dilatometry curves of powder compacts with Mo additions (a) Shrinkage (%), (b)
Shrinkage rate (%/min).
Figure IV-6 Dilatometry curves of powder compacts with C additions (a) Shrinkage (%), (b)
Shrinkage rate (%/min). A swelling is visible for the higher C content, indicated by arrows.
Figure IV-7 Shrinkage rate curves of powder compacts with C additions with an offset in the
vertical direction. A swelling is visible for the higher C content (encircled).
-1.0
-0.8
-0.6
-0.4
-0.2
0.0
0.2
600
750
900
1050
1200
1350
1500
2 3 4
Sh
rin
kag
e ra
te (
%/m
in)
Tem
per
atu
re (
°C)
Time (h)
-22
-19
-16
-13
-10
-7
-4
-1
2
0
200
400
600
800
1000
1200
1400
1600
0 2 4 6
Sh
rin
kag
e (%
)
Tem
per
atu
re (
°C)
Time (h)
─ Reference ─ 1.5at%C ─ 3at%C ─ 4.5at%C ─ T (°C)
(a) (b)
IB
IA1
IA2
600
750
900
1050
1200
1350
1500
2 3 4
Tem
per
atu
re (
°C)
Time (h)
─ Reference ─ 1.5at%C ─ 3at%C ─ 4.5at%C ─ T (°C)
II
II
II
II

IV. Effect of the carbon content in (NbC-3%Mo2C)-0.5vol%WC-12vol%Ni
88
Table IV-2 Density after sintering at 1450°C in vacuum.
Alloy Archimedes density after
sintering (g/cm3)
Theoretical densities
(g/cm3) Relative density (%)
Reference 7.813 7.963 98.1
3at%Mo 7.966 8.057 98.9
2at%Mo 7.938 8.023 98.9
1at%Mo 7.915 7.998 99.0
1.5at%C 7.938 7.876 100.8
3at%C 7.896 7.828 100.9
4.5at%C 7.823 7.762 100.8
IV.C Microstructural evolutions
IV.C.1 Microstructural analysis
The microstructure evolution as a function of molybdenum or carbon additions has been studied by SEM
(Scanning Electron Microscopy) as presented in Figure IV-8 and Figure IV-9. Two phases are always
visible: carbides (dark) and binder (bright). A third phase of graphite (black) appears when adding large
quantities of carbon (3at%C or 4.5at%C). The carbide grain shape is cuboidal with rounded edges.
Smaller grains are more spheroidal and bigger grains are more cuboidal. At the center of grains, small
holes and binder inclusions are visible, probably trapped during sintering, as detailed in part III.C.
When adding molybdenum, the grain size is significantly reduced. On the contrary, when adding carbon,
the grain size increases significantly. However, the grain size is reduced between the 3at%C sample and
4.5at%C sample.
Figure IV-8 Secondary electron images of (NbC-3%Mo2C)-12vol%Ni-0.5vol%WC with Mo
additions.
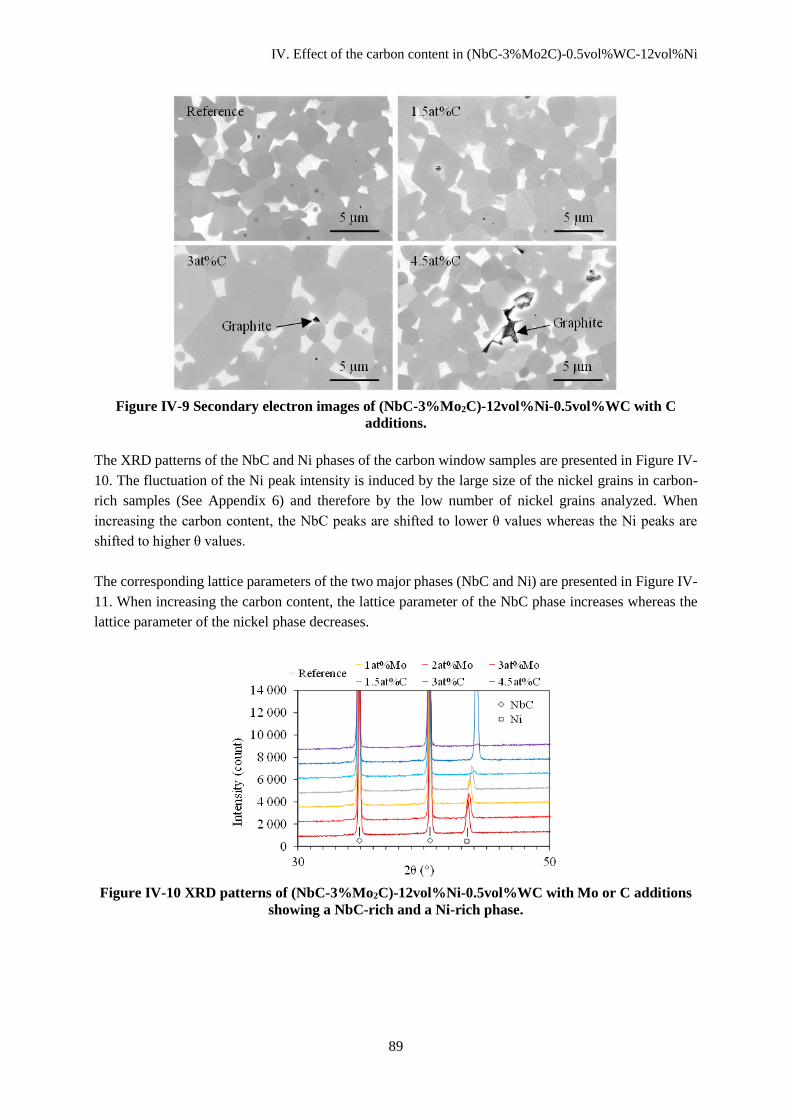
IV. Effect of the carbon content in (NbC-3%Mo2C)-0.5vol%WC-12vol%Ni
89
Figure IV-9 Secondary electron images of (NbC-3%Mo2C)-12vol%Ni-0.5vol%WC with C
additions.
The XRD patterns of the NbC and Ni phases of the carbon window samples are presented in Figure IV-
10. The fluctuation of the Ni peak intensity is induced by the large size of the nickel grains in carbon-
rich samples (See Appendix 6) and therefore by the low number of nickel grains analyzed. When
increasing the carbon content, the NbC peaks are shifted to lower θ values whereas the Ni peaks are
shifted to higher θ values.
The corresponding lattice parameters of the two major phases (NbC and Ni) are presented in Figure IV-
11. When increasing the carbon content, the lattice parameter of the NbC phase increases whereas the
lattice parameter of the nickel phase decreases.
Figure IV-10 XRD patterns of (NbC-3%Mo2C)-12vol%Ni-0.5vol%WC with Mo or C additions
showing a NbC-rich and a Ni-rich phase.

IV. Effect of the carbon content in (NbC-3%Mo2C)-0.5vol%WC-12vol%Ni
90
Figure IV-11 Lattice parameter evolution of NbC-rich and Ni-rich phases as a function of Mo or
C additions.
The grain size of the reference sample and of the 3at%C and 3at%Mo samples was measured on EBSD
maps (see part II.D) and the results are presented in Figure IV-12 and in Table IV-3. The average grain
size rises with the carbon content from 1.1 µm (3at%Mo) to 1.9 µm (Ref) and 3.0 µm (3at%C). This
increase is in adequacy with what was observed in SEM. The reduced grain size distribution keeps the
same shape no matter the carbon content, which is confirmed by the ratio 𝜎 �̅�⁄ which remains more or
less constant.
3.53
3.55
3.57
3.59
3.61
4.448
4.453
4.458
4.463
4.468
Lat
tice
Par
amet
er N
i (Å
)
Lat
tice
par
amet
er N
bC
(Å
)
NbC Ni
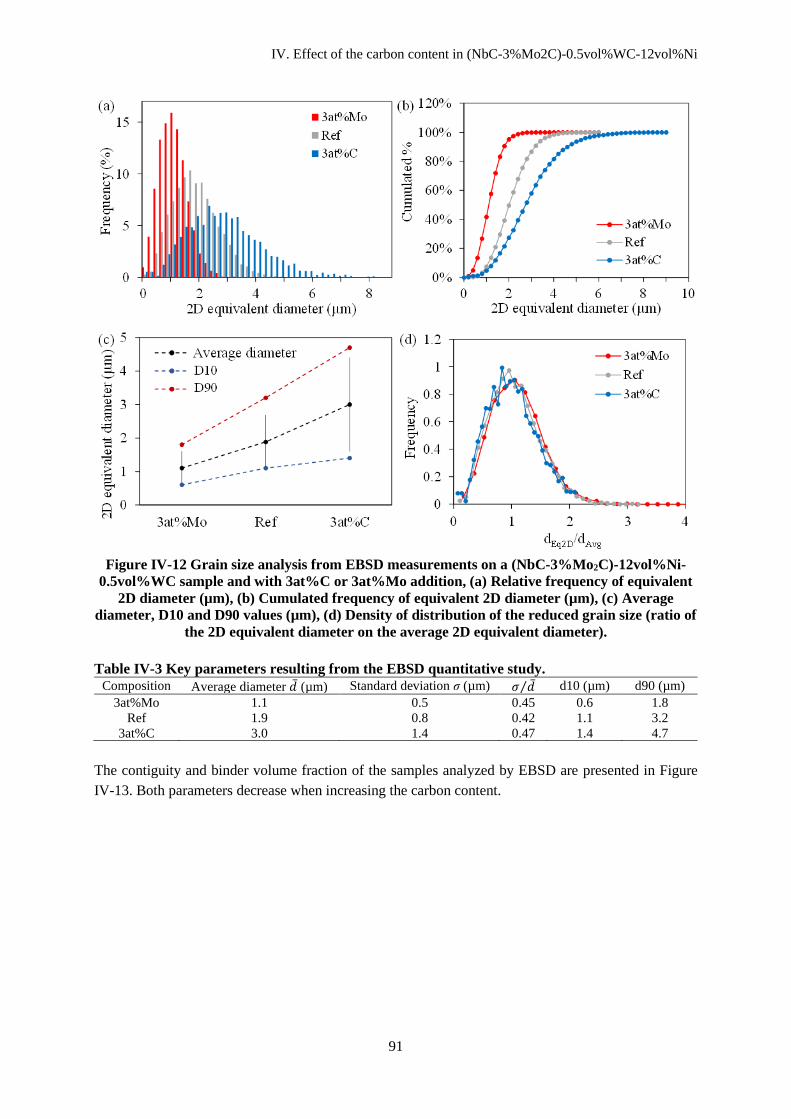
IV. Effect of the carbon content in (NbC-3%Mo2C)-0.5vol%WC-12vol%Ni
91
Figure IV-12 Grain size analysis from EBSD measurements on a (NbC-3%Mo2C)-12vol%Ni-
0.5vol%WC sample and with 3at%C or 3at%Mo addition, (a) Relative frequency of equivalent
2D diameter (µm), (b) Cumulated frequency of equivalent 2D diameter (µm), (c) Average
diameter, D10 and D90 values (µm), (d) Density of distribution of the reduced grain size (ratio of
the 2D equivalent diameter on the average 2D equivalent diameter).
Table IV-3 Key parameters resulting from the EBSD quantitative study.
Composition Average diameter �̅� (µm) Standard deviation σ (µm) 𝜎 �̅�⁄ d10 (µm) d90 (µm)
3at%Mo 1.1 0.5 0.45 0.6 1.8
Ref 1.9 0.8 0.42 1.1 3.2
3at%C 3.0 1.4 0.47 1.4 4.7
The contiguity and binder volume fraction of the samples analyzed by EBSD are presented in Figure
IV-13. Both parameters decrease when increasing the carbon content.
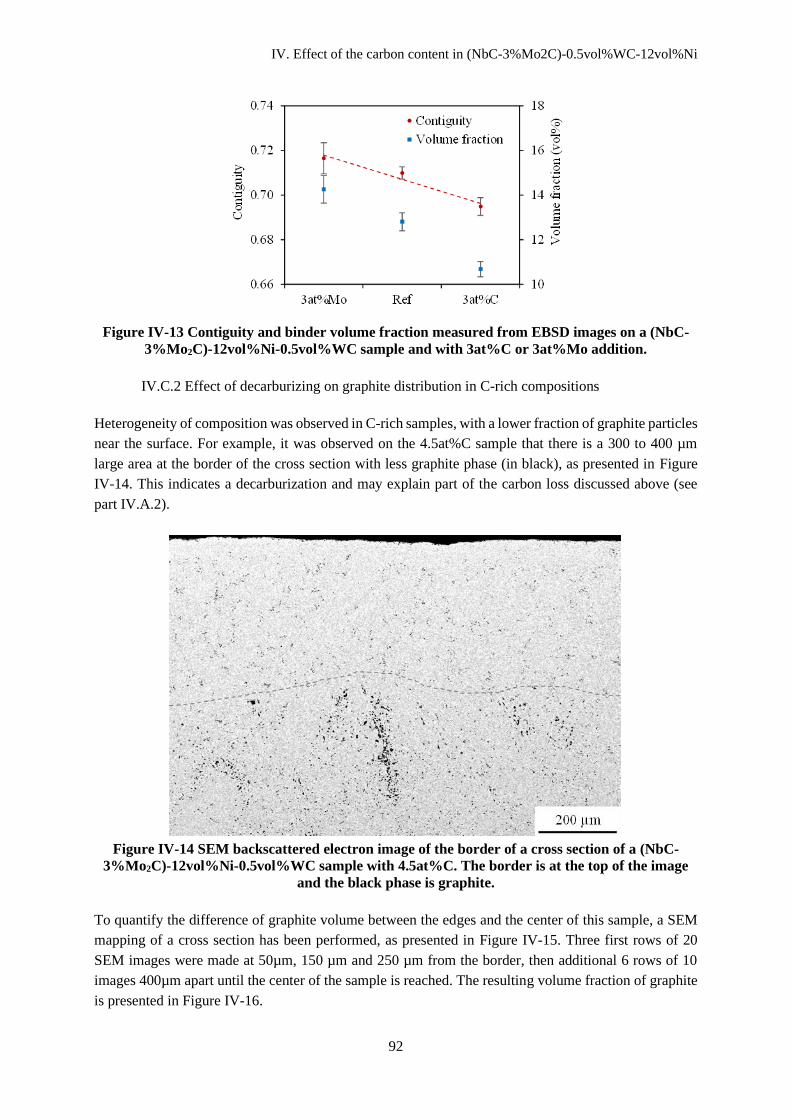
IV. Effect of the carbon content in (NbC-3%Mo2C)-0.5vol%WC-12vol%Ni
92
Figure IV-13 Contiguity and binder volume fraction measured from EBSD images on a (NbC-
3%Mo2C)-12vol%Ni-0.5vol%WC sample and with 3at%C or 3at%Mo addition.
IV.C.2 Effect of decarburizing on graphite distribution in C-rich compositions
Heterogeneity of composition was observed in C-rich samples, with a lower fraction of graphite particles
near the surface. For example, it was observed on the 4.5at%C sample that there is a 300 to 400 µm
large area at the border of the cross section with less graphite phase (in black), as presented in Figure
IV-14. This indicates a decarburization and may explain part of the carbon loss discussed above (see
part IV.A.2).
Figure IV-14 SEM backscattered electron image of the border of a cross section of a (NbC-
3%Mo2C)-12vol%Ni-0.5vol%WC sample with 4.5at%C. The border is at the top of the image
and the black phase is graphite.
To quantify the difference of graphite volume between the edges and the center of this sample, a SEM
mapping of a cross section has been performed, as presented in Figure IV-15. Three first rows of 20
SEM images were made at 50µm, 150 µm and 250 µm from the border, then additional 6 rows of 10
images 400µm apart until the center of the sample is reached. The resulting volume fraction of graphite
is presented in Figure IV-16.
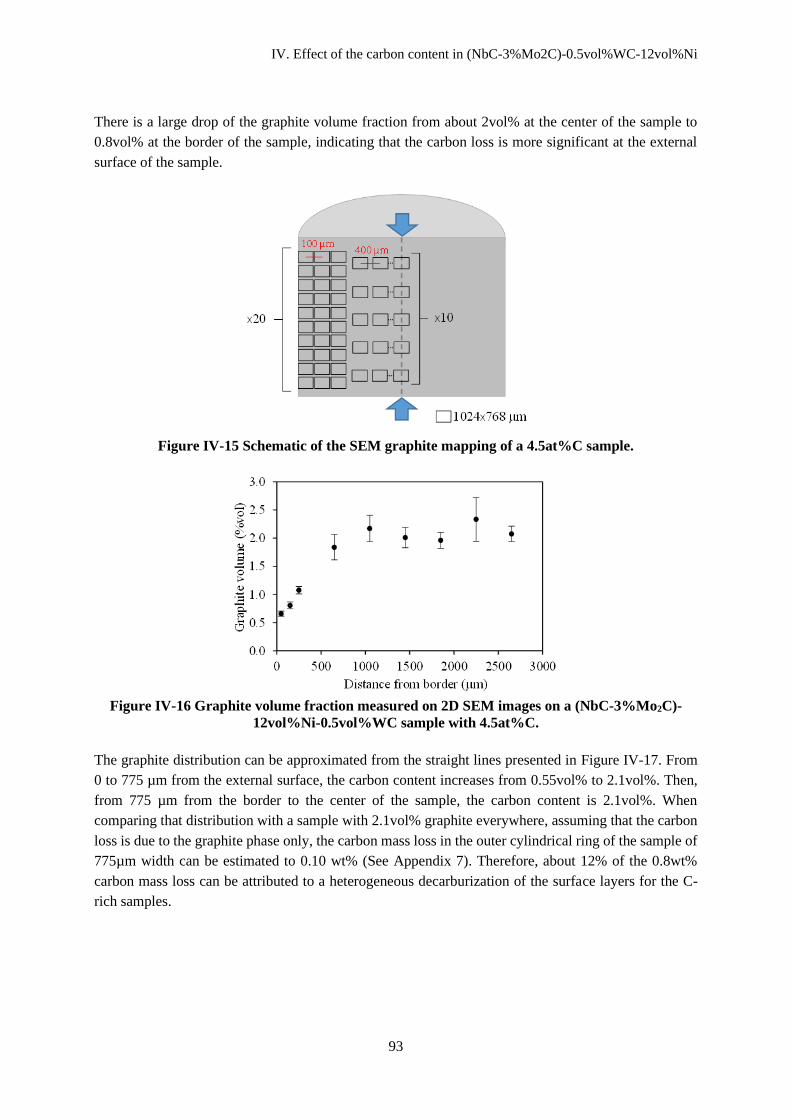
IV. Effect of the carbon content in (NbC-3%Mo2C)-0.5vol%WC-12vol%Ni
93
There is a large drop of the graphite volume fraction from about 2vol% at the center of the sample to
0.8vol% at the border of the sample, indicating that the carbon loss is more significant at the external
surface of the sample.
Figure IV-15 Schematic of the SEM graphite mapping of a 4.5at%C sample.
Figure IV-16 Graphite volume fraction measured on 2D SEM images on a (NbC-3%Mo2C)-
12vol%Ni-0.5vol%WC sample with 4.5at%C.
The graphite distribution can be approximated from the straight lines presented in Figure IV-17. From
0 to 775 µm from the external surface, the carbon content increases from 0.55vol% to 2.1vol%. Then,
from 775 µm from the border to the center of the sample, the carbon content is 2.1vol%. When
comparing that distribution with a sample with 2.1vol% graphite everywhere, assuming that the carbon
loss is due to the graphite phase only, the carbon mass loss in the outer cylindrical ring of the sample of
775µm width can be estimated to 0.10 wt% (See Appendix 7). Therefore, about 12% of the 0.8wt%
carbon mass loss can be attributed to a heterogeneous decarburization of the surface layers for the C-
rich samples.

IV. Effect of the carbon content in (NbC-3%Mo2C)-0.5vol%WC-12vol%Ni
94
Figure IV-17 Graphite volume distribution estimated from the measured values on a (NbC-
3%Mo2C)-12vol%Ni-0.5vol%WC sample with 4.5at%C.
IV.D Mechanical properties
The hardness and toughness of each composition were deduced from Vickers macro-indentations at 30
kgf (300 N), as presented in Figure IV-18. The hardness increases when adding molybdenum and
decreases when adding carbon. The toughness drops when adding molybdenum and even more when
adding carbon. The carbon composition therefore strongly impacts the mechanical properties of the
material.
Figure IV-18 Hardness and toughness as a function of Mo or C additions.
IV.E Discussion
IV.E.1 General discussion
In this work the carbon content effect was studied by adding C or Mo in different quantities to the (NbC-
3%Mo2C)-0.5vol%WC-12vol%Ni reference composition. Substitution of Nb with Mo to decrease the
carbon content is questionable. First it must be noticed that this substitution does not introduce new
phases in the systems, which always consists in Nb-rich carbides embedded in a Ni-rich matrix, with
0.0
0.5
1.0
1.5
2.0
2.5
3.0
0 500 1000 1500 2000 2500 3000
Gra
phit
e vo
lum
e (%
vo
l)
Distance from border (µm)
2.1 vol%
775

IV. Effect of the carbon content in (NbC-3%Mo2C)-0.5vol%WC-12vol%Ni
95
Mo2C additions. The experimental variation of lattice parameters of the carbide phase and of the binder
phase with the carbon content is consistent with other studies which use different additions to adjust the
C content [35]. Also the mechanical properties (hardness and toughness) have a similar variation with
the carbon content than in other studies of the literature [35]. A continuous enhancement of grain growth
is also observed in this study, from Mo-rich to C-rich samples, which suggests that C content is the
pertinent parameter.
A more direct analysis of the effect of Mo substitution to Nb on the phase equilibria was performed with
Thermocalc. Figure IV-19 presents the calculated limits of the 2-phase NbC-Ni domain for different Mo
contents. The Mo contents of the carbon window compositions are presented in Table IV-4. On one
hand, the right limit, separating the NbC + Ni and the NbC + Ni + graphite domains, is only slightly
shifted to lower carbon contents with our Mo composition range. On the other hand, the left limit,
separating the NbC + Ni and the NbC + Ni + Ni3Nb domain, is significantly shifted to lower carbon
contents. The Ni3Nb phase is apparently destabilized by Mo additions and this might be one reason why
the Ni3Nb phase has never been observed in our experiments.
Except for this last point, it will be assumed in the following that the procedure used in this work to
adjust the composition gives a good representation of the C content effect in our system.
Figure IV-19 Limit of the NbC + Ni domain depending on the Mo content in the Nb-C isopleth
with 0.5vol%WC and 12vol%Ni calculated with thermocalc (TCNI9 base).
Table IV-4 Mo content of the carbon window compositions.
Composition 3at%Mo 2at%Mo 1at%Mo Ref 1.5at%C 3at%C 4.5at%C
wt% Mo 7.89 6.23 4.53 2.82 2.80 2.79 2.77
The onset of solid state sintering virtually coincides with the temperature of oxide reduction observed
in TGA, as already observed for the reference composition (see Chapter III). It is slightly delayed to

IV. Effect of the carbon content in (NbC-3%Mo2C)-0.5vol%WC-12vol%Ni
96
lower temperatures when increasing the carbon content. As solid state sintering is initiated by the
spreading of the binder phase on the carbide grains, this may be due to a lower interfacial energy for
higher carbon contents. This is consistent with the contiguity variation observed on the final sintered
materials.
Liquid phase sintering starts at a lower temperature when adding either Mo or C. It can be explained by
assuming that the reference composition is close to the composition with maximum solidus temperature
on the phase diagram. The decrease of the solidus temperature is more rapid when increasing the carbon
content, in agreement with our observations.
For the compositions with high carbon addition, a swelling is observed in dilatometry during liquid
phase sintering. This swelling occurs during heating in the (NbC + Ni + liquid) 3 phase domain of the
phase diagram (see Figure IV-1). In that domain, the niobium content in the remaining solid binder
increases with the temperature, which leads to an increase of the lattice parameter and may explain
swelling. Swelling ends as soon as all the binder turns liquid. Similar swelling observations were
previously made on WC based materials [15].
Beside the temperature of liquid formation, composition of the alloys also affects the nickel evaporation,
which is significantly reduced when adding either Mo or C. This is probably due to the earlier
densification due to the lower solidus temperature, as discussed before. Indeed, after pore closure, the
liquid is in contact with the vacuum atmosphere only at the external surface of the compact and
evaporation kinetics are therefore significantly reduced.
The lattice parameters of the two phases (niobium-rich carbide & nickel-rich binder) are influenced by
the C/(Nb+Mo+W) ratio. When the C/(Nb+Mo+W) ratio increases, the lattice parameter of the carbide
phase increases while the one of the binder phase decreases. Indeed, addition of C probably also reduces
the solubility of metallic elements in the solid binder, as it does in the liquid [35], which may explain
the lower lattice parameter in this phase. For the carbide phase, increase of the lattice parameter with C
content is similar to previous observations in the literature [21]. The effect of Mo substitution to Nb may
further amplify the effect of C content reduction, Mo having a smaller atomic radius than Nb.
The binder volume decreases when increasing the carbon content from image analysis measurements.
Looking at the ternary phase diagram Nb-Ni-C in Figure IV-20, it can be identified that the niobium
content in the liquid phase decreases when increasing the carbon content, which could explain the result.
For example, considering the points A and B on the phase diagram for 100g of nickel, the corresponding
binder volume were calculated and are presented in Table IV-5. Carbon was assumed not to contribute
to the volume as it is in interstitial position. It was confirmed by EDS measurements that the niobium
content of the binder decreases when increasing the carbon content.

IV. Effect of the carbon content in (NbC-3%Mo2C)-0.5vol%WC-12vol%Ni
97
Figure IV-20 Calculated isothermal section of the Nb-C-Ni system at 1420°C (TCNI9 database).
Table IV-5 Binder liquid phase volume for 100g of nickel for different carbon contents.
Ni Nb C Total
A
wt% 91.4 6 2.6 100
For 100g of Ni (g) 100 6.6 2.8 109
Volume (cm3) 13.3 0.77 0 14.1
B
wt% 31.9 68 0.10 100
For 100g of Ni (g) 100 213 0.32 313
Volume (cm3) 13.3 24.9 0 38.2
The contiguity in the final sintered materials decreases when increasing the carbon content. This cannot
be explained by the decrease of the binder volume, which should lead to an increase of the contiguity.
Therefore, the variation of the contiguity is most probably due to a variation of interfacial energy. The
contiguity decrease would then correspond to a relative decrease of the carbide-binder interfacial energy
with respect to the grain boundary energy. This lower interfacial energy could also explain the earlier
solid state spreading of the binder for C-rich compositions, as explained previously.
Grain growth of the carbide phase is enhanced as the carbon content increases from Mo-rich to C-rich
compositions. Huang et al observed a similar effect of the carbon content on grain growth [35]. This is
also a classical result for WC cemented carbides [77][78][79]. However, grain growth seems to stall for
composition above 3 at% C, likely due to the pinning effect of graphite inclusions on grain boundaries.
The hardness increases as the carbon content decreases which is probably mainly due to a decrease in
grain size and to an increase of the metallic solute content in the binder. The increase of hardness of the
carbide phase may also play a role. It was indeed shown that the C/(Nb+Mo+W) ratio has an effect on
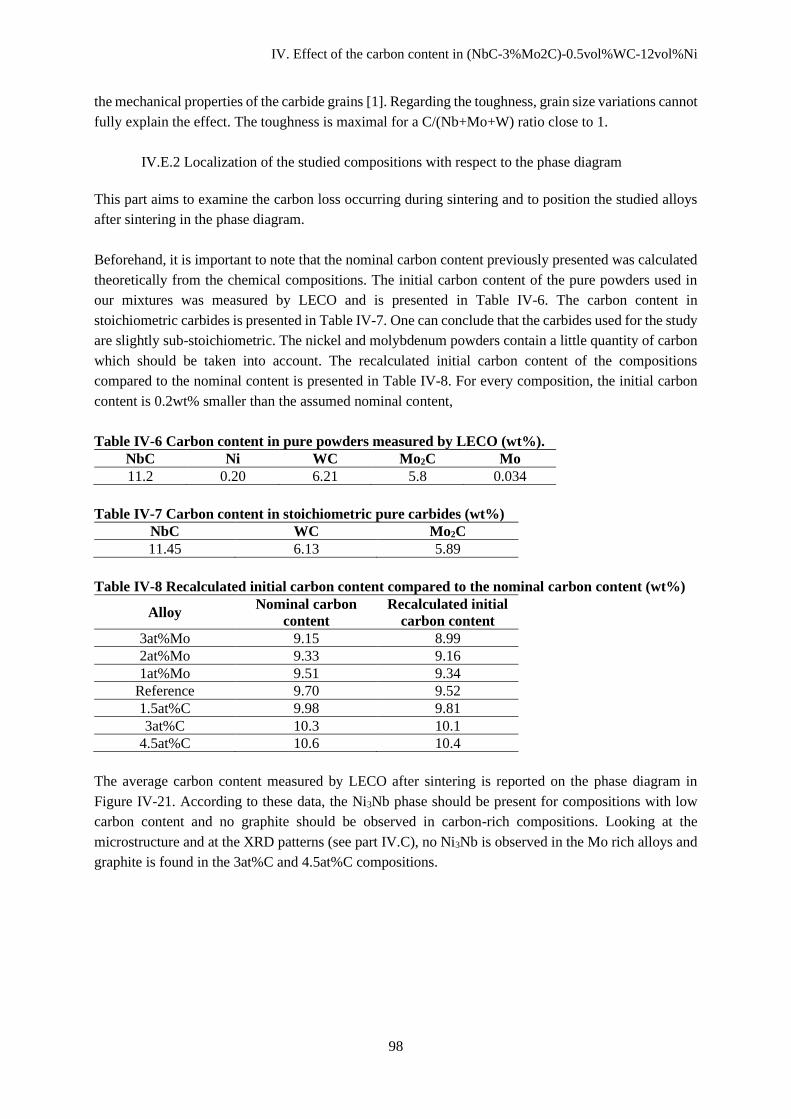
IV. Effect of the carbon content in (NbC-3%Mo2C)-0.5vol%WC-12vol%Ni
98
the mechanical properties of the carbide grains [1]. Regarding the toughness, grain size variations cannot
fully explain the effect. The toughness is maximal for a C/(Nb+Mo+W) ratio close to 1.
IV.E.2 Localization of the studied compositions with respect to the phase diagram
This part aims to examine the carbon loss occurring during sintering and to position the studied alloys
after sintering in the phase diagram.
Beforehand, it is important to note that the nominal carbon content previously presented was calculated
theoretically from the chemical compositions. The initial carbon content of the pure powders used in
our mixtures was measured by LECO and is presented in Table IV-6. The carbon content in
stoichiometric carbides is presented in Table IV-7. One can conclude that the carbides used for the study
are slightly sub-stoichiometric. The nickel and molybdenum powders contain a little quantity of carbon
which should be taken into account. The recalculated initial carbon content of the compositions
compared to the nominal content is presented in Table IV-8. For every composition, the initial carbon
content is 0.2wt% smaller than the assumed nominal content,
Table IV-6 Carbon content in pure powders measured by LECO (wt%).
NbC Ni WC Mo2C Mo
11.2 0.20 6.21 5.8 0.034
Table IV-7 Carbon content in stoichiometric pure carbides (wt%)
NbC WC Mo2C
11.45 6.13 5.89
Table IV-8 Recalculated initial carbon content compared to the nominal carbon content (wt%)
Alloy Nominal carbon
content
Recalculated initial
carbon content
3at%Mo 9.15 8.99
2at%Mo 9.33 9.16
1at%Mo 9.51 9.34
Reference 9.70 9.52
1.5at%C 9.98 9.81
3at%C 10.3 10.1
4.5at%C 10.6 10.4
The average carbon content measured by LECO after sintering is reported on the phase diagram in
Figure IV-21. According to these data, the Ni3Nb phase should be present for compositions with low
carbon content and no graphite should be observed in carbon-rich compositions. Looking at the
microstructure and at the XRD patterns (see part IV.C), no Ni3Nb is observed in the Mo rich alloys and
graphite is found in the 3at%C and 4.5at%C compositions.

IV. Effect of the carbon content in (NbC-3%Mo2C)-0.5vol%WC-12vol%Ni
99
Figure IV-21 Calculated phase diagram for a NbC-12vol%Ni system (TCNI9 database) with the
average carbon content measured by LECO. The red arrow indicates the composition in the core
of the specimens.
Another method to evaluate the carbon content is to apply the mass loss deduced from TGA
measurements to the recalculated nominal carbon content. It was previously established that a measured
mass loss of 0.9wt% is due to an oxide reduction. If the reduction product is CO gas, then 0.4wt% of
the sample mass loss is carbon. This shift of the carbon content from the recalculated nominal
composition is reported on the phase diagram in Figure IV-22. With this shift, the window is more or
less centered on the Ni + NbC domain. This positioning on the phase diagram is more consistent with
the microstructural observations and XRD patterns (see part IV.C).

IV. Effect of the carbon content in (NbC-3%Mo2C)-0.5vol%WC-12vol%Ni
100
Figure IV-22 Calculated phase diagram for a NbC-12vol%Ni system (TCNI9 database) with a
carbon content shift of 0.4wt% applied to the nominal carbon content. The red arrow indicates
the composition in the core of the specimens.
When looking at the solidification peak during cooling on the dilatometry plots, the highest solidification
temperature is obtained for 1.5at%C. Both temperatures, at heating and at cooling, have been reported
on the phase diagrams in Figure IV-23. The carbon contents are estimated from LECO measurements
or recalculated nominal temperatures and TGA measurements. The difference of temperature between
cooling and heating can be explained by the homogenization of the binder phase in liquid state. Looking
at the phase diagram, and using the carbon content deduced from the recalculated initial composition
and TGA measurements, the highest solidus temperature is close to the 1.5at%C, which is more or less
consistent the experimental solidus lines. Therefore, this carbon content seems to be consistent with the
measured temperatures.

IV. Effect of the carbon content in (NbC-3%Mo2C)-0.5vol%WC-12vol%Ni
101
Figure IV-23 Calculated phase diagram for a NbC-12vol%Ni system (TCNI9 database) with the
melting and solidification temperatures measured at heating and cooling in dilatometry,
(a)LECO carbon contents, (b) Carbon content estimated from recalculated nominal composition
and TGA.
A heterogeneous carbon loss between the center and the periphery of the sample was observed, so that
the microstructure analysis would correspond to a C content higher than the global value. This
assumption was investigated in part IV.C.2 for a 4.5at%C sample which presents a high volume of
graphite phase. A carbon loss at the external surfaces of the sample corresponding to a global carbon
loss of 0.10 wt% was identified. The microstructures presented in part IV.C were observed at the center
of the samples, where the carbon loss was smaller. Therefore, the global carbon content measured by
LECO or deduced from TGA analysis does not correspond to the carbon content in the core of the
sample. An approximate carbon content at the center of the sample could be obtained by adding 0.10wt%
to the measured global values. This shift is figured by a red arrow on Figure IV-21 and Figure IV-22.
When looking at Figure IV-21 and Figure IV-22, the actual carbon window is probably intermediate
between the one deduced from LECO measurements and the one deduced from TGA analyses. However,
the difference between the two carbon windows is significant (about 0.3 wt%), and remains unjustified.
One can also question on the accuracy of the calculated phase diagram as few experimental
investigations were conducted on the NbC-Ni alloys. Further experimental investigations would be
helpful to validate the phase diagram.

IV. Effect of the carbon content in (NbC-3%Mo2C)-0.5vol%WC-12vol%Ni
102

103
V. Effect of Mo2C addition in NbC-
0.5vol%WC-12vol%Ni
Mo2C is added to limit grain growth in NbC-Ni cemented carbides [57]. In this part, the impact of Mo2C
addition, to a NbC-0.5vol%WC-12vol%Ni composition on the sintering behavior and resulting
properties will be investigated. A portion of NbC is replaced by Mo2C in order not to affect the other
element quantities. The samples of this study will be referred to as the volume percentage of NbC
replaced by Mo2C. For example, the (NbC-3vol%Mo2C)-0.5vol%WC-12vol%Ni material will be
referred to as “3%Mo2C”.
First, the impact of Mo2C on the mass loss, and on the sintering process will be investigated. Then, the
microstructure with different Mo2C contents will be analyzed at different scales and for different
sintering temperatures. Finally, the resulting hardness and toughness will be considered.
V.A Physical and chemical transformations during heating
V.A.1 Mass loss
The mass loss due to the elimination of hydroxides and to the decomposition of the organic binder agents
was presented in part III and is similar for every composition of this work.
The mass loss during sintering measured by TGA is presented in Figure V-1. There is a global mass loss
of 1.3% for the 0%, 6% and 9% Mo2C compositions, and 1.4% for the 3%Mo2C composition. This
difference can be explained by an incomplete debinding step for the 3%Mo2C composition as a mass
loss is measured before 400°C. The rest of the mass loss curve is very similar to the other compositions,
confirming that the 0.1% mass loss shift is due only to an incomplete debinding. The mass loss during
sintering can thus be estimated to 1.3% for all compositions (0, 3, 6 & 9% Mo2C contents). Therefore,
the addition of Mo2C has no significant effect on the global mass loss.
Looking at the mass loss rate (Figure V-1 (b)), two mass loss phenomena are detected. First, a mass loss
due to oxides reduction is measured. This mass loss presents several steps, between 500 and 800°C (A1),
between 850 and 1200°C (A2) and between 1200°C and 1300°C (A3), probably corresponding to the
reduction of W, Nb and Mo oxides. Nickel oxides are reduced at low temperature during debinding (see
part II.B.1). As the Mo2C content increases, the A2 peak intensity is slightly decreased and the A3 peak
appears. This may look surprising because Mo oxides are in average less stable than Nb oxides from
Ellingham diagrams (see Figure II-6). However, the total mass loss due to oxide reduction remains
equivalent for all compositions. Second, a mass loss occurs above 1340°C, which was previously
identified as nickel evaporation (see part III). The global mass loss can therefore be attributed to these
two phenomena, with 0.9 % of the mass loss due to metallic oxide reduction and 0.4% due to nickel
evaporation.
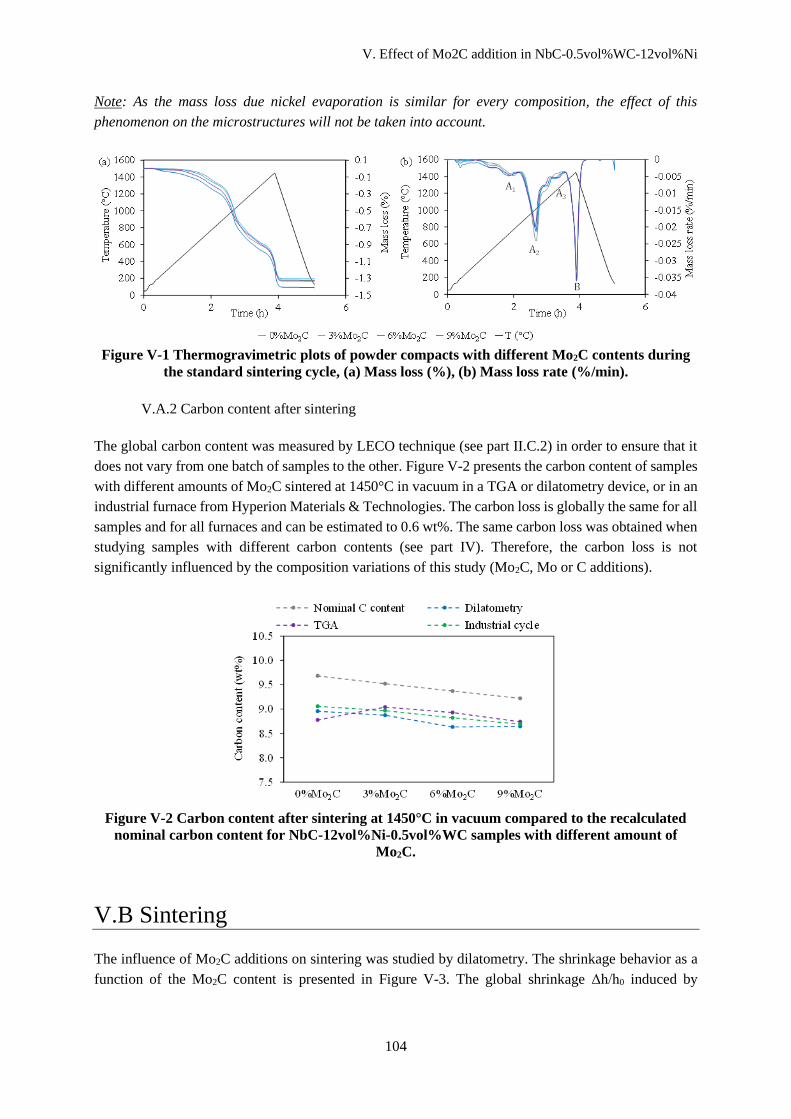
V. Effect of Mo2C addition in NbC-0.5vol%WC-12vol%Ni
104
Note: As the mass loss due nickel evaporation is similar for every composition, the effect of this
phenomenon on the microstructures will not be taken into account.
Figure V-1 Thermogravimetric plots of powder compacts with different Mo2C contents during
the standard sintering cycle, (a) Mass loss (%), (b) Mass loss rate (%/min).
V.A.2 Carbon content after sintering
The global carbon content was measured by LECO technique (see part II.C.2) in order to ensure that it
does not vary from one batch of samples to the other. Figure V-2 presents the carbon content of samples
with different amounts of Mo2C sintered at 1450°C in vacuum in a TGA or dilatometry device, or in an
industrial furnace from Hyperion Materials & Technologies. The carbon loss is globally the same for all
samples and for all furnaces and can be estimated to 0.6 wt%. The same carbon loss was obtained when
studying samples with different carbon contents (see part IV). Therefore, the carbon loss is not
significantly influenced by the composition variations of this study (Mo2C, Mo or C additions).
Figure V-2 Carbon content after sintering at 1450°C in vacuum compared to the recalculated
nominal carbon content for NbC-12vol%Ni-0.5vol%WC samples with different amount of
Mo2C.
V.B Sintering
The influence of Mo2C additions on sintering was studied by dilatometry. The shrinkage behavior as a
function of the Mo2C content is presented in Figure V-3. The global shrinkage Δh/h0 induced by

V. Effect of Mo2C addition in NbC-0.5vol%WC-12vol%Ni
105
sintering varies between 19% and 21%. All the samples are almost fully dense after sintering, with about
1% of remaining porosity, as presented in Table V-1.
On the shrinkage rate curve, the different steps of solid state (IA1, IA2 and IB) and liquid phase (II)
sintering, already observed in part IV, are identified. The solid state sintering is significantly delayed to
higher temperature when adding Mo2C. For 0%Mo2C, it starts at approximately 1100°C, whereas it
starts above 1170°C for 3%, 6% and 9%Mo2C. On the other hand, the liquid phase sintering starts around
1300°C and is little affected by the Mo2C addition. The slight shift of the peak II toward higher
temperature is probably due to the larger overlap between the solid state sintering and liquid phase
sintering peaks when adding Mo2C, and therefore does not indicate an effect of Mo2C on the liquid
phase sintering.
A third peak is visible on the shrinkage rate curve during cooling at 1350°C, corresponding to the
solidification of the liquid binder.
Figure V-3 Dilatometry curves of powder compacts with different Mo2C content. (a) Shrinkage
(%), (b) Shrinkage rate (%/min) showing the different sintering steps: I. Solid state sintering, II.
Liquid phase sintering.
Table V-1 Density after sintering at 1450°C in vacuum.
Alloy Archimedes density after
sintering (g/cm3)
Theoretical densities
(g/cm3) Relative density (%)
0%Mo2C 7.848 7.934 98.9
3%Mo2C 7.813 7.963 98.1
6%Mo2C 7.840 7.992 98.1
9%Mo2C 8.011 8.022 99.9
V.C Microstructural evolutions
This part aims to present the effect of Mo2C on the microstructure but also the evolution of the
microstructure during sintering. First, the effect of Mo2C on grain size will be observed. Then, a
thorough characterization at low scale of grain boundaries and phase boundaries will be conducted in
order to study the mechanism allowing grain growth inhibition. Finally, the evolution of the
microstructure with the temperature will be analyzed in order to explain the solid state sintering delay
observed previously by dilatometry.

V. Effect of Mo2C addition in NbC-0.5vol%WC-12vol%Ni
106
V.C.1 Effect of Mo2C addition
Figure V-4 presents the microstructure of NbC-12vol%Ni-0.5vol%WC sintered compacts with different
amounts of Mo2C. The same type of microstructure with two phases as presented in part III is observed
no matter the Mo2C content. A NbC-rich carbide phase (dark) and a nickel-rich binder phase (bright)
are visible.
The nature of these phases is confirmed by XRD identification as presented in Figure V-5 (a). A
variation of lattice parameter when adding Mo2C presented in Figure V-5 (b) confirms the dissolution
of Mo in both phases, forming a mixed carbides with NbC and a metallic solution with Ni. The lattice
parameter of the NbC phase decreases when increasing the Mo2C content whereas the lattice parameter
of the nickel phase increases.
Figure V-4 Microstructure of NbC-12vol%Ni-0.5vol%WC with different Mo2C content sintered
at 1450°C in vacuum.
Figure V-5 XRD study of NbC-12vol%Ni-0.5vol%WC compacts with different Mo2C contents
sintered at 1450°C in vacuum, (a) XRD pattern showing a NbC phase and a Ni phase, (b) Lattice
parameters evolution of both phases as a function of the Mo2C content.
A grain size reduction induced by the secondary carbide addition is also clearly visible on Figure V-4.
The different parameters of grain size quantification from EBSD maps are presented in Figure V-6 and
in
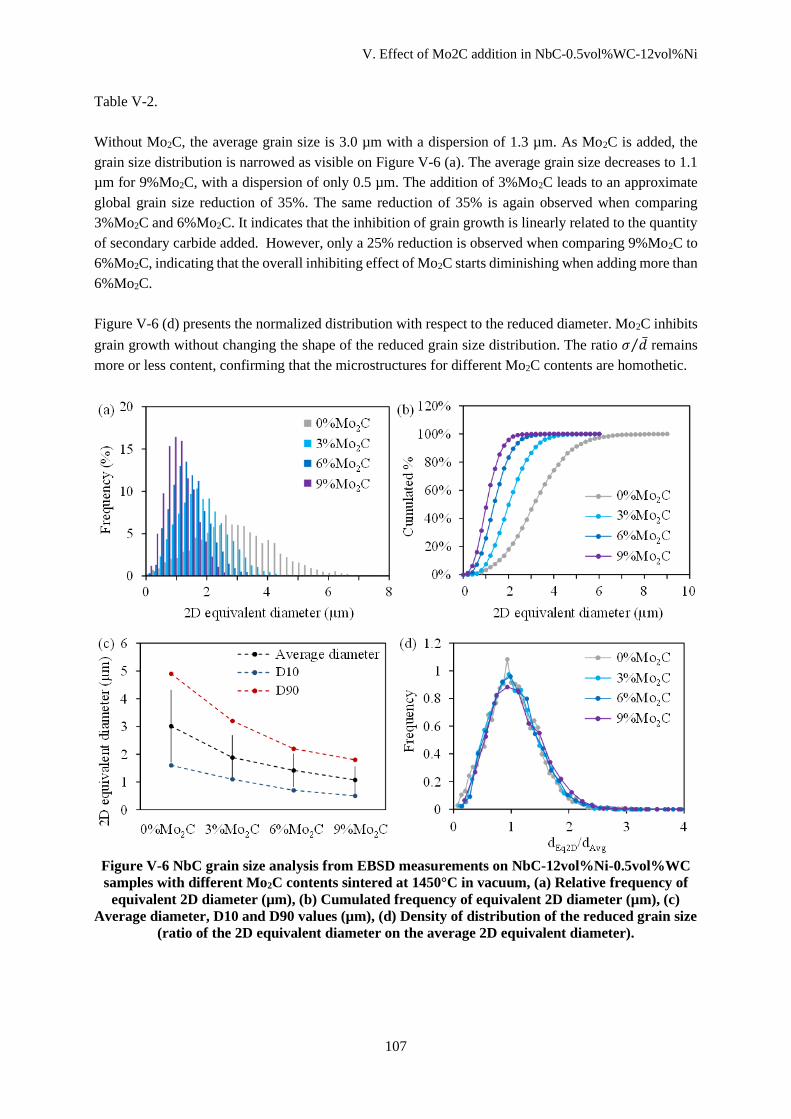
V. Effect of Mo2C addition in NbC-0.5vol%WC-12vol%Ni
107
Table V-2.
Without Mo2C, the average grain size is 3.0 µm with a dispersion of 1.3 µm. As Mo2C is added, the
grain size distribution is narrowed as visible on Figure V-6 (a). The average grain size decreases to 1.1
µm for 9%Mo2C, with a dispersion of only 0.5 µm. The addition of 3%Mo2C leads to an approximate
global grain size reduction of 35%. The same reduction of 35% is again observed when comparing
3%Mo2C and 6%Mo2C. It indicates that the inhibition of grain growth is linearly related to the quantity
of secondary carbide added. However, only a 25% reduction is observed when comparing 9%Mo2C to
6%Mo2C, indicating that the overall inhibiting effect of Mo2C starts diminishing when adding more than
6%Mo2C.
Figure V-6 (d) presents the normalized distribution with respect to the reduced diameter. Mo2C inhibits
grain growth without changing the shape of the reduced grain size distribution. The ratio 𝜎 �̅�⁄ remains
more or less content, confirming that the microstructures for different Mo2C contents are homothetic.
Figure V-6 NbC grain size analysis from EBSD measurements on NbC-12vol%Ni-0.5vol%WC
samples with different Mo2C contents sintered at 1450°C in vacuum, (a) Relative frequency of
equivalent 2D diameter (µm), (b) Cumulated frequency of equivalent 2D diameter (µm), (c)
Average diameter, D10 and D90 values (µm), (d) Density of distribution of the reduced grain size
(ratio of the 2D equivalent diameter on the average 2D equivalent diameter).

V. Effect of Mo2C addition in NbC-0.5vol%WC-12vol%Ni
108
Table V-2 Key parameters resulting from the EBSD quantitative study of NbC-12vol%Ni-
0.5vol%WC compacts with different Mo2C contents sintered at 1450°C in vacuum.
Composition Average diameter �̅� (µm) Standard deviation σ (µm) σ �̅�⁄ d10 (µm) d90 (µm)
0%Mo2C 3.0 1.3 0.43 1.6 4.9
3%Mo2C 1.9 0.8 0.42 1.1 3.2
6%Mo2C 1.4 0.6 0.43 0.7 2.2
9%Mo2C 1.1 0.5 0.45 0.5 1.8
The contiguity and binder volume fraction were measured from EBSD maps and are presented in Figure
V-7. When adding Mo2C, the contiguity increases. The binder volume fraction does not vary, indicating
that the nickel evaporation identified in chapter III is more or less the same no matter the composition.
Figure V-7 Contiguity and binder volume fraction of NbC-12vol%Ni-0.5vol%WC samples with
different Mo2C contents measured from EBSD images.
A chemical mapping was performed by SEM-EDS on samples with different Mo2C contents as
presented in Figure V-8. The niobium is mostly found in the carbides and nickel is mostly found in the
binder. Molybdenum is evenly distributed between the two phases. Tungsten is found in both phases,
but seems to preferentially go into the binder phase. To better characterize the mutual solubility, TEM-
EDS was performed on (NbC-6%Mo2C)-0.5vol%WC-12vol%Ni, as presented in Figure V-9.
Figure V-8 EDS mapping of NbC-12vol%Ni-0.5vol%WC compacts with different Mo2C
contents sintered at 1450°C in vacuum, (a) 3%Mo2C, (b) 9%Mo2C.
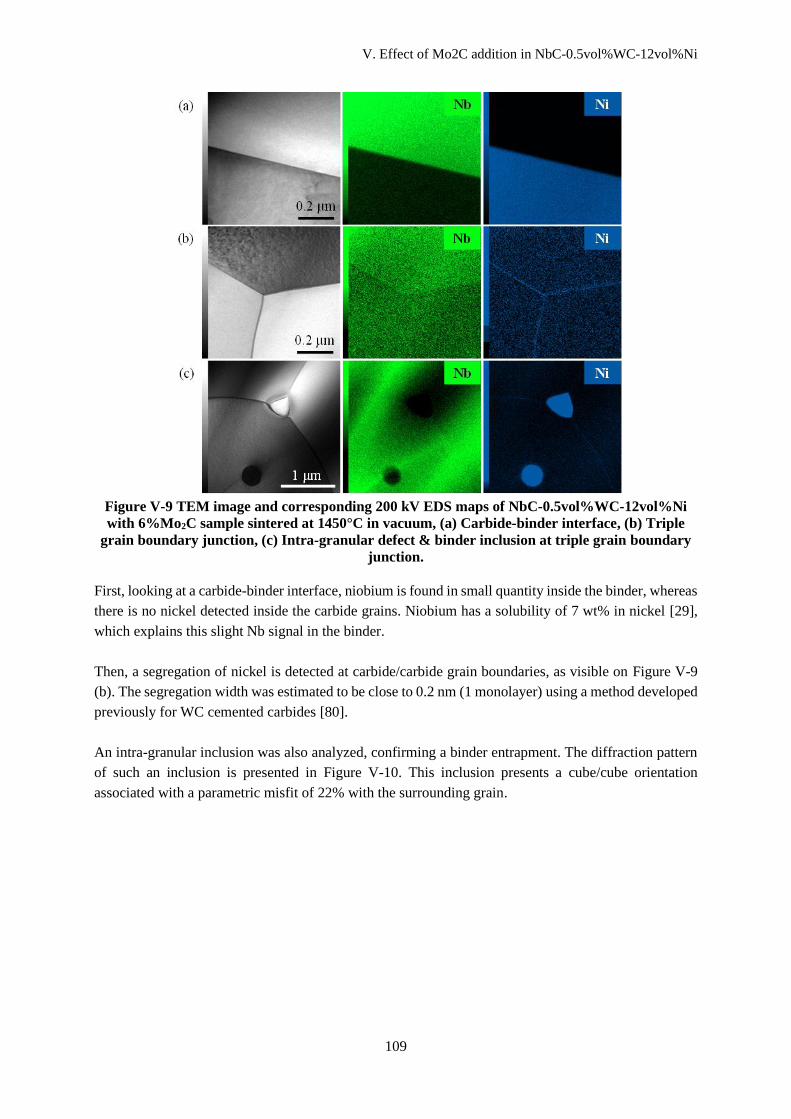
V. Effect of Mo2C addition in NbC-0.5vol%WC-12vol%Ni
109
Figure V-9 TEM image and corresponding 200 kV EDS maps of NbC-0.5vol%WC-12vol%Ni
with 6%Mo2C sample sintered at 1450°C in vacuum, (a) Carbide-binder interface, (b) Triple
grain boundary junction, (c) Intra-granular defect & binder inclusion at triple grain boundary
junction.
First, looking at a carbide-binder interface, niobium is found in small quantity inside the binder, whereas
there is no nickel detected inside the carbide grains. Niobium has a solubility of 7 wt% in nickel [29],
which explains this slight Nb signal in the binder.
Then, a segregation of nickel is detected at carbide/carbide grain boundaries, as visible on Figure V-9
(b). The segregation width was estimated to be close to 0.2 nm (1 monolayer) using a method developed
previously for WC cemented carbides [80].
An intra-granular inclusion was also analyzed, confirming a binder entrapment. The diffraction pattern
of such an inclusion is presented in Figure V-10. This inclusion presents a cube/cube orientation
associated with a parametric misfit of 22% with the surrounding grain.

V. Effect of Mo2C addition in NbC-0.5vol%WC-12vol%Ni
110
Figure V-10 300 kV TEM image of (NbC-6%Mo2C)-0.5vol%WC-12vol%Ni sample sintered at
1450°C in vacuum, (a) TEM image of the area of analysis, (b) Electron diffraction pattern of
cubic NbC in region A viewed along [001], (c) Diffraction pattern of NbC in region B with Ni
inclusion depicting a cube-cube relation. The additional reflections are due to double diffraction.
V.C.2 Grain boundary and phase boundary analysis
The mechanism by which Mo2C addition reduces grain growth is yet to be identified. A study at a
smaller scale has been performed in order to determine how Mo might impact the microstructure once
Mo2C has dissolved.
A TEM-EDS composition analysis has been performed in order to identify possible segregations of
molybdenum on 9%Mo2C sample at grain boundaries or phase boundaries. First, a global mapping of
the chemical elements at a grain boundary or at a carbide-binder interface are presented in Figure V-11.
Composition profiles were drawn on these maps and are presented in Figure V-12. As previously
observed, a film of nickel is found at grain boundaries. Mo is found both in the carbides and in the
binder. On these maps, there is no clear evidence of finding more W in the binder. This element seems
to be equally distributed in the binder and in the carbides. There are no signs of segregations of Mo or
W at grain boundaries or interfaces.
Figure V-11 TEM-EDS mapping of NbC-12vol%Ni-0.5vol%WC compacts with 9%Mo2C
sintered at 1450°C in vacuum, (a) Grain boundary, (b) Carbide-binder interface.

V. Effect of Mo2C addition in NbC-0.5vol%WC-12vol%Ni
111
Figure V-12 Chemical composition profile performed on the Figure V-11 maps, (a) Grain
boundary, (b) Carbide-binder interface.
However, the previous results were obtained from small volumes, with a rather weak signal intensity
for W and Mo. To get an overview of the composition of the interfacial areas compared to the bulk, the
overall signal of volumes parallel to the interface presented in Figure V-13 (b) and Figure V-14 (b) was
measured. The resulting average composition in each area is presented in Figure V-13 (c) for a grain
boundary and in Figure V-14 (c) for a carbide-binder interface.
A slight increase of the Mo concentration can be observed at the observed grain boundary. However,
this observation could not be systematically verified for other grain boundaries. Regarding the binder-
carbide interfaces, it is observed that tungsten is preferentially found in the binder rather than in the
carbides. Molybdenum is found in both phases, but in larger amount in the binder.

V. Effect of Mo2C addition in NbC-0.5vol%WC-12vol%Ni
112
Figure V-13 TEM-EDS analysis at a grain boundary in a NbC-12vol%Ni-0.5vol%WC with
9%Mo2C sample sintered at 1450°C in vacuum, (a) SEM image, (b) Approximate areas of
measurement of the average compositions (width ≈ 20nm), (c) Average compositions of Mo, Ni
and W (at%).
Figure V-14 TEM-EDS analysis at a carbide-binder interphase in a NbC-12vol%Ni-0.5vol%WC
with 9%Mo2C sample sintered at 1450°C in vacuum, (a) SEM image, (b) Approximate areas of
measurement of the average compositions (width ≈ 20nm), (c) Average compositions of Mo and
W (at%).

V. Effect of Mo2C addition in NbC-0.5vol%WC-12vol%Ni
113
The binder composition measured by TEM-EDS for samples with 6% or 9% Mo2C additions is presented
in Table V-3. The niobium and molybdenum are not distinguished as the Lα signal is used to maximize
the collected data (see part II.C.3.c). The solute content of the binder increases when adding more Mo2C
to the composition.
Table V-3 Binder composition measured by TEM-EDS for samples with 6% or 9% Mo2C
additions
Composition Ni (at%) W (at%) Mo + Nb (at%)
6%Mo2C 87,6 0.5 11.9
9%Mo2C 83,1 0.8 16.0
V.C.3 Temperature dependent microstructural evolution
To understand the sintering behavior observed previously by dilatometry, (NbC-3%Mo2C)-12vol%Ni-
0.5vol%WC samples were sintered at different temperatures. First, at 1080°C and 1180°C,
corresponding to the beginning of solid state sintering respectively without and with Mo2C additions.
Then, at 1320°C, which corresponds to the intermediary step between solid state and liquid phase
sintering with Mo2C. Figure V-15 presents the chosen temperatures on the previously presented
shrinkage rate curve for 0 and 3%Mo2C contents.
Figure V-15 Shrinkage rate curve of NbC-12vol%Ni-0.5vol%WC with 0%Mo2C or 3%Mo2C
sintered in vacuum at 1450°C.
Figure V-16 presents the corresponding microstructures. On the 1080°C and 1180°C samples,
agglomerates of nickel binder and small carbide grains of no more than 1 µm are visible, similarly to
what was observed on powder particles in part II. On the 1320°C sample, the nickel phase seems to have
spread, filling porosities, and carbide grain have grown. However, porosities remain as the binder has
not yet melted. Reaching 1450°C, most porosities have been removed except for some intra-granular
remaining pores. The binder phase has therefore efficiently spread into the remaining porosities
following its melting. The carbide grains have also further grown.

V. Effect of Mo2C addition in NbC-0.5vol%WC-12vol%Ni
114
Figure V-16 Microstructure of NbC-12vol%Ni-0.5vol%WC with 3%Mo2C compacts sintered in
vacuum at different temperatures.
In order to determine how molybdenum affects sintering, an XRD analysis and EDS chemical mapping
have been performed. First, Figure V-17 presents the XRD diffraction patterns for each temperature. For a
sintering at 1080°C, all the individual components (NbC, Ni, Mo2C, WC) of the initial powder mixture are
still identified. For a sintering at 1180°C, a very small peak of Mo2C can still be identified but there is no
more WC peak, indicating the dissolution into the NbC and Ni phases of the majority of these carbides
between 1080°C and 1180°C. For a sintering at 1320°C or 1450°C, only the NbC and Ni phases are detected.
Figure V-17 XRD pattern of NbC-12vol%Ni-0.5vol%WC with 3%Mo2C samples sintered at
different temperatures.
The chemical analysis mapping (EDS) of the initial powder mix for the 3%Mo2C composition is
presented in Figure V-18. Agglomerates of nickel binder and carbides of a few µm are visible, and
niobium carbide, molybdenum carbide and tungsten carbides are clearly identifiable, well disseminated
in the microstructure. Figure V-19 presents the EDS mapping of 3%Mo2C samples sintered at 1080°C,
1180°C, 1320°C and 1450°C in vacuum. On the samples sintered at 1180°C or higher, WC and Mo2C
are no longer detected by EDS, confirming that these carbides have dissolved into the microstructure,
as indicated by the XRD diffraction patterns. For those samples, molybdenum seems to have diffused
equally in the niobium carbides and in the nickel binder, while tungsten is found in higher quantity in
the nickel binder.

V. Effect of Mo2C addition in NbC-0.5vol%WC-12vol%Ni
115
Figure V-18 SEM images and EDS mapping of NbC-12vol%Ni-0.5vol%WC with 3%Mo2C
powder mix with pressing agents, (a) Secondary electron SEM image, (b) EDS map of Ni, Mo
and W superimposed on SEM image, (c) EDS map of Nb, Ni, Mo and W.
Figure V-19 EDS mapping of NbC-12vol%Ni-0.5vol%WC samples with 3%Mo2C sintered at
different temperature in vacuum.

V. Effect of Mo2C addition in NbC-0.5vol%WC-12vol%Ni
116
Figure V-20 presents the lattice parameters of the NbC and Ni phases as a function of the sintering
temperature. The lattice parameter of the NbC-rich phase decreases gradually from 1080°C to 1450°C.
The lattice parameter of the Ni-rich phase increases considerably from 1080°C to 1180°C, then remains
more or less constant above 1180°C.
Figure V-20 Lattice parameters of the NbC-rich and Ni-rich phases of NbC-12vol%Ni-
0.5vol%WC with 3%Mo2C samples sintered at different temperatures.
V.D Mechanical properties
All samples from this mechanical study were sintered with the industrial thermal cycle. The hardness
HV30 and toughness KIc measured from Vickers indents performed at 30 kgf (294 N) is presented in
Figure V-21. The toughness could not be measured for the 0%Mo2C sample as the applied load did not
allow a crack formation at the edges of the indent because of the large grain size (�̅� = 3 µm) of this
composition. The hardness increases and the toughness decreases when adding Mo2C.
Examples of crack propagation patterns obtained for the 3%Mo2C and 9%Mo2C are presented in Figure
V-22. In both cases, the propagation of the fracture is preferentially in the binder phase and along the
NbC grain boundaries.

V. Effect of Mo2C addition in NbC-0.5vol%WC-12vol%Ni
117
Figure V-21 Hardness and toughness of NbC-12vol%Ni-0.5vol%WC samples with different
amount of Mo2C sintered at 1450°C in vacuum.
Figure V-22 Cracks formed at the edges of 30 kgf (294 N)Vickers indentations for NbC-
12vol%Ni-0.5vol%WC samples with different amount of Mo2C sintered at 1450°C in vacuum.
V.E Discussion
This part aimed to investigate the effect of a secondary carbide addition, Mo2C, to a NbC-12vol%Ni-
0.5vol%WC material on sintering and on the resulting microstructures.
In comparison with chapter IV, a new peak A3 was identified on the mass loss rate curve. The oxide
reduction associated to this peak may be related to the late reduction of a stable oxide during formation
of the (Nb,Mo)C mixed carbides which occurs around 1200°C (see § V.C.3). The global mass loss
associated to oxide reduction and to nickel evaporation are about 0.9 wt% and 0.4 wt% respectively as
observed in chapter IV and these amounts are not affected by Mo2C additions. If the reduction product
were CO gas, then 0.4wt% of the sample mass loss would be carbon. The carbon content measured by
LECO on the final sintered materials is little affected by Mo2C additions and is about 0.6-0.7 wt% lower

V. Effect of Mo2C addition in NbC-0.5vol%WC-12vol%Ni
118
than the initial recalculated nominal compositions. Therefore, Mo2C additions do not impact the carbon
loss. However, the LECO measurements still underestimate by 0.2-0.3 wt% the carbon content
compared to the values deduced from TGA analyses.
During sintering, the composition of both the carbide and the binder phase evolves, although only these
two phases are detected no matter the Mo2C content after sintering. First, a small quantity of NbC is
detected in the binder, which is consistent with its solubility in nickel (7.0 wt% [29]). On the contrary,
no nickel is detected in the carbides. Molybdenum is found in both the carbides and the binder as
expected from the solubility of Mo2C in both phases (36 wt% in nickel [29] and 60 mol% in NbC [60]).
Tungsten is mostly found in the binder because of the good solubility of WC in nickel (27 wt% [29]).
Mo2C and WC dissolve during the first step of solid state sintering, between 1080°C and 1180°C, with
the heating rate of 6°C/min. Increasing the heating rate would probably lead to a higher dissolution
temperature range. The formation of mixed carbides with Mo and W is sometimes reported to have a
positive effect on densification as it should increase the affinity for the binder and then improve the
wettability between the carbide and the binder phase [58]. This better affinity is indeed confirmed by
the higher solubility of metallic elements (Nb + Mo + W) in the binder identified by TEM analyses.
However, the contiguity increases when adding Mo2C, which indicates an increase of the interfacial
energy with respect to the grain boundary energy. As detailed in Appendix 8, the addition of a third
element like Mo with a good affinity with liquid nickel to a pseudo binary system NbC-Ni could increase
the interfacial energy, essentially because the number of Mo-Ni bonds at the interfaces would be lower
than the number of Mo-Ni bonds in the liquid phase, for solubility reasons, thus making the impact of
Mo on the interfaces less significant. Therefore, it is difficult to conclude on the link between the atomic
affinities and the measured contiguity when considering a pseudo ternary system like NbC-Mo-Ni.
The lattice parameters of the carbide and binder phase evolve accordingly with the dissolution of Mo2C
and WC. When Mo2C dissolves in both phases, the lattice parameter of the niobium-rich carbide phase
decreases, while the lattice parameter of the nickel-rich phase increases. It can be explained by a
difference of atomic radius. Indeed, the atomic radius of molybdenum (190 pm) is smaller than the
atomic radius of niobium (198 pm) but bigger than the atomic radius of nickel (149 pm) [74]. When WC
dissolves preferentially in the binder, it contributes to the increase of the binder lattice parameter as the
atomic radius of tungsten is 193 pm [74]. This is confirmed by the evolution of these lattice parameters
with the sintering temperature. Between 1080°C and 1180°C, the lattice parameter of the Ni-rich phase
significantly increases and remains virtually constant above 1180°C. On the contrary, the lattice
parameter of the NbC-rich phase decreases mainly above 1180°C. This delay can be explained by the
slower diffusion kinetic of Mo and W in NbC than in Ni.
As it was previously observed (see part III & IV), the spreading of the binder and solid state sintering
start when the Nb/Mo/W oxides are reduced. A delay of densification is however observed for samples
with Mo2C additions. For those samples, solid state sintering significantly accelerates as soon as
secondary carbides are dissolved. Mo2C inclusions may exert local tensile stresses on the surrounding
NbC particles, which prevent shrinkage of the NbC skeleton undergoing solid state sintering [81].
Another explanation could be that the formation of mixed Nb/Mo secondary carbides leads to an
increase of the interfacial energy and thus to a less favorable wetting of the carbides and to a less efficient
solid state sintering. This would be consistent with the contiguity measurements discussed above. The
apparent slight delay of liquid phase sintering could be a consequence of this, as solid state sintering is

V. Effect of Mo2C addition in NbC-0.5vol%WC-12vol%Ni
119
not finished when the liquid forms. Liquid phase sintering is thereafter more active and densification is
at the end almost complete.
A nickel segregation is visible at grain boundaries. Ni grain boundary segregation could have the same
effect at NbC grain boundaries as Co segregation at WC grain boundaries. It could decrease their energy
and prevent their complete infiltration during sintering [82].
Binder inclusions and holes are observed inside the grains. This is usually the sign of a bad carbide-
binder wettability (see part I.C.1.c) and is unexpected as the NbC-Ni wettability is rather good (see
Table I-2). The initial heterogeneity of the powder mixes, with Ni-rich agglomerates, could explain the
formation of these pores/inclusions. A local lack of nickel during solid state sintering could lead to the
coalescence of NbC clusters by grain boundary migration, entrapping pores or solid binder inclusions.
The grain size of the sintered material is significantly reduced when adding Mo2C. A slight molybdenum
segregation was detected by TEM-EDS, which could indicate a grain growth inhibition by a decrease of
either the grain boundary mobility or the grain boundary energy due to this segregation. However, the
measured segregation is very low and not systematic in grain boundaries. The effect of Mo2C on grain
growth will be further investigated in chapter VI.
When adding Mo2C, the hardness increases while the toughness decreases, which can be explained by
the carbide grain size variations and by the higher solute content in the binder.

V. Effect of Mo2C addition in NbC-0.5vol%WC-12vol%Ni
120
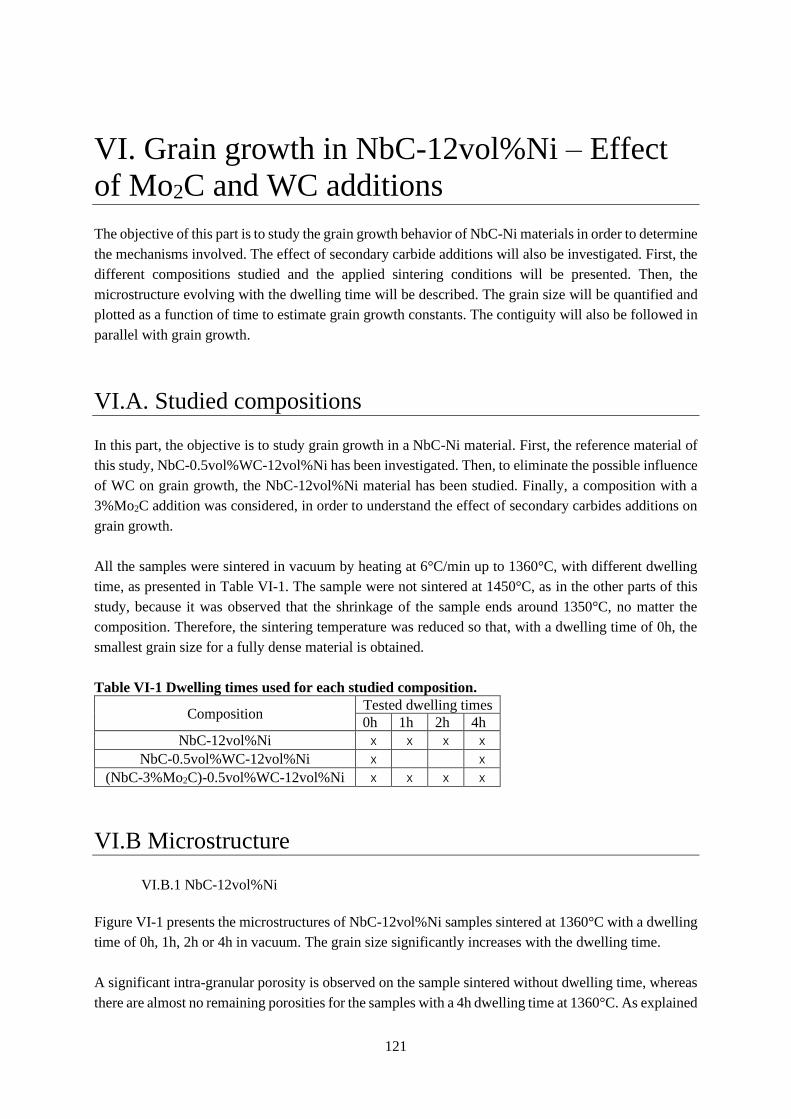
121
VI. Grain growth in NbC-12vol%Ni – Effect
of Mo2C and WC additions
The objective of this part is to study the grain growth behavior of NbC-Ni materials in order to determine
the mechanisms involved. The effect of secondary carbide additions will also be investigated. First, the
different compositions studied and the applied sintering conditions will be presented. Then, the
microstructure evolving with the dwelling time will be described. The grain size will be quantified and
plotted as a function of time to estimate grain growth constants. The contiguity will also be followed in
parallel with grain growth.
VI.A. Studied compositions
In this part, the objective is to study grain growth in a NbC-Ni material. First, the reference material of
this study, NbC-0.5vol%WC-12vol%Ni has been investigated. Then, to eliminate the possible influence
of WC on grain growth, the NbC-12vol%Ni material has been studied. Finally, a composition with a
3%Mo2C addition was considered, in order to understand the effect of secondary carbides additions on
grain growth.
All the samples were sintered in vacuum by heating at 6°C/min up to 1360°C, with different dwelling
time, as presented in Table VI-1. The sample were not sintered at 1450°C, as in the other parts of this
study, because it was observed that the shrinkage of the sample ends around 1350°C, no matter the
composition. Therefore, the sintering temperature was reduced so that, with a dwelling time of 0h, the
smallest grain size for a fully dense material is obtained.
Table VI-1 Dwelling times used for each studied composition.
Composition Tested dwelling times
0h 1h 2h 4h
NbC-12vol%Ni x x x x
NbC-0.5vol%WC-12vol%Ni x x
(NbC-3%Mo2C)-0.5vol%WC-12vol%Ni x x x x
VI.B Microstructure
VI.B.1 NbC-12vol%Ni
Figure VI-1 presents the microstructures of NbC-12vol%Ni samples sintered at 1360°C with a dwelling
time of 0h, 1h, 2h or 4h in vacuum. The grain size significantly increases with the dwelling time.
A significant intra-granular porosity is observed on the sample sintered without dwelling time, whereas
there are almost no remaining porosities for the samples with a 4h dwelling time at 1360°C. As explained
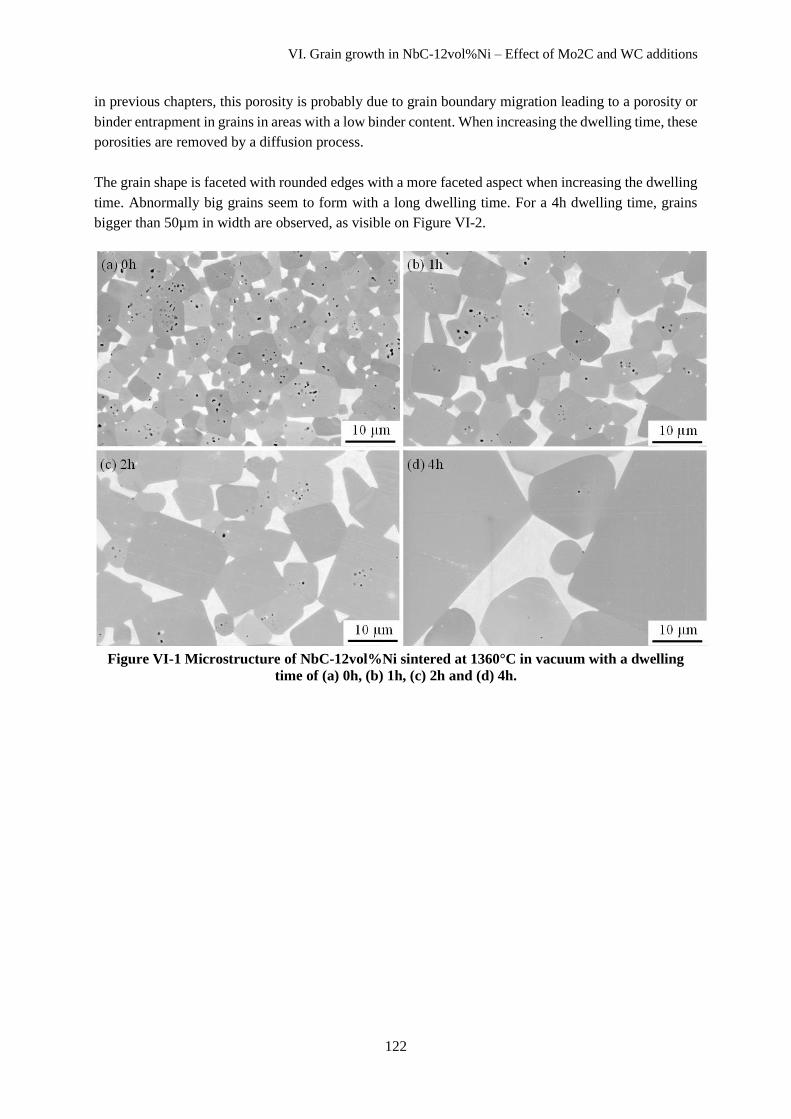
VI. Grain growth in NbC-12vol%Ni – Effect of Mo2C and WC additions
122
in previous chapters, this porosity is probably due to grain boundary migration leading to a porosity or
binder entrapment in grains in areas with a low binder content. When increasing the dwelling time, these
porosities are removed by a diffusion process.
The grain shape is faceted with rounded edges with a more faceted aspect when increasing the dwelling
time. Abnormally big grains seem to form with a long dwelling time. For a 4h dwelling time, grains
bigger than 50µm in width are observed, as visible on Figure VI-2.
Figure VI-1 Microstructure of NbC-12vol%Ni sintered at 1360°C in vacuum with a dwelling
time of (a) 0h, (b) 1h, (c) 2h and (d) 4h.
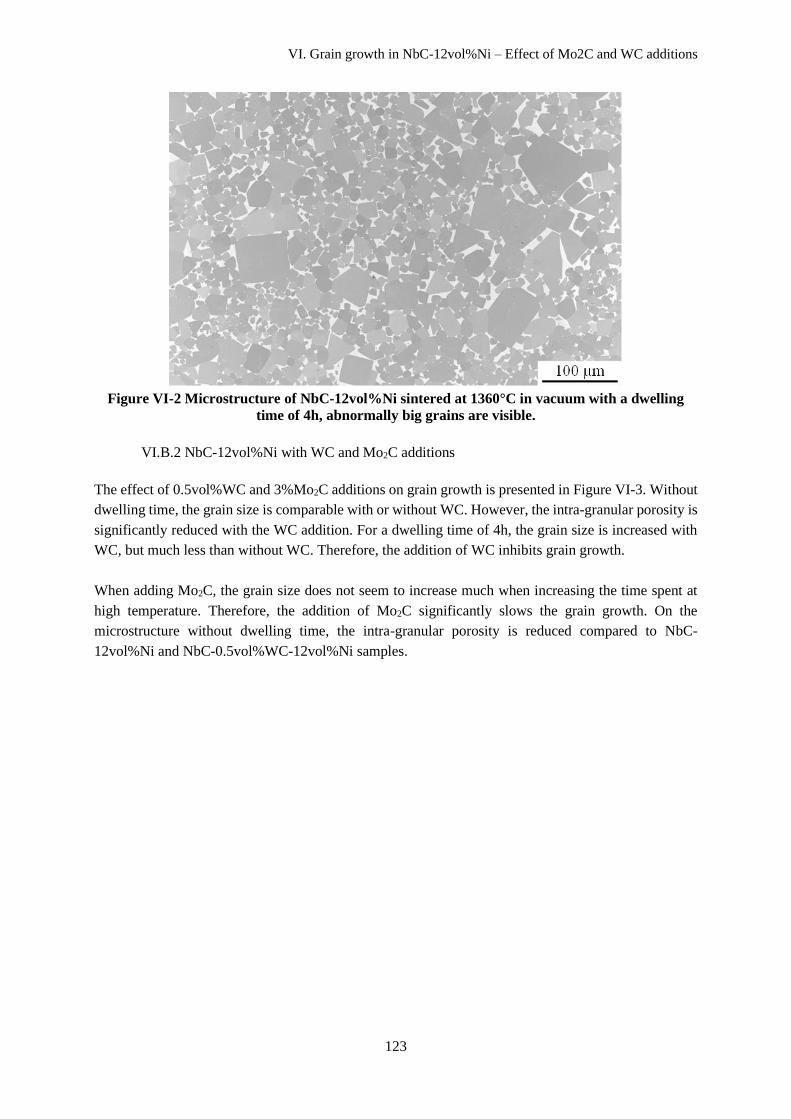
VI. Grain growth in NbC-12vol%Ni – Effect of Mo2C and WC additions
123
Figure VI-2 Microstructure of NbC-12vol%Ni sintered at 1360°C in vacuum with a dwelling
time of 4h, abnormally big grains are visible.
VI.B.2 NbC-12vol%Ni with WC and Mo2C additions
The effect of 0.5vol%WC and 3%Mo2C additions on grain growth is presented in Figure VI-3. Without
dwelling time, the grain size is comparable with or without WC. However, the intra-granular porosity is
significantly reduced with the WC addition. For a dwelling time of 4h, the grain size is increased with
WC, but much less than without WC. Therefore, the addition of WC inhibits grain growth.
When adding Mo2C, the grain size does not seem to increase much when increasing the time spent at
high temperature. Therefore, the addition of Mo2C significantly slows the grain growth. On the
microstructure without dwelling time, the intra-granular porosity is reduced compared to NbC-
12vol%Ni and NbC-0.5vol%WC-12vol%Ni samples.

VI. Grain growth in NbC-12vol%Ni – Effect of Mo2C and WC additions
124
Figure VI-3 Microstructure of NbC-12vol%Ni, NbC-0.5vol%WC-12vol%Ni and NbC-
0.5vol%WC-12vol%Ni with 3%Mo2C samples sintered at 1360°C in vacuum with a dwelling
time of 0h and 4h.
VI.C Evolution of grain size
VI.C.1 NbC-12vol%Ni
EBSD measurements were performed on the samples in order to quantify the grain size. An example of
map obtained for samples with a 0h, 1h, 2h or 4h dwelling time is presented in Figure VI-4.
(e) WC & Mo2C, 0h
10 µm
(f) WC & Mo2C, 4h
10 µm
(c) WC, 0h
10 µm
(d) WC, 4h
10 µm
(a) 0h
10 µm
(a) 0h
10 µm
(d) 4h
10 µm
(b) 4h
10 µm

VI. Grain growth in NbC-12vol%Ni – Effect of Mo2C and WC additions
125
Figure VI-4 Orientation images with grain boundaries of NbC-12vol%Ni samples sintered at
1360°C in vacuum with a dwelling time of 0h, 1h, 2h and 4h obtained by EBSD.
The grain size quantification in 2D for NbC-12vol%Ni samples sintered at 1360°C with different
dwelling times is presented in Figure VI-5 and the resulting parameters are presented in Table VI-2.
The grain size increases significantly with the dwelling time, from an average particle diameter of 2.9
µm for 0h to 12.8 µm for 4h. The reduced grain size distribution of Figure VI-5 (d) becomes broader,
with a shift of the peak towards smaller size and an increase of the fraction of large grains with time.
This is also shown by the ratio σ �̅�⁄ which increases with the dwelling time. Therefore, grain growth
cannot be qualified as normal and the microstructures do not evolve in a homothetic way.

VI. Grain growth in NbC-12vol%Ni – Effect of Mo2C and WC additions
126
Figure VI-5 NbC grain size analysis from EBSD measurements on NbC-12vol%Ni samples with
different dwelling times sintered at 1360°C in vacuum, (a) Relative frequency of equivalent 2D
diameter (µm), (b) Cumulated frequency of equivalent 2D diameter (µm), (c) Average diameter,
D10 and D90 values (µm), (d) Density of distribution of the reduced grain size (ratio of the 2D
equivalent diameter on the average 2D equivalent diameter).
Table VI-2 Key parameters resulting from the EBSD quantitative study of NbC-12vol%Ni-
compacts sintered at 1360°C with a dwelling time of 0h, 1h, 2h or 4h in vacuum.
Dwelling time (h) Average diameter �̅� (µm) Standard deviation σ (µm) σ �̅�⁄ d10 (µm) d90 (µm)
0 2.9 1.3 0.45 0.9 4.3
1 4.2 2.1 0.50 1.6 7.0
2 6.4 3.6 0.56 3.1 10.5
4 12.8 8.0 0.63 5.9 22
The 3D grain size distribution was reconstructed with the method described in Appendix 5 and is
presented in Figure VI-6 with the resulting parameters in Table VI-3. As for the 2D distributions, the
grain size increases significantly with the dwelling time, from 3.5 µm for 0h to 13.5 µm for 4h in
average. The reduced grain size distribution of Figure VI-6 (d) seems to become broader, with a shift of
the peak towards smaller size and an increase of the fraction of large grains, as for the 2D distribution.
However, this evolution is not as marked as for the 2D distribution. When selecting a 2D section of a
3D distribution, there is indeed a stronger chance to cut big grains than small grains, therefore enhancing
the shift of the reduced grain size distribution. The ratio σ �̅�⁄ also increases with the dwelling time.
Therefore, grain growth cannot be qualified as normal and the microstructures do not evolve in a
homothetic way.

VI. Grain growth in NbC-12vol%Ni – Effect of Mo2C and WC additions
127
Figure VI-6 3D NbC grain size estimation from EBSD measurements on NbC-12vol%Ni samples
with different dwelling time sintered at 1360°C in vacuum, (a) Relative frequency of equivalent
3D diameter (µm), (b) Cumulated frequency of equivalent 3D diameter (µm), (c) Average
diameter, D10 and D90 values (µm), (d) Density of distribution of the reduced grain size (ratio of
the 3D equivalent diameter on the average 3D equivalent diameter).
Table VI-3 3D Key parameters resulting from the EBSD quantitative study of NbC-12vol%Ni-
compacts sintered at 1360°C with a dwelling time of 0h, 1h, 2h or 4h in vacuum.
Dwelling time (h) Average diameter �̅� (µm) Standard deviation σ (µm) σ �̅�⁄ d10 (µm) d90 (µm)
0 3.5 1.2 0.34 1.5 4.8
1 4.8 1.8 0.38 2.5 6.8
2 7.0 3.1 0.44 3.5 9.9
4 13.5 6.3 0.47 6.0 20
VI.C.2 NbC-12vol%Ni with WC and Mo2C additions
The grain size distribution of NbC-0.5vol%WC-12vol%Ni and NbC-0.5vol%WC-12vol%Ni with 3%Mo2C
sintered at 1360°C with a dwelling time of 4h was quantified on EBSD maps (see Figure VI-7 and Figure
VI-8) and the results are presented in Figure VI-9 and Table VI-4.
When adding a small quantity of WC, the grain growth is significantly inhibited, with a final average grain
size of 3.7 µm instead of 12.8 µm. When adding 3%Mo2C to this composition, the final average grain size is
further reduced to 2.9 µm. Therefore, a small addition of secondary carbide, such as 0.5%WC, can already
significantly limit the grain growth.
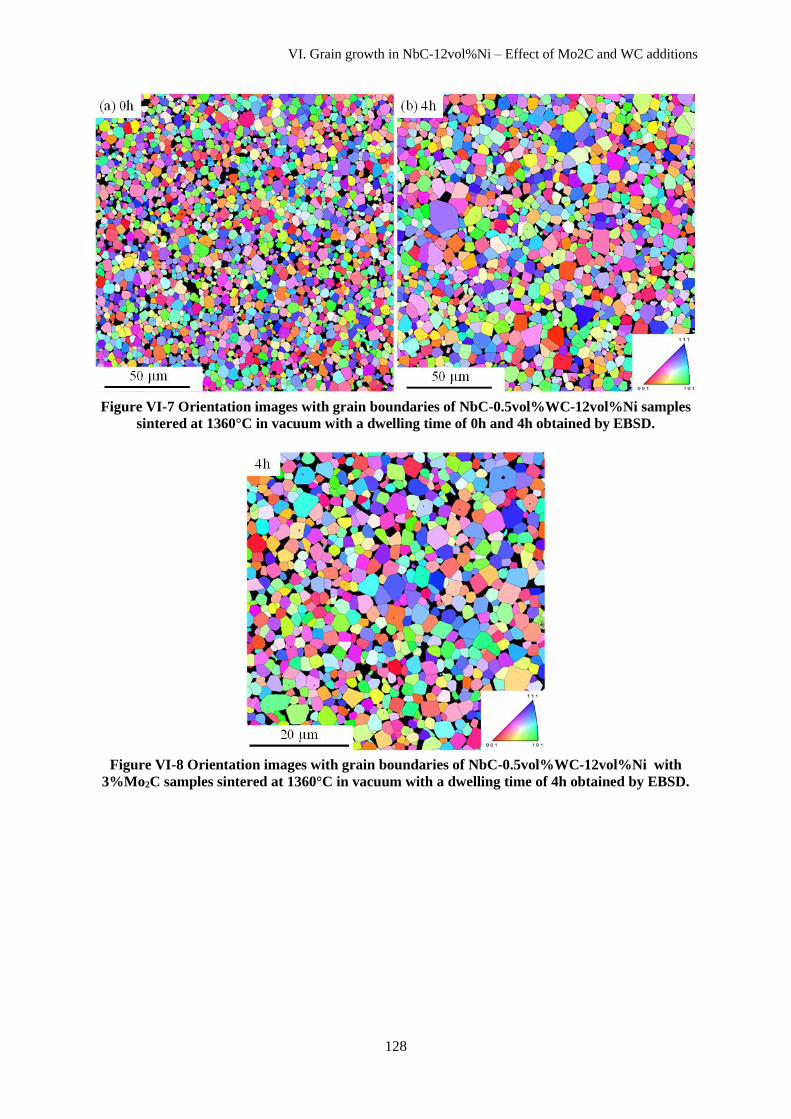
VI. Grain growth in NbC-12vol%Ni – Effect of Mo2C and WC additions
128
Figure VI-7 Orientation images with grain boundaries of NbC-0.5vol%WC-12vol%Ni samples
sintered at 1360°C in vacuum with a dwelling time of 0h and 4h obtained by EBSD.
Figure VI-8 Orientation images with grain boundaries of NbC-0.5vol%WC-12vol%Ni with
3%Mo2C samples sintered at 1360°C in vacuum with a dwelling time of 4h obtained by EBSD.
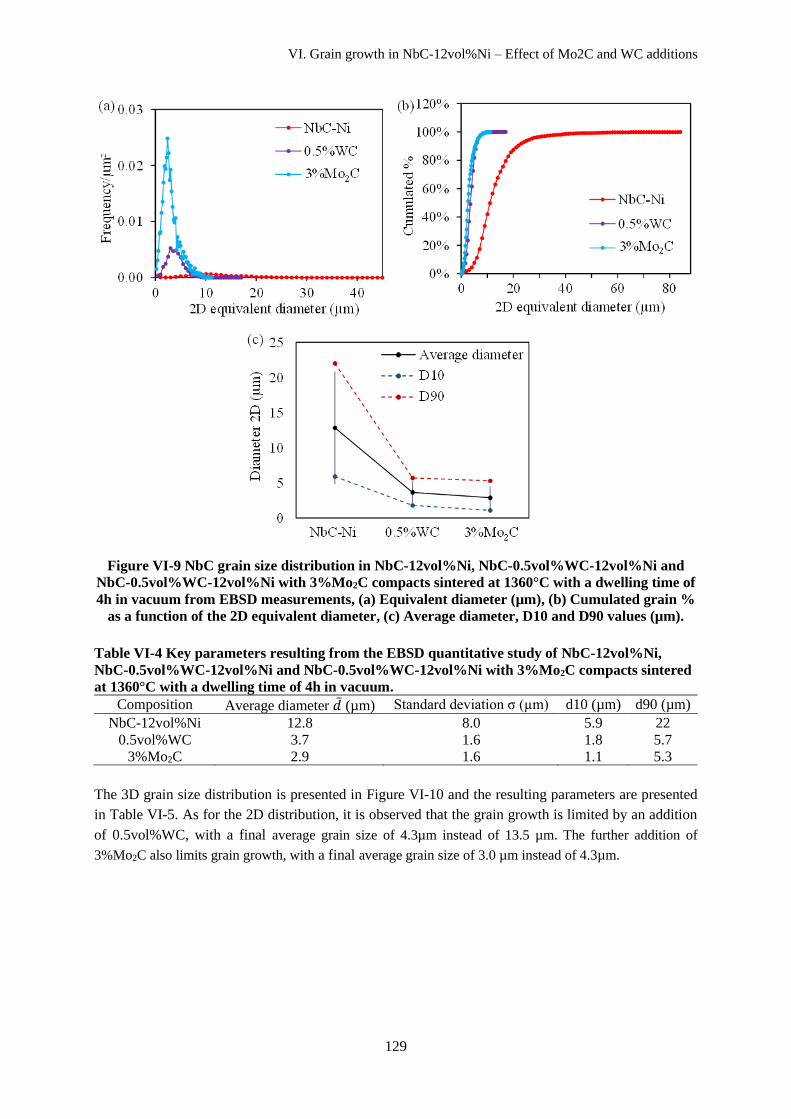
VI. Grain growth in NbC-12vol%Ni – Effect of Mo2C and WC additions
129
Figure VI-9 NbC grain size distribution in NbC-12vol%Ni, NbC-0.5vol%WC-12vol%Ni and
NbC-0.5vol%WC-12vol%Ni with 3%Mo2C compacts sintered at 1360°C with a dwelling time of
4h in vacuum from EBSD measurements, (a) Equivalent diameter (µm), (b) Cumulated grain %
as a function of the 2D equivalent diameter, (c) Average diameter, D10 and D90 values (µm).
Table VI-4 Key parameters resulting from the EBSD quantitative study of NbC-12vol%Ni,
NbC-0.5vol%WC-12vol%Ni and NbC-0.5vol%WC-12vol%Ni with 3%Mo2C compacts sintered
at 1360°C with a dwelling time of 4h in vacuum.
Composition Average diameter �̅� (µm) Standard deviation σ (µm) d10 (µm) d90 (µm)
NbC-12vol%Ni 12.8 8.0 5.9 22
0.5vol%WC 3.7 1.6 1.8 5.7
3%Mo2C 2.9 1.6 1.1 5.3
The 3D grain size distribution is presented in Figure VI-10 and the resulting parameters are presented
in Table VI-5. As for the 2D distribution, it is observed that the grain growth is limited by an addition
of 0.5vol%WC, with a final average grain size of 4.3µm instead of 13.5 µm. The further addition of
3%Mo2C also limits grain growth, with a final average grain size of 3.0 µm instead of 4.3µm.
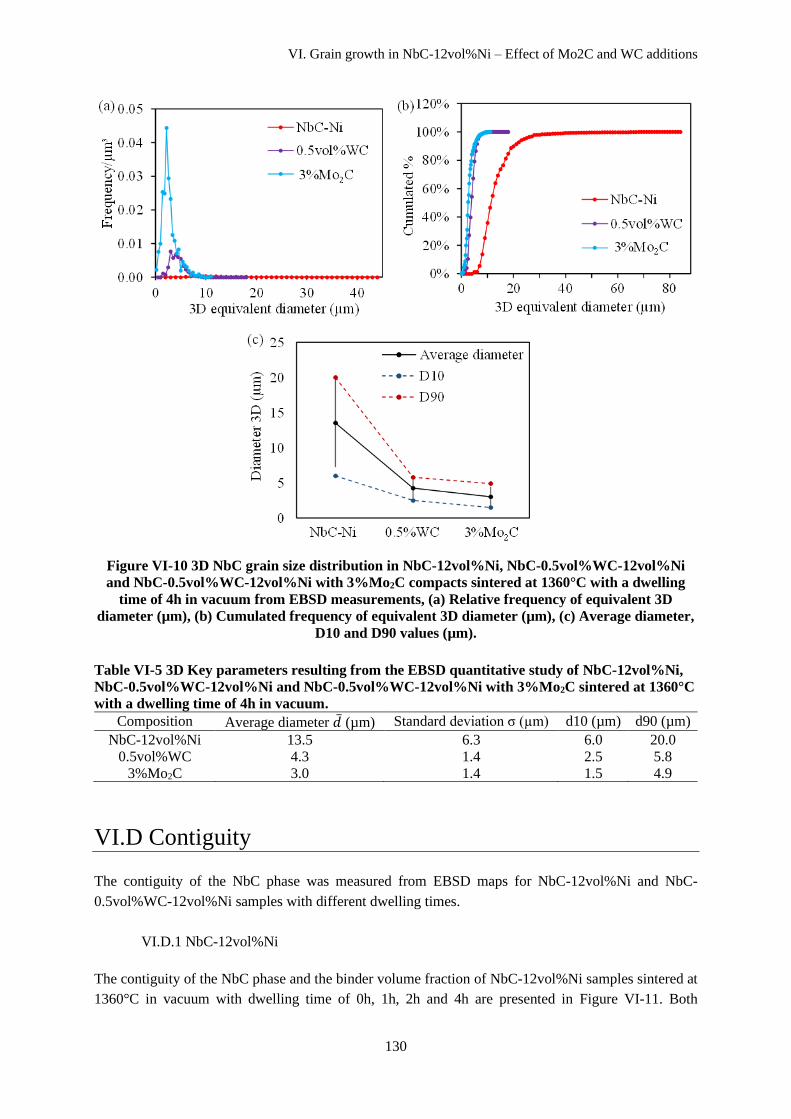
VI. Grain growth in NbC-12vol%Ni – Effect of Mo2C and WC additions
130
Figure VI-10 3D NbC grain size distribution in NbC-12vol%Ni, NbC-0.5vol%WC-12vol%Ni
and NbC-0.5vol%WC-12vol%Ni with 3%Mo2C compacts sintered at 1360°C with a dwelling
time of 4h in vacuum from EBSD measurements, (a) Relative frequency of equivalent 3D
diameter (µm), (b) Cumulated frequency of equivalent 3D diameter (µm), (c) Average diameter,
D10 and D90 values (µm).
Table VI-5 3D Key parameters resulting from the EBSD quantitative study of NbC-12vol%Ni,
NbC-0.5vol%WC-12vol%Ni and NbC-0.5vol%WC-12vol%Ni with 3%Mo2C sintered at 1360°C
with a dwelling time of 4h in vacuum.
Composition Average diameter �̅� (µm) Standard deviation σ (µm) d10 (µm) d90 (µm)
NbC-12vol%Ni 13.5 6.3 6.0 20.0
0.5vol%WC 4.3 1.4 2.5 5.8
3%Mo2C 3.0 1.4 1.5 4.9
VI.D Contiguity
The contiguity of the NbC phase was measured from EBSD maps for NbC-12vol%Ni and NbC-
0.5vol%WC-12vol%Ni samples with different dwelling times.
VI.D.1 NbC-12vol%Ni
The contiguity of the NbC phase and the binder volume fraction of NbC-12vol%Ni samples sintered at
1360°C in vacuum with dwelling time of 0h, 1h, 2h and 4h are presented in Figure VI-11. Both
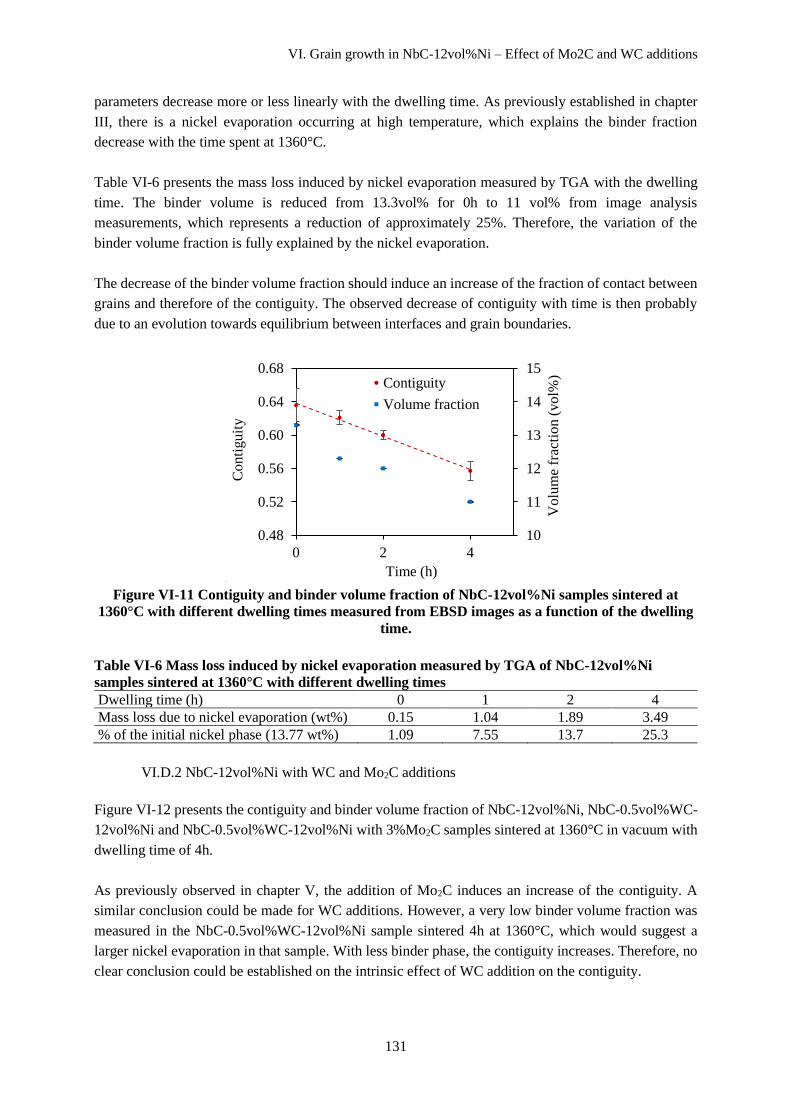
VI. Grain growth in NbC-12vol%Ni – Effect of Mo2C and WC additions
131
parameters decrease more or less linearly with the dwelling time. As previously established in chapter
III, there is a nickel evaporation occurring at high temperature, which explains the binder fraction
decrease with the time spent at 1360°C.
Table VI-6 presents the mass loss induced by nickel evaporation measured by TGA with the dwelling
time. The binder volume is reduced from 13.3vol% for 0h to 11 vol% from image analysis
measurements, which represents a reduction of approximately 25%. Therefore, the variation of the
binder volume fraction is fully explained by the nickel evaporation.
The decrease of the binder volume fraction should induce an increase of the fraction of contact between
grains and therefore of the contiguity. The observed decrease of contiguity with time is then probably
due to an evolution towards equilibrium between interfaces and grain boundaries.
Figure VI-11 Contiguity and binder volume fraction of NbC-12vol%Ni samples sintered at
1360°C with different dwelling times measured from EBSD images as a function of the dwelling
time.
Table VI-6 Mass loss induced by nickel evaporation measured by TGA of NbC-12vol%Ni
samples sintered at 1360°C with different dwelling times
Dwelling time (h) 0 1 2 4
Mass loss due to nickel evaporation (wt%) 0.15 1.04 1.89 3.49
% of the initial nickel phase (13.77 wt%) 1.09 7.55 13.7 25.3
VI.D.2 NbC-12vol%Ni with WC and Mo2C additions
Figure VI-12 presents the contiguity and binder volume fraction of NbC-12vol%Ni, NbC-0.5vol%WC-
12vol%Ni and NbC-0.5vol%WC-12vol%Ni with 3%Mo2C samples sintered at 1360°C in vacuum with
dwelling time of 4h.
As previously observed in chapter V, the addition of Mo2C induces an increase of the contiguity. A
similar conclusion could be made for WC additions. However, a very low binder volume fraction was
measured in the NbC-0.5vol%WC-12vol%Ni sample sintered 4h at 1360°C, which would suggest a
larger nickel evaporation in that sample. With less binder phase, the contiguity increases. Therefore, no
clear conclusion could be established on the intrinsic effect of WC addition on the contiguity.
10
11
12
13
14
15
0.48
0.52
0.56
0.60
0.64
0.68
0 2 4V
olu
me
frac
tion
(vol%
)
Conti
guit
y
Time (h)
Contiguity
Volume fraction

VI. Grain growth in NbC-12vol%Ni – Effect of Mo2C and WC additions
132
Figure VI-12 Contiguity and binder volume fraction of NbC-12vol%Ni, NbC-0.5vol%WC-
12vol%Ni and NbC-0.5vol%WC-12vol%Ni with 3%Mo2C samples sintered at 1360°C with a 4h
dwelling time measured from EBSD images.
VI.E Discussion
This chapter aims to study the grain growth as a function of the dwelling time and the effect of additions
of WC and Mo2C on grain growth. No matter the studied composition or the dwelling time, the 2D and
3D distribution show similar tendency.
The grain size is significantly increased when increasing the dwelling time. The reduced grain size
distribution becomes slightly broader with dwelling time, with a shift of the peak towards smaller size
and an increase of the fraction of large grains. This suggest that grain growth is not normal, as the grain
size distribution does not remain self-similar with time. To deepen this analysis, theoretical calculations
will be performed to investigate the grain growth mechanism in part VI.E.1.
The contiguity decreases with the dwelling time. This may look surprising, as the nickel evaporation,
identified by measuring the binder volume fraction, would imply an increase of the contiguity. This
increase is then more than compensated by a decrease, due to an evolution towards equilibrium between
phase boundaries and grain boundaries, at the advantage of phase boundaries. Indeed, a decrease of the
interface energy is expected at the melting point, due first to the relaxation of elastic stresses at the
interface and second to the better chemical affinity with the liquid in relation with the higher solubility
of solid atoms in the liquid. This decrease can be as high as 30-50% for metallic systems with eutectic
liquids [83]. Therefore there is a natural trend for the liquid to infiltrate the grain boundaries created in
the solid state and contiguity usually tends to decrease with time during liquid phase sintering, as
observed by many authors on different cemented carbides [8][84][85][86].
The grain size is significantly reduced when adding only 0.5vol%WC to the NbC-12vol%Ni
composition. It is further reduced when adding Mo2C to the composition. The mechanisms responsible
for this effect will be discussed in part VI.E.2.
VI.E.1 Grain growth mechanisms in NbC-12vol%Ni

VI. Grain growth in NbC-12vol%Ni – Effect of Mo2C and WC additions
133
In order to determine the mechanism responsible for grain growth (see part I.C.1.a), the variation of �̅�2
and �̅�3 with the dwelling time was drawn , �̅� being the mean particle radius estimated from the 3D grain
size distribution. The objective is to identify a linear behavior, following formulas (VI-1) and (VI-2)
which respectively describe a grain growth controlled by diffusion in the liquid or by interfacial reaction,
in the framework of the LSW theory of normal grain growth by solution-precipitation (see I.C.1).
�̅�3 − �̅�03 = 𝐾𝐷𝑡 (VI-1)
�̅�2 − �̅�02 = 𝐾𝑅𝑡 (VI-2)
where �̅� is the mean particle radius after time t; �̅�0 is the initial mean particle radius; KD and KR are the
characteristic grain growth constants for diffusion and reaction-controlled grain growth respectively.
The results are presented in Figure VI-13. There is no linear evolution of those parameters with time.
Therefore, the theory of normal grain growth controlled by diffusion in the liquid or by interfacial
reaction is not adapted to this system. The non-self-similar evolution of the grain size distribution (see
Figure VI-5 (d) and Figure VI-6 (d)) also confirms this point.
Figure VI-13 Evolution of the (a) square and (b) cube mean radius of NbC-12vol%Ni samples
sintered at 1360°C in vacuum as a function of the dwelling time.
It is however interesting to compare the order of magnitude of our experimental growth rate to the
theoretical predictions of the LSW theory for diffusion. The grain growth constant KD can actually be
recalculated for each dwelling time with formula (VI-3). The used data and resulting constant are
presented in Table VI-7.
𝐾𝐷 =8𝛾𝑠𝑙Ω²
9𝑅𝑇𝐷𝐶0 (VI-3)
where T is the temperature; R is the gas constant ; Ω is the molar volume of the solid; 𝛾𝑠𝑙 is the interfacial
energy per unit area of the solid/liquid interface; D is the diffusion coefficient of the solid phase
constituent in the liquid; CO is the solubility of the solid in the liquid (at a planar interface).
The corrected grain growth constant K”, which takes into account the effect of the contiguity and binder
volume fraction on grain growth (see part I.C.1), can also be calculated as both these parameters are
known with formula (VI-4). The used data and resulting constants are presented in Table VI-8.
0
50
100
150
200
250
300
0 1 2 3 4 5
r3
Time (h)
0
10
20
30
40
50
0 1 2 3 4 5
r2
Time (h)
(a) (b)
𝑟2 𝑟3

VI. Grain growth in NbC-12vol%Ni – Effect of Mo2C and WC additions
134
𝐾𝐷" = (1 − 𝐶)
9
4𝐾(𝑓𝑣)𝐾𝐷 (VI-4)
Where C is the contiguity and K(fv) is a corrective term depending on the binder volume fraction fv
estimated by Voorhees [54] (see Figure I-25).
Table VI-7 Parameters for 𝑲𝑫 grain growth constant calculation for NbC-12vol%Ni samples
sintered at 1360°C in vacuum.
Parameters 𝛾𝑠𝑙 Ω R T D C0
Value 0.27 13.42 8.314 1633 3 10-9 5.1 103
Unit J/m2 cm3/mol J/mol/K K m²/s mol/m3
Source [6] - - - [87] [29]
Table VI-8 𝑲𝑫 and 𝑲𝑫
" grain growth constant calculation for NbC-12vol%Ni samples
Dwelling time (h) Contiguity Binder volume fraction fv K(fv) 𝐾𝐷 (µm3/s) 𝐾𝐷
" (µm3/s)
0 0.636 0.133 3.40
0.049
0.14
1 0.621 0.123 3.58 0.15
2 0.600 0.120 3.60 0.16
4 0.557 0.110 3.70 0.18
The theoretical growth rate (volume growth rate) corresponding to the grain growth constant 𝐾𝑑" = 0.14
µm3/s at 0h is presented in Figure VI-14. The experimental volume growth rate is slower by about one
order of magnitude than the theoretical growth rate for diffusion-limited kinetics. This means that
another mechanism than diffusion slows down the growth kinetics.
Figure VI-14 Evolution of the cube mean radius of NbC-12vol%Ni samples sintered at 1360°C in
vacuum as a function of the dwelling time and comparison of the average experimental volumic
growth rate �̅�𝒆𝒙𝒑 with the theoretical constant 𝑲𝑫" (see Table VI-8).
It was previously established by Warren [6][8] that grain growth kinetics in NbC-20vol%Ni and NbC-
20vol%Co materials follows a �̅�3 = K t law with an experimental growth rate constant which is about
twice smaller than the theoretical one. This slight discrepancy on the growth rate constant is not enough
to discard the diffusion-controlled process, due to imprecision on the physical parameters, especially the
diffusion coefficients and solubilities. However, in the complete analysis of grain growth mechanisms
for various cemented carbides [8], Warren concluded that only the grain growth in VC-Co and Mo2C-

VI. Grain growth in NbC-12vol%Ni – Effect of Mo2C and WC additions
135
Co alloys were fully consistent with a diffusion-controlled process. For TiC, HfC and WC based
cemented carbides, another mechanism should take place which slows down the kinetics. And the NbC-
Co and TaC-Co systems would be at the transition where diffusion still mostly controls grain growth
kinetics. Following their conclusion, in our alloys with 12vol% binder phase and similar grain sizes,
diffusion distances are smaller and diffusion kinetics are then more rapid, especially at short times,
which could explain that our experimental growth rate constant is an order of magnitude smaller than
the theoretical value calculated with the diffusion process. Moreover, Warren compares the grain growth
behaviours for the different cemented carbides in a diagram showing the growth rate constants as a
function of the contiguity (see Fig I-24 in chapter I). The systems where diffusion controls the kinetics
have the lowest contiguity, whereas the systems where another mechanism slows down the kinetics have
the highest contiguity, NbC-Co being at the transition. Again, following Warren analysis, contiguity
may slow down grain growth and this may be more pronounced in our system with 12vol% binder than
in his experiments with 20vol% binder.
As the contiguity increases, the fraction of phase boundaries available for precipitation is reduced, but
this is already taken into account in the theoretical formula VI-4. However, as suggested by Warren, for
systems with high contiguity values, grain growth kinetics can be modified or controlled by the
migration of grain boundaries rather than phase boundaries.
The kinetics could then significantly slow down with the increase of contiguity and this may even be
more pronounced at the transition between the phase boundary-controlled process to the grain boundary-
controlled process. Inversely, infiltration of grain boundaries at the beginning of liquid phase sintering,
as quantified by the reduction of contiguity with the sintering time, could reduce the amount of grain
boundaries and explain that grain growth kinetics are enhanced (see Figure VI-14), in addition to the
increase of the fraction of phase boundaries available for precipitation (term (1-C) in formula VI-4).
In the NbC-12vol%Ni samples, curved grain boundaries and partial engulfment of grains were observed,
as presented in Figure VI-15, which confirms that grain boundary migration is not rapid in the system
and could at least compete with phase boundary migration. The fastest migration of carbide-binder
interfaces in comparison with grain boundaries can be observed, as in the example of Figure VI-16.

VI. Grain growth in NbC-12vol%Ni – Effect of Mo2C and WC additions
136
Figure VI-15 Curved grain boundaries and partial grain engulfment observed on EBSD
orientation & quality maps of NbC-12vol%Ni samples sintered at 1360°C in vacuum with
different dwelling times.
Figure VI-16 Curved grain boundaries of a NbC-12vol%Ni sample sintered 1h at 1360°C in
vacuum. The relative rate of grain boundary and phase boundary migration is indicated by red
arrows.
10 µm
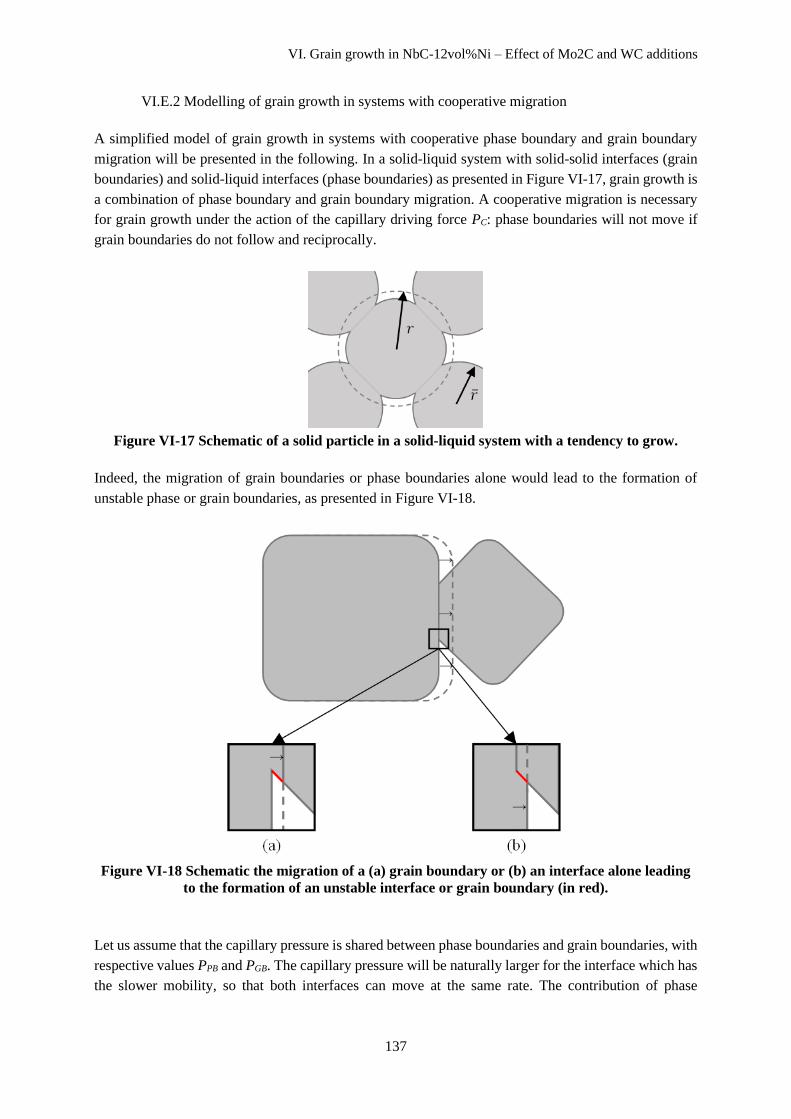
VI. Grain growth in NbC-12vol%Ni – Effect of Mo2C and WC additions
137
VI.E.2 Modelling of grain growth in systems with cooperative migration
A simplified model of grain growth in systems with cooperative phase boundary and grain boundary
migration will be presented in the following. In a solid-liquid system with solid-solid interfaces (grain
boundaries) and solid-liquid interfaces (phase boundaries) as presented in Figure VI-17, grain growth is
a combination of phase boundary and grain boundary migration. A cooperative migration is necessary
for grain growth under the action of the capillary driving force PC: phase boundaries will not move if
grain boundaries do not follow and reciprocally.
Figure VI-17 Schematic of a solid particle in a solid-liquid system with a tendency to grow.
Indeed, the migration of grain boundaries or phase boundaries alone would lead to the formation of
unstable phase or grain boundaries, as presented in Figure VI-18.
Figure VI-18 Schematic the migration of a (a) grain boundary or (b) an interface alone leading
to the formation of an unstable interface or grain boundary (in red).
Let us assume that the capillary pressure is shared between phase boundaries and grain boundaries, with
respective values PPB and PGB. The capillary pressure will be naturally larger for the interface which has
the slower mobility, so that both interfaces can move at the same rate. The contribution of phase

VI. Grain growth in NbC-12vol%Ni – Effect of Mo2C and WC additions
138
boundaries and grain boundaries to grain growth kinetics is then related to the corresponding driving
force and to the respective mobilities MPB and MGB (see formulas (VI-5) and (VI-6)).
(𝑑𝑟
𝑑𝑡)𝑃𝐵
= 𝑀𝑃𝐵𝑃𝑃𝐵 (VI-5)
(𝑑𝑟
𝑑𝑡)𝐺𝐵
= 𝑀𝐺𝐵𝑃𝐺𝐵 (VI-6)
The total capillary pressure PC is the average of the pressure on phase boundaries PPB and grain
boundaries PGB, weighted by the proportion of grain boundaries with respect to the phase boundaries,
i.e. the contiguity C, as presented in formula (VI-7).
𝑃𝑐 = 𝑃𝑃𝐵 (1 − 𝐶) + 𝑃𝐺𝐵 𝐶 (VI-7)
By combining (VI-5), (VI-6) and (VI-7), formula (VI-8) is obtained.
𝑃𝐶 =
(1 − 𝐶)
𝑀𝑃𝐵(𝑑𝑟
𝑑𝑡)𝑃𝐵
+ 𝐶
𝑀𝐺𝐵(𝑑𝑟
𝑑𝑡)𝐺𝐵
(VI-8)
In stationary conditions, (𝑑𝑟
𝑑𝑡)𝑃𝐵
should equal (𝑑𝑟
𝑑𝑡)𝐺𝐵
, from which it follows that the resulting grain
growth rate is related to the grain growth rates of each mechanism by formula (VI-9).
1
(𝑑𝑟𝑑𝑡)=
(1 − 𝐶)
𝑀𝑃𝐵 𝑃𝐶+
𝐶
𝑀𝐺𝐵 𝑃𝐶=
(1 − 𝐶)
(𝑑𝑟𝑑𝑡)𝑃𝐵
∗ + 𝐶
(𝑑𝑟𝑑𝑡)𝐺𝐵
∗ (VI-9)
where (𝑑𝑟
𝑑𝑡)𝑃𝐵
∗ and (
𝑑𝑟
𝑑𝑡)𝐺𝐵
∗ are the grain growth rates in the case of phase boundary control and grain
boundary control respectively.
Note: PC is an average capillary pressure, taking into account the contribution of phase boundaries and
grain boundaries. In the following limiting case, the capillary pressure is for systems with phase
boundaries only or grain boundaries only. It will be assumed that the capillary pressure is then not
significantly modified, since phase boundary and grain boundary energies have a similar order of
magnitude. A general expression of the capillary pressure can be found in [72].
This formula can be assimilated to the “loi des lenteurs” [88] in kinetics for mechanisms sharing the
same driving force. It means that the slowest mechanism will impose its kinetics for the migration of
both interfaces.
If phase boundary migration is the slowest mechanism, formula (VI-10) applies.
𝑑𝑟
𝑑𝑡=
1
1 − 𝐶(𝑑𝑟
𝑑𝑡)𝑃𝐵
∗
(VI-10)
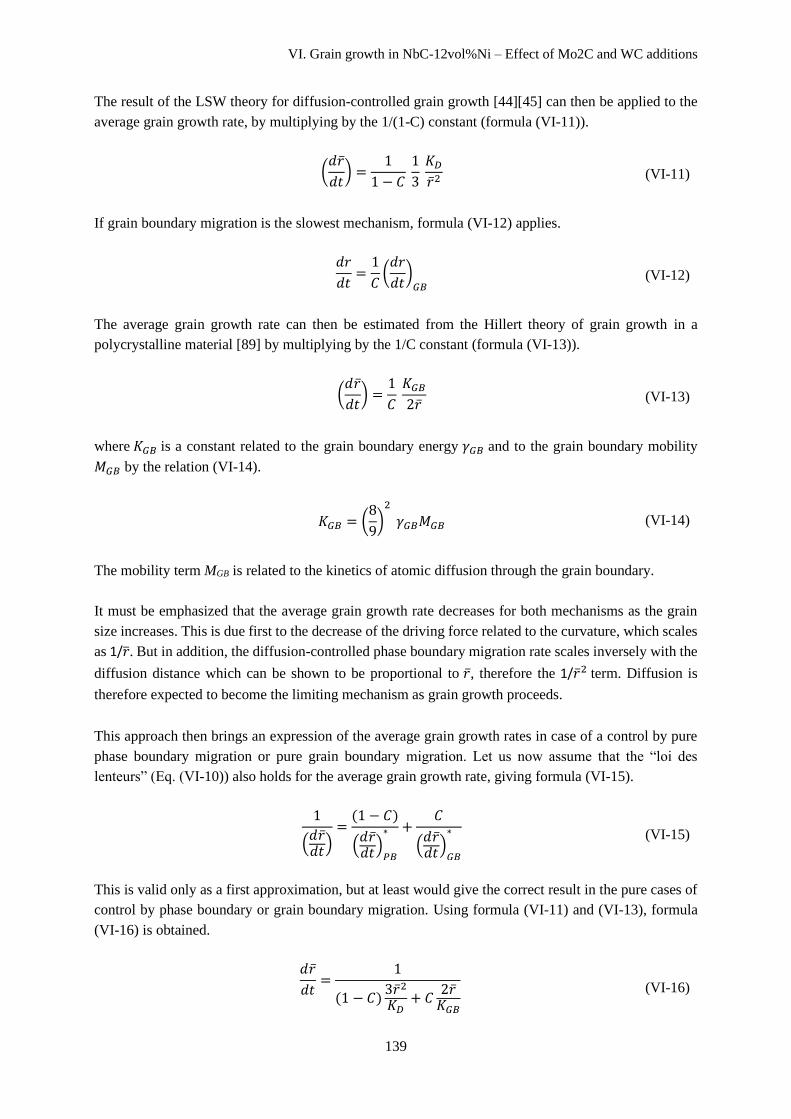
VI. Grain growth in NbC-12vol%Ni – Effect of Mo2C and WC additions
139
The result of the LSW theory for diffusion-controlled grain growth [44][45] can then be applied to the
average grain growth rate, by multiplying by the 1/(1-C) constant (formula (VI-11)).
(𝑑�̅�
𝑑𝑡) =
1
1 − 𝐶 1
3 𝐾𝐷�̅�2
(VI-11)
If grain boundary migration is the slowest mechanism, formula (VI-12) applies.
𝑑𝑟
𝑑𝑡=1
𝐶(𝑑𝑟
𝑑𝑡)𝐺𝐵
(VI-12)
The average grain growth rate can then be estimated from the Hillert theory of grain growth in a
polycrystalline material [89] by multiplying by the 1/C constant (formula (VI-13)).
(𝑑�̅�
𝑑𝑡) =
1
𝐶 𝐾𝐺𝐵2�̅�
(VI-13)
where 𝐾𝐺𝐵 is a constant related to the grain boundary energy 𝛾𝐺𝐵 and to the grain boundary mobility
𝑀𝐺𝐵 by the relation (VI-14).
𝐾𝐺𝐵 = (
8
9)2
𝛾𝐺𝐵𝑀𝐺𝐵 (VI-14)
The mobility term MGB is related to the kinetics of atomic diffusion through the grain boundary.
It must be emphasized that the average grain growth rate decreases for both mechanisms as the grain
size increases. This is due first to the decrease of the driving force related to the curvature, which scales
as 1/�̅�. But in addition, the diffusion-controlled phase boundary migration rate scales inversely with the
diffusion distance which can be shown to be proportional to �̅�, therefore the 1/�̅�2 term. Diffusion is
therefore expected to become the limiting mechanism as grain growth proceeds.
This approach then brings an expression of the average grain growth rates in case of a control by pure
phase boundary migration or pure grain boundary migration. Let us now assume that the “loi des
lenteurs” (Eq. (VI-10)) also holds for the average grain growth rate, giving formula (VI-15).
1
(𝑑�̅�𝑑𝑡)=(1 − 𝐶)
(𝑑�̅�𝑑𝑡)𝑃𝐵
∗ +𝐶
(𝑑�̅�𝑑𝑡)𝐺𝐵
∗ (VI-15)
This is valid only as a first approximation, but at least would give the correct result in the pure cases of
control by phase boundary or grain boundary migration. Using formula (VI-11) and (VI-13), formula
(VI-16) is obtained.
𝑑�̅�
𝑑𝑡=
1
(1 − 𝐶)3�̅�2
𝐾𝐷+ 𝐶
2�̅�𝐾𝐺𝐵
(VI-16)

VI. Grain growth in NbC-12vol%Ni – Effect of Mo2C and WC additions
140
The rate of variation of �̅�3can then be advantageously expressed with formula (VI-17).
𝑑�̅�3
𝑑𝑡=
1
(1 − 𝐶)1𝐾𝐷
+23𝐶
1𝐾𝐺𝐵�̅�
(VI-17)
The first term in the denominator represents the classical contribution of solution-precipitation
mechanisms, the second term the additional effect of grain boundary migration on grain growth kinetics.
Due to this grain size dependency, the grain boundary controlled mechanism can be dominant initially
for small grain sizes, but the solution-precipitation controlled mechanism can become dominant at long
times, as the grain size and consequently the diffusion distance increases.
The result predicted by formula (VI-17) is plotted on the experimental kinetic curve in Figure VI-19 (b).
The KD value is the one in Table VI-8. Experimental values are taken for the contiguity and for the
average grain size at times 0, 1h, 2h and 4h. Figure VI-19 (a) shows the results for pure diffusion-
controlled phase boundary migration with the values of KD” taken from Table VI-8.
Figure VI-19 Evolution of the cube mean radius of NbC-12vol%Ni samples sintered at 1360°C in
vacuum as a function of the dwelling time with arrows indicating (a) the normal volume grain
growth rate predicted by the LSW theory, (b) the volume grain growth rate predicted from
formula (VI-17).
The calculation for pure diffusion-controlled phase boundary migration clearly overestimates the
experimental kinetics. The calculation for the cooperative migration of phase boundaries and grain
boundaries gives a more correct estimate. It captures the increase of the grain growth rate and of the
diffusion contribution as grain growth proceeds (see Eq. (VI-17)), although the grain growth rate at long
times is significantly underestimated, which may be due to imprecision in the model and to the lack of
data for longer times. The fit was obtained with a value of the grain growth rate constant for grain
boundary migration KGB around 0.001 μm2/s. From an experimental study of grain growth kinetics in a
pure NbC polycrystalline material [90], KGB can also be estimated from formula (VI-13) to 0.001 μm2/s,
which is in fairly good agreement, and validates the hypothesis of a cooperative migration between
phase boundary and grain boundary migration in our NbC-Ni materials.
The acceleration of grain growth for long dwelling times, which is not totally captured by the model,
could be explained by the elimination of small grains nearby big grains by cooperative solution-
precipitation and grain boundary migration, which could decrease the local contiguity of large grains
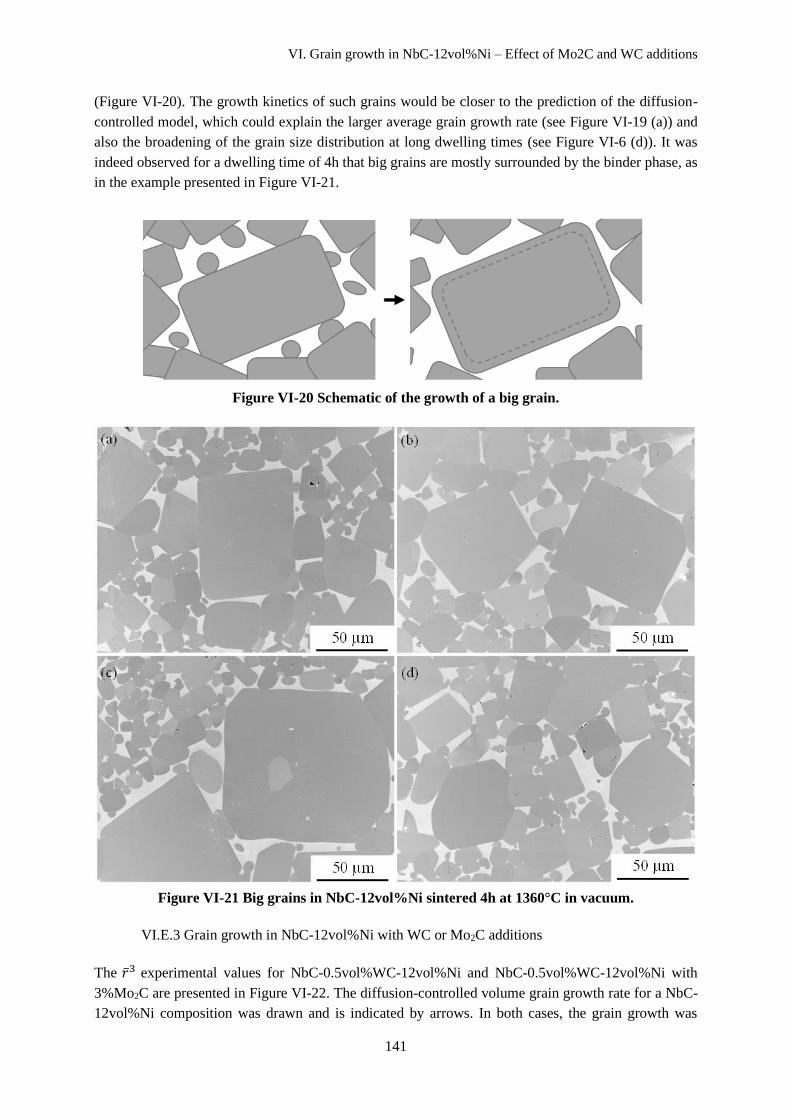
VI. Grain growth in NbC-12vol%Ni – Effect of Mo2C and WC additions
141
(Figure VI-20). The growth kinetics of such grains would be closer to the prediction of the diffusion-
controlled model, which could explain the larger average grain growth rate (see Figure VI-19 (a)) and
also the broadening of the grain size distribution at long dwelling times (see Figure VI-6 (d)). It was
indeed observed for a dwelling time of 4h that big grains are mostly surrounded by the binder phase, as
in the example presented in Figure VI-21.
Figure VI-20 Schematic of the growth of a big grain.
Figure VI-21 Big grains in NbC-12vol%Ni sintered 4h at 1360°C in vacuum.
VI.E.3 Grain growth in NbC-12vol%Ni with WC or Mo2C additions
The �̅�3 experimental values for NbC-0.5vol%WC-12vol%Ni and NbC-0.5vol%WC-12vol%Ni with
3%Mo2C are presented in Figure VI-22. The diffusion-controlled volume grain growth rate for a NbC-
12vol%Ni composition was drawn and is indicated by arrows. In both cases, the grain growth was
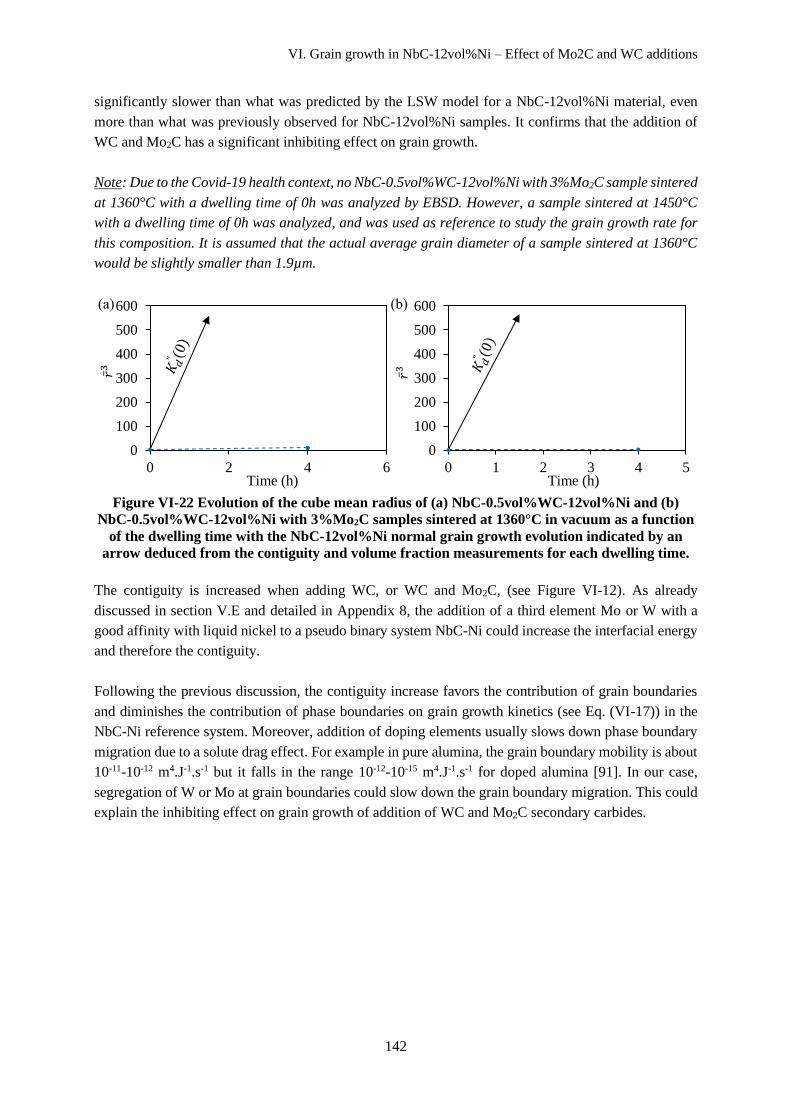
VI. Grain growth in NbC-12vol%Ni – Effect of Mo2C and WC additions
142
significantly slower than what was predicted by the LSW model for a NbC-12vol%Ni material, even
more than what was previously observed for NbC-12vol%Ni samples. It confirms that the addition of
WC and Mo2C has a significant inhibiting effect on grain growth.
Note: Due to the Covid-19 health context, no NbC-0.5vol%WC-12vol%Ni with 3%Mo2C sample sintered
at 1360°C with a dwelling time of 0h was analyzed by EBSD. However, a sample sintered at 1450°C
with a dwelling time of 0h was analyzed, and was used as reference to study the grain growth rate for
this composition. It is assumed that the actual average grain diameter of a sample sintered at 1360°C
would be slightly smaller than 1.9µm.
Figure VI-22 Evolution of the cube mean radius of (a) NbC-0.5vol%WC-12vol%Ni and (b)
NbC-0.5vol%WC-12vol%Ni with 3%Mo2C samples sintered at 1360°C in vacuum as a function
of the dwelling time with the NbC-12vol%Ni normal grain growth evolution indicated by an
arrow deduced from the contiguity and volume fraction measurements for each dwelling time.
The contiguity is increased when adding WC, or WC and Mo2C, (see Figure VI-12). As already
discussed in section V.E and detailed in Appendix 8, the addition of a third element Mo or W with a
good affinity with liquid nickel to a pseudo binary system NbC-Ni could increase the interfacial energy
and therefore the contiguity.
Following the previous discussion, the contiguity increase favors the contribution of grain boundaries
and diminishes the contribution of phase boundaries on grain growth kinetics (see Eq. (VI-17)) in the
NbC-Ni reference system. Moreover, addition of doping elements usually slows down phase boundary
migration due to a solute drag effect. For example in pure alumina, the grain boundary mobility is about
10-11-10-12 m4.J-1.s-1 but it falls in the range 10-12-10-15 m4.J-1.s-1 for doped alumina [91]. In our case,
segregation of W or Mo at grain boundaries could slow down the grain boundary migration. This could
explain the inhibiting effect on grain growth of addition of WC and Mo2C secondary carbides.
0
100
200
300
400
500
600
0 2 4 6
r3
Time (h)
0
100
200
300
400
500
600
0 1 2 3 4 5
r3
Time (h)
(a) (b)
𝑟3
𝑟3

Conclusion & Perspectives
143
Conclusion & Perspectives
Past studies have shown that a good range of mechanical properties could be reached with NbC based
cemented carbides, confirming the potential of niobium carbide as an alternative to tungsten carbide.
This research aimed to understand the sintering behavior and microstructural evolutions of NbC-Ni
materials. The impact of the carbon content was studied, as well as the effect of a secondary carbide
addition. Grain growth was also investigated for different compositions and the mechanisms mentioned
for WC-Co materials were revisited to explain the results observed for NbC-Ni materials.
Debinding and chemical transformations during heating were first investigated. The debinding of the
NbC-12vol%Ni reference material was studied, and the full decomposition of the organic binder at
400°C in hydrogenated helium was confirmed. Different oxide reduction steps were identified by TGA.
The debinding and oxide reduction steps are little affected by the carbon content and by Mo2C or WC
additions. Above 1300°C, nickel evaporation was identified. The nickel evaporation (0.4wt%) was
significantly reduced when increasing or decreasing the carbon content. It can be explained by an earlier
densification due to the lower solidus temperature. A significant carbon loss during heating was also
evidenced by chemical analysis of final samples for every composition. Part of this loss corresponds to
the oxide reduction measured in TGA. A heterogeneity of the carbon loss was furthermore identified,
with a bigger loss at the periphery of the sample.
The different steps of sintering in vacuum were analyzed by dilatometry. Solid state sintering starts
around 950°C, followed by liquid phase sintering above 1315°C for the NbC-0.5vol%WC-12vol%Ni
reference material. The onset of solid state sintering coincides with the temperature of oxide reduction
measured in TGA. This is a classical result for cemented carbides and it is explained by a lower
interfacial energy and an easier solid state spreading of the binder on oxide-free carbide particles. Solid
state sintering is delayed to higher temperatures for low carbon contents, probably due to a higher
interfacial energy and therefore to a more difficult spreading of the binder on carbide surfaces. The same
effect is observed when adding Mo2C to the reference composition. The formation of mixed Nb/Mo
carbides could also be responsible for an increase of the interfacial energy, and therefore to a more
difficult spreading of the binder. The presence of Mo2C particles exerting local tensile stresses on the
NbC skeleton could also delay the onset of shrinkage. Liquid phase sintering is unaffected by the
addition of Mo2C, but it starts at a slightly lower temperature when modifying the carbon content, due
to the maximum of the solidus on the phase diagram. A swelling was observed during liquid phase
sintering for high carbon contents and can be related to the transition through the 3 phase (NbC + Ni +
liquid) domain of the phase diagram. The sintering densification is almost completed at 1450°C for all
compositions.
The microstructure of the NbC-12vol%Ni composition presents two phases, cuboidal carbide grains
with rounded edges and a Ni-rich binder phase. The same phases were identified when adding WC and
Mo2C or when decreasing the carbon content. For high carbon contents, a graphite phase was identified.
Nickel segregation was observed at grain boundaries that could decrease the grain boundary energy and
prevent their complete infiltration during sintering. Bigger grains have a more faceted shape. A
remaining 1% porosity was found inside the grains, whose formation could be due to a coalescence

Conclusion & Perspectives
144
process with a local lack of binder during solid state sintering. In addition, very small porosities were
found at the carbide-binder interfaces, and a great density of dislocations was observed in the binder.
These defects can be attributed to the thermal stresses exerted on the binder during cooling.
The composition of the carbide and binder phases evolves during sintering. WC and Mo2C, when
present, dissolve in the NbC carbide and in the binder during the first step of solid state sintering,
between 1080°C and 1180°C. Molybdenum was found in both the carbide and the binder but tungsten
was mostly found in the binder after sintering. A small quantity of niobium was also found in the binder,
but no nickel was identified in the carbide, except in the form of small inclusions which could be related
to the solid state coalescence discussed above.
The contiguity of the final sintered materials was determined by analysis of EBSD images and
significantly evolves with the composition and time spent at high temperature. It increases when
decreasing the carbon content or when adding Mo2C or WC to the NbC-Ni material, as the corresponding
interfacial energy increases with respect to the grain boundary energy. The higher interface energy when
decreasing the carbon content or increasing the amount of secondary carbides is also consistent with the
delay of solid state sintering discussed above. The increase of interface energy as pure NbC carbide is
replaced by Nb/Mo mixed carbide may look surprising, owing to the good affinity of Mo2C for Ni. A
simplified calculation of interface energy in a pseudo-ternary system was undertaken to justify this
apparent paradox. When increasing the time spent at high temperature, the contiguity decreases. This is
due to an evolution towards equilibrium between carbide-binder interfaces and grain boundaries, at the
advantage of interfaces. Indeed, a decrease of the interface energy is expected at the melting point, due
first to the relaxation of elastic stresses at the interface and second to the better chemical affinity with
the liquid in relation with the higher solubility of solid atoms in the liquid. Infiltration of grain
boundaries created in the solid state by the liquid, as quantified by a decrease of the contiguity in the
early stage of liquid phase sintering, is a classical result for cemented carbides [8][84][85][86].
A significant grain growth was observed for the NbC-12vol%Ni material. The reduced grain size
distribution evolves with dwelling time at 1360°C, which suggests that grain growth is not normal. The
evolution of the square and cube mean particle radius with time is not linear, confirming that the theory
of normal grain growth controlled by diffusion in the liquid or by interfacial reaction is not adapted to
this system. The experimental volume growth rate is one order of magnitude slower than expected by
the LSW theory for limitation by diffusion in the liquid. A model was proposed for grain growth kinetics
by a cooperative grain boundary and phase boundary migration, which could explain this discrepancy.
The growth constant for grain boundary migration fitting the results is close to a value from the literature
obtained for grain growth in pure NbC polycrystalline materials, which validates the analysis. Grain
growth kinetics predicted by the model are dominated by grain boundary migration and are quite close
to the experimental kinetics at short times. For long dwelling times, an acceleration of the experimental
grain growth was observed, which is partly explained by the exaggerated growth of large grains.
Grain growth is highly influenced by the composition. First, a slight increase of the carbon content
accelerates grain growth, but grain growth is limited for a more consequent addition, due to the pinning
of grain boundaries by graphite particles. Second, the addition of WC or Mo2C to a NbC-Ni material
significantly inhibits grain growth. The grain growth inhibition is explained by the increase of contiguity
which favors the contribution of grain boundaries and diminishes the contribution of phase boundaries
on grain growth kinetics. Segregation of W or Mo at grain boundaries could further decrease the grain

Conclusion & Perspectives
145
boundary mobility by a solute drag effect, although only a slight segregation was detected for Mo in
TEM.
The hardness and toughness were measured from Vickers indentations and significantly vary with the
composition. When adding Mo2C, the hardness increases while the toughness decreases, which can be
explained by the decrease of the carbide grain size and by the higher solute content in the binder. The
hardness increases when decreasing the carbon content. Again this can be explained by the grain size
decrease and by an increase of the metallic solute content in the binder. The increase of hardness of the
carbide phase may also play a role as it was shown that the C/(Nb+Mo+W) ratio has an effect on the
mechanical properties of the carbide grains. The toughness is maximal for a C/(Nb+Mo+W) ratio close
to 1. Grain size variations cannot fully explain this trend.
Different perspectives to this work can be considered. First, from the application point of view,
improving the mixing step to obtain a more even repartition of the binder could help limiting the
formation of intra-granular porosities and ease the sintering process, and could therefore allow a faster
densification. As for inhibition of grain growth, the study of the impact of secondary carbide addition
of Mo2C was carried out with a reference mix already containing a very small quantity of WC. It was
later shown that this small addition already significantly inhibits grain growth. It would therefore be
interesting to add different quantities of WC or Mo2C independently to a NbC-Ni material, in order to
quantify the inhibiting effect of each secondary carbide. Such compositions were already investigated
by Huang et al [65][57]. Secondly, from the theoretical point of view, atomistic calculations would be
helpful to understand the effect of composition on the energy of carbide-grain boundaries and carbide-
binder interfaces. Such effects could also be addressed experimentally by a more systematic analysis of
the contiguity variations with composition.
As for grain growth, the proposed theory of cooperative grain boundary and phase boundary migration
would need to be confirmed by other experiments and analyses. From this theory, the grain growth
behavior would be strongly linked to the contiguity of the carbide phase. It would therefore be interesting
to study the growth behavior in samples with different binder contents. Notably, a quasi-normal grain
growth behavior (with a linear evolution of the cube mean radius) should be observed for a high binder
content, as observed by Warren [6]. The field of this theory should also be extended to other materials
and especially to WC-based cemented carbides. Grain growth kinetics in these materials are also much
slower than predicted by the classical Ostwald ripening models for diffusion-controlled kinetics [8] [80].
An explanation often put forward is the contribution of 2D nucleation for faceted grains, which would
considerably slow down precipitation of solute atoms at the carbide-liquid interface [50]. But grain
boundary migration could also be the limiting grain growth mechanism in such materials with high
contiguity and considerably slow down grain growth kinetics as observed in our NbC-Ni materials.

Conclusion & Perspectives
146

References
147
References
[1] M. Woydt, H. Mohrbacher, J. Vleugels, and S. Huang, “Niobium carbide for wear protection -
tailoring its properties by processing and stoichiometry,” Met. Powder Rep., vol. 71, no. 4, pp.
265–272, 2016, doi: 10.1016/j.mprp.2015.12.010.
[2] H. M. Ortner, P. Ettmayer, and H. Kolaska, “The history of the technological progress of
hardmetals,” Int . J. Refract. Met. Hard Mater., vol. 44, pp. 148–159, 2014, doi:
10.1016/j.ijrmhm.2013.07.014.
[3] K. Schröter, “Sintered hardmetals alloy and procedure for its fabrication,” DRP 420.689, 1923.
[4] G. E. Spriggs, “A History of Fine Grained Hardmetal,” Int . J. Refract. Met. Hard Mater., vol.
13, pp. 241–255, 1995.
[5] R. Warren, “Microstructural development during the liquid-phase sintering of two-phase
alloys, with special reference to the NbC/Co system,” J. Mater. Sci., vol. 3, no. 5, pp. 471–485,
1968, doi: 10.1007/BF00549730.
[6] R. Warren, “Carbide grain growth during the liquid-phase sintering of the alloys NbC-Fe, NbC-
Ni and NbC-Co.,” J. Less-Common Met., vol. 17, pp. 65–72, 1969.
[7] R. Warren, “Microstructural development during the liquid-phase sintering of VC-Co alloys,”
J. Mater. Sci., vol. 7, pp. 1434–1442, 1972.
[8] R. Warren and M. B. Waldron, “Microstructural development during liquid-phase sintering of
cemented carbides. 1. Wettability and grain contact,” Powder Metall., vol. 15, no. 30, pp. 166–
201, 1972.
[9] European Commission, “Report on critical raw materials for the EU, Ref.
Ares(2015)1819503,” 2014. [Online]. Available: http://litio.ipg.pt/wp-
content/uploads/2018/07/EC_crm-report-on-critical-raw-materials_2014.pdf.
[10] European Commission, “Study on the review of the list of Critical Raw Materials - Executive
summary,” 2017. [Online]. Available: https://ec.europa.eu/docsroom/documents/25421.
[11] European Commission, “Report on critical raw materials for the EU - Critical raw materials
profiles,” 2015. [Online]. Available: http://publications.europa.eu/resource/cellar/d1be1b43-
e18f-11e8-b690-01aa75ed71a1.0001.01/DOC_1.
[12] National toxicology program, “National Toxicology Program technical report on the toxicology
studies of cobalt metal in F344/N rats and B6C3F1/N mice and toxicology and carcinogenesis
studies of cobalt metal in F344/N rats and B6C3F1/N mice (inhalation studies),” 2014.
[Online]. Available:
https://ntp.niehs.nih.gov/ntp/htdocs/lt_rpts/tr581_508.pdf?utm_source=direct&utm_medium=p
rod&utm_campaign=ntpgolinks&utm_term=tr581.
[13] World Health Organization, “Cobalt in Hard Metals and Cobalt Sulfate , Gallium Arsenide ,
Indium Phosphide and Vanadium Pentoxide,” Lyon, France, 2006. [Online]. Available:
https://www.ncbi.nlm.nih.gov/books/NBK321688/.
[14] European Chemicals Agency (ECHA), “REACH, Introduction,” 2007.
https://ec.europa.eu/environment/chemicals/reach/reach_en.htm.
[15] Z. Roulon, “Thesis, Effect of binder on sintering and microstructure of cemented carbides,”

References
148
Université Grenoble Alpes, 2019.
[16] C. Polak, “Métallurgie et recyclage du niobium et du tantale,” Tech. l’ingénieur, vol. 33, pp. 1–
12, 2009.
[17] European Commission, “Report on critical raw materials ofr the EU - Non-critical raw
materials profiles,” 2014. [Online]. Available:
http://publications.europa.eu/resource/cellar/ceb9a1b5-98f9-11e7-b92d-
01aa75ed71a1.0001.01/DOC_1.
[18] E. E. Nikishina, D. V. Drobot, and E. N. Lebedeva, “Niobium and tantalum: State of the world
market, application fields, and sources of raw materials.,” Russ. J. Non-Ferrous Met., vol. 55,
no. 2, pp. 130–140, 2014, doi: 10.3103/S1067821214020126.
[19] M. Woydt and H. Mohrbacher, “Friction and wear of binder-less niobium carbide,” Wear, vol.
306, no. 1–2, pp. 126–130, 2013, doi: 10.1016/j.wear.2013.07.013.
[20] M. Woydt and H. Mohrbacher, “The use of niobium carbide (NbC) as cutting tools and for
wear resistant tribosystems,” Int. J. Refract. Met. Hard Mater., vol. 49, no. 1, pp. 212–218,
2015, doi: 10.1016/j.ijrmhm.2014.07.002.
[21] J. F. Smith, O. N. Carlson, and R. R. De Avillez, “The Niobium-Carbon system,” Nucl. Mater.,
vol. 148, pp. 1–16, 1987.
[22] S. G. Huang, K. Vanmeensel, H. Mohrbacher, M. Woydt, and J. Vleugels, “Microstructure and
mechanical properties of NbC-matrix hardmetals with secondary carbide addition and different
metal binders,” Int. J. Refract. Met. Hard Mater., vol. 48, pp. 418–426, 2015, doi:
10.1016/j.ijrmhm.2014.10.014.
[23] M. Woydt, H. Mohrbacher, J. Vleugels, and S. Huang, “Potentials of niobium carbide (NBC)
as cutting tools and for wear protection,” Ceram. Eng. Sci. Proc., vol. 38, no. 2, pp. 99–111,
2018, doi: 10.1002/9781119474678.ch10.
[24] R. M. German, Liquid Phase Sintering. New York: Springer Science & Business Media, LLC,
1985.
[25] S. Lay and J. M. Missiaen, “Microstructure and morphology of hard metals,” Compr. Hard
Mater., vol. 1, no. 1.03, pp. 91–122, 2014.
[26] L. Ramqvist, “Wetting of metallic carbides by liquid copper, nickel, cobalt and iron,” Int. J.
Powder Metall., vol. 1, pp. 2–21, 1965.
[27] S. G. Huang, L. Li, O. Van der Biest, and J. Vleugels, “Influence of WC addition on the
microstructure and mechanical properties of NbC-Co cermets,” J. Alloys Compd., vol. 430, no.
1–2, pp. 158–164, 2007, doi: 10.1016/j.jallcom.2006.05.015.
[28] L. Lauter, R. Hochenauer, C. Buchegger, M. Bohn, and W. Lengauer, “Solid-state solubilities
of grain-growth inhibitors in WC-Co and WC-MC-Co hardmetals,” J. Alloys Compd., vol. 675,
pp. 407–415, 2016, doi: 10.1016/j.jallcom.2016.03.117.
[29] P. Ettmayer, H. Kolaska, W. Lengauer, and K. Dreyert, “Ti(C,N) Cermets - Metallurgy and
Properties,” Int . J. Refract. Met. Hard Mater., vol. 13, pp. 343–351, 1995.
[30] J. Garcia, V. Collado Ciprés, A. Blomqvist, and B. Kaplan, “Cemented carbide
microstructures: a review,” Int. J. Refract. Metals Hard Mater., vol. 80, no. August 2018, pp.
40–68, 2019, doi: 10.1016/j.ijrmhm.2018.12.004.
[31] S. G. Huang, J. Vleugels, and H. Mohrbacher, “Stainless steel bonded NbC matrix cermets
References
149
using a submicron NbC starting powder,” Int. J. Refract. Met. Hard Mater., vol. 63, pp. 26–31,
2017, doi: 10.1016/j.ijrmhm.2016.04.021.
[32] M. Woydt and H. Mohrbacher, “The tribological and mechanical properties of niobium
carbides (NbC) bonded with cobalt or Fe3Al,” Wear, vol. 321, pp. 1–7, 2014, doi:
10.1016/j.wear.2014.09.007.
[33] A. Hadian, C. Zamani, and F. Jörg, “Sintering behavior of NbC based cemented carbides
bonded with M2 high speed steel,” Ceram. Int., vol. 45, no. 7, pp. 8616–8625, 2019, doi:
10.1016/j.ceramint.2019.01.181.
[34] A. Hadian, C. Zamani, and F. Jörg, “Effect of sintering temperature on microstructural
evolution of M48 high speed tool steel bonded NbC matrix cemented carbides sintered in inert
atmosphere,” Int. J. Refract. Metals Hard Mater., vol. 74, no. March, pp. 20–27, 2018, doi:
10.1016/j.ijrmhm.2018.02.021.
[35] S. Huang, P. Baets, J. Sukumaran, H. Mohrbacher, M. Woydt, and J. Vleugels, “Effect of
Carbon Content on the Microstructure and Mechanical Properties of NbC-Ni Based Cermets,”
Metals (Basel)., vol. 8, no. 3, p. 178, 2018, doi: 10.3390/met8030178.
[36] R. M. German, Sintering Theory and Practice. New York, 1996.
[37] A. G. P. da Silva, W. D. Schubert, and B. Lux, “The role of the binder phase in the WC-Co
sintering,” Mater. Res., vol. 4, no. 2, pp. 59–62, 2001, doi: 10.1590/s1516-
14392001000200003.
[38] S. Roure, “Densification des mélanges de poudres WC-Co : de la compression au frittage,”
Grenoble INP, 1996.
[39] S. G. Huang, J. Vleugels, H. Mohrbacher, and M. Woydt, “NbC grain growth control and
mechanical properties of Ni bonded NbC cermets prepared by vacuum liquid phase sintering,”
Int. J. Refract. Metals Hard Mater., vol. 72, pp. 63–70, 2018, doi:
10.1016/j.ijrmhm.2017.12.013.
[40] V. Bounhoure, S. Lay, F. Charlot, A. Antoni-zdziobek, E. Pauty, and J. M. Missiaen, “Effect of
C content on the microstructure evolution during early solid state sintering of WC – Co alloys,”
Int . J. Refract. Met. Hard Mater., vol. 44, pp. 27–34, 2014, doi:
10.1016/j.ijrmhm.2013.12.012.
[41] G. Gille, B. Szesny, and G. Leitner, “A new 0.4 µm powder as well as powder-related
properties and sintering behaviour of 0.6 to 30 µm WC-Co hardmetals,” in 14th Int. Plansee
Seminar, 1997, pp. 139–167.
[42] K. Mannesson, J. Jeppsson, A. Borgenstam, and A. John, “Carbide grain growth in cemented
carbides,” Acta Mater., vol. 59, pp. 1912–1923, 2011, doi: 10.1016/j.actamat.2010.11.056.
[43] G. W. Greenwood, “The growth of dispersed precipitates in solutions,” Acta Metall., vol. 4, pp.
243–248, 1956.
[44] I. M. Lifshitz and V. V. Slyozov, “The kinetics of precipitation from supersaturated solid
solutions,” J. Phys. Chem. Solids, vol. 19, no. 1, pp. 35–50, 1961.
[45] C. Wagner, “Theorie der Alterung von Niederschlägen durch Umlösen,” Z. Electrochem., vol.
19, no. 7, pp. 581–591, 1961.
[46] K.-S. Oh, J.-Y. Jun, D.-Y. Kim, and N. M. Hwang, “Shape Dependence of the Coarsening
Behavior of Niobium Carbide Grains Dispersed in a Liquid Iron Matrix,” J. Am. Ceram. Soc.,
vol. 83, no. 12, pp. 3117–3120, 2000, doi: 10.1111/j.1151-2916.2000.tb01691.x.

References
150
[47] Y. J. Park, N. M. Hwang, and D. Y. Yoon, “Abnormal growth of faceted (WC) grains in a (Co)
liquid matrix,” Metall. Mater. Trans. A Phys. Metall. Mater. Sci., vol. 27, no. 9, pp. 2809–
2819, 1996, doi: 10.1007/BF02652373.
[48] Y. Zhong and L. L. Shaw, “Growth mechanisms of WC in WC-5.75 wt% Co,” Ceram. Int.,
vol. 37, no. 8, pp. 3591–3597, 2011, doi: 10.1016/j.ceramint.2011.06.016.
[49] S. J. L. Kang, M.-G. Lee, and S.-M. An, “Microstructural evolution during sintering with
control of the interface structure,” J. Am. Ceram. Soc., vol. 92, no. 7, pp. 1464–1471, 2009,
doi: 10.1017/CBO9781107415324.004.
[50] S.-J. L. Kang, Sintering - Densification, grain growth & microstructure. Oxford, 2005.
[51] J. Gurland, “The measurement of grain contiguity in two-phase alloys,” Trans. AIME, vol. 212,
pp. 452–455, 1958.
[52] A. V Shatov, “The contiguity of carbide crystals of different shapes in cemented carbides,” Int .
J. Refract. Met. Hard Mater., vol. 24, pp. 61–74, 2006, doi: 10.1016/j.ijrmhm.2005.03.003.
[53] S. Sarian and H. W. Weart, “Kinetics of coarsening of spherical particles in a liquid matrix,” J.
Appl. Phys., vol. 37, no. 4, pp. 1675–1681, 1966, doi: 10.1063/1.1708583.
[54] P. W. Voorhees and M. E. Glicksman, “Ostwald Ripening during Liquid Phase Sintering Effect
of Volume Fraction on Coarsening Kinetics,” Metall. Trans. A, vol. 15, pp. 1081–1088, 1984.
[55] H. Moon, B. K. Kim, and S. J. L. Kang, “Growth mechanism of round-edged NbC grains in Co
liquid,” Acta Mater., vol. 49, no. 7, pp. 1293–1299, 2001, doi: 10.1016/S1359-6454(00)00394-
3.
[56] W. F. Gale and T. C. Totemeier, Smithells Metals Reference Book, 8th ed. 2004.
[57] S. G. Huang, J. Vleugels, H. Mohrbacher, and M. Woydt, “Microstructure and tribological
performance of NbC-Ni cermets modified by VC and Mo2C,” Int. J. Refract. Met. Hard
Mater., vol. 66, no. March, pp. 188–197, 2017, doi: 10.1016/j.ijrmhm.2017.03.012.
[58] S. G. Huang, J. Vleugels, H. Mohrbacher, and M. Woydt, “Development of NbC-based
hardmetals: Influence of secondary carbide addition and metal binder,” Euro PM 2014 Congr.
Exhib. Proc., 2014.
[59] J. Missiaen, “Solid-state spreading and sintering of multiphase materials,” Mater. Sci. Eng. A,
vol. 475, pp. 2–11, 2008, doi: 10.1016/j.msea.2007.01.160.
[60] G. S. Upadhyaya, “Materials science of cemented carbides - an overview,” Mater. Des. 22, pp.
483–489, 2001.
[61] S. G. Huang et al., “Microstructural investigation and machining performance of NbC-Ti
(C0.5N0.5) matrix cermets,” Int. J. Refract. Metals Hard Mater., vol. 84, no. May, p. 105038,
2019, doi: 10.1016/j.ijrmhm.2019.105038.
[62] S. G. Huang, J. Vleugels, H. Mohrbacher, and M. Woydt, “Microstructure and mechanical
properties of NbC matrix cermets using Ni containing metal binder,” Met. Powder Rep., vol.
71, no. 5, pp. 349–355, 2016, doi: 10.1016/j.mprp.2016.05.009.
[63] S. G. Huang, J. Vleugels, H. Mohrbacher, and M. Woydt, “NbC grain growth control and
mechanical properties of Ni bonded NbC cermets prepared by vacuum liquid phase sintering,”
19th Plansee Semin. 2017, vol. 72, no. September 2017, pp. 1–11, 2017, doi:
10.1016/j.ijrmhm.2017.12.013.

References
151
[64] D. K. Shetty, I. G. Wright, P. N. Mincer, and A. H. Clauer, “Indentation fracture of WC - Co
cermets,” J. Mater. Sci., vol. 20, pp. 1873–1882, 1985.
[65] J. H. Huang, S. G. Huang, J. Vleugels, and B. Lauwers, “Microstructure and mechanical
properties of WC modified NbC-Ni cermets,” 2019.
[66] L. S. Sigl and H. F. Fischmeister, “On the fracture toughness of cemented carbides,” Acta
Metall., vol. 36, no. 4, pp. 887–897, 1988, doi: 10.7498/aps.32.1255.
[67] S. G. Huang, O. Van der Biest, L. Li, and J. Vleugels, “Properties of NbC-Co cermets obtained
by spark plasma sintering,” Mater. Lett., vol. 61, no. 2, pp. 574–577, 2007, doi:
10.1016/j.matlet.2006.05.011.
[68] L. Gu, J. Huang, and C. Xie, “Effects of carbon content on microstructure and properties of
WC – 20Co cemented carbides,” Int . J. Refract. Met. Hard Mater., vol. 42, pp. 228–232, 2014,
doi: 10.1016/j.ijrmhm.2013.09.010.
[69] O. Kubaschewski and C. B. Alcock, Metallurgical Thermochemistry, 5th Edition, International
Series on Materials Science and Technology, G. Pergamo., vol. 24, 5th ed. 1979.
[70] J. M. Lebrun, J. M. Missiaen, and C. Pascal, “Elucidation of mechanisms involved during silica
reduction on silicon powders,” Scr. Mater., vol. 64, no. 12, pp. 1102–1105, 2011, doi:
10.1016/j.scriptamat.2011.02.031.
[71] S. A. Saltykov, “The Determination of the Size Distribution of Particles in an Opaque Material
from a Measurement of the Size Distribution of Their Sections,” in Stereology, 1967, pp. 163–
173, doi: 10.1017/CBO9781107415324.004.
[72] M. Pellan, “Thesis, Development of grain boundaries and phase boundaries in WC-Co
cemented carbides,” Grenoble Alpes University, 2016.
[73] W. P. Davey, “Precision measurements of the lattice constants of twelve common metals,”
Phys. Rev., vol. 25, pp. 753–761, 1925.
[74] D. C. Ghosh and R. Biswas, “Theoretical Calculation of Absolute Radii of Atoms and Ions .
Part 1 . The Atomic Radii,” pp. 87–113, 2002.
[75] A. Krawitz and E. Drake, “Residual stresses in cemented carbides - An overview,” Int. J.
Refract. Met. Hard Mater., vol. 49, no. 1, pp. 27–35, 2015, doi: 10.1016/j.ijrmhm.2014.07.018.
[76] D. R. Lide, CRC Handbook of Chemistry and Physics, 90th ed. CRC Press Inc, 2009.
[77] J. Gurland, “A study of the effect if carbon content on the structure and properties of sintered
WC-Co alloys,” J. Met., pp. 285–290, 1954.
[78] G. J. Rees and B. Young, “A study of the factors controlling grain size in sintered hard-metal,”
Powder Metall., vol. 14, no. 27, pp. 185–198, 1971, doi: 10.1179/pom.1971.14.27.014.
[79] V. Chabretou, C. H. Allibert, and J. M. Missiaen, “Quantitative analysis of the effect of the
binder phase composition on grain growth in WC-Co sintered materials,” J. Mater. Sci., vol.
38, no. 12, pp. 2581–2590, 2003, doi: 10.1023/A:1024418131674.
[80] Z. Roulon, S. Lay, and J. M. Missiaen, “Interface characteristics in cemented carbides with
alternative binders,” Int. J. Refract. Met. Hard Mater., 2020.
[81] M. N. Rahaman, Ceramic processing and sintering, Marcel Dek. New York, 1995.
[82] M. V. G. Petisme, S. A. E. Johansson, and G. Wahnström, “A computational study of
interfaces in WC-Co cemented carbides,” Model. Simul. Mater. Sci. Eng., vol. 23, no. 4, p.

References
152
45001, 2015, doi: 10.1088/0965-0393/23/4/045001.
[83] N. Eustathopoulos and J. C. Joud, “Interfacial tension and adsorption of metallic systems,”
Curr. Top. Mater. Sci., vol. 4, pp. 281–360, 1980.
[84] M. Coster, J. L. Chermant, and A. Deschanvres, “Cinetique de croissance des cristaux de CW
dans le cobalt.,” Mem. Sci. Rev. Metall., vol. 69, no. 6, pp. 465–478, 1972.
[85] H. E. Exner, “Physical and chemical nature of cemented carbides,” Int. Met. Rev., vol. 24, no.
1, pp. 149–173, 1979.
[86] R. Deshmukh and J. Gurland, “Study of the microstructural development during the liquid-
phase sintering of WC-Co alloys,” in Institute of Physics Conference Series, 1986, pp. 347–
358.
[87] M. Walbrühl, A. Blomqvist, and P. A. Korzhavyi, “Atomic diffusion in liquid nickel : First-
principles modeling Atomic diffusion in liquid nickel : First-principles modeling,” vol. 244503,
2018, doi: 10.1063/1.5026348.
[88] M. Soustelle, “Mécanismes réactionnels et cinétique chimique.” Lavoisier, 2011.
[89] M. Hillert, “On the theory of normal and abnormal grain growth,” Acta Metall., vol. 13, no. 3,
pp. 227–238, 1965, doi: https://doi.org/10.1016/0001-6160(65)90200-2.
[90] J. Sautereau and A. Mocellin, “Sintering behaviour of ultrafine NbC and TaC powders,” J.
Mater. Sci., vol. 9, no. 5, pp. 761–771, 1974, doi: 10.1007/BF00761796.
[91] J. D. Powers and A. M. Glaeser, “Grain boundary migration in ceramics,” Interface Sci., vol. 6,
no. 1–2, pp. 23–39, 1998, doi: 10.1023/a:1008656302007.
[92] H. E. Exner, “The influence of sample preparation on the surface stress state and palmqvist’s
method for toughness testing of cemented carbides,” Div. Eng. Brown Univ., 1968.
[93] I. M. Ogilvy, C. M. Perrott, and J. W. Suiter, “On the indentation fracture of cemented carbide
part 1 - Survey of operative fracture modes,” Wear, vol. 43, pp. 239–252, 1977.
[94] C. M. Perrott, “On the indentation fracture of cemented carbide II - The nature of surface
fracture toughness,” Wear, vol. 47, pp. 81–91, 1978.
[95] K. Niihara, “A fracture mechanics analysis of indentation-induced Palmqvist cracks in
ceramics,” J. Mater. Sci. Lett., vol. 2, pp. 221–223, 1983.
[96] R. Warren and H. Matzke, “Identation testing of a broad range of cemented carbides,” in
Science of Hard Materials, 1983, pp. 563–582.
[97] G. I. Barenblatt, “The mathematical theory of equilibrium cracks in brittle fracture,” in
Advances in Applied Mechanics, 1962, pp. 55–125.
[98] J. Tweed, “The stress intensity factor of a Griffith crack which is opened by a thin symmetric
wedge,” J. Elast., vol. 1, no. 1, pp. 29–35, 1971.
[99] “ISO 28079:2009 Hardmetals — Palmqvist toughness test,” 2009.
[100] J. M. Missiaen and S. Rolland du Roscoat, “Analyse quantitative des microstructures.” Cours
école doctorale IMEP-2, Univ. Grenoble Alpes, 2018.
[101] N. Eustathopoulos, M. G. Nicholas, and B. B. Drevet, Wettability at high temperatures.
Oxford, 1999.

Appendix 1 – Literature summary table
153
Appendix 1 – Literature summary table
Table A1-1 presents a recap of the different binder and secondary additions that have been used in NbC
alloys in the literature, with the corresponding sintering parameters, grain size and shape and mechanical
properties (hardness and toughness).
Table A1-1 Summary table of NbC-based hardmetals and corresponding properties studied.
Binder Additive(s) Sintering parameters Grain size
(µm) Grain shape
Hardness
(GPa)
Toughness
(MPa.m0.5)
Year &
Source T (°C) Time (h) Atmosphere
Co (21wt%)
-
1420 0
Vacuum
4.8 c-r - -
1968
Warren [5]
1420 0.25 9.0 c-r c-a - -
1420 0.5 11.7 c-r - -
1420 2 17.6 c-r c-a - -
1420 5 23.9 c-r - -
1400 0.8 11.8 c-r c-a - -
1450 0.8 15.5 c-r - -
1.25wt%NbB2 1420 0.83 15.7 p-r - -
1420 2 19.2 p-r - -
3.75wt% NbB2
1420 0 7.2 p-r p-a - -
1420 0.25 10.0 p-a - -
1420 0.8 13.0 p-r - -
1420 2 16.0 p-r - -
1420 5 20.2 p-r - -
2wt%TiC 1420 0.8 11.2 c-a - -
5wt%TiC
1420 0.25 5.0 c-a - -
1420 0.8 7.2 c-a - -
1420 2 10.7 c-a - -
1420 5 12.0 c-a - -
1450 0.8 9.1 c-a - -
1480 0.8 11.3 c-a - -
5wt%WC
1420 0.25 7.4 p-r - -
1420 0.84 9.8 p-r p-a - -
1420 2 12.8 p-r p-a - -
0.976wt%Nb
1420 0.25 10.0 p-r - -
1420 0.8 14.0 p-r - -
1420 2 17.7 p-r - -
0.08wt%C 1420 0.85 12.5 c-r c-a - -
Ni
(22wt%) -
1380 0
Vacuum
(~10-4 torr)
4.4
c-r
- -
1969 Warren
[6]
1380 0.25 6.6 - -
1380 0.8 9.3 - -
1380 2 12.2 - -
1380 3.75 14.9 - -
1440 0.8 11.4 - -
1480 0.5 12.0 - -
Fe
(22wt%) -
1500 0 5.8
c-r
- -
1500 0.25 8.0 - -
1500 0.8 10.1 - -
1500 2 13.4 - -
Co
(20vol%) -
1420 0.8
Vacuum
(1.33 mN/m²)
13.5
c-r
- -
1972
Warren [8]
1420 2 18.0 - -
1450 0.8 15.8 - -
1450 1.67 20.0 - -
1450 2 20.8 - -
1450 3.67 25.7 - -
1500 0.8 20.5 - -
1500 2 26.6 - -

Appendix 1 – Literature summary table
154
Co
(20vol%) -
1550 0.8 Vacuum
(1.33 mN/m²)
23.7
c-r
- - 1972
Warren
[8] 1550 2 31.8 - -
Fe (30wt%)
- 1450 1
Vacuum
12 faceted - - 2000
Oh
[46]
3wt%B 1450 1 17 s - -
Fe (50wt%)
- 1450 1
12 faceted - -
Co (30wt%) -
1400 0.08
Vacuum
(~10Pa)
4
c-a
- -
2001
Moon [55]
1400 0.33 5.8 - -
1400 1 8.8 - -
1400 2 11.1 - -
1450 0.08 5.0 - -
1450 0.33 6.2 - -
1450 1 9.4 - -
1450 2 12.2 - -
1500 0.08 6.2 - -
1500 0.33 8.6 - -
1500 1 11.0 - -
1500 2 13.4 - -
1550 0.08 8.2 - -
1550 0.33 10.2 - -
1550 1 12.8 - -
1550 2 15.4 - -
Co (30wt%) 2.3wt%B
1400 0.08
Vacuum
(~10Pa)
7.4
c-r
- -
1400 0.33 9.2 - -
1400 1 13.6 - -
1400 2 15.4 - -
1450 0.08 8.2 - -
1450 0.33 12.0 - -
1450 1 14.6 - -
1450 2 17.4 - -
1500 0.08 9.8 - -
1500 0.33 12.6 - -
1500 1 18.4 - -
1500 2 22.2 - -
1550 0.08 11.6 - -
1550 0.33 14.4 - -
1550 1 20.4 - -
1550 2 26.0 - -
Co (30wt%) 3wt%B
1400 0.08
Vacuum
(~10Pa)
7.8
s
- -
1400 0.33 10.4 - -
1400 1 15.4 - -
1400 2 19.1 - -
1450 0.08 8.6 - -
1450 0.33 12.5 - -
1450 1 17.5 - -
1450 2 21.1 - -
1500 0.08 10 - -
1500 0.33 14.1 - -
1500 1 19.1 - -
1500 2 23.8 - -
1550 0.08 11.4 - -
1550 0.33 14.5 - -
1550 1 19.6 - -
1550 2 24.8 - -
Co (24.5wt%)
- 1360 1
Vacuum
4.2 c-r HV10 = 11.4 7.2
2007
Huang [27]
4wt%WC 1360 1 4.4
Rounder + Core-rim
structure
HV10 = 11.8 7.9
7wt%WC 1360 1 4.5 HV10 = 11.8 7.7
10wt%WC 1360 1 4.5 HV10 = 12.2 8.1
20wt%WC 1360 1 3.0 HV10 = 12.3 8.3
30wt%WC 1360 1
2.8 HV10 = 12.2 8.7

Appendix 1 – Literature summary table
155
Co
(12vol%)
- 1420 1
Vacuum
(~7Pa)
- Irregular HV10 = 12.2 6.3
2014
Huang [58]
0.9vol%Cr3C2 1420 1 - s HV10 = 12.6 6.4
Fe
(12vol%) -
1420 1 5-20 p-r HV10 = 12.9 7.1
Fe-25at%Al
(12vol%) -
1420 1 5-10 Al2O3 phase HV10 = 13.7 5.9
Fe-50at%Al (12vol%)
- 1420 1
5-10 Al2O3 phase HV10 = 15.2 5.1
Ni-25at%Al
(12vol%) -
1420 1 5-10 Al2O3 phase HV10 = 13.6 5.7
Ni
(12vol%) -
1420 1 < 15 c-r HV10 = 12.2 12.0
Ni
(15vol%)
5vol%Mo2C 1420 1 < 3 - HV10 = 13.5 8.2
8.5vol%Mo2C + 8.5vol%WC
1420 1 1-2 - HV10 = 13.6 10.1
8.5vol%Mo2C +
8.5vol%WC +
8.5vol%TiC
1420 1
- - HV10 = 15.5 7.8
8.5vol%Mo2C + 8.5vol%WC +
17vol%TiC
1420 1 - - HV10 = 14.9 8.6
Co (12wt%)
- 1420 1
Vacuum
8.8 c-r HV10 = 12.3 6.3
2015
Huang
[22]
5wt%WC
1420 1
6.6
Rounder +
Core-rim structure
HV10 = 12.2 8.3
5wt%VC 1420 1 3.8 c HV10 = 14.1 6.4
5wt%Mo2C 1420 1 3.8 c HV10 = 13.6 7.4
Co (12vol%)
- 1420 1
Vacuum ~20Pa
- - HV30 = 11.3 7.2
2017
Huang
[57]
5vol%VC 1420 1 - - HV30 = 13.1 7.6
10vol%VC 1420 1 HV30 = 13.8 7.4
5vol%Mo2C 1420 1 - - HV30 = 14.0 6.3
10vol%Mo2C 1420 1 HV30 = 14.4 7.3
4vol%VC +
4vol%Mo2C
1420 1 - - HV30 = 13.9 7.5
Ni
(12vol%)
- 1420 1 5-20 c-r HV30 = 10.6 9.1
5vol%VC 1420 1
< 10
- HV30 = 13.0 11.1
10vol%VC 1420 1 - HV30 = 13.3 11.3
15vol%VC 1420 1 - HV30 = 13.3 10.4
5vol%Mo2C 1420 1
0.5-5
- HV30 = 12.7 10.1
10vol%Mo2C 1420 1 - HV30 = 13.3 9.9
15vol%Mo2C 1420 1 - HV30 = 13.9 8.1
4vol%VC + 4vol%Mo2C
1420 1 0.5-5 - HV30 = 13.6 9.4
Ni
(20vol%)
4vol%VC +
4vol%Mo2C
1420 1 < 5 - HV30 = 10.7 15
Ni
(12vol%)
- 1420 1
Vacuum 7Pa
5-20 c-r HV10 = 11.1 11.8
2016
Huang [62]
30mol%Al 1420 1 <10 more faceted HV10 = 13.3 6.4
4vol%Mo2C +
4vol%WC + 4vol%VC
1420 1
0.5-2 rounder HV10 = 14.6 9.2
Ni
(12vol%)
- 1420 1
Vacuum
~20Pa
7.7 c-r HV30 = 10.2 10.6
2018 Huang
[39]
5vol% VC 1420 1
2.3
- HV30 = 11.5 12.9
7.5vol% VC 1420 1 - HV30 = 12.1 9.9
10vol% VC 1420 1 - HV30 = 12.3 9.7
5vol% Mo2C 1420 1
2.0
- HV30 = 12.4 9.0
7.5vol% Mo2C 1420 1 - HV30 = 13.1 9.2
10vol% Mo2C 1420 1 - HV30 = 13.3 8.9
10vol%TiC + 7.5vol%VC
1420 1 1.3
Core-rim structure
HV30 = 13.4 8.7
10vol%TiC +
7.5vol%Mo2C
1420 1 0.9
Core-rim
structure HV30 = 14.0 8.5
Ni
(12vol%)
- 1420 1 Vacuum
~20Pa
- c-r + Graphite HV30 = 8.4 14 2018
Huang [35]
4vol%NbH2 1420 1 - Rounder HV30 = 12.1 11.0
2vol%NbH2 1420 1 - Rounder HV30 = 10.7 9.6
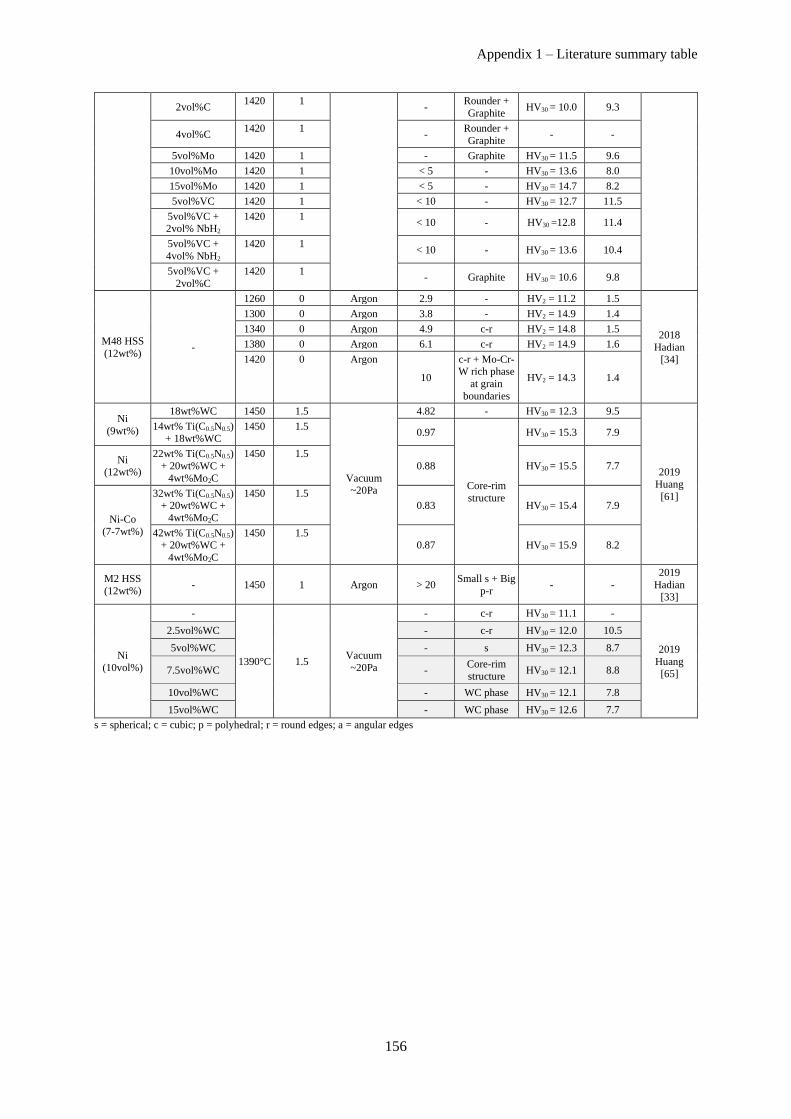
Appendix 1 – Literature summary table
156
2vol%C 1420 1
- Rounder +
Graphite HV30 = 10.0 9.3
4vol%C 1420 1
- Rounder +
Graphite - -
5vol%Mo 1420 1 - Graphite HV30 = 11.5 9.6
10vol%Mo 1420 1 < 5 - HV30 = 13.6 8.0
15vol%Mo 1420 1 < 5 - HV30 = 14.7 8.2
5vol%VC 1420 1 < 10 - HV30 = 12.7 11.5
5vol%VC + 2vol% NbH2
1420 1 < 10 - HV30 =12.8 11.4
5vol%VC +
4vol% NbH2
1420 1 < 10 - HV30 = 13.6 10.4
5vol%VC +
2vol%C
1420 1 - Graphite HV30 = 10.6 9.8
M48 HSS
(12wt%) -
1260 0 Argon 2.9 - HV2 = 11.2 1.5
2018
Hadian
[34]
1300 0 Argon 3.8 - HV2 = 14.9 1.4
1340 0 Argon 4.9 c-r HV2 = 14.8 1.5
1380 0 Argon 6.1 c-r HV2 = 14.9 1.6
1420 0 Argon
10
c-r + Mo-Cr-W rich phase
at grain
boundaries
HV2 = 14.3 1.4
Ni
(9wt%)
18wt%WC 1450 1.5
Vacuum ~20Pa
4.82 - HV30 = 12.3 9.5
2019
Huang
[61]
14wt% Ti(C0.5N0.5) + 18wt%WC
1450 1.5 0.97
Core-rim
structure
HV30 = 15.3 7.9
Ni (12wt%)
22wt% Ti(C0.5N0.5)
+ 20wt%WC +
4wt%Mo2C
1450 1.5
0.88 HV30 = 15.5 7.7
Ni-Co
(7-7wt%)
32wt% Ti(C0.5N0.5) + 20wt%WC +
4wt%Mo2C
1450 1.5 0.83 HV30 = 15.4 7.9
42wt% Ti(C0.5N0.5) + 20wt%WC +
4wt%Mo2C
1450 1.5 0.87 HV30 = 15.9 8.2
M2 HSS
(12wt%) - 1450 1 Argon > 20
Small s + Big
p-r - -
2019
Hadian
[33]
Ni
(10vol%)
-
1390°C 1.5 Vacuum
~20Pa
- c-r HV30 = 11.1 -
2019
Huang [65]
2.5vol%WC - c-r HV30 = 12.0 10.5
5vol%WC - s HV30 = 12.3 8.7
7.5vol%WC - Core-rim
structure HV30 = 12.1 8.8
10vol%WC - WC phase HV30 = 12.1 7.8
15vol%WC - WC phase HV30 = 12.6 7.7
s = spherical; c = cubic; p = polyhedral; r = round edges; a = angular edges
Appendix 2 – Toughness from Vickers indentations
157
Appendix 2 – Toughness from Vickers indentations
It has been shown by Shetty et al that the resulting cracks of the Vickers indentation are a good indication
of the toughness of the material [64]. Their aim was to combine existing theories and experimental
results on WC-Co materials in order to determine which was the right way to link the characteristics of
the Palmqvist cracks to the toughness of the material.
Exner [92] first defined a crack resistance W based on the relationship between the indentation load P
and the mean radial crack length �̅�, as presented in formula (A2-1).
This formula is valid for low-binder content cermets (less than 10%). For higher contents, the
experimental results of Ogilvy and Perrott [93][94] show that the formula (A2-2) that takes into account
the threshold indentation load for cracking P0 is more appropriate.
The question that remains is how to link the crack resistance W to the fracture toughness KIc. It was
suggested by Niihara [95] and Warren and Matzke [96] that this dependence would take the following
formula (A2-3).
where β is a non-dimensional constant dependent, according to Niihara’s model [95], on the ratio of
Young’s modulus (E) and the hardness (H).
To determine KIc, it is necessary to identify β. An example of Palmqvist crack is presented in Figure A2-1.
Its 3D shape makes it difficult to analyze, especially because it is complicated to measure the depth of the
crack.
However, the Palmqvist crack can be realistically represented as two-dimensional through cracks in
equilibrium with a wedge of height 2h as illustrated in Figure A2-1 and Figure A2-2 rather than three-
dimensional surface cracks. Taking this simplification of shape into account, formula (A2-4) has been
determined by Barenblatt [97] and Tweed [98]. For a diamond pyramid indentation, the toughness will then
be given by the formula (A2-5).
where ν is Poisson’s ratio and ψ is the apex angle of the indent.
𝑊 = 𝑃
4�̅� (A2-1)
𝑊 = 𝑃 − 𝑃04�̅�
(A2-2)
𝐾𝐼𝑐 = 𝛽(𝐻𝑊)1/2 (A2-3)
𝐾𝐼𝑐 = 𝐸ℎ
(1 − 𝜈2)(2𝜋�̅�)1/2 (A2-4)
𝐾𝐼𝑐 =1
3(1 − 𝜈2)(21/2𝜋 tan𝜓)1/3(𝐻𝑃)1/2
(4�̅�)1/2 (A2-5)

Appendix 2 – Toughness from Vickers indentations
158
This formula (A2-6) can be approximated as formula (A2-6) [99].
where L is the total length of the four edges cracks cumulated.
Figure A2-1 Palmqvist cracks in a WC-5.1vol.%Co cermet indented at a load of 1200 N [64].
Figure A2-2 The Palmqvist indentation crack (a) and the equivalent wedge-loaded crack
analogue (b) used in the analysis [64].
(a) (b)
𝐾𝐼𝑐 = 0.0028(𝐻𝑃)1/2
(4𝐿)1/2 (A2-6)

Appendix 3 – Thermodynamic calculations
159
Appendix 3 – Thermodynamic calculations
The different steps of calculation of the curves presented in part II.B.1 are detailed in this part. The
standard Gibbs free energies are calculated depending on the temperature with Eq. (A3-1).
∆𝐺0(𝑇) ≈ ∆𝐻0(25°𝐶) − 𝑇∆𝑆0(25°𝐶) (A3-1)
For each given oxidation reaction, the constants of reaction K depending on the temperature are
calculated with Eq. (A3-2).
𝐾 = 𝑒−∆𝐺0(𝑇)𝑅𝑇 (A3-2)
For a H2 reducing agent, the considered reactions are (A3-3) and (A3-4), with the corresponding reaction
constants K1 and K2.
2
𝑀𝐶 + 𝑂2 →
2
𝑀𝑂𝑥 +
2
𝐶 K1 (A3-3)
2𝐻2 + 𝑂2 → 2 𝐻2𝑂 K2 (A3-4)
From the reaction constants, the different gas pressures depending on the temperature can be calculated
according to (A3-5) and (A3-6).
𝑃(𝑂2) = 1
𝐾1 (A3-5)
𝑃(𝐻2𝑂)
𝑃(𝐻2)= (
𝐾2𝐾1)0.5
(A3-6)
For a fixed value of P(H2), P(H2O) can be drawn depending on the temperature.
For a C reducing agent, the considered reactions are (A3-7), (A3-8) and (A3-9), with the corresponding
reaction constants K1, K3 and K4.
2
𝑀𝐶 + 𝑂2 →
2
𝑀𝑂𝑥 +
2
𝐶 K1 (A3-7)
𝐶 + 𝑂2 → 𝐶𝑂2 K3 (A3-8)
2 𝐶 + 𝑂2 → 2 𝐶𝑂 K4 (A3-9)
From the reaction constants, the different gas pressures are plotted as a function of the temperature
according to (A3-10), (A3-11) and (A3-12).
𝑃(𝑂2) = 1
𝐾1 (A3-10)

Appendix 3 – Thermodynamic calculations
160
𝑃(𝐶𝑂2) = 𝐾3𝐾1
(A3-11)
𝑃(𝐶𝑂) = (𝐾4𝐾1)0.5
(A3-12)
Therefore, P(CO) and P(CO2) can be plotted as a function of the temperature.

Appendix 4 – EBSD data treatment
161
Appendix 4 – EBSD data treatment
This appendix aims to present the different steps of the processing of EBSD maps in this study, along with
the Aphelion code which was used.
A4.1 Data cleaning and pre-processing
Figure A4-1 presents the different steps of data cleaning and pre-processing performed with the software
OIM analysis 8. First, a cleaning is performed in order to remove noise and unattributed pixels. Then,
the nickel binder is manually removed. It could not be done by EBSD species identification as the
Kikuchi lines of Ni and NbC overlap. Therefore, the entire map’s orientation is NbC indexation. A
condition on the image quality is then applied to remove any points that could not be identified as NbC
with certainty, such as for example points corresponding to alumina particles from polishing. Every
points with a quality index (IQ) below 0.3 is removed. Finally, grain boundaries are drawn for a
disorientation of two neighboring grains above 2°. This low value was chosen after observing that some
grain boundaries have a very low disorientations (< 5°) as presented in Figure A4-2.
Figure A4-1 Data cleaning and pre-processing of an EBSD map of a NbC-12vol%Ni sample
sintered 1h at 1360°C in vacuum, (a) Initial map, (b) Cleaned map, (c) Cleaned map without
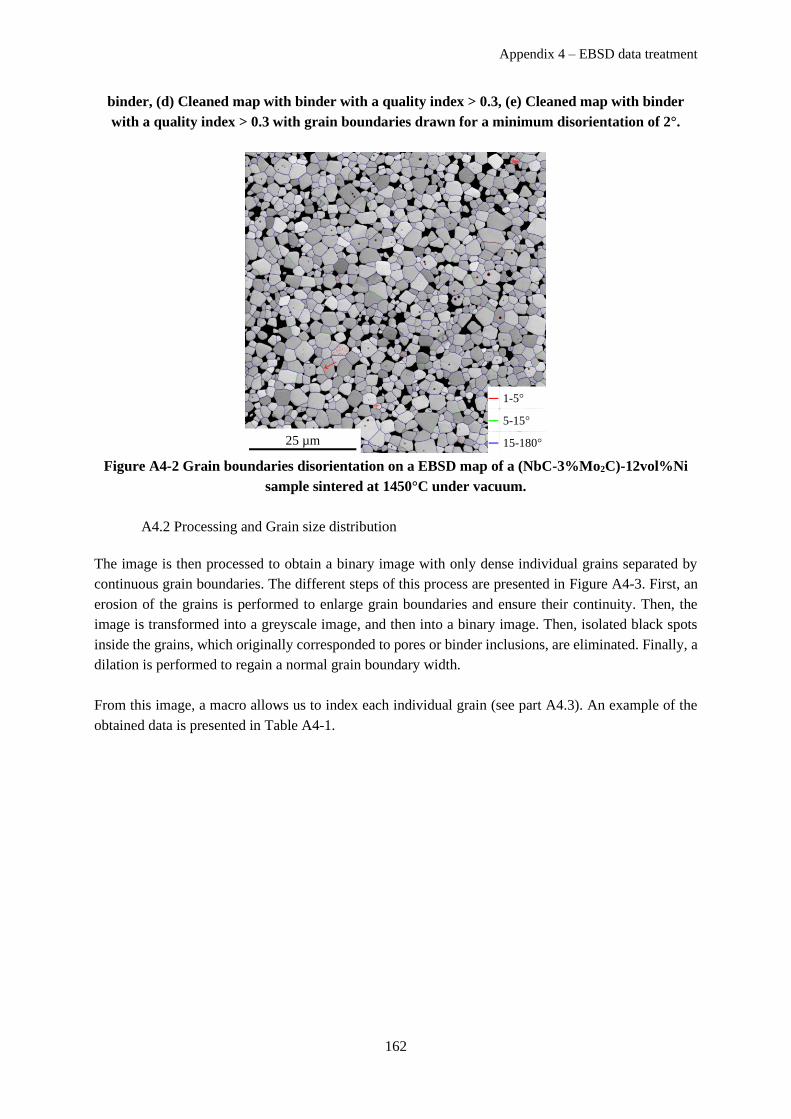
Appendix 4 – EBSD data treatment
162
binder, (d) Cleaned map with binder with a quality index > 0.3, (e) Cleaned map with binder
with a quality index > 0.3 with grain boundaries drawn for a minimum disorientation of 2°.
Figure A4-2 Grain boundaries disorientation on a EBSD map of a (NbC-3%Mo2C)-12vol%Ni
sample sintered at 1450°C under vacuum.
A4.2 Processing and Grain size distribution
The image is then processed to obtain a binary image with only dense individual grains separated by
continuous grain boundaries. The different steps of this process are presented in Figure A4-3. First, an
erosion of the grains is performed to enlarge grain boundaries and ensure their continuity. Then, the
image is transformed into a greyscale image, and then into a binary image. Then, isolated black spots
inside the grains, which originally corresponded to pores or binder inclusions, are eliminated. Finally, a
dilation is performed to regain a normal grain boundary width.
From this image, a macro allows us to index each individual grain (see part A4.3). An example of the
obtained data is presented in Table A4-1.
25 µm
1-5°
5-15°
15-180°
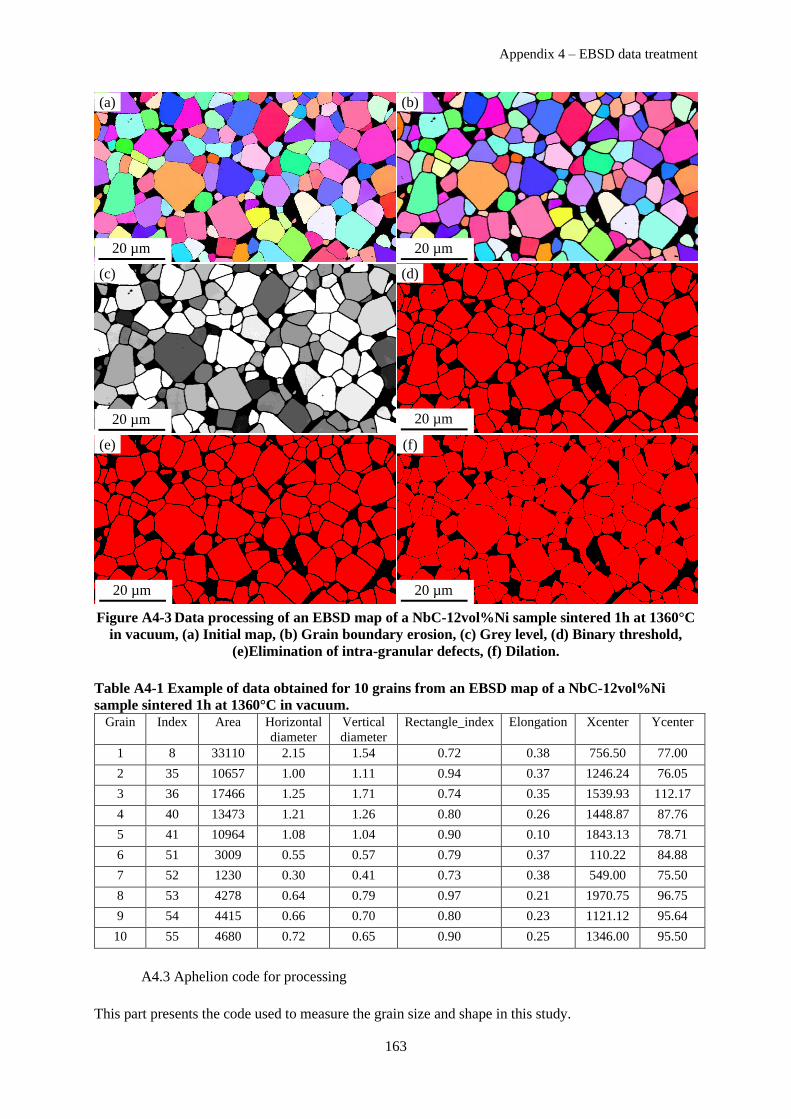
Appendix 4 – EBSD data treatment
163
Figure A4-3 Data processing of an EBSD map of a NbC-12vol%Ni sample sintered 1h at 1360°C
in vacuum, (a) Initial map, (b) Grain boundary erosion, (c) Grey level, (d) Binary threshold,
(e)Elimination of intra-granular defects, (f) Dilation.
Table A4-1 Example of data obtained for 10 grains from an EBSD map of a NbC-12vol%Ni
sample sintered 1h at 1360°C in vacuum.
Grain Index Area Horizontal
diameter
Vertical
diameter
Rectangle_index Elongation Xcenter Ycenter
1 8 33110 2.15 1.54 0.72 0.38 756.50 77.00
2 35 10657 1.00 1.11 0.94 0.37 1246.24 76.05
3 36 17466 1.25 1.71 0.74 0.35 1539.93 112.17
4 40 13473 1.21 1.26 0.80 0.26 1448.87 87.76
5 41 10964 1.08 1.04 0.90 0.10 1843.13 78.71
6 51 3009 0.55 0.57 0.79 0.37 110.22 84.88
7 52 1230 0.30 0.41 0.73 0.38 549.00 75.50
8 53 4278 0.64 0.79 0.97 0.21 1970.75 96.75
9 54 4415 0.66 0.70 0.80 0.23 1121.12 95.64
10 55 4680 0.72 0.65 0.90 0.25 1346.00 95.50
A4.3 Aphelion code for processing
This part presents the code used to measure the grain size and shape in this study.
(a) (b)
(c) (d)
(e) (f)
20 µm
20 µm 20 µm
20 µm20 µm
20 µm
Appendix 4 – EBSD data treatment
164
'**********************************************************************************
'Analyse individuelle version du 30-04-19 (travail avec des images couleur)
'**********************************************************************************
Sub main
'Declarations
Const crlf = chr$(13) + chr$ (10)
Dim fichimage As String, image As String, imagedir As String, sauvdir As String, taille As String
Dim ul(0 to 1) As Long, dr(0 to 1) As Long
Dim size() As Long
Dim pixelx, pixely as Double
Dim aire As Double, airemasque As Double
Dim indexes() As Long
Dim diameter() As Single, centre() As Single
Dim n_exclus As Double, n_compte As Double
' PRELIMINAIRES
'Viewmacro = AphViewId("4_Analyse_individuelle_fichier")
'AphViewMinimize Viewmacro
AphImgFreeAll
'AphDeferRefresh 1
u$="µm"
n_exclus=0
n_compte=0
repertoiredir$="C:\Users\Utilisateur\Documents\Data\Mathilde\Aphelion\"
chDir repertoiredir$
'**********************************************************************************
'Lecture des données du fichier text
'**********************************************************************************
donnees = repertoiredir$ & "donnees_ana_individuelle.txt"
Open donnees For Input As #1
Line Input #1, imagedir$
Line Input #1, pixx$
Line Input #1, pixy$
Line Input #1, fich$
Appendix 4 – EBSD data treatment
165
Close #1
'**********************************************************************************
'Boucle de lecture des noms de fichier image
'**********************************************************************************
ChDrive("C")
chDir imagedir$
fichimage$ = Dir$("*.tif")
nchamps = 0
While (fichimage$ <> "")
nchamps = nchamps + 1
fichimage$=dir$
WEnd
'**********************************************************************************
'Création du fichier de sauvegarde
'**********************************************************************************
ChDrive("C")
chDrive repertoiredir$
sauvdir$ = repertoiredir$
fichier_sauvegarde = sauvdir$ & fich$ & ".tdg"
open fichier_sauvegarde For Output Access Write As #1
Write #1,"Mesure de taille et de géométrie des grains de NbC dans les carbures cémentés"
write #1,
write #1, imagedir$
Write #1,"Nombre d'images", nchamps
Write #1,
write #1, "taille du pixel", pixx$, u$
'**********************************************************************************
'Boucle sur les images
'**********************************************************************************
'Initialisation des images
Initiale = AphImgNew("Initiale")
InitialeBW = AphImgNew("InitialeBW")
Appendix 4 – EBSD data treatment
166
Threshold = AphImgNew("Threshold")
Erode = AphlmgNew("Erode")
Separee = AphImgNew("Separee")
Separee2 = AphImgNew("Separee2")
Separee3 = AphImgNew("Separee3")
Grains = AphObjNew("Grains")
ChDrive("C")
chDir imagedir$
fichimage$ = Dir$("*.tif")
While (fichimage$ <> "")
write #1,
write #1,
write #1,
Write #1,fichimage$
Write #1,
write #1,"Grain", "Index","Aire","Diametre horizontal","Diametre
vertical","Rectangle_indice","Elongation","Xcentre","Ycentre"
AphImgRead Initiale, imagedir & fichimage
'Taille de l'image
AphImgGetSize Initiale, size
xsize=size(0)
ysize=size(1)
'Calibration
AphImgSetCalibrationUnit Initiale, 0, u$
AphImgSetCalibrationUnit Initiale, 1, u$
'Calibrage de l'axe x
AphImgSetCalibrationScale Initiale,0, pixx
'Calibrage de l'axe Y
AphImgSetCalibrationScale Initiale,1, pixy
'Début du traitement
AphImgSplitBands Initiale, InitialeBW, 0
AphImgThreshold InitialeBW, Threshold, Aph4Interval(1,255)

Appendix 4 – EBSD data treatment
167
Aph4ImgErode Threshold, Erode, pseSquare, 3
Aph4ImgDilateReconsClose Erode, Separee, pseSquare, 9, pngSquare8
Aph4ImgDilate Separee, Separee2, pseSquare, 3
Aph4ImgSplitConvex Separee2, Separee3, 10, pngSquare8
AphImgClustersObj Separee3, Grains, AphNamedNgbGraph("2D 8-connected")
AphObjGetIndexList Grains, indexes
NbVoisins = UBound(indexes)
AphObjShape Grains, "REGION"
AphObjComputeMeasurements Initiale, Grains, AphMeasurementSet()
for i = 0 to NbVoisins
Area = AphObjGetAttributeD( Grains, indexes(i), "AREA")
Hauteur = AphObjGetAttributeD( Grains, indexes(i), "MBR_HEIGHT")
Largeur = AphObjGetAttributeD( Grains, indexes(i), "MBR_WIDTH")
Rectangle_indice = Hauteur / Largeur
Elong_indice = AphObjGetAttributeD( Grains, indexes(i), "ELONGATION")
AphObjGetAttributeA Grains, i+1, "MBR_DIAMETERS", diameter
AphObjGetAttributeA Grains, i+1, "MBR_CENTER", centre
Diametre_X= diameter(0) * pixx
Diametre_Y= diameter(6) * pixy
Centre_X= centre(0)
Centre_Y= centre(1)
'Sauvegarde des résultats
If Centre_X > 70 And Centre_X < xsize-70 And Centre_Y > 70 And Centre_Y < ysize-70 Then
n_compte = n_compte + 1
Write #1,n_compte,indexes(i), Area, Diametre_X,Diametre_Y, Rectangle_indice,
Elong_indice, Centre_X, Centre_Y
Else n_exclus = n_exclus + 1
End If
Next
ntotal= n_compte + n_exclus
Write #1,
Write #1,
Write #1,"Nombre de Grains Exclus:", n_exclus

Appendix 4 – EBSD data treatment
168
Write #1,"Nombre Total de Grains:", ntotal
fichimage$ = Dir$
WEnd
'AphImgFreeAll
MsgBox("C'est fini")
End Sub
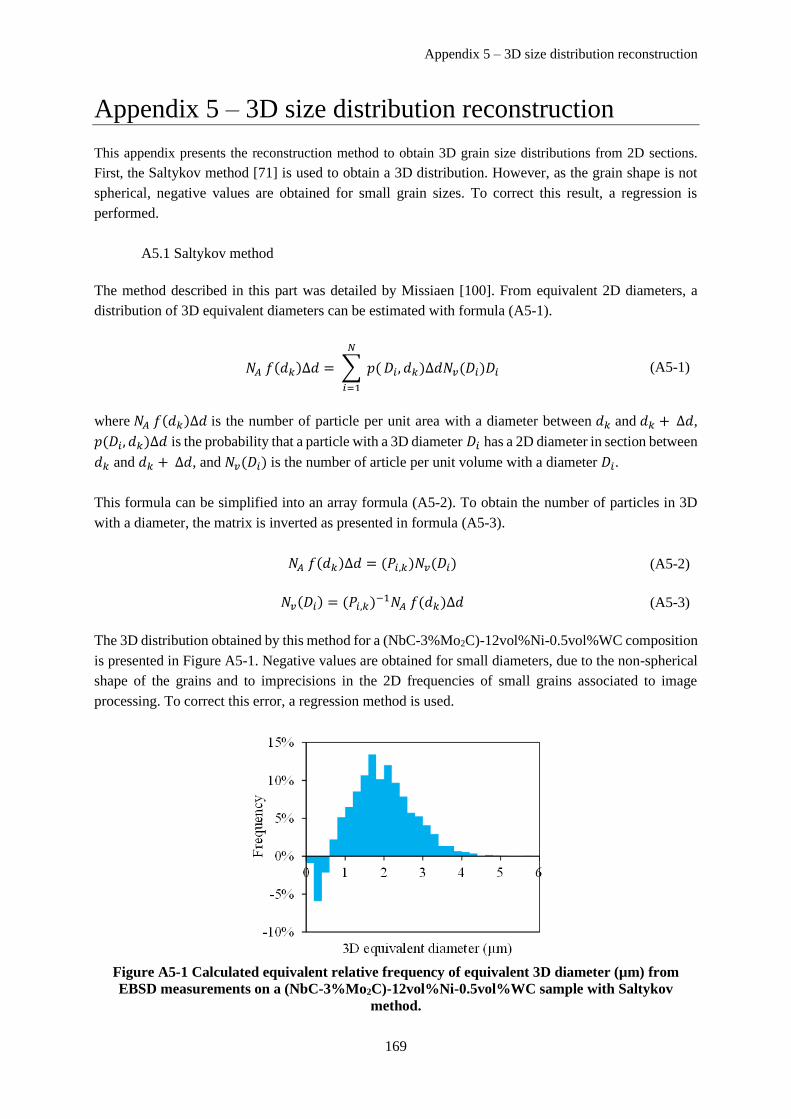
Appendix 5 – 3D size distribution reconstruction
169
Appendix 5 – 3D size distribution reconstruction
This appendix presents the reconstruction method to obtain 3D grain size distributions from 2D sections.
First, the Saltykov method [71] is used to obtain a 3D distribution. However, as the grain shape is not
spherical, negative values are obtained for small grain sizes. To correct this result, a regression is
performed.
A5.1 Saltykov method
The method described in this part was detailed by Missiaen [100]. From equivalent 2D diameters, a
distribution of 3D equivalent diameters can be estimated with formula (A5-1).
𝑁𝐴 𝑓(𝑑𝑘)∆𝑑 = ∑ 𝑝(
𝑁
𝑖=1
𝐷𝑖, 𝑑𝑘)∆𝑑𝑁𝑣(𝐷𝑖)𝐷𝑖 (A5-1)
where 𝑁𝐴 𝑓(𝑑𝑘)∆𝑑 is the number of particle per unit area with a diameter between 𝑑𝑘 and 𝑑𝑘 + ∆𝑑,
𝑝(𝐷𝑖, 𝑑𝑘)∆𝑑 is the probability that a particle with a 3D diameter 𝐷𝑖 has a 2D diameter in section between
𝑑𝑘 and 𝑑𝑘 + ∆𝑑, and 𝑁𝑣(𝐷𝑖) is the number of article per unit volume with a diameter 𝐷𝑖.
This formula can be simplified into an array formula (A5-2). To obtain the number of particles in 3D
with a diameter, the matrix is inverted as presented in formula (A5-3).
𝑁𝐴 𝑓(𝑑𝑘)∆𝑑 = (𝑃𝑖,𝑘)𝑁𝑣(𝐷𝑖) (A5-2)
𝑁𝑣(𝐷𝑖) = (𝑃𝑖,𝑘)−1𝑁𝐴 𝑓(𝑑𝑘)∆𝑑 (A5-3)
The 3D distribution obtained by this method for a (NbC-3%Mo2C)-12vol%Ni-0.5vol%WC composition
is presented in Figure A5-1. Negative values are obtained for small diameters, due to the non-spherical
shape of the grains and to imprecisions in the 2D frequencies of small grains associated to image
processing. To correct this error, a regression method is used.
Figure A5-1 Calculated equivalent relative frequency of equivalent 3D diameter (µm) from
EBSD measurements on a (NbC-3%Mo2C)-12vol%Ni-0.5vol%WC sample with Saltykov
method.

Appendix 5 – 3D size distribution reconstruction
170
A5.2 Regression method
The 3D distribution determined previously is used to recalculate a 2D distribution using formula (A5-
2). This distribution is then compared to the experimental 2D distribution by calculating the sum of the
squared deviation, with formula (A5-4).
𝜒² = ∑(𝑁𝐴𝑓(𝑑𝑡ℎ,𝑘)∆𝑑 − 𝑁𝐴𝑓(𝑑𝑒𝑥𝑝,𝑘)∆𝑑)
2
𝑁𝐴𝑓(𝑑𝑡ℎ,𝑘)∆𝑑
𝑁
𝑘=1
(A5-4)
where 𝑓(𝑑𝑡ℎ,𝑘) is the recalculated frequency of 2D diameters from the 3D distribution and 𝑓(𝑑𝑒𝑥𝑝,𝑘) is
the experimental frequency of 2D diameters.
Then, a regression is performed on the 3D distribution with two conditions: minimizing χ2 and having
only positive values in the 3D distribution. An example of obtained 3D distribution by this method is
presented in Figure A5-2.
Figure A5-2 Calculated equivalent relative frequency of equivalent 3D diameter (µm) from
EBSD measurements on a (NbC-3%Mo2C)-12vol%Ni-0.5vol%WC sample with Saltykov
method and regression.
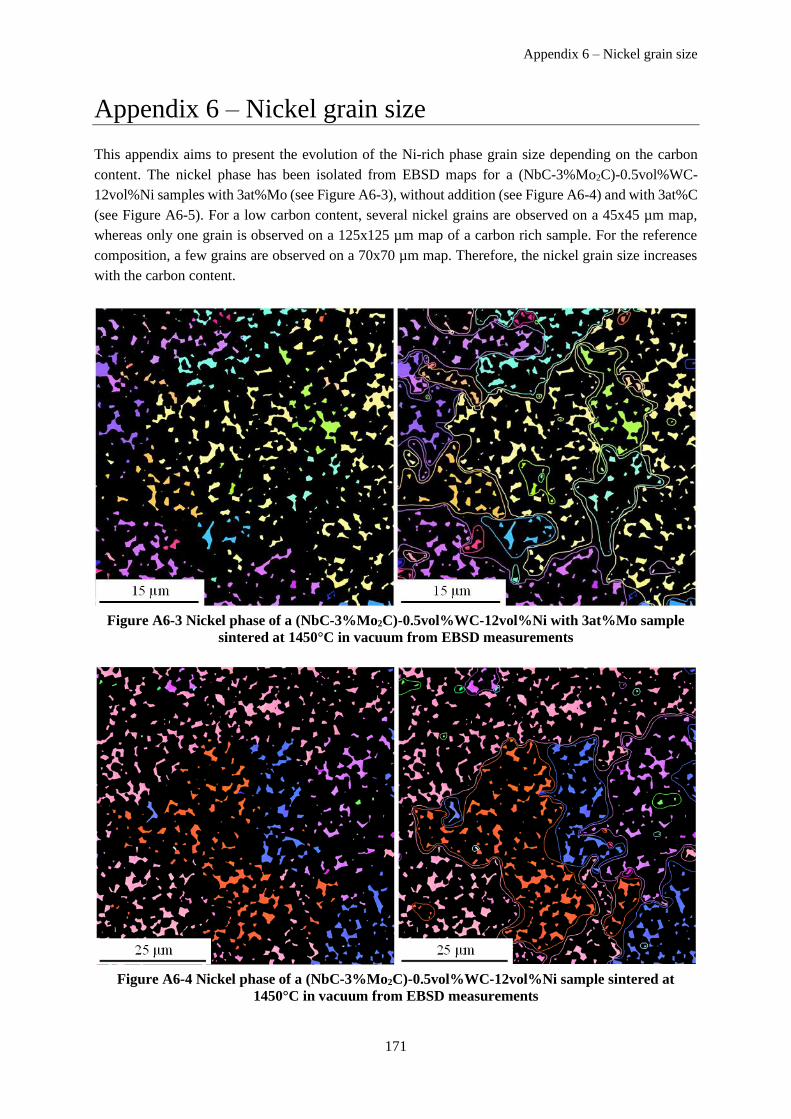
Appendix 6 – Nickel grain size
171
Appendix 6 – Nickel grain size
This appendix aims to present the evolution of the Ni-rich phase grain size depending on the carbon
content. The nickel phase has been isolated from EBSD maps for a (NbC-3%Mo2C)-0.5vol%WC-
12vol%Ni samples with 3at%Mo (see Figure A6-3), without addition (see Figure A6-4) and with 3at%C
(see Figure A6-5). For a low carbon content, several nickel grains are observed on a 45x45 µm map,
whereas only one grain is observed on a 125x125 µm map of a carbon rich sample. For the reference
composition, a few grains are observed on a 70x70 µm map. Therefore, the nickel grain size increases
with the carbon content.
Figure A6-3 Nickel phase of a (NbC-3%Mo2C)-0.5vol%WC-12vol%Ni with 3at%Mo sample
sintered at 1450°C in vacuum from EBSD measurements
Figure A6-4 Nickel phase of a (NbC-3%Mo2C)-0.5vol%WC-12vol%Ni sample sintered at
1450°C in vacuum from EBSD measurements
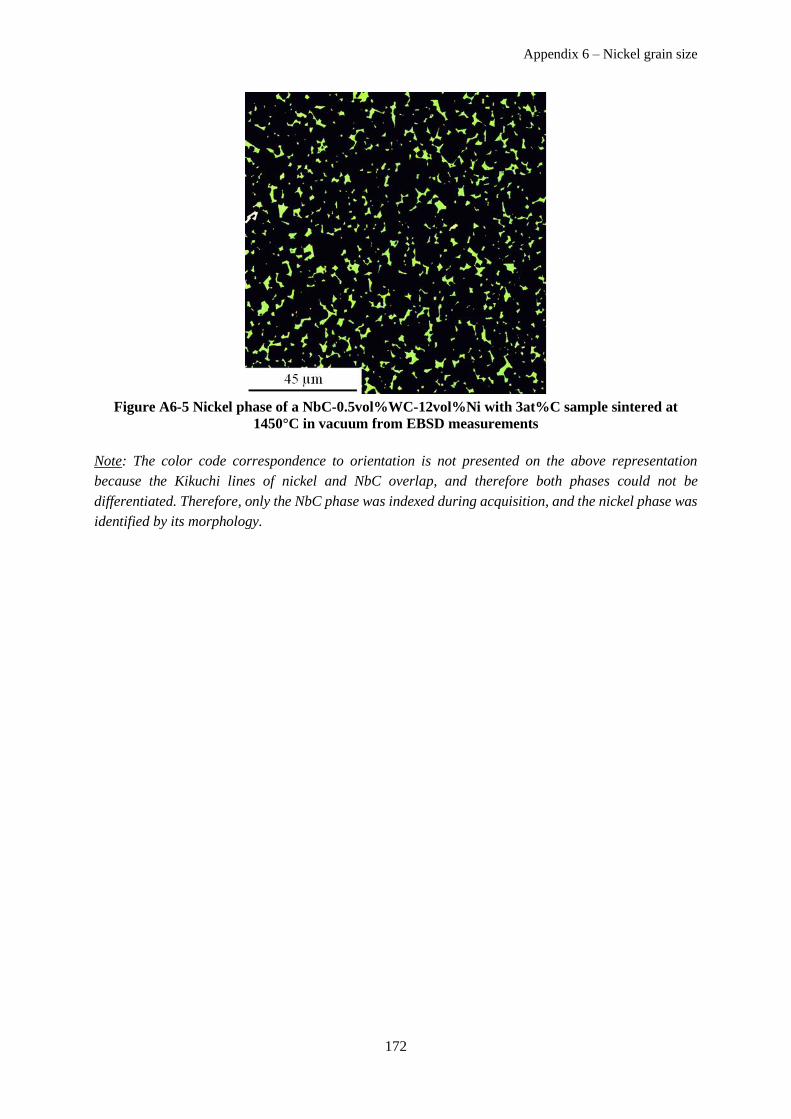
Appendix 6 – Nickel grain size
172
Figure A6-5 Nickel phase of a NbC-0.5vol%WC-12vol%Ni with 3at%C sample sintered at
1450°C in vacuum from EBSD measurements
Note: The color code correspondence to orientation is not presented on the above representation
because the Kikuchi lines of nickel and NbC overlap, and therefore both phases could not be
differentiated. Therefore, only the NbC phase was indexed during acquisition, and the nickel phase was
identified by its morphology.
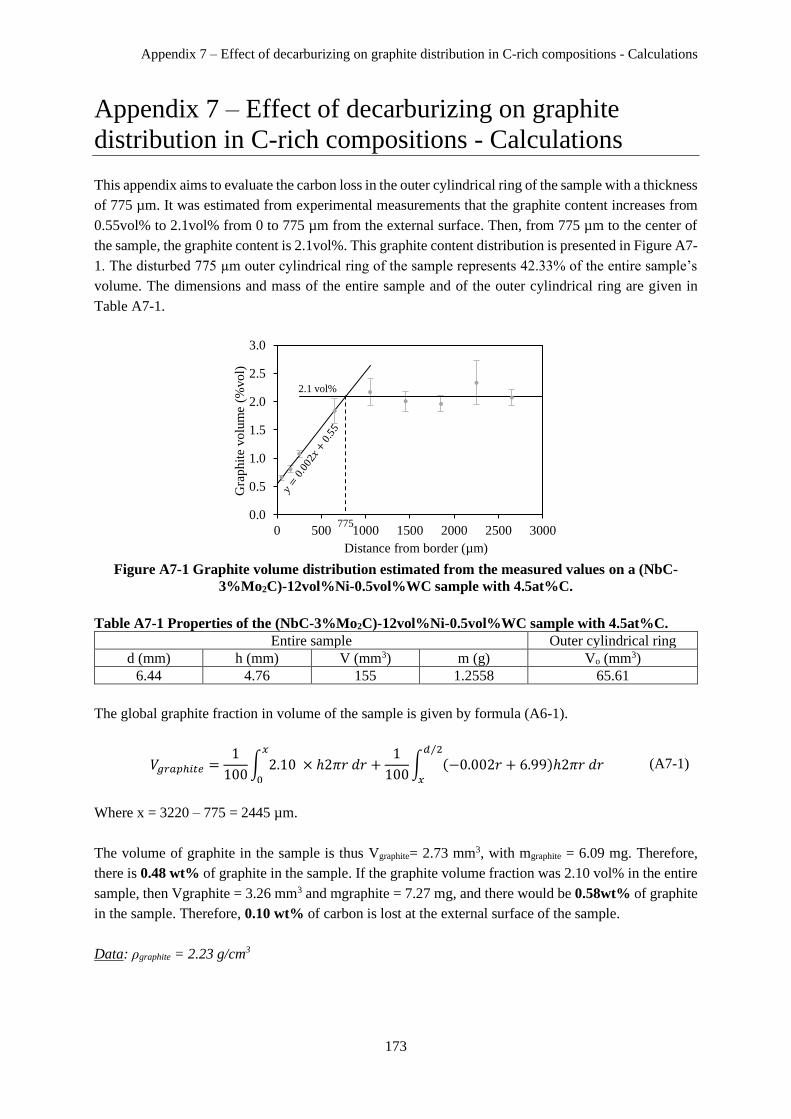
Appendix 7 – Effect of decarburizing on graphite distribution in C-rich compositions - Calculations
173
Appendix 7 – Effect of decarburizing on graphite
distribution in C-rich compositions - Calculations
This appendix aims to evaluate the carbon loss in the outer cylindrical ring of the sample with a thickness
of 775 µm. It was estimated from experimental measurements that the graphite content increases from
0.55vol% to 2.1vol% from 0 to 775 µm from the external surface. Then, from 775 µm to the center of
the sample, the graphite content is 2.1vol%. This graphite content distribution is presented in Figure A7-
1. The disturbed 775 µm outer cylindrical ring of the sample represents 42.33% of the entire sample’s
volume. The dimensions and mass of the entire sample and of the outer cylindrical ring are given in
Table A7-1.
Figure A7-1 Graphite volume distribution estimated from the measured values on a (NbC-
3%Mo2C)-12vol%Ni-0.5vol%WC sample with 4.5at%C.
Table A7-1 Properties of the (NbC-3%Mo2C)-12vol%Ni-0.5vol%WC sample with 4.5at%C.
Entire sample Outer cylindrical ring
d (mm) h (mm) V (mm3) m (g) Vo (mm3)
6.44 4.76 155 1.2558 65.61
The global graphite fraction in volume of the sample is given by formula (A6-1).
Where x = 3220 – 775 = 2445 µm.
The volume of graphite in the sample is thus Vgraphite= 2.73 mm3, with mgraphite = 6.09 mg. Therefore,
there is 0.48 wt% of graphite in the sample. If the graphite volume fraction was 2.10 vol% in the entire
sample, then Vgraphite = 3.26 mm3 and mgraphite = 7.27 mg, and there would be 0.58wt% of graphite
in the sample. Therefore, 0.10 wt% of carbon is lost at the external surface of the sample.
Data: ρgraphite = 2.23 g/cm3
0.0
0.5
1.0
1.5
2.0
2.5
3.0
0 500 1000 1500 2000 2500 3000
Gra
phit
e vo
lum
e (%
vo
l)
Distance from border (µm)
2.1 vol%
775
𝑉𝑔𝑟𝑎𝑝ℎ𝑖𝑡𝑒 =1
100∫ 2.10 × ℎ2𝜋𝑟 𝑑𝑟𝑥
0
+1
100∫ (−0.002𝑟 + 6.99)ℎ2𝜋𝑟 𝑑𝑟𝑑 2⁄
𝑥
(A7-1)

Appendix 7 – Effect of decarburizing on graphite distribution in C-rich compositions - Calculations
174

Appendix 8 – Chemical effect on interface energy for systems with mutual solubility
175
Appendix 8 – Chemical effect on interface energy for
systems with mutual solubility
Introduction
Let us consider a binary system A-B, where a solid containing only A atoms is in equilibrium with a
liquid solution containing A and B atoms. The structural and chemical contribution to the solid-liquid
interface energy can be estimated with a simple model of broken bonds and regular solution for the
liquid [101]:
where 𝜎𝐴𝛽pure 𝐴
represents the interface energy between A and when the liquid contains only A atoms.
Therefore, it does not contain information on the chemistry but on the structure of the interface, i.e. the
atomic arrangement near the interface. m is the fraction of broken bonds at the interface, is the area
occupied by one mole of atoms at the interface, 𝐴𝛽 is the molar fraction of A in the liquid and 𝜆𝐴𝐵 is the
interchange energy of the regular AB solution, which is related to the bonding pair energies 𝜀𝐴𝐴, 𝜀𝐵𝐵 and
𝜀𝐴𝐵, to the Avogadro number 𝑁𝐴𝑣 and to the coordination number z:
In this model, the coordination number z is assumed to be constant in the solid, in the liquid and at the
interface. This assumption simplifies the structural description to focus on chemical effects on the
interface energy. The chemical contribution to the interface energy is contained in the second term of
formula (A8-1). It is deduced that a good affinity between A and B atoms, which will decrease the
interchange energy but also increase the solubility of A atoms in the liquid, will decrease the interface
energy.
This argument is sometimes found in the literature to explain the effect of addition of a third element to
a binary system. If this element has a good affinity for B atoms in the liquid, it is speculated to reduce
the interface energy. However, things are not so simple in that case. First, it is not simply the absolute
affinity of the additive element with the liquid atoms which is to be considered, but rather the relative
affinity with liquid atoms and with solid atoms. Then, the effect of a minor element in the solid phase
cannot be discussed the same way as the effect of the main element A in the binary case. The aim of this
paper is to discuss these aspects in a ternary system.
Theoretical background
Let us consider a binary solid solution containing A1 and A2 atoms, in equilibrium with a liquid
solution containing mostly B atoms and a small amount of A1 and A2 solute atoms. B atoms are
supposed to have negligible solubility in the solid phase .
𝜎𝐴𝛽 = 𝜎𝐴𝛽pure 𝐴
+𝑚
Ω𝜆𝐴𝐵 (1 − 𝐴
𝛽)2 (A8-1)
𝜆𝐴𝛽 = 𝑁𝐴𝑣𝑧 (𝜀𝐴𝐵 −𝜀𝐴𝐴 + 𝜀𝐵𝐵
2) (A8-2)

Appendix 8 – Chemical effect on interface energy for systems with mutual solubility
176
The formation of an interface between and from bulk and phase is sketched in Figure A8-1. In
a first step, the fracture of and bulk materials is performed along a cleavage plane. In a second step,
the two free surfaces are put into contact and new chemical bonds are formed. As in the binary case, it
is assumed that the coordination number z is constant in and and at the interface. The interface
energy is then simply the sum of the free energy variations ∆𝐹1 and ∆𝐹2 for the two steps divided by the
surface area S of the interface:
Figure A8-1 Formation of an interface between and bulk phases.
This formula can be expressed per atom at the interface, i.e. for 1/2 atom at the surface of and :
where m is the fraction of broken bonds at the cleavage plane, is the area occupied by an atom at the
surface or interface, 𝜀𝛼̅̅ ̅, 𝜀𝛽̅̅ ̅ and 𝜀𝛼𝛽̅̅ ̅̅ ̅ are the average bonding pair energies in bulk and phases and at
the interface, respectively.
Assuming a uniform distribution of the atoms, the average bonding pair energies are related to the
bonding pair energies between the different kind of atoms j and to the corresponding atomic fractions
𝑗𝛼 and 𝑗
𝛽 in both phases:
Reporting these expressions in the expression of interface energy (A8-4) gives:
DF1 DF2
𝜎𝛼𝛽 =∆𝐹1 + ∆𝐹2
𝑆 (A8-3)
𝜎𝛼𝛽 = −1
2
𝑧 𝑚
𝜔𝜀𝛼̅̅ ̅ −
1
2
𝑧 𝑚
𝜔𝜀𝛽̅̅ ̅ +
𝑧 𝑚
𝜔𝜀𝛼𝛽̅̅ ̅̅ ̅ =
𝑧𝑚
𝜔 (𝜀𝛼𝛽̅̅ ̅̅ ̅ −
𝜀𝛼̅̅ ̅ + 𝜀𝛽̅̅ ̅
2) (A8-4)
𝜀𝛼̅̅ ̅ = 𝐴1𝛼 2
𝜀𝐴1𝐴1𝛼 + 𝐴2
𝛼 2𝜀𝐴2𝐴2𝛼 + 2 𝐴1
𝛼 𝐴2𝛼 𝜀𝐴1𝐴2
𝛼 (A8-5)
𝜀𝛽̅̅ ̅ = 𝐴1𝛽 2
𝜀𝐴1𝐴1𝛽
+ 𝐴2𝛽 2
𝜀𝐴2𝐴2𝛼 + 𝐵
𝛽2𝜀𝐵𝐵𝛼 + 2 𝐴1
𝛽 𝐴2𝛽𝜀𝐴1𝐴2𝛽
+ 2 𝐴1𝛽 𝐵𝛽𝜀𝐴1𝐵𝛽
+ 2 𝐴2𝛽 𝐵𝛽𝜀𝐴2𝐵𝛽
(A8-6)
𝜀𝛼𝛽̅̅ ̅̅ ̅ = 𝐴1𝛼 𝐴1
𝛽𝜀𝐴1𝐴1𝛼𝛽
+ 𝐴2𝛼 𝐴2
𝛽𝜀𝐴2𝐴2𝛼𝛽
+ 𝐴1𝛼 𝐵
𝛽𝜀𝐴1𝐵𝛼𝛽
+ 𝐴2𝛼 𝐵
𝛽𝜀𝐴2𝐵𝛼𝛽
+( 𝐴1𝛼 𝐴2
𝛽
+ 𝐴2𝛼 𝐴1
𝛽)𝜀𝐴1𝐴2
𝛼𝛽
(A8-7)
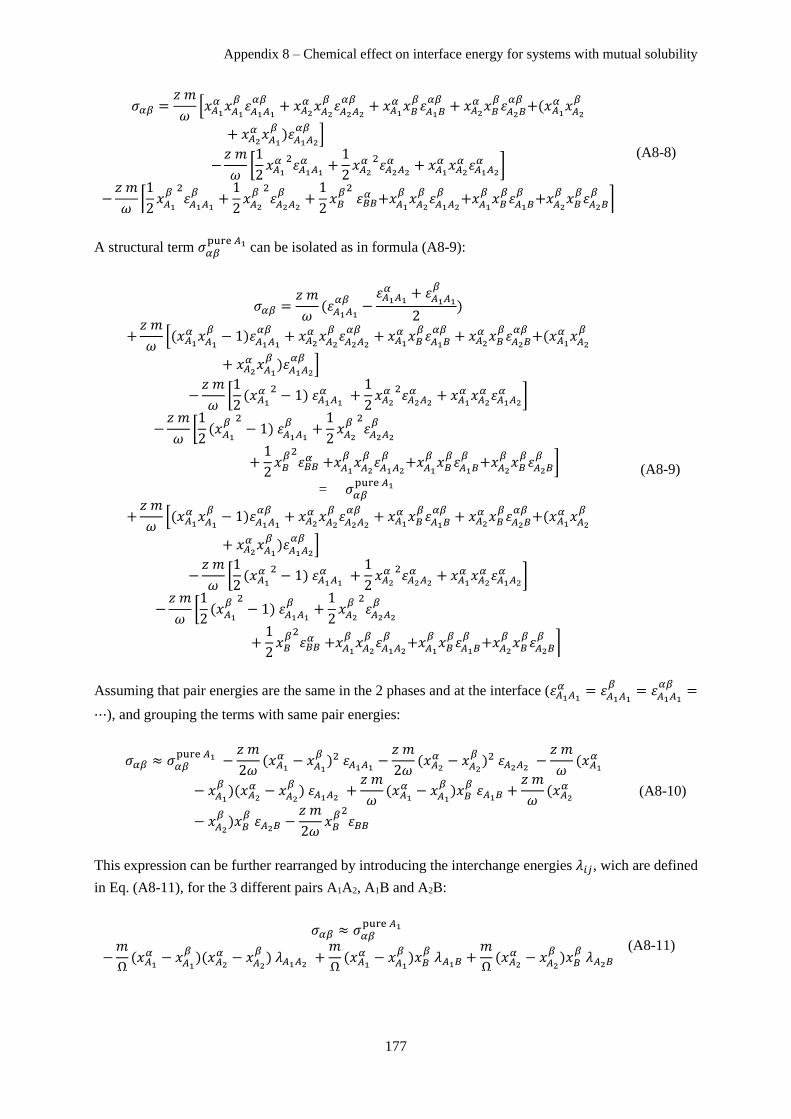
Appendix 8 – Chemical effect on interface energy for systems with mutual solubility
177
A structural term 𝜎𝛼𝛽pure 𝐴1 can be isolated as in formula (A8-9):
Assuming that pair energies are the same in the 2 phases and at the interface (𝜀𝐴1𝐴1𝛼 = 𝜀𝐴1𝐴1
𝛽= 𝜀𝐴1𝐴1
𝛼𝛽=
⋯), and grouping the terms with same pair energies:
This expression can be further rearranged by introducing the interchange energies 𝜆𝑖𝑗, wich are defined
in Eq. (A8-11), for the 3 different pairs A1A2, A1B and A2B:
𝜎𝛼𝛽 =𝑧 𝑚
𝜔[ 𝐴1
𝛼 𝐴1𝛽𝜀𝐴1𝐴1𝛼𝛽
+ 𝐴2𝛼 𝐴2
𝛽𝜀𝐴2𝐴2𝛼𝛽
+ 𝐴1𝛼 𝐵
𝛽𝜀𝐴1𝐵𝛼𝛽
+ 𝐴2𝛼 𝐵
𝛽𝜀𝐴2𝐵𝛼𝛽
+( 𝐴1𝛼 𝐴2
𝛽
+ 𝐴2𝛼 𝐴1
𝛽)𝜀𝐴1𝐴2
𝛼𝛽]
−𝑧 𝑚
𝜔[1
2 𝐴1𝛼 2
𝜀𝐴1𝐴1𝛼 +
1
2 𝐴2𝛼 2
𝜀𝐴2𝐴2𝛼 + 𝐴1
𝛼 𝐴2𝛼 𝜀𝐴1𝐴2
𝛼 ]
−𝑧 𝑚
𝜔[1
2 𝐴1𝛽 2
𝜀𝐴1𝐴1𝛽
+1
2 𝐴2𝛽 2
𝜀𝐴2𝐴2𝛽
+1
2 𝐵𝛽2 𝜀𝐵𝐵𝛼 + 𝐴1
𝛽 𝐴2𝛽𝜀𝐴1𝐴2𝛽
+ 𝐴1𝛽 𝐵𝛽𝜀𝐴1𝐵𝛽
+ 𝐴2𝛽 𝐵𝛽𝜀𝐴2𝐵𝛽
]
(A8-8)
𝜎𝛼𝛽 =𝑧 𝑚
𝜔(𝜀𝐴1𝐴1
𝛼𝛽−𝜀𝐴1𝐴1𝛼 + 𝜀𝐴1𝐴1
𝛽
2)
+𝑧 𝑚
𝜔[( 𝐴1
𝛼 𝐴1𝛽− 1)𝜀𝐴1𝐴1
𝛼𝛽+ 𝐴2
𝛼 𝐴2𝛽𝜀𝐴2𝐴2𝛼𝛽
+ 𝐴1𝛼 𝐵
𝛽𝜀𝐴1𝐵𝛼𝛽
+ 𝐴2𝛼 𝐵
𝛽𝜀𝐴2𝐵𝛼𝛽
+( 𝐴1𝛼 𝐴2
𝛽
+ 𝐴2𝛼 𝐴1
𝛽)𝜀𝐴1𝐴2
𝛼𝛽]
−𝑧 𝑚
𝜔[1
2( 𝐴1
𝛼 2− 1) 𝜀𝐴1𝐴1
𝛼 +1
2 𝐴2𝛼 2
𝜀𝐴2𝐴2𝛼 + 𝐴1
𝛼 𝐴2𝛼 𝜀𝐴1𝐴2
𝛼 ]
−𝑧 𝑚
𝜔[1
2( 𝐴1
𝛽 2− 1) 𝜀𝐴1𝐴1
𝛽+1
2 𝐴2𝛽 2
𝜀𝐴2𝐴2𝛽
+1
2 𝐵𝛽2𝜀𝐵𝐵𝛼 + 𝐴1
𝛽 𝐴2𝛽𝜀𝐴1𝐴2𝛽
+ 𝐴1𝛽 𝐵𝛽𝜀𝐴1𝐵𝛽
+ 𝐴2𝛽 𝐵𝛽𝜀𝐴2𝐵𝛽
]
= 𝜎𝛼𝛽pure 𝐴1
+𝑧 𝑚
𝜔[( 𝐴1
𝛼 𝐴1𝛽− 1)𝜀𝐴1𝐴1
𝛼𝛽+ 𝐴2
𝛼 𝐴2𝛽𝜀𝐴2𝐴2𝛼𝛽
+ 𝐴1𝛼 𝐵
𝛽𝜀𝐴1𝐵𝛼𝛽
+ 𝐴2𝛼 𝐵
𝛽𝜀𝐴2𝐵𝛼𝛽
+( 𝐴1𝛼 𝐴2
𝛽
+ 𝐴2𝛼 𝐴1
𝛽)𝜀𝐴1𝐴2
𝛼𝛽]
−𝑧 𝑚
𝜔[1
2( 𝐴1
𝛼 2− 1) 𝜀𝐴1𝐴1
𝛼 +1
2 𝐴2𝛼 2
𝜀𝐴2𝐴2𝛼 + 𝐴1
𝛼 𝐴2𝛼 𝜀𝐴1𝐴2
𝛼 ]
−𝑧 𝑚
𝜔[1
2( 𝐴1
𝛽 2− 1) 𝜀𝐴1𝐴1
𝛽+1
2 𝐴2𝛽 2
𝜀𝐴2𝐴2𝛽
+1
2 𝐵𝛽2𝜀𝐵𝐵𝛼 + 𝐴1
𝛽 𝐴2𝛽𝜀𝐴1𝐴2𝛽
+ 𝐴1𝛽 𝐵𝛽𝜀𝐴1𝐵𝛽
+ 𝐴2𝛽 𝐵𝛽𝜀𝐴2𝐵𝛽
]
(A8-9)
𝜎𝛼𝛽 ≈ 𝜎𝛼𝛽pure 𝐴1 −
𝑧 𝑚
2𝜔( 𝐴1
𝛼 − 𝐴1𝛽)2 𝜀𝐴1𝐴1 −
𝑧 𝑚
2𝜔( 𝐴2
𝛼 − 𝐴2𝛽)2 𝜀𝐴2𝐴2 −
𝑧 𝑚
𝜔( 𝐴1
𝛼
− 𝐴1𝛽)( 𝐴2
𝛼 − 𝐴2𝛽) 𝜀𝐴1𝐴2 +
𝑧 𝑚
𝜔( 𝐴1
𝛼 − 𝐴1𝛽) 𝐵
𝛽 𝜀𝐴1𝐵 +
𝑧 𝑚
𝜔( 𝐴2
𝛼
− 𝐴2𝛽) 𝐵
𝛽 𝜀𝐴2𝐵 −
𝑧 𝑚
2𝜔 𝐵𝛽2𝜀𝐵𝐵
(A8-10)
𝜎𝛼𝛽 ≈ 𝜎𝛼𝛽pure 𝐴1
−𝑚
Ω( 𝐴1
𝛼 − 𝐴1𝛽)( 𝐴2
𝛼 − 𝐴2𝛽) 𝜆𝐴1𝐴2 +
𝑚
Ω( 𝐴1
𝛼 − 𝐴1𝛽) 𝐵
𝛽 𝜆𝐴1𝐵 +
𝑚
Ω( 𝐴2
𝛼 − 𝐴2𝛽) 𝐵
𝛽 𝜆𝐴2𝐵
(A8-11)
Appendix 8 – Chemical effect on interface energy for systems with mutual solubility
178
Ω = 𝑁𝐴𝑣𝜔 being the average area occupied by one mole of atoms at the surface or at the interface. This
formula is reduced to Eq. (A8-1) as 𝐴2𝛼 , 𝐴2
𝛽≪ 0, i.e. for the binary system.
Formula (A8-11) summarizes the complex effect of chemical affinities on the αβ interface energy. Let
us assume for simplicity that the 3 solutions are stable at all temperatures ( 𝜆𝐴1𝐴2 < 0, 𝜆𝐴1𝐵 <
0 and 𝜆𝐴2𝐵 < 0). The effect of addition of a ternary element A2 to the binary system A1B can be seen
in the 2nd and 4th term of formula (A8-11). If A2 has a strong affinity for B atoms in the liquid, 𝐴2𝛽>
𝐴2𝛼 and the 4th term tends to increase the interface energy whereas the 2nd term tends to decrease it. And
since |𝜆𝐴2𝐵| is expected to be larger than |𝜆𝐴1𝐴2| in this case, the positive contribution may be dominant.
The presence of the ternary element would then increase the interface energy although it has a good
affinity for atoms in the liquids. In other words, the addition of a ternary element A2 having a good
affinity for atoms B in the liquid would increase the interface energy, first because the number of A2B
bonds at the interface would be lower than the number of such bonds in the liquid (for solubility reasons),
then because the resultant positive contribution of A2B bonds to the interface energy is not compensated
by the negative contribution of A1A2 bonds which are not so strong.
The present approach only gives a first order representation of chemical effects on the interface energy.
Structural variations at the interface when adding a third element may complicate the approach. Also
the model assumes a uniform composition in the liquid. Adsorption at the interface can play a role and
especially decrease the interface energy for an element having a good affinity for atoms in the liquid.
But still the model should give the basic trends of chemical effects on the interface energy in ternary
systems and avoid erroneous intuitive conclusions based on simple binary systems.