Microstructural Classification of Bainitic Subclasses in Low ...
Upload
khangminh22Category
view
1download
0
University of Windsor University of Windsor
Scholarship at UWindsor Scholarship at UWindsor
Electronic Theses and Dissertations Theses, Dissertations, and Major Papers
2014
Thermal and Microstructural Analysis of the A356 Alloy Subjected Thermal and Microstructural Analysis of the A356 Alloy Subjected
to High Pressure in the Squeeze Casting (SC) UMSA Technology to High Pressure in the Squeeze Casting (SC) UMSA Technology
Platform Platform
Mohammad Khurshed-Ul Alam University of Windsor
Follow this and additional works at: https://scholar.uwindsor.ca/etd
Recommended Citation Recommended Citation Alam, Mohammad Khurshed-Ul, "Thermal and Microstructural Analysis of the A356 Alloy Subjected to High Pressure in the Squeeze Casting (SC) UMSA Technology Platform" (2014). Electronic Theses and Dissertations. 5116. https://scholar.uwindsor.ca/etd/5116
This online database contains the full-text of PhD dissertations and Masters’ theses of University of Windsor students from 1954 forward. These documents are made available for personal study and research purposes only, in accordance with the Canadian Copyright Act and the Creative Commons license—CC BY-NC-ND (Attribution, Non-Commercial, No Derivative Works). Under this license, works must always be attributed to the copyright holder (original author), cannot be used for any commercial purposes, and may not be altered. Any other use would require the permission of the copyright holder. Students may inquire about withdrawing their dissertation and/or thesis from this database. For additional inquiries, please contact the repository administrator via email ([email protected]) or by telephone at 519-253-3000ext. 3208.

Thermal and Microstructural Analysis of the A356 Alloy Subjected to High
Pressure in the Squeeze Casting (SC) UMSA Technology Platform
By
Mohammad Khurshed-Ul Alam
A Thesis
Submitted to the Faculty of Graduate Studies
through the Department of
Mechanical, Automotive & Materials Engineering
in Partial Fulfillment of the Requirements for the Degree of
Master of Applied Science in Engineering Materials
at the
University of Windsor
Windsor, Ontario, Canada
2014
© 2014 M. K. Alam

Thermal and Microstructural Analysis of the A356 Alloy Subjected to High
Pressure in the Squeeze Casting (SC) UMSA Technology Platform
By
Mohammad Khurshed-Ul Alam
APPROVED BY:
______________________________________________
S. Das
Department of Civil and Environmental Engineering
______________________________________________
D. O. Northwood
Department of Mechanical, Automotive and Materials Engineering
______________________________________________
A. Conle
Department of Mechanical, Automotive and Materials Engineering
______________________________________________
F. Ghrib
Department of Civil and Environmental Engineering
______________________________________________
J. H. Sokolowski, Advisor
Department of Mechanical, Automotive and Materials Engineering
April 30, 2014
iii
DECLARATION OF CO-AUTHORSHIP
Co-Authorship Declaration
I hereby declare that this thesis incorporates material that is a result of joint
research, as follows:
This thesis incorporates the outcome of research performed in the field of
SEM/EDS Elemental Analysis in collaboration with Dr. Adam Gesing under the
supervision of Dr. Jerry H. Sokolowski and Dr. Al Conle. The collaboration is
covered in some portions of Sections 4.7-4.8 of Chapter 4 of the thesis.
Contributions by the collaborators were primarily through the provision of
calculations of micro chemical compositions in SEM/EDS Analysis.
I am aware of the University of Windsor Senate Policy on Authorship and I
certify that I have properly acknowledged the contribution of other researcher to
my thesis, and have obtained written permission from the co-author to include the
above material(s) in my thesis.
I certify that, with the above qualification, this thesis, and the research to
which it refers, is the product of my own work. I also certify that the above
material describes work completed during my registration as a graduate student at
the University of Windsor.
I declare that, to the best of my knowledge, my thesis does not infringe
upon anyone’s copyright nor violate any proprietary rights and that any ideas,
techniques, quotations, or any other material from the work of other people
included in my thesis, published or otherwise, are fully acknowledged in
accordance with the standard referencing practices.
I declare that this is a true copy of my thesis, including any final revisions,
as approved by my Thesis Committee and the Graduate Studies office, and that
this thesis has not been submitted for a higher degree to any other University or
Institution.
iv
ABSTRACT
The effect of cyclic pressure on the thermal and microstructural behaviour of the
A356 alloy and the addition of commercial Al-Sr Master Alloy, Nano Alumina
Master Alloy and a combination of both Master Alloys during the squeeze casting
was investigated in this study. The results show that the α-dendrite growth
temperature was increased and the Al-Si eutectic growth temperature was
decreased substantially, resulting in a super refined, as-cast, equiaxed α-Al cells
and ultra fine dendritic eutectic Si in the modified and unmodified A356 aluminum
alloy. Moreover, very rapid spheroidization of the Si particles was observed within
a very short Solution Treatment time (15min) of the squeeze cast unmodified and
Sr modified A356 alloy. It is expected that the results of this study will lead to a
number of further fundamental and applied research rendering new alloys and
technology.

v
DEDICATION
I dedicate this thesis to my beloved parents whom I lost long ago and who were
my first teachers in this world. I pray for their departed souls.

vi
ACKNOWLEDGEMENTS
I would like to express my heartfelt gratitude to the Almighty Allah who has
created me and who has given me the ability and strength to carry out my research
and the writing of this thesis.
I would like to acknowledge my supervisor Dr. Jerry H. Sokolowski and thank him
for giving me the opportunity to conduct my MASc research project under his
supervision and for providing me with his scientific and technical support. I am
also thankful to the AUTO21 Network of Centres of Excellence for the financial
support provided during my MASc project.
I would like to thank Drs. F. Ghrib, D. Northwood and S. Das for consenting to be
a part of my Advisory Committee as well as for their continued guidance. Their
help and feedback is highly appreciated.
My sincere thanks go to Dr. Al Conle, a Special Member of my Committee, who
has been instrumental in the success of my experiments. His continuous assistance
and support in carrying out my experiments, and in writing my thesis, is very much
appreciated. I would also like to thank to Dr. Adam Gesing and Dr. Marcin
Kasprzak for their scientific and technical support on my project. Dr. Gesing’s
collaborative work has enhanced my research and enriched this thesis.

vii
Thanks to Dr. T. Troczynski (University of British Columbia) for providing the
nano Al2O3 Master Alloy and thanks to Professor L. Dobrzanski and Professor Z.
Rdzawski, from the Silesian University of Technology, Poland, for the further
processing of this Master Alloy, for access to their analytical facilities and for
providing the author with comprehensive characterization of the experimental test
samples.
I wish to express my thanks to Ms. Ellen Moosberger for her invaluable assistance
with the editing of this thesis. Special thanks go to my colleagues, Israel Aguilera,
Brandon Hooper, Peter Guba, Paul Marchwica, Bruce Durfy, Andrew Jenner,
Sharon Lackie and Steve Budinsky for their valuable help in my daily activities.
Most of all, I would like to express my deepest gratitude to my wife Kashfia
Nehrin and to my son Ahmad Tashfeen for their absolute love and understanding.
It would have been impossible to complete this master’s thesis without their
unlimited support.
viii
TABLE OF CONTENTS
DECLARATION OF CO-AUTHORSHIP .................................................................... iii
ABSTRACT ...................................................................................................................... iv
DEDICATION....................................................................................................................v
ACKNOWLEDGEMENTS ............................................................................................ vi
LIST OF TABLES .......................................................................................................... xii
LIST OF FIGURES ....................................................................................................... xiii
LIST OF APPENDICES ...............................................................................................xxv
LIST OF ABBREVIATIONS/SYMBOLS ................................................................. xxvi
CHAPTER ONE - INTRODUCTION .............................................................................1
1.0. Background ...........................................................................................................1
1.2. Scope of Research .................................................................................................5
1.3. Objectives ..............................................................................................................6
CHAPTER TWO - LITERATURE REVIEW ................................................................8
2.1. Aluminum and Aluminum Alloys .........................................................................8
2.1.1. Aluminum ................................................................................................................ 8
2.1.2. Aluminum Alloys ..................................................................................................... 8
2.1.3. Alloy Designation of Cast Aluminum Alloys .......................................................... 9
2.1.4. Importance of Al-Si Alloys .................................................................................... 10
2.1.5. Al-Si Alloy System ................................................................................................ 11
2.1.6. Mechanical Properties of Al-Si Alloys .................................................................. 14
2.1.7. Effect of Minor Common Elements Present in Al-Si Alloys ................................. 15
2.1.8. The A356 Alloy and Silicon Modification............................................................. 16
2.1.9. Chemical Modification and Mechanical Characteristics ....................................... 19
2.1.10. Levels of Si Morphology Modification ................................................................. 22
2.1.11. The Nano Alumina Master Alloy (NAMA) ........................................................... 23
2.1.12. Secondary Dendrite Arm Spacing (SDAS) ............................................................ 26
ix
2.1.13. Heat Treatment ....................................................................................................... 28
2.2. Squeeze Casting ..................................................................................................30
2.2.1. History of Squeeze Casting .................................................................................... 31
2.2.2. Squeeze Casting Processes..................................................................................... 33
2.2.3. Mechanics of Squeeze Casting .............................................................................. 33
2.2.4. Application of Pressure and its Effect on Solidification ........................................ 35
2.3. Thermal Analysis (TA) .......................................................................................40
2.4. Silicon Equivalency and Liquidus Temperature .................................................46
CHAPTER THREE - EXPERIMENTAL METHODOLOGIES ...............................49
3.1. Material Chemistry of A356 Alloy for Squeeze Casting ....................................49
3.1.1 Calculations for Sr and Nano Alumina Master Alloy Additives ........................... 50
3.1.2. A356 Ingot Segregation ........................................................................................ 51
3.1.3. SEM/EDS Analysis of SC UMSA Test Sample Phases and Bulk Chemical
Analysis 51
3.2. Squeeze Casting (SC) – UMSA Technology Platform .......................................52
3.2.1. Background ............................................................................................................ 52
3.2.2. SC UMSA Technology Platform's Functional Design .......................................... 53
3.2.3. SC Die .................................................................................................................... 53
3.2.4. Test Sample ............................................................................................................ 56
3.2.5. Processing Parameters for Programmable Squeeze Casting Experiments ............. 57
3.2.6. Test Control Software and Data Collection Procedure for Squeeze Casting
Experiments ........................................................................................................................... 60
3.2.7. Calibration of Thermocouple and Data Acquisition System ................................. 62
3.2.8. Experimental Procedure for the Squeeze Casting ................................................. 71
3.3. High Temperature Universal Metallurgical Simulator and Analyzer (HT
UMSA) ...........................................................................................................................77
3.3.1. Hardware Platform ................................................................................................. 77
3.3.2. Software Platform .................................................................................................. 79
3.3.3. Solution Treatment Procedure ............................................................................... 80
3.4. Metallographic Sample Preparation ....................................................................80
3.5. Light Optical Microscopy (LOM) Analysis ........................................................81

x
3.6. Measurement of Dendrite Refinements - Secondary Dendrite Arm
Spacing (SDAS) and Dendrite Cell Size ........................................................................82
3.7. Experimental Design ...........................................................................................84
CHAPTER FOUR - RESULTS AND DISCUSSION ...................................................87
4.1. Determination of Thermal Characteristics of A356 Alloy ..................................87
4.2. Determination of Solidification Rate (SR) ..........................................................92
4.3. Effect of Cyclic Pressure on the Unmodified A356 Alloy in the SC
UMSA Platform .............................................................................................................93
4.3.1. Changes in the Thermal Characteristics of Unmodified A356 Alloy .................... 94
4.3.2. Changes in the Internal Energy of the 356 Alloy System ..................................... 98
4.3.3. Changes in the Solidification Rate of Unmodified A356 Alloy ............................ 99
4.4. Effect of Cyclic Pressure on the Sr Modified A356 Alloy in SC UMSA
Platform ........................................................................................................................101
4.4.1. Changes in the Thermal Characteristics of Sr Modified Alloy ............................ 101
4.4.2. Changes in the Solidification Rate of Sr Modified Alloy .................................... 104
4.5. Effect of Cyclic Pressure on the Nano Alumina Modified A356 Alloys in
the SC UMSA Platform................................................................................................105
4.5.1 Changes in the Thermal Characteristics of Nano Alumina Modified A356
Alloy .................................................................................................................................... 105
4.6. Effect of Cyclic Pressure on the Sr and Nano Alumina Combined
Modified A356 Alloy in the SC UMSA Platform........................................................107
4.6.1. Changes in the Thermal Characteristics of Strontium & Nano Alumina
Combined Modified A356 Alloy ......................................................................................... 107
4.7. Microstructural Analysis ...................................................................................109
4.7.1. Microstructural Analysis of the Unmodified A356 Alloy .................................. 110
4.7.2. Microstructural Analysis of the Sr Modified A356 Alloy .................................. 118
4.7.3. Microstructural Analysis of the Nano Alumina Modified A356 Alloy .............. 125
4.7.4. Microstructural Analysis of the Sr and Nano Alumina Combined Modified
A356 Alloy........................................................................................................................... 131
4.8. Solution Treatment ............................................................................................134
4.8.1. SEM/EDS Analysis for Solution Treated UM A356 Alloy ................................ 140
4.8.2. SEM/EDS Analysis for Solution Treated Sr Modified Alloy .............................. 141

xi
4.9. Comparison and Correlation between Thermal and Microstructural
Analysis of Unmodified and Modified Alloys .............................................................143
4.10. Comparison with the Alcoa A356 Alloy Wheel ..............................................148
CHAPTER FIVE – SUMMARY AND CONCLUSIONS ..........................................150
5.1. Summary ...........................................................................................................150
5.2. Conclusions .......................................................................................................154
CHAPTER SIX - RECOMMENDATIONS FOR FUTURE WORK .......................156
REFERENCES/BIBLIOGRAPHY ..............................................................................157
APPENDICES ................................................................................................................167
VITA AUCTORIS .........................................................................................................211

xii
LIST OF TABLES
Table 1 - Cast Aluminum Alloy Families . .............................................................. 9
Table 2 - Comparison of Two Alloy Designations and Their Chemistries . .......... 11
Table 3 - Some Common Industrial Alloys of Aluminum . ................................... 11
Table 4 - UMSA Cooling Cycle Thermal Characteristic for the Alcoa 356 Cast
Wheel . .................................................................................................................... 43
Table 5 - Comparison of Metallurgical Reactions of A356 Alloy at Different
Solidification Rates . ............................................................................................... 45
Table 6 - Reactions during Solidification of A356 Aluminum Alloy . ................. 45
Table 7 - Comparison of Selected Characteristics of A356 in Relation to
Solidification Rate . ................................................................................................ 46
Table 8 - Polynomial Coefficients for Binary Al-Xi alloys . .................................. 48
Table 9 - Chemical Composition (wt %) of the A356 Ingot................................... 49
Table 10 - Thermocouple Types and Temperature Ranges. ................................... 65
Table 11 - Calibration Between Voltage and Temperature. ................................... 69
Table 12 - Calibration Data Summary. ................................................................... 70
Table 13 - Matrix of SC- UMSA Tests. .................................................................. 85
Table 14 - Matrix of Solution Treatment Experiments. .......................................... 86
Table 15 - Thermal Characteristics of Unmodified A356 alloy. ............................ 93
Table 16 - Summary of Test Results and Thermal Characteristics of Unmodified
A356 under Variable Pressure and Cycles.............................................................. 95
Table 17 - Summary of Results and Thermal Characteristics of Modified A356 at
Variable Pressure with Variable Cycles. .............................................................. 102
Table 18 - Summary of EDS Analysis for UM A356 at 115 MPa with 20 pressure
cycles..................................................................................................................... 118
Table 19 - Summary of EDS Analysis for 0.015 wt% Sr M A356 at 115 MPa with
50 pressure cycles. ................................................................................................ 125
Table 20 - Summary of EDS Analysis for 1 wt% Nano Alumina Modified A356 at
115 MPa with 50 Pressure cycles. ........................................................................ 131
Table 21 - Summary of EDS Analysis for Solution Treated UM Squeezed Cast
A356 Alloy............................................................................................................ 141
Table 22 - Summary of EDS Analysis for Solution Treated Sr M Squeezed Cast
A356 Alloy............................................................................................................ 141

xiii
LIST OF FIGURES
Figure 1 – Flow chart for the scope of research. ....................................................... 5
Figure 2 - Al-Si Binary phase diagram . ................................................................. 13
Figure 3 - Part of the Al-Si Binary phase diagram . ............................................... 13
Figure 4 - Silicon crystals in a unmodified A356 alloy sample, SEM pictures after
deep etching . .......................................................................................................... 18
Figure 5 - Silicon crystals in a modified A356 alloy sample, SEM pictures after
deep etching . .......................................................................................................... 18
Figure 6 - Comparison of the silicon morphology in (a) unmodified, (b) Sr-
modified (300ppm Sr) and (c) Sb-modified (2400ppm Sb), hypoeutectic
Aluminum–Silicon alloys . ..................................................................................... 19
Figure 7 - Microstructure at the end of solidification (unquenched): a) unmodified,
b) 0.008% Na and c) 0.017% Na . .......................................................................... 21
Figure 8 - Higher magnified SEM micrographs showing the typical microstructure
of (a) the semi continuous MgO layer (b) Detached MgO particles and the Mg
channel in the NAMA . ........................................................................................... 24
Figure 9 – LOM Micrographs shows improved structure of Nano Alumina Master
Alloy developed by University of Windsor . .......................................................... 24
Figure 10 - LOM micrographs of As-Cast A356 test sample at two different
locations from the chilling end after addition of 1.0 wt. % NAMA (a) 20 mm (b)
50 mm . ................................................................................................................... 25
Figure 11- LOM micrographs of As-Cast A356 test sample at two different
locations from the chilling end after addition of 2.0 wt. % NAMA (a) 20 mm (b)
50 mm. .................................................................................................................... 25
Figure 12 - Dendrite arm spacing and dendrite cell size as a function of local
solidification rate. ................................................................................................... 27
Figure 13 - Microstructures of the A356 alloy before and after solution heat
treatment a) unmodified, b) 0.02% strontium modified, c) unmodified heat treated,
d) Sr modified solution treated . ............................................................................. 29
Figure 14 - Microstructures of the Squeeze cast unmodified A356 alloy before and
after solution heat treatment a) Eutectic silicon angular lamellas are short and
relatively coarse or longer and thinner, b) Eutectic silicon lamellas are shorter and
rounded, but also coarser . ...................................................................................... 29
Figure 15 - Automotive parts produced by the squeeze casting process. Courtesy of
UBE Industries . ...................................................................................................... 32
Figure 16 - Squeeze cast automotive components produced by SPX Contech
Corporation (upper - wheels, lower left - valve housing, lower right - steering
column housing) ..................................................................................................... 32
Figure 17 - Schematic diagram to illustrate the direct and indirect modes of the
squeeze casting ....................................................................................................... 34
xiv
Figure 18 - Schematic diagram of the stages of squeeze casting to manufacture
metal matrix composites (MMC) . .......................................................................... 34
Figure 19 - Change of Liquidus and solidus lines in the binary Al-Si phase diagram
following rapid solidification under high squeezed pressure [64, 73]. ................... 37
Figure 20 - Microstructure of solution-treated alloys (a) as-cast (b) squeeze cast at
70 MPa . .................................................................................................................. 40
Figure 21 - Comparisons of different cooling curves obtained from A356 ingot
samples . .................................................................................................................. 44
Figure 22 - Comparison of the first derivative of the cooling curves obtained from
A356 ingot samples ................................................................................................ 44
Figure 23 - Overall view of the SC-UMSA frame. ................................................. 54
Figure 24 - a) Details of die assembly, b) Environmental chamber. ...................... 54
Figure 25 - Schematic drawing of 3D SC Die. ....................................................... 55
Figure 26 - Schematic drawing of the squeeze cast die. ......................................... 55
Figure 27 - Samples of squeeze cast experiment, a) Plain drawing (dimensions are
in mm), b) Picture ................................................................................................... 56
Figure 28 - Relationship between stroke and pressure vs. time. ............................. 58
Figure 29 – Gating System, a) Graphite Gate, b) Components of gating system. .. 59
Figure 30 - SC-UMSA test set-up, data recording and data collection devices: main
test and data control computer monitor on left, SCXI-1000 at center, and HP
system for monitoring temperature of thermocouples at the right. ......................... 61
Figure 31 - Schematic diagram of SC-UMSA data collection. .............................. 63
Figure 32 Three Junctions of Thermocouples ....................................................... 65
Figure 33 - Relationship between voltages and uncalibrated temperature. ............ 70
Figure 34 - Relationship between calibrated data and uncalibrated data. ............... 71
Figure 35 - Incorporation of calibration factor in the first derivative of cooling
curve of unmodified A356 at 90 MPa for 10 pressure cycles................................. 71
Figure 36 - Desktop view of four channels labview software for monitoring and
recording temperatures of thermocouples in HP computer as shown in a), b), c),
and d). ..................................................................................................................... 73
Figure 37 – SC test samples. ................................................................................... 77
Figure 38 - Photograph of the HT UMSA Technology Platform. A – Melting and
environmental chamber, B - heat exchanging systems, C – Power supply, D – Data
acquisition system, E –Desktop computer, X – Water cooling pump. ................... 78
Figure 39 - Solution Treatment heating- quenching curve. .................................... 81
Figure 40 - Calibration scale at different LOM magnification. .............................. 82
Figure 41 - The As-Cast microstructure showing the dendrite structure and
superimposed intersect lines according to the ASTM R-1(Al. 100X) ................... 83
Figure 42 - Cooling curve and its first derivative of unmodified A356 at
atmospheric pressure in HT UMSA Platform. ........................................................ 89
xv
Figure 43 - Cooling curve and its first derivative of unmodified A356 at
atmospheric pressure in SC UMSA Platform. ........................................................ 90
Figure 44 - Cooling curve and its first derivative of unmodified A356 alloy at 115
MPa pressure with 20 cycles. .................................................................................. 90
Figure 45 – Comparison of cooling curves of unmodified A356 at different
pressure profiles. ..................................................................................................... 95
Figure 46 – Comparison of first derivatives of cooling curves of unmodified A356
at different pressure profiles. .................................................................................. 96
Figure 47 - Comparison of first derivatives of cooling curves of unmodified A356
at 115 MPa pressure profiles................................................................................... 97
Figure 48 - Correlation between α-dendrite growth temperature and cyclic pressure
of unmodified A356 alloy at different pressure profiles (Appendix E) .................. 97
Figure 49 – Cumulative energy of unmodified A356 alloy under 115 MPa with 20
pressure cycles. ....................................................................................................... 99
Figure 50 - Correlation between cumulative energy and cyclic pressure of
unmodified A356 alloy at different pressure profiles (Appendix F) .................... 100
Figure 51 - Correlation between solidification rate and cyclic pressure of
unmodified A356 alloy at different pressure profiles. .......................................... 100
Figure 52 - Correlation between SDAS or dendrite cell size and average
solidification rate of unmodified A356 alloy at different pressure profiles.......... 101
Figure 53 - Cooling curves of Sr modified A356 at variable pressure with variable
cycles..................................................................................................................... 103
Figure 54 - First derivatives of cooling curves of Sr modified A356 at variable
pressure with variable cycles. ............................................................................... 103
Figure 55 - Cooling curves of Nano alumina modified A356 at 115 MPa pressure
with variable cycles............................................................................................... 106
Figure 56 - First derivatives of cooling curves of Nano alumina modified A356 at
115 MPa pressure with variable cycles. ................................................................ 106
Figure 57 - Cooling curves of Sr & Nano alumina modified A356 alloy at 115 MPa
pressure with variable cycles. ............................................................................... 107
Figure 58 - First derivatives of cooling curves of Sr & Nano alumina modified
A356 alloy at 115 MPa pressure with variable cycles. ......................................... 108
Figure 59 - LOM Microstructure of UM A356 alloy (Ref. # 31513) solidified in
SC die at atmospheric pressure a) Morphology of α-Al Dendrite and Al-Si
eutectics, dendrite cell size 23.8 µm b) Main phases are identified , acicular
eutectic Si. ............................................................................................................. 111
Figure 60 - SEM Microstructure of UM A356 alloy (Ref. # 31513) solidified in SC
die at atmospheric pressure a) Morphology of α-Al Dendrite, Si eutectics,
AlSiMgFe size is 30x2 µm b) eutectic Si and α-Al in deep etched sample, , Si size
40x1 µm. ............................................................................................................... 111
xvi
Figure 61 - LOM Microstructure of UM A356 alloy (Ref. # 32813) solidified in
SC die at 50 MPa/1 pressure a) Morphology of α-Al Dendrite and Al-Si
eutectics, dendrite cell size 15.2 µm, b) Main phases are identified , lamellar
eutectic Si. ............................................................................................................. 112
Figure 62 – Average SDAS or Dendrite Cell Size relationship with Pressure. .... 113
Figure 63 - LOM Microstructure of UM A356 alloy(Ref. # 40113) solidified in
SC die at 55 MPa/10 pressure a) Morphology of α-Al cells and Al-Si eutectics,
dendrite cell size 11.3 µm, b) Fibrous eutectic Si. ............................................... 113
Figure 64 - LOM Microstructure of UM A356 alloy (Ref. # 40213) solidified in
SC die at 60 MPa/10 pressure, a) Morphology of α-Al cells and Al-Si eutectics,
dendrite cell size 9.9 µm, b) Fibrous eutectic Si. ................................................. 114
Figure 65 - LOM Microstructure of UM A356 alloy (Ref. # 41913) solidified in
SC die at 80 MPa/10 pressure a) Morphology of α-Al Dendrite and Al-Si
eutectics, dendrite cell size 11.9 µm, b) Acicular eutectic Si. ............................. 114
Figure 66 - LOM Microstructure of UM A356 alloy (Ref. # 41713) solidified in
SC die at 90 MPa/10 pressure a) Morphology of α-Al Dendrite and Al-Si
eutectics, dendrite cell size 12.5 µm, b) Acicular eutectic Si. ............................. 114
Figure 67 - LOM Microstructure of UM A356 alloy (Ref. # 62513) solidified in
SC die at 115 MPa/20 cycles pressure a) Morphology of α-Al cells and Al-Si
eutectics, dendrite cell size 8.1 µm, b) Fibrous eutectic Si. ................................. 115
Figure 68 - SEM Microstructure of UM A356 alloy (Ref. # 62513) solidified in SC
die at 115 MPa/20 cycles pressure a) Morphology of α-Al cells and Al-Si
eutectics, dendrite cell size 8.1 µm, b) Fibrous eutectic Si. ................................. 115
Figure 69 - LOM Microstructure of UM A356 alloy (Ref. # 61013) solidified in
SC die at 115 MPa/40 pressure a) Morphology of α-Al Dendrite and Al-Si
eutectics, dendrite cell size 11.5 µm b) Lamellar eutectic Si. .............................. 115
Figure 70 - LOM Microstructure of UM A356 alloy (Ref. # 61213A) solidified in
SC die at 115 MPa/50 pressure a) Morphology of α-Al Dendrite and Al-Si
eutectics, dendrite cell size 10.9 µm b) Lamellar eutectic Si. ............................. 116
Figure 71 - SEM Microstructure of UM A356 alloy solidified in SC die at 115
MPa, α-Al and Al-Si eutectics in deep etched sample, acicular eutectic Si, a) at 40
cycles (Ref. # 61013) b) at 50 cycles pressure (Ref. # 61213A). ....................... 116
Figure 72 - LOM Microstructure of 0.015 wt% Sr M A356 alloy (Ref. # 72413)
solidified in SC die at atmospheric pressure, a) Morphology of α-Al cell and Al-Si
eutectics, dendrite cell size 13 µm, b) Fibrous eutectic Si. ................................... 119
Figure 73 - LOM Microstructure of 0.04 wt% Sr M A356 alloy (Ref. # 51313)
solidified in SC die at 100 MPa, 1 cycle pressure a) Morphology of α-Al cells and
Al-Si eutectics, dendrite cell size 10.8 µm, b) Fibrous eutectic Si. ..................... 120

xvii
Figure 74 - LOM Microstructure of 0.04 wt% Sr M A356 alloy (Ref. # 51513)
solidified in SC die at 100 MPa 10 cycle pressure, a) Morphology of α-Al cells and
Al-Si eutectics, dendrite cell size 10.8 µm, b) Fibrous eutectic Si. ...................... 120
Figure 75 - SEM ultrafine as-cast microstructure of 0.04 wt% Sr M A356 alloy
(Ref. # 51313) solidified in SC die at 100 MPa/1 cycle pressure, Morphology of α-
Al cells and Al-Si eutectics in etched sample, Fibrous dendritic Si. .................... 120
Figure 76 - SEM ultrafine as-cast microstructure of 0.04 wt% Sr M A356 alloy
(Ref. # 51313) solidified in SC die at 100 MPa/1 cycle pressure, Morphology of
α-Al cells and Al-Si eutectics in etched sample, Fibrous dendritic Si. ................. 121
Figure 77 – SEM ultrafine as-cast microstructure of 0.04 wt% Sr M A356 alloy
(Ref. # 51313) solidified in SC die at 100 MPa/1 cycle pressure, Morphology of α-
Al cells and Al-Si eutectics in etched sample, Fibrous dendritic Si. .................... 121
Figure 78 - SEM ultrafine as-cast microstructure of 0.04 wt% Sr M A356 alloy
(Ref. # 51513) solidified in SC die at 100 MPa/10 cycles pressure, Morphology of
α-Al cells and Al-Si eutectics in etched sample, Fibrous dendritic Si. ................ 122
Figure 79 - LOM Microstructure of 0.015 wt% Sr M A356 alloy (Ref. # 61913)
solidified in SC die at 115 MPa 7 cycle pressure a) Morphology of α-Al elongated
cells and Al-Si eutectics, dendrite cell size 9.4 µm b) Acicular eutectic Si. ....... 122
Figure 80 - LOM Microstructure of 0.015 wt% Sr M A356 alloy (Ref. # 71613)
solidified in SC die at 115 MPa 50 cycles pressure a) Morphology of α-Al
fragmented cells and Al-Si eutectics, dendrite cell size 9.3 µm b) Fibrous eutectic
Si. .......................................................................................................................... 123
Figure 81 - SEM Microstructure of 0.015 wt% Sr M A356 alloy (Ref. # 71613)
solidified in SC die at 115 MPa/50 cycles pressure a) Morphology of α-Al cells
and Al-Si eutectics in polished sample, Fibrous dendritic Si. ............................. 123
Figure 82 - SEM Microstructure of 0.015 wt% Sr M A356 alloy (Ref. # 71613)
solidified in SC die at 115 MPa/50 cycles pressure a-b) Morphology of Si
eutectics in etched sample, Fibrous dendritic Si. .................................................. 123
Figure 83 - LOM Microstructure of 1 wt% NAMA M A356 alloy (Ref. # 72413)
solidified in SC die at atmospheric pressure a) Morphology of α-Al cells and Al-Si
eutectics, dendrite cell size 16.1 µm, b) Acicular eutectic Si. .............................. 126
Figure 84 - LOM Microstructure of 1 wt% NAMA M A356 alloy (Ref. # 61213B)
solidified in SC die at 115 MPa 2 cycles pressure a) Morphology of α-Al cells and
Al-Si eutectics, dendrite cell size 7.8 µm, b) Acicular eutectic Si. .................... 126
Figure 85 - SEM Microstructure of 1 wt% NAMA M A356 alloy (Ref. # 61213B)
solidified in SC die at 115 MPa 2 cycles pressure, Morphology of α-Al cells and
Al-Si eutectics in an etched sample, acicular eutectic Si. ..................................... 127
Figure 86 - LOM Microstructure of 1 wt% NAMA M A356 alloy (Ref. # 62013)
solidified in SC die at 115 MPa 20 cycles pressure a) Morphology of fragmented

xviii
and semi-solid α-Al dendrites and Al-Si eutectics, dendrite cell size 11.3 µm, b)
Fibrous eutectic Si................................................................................................. 127
Figure 87 - LOM Microstructure of 1 wt% NAMA M A356 alloy (Ref. # 71513)
solidified in SC die at 115 MPa 50 cycles pressure a) Morphology of α-Al cells
and Al-Si eutectics, dendrite cell size 9.2 µm b) Fibrous eutectic Si. ................. 127
Figure 88 - SEM Microstructure of 1 wt% NAMA M A356 alloy (Ref. # 71513)
solidified in SC die at 115 MPa 50 cycles pressure a) Morphology of α-Al Cells
and Al-Si eutectics in polished sample, b) Ultrafine Si. ..................................... 128
Figure 89 - SEM Microstructure of 1 wt% NAMA M A356 alloy (Ref. # 71513)
solidified in SC die at 115 MPa 50 cycles pressure a) Morphology of α-Al
equiaxed cells and Al-Si eutectics in polished sample, b) shrinkage porosity filled
with MgO. ............................................................................................................. 128
Figure 90 - LOM Microstructure of both 0.015 wt% Sr & 1 wt% NAMA M A356
alloy (Ref. # 72413C) solidified in SC die at atmospheric pressure a) Morphology
of α-Al cells & Al-Si eutectics, dendrite cell size 15.2 µm b) Fibrous eutectic Si.
............................................................................................................................... 132
Figure 91 - LOM Microstructure of both 0.015 wt% Sr & 1 wt% NAMA M A356
alloy (Ref. # 81413) solidified in SC die at 115 MPa 12 cycles pressure a)
Morphology of α-Al cells & Al-Si eutectics, dendrite cell size 9.2 µm b) Fibrous
eutectic Si. ............................................................................................................. 132
Figure 92 - LOM Microstructure of both 0.015 wt% Sr & 1 wt% NAMA M A356
alloy (Ref. # 62413) solidified in SC die at 115 MPa 20 cycles pressure a)
Morphology of α-Al cells and Al-Si eutectics, dendrite cell size 9.9 µm b) Fibrous
eutectic Si. ............................................................................................................. 133
Figure 93 - LOM Microstructure of both 0.015 wt% Sr & 1 wt% NAMA M A356
alloy (Ref. # 61713) solidified in SC die at 115 MPa 50 cycles pressure a)
Morphology of α-Al cells and Al-Si eutectics, dendrite cell size 7.6 µm b) Fibrous
eutectic Si. ............................................................................................................. 133
Figure 94 - SEM Microstructure of both 0.015 wt% Sr & 1 wt% NAMA M A356
alloy (Ref. # 81413) solidified in SC die at 115 MPa 12 cycles pressure a)
Morphology of α-Al cells and Al-Si eutectics in polished sample b) Fibrous
eutectic Si. ............................................................................................................. 133
Figure 95 - LOM Microstructure of UM A356 alloy ( Ref. # 62513) solidified in
SC die at 115 MPa 20 cycles pressure and Solution Treated at 540ᵒC for 15 min
a) Morphology of α-Al & Al-Si eutectics, b) Spheroids of eutectic Si and other
phases. ................................................................................................................... 135
Figure 96 - LOM Microstructure of UM A356 alloy ( Ref. # 62513) solidified in
SC die at 115 MPa 20 cycles pressure and Solution Treated at 540ᵒC for 30 min
a) Morphology of α-Al & Al-Si eutectics, b) Spheroids of eutectic Si and other
phases. ................................................................................................................... 136
xix
Figure 97 - LOM Microstructure of 0.015 wt% Sr M A356 alloy ( Ref. # 71613)
solidified in SC die at 115 MPa 50 cycles pressure and Solution Treated at 540ᵒC
for 15 min a) Morphology of α-Al Dendrite & Al-Si eutectics, b) Spheroids of
eutectic Si and other phases. ................................................................................. 136
Figure 98 - LOM Microstructure of 0.015 wt% Sr M A356 alloy ( Ref. # 71613)
solidified in SC die at 115 MPa 50 cycles pressure and Solution Treated at 540ᵒC
for 30 min a) Morphology of α-Al & Al-Si eutectics, b) Spheroids of eutectic Si
and other phases. ................................................................................................... 136
Figure 99 - SEM Microstructure of UM A356 alloy ( Ref. # 62513) solidified in
SC die at 115 MPa 20 cycles pressure and Solution Treated at 540ᵒC for 30 min
a) Morphology of α-Al & Al-Si eutectics, b) Spheroids of eutectic Si and other
phases. ................................................................................................................... 137
Figure 100 - SEM Microstructure of 0.015 wt% Sr M A356 alloy ( Ref. # 71613)
solidified in SC die at 115 MPa 50 cycles pressure and Solution Treated at 540 ᵒC
for 30 min a) Morphology of α-Al & Al-Si eutectics, b) Spheroids of eutectic Si
and other phases. ................................................................................................... 137
Figure 101 - Image Analysis of Si Spheroids in Solution Treatment for UM and
Strontium modified alloy at 540ᵒC for 15-30 min, Comparison of Perimeter of Si
spheroids at different soaking time and alloy. ...................................................... 138
Figure 102 - Image Analysis of Si Spheroids in Solution Treatment for UM and
Strontium modified alloy at 540ᵒC for 15-30 min, Comparison of Area of Si
spheroids at different soaking time and alloy. ...................................................... 138
Figure 103 - Image Analysis of Si Spheroids in Solution Treatment for UM and
Strontium modified alloy at 540ᵒC for 15-30 min, Comparison of Diameter of Si
spheroids at different soaking time and alloy. ...................................................... 139
Figure 104 - Image Analysis of Si Spheroids in Solution Treatment for UM and
Strontium modified alloy at 540ᵒC for 15-30 min, Comparison of Roundness of Si
spheroids at different soaking time and alloy. ...................................................... 139
Figure 105 - Image analysis of Si spheroids in solution treatment for UM and
Strontium modified alloy at 540ᵒC for 15-30 min, Comparison of aspect ratio of Si
spheroids at different soaking time and alloy. ...................................................... 140
Figure 106 – Correlation between cumulative energy and pressure cycles for
modified and unmodified alloys at 115MPa. ........................................................ 144
Figure 107 – Correlation between α dendrite growth temperature and pressure
cycles for modified and unmodified alloys at 115 MPa. ...................................... 145
Figure 108 – Correlation between Al-Si eutectic growth temperature and pressure
cycles for modified and unmodified alloys at 115 MPa. ...................................... 145
Figure 109 – Correlation between average SR and cumulative energy for modified
and unmodified alloys. .......................................................................................... 146

xx
Figure 110 - Correlation between average SDAS or dendrite cell size and
cumulative energy for modified and unmodified alloys. ...................................... 146
Figure 111 – Correlation between average SDAS or dendrite cell size and average
solidification rate for modified and unmodified alloys......................................... 147
Figure 112 – Correlation between SDAS or dendrite cell size and pressure cycles
at 115 MPa for modified and unmodified alloys. ................................................. 148
Figure 113 – LOM Microstructure of Alcoa wheel part with 0.015 wt% Sr M A356
alloy solidified at atmospheric pressure in LPDC process and Solution Treated at
540 ᵒC for 5 hours a) Morphology of α-Al Dendrite & Al-Si eutectics, b)
Eutectic Si and other phases. ................................................................................ 149
Figure 114 - Cooling curve and its first derivative of unmodified A356 at 50 MPa
with 1 pressure cycle. ............................................................................................ 167
Figure 115 - First derivative of the cooling curve of unmodified A356 at 50 MPa 1
pressure cycle. ....................................................................................................... 167
Figure 116 - Cooling curve and pressure profile of unmodified A356 at 50 MPa
with 1 pressure cycle showing pressure applied location on the cooling cuve. .... 168
Figure 117 - Stroke and pressure curve of unmodified A356 at 50 MPa with 1
pressure cycle. ....................................................................................................... 168
Figure 118 - Cooling curve and first derivative of unmodified A356 at 55 MPa
with 10 pressure cycles. ........................................................................................ 169
Figure 119 - First derivative of cooling curve of unmodified A356 at 55 MPa with
10 pressure cycles. ................................................................................................ 169
Figure 120 - Cooling curve and pressure profile unmodified A356 at 55 MPa with
10 pressure cycles. ................................................................................................ 170
Figure 121 - Stroke, pressure and cumulative energy of unmodified A356 at 55
MPa with 10 pressure cycles. ................................................................................ 170
Figure 122 - Cooling curve and its first derivative of unmodified A356 at 60 MPa
with 10 pressure cycles. ........................................................................................ 171
Figure 123 - First derivative of cooling curve of unmodified A356 at 60 MPa with
10 pressure cycles. ................................................................................................ 171
Figure 124 - Cooling curve and pressure profile of unmodified A356 at 60 MPa
with 10 pressure cycles. ........................................................................................ 172
Figure 125 - Stroke, pressure profile and cumulative energy of unmodified A356 at
60 MPa with 10 pressure cycles............................................................................ 172
Figure 126 - Cooling curve and its first derivative of unmodified A356 at 80 MPa
with 10 pressure cycles. ........................................................................................ 173
Figure 127 - First derivative of cooling curve of unmodified A356 at 80 MPa with
10 pressure cycles. ................................................................................................ 173
Figure 128 - Cooling curve and pressure profile of unmodified A356 at 80 MPa
with 10 pressure cycles. ........................................................................................ 174
xxi
Figure 129 - Stroke, Pressure profile and cumulative energy unmodified A356 at
80 MPa with 10 pressure cycles............................................................................ 174
Figure 130 - Cooling curve and its first derivative of unmodified A356 at 90 MPa
with 10 pressure cycles. ........................................................................................ 175
Figure 131 - First derivative of cooling curve of unmodified A356 at 90 MPa with
10 pressure cycles. ................................................................................................ 175
Figure 132 - Cooling curve and pressure profile of unmodified A356 at 90 MPa
with 10 pressure cycles. ........................................................................................ 176
Figure 133 - Stroke, pressure profiles and cumulative energy of unmodified A356
at 90 MPa with 10 pressure cycles. ....................................................................... 176
Figure 134 - Cooling curve and its first derivative of unmodified A356 at 115 MPa
with 20 pressure cycles. ........................................................................................ 177
Figure 135 - First derivative of cooling curve of unmodified A356 at 115 MPa
with 20 pressure cycles. ........................................................................................ 177
Figure 136 - Cooling curve and pressure profile of unmodified A356 at 115 MPa
with 20 pressure cycles. ........................................................................................ 178
Figure 137 - Stroke, pressure profile and cumulative energy of unmodified A356 at
115 MPa with 20 pressure cycles.......................................................................... 178
Figure 138 - Cooling curve and first derivative of unmodified A356 at 115 MPa
with 40 pressure cycles. ........................................................................................ 179
Figure 139 - First derivative of cooling curve of unmodified A356 at 115 MPa
with 40 pressure cycles. ........................................................................................ 179
Figure 140 - Cooling curve and pressure profile of unmodified A356 at 115 MPa
with 40 pressure cycles. ........................................................................................ 180
Figure 141 - Stroke, pressure and cumulative energy of unmodified A356 at 115
MPa with 40 pressure cycles. ................................................................................ 180
Figure 142 – Cooling curve and its first derivative of unmodified A356 at 115 MPa
with 50 pressure cycles. ........................................................................................ 181
Figure 143 - First derivative of cooling curve of unmodified A356 at 115 MPa
with 50 pressure cycles ......................................................................................... 181
Figure 144 - Cooling curve and pressure profile of unmodified A356 at 115 MPa
with 50 pressure cycles. ........................................................................................ 182
Figure 145 - Stroke, pressure and cumulative energy of unmodified A356 at 115
MPa with 50 pressure cycles. ................................................................................ 182
Figure 146 - Cooling curve and first derivative of Sr modified A356 at atmospheric
pressure. ................................................................................................................ 183
Figure 147 - First derivative of cooling curve of Sr modified A356 at atmospheric
pressure. ................................................................................................................ 183
Figure 148 - Cooling curve and first derivative of Sr modified A356 at 100 MPa
with 1 pressure cycle. ............................................................................................ 184

xxii
Figure 149 - First derivative of cooling curve of Sr modified A356 at 100 MPa
with 1 pressure cycle. ............................................................................................ 184
Figure 150 - Cooling curve and pressure profile of Sr modified A356 at 100 MPa
with 1 pressure cycles. .......................................................................................... 185
Figure 151 - Stroke, pressure profiles and cumulative energy of Sr modified A356
at 100 MPa with 1 pressure cycle. ........................................................................ 185
Figure 152 - Cooling curve and first derivative of Sr modified A356 at 100 MPa
with 10 pressure cycles. ........................................................................................ 186
Figure 153 - First derivative of cooling curve of Sr modified A356 at 100 MPa
with 10 pressure cycles. ........................................................................................ 186
Figure 154 - Cooling curve and pressure profile of Sr modified A356 at 100 MPa
with 10 pressure cycles. ........................................................................................ 187
Figure 155 - Stroke, pressure profiles and cumulative energy of Sr modified A356
at 100 MPa with 10 pressure cycles. ..................................................................... 187
Figure 156 – Cooling curve and its first derivative of Sr modified A356 at 115
MPa with 7 pressure cycles................................................................................... 188
Figure 157 - First derivative of cooling curve of Sr modified A356 at 115 MPa
with 7 pressure cycles. .......................................................................................... 188
Figure 158 - Cooling curve and pressure profile of Sr modified A356 at 115 MPa
with 7 pressure cycles. .......................................................................................... 189
Figure 159 - Stroke, pressure profile and cumulative energy of Sr modified A356
at 115 MPa with 7 pressure cycles. ....................................................................... 189
Figure 160 – Cooling curve and its first derivative of Sr modified A356 at 115
MPa with 50 pressure cycles. ................................................................................ 190
Figure 161 - First derivative of cooling curve of Sr modified A356 at 115 MPa
with 50 pressure cycles. ........................................................................................ 190
Figure 162 - Cooling curve and pressure profile of Sr modified A356 at 115 MPa
with 50 pressure cycles. ........................................................................................ 191
Figure 163 - Stroke, pressure profile and cumulative energy of Sr modified A356
at 115 MPa with 50 pressure cycles. ..................................................................... 191
Figure 164 - Cooling curve and its first derivative of Nano alumina modified A356
at atmospheric pressure. ........................................................................................ 192
Figure 165 - First derivative of cooling curve of Nano alumina modified A356 at
atmospheric pressure. ............................................................................................ 192
Figure 166 - Cooling curve and its first derivative Nano alumina modified A356 at
115 MPa with 2 pressures cycles. ......................................................................... 193
Figure 167 - First derivative of cooling curve of Nano alumina modified A356 at
115 MPa with 2 pressures cycles. ......................................................................... 193
Figure 168 - Cooling curve and pressure profile of Nano alumina modified A356 at
115 MPa with 2 pressures cycles .......................................................................... 194

xxiii
Figure 169 - Stroke, pressure profile and cumulative energy of Nano alumina
modified A356 at 115 MPa with 2 pressures cycles. ............................................ 194
Figure 170 - Cooling curve and its first derivative Nano alumina modified A356 at
115 MPa with 20 pressures cycles. ....................................................................... 195
Figure 171 - First derivative of cooling curve of Nano alumina modified A356 at
115 MPa with 20 pressures cycles. ....................................................................... 195
Figure 172 - Cooling curve and pressure profile of Nano alumina modified A356 at
115 MPa with 20 pressures cycles. ....................................................................... 196
Figure 173 - Stroke, pressure profile and cumulative energy of Nano alumina
modified A356 at 115 MPa with 50 pressures cycles. .......................................... 196
Figure 174 - Cooling curve and its first derivative Nano alumina modified A356 at
115 MPa with 50 pressures cycles. ....................................................................... 197
Figure 175 - First derivative of cooling curve of Nano alumina modified A356 at
115 MPa with 50 pressures cycles. ....................................................................... 197
Figure 176 - Cooling curve and pressure profile of Nano alumina modified A356 at
115 MPa with 50 pressures cycles. ....................................................................... 198
Figure 177 - Stroke, pressure profile and cumulative energy of Nano alumina
modified A356 at 115 MPa with 50 pressures cycles. .......................................... 198
Figure 178 - Cooling Curve and its first derivative of Sr and Nano alumina
modified A356 at atmospheric pressure. .............................................................. 199
Figure 179 - First derivative of cooling curve of Sr and Nano alumina modified
A356 at atmospheric pressure. .............................................................................. 199
Figure 180 - Cooling Curve and its first derivative of Sr and Nano alumina
modified A356 at 115 MPa with 12 pressures cycles. .......................................... 200
Figure 181 - First derivative of cooling curve of Sr and Nano alumina modified
A356 at 115 MPa with 12 pressures cycles. ......................................................... 200
Figure 182 - Cooling curve and pressure profile of Sr and Nano alumina modified
A356 at 115 MPa with 12 pressures cycles. ......................................................... 201
Figure 183 - Stroke, Pressure profile and cumulative energy of Sr and Nano
alumina modified A356 at 115 MPa with 12 pressures cycles. ............................ 201
Figure 184 - Cooling Curve and its first derivative of Sr and Nano alumina
modified A356 at 115 MPa with 20 pressures cycles. .......................................... 202
Figure 185 - First derivative of cooling curve of Sr and Nano alumina modified
A356 at 115 MPa with 20 pressures cycles. ......................................................... 202
Figure 186 - Cooling curve and pressure profile of Sr and Nano alumina modified
A356 at 115 MPa with 20 pressures cycles. ......................................................... 203
Figure 187 - Stroke, Pressure profile and cumulative energy of Sr and Nano
alumina modified A356 at 115 MPa with 20 pressures cycles. ............................ 203
Figure 188 - Cooling Curve and its first derivative of Sr and Nano alumina
modified A356 at 115 MPa with 50 pressures cycles. .......................................... 204

xxiv
Figure 189 - First derivative of cooling curve of Sr and Nano alumina modified
A356 at 115 MPa with 50 pressures cycles. ......................................................... 204
Figure 190 - Cooling curve and pressure profile of Sr and Nano alumina modified
A356 at 115 MPa with 50 pressures cycles. ......................................................... 205
Figure 191 - Stroke, Pressure profile and cumulative energy of Sr and Nano
alumina modified A356 at 115 MPa with 50 pressures cycles. ............................ 205

xxv
LIST OF APPENDICES
Appendix A – UM A356 at Different Pressure Profiles (Cooling Curve, First
Derivative Curve, Pressure Curve, Stroke and Cumulative Energy Curve)......167
Appendix B – Sr Modified A356 Alloy at Different Pressure Profiles (Cooling
Curve, First Derivative Curve, Pressure Curve, Stroke and Cumulative Energy
Curve)…………………………………………………………………………183
Appendix C – Nano Alumina Modified A356 at Different Pressure Profiles
(Cooling Curve, First Derivative Curve, Pressure Curve, Stroke and Cumulative
Energy Curve)…………………………………………………………………192
Appendix D – Sr and Nano Alumina Combinedly Modified A356 at Different
Pressure Profiles (Cooling Curve, First Derivative Curve, Pressure Curve, Stroke
and Cumulative Energy Curve)…………………………………………….…199
Appendix E - Non Linear Regression for the Correlation between the α-Dendrite
Growth Peak Temperature and the Cyclic Pressure of UM A356 alloy at
Different Pressure Profiles.................................................................................206
Appendix F - Non Linear Regression for the Correlation between the
Cumulative energy and the Cyclic Pressure of UM A356 alloy at Different
Pressure Profiles………………………………………………………………208
Appendix G – Permission from Co-Author………………..……………...….210

xxvi
LIST OF ABBREVIATIONS/SYMBOLS
A/D, D/A Analogue to Digital, Digital to Analogue
DAP Data Acquisition Processor
DAQ Data Acquisition
HPDC High Pressure Die Casting
HSR High Solidification Rate
HT/ST Heat Treatment/Solution Treatment
HT UMSA High Temperature Universal Metallurgical Simulator and
Analyzer
LOM Light Optical Microscopy
LPDC Low Pressure Die Casting
LVDT Linear Variable Differential Transformer
MA Master Alloy (Al-Sr)
MCPT Metal Casting and Post-Processing Technology
NAMA Nano Alumina Master Alloy (MgAl2O
3)
NIST National Institute of Standards and Technology
SC Squeeze Casting
SEM Scanning Electron Microscopy
SDAS Secondary Dendrite Arm Spacing
SR [⁰C/s] Solidification Rate - Average rate of temperature change in the
semi-solid region
SC UMSA Squeeze Casting Universal Metallurgical Simulator and Analyzer
TA Thermal Analysis
TαDEN
NUC
[⁰C] α- Al Dendrite Nucleation Temperature
TαDEN
MIN [⁰C] α- Al Dendrite Minimum (Undercooling) Temperature
TαDEN
G [⁰C] α- Al Dendrite Growth Temperature
TAlSi
E, G [⁰C] Al-Si Eutectic Growth Temperature
Ts [⁰C] Solidus Temperature
tαDEN
G α- Al Dendrite Growth Time
tS Solidus Time
UBC University of British Columbia
UM Unmodified
UMSA TP Universal Metallurgical Simulator and Analyzer Technology
Platform

1
CHAPTER ONE - INTRODUCTION
1.0. Background
In this competitive automotive industry there is a continuing demand for materials with
improved strength and durability for achievement of weight and cost savings. The
aluminum casting industry responds to these goals through the use of novel technologies
and development of semi-solid processing that result in significant refinement and
modification of microstructural features (phases) including eutectic Si, SDAS and α-
dendrite cell size for the improvement of components’ functional. Alcoa, a leader in the
production of A356 aluminum wheels, which are 35 - 44% lighter compared to the
conventional steel wheels, uses the Low Pressure Die Casting (LPDC) process [1]. The
Metal Casting and Post-processing Technology (MCPT) Group of University of Windsor
collaborated with Alcoa on LPDC technology.
The ALCOA Collingwood Aluminum Wheel Plant used the following processing
parameters for making A356 aluminum wheels with the LPDC process [2]:
Induction melting: maximum temperature 780°C
Degassing and skimming in the temperature range from 760 to 735°C
Sr master alloy (Al-15wt%Sr) for Si modification: 130 to 150 ppm Sr
TiB master alloy (Al-5wt%Ti, 1wt%B) for grain refining: 0.12 to 0.13 wt%Ti;
10 to 30 ppm B
Melt transfer temperature (to the LPDC machine) range from 735 to 705°C
Casting temperature range: 705 to 695°C

2
Wheel ejection temperature: 470°C
Solution Treatment: temperature range (set point in various zones): 540 to
545°C, time: 297 minutes, 70°C water quenching; Artificial aging:
temperature 150°C, time 148 min
There are ample publications on the utilization of Squeeze casting (SC), High Pressure
Die Casting (HPDC) and Low Pressure Die Casting (LPDC) technologies for automotive
cast components, e.g.: transmission cases and road wheels, radiator support, dash panels
etc. However, exploring a novel approach in this area, MCPT group found the SC UMSA
to be a potential process for wheel production, which is very similar to the Die Casting
process as high pressure is applied on the liquid melt in both processes.
The current study shows that commercial LPDC as-cast and heat treated structures of
A356 Al wheels can be significantly improved by using the following methodologies in
SC UMSA Technology Platform keeping similar process parameters [2]:
Melt treatment using commercial Al-10wt.%Sr master alloy and the novel Nano
Alumina Master Alloy, MgAl2O3 (NAMA) individually and combined.
Various pressure profiles (cyclic pressure up to 115 MPa with 1-50 No. of cycles,
amplitude, timing etc.)
Solution treatment (at 540 ᵒC, 15- 30 min) including Quenching at 70ᵒC water and
natural aging, no artificial aging.
MCPT Group is involved in the further developing of SC-UMSA Technology Platform’s
physical simulation capabilities for possible merging of the SC and LPDC processes
rendering ultrafine Si, α-dendrite cell and SDAS. A number of further Master thesis and
3
Ph.D dissertations will cover the new technology for the development of new Magnesium
alloy, hypoeutectic and hypereutectic aluminum alloys. Depending on the research
outcome, the new SC technology may be used as an alternative stand alone production
process for advanced, cost effective mass production of low weight components. SC
UMSA Technology Platform including a novel squeeze pin has been being considered for
patenting. The new scientific and applied engineering knowledge needed for rapid
progress in the understanding of the metallurgical phenomena governing SC
technological processes of new class A356 material(s) and cast components is generated
in the scope of this research project.
This thesis will concentrate on the analysis and quantification of the solidification of
squeezed cast A356 Aluminum alloy subjected to high pressure applied in a cyclic
manner between the liquidus and solidus temperature. Applied Pressure on a solidifying
semi solid melt has a great impact on the thermal and microstructural characteristics of
the resulting cast component. The pressure can be applied in a number of ways, such as
high pressure die casting, hot isostatic pressing or squeeze casting. Squeeze casting (SC)
is held to provide the highest mechanical properties of the three. In commercial SC,
pressure is applied in static manner and produces large dendrites. Cyclic pressure
disintegrates the primary phase (long dendrite arm) as well as the secondary phases
(Coarse Si, AlSiFeMg) and produces almost equiaxed α-aluminum cell and ultrafine
dendritic eutectic Si. Solution treatment of this structure goes into spheroidization of Si
particles within a very short soaking time. Therefore, the innovative cyclic pressure was
chosen for the research as per the direction of Dr. Jerry Sokolowski.

4
In addition, A356 alloy has high demand in the auto industry due to its excellent
castability and good weldability. It is currently the most popular alloy used in squeeze
casting and semi solid metal processing. A356 has long been the material of choice for
cast aluminum automobile wheels in North America and has become the standard for
most automotive chassis and suspension castings as well. This alloy is used by Alcoa,
Toyota and GKN plc for making automotive wheels through squeeze casting. In other
applications where pressure tightness, and good resistance to corrosion are required,
A356 alloy is also the right candidate [3].

5
1.2. Scope of Research
The research is outlined as per the flow chart shown in Fig. 1.
Figure 1 – Flow chart for the scope of research.

6
1.3. Objectives
1. To perform a worldwide, comprehensive literature review regarding the A356 alloy; its
processing technologies including Squeeze casting (SC); the effect of pressure profiles
during solidification; master alloys; thermal and metallurgical analysis for material and
process characterization.
2. To determine the methodologies and the calibration scope of thermocouples and the
Data Acquisition System used in SC UMSA Platform.
2.1. HT UMSA Calibration at a very low Solidification Rate (SR) against
National Institute of Standards and Technology (NIST) calibrated data.
2.2. SC UMSA Calibration at a high SR against HT UMSA calibrated data.
3. To design and execute SC UMSA experiments for the development of novel materials
and technology as well as characterization of the solidification process for untreated and
treated A356 melts/samples subjected to variable pressure profiles (Pressure up to 115
MPa, 1-50 cycles).
3.1. To determine a suitable pressure profile for the untreated and the melt-
treated A356 using nano-Al2O3 and Sr Master Alloys as well as combined (Sr and
Nano Alumina) Master Alloys rendering semi-solid α-Al cells and ultra fine Si in
the as-cast SC test samples.
3.2. To determine Solution Treatment (ST) parameters rendering a significantly
improved Si structure in comparison with the LPDC technology.

7
4. To understand the effect of experimental conditions on the solidified structure and
thermal data as well as solution treated microstructures.

8
CHAPTER TWO - LITERATURE REVIEW
2.1. Aluminum and Aluminum Alloys
2.1.1. Aluminum
Pure aluminum is a soft, lightweight metallic element. It is the second most plentiful
metallic element on earth. It became an economic competitor in engineering applications
at the end of the 19th century [4]. The properties of aluminum that make this metal and
its alloys the most economical and attractive for a wide variety of uses are appearance,
light weight, fabricability, physical properties, mechanical properties, and corrosion
resistance. Aluminum has a density of only 2.7 g/cm3, which is approximately one-third
of steel (7.83 g/cm3), copper (8.93 g/cm
3), or brass (8.53 g/cm
3). It can display excellent
corrosion resistance in most environments, including atmosphere, water (including salt
water), petrochemicals, and many chemical systems if optimized in terms of chemical
composition and heat treatment [7-9].
2.1.2. Aluminum Alloys
Aluminum alloys are divided into two major categories based on the processing
technology and the primary mechanism of property development: Cast Aluminum and
wrought aluminum alloys [7-9]. Wrought alloys are those obtained by working on ingots
of particular forms, which can be affected by rolling, extruding, drawing or forging. Cast
alloys are those for which ingots are melted and poured into moulds having the shape of
the final product [7-9].

9
2.1.3. Alloy Designation of Cast Aluminum Alloys
A system for designating aluminum and aluminum alloys that incorporate the product
form (wrought, casting, or foundry ingot), are covered by American National Standards
Institute (ANSI) standard H35.1. The Aluminum Association is the registrar under ANSI
H35.1 with respect to the designation and composition of aluminum alloys in the United
States [4]. The Aluminum Association has established a system of nomenclatures to
divide the alloys according to a number of criteria, including chemistry and processing
(i.e. cast vs. wrought alloys). This thesis will discuss only the cast aluminum alloys. The
cast aluminum alloys families are shown in Table 1 [4].
Table 1 - Cast Aluminum Alloy Families [4].
Code Description
1xx.x Controlled unalloyed (pure) compositions
2xx.x Copper as major alloying element, other elements may be included
3xx.x Silicon as major alloying element, other elements (e.g. Cu or Mg) included
4xx.x Silicon as principal alloying element
5xx.x Magnesium as principal alloying element
6xx.x Currently unused
7xx.x Zinc as principal alloying element, other elements (e.g. Cu, Cr, Mn or Mg)
included
8xx.x Tin as majorly alloying element
9xx.x Currently unused
Cast alloys are described by a three digit system followed by a decimal value. In this
nomenclature, ‘xx’ is a unique code that identifies a specific alloy composition within the

10
family of alloys. The ‘x’ following the decimal point refers to alloy composition limits
and indicates either cast composition limits (.0) or ingot composition limits (e.g. .1 or .2).
Furthermore, a letter added as a prefix to a code indicates a specific restriction to the
alloy such as a limitation on impurity elements between primary and secondary alloys
[3]. For an instance, differences between designations and the alloys are compared in
Table 2 between two alloys, 356.0 and A356.0. Also, some common industrial aluminum
alloys are shown in Table 3.
2.1.4. Importance of Al-Si Alloys
Among all commercial aluminum casting alloys, Al-Si alloys are the most important ones
mainly because of their excellent casting characteristics. The most attractive reasons for
which Al-Si alloys are widely used are their inexpensiveness and availability. Addition of
Si to pure aluminum imparts high fluidity, good feeding characteristics, low shrinkage
and good hot cracking resistance [4]. The high strength to weight ratio is another
important characteristic. While the volume of most metals (including Al) shrinks
substantially on solidification, two phase Al-Si alloys contract relatively less. These are
the only Al alloys that are not prone to hot-tearing during solidification. Silicon has a
density of 2.3 g/cc, which is very close to that of aluminum, and thus is one of the few
elements which may be added to aluminum without affecting the light weight of the
alloy. For a specific application, the selection of an alloy depends on its castability, the
casting process, the required mechanical and physical properties and the end use of the
casting. The properties of Al-Si alloys make them very popular in various applications
including the automotive, aerospace and defense industries.

11
Table 2 - Comparison of Two Alloy Designations and Their Chemistries [3].
Code Composition (Trace elements excluded)
356.0 6.5-7.5 Si, 0.25 Cu max, 0.20-0.45 Mg, 0.35 Mn max, 0.60 Fe max, 0.35 Zn
max, 0.25 Ti max
A356.0 6.5-7.5 Si, 0.20 Cu max, 0.25-0.45 Mg, 0.10 Mn max, 0.20 Fe max, 0.10 Zn
max, 0.20 Ti max
Table 3 - Some Common Industrial Alloys of Aluminum [8].
Alloy types Alloy Characteristics
Hypoeutectic Al-Si casting
alloys (less than 10% Si)
Standard automotive grades of A356 and 359
Aerospace and structural alloys: C355 and 357
High-purity alloys: B356, C356 and E357, F357
Low strength, high ductility, binary alloys: 443 and 444
Die-casting alloys: 360 and
Eutectic Al-Si casting alloys
(greater than 10% and less
than 12.6% Si)
High-purity near-eutectic Al-Si alloys: 413.X and A413.x
For thin wall intricate, high integrity die-cast parts
requiring ductility and consistent castability and pressure
tightness A365, Aural™-2 and Aural™-3
Hypereutectic Al-Si casting
alloys (greater than 12.6 %
Si)
For wear resistance castings: A390.1
Al-Cu alloys High strength and ductility alloy with fracture toughness:
A206, B206. High temperature alloy 242
Al-Si-Cu alloys
Automotive and Aerospace alloys: 319, 354, A355, and
C355. Specialty diesel engine cylinder head alloys by
inquiry only.
2.1.5. Al-Si Alloy System
Al-Si binary alloy is a eutectic system with the eutectic composition at 12.6 wt. % Si and
eutectic temperature at 577 C. The Al-Si binary phase diagram is shown in Figures 2-3.
12
The two phases in equilibrium below the eutectic temperature will be Al solid solution
(solid solution of Si in Al) and pure Si. The solid solubility of Si in Al at 577 ᵒC is 1.65%.
However, rapid quenching from the liquid in non-equilibrium stage raises the solubility
up to 16% Si and shifts the eutectic point up to 17% Si [9]. Silicon reduces the thermal
expansion coefficient, increases corrosion and wear resistance and improves casting and
machining characteristics of the alloy. As the Al-Si alloy solidifies, the primary alpha
aluminum forms and grows in dendrites. When the eutectic point is reached, the eutectic
Al-Si phases nucleate and grow until the end of solidification. The alloys to the left of the
eutectic composition are referred to as hypoeutectic alloys and those to the right as
hypereutectic alloys [12-13].
At room temperature, hypoeutectic alloys consist of a soft and ductile primary aluminum
phase and a hard brittle eutectic silicon phase. In hypoeutectic alloys, the silicon varies
between 5.5 and 10.5%, and primary aluminum is the first phase to solidify. The
microstructure consists of primary aluminum dendrites, eutectic Si and AlSiFe
intermetallic phases. Eutectic alloys contain 10.5 to 12.5% silicon and have
microstructures consisting mainly of aluminum - silicon eutectic. In hypereutectic alloys
containing more than 12.6% silicon, the first phase to solidify is the primary silicon
phase. Hypereutectic alloy usually contains coarse, primary silicon cuboids as well as
angular eutectic silicon phase. These alloys having a distribution of coarse silicon
cuboids provide excellent wear resistance [11].
Although binary Al-Si alloys show excellent casting characteristics, the addition of Mg,
Cu and Zn makes the alloys heat treatable, providing the means to enhance their
properties with the use of appropriate heat treatments. Magnesium contents are typically
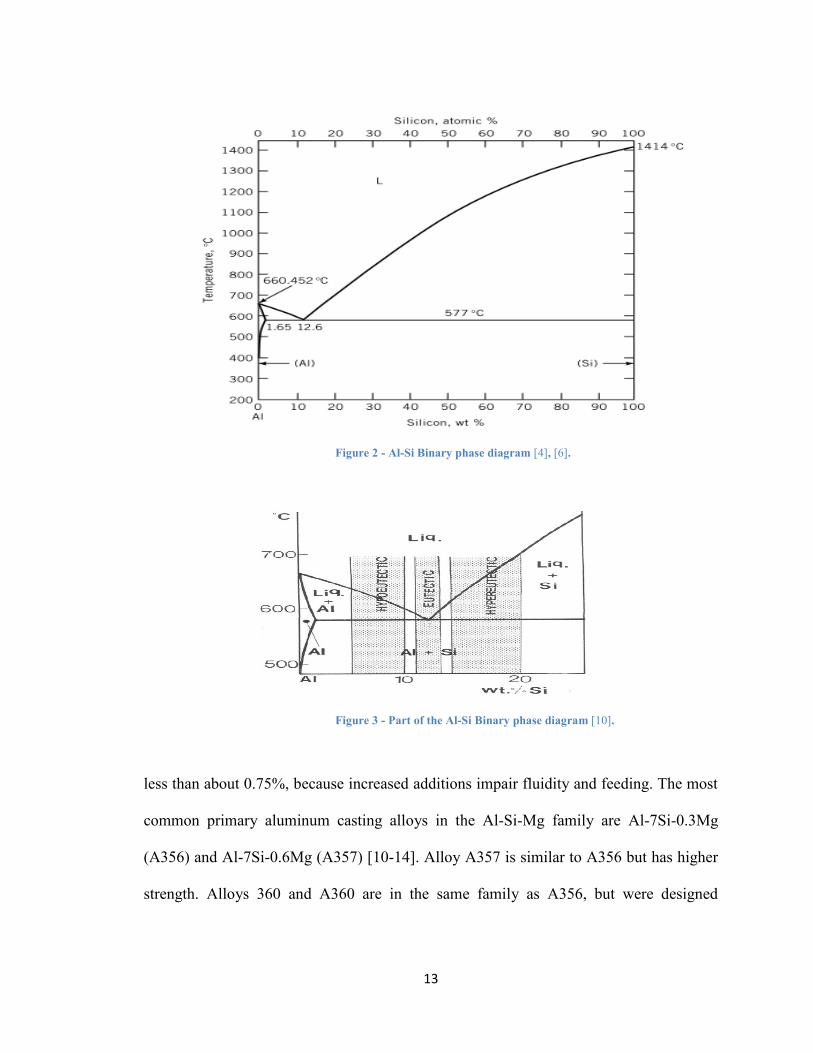
13
Figure 2 - Al-Si Binary phase diagram [4], [6].
Figure 3 - Part of the Al-Si Binary phase diagram [10].
less than about 0.75%, because increased additions impair fluidity and feeding. The most
common primary aluminum casting alloys in the Al-Si-Mg family are Al-7Si-0.3Mg
(A356) and Al-7Si-0.6Mg (A357) [10-14]. Alloy A357 is similar to A356 but has higher
strength. Alloys 360 and A360 are in the same family as A356, but were designed

14
specifically for die casting and, as such, contain more silicon and higher iron and allow
more impurities than A356 [13].
2.1.6. Mechanical Properties of Al-Si Alloys
The mechanical properties of an Al-Si cast alloy are mainly governed by the grain size,
secondary dendrite arm spacing (SDAS), α-dendrite cell size and the size, shape and
distribution of the eutectic silicon particles, as well as the morphologies and amounts of
intermetallic phases present [3, 6, 16]. The amount of aluminum dendrites in
hypoeutectic Al-Si alloys is mainly dependant on solidification parameters like applied
pressure, cooling rate, casting process etc., and its control can improve mechanical
properties of the finished products. Further, the desirable mechanical properties in these
alloys can also be obtained by controlling chemical composition and process parameters
during melting, casting and heat treatment [13, 17].
The amount of silicon added can depend on the casting process being used. Slow cooling
processes such as sand and investment casting can use alloys with silicon compositions of
5% to 7%, while fast cooling processes, such as squeeze casting and die casting, silicon
contents are used from 8% to 12%. The latter alloy has a higher fluidity and lower
melting point than the former. The higher silicon content, approaching the eutectic
composition of 12.6%, decreases the solidification range of the alloy, reducing the chance
of cold shuts and incomplete filling in the faster cooling processes, when cast at the same
temperature [3, 13-14, 16]. These advantages result in most common commercial casting
alloys containing a significant proportion of silicon. Other alloying additions are made to
improve the mechanical properties of the casting, or are present as impurities, either
arising from the casting process or are present in the raw material.
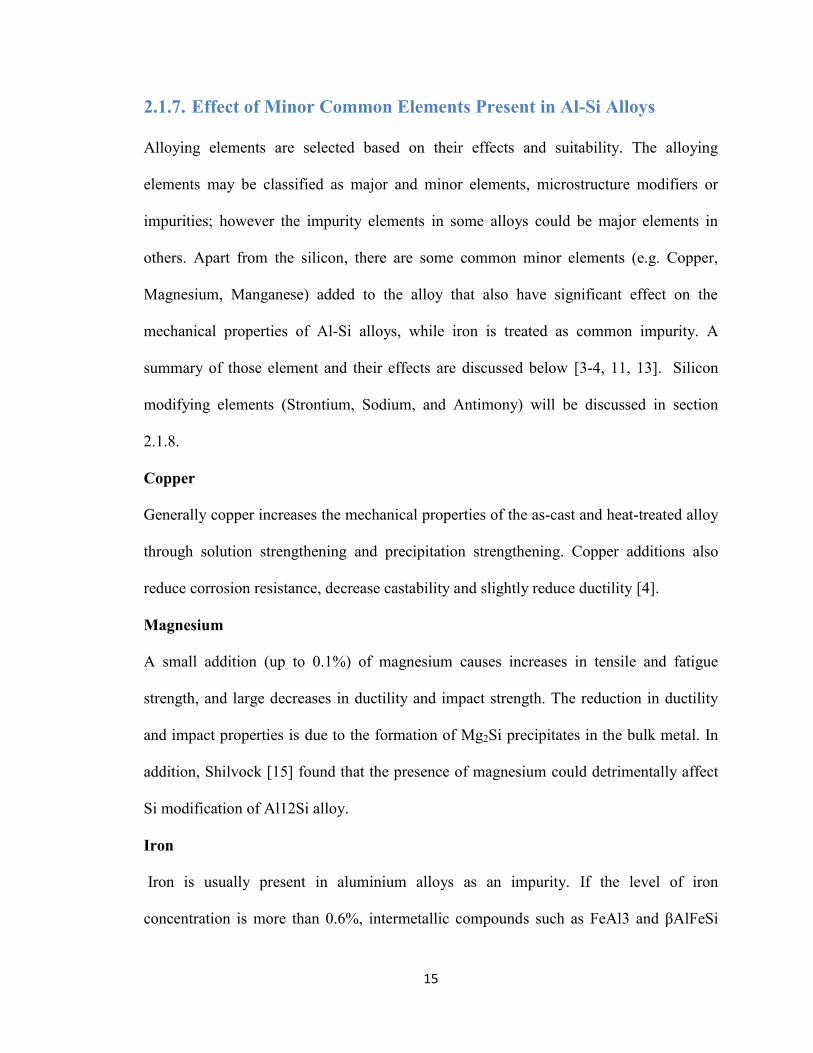
15
2.1.7. Effect of Minor Common Elements Present in Al-Si Alloys
Alloying elements are selected based on their effects and suitability. The alloying
elements may be classified as major and minor elements, microstructure modifiers or
impurities; however the impurity elements in some alloys could be major elements in
others. Apart from the silicon, there are some common minor elements (e.g. Copper,
Magnesium, Manganese) added to the alloy that also have significant effect on the
mechanical properties of Al-Si alloys, while iron is treated as common impurity. A
summary of those element and their effects are discussed below [3-4, 11, 13]. Silicon
modifying elements (Strontium, Sodium, and Antimony) will be discussed in section
2.1.8.
Copper
Generally copper increases the mechanical properties of the as-cast and heat-treated alloy
through solution strengthening and precipitation strengthening. Copper additions also
reduce corrosion resistance, decrease castability and slightly reduce ductility [4].
Magnesium
A small addition (up to 0.1%) of magnesium causes increases in tensile and fatigue
strength, and large decreases in ductility and impact strength. The reduction in ductility
and impact properties is due to the formation of Mg2Si precipitates in the bulk metal. In
addition, Shilvock [15] found that the presence of magnesium could detrimentally affect
Si modification of Al12Si alloy.
Iron
Iron is usually present in aluminium alloys as an impurity. If the level of iron
concentration is more than 0.6%, intermetallic compounds such as FeAl3 and βAlFeSi

16
are formed [15]. The β phase is associated with plate-like precipitates containing
aluminium, silicon and iron, which are detrimental to the mechanical properties. Iron
increases hot tear resistance and reduces die soldering but decreases flowability and
feeding characteristics [15].
Manganese
Manganese is reported to have a little effect on the mechanical properties of cast
aluminium silicon alloys [14]. However, Shilvock [16] reports a number of conflicting
studies which show that, in the absence of iron, manganese will either slightly increase or
decrease tensile strength and decrease ductility. Shilvock concludes that tensile strength
gains from manganese are only seen when strontium is used as a silicon modifier, and the
presence of manganese is detrimental to ductility in all cases [16]. In the presence of
significant iron (>0.5%) manganese is added to create αAl(Mn,Fe)Si "Chinese script"
precipitates instead of more embrittling βAlFeSi plates [15].
2.1.8. The A356 Alloy and Silicon Modification
Aluminum A356 alloy is a hypo-eutectic alloy. It is one of the most widely used casting
aluminum alloys in the automotive and aerospace industries due to its excellent
mechanical strength, ductility, hardness, fatigue strength, pressure tightness, fluidity, and
machinability [3]. The nominal chemical composition [3] of A356 alloy is (6.5-7.5)wt%
Si, (0.25-0.45)wt.% Mg, 0.10wt.% Mn max, 0.20wt.% Fe max, 0.10 wt.% Zn max,
0.20wt.% Ti max. The designation of this alloy is different in other countries, and it is
known as LM25 in the Great Britain, AC4C in, Japan, L-2651 in Spain and A19 in
Russia. In unmodified A356 alloy, the main eutectic reaction occurs at 577 ºC as a binary
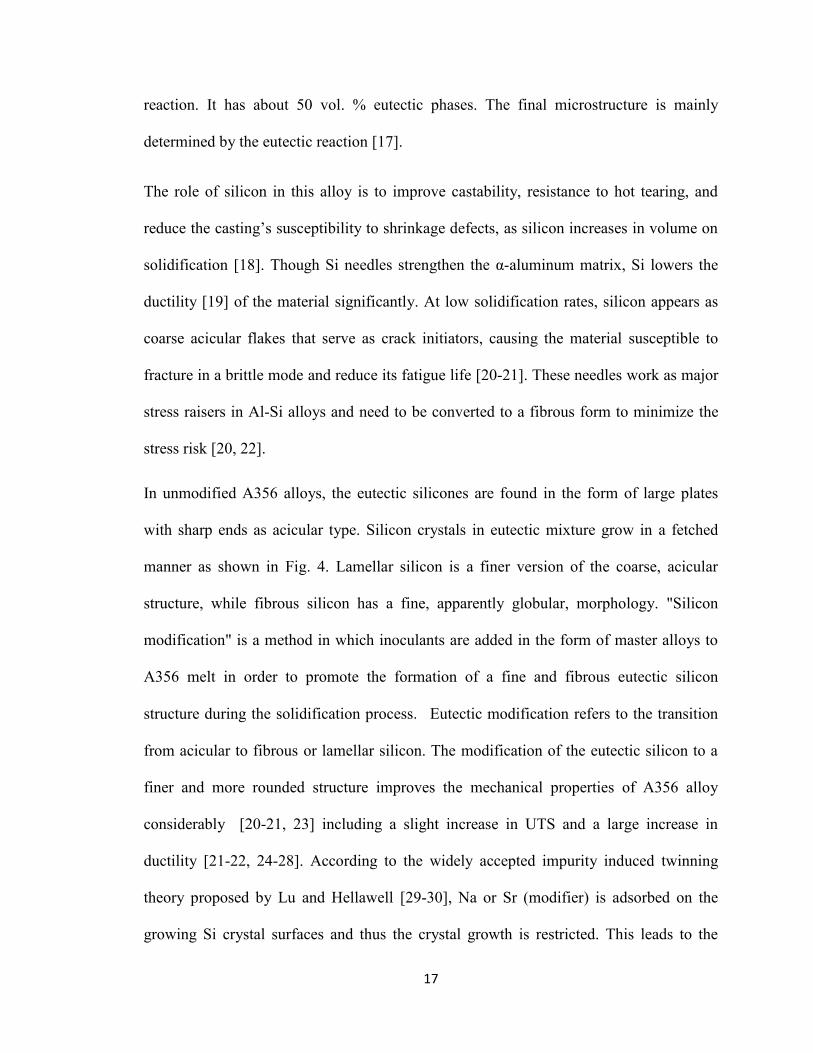
17
reaction. It has about 50 vol. % eutectic phases. The final microstructure is mainly
determined by the eutectic reaction [17].
The role of silicon in this alloy is to improve castability, resistance to hot tearing, and
reduce the casting’s susceptibility to shrinkage defects, as silicon increases in volume on
solidification [18]. Though Si needles strengthen the α-aluminum matrix, Si lowers the
ductility [19] of the material significantly. At low solidification rates, silicon appears as
coarse acicular flakes that serve as crack initiators, causing the material susceptible to
fracture in a brittle mode and reduce its fatigue life [20-21]. These needles work as major
stress raisers in Al-Si alloys and need to be converted to a fibrous form to minimize the
stress risk [20, 22].
In unmodified A356 alloys, the eutectic silicones are found in the form of large plates
with sharp ends as acicular type. Silicon crystals in eutectic mixture grow in a fetched
manner as shown in Fig. 4. Lamellar silicon is a finer version of the coarse, acicular
structure, while fibrous silicon has a fine, apparently globular, morphology. "Silicon
modification" is a method in which inoculants are added in the form of master alloys to
A356 melt in order to promote the formation of a fine and fibrous eutectic silicon
structure during the solidification process. Eutectic modification refers to the transition
from acicular to fibrous or lamellar silicon. The modification of the eutectic silicon to a
finer and more rounded structure improves the mechanical properties of A356 alloy
considerably [20-21, 23] including a slight increase in UTS and a large increase in
ductility [21-22, 24-28]. According to the widely accepted impurity induced twinning
theory proposed by Lu and Hellawell [29-30], Na or Sr (modifier) is adsorbed on the
growing Si crystal surfaces and thus the crystal growth is restricted. This leads to the
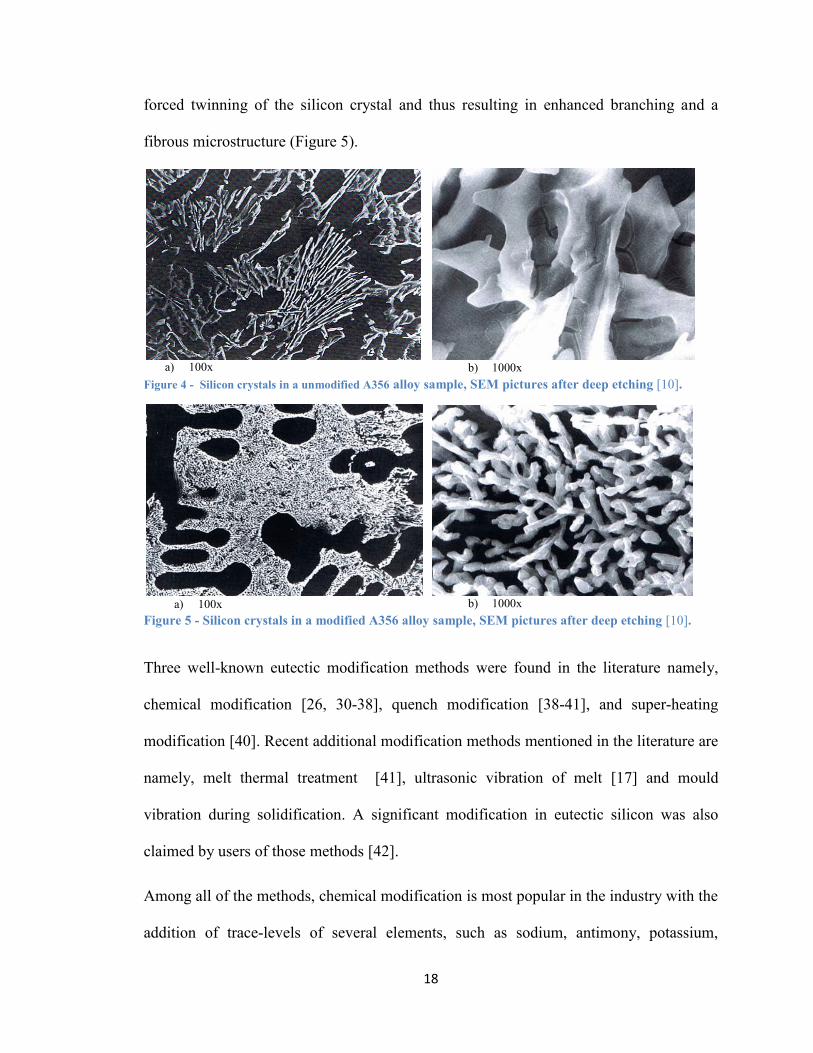
18
forced twinning of the silicon crystal and thus resulting in enhanced branching and a
fibrous microstructure (Figure 5).
Figure 4 - Silicon crystals in a unmodified A356 alloy sample, SEM pictures after deep etching [10].
Figure 5 - Silicon crystals in a modified A356 alloy sample, SEM pictures after deep etching [10].
Three well-known eutectic modification methods were found in the literature namely,
chemical modification [26, 30-38], quench modification [38-41], and super-heating
modification [40]. Recent additional modification methods mentioned in the literature are
namely, melt thermal treatment [41], ultrasonic vibration of melt [17] and mould
vibration during solidification. A significant modification in eutectic silicon was also
claimed by users of those methods [42].
Among all of the methods, chemical modification is most popular in the industry with the
addition of trace-levels of several elements, such as sodium, antimony, potassium,
a) 100x b) 1000x
b) 1000x a) 100x
19
calcium, strontium, and barium. The addition of strontium is most widely used due to
long lasting effect in the melt [45-46]. A comparison of silicon morphology in
unmodified, Sr modified and Antimony modified hypoeutectic Al-Si alloy is shown in
Figure 6 [44].
Figure 6 - Comparison of the silicon morphology in (a) unmodified, (b) Sr-modified (300ppm Sr) and (c) Sb-
modified (2400ppm Sb), hypoeutectic Aluminum–Silicon alloys [44].
2.1.9. Chemical Modification and Mechanical Characteristics
2.1.9.1. Strontium
Strontium has become very prominent as a major Si modifier in the foundry industry.
Pure strontium can be used as a modifier, but is commonly added in the form of Al-
10wt%Sr master alloy to minimize reactions with air and water vapor [25, 47-48].
Backerud et al. [10], reported that strontium addition in a A356 alloy changed the
morphology of the eutectic silicon crystals from large flakes into a fibrous structure
resembling a seaweed type morphology (Fig. 5). This morphological change influenced
20
the nucleation and growth process of eutectic Si by lowering the nucleation and α-
dendrite growth temperature of the alloy by approximately 10 ᵒC [10].
A superior modification of the silicon eutectic phase in Al-Si alloys was found in the
range of 0.007% [35], to 0.017% strontium [45, 49] despite a wider range of
concentrations found in industry from 0.015 to 0.050% and beyond. However, it is
usually accepted that modification of the eutectic Si phase occurs at strontium levels
higher than 150 ppm (0.015%) [48]. As the amount of strontium in the melt increases, the
level of modification also increases [51-52]. The optimum modification level depends
mainly on the cooling rate of the casting [18] and on its chemistry [51].
Over addition of strontium may negatively affect castability of the alloy [23]. Two
discrete effects are associated with the strontium over modification [46]. The first one is
coarsening of the silicon structure and the reversion of the fine fibrous silicon to an
interconnected plate form. The second one is the presence of strontium containing
intermetallic phases in the microstructure, such as Al2SrSi2 or Al4SrSi2 [25, 48] . Both of
these effects can reduce the mechanical properties of the alloy, causing them to revert to
values more typical of unmodified alloys. Surplus strontium in the melt, can also form
Al2Si2Sr particles and reduce the modification properties [50].
2.1.9.2. Sodium
Sodium could be used in aluminium silicon alloys as a modifier of the eutectic phase.
Addition of small quantities of Sodium could greatly improve mechanical properties of
cast aluminium silicon alloys by refining the coarse plates of eutectic silicon into a finely
dispersed fibrous structure [54-55]. Excess sodium modification results in over-
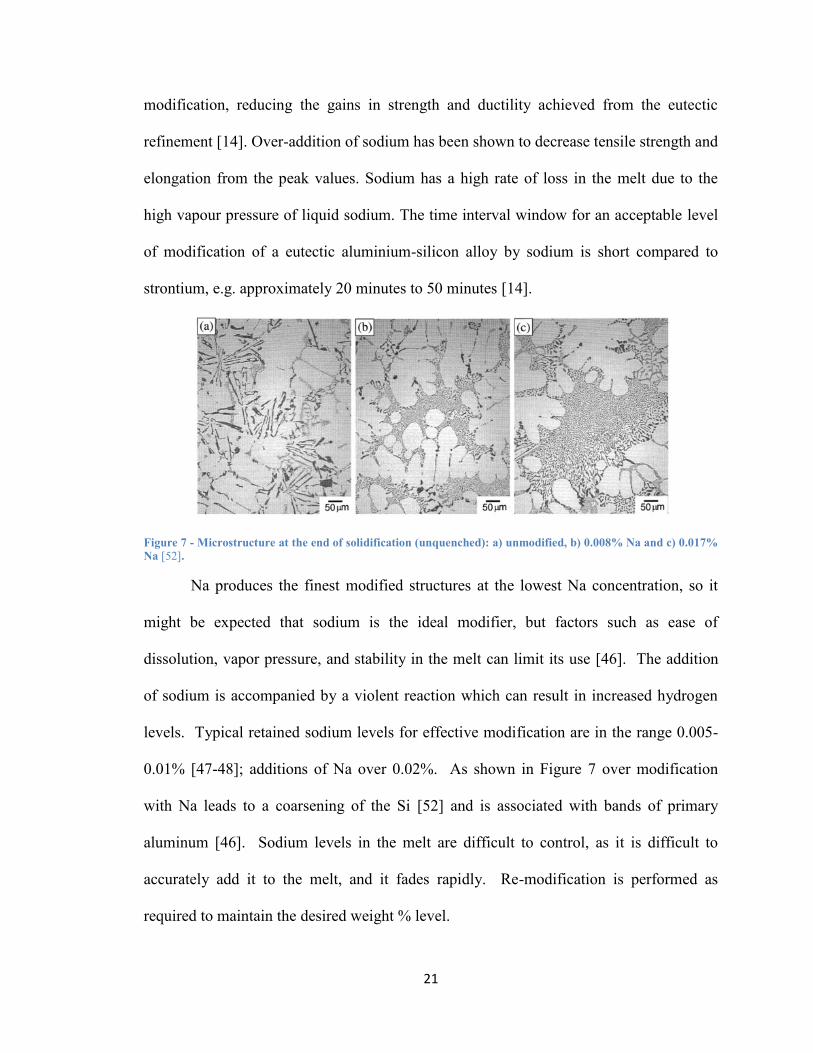
21
modification, reducing the gains in strength and ductility achieved from the eutectic
refinement [14]. Over-addition of sodium has been shown to decrease tensile strength and
elongation from the peak values. Sodium has a high rate of loss in the melt due to the
high vapour pressure of liquid sodium. The time interval window for an acceptable level
of modification of a eutectic aluminium-silicon alloy by sodium is short compared to
strontium, e.g. approximately 20 minutes to 50 minutes [14].
Figure 7 - Microstructure at the end of solidification (unquenched): a) unmodified, b) 0.008% Na and c) 0.017%
Na [52].
Na produces the finest modified structures at the lowest Na concentration, so it
might be expected that sodium is the ideal modifier, but factors such as ease of
dissolution, vapor pressure, and stability in the melt can limit its use [46]. The addition
of sodium is accompanied by a violent reaction which can result in increased hydrogen
levels. Typical retained sodium levels for effective modification are in the range 0.005-
0.01% [47-48]; additions of Na over 0.02%. As shown in Figure 7 over modification
with Na leads to a coarsening of the Si [52] and is associated with bands of primary
aluminum [46]. Sodium levels in the melt are difficult to control, as it is difficult to
accurately add it to the melt, and it fades rapidly. Re-modification is performed as
required to maintain the desired weight % level.

22
2.1.9.4. Antimony
Antimony is very stable in the melt with virtually no losses (even after re-
melting), so extra additions are not required. Sb is effective in amounts of 0.1-0.4% [46].
Although it was once used fairly extensively for commercial applications in Europe and
Japan, it is now used less, primarily because recycling metal containing Sb is difficult. In
addition, Sb can react with hydrogen dissolved in the liquid aluminum to form deadly
stibine gas (SbH3) [46].
2.1.10. Levels of Si Morphology Modification
The level of Si modification of an A356 alloy appear to have a strong reliance not
only on the strontium content, but mainly on the applied pressure during solidification,
solidification rates and post solidification solution heat treatments [19]. The modified
microstructures contain fine fibrous silicon. These fibres appear to be small individual
particles on a conventional polished surface, but etching away the aluminum shows that
they are connected in a coral or a sea weed like structure [10].
Two standards to determine the level of modification of silicon particles have been
suggested in the literature, namely: the AFS Si Modification Standard and MCPT
Quantitative Si Modification Level [18], [54]. The first method can only be used for Al-
Si hypoeutectic alloys and the second one for both hypo and hypereutectic alloys. In the
first method, the determination of the level of modification of silicon is carried out by
comparing micrographs of the test sample with the AFS wall chart by visual observation.
These results could be biased and could have observational error. It does not take
advantage of the analytical accuracy made possible by modern image analysis techniques.

23
In the second method quantitative assessment of SiML is introduced by MCPT group at
the University of Windsor. Jiang and Sokolowski [56] developed a quantitative
methodology of assessing AFS Si partic1e modification using a Leica Q550IW Image
Analysis system. Later on Bhowmik and Alam expanded the quantitative Image analysis
of Si under the supervision of Dr. J.H. Sokolowski [59-60]. Six candidate criteria (length,
width, perimeter, equivalent diameter, area and aspect ratio) were assessed, based on their
ability to differentiate between the Si modification levels [56].
2.1.11. The Nano Alumina Master Alloy (NAMA)
Despite having traditional individual master alloy for grain refinement and silicon
modification, materials scientists have been working to develop a master alloy that will
serve the purpose of both grain refinement and modification of secondary phases
including eutectic Si. The University of British Columbia (UBC) developed the
Magnesium Matrix Composite (MMC) by using Baikowski polishing nano Alumina
powder (40 nanometer particle size) as reinforcement materials known as Nano Alumina
Master Alloy (NAMA). This master alloy contains 93% pure magnesium and 7% nano
Alumina powder. It was fabricated by using a unique method for dispersion of nano
Alumina ceramic particles, throughout the volume of liquid alloy melt, to induce
heterogeneous nucleation sites. These particles are wettable by the melt due to the unique
method of their surface modification [57].
Fig. 8 shows the particles remain suspended in the melt for an extended period of time
due to nano particle size and a negligible sedimentation force while Fig. 9 shows an
improved structure with the addition of some cold work. As the ceramic nano alumina are

24
thermodynamically stable in the melt, this novel technology provides much needed time
flexibility during melt holding, processing and casting operations. S. Bhowmik [57]
reported a 15% reduction in SDAS of Al-Si-Cu alloy after adding 2% Nano alumina MA.
He also reported that NAMA alloy has a high ability to modify silicon particles of 328
aluminum alloy. A. Alam [58] reported that using 1.0-2.0 wt.% Nano Alumina MA in
A356 alloy showed (Figures 10 - 11) a high level of Silicon Modification and Grain
Refinement with 2.0wt% being the most effective level.
Figure 8 - Higher magnified SEM micrographs showing the typical microstructure of (a) the semi continuous
MgO layer (b) Detached MgO particles and the Mg channel in the NAMA [57].
Figure 9 – LOM Micrographs shows improved structure of Nano Alumina Master Alloy developed by
University of Windsor [57].

25
Figure 10 - LOM micrographs of As-Cast A356 test sample at two different locations from the chilling end after
addition of 1.0 wt. % NAMA (a) 20 mm (b) 50 mm [58].
Figure 11- LOM micrographs of As-Cast A356 test sample at two different locations from the chilling end after
addition of 2.0 wt. % NAMA (a) 20 mm (b) 50 mm [58].
As reported by A. Alam in his master thesis, the preliminary results indicated an
unprecedented high level of refinement and modification of the primary and secondary
phase. Metallurgical analysis of the melt treated with the new master alloy indicated that
during the cast test sample solidification process, the ceramic particles did serve as
heterogeneous nucleation sites for all the phases including eutectics that were formed at
different temperatures. The resulting morphology of grains, major and minor phases, and

26
eutectics as well as micro porosity cavities were significantly improved in comparison to
any melt treatment using commercial master alloys [58].
2.1.12. Secondary Dendrite Arm Spacing (SDAS)
Solidification of a hypoeutectic aluminum silicon alloy commences with the growth of a
primary α-Al dendritic network [20, 56]. The distances between the secondary arms of
these dendrites, are known as Secondary Dendrite Arm Spacing (SDAS). The SDAS and
also where dendritic structure is broken into α-dendrite equiaxed cell, dendrite cell size
has great influence over the mechanical properties of the alloy. As the SDAS or dendrite
cell size is reduced, the cast structure becomes finer and more sound, resulting in higher
mechanical properties [20, 56].
SDAS or dendrite cell size is exclusively controlled by solidification rate as shown in
Fig.12. There are at least three measurements used to describe dendrite refinement [11]:
• Secondary Dendrite arm spacing: The distance between the secondary dendrite arms
• Dendrite cell interval: The distance between centerlines of adjacent dendrite cells
• Dendrite cell size: The width of individual dendrite cells
The larger the dendrite arm spacing, the coarser the micro constituents and the more
pronounced their effects on properties. Finer dendrite arm spacing is desirable for
improved mechanical property performance [11]. Cooling rates directly control dendrite
arm spacing, which influences property development and substantially improves
ductility. The relationship between solidification rates and the SDAS is inverse; the
higher the solidification rate, the lower the SDAS [56, 61].

27
Figure 12 - Dendrite arm spacing and dendrite cell size as a function of local solidification rate [11].
As well as refining the SDAS, a high solidification rate also refines the dendrite cell size
[56]. The solidification time of the casting should be as short as possible, to ensure the
smallest SDAS [59]. For optimum grain size, the temperature gradient in the casting
should also be very steep [59].
SDAS have a great effect on the microstructure of A356. The secondary SDAS controls
the size and distribution of porosity and intermetallic particles in casting, therefore as the
SDAS decreases, porosity and secondary phase constituents are smaller, and are
distributed more finely and evenly resulting in substantially better mechanical properties
[18]. Also as the SDAS is reduced, the speed of homogenization is increased, allowing
more complete homogenization, giving more solute in solution and so greater strength
from the subsequent precipitation reaction. The rate of solution is also increased,
allowing a greater proportion of the non-equilibrium phase to be taken into solution. The
smaller numbers and sizes of remaining particles, if any, and the extra solute usefully
available in solution, will once again bring benefits to strength and toughness.

28
2.1.13. Heat Treatment
The term “Heat Treatment” is generally used to describe the steps required to achieve
maximum strength in any suitable casting composition through the sequence of solution
heat treatment, quenching and natural aging or artificial aging. Heat treatment comprises
all thermal practices intended to modify the metallurgical structure of a casting in such a
way that the physical and mechanical characteristics are controllably altered to meet
specific engineering criteria [7, 16].
Solution treatment changes the cast structure depending on the status of the alloy whether
or not it was modified [25, 48]. It is agreed between investigators that heat treated
microstructures reveal a globular eutectic structure regardless of the amount of Sr
present, making it difficult to correlate the degree of modification with Sr after heat
treatment. Figure 13 shows the effect of heat treatment on the microstructure of
unmodified and Sr modified A356 alloy [46].
On the other hand, Vanko et al [25] reported that at 100 MPa pressure squeezed cast
unmodified A356 alloy showed a tendency of spheroidization of lamellar Si with a 10
minutes soaking time in a solution treatment at 540°C followed by water quenching at
20ᵒC and 4 hours artificial aging. However, as can be seen in Fig. 14, it didn’t fully
spheroidized as claimed by him either in 3, 5 or 10 minutes soaking times [25].
Shivkumar et al. [18] reported that rapid spheroidization on heat treatment occurred in
strontium modified melts as they experienced fragmentation rapidly. During solution
treatment, the modified eutectic becomes more spherical. It has therefore been suggested
[18] that chemical modification can be used to reduce heat treatment soaking time and
overall costs.

29
Figure 13 - Microstructures of the A356 alloy before and after solution heat treatment a) unmodified, b) 0.02%
strontium modified, c) unmodified heat treated, d) Sr modified solution treated [46].
Figure 14 - Microstructures of the Squeeze cast unmodified A356 alloy before and after solution heat treatment
a) Eutectic silicon angular lamellas are short and relatively coarse or longer and thinner, b) Eutectic silicon
lamellas are shorter and rounded, but also coarser [25].
Microstructural changes of the eutectic Si due to modification and heat treatment both
have a considerable effect on the mechanical properties of the A356 alloy, while the
effect of heat treatment on the mechanical properties is more significant than that of
chemical modification [60]. Beumler et al [48] reported that the tensile strengths of as-
cast or heat treated structures are not significantly influenced by increasing the strontium
content. However, modification of the melt with strontium does contribute to big
a) b)
c) d)
a) b)

30
changes in % elongation for both as-cast and heat treated structures [48]. Investigators
have found [48] that at equivalent strontium levels, the tensile data after heat treatment
are higher than those for as-cast [48].
Paray et al [60] found that a longer solution heat treatment increases the ductility of the
unmodified alloy, whereas when strontium is present, the greatest improvement is
observed for yield strength [60]. The greatest advantages of chemical modification are
evident for the slower solidification rates associated with sand casting. The coarseness of
the original eutectic structure of the unmodified sand casting explains the beneficial
effect of strontium which persists with heat treatment [60]. It was suggested that the best
mechanical properties are reached when strontium is used in combination with heat
treatment, although more work is necessary to define the optimum solution treatment
time for the best properties [60].
2.2. Squeeze Casting
Squeeze casting is a specialized permanent mould process in which pressure is applied
through a hydraulically operated ram during the freezing stage of casting [61]. It is used
to obtain near net shape castings with better mechanical properties. It has been considered
a high-integrity process and has emerged as an alternative to conventional casting
techniques e.g. gravity permanent mould, low-pressure permanent mould or sand casting
[62]. It has been widely used to manufacture automotive components (mainly aluminium)
requiring high impact strength, high fatigue strength, and pressure tightness or wear
resistance. Today, many automotive components are squeeze cast, with aluminium
wheels being one of the largest products of this process as shown in Figures 15-16.

31
Squeeze casting involves the slow, direct application of pressure to a volume of liquid
metal before or during solidification. The pressure applied during the process increases
heat transfer between the casting and the die, reduces or eliminates porosity in the final
casting and also ensures complete filling of the die [14].
2.2.1. History of Squeeze Casting
Squeeze casting was first originated in Russia in 1878 where steam pressure was applied
to the molten metal during its solidification in a mould as suggested by D. K. Chernov
[63]. However, the first recorded experiment on the effect of pressure on Al-Si alloys in
a squeeze casting was carried out by Welter in 1931 [63]. Casting on an industrial scale
was underway in the U.S.S.R. in the 1960s, with commercial development in the West
being established about the same period. As reported by Rajagopal [83], the earliest
American study on pressurized solidification of metals was carried out by Reiss and Kron
in the 1960s on a U. S. Air Force sponsored research project, which outlined a cautious
examination of the effect of solidification pressure, pour temperature, and tooling
temperature on the microstructures and mechanical properties of A356 aluminum alloy.
However, the pressure level studied was in the range of 350 - 700 MPa, which was too
high for the process to be directly implemented [83]. The most notable application of the
process was in the production of alloy wheels by Toyota, starting from 1979, using
squeeze casting machines developed by UBE Industries as shown in Fig. 15. The casting
process was used to produce a low porosity aluminium wheel. The squeeze cast wheel
was lighter, stronger and more durable than the previous component [15].

32
Figure 15 - Automotive parts produced by the squeeze casting process. Courtesy of UBE Industries [11].
Squeeze casting is now used for a wide range of products, including heavy duty diesel
engine pistons, light alloy gears and pulleys, light alloy connecting rods, mortar shell
cases and other general engineering components. Squeeze casting is also a major method
in the manufacture of metal matrix composites (MMC's).
Figure 16 - Squeeze cast automotive components produced by SPX Contech Corporation (upper - wheels, lower
left - valve housing, lower right - steering column housing) [64].

33
2.2.2. Squeeze Casting Processes
The process of squeeze casting involves the following steps [65]:
1. A pre-specified amount of molten metal is poured into a preheated die cavity, located
on the bed of a hydraulic press.
2. The press is activated to close off the die cavity and to pressurize the liquid metal. This
is carried out very quickly, rendering solidification of the molten metal under pressure.
3. The pressure is held on the metal until complete solidification. This not only increases
the rate of heat flow, but also most importantly may eliminate macro/micro shrinkage
porosity.
4. Finally the punch is withdrawn and the component is ejected.
2.2.3. Mechanics of Squeeze Casting
2.2.3.1. The die
A most crucial aspect in permanent mould castings such as die-casting or squeeze casting
is the die itself and, most importantly, the design of the die including the selection of a
suitable die material, the manufacturing process, appropriate heat treatment and the
maintenance practice. Squeeze casting dies are exposed to severe thermal and mechanical
cyclic loading, which may cause thermal fatigue, cracking, erosion, corrosion, and
indentation. The nature and features of a die are greatly influenced by the particular alloy
to be cast. Currently H13 tool steel is a widely used material for die constructions as it
has good hot hardness, high temper resistance, adequate toughness and especially a high
degree of cleanliness and uniform microstructure [66].

34
2.2.3.2. The Casting Process: Key Features
Two basic forms of the process may be distinguished, depending on whether the pressure
is applied directly on to the solidifying cast product via an upper or male die (punch) or
the applied pressure is exerted through an intermediate feeding system as schematically
shown in Fig. 17: (i) the direct squeeze casting mode, and (ii) the indirect squeeze casting
mode. For an instance, Metal Matrix composites (MMC's) are produced by using the
direct squeeze casting method as shown in Fig. 18.
Figure 17 - Schematic diagram to illustrate the direct and indirect modes of the squeeze casting [65].
Figure 18 - Schematic diagram of the stages of squeeze casting to manufacture metal matrix composites (MMC)
[61].
i) ii)
35
2.2.4. Application of Pressure and its Effect on Solidification
J. J. Sobczak reported [67] that pressure could affect casting solidification and structure
formation in two ways, namely (1) mechanical effects and (2) thermodynamic effects.
Mechanical effects related to the physical phenomena at macro-level like elastic and/or
plastic deformation, intensification of heat exchange between casting and mould,
variation of cooling rate, control of mould filling, etc. On the other hand, thermodynamic
effects are related to transport phenomena at micro-level like changes in phase diagrams,
physical properties, Gibbs free energy, chemical potentials, specific heat, surface tension,
diffusion coefficients, etc. The physical phenomena at both macro- and micro scales alter
some basic thermodynamic and kinetic parameters of systems and, thus, influence phase
transformations in the system [67]. The main parameters in pressure application are
magnitude of pressure, manner of its application to the solidifying melt, duration of
pressure influence and physical or thermal status of melt before application of the
pressure. Higher than atmospheric pressures can be applied to solidifying melts using
either gas or specific mechanical systems through piston or plunger mechanisms [67].
Conventional autoclaves or their variants are usually used for solidification under
elevated gas pressure. Units with one or more plungers are designed for direct application
of pressure on solidifying melt [67]. Pressure can be applied during melt preparation
(melting and alloying), melt transfer (die filling), at the commencement of casting
solidification, just before the end of solidification, or after solidification of entire casting
but before its complete cooling (i.e. when casting temperature is less than but close to
solidus temperature). On the other hand, the melt can be overheated or cooled below the
liquidus to form semisolid slurry before pressurization. Conventional casting
36
technologies that make use of pressure are often based on purely empirical knowledge
rather than sound design criteria that originate in an understanding of the physical
changes caused by pressure. Understanding the entire complex of physical phenomena
that accompany solidification under high pressure is facilitated by the thermodynamic
and kinetic descriptions of the solidification process [67].
Applying high pressure during solidification can increase the solidification rate by
increasing the heat transfer at the metal/mold interface and consequently changing the
thermodynamic properties such as solid-liquid transition temperature [68]. From a
theoretical point of view, the effect of the pressure application is related to the alloy
phase diagram modification whereby thermodynamic equilibrium curves shift toward
higher temperatures as pressure increases [69].
The application of pressure during solidification would be expected to affect phase
relationships in an alloy system [65]. This may be deduced by considering the Clausius -
Clapeyron equation,
ΔTs/ΔP = Ts (Vl -Vs)/ ΔHf …………………………………Equation 1
Where, Ts is the equilibrium solidification temperature, Vl and Vs are the specific
volumes of the liquid and solid, respectively, and ΔHf is the latent heat of fusion.
Substituting the appropriate thermodynamic equation for volume, the effect of pressure
on solidification point may roughly be estimated as follows:
P = P0 exp (-ΔHf/RTs)......………………………………………………………Equation 2
Where, P0, ΔHf and R are constants. Therefore, Ts should increase with increasing
pressure. On a mechanistic approach, such change in solidification temperature is
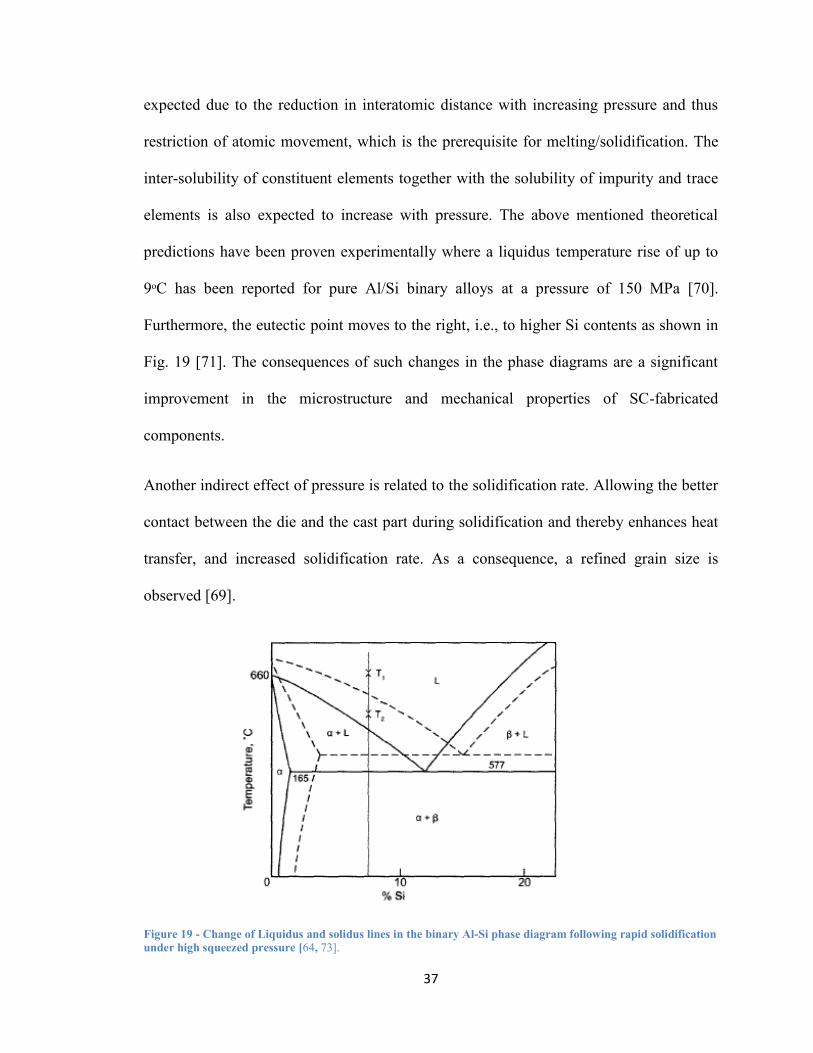
37
expected due to the reduction in interatomic distance with increasing pressure and thus
restriction of atomic movement, which is the prerequisite for melting/solidification. The
inter-solubility of constituent elements together with the solubility of impurity and trace
elements is also expected to increase with pressure. The above mentioned theoretical
predictions have been proven experimentally where a liquidus temperature rise of up to
9ᵒC has been reported for pure Al/Si binary alloys at a pressure of 150 MPa [70].
Furthermore, the eutectic point moves to the right, i.e., to higher Si contents as shown in
Fig. 19 [71]. The consequences of such changes in the phase diagrams are a significant
improvement in the microstructure and mechanical properties of SC-fabricated
components.
Another indirect effect of pressure is related to the solidification rate. Allowing the better
contact between the die and the cast part during solidification and thereby enhances heat
transfer, and increased solidification rate. As a consequence, a refined grain size is
observed [69].
Figure 19 - Change of Liquidus and solidus lines in the binary Al-Si phase diagram following rapid solidification
under high squeezed pressure [64, 73].

38
Based upon these advantages of high pressure solidification, various investigators have
reported substantial refinement of microstructures and improvement of mechanical
properties. In many articles [65, 67, 71, 74-88], it has been reported that applied pressure
during solidification in squeeze casting has a tremendous effect on the overall quality of
the casting. The quality of the squeeze cast components in terms of fine microstructure,
grain refinement, porosity reduction and improved mechanical properties increases with
increasing applied pressure during solidification.
Hu et. al [80] reported the effect of applied pressure on the tensile properties and
microstructure of squeeze cast Mg- 5wt%- 1wt%Ca (AX51) alloy. They found that the
fraction of 2nd
phases and porosity level reduced with an increase in applied pressure
from 3-90 MPa. Also, Ultimate Tensile Strength, Yield Strength and elongation of AX51
alloy increased with increasing pressure.
In another investigation, Yu et al. [87] found that the application of external pressures on
the solidifying magnesium alloy AM50A affected its solidification behavior; the Liquidus
Temperatures of the alloy increased by 1.85, 2.62 and 5.40◦C under the applied pressure
levels of 35, 70 and 105MPa, respectively.
A considerable microstructural refinement was observed by Han et al. [68] in an
investigation of an hypoeutectic Al-Cu alloy during the solidification under very high
pressure in the range of up to 1.7 GPa. He found that the average dendrite cell size
changed from 30 µm, without applied pressure, to 5 µm at 1.7 GPa.
Similarly, Stefanos et. al. [82] reported the effect of applied pressure on the
microstructure and mechanical properties of squeeze cast AA 6061 alloy. They observed

39
that squeezed casting decreased the volume fraction of porosity and microspores size as
well as the size of dendrites and of the interdendritic areas. The ultimate tensile strength
and elongation were increased accordingly with the increase of applied pressure.
In another study, MT. Abou-El-Khair [88] reported that the application of a squeeze
pressure of 70 MPa resulted in a structure of α-Al of about 50 µm size with fine eutectic
Si in a Al6Si0.3Mg alloy. He also found that increasing the applied pressure from 100 to
160 MPa reduced the grain size of the primary phase from 30 µm to 20 µm with
formation of a very fine eutectic Si. However, he didn’t observe any modification in
eutectic Si at high pressure [88]. He also reported that in a solution treatment, the Si
particles of squeeze cast alloy have spheroidized and coarsened to some extent compared
to as-cast alloy despite having longitudinal shape in some particles as shown in Fig. 20,
and that prolonged solution treatment led to coarsening of the particles [88].
For an Al-Si alloy (designated as B390) a substantial microstructure refinement was also
observed as a consequence of the pressure application (up to 100 MPa) and higher
mechanical properties were measured in terms of hardness and tensile strength [78].
Other studies showed that in direct and indirect squeeze casting, apart from the pressure,
other process parameters such as melt and die temperature strongly affect microstructure
and mechanical properties [80-81, 85-86]. Also for aluminum matrix composites, a
positive effect of the applied pressure was observed on the mechanical properties of the
cast composites [63].

40
Figure 20 - Microstructure of solution-treated alloys (a) as-cast (b) squeeze cast at 70 MPa [88].
2.3. Thermal Analysis (TA)
Thermal analysis technique has been used for seven decades in both ferrous and
nonferrous industries for evaluating the metallurgical quality of the liquid metal before
41
casting. TA principles of solidification processes are recognized as the high potential
powerful scientific and applied engineering tool for making rapid manufacturing and
R&D decisions. Most commercial TA systems lack the technical capabilities for
comprehensive and automated assessment of the melt’s metallurgical characteristics.
In addition, simplification and/or analytical errors in both software and hardware design
result in inherent discrepancies between TA results and the test sample structure. For
example, ATAS, Foseco and Heraeus utilize a thermal sensor located in a large
rectangular solidifying test sample that is held in a Very High Thermal Mass (VHTM)
sand test cup(s). VHTM tall rectangular test cups induce complex multi-directional heat
transfer and melt convection resulting in a “smeared and convoluted” TA signal that is
not ideal for high resolution heating/cooling curve analysis.
The University of Windsor developed a custom made novel High Temperature (HT)
UMSA Technology Platform that guarantees unbiased physical simulations representing
selected sections of industrial cast components. Simulated processes include heating, heat
treatment, homogenization alloying, inoculation, casting, solidification with average and
instantaneous heating/cooling rates. Universal Metallurgical Analyzer and Simulator
(UMSA) Technology Platform is the state of the art technology for the modern thermal
analysis. It uses low thermal mass that produce high resolution heating- cooling curves.
In chapter three detail descriptions are provided on UMSA [89].
There are several methods for thermal analysis which include Differential Scanning
Calorimetry (DSC), Differential Thermal Analysis (DTA) and Cooling Curve Analysis
(CCA). All of these methods are mainly based on the similar principle. However, Cooling
Curve Analysis (CCA) is the most widely used method. It measures the changes in
42
temperature in a sample that occur as it is heated or solidified through phase
transformations. The record of these temperatures can be analyzed in order to derive
metallurgical characteristics of the sample.
Cooling Curve Analysis (CCA) has been used in this study. It deals with temperature
measurements using one or more thermocouple(s) inserted within the bulk of a sample
during a heating/cooling cycle. The heating and cooling curves can be described as the
“metallurgical DNA” of the melting and solidification processes [89]. Major and minor
thermal events called metallurgical reactions that are thermodynamically strong enough
in terms of the latent heat evolution that manifest themselves on the heating and cooling
curves as inflection points and slope changes etc. can be determined. These changes are
proportional to the volume fraction of the phases undergoing transformation.
Unfortunately, phases appearing in small amounts are harder to detect on a cooling curve.
By examining the first derivative of the cooling curve it is possible to increase the
resolution of the thermal events. These thermal curves and their derivatives can be used
to identify key metallurgical characteristic points [90]. Many researchers [91-102] have
tried to correlate parameters of the cooling curves with microstructure features. However,
using the UMSA solidification methodology, the test sample structure and the mechanical
properties can be analyzed at any point between the liquidus and solidus or after
completion of the solidification process in relation to the metallurgical reaction
characteristics [89].
The Metal Casting and Post-processing Group at the University of Windsor has
carried out an extensive thermal analysis on Alcoa A356 cast wheel and related ingot bar
samples using UMSA Technology Platform [2]. In Table 4, the metallurgical reactions
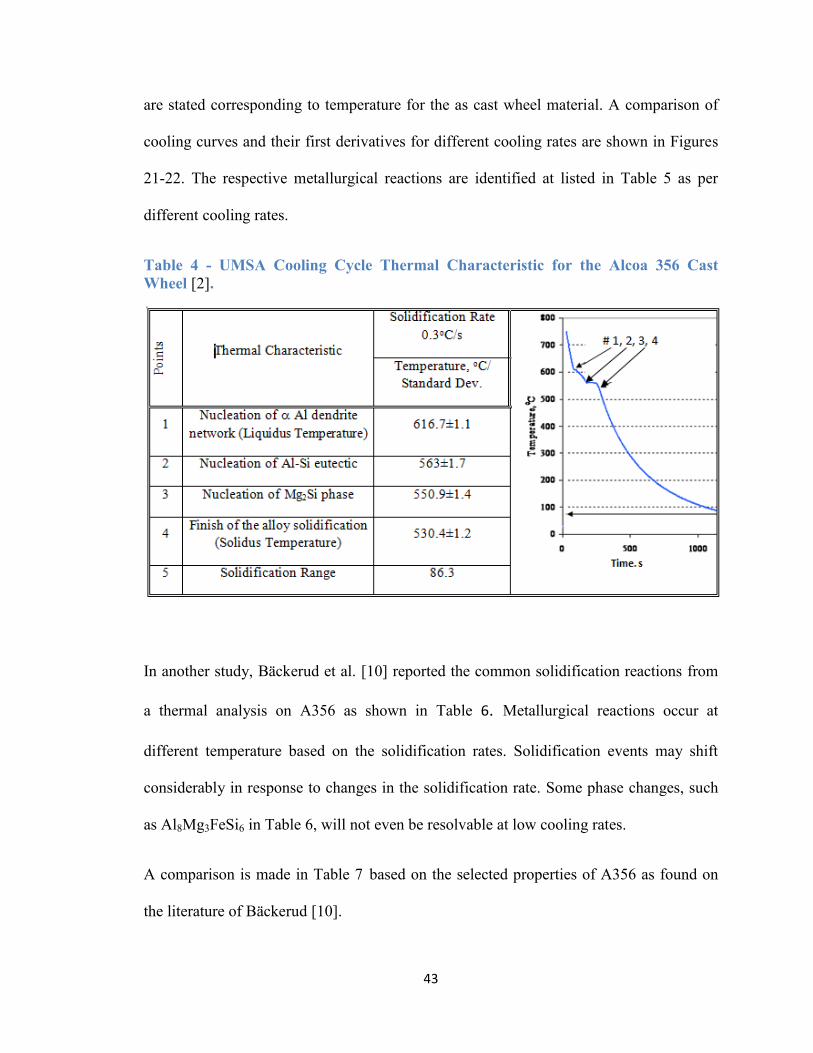
43
are stated corresponding to temperature for the as cast wheel material. A comparison of
cooling curves and their first derivatives for different cooling rates are shown in Figures
21-22. The respective metallurgical reactions are identified at listed in Table 5 as per
different cooling rates.
Table 4 - UMSA Cooling Cycle Thermal Characteristic for the Alcoa 356 Cast
Wheel [2].
In another study, Bäckerud et al. [10] reported the common solidification reactions from
a thermal analysis on A356 as shown in Table 6. Metallurgical reactions occur at
different temperature based on the solidification rates. Solidification events may shift
considerably in response to changes in the solidification rate. Some phase changes, such
as Al8Mg3FeSi6 in Table 6, will not even be resolvable at low cooling rates.
A comparison is made in Table 7 based on the selected properties of A356 as found on
the literature of Bäckerud [10].

44
Figure 21 - Comparisons of different cooling curves obtained from A356 ingot samples [2].
Figure 22 - Comparison of the first derivative of the cooling curves obtained from A356 ingot samples [2].
#2 #3

45
Table 5 - Comparison of Metallurgical Reactions of A356 Alloy at Different
Solidification Rates [2].
Table 6 - Reactions during Solidification of A356 Aluminum Alloy [10].
Reaction No. Reaction Suggested
Temperature (°C)
1 Development of dendritic network 614
2a Liq. Al + Al15(Mn,Fe)3Si2 594
2b Liq. Al + Al5FeSi + Al15(Mn,Fe)3Si2 594
3 Liq. Al + Si + Al5FeSi 575
4 Liq. Al + Si + Mg2Si 555
5* Liq. Al + Si + Mg2Si + Al8Mg3FeSi6 554
* Detected only at higher cooling rates
In all of the above mentioned studies in the literature, thermal analysis was done at
atmospheric pressure. However, no thermal analysis of A356 Alloy was found done

46
under high pressure. In the results and discussion section the behavior of A356 at high
pressure will be elaborated in greater detail.
Table 7 - Comparison of Selected Characteristics of A356 in Relation to
Solidification Rate [10].
Characteristics Average Solidification Rate (°C/s)
0.2 0.6 5
Temp. of Reaction 1 (°C) 612-610 613-608 614-611
Temp. of Reaction 2 (°C) 594-571 592-570 590-574
Temp. of Reaction 3 (°C) 569-568 563-561 565-562
Temp. of Reaction 4 (°C) 553-559 552-542 548-541
Temp. of Reaction 5 (°C) - - 541-505
fs of Reaction 1 (%) 12 23 32
fs of Reaction 2 (%) 19 20 11
fs of Reaction 3 (%) 25 28 22
fs of Reaction 4 (%) 3 3 7
fs of Reaction 5 (%) - - 9
Dendrite Arm Spacing (μm) 95 69 33
Solidification Temp. Range
(°C) 73 71 109
Solidification time(s) 785 274 49
End temperature (°C) 539 542 505
2.4. Silicon Equivalency and Liquidus Temperature
Silicon Equivalency (SiEQ) is a means of equating quantities of alloying and impurity
elements in aluminum to an equivalent amount of alloying silicon, based on the effect
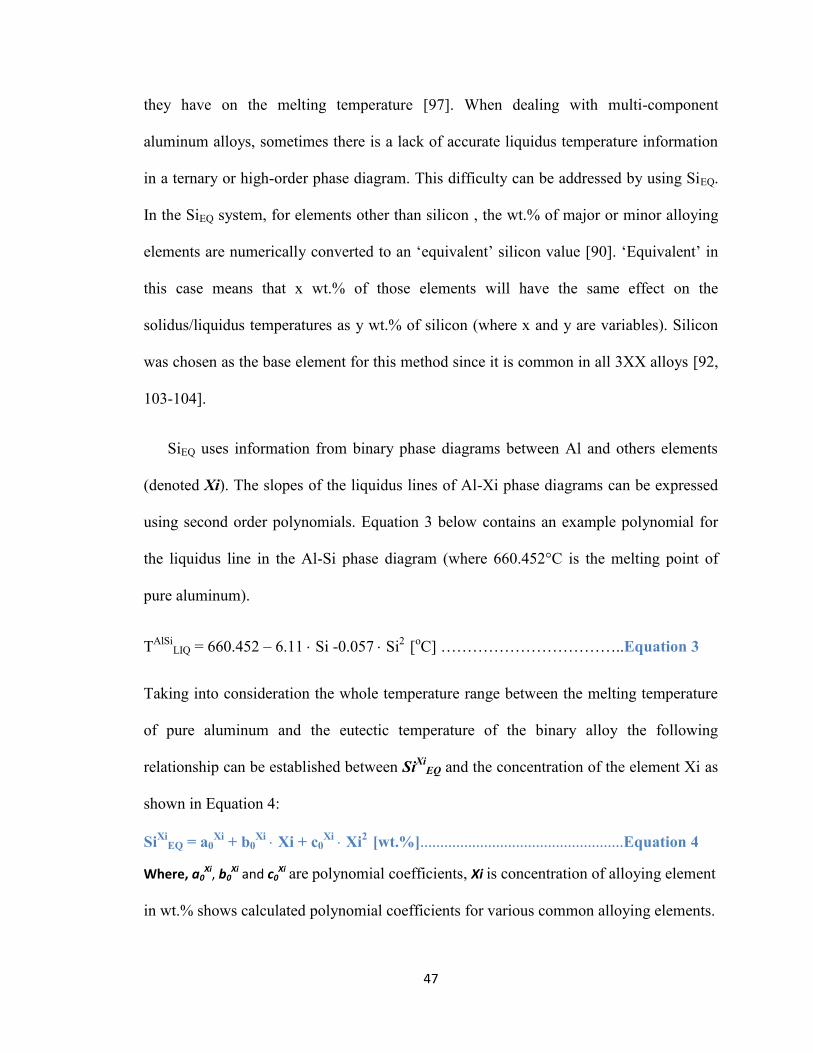
47
they have on the melting temperature [97]. When dealing with multi-component
aluminum alloys, sometimes there is a lack of accurate liquidus temperature information
in a ternary or high-order phase diagram. This difficulty can be addressed by using SiEQ.
In the SiEQ system, for elements other than silicon , the wt.% of major or minor alloying
elements are numerically converted to an ‘equivalent’ silicon value [90]. ‘Equivalent’ in
this case means that x wt.% of those elements will have the same effect on the
solidus/liquidus temperatures as y wt.% of silicon (where x and y are variables). Silicon
was chosen as the base element for this method since it is common in all 3XX alloys [92,
103-104].
SiEQ uses information from binary phase diagrams between Al and others elements
(denoted Xi). The slopes of the liquidus lines of Al-Xi phase diagrams can be expressed
using second order polynomials. Equation 3 below contains an example polynomial for
the liquidus line in the Al-Si phase diagram (where 660.452°C is the melting point of
pure aluminum).
TAlSi
LIQ = 660.452 – 6.11 Si -0.057 Si2
[oC] ……………………………..Equation 3
Taking into consideration the whole temperature range between the melting temperature
of pure aluminum and the eutectic temperature of the binary alloy the following
relationship can be established between SiXi
EQ and the concentration of the element Xi as
shown in Equation 4:
SiXi
EQ = a0Xi
+ b0Xi
Xi + c0Xi
Xi2
[wt.%]……………………………………………Equation 4
Where, a0Xi, b0
Xi and c0Xi are polynomial coefficients, Xi is concentration of alloying element
in wt.% shows calculated polynomial coefficients for various common alloying elements.

48
Table 8 - Polynomial Coefficients for Binary Al-Xi alloys [58].
Al-Xi Alloy ao bo co
Al-Cu 0.350 -0.027
Al-Mg 0.0258 -0.0088
Al-Mn 0.8221 -0.0349
Al-Fe 0.6495 0.0003
Al-Zn 0.1227 -0.0002
Al-Sn 0.7849 -0.0313
Al-Bi 0 0.9076 -0.0092
Al-Pb 0 0.859 0.02976
Al-Ca 0 0.0594 0.00685
Al-Sb 0 0.8255 -0.0327
Al-Ni 0 0.5644 -0.0285
Al-Sr 0 0.7854 -0.0157
Al-Ti 0 -0.8159 0.009927
Al-B 0 -0.9977 0.00007506
With the silicon equivalents for all component alloys calculated, the overall silicon
equivalency value can be expressed using Equation 5 below. Substituting this SiEQ value
into equation 6, allows the characteristic liquidus temperatures of A356 alloy to be
calculated for this project.
SiEQ = Si + SiXi
EQ [wt. %]…………………………………………………Equation 5
TAl-Si-i
LIQ = 660.452 – 6.11 SiEQ – 0.057 SiEQ2
[oC]……………………Equation 6
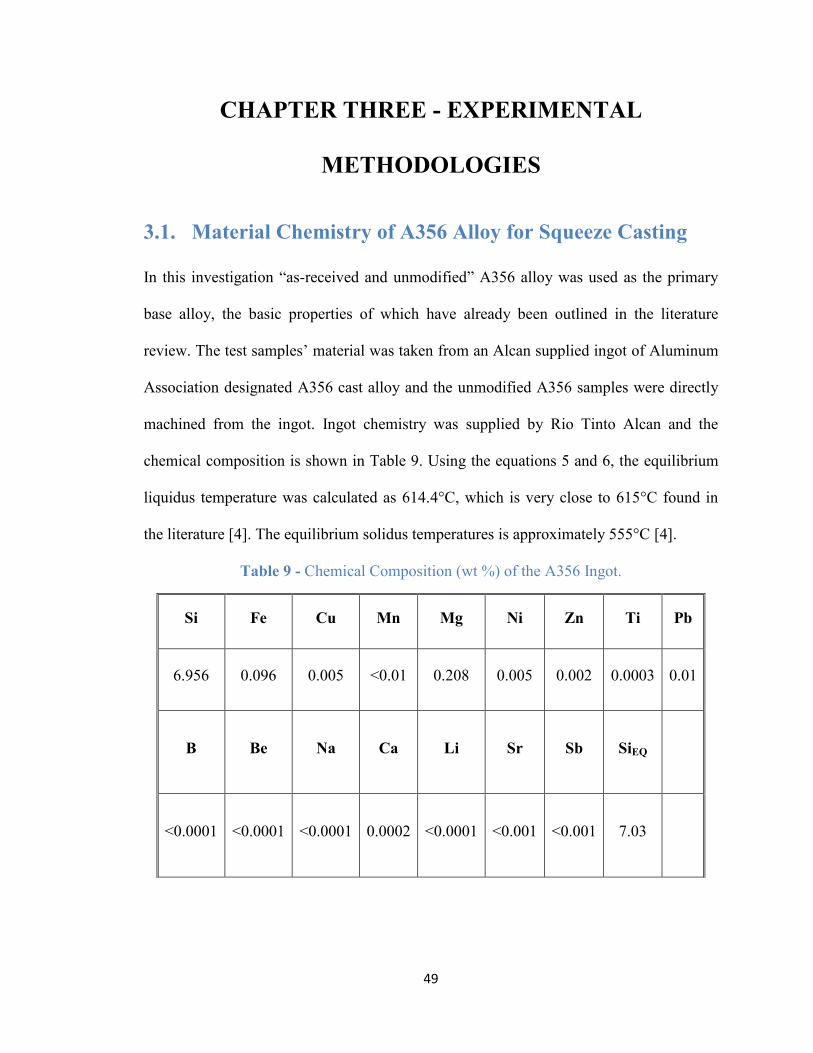
49
CHAPTER THREE - EXPERIMENTAL
METHODOLOGIES
3.1. Material Chemistry of A356 Alloy for Squeeze Casting
In this investigation “as-received and unmodified” A356 alloy was used as the primary
base alloy, the basic properties of which have already been outlined in the literature
review. The test samples’ material was taken from an Alcan supplied ingot of Aluminum
Association designated A356 cast alloy and the unmodified A356 samples were directly
machined from the ingot. Ingot chemistry was supplied by Rio Tinto Alcan and the
chemical composition is shown in Table 9. Using the equations 5 and 6, the equilibrium
liquidus temperature was calculated as 614.4°C, which is very close to 615°C found in
the literature [4]. The equilibrium solidus temperatures is approximately 555°C [4].
Table 9 - Chemical Composition (wt %) of the A356 Ingot.
Si Fe Cu Mn Mg Ni Zn Ti Pb
6.956 0.096 0.005 <0.01 0.208 0.005 0.002 0.0003 0.01
B Be Na Ca Li Sr Sb
SiEQ
<0.0001 <0.0001 <0.0001 0.0002 <0.0001 <0.001 <0.001
7.03

50
Apart from the unmodified alloy, three melt treated modified A356 alloys were also
prepared and examined in this study. The first modified A356 alloy used the same A356
ingot with the addition of Strontium (Sr). These modified samples were made by re-
melting part of the ingot in a Lindbergh furnace in a small crucible. During re-melting,
the liquid metal was allowed to reach a target temperature of 730ᵒC in the furnace. When
it reached to the target temperature, a 0.015wt% of Sr (150 ppm) was added in a form of
Al-10%Sr master alloy and stirred. The melt was then held for 10 minutes at 730ᵒC, and
subsequently poured into a dried Ø25mm tubular graphite crucible coated with boron
nitride.
Similarly, the second and third modified samples also used the same A356 ingot material
as its base, but with the addition of 1% Nano alumina and combination of both 0.015 wt.
% Sr and 1 wt% Nano Alumina Master Alloys respectively and were prepared in the
same way.
3.1.1 Calculations for Sr and Nano Alumina Master Alloy
Additives
In this investigation, 0.04 wt. % and 0.015 wt. % Strontium were used in the form of Al-
10%Sr master alloy. Test Sample weight was 24gm. For this test sample, in the first
category, 0.0096gm strontium was used in the form of 0.096gm Master Alloy, while in
the second category, 0.0036gm Sr was used in the form of 0.036gm Master Alloy.
Similarly for the 24gm test sample, 1 wt. % Nano Alumina Master Alloy (NAMA) was
used. NAMA consists of 7 wt. % Nano Alumina powder with 93 wt. % Magnesium.
Therefore, 0.0168gm (0.07 wt. %) of Nano Alumina was used in the form of 0.24 gm

51
Nano alumina master alloy, that is, 0.2232gm (0.93 wt. %) of Magnesium (contributed
from the master alloy) was added as well.
3.1.2. A356 Ingot Segregation
Al-Si ingots are prone to the micro and macro-segregation of alloying and impurity
elements. The main contribution to as-cast macro-segregation is the melt’s thermo-solute
convection in the semi-solid state and, prior to the Dendrite Coherency Point (DCP),
movement of the free solid dendrites which is also influenced by gravity.
In order to minimize the difference between the bulk SC UMSA test samples’ chemical
composition, ingot(s) should be re-melted in the induction furnace and rapidly solidified.
However, Metal Casting and Post-Processing Technology Group lost some of its
technical capabilities including induction furnace and therefore, this processing step
cannot be performed.
In addition due to the lack of access to the Optical Emission Spectrometer (OES) for a
bulk chemical analysis of the individual test samples, A356 ingots’ certified nominal
composition provided by the supplier Rio Tinto Alcan was utilized (Table 9) and the
novel SEM/EDS analytical methodologies were developed ( Table 18-20).
3.1.3. SEM/EDS Analysis of SC UMSA Test Sample Phases and Bulk
Chemical Analysis
In order to compensate for the lack of OES bulk chemistry data of the SC UMSA test
samples and inability of simultaneous SEM/EDS analysis of phases smaller than electron
beam diameter and lack of analytical procedures from equipment manufacturer and to-
date users, the novel procedures were developed by one of the Auto21 Network
52
Researchers Dr. Adam Gesing. His paper “Quantitative X-Ray Fluorescence
Determination of Elemental Composition of Micro-Constituents Smaller than the
Electron Probe” was published in TMS and won the TMS 2013 award. The same
methodology was utilized in this thesis with Dr. Gesing’s permission.
The EDS micro-chemical composition of various phases presented in Tables 18-20 and
can be directly compared, while the difference in bulk chemical composition between test
samples (termed: alloy) indicates the magnitude of macro-segregation.
3.2. Squeeze Casting (SC) – UMSA Technology Platform
3.2.1. Background
The Universal Metallurgical Simulator and Analyzer (UMSA) Technology Platform has
unique capabilities for physical simulation and thermal interpretation of the metallurgical
processes. It allows researchers to rapidly develop new alloys and improve existing
alloys, their processing and post-processing technologies leading to better in-service cast
components. Recently addition of High Temperature capability in the new HT UMSA
extended its functional characteristics to cover a wide range of research and development
on the Ferrous and Non-Ferrous alloys. However, to cover High Pressure Technology
parameters including the cyclic pressure and high solidification rates, the idea of
developing the squeeze casting and high pressure die casting platform was initiated by
Dr. J. H. Sokolowski of Metal Casting and Post-processing Technology Group at the
University Windsor as part of the patented UMSA through incorporation of a tool steel
die into the Instron Mechanical Testing Frame. Initially two students namely Joe
Giovanatto and Rahul Kapoor started working on the development of the die in the frame
53
of integrated AUTO21 and Capstone Projects. Then the author, Brandon Hooper, Dr. Al
Conle and Peter Guba worked together under the supervision of Dr. J. Sokolowski on the
modification and up-gradation of the die setting, new plunger design, slide gating,
thermocouple setting and improvement in data collection as well as software
development for successful operation of the Platform. In addition, Dr. Adam Gesing and
Dr. Marcin Kasprzak are also involved on the automation of the overall SC UMSA
Technology Platform. A patent of squeeze pin with various pressure profiles is going to
be commercialized by the University of Windsor.
3.2.2. SC UMSA Technology Platform's Functional Design
The SC-UMSA Technology Platform is integrated with an Instron Mechanical Testing
Frame including an environmental chamber as shown in Figures 23-24. The
environmental chamber can achieve temperatures of 350oC and provides the necessary
protection to allow experiments to be completed safely. The applied pressure ranges from
the ambient to 115 MPa in a static or cyclic manner on the samples having a diameter of
20.5 mm and height of 26 mm. The maximum instantaneous cooling rate achieved is of
approximately 100 °C/sec with an average solidification rate of 40 °C/sec. The present
squeeze casting technology can address a quantitative assessment of the cumulative and
individual effects of the solidification rate not limited to the average rate.
3.2.3. SC Die
The design of the squeeze casting die and corresponding assembly for producing a
cylindrical test sample is illustrated in Figures 25-26. The Die assembly is composed of
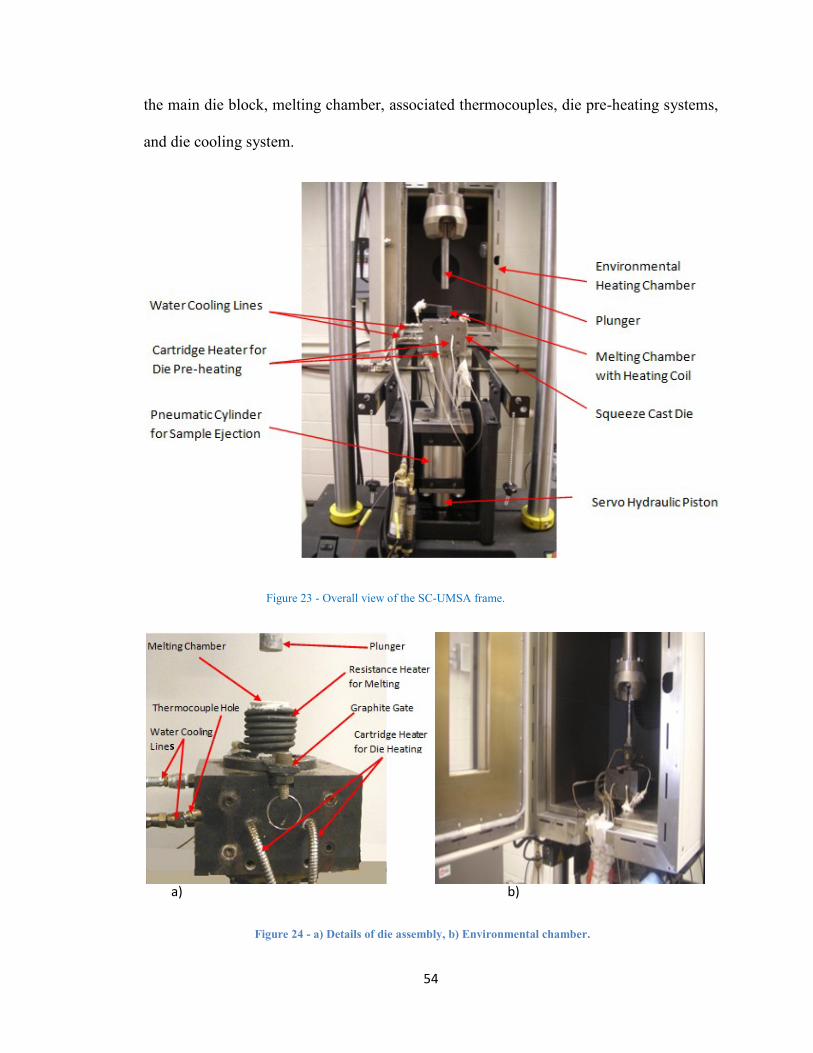
54
the main die block, melting chamber, associated thermocouples, die pre-heating systems,
and die cooling system.
Figure 23 - Overall view of the SC-UMSA frame.
Figure 24 - a) Details of die assembly, b) Environmental chamber.
a) b)
s
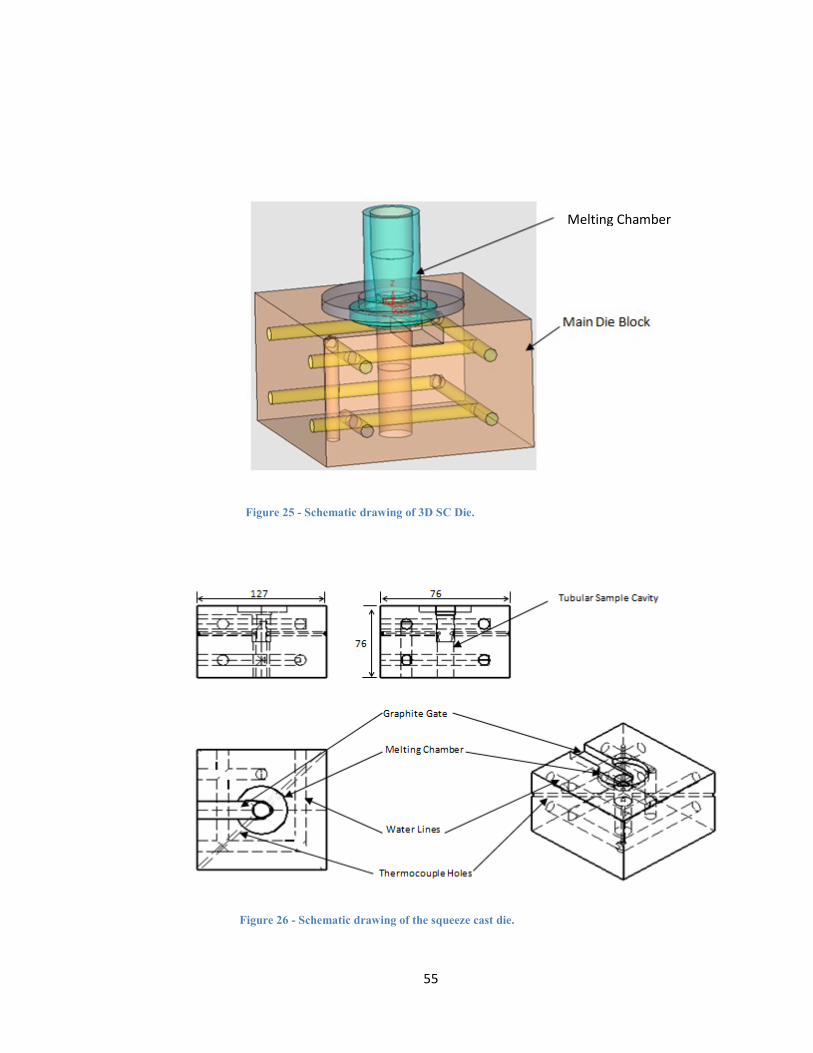
55
Figure 25 - Schematic drawing of 3D SC Die.
Figure 26 - Schematic drawing of the squeeze cast die.
Melting Chamber

56
Figures 25-26 show the schematic view and design of the die which has water lines (1/8"
or 3.18mm) drilled through the die block, and two levels of cooling passages within the
die. Two holes (1/16" or 1.59mm) were also drilled diagonally in the die, opposite to
each other for inserting thermocouples. One is through hole for the temperature
measurement of the test sample and the other one is a blind hole for measuring die
temperature during experiments. A passage for graphite gate and melting chamber are
engraved on the top part of the die.
The melt chamber is made of stainless steel (G304), is capable of handling temperatures of
up to 1100oC. However, 850
oC is a maximum sheath temperature of the coil can be
generated using a tubular heater.
3.2.4. Test Sample
As shown in Fig. 27 all samples for melting in the Squeeze Cast experiment were
machined into truncated cone shape at the University of Windsor Technical Support
center.
Figure 27 - Samples of squeeze cast experiment, a) Plain drawing (dimensions are in mm), b) Picture
Ø3
a) b)
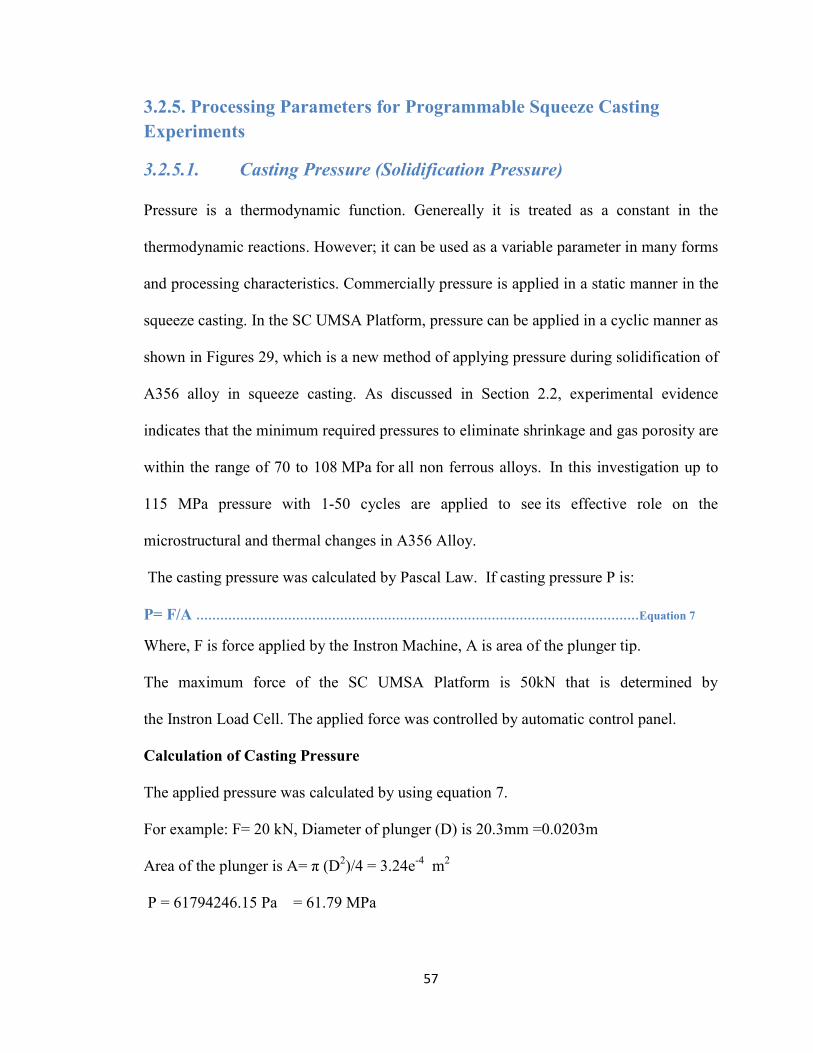
57
3.2.5. Processing Parameters for Programmable Squeeze Casting
Experiments
3.2.5.1. Casting Pressure (Solidification Pressure)
Pressure is a thermodynamic function. Genereally it is treated as a constant in the
thermodynamic reactions. However; it can be used as a variable parameter in many forms
and processing characteristics. Commercially pressure is applied in a static manner in the
squeeze casting. In the SC UMSA Platform, pressure can be applied in a cyclic manner as
shown in Figures 29, which is a new method of applying pressure during solidification of
A356 alloy in squeeze casting. As discussed in Section 2.2, experimental evidence
indicates that the minimum required pressures to eliminate shrinkage and gas porosity are
within the range of 70 to 108 MPa for all non ferrous alloys. In this investigation up to
115 MPa pressure with 1-50 cycles are applied to see its effective role on the
microstructural and thermal changes in A356 Alloy.
The casting pressure was calculated by Pascal Law. If casting pressure P is:
P= F/A …………………………………………………………………………………………………Equation 7
Where, F is force applied by the Instron Machine, A is area of the plunger tip.
The maximum force of the SC UMSA Platform is 50kN that is determined by
the Instron Load Cell. The applied force was controlled by automatic control panel.
Calculation of Casting Pressure
The applied pressure was calculated by using equation 7.
For example: F= 20 kN, Diameter of plunger (D) is 20.3mm =0.0203m
Area of the plunger is A= π (D2)/4 = 3.24e
-4 m
2
P = 61794246.15 Pa = 61.79 MPa
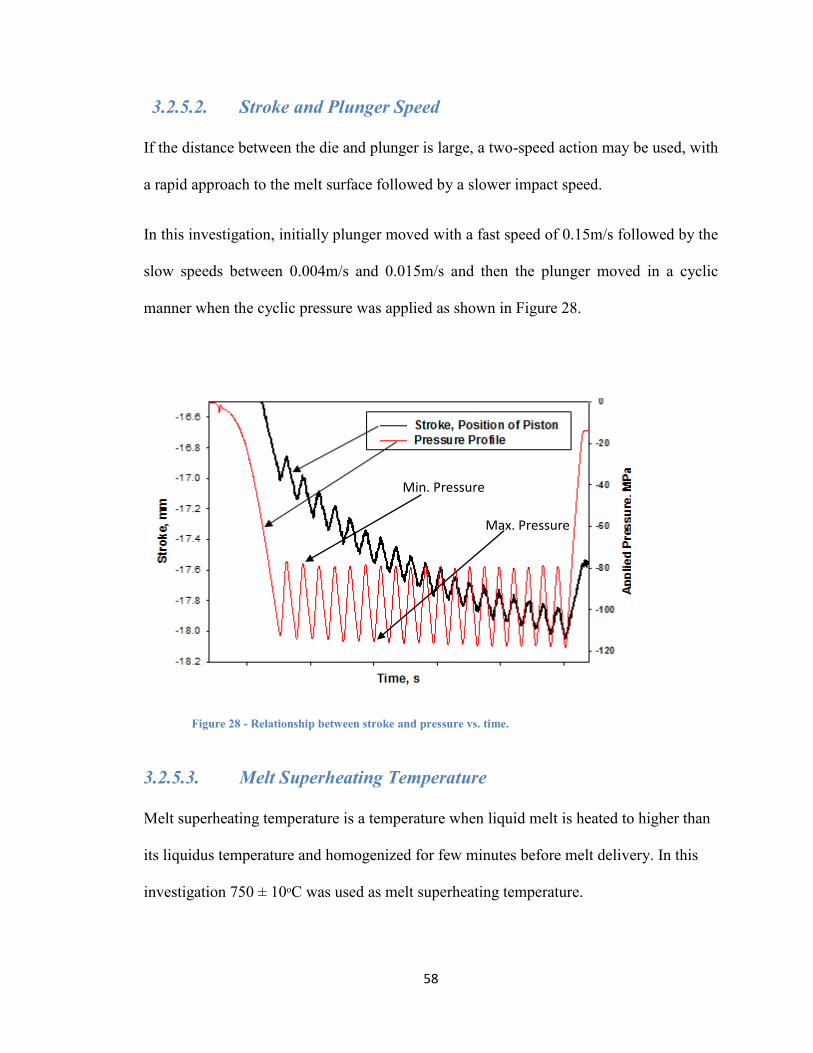
58
3.2.5.2. Stroke and Plunger Speed
If the distance between the die and plunger is large, a two-speed action may be used, with
a rapid approach to the melt surface followed by a slower impact speed.
In this investigation, initially plunger moved with a fast speed of 0.15m/s followed by the
slow speeds between 0.004m/s and 0.015m/s and then the plunger moved in a cyclic
manner when the cyclic pressure was applied as shown in Figure 28.
Figure 28 - Relationship between stroke and pressure vs. time.
3.2.5.3. Melt Superheating Temperature
Melt superheating temperature is a temperature when liquid melt is heated to higher than
its liquidus temperature and homogenized for few minutes before melt delivery. In this
investigation 750 ± 10ᵒC was used as melt superheating temperature.
Max. Pressure
Min. Pressure
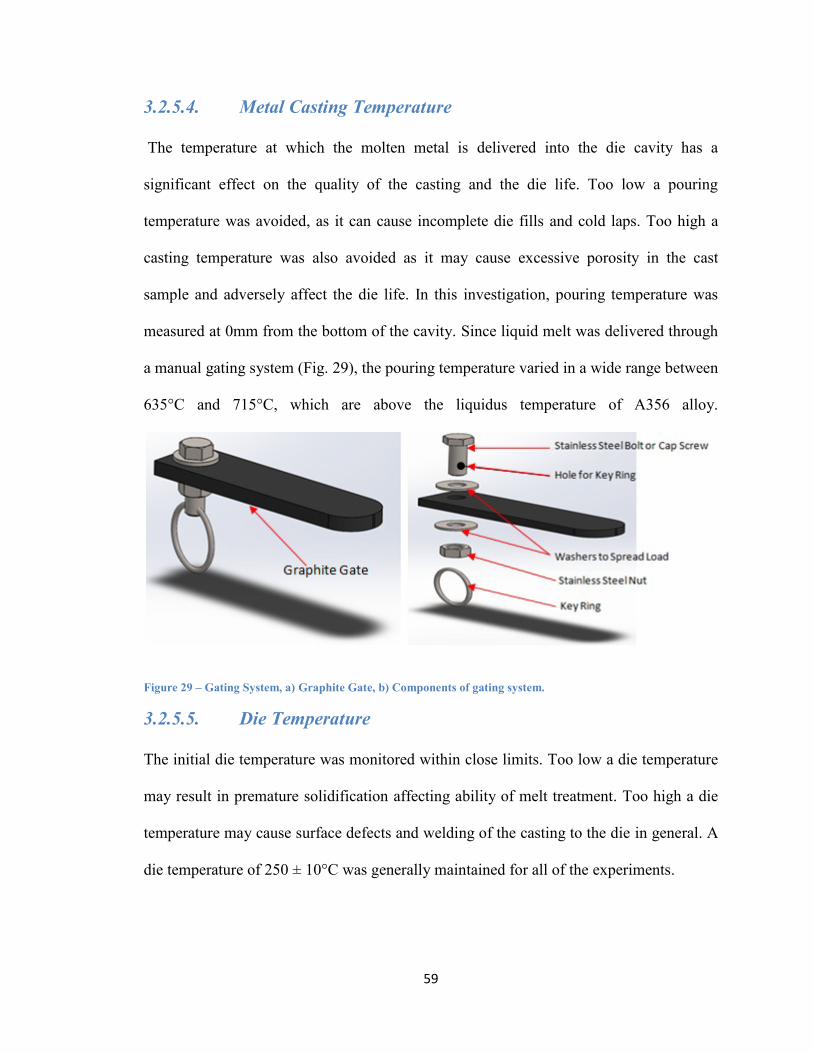
59
3.2.5.4. Metal Casting Temperature
The temperature at which the molten metal is delivered into the die cavity has a
significant effect on the quality of the casting and the die life. Too low a pouring
temperature was avoided, as it can cause incomplete die fills and cold laps. Too high a
casting temperature was also avoided as it may cause excessive porosity in the cast
sample and adversely affect the die life. In this investigation, pouring temperature was
measured at 0mm from the bottom of the cavity. Since liquid melt was delivered through
a manual gating system (Fig. 29), the pouring temperature varied in a wide range between
635°C and 715°C, which are above the liquidus temperature of A356 alloy.
Figure 29 – Gating System, a) Graphite Gate, b) Components of gating system.
3.2.5.5. Die Temperature
The initial die temperature was monitored within close limits. Too low a die temperature
may result in premature solidification affecting ability of melt treatment. Too high a die
temperature may cause surface defects and welding of the casting to the die in general. A
die temperature of 250 ± 10°C was generally maintained for all of the experiments.

60
3.2.5.6. Die Coating and Lubrication
Some release agents used in pressure die casting work reasonably well in squeeze casting
applications. A commonly used lubricant is Boron Nitride that was sprayed onto the die
and the plunger between each cycle. Limiting the thickness of the coating/lubricant under
50 microns can prevent surface contamination of the parts with coating residues stripped
from the die surface. This lubricant was used in all of the SC Experiments to lubricate the
die cavity. The coating needs to be dried well before delivering the melt into die cavity as
it creates gas porosity inside the casting.
3.2.6. Test Control Software and Data Collection Procedure for Squeeze
Casting Experiments
A special computer software was developed by Dr. Al Conle as part of an Open Source
Fatigue Test Control Software servo hydraulic test control project. The software is a
combination of C++, FORTRAN and Linux scripts and run on a specially designed PC
computer with a Microstar 840/103 analog to digital(A/D) and digital to analog(D/A)
control processor board installed on the PCI bus.
As shown in Fig. 31, Data Acquisition (DAQ), Data Acquisition Processor (DAP) boards
at PC, Bayonet Nut Coupling (BNC) Connectors and Instron Control Panels are the data
collecting devices that transmit experiments generated data to the software.
Data collection and control signals for stroke command (D/A) (plunger position), applied
load (A/D) are managed by the Instron 8800 servo control system and temperatures(A/D)
are conditioned by a Nat. Instruments SCXI-1000, which are illustrated in Figure 32.
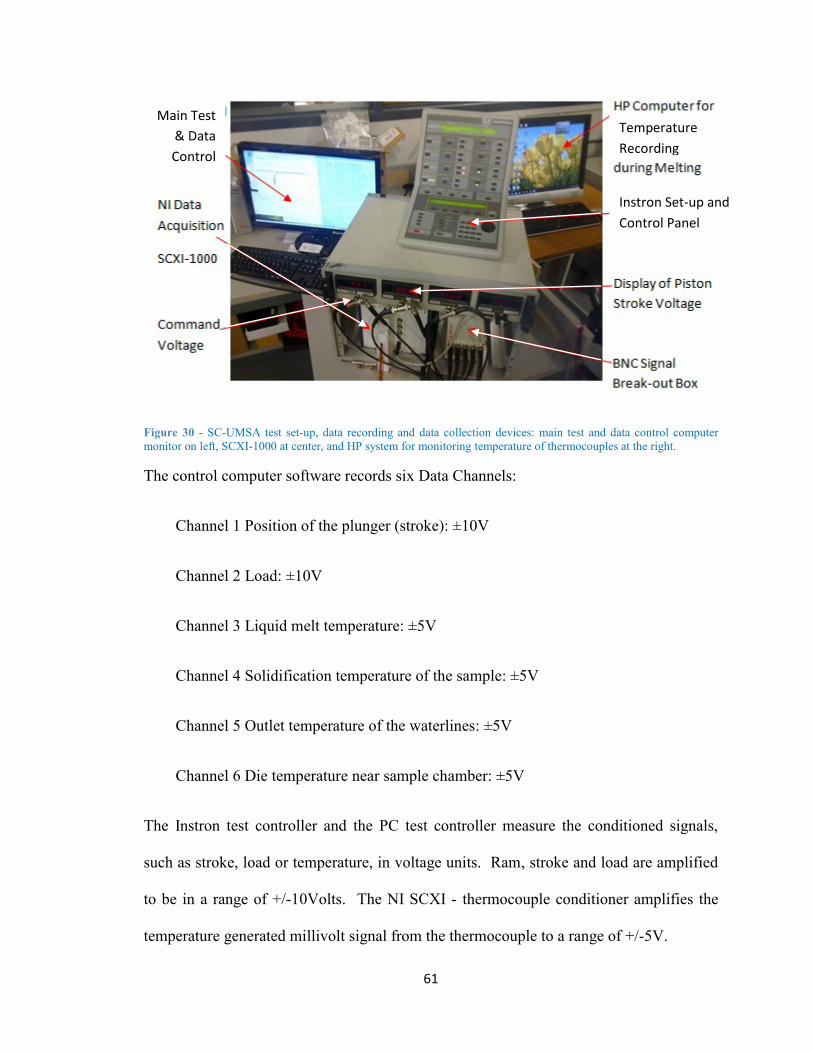
61
Figure 30 - SC-UMSA test set-up, data recording and data collection devices: main test and data control computer
monitor on left, SCXI-1000 at center, and HP system for monitoring temperature of thermocouples at the right.
The control computer software records six Data Channels:
Channel 1 Position of the plunger (stroke): ±10V
Channel 2 Load: ±10V
Channel 3 Liquid melt temperature: ±5V
Channel 4 Solidification temperature of the sample: ±5V
Channel 5 Outlet temperature of the waterlines: ±5V
Channel 6 Die temperature near sample chamber: ±5V
The Instron test controller and the PC test controller measure the conditioned signals,
such as stroke, load or temperature, in voltage units. Ram, stroke and load are amplified
to be in a range of +/-10Volts. The NI SCXI - thermocouple conditioner amplifies the
temperature generated millivolt signal from the thermocouple to a range of +/-5V.
Temperature
Recording
Main Test
& Data
Control
Computer
Instron Set-up and
Control Panel
62
Data for each channel was recorded in the form of a digital +/-32767 numbering system
which was then scaled for the range of +/-10.000 volts prior to storage on the disk. Since
the computer program reads everything in voltages, it was necessary to develop a
relationship, through "calibration" between device's voltage output and the actual signal
or variable of interest.
The Instron mechanical testing machine was calibrated by Instron standard such that
(a) Stroke or ram displacement: +/-10.000V is +/-75mm
(b) Load on +/-10.000V is +/-50.0kN
3.2.7. Calibration of Thermocouple and Data Acquisition System
3.2.7.1. Thermocouple and Selection Criteria
Apart from Data Acquisition System as discussed earlier, another important sensor
utilized to collect data is the thermocouple. In this research, thermocouples are widely
used to measure temperature of die, melt and characterize of the solidification process.
Hence the accuracy of thermocouples was established through calibration procedure
before carrying out the experiments. Before going into details of calibration, some
explanation will be given on the type and selection of thermocouples for a clear
understanding of its significant performance.
A thermocouple is a sensor for measuring temperature. The working principle of
thermocouple is the Seebeck effect, which states that when two dissimilar metal wires are
connected with each other in a loop to form two junctions that are maintained at two
different temperatures, a voltage potential or electro-motive force (emf) will be generated

63
and current will flow through the loop circuit. The current will be proportional to the
difference in temperature between the junctions and the metals used.
Figure 31 - Schematic diagram of SC-UMSA data collection.
Linux Operated
Computer
64
The first task was to select the most suitable thermocouple for recoding temperature of
solidification sequence of A356 Alloy in SC UMSA Platform. Thermocouples are
available in different combination of metals. The four most common types of
thermocouples are J, K, T, and E. Each type has a different temperature range of
operation, although the maximum temperature varies with the diameter of the wire used
in the thermocouple. The most common thermocouple types and their temperature ranges
are given in the Table 10.
Sheathed thermocouple probes are available with one of the three junction types:
grounded, ungrounded, or exposed. At the tip of the grounded junction probe,
thermocouple wires are physically attached to the inside of the probe wall. This results in
good heat transfer from the outside, through the probe wall to the thermocouple junction.
In an ungrounded probe the thermocouple junction is detached from the probe wall. The
response time is slower compared to the grounded style but this offers electrical isolation.
The ungrounded junction is excellent for applications where stray EMFs would affect the
reading and for frequent or rapid temperature cycling. In the exposed junction style, the
thermocouple protrudes out of the tip of the sheath and is exposed to the surrounding
environment. This type offers the best response time but is limited in use to non-corrosive
and non-pressurized applications [103]. Figure 33 illustrates the three junction types
discussed above.
The K-type ungrounded thermocouples are used in all of the experiments conducted for
this research project and thesis. The chromel-alumel K-type thermocouple is produced by
OMEGA with a 304 stainless steel sheath. The OMEGA specifications used are

65
“KMQSS-020U- 6” that stand for a 6ʺ length probe, 0.020ʺ or 20 thou (0.508mm)
diameter and U-for ungrounded.
Table 10 - Thermocouple Types and Temperature Ranges.
Figure 32 Three Junctions of Thermocouples [103]
Thermo-
couple
Type
Thermocouple
Alloy
Temperature
Range
ᵒC
Standard Limit
of Error
Comments
J Iron– Constantan 0-750
Greater of 2.2ᵒC
or 0.75%
Suitable for reducing
atmospheres
K Chromel - Alumel -200-1250
Greater of 2.2ᵒC
or 0.75%
Recommended for use
in clean oxidizing
atmospheres.
E
Chromel -
Constantan
-200-900
Greater of 1.7ᵒC
or 0.5%
This thermocouple has
the highest emf output
of any standard metallic
thermocouple.
T
Copper -
Constantan
-250-350
Greater of 1ᵒC
or 0.75%
Recommended for
mildly oxidizing and
reducing atmospheres.
Suitable for
applications where
moisture is present.
66
Ungrounded thermocouples were chosen in order to have less interference from the
surrounding Electromagnetic Force (EMF). Moreover, for a better response time, 20 thou
(0.508mm) diameter is selected, as the lower the diameter of thermocouple, the better the
response time [103]. It is estimated that for the same thermocouple, the response time
could be approximately 0.25s in water environment [90]. Other sources indicate values of
less than 0.13s [104]. However, there was found no available response time in high
temperature and high pressure environment.
3.2.7.2. Calibration Requirements
Calibration is the process of standardizing a temperature monitoring instrument to ensure
that it will measure within a specific temperature range in which the instrument is
designed to operate [105]. It is also a process to verify and validate the thermocouple at
its working condition. Accuracy of a thermocouple is its ability to measure temperature
correctly without error. Generally thermocouples are designed to work at certain
conditions. However, due to necessity of experimental condition thermocouples are used
in different environments, e.g. slow solidification environment to high solidification
environment as well as atmospheric pressure to high pressure environments. Investigators
found that pressure has an effect of less than 5ᵒC on the Chromel - Alumel
Thermocouples at 4GPa pressure in the temperature up to 1000ᵒC, while for Pt-Pt Rh
thermocouples the correction factor is 35ᵒC in the same range of pressure and
temperature [106]. By contrast, Ivan C. Getting and George C. Kennedy from the
University of California found that at 3GPa and for temperature up to 600ᵒC, the
corrections for Chromel- Alumel Thermocouples are less than 2ᵒC [106]. In contrast to
those high pressure experiments, in this investigation we have used only 50-115 MPa
67
pressure. Therefore, it is expected that there will less effect of pressure on the Chromel-
Alumel Thermocouples. Apart from the pressure effect, there might be also effect for
high solidification rate and effect of cyclic pressure as well as combined effect on the
thermocouples data.
3.2.7.3. Calibration Procedures
Thermocouples are calibrated by measurement either at a series of fixed point
temperatures, e.g. melting/solidification points or, by comparison with reference or
standard thermometers, in thermally stabilized baths or furnaces suitable for the
calibration, or by a combination of techniques, e.g. comparisons and fixed-point
temperatures [107, 109]. Fixed-point(s) and standard thermometer(s) shall be traceable to
national standards. Generally, fixed point calibrations are only required for the calibration
of platinum-rhodium thermocouples at the highest accuracy. However, it could be used
for Chromel –Alumel thermocouples as well.
In this investigation K-type thermocouples (Chromel-Alumel) were used to measure
solidification sequence of A356 alloy whose liquidus and solidus temperature are
614.4ᵒC and 555ᵒC respectively and the melt temperature was in the range of 700 -
750ᵒC. Therefore, equivalent procedure of fixed points temperatures e.g. solidification
temperature of pure (99.99) Al and Zn are used for the calibration as their solidification
temperatures (as per NIST) are 660.32ᵒC and 419.6ᵒC respectively.
In order to perform the calibration the following factors need to be considered:
1. Effect of slow heating/cooling rates on the thermocouple and data acquisition
system’s temperature characteristics.

68
2. Effect of high heating/cooling rates on the thermocouple and data acquisition
system’s temperature characteristics.
3. Effect of static pressure on the thermocouple and data acquisition system’s
temperature characteristics.
4. Effect of cyclic pressure on the thermocouple and data acquisition system’s
temperature characteristics.
5. Combined effects of high cooling rate and cyclic pressure on the thermocouple
and data acquisition system’s temperature characteristics.
However, due to severe time constraints the calibration procedures are kept limited to the
following procedures:
1. Calibration to convert voltage into degree C at SC UMSA.
2. HT UMSA Calibration against NIST calibrated data for slow solidification rate.
3. SC UMSA Calibration against HT UMSA calibrated data for high solidification
rate at atmospheric pressure.
1. Calibration to Convert Voltage to Degree (ᵒC) at SC UMSA.
Thermocouples produce a voltage output that can be correlated to the temperature that the
thermocouple is measuring. To convert the voltage into temperature and to determine a
relationship between temperature and voltage, the first calibration was done through
carrying out experiments for pure aluminum and pure zinc at atmospheric pressure in SC-
UMSA Platform. During the experiments, temperatures were recorded separately in
degree Celsius converted from voltages in Windows (HP) and Linux operated computer
respectively. The solidification temperature of pure aluminum and zinc were determined
through thermal analysis and tabulated in Table-11, in both degree Celsius and voltage
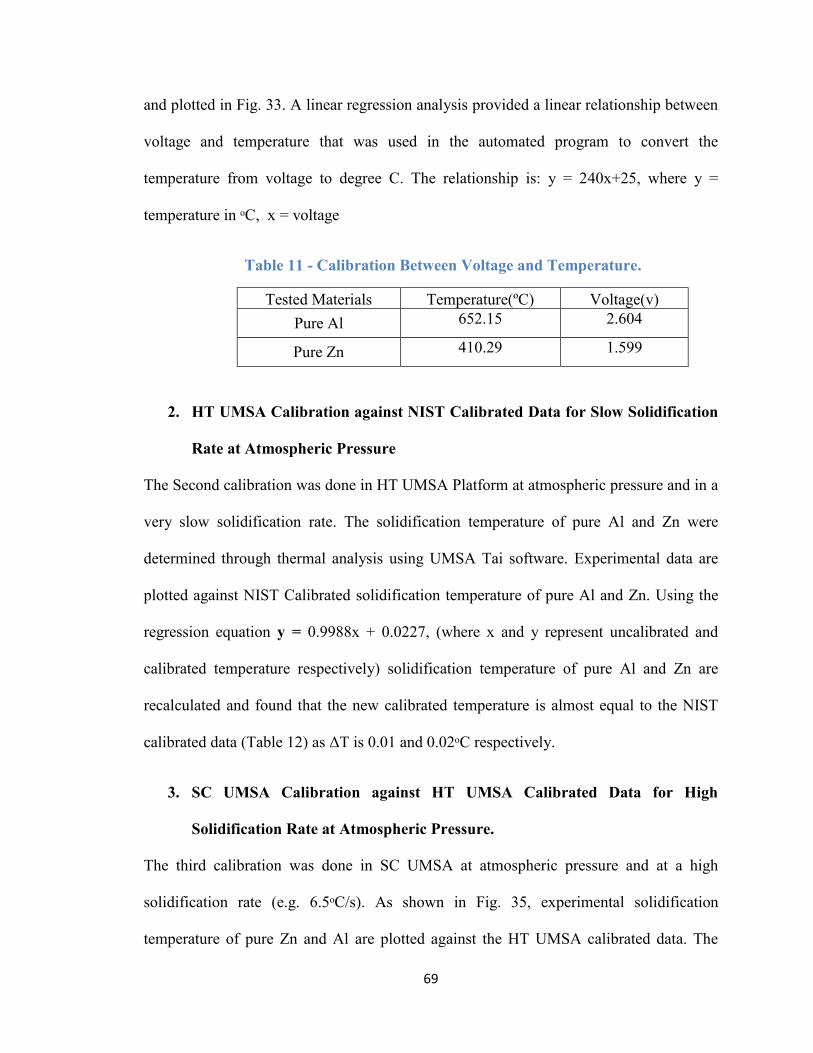
69
and plotted in Fig. 33. A linear regression analysis provided a linear relationship between
voltage and temperature that was used in the automated program to convert the
temperature from voltage to degree C. The relationship is: y = 240x+25, where y =
temperature in ᵒC, x = voltage
Table 11 - Calibration Between Voltage and Temperature.
Tested Materials Temperature(ºC) Voltage(v)
Pure Al 652.15 2.604
Pure Zn 410.29 1.599
2. HT UMSA Calibration against NIST Calibrated Data for Slow Solidification
Rate at Atmospheric Pressure
The Second calibration was done in HT UMSA Platform at atmospheric pressure and in a
very slow solidification rate. The solidification temperature of pure Al and Zn were
determined through thermal analysis using UMSA Tai software. Experimental data are
plotted against NIST Calibrated solidification temperature of pure Al and Zn. Using the
regression equation y = 0.9988x + 0.0227, (where x and y represent uncalibrated and
calibrated temperature respectively) solidification temperature of pure Al and Zn are
recalculated and found that the new calibrated temperature is almost equal to the NIST
calibrated data (Table 12) as ΔT is 0.01 and 0.02ᵒC respectively.
3. SC UMSA Calibration against HT UMSA Calibrated Data for High
Solidification Rate at Atmospheric Pressure.
The third calibration was done in SC UMSA at atmospheric pressure and at a high
solidification rate (e.g. 6.5ᵒC/s). As shown in Fig. 35, experimental solidification
temperature of pure Zn and Al are plotted against the HT UMSA calibrated data. The

70
high SR regression equation, y = 1.0x + 11.0 (where x and y represent uncalibrated and
calibrated temperature respectively) showed that experimental temperature is 11ᵒC lower
than the calibrated temperature. Data Acquisition was adjusted accordance with the
correction factor of 11ᵒC. All data were recorded and listed in Table 12.
Sincere there was no calibrated data available at high pressure environment for pure Zn
and Al, all experimental data produced at cyclic pressure were corrected against the
calibrated data of atmospheric pressure at high SR in SC UMSA Platform. For instance,
the correction factor was incorporated for the experimental data produced at 90 MPa with
10 pressure cycles as shown in Figure 36. However, it is recommended to incorporate
pressure effect in future studies.
Figure 33 - Relationship between voltages and uncalibrated temperature.
Table 12 - Calibration Data Summary.
Experi-
mental
Materials
NIST
Calibrated
Solidification
Temperature
(ᵒC)
HT UMSA
Uncalibrated
Solidification
Temperature
(ᵒC)
HT UMSA
Calibrated
Solidification
Temperature
(ᵒC)
SC UMSA
Uncalibrated
Solidification
Temperature
(ᵒC)
SC UMSA
Calibrated
Solidification
Temperature
(ᵒC)
Zinc 419.572 420.03 419.55 410.29 421.29
Aluminum 660.32 661.1 660.33 652.15 663.15
y = 240x + 25R² = 1
350
400
450
500
550
600
650
700
1.5 1.7 1.9 2.1 2.3 2.5 2.7
Unc
alib
rate
d Te
mpe
ratu
re, ᵒ
C
Voltage, V
Uncalibrated Temperature Vs VoltageLinear (Uncalibrated Temperature Vs Voltage)
Solidification Temperatureof Pure Zinc
Solidification Temperatureof Pure Aluminum
1) Calibration to convert Voltage into Temperature,

71
Figure 34 - Relationship between calibrated data and uncalibrated data.
Figure 35 - Incorporation of calibration factor in the first derivative of cooling curve of unmodified A356 at 90
MPa for 10 pressure cycles.
3.2.8. Experimental Procedure for the Squeeze Casting
Before starting the squeeze casting experiments, the die cavity was cleaned with small
tools to break off any loose residual metal left from a previous experiment. A vacuum
MPa
72
cleaner was used to remove all tiny particles. A layer of boron nitride die release was
then sprayed onto the melt and mold chamber walls.
The thermocouple for measuring solidification temperature of the squeeze cast sample
was also coated or thin filmed with boron nitride to minimize the thermocouples sticking
in the sample or in the die and then inserted into the access hole at the corner of the die
such that the tip was at the center of the die cavity. Any extra vapor or moisture inside
the die cavity was evaporated during die warm up to a temperature of 250 ᵒC using the
two cartridge heaters. The graphite gate was then inserted into its position just beneath
the melting chamber in the die and it too was sprayed with boron nitride.
The test sample was placed inside the melting chamber on top of the gate. A
thermocouple was inserted into a small hole previously drilled into the top of the sample
for measuring and recording the melt temperature. Another thermocouple was inserted
diagonally into a blind hole at the side of the die such that the tip measured the die
temperature close to the die cavity chamber. An additional thermocouple was inserted
into a small hole located near the bottom of the melt chamber to measure the external
temperature of the melt chamber and its output was connected to the temperature
controller of the melt chamber. The melt chamber that was coiled with one high
temperature tubular heater was able to heat up the melts up to 800 ᵒC. It was energized
with 110 VAC from the controller.
When all thermocouples were placed in their respective positions, four channels Labview
software was started in the HP computer to see whether all thermocouples were working
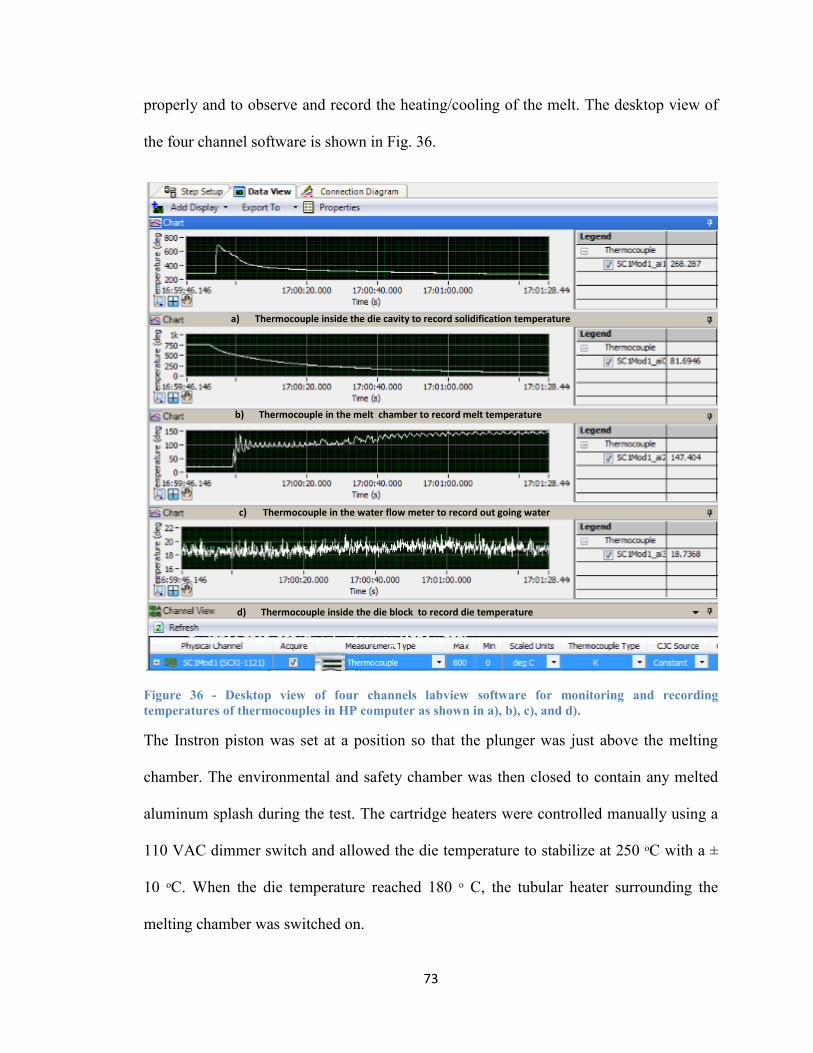
73
properly and to observe and record the heating/cooling of the melt. The desktop view of
the four channel software is shown in Fig. 36.
Figure 36 - Desktop view of four channels labview software for monitoring and recording
temperatures of thermocouples in HP computer as shown in a), b), c), and d).
The Instron piston was set at a position so that the plunger was just above the melting
chamber. The environmental and safety chamber was then closed to contain any melted
aluminum splash during the test. The cartridge heaters were controlled manually using a
110 VAC dimmer switch and allowed the die temperature to stabilize at 250 ᵒC with a ±
10 ᵒC. When the die temperature reached 180 ᵒ C, the tubular heater surrounding the
melting chamber was switched on.
a) Thermocouple inside the die cavity to record solidification temperature
b) Thermocouple in the melt chamber to record melt temperature
c) Thermocouple in the water flow meter to record out going water
temperature
d) Thermocouple inside the die block to record die temperature

74
As the alloy temperature approached to test sample’s melting point, the automated
software in the main data control computer for SC-UMSA was started to collect the data
through six channel sensors as described earlier. When the liquid metal temperature
reached 750°C, a targeted temperature for the liquid metal of A356 Al alloy, the melt was
held at that temperature for 5 minutes to homogenize the liquid phase. After the hold the
slide gate was opened to deliver the molten metal into the die cavity below. From this
part of the experiment to the end of solidification, the process was automatically
controlled by the Squeeze Casting Test Control Software.
The squeeze casting test control program works in six stages, and in each stage all 6
channels of data are recorded to the hard disk at 333 data points/second/channel. The six
control stages are:
Stage 1: The program monitors the die cavity thermocouple to see when the melt has
been delivered to the die cavity. When the thermocouple exceeds 1.5 volts the program
concludes that the cavity is filled with melt and stage 2 begins.
Stage 2: The program monitors the die cavity thermocouple’s signal to see when a peak
temperature is achieved. The computer tracks the voltage on the way up and when a
specified voltage drop (0.50) occurs the program concludes that the peak temperature has
been achieved. The volt window is required because the thermocouple signal has
inherent noise which, if the window is too small, could trigger an incorrect “peak
detected" state. When a peak temperature has been observed stage 3 begins.

75
Stage 3: The program monitors the die cavity thermocouple as the temperatures
decrease to see when a user defined post peak temperature trigger has occurred. Then it
goes to stage 4.
Stage 4: The program gives instruction to move the ram (via outputs onto the D/A) into
a predefined position just above the dropped melt at a high ram speed. The ram speed
needs to be determined iteratively as overshoot of the target position above the melt is
possible. As the ram gets close to the target position the voltage step size is decreased by
a factor of 2, to slow the ram. When the stage 4 ram position is reached, stage 5 starts.
Stage 5: The program selects a target load voltage from the program list and change
stoke (ram position) in very small voltage steps to minimize overshoot of the target load.
As each of the programmed loads is achieved, select the next target load in the list.
When the load list is completed go to stage 6.
Stage 6: The program monitors and records all 6 channels data until the stop signal is
received and shut down eventually.
The die cavity thermocouple recorded data of the solidification process to verify the
solidification/cooling rate of the test sample. Just after dropping the melt into die cavity,
the water flow is on. The water lines inside the die block helped cooling the die block and
the cast sample. However, the heavy die block absorbed the heat so fast that the
subsequent water cooling had negligible effect on the solidification process as by the time
the water started cooling the block the solidification process usually did finish. The outlet
water temperature was recorded as one of the data channels.

76
The experimental data was processed by the PC Data Acquisition System (DAS). Final
outputs were recorded in a large data log file for computation purposes, which was then
truncated to required set of data. Using a Linux Bash script a set of data files with
important variables including time, temperature, stroke and cyclic pressure were created
for data analysis. All data channels were converted from volts to their respective units
(e.g. time in seconds, stroke in mm, temperature in ᵒC etc.).
The Savitzky-Golay algorithm was applied twice, each time with a window of 60 points
on both sides of each smoothed point. The point window size was larger than that of used
in the standard UMSA program because the number of samples per second was larger.
Savitzky-Golay code was also used to compute the first derivative of the cooling curves.
In parallel to the PC control and record system, the HP computer and its UMSA software
was used to obtain heating/cooling curve and 1st derivatives.
Once the solidification process was completed, the subsequent step was to eject the test
sample (see Fig. 37) from the die. This was done through the pneumatic ejection cylinder
activated by way of a detent control valve. The maximum capacity of the air regulator
was between 80-90 psi which ejected the test sample from out of the die cavity. Prior to
the ejection of the sample, an attempt was made to remove the specimen thermocouple
from the die though it was not usually successful. Then the test sample was prepared for
the metallographic observations through LOM & SEM/EDS.

77
Figure 37 – SC test samples.
3.3. High Temperature Universal Metallurgical Simulator
and Analyzer (HT UMSA)
Part of the calibration (slow SR) and initial thermal analysis of UM A356 alloy as well as
the heat treatment of the squeezed cast A356 samples were done in the High Temperature
Universal Metallurgical Simulator and Analyzer Technology Platform (HT UMSA), a
unique platform for thermal analysis jointly developed by the researchers at the
University of Windsor and the Silesian University of Technology in Gliwice, Poland
(Fig. 38). It has been patented as Canadian Patent No: 2,470,127 and US Patent No:
7,354,491.
3.3.1. Hardware Platform
The HT UMSA consists of several components, including:
A) Melting and Environmental Chamber
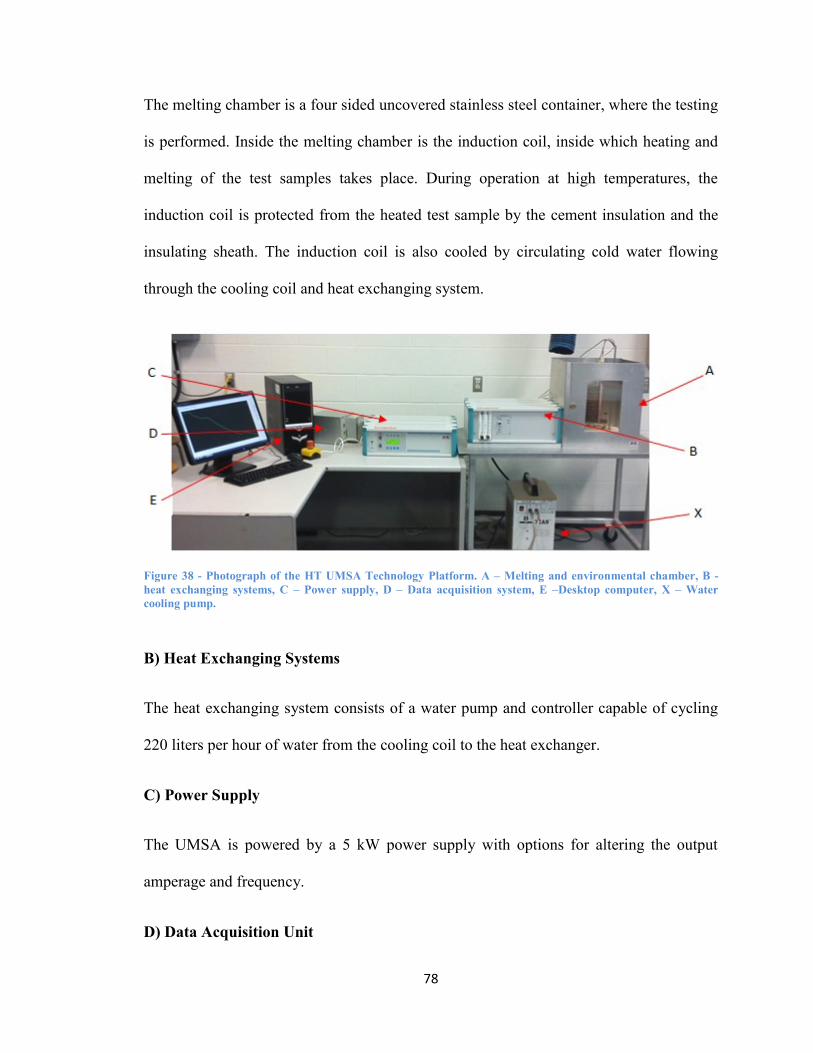
78
The melting chamber is a four sided uncovered stainless steel container, where the testing
is performed. Inside the melting chamber is the induction coil, inside which heating and
melting of the test samples takes place. During operation at high temperatures, the
induction coil is protected from the heated test sample by the cement insulation and the
insulating sheath. The induction coil is also cooled by circulating cold water flowing
through the cooling coil and heat exchanging system.
Figure 38 - Photograph of the HT UMSA Technology Platform. A – Melting and environmental chamber, B -
heat exchanging systems, C – Power supply, D – Data acquisition system, E –Desktop computer, X – Water
cooling pump.
B) Heat Exchanging Systems
The heat exchanging system consists of a water pump and controller capable of cycling
220 liters per hour of water from the cooling coil to the heat exchanger.
C) Power Supply
The UMSA is powered by a 5 kW power supply with options for altering the output
amperage and frequency.
D) Data Acquisition Unit
79
The data acquisition unit is a 16-bit system capable of logging temperature/time
measurements on two channels simultaneously and has a scan rate of up to 100Hz per
channel. However, 5Hz scan rate was used during the current experiments.
E) Desktop Computer
A desktop computer interfaces with the HT-UMSA platform via a National Instruments
data acquisition system. Live control of the platform through the computer software
allows the operator to specify detailed process parameters, make in-process input
changes, if necessary, and complete post-process analysis using custom designed thermal
analysis software. This thermal analysis software allows for calculation of various data of
metallurgical importance, including derivatives, temperature of metallurgical reactions,
fraction solid curves, etc.
3.3.2. Software Platform
The software components of the UMSA consist primarily of [90] two front-end
programs namely UMSA-TAI and UMSA-CA, which were designed for use with the
UMSA and handle all end-user thermal analysis operations. These programs were written
in C++ by the developers of the hardware system.
UMSA-CA is used for control and data logging during experiments conducted on the
UMSA platform. It accepts user input in the form of settings, temperature settings, heat
treatment paths, etc. and regulates the power supply accordingly. If cooling is required it
may also release gas coolants via the integrated cooling coil.
UMSA-TAI is a post-processing software used to analyze data logged by UMSA-CA.
Using the temperature/time data as input; the program is capable of efficiently calculating
80
information of metallurgical importance, including derivatives, baselines and fraction
solid curves. The program is well-suited to the visualization and comparison of multiple
graphs and also has curve smoothing capabilities (following the Savitzky-Golay
algorithm). The data is also easily exportable to any standard spreadsheet program for
further analysis [90].
3.3.3. Solution Treatment Procedure
One fourth of squeezed cast samples were cut longitudinally for the heat treatment. A
10mm deep thermocouple hole was made at the top center of the quarter sample and then
cleaned by ultrasound cleaning. The sample was placed inside the induction coil of
UMSA. A K type thermocouple coated with boron nitride was inserted into the hole at
the top of the sample.
The UMSA-CA software, described in the previous section, was used to run the heat
treatment by using 20% power to heat up the sample to 540 ᵒ C, where the temperature
was held for a certain period e.g.(15-30 minutes) for both as-cast A356 alloy, and the Sr
modified A356 alloy as shown in Fig. 39. The sample was then quenched into the warm
water of 70 ᵒ C. No artificial aging was done for any of the samples except natural aging.
3.4. Metallographic Sample Preparation
Metallographic samples were prepared at the MCPT lab in the University of Windsor.
Squeezed cast samples were cut using a saw along the longitudinal axis and one half
samples was cut in transverse section. The sample pieces were then mounted in blue
epoxy using the Buehler Mounting Press. Grinding and polishing were done in Buehler
Ecomet ll Grinding, Lapping, Polishing Machine at a single speed of 300rpm or lower.

81
Figure 39 - Solution Treatment heating- quenching curve.
Samples were ground manually using Silicon Carbide 320 grit paper in a magnetic disc
with an adaptor followed by polishing using Struers diamond solution MD Largo (9µm
for 4 min), MD Mol (3µm for 3 min) and final polishing by OP-Chem (OP-S, 0.04µm for
1 min). Final cleaning was done with ethyl alcohol (95%).
3.5. Light Optical Microscopy (LOM) Analysis
The LOM observations were made using a Leica Q5501W microscope connected with an
OPTIXCAM camera and a desktop computer along with OCVIEW Image processing
software. The microscope has five objective lenses (5x, 10x, 20x, 50x and 100x) which
are in series with a 10x lens, resulting in a maximum of 1000x magnification. The
imaging system was calibrated for all objective lenses to obtain accurate pixel: micron
ratios. A calibrated scale of 2 mm is shown in the Figure 40 at different magnification.

82
Figure 40 - Calibration scale at different LOM magnification.
3.6. Measurement of Dendrite Refinements - Secondary Dendrite Arm
Spacing (SDAS) and Dendrite Cell Size
Secondary Dendrite Arm Spacing (SDAS) is the distance between the two adjacent
Secondary Dendrite Arms. Dendrite cell size is the width of individual dendrite cells. As
both measurements procedures are similar, here only the SDAS measurements procedure
is described as per the Ford Material Specification WSE-M2A151-A3 (also ASTM E-3).

83
The LOM micrograph of the as-cast A356 sample solidified at atmospheric pressure is
shown in Fig.41. The intersection method was utilized to calculate the SDAS. Several
lines were drawn over the Secondary Dendrite Arms in a perpendicular direction. The
length of the intersect lines and the number of intersecting secondary dendrite arms were
measured and the average SDAS was calculated as shown in the following paragraphs.
Figure 41 - The As-Cast microstructure showing the dendrite structure and superimposed intersect lines
according to the ASTM R-1(Al. 100X) [58]
Measuring procedure of the SDAS is:
SDAS = (Total width of the secondary dendrite arms/Number of secondary dendrite
arms);
The average SDAS = (L1 + L2 + L3)/(N1 + N2 + N3)………………………….Equation 8
Where, L1, L2, L3 stands for the lines of dendrite width and N1, N2, N3 stands for
number of dendrites in the respective lines.

84
In order to obtain statistical reliability and repeatable results, numerous measurements
had to be taken. The SDAS and dendrite cell size measurements were based on 20 fields,
and 5 measurements were taken in each field.
3.7. Experimental Design
A summary of the squeeze casting experiment and testing conditions used during
experimentation is shown in the Table 13 while the solution treatment matrix is stated in
the Table 14.

85
Table 13 - Matrix of SC- UMSA Tests.
Runs# Sample
Reference Alloy
Applied
Pressure(MPa) No of
Pressure
Cycle
Temperature
of Applied
Pressure (ᵒC)
Min. Max. Start End
1 31513 Unmodified
A356
0 0 - - -
2 31813 ʺ 0 0 - - -
3 32513 ʺ 0 0 - - -
4 32713 ʺ 0 45 1 - -
5 32813 ʺ 0 50 1 615 614
6 40113 ʺ 0 55 10 618 614
7 40213 ʺ 0 60 10 615 608
8 50613 ʺ 0 60 1 - -
9 41913 ʺ 30 80 10 619 613
10 41713 ʺ 20 90 10 622 619
11 60513 ʺ 60 100 10 - -
14 62513 ʺ 80 115 20 620 537
12 61013 ʺ 20 115 40 615 362
13 61213A ʺ 20 115 50 622 348
15 51313 0.04%Sr +
A356
0 100 1 591 568
16 51513 ʺ 75 100 10 614 593
17 72413B 0.015%Sr +
A356 0 0 - - -
18 61913 ʺ 20 115 7 619 565
19 71613 ʺ 20 115 50 619 360
20 72413A 1%Al2O3 +
A356
0 0 - - -
21 61213B ʺ 20 115 2 615 602
22 62013 ʺ 80 115 20 615 538
23 71513 ʺ 80 115 50 614 430
24 72413C 0.015%Sr+
1%Al2O3 +
A356
0 0 - - -
25 81413 ʺ 20 115 12 623 534
26 62413 ʺ 80 115 20 617 523
27 61713 ʺ 20 115 50 623 366

86
Table 14 - Matrix of Solution Treatment Experiments.
Runs # Test reference Alloy
Holding
Temperature,
(ºC)
Holding Time,
(s)
1. 62513 Unmodified
A356
540 30
2. 62513 Unmodified
A356
540 15
3. 71613 Sr modified
A356
540 30
4. 71613 Sr modified
A356
540 15
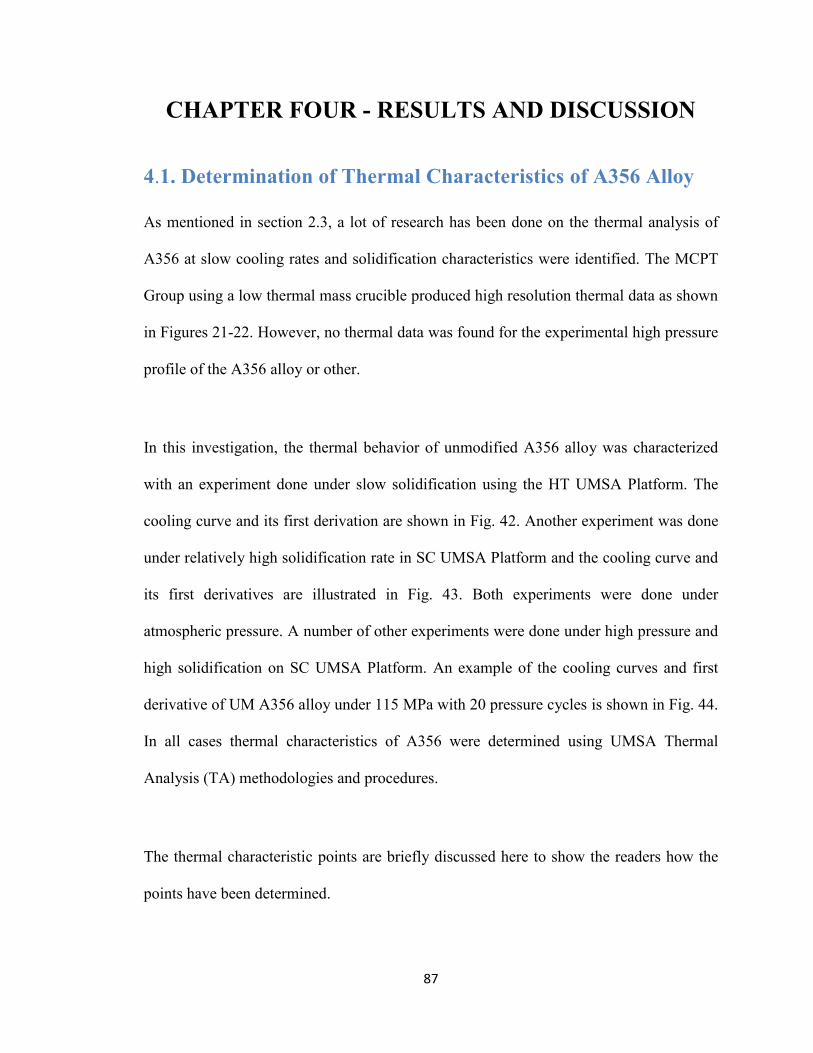
87
CHAPTER FOUR - RESULTS AND DISCUSSION
4.1. Determination of Thermal Characteristics of A356 Alloy
As mentioned in section 2.3, a lot of research has been done on the thermal analysis of
A356 at slow cooling rates and solidification characteristics were identified. The MCPT
Group using a low thermal mass crucible produced high resolution thermal data as shown
in Figures 21-22. However, no thermal data was found for the experimental high pressure
profile of the A356 alloy or other.
In this investigation, the thermal behavior of unmodified A356 alloy was characterized
with an experiment done under slow solidification using the HT UMSA Platform. The
cooling curve and its first derivation are shown in Fig. 42. Another experiment was done
under relatively high solidification rate in SC UMSA Platform and the cooling curve and
its first derivatives are illustrated in Fig. 43. Both experiments were done under
atmospheric pressure. A number of other experiments were done under high pressure and
high solidification on SC UMSA Platform. An example of the cooling curves and first
derivative of UM A356 alloy under 115 MPa with 20 pressure cycles is shown in Fig. 44.
In all cases thermal characteristics of A356 were determined using UMSA Thermal
Analysis (TA) methodologies and procedures.
The thermal characteristic points are briefly discussed here to show the readers how the
points have been determined.

88
The α-Al Dendrite Nucleation Temperature, (TαDEN
NUC) – Non Equilibrium
Liquidus Temperature (NTL)
The α-Al Dendrite Nucleation Temperature, (TαDEN
NUC) characterizes the point at
which primary α dendrites start to nucleate from the melt. This event is exhibited by the
change in the slope of the cooling curve and determined by the first derivative inflection
point (point#1 in figure 42-44). However, FDs in Figures 43 and 44 (SC UMSA –
atmospheric pressure and SC UMSA – cyclic pressure respectively) with increased SR
and cyclic pressure show progressively worsened spatial resolution to the point that the
precise determination of the TL (point # 1) is not feasible.
The α-Al Dendrite Minimum (Undercooling) Temperature, (TαDEN
MIN)
The α-Al Dendrite Minimum Temperature, (TαDEN
MIN) exemplifies a state (point#2 in
Fig. 43) where the nucleated dendrites have grown to such an extent that the liberated
latent heat of fusion stabilizes the heat extracted from the test sample. After this point, the
melt temperature increases to a steady state growth temperature (TαDEN
G, point#3 in Fig.
43). The TαDEN
MIN as the local minimum is determined by the point (point#2) at which
the first derivative intersects the zero line (dT/dt=0). If the first derivative does not
intersect the zero line, point#2 does not exist as in Fig. 42 and Fig 44.
The α-Al Dendrite Growth Temperature, (TαDEN
G)
The α-Al Dendrite Growth Temperature, (TαDEN
G see Fig. 43) denotes the local
maximum temperature of this reaction. It is also called the “steady state growth
temperature”. It corresponds to the second zero point (point#3 in Fig. 43) on the first
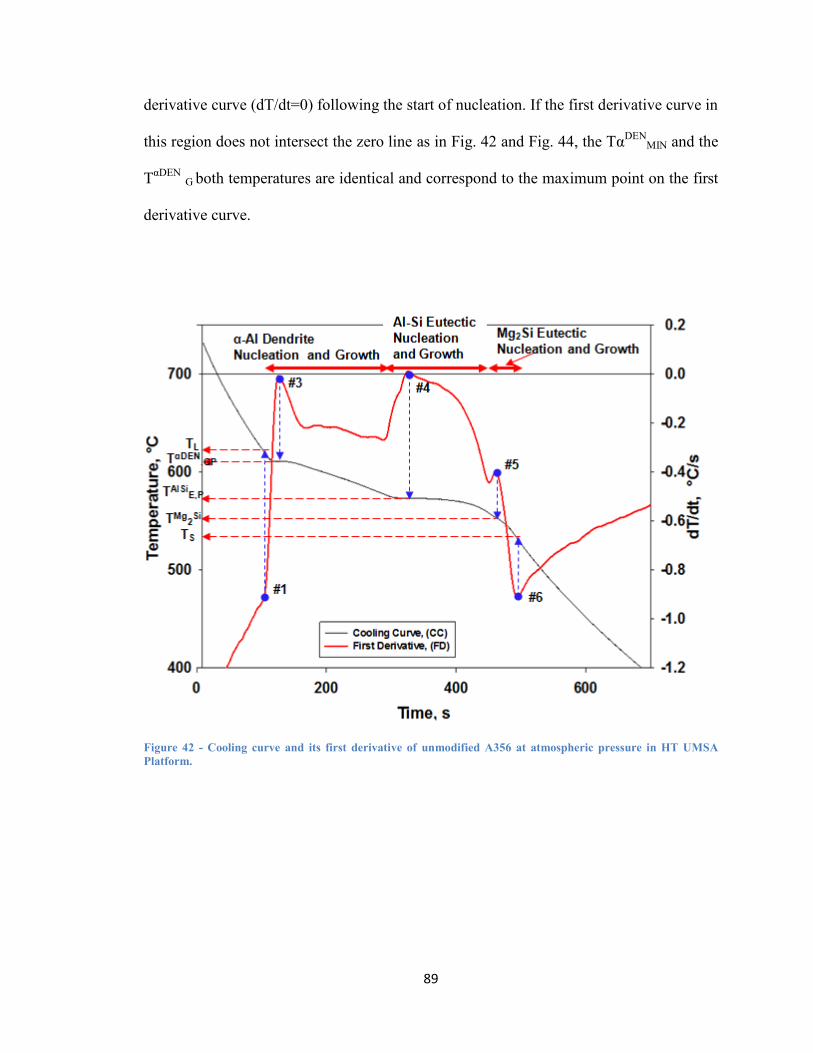
89
derivative curve (dT/dt=0) following the start of nucleation. If the first derivative curve in
this region does not intersect the zero line as in Fig. 42 and Fig. 44, the TαDEN
MIN and the
TαDEN
G both temperatures are identical and correspond to the maximum point on the first
derivative curve.
Figure 42 - Cooling curve and its first derivative of unmodified A356 at atmospheric pressure in HT UMSA
Platform.

90
Figure 43 - Cooling curve and its first derivative of unmodified A356 at atmospheric pressure in SC UMSA Platform.
Figure 44 - Cooling curve and its first derivative of unmodified A356 alloy at 115 MPa pressure with 20 cycles.

91
The Al-Si Eutectic Growth Temperature, (TAlSi
E,G)
Al-Si Eutectic Growth Temperature, (TAlSi
E,G) represents the temperature at which
considerable Al-Si eutectic growth occurs. This point (point #4 in Figures 42-44)
generally corresponds to the maximum point on the first derivative curve, if the first
derivative curve does not intersect the zero line. In this study the first derivative curve
didn’t intersect the zero line for any of the experiments.
Al- Mg- Fe-Si Eutectic Nucleation and Growth Temperature
According to the literature and to the University of Windsor’s experimental 3XX alloy
data, the Al-Si eutectic formation leads to a further localized increase in Mg and other
remaining elements (e.g. Fe) contained in the liquid and will represent these phases by
separate dT/dt peak(s). In figures 42-43, a third peak (point # 5) is formed in the first
derivative curve that corresponds to the phases of either Mg2Si or AlMgFeSi phase. At
slow solidification rates less than 5°C/s, this peak is considered as the peak of Mg2Si
(Fig. 42). At moderate high cooling rates between 5-7°C/s, the Mg2Si peak does not show
up, instead the peak of AlMgFeSi appeared at approximately 554°C (Figure 43).
However, at the high solidification rates above 7°C/s achieved during high pressure
solidification, the first derivative curve neither show Mg2Si nor AlMgFeSi as a separate
peak (Fig. 44).
Solidus Temperature (TS)
The solidus temperature is the temperature below which the melt is completely solidified
and is the end of the solidification process. The corresponding temperature of point # 6 in

92
Figures 42-44 is considered to be the apparent solidus temperature as it is not feasible to
determine TS precisely due to the effect of high thermal mass die on the TA data.
4.2. Determination of Solidification Rate (SR)
The rationale of determining Solidification Rate (SR) for highly non-equilibrium
solidification is discussed here. The solidification process is involved with the liquidus
and solidus temperature range. The SR is defined as the temperature change divided by
the time difference between the liquidus and solidus points. During slow solidification
with low thermal mass at very slow SR, liquidus and solidus temperatures are easy to
identify using UMSA high resolution thermal analysis as shown in Figure 42. However, a
high thermal mass die in SC UMSA and high SR, precise determination of the TL and TS
temperature is not feasible in all of squeeze casting experiments.
Hence, it was decided to use the α-Al Dendrite Growth Temperature (TαDEN
G, point#3) as
apparent liquidus temperature, and point #6 as apparent solidus temperature. Considering
all of the above points, it was decided to calculate the apparent Solidification Rate (SR)
based on TαDEN
G, (point#3) and TS (Point#6) for all highly non-equilibrium solidification
tests on the SC UMSA platform.
Based on the above definitions and discussions in section 4.1 and 4.2, the characteristic
points associated with individual non-equilibrium metallurgical events taking place
during solidification processes in HT UMSA and SC UMSA are summarized and
compared in Table 15. Also, a summary of squeeze casting test results and thermal
characteristics points of unmodified and modified A356 alloy is tabulated in Table 16 and
Table 17. Note that all experimental data are calibrated as discussed in section 3.2.7.

93
Table 15 - Thermal Characteristics of Unmodified A356 alloy.
Thermal Characteristics Atmospheric Pressure
115 MPa
/20cycles
HT UMSA SC UMSA SC UMSA
Av. Solidification Rate, ᵒC/s 0.3 6.5 40.1
α- Al Dendrite Growth
Temperature, (TαDEN
G ), ᵒC 611.0 613.9 621.0
Al-Si Eutectic Growth
Temperature, (TAlSi
E,G ), ᵒC 573.0 573.0 564.0
Growth Temperature of Mg
enriched phases, Mg2Si or
AlFeMgSi (TAlSiMgFe
G), ᵒC
553.0 552.0 -
4.3. Effect of Cyclic Pressure on the Unmodified A356 Alloy
in the SC UMSA Platform
As has been discussed in Chapter Two, applying pressure on the solidifying melt in the
water cooled steel die creates non-equilibrium solidification. Moreover, high pressure
promotes better contact between the steel die and the test sample that enhanced the
solidification rate. In the entire squeeze casting experiments, melt temperature and initial
die temperature have been kept constant at 750ᵒC and 250ᵒC respectively with ± 10ᵒC.
Pressure profiles are varied in terms of number of cycles and magnitude. Since pressure
has been applied in a cyclic manner on the solidifying melt, it was found that the thermal
and microstructural behavior of A356 alloy has been greatly influenced by the cyclic
pressure in comparison to static and atmospheric pressure. All thermal characteristics of
the unmodified alloy are tabulated in Table 16. Comparisons of cooling curves and their
first derivatives are depicted in Figures 45 - 46 and individual graphs are shown in

94
Appendix A (Figures 114 – 137). All experimental data have been incorporated with the
calibration as discussed in Chapter Three.
4.3.1. Changes in the Thermal Characteristics of Unmodified A356
Alloy
The first experiment in the squeeze casting platform was done by applying 50 MPa with
1 cycle pressure. As can be seen in Table 16 and Figures 45-46, the α-Al Dendrite
Growth Temperature (TαDEN
G) was increased from 613.9ᵒC (at atmospheric pressure) to
615.5ᵒC together with a decrease in the Al-Si Eutectic Growth Temperature (TAlSi
E,G)
from 573ᵒC (at atmospheric pressure) to 566ᵒC at 50 MPa pressure. In later experiments
the pressure was increased to 55 MPa and 60 MPa respectively for 10 cycles each. The
combined effect of pressure and increasing number of cycles increases the TαDEN
G to
618.1ᵒC and 615.1ᵒC respectively with further reduction in the TAlSi
E,G to 565ᵒC and
563ᵒC respectively. Two more experiments done at the pressure range of 80 MPa and 90
MPa for the same number of cycles showed that both the TαDEN
G and TAlSi
E,G were
increased simultaneously in the range of (619.1-622.3)ᵒC and (572-578)ᵒC. A high
pressure test of 20 cycles at 115 MPa was performed in the seventh experiment and
showed (Fig. 47) that the TαDEN
G and TAlSi
E, G reached 620.8ᵒC and 564ᵒC respectively.
Keeping the same level of pressure, two more experiments were carried out with further
increasing number of cycles to 40 and 50 respectively (Fig. 47). However, it was found
that in these latter experiments the α-Al Dendrite Growth Temperature (TαDEN
G) were
reduced to 615.2ᵒC and 613.1ᵒC along with the TAlSi
E,G increase to 573ᵒC and 568ᵒC
respectively.
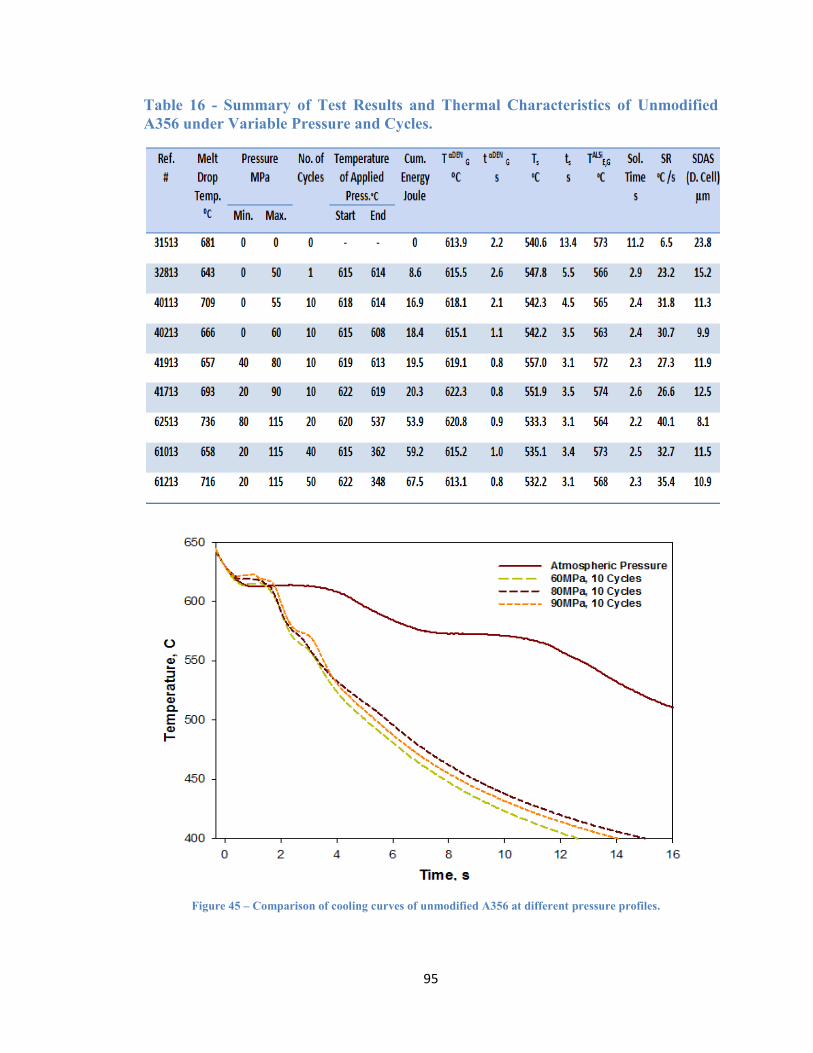
95
Table 16 - Summary of Test Results and Thermal Characteristics of Unmodified
A356 under Variable Pressure and Cycles.
Figure 45 – Comparison of cooling curves of unmodified A356 at different pressure profiles.
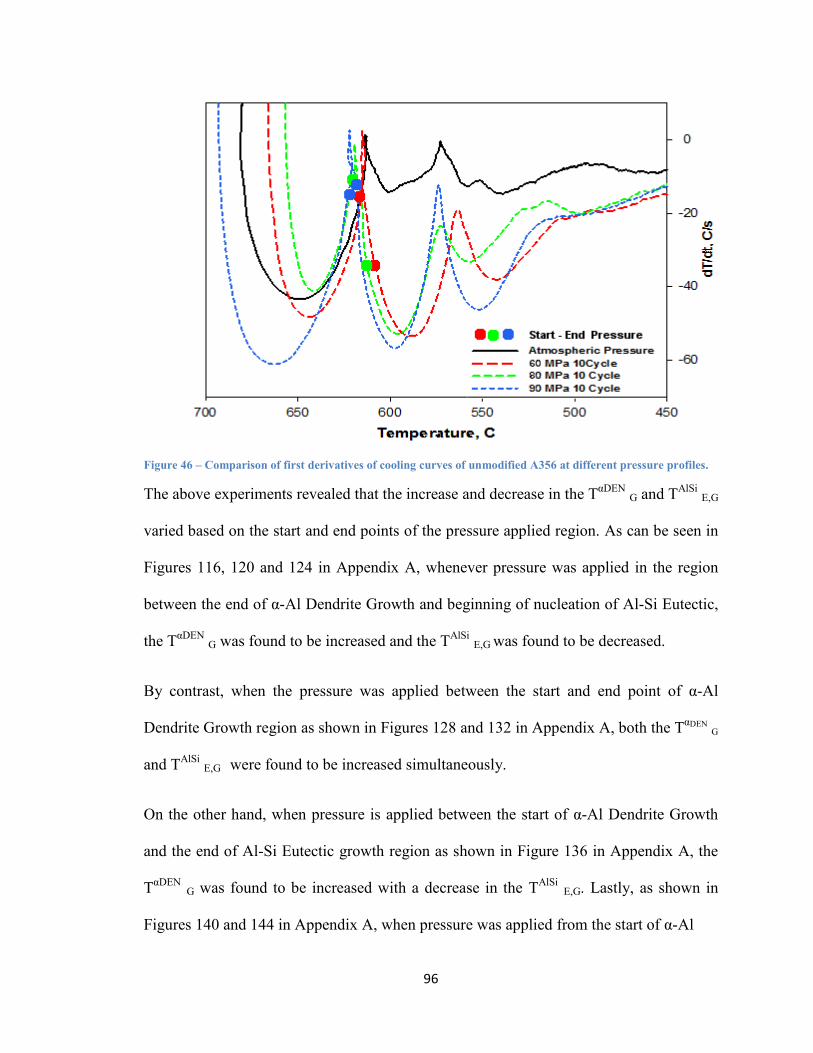
96
Figure 46 – Comparison of first derivatives of cooling curves of unmodified A356 at different pressure profiles.
The above experiments revealed that the increase and decrease in the TαDEN
G and TAlSi
E,G
varied based on the start and end points of the pressure applied region. As can be seen in
Figures 116, 120 and 124 in Appendix A, whenever pressure was applied in the region
between the end of α-Al Dendrite Growth and beginning of nucleation of Al-Si Eutectic,
the TαDEN
G was found to be increased and the TAlSi
E,G was found to be decreased.
By contrast, when the pressure was applied between the start and end point of α-Al
Dendrite Growth region as shown in Figures 128 and 132 in Appendix A, both the TαDEN G
and TAlSi
E,G were found to be increased simultaneously.
On the other hand, when pressure is applied between the start of α-Al Dendrite Growth
and the end of Al-Si Eutectic growth region as shown in Figure 136 in Appendix A, the
TαDEN
G was found to be increased with a decrease in the TAlSi
E,G. Lastly, as shown in
Figures 140 and 144 in Appendix A, when pressure was applied from the start of α-Al
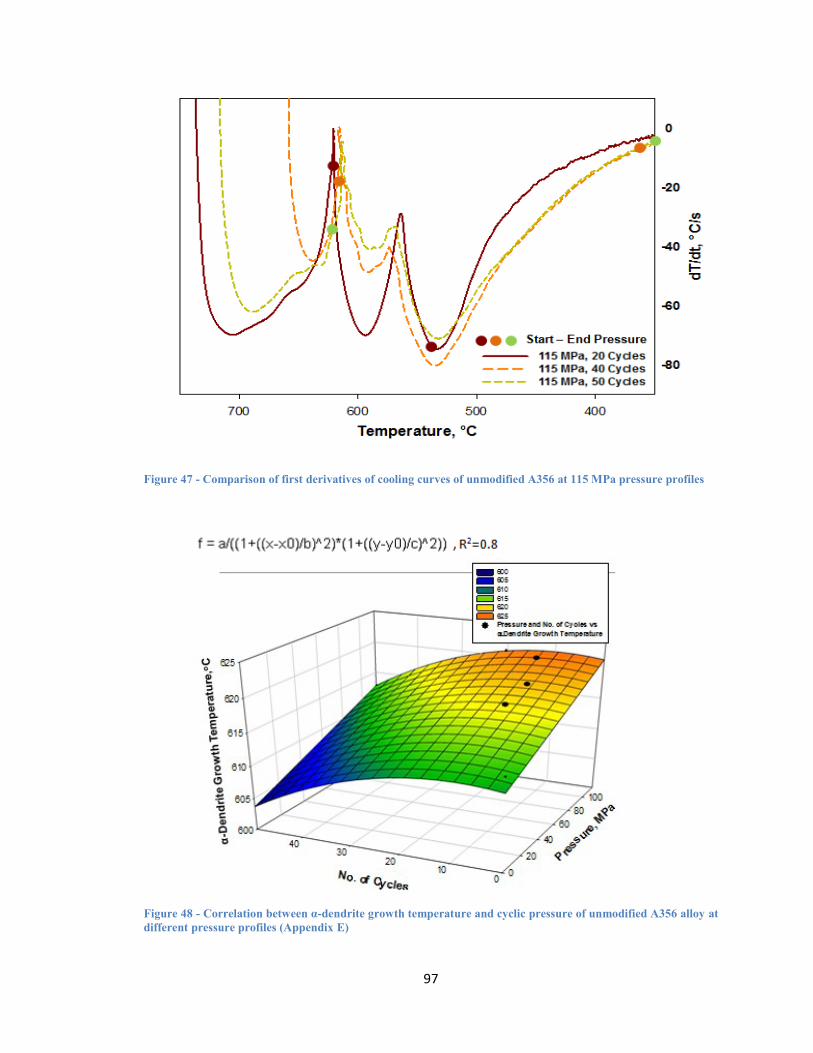
97
Figure 47 - Comparison of first derivatives of cooling curves of unmodified A356 at 115 MPa pressure profiles
Figure 48 - Correlation between α-dendrite growth temperature and cyclic pressure of unmodified A356 alloy at
different pressure profiles (Appendix E)
98
Dendrite Growth and beyond the end of Al-Si Eutectic growth region, the TαDEN
G was
found to be decreased with increasing of TAlSi
E,G. Most importantly, the behavior of the
alloy, as relating to those changes on the transformation temperatures appear to have a
significant impact on the silicon modification that will be discussed in a later section.
The apparent Solidification Temperature (TS) was found to increase inconsistently with
the increase of pressure in the range of 50-90 MPa and for increasing number of cycles
from 1-10. However, at 115 MPa pressure, TS reduced substantially to 532ᵒC for
increasing number of cycles up to 50. The total time of solidification range has been
abruptly reduced from 11.2 s at atmospheric pressure to 2.2 s at 115 MPa pressure for 20
numbers of cycles
4.3.2. Changes in the Internal Energy of the 356 Alloy System
Energy input by the servo hydraulic ram can be expressed as the product of load and
stroke. During the squeeze casting experiments, the movement of the plunger and the
increase in load or pressure as applied on the solidifying melt, added thermal energy to
the melt system. For instance, Fig. 49 shows in red the load- stroke curve during the
pressure load cycling. The enclosed area (integral of pressure and stroke difference) in
green is the total energy imparted by the movement and load of the plunger. Hence the
internal energy of the melt system was increased. As can be seen in Table 16 and Fig. 50,
the cumulative energy increased from 8.6 J to 67.5 J after increasing squeeze pressure
from 50 MPa to 115 MPa for increasing number of pressure cycles of 1-50. Basically
applied pressure has been converted into thermal energy and has increased the overall

99
internal energy of the melt system, which is responsible for all thermal and metallurgical
changes in the alloy.
Figure 49 – Cumulative energy of unmodified A356 alloy under 115 MPa with 20 pressure cycles.
4.3.3. Changes in the Solidification Rate of Unmodified A356 Alloy
Generally SR increases with cyclic pressure. When the melt was solidified in the SC
UMSA Platform at atmospheric pressure, the SR was only 6.5ᵒC/s. However, when the
melt was solidified at high pressure of 50 MPa, the SR increased to 23.2ᵒC/s. With the
further increment of pressure from 55 MPa to 115 MPa, the SR increased up to maximum
of 40.1ᵒC/s. Fig. 51 shows that solidification rate is varied with the cumulative energy.
As cumulative energy increased the solidification rate increased to some extent and one
would expect a corresponding effect on the microstructural changes. As can be seen from
Fig. 52, SDAS or dendrite cell size has been reduced to a great extend as SR is increased.

100
When SR was 6.5ᵒC/s, the dendrite cell size was 23.8 µm. However, it drastically
changed to 8.1 µm, when SR increased to 40.1ᵒC/s. Similarly, most of the finest dendrite
cells were observed in the range of SR 30-40ᵒC/s.
Figure 50 - Correlation between cumulative energy and cyclic pressure of unmodified A356 alloy at different
pressure profiles (Appendix F)
Figure 51 - Correlation between solidification rate and cyclic pressure of unmodified A356 alloy at different
pressure profiles.
2D Graph 2
Cumulative Enegy, J
0 20 40 60 80
Avera
ge S
olid
ific
ation R
ate
, °C
/s
0
10
20
30
40
50
Energy, J vs SR, C/s
R2=0.9
7

101
Figure 52 - Correlation between SDAS or dendrite cell size and average solidification rate of unmodified A356
alloy at different pressure profiles.
4.4. Effect of Cyclic Pressure on the Sr Modified A356 Alloy
in SC UMSA Platform
4.4.1. Changes in the Thermal Characteristics of Sr Modified Alloy
As can be seen in Table 17 as well as observed in Figures 53-54 and Figures 146-163 in
Appendix B, the cyclic pressure didn’t change the α--Al Dendrite Growth Temperature
(TαDEN
G) much while it has great impact on the Al-Si Eutectic Growth temperature (TAlSi
E,G) in Sr modified A356 alloy. The α-Al Dendrite Growth Temperature (TαDEN
G) at
atmospheric pressure has been found decreased from 613.9ᵒC (unmodified) to 612.3ᵒC
after modifying with Sr, which is a general characteristic trend for unmodified and Sr
modified A356 alloy proven from the literature. Interestingly TαDEN
G was decreased
further to 610ᵒC after applying pressure of 100 MPa for single cycle and then it increased
to 613.9ᵒC at 100 MPa applied pressure for 10 numbers of cycles. It increased further
with increasing the pressure to 115 MPa for a pressure cycles of 7.
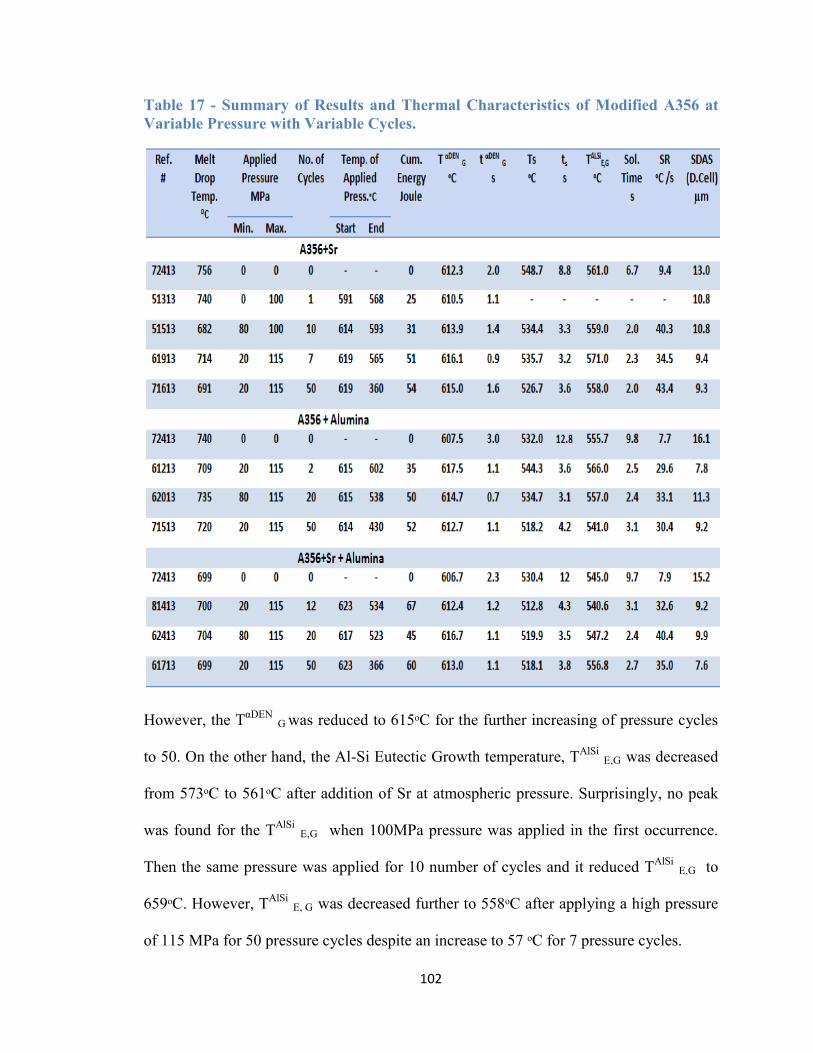
102
Table 17 - Summary of Results and Thermal Characteristics of Modified A356 at
Variable Pressure with Variable Cycles.
However, the TαDEN
G was reduced to 615ᵒC for the further increasing of pressure cycles
to 50. On the other hand, the Al-Si Eutectic Growth temperature, TAlSi
E,G was decreased
from 573ᵒC to 561ᵒC after addition of Sr at atmospheric pressure. Surprisingly, no peak
was found for the TAlSi
E,G when 100MPa pressure was applied in the first occurrence.
Then the same pressure was applied for 10 number of cycles and it reduced TAlSi
E,G to
659ᵒC. However, TAlSi
E, G was decreased further to 558ᵒC after applying a high pressure
of 115 MPa for 50 pressure cycles despite an increase to 57 ᵒC for 7 pressure cycles.

103
Some underlying information has been revealed from the above experiments. The
tendency of those increases and decreases in the TαDEN
G and TAlSi
E, G were found to be
varied based on the start and end of pressure applied region.
Figure 53 - Cooling curves of Sr modified A356 at variable pressure with variable cycles.
Figure 54 - First derivatives of cooling curves of Sr modified A356 at variable pressure with variable cycles.

104
In the first occurrence as shown in Figures 150 in Appendix B, pressure was applied at
586ᵒC and ended at 565ᵒC in the region between the start of nucleation of Al-Si Eutectic
and the end of Al-Si Eutectic growth. This incident had a great impact on the
transformation temperature. Surprisingly no peak was found for the TAlSi
E,G while the
TαDEN
G decreased to 610ᵒC.
By contrast, when the pressure was applied between the start and end point of α-Al
Dendrite Growth region as shown in Figure 154 in Appendix B, both the TαDEN
G and the
TAlSi
E,G were found to be increased simultaneously. On the contrary, as can be seen in
Figure 158, when pressure was applied between the nucleation of α-Al Dendrite and the
nucleation of Al-Si Eutectic region, the both TαDEN
G and TAlSi
E,G were found to be
increased again. Lastly, as shown in Figure 162, when pressure was applied at the
nucleation of α-Al Dendrite and beyond the end of Al-Si Eutectic growth region, the
TαDEN
G and TAlSi
E,G were both decreased. Most importantly, these behaviors of alloy
relating to those changes on the transformation temperatures appeared to have a great
impact on the silicon modification that will be discussed in section 4.7.
On the other side, the apparent Solidification Temperature (TS) have been decreased for
the variable pressure cycles at the pressure range of 100-115 MPa. The total time of
solidification range has also been reduced from 6.7 s at atmospheric pressure to 2 s at
max. 115 MPa pressure for 50 numbers of cycles.
4.4.2. Changes in the Solidification Rate of Sr Modified Alloy
Solidification rate has been increased from 6.5ᵒC/s to 9.4ᵒC/s at atmospheric pressure in
unmodified alloy to Sr modified alloy. Since the Al-Si eutectic growth and solidification

105
peak temperature were unable to be identified after applying pressure of 100 MPa for a
single cycle, solidification rate was unable to be calculated for this pressure. By contrast,
SR was found to be 40.3ᵒC/s at the same pressure level for 10 pressure cycles. SR has
been further increased to 43.4ᵒC/s at 115 MPa for 50 pressure cycles.
4.5. Effect of Cyclic Pressure on the Nano Alumina Modified
A356 Alloys in the SC UMSA Platform
4.5.1 Changes in the Thermal Characteristics of Nano Alumina
Modified A356 Alloy
As can be seen from Table 16-17 as well as Figures 55-56 and Figures 164-177 in
Appendix C, the addition of Nano alumina to A356 alloy decreased the TαDEN
G from
613.9ᵒC to 607.5ᵒC at atmospheric pressure and it increased to 617.5ᵒC at 115 MPa for 2
pressure cycles and then it reduced to 614.7ᵒC and 612.7ᵒC after increasing the number of
pressure cycles from 20 to 50 respectively keeping the level of pressure same as max. 115
MPa. Similarly the TAlSi
E,G decreased from 573ᵒC to 555.7ᵒC after addition of Nano
alumina at atmospheric pressure and then it increased to 566ᵒC at 115 MPa for 2 pressure
cycles. However, it decreased again for increasing number of cycles from 20 to 50 at the
same level of pressure.
On the other hand, the apparent Ts decreased from 540ᵒC to 532ᵒC at atmospheric
pressure with the modification of Nano alumina and then increased to 544.3ᵒC at 115
MPa for 2 pressure cycles and decreased again to 534ᵒC and 518ᵒC with the increase of
pressure cycles from 20-50. Conversely, SR increased from 7.7ᵒC/s at atmospheric
pressure to 29.1ᵒC/s at 115 MPa for 2 pressure cycles and then increased to 33.1ᵒC/s after
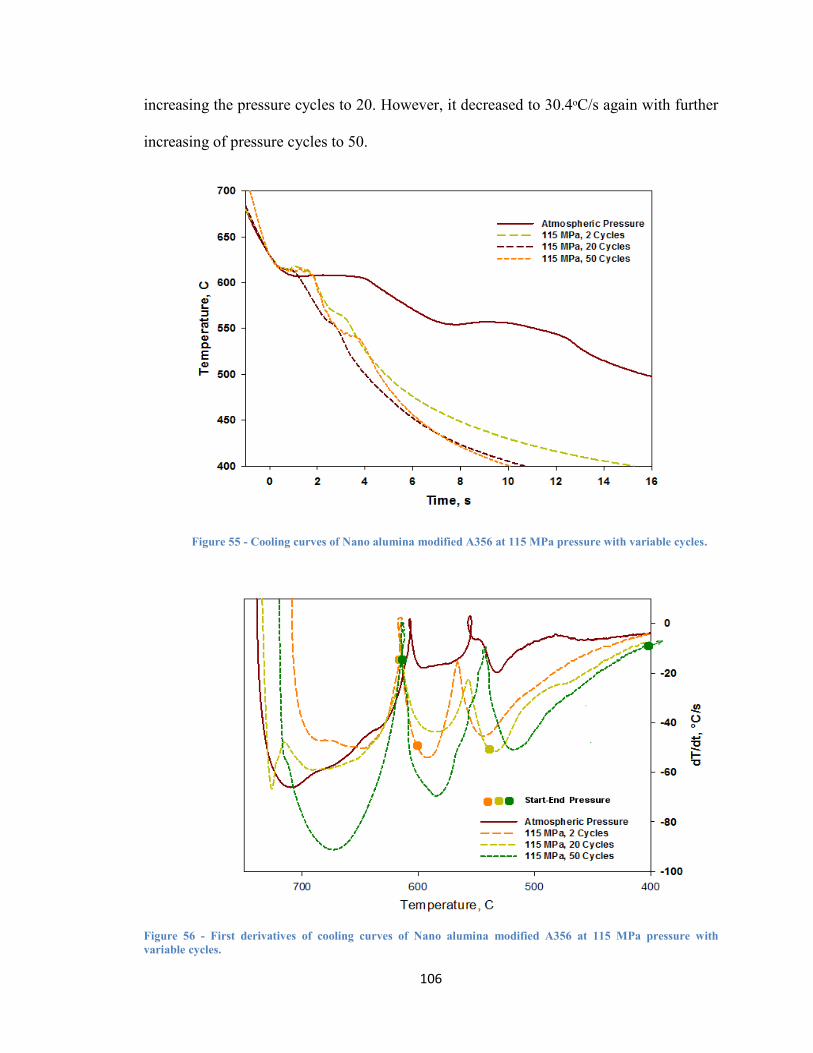
106
increasing the pressure cycles to 20. However, it decreased to 30.4ᵒC/s again with further
increasing of pressure cycles to 50.
Figure 55 - Cooling curves of Nano alumina modified A356 at 115 MPa pressure with variable cycles.
Figure 56 - First derivatives of cooling curves of Nano alumina modified A356 at 115 MPa pressure with
variable cycles.

107
4.6. Effect of Cyclic Pressure on the Sr and Nano Alumina
Combined Modified A356 Alloy in the SC UMSA Platform
4.6.1. Changes in the Thermal Characteristics of Strontium & Nano
Alumina Combined Modified A356 Alloy
As can seen in Figures 57-58, the α--Al Dendrite Growth Temperature (TαDEN
G) was not
much affected by the cyclic pressure while the Al-Si Eutectic Growth temperature (TAlSi
E,G) was abruptly shifted 16ᵒC higher temperature, in the Sr and Nano Alumina combined
modified A356 alloy.
Figure 57 - Cooling curves of Sr & Nano alumina modified A356 alloy at 115 MPa pressure with variable cycles.
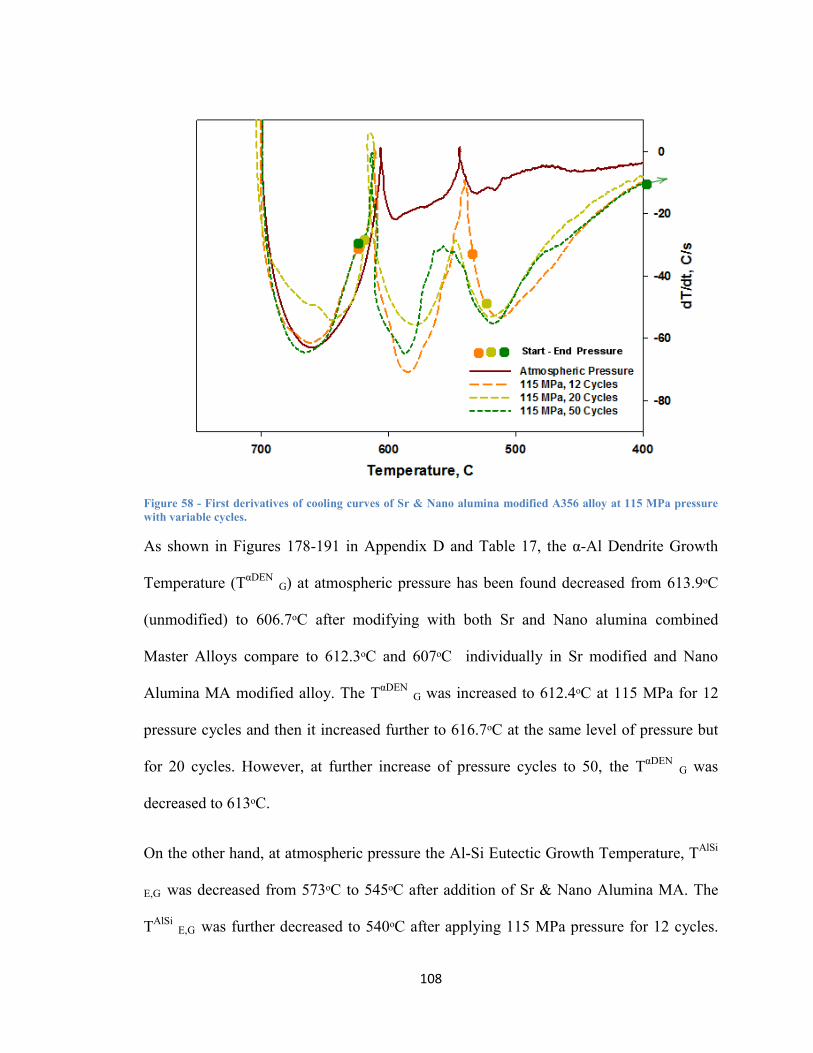
108
Figure 58 - First derivatives of cooling curves of Sr & Nano alumina modified A356 alloy at 115 MPa pressure
with variable cycles.
As shown in Figures 178-191 in Appendix D and Table 17, the α-Al Dendrite Growth
Temperature (TαDEN
G) at atmospheric pressure has been found decreased from 613.9ᵒC
(unmodified) to 606.7ᵒC after modifying with both Sr and Nano alumina combined
Master Alloys compare to 612.3ᵒC and 607ᵒC individually in Sr modified and Nano
Alumina MA modified alloy. The TαDEN
G was increased to 612.4ᵒC at 115 MPa for 12
pressure cycles and then it increased further to 616.7ᵒC at the same level of pressure but
for 20 cycles. However, at further increase of pressure cycles to 50, the TαDEN
G was
decreased to 613ᵒC.
On the other hand, at atmospheric pressure the Al-Si Eutectic Growth Temperature, TAlSi
E,G was decreased from 573ᵒC to 545ᵒC after addition of Sr & Nano Alumina MA. The
TAlSi
E,G was further decreased to 540ᵒC after applying 115 MPa pressure for 12 cycles.

109
However, at the same level of pressure, it has been increased to 547.2ᵒC and 556.8ᵒC at
20 and 50 pressure cycles respectively.
Pressure has also an effect on the apparent solidus temperature as it was substantially
reduced from 530ᵒC at atmospheric pressure to 512.8ᵒC at 115 MPa pressure for 12
cycles. However, it increased to 519.9ᵒC and 518.1ᵒC at the same level of pressure when
pressure cycles were increased to 20 and 50 respectively.
The Solidification Rate was drastically increased from 7.9ᵒC/s at atmospheric pressure to
40.4ᵒC/s at 115 MPa with a variation with respect to number of pressure cycles.
Surprisingly, pressure has a great effect on the cumulative energy that increases up to 67
Joule at 115 MPa pressure compare to Sr or NAM modified alloy individually.
4.7. Microstructural Analysis
The LOM micrographs are primarily used to identify the main phases and measurement
of dendrite cell size or secondary dendrite arm spacing (SDAS). The SEM micrographs
are used to see those phases in high resolution and to confirm the LOM findings. SEM
micrographs are also used to do EDS analysis and calculations of the volume of those
main phases. The main phases are identified as primary α-Al dendrite and Al-Si eutectic
phase. The intermetallic phases are Fe or Mg rich phases. A very small fraction of Mg2Si
phase appeared. Two types of Fe phases were found, namely script type and plate type
phases. The script type phases could have been π or α-AlFeSi. However, the presence of
magnesium in almost all of the particles examined in SEM/EDS analysis showed that
they are a π-AlSiMgFe phase. The plate type Fe phase is most likely to be β-phase of

110
AlFeSi. But SEM/EDS analysis confirmed that it is π-AlSiMgFe phase as well. In almost
all microstructures, all of those phases are commonly found, although the morphology of
those phases is varied with respect to various pressure profiles. A few MgO, SiO2 oxide
phases have also been found in some microstructures. The α-Al dendrite is the first phase
that solidified followed by AlSiMgFe and Al-Si eutectic phase. Eutectic Si and
AlSiMgFe eutectic phases are solidified in the interdendritic region.
4.7.1. Microstructural Analysis of the Unmodified A356 Alloy
Cyclic pressure application have significantly affected the eutectic Si and dendrite cell
size or dendrite arm spacing (SDAS) without the addition of any chemical modifiers or
grain refiners. In some squeeze casting experiments, eutectic Si was modified so ultra
finely that it was impossible to do image analysis of those modified microstructure even
at 1000x of LOM micrographs. Compare to acicular type Si (dia. 2-3 µm) formed at
atmospheric pressure (Figures 59-60), eutectic Si were transformed into a combination of
acicular and lamellar structure at 50 MPa (Fig. 61) with a dia. of 0.8-1.0 µm. At an
increasing pressure, the eutectic Si modified into ultra fine fibrous Si dendrite at 55-60
MPa pressure for 10 pressure cycles (Figures 63-64) that achieved a Si dia. between 0.5-
0.6 µm. By contrast, Si remains in acicular shape (dia. 1-3 µm) at 80-90 MPa for 10
pressure cycles (Figures 65-66) though the length of acicular Si is comparatively reduced
at these high pressure ranges. At high pressure like 115 MPa, Si modification behaved
differently for different numbers of pressure cycles. At 115 MPa for 20 cycles, the
eutectic Si fully converted into a ultra fine fibrous Si (dia. 0.15-0.25 µm) dendritic
structure (Fig. 67), which is confirmed by SEM micrographs (Fig.68) of a deep etched
sample ( etching done by 10% NaOH solution). However, Si didn’t show much

111
modification after increasing the number of cycles in the range of 40-50 as shown in
Figures 69-72, and the Si dia. observed was 1.0-1.5 µm
Figure 59 - LOM Microstructure of UM A356 alloy (Ref. # 31513) solidified in SC die at atmospheric pressure
a) Morphology of α-Al Dendrite and Al-Si eutectics, dendrite cell size 23.8 µm b) Main phases are identified ,
acicular eutectic Si.
Figure 60 - SEM Microstructure of UM A356 alloy (Ref. # 31513) solidified in SC die at atmospheric pressure a)
Morphology of α-Al Dendrite, Si eutectics, AlSiMgFe size is 30x2 µm b) eutectic Si and α-Al in deep etched
sample, , Si size 40x1 µm.
On the other hand, as shown in Fig. 62, the secondary dendrite arm spacing (SDAS) or
dendrite cell size has been reduced substantially with the increasing cyclic pressure
during solidification. It is found that the dendrite cell size has been reduced from 24 µm
a) 200x b) 1000x
a) Etched sample 3000x a) Polished sample 800x
Eutectic Si
α-Al
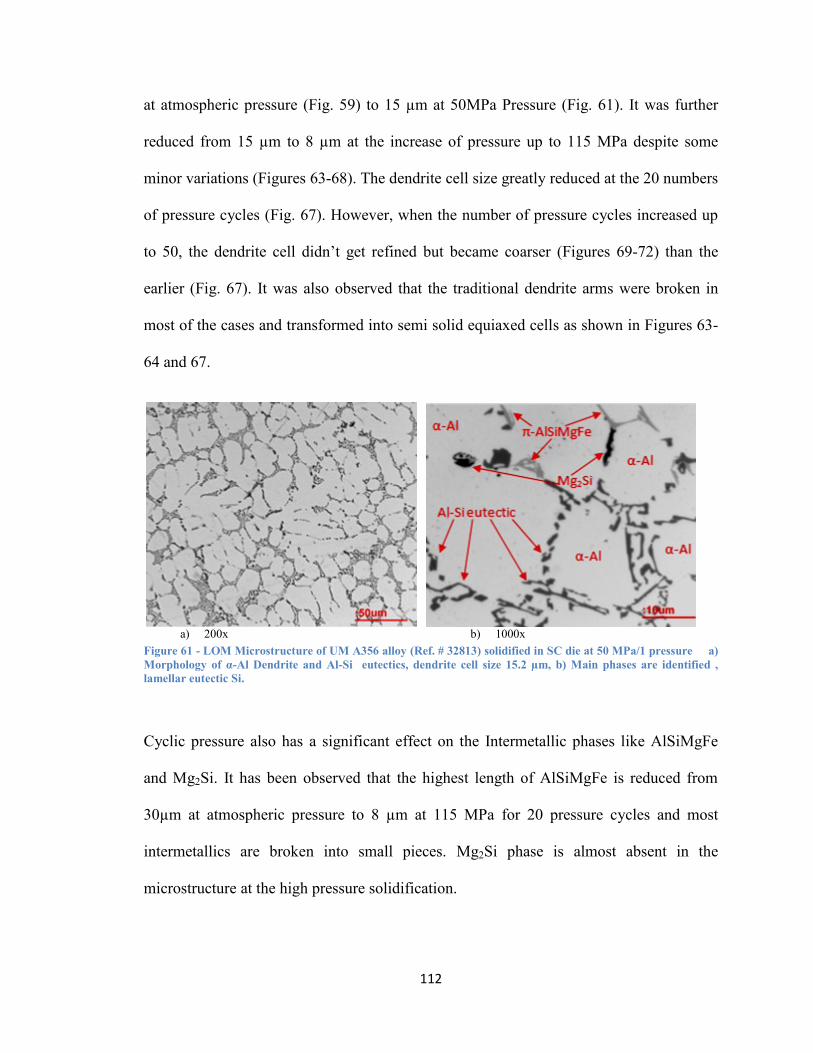
112
at atmospheric pressure (Fig. 59) to 15 µm at 50MPa Pressure (Fig. 61). It was further
reduced from 15 µm to 8 µm at the increase of pressure up to 115 MPa despite some
minor variations (Figures 63-68). The dendrite cell size greatly reduced at the 20 numbers
of pressure cycles (Fig. 67). However, when the number of pressure cycles increased up
to 50, the dendrite cell didn’t get refined but became coarser (Figures 69-72) than the
earlier (Fig. 67). It was also observed that the traditional dendrite arms were broken in
most of the cases and transformed into semi solid equiaxed cells as shown in Figures 63-
64 and 67.
Figure 61 - LOM Microstructure of UM A356 alloy (Ref. # 32813) solidified in SC die at 50 MPa/1 pressure a)
Morphology of α-Al Dendrite and Al-Si eutectics, dendrite cell size 15.2 µm, b) Main phases are identified ,
lamellar eutectic Si.
Cyclic pressure also has a significant effect on the Intermetallic phases like AlSiMgFe
and Mg2Si. It has been observed that the highest length of AlSiMgFe is reduced from
30µm at atmospheric pressure to 8 µm at 115 MPa for 20 pressure cycles and most
intermetallics are broken into small pieces. Mg2Si phase is almost absent in the
microstructure at the high pressure solidification.
a) 200x b) 1000x

113
Figure 62 – Average SDAS or Dendrite Cell Size relationship with Pressure.
In this investigation, two levels of pressure profiles, 10 cycles @ 50 MPa and 20 cycles
@ 115 MPa, were found to have successfully modified the eutectic Si and to refine the
dendrite cell size. A good correlation was found between the thermal analysis and the
microstructural characterization and the mode of pressure application in those test
samples. Details will be discussed in section 4.9.
Figure 63 - LOM Microstructure of UM A356 alloy(Ref. # 40113) solidified in SC die at 55 MPa/10 pressure
a) Morphology of α-Al cells and Al-Si eutectics, dendrite cell size 11.3 µm, b) Fibrous eutectic Si.
2D Graph 1
Applied Pressure, MPa
0 20 40 60 80 100 120 140
Avera
ge
SD
AS
or,
Den
dri
te C
ell S
ize
, m
5
10
15
20
25
30
PRESS vs SDAS
a) 200x b) 1000x

114
Figure 64 - LOM Microstructure of UM A356 alloy (Ref. # 40213) solidified in SC die at 60 MPa/10 pressure,
a) Morphology of α-Al cells and Al-Si eutectics, dendrite cell size 9.9 µm, b) Fibrous eutectic Si.
Figure 65 - LOM Microstructure of UM A356 alloy (Ref. # 41913) solidified in SC die at 80 MPa/10 pressure
a) Morphology of α-Al Dendrite and Al-Si eutectics, dendrite cell size 11.9 µm, b) Acicular eutectic Si.
Figure 66 - LOM Microstructure of UM A356 alloy (Ref. # 41713) solidified in SC die at 90 MPa/10 pressure
a) Morphology of α-Al Dendrite and Al-Si eutectics, dendrite cell size 12.5 µm, b) Acicular eutectic Si.
b) 200x
b) 1000x a) 200x
a) 1000x
c) 1000x a) 200x
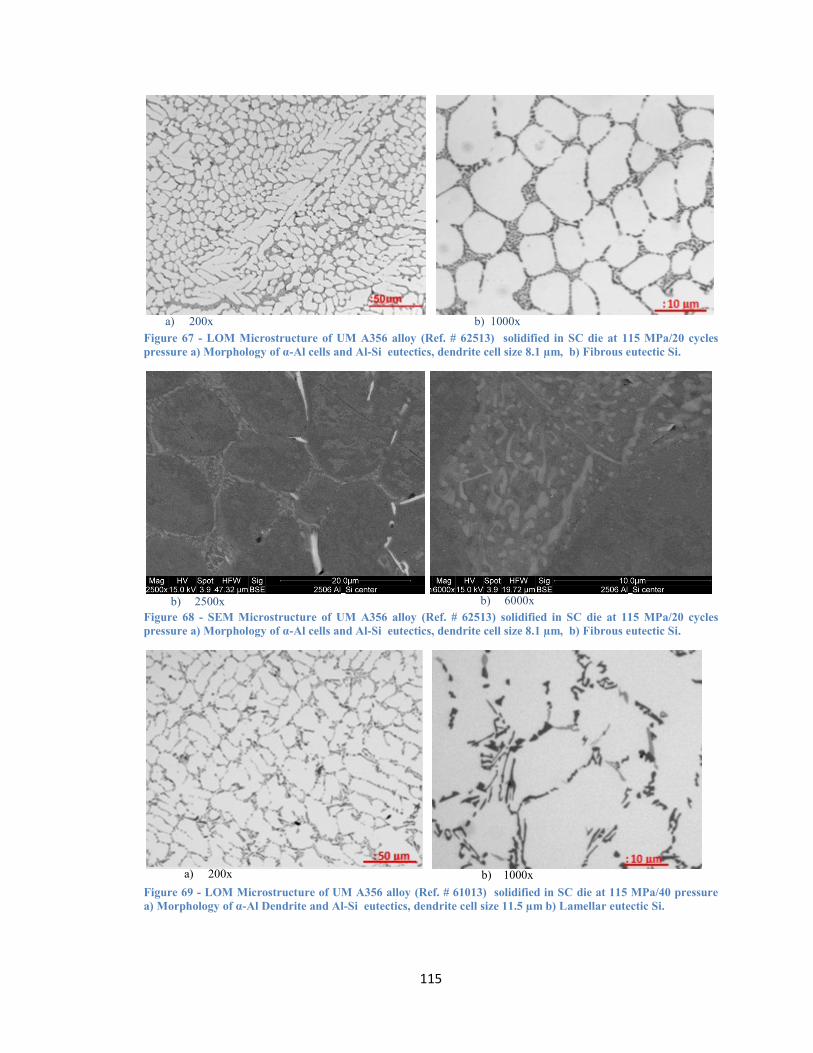
115
Figure 67 - LOM Microstructure of UM A356 alloy (Ref. # 62513) solidified in SC die at 115 MPa/20 cycles
pressure a) Morphology of α-Al cells and Al-Si eutectics, dendrite cell size 8.1 µm, b) Fibrous eutectic Si.
Figure 68 - SEM Microstructure of UM A356 alloy (Ref. # 62513) solidified in SC die at 115 MPa/20 cycles
pressure a) Morphology of α-Al cells and Al-Si eutectics, dendrite cell size 8.1 µm, b) Fibrous eutectic Si.
Figure 69 - LOM Microstructure of UM A356 alloy (Ref. # 61013) solidified in SC die at 115 MPa/40 pressure
a) Morphology of α-Al Dendrite and Al-Si eutectics, dendrite cell size 11.5 µm b) Lamellar eutectic Si.
a) 200x b) 1000x
a) 200x b) 1000x
b) 2500x b) 6000x

116
Figure 70 - LOM Microstructure of UM A356 alloy (Ref. # 61213A) solidified in SC die at 115 MPa/50 pressure
a) Morphology of α-Al Dendrite and Al-Si eutectics, dendrite cell size 10.9 µm b) Lamellar eutectic Si.
Figure 71 - SEM Microstructure of UM A356 alloy solidified in SC die at 115 MPa, α-Al and Al-Si eutectics in
deep etched sample, acicular eutectic Si, a) at 40 cycles (Ref. # 61013) b) at 50 cycles pressure (Ref. # 61213A).
4.7.1.1. SEM/EDS Analysis of Unmodified A356 Alloy*
Out of the eight unmodified test samples, one best sample (Ref. # 62513, 20 cycles @
115 MPa) was selected for SEM/EDS analysis in an "as polished" condition. Four
distinct phases were identified namely α-Al, Eutctic Al, Eutectic Si and AlSiMgFe
intermetallic phases through EDS/SEM analysis. Their compositions were deconvoluted
and phase distribution quantities were determined and results are tabulated in Table 18
and summarized as below:
a) 200x b) 1000x
*This work was done in collaboration with Dr. Adam Gesing.
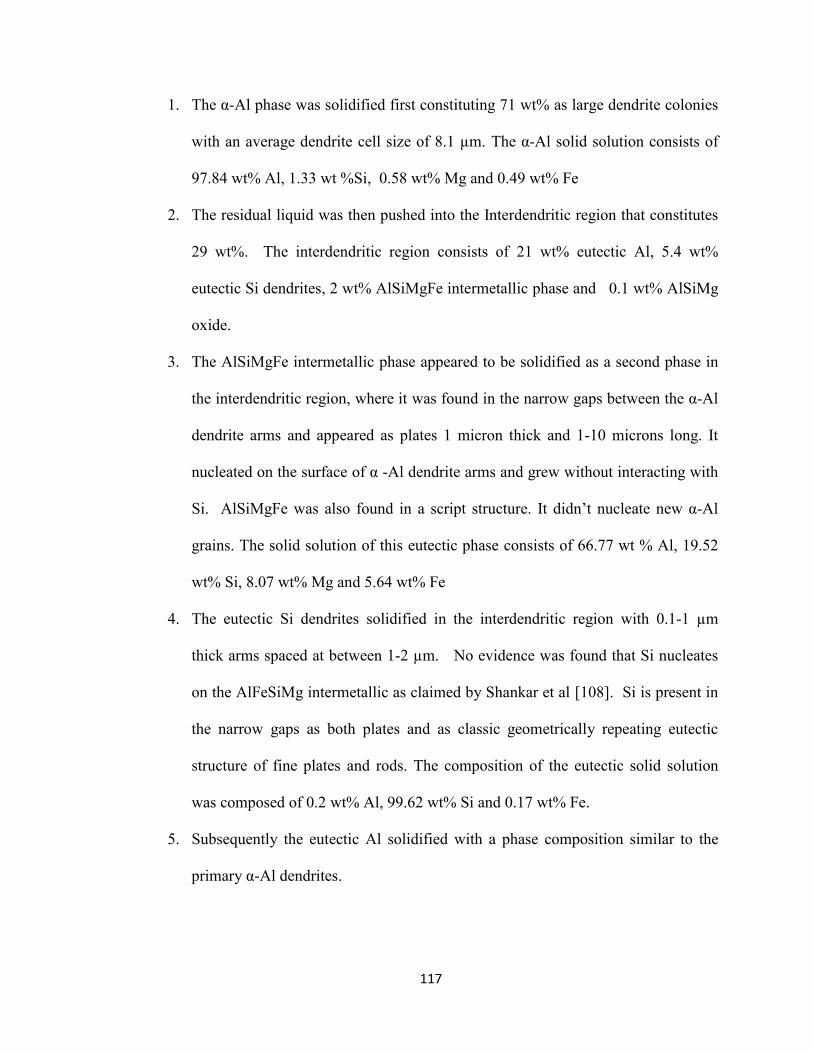
117
1. The α-Al phase was solidified first constituting 71 wt% as large dendrite colonies
with an average dendrite cell size of 8.1 µm. The α-Al solid solution consists of
97.84 wt% Al, 1.33 wt %Si, 0.58 wt% Mg and 0.49 wt% Fe
2. The residual liquid was then pushed into the Interdendritic region that constitutes
29 wt%. The interdendritic region consists of 21 wt% eutectic Al, 5.4 wt%
eutectic Si dendrites, 2 wt% AlSiMgFe intermetallic phase and 0.1 wt% AlSiMg
oxide.
3. The AlSiMgFe intermetallic phase appeared to be solidified as a second phase in
the interdendritic region, where it was found in the narrow gaps between the α-Al
dendrite arms and appeared as plates 1 micron thick and 1-10 microns long. It
nucleated on the surface of α -Al dendrite arms and grew without interacting with
Si. AlSiMgFe was also found in a script structure. It didn’t nucleate new α-Al
grains. The solid solution of this eutectic phase consists of 66.77 wt % Al, 19.52
wt% Si, 8.07 wt% Mg and 5.64 wt% Fe
4. The eutectic Si dendrites solidified in the interdendritic region with 0.1-1 µm
thick arms spaced at between 1-2 µm. No evidence was found that Si nucleates
on the AlFeSiMg intermetallic as claimed by Shankar et al [108]. Si is present in
the narrow gaps as both plates and as classic geometrically repeating eutectic
structure of fine plates and rods. The composition of the eutectic solid solution
was composed of 0.2 wt% Al, 99.62 wt% Si and 0.17 wt% Fe.
5. Subsequently the eutectic Al solidified with a phase composition similar to the
primary α-Al dendrites.
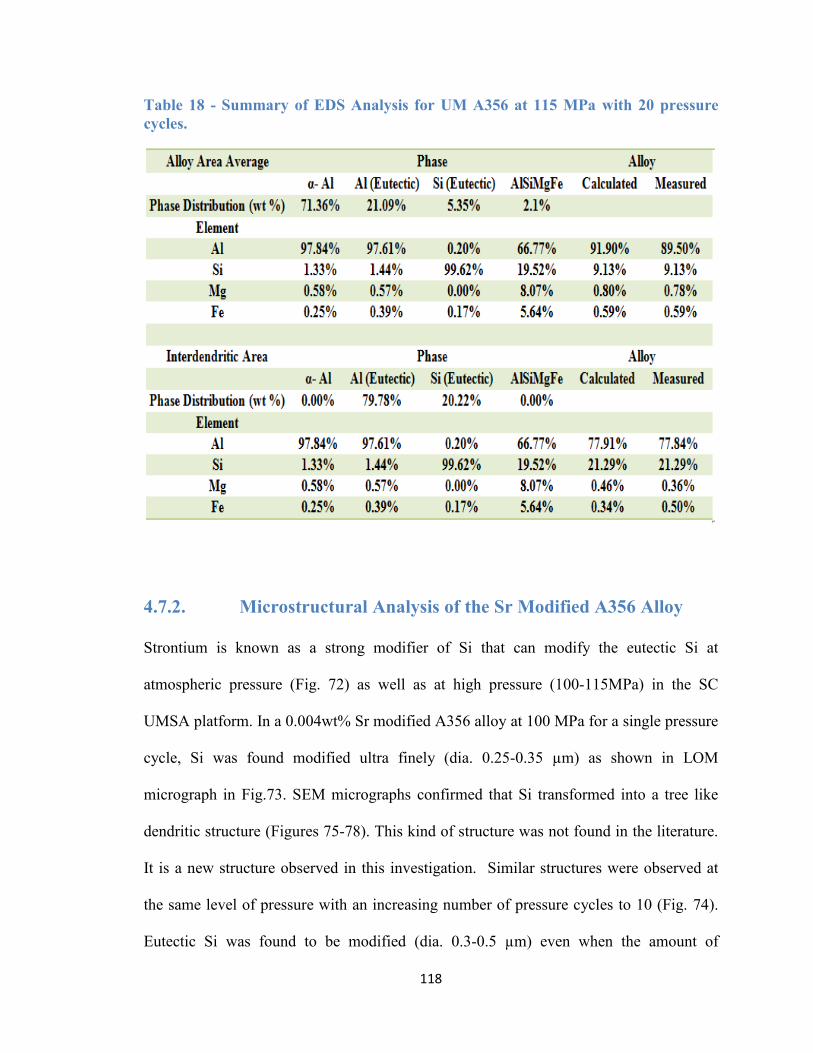
118
Table 18 - Summary of EDS Analysis for UM A356 at 115 MPa with 20 pressure
cycles.
4.7.2. Microstructural Analysis of the Sr Modified A356 Alloy
Strontium is known as a strong modifier of Si that can modify the eutectic Si at
atmospheric pressure (Fig. 72) as well as at high pressure (100-115MPa) in the SC
UMSA platform. In a 0.004wt% Sr modified A356 alloy at 100 MPa for a single pressure
cycle, Si was found modified ultra finely (dia. 0.25-0.35 µm) as shown in LOM
micrograph in Fig.73. SEM micrographs confirmed that Si transformed into a tree like
dendritic structure (Figures 75-78). This kind of structure was not found in the literature.
It is a new structure observed in this investigation. Similar structures were observed at
the same level of pressure with an increasing number of pressure cycles to 10 (Fig. 74).
Eutectic Si was found to be modified (dia. 0.3-0.5 µm) even when the amount of
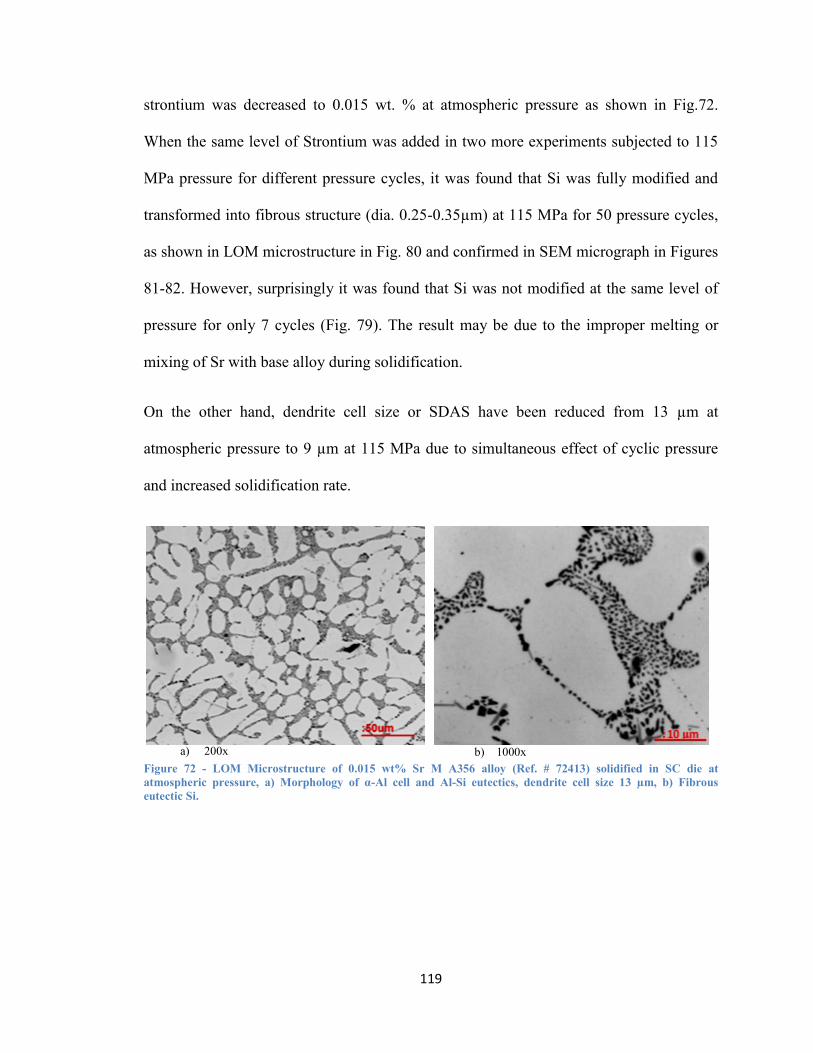
119
strontium was decreased to 0.015 wt. % at atmospheric pressure as shown in Fig.72.
When the same level of Strontium was added in two more experiments subjected to 115
MPa pressure for different pressure cycles, it was found that Si was fully modified and
transformed into fibrous structure (dia. 0.25-0.35µm) at 115 MPa for 50 pressure cycles,
as shown in LOM microstructure in Fig. 80 and confirmed in SEM micrograph in Figures
81-82. However, surprisingly it was found that Si was not modified at the same level of
pressure for only 7 cycles (Fig. 79). The result may be due to the improper melting or
mixing of Sr with base alloy during solidification.
On the other hand, dendrite cell size or SDAS have been reduced from 13 µm at
atmospheric pressure to 9 µm at 115 MPa due to simultaneous effect of cyclic pressure
and increased solidification rate.
Figure 72 - LOM Microstructure of 0.015 wt% Sr M A356 alloy (Ref. # 72413) solidified in SC die at
atmospheric pressure, a) Morphology of α-Al cell and Al-Si eutectics, dendrite cell size 13 µm, b) Fibrous
eutectic Si.
a) 200x b) 1000x
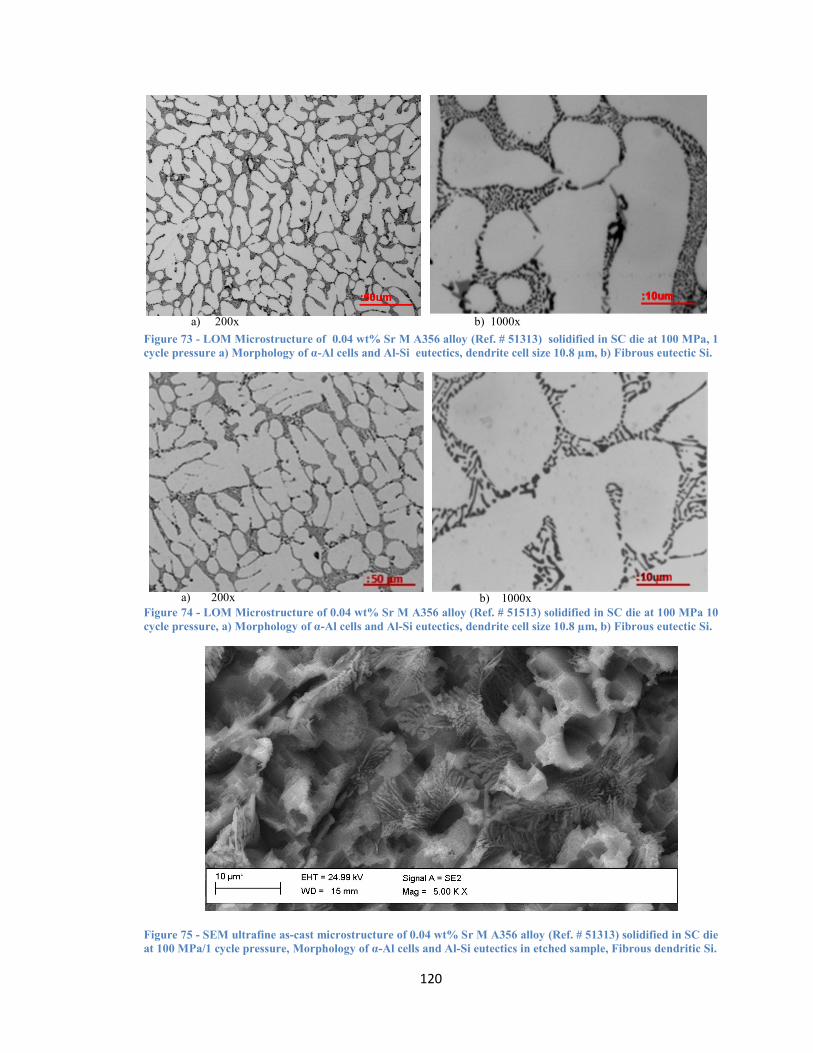
120
Figure 73 - LOM Microstructure of 0.04 wt% Sr M A356 alloy (Ref. # 51313) solidified in SC die at 100 MPa, 1
cycle pressure a) Morphology of α-Al cells and Al-Si eutectics, dendrite cell size 10.8 µm, b) Fibrous eutectic Si.
Figure 74 - LOM Microstructure of 0.04 wt% Sr M A356 alloy (Ref. # 51513) solidified in SC die at 100 MPa 10
cycle pressure, a) Morphology of α-Al cells and Al-Si eutectics, dendrite cell size 10.8 µm, b) Fibrous eutectic Si.
Figure 75 - SEM ultrafine as-cast microstructure of 0.04 wt% Sr M A356 alloy (Ref. # 51313) solidified in SC die
at 100 MPa/1 cycle pressure, Morphology of α-Al cells and Al-Si eutectics in etched sample, Fibrous dendritic Si.
a) 200x b) 1000x
a) 200x b) 1000x

121
Figure 76 - SEM ultrafine as-cast microstructure of 0.04 wt% Sr M A356 alloy (Ref. # 51313) solidified in SC
die at 100 MPa/1 cycle pressure, Morphology of α-Al cells and Al-Si eutectics in etched sample, Fibrous
dendritic Si.
Figure 77 – SEM ultrafine as-cast microstructure of 0.04 wt% Sr M A356 alloy (Ref. # 51313) solidified in SC
die at 100 MPa/1 cycle pressure, Morphology of α-Al cells and Al-Si eutectics in etched sample, Fibrous
dendritic Si.
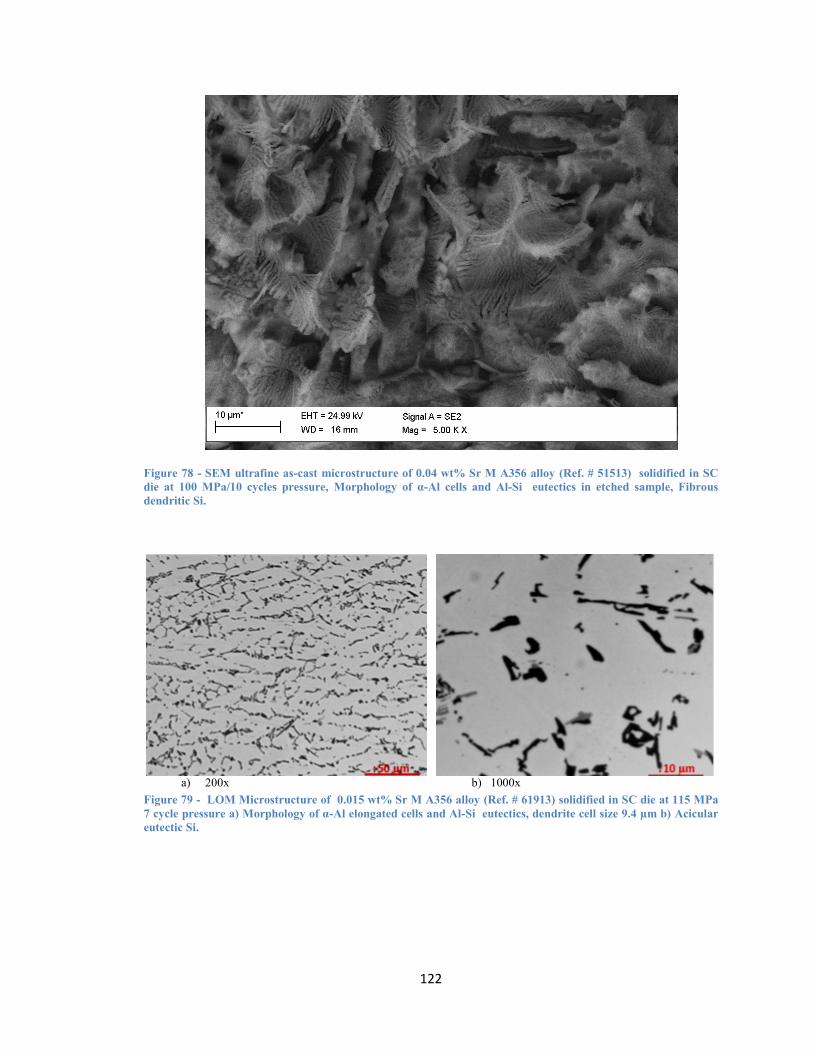
122
Figure 78 - SEM ultrafine as-cast microstructure of 0.04 wt% Sr M A356 alloy (Ref. # 51513) solidified in SC
die at 100 MPa/10 cycles pressure, Morphology of α-Al cells and Al-Si eutectics in etched sample, Fibrous
dendritic Si.
Figure 79 - LOM Microstructure of 0.015 wt% Sr M A356 alloy (Ref. # 61913) solidified in SC die at 115 MPa
7 cycle pressure a) Morphology of α-Al elongated cells and Al-Si eutectics, dendrite cell size 9.4 µm b) Acicular
eutectic Si.
a) 200x b) 1000x

123
Figure 80 - LOM Microstructure of 0.015 wt% Sr M A356 alloy (Ref. # 71613) solidified in SC die at 115 MPa
50 cycles pressure a) Morphology of α-Al fragmented cells and Al-Si eutectics, dendrite cell size 9.3 µm b)
Fibrous eutectic Si.
Figure 81 - SEM Microstructure of 0.015 wt% Sr M A356 alloy (Ref. # 71613) solidified in SC die at 115
MPa/50 cycles pressure a) Morphology of α-Al cells and Al-Si eutectics in polished sample, Fibrous dendritic Si.
Figure 82 - SEM Microstructure of 0.015 wt% Sr M A356 alloy (Ref. # 71613) solidified in SC die at 115
MPa/50 cycles pressure a-b) Morphology of Si eutectics in etched sample, Fibrous dendritic Si.
b) 200x a) 1000x
a) 3000x
b) 6000x a) 10000x
b) 6000x
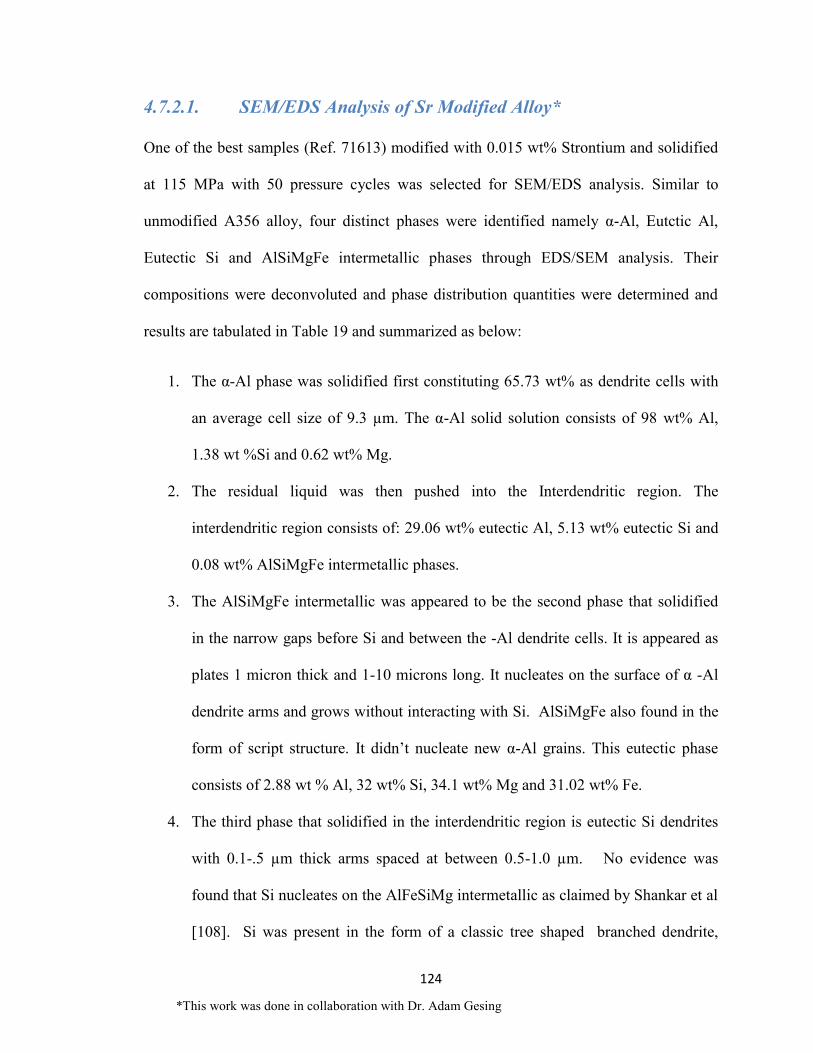
124
4.7.2.1. SEM/EDS Analysis of Sr Modified Alloy*
One of the best samples (Ref. 71613) modified with 0.015 wt% Strontium and solidified
at 115 MPa with 50 pressure cycles was selected for SEM/EDS analysis. Similar to
unmodified A356 alloy, four distinct phases were identified namely α-Al, Eutctic Al,
Eutectic Si and AlSiMgFe intermetallic phases through EDS/SEM analysis. Their
compositions were deconvoluted and phase distribution quantities were determined and
results are tabulated in Table 19 and summarized as below:
1. The α-Al phase was solidified first constituting 65.73 wt% as dendrite cells with
an average cell size of 9.3 µm. The α-Al solid solution consists of 98 wt% Al,
1.38 wt %Si and 0.62 wt% Mg.
2. The residual liquid was then pushed into the Interdendritic region. The
interdendritic region consists of: 29.06 wt% eutectic Al, 5.13 wt% eutectic Si and
0.08 wt% AlSiMgFe intermetallic phases.
3. The AlSiMgFe intermetallic was appeared to be the second phase that solidified
in the narrow gaps before Si and between the -Al dendrite cells. It is appeared as
plates 1 micron thick and 1-10 microns long. It nucleates on the surface of α -Al
dendrite arms and grows without interacting with Si. AlSiMgFe also found in the
form of script structure. It didn’t nucleate new α-Al grains. This eutectic phase
consists of 2.88 wt % Al, 32 wt% Si, 34.1 wt% Mg and 31.02 wt% Fe.
4. The third phase that solidified in the interdendritic region is eutectic Si dendrites
with 0.1-.5 µm thick arms spaced at between 0.5-1.0 µm. No evidence was
found that Si nucleates on the AlFeSiMg intermetallic as claimed by Shankar et al
[108]. Si was present in the form of a classic tree shaped branched dendrite,
*This work was done in collaboration with Dr. Adam Gesing

125
which indicated Si solidification occurred in the residual liquid rather than
simultaneous formation of Al-Si solid eutectic structure The composition of
eutectic solid solution of dendritic Si composed of 0.10 wt% Al, 99.86 wt% Si
and 0.04 wt% Mg.
5. Residual Al liquid solidified at the end in the interdendritic region. It has a phase
composition similar to the primary α-Al dendrites.
Table 19 - Summary of EDS Analysis for 0.015 wt% Sr M A356 at 115 MPa with 50
pressure cycles.
4.7.3. Microstructural Analysis of the Nano Alumina Modified
A356 Alloy
Apart from Al-Sr master alloy, in this investigation 1wt% Nano Alumina Master Alloy
was found to be a good Si modifier for A356 alloy as well as grain refiner. In almost all
micrographs, α-Al Dendrite cells converted to a semi dendritic structure. The LOM

126
micrographs (Figures 86-87) show a significant modification in Eutectic Si at 115 MPa
with some exceptions. Compare to atmospheric pressure samples (Fig. 83), Si showed
full modification at 115 MPa with increasing pressure cycles 20 and 50. The SEM
micrographs (Figures 88-89) confirmed that Si was converted to fibrous structure (Si. dia.
0.3-0.4 µm) with the presence of shrinkage cavity full of MgO. Details will be discussed
in EDS analysis section. However, no modification was observed at 2 pressure cycles
despite having the same pressure during solidification (Figures 84-85) due to unknown
reasons.
Figure 83 - LOM Microstructure of 1 wt% NAMA M A356 alloy (Ref. # 72413) solidified in SC die at
atmospheric pressure a) Morphology of α-Al cells and Al-Si eutectics, dendrite cell size 16.1 µm, b) Acicular
eutectic Si.
Figure 84 - LOM Microstructure of 1 wt% NAMA M A356 alloy (Ref. # 61213B) solidified in SC die at 115
MPa 2 cycles pressure a) Morphology of α-Al cells and Al-Si eutectics, dendrite cell size 7.8 µm, b) Acicular
eutectic Si.
a) 200x b) 1000x
a) 200x b) 1000x

127
Figure 85 - SEM Microstructure of 1 wt% NAMA M A356 alloy (Ref. # 61213B) solidified in SC die at 115 MPa
2 cycles pressure, Morphology of α-Al cells and Al-Si eutectics in an etched sample, acicular eutectic Si.
Figure 86 - LOM Microstructure of 1 wt% NAMA M A356 alloy (Ref. # 62013) solidified in SC die at 115 MPa
20 cycles pressure a) Morphology of fragmented and semi-solid α-Al dendrites and Al-Si eutectics, dendrite cell
size 11.3 µm, b) Fibrous eutectic Si.
Figure 87 - LOM Microstructure of 1 wt% NAMA M A356 alloy (Ref. # 71513) solidified in SC die at 115 MPa
50 cycles pressure a) Morphology of α-Al cells and Al-Si eutectics, dendrite cell size 9.2 µm b) Fibrous eutectic
Si.
a) 200x b) 1000x
a) 200x b) 1000x
a) 2000x b) 3000x

128
Figure 88 - SEM Microstructure of 1 wt% NAMA M A356 alloy (Ref. # 71513) solidified in SC die at 115 MPa
50 cycles pressure a) Morphology of α-Al Cells and Al-Si eutectics in polished sample, b) Ultrafine Si.
The dendrite cell size is reduced from 16 µm at atmospheric pressure to 9 µm at 115 MPa
with 50 pressure cycles and it refined to 8 µm with 2 pressure cycles (Fig.84). Most of
the dendrites converted into equiaxed and semi-solid morphology (Figures 87-88).
Figure 89 - SEM Microstructure of 1 wt% NAMA M A356 alloy (Ref. # 71513) solidified in SC die at 115 MPa
50 cycles pressure a) Morphology of α-Al equiaxed cells and Al-Si eutectics in polished sample, b) shrinkage
porosity filled with MgO.
4.7.3.1. SEM/EDS Analysis of Nano Alumina Modified A356 Alloy*
One of the best samples (Ref. 71513) modified with 1 wt% Nano Alumina Master Alloy
and solidified at 115 MPa with 50 pressure cycles was selected for SEM/EDS analysis.
a) 3000x
a) 3000x a) 6000x
a) 800x
*This work was done in collaboration with Dr. Adam Gesing

129
Similar to unmodified and strontium modified A356 alloy, four distinct phases were
identified in this alloy. Their compositions are deconvoluted and phase distribution
quantities are determined. Results are shown in Table 20 and an observational summary
is presented below.
1. The α-Al phase was solidified first and constituted 75.47 wt% dendrite cells with
an average dendrite cell size of 9.2 µm. The α-Al solid solution consists of 97.18
wt.% Al, 1.28 wt. %Si and 0.75 wt.% Mg, 0.79wt.% Fe.
2. The residual liquid was then pushed into the interdendritic regions that account
for 24.53wt.% of the alloy. The interdendritic region consists of 17.64 wt%
eutectic Al, 6.89wt.% eutectic Si and a negligible amount of AlSiMgFe
intermetallic phase.
3. AlSiMgFe intermetallics were appeared to be solidified first in the interdendritic
region and found in the narrow gaps between the α-Al dendrite arms as plates.
The plates are less than 1 micron thick and 1-10 microns long. It is found to be
nucleated on the surface of α -Al dendrite arms and grew without interacting with
Si. Hence it can be concluded that it solidified before Si. Moreover, AlSiMgFe
intermetallics didn’t show any tendency on nucleating any new α -Al grains.
4. Subsequently Eutectic Si was found to have solidified in dendritic structure just
after AlSiMgFe phase solidification. No evidence was found that Si nucleates on
the AlFeSiMg intermetallics. Si appeared as dendritic trees growing in the gaps
in between α-Al dendrite arms. Si dendrite arms are around 0.3-0.4 microns in
diameter and are spaced approximately 1.5 microns apart. The shape of the
eutectic Si dendrites suggested that it grew in the residual melt, rater than
130
simultaneous eutectic solidification. The composition of Si eutectic solid solution
composed of 0.04 wt% Al, 99.68 wt% Si and 0.15 wt% Mg.
5. 17.64 wt% of α-Al matrix were found in the Al-Si "eutectic region”. It was
composed of a phase that is actually purer than that of the primary α-Al dendrite.
Calculation suggested that no Si was available in the matrix solid solution and Mg
content of 0.8% was almost similar in the both Al matrix. Fe was also low, but it
did not show its concentration in the EDX results.
6. AlSiMg oxide were found to be present as a glass layer in the solidification
shrinkage cavities formed as secondary dendritic arms in the interdendritic region
(Fig. 89). Associated with interdendritic Si, these secondary dendrites have 0.5-1
micron arm spacing, Oxides are found at the location which was locally last to
solidify in the interdendritic region. In this case it is clear that there is oxide
liquid in the microstructure at the location that solidified last. The calculated
composition should be solid at 550ᵒC. The observations suggest that the oxide
liquid is under cooled and deformable by the solidifying secondary Al dendrite.
7. Alumina nano-particles are very non-uniformly distributed in the interdendritic
space. They did not nucleate the primary α-Al dendrites. There are also no rosette
structures in the secondary interdendritic structure that radiate from a central
Alumina nanoparticle in the Si, rather the individual alumina nano particles are
located in the secondary Al phase and the structure of the Si dendrites appear not
to be affected by them. Many nano-particles probably reacted to form the oxide
glass that was observed to coat the solidification shrinkage cavities in the
interdendritic space.
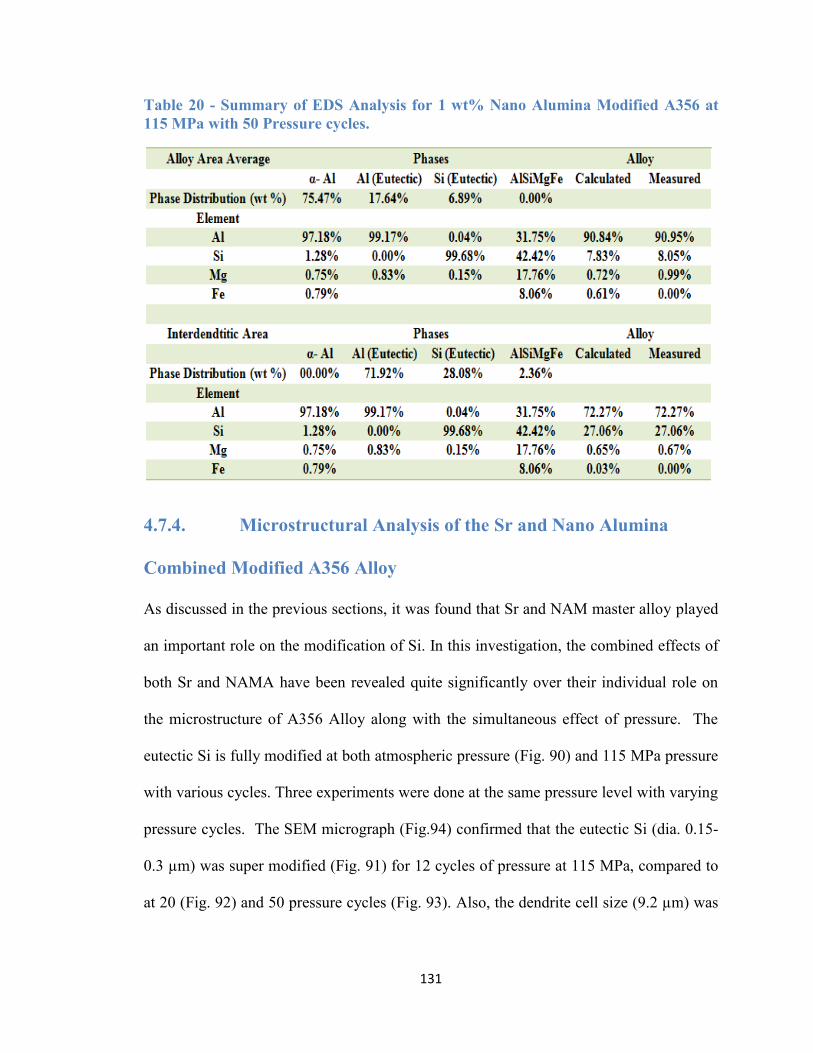
131
Table 20 - Summary of EDS Analysis for 1 wt% Nano Alumina Modified A356 at
115 MPa with 50 Pressure cycles.
4.7.4. Microstructural Analysis of the Sr and Nano Alumina
Combined Modified A356 Alloy
As discussed in the previous sections, it was found that Sr and NAM master alloy played
an important role on the modification of Si. In this investigation, the combined effects of
both Sr and NAMA have been revealed quite significantly over their individual role on
the microstructure of A356 Alloy along with the simultaneous effect of pressure. The
eutectic Si is fully modified at both atmospheric pressure (Fig. 90) and 115 MPa pressure
with various cycles. Three experiments were done at the same pressure level with varying
pressure cycles. The SEM micrograph (Fig.94) confirmed that the eutectic Si (dia. 0.15-
0.3 µm) was super modified (Fig. 91) for 12 cycles of pressure at 115 MPa, compared to
at 20 (Fig. 92) and 50 pressure cycles (Fig. 93). Also, the dendrite cell size (9.2 µm) was

132
found to be comparatively refined and transformed into equiaxed structure (Fig. 91) than
those pressure cycles (Figures 92-93).
Figure 90 - LOM Microstructure of both 0.015 wt% Sr & 1 wt% NAMA M A356 alloy (Ref. # 72413C) solidified
in SC die at atmospheric pressure a) Morphology of α-Al cells & Al-Si eutectics, dendrite cell size 15.2 µm b)
Fibrous eutectic Si.
Figure 91 - LOM Microstructure of both 0.015 wt% Sr & 1 wt% NAMA M A356 alloy (Ref. # 81413) solidified
in SC die at 115 MPa 12 cycles pressure a) Morphology of α-Al cells & Al-Si eutectics, dendrite cell size 9.2 µm
b) Fibrous eutectic Si.
a) 200x b) 1000x
a) 200x b) 1000x
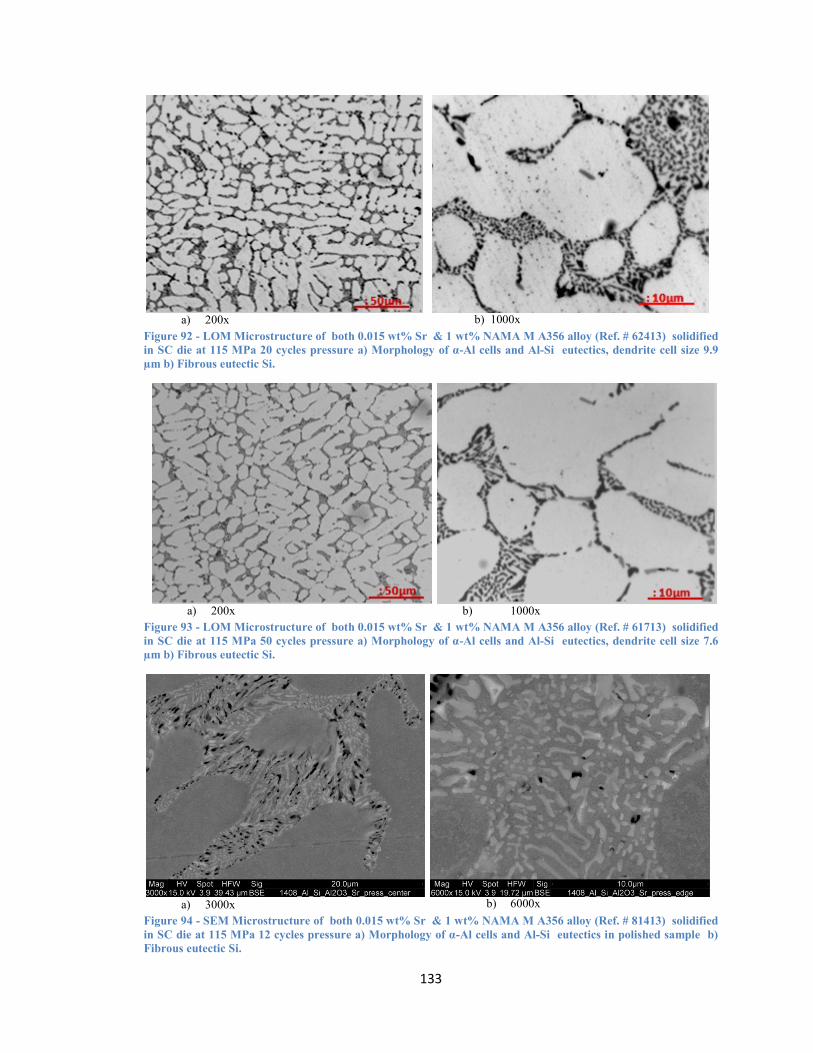
133
Figure 92 - LOM Microstructure of both 0.015 wt% Sr & 1 wt% NAMA M A356 alloy (Ref. # 62413) solidified
in SC die at 115 MPa 20 cycles pressure a) Morphology of α-Al cells and Al-Si eutectics, dendrite cell size 9.9
µm b) Fibrous eutectic Si.
Figure 93 - LOM Microstructure of both 0.015 wt% Sr & 1 wt% NAMA M A356 alloy (Ref. # 61713) solidified
in SC die at 115 MPa 50 cycles pressure a) Morphology of α-Al cells and Al-Si eutectics, dendrite cell size 7.6
µm b) Fibrous eutectic Si.
Figure 94 - SEM Microstructure of both 0.015 wt% Sr & 1 wt% NAMA M A356 alloy (Ref. # 81413) solidified
in SC die at 115 MPa 12 cycles pressure a) Morphology of α-Al cells and Al-Si eutectics in polished sample b)
Fibrous eutectic Si.
a) 200x b) 1000x
a) 200x b) 1000x
a) 3000x b) 6000x

134
4.8. Solution Treatment
The main purpose of the solution treatment was to change the morphology of silicon from
lamellar and fibrous structure to globular structure within a very short period of soaking
time. In the industrial practice of the Alcoa Wheel, it used to take 5 hours at 540ᵒC. In
this investigation, the same temperature was used for the solution treatment. However,
the target was to determine the shortest time in order to achieve complete spheroidization
of Si. Two types of test samples were chosen for the solution treatment, namely
unmodified A356 alloy (Ref. # 62513, Figures 67-68) and Strontium modified A356
alloy (Ref. # 71613, Figures 80-82). Both test samples were solidified at 115 MPa
pressure, one with 20 and the other with 50 cycles respectively in the SC UMSA
platform. From each type of alloy two test samples were cut and subjected to two
different soaking times. The first unmodified test sample was tried for 30min and the
second one for 15min. The strontium modified test samples were soaked similarly.
LOM micrographs (Figures 95-98) indicated that both unmodified and Sr modified alloy
showed very rapid spheroidization within 15 min and the eutectic silicon transformed into
ultra fine globular type Si with an average diameter of 1.12-1.16 μm. The silicon
spheroids were homogenously distributed all over the microstructure in both alloys. SEM
micrographs (Figures 99-100) confirmed the result and also identified the main phases
very clearly. Most of the AlSiMgFe intermetallic compound was broken into small pieces
of average 1-2 μm in length, except a few that remained at 5 μm.
Image Analysis (Figures 101-105) of the Si spheroids showed that the perimeter, area and
diameter of the Si spheroids increased if the soaking time increased from 15 to 30 min in
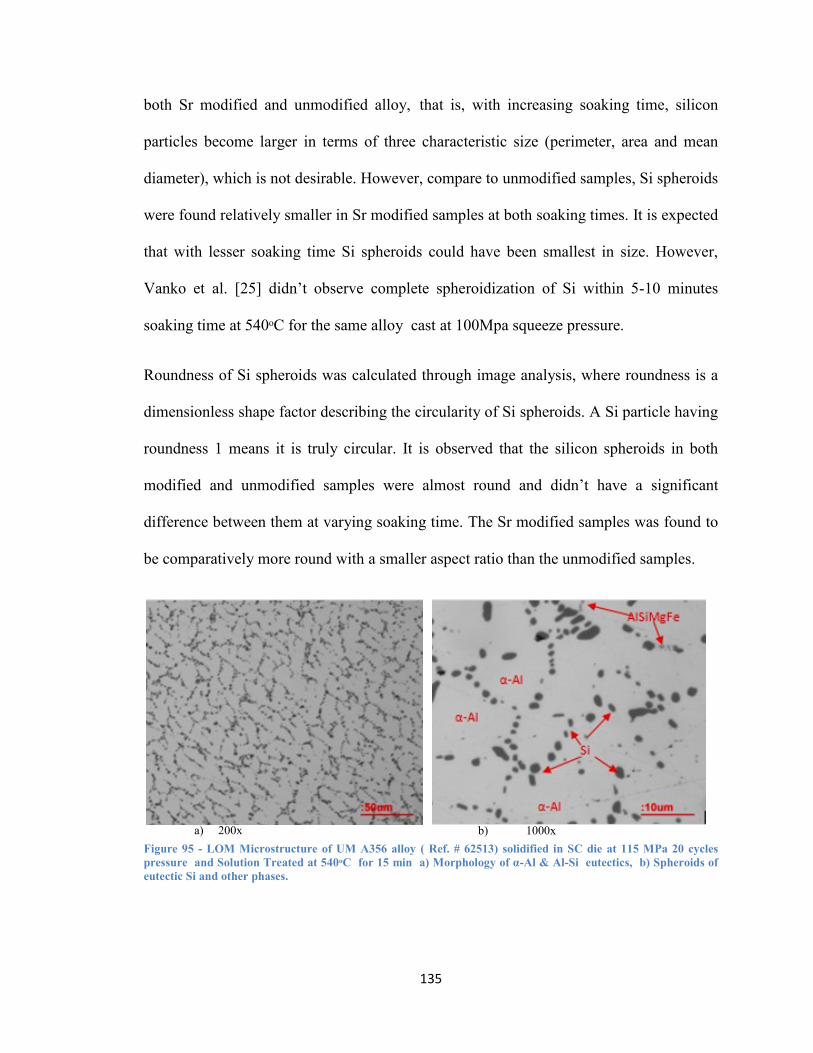
135
both Sr modified and unmodified alloy, that is, with increasing soaking time, silicon
particles become larger in terms of three characteristic size (perimeter, area and mean
diameter), which is not desirable. However, compare to unmodified samples, Si spheroids
were found relatively smaller in Sr modified samples at both soaking times. It is expected
that with lesser soaking time Si spheroids could have been smallest in size. However,
Vanko et al. [25] didn’t observe complete spheroidization of Si within 5-10 minutes
soaking time at 540ᵒC for the same alloy cast at 100Mpa squeeze pressure.
Roundness of Si spheroids was calculated through image analysis, where roundness is a
dimensionless shape factor describing the circularity of Si spheroids. A Si particle having
roundness 1 means it is truly circular. It is observed that the silicon spheroids in both
modified and unmodified samples were almost round and didn’t have a significant
difference between them at varying soaking time. The Sr modified samples was found to
be comparatively more round with a smaller aspect ratio than the unmodified samples.
Figure 95 - LOM Microstructure of UM A356 alloy ( Ref. # 62513) solidified in SC die at 115 MPa 20 cycles
pressure and Solution Treated at 540ᵒC for 15 min a) Morphology of α-Al & Al-Si eutectics, b) Spheroids of
eutectic Si and other phases.
b) 1000x a) 200x
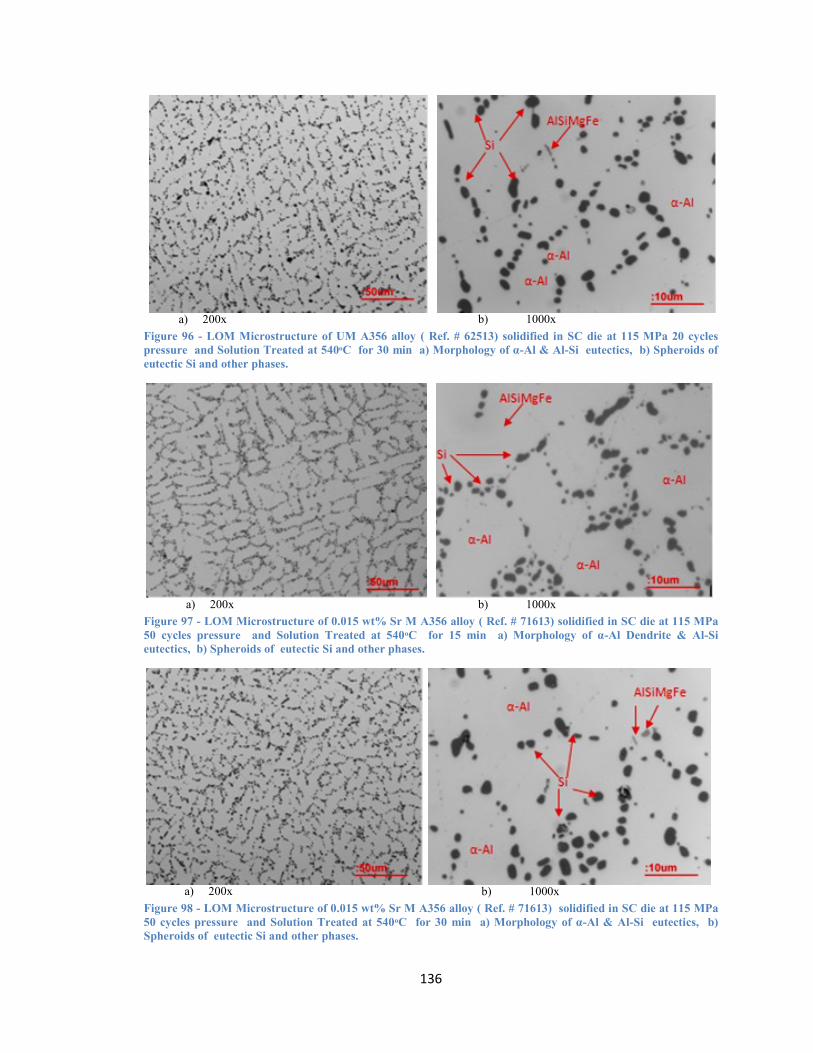
136
Figure 96 - LOM Microstructure of UM A356 alloy ( Ref. # 62513) solidified in SC die at 115 MPa 20 cycles
pressure and Solution Treated at 540ᵒC for 30 min a) Morphology of α-Al & Al-Si eutectics, b) Spheroids of
eutectic Si and other phases.
Figure 97 - LOM Microstructure of 0.015 wt% Sr M A356 alloy ( Ref. # 71613) solidified in SC die at 115 MPa
50 cycles pressure and Solution Treated at 540ᵒC for 15 min a) Morphology of α-Al Dendrite & Al-Si
eutectics, b) Spheroids of eutectic Si and other phases.
Figure 98 - LOM Microstructure of 0.015 wt% Sr M A356 alloy ( Ref. # 71613) solidified in SC die at 115 MPa
50 cycles pressure and Solution Treated at 540ᵒC for 30 min a) Morphology of α-Al & Al-Si eutectics, b)
Spheroids of eutectic Si and other phases.
a) 200x b) 1000x
a) 200x b) 1000x
b) 1000x a) 200x

137
Figure 99 - SEM Microstructure of UM A356 alloy ( Ref. # 62513) solidified in SC die at 115 MPa 20 cycles
pressure and Solution Treated at 540ᵒC for 30 min a) Morphology of α-Al & Al-Si eutectics, b) Spheroids of
eutectic Si and other phases.
Figure 100 - SEM Microstructure of 0.015 wt% Sr M A356 alloy ( Ref. # 71613) solidified in SC die at 115 MPa
50 cycles pressure and Solution Treated at 540 ᵒC for 30 min a) Morphology of α-Al & Al-Si eutectics, b)
Spheroids of eutectic Si and other phases.
b) 3000x a) 6000x
b) 3000x a) 6000x
Pore/void
s

138
Figure 101 - Image Analysis of Si Spheroids in Solution Treatment for UM and Strontium modified alloy at
540ᵒC for 15-30 min, Comparison of Perimeter of Si spheroids at different soaking time and alloy.
Figure 102 - Image Analysis of Si Spheroids in Solution Treatment for UM and Strontium modified alloy at
540ᵒC for 15-30 min, Comparison of Area of Si spheroids at different soaking time and alloy.
Unmodified Alloy 15 min. 30 min. Sr modified Alloy 15 min. 30min.

139
Figure 103 - Image Analysis of Si Spheroids in Solution Treatment for UM and Strontium modified alloy at
540ᵒC for 15-30 min, Comparison of Diameter of Si spheroids at different soaking time and alloy.
Figure 104 - Image Analysis of Si Spheroids in Solution Treatment for UM and Strontium modified alloy at
540ᵒC for 15-30 min, Comparison of Roundness of Si spheroids at different soaking time and alloy.

140
Figure 105 - Image analysis of Si spheroids in solution treatment for UM and Strontium modified alloy at 540ᵒC
for 15-30 min, Comparison of aspect ratio of Si spheroids at different soaking time and alloy.
4.8.1. SEM/EDS Analysis for Solution Treated UM A356 Alloy*
As can be seen in Table 22, after the solution treatment at 540ᵒC for 30 min, the alloy
area average composition was found to be almost the same as the as-cast sample. There
was no observed change in the percentage of Si, Mg and Fe except the availability of a
new element Ni. Ni was available only in the trace level in the as-cast alloy composition.
Its presence could be due to contamination of Ni during re-melting or solution treatments
of the sample. However, there was a significant change in the percentage of phases that
appeared after the solution treatment. Eutectic Si phase (average dia. of 1.12 - 1.16 µm)
was found homogenously distributed throughout the α-Al matrix. The AlSiMgFe phase
which was originally present as plates had also been in the process of breakup and
spheroidization during solution treatment. Additionally, a new phase AlSiFeNi appeared
in the alloy pushing the Mg element to go into the solid solution of α-Al matrix and
eutectic Si. Hence, it was found that Mg was increased in both solid solutions.

141
Round voids were also found around 2 microns in diameter scattered randomly, but
associated with Si and/or AlFeSiMg particles, and located in the original interdendritic
regions. This could be either shrinkage porosity that was spheroidized by solution
treatment or of H2 bubbles that came out of solution during heat treatment.
4.8.2. SEM/EDS Analysis for Solution Treated Sr Modified Alloy*
There was a significant change in the alloy composition, percentage of phases and phase
composition of as-cast and solution treated strontium modified A356 alloy at 540ᵒC for
30 min.
Table 21 - Summary of EDS Analysis for Solution Treated UM Squeezed Cast A356
Alloy.
Table 22 - Summary of EDS Analysis for Solution Treated Sr M Squeezed Cast
A356 Alloy.
*This work was done in collaboration with Dr. Adam Gesing

142
On the other hand, Si spheroids particles (0.1-1.5 micron) were homogenously distributed
in the α-Al matrix decorating the original interdendritic locations. The Sr containing
sample had larger volume fraction of interdendritic liquid, the Si particle containing
bands were wider, in places higher than 5 micron wide, with few particles distributed
across the band.
It was found that the percentage of AlSiMgFe had been reduced. The AlSiFe phase
showed up in three shapes. Firstly, oval shaped AlSiFe particles (0.1 µm) often arranged
in strings associated with the original as-cast AlSiFeMg phase plate or needle. They also
appeared in the original interdendritic locations. Secondly, plate or needle shaped AlSiFe
(size 2-5 x 0.1µm) particles that did not appear to fragment and recrystalized under the
540ᵒC heat treatment conditions. Thirdly, more irregularly shaped recrystalized AlSiFe
(less than 2 µm) particles recrystalizing in close contact with Si. Total content of the
AlSiFe phases was even less than 1 wt%.
Round voids/bubbles were indentified with a size less than 3 microns in the original
interdendritic locations. Sr containing phases were not detected, and Sr content of the Al
matrix was below the EDX detection limit. After heat treatment the effect of Sr addition
on A356 alloy microstructure is significantly diminished. The microstructures of
modified and unmodified differ principally in the distribution of the Si particles in the α-
Al grains. The slightly higher proportion of Si particles in modified microstructure is
likely due to a lower contamination by Fe and the absence of Ni, and consequently less Si
is trapped in the AlSiFeX phases

143
4.9. Comparison and Correlation between Thermal and
Microstructural Analysis of Unmodified and Modified Alloys
Most of the squeeze casting experiments was done using unmodified A356 alloy to
determine the suitable pressure profiles. In this investigation, it was found that 115 MPa
is the highest pressure that can produce desirable microstructure at varying pressure
cycles. Keeping the same pressure, cycles were varied as 10, 20 and 50 number cycles.
However, due to the complexity of the experiments it was sometimes difficult to get the
desired number of cycles. Despite repeating some experiments, certain numbers of cycles
were not being imposed in some experiments. Given these reservations, modified and
unmodified alloys were compared based on the achieved pressure profiles. Moreover,
other parameters like melt temperature and die temperature were tried to keep constant at
750˚C and 250˚C, though it was difficult to keep the same temperatures sometimes,
which may slightly affect the outputs.
Generally it was observed that cumulative energy, a product of pressure and stroke,
increased with increasing number of cycles. As can be seen in Fig. 106, unmodified alloy
achieved the highest energy at the same level of pressure and for 20 and 50 cycles
compared to Sr and NAMA modified alloys, despite an abnormal increase of energy in
combined modified (Sr and NAMA) alloy at 12 cycles pressure. Having higher
cumulative energy and higher α-dendrite growth temperature appeared to be an indication
of higher effect of pressure and resulted in better microstructures. The α-dendrite
growth temperature also has a higher increase in unmodified alloy compared to any other
modified alloys at the same pressure for 20 numbers of cycles (Fig. 107).

144
On the other hand, eutectic growth temperature was the lowest in the combined (Sr and
NAMA) modified alloy compared to individually modified alloy and unmodified alloy in
all instances of pressure cycles at 115 MPa. It was concluded that having lower eutectic
growth temperature is the best for fully modified ultrafine eutectic silicon (Fig. 108).
Compare to unmodified alloy, modified alloys either Sr modified or NAMA modified or
combined modified alloy showed lower Al-Si eutectic growth temperature for their
eutectic Si modification.
Figure 106 – Correlation between cumulative energy and pressure cycles for modified and unmodified alloys at
115MPa.
20
25
30
35
40
45
50
55
60
65
70
0 10 20 30 40 50 60
Cu
mu
lati
ve E
ner
gy, J
No. of Pressure Cycles at 115 MPa
UM A356
Sr+Al2O3
Al2O3
Sr
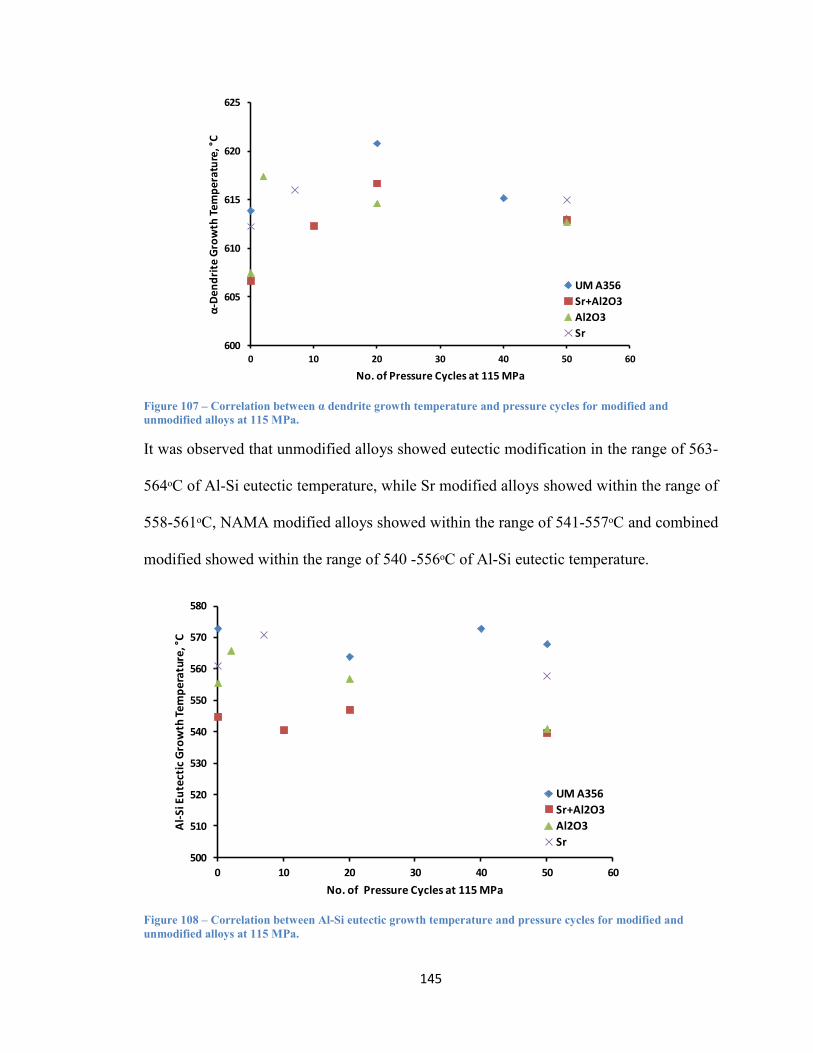
145
Figure 107 – Correlation between α dendrite growth temperature and pressure cycles for modified and
unmodified alloys at 115 MPa.
It was observed that unmodified alloys showed eutectic modification in the range of 563-
564ᵒC of Al-Si eutectic temperature, while Sr modified alloys showed within the range of
558-561ᵒC, NAMA modified alloys showed within the range of 541-557ᵒC and combined
modified showed within the range of 540 -556ᵒC of Al-Si eutectic temperature.
Figure 108 – Correlation between Al-Si eutectic growth temperature and pressure cycles for modified and
unmodified alloys at 115 MPa.
600
605
610
615
620
625
0 10 20 30 40 50 60
α-D
en
dri
te G
row
th T
em
pe
ratu
re, °
C
No. of Pressure Cycles at 115 MPa
UM A356
Sr+Al2O3
Al2O3
Sr
500
510
520
530
540
550
560
570
580
0 10 20 30 40 50 60
Al-
Si E
ute
ctic
Gro
wth
Te
mp
era
ture
, °C
No. of Pressure Cycles at 115 MPa
UM A356
Sr+Al2O3
Al2O3
Sr

146
Figure 109 – Correlation between average SR and cumulative energy for modified and unmodified alloys.
As shown in Fig. 109, there is a good correlation between the average solidification rate
and cumulative energy for all modified and unmodified alloys. Generally average
solidification rate increased with the increase of cumulative energy and then decreased to
some extent. In contrast, average SDAS or dendrite cell size decreased as cumulative
energy increased (Fig. 110) in a weak correlation. However, a strong correlation was
found between the average SR and average SDAS or dendrite cell size. As shown in Fig.
Figure 110 - Correlation between average SDAS or dendrite cell size and cumulative energy for modified and
unmodified alloys.
0.0
5.0
10.0
15.0
20.0
25.0
30.0
35.0
40.0
45.0
0 10 20 30 40 50 60 70 80
Av
era
ge
So
lidif
ica
tio
n R
ate
, ᵒC/s
Cumulative Energy, Joule
Unmodified A356 Alloy
Sr Modified
Nano Alumina Modified
Sr+Nano Alumina Modified
0.0
5.0
10.0
15.0
20.0
25.0
0 10 20 30 40 50 60 70 80
Av
era
ge
SD
AS
or,
De
nd
rite
Ce
ll S
ize
, µm
Cumulative Energy, Joule
Unmodified A356 Alloy
Sr Modified
Nano Alumina Modified
Sr+ Nano Alumina Modified

147
Figure 111 – Correlation between average SDAS or dendrite cell size and average solidification rate for modified
and unmodified alloys.
Fig.111, average SDAS or dendrite cell size decreased with increasing the average SR.
The unmodified alloys showed better correlation compared to the modified alloys.
Previous research in the literature indicated that the higher the SR, the better the refined
microstructure, was confirmed for the refinement of dendrite cell size or small SDAS as
shown in Fig. 111. However, there was found no strong correlation between the average
SDAS or dendrite cell size and the pressure cycles (Fig. 112).
0.0
5.0
10.0
15.0
20.0
25.0
0.0 10.0 20.0 30.0 40.0 50.0
Ave
rage
SD
AS
or,
Den
dri
te C
ell S
ize,
µm
Average Solidiification Rate, ᵒC/s
Unmodified A356 Alloy
Sr Modified
Nano Alumina Modified
Sr+ Nano Alumina Modified

148
Figure 112 – Correlation between SDAS or dendrite cell size and pressure cycles at 115 MPa for modified and
unmodified alloys.
4.10. Comparison with the Alcoa A356 Alloy Wheel
As discussed in the preceding sections, unmodified and modified A356 alloys showed a
high degree of microstructural improvement in terms of very fine dendrite cells and
ultrafine eutectic silicon compare to Alcoa A356 wheel material as shown in Figure 113.
Average dendrite cell size or SDAS of the Alcoa wheel material is found to be 17.31± 2.5
µm which is comparatively higher than that of squeezed cast unmodified A356 (8.1 ±1.1
µm), Sr modified (9.3±1.2 µm), Nano Alumina modified (9.2±1.2 µm) and combined
modified A356 alloy (7.6±0.8 µm). Moreover, in squeeze cast samples, eutectic Si was
super modified having ultra fine Si particles as shown in Figures 67, 80, 87 and 91-93
when compared to Alcoa wheel Si morphology. Squeeze cast samples also showed full
spheroidization of Si within 15 minutes of soaking time, as compared to 5 hours in LPDC
produced Alcoa wheel at 540 ᵒC followed by water quenching at 70 ᵒC. It is expected that
0
5
10
15
20
25
0 10 20 30 40 50 60
Ave
rage
SD
AS
or,
De
nd
rite
Ce
ll Si
ze, µ
m
No. of Pressure Cycles at 115 MPa
UM A356Sr+Al2O3Al2O3Sr
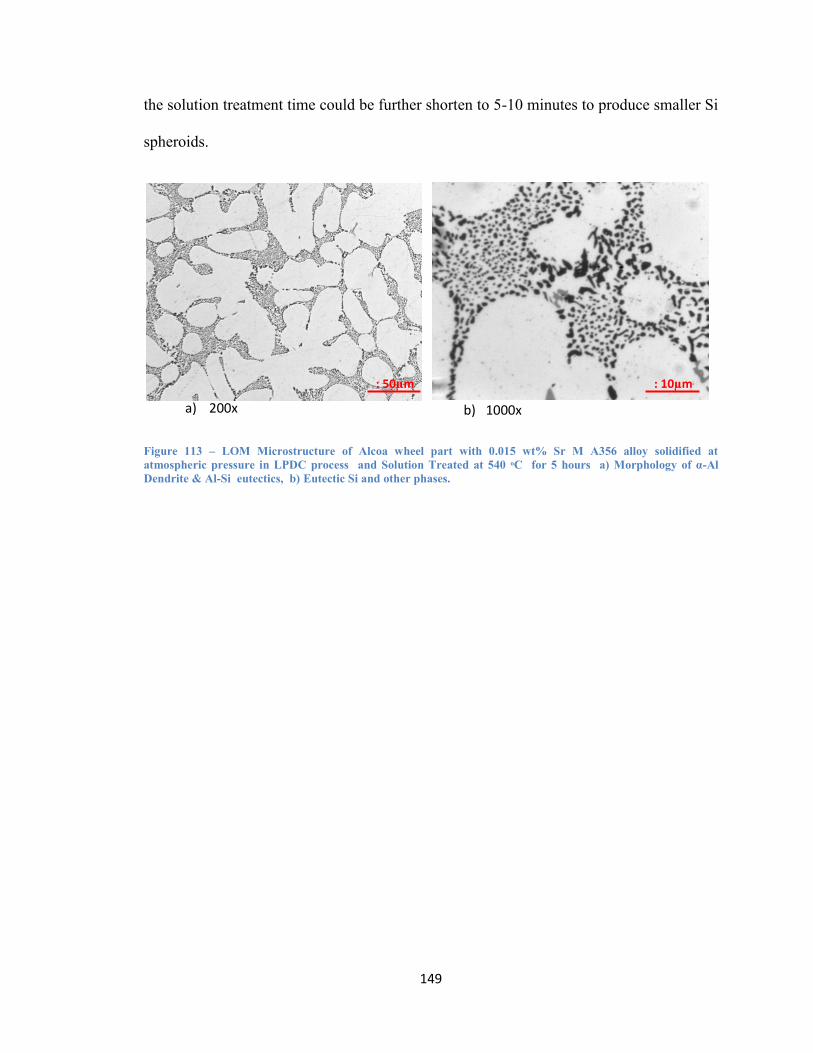
149
the solution treatment time could be further shorten to 5-10 minutes to produce smaller Si
spheroids.
Figure 113 – LOM Microstructure of Alcoa wheel part with 0.015 wt% Sr M A356 alloy solidified at
atmospheric pressure in LPDC process and Solution Treated at 540 ᵒC for 5 hours a) Morphology of α-Al
Dendrite & Al-Si eutectics, b) Eutectic Si and other phases.
a) 200x b) 1000x
: 50µm : 10µm
150
CHAPTER FIVE – SUMMARY AND CONCLUSIONS
5.1. Summary
The motivation of this research was to improve the microstructure of A356 alloy as well
as to introduce a new squeeze casting (SC) UMSA process compared to the LPDC
process. By introducing for the first time a unique cycling of pressure on the solidifying
melt and analyzing its effect on the thermal and microstructural behavior of A356 alloy,
it was revealed that cyclic pressure significantly improved the microstructure of
unmodified and modified A356 alloy in terms of finest equiaxed dendrite cell size and
ultrafine modified fibrous eutectic Si. The SEM analysis on the deep etched samples
revealed a 3D tree like ultrafine (0.15 micron width) dendritic structure which is not
found in the literature. For squeeze cast unmodified and Sr modified alloy, very rapid Si
spheroidization was achieved in a solution treatment at 540ᵒC within a very short 15
minute soaking time. Moreover, melt treatment by Sr and Nano Alumina Master Alloy
showed that their individual and combined effect along with effect of cyclic pressure
were able to produce a super modified microstructure of A356 alloy.
Cyclic pressure changed the thermal characteristics of A356 alloy. Compared to
atmospheric pressure, alloy solidified at high pressure showed a significant shifting of the
α-dendrite growth temperature with some exceptions.
1. The α-dendrite growth temperature of unmodified alloy increased 2-8°C at
the range of 50-115 MPa pressure with 10-20 pressure cycles. In one
experiment there was a 1°C decrease.
151
2. There was 2-4°C increase in the α-dendrite growth temperature for Sr
modified alloy at 115 MPa pressure with 10-50 cycles. One experiment
showed a 2°C decrease.
3. Solidified at the same pressure level, Nano alumina modified alloyed
showed 5-10°C increase in the α-dendrite growth temperature with
varying pressure cycles of 2-50.
4. Combined (Sr and Nano Alumina) modified alloy also showed 5-10°C
increase in the α-dendrite growth temperature at 115 MPa pressure within
12-50 pressure cycles.
Cyclic pressure application caused significant changes in the Al-Si eutectic growth
temperature compared to alloy solidified at atmospheric pressure. Depending on the start
and end point of pressure applied region during solidification, the Al-Si eutectic growth
temperature increased or decreased. A decrease of eutectic temperature to values between
540-565°C showed significant modifications in the eutectic silicon of the alloy
microstructure while increasing eutectic temperature above 565°C didn’t show any
modification on the eutectic Si. Some highlights stated below:
1. For untreated A356 alloy, the Al-Si eutectic growth temperature decreased
1-10ᵒC within the range of 50-115 MPa pressure for 10-50 cycles. One
experiment showed a 1°C increase and another showed no change.
2. There was 2-3°C decrease in Sr treated alloy solidified at 115 MPa
pressure for 10-50 pressure cycles although one experiment gave a 10°C
increase.

152
3. Nano Alumina treated alloy experiments showed 1 -15°C decrease in Al-
Si eutectic temperature. One experiment showed a 10°C increase.
4. Combined (Sr and Nano Alumina) modified alloy experiments showed a
5°C decrease in one experiment while 2-11°C increase in other two
experiments at the same pressure for 20-50 pressure cycles. However,
despite this increase in Al-Si eutectic temperature, the eutectic Si was fully
modified as the resulted eutectic temperature was well below 560°C.
With regard to α-Al dendrite cell, the best results are achieved at 115 MPa pressure for
varying pressure cycles 10-50. Microstructural analysis of some as-cast samples
solidified at 115 MPa revealed that
1. The SDAS or α-dendrite cell size reduced from 23.84 μm at atmospheric
pressure to 8.12 μm at 115 MPa, which is very significant compared to
17.3 μm at atmospheric pressure in LPDC made AlCOA wheel.
2. Sr modified test samples showed a dendrite cell size of 9.3 μm at 115 MPa
pressure for 50 cycles compared to 13 μm found at atmospheric pressure
for the same alloy.
3. Nano Alumina modified alloy showed a similar improvement in dendrite
cell size having 9.2 μm compared to 16.1 μm at atmospheric pressure.
4. The super refined dendrite cell size of 7.6 μm was achieved in a combined
modified (Sr and Nano Alumina) alloy at the same pressure profiles.
Increasing the number of pressure cycle causes a slight improvement in cell size.

153
With respect to silicon modification of as-cast samples solidified at the 115 MPa pressure
profiles revealed that
1. Untreated as-cast A356 sample solidified at 115 MPa with 20 pressure
cycles showed super modified Si (dia. 0.15-0.25 µm) compared to acicular
Si (dia. 2-3µm) at atmospheric pressure.
2. Without any chemical modifiers, cyclic pressure seems to modify eutectic
Si if pressure is applied at a certain range of solidification process between
the starting of α-dendrite growth temperature and the ending of Al-Si
eutectic growth temperature.
3. Sr treated and Nano alumina master alloy treated alloy also showed
similar eutectic modification having super modified Si (dia. 0.25-0.35 and
0.3-0.4 µm respectively) at the range of 100-115 MPa pressure.
4. Cyclic pressure also produced super modified Si (dia. 0.15-0.3 µm) in
combined (Sr and Nano alumina) melt treated alloy.
It is not clear if number of pressure cycles influence the Si modification.
In both Sr modified and unmodified alloy solution treatments, the percentage of Mg and
Fe has been increased in the solid solution of α-Al matrix, whereby most of the Mg2Si
and part of AlSiMgFe phases went into solid solution of α-Al matrix, which is an
indication of precipitation of Mg2Si in the solid solution of the matrix.
Cyclic pressure appeared to generate cumulative energy that increased from 8.6 J to 67.5
J as pressure increased from 50 MPa to 115 MPa 0 increasing pressure cycles 1-50 in the
solidification of unmodified alloy. Experiments also showed a similar energy input
154
increment in the Sr and Nano Alumina modified alloy solidified at 115 MPa pressure. It
is not clear whether pressure alone or this energy is the deciding factor for the
metallurgical changes. However, cyclic pressure appeared to be one of the main factors
for the thermal and microstructural changes in the A356 alloy.
5.2. Conclusions
1. A comprehensive literature review was carried out and did not provide any
information on the cyclic mechanical pressure utilized during solidification of
castable alloys.
2. Limited calibration of the thermocouples and the Data Acquisition System was
carried out at high Solidification Rates using pure Al and Zn, however, due to the
time constraints, and complexity of high cyclic mechanical pressure further
calibration needs to be carried out for future determination of the unbiased TA
characteristics.
3. Extensive experimentation was carried out on the A356 alloy leading to the
development of a novel processing technology rendering an ultra fine dendritic Si
structure and semi-solid α-Al cell structure.
3.1. The unmodified alloy solidified at 115 MPa for 20 cycles showed the best
microstructure. The Sr modified alloy solidified at the range of 100 -115 MPa
pressure for 10-50 cycles, the Nano Alumina modified alloy solidified at 115
MPa pressure for 20-50 cycles and the combined modified alloy solidified at
155
115 MPa pressure for 12-50 cycles showed the best microstructures in terms of
ultra fine dendritic Si and semi-solid equiaxed α-Al cells.
3.2. Limited Solution Treatment experiments with the A356 alloy using processing
parameters (540°C, 15-30minutes, water quenching at 70°C) rendered spherical
Si particles having an average diameter range of 1.12-1.16 μm. It is expected
that a 15 minute Solution Treatment time could be further shortened to 5-10
minutes to produce a smaller Si dia. Sr modified alloy showed smaller and
round Si spheroids compared to unmodified alloy. Significant industrial cost
savings will be feasible in comparison with a 5 hrs Solution Treatment of the
ALCOA Wheel.
4. In order to understand the effect of the experimental conditions on the as-cast
thermal and microstructural data as well as in depth characterization of 3D Si
morphology, it will be necessary to continue SEM/TEM comprehensive analysis
based on TA and squeeze casting UMSA processing data available to-date.

156
CHAPTER SIX - RECOMMENDATIONS FOR
FUTURE WORK
1. Perform calibration at different pressure profiles to determine the effect of
pressure on the thermocouple materials at high temperature and high pressure.
2. Perform squeeze casting experiments considering wide range of variables
including superheat temperature, melt pouring temperature and die temperature at
different pressure profiles to analyze effect of pressure at different thermal
conditions.
3. Design a new die to produce a single cylindrical test sample with 60mm length
and 20 mm diameter in order to perform mechanical testing to determine the
fatigue behaviour of A356 alloy as well as to determine the yield strength,
ultimate tensile strength, elongation and hardness of the alloy subjected to high
pressure.
157
REFERENCES/BIBLIOGRAPHY
[1] Alcoa, “Alcoa Introduces New Lighter, Stronger High-Load Aluminum Wheels
Unavailable in Steel,” International Motor Show (IAA) Commercial Vehicles
conference, 2012. [Online]. Available:
http://www.alcoa.com/global/en/news/news_detail.asp?pageID=20120919005844e
n&newsYear=2012. [Accessed: 02-Jan-2014].
[2] J. H. Sokolowski, and W. Kasprzak, B. Hernandez, “Novel Cost Effective
Structure Refinement and Modification Technologies for ALCOA Wheel
Production, Collingwood, Ontario, Canada, MMO Project #40636,” Windsor,
Ontario, 2006.
[3] A.L. Kearney, “Properties of Cast Aluminum Alloys, Properties and Selection:
Nonferrous Alloys and Special-Purpose Materials,” in the ASM Handbook , Vol 2,
ASM International, 1990, pp. 152–177.
[4] Elwin L. Rooy, “Introduction to Aluminum and Aluminum Alloys, Properties and
Selection: Nonferrous Alloys and Special-Purpose Materials,” in in ASM
Handbook , Vol 2, ASM International, 1990, pp. 3–14.
[5] D. S. Mackenzie, Handbook of Aluminum. New York: Marcel Dekker, 2003.
[6] Robert. E. Sanders. Jr., “Aluminum and Aluminum Alloys,” in Kirk-Othmer
Encyclopedia of Chemical Technology, Online., vol. 2, John Wiley & Sons, Inc.,
2012.
[7] C. Grard, Aluminium and Its Alloys. Warrington: Constable and Company Ltd.,
1920, pp. 1–5.
[8] R. T. Alcan, “Foundry Alloys,” Online, 2013. [Online]. Available:
https://www.rtapublicsales.riotinto.com/En/OurGlobalNetwork/Americas/Pages/F
oundryAlloys.aspx. [Accessed: 10-Feb-2013].
[9] L. F. Mondolfo, Aluminum Alloys: Structure and Properties. London, UK:
Butterworths, 1976, p. 369.
[10] J. Bäckerud, Lennart; Chai, Guocai ;Tamminen, Solidification Characteristics of
Aluminum Alloys Vol. 2: Foundry Alloys. American Foundry Society, 1990.
[11] J. G. Kaufman and E. L. Rooy, Aluminum Alloy Castings: Properties, Processes,
and Applications. Materials Park, OH: ASM International., 2004.
[12] J. F. Major and R. T. Alcan, “Aluminum and Aluminum Alloy Castings,” in
Nonferrous Alloy Castings,, ASM, 2008.

158
[13] D. Apelian, “Enabling Tools for Improved Performance Aluminum Cast Alloys :,”
Optimization, 2009.
[14] J. R. Davis, Ed., ASM Specialty Handbook: Aluminium and Aluminium Alloys.
ASM International, 1993.
[15] M. Smillie, “Casting and Analysis of Squeeze Cast Aluminium Silicon Eutectic
Alloy - Doctoral Thesis, Mechanical Engineering,” University of Canterbury,
2006.
[16] W. D. Shilvock, “The Effect of Alloy and Impurity Variation on the Treatment,
Casting and Physical Properties of Aluminium-Silicon Eutectic Alloys - Doctoral
Thesis, Mechanical Engineering,” University of Canterbury, 1995.
[17] X. Jian, T. T. Meek, and Q. Han, “Refinement of eutectic silicon phase of
aluminum A356 alloy using high-intensity ultrasonic vibration,” Scripta
Materialia, vol. 54, no. 5, pp. 893–896, Mar. 2006.
[18] L. Wang, D. Apelian and S. Shivkumar, “Molten Metal Processing of Advanced
Cast Aluminum Alloys,” Journal of the Minerals, Metals and Materials Society,
pp. 26–32.
[19] G. K. Sigworth, “Theoretical and Practical Aspects of the Modification of Al-Si
Alloys,” AFS Transactions, vol. 83–66, pp. 7–16.
[20] W. G. Lidman, “Master Alloys Improve Aluminum Casting Properties,” Foundry
M&T, pp. 46–47, 1994.
[21] S. Shivkumar, L. Wang, and B. Steenhoff, “Metallurgical Quality of Aluminum
Castings produced by the Lost Foam Process,” AFS Transactions, vol. 89–140, pp.
825–836, 1989.
[22] Shouxun. Ji, Y. Wang, D. Watson, and Z. Fan, “Microstructural Evolution and
Solidification Behavior of Al-Mg-Si Alloy in High-Pressure Die Casting,”
Metallurgical and Materials Transactions A, vol. 44, no. 7, pp. 3185–3197, Feb.
2013.
[23] B. Closset, and J.E.Gruzleski, “Structure and Properties of Hypoeutectic Al-Si-Mg
Alloys Modified with Pure Strontium,” Metallurgical Transactions, vol. 13A, pp.
945–951, 1982.
[24] M. Fatahalla, N., Hafiz, “Effect of microstructure on the mechanical properties and
fracture of commercial hypoeutectic Al-Si alloy modified with Na, Sb, and Sr,”
Journal of Materials Science, vol. 34, pp. 3555–3564, 1999.
159
[25] B. Vanko, “Effect of Silicon Spheroidization Treatment on Mechanical Properties
of Unmodified Al-Si Alloy Squeeze Castings,” Die Casting Engineer, NADCA,
November, pp. 22–25, 2013.
[26] D. G. Mallapur, K. R. Udupa, S. A. Kori, and R. S. Kadadevarmath, “Influence of
Grain Refining and Modification on Microstructure and Mechanical Properties of
Cast and Forged A356 Alloy – A Comparative Study.” pp. 21–25, 2012.
[27] S. Lu and A. Hellawell, “The Mechanism of Silicon Modification in Aluminum-
Silicon Alloys : Impurity Induced Twinning,” Metallurgical Transactions A, vol.
18, October, pp. 1721–1733, 1987.
[28] M. D. Hanna, S. Lu, and A. Hellawell, “Modification in the Aluminum Silicon
System,” Metallurgical Transactions A, vol. 15, March, pp. 459–469, 1984.
[29] H. V. Guthy, “Evolution of the Eutectic Microstructure in Chemically Modified
and Unmodified Aluminum Silicon Alloys - Master Thesis, Material Science and
Engineering,” Worcester Politechnique Institute, 2002.
[30] M. Zarif, B. Mckay, and P. Schumacher, “Study of Heterogeneous Nucleation of
Eutectic Si in High-Purity Al-Si Alloys with Sr Addition,” Metallurgical and
Materials Transactions A, vol. 42, no. 6, pp. 1684–1691, Dec. 2010.
[31] K. Nogita and A. Dahle, “Effects of boron on eutectic modification of
hypoeutectic Al–Si alloys,” Scripta Materialia, vol. 48, no. 3, pp. 307–313, Feb.
2003.
[32] C. Zhongwei, “Effect of strontium on primary dendrite and eutectic temperature of
A357 aluminum alloy,” China Foundary, May, pp. 149–152, 2010.
[33] M. Dudyk, “The Influence of Modification, Using Strontium and Antimony on the
Properties of AlSi6CuMg and AlSi8CuMgMn Aluminum Alloys Used for
Automobile Castings,” Cast Metals, vol. 3, pp. 157–162, 1990.
[34] A. Shabestari, S. G. Miresmaeili, S. M., Boutorabi, “Effects of Sr-modification and
melt cleanliness on melt hydrogen absorption of 319 aluminium alloy,” Journal of
Materials Science, vol. 38, pp. 1901–1907, 2003.
[35] Hess, P. D.; Blackmun, E. V. “Strontium as a Modifying Agent for Hypoeutectic
Aluminum-Silicon Alloys,” AFS Transactions, vol. 83, pp. 87–90, 1975.
[36] Martínez, E. J., Cisneros M. A., Valtierra, S., Lacaze, J. “Effect of strontium and
cooling rate upon eutectic temperatures of A319 aluminum alloy,” Scripta
Materialia, vol. 52, pp. 439–443., 2005.

160
[37] S. Khan and R. Elliott, “Quench modification of aluminium-silicon eutectic
alloys,” Journal of Materials Science, vol. 31, no. 14, pp. 3731–3737, 1996.
[38] Kang, H.G; H, Miyahara; Ogi, K. “Influence of cooling rate and additions of Sr
and Ti-B on solidification structures of AC4B type alloy,” in the 3rd Asian
Foundry Congress, 1995, pp. 108–115.
[39] Chadwick, T. M.; Thomas A.“The Effects of Chemistry, Grain Refiner, Modifier,
and Cooling Rate on the Microstructure of 356,” in Molten Aluminum Processing
(AFS), 1995.
[40] W. Jie, Z. Chen, W. Reif, and K. Müller, “Superheat Treatment of Al-7Si-0 .
55Mg Melt and Its Influences on the Solidification Structures and the Mechanical
Properties,” vol. 34, March, 2003.
[41] S. A. Al Kahtani, “Effect of Melt Thermal Treatment on Eutectic Silicon Particles
Characteristics in Cast Al-Si-Mg Alloys,” vol. 2, pp. 144–153, 2013.
[42] N. Abu-Dheir, M. Khraisheh, K. Saito, and A. Male, “Silicon morphology
modification in the eutectic Al–Si alloy using mechanical mold vibration,”
Materials Science and Engineering: A, vol. 393, no. 1–2, pp. 109–117, Feb. 2005.
[43] A. K. Dahle, K. Nogita, J. W. Zindel, S. D. Mcdonald, and L. M. Hogan, “Eutectic
Nucleation and Growth in Hypoeutectic Al-Si Alloys at Different Strontium
Levels,” vol. 32, no. April, pp. 949–960, 2001.
[44] A. K. Dahle, K. Nogita, S. D. McDonald, C. Dinnis, and L. Lu, “Eutectic
modification and microstructure development in Al–Si Alloys,” Materials Science
and Engineering: A, vol. 413–414, pp. 243–248, Dec. 2005.
[45] V. Heusser, Peter; Pocajt, “Modification and Refinement of Aluminum-Silicon
Alloys,” Key to Metals AG, Total Materia, 2003. [Online]. Available:
http://www.keytometals.com/page.aspx?ID=CheckArticle&site=ktn&NM=85.
[Accessed: 13-Apr-2013].
[46] Gruzleski, J. E.; Closset B. M. E, “The Treatment of Liquid Aluminum-Silicon
Alloys,” American Foundrymen’s Society, Inc, pp. 1–105, 1990.
[47] ASM Handbook, Vol. 15, Casting, vol. 15. ASM International, 2008, pp. 220–224.
[48] Beumler, R.D; Hammerstad, H; DasGupta, “Analysis of Modified 319 Aluminum
Alloy,” AFS Transactions, vol. 88, no. 54, pp. 1–12.
[49] Apelian, D; Cheng, J.A.“Effect of Processing Variables on the Grain Refinement
and Eutectic Modification of Al-Si Foundry Alloys,” International Molten
Aluminum Processing Conference, 1986.

161
[50] Chai, G; Backerud, L. “Factors Affecting Modification of Al-Si Alloys by Adding
Sr-Containing Master Alloys,” AFS Transactions, vol. 92–194, pp. 847–854.
[51] Emadi, D. and Gruzleski, J.E. “The Effects of Casting and Melt Variables on
Porosity in Directionally Solidified Al-Si Alloys,” AFS Casting Congress, vol. 98,
1994.
[52] Mcdonald, S. D.; Zindel, J.W. and Dahle, A.K; Nogita Kazuhiro, “Eutectic
Solidification Mode in Sodium Modified Al- 7 mass%Si-3.5 mass%Cu-0.2
mass%Mg Casting Alloys,” The Japan Institutes of Metals, Materials
Transactions, vol. 42, no. 9, pp. 1981–1986, 2001.
[53] J. Brown, “Aluminium casting alloys,” pp. 23–45, 1999.
[54] U. Feurer, “Influence of Alloy Composition and Solidification Conditions on
Dendrite Arm Spacing, Feeding, and Hot Tearing Properties of Aluminum
Alloys,” pp. 131–145.
[55] M. Djurdjevic, H. Jiang, and J. Sokolowski, “On-line prediction of aluminum–
silicon eutectic modification level using thermal analysis,” Materials
Characterization, vol. 46, no. 1, pp. 31–38, Jan. 2001.
[56] Gruzleski, J. E., “Thermal Analysis Studies of the Effect of Cooling Rate on the
Microstructure of 319 Aluminum Alloy,” AFS Transactions, vol. 92-¬141, pp.
383–391, 1992.
[57] S. Bhowmik, “Simultaneous Modification and Grain Refinement of the Al-Si-Cu
Alloy using a Magnesium Matrix Alumina Composite as the Master Alloy-
Masters Thesis” University of Windsor, 2007.
[58] M. A. Alam, “Simultaneous Si Modification and Grain Refinement of A356 Al-Si
Alloy using a Magnesium Matrix Alumina Composite (MgAl2O3) as a Master
Alloy - Masters Thesis” University of Windsor, 2010.
[59] Radhakrishna, K., Seshan, S. “Dendrite Arm Spacing in Aluminum Alloy
Castings,” AFS Transactions, vol. 80–87, pp. 695–702.
[60] Paray, F., and Gruzleski, J.E. “Some Factors to Consider in Modification,” AFS
Casting Congress, vol. 98, 1994.
[61] J. E. Gruzleski, Microstructure Development During Metal Casting. AFS,
American Foundry Society Inc, 2000.
[62] Helmut Kaufmann & Peter J. Uggowitzer, Metallurgy and Processing of High
Integrity Light Metal Pressure Castings. Schiele & Schon GmbH, Berlin, 2007.
162
[63] T. M. Yue, G. A. Chadwick, “Squeeze casting of light alloys and their
composites,” Journal of Materials Processing Technology, vol. 58, pp. 302–307,
1996.
[64] J. C. Benedy K, “Aluminum Alloys for Lightweight Automotive Structures,” in
the ASM Hanbook, ASM International., 2010, pp. 79–113.
[65] M. R. Ghomashchi and A. Vikhrov, “Squeeze Casting : An Overview,” Journal of
Materials Processing Technology, vol. 101, May 1998, pp. 1–9, 2000.
[66] K. M. Lyer, “Selecting Steel for High Pressure Die Casting Dies,” Metalworld,
January, pp. 8–13, 2008.
[67] J. J. Sobczak, L. Drenchev, and R. Asthana, “Effect of pressure on solidification of
metallic materials,” International Journal of Cast Metals Research, vol. 25, no. 1,
pp. 1–14, Jan. 2012.
[68] Han, Y.S.; Lee, H.I.; Kim, D.H.; Kim, Y.G. “Effect of applied pressure during
solidification on the microstructural refinement in an Al-Cu alloy,” Scripta
Metallurgica et Materialia, vol. 31:12, pp. 1623–1628, 1994.
[69] B. Denise, B. Alberto, C. Girolamo, T. M. Elisa, Q. Fabrizio, and S. Loredana,
“Squeeze Casting of Al-Si Alloys,” in Recent Researches in Metallurgical
Engineering - From Extraction to Forming, Online., Mohammad Nusheh, Horacio
Garza Ahuett and Alejandro Arrambide, Ed. InTechopen.com, 2012.
[70] G.Smith, “Squeeze Casting of Pure Al/Si Alloys, Ph.D.Project,” University of
Southampton,UK, 1986.
[71] O.G. Epanchistov, “Structure and Properties of Metals Solidified Under High
Pressure,” Russian Casting Prod., pp. 34–37, 1972.
[72] J. A. Aniyi and M. B. Adeyemi, “Effects of Squeeze Casting Parameters on
Temperature Distribution During Casting of Aluminum,” Journal of Applied
Science and Technology (JAST), vol. 14, no. 1 & 2, pp. 67–73, 2009.
[73] J. A. Aniyi and M. B. Adeyemi, “Effects of Pressure , Die , and Stress-Relief
Temperatures on the Residual Stresses and Mechanical Properties of Squeeze-Cast
Aluminum Rods,” Journal of Materials Engineering and Performance, vol. 5, no.
June, pp. 399–404, 1996.
[74] J. O. Aweda, “Improving the electrical properties of aluminium metal through
squeeze casting process.” Ilorin, pp. 1–13, 2009.

163
[75] M. Gallerneault, G. Durrant, and B. Cantor, “The Squeeze Casting of Hypoeutectic
Binary Al-Cu,” Metallurgical and Materials Transactions A, vol. 27A, December,
pp. 4121–4132, 1996.
[76] E. . Kim, K. . Lee, and Y. . Moon, “A feasibility study of the partial squeeze and
vacuum die casting process,” Journal of Materials Processing Technology, vol.
105, no. 1–2, pp. 42–48, Sep. 2000.
[77] R. R. Li and Y. Bai, “Effect of specific pressure on microstructure and mechanical
properties of squeeze casting ZA27 alloy,” Transactions of Nonferrous Metals
Society of China, vol. 20, no. 1, pp. 59–63, Jan. 2010.
[78] D. Y. Maeng, J. H. Lee, C. W. Won, S. S. Cho, and B. S. Chun, “The effects of
processing parameters on the microstructure and mechanical properties of modi ®
ed B390 alloy in direct squeeze casting,” Journal of Materials Processing
Technology, vol. 105, pp. 196–203, 2000.
[79] A. Maleki, B. Niroumand, and A. Shafyei, “Effects of squeeze casting parameters
on density, macrostructure and hardness of LM13 alloy,” Materials Science and
Engineering: A, vol. 428, no. 1–2, pp. 135–140, Jul. 2006.
[80] M. Masoumi and H. Hu, “Influence of applied pressure on microstructure and
tensile properties of squeeze cast magnesium Mg–Al–Ca alloy,” Materials Science
and Engineering: A, vol. 528, no. 10–11, pp. 3589–3593, Apr. 2011.
[81] S. Rajagopal, “Squeeze Casting: A Review and Update,” J. Applied Metal
Working, American Society for Metals, vol. 1, no. 4, pp. 3–14, 1981.
[82] G. K. Stefanos, M. Skolianos, “Effect of applied pressure on the microstructure
and mechanical properties of squeeze-cast aluminum AA6061 alloy,” Materials
Science and Engineering, vol. A231, pp. 17–24, 1997.
[83] J. F. Wallace, “Optimization of the Squeeze Casting Process for Aluminum Alloy
Parts, Final Report for U.S. Department of Energy, Case Western reserve
University,” 2002.
[84] Y. Yang, L. Peng, P. Fu, B. Hu, W. Ding, and B. Yu, “Effects of Process
Parameters on the Macrostructure of a Squeeze-Cast Mg-2.5 mass%Nd Alloy,”
Materials Transactions, vol. 50, no. 12, pp. 2820–2825, 2009.
[85] M. Zhang, W. Zhang, H. Zhao, D. Zhang, and Y. Li, “Effect of pressure on
microstructures and mechanical properties of Al-Cu-based alloy prepared by
squeeze casting,” Transactions of Nonferrous Metals Society of China, vol. 17, no.
3, pp. 496–501, Jun. 2007.
164
[86] A. A. Moosa, “Microstructure and Some Properties of Aluminum-Silicon Matrix
Composites Reinforced by Alumina or Chromia,” Al-Khwarizmi Engineering
Journal, vol. 6, no. 1, pp. 57–68, 2010.
[87] A. Yu, S. Wang, N. Li, and H. Hu, “Pressurized solidification of magnesium alloy
AM50A,” Journal of Materials Processing Technology, vol. 191, no. 1–3, pp.
247–250, Aug. 2007.
[88] M. T. Abou El-khair, “Microstructure characterization and tensile properties of
squeeze-cast AlSiMg alloys,” Materials Letters, vol. 59, no. 8–9, pp. 894–900,
Apr. 2005.
[89] W. Kasprzak, J. H. Sokolowski, M. Kasprzak, and W.T. Kierkus “Method and
Apparatus for Universal Metallurgical Simulation and Analysis (UMSA)” Canada
Patent No. PCT/CA2002/0019032002, US Patent No., US20050151306 A1
[90] P. C. Marchwica, “Microstructual and Thermal Analysis of AlSi and MgAl Alloys
Subjected to High Cooling Rates - Masters Thesis” University of Windsor, 2012.
[91] R. Maniara, J. H. Sokolowski, “The effect of cast Al-Si-Cu alloy solidification rate
on alloy thermal characteristics,” Journal of Achievements in Materials and
Manufacturing Engineering, vol. 17, Issue 1-2, pp. 217–220, 2006.
[92] L. A. Dobrzañski, R. Maniara, and J. H. Sokolowski, “The effect of cooling rate on
microstructure and mechanical properties of AC AlSi9Cu alloy,” Archives of
Materials Science and Engineering, vol. 28, no. 2, pp. 105–112, 2007.
[93] W. Kasprzak, J. H. Sokolowski, M. Sahoo, L. Metals, C. Technology, and C.
Techniques, “Thermal characteristics of the AM50 magnesium alloy,” Journal of
Achievements in Materials and Manufacturing Engineering, vol. 29, no. 2, pp. 15–
18, 2008.
[94] L. A. Dobrzański, M. Król, T. Tański, and R. Maniara, “Effect of cooling rate on
the solidification behavior of magnesium alloys,” ARCHIVES of Computational
Materials Science and Surface Engineering, International Scientific Journal
published quarterly by the Association of Computational Materials Science and
Surface Engineering, 2009, vol. 1, no. 1, pp. 21–24, 2009.
[95] W. Kasprzak, M. Sahoo, J. Sokolowski, H. Yamagata, and H. Kurita, “The Effect
of the Melt Temperature and the Cooling Rate on the Microstructure of the Al-20
% Si Alloy Used for Monolithic Engine Blocks,” American Foundry Society, pp.
55–72, 2009.
[96] L. A. Dobrzañski, M. Król, T. Tañski, and R. Maniara, “Thermal analysis of the
MCMgAl9Zn1 magnesium alloy,” ARCHIVES of Computational Materials
Science and Surface Engineering, International Scientific Journal published

165
quarterly by the Association of Computational Materials Science and Surface
Engineering, vol. 34, no. 2, pp. 113–116, 2008.
[97] P. Marchwica, J. H. Sokolowski, and W. T. Kierkus, “Fraction solid evolution
characteristics of AlSiCu alloys - dynamic baseline approach,” Achievements in
Materials and Manufacturing Engineering, vol. 47, no. 2, pp. 115–136, 2011.
[98] S. Thompson, “Effect of Cooling rate on Soldification Characteristics of
Aluminum Alloys A356 and AA5182 - Masters Thesis” University of British
Columbia, 2003.
[99] L. A. Dobrzanski, W. Kasprzak, and J. H. Sokolowski, “Analysis of the Al-Si
Alloy Structure Development using Thermal Analysis and Rapid Quenching
Techniques,” Achievements in Mechanical and Materials Engineering, 12th
International Scientific Conference Proceedings, pp. 225–228.
[100] L. A. Dobrza, W. Kasprzak, J. Sokołowski, R. Maniara, and M. Krupi,
“Applications of the derivation analysis for assessment of the ACAlSi7Cu alloy
crystallization process cooled with different cooling rate,” Achievements in
Mechanical and Materials Engineering, 2005.
[101] Djurdjevic, M.B., J.H. Sokolowski, “Modelling of Casting Processes Parameters
for the 3XX Series of Aluminum Alloys Using The Silicon Equivalency
Algorithm,” Association of Metallurgical Engineers Serbia and Montenegro
(AME), 2003.
[102] F. C. R. Hernandez, M. B. Djurdjevic, W. T. Kierkus, and J. H. Sokolowski,
“Calculation of the liquidus temperature for hypo and hypereutectic aluminum
silicon alloys,” Materials Science and Engineering: A, vol. 396, no. 1–2, pp. 271–
276, Apr. 2005.
[103] Omega Engineering Inc., “Thermocouples,” Omega Engineering Inc., 2013.
[Online]. Available: (http://www.omega.com/thermocouples.html. [Accessed: 03-
Dec-2013].
[104] “RDC Control. Thermocouples.” [Online]. Available:
http://www.rdccontrol.com/en/thermocouple/thermocouple-junctions-and-
response-time.html#q9. [Accessed: 09-Apr-2014].
[105] Calibration Guide, “Calibration of Thermocouples,” by European Association of
National Metrology Institutes, EURAMET cg-8, Version 2.1 (10/2011)
[106] E. C. Lloyd, “Accurate Characterization of the High Pressure Environments,” in
National Bureau of Standards, Conference Proceedings, 1968.

166
[107] G. W. Burns and M. G. Scroger, “NIST Measurement Services: Calibration of
Thermocouples and Thermocouples Materials.” National Institute of Stadards and
Technology, NIST Special Publication 250-35, 1989.
[108] S. Shankar, Y. W. Riddle, and M. M. Makhlouf, “Eutectic solidification of
aluminum-silicon alloys,” Metallurgical and Materials Transactions A, vol. 35,
no. 9, pp. 3038–3043, Sep. 2004.

167
APPENDICES
Appendix A – UM A356 at Different Pressure Profiles (Cooling Curve, First
Derivative Curve, Pressure Curve, Stroke and Cumulative Energy Curve)
Figure 114 - Cooling curve and its first derivative of unmodified A356 at 50 MPa with 1 pressure cycle.
Figure 115 - First derivative of the cooling curve of unmodified A356 at 50 MPa 1 pressure cycle.

168
Figure 116 - Cooling curve and pressure profile of unmodified A356 at 50 MPa with 1 pressure cycle showing
pressure applied location on the cooling cuve.
Figure 117 - Stroke and pressure curve of unmodified A356 at 50 MPa with 1 pressure cycle.
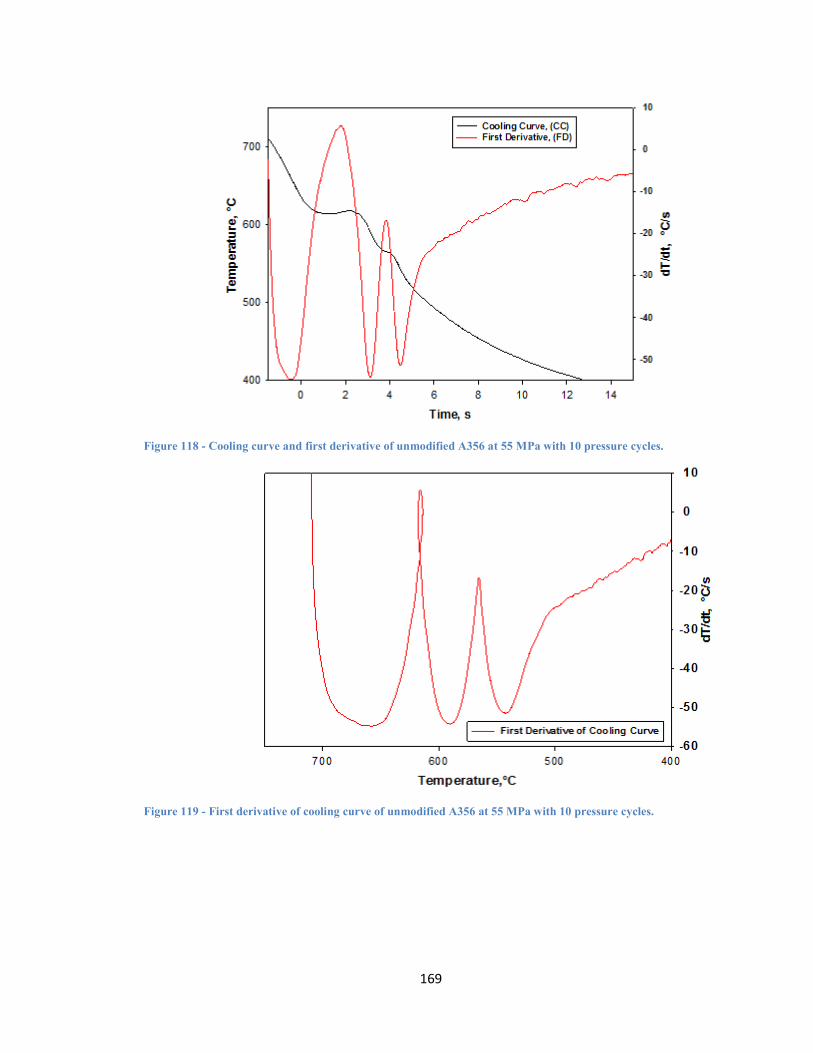
169
Figure 118 - Cooling curve and first derivative of unmodified A356 at 55 MPa with 10 pressure cycles.
Figure 119 - First derivative of cooling curve of unmodified A356 at 55 MPa with 10 pressure cycles.
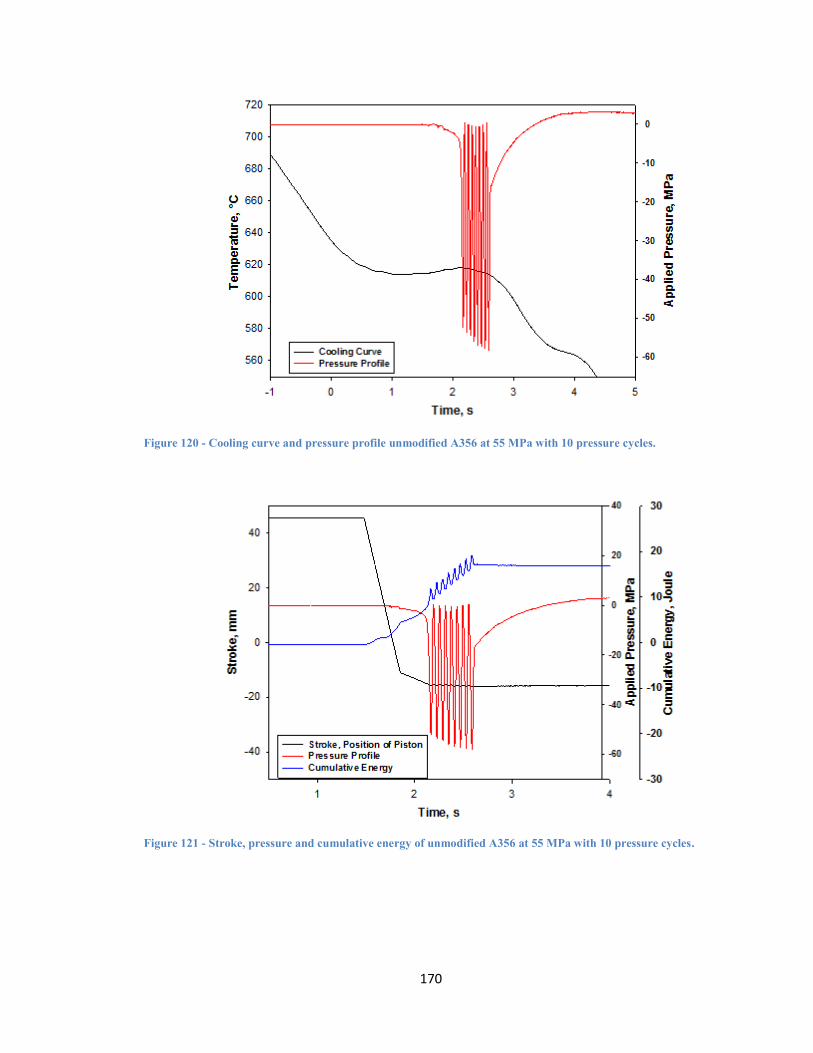
170
Figure 120 - Cooling curve and pressure profile unmodified A356 at 55 MPa with 10 pressure cycles.
Figure 121 - Stroke, pressure and cumulative energy of unmodified A356 at 55 MPa with 10 pressure cycles.
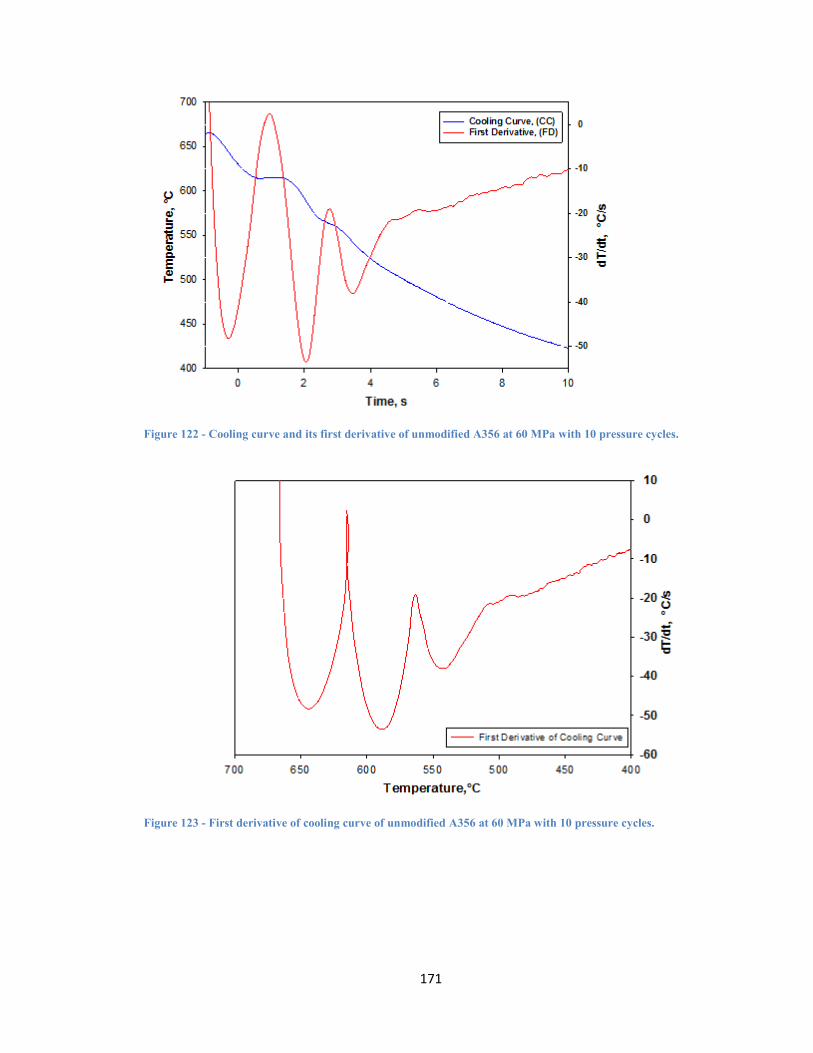
171
Figure 122 - Cooling curve and its first derivative of unmodified A356 at 60 MPa with 10 pressure cycles.
Figure 123 - First derivative of cooling curve of unmodified A356 at 60 MPa with 10 pressure cycles.

172
Figure 124 - Cooling curve and pressure profile of unmodified A356 at 60 MPa with 10 pressure cycles.
Figure 125 - Stroke, pressure profile and cumulative energy of unmodified A356 at 60 MPa with 10 pressure
cycles.
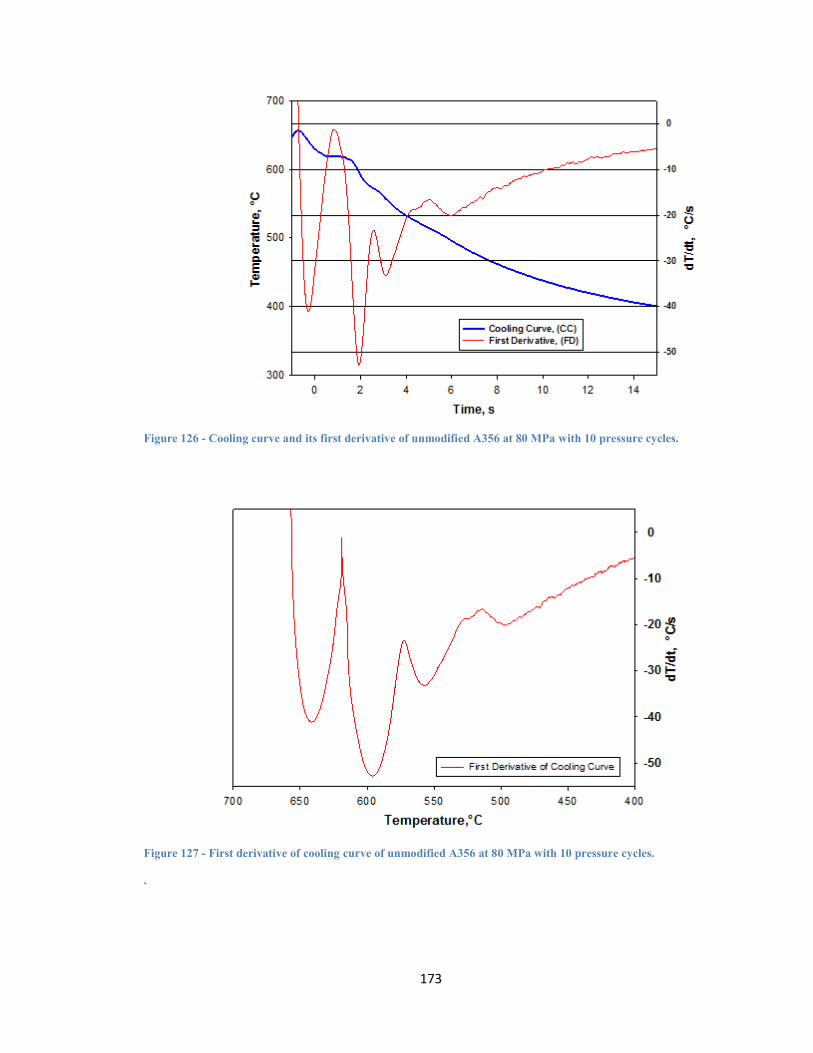
173
Figure 126 - Cooling curve and its first derivative of unmodified A356 at 80 MPa with 10 pressure cycles.
Figure 127 - First derivative of cooling curve of unmodified A356 at 80 MPa with 10 pressure cycles.
.
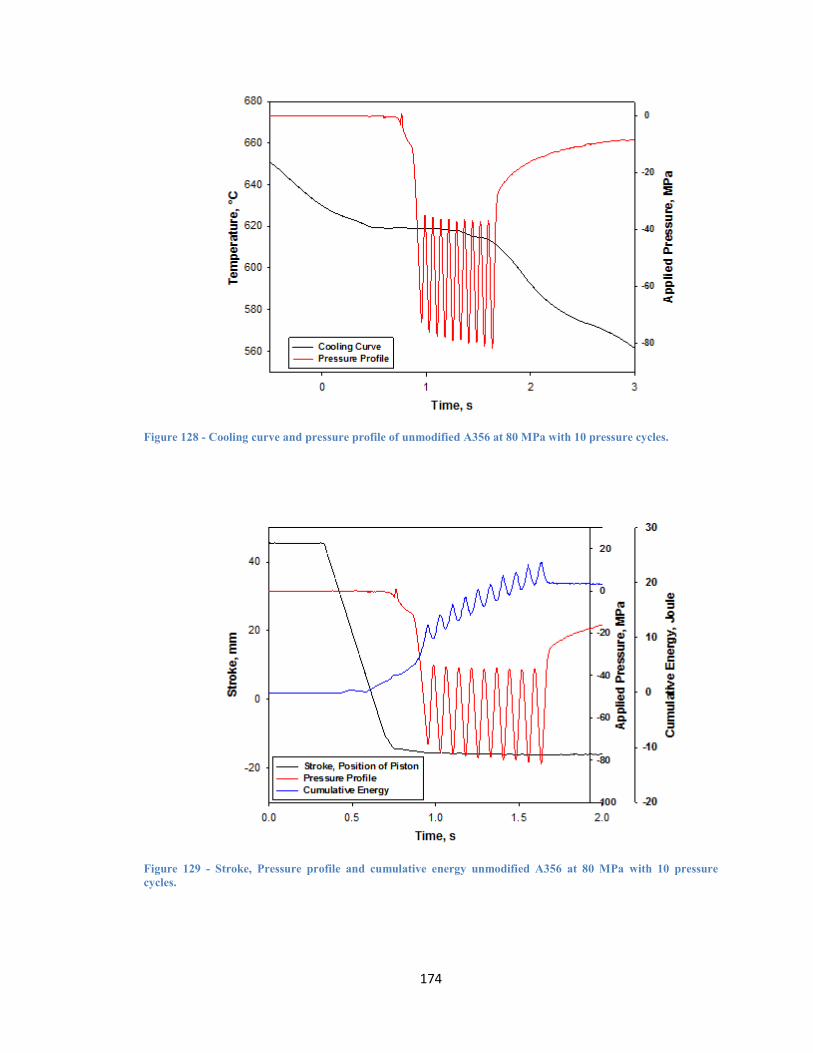
174
Figure 128 - Cooling curve and pressure profile of unmodified A356 at 80 MPa with 10 pressure cycles.
Figure 129 - Stroke, Pressure profile and cumulative energy unmodified A356 at 80 MPa with 10 pressure
cycles.

175
Figure 130 - Cooling curve and its first derivative of unmodified A356 at 90 MPa with 10 pressure cycles.
Figure 131 - First derivative of cooling curve of unmodified A356 at 90 MPa with 10 pressure cycles.

176
Figure 132 - Cooling curve and pressure profile of unmodified A356 at 90 MPa with 10 pressure cycles.
Figure 133 - Stroke, pressure profiles and cumulative energy of unmodified A356 at 90 MPa with 10 pressure
cycles.

177
Figure 134 - Cooling curve and its first derivative of unmodified A356 at 115 MPa with 20 pressure cycles.
Figure 135 - First derivative of cooling curve of unmodified A356 at 115 MPa with 20 pressure cycles.
Temperature,°C
400500600700800
dT
/dt,
°C
/s
-80
-60
-40
-20
0
First Derivative of Cooling Curve
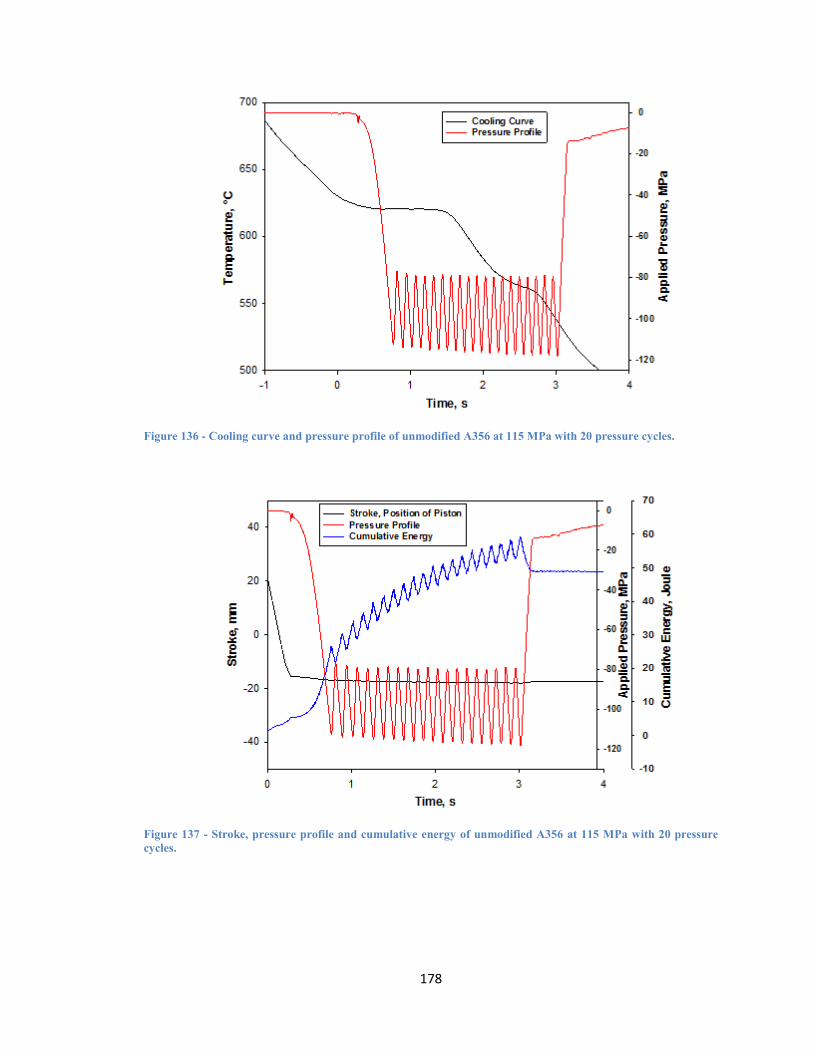
178
Figure 136 - Cooling curve and pressure profile of unmodified A356 at 115 MPa with 20 pressure cycles.
Figure 137 - Stroke, pressure profile and cumulative energy of unmodified A356 at 115 MPa with 20 pressure
cycles.

179
Figure 138 - Cooling curve and first derivative of unmodified A356 at 115 MPa with 40 pressure cycles.
Figure 139 - First derivative of cooling curve of unmodified A356 at 115 MPa with 40 pressure cycles.
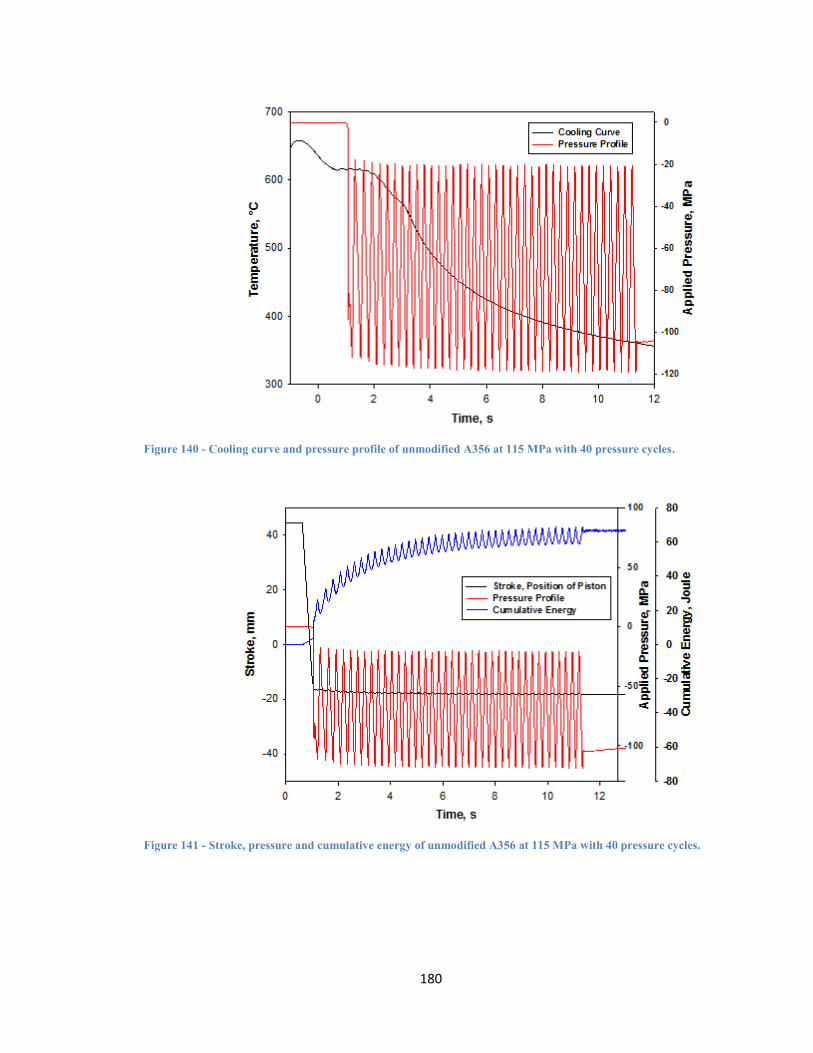
180
Figure 140 - Cooling curve and pressure profile of unmodified A356 at 115 MPa with 40 pressure cycles.
Figure 141 - Stroke, pressure and cumulative energy of unmodified A356 at 115 MPa with 40 pressure cycles.

181
Figure 142 – Cooling curve and its first derivative of unmodified A356 at 115 MPa with 50 pressure cycles.
Figure 143 - First derivative of cooling curve of unmodified A356 at 115 MPa with 50 pressure cycles
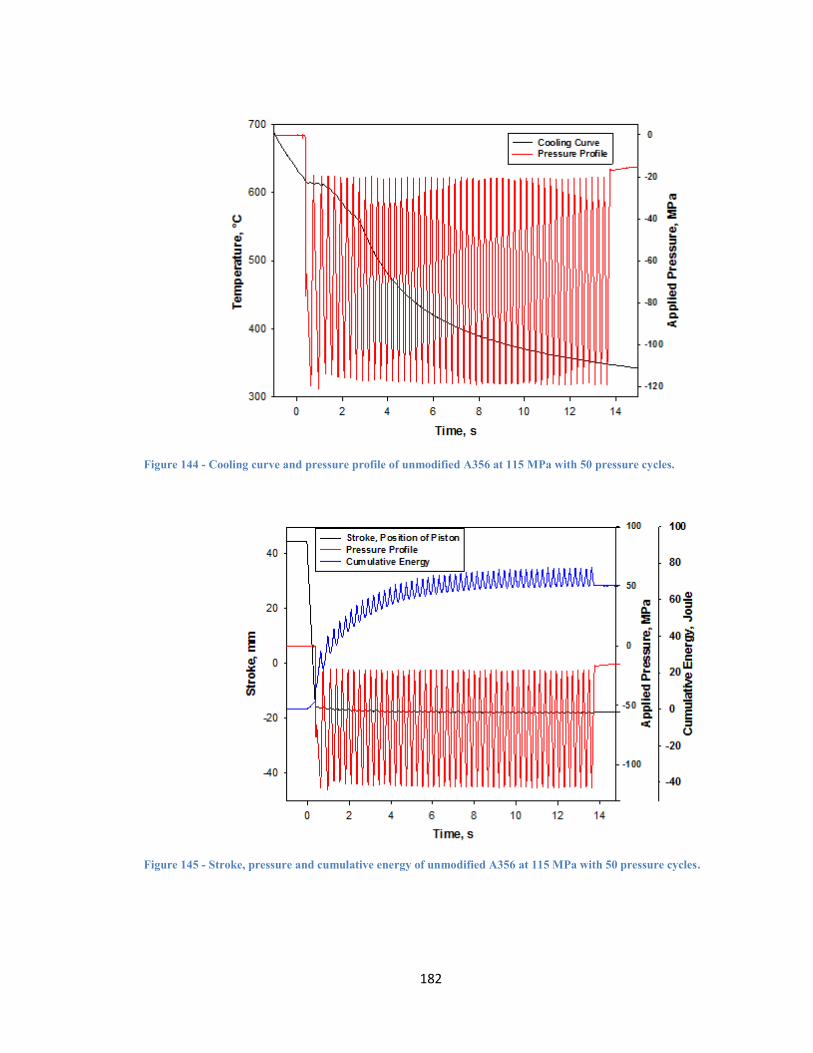
182
Figure 144 - Cooling curve and pressure profile of unmodified A356 at 115 MPa with 50 pressure cycles.
Figure 145 - Stroke, pressure and cumulative energy of unmodified A356 at 115 MPa with 50 pressure cycles.

183
Appendix B – Sr Modified A356 Alloy at Different Pressure Profiles (Cooling
Curve, First Derivative Curve, Pressure Curve, Stroke and Cumulative Energy
Curve)
Figure 146 - Cooling curve and first derivative of Sr modified A356 at atmospheric pressure.
Figure 147 - First derivative of cooling curve of Sr modified A356 at atmospheric pressure.

184
Figure 148 - Cooling curve and first derivative of Sr modified A356 at 100 MPa with 1 pressure cycle.
Figure 149 - First derivative of cooling curve of Sr modified A356 at 100 MPa with 1 pressure cycle.
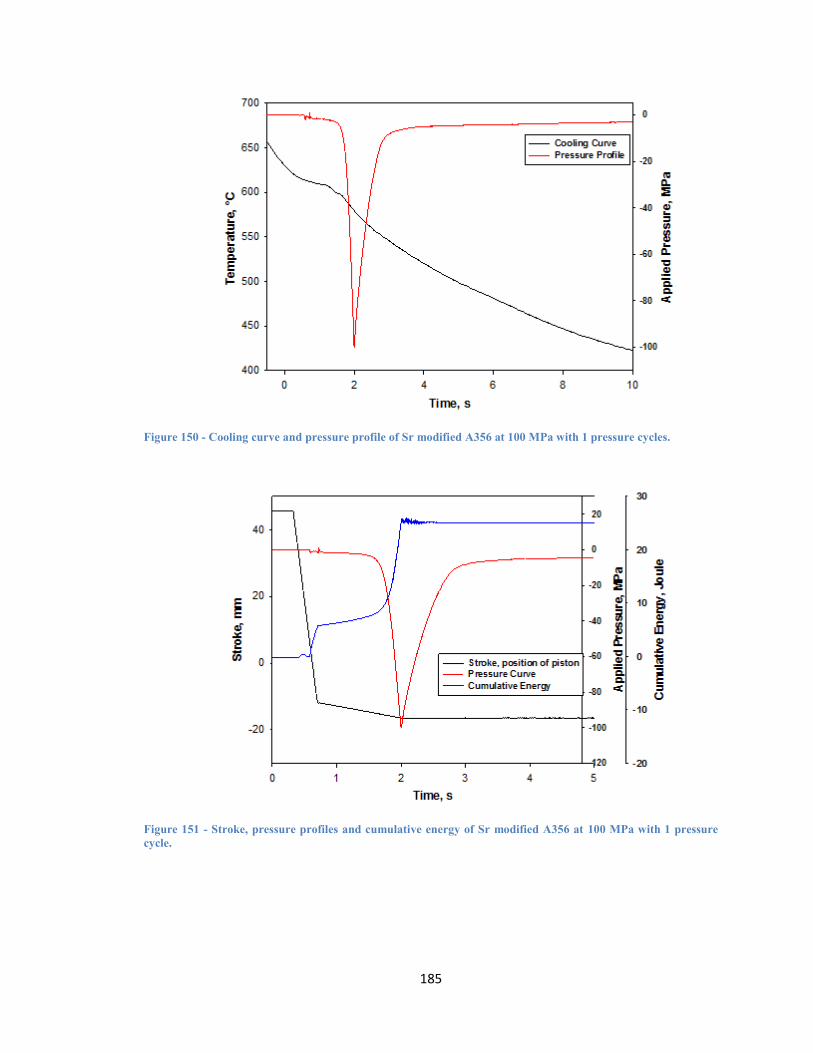
185
Figure 150 - Cooling curve and pressure profile of Sr modified A356 at 100 MPa with 1 pressure cycles.
Figure 151 - Stroke, pressure profiles and cumulative energy of Sr modified A356 at 100 MPa with 1 pressure
cycle.
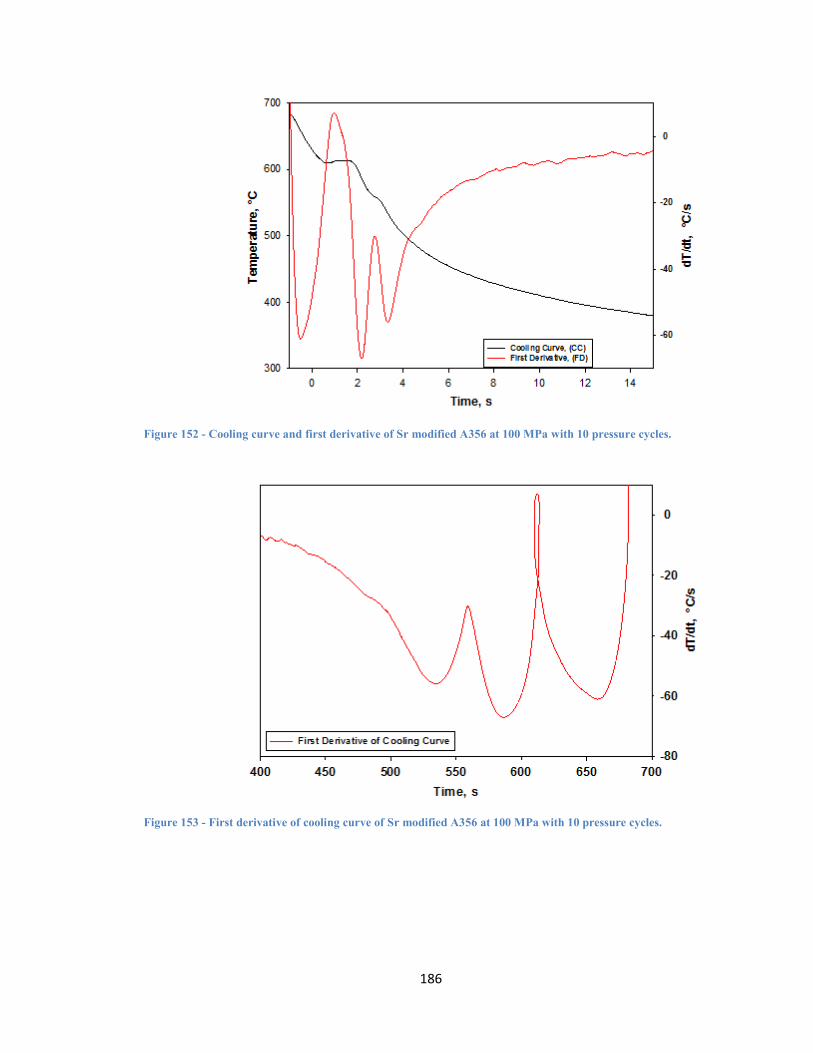
186
Figure 152 - Cooling curve and first derivative of Sr modified A356 at 100 MPa with 10 pressure cycles.
Figure 153 - First derivative of cooling curve of Sr modified A356 at 100 MPa with 10 pressure cycles.

187
Figure 154 - Cooling curve and pressure profile of Sr modified A356 at 100 MPa with 10 pressure cycles.
Figure 155 - Stroke, pressure profiles and cumulative energy of Sr modified A356 at 100 MPa with 10 pressure
cycles.

188
Figure 156 – Cooling curve and its first derivative of Sr modified A356 at 115 MPa with 7 pressure cycles.
Figure 157 - First derivative of cooling curve of Sr modified A356 at 115 MPa with 7 pressure cycles.

189
Figure 158 - Cooling curve and pressure profile of Sr modified A356 at 115 MPa with 7 pressure cycles.
Figure 159 - Stroke, pressure profile and cumulative energy of Sr modified A356 at 115 MPa with 7 pressure
cycles.

190
Figure 160 – Cooling curve and its first derivative of Sr modified A356 at 115 MPa with 50 pressure cycles.
Figure 161 - First derivative of cooling curve of Sr modified A356 at 115 MPa with 50 pressure cycles.

191
Figure 162 - Cooling curve and pressure profile of Sr modified A356 at 115 MPa with 50 pressure cycles.
Figure 163 - Stroke, pressure profile and cumulative energy of Sr modified A356 at 115 MPa with 50 pressure
cycles.

192
Appendix C – Nano Alumina Modified A356 at Different Pressure Profiles (Cooling
Curve, First Derivative Curve, Pressure Curve, Stroke and Cumulative Energy
Curve)
Figure 164 - Cooling curve and its first derivative of Nano alumina modified A356 at atmospheric pressure.
Figure 165 - First derivative of cooling curve of Nano alumina modified A356 at atmospheric pressure.
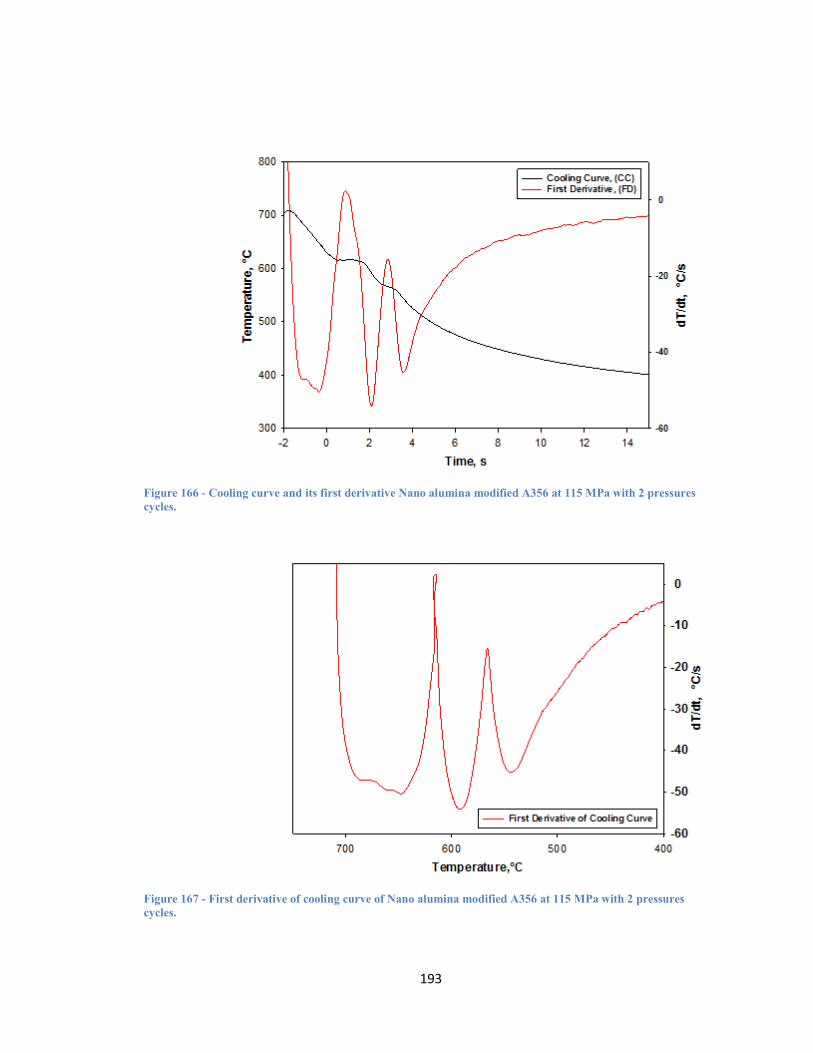
193
Figure 166 - Cooling curve and its first derivative Nano alumina modified A356 at 115 MPa with 2 pressures
cycles.
Figure 167 - First derivative of cooling curve of Nano alumina modified A356 at 115 MPa with 2 pressures
cycles.

194
Figure 168 - Cooling curve and pressure profile of Nano alumina modified A356 at 115 MPa with 2 pressures
cycles
Figure 169 - Stroke, pressure profile and cumulative energy of Nano alumina modified A356 at 115 MPa with 2
pressures cycles.
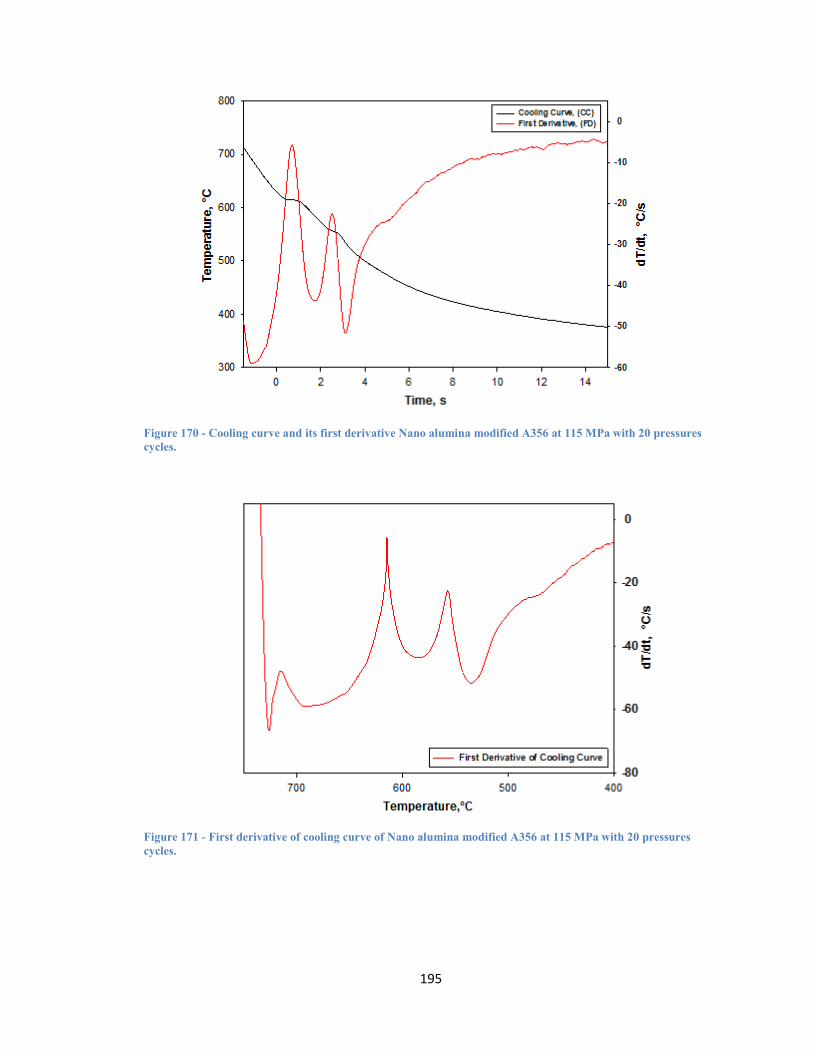
195
Figure 170 - Cooling curve and its first derivative Nano alumina modified A356 at 115 MPa with 20 pressures
cycles.
Figure 171 - First derivative of cooling curve of Nano alumina modified A356 at 115 MPa with 20 pressures
cycles.
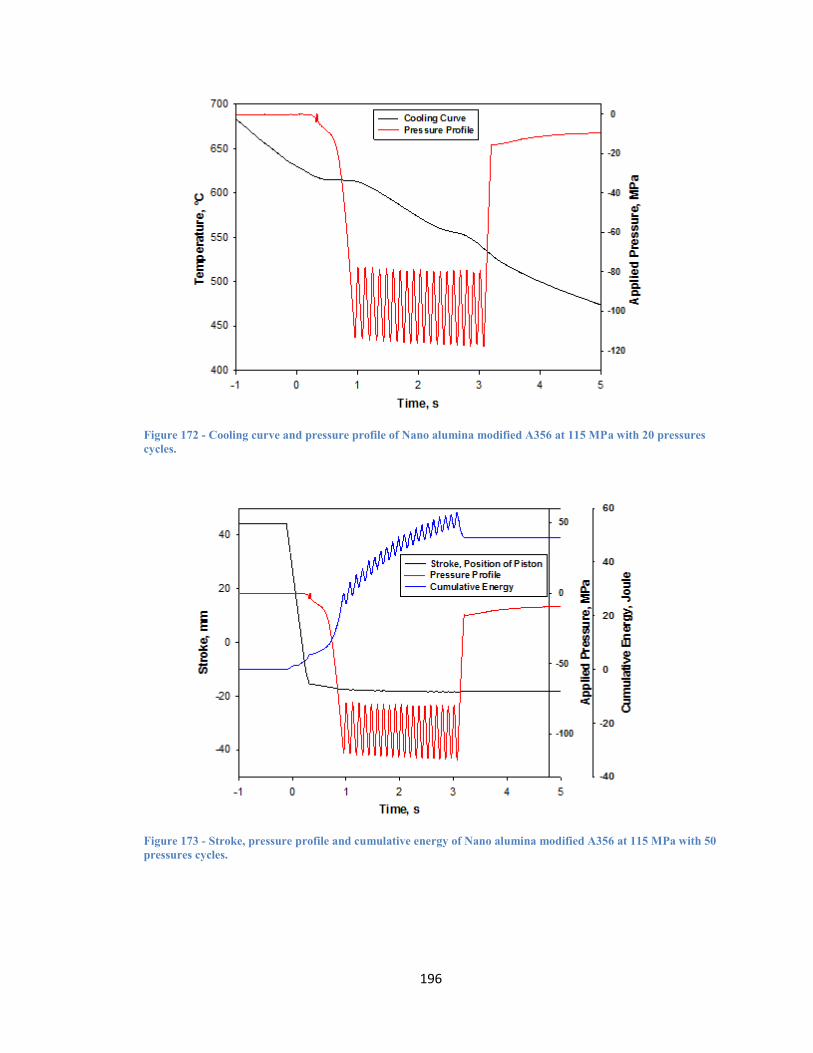
196
Figure 172 - Cooling curve and pressure profile of Nano alumina modified A356 at 115 MPa with 20 pressures
cycles.
Figure 173 - Stroke, pressure profile and cumulative energy of Nano alumina modified A356 at 115 MPa with 50
pressures cycles.

197
Figure 174 - Cooling curve and its first derivative Nano alumina modified A356 at 115 MPa with 50 pressures
cycles.
Figure 175 - First derivative of cooling curve of Nano alumina modified A356 at 115 MPa with 50 pressures
cycles.

198
Figure 176 - Cooling curve and pressure profile of Nano alumina modified A356 at 115 MPa with 50 pressures
cycles.
Figure 177 - Stroke, pressure profile and cumulative energy of Nano alumina modified A356 at 115 MPa with 50
pressures cycles.

199
Appendix D – Sr and Nano Alumina Combinedly Modified A356 at Different
Pressure Profiles (Cooling Curve, First Derivative Curve, Pressure Curve, Stroke
and Cumulative Energy Curve)
Figure 178 - Cooling Curve and its first derivative of Sr and Nano alumina modified A356 at atmospheric
pressure.
Figure 179 - First derivative of cooling curve of Sr and Nano alumina modified A356 at atmospheric pressure.
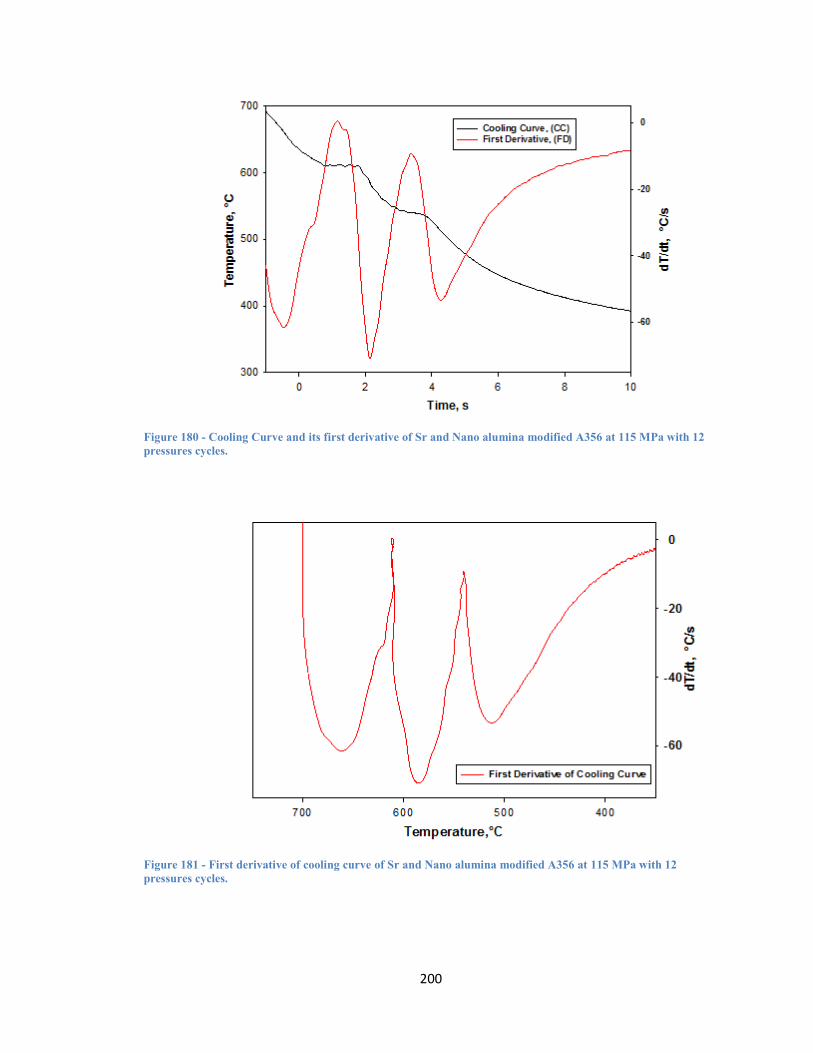
200
Figure 180 - Cooling Curve and its first derivative of Sr and Nano alumina modified A356 at 115 MPa with 12
pressures cycles.
Figure 181 - First derivative of cooling curve of Sr and Nano alumina modified A356 at 115 MPa with 12
pressures cycles.

201
Figure 182 - Cooling curve and pressure profile of Sr and Nano alumina modified A356 at 115 MPa with 12
pressures cycles.
Figure 183 - Stroke, Pressure profile and cumulative energy of Sr and Nano alumina modified A356 at 115 MPa
with 12 pressures cycles.

202
Figure 184 - Cooling Curve and its first derivative of Sr and Nano alumina modified A356 at 115 MPa with 20
pressures cycles.
Figure 185 - First derivative of cooling curve of Sr and Nano alumina modified A356 at 115 MPa with 20
pressures cycles.

203
Figure 186 - Cooling curve and pressure profile of Sr and Nano alumina modified A356 at 115 MPa with 20
pressures cycles.
Figure 187 - Stroke, Pressure profile and cumulative energy of Sr and Nano alumina modified A356 at 115 MPa
with 20 pressures cycles.

204
Figure 188 - Cooling Curve and its first derivative of Sr and Nano alumina modified A356 at 115 MPa with 50
pressures cycles.
Figure 189 - First derivative of cooling curve of Sr and Nano alumina modified A356 at 115 MPa with 50
pressures cycles.
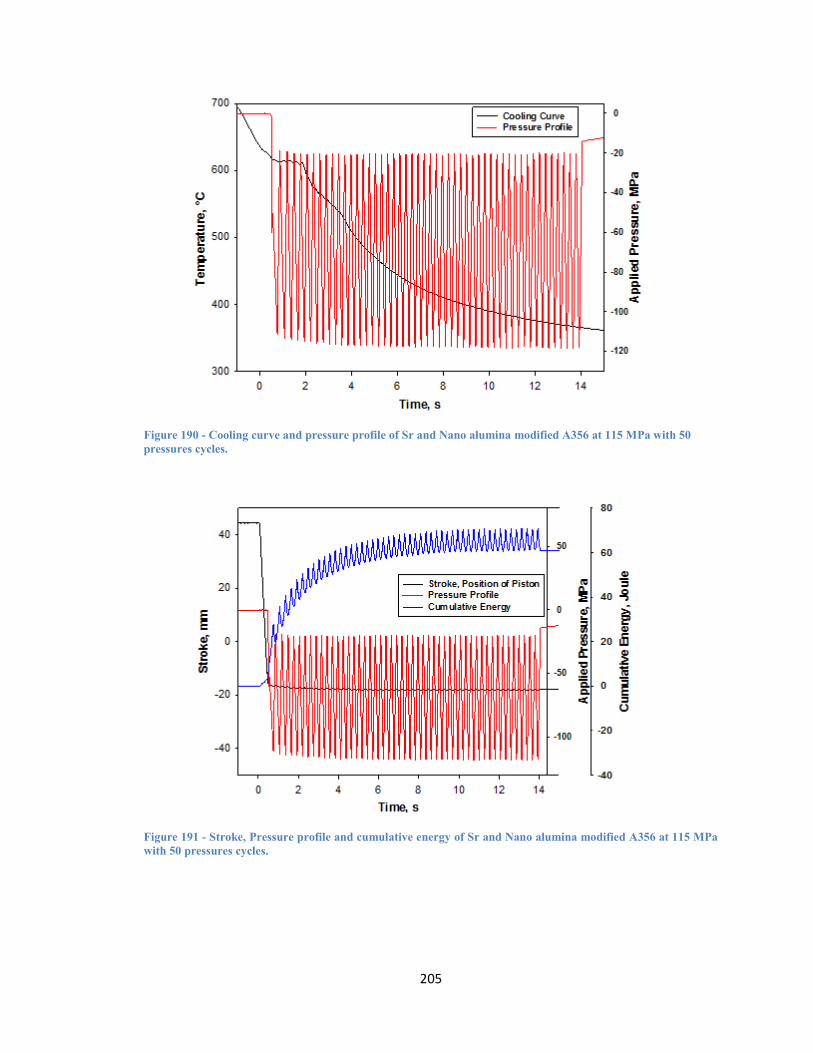
205
Figure 190 - Cooling curve and pressure profile of Sr and Nano alumina modified A356 at 115 MPa with 50
pressures cycles.
Figure 191 - Stroke, Pressure profile and cumulative energy of Sr and Nano alumina modified A356 at 115 MPa
with 50 pressures cycles.

206
Appendix E - Non Linear Regression for the Correlation between the α-Dendrite
Growth Peak Temperature and the Cyclic Pressure of UM A356 alloy at Different
Pressure Profiles.
Nonlinear Regression Saturday, January 04, 2014, 12:23:31 PM
Data Source: Squeeze casting A356 UM (α-dendrite growth peak temperature and cyclic pressure of UM
A356 alloy at different pressure profiles)
Equation: 3D, Lorentzian
f = a/((1+((x-x0)/b)2)*(1+((y-y0)/c)2))
R Rsqr Adj Rsqr Standard Error of Estimate
0.8814 0.7769 0.5537 2.2248
Coefficient Std. Error t P
x0 11821.4713 2189821.8988 0.0054 0.9960
y0 9.5026 24.0970 0.3943 0.7134
a 2612.8240 1575095.8419 0.0017 0.9988
b 6539.3980 1362891.6004 0.0048 0.9964
c 340.3248 176.2774 1.9306 0.1257
Analysis of Variance:
DF SS MS
Regression 5 3421520.6737 684304.1347
Residual 4 19.7988 4.9497
Total 9 3421540.4725 380171.1636
Corrected for the mean of the observations:
DF SS MS F P
Regression 4 68.9268 17.2317 3.4814 0.1272
Residual 4 19.7988 4.9497
Total 8 88.7256 11.0907
Statistical Tests:
Normality Test (Shapiro-Wilk) Passed (P = 0.8448)
W Statistic= 0.9646 Significance Level = 0.0500
Constant Variance Test Passed (P = 0.6116)
Fit Equation Description: [Variables]
x = col(1)
y = col(2)
z = col(3)
reciprocal_z = 1/abs(z)

207
reciprocal_zsquare = 1/z^2
reciprocal_pred = 1/abs(f)
reciprocal_predsqr = 1/f^2
[Parameters]
x0 = xatymax(x,z) ''Auto {{previous: 11821.5}}
y0 = xatymax(y,z) ''Auto {{previous: 9.50265}}
a = max(z) ''Auto {{previous: 2612.82}}
b = if(fwhm(x,z)<>0, fwhm(x,z)/2, (max(x)-min(x))/4) ''Auto {{previous: 6539.4}}
c = if(fwhm(y,z)<>0, fwhm(y,z)/2, (max(y)-min(y))/4) ''Auto {{previous: 340.325}}
[Equation]
f = a/((1+((x-x0)/b)^2)*(1+((y-y0)/c)^2))
fit f to z
''fit f to z with weight reciprocal_pred
''fit f to z with weight reciprocal_predsqr
''fit f to z with weight reciprocal_z
''fit f to z with weight reciprocal_zsquare
[Constraints]
[Options]
tolerance=1e-8
''tolerance=0.0000000001
''tolerance=1e-7
''tolerance=1e-9
stepsize=1
iterations=2000
''iterations=1000
''iterations=1500
''iterations=200
Number of Iterations Performed = 822
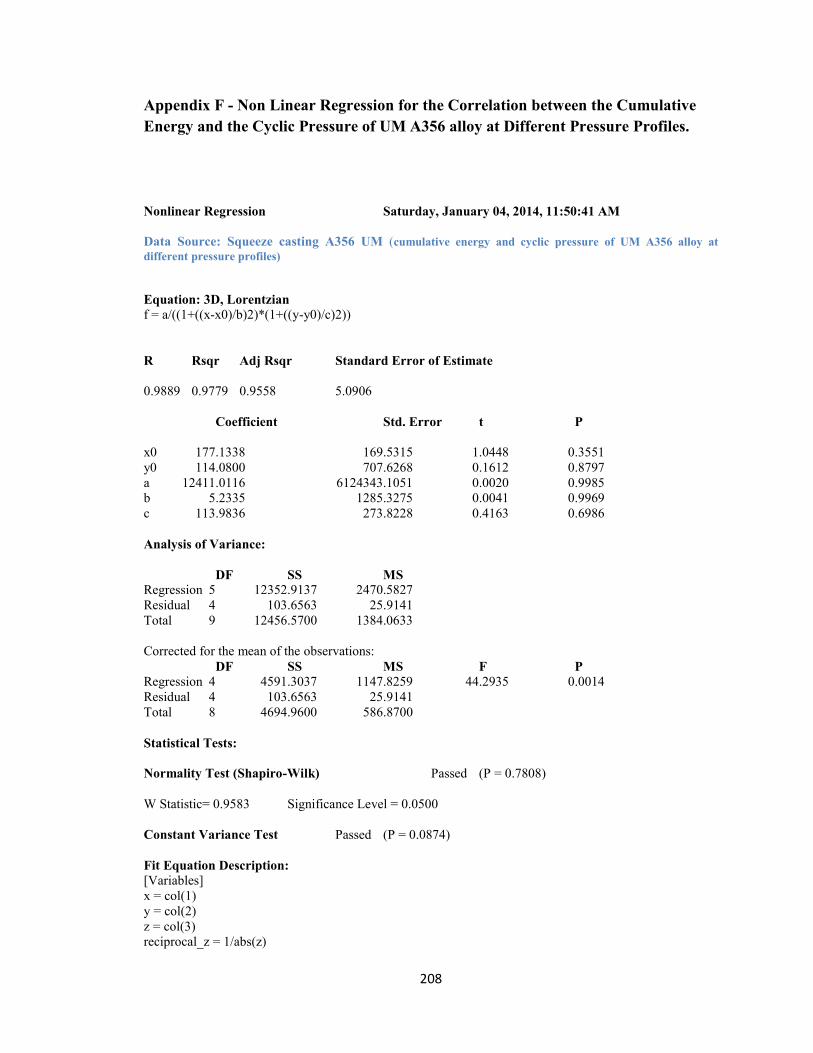
208
Appendix F - Non Linear Regression for the Correlation between the Cumulative
Energy and the Cyclic Pressure of UM A356 alloy at Different Pressure Profiles.
Nonlinear Regression Saturday, January 04, 2014, 11:50:41 AM
Data Source: Squeeze casting A356 UM (cumulative energy and cyclic pressure of UM A356 alloy at
different pressure profiles)
Equation: 3D, Lorentzian
f = a/((1+((x-x0)/b)2)*(1+((y-y0)/c)2))
R Rsqr Adj Rsqr Standard Error of Estimate
0.9889 0.9779 0.9558 5.0906
Coefficient Std. Error t P
x0 177.1338 169.5315 1.0448 0.3551
y0 114.0800 707.6268 0.1612 0.8797
a 12411.0116 6124343.1051 0.0020 0.9985
b 5.2335 1285.3275 0.0041 0.9969
c 113.9836 273.8228 0.4163 0.6986
Analysis of Variance:
DF SS MS
Regression 5 12352.9137 2470.5827
Residual 4 103.6563 25.9141
Total 9 12456.5700 1384.0633
Corrected for the mean of the observations:
DF SS MS F P
Regression 4 4591.3037 1147.8259 44.2935 0.0014
Residual 4 103.6563 25.9141
Total 8 4694.9600 586.8700
Statistical Tests:
Normality Test (Shapiro-Wilk) Passed (P = 0.7808)
W Statistic= 0.9583 Significance Level = 0.0500
Constant Variance Test Passed (P = 0.0874)
Fit Equation Description: [Variables]
x = col(1)
y = col(2)
z = col(3)
reciprocal_z = 1/abs(z)

209
reciprocal_zsquare = 1/z^2
reciprocal_pred = 1/abs(f)
reciprocal_predsqr = 1/f^2
[Parameters]
x0 = xatymax(x,z) ''Auto {{previous: 177.134}}
y0 = xatymax(y,z) ''Auto {{previous: 114.08}}
a = max(z) ''Auto {{previous: 12411}}
b = if(fwhm(x,z)<>0, fwhm(x,z)/2, (max(x)-min(x))/4) ''Auto {{previous: 5.23346}}
c = if(fwhm(y,z)<>0, fwhm(y,z)/2, (max(y)-min(y))/4) ''Auto {{previous: 113.984}}
[Equation]
f = a/((1+((x-x0)/b)^2)*(1+((y-y0)/c)^2))
fit f to z
''fit f to z with weight reciprocal_pred
''fit f to z with weight reciprocal_predsqr
''fit f to z with weight reciprocal_z
''fit f to z with weight reciprocal_zsquare
[Constraints]
[Options]
tolerance=1e-7
''tolerance=0.0000000001
stepsize=1
iterations=1000
''iterations=200
Number of Iterations Performed = 368

210
Appendix G – Permission from Co-Author
211
VITA AUCTORIS
NAME: Mohammad Khurshed-Ul Alam
PLACE OF BIRTH:
Chittagong, Bangladesh
YEAR OF BIRTH:
1974
EDUCATION:
Notre Dame College, Dhaka, Bangladesh,
Higher Secondary Certificate, Science 1991
Bangladesh University of Engineering & Technology, Dhaka
B.A.Sc., Materials and Metallurgical Engineering, 1998
University of Windsor, Windsor, Ontario, Canada
M.A.Sc., Mechanical, Automotive & Materials Engineering, 2014
Copyright © 2022 FDOKUMEN