Using functional neuroimaging to advance entrepreneurial ...
Upload
khangminh22Category
view
1download
0
HAL Id: tel-02425625https://tel.archives-ouvertes.fr/tel-02425625v1
Submitted on 30 Dec 2019 (v1), last revised 17 Nov 2020 (v2)
HAL is a multi-disciplinary open accessarchive for the deposit and dissemination of sci-entific research documents, whether they are pub-lished or not. The documents may come fromteaching and research institutions in France orabroad, or from public or private research centers.
L’archive ouverte pluridisciplinaire HAL, estdestinée au dépôt et à la diffusion de documentsscientifiques de niveau recherche, publiés ou non,émanant des établissements d’enseignement et derecherche français ou étrangers, des laboratoirespublics ou privés.
Structural and microstructural neuroimaging fordiagnosis and tracking of neurodegenerative diseases
Junhao Wen
To cite this version:Junhao Wen . Structural and microstructural neuroimaging for diagnosis and tracking of neurodegen-erative diseases. Artificial Intelligence [cs.AI]. Sorbonne Universites, UPMC University of Paris 6,2019. English. �tel-02425625v1�

STRUCTURAL AND MICROSTRUCTURAL NEUROIMAGING FOR DIAGNOSIS AND TRACKING OF
NEURODEGENERATIVE DISEASES
JU NHAO WEN
Image credit : generated by deep dream


Sorbonne Université
École Doctorale d’Informatique, de Télécommunication et d’Électronique (EDITE)
ARAMIS LAB à l’Institut du Cerveau et de la Moelle épinière (ICM)
S T R U C T U R A L A N D M I C R O S T R U C T U R A L
N E U R O I M A G I N G F O R D I A G N O S I S A N D
T R A C K I N G O F N E U R O D E G E N E R A T I V E
D I S E A S E S
NE UROIMAGE RIE STRUCTURE L E T MICROSTRUCTURE L POUR LE DIAGNOSTIC E T LE SUIVI DE
MALADIE S NE URODEGE NE RATIVE S
JUNHAO WEN
Thèse de doctorat d’informatique
Dirigée par Olivier Colliot, Stanley Durrleman et Anne Bertrand
Présentée et soutenue publiquement le 4 Juillet 2019
Devant un jury composé de :
o M. Frederik BARKHOF
Professeur, Vrije University, Rapporteur
o M. Pierrick COUPÉ
Chargé de recherche, Bordeaux Université, Rapporteur
o M. Matthieu CORD Professeur, Sorbonne Université, Examinateur
o M. Olivier COMMOWICK
Chargé de recherche, INRIA, Examinateur
o M. Olivier COLLIOT
Directeur de recherche, CNRS, Directeur de thèse
o M. Stanley DURRLEMAN Directeur de recherche, INRIA, Co-Directeur de thèse


iii
Abstract
STRUCTURAL AND MICROSTRUCTURAL NEUROIMAGING FORDIAGNOSIS AND TRACKING OF NEURODEGENERATIVE DISEASES
by Junhao WEN
Biomarker identification and tracking in dementia are essential to better under-stand the pathological mechanism and disease trajectory. For this purpose, vari-ous types of data, including cognitive and clinical tests, neuroimaging and fluidbiomarkers, have been used. Another challenge is early diagnosis of dementia. Itis of great importance to diagnose patients in an early stage at which brain damageis not yet severe and may be reversible. Tracking and diagnosis at an early stageultimately ensures a proper care of patients, and monitoring of disease-modifyingtherapeutic treatment.
The current PhD aims has two main objectives. First, we aim to identify themost promising biomarkers at the presymptomatic stage of dementia. More specif-ically, we studied this in the case of genetic frontotemporal lobar degeneration(FTLD) due to C9orf72 mutation. The second objective is to advance early diag-nosis and prognosis by using machine learning (ML) methods with magnetic res-onance imaging (MRI) data. We tackle this in the context of sporadic Alzheimer’sdisease (AD).
According to these two objectives, the thesis consists of two main parts, eachpart comprising two studies. In the first study, biomarkers were identified fromconventional T1-weighted MRI and diffusion tensor imaging (DTI) model. Thesecond study compared the sensitivity and specificity of the advanced NeuriteOrientation Dispersion and Density Imaging (NODDI) model and to that of con-ventional techniques, namely T1-weighted MRI and DTI. The second part focuseson early diagnosis of AD and comprises the last two studies. The third study pro-poses an open source framework for reproducible evaluation of AD classificationusing diffusion MRI and conventional ML methods. The last study extends thisframework to deep learning methods and demonstrates its use on T1-weightedMRI. Generally, we aim to improve the transparency and reproducibility in thefield, including clarifying the bad practices, sharing the tools and source code forreproducible research and rigorously comparing different approaches.


v
Résuméby Junhao WEN
L’identification et le suivi de biomarqueur de la démence sont essentiels pourmieux comprendre les mécanismes pathologiques et la trajectoire de la maladie.À cette fin, divers types de données, tests cognitifs et cliniques, neuroimagerie etbiomarqueurs des fluides périphériques, ont été utilisés. Le diagnostic précocede la démence constitue un autre défi. Il est très important de diagnostiquer lespatients à un stade précoce auquel les lésions cérébrales ne sont pas encore sévèreset peuvent être réversibles. Le suivi et le diagnostic à un stade précoce permettentune prise en charge adéquate des patients et de mesurer l’efficacité de nouveauxtraitements.
Cette thèse a deux objectifs principaux. Premièrement, nous cherchons à iden-tifier les biomarqueurs les plus prometteurs au stade présymptomatique de la dé-mence. Plus spécifiquement, nous avons étudié ce phénomène dans le cas de ladégénérescence lobaire frontotemporale (FTLD) due à la mutation C9orf72. Ledeuxième objectif est de faire progresser le diagnostic et le pronostic précoces enutilisant des méthodes d’apprentissage machine et des données d’imagerie par ré-sonance magnétique (IRM). Nous abordons cette question dans le contexte de lamaladie d’Alzheimer sporadique (MA).
Suivant ces deux objectifs, la thèse se compose de deux parties principales,chaque partie comprenant deux études. Dans la première étude, les biomarqueursont été identifiés à partir de l’IRM conventionnelle pondérée T1 et du modèled’imagerie du tenseur de diffusion (DTI). La deuxième étude a comparé la sen-sibilité et la spécificité du modèle NODDI (Advanced Neurite Orientation Dis-persion and Density Imaging) et celle de techniques conventionnelles, à savoirl’IRM pondérée en T1 et le DTI. La deuxième partie porte sur le diagnostic pré-coce de la MA et comprend les deux dernières études. La troisième étude proposeun cadre open source pour une évaluation reproductible de la classification de laMA à l’aide de l’IRM de diffusion et des méthodes classiques d’apprentissage. Ladernière étude étend ce cadre aux méthodes d’apprentissage profond et démontreson utilisation sur l’IRM pondérée en T1. Généralement, nous visons à améliorer latransparence et la reproductibilité de ces recherches, notamment en mettant en év-idence les mauvaises pratiques, en partageant les outils et le code source pour unerecherche reproductible et en comparant rigoureusement différentes approches.


vii
AcknowledgementsThis wonderful journey heads to the end. I am very grateful to all the beautiful
things that I have ever encountered during this PhD.Firstly, I thank the financial support from China Scholarship Council (CSC) and
ARAMIS laboratory during my PhD.Secondly, I would like to thank myself, who had enough courage to pursue a
PhD at the very beginning, with knowing almost nothing about machine learning,neuroscience and French, little about English. I am so grateful for the 4-year life inParis: I have been intensively emerged into the scientific topics that attract me; Ihave mastered English, French and Spanish; I have traveled to 18 countries all overthe world; I have experienced too many my-first-time, such as surfing and skate.As Ernest Hemingway said, "Paris est une fête", Paris will always accompany me.
Thirdly, I am so grateful to my three supervisors during my PhD: Olivier Col-liot, Anne Bertrand and Stanley Durrleman. Thank you for guiding me into thisfield.
Fourthly, I would like to thank my families for all their supports: my father,mother and big brother. Especially my father, who has always high expectationsfor me.
Fifthly, I want to thank all my friends and colleagues. I am so happy to meet"Mi hermano comunista" Jorge and "Mon fiston" Alex, I can not imagine a PhDwithout you. I enjoyed all the jokes, gyms, saunas and parties that we experiencedtogether. I remember all the wonderful moments with Aleix and Susana at CitéUniversitaire de Paris and also during our trips to Grans Canaria and Iceland. Ithank Mingyue for accompanying me to come to ICM in the weekends. I appre-ciate all the time with Cata and Jérémy being around my place in ARAMIS. Wewent through this wonderful journey together. I thank all the help for my Frenchlearning, especially Alex for the bad words, Jérémy for the grammar correctionand Martina and Marie for the practicing time. For my Spanish learning (a lot ofthanks to Marie, Juliana, Jorge and Cata), I would like to especially thank Julianabecause I have an Argentina accent thanks to you! I enjoyed each time for theskate patrolling in the streets of Paris with Benoît and Raphaël. Also, I hope wewill make it work for our first surfing trip.
Finally, longing for a new journey, I hope that I can always find happiness andsatisfaction in science and always be myself.


ix
Scientific production
JOURNAL PAPERS
1. Wen, J., Zhang, H., Alexander, D.C., Durrleman, S., Routier, A., Rinaldi, D.,Houot, M., Couratier, P., Hannequin, D., Pasquier, F. and Zhang, J., Colliot,O., Le Ber., I. and Bertrand, A. Neurite Density is Reduced in the Presymp-tomatic Phase of C9orf72 Disease, J Neurol Neurosurg Psychiatry, pp.jnnp-2018. https://hal.inria.fr/hal-01907482/file/WEN_NODDI-R1_manuscript_2018_10_27_postprint.pdf. (Chapter 2 of the dissertation)
2. Bertrand, A., Wen, J. (Co-first author), Rinaldi, D., Houot, M., Sayah, S., Ca-muzat, A., Fournier, C., Fontanella, S., Routier, A., Couratier, P. and Pasquier,F., Habert, M., Hannequin, D., Martinaud, O., Caroppo, P., Levy, R., Dubois,B., Brice, A., Durrleman, S. and Colliot, O., Le Ber. Early Cognitive, Struc-tural, and Microstructural Changes in Presymptomatic C9orf72 Carriers YoungerThan 40 Years. JAMA Neurology, 75(2), pp.236-245, 2018. https://hal.inria.fr/hal-01654000/document (Chapter 1 of the dissertation)
3. Samper-González, J., Burgos, N., Bottani, S., Fontanella, S., Lu, P., Marcoux,A., Routier, A., Guillon, J., Bacci, M., Wen, J. and Bertrand, A., Bertin, H.,Habert, M., Durrleman, S., Evgeniou, T. and Colliot, O. Reproducible evalu-ation of classification methods in Alzheimer’s disease : framework and ap-plication to MRI and PET data. Neuroimage, 183, pp.504-521.2018. https://hal.inria.fr/hal-01858384/document
4. Marcoux, A., Burgos, N., Bertrand, A., Teichmann, M., Routier, A., Wen, J.,Samper-González J, Bottani S, Durrleman S, Habert M-O, and Colliot O. AnAutomated Pipeline for the Analysis of PET Data on the Cortical Surface,Frontiers in Neuroinformatics, 12, 2018. https://hal.inria.fr/hal-01950933.
SUBMITTED JOURNAL PAPERS

x
1. Wen, J., Thibeau–Sutre, Jorge S., Routiere A., Bottanie, S., Durrlemane, S.,Burgos, N., Colliot, O. Convolutional Neural Networks for Classificationof Alzheimer’s Disease: Overview and Reproducible Evaluation, Submit-ted to Medical Image Analysis. https://arxiv.org/pdf/1904.07773.pdf.(Chapter 4 of the dissertation)
2. Wen, J., Samper-González, J., Bottani, S., Routier, A., Burgos, N., Jacquemont,T., Fontanella, S., Durrleman, S., Epelbaum, S., Bertrand, A., and Colliot, O.Reproducible evaluation of diffusion MRI features for automatic classifica-tion of patients with Alzheimer’s disease, Submitted to Neuroinformatics.https://arxiv.org/pdf/1812.11183.pdf. (Chapter 3 of the dissertation)
3. Yue, L., Hu, D., Zhang, H., Wen, J., Wu, Y., Wang, T., Shen D., Xiao, S.Prediction of 7-year MCI progression from subjective cognitive decline: Ev-idence from the China Longitudinal Ageing Study (CLAS), Submitted toAlzheimer’s & Dementia.
4. Routier, A., Burgos, N., Guillon, J., Samper-González, J., Wen, J., Bottani, S.,Marcoux, A., Bacci, M., Fontanella, S., Jacquemont, T., Gori, P., Guyot, A., Lu,P., Diaz Melo, D., Thibeau—Sutre, E., Moreau, T., Teichmann, M., Habert, M.-O., Durrleman, S., Colliot, O. Submitted to Frontiers in Neuroinformatics.
CONFERENCE ABSTRACTS
1. Wen, J., Samper-Gonzalez, J., Routier, A., Bottani, S., Durrleman, S., Burgos,N. and Colliot, O. Beware of feature selection bias! Example on Alzheimer’sdisease classification from diffusion MRI. Organization for Human BrainMapping Annual Meeting, OHBM 2019, Rome, June 2019. https://hal.inria.fr/hal-02105134/document
2. Wen, J., Elina Thibeau–Sutre, Samper-Gonzalez, J., Routier, A., Bottani, S.,Didier Dormont, Durrleman, S., Colliot, O and Burgos, N. How serious isdata leakage in deep learning studies on Alzheimer’s disease classification?Organization for Human Brain Mapping Annual Meeting, OHBM 2019,Rome, June 2019. https://hal.inria.fr/hal-02105133/document
3. Wen, J., Samper-González, J., Bottani, S., Routier, A., Burgos, N., Jacquemont,T., Fontanella, S., Durrleman, S., Bertrand, A. and Colliot, O. Using diffu-sion MRI for classification and prediction of Alzheimer’s Disease : a repro-ducible study. Alzheimer’s Association International Conference, AAIC2018, Chicago, USA, July, 2018. https://www.alzheimersanddementia.com/article/S1552-5260(18)32351-3/fulltext

xi
4. Wen, J., Samper-Gonzalez, J., Bottani, S., Routier, A., Burgos, N., Jacque-mont, T., Fontanella, S., Durrleman, S., Bertrand, A. and Colliot, O. Compar-ison of DTI Features for the Classification of Alzheimer’s Disease : A Repro-ducible Study. Organization for Human Brain Mapping Annual Meeting,OHBM 2018, Singapore, June 2018. https://hal.inria.fr/hal-01758206/document
5. Wen, J., Zhang, H., Alexander, D., Durrleman, S., Routier, A., Rinaldi, D.,Houot, M., Zhang, J., Colliot, O., Le Ber, I. and Bertrand, A. NODDI High-lights Promising New Markers In Presymptomatic C9orf72 Carriers. Orga-nization for Human Brain Mapping Annual Meeting, OHBM 2018, Singa-pore, June 2018. https://hal.inria.fr/hal-01758137/document
6. Wen, J., Thibeau–Sutre, E., Samper-González, J., Routier, S., Bottani, S., Dor-mont, D., Durrleman, S., Colliot, O., Burgos, N. How serious is data leakagein deep learning studies on Alzheimer’s disease classification? Organiza-tion for Human Brain Mapping Annual Meeting, OHBM 2019, Italy, Roma2019.
7. Wen, J., Samper-González, J., Routier, A., Bottani, S., Durrleman S., Burgos,N., Colliot, O. Beware of feature selection bias! Example on Alzheimer’s dis-ease classification from diffusion MRI Organization for Human Brain Map-ping Annual Meeting, OHBM 2019, Italy, Roma 2019.
8. Samper-González, J., Bottani, S., Burgos, N., Fontanella, S., Lu, P., Marcoux,A., Routier, A., Guillon, J., Bacci, M., Wen, J., Bertrand, A., Bertin, H., Habert,M-O., Durrleman, S., Evgeniou, T., and Colliot, O. Reproducible evaluationof Alzheimer’s Disease classification from MRI and PET data, In Annualmeeting of the Organization for Human Brain Mapping - OHBM 2018, Sin-gapore, June 2018, https://hal.inria.fr/hal-01761666
9. Marcoux, A., Burgos, N., Bertrand, A., Teichmann, M., Routier, A., Wen, J.,Samper-González, J., Bottani, S., Durrleman, S., Habert, M-O. and Colliot,O. A pipeline for the analysis of 18F-FDG PET data on the cortical surfaceand its evaluation on ADNI, In Annual meeting of the Organization forHuman Brain Mapping - OHBM 2018, Singapore, June 2018, https://hal.archives-ouvertes.fr/hal-01757646
10. Routier, A., Guillon, J., Burgos, N., Samper-González, J., Wen, J., Fontanella,S., Bottani, S., Jacquemont, T., Marcoux, A., Gori, P., Lu, P., Moreau, T., Bacci,M., Durrleman, S., and Colliot, O. Clinica: an open source software platformfor reproducible clinical neuroscience studies. In Annual meeting of the

xii
Organization for Human Brain Mapping - OHBM 2018, Singapore, June2018, https://hal.inria.fr/hal-01760658
11. Yue, L., Wen, J. and Xiao, S. Asymmetry of Medial Temporal Lobe Associ-ated with Cognitive Deterioration in Sub- jective Memory Decline : A Chi-nese Community Study with One Year Follow-up. Alzheimer’s AssociationInternational Conference, AAIC 2018, Chicago, USA, July, 2018. https://www.alzheimersanddementia.com/article/S1552-5260(18)30557-0/abstract
12. Bertrand, A., Wen, J., Rinaldi, D., Camuzat, A., Fontanella, S., Routier, A.,Couratier, P., Pasquier, F., Martinaud, O., Durrleman, S. and Brice, A., Colliot,O. and Le Ber., I. Accelerated Subcortical Atrophy During Aging Presymp-tomatic Carriers of C9orf72 Mutation. In Annual meeting of the Organi-zation for Human Brain Mapping - OHBM 2017, UK, London, July 2017.https://www.alzheimersanddementia.com/article/S1552-5260(17)31814-9/fulltext
TALKS AND POSTERS
1. Poster – Annual meeting of the Organization for Human Brain Mapping-OHBM, Italy, Rome, June 2019.
2. Oral – ICM - IoN Workshop, Paris, France, October 2018.
3. Poster – Annual meeting of the Organization for Human Brain Mapping-OHBM, Singapore, June 2018.
4. Poster – Alzheimer’s Association International Conference, AAIC 2017, USA,Chicago, July 2018.
5. Poster – Alzheimer’s Association International Conference, AAIC 2017, UK,London, July 2017.
SCIENTIFIC POPULARIZATION
1. Fête de la science, Campus Jussieu, Paris, France, 2016
2. Salon Culture et Jeux Mathématiques, Paris France, 2016
3. Fête de la science, ICM, Paris, France, 2017
4. Exchange internship at CIMC lab at UCL, London, 2018

xiii
Contents
Abstract iii
Résumé v
Acknowledgements vii
Scientific production ix
Contents xiii
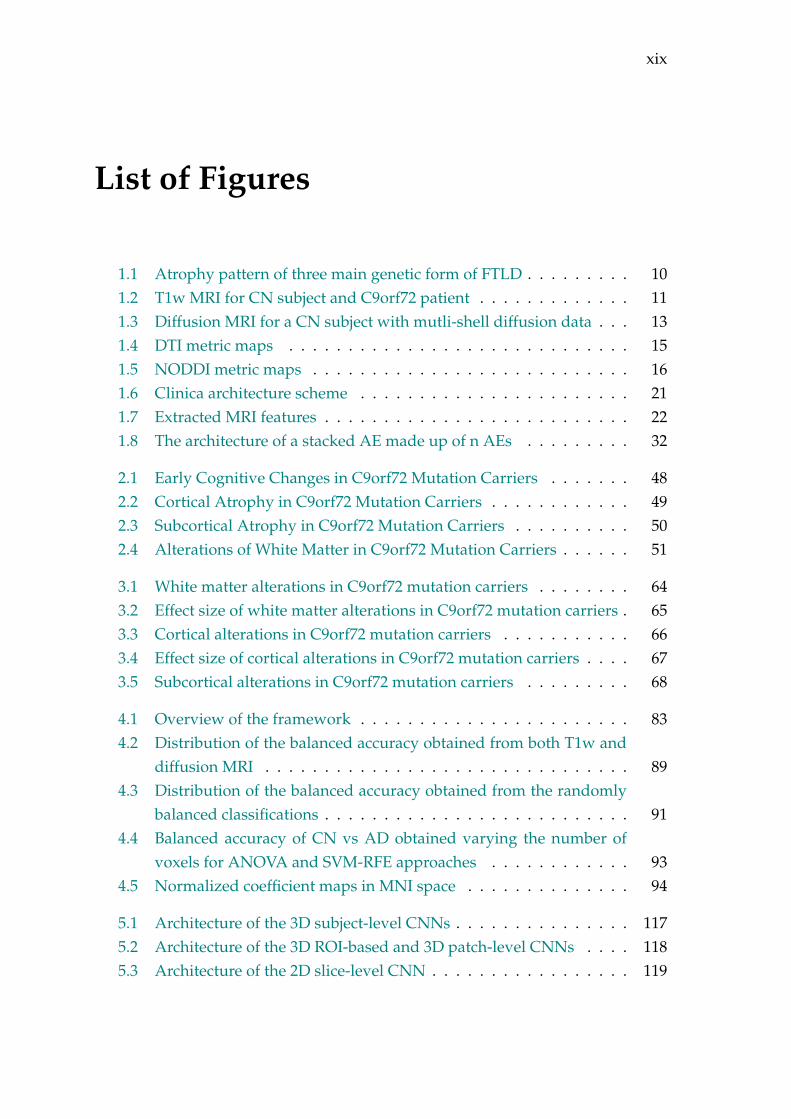
List of Figures xix
List of Tables xxi
List of Abbreviations xxiii
Introduction 1
1 Background 71.1 Neurodegenerative diseases . . . . . . . . . . . . . . . . . . . . . . . 7
1.1.1 Alzheimer’s disease . . . . . . . . . . . . . . . . . . . . . . . 71.1.2 Frontotemporal lobar degeneration . . . . . . . . . . . . . . 9
1.1.2.1 Genetic forms of FTLD . . . . . . . . . . . . . . . . 91.2 Neuroimaging data . . . . . . . . . . . . . . . . . . . . . . . . . . . . 10
1.2.1 Anatomical MRI . . . . . . . . . . . . . . . . . . . . . . . . . 111.2.2 Diffusion MRI . . . . . . . . . . . . . . . . . . . . . . . . . . . 12
1.2.2.1 Diffusion tensor imaging . . . . . . . . . . . . . . . 131.2.2.2 Neurite orientation dispersion and density imaging 15
1.3 Image preprocessing . . . . . . . . . . . . . . . . . . . . . . . . . . . 161.3.1 Bias field correction . . . . . . . . . . . . . . . . . . . . . . . . 171.3.2 Intensity rescaling and standardization . . . . . . . . . . . . 171.3.3 Skull stripping . . . . . . . . . . . . . . . . . . . . . . . . . . 181.3.4 Image registration . . . . . . . . . . . . . . . . . . . . . . . . 181.3.5 Head motion correction . . . . . . . . . . . . . . . . . . . . . 181.3.6 Eddy current-induced distortion correction . . . . . . . . . . 19

xiv
1.3.7 Susceptibility-induced distortion correction . . . . . . . . . . 191.3.8 Other processing steps . . . . . . . . . . . . . . . . . . . . . . 201.3.9 Implementation: Clinica open source platform . . . . . . . . 201.3.10 Extracted features . . . . . . . . . . . . . . . . . . . . . . . . . 21
1.4 Classical statistics . . . . . . . . . . . . . . . . . . . . . . . . . . . . . 241.4.1 Generalized linear model . . . . . . . . . . . . . . . . . . . . 241.4.2 P-value and effect size . . . . . . . . . . . . . . . . . . . . . . 25
1.5 Machine learning . . . . . . . . . . . . . . . . . . . . . . . . . . . . . 261.5.1 Conventional machine learning . . . . . . . . . . . . . . . . . 27
1.5.1.1 Support vector machine . . . . . . . . . . . . . . . . 271.5.1.2 Logistic regression . . . . . . . . . . . . . . . . . . . 271.5.1.3 Random forest . . . . . . . . . . . . . . . . . . . . . 28
1.5.2 Deep learning . . . . . . . . . . . . . . . . . . . . . . . . . . . 281.5.2.1 Main building layers of CNN . . . . . . . . . . . . 281.5.2.2 Classical CNN architectures . . . . . . . . . . . . . 301.5.2.3 Methods to deal with overfitting . . . . . . . . . . . 31
1.5.3 Validation . . . . . . . . . . . . . . . . . . . . . . . . . . . . . 331.5.3.1 Cross-validation . . . . . . . . . . . . . . . . . . . . 331.5.3.2 Performance metrics . . . . . . . . . . . . . . . . . . 33
1.6 Neuroimaging biomarkers of C9orf72 diseases at presymptomaticstage . . . . . . . . . . . . . . . . . . . . . . . . . . . . . . . . . . . . 35
1.7 Classification of AD based on neuroimaging data . . . . . . . . . . 361.8 Datasets . . . . . . . . . . . . . . . . . . . . . . . . . . . . . . . . . . 38
1.8.1 PREVDEMALS dataset for C9orf72 carriers . . . . . . . . . . 381.8.2 Public databases for AD . . . . . . . . . . . . . . . . . . . . . 38
2 Early Cognitive, Structural, and Microstructural Changes in Presymp-tomatic C9orf72 Carriers Younger Than 40 Years 412.1 Abstract . . . . . . . . . . . . . . . . . . . . . . . . . . . . . . . . . . 412.2 Introduction . . . . . . . . . . . . . . . . . . . . . . . . . . . . . . . . 422.3 Material and Methods . . . . . . . . . . . . . . . . . . . . . . . . . . 43
2.3.1 Participants . . . . . . . . . . . . . . . . . . . . . . . . . . . . 432.3.2 MRI acquisition . . . . . . . . . . . . . . . . . . . . . . . . . 442.3.3 Anatomical MRI processing . . . . . . . . . . . . . . . . . . . 442.3.4 Diffusion MRI processing . . . . . . . . . . . . . . . . . . . . 442.3.5 Statistical analysis . . . . . . . . . . . . . . . . . . . . . . . . 45
2.4 Results . . . . . . . . . . . . . . . . . . . . . . . . . . . . . . . . . . . 462.4.1 Participants . . . . . . . . . . . . . . . . . . . . . . . . . . . . 462.4.2 Association of C9orf72 Mutation With Cortical Structures . 48
xv
2.4.3 Association of C9orf72 Mutation With Subcortical Structures 492.4.4 Association of C9orf72 Mutation With White Matter Microstruc-
ture . . . . . . . . . . . . . . . . . . . . . . . . . . . . . . . . . 502.4.5 Correlation Between Structural Changes and Clinical Scores 52
2.5 Discussion . . . . . . . . . . . . . . . . . . . . . . . . . . . . . . . . . 522.5.1 Cognitive, Structural and Microstructural Changes are De-
tected in Young C9+ Subjects . . . . . . . . . . . . . . . . . . 522.5.2 Praxis Impairment Is an Early Feature of C9orf72 Disease . 532.5.3 C9orf72 Mutation Is Associated With Early Thalamic Atrophy 542.5.4 White Matter Microstructural Changes, but not Cortical At-
rophy Reflects the Expected Topography of FTLD-ALS inC9+ Subjects . . . . . . . . . . . . . . . . . . . . . . . . . . . . 55
2.6 Conclusion . . . . . . . . . . . . . . . . . . . . . . . . . . . . . . . . . 55
3 Neurite density is reduced in the presymptomatic phase of C9orf72 dis-ease 573.1 Abstract . . . . . . . . . . . . . . . . . . . . . . . . . . . . . . . . . . 573.2 Introduction . . . . . . . . . . . . . . . . . . . . . . . . . . . . . . . . 583.3 Material and Methods . . . . . . . . . . . . . . . . . . . . . . . . . . 59
3.3.1 Participants . . . . . . . . . . . . . . . . . . . . . . . . . . . . 593.3.2 MRI acquisition . . . . . . . . . . . . . . . . . . . . . . . . . 603.3.3 Anatomical MRI processing . . . . . . . . . . . . . . . . . . . 613.3.4 DTI processing . . . . . . . . . . . . . . . . . . . . . . . . . . 613.3.5 NODDI processing . . . . . . . . . . . . . . . . . . . . . . . . 613.3.6 Statistical analysis . . . . . . . . . . . . . . . . . . . . . . . . 62
3.4 Results . . . . . . . . . . . . . . . . . . . . . . . . . . . . . . . . . . . 633.4.1 White matter analysis . . . . . . . . . . . . . . . . . . . . . . 633.4.2 Cortical gray matter analysis . . . . . . . . . . . . . . . . . . 653.4.3 Subcortical gray matter analysis . . . . . . . . . . . . . . . . 67
3.5 Discussion . . . . . . . . . . . . . . . . . . . . . . . . . . . . . . . . . 683.6 Limitations . . . . . . . . . . . . . . . . . . . . . . . . . . . . . . . . . 71
4 Reproducible evaluation of diffusion MRI features for automatic classi-fication of patients with Alzheimer’s disease 734.1 Abstract . . . . . . . . . . . . . . . . . . . . . . . . . . . . . . . . . . 734.2 Introduction . . . . . . . . . . . . . . . . . . . . . . . . . . . . . . . . 744.3 State of the art . . . . . . . . . . . . . . . . . . . . . . . . . . . . . . . 754.4 Materials . . . . . . . . . . . . . . . . . . . . . . . . . . . . . . . . . . 804.5 Methods . . . . . . . . . . . . . . . . . . . . . . . . . . . . . . . . . . 82
4.5.1 Converting datasets to a standardized data structure . . . . 83

xvi
4.5.2 Preprocessing pipelines . . . . . . . . . . . . . . . . . . . . . 844.5.2.1 Preprocessing of T1w MRI . . . . . . . . . . . . . . 844.5.2.2 Preprocessing of diffusion MRI . . . . . . . . . . . 85
4.5.3 Feature extraction . . . . . . . . . . . . . . . . . . . . . . . . . 854.5.4 Classification . . . . . . . . . . . . . . . . . . . . . . . . . . . 864.5.5 Cross-validation . . . . . . . . . . . . . . . . . . . . . . . . . 864.5.6 Classification experiments . . . . . . . . . . . . . . . . . . . . 87
4.6 Results . . . . . . . . . . . . . . . . . . . . . . . . . . . . . . . . . . . 884.6.1 Influence of the type of features . . . . . . . . . . . . . . . . . 894.6.2 Influence of the imaging modality . . . . . . . . . . . . . . . 894.6.3 Influence of the imbalanced data . . . . . . . . . . . . . . . . 904.6.4 Influence of the feature selection bias . . . . . . . . . . . . . 924.6.5 Potential anatomical pattern . . . . . . . . . . . . . . . . . . 93
4.7 Discussion . . . . . . . . . . . . . . . . . . . . . . . . . . . . . . . . . 94
5 Convolutional Neural Networks for Classification of Alzheimer’s Dis-ease: Overview and Reproducible Evaluation 995.1 Abstract . . . . . . . . . . . . . . . . . . . . . . . . . . . . . . . . . . 995.2 Introduction . . . . . . . . . . . . . . . . . . . . . . . . . . . . . . . . 1005.3 State of the art . . . . . . . . . . . . . . . . . . . . . . . . . . . . . . . 102
5.3.1 Main causes of data leakage . . . . . . . . . . . . . . . . . . . 1035.3.2 Classification of AD with end-to-end CNNs . . . . . . . . . 104
5.3.2.1 2D slice-level CNN . . . . . . . . . . . . . . . . . . 1065.3.2.2 3D patch-level CNN . . . . . . . . . . . . . . . . . . 1075.3.2.3 ROI-based CNN . . . . . . . . . . . . . . . . . . . . 1085.3.2.4 3D subject-level CNN . . . . . . . . . . . . . . . . . 1095.3.2.5 Conclusion . . . . . . . . . . . . . . . . . . . . . . . 110
5.3.3 Other deep learning approaches for AD classification . . . . 1105.4 Materials . . . . . . . . . . . . . . . . . . . . . . . . . . . . . . . . . . 1125.5 Methods . . . . . . . . . . . . . . . . . . . . . . . . . . . . . . . . . . 114
5.5.1 Converting datasets to a standardized data structure . . . . 1145.5.2 Preprocessing of T1w MRI . . . . . . . . . . . . . . . . . . . . 1145.5.3 Classification models . . . . . . . . . . . . . . . . . . . . . . . 115
5.5.3.1 3D subject-level CNN . . . . . . . . . . . . . . . . . 1175.5.3.2 3D ROI-based and 3D patch-level CNN . . . . . . 1175.5.3.3 2D slice-level CNN . . . . . . . . . . . . . . . . . . 1185.5.3.4 Majority voting system . . . . . . . . . . . . . . . . 1195.5.3.5 Comparison to a linear SVM on voxel-based features 120
5.5.4 Transfer learning . . . . . . . . . . . . . . . . . . . . . . . . . 120
xvii
5.5.4.1 AE pre-training . . . . . . . . . . . . . . . . . . . . 1205.5.4.2 ImageNet pre-training . . . . . . . . . . . . . . . . 121
5.5.5 Classification tasks . . . . . . . . . . . . . . . . . . . . . . . . 1215.5.6 Evaluation strategy . . . . . . . . . . . . . . . . . . . . . . . . 121
5.5.6.1 Validation procedure . . . . . . . . . . . . . . . . . 1215.5.6.2 Metrics . . . . . . . . . . . . . . . . . . . . . . . . . 122
5.5.7 Implementation details . . . . . . . . . . . . . . . . . . . . . 1225.6 Experiments and results . . . . . . . . . . . . . . . . . . . . . . . . . 123
5.6.1 Results on training/validation set . . . . . . . . . . . . . . . 1235.6.1.1 3D subject-level . . . . . . . . . . . . . . . . . . . . 1255.6.1.2 3D ROI-based . . . . . . . . . . . . . . . . . . . . . 1255.6.1.3 3D patch-level . . . . . . . . . . . . . . . . . . . . . 1255.6.1.4 2D slice-level . . . . . . . . . . . . . . . . . . . . . . 1265.6.1.5 Linear SVM . . . . . . . . . . . . . . . . . . . . . . . 126
5.6.2 Results on the test sets . . . . . . . . . . . . . . . . . . . . . . 1265.7 Discussion . . . . . . . . . . . . . . . . . . . . . . . . . . . . . . . . . 128
Conclusion & Perspectives 135
A Early Cognitive, Structural, and Microstructural Changes in Presymp-tomatic C9orf72 Carriers Younger Than 40 Years 143
B Neurite density is reduced in the presymptomatic phase of C9orf72 dis-ease 155
C Convolutional Neural Networks for Classification of Alzheimer’s Dis-ease: Overview and Reproducible Evaluation 163
Bibliography 179

xix
List of Figures
1.1 Atrophy pattern of three main genetic form of FTLD . . . . . . . . . 101.2 T1w MRI for CN subject and C9orf72 patient . . . . . . . . . . . . . 111.3 Diffusion MRI for a CN subject with mutli-shell diffusion data . . . 131.4 DTI metric maps . . . . . . . . . . . . . . . . . . . . . . . . . . . . . 151.5 NODDI metric maps . . . . . . . . . . . . . . . . . . . . . . . . . . . 161.6 Clinica architecture scheme . . . . . . . . . . . . . . . . . . . . . . . 211.7 Extracted MRI features . . . . . . . . . . . . . . . . . . . . . . . . . . 221.8 The architecture of a stacked AE made up of n AEs . . . . . . . . . 32
2.1 Early Cognitive Changes in C9orf72 Mutation Carriers . . . . . . . 482.2 Cortical Atrophy in C9orf72 Mutation Carriers . . . . . . . . . . . . 492.3 Subcortical Atrophy in C9orf72 Mutation Carriers . . . . . . . . . . 502.4 Alterations of White Matter in C9orf72 Mutation Carriers . . . . . . 51
3.1 White matter alterations in C9orf72 mutation carriers . . . . . . . . 643.2 Effect size of white matter alterations in C9orf72 mutation carriers . 653.3 Cortical alterations in C9orf72 mutation carriers . . . . . . . . . . . 663.4 Effect size of cortical alterations in C9orf72 mutation carriers . . . . 673.5 Subcortical alterations in C9orf72 mutation carriers . . . . . . . . . 68
4.1 Overview of the framework . . . . . . . . . . . . . . . . . . . . . . . 834.2 Distribution of the balanced accuracy obtained from both T1w and
diffusion MRI . . . . . . . . . . . . . . . . . . . . . . . . . . . . . . . 894.3 Distribution of the balanced accuracy obtained from the randomly
balanced classifications . . . . . . . . . . . . . . . . . . . . . . . . . . 914.4 Balanced accuracy of CN vs AD obtained varying the number of
voxels for ANOVA and SVM-RFE approaches . . . . . . . . . . . . 934.5 Normalized coefficient maps in MNI space . . . . . . . . . . . . . . 94
5.1 Architecture of the 3D subject-level CNNs . . . . . . . . . . . . . . . 1175.2 Architecture of the 3D ROI-based and 3D patch-level CNNs . . . . 1185.3 Architecture of the 2D slice-level CNN . . . . . . . . . . . . . . . . . 119


xxi
List of Tables
2.1 Study Group Characteristics . . . . . . . . . . . . . . . . . . . . . . . 47
3.1 Study Group Characteristics . . . . . . . . . . . . . . . . . . . . . . . 60
4.1 Summary of the studies using DTI metric features for AD classification 774.2 Summary of the studies using tract-based or network-based fea-
tures for AD classification . . . . . . . . . . . . . . . . . . . . . . . . 784.3 Summary of participant demographics, mini-mental state examina-
tion (MMSE) and global clinical dementia rating (CDR) scores . . . 824.4 Summary of the different types of features. . . . . . . . . . . . . . . 864.5 Results of all the classification experiments using original (imbal-
anced) data . . . . . . . . . . . . . . . . . . . . . . . . . . . . . . . . . 884.6 Results of all the classification experiments using balanced data . . 88
5.1 Summary of the studies performing classification of AD using CNNson anatomical MRI . . . . . . . . . . . . . . . . . . . . . . . . . . . . 105
5.2 Summary of participant demographics, mini-mental state examina-tion (MMSE) and global clinical dementia rating (CDR) scores forADNI . . . . . . . . . . . . . . . . . . . . . . . . . . . . . . . . . . . . 113
5.3 Summary of participant demographics, mini-mental state examina-tion (MMSE) and global clinical dementia rating (CDR) scores forAIBL . . . . . . . . . . . . . . . . . . . . . . . . . . . . . . . . . . . . 113
5.4 Summary of participant demographics, mini-mental state examina-tion (MMSE) and global clinical dementia rating (CDR) scores forOASIS . . . . . . . . . . . . . . . . . . . . . . . . . . . . . . . . . . . 114
5.5 Summary of all the classification experiments and validation resultsin our analyses . . . . . . . . . . . . . . . . . . . . . . . . . . . . . . . 124
5.6 Summary of all the classification experiments and validation resultsin our analyses . . . . . . . . . . . . . . . . . . . . . . . . . . . . . . . 127

xxiii
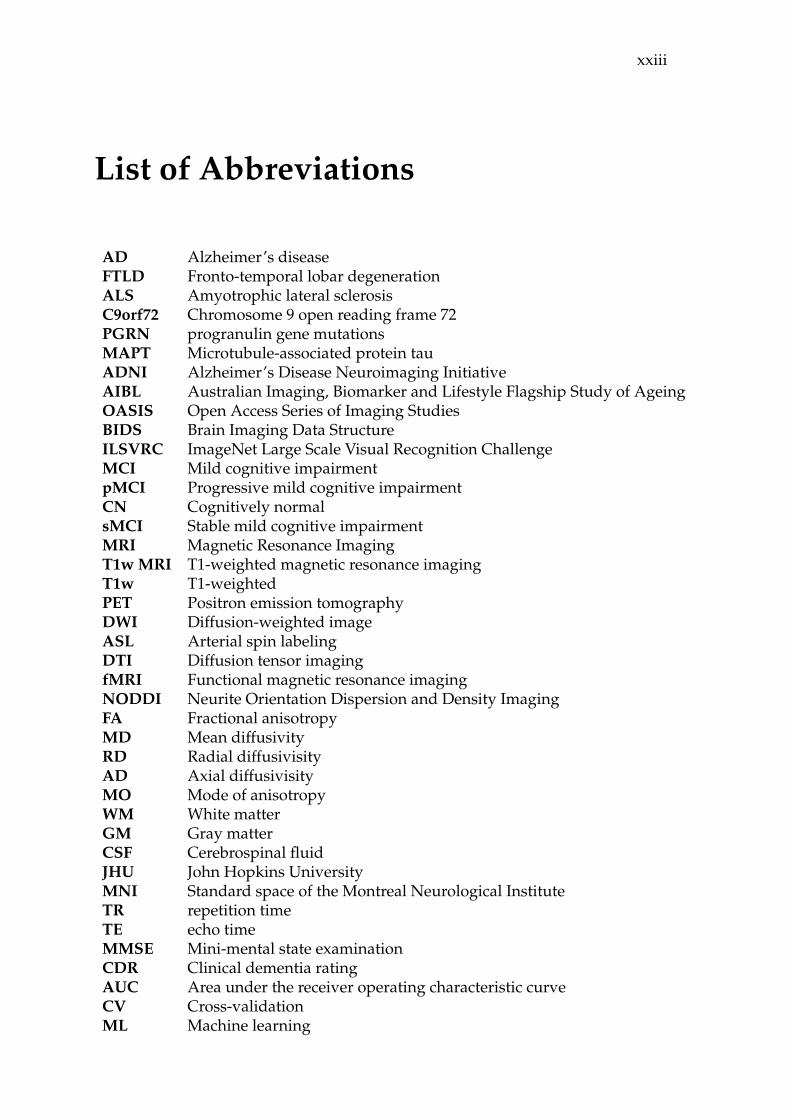
List of Abbreviations
AD Alzheimer’s diseaseFTLD Fronto-temporal lobar degenerationALS Amyotrophic lateral sclerosisC9orf72 Chromosome 9 open reading frame 72PGRN progranulin gene mutationsMAPT Microtubule-associated protein tauADNI Alzheimer’s Disease Neuroimaging InitiativeAIBL Australian Imaging, Biomarker and Lifestyle Flagship Study of AgeingOASIS Open Access Series of Imaging StudiesBIDS Brain Imaging Data StructureILSVRC ImageNet Large Scale Visual Recognition ChallengeMCI Mild cognitive impairmentpMCI Progressive mild cognitive impairmentCN Cognitively normalsMCI Stable mild cognitive impairmentMRI Magnetic Resonance ImagingT1w MRI T1-weighted magnetic resonance imagingT1w T1-weightedPET Positron emission tomographyDWI Diffusion-weighted imageASL Arterial spin labelingDTI Diffusion tensor imagingfMRI Functional magnetic resonance imagingNODDI Neurite Orientation Dispersion and Density ImagingFA Fractional anisotropyMD Mean diffusivityRD Radial diffusivisityAD Axial diffusivisityMO Mode of anisotropyWM White matterGM Gray matterCSF Cerebrospinal fluidJHU John Hopkins UniversityMNI Standard space of the Montreal Neurological InstituteTR repetition timeTE echo timeMMSE Mini-mental state examinationCDR Clinical dementia ratingAUC Area under the receiver operating characteristic curveCV Cross-validationML Machine learning

xxiv
DL Deep LearningSVM Support vector machineRF Random ForestNN Nearest NeighborsLR Logistic RegressionNB Native BayesSGD stochastic gradient descentResNet Residual Neural NetworkGANs Generative Adversarial NetworksAE autoencoderFWHM Full width at half maximumROI Region Of InterestQC Quality checkSNR signal-to-noise ratioMSE mean squared errordof degree of freedomEPI echo-planar imaging

xxv
To my father.


1
Introduction
Dementia is a syndrome, usually of a chronic or progressive nature, in which thereare impairments in different cognitive functions, including difficulty in memory,disturbances in language, behavior, and impairments in activities of daily living(Burns and Iliffe, 2009b). Worldwide, about 12 million people have dementia, andthis total is likely to increase to 25 million by 2040 (Ferri et al., 2005). Only inFrance, there were about 1,175,000 patients with dementia in 20121. The burdenof caring for dementia patients is heavy. Annual costs per patient have been es-timated at $57,000 in the United States, $64,000 in Italy, $24,000 in Sweden and$14,000 in Canada (Burns and Iliffe, 2009b).
The most common type of dementia is Alzheimer’s disease (AD), represent-ing 50% to 70% of cases (Burns and Iliffe, 2009b). Other major forms includefrontotemporal lobar degeneration (FTLD), vascular dementia and dementia withLewy bodies. There are no strict boundaries between different forms of demen-tia and mixed forms often co-exist, meaning that one patient may be affected bydifferent forms of dementia simultaneously. A small proportion of families havea genetic form of dementia, mainly caused by a mutation in one of the dementiagenes. For instance, APP, PSEN1 and PSEN2 genes for AD; MAPT, GRN, C9orf72,and other genes for FTLD (Loy et al., 2014).
There is currently no effective treatment to cure dementia or to alter its progres-sive course. The main obstacles are as follows. First, early and accurate diagnosisof dementia is difficult. Given that the disease trajectory usually starts many yearsbefore the symptoms appear, it is of great importance to identify, as early as possi-ble, if a certain subject will develop dementia. The stages before dementia consistin the presymptomatic (no symptoms) and prodromal (mild symptoms but no de-mentia) stages. For instance, the progression of mild cognitive impairment (MCI)subjects into AD attracts more and more attention to the community (Rathore etal., 2017). The benefits of early diagnosis and biomarker identification includeidentification of treatable physical and psychiatric causes, treatment of comorbidconditions, initiation of psychosocial support, and instigation of pharmacologicalsymptomatic treatments (Burns and Iliffe, 2009b). Secondly, one needs to have ro-bust markers to track disease progression and to monitor the effect of potential
1www.alzheimer-europe.org

2
therapeutic treatments. This is particularly important during the presymptomaticstage. The presymptomatic stage represents the best time-window for the medicalintervention before irreversible brain damage is present. A large body of stud-ies has looked at the automatic classification for early diagnosis, and biomarkersidentification and tracking during different stages of dementia. Refer to (Rathoreet al., 2017; Floeter and Gendron, 2018) for more details on related topics.
In this work, we consider two types of dementia: sporadic AD and geneticforms of FTLD. The needs in terms of early diagnosis and biomarker tracking arequite different. On the one hand, in genetic forms of dementia where the causalmutation is known, identification of individuals who will become demented isrelatively straightforward since the mutations usually have complete penetrance.However, for genetic forms of FTLD, biomarkers of the presymptomatic phase arestill lacking. These are crucially needed to identify the best therapeutic windowand to monitor new treatments. On the other hand, there has been a huge progressin the development of biomarkers of AD, in particular the ability to measure amy-loid and tau in the CSF and using positron emission tomography (PET) imaging.However, in sporadic AD, identifying future demented patients remains challeng-ing.
FTLD and amyotrophic lateral sclerosis (ALS) are neurodegenerative diseaseswith common genetic causes, the most frequent being a GGGGCC repeat expan-sion in the chromosome 9 open reading frame 72 (C9orf72) gene. Currently, thepathological mechanism behind this disease is still unclear (DeJesus-Hernandezet al., 2011). Several studies focused on identifying biomarkers at the presymp-tomatic stage (Rohrer et al., 2015; Walhout et al., 2015; Lee et al., 2016; Cash et al.,2017; Papma et al., 2017; Popuri et al., 2018; Burns and Iliffe, 2009b; Lee et al., 2016).Researchers have demonstrated that biomarkers change up to 25 years before es-timated symptom onset (Rohrer et al., 2015), suggesting that the presymptomaticphase is the best time-window to monitor the potential therapeutic treatment sincethe pathological damage is at its minimum and potentially still reversible (Rohreret al., 2013). However, limitations exist and advances are needed. First, most stud-ies focused on gray matter (GM) analysis based on anatomical MRI and only a fewstudies have assessed white matter (WM) with diffusion MRI. Besides, no consen-sus reached among these studies. For instance, one study (Lee et al., 2016) de-tected disruptions of white matter (WM) integrity using diffusion tensor imaging(DTI), whereas another study (Walhout et al., 2015) failed to identify such changes.Lastly, the data sample of participants in these studies was relatively small, mean-ing that the statistical power of their studies were limited. Efforts have also beenmade to identify biomarkers using other modalities. This includes functional MRI,

Introduction 3
perfusion by arterial spin labeling (ASL) and PET imaging, and neuropsycholog-ical tests (see (Jiskoot, 2018) for details). However, robust biomarkers of familialFTLD are urgently needed for staging, prognosis, onset prediction, and treatmentmonitoring.
Early diagnosis and prediction of the progression of the disease are critical fromthe clinical perspective. In genetic forms of dementia, a genetic consultation caneasily identify carriers of mutation (when the patients have a known mutation).For sporadic cases, such as sporadic AD, this diagnosis still mainly relies on clini-cal evaluation and cognitive assessment using neuropsychological tests. In recentyears, diagnosis has evolved thanks to advances in biomarker technology andneuroimaging. Currently, besides the clinical assessment, neuroimaging-basedbiomarkers are also integrated into the diagnosis criteria. T1-weighted (T1w) MRIand diffusion MRI provide macroscopic spatial patterns of atrophy and micro-scopic white matter integrity, respectively. These neuroimaging-based markers areused to describe the topography of neurodegeneration within the brain. Moreover,pathophysiological markers, reflecting the presence of specific abnormal proteindeposits, conveyed by PET imaging are also available.
Diagnosis of dementia at its late stage has limited value. Researchers are cur-rently challenging early and accurate diagnosis or prediction of the progressionfrom mild to severe stage of the disease trajectory. However, this remains a diffi-cult task. To that objective, machine learning (ML) techniques are of interest due totheir ability to learn relevant patterns within the data, providing promising perfor-mances for classification and prediction. In the past years, large publicly availabledatasets have been made available. These datasets provide multimodal data, in-cluding MRI, PET and also neuropsychological data. The most well known is theAlzheimer’s Disease Neuroimaging Initiative2 (ADNI) but other publicly avail-able datasets exist, including the Open Access Series of Imaging Studies3 (OA-SIS) and the Australian Imaging, Biomarker and Lifestyle Flagship Study of Age-ing4 (AIBL). These open-access datasets considerably advanced the developmentof ML for AD diagnosis, including both conventional ML and deep learning (DL)methods (LeCun, Bengio, and Hinton, 2015). One can note that more than sev-eral hundreds of papers have been published on that topic and new papers arecontinuously coming out.
With such intensive research, one may wonder why there has been very littletranslation of these methods to clinical routine. The underlying reasons are as fol-lows. First, bad practices, due to the lack of knowledge from medical imaging toML techniques, are unfortunately often present. Several studies (see (O’Dwyer et
2http://adni.loni.usc.edu/3https://www.oasis-brains.org/4https://aibl.csiro.au/
4
al., 2012; Wang et al., 2019) for example) reporting promising performances con-founded by data leakage, which refers to the use of test data in any part of thetraining process (Kriegeskorte et al., 2009; Rathore et al., 2017). Secondly, it is veryhard, even for the solid papers without data leakage, to assess and compare theperformances across studies and approaches. This is due to the fact that they dif-fer in terms of participant selection, image preprocessing procedures for featureextraction or selection, classification models and evaluation procedures. It is thushard to tell which method performs best and which component of the approach(e.g., feature extraction or classification algorithm) has the most influence on theresults. Moreover, these studies are difficult to reproduce. Reproducibility has re-cently become an intensively debated issue in areas of science such as neuroimag-ing (Gorgolewski et al., 2016; Poldrack et al., 2017) and ML (Sonnenburg et al.,2007; Stodden, Leisch, and Peng, 2014; Vanschoren et al., 2014). Finally, most ofthe published works have achieved competitive performances for discriminatingAD patients from cognitively normal (CN) subjects. However, the clinical value ofthis task may be limited since the patient is already demented. More interestingchallenge tasks for early diagnosis still remain unsolved.
* **
The current dissertation has two main objectives.First, we aim to advance the identification of biomarkers of the presymptomatic
phase of genetic FTLD, focusing on the C9orf72 mutation, using multimodal neu-roimaging data. To that purpose, we studied a relatively large population ofpresymptomatic C9orf72 carriers (N=41), using various neuroimaging modalities.We first used classical anatomical MRI and diffusion MRI applied to DTI model.We then used advanced models of multi-shell diffusion MRI data, specifically theneurite orientation dispersion and density imaging (NODDI) model. For thesedifferent modalities, we developed specific image processing pipelines that wereused for the study and released publicly.
Secondly, we hope to advance the steps towards the future translation to clini-cal practice of ML approaches for diagnosis and prognosis of AD. To that purpose,we first proposed a framework for reproducible evaluation of AD classificationmethods from diffusion MRI data. This extended a previous framework devotedto T1w MRI and PET data (Samper-González et al., 2018). In this study, we usedconventional ML models. We then went one step further and checked the poten-tial of DL models in AD classification. As mentioned above, bad practices exist inthis field. We performed an exhaustive literature survey and critically reviewedthe potential flaws of these studies. We then proposed an open-access framework

Introduction 5
and studied the influence of the key components of the framework on classifica-tion performances. By doing this, we hope to facilitate the future research on ADclassification and improve the research transparency, reproducibility and objectiv-ity.
To summarize, the current thesis tries make progress towards answering thefollowing questions:
• What are the most promising candidate of biomarkers in presymptomaticstage of C9orf72 diseases?
• How far are we away from the translation to clinical practice of AD classifi-cation using ML techniques?
The main contributions of this thesis are:
• Identification of early alterations in the presymptomatic stage of C9orf72 dis-ease using conventional anatomical and diffusion MRI.
• Identification of more sensitive biomarkers using an advanced model (NODDI)of diffusion MRI.
• The development of a framework for reproducible evaluation of classifica-tion of AD and its application to diffusion MRI with conventional ML meth-ods, and to anatomical MRI with DL methods.
• The development and release of open source software packages, focusing onimage processing, statistics and ML techniques.
* **
The dissertation consists of five chapters.First, Chapter 1 introduces the background related to this thesis. This covers: i)
the basic knowledge of frontotemporal lobar degeneration and its genetic forms,and Alzheimer’s disease, ii) different modalities of neuroimaging data, iii) im-age processing procedures and iv) two types of analysis approaches (i.e., classicalstatistics and ML methods), and datasets used in the current thesis.
Chapter 2 presents the study of a cohort of first-degree relatives of C9orf72 pa-tients. T1w MRI, DTI and neuropsychological test were examined for identifyingpotential biomarkers at the presymptomatic stage.
Chapter 3 extends the previous paper by studying the potential of NODDI andcomparing it sensitivity to that of DTI. It aims to clarify the added value of NODDIcompared to conventional techniques such as DTI and T1w MRI.

6
Chapter 4 describes our open source framework for AD classification from dif-fusion MRI data and applies it to study the value of this modality for these diag-nostic and prediction tasks.
Chapter 5 extends the previous chapter to DL models and demonstrates its useon anatomical MRI.
Finally, the main results are recalled and future work directions are presented.In addition, we present, in appendices, the supplementary materials for Chap-
ter 2, Chapter 3 and Chapter 5, respectively.

7
Chapter 1
Background
In this chapter, we aim to provide a straightforward introduction to the main con-cepts involved in this dissertation. Specifically, this chapter contains the back-ground knowledge regarding: i) the neurodegenerative diseases that we studied(Section 1.1); ii) neuroimaging modalities (Section 1.2); iii) main steps for imagepreprocessing and feature extraction (Section 1.3); iv) classical statistical models(Section 1.4), v) machine learning models (Section 1.5), vi) neuroimaging biomark-ers of C9orf72 carriers (Section 1.6), vii) neuroimaging for classification of AD (Sec-tion 1.7) and viii) datasets used in this dissertation (Section 1.8).
1.1 Neurodegenerative diseases
Neurodegenerative diseases are characterized by the progressive loss of structureor function of neurons, due to for instance, the death of neurons. Neurons nor-mally don’t reproduce or replace themselves, thus such diseases are irreversible5.Examples of neurodegenerative diseases are AD, FTLD and ALS. In the section,we briefly introduce the three diseases involved in this PhD.
1.1.1 Alzheimer’s disease
AD is the first cause and represents 60–70% of cases of dementia (Burns and Iliffe,2009a). Currently, the epidemic situation of AD is becoming more and more grievous.In 2015, there were approximately 29.8 million people worldwide with AD (Vos etal., 2016). It affects most often elderly people. Among the general population, itaffects about 6% of people over 65 years of age (Burns and Iliffe, 2009a). Especiallyin developed countries, AD is one of the most financially costly diseases (Bonin-Guillaume et al., 2005).
The underlying cause of Alzheimer’s disease is still poorly understood (Burnsand Iliffe, 2009a). For instance, about 70% of the cases are believed to be influencedby different genes inherited from patients’ parents (Ballard et al., 2011). Other risk
5https://en.wikipedia.org/wiki/Neurodegeneration
8
factors include a history of head injuries, depression, and hypertension (Burnsand Iliffe, 2009a). The disease trajectory is divided into three main stages, with aprogressive pattern of cognitive and functional impairment.
• Presymptomatic: the stage during which pathological changes accumulatein the absence of any symptoms (Dubois et al., 2016; Sperling et al., 2011);
• mild cognitive impairment (MCI): the stage during which the patient hasmild cognitive deficits, mainly memory troubles, but is not demented (Duboisand Albert, 2004; Albert et al., 2011);
• AD: the final stage during which the presence of the memory problems, lan-guage, executive and motor functions is severe enough to make it impossibleto carry out everyday tasks for the patients (McKhann et al., 1984; McKhannet al., 2011).
Several competing hypotheses exist and try to explain the cause of the disease(Duyckaerts, Delatour, and Potier, 2009). The first one is the amyloid hypothesis. Itpostulates that extracellular amyloid beta (Ab) deposits are the fundamental causeof AD (Mudher and Lovestone, 2002; Hardy and Allsop, 1991). This accumula-tion can start up to 20 years before the diagnosis. Another popular hypothesis isthe so-called tau hypothesis (Mudher and Lovestone, 2002). This hypothesis pro-posed that tau protein abnormalities initiate the disease cascade. The formationof neurofibrillary tangles made of tau proteins links to each other inside neuronsand causes the death of neurons. Other hypotheses also exist in the community(Zlokovic, 2007).
AD is usually diagnosed based on clinical assessment (e.g., person’s medicalhistory, history from relatives) and neuropsychological tests (e.g., mini mentalstate examination, MMSE). This is usually performed once the symptoms occur.Earlier diagnosis of AD is critical because it not only would allow providing ade-quate care to the patient, but also provides the best time window for developmentof disease-modifying drugs. Until now, there is no definitive evidence to sup-port that any particular measure is effective in preventing or curing AD. In recentdecades, new criterias have been proposed to achieve an earlier and more accuratediagnosis (Dubois et al., 2007; Dubois et al., 2014; Albert et al., 2011). These cri-terias integrated biomarkers, established thanks to different techniques includingneuroimaging and fluid biomarkers (Hampel et al., 2014), into clinical and cogni-tive tests.

1.1. Neurodegenerative diseases 9
1.1.2 Frontotemporal lobar degeneration
FTLD is a clinically and pathologically heterogeneous syndrome, which is char-acterized by progressive decline in behaviour or language associated with degen-eration of the frontal and anterior temporal lobes (Floeter et al., 2016). FTLD isconsidered as an important cause of dementia, in particular in patients youngerthan 65 years of age.
There are three main distinct clinical phenotypes of FTLD: (i) behavioural vari-ant frontotemporal dementia (bvFTD), characterized by changes in behaviour andpersonality and cortical degeneration focusing on frontal-predominant regions; (ii)semantic dementia, showing the loss of knowledge about words and objects in-volving anterior temporal regions and (iii) progressive nonfluent aphasia, result-ing in difficulty in language output and grammar associated with left perisylviancortical atrophy (Rabinovici and Miller, 2010). FTLD is also pathologically hetero-geneous. Like most neurodegenerative diseases, FTLD is accompanied with thepresence of insoluble protein in neurons (Le Ber et al., 2008). Three subtypes ex-ist depending on the type of the protein that aggregates in neuronal inclusions: i)FTLD-Tau, accounting for 30–40% of FTLD. They are characterized by the accu-mulation of tau protein in neurons. ii) FTLD-TDP, representing 50–60% of FTLDcases. TDP-43 (TAR DNA-binding protein) is witnessed to be aggregated in neu-rons (Neumann et al., 2006); iii) FTLD-FUS, a rare form (10% of FTLD cases). It ischaracterized by the presence of FUS-positive inclusions (Neumann et al., 2007).
1.1.2.1 Genetic forms of FTLD
FTLD is also genetically heterogeneous. For the last decade, researchers shed morelight on the genetic forms of FTLD since the identification of two major genes, pro-granulin gene mutations (PGRN) (Snowden et al., 2006; Baker et al., 2006; Cruts etal., 2006) and chromosome 9 open reading frame 72 (C9orf72) (DeJesus-Hernandezet al., 2011), but also with other genes which are less frequently witnessed. Until2013, more than twelve genes were identified in the literature explaining 50-60%of familial cases (see (Le Ber, 2013) for details). Here, we present three main genesrepresenting a familial form of FTLD.
Microtubule-associated protein tau (MAPT) mutation was the firstly identi-fied in 1998 (Hutton et al., 1998) and helps encode the tau protein. In France,the frequency of MAPT mutations is approximately 3% of patients with FTLDand close to 10% in familial forms of the disease (Le Ber et al., 2008). In 2006,PGRN mutations were identified. This mutation is associated with the TDP-43positive inclusions in neurons (Snowden et al., 2006; Baker et al., 2006; Cruts etal., 2006). In France, the relative frequency of PGRN mutations is 13% in familial
10
FTLD (Le Ber et al., 2008). Progranulin promotes the growth of neurons and in-creases the survival of cortical and spinal motor neurons, and could therefore havea neurotrophic effect. The pathophysiological mechanisms associated with PGRNmutations are still unknown. In 2011, a GGGGCC repeat expansion in C9orf72gene was identified in 9p-linked families (c9FTLD/ALS) (DeJesus-Hernandez etal., 2011). In France, the prevalence rate differed according to the phenotype: 13%in familial bvFTD (without ALS), but up to 66% in familial FTLD-ALS (Le Ber etal., 2013). The function of the protein coded by C9orf72 and the pathogenic effectof the non-coding expansion are still unclear.
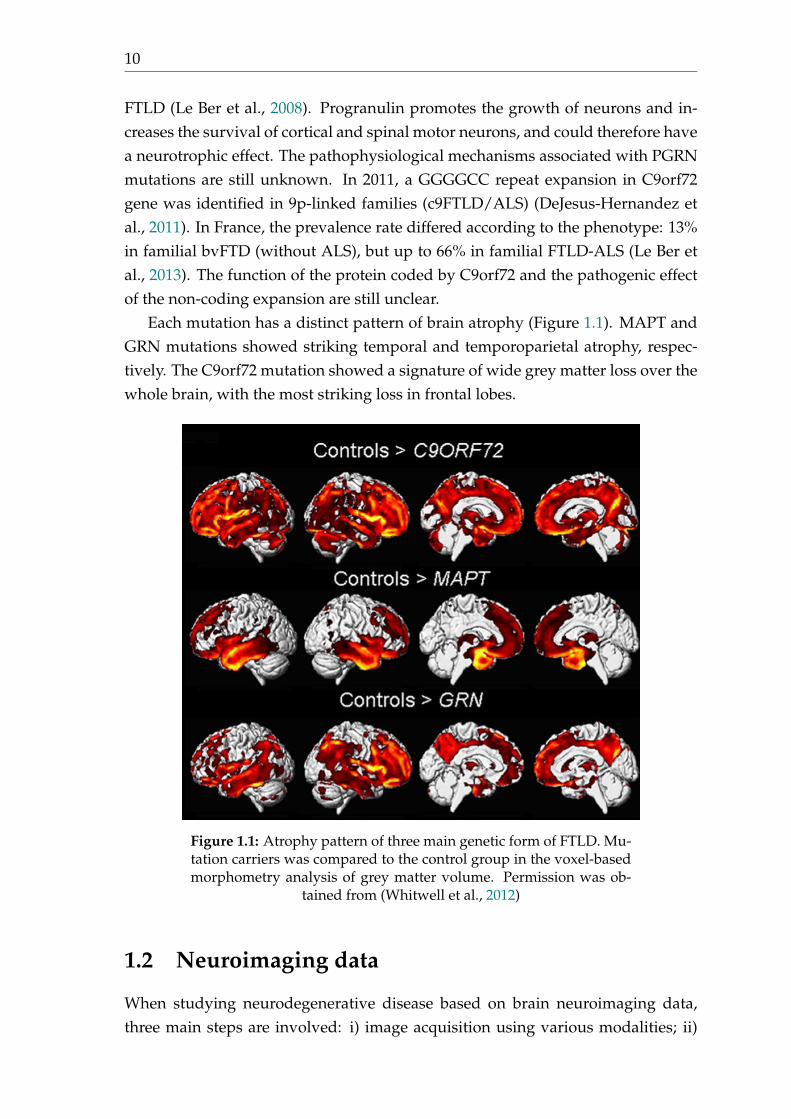
Each mutation has a distinct pattern of brain atrophy (Figure 1.1). MAPT andGRN mutations showed striking temporal and temporoparietal atrophy, respec-tively. The C9orf72 mutation showed a signature of wide grey matter loss over thewhole brain, with the most striking loss in frontal lobes.
Figure 1.1: Atrophy pattern of three main genetic form of FTLD. Mu-tation carriers was compared to the control group in the voxel-basedmorphometry analysis of grey matter volume. Permission was ob-
tained from (Whitwell et al., 2012)
1.2 Neuroimaging data
When studying neurodegenerative disease based on brain neuroimaging data,three main steps are involved: i) image acquisition using various modalities; ii)

1.2. Neuroimaging data 11
image preprocessing to extract features and iii) applying different data analysismethods, for instance classical statistical models for group comparison or moreadvanced machine learning models, on the extracted quantitative features.
In this section, we review the two data modalities that are relevant to this dis-sertation and provide a basic explanation of these techniques. Specifically, section1.2.1 presents the anatomical MRI and section 1.2.2 introduces the diffusion MRI.Note that we only briefly introduce these techniques. One can refer to (SusumuMori and J-Donald Tournier, 2013; McRobbie, 2006; Schmitt, Stehling, and Turner,1998) for more details on different MRI modalities.
1.2.1 Anatomical MRI
T1w MRI uses a short repetition time (TR) and echo time (TE) to enhance the tissuecontrast, thus allowing to study the patient’s brain morphology. T1w MRI usuallyoffers excellent contrast: fluids are very dark such as CSF in ventricle, GM is greyand WM is more brighter. This MRI sequence is known as anatomical MRI be-cause it shows clearly the boundaries between different tissues (Figure 1.2). T1wMRI is widely used in neurodegenerative diseases to assess brain atrophy or tissuedamage.
Figure 1.2: T1w MRI for a cognitively normal subject (CN) and fora patient with C9orf72 mutation (PT). One can note the whole brain
atrophy and the enlargement of the ventricles.

12
1.2.2 Diffusion MRI
Diffusion MRI (Le Bihan et al., 1986) uses the diffusion of water molecules to gen-erate contrast in MR images. It allows the mapping of the Brownian motion pro-cess of molecules, mainly water, in biological tissues (e.g., GM and WM) in vivoand non-invasively. The motion of water in the brain is not totally isotropic be-cause the mobility of water is constrained by its cellular environment. The inten-sity of each voxel reflects the rate of water diffusion at that location in the brain.When there is no constraint as in free water (e.g., CSF), the motion of water is ran-domly diffused in all directions (isotropy). When the water motion is constrainedby the tissues (e.g., WM and GM), the diffusion is anisotropic (Merboldt, Hanicke,and Frahm, 1985). This quality makes diffusion MRI sensitive to the microstruc-tural damage and indicative for early pathological changes.
The amplitude and anisotropy of the diffusion depends on several parameters,such as the direction, density or diameter of the fibre bundles. In order to measurethese diffusion parameters (amplitude and anisotropy), one should first acquire animage with the diffusion-sensitizing gradients turned off (b-value=0 s/mm2) or setto a very low value (e.g., b-value=5 s/mm2). This is usually referred to as b0 imageand serves as a baseline for later calculated maps. The diffusion-weighted images(DWI) are then run with different combination of b-value and b-vec (the gradients’direction), generating the source images sensitized to diffusion in multiple direc-tions. For illustration purpose, three diffusion images using b-values of 5, 300, 700and 2200 s/mm2 are shown in Figure 1.3. One can observe that higher b-valueshows progressively more diffusion weighting but also more noise (lower signal-to-noise ratio, SNR). As a practical matter, most routine clinical diffusion sequencecurrently use b-values between 0 and 1000 s/mm2). Note that we denote one im-age sequence with multiple b-values as multi-shell data. Conversely, we note theimage sequence with a single b-value as single-shell data in this dissertation.

1.2. Neuroimaging data 13
Figure 1.3: Multi-shell diffusion MRI for a cognitively normal subject(CN). Images using different b-values, 5, 300, 700, and 2200 s/mm2,
are shown here.
1.2.2.1 Diffusion tensor imaging
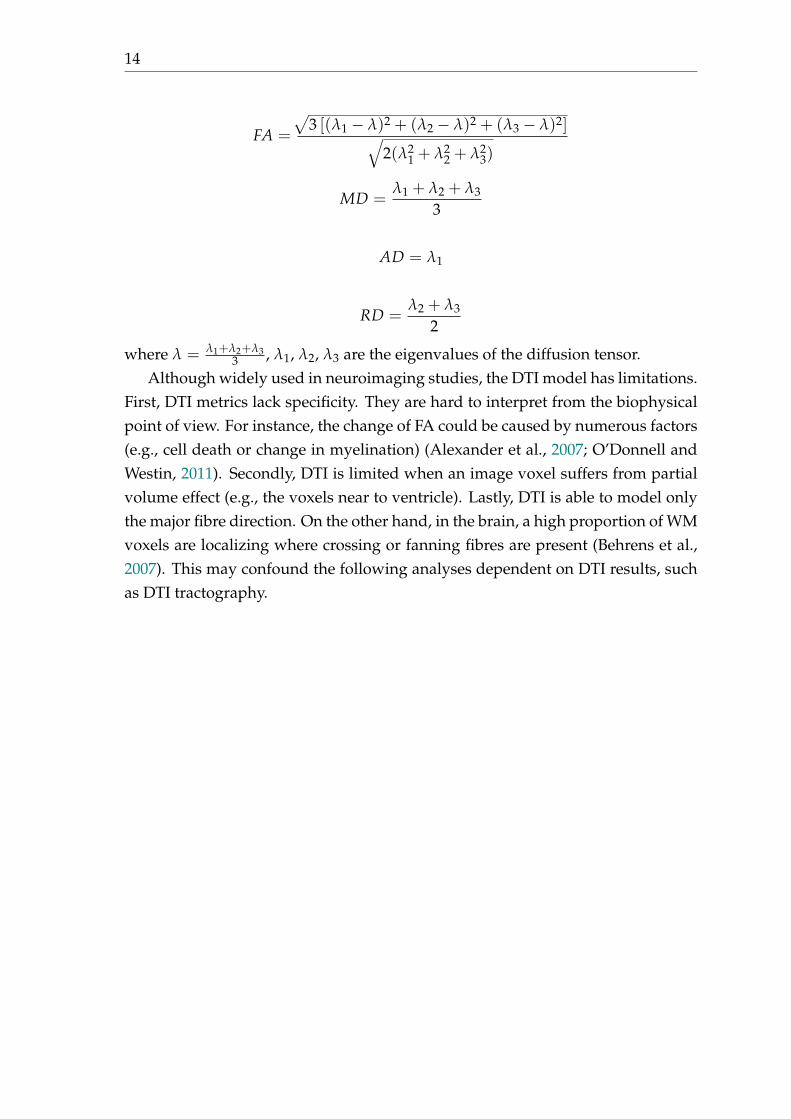
Different models can be applied to the preprocessed diffusion MRI data (the de-tails of image preprocessing will be introduced in section 1.3). One of the mostwidely used models is DTI (Basser et al., 1994). DTI is popular for imaging thewhite matter of the brain and has been applied to a tremendous variety of neu-roimaging studies (O’Donnell and Westin, 2011). DTI modelizes each voxel as adiffusion tensor. The derived tensor anisotropy measures are ratios of the eigen-values that are used to quantify the shape of the diffusion. The most commonmetrics are fractional anisotropy (FA, often referred to as the measure of "whitematter integrity"), mean diffusivity (MD), axial diffusivity (AD) and radial diffu-sivity (RD). Figure 1.4 shows the DTI metric maps. DTI metrics are computedaccording to the following formulas:
14
FA =
p3 [(l1 � l)2 + (l2 � l)2 + (l3 � l)2]q
2(l21 + l2
2 + l23)
MD =l1 + l2 + l3
3
AD = l1
RD =l2 + l3
2
where l = l1+l2+l33 , l1, l2, l3 are the eigenvalues of the diffusion tensor.
Although widely used in neuroimaging studies, the DTI model has limitations.First, DTI metrics lack specificity. They are hard to interpret from the biophysicalpoint of view. For instance, the change of FA could be caused by numerous factors(e.g., cell death or change in myelination) (Alexander et al., 2007; O’Donnell andWestin, 2011). Secondly, DTI is limited when an image voxel suffers from partialvolume effect (e.g., the voxels near to ventricle). Lastly, DTI is able to model onlythe major fibre direction. On the other hand, in the brain, a high proportion of WMvoxels are localizing where crossing or fanning fibres are present (Behrens et al.,2007). This may confound the following analyses dependent on DTI results, suchas DTI tractography.

1.2. Neuroimaging data 15
Figure 1.4: DTI metric maps. From up to down, FA, MD, RD and ADare presented.
1.2.2.2 Neurite orientation dispersion and density imaging
Beyond DTI, other models have been proposed in the community (Zhang et al.,2012; Pasternak et al., 2009; Eaton-Rosen et al., 2017). Neurite orientation disper-sion and density imaging (NODDI) model was firstly proposed by Zhang et al(Zhang et al., 2012). They demonstrated that NODDI model, compared to DTImodel, offered higher tissue-specificity. Note that NODDI, compared to conven-tional DTI model, requires a multi-shell diffusion MRI sequence which takes about30 minutes to acquire in a clinical routine. The image preprocessing procedure,which will be detailed in the next section, is similar to that of single-shell data,including corrections for head motion, susceptibility and eddy-current distortion.
NODDI models the diffusion signal from three compartments: i) free water,Sf w f is the signal from the free water and Vf w f is the volume fraction of each voxel

16
representing free water, ii) intracellular space, Sin and Vin represent the signal andvolume fraction from the intracellular compartment (e.g., intra-axonal in WM) andiii) extracellular space, Sex and Vex mean the signal and volume fraction from theextracellular compartment. Thus, the total signal at each voxel can be written withthe following equation:
St = (S f w f ⇥ Vf w f ) + (1 � Vf w f )(Sin ⇥ Vin + (1 � Vin)⇥ Sex)
where St is the measured diffusion signal in total.The NODDI model derives three metrics: neurite density index (NDI) and ori-
entation dispersion index (ODI) quantify the density and angular variation of neu-rites, respectively, while free water fraction (FWF) captures the contamination oftissues by free water at the microstructural level. NODDI metric maps are shownin Figure 1.5
Figure 1.5: NODDI metric maps. From up to down, NDI, ODI andFWF are presented.
1.3 Image preprocessing
MR images may suffer from various artifacts. These may result from physiologi-cal sources (e.g., head motion, respiration and anxiety) or from the scanner itself

1.3. Image preprocessing 17
(e.g., geometric distortions and signal losses). A proper image preprocessing isnecessary for a successful quantitative analysis. In the context of classification,researcher has proven that image processing procedures have a strong influenceon classification results (Uchida, 2013; Lu and Weng, 2007; Cuingnet et al., 2011).Generally, the image preprocessing procedure includes the main following steps:bias field correction, intensity rescaling and standardization, skull stripping, eddycurrent-induced distortion correction, susceptibility-induced distortion correctionand registration. According to the data modality (e.g., T1w MRI or diffusion) andthe scientific question of interest (e.g., conventional ML or DL methods), differ-ent sources of artifacts may be present and different correction methods should beadapted.
In this section, we present the most essential preprocessing steps for T1w MRIand diffusion MRI. We then introduce the Clinica 6 open-source platform for re-producible neuroimaging studies implemented and maintained by the ARAMISlaboratory 7. Lastly, we summarize the extracted features which are used in thefollowing analyses in this dissertation. Note that we present here only the basicknowledge on MRI processing, readers can refer to (Bankman, 2008) for more de-tails.
1.3.1 Bias field correction
MR images can be corrupted by a low frequency and smooth signal caused bymagnetic field inhomogeneities. This bias field induces variations in the intensityof the same tissue in different locations of the image, which deteriorates the perfor-mance of image analysis algorithms such as registration (Vovk, Pernus, and Likar,2007). Several methods exist to correct these intensity inhomogeneities, two pop-ular ones being the nonparametric nonuniformity intensity normalization (N3) al-gorithm (Sled, Zijdenbos, and Evans, 1998), available for example in the Freesurfersoftware package 8, and the N4 algorithm (Tustison et al., 2010) implemented inITK 9. Moreover, MRtrix 10 also provided tools for B1 field inhomogeneity correc-tion for diffusion MRI data (Zhang, Brady, and Smith, 2001).
1.3.2 Intensity rescaling and standardization
As MRI is usually not a quantitative imaging modality itself, MR images usuallyhave different intensity ranges and the intensity distribution of the same tissue
6http://www.clinica.run/7http://www.aramislab.fr8http://surfer.nmr.mgh.harvard.edu/fswiki/recon-all9http://hdl.handle.net/10380/3053
10http://www.mrtrix.org
18
type may be different between two images, which might affect the subsequent im-age preprocessing steps. The first point can be dealt with by globally rescaling theimage, for example between 0 and 1 using the minimum and maximum intensityvalues (Juszczak, Tax, and Duin, 2002). Intensity standardization can be achievedusing techniques such as histogram matching (Madabhushi and Udupa, 2005).
1.3.3 Skull stripping
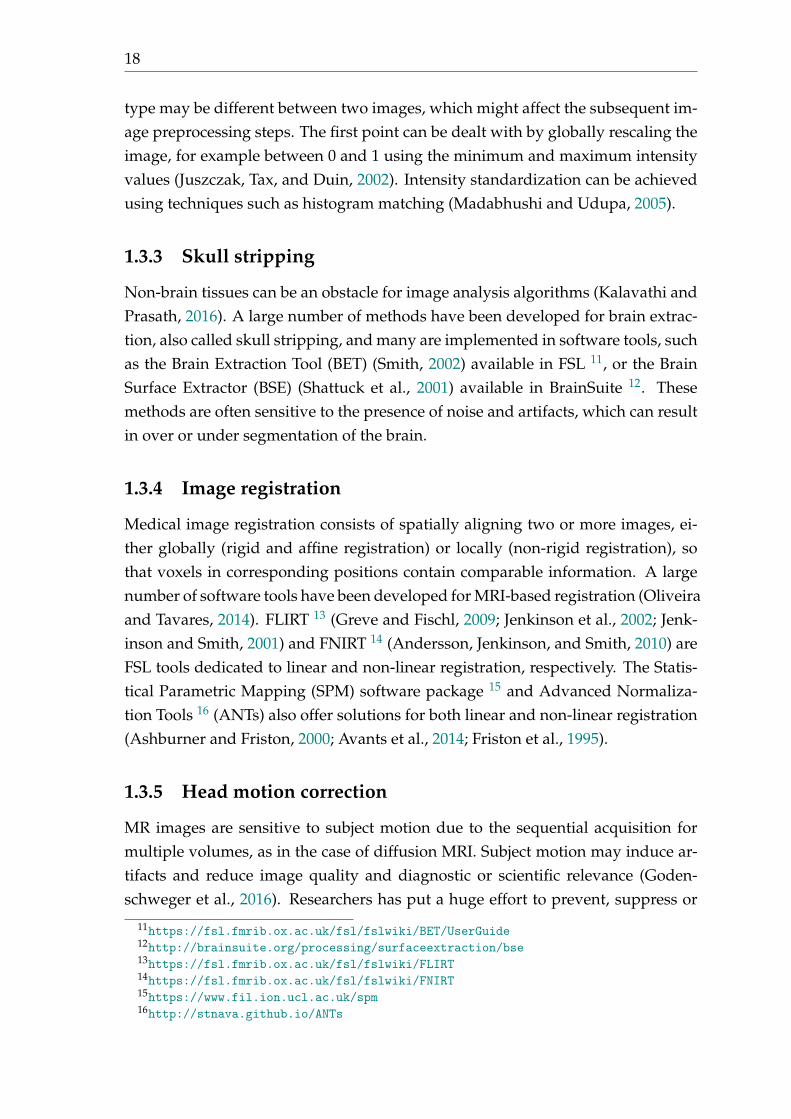
Non-brain tissues can be an obstacle for image analysis algorithms (Kalavathi andPrasath, 2016). A large number of methods have been developed for brain extrac-tion, also called skull stripping, and many are implemented in software tools, suchas the Brain Extraction Tool (BET) (Smith, 2002) available in FSL 11, or the BrainSurface Extractor (BSE) (Shattuck et al., 2001) available in BrainSuite 12. Thesemethods are often sensitive to the presence of noise and artifacts, which can resultin over or under segmentation of the brain.
1.3.4 Image registration
Medical image registration consists of spatially aligning two or more images, ei-ther globally (rigid and affine registration) or locally (non-rigid registration), sothat voxels in corresponding positions contain comparable information. A largenumber of software tools have been developed for MRI-based registration (Oliveiraand Tavares, 2014). FLIRT 13 (Greve and Fischl, 2009; Jenkinson et al., 2002; Jenk-inson and Smith, 2001) and FNIRT 14 (Andersson, Jenkinson, and Smith, 2010) areFSL tools dedicated to linear and non-linear registration, respectively. The Statis-tical Parametric Mapping (SPM) software package 15 and Advanced Normaliza-tion Tools 16 (ANTs) also offer solutions for both linear and non-linear registration(Ashburner and Friston, 2000; Avants et al., 2014; Friston et al., 1995).
1.3.5 Head motion correction
MR images are sensitive to subject motion due to the sequential acquisition formultiple volumes, as in the case of diffusion MRI. Subject motion may induce ar-tifacts and reduce image quality and diagnostic or scientific relevance (Goden-schweger et al., 2016). Researchers has put a huge effort to prevent, suppress or
11https://fsl.fmrib.ox.ac.uk/fsl/fslwiki/BET/UserGuide12http://brainsuite.org/processing/surfaceextraction/bse13https://fsl.fmrib.ox.ac.uk/fsl/fslwiki/FLIRT14https://fsl.fmrib.ox.ac.uk/fsl/fslwiki/FNIRT15https://www.fil.ion.ucl.ac.uk/spm16http://stnava.github.io/ANTs

1.3. Image preprocessing 19
correct motion artifacts. One typical case of head motion artifact can be referredas MRI-based motion (Godenschweger et al., 2016). It happens when there are atleast two MR images/volumes at different time points within subject. The headmotion caused during the interval time between images/volumes can be calcu-lated by registration algorithms or by comparison to training data sets on the basisof 3D volumes. The type of motion can be divided into linear (e.g., rigid) or non-linear. The registration-based solution can be achieved by the registration toolsmentioned above. Beyond the MRI-based motion, it exists other types of motionsand the corresponding correction methods, including both prospective or retro-spective head motion correction methods (see (Godenschweger et al., 2016) formore details).
1.3.6 Eddy current-induced distortion correction
Eddy current-induced off-resonance field, frequently present in diffusion weightedEPI images, is caused by the rapidly switched diffusion encoding gradients, whichis an additional source of off-resonance. The rapidly changing magnetic field re-sults in eddy currents (EC) in conductors within the bore, thus in turn inducing amagnetic field (Andersson and Sotiropoulos, 2016). Numerous studies focused onthe correction of this artifact. The most common used technique is the eddy tool 17
from FSL. This tool integrates the corrections for eddy current-induced distortionsand subject movements. It simultaneously models the effects of diffusion eddycurrents and movements on the image, allowing it to work with higher b-valuedata (Andersson and Sotiropoulos, 2016).
1.3.7 Susceptibility-induced distortion correction
Another common artifact of diffusion MRI is the so-called susceptibility-induceddistortion. The reason behind this artifact is as follows. Diffusion images are sen-sitive to off-resonance fields due to the low bandwidth in the phase-encode (PE)direction, which results in telltale unidirectional distortions (Schmitt, Stehling, andTurner, 1998). Various sources of off-resonance exit during image sequence. For in-stance, the object itself in the scanner will disrupt the existing homogeneous mag-netic field, rendering the resulting field inhomogeneous. Also, air in the brain andthe presence of metallic ions in tissues can cause similar susceptibility-induceddistortions. In the field, FSL provides a robust tool, topup 18, for susceptibility-induced distortion correction. One prerequisite is that the data shoud be collected
17https://fsl.fmrib.ox.ac.uk/fsl/fslwiki/eddy18https://fsl.fmrib.ox.ac.uk/fsl/fslwiki/topup

20
with reversed phase-encode blips, resulting in pairs of images with distortions go-ing in opposite directions (Andersson, Skare, and Ashburner, 2003; Smith et al.,2004).
1.3.8 Other processing steps
Beyond these steps mentioned above, other procedures, such as image segmenta-tion or cortical reconstruction, may also be necessary. For instance, image segmen-tation is the most critical step in region of interest (ROI) analyses. The regional fea-tures (e.g., regional volumetric measures based on an anatomical atlas) depend onthe results of image segmentation. Different software, such as FreeSurfer and SPM,integrate image segmentation steps and one can refer to (Despotovic, Goossens,and Philips, 2015) for more details on different segmentation techniques. Anotherexample is that the cortical surface reconstruction (Fischl, 2012; Fischl et al., 1999)is critical to precisely extract the cortex-wise features (e.g., cortical thickness).
1.3.9 Implementation: Clinica open source platform
The complexity of neuroimaging analyses can make it difficult, especially for new-comers in this field, to perform or reproduce a study. Often, researchers performedtheir analysis by combining different software packages widely used in the com-munity, such as FreeSurfer and SPM. However, such hand-craft strategy makesit difficult to reproduce their studies for the following reasons. i) Heterogeneousdata organization. No existing automatic tools exist to convert the raw data fromthe extensively used databases (e.g., ADNI dataset) to a standard data format.ii) Inflexible software deployment, different software exist in the field but maynot be mutually compatible. Steps have been made in the right direction. TheBrain Imaging Data Structure (BIDS) data organization standard (Gorgolewski etal., 2016) and Nipype pipelining system (Gorgolewski et al., 2011) have been pro-posed in the community. To help further address the limitations mentioned above,we developed Clinica, a software that aims at making clinical neuroimaging stud-ies easier and more reproducible.
An overview of Clinica is shown on Figure 1.6. Three main components canbe summarized: i) data management tools, such as automatic tools to convert theraw data of public databases into BIDS format, or tools for participant selection; ii)feature extraction pipelines, different software or tools can be easily deployed andtested with the Nipype modular architecture; iii) Statistics and machine learning,such as generalized linear model (GLM), conventional ML and DL.

1.3. Image preprocessing 21
Figure 1.6: Clinica, an open source platform for reproducible neu-roimaging studies.
Note that The Clinica software is publicly available and under active devel-opment. The current dissertation highly depends on the Clinica software. Con-versely, I contributed to the development of Clinica, namely to the following com-ponents: T1w MRI surface-based extraction and statistics, DTI processing, NODDIprocessing, and machine learning.
1.3.10 Extracted features
According to the type of analysis (i.e., GLM or machine learning), features were ex-tracted based on different preprocessing procedures. We summarize and presenthere all the features extracted based on the Clinica software and involved in ouranalyses (Figure 1.7).
22
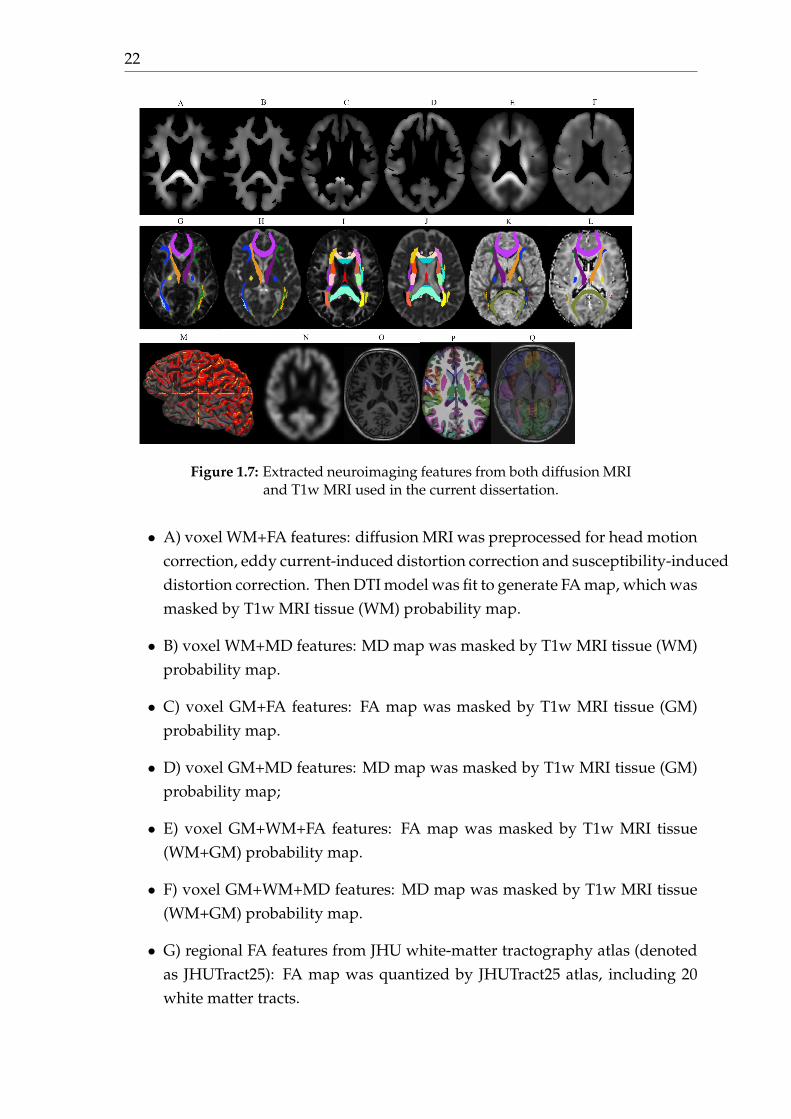
Figure 1.7: Extracted neuroimaging features from both diffusion MRIand T1w MRI used in the current dissertation.
• A) voxel WM+FA features: diffusion MRI was preprocessed for head motioncorrection, eddy current-induced distortion correction and susceptibility-induceddistortion correction. Then DTI model was fit to generate FA map, which wasmasked by T1w MRI tissue (WM) probability map.
• B) voxel WM+MD features: MD map was masked by T1w MRI tissue (WM)probability map.
• C) voxel GM+FA features: FA map was masked by T1w MRI tissue (GM)probability map.
• D) voxel GM+MD features: MD map was masked by T1w MRI tissue (GM)probability map;
• E) voxel GM+WM+FA features: FA map was masked by T1w MRI tissue(WM+GM) probability map.
• F) voxel GM+WM+MD features: MD map was masked by T1w MRI tissue(WM+GM) probability map.
• G) regional FA features from JHU white-matter tractography atlas (denotedas JHUTract25): FA map was quantized by JHUTract25 atlas, including 20white matter tracts.

1.3. Image preprocessing 23
• H) regional MD features from JHUTract25: MD map was quantized by JHUTract25atlas.
• I) regional FA features from ICBM-DTI-81 white-matter labels atlas (denotedas JHULabel): FA map was quantized by JHULabel atlas, including 48 whitematter tracts.
• J) regional MD features from JHULabel: MD map was quantized by JHULa-bel atlas.
• K) regional ODI features from JHUTract25: NODDI model was fit to the pre-processed diffusion data and generated ODI map. ODI maps was quantizedby JHUTract25 atlas.
• L) regional NDI features from JHUTract25: NDI map was quantized by JHUTract25.
• M) regional Desikan FWF features: FWF map was projected at the middlecortex and quantized by Desikan atlas.
• N) voxel GM density map: voxel features from T1w MRI gray matter densitymap. T1w MRI was preprocessed with a complex procedure, including non-linear registration, intensity normalization, segmentation, etc.
• O) full brain density map from T1w MRI. T1w MRI was preprocessed onlywith intensity rescaling, bias field correction and a linear registration intoMNI space.
• P) regional Desikan density map: regional feature from T1w MRI quantizedby Desikan atlas. T1w MRI was preprocessed with a complex processingprocedure, including segmentation, cortical construction.
• Q) regional AAL2 density map: regional features from T1w MRI quantizedby AAL2 atlas. T1w MRI was preprocessed with a complex processing pro-cedure, including segmentation, non-linear registration.
With the extracted features from both T1w MRI and diffusion MRI, furtheranalysis can be performed depending on the scientific question of interest. In thecurrent dissertation, we applied these features into two categories of analyses: i)classical statistics (see Section 1.4) for identifying neuroimaging biomarkers at thepresymptomatic stage of C9orf72 carriers and ii) advanced ML techniques (seeSection 1.5) for early and accurate diagnosis of AD.
24
1.4 Classical statistics
Classical statistical models have been used to identify biomarkers in dementiaduring the disease trajectory. Generally, this approach helps decide if significantdifference exists between two groups within a disease population on the chosenfeatures (e.g., regional volumetric measures). For instance, researchers collectedone group of AD patients (denoted as AD) and another group of cognitively nor-mal subjects (denoted as CN). Here, the chosen feature could be the volumetricmeasures of each ROI based on an pre-defined anatomical atlas. By leveraging theclassical statistics, researchers may address the following scientific questions:
• i) Is there significant difference in brain atrophy between two groups (re-flected by the p-value)?
• ii) How much is the magnitude of this difference (reflected by the effect size)?
The Generalized Linear Model (GLM), the most common type of regressionmodel, could be used for this purpose. A p-value can be derived from a hypothesistest for each ROI, resulting in the so-called uncorrected p-values (one for eachROI). A correction (e.g., bonferroni correction) for these multiple comparisons canbe then performed to reduce the false positive rate (also known as Type 1 error).GLM has been widely used in neuroimaging studies to identify neuroimaging-based biomarkers.
In this section, we present the basic knowledge of GLM. Readers should feelfree to skip this section given their background and knowledge. Conversely, formore details, see (McCullagh, 2018) on this topic.
1.4.1 Generalized linear model
GLM is a flexible and generalized form of ordinary linear regression. One shouldnot confuse the general linear model and the generalized linear model: the gen-eralized linear model allows for the distribution of the error of the response vari-ables to be non-normal (e.g., binomial distribution), whereas general linear modelrequires strictly a Gaussian distribution.
In a GLM, both systematic and random components can be encompassed. AGLM can be characterized by the following components:
• i) A dependent variable Y whose distribution with parameter q is one of theexponential family of probability distributions.
• ii) A set of independent variables (Xi) and the linear predictor Y = Â bXi.

1.4. Classical statistics 25
• iii) A linking function q = f (Y) to connect the distribution parameter andthe dependent variable Y of the model.
Thus a GLM could be written as follows:
Y = b0 + b1X1i + b2X2i + ... + bpXpi + ei
where ei is the errors part.Fitting the formulated GLM can be achieved by maximum likelihood. The
maximum likelihood estimates can be found using an iteratively reweighted leastsquares algorithm or a Newton’s method with updates of the form. For more basisof mathematics, refer to (Nelder and Wedderburn, 1972).
1.4.2 P-value and effect size
Statistical significance, namely p-value, is the probability that the observed differ-ence between two groups is due to chance (Sullivan and Feinn, 2012). The p-valueis often used in a dichotomous way. For instance, if the p-value is larger than thechosen alpha level (e.g, 0.05), any observed difference is due to the sampling vari-ability or by chance. Conversely, an opposite conclusion, the two groups are sig-nificantly different, is made if the p-value is smaller than 0.05. This interpretationmay have limitations. First, the alpha level is more or less arbitrarily, subjectivelyand manually chosen. R. A. Fisher, in the 1920’s, firstly proposed 0.05 as a stan-dard (Fisher, 1992). This was driven partly by the fact that the five percent cutoff,in a normal distribution, falls nearby the second standard deviation away from themean of the distribution. Currently, some researchers have advocated to shift thealpha level to be more strict (e.g., 0.005 or 0.001) (Benjamin et al., 2018). However,others argued that to boil all this down to a binary decision based on a p-valuethreshold of 0.05, 0.01, 0.005, or anything else, is not acceptable (Trafimow et al.,2018). Moreover, p-value is dependent on the sample size, which means that, witha sufficiently large sample, a statistical test will almost always demonstrate a sig-nificant difference. Thus, reporting only the p-value for a hypothesis test analysisis not adequate for readers to fully understand the results. Argues still exist aboutthe correct use of p-value and researchers have become increasingly aware of itsshortcomings and the potential for abuse (see the call on this issue on Nature formore details: https://www.nature.com/articles/d41586-019-00857-9).
Effect size, the magnitude of the differences between groups, was proposed tobe reported along together with the p-value. Effect size can refer to the raw differ-ence between group means, or absolute effect size, as well as standardized mea-sures of effect, which are calculated to transform the effect to an easily understoodscale (Sullivan and Feinn, 2012). One property of effect size is its independence

26
from the sample size, leading to the use to quantitatively compare results fromdifferent studies. Commonly used effect size indices are as follows:
• i) Cohen’s d is based on differences between means and derived as the dif-ference between two means divided by a standard deviation.
• ii) Cohen’s f2 is one form of effect size measures to use in the context of anF-test for ANOVA.
• iii) Cohen’s q is used with correlation differences between two Fisher trans-formed Pearson regression coefficients..
1.5 Machine learning
Another application focuses on using the advanced ML methods for automatic dis-ease diagnosis and prognosis, due to their main virtue of modelling high-dimensionalneuroimaging data. This approach can be categorized into two phases accord-ing to time and the computational hardware development (e.g., GPU). During thefirst phase, researchers leveraged conventional ML models, such as kernel ma-chines (e.g., SVM) and graphical models (e.g., Bayesian network), for individual-ized disease diagnosis. It was widely applied to several neurodegenerative dis-eases and obtained promising performances for certain tasks, such as diagnosis ofAD (Rathore et al., 2017). At that time, neural network was also in the field but didnot attract so much attention as today. The turning point of neural network cameuntil 2009, when researchers obtain impressive performance on the classificationtasks based on the ImageNet dataset (Deng et al., 2009). This was the beginning ofsecond phase for early dementia diagnosis. A large body of studies has looked atthe potential of DL methods, most often the convolutional neural network (CNN),for instance, for AD classification in the very recent years.
Although no clear separation of the two phases, researchers usually refer thetraditional algorithms, such as SVM and RF, as conventional ML methods. Thesemethods are limited in their ability to process natural data in their raw form anddemand hand-craft feature engineering. Whereas, DL has the ability to learnthe data with intermediate feature representation, which automatically and au-tonomously extract low-to-high level features. With the huge algorithm advanceand also hardware computational power improvement (e.g., GPU), nowadays isthe gold rush era of DL. DL conversely demands a huge appetite of data and com-putational power (LeCun, Bengio, and Hinton, 2015).
In this section, we briefly introduce these techniques. Again, for the readerswho seek for more details on the related topics, please refer to (Bishop, 2009) aboutconventional ML and (Goodfellow et al., 2016) about DL.

1.5. Machine learning 27
1.5.1 Conventional machine learning
A large number of conventional ML algorithms was firstly introduced in the con-text of dementia classification. Here, we present the main algorithms used in thefield.
1.5.1.1 Support vector machine
Support vector machines (SVM) is a popular kernel machine algorithm becauseof its robustness to high dimensional data and to the overfitting problem. Themechanism of SVM is to find an optimal separating hyperplane that maximizes themargin between two classes. Apart from the linear classification task, SVMs canbe used for a non-linear classification by means of the so-called kernel trick. Thekernel functions are used to map the original data (linear/nonlinear ) into a higherdimensional space with view to making it linearly separable. Different types ofkernels can be applied in this case. When the dimensionality is high compared tothe number of subjects, like in the case of neuroimaging studies, a linear kernel isa natural choice, as non-linear kernels would have the effect of transforming thedata into an even higher dimensional space.
1.5.1.2 Logistic regression
Logistic regression (LR) is another widely used model in the context of classifica-tion. It models the relationship between the categorical dependent variable (e.g.,group labels for AD and CN) and one or more independent variables (i.e., theextracted features). This approach can be seen as a special case of GLM, or of lin-ear regression, but with the two major distinct properties. First, the conditionaldistribution of LR is a Bernoulli distribution rather than a Normal distribution.Secondly, it outputs the probabilities restricted to (0,1) through the logistic distri-bution function, rather than the outcomes themselves.
With its simple implementation, LR was adopted in the task of AD classifica-tion (Desikan et al., 2006). However, it exists evident drawbacks. First, the as-sumption of linearity between the dependent and independent variables is notalways valid. Secondly, it is sensitive to multicollinearity and outliers. Lastly, LRdoes not provide accurate results with high dimensional data. In that case, it canbe regularized with different types of penalties (e.g., the l1 and l2 norm) in orderto prevent overfitting.

28
1.5.1.3 Random forest
Random forest (RF) is a typical representative of the ensemble learning method. Itoutputs the final decision by constructing a multitude of individual trees at train-ing time (Ho, 1995). RFs have also been used, although not as frequently as otherapproaches, for AD classification (see (Rathore et al., 2017) for details). Most ofthe studies adopted the voxel-based approach, which would take decisions at thevoxel level, resulting in a high computational cost.
More generally, ensemble learning approaches can also be adopted with differ-ent weak classifiers. For instance, in (Farhan, Fahiem, and Tauseef, 2014), a bunchof different classifiers (e.g., SVM, multilayer perceptron and decision trees) wasused and a majority voting was followed to provide a classification accuracy of94% for AD vs CN classification.
1.5.2 Deep learning
DL has become more and more popular in the very recent years and has been ap-plied to various fields, including medical imaging. This section introduces the ba-sic concepts regarding the key aspects of DL, including the main building layers ofCNN, classical CNN architectures and methods to tackle the overfitting problem.Readers should feel free to skip this section given their background and knowl-edge. Conversely, for more details, see (Goodfellow et al., 2016).
1.5.2.1 Main building layers of CNN
CNNs are the most widely used type of network for computer vision and imageanalysis. A CNN is made of an input and an output layer, as well as differenthidden layers. The hidden layers typically include convolutional layers, poolinglayers, activation functions and fully connected (FC) layers.
The convolutional layer is the core building block of a CNN. It acts as an auto-matic feature extractor (on the contrary, conventional ML methods would typicallyuse hand-craft feature extraction or selection). Convolutional layers apply learn-able filters to all available receptive fields with a convolutional operation. A filteror kernel is a 2D (or 3D for MRI) matrix of weights. A receptive field is a localpatch of the input image, of the same size as the filter. The filter is convolved withall the local receptive fields. The application of a given filter to the whole inputimage generates a feature map or activation map. All the feature maps are thenstacked to constitute the output volume of a convolutional layer. Several hyper-parameters (number of filters, stride size and padding size) control the size of theoutput volume (see (Dumoulin and Visin, 2016) for more details).

1.5. Machine learning 29
Another building block of CNNs is the pooling layer, which reduces the dimen-sionality of the feature maps. The pooling layer combines the outputs of a clusterof neurons of the current layer into a single neuron in the next layer (Ciresan et al.,2011; Krizhevsky, Sutskever, and Hinton, 2012). Pooling can be of different types,such as max, average and sum pooling (Scherer, Müller, and Behnke, 2010).
To learn a mapping between the adjacent convolutional layers, one applies ac-tivation functions to the output volume of each convolutional layer. The rectifiedlinear unit (ReLU) is the most common activation function and ensures a sparseand non-linear representation (Glorot, Bordes, and Bengio, 2011; Krizhevsky, Sutskever,and Hinton, 2012; Nair and Hinton, 2010). However, ReLU can be fragile duringbackpropagation. Indeed, the fact that ReLU sets all negative values to be zerocan cause the problem of gradient vanishing or dying ReLU. If this happens, thegradient flowing through the unit will be forever zero during backpropagation.One alternative, leaky ReLU, can overcome this drawback by introducing a smallnegative slope (e.g. 0.01), thus allowing a small positive gradient when the unit isnot active (Maas, Hannun, and Ng, 2013).
FC layers learn the relationship between the features, extracted by previousconvolutional and pooling layers, and the target (in our case the patient’s diag-nosis). In a FC layer, all the neurons in the current layer are connected to all theneurons in the previous layer. The output volumes (one for each feature map)from the previous convolutional layers are first flattened and then fed as inputto the FC. For a n-class classification problem, the output of the last FC layer iscomposed of n neurons which values indicate membership to a given class. Thiscan be transformed into n probabilities by using a softmax function on the outputs(Goodfellow et al., 2016).
The loss function is used to measure the difference between the predicted andtrue labels. Cross entropy loss, measuring the distance between the output dis-tribution and the real distribution, is widely used in classification tasks (Boer etal., 2005). Other loss functions were also discussed in the literature, such as meansquared error (MSE) loss and hinge loss (see (Janocha and Czarnecki, 2017) fordetails).
The weights and biases of the network are learned using an optimization algo-rithm, such as the stochastic gradient descent (SGD). Most often, backpropagationis used to successively update the weights of the different layers.

30
1.5.2.2 Classical CNN architectures
Several CNN architectures have become classical, often due to their performanceon the ImageNet Large Scale Visual Recognition Challenge (ILSVRC): a bench-mark in object category classification and detection on hundreds of object cate-gories and millions of images (Deng et al., 2009). These architectures were origi-nally designed for 2D natural images. However, some of them have been adaptedto the applications of MRIs.
Before the ILSVRC that began in 2010, Yann Lecun proposed LeNet-5 to rec-ognize handwritten digits from the MNIST database (Lecun et al., 1998). Thisnetwork includes seven layers: two convolutional layers associated with poolinglayers, followed by three FC layers.
In 2012, AlexNet (Krizhevsky, Sutskever, and Hinton, 2012) significantly out-performed all the prior competitors of the ILSVRC, reducing the top-5 error from26% to 15.3%. The network went deeper than LeNet-5, with more filters per layer.It consisted of five convolutional layers with decreasing filter size (11x11, 5x5 and3x3) and three FC layers.
The runner-up at ILSVRC 2014 was VGGNet (Simonyan and Zisserman, 2014),which consists of 16 convolutional layers. It was appealing because of its uniformarchitecture, including only 3x3 convolutional filters cross the entire architecture.One of the main conclusion of this architecture is that using many small filters ofsize 3x3 is more efficient than using only a few filters of bigger size. The winnerof that year was GoogleNet or Inception V1 (Szegedy et al., 2015). It went deeper(22 layers) and achieved a top-5 error rate of 6.67%. This architecture was inspiredby LeNet-5 and implemented a novel element called the inception layer. The ideabehind the inception layer is to convolve over larger receptive fields, but also keepa fine resolution based on smaller receptive fields. Thus, different filter sizes (from1x1 to 5x5) were used in the same convolutional layer.
ILSVRC 2015 was won by the Residual Neural Network (ResNet) (He et al.,2016) with a top-5 error rate of 3,57%. ResNet includes over a hundred layers byintroducing a novel architecture with shortcut connections that perform identitymapping and heavy batch normalization. Such shortcut connections make thedeep residual nets easier to optimize than their counterpart “plain” nets.
DenseNet was presented at ILSVRC 2016 (Huang et al., 2017). It introduces theso-called dense block: each layer receives the outputs of all previous layers as in-put. The underlying assumption of dense connectivity is that each layer shouldhave access to all the preceding feature maps and this “collective knowledge”therefore helps to improve the performance. In the same way than ResNet, denseconnectivity allows the construction of very deep CNNs, such as DenseNet-264which consists of 264 layers.

1.5. Machine learning 31
1.5.2.3 Methods to deal with overfitting
Neuroimaging datasets of AD patients are usually of relatively small size (typi-cally a few hundreds of samples) compared, for instance, to those in computervision (typically several million). DL models tend to easily overfit when trainedon small samples due to the large number of learnt parameters (Goodfellow et al.,2016). Here, we summarize the main strategies to alleviate overfitting.
Data augmentation aims at generating new data samples from the availabletraining data (Perez and Wang, 2017). It can be categorized into: i) transforma-tion methods, which apply a combination of simple transformations (e.g. rotation,distortion, blurring and flipping) on the training data and ii) data synthesis meth-ods, which aim to learn the training distribution to then generate new samples.Data synthesis often relies on autoencoders (AE) (Bourlard and Kamp, 1988; Hin-ton and Zemel, 1994; Yann, 1987) and Generative Adversarial Networks (GANs)(Goodfellow, 2016).
Dropout randomly and independently drops neurons, setting their output valueto be zero along with their connections (Srivastava et al., 2014). This aims to makethe network less complex and thus less prone to overfitting.
Another approach involves a regularization of the weights which makes themodel less complex. This enhances the generalizability of the model. In DL, acommon regularization is weight decay, where the updated weights are regular-ized by multiplying by a factor slightly smaller than 1 (Krogh and Hertz, 1992).
Batch normalization is a procedure which normalizes the input of a given setof layers (the normalization is done using the mean and standard-deviation of abatch, hence the name) (Ioffe and Szegedy, 2015). This procedure acts as a regu-larizer, in some cases eliminating the need for dropout (Ioffe and Szegedy, 2015).In addition, it helps battle against the gradient explosion phenomenon and allowsusing much higher learning rates and being less careful about initialization (Pani-grahi, Chen, and C. Jay Kuo, 2018).
Transfer learning is a broadly defined terminology. In general, it consists inusing a model trained on a given task, called the source task (e.g. ImageNet classi-fication task or unsupervised learning task), in order to perform a target task (e.g.AD classification). Here, we introduce two transfer learning approaches that havebeen used in the context of AD classification. The first one is based on performingunsupervised learning before the supervised learning on the task of interest. It issupposed to be useful when one has limited labeled data but a larger set of unla-beled data. In that case, the most common approach is to use an AE (Yann, 1987).Strictly speaking, the AE is made of two parts: an encoder layer and a decoderlayer. Generally, several AEs are stacked, the resulting being called stacked AE,but which we will refer to as AE for the sake of simplicity. The encoder learns to

32
compress the original data and produces a representation, the decoder then recon-structs the input using only this representation. An illustration of AE is shownin Figure 1.8. The weights and biases of the target network (e.g. CNNs) are theninitialized with those of the encoder part of AE, which should provide a betterinitialization. The second approach involves transferring a model trained on Ima-geNet to the problem of classification of AD. As for the AE, the weights and biasesof the target network are initialized with those of the source network. The ideabehind is that random weight initialization of DL models may place parameters ina region of the parameter space where poor generalization occurs, while transferlearning may provide a better initialization (Erhan et al., 2010).
Figure 1.8: For the n-th AE, the encoder part is made of one convolu-tional layer (Conv n), one pooling layer (Pooling n) and one activationfunction, sequentially. Correspondingly, the decoder part consists ofone activation function, one unpooling layer (Unpooling n) and onedeconvolutional layer (Deconv n), sequentially. The n AEs’s encoderand decoder parts are separated and then stacked to construct the fi-nal stacked AE. This layer-wise fashion ensures that the output of theformer AE’s encoder/decoder connects as input for the next AE’s en-coder/decoder. The intermediate representation provides a reduced
representation of the data.
Early Stopping consists in stopping the learning process at an earlier point.It aims to determine the number of epochs (or iterations) at which the networkshould be stopped before being severely overfitted. For instance, one can selectthe model parameters corresponding to the lowest validation error rather than thelast updated parameters. Various other stopping criterions have been proposed(Prechelt, 2012; Yao, Rosasco, and Caponnetto, 2007; Zhang and Yu, 2005).

1.5. Machine learning 33
1.5.3 Validation
1.5.3.1 Cross-validation
Cross-validation aims at assessing how the trained model will generalize to an in-dependent data set. Alternatively stated, it consists of applying the model trainedon a training data (from which the model learns) to the unseen dataset (test data,where the model is evaluated), while keeping the bias of this estimation as smallas possible. In the application of neuroimaging and ML, it is critical to perform aproper cross-validation. However, data leakage (Rathore et al., 2017; Kriegeskorteet al., 2009), the use of information coming from the test set during the trainingphase, still occurred in a considerable proportion of peer-reviewed papers in theliterature.
Different strategies may be adopted according to the algorithm you choose. Inthe case of conventional ML models, researchers have addressed the importanceof the proper way for the optimization of model hyperparameters (e.g., the C pa-rameter of SVM, controlling how much you want to avoid misclassifying each sub-ject). Recent cross-validation guidelines, highly demanding an inner loop of cross-validation, or nested cross-validation, was proposed in (Varoquaux et al., 2017).Moreover, bad practices due to this can be witnessed in the literature, where thisstep has not been properly followed (Querbes et al., 2009; Wolz et al., 2011), leadingto over-optimistic results, as presented in (Eskildsen et al., 2013; Maggipinto et al.,2017). On the other hand, the cross-validation in DL seems more tricky. First, un-like conventional ML models which have limited hyperparameter for optimizing,DL models have a huge number of hyperparameters for tuning, including bothmodel architecture hyperparameters (e.g., number of layers) and training hyper-parameters (e.g., learning rate). Due to the limitation of computational power andtime, one can not try each combination of these hyperparameters in an exhaustivemanner. Moreover, the need of an independent test dataset is more urgent in DLbecause the process of hyperparameter optimization could easily contaminate theso-called test dataset, which is actually the validation dataset in many studies. Ac-cordingly, the data leakage problem flooded seriously in DL and cautions need tobe advocated. See the State of the art section in Chapter 5 for details.
1.5.3.2 Performance metrics
Different metrics are used to quantify the performance of a trained model. In thecontext of a binary classification, accuracy, sensitivity and specificity are most of-ten used. In this setting, we introduce the following definitions:
• True positive (TP): number of instances that are correctly identified;
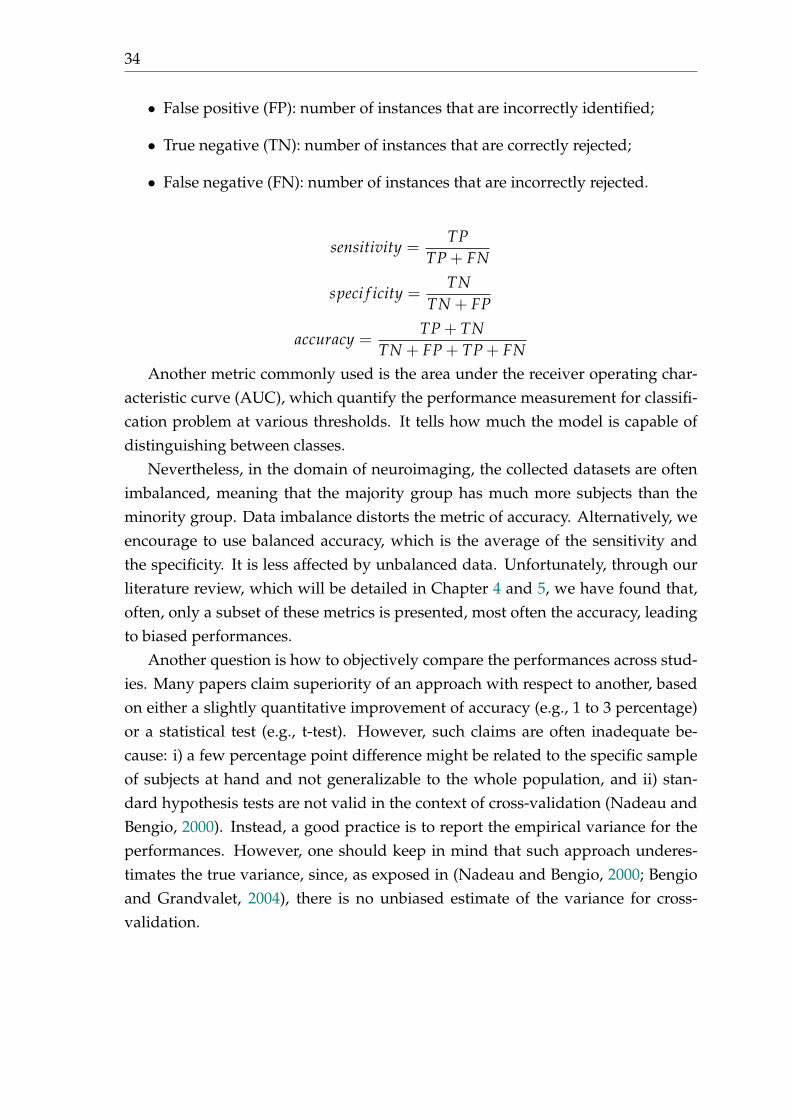
34
• False positive (FP): number of instances that are incorrectly identified;
• True negative (TN): number of instances that are correctly rejected;
• False negative (FN): number of instances that are incorrectly rejected.
sensitivity =TP
TP + FN
speci f icity =TN
TN + FP
accuracy =TP + TN
TN + FP + TP + FNAnother metric commonly used is the area under the receiver operating char-
acteristic curve (AUC), which quantify the performance measurement for classifi-cation problem at various thresholds. It tells how much the model is capable ofdistinguishing between classes.
Nevertheless, in the domain of neuroimaging, the collected datasets are oftenimbalanced, meaning that the majority group has much more subjects than theminority group. Data imbalance distorts the metric of accuracy. Alternatively, weencourage to use balanced accuracy, which is the average of the sensitivity andthe specificity. It is less affected by unbalanced data. Unfortunately, through ourliterature review, which will be detailed in Chapter 4 and 5, we have found that,often, only a subset of these metrics is presented, most often the accuracy, leadingto biased performances.
Another question is how to objectively compare the performances across stud-ies. Many papers claim superiority of an approach with respect to another, basedon either a slightly quantitative improvement of accuracy (e.g., 1 to 3 percentage)or a statistical test (e.g., t-test). However, such claims are often inadequate be-cause: i) a few percentage point difference might be related to the specific sampleof subjects at hand and not generalizable to the whole population, and ii) stan-dard hypothesis tests are not valid in the context of cross-validation (Nadeau andBengio, 2000). Instead, a good practice is to report the empirical variance for theperformances. However, one should keep in mind that such approach underes-timates the true variance, since, as exposed in (Nadeau and Bengio, 2000; Bengioand Grandvalet, 2004), there is no unbiased estimate of the variance for cross-validation.
1.6. Neuroimaging biomarkers of C9orf72 diseases at presymptomatic stage 35
1.6 Neuroimaging biomarkers of C9orf72 diseases atpresymptomatic stage
FTLD and ALS are neurodegenerative diseases sharing common genetic causes,the most frequent being the C9orf72 gene (DeJesus-Hernandez et al., 2011; Ren-ton et al., 2011), accounting for between 13% and 26% of genetic cases (Mahoneyet al., 2012a). The clinical phenotype associated with C9orf72 repeat expansioncould be bvFTD, ALS, FTD-ALS or less commonly PPA (Snowden et al., 2012).The presymptomatic stage can be defined as the stage during which pathologicalchanges accumulate in the absence of any symptoms, but the underlying pathol-ogy may become active already. Thus, robust biomarkers are highly demandedin order to track and monitor the disease trajectory, especially at the presymp-tomatic stage. From a clinical trial perspective, presymptomatic carriers of ge-netic mutation represent the optimal target population for the development of newdisease-modifying treatments against C9orf72 carriers. It is now well-known thatneurodegenerative diseases cause biological and morphological changes decadesbefore symptom onset (Bateman et al., 2012); the presymptomatic stage representsthe best time for therapeutic interventions because it allows stopping the neurode-generative process before irreversible brain damage occurs. Thus, establishing thechronology of structural and microstructural changes during the presymptomaticstage is crucial to identify markers of disease progression and monitor the effect oftreatments.
Researchers have tried to establish the blueprint of neuroimaging-based biomark-ers at the presymptomatic phase (Rohrer et al., 2015; Walhout et al., 2015; Lee etal., 2016; Cash et al., 2017; Papma et al., 2017; Popuri et al., 2018; Bertrand et al.,2017; Papma et al., 2017; Jiskoot, 2018). The modalities involved among thesestudies are T1w MRI (Rohrer et al., 2015; Walhout et al., 2015; Lee et al., 2016;Cash et al., 2017; Papma et al., 2017; Popuri et al., 2018), diffusion MRI (Lee etal., 2016; Bertrand et al., 2017; Papma et al., 2017) and functional MRI (Lee et al.,2016). Moreover, recent preclinical development of disease-modifying drugs, suchas antisense oligonucleotides that target mutant RNA, offer promising therapeuticperspectives in C9orf72 disease. However, no robust biomarkers of genetic FTLDexist yet to i) stratify correctly into treatment groups based on the pathologicalsubtypes, ii) assess the diseases severity and progression, iii) discriminate betweenthe disease stages (e.g., presymptomatic stage or late symptomatic stage) and iv)finally to track and monitor disease progression and the therapeutic treatment re-sponse. Please refer to (Floeter and Gendron, 2018; Jiskoot, 2018) for more detailson biomarkers of C9orf72 disease.

36
1.7 Classification of AD based on neuroimaging data
Early and accurate diagnosis of AD is difficult, partly because of the large numberof measures involved, such as neuroimaging and fluid biomarkers or neuropsy-chological tests. The ability of ML algorithms to learn relevant patterns within thedata is expected to enable accurate automatic classifications and predictions.
It has been suggested that the neuroimaging-based biomarkers can be valuableto track the characteristics of neurodegeneration, as measured with structural MRI(Frisoni et al., 2010). Further alterations quantified by other modalities were alsodiscussed (Agosta et al., 2012). However, the subtle changes at the early stages ofAD are difficult to distinguish. Thus early and accurate identification of patientswith AD remains challenging. In recent years, a large body of papers has beenpublished on neuroimaging and machine learning (ML) techniques for automaticclassification of AD. Depending on the stages that are considered, different classi-fication tasks can be formulated.
• i) AD vs CN: to classify patients with AD dementia (AD) from cognitivelynormal subjects (CN);
• ii) MCI vs CN: to classify subjects with mild cognitive impairment from cog-nitively normal subjects;
• iii) pMCI vs sMCI: to distinguish the progression of MCI subjects to AD,meaning to classify subjects that will progress to AD (denoted as pMCI) inthe future (e.g. in 12, 18 or 36 months) from those who will remain stable(denoted as sMCI);
• iv) AD vs MCI: to classify patients with AD dementia from the MCI subjects;
• v) multiclass classification: to classify subjects into one of three or moreclasses.
A large majority of studies (see (Magnin et al., 2009; Vemuri et al., 2008; Klöppelet al., 2008) for example) examined the task of AD vs CN and achieved encourag-ing but varied performances, generally ranging from 76% to 95% of accuracy forconventional ML methods (see review paper (Rathore et al., 2017) for details), from80% to 100% for DL methods. The distinguishable pattern between AD and CNis evident and easily detectable in MRI and cognitive tests, thus the translationto clinical practice from this task is limited, but it could be useful to reinforce theconfidence in the diagnosis.

1.7. Classification of AD based on neuroimaging data 37
Other studies have then focused on discriminating MCI subjects from cogni-tively normal subjects (MCI vs CN). The difficulty of this task is the heterogene-ity of the MCI state, which means that a MCI subject could possibly develop ADbut also other neurodegenerative diseases, or remain stable as MCI or even revertback to the CN stage. Therefore, this task may not be very relevant to predict ADdirectly, but a large number of papers has performed this task. The obtained clas-sification accuracy typically ranges from 65% to 85% for conventional ML, eventhough a few studies reach over 90% (Rathore et al., 2017), and from 62% to 98%for DL.
A more challenging task is to predict the progression of MCI subjects to AD:pMCI vs sMCI. In the literature, the classification perforances varied across stud-ies, ranging from 62% to 83% for conventional ML (Rathore et al., 2017) and from62% to 83% for DL. Indeed, a few studies achieved higher accuracies (e.g., Cabralet al., 2015). Nevertheless, such results must be taken with caution since someof these studies involved i) small samples (Misra, Fan, and Davatzikos, 2009;Cabral et al., 2015), ii) imbalanced groups and iii) inadequate details on the cross-validation procedure, which may lead to over-optimistic results.
The task of AD vs MCI was also presented in the literature (see (Wee et al., 2013;Lillemark et al., 2014) as example). The performances across papers differ, rangingfrom 70% to 90% for conventional ML (Rathore et al., 2017) and from 67% to 100%for DL. However, with similar limitations, these performances may be biased andover-optimistic.
Apart from the binary classification tasks mentioned above, researchers havealso looked at multiclass classification. Generally, this is more challenging andseveral papers used DL, most often convolutional neural networks (CNN), for thatpurpose. The performances vary according to the specific tasks and the validity oftheir methodology (see (Islam and Zhang, 2018; Valliani and Soni, 2017) as exam-ple).
The review papers, such as in (Rathore et al., 2017) aid to get an overview ofthe state of the art. In the current PhD, we performed a systematic and exhaus-tive literature search regarding classification of AD using conventional ML withdiffusion MRI (see Chapter 4) and CNNs with anatomical MRI (see Chapter 5).According to the high accuracies obtained in the literature, one may question howmuch confidence we can put on the reported accuracies? One step further, how farare we away from the translation to clinical practice? One will see in the results ofour literature reviews that the reported accuracies in the literature are not directlycomparable across studies. Moreover, the high accuracies, sometimes nearly a per-fect accuracy, are not always reliable due to the existence of bad practices.

38
1.8 Datasets
In this section, we briefly present the datasets which were used in this dissertation.
1.8.1 PREVDEMALS dataset for C9orf72 carriers
PREVDEMALS is a national multicentric study cohort which enrolled patientsand their first-degree relatives of C9orf72 mutation carriers from 48 families. Thisstudy was approved by the Comité de Prévention des Personnes Ile de France VIof the Hôpital Pitié-Salpêtrière, and written informed consent was obtained fromall participants.
The aim of this study is to identify biomarkers of this disease at the presymp-tomatic stage. All the patients underwent an anatomical MRI (T1w MRI), diffu-sion MRI (both single-shell and multi-shell diffusion MRI), functional MRI, FLAIRMRI, arterial spin labeling (ASL) MRI, FDG PET scans and cognitive tests. Weused only the T1w and diffusion MRI data in this dissertation.
1.8.2 Public databases for AD
Three publicly available datasets have been mainly used for the study of AD:the Alzheimer’s Disease Neuroimaging Initiative (ADNI), the Australian Imaging,Biomarkers and Lifestyle (AIBL) and the Open Access Series of Imaging Studies(OASIS). In the following, we briefly describe these datasets and provide expla-nations on the diagnosis labels provided. Indeed, the diagnostic criteria of thesestudies differ, hence there is no strict equivalence between the labels of ADNI andAIBL, and those of OASIS.
The ADNI study is composed of 4 cohorts: ADNI-1, ADNI-GO, ADNI-2 andADNI-3. These cohorts are dependent and longitudinal, meaning that a given pa-tient may be examined at multiple points in time and that different cohorts mayinclude the same patients. Many modalities are included in these datasets includ-ing clinical, genetic, imaging (MRI and PET) data, as well as biospecimen analysessuch as blood, urine and cerebrospinal fluid (CSF). Diagnosis labels are given by aphysician after a series of tests (Petersen et al., 2010). The existing labels are:
• AD (Alzheimer’s disease): mildly demented patients;
• MCI (mild cognitive impairment): patients in the prodromal phase of AD;
• NC (normal controls): elderly control participants;

1.8. Datasets 39
• SMC (significant memory concern): participants with cognitive complaintsand no abnormal neuropsychological findings. The designations SMC andsubjective cognitive decline (SCD) are equivalently found in the literature.
Since the ADNI-GO and ADNI-2 cohorts, new patients at the very beginning ofthe prodromal stage have been recruited (Aisen et al., 2010), hence the MCI labelhas been split into two labels:
• EMCI (early MCI): patients at the beginning of the prodromal phase;
• LMCI (late MCI): patients at the end of the prodromal phase (similar to theprevious label MCI of ADNI-1).
The AIBL project includes a longitudinal cohort of patients. Several modalitiesare present in the dataset, such as clinical and imaging (MRI and PET) data, aswell as the analysis of blood and CSF samples. As in ADNI, the diagnosis is givenaccording to a series of clinical tests (Ellis et al., 2010; Ellis et al., 2009) and theexisting labels are AD, MCI and NC.
The OASIS project includes three cohorts, OASIS-1, OASIS-2 and OASIS-3. Thefirst cohort OASIS-1 is only cross-sectional, whereas the other two are longitudinal.Available data is far more limited than in ADNI with only few clinical tests andimaging data (MRI and PET only in OASIS-3). Diagnosis labels are given onlybased on the clinical dementia rating (CDR) scale (Marcus et al., 2007). Two labelscan be found in the OASIS-1 dataset:
• AD, which corresponds to patients with a non-null CDR score. This classgathers patients who would be spread between the MCI and AD classes inADNI. A subdivision of this class is done based on the CDR, the scores of0.5, 1, 2 and 3 representing very mild, mild, moderate and severe dementia,respectively;
• Control, which corresponds to patients with a CDR of zero. Unlike in ADNI,some of the controls are younger than 55.
In many datasets, the label related to the stability of the diagnosis (i.e. sMCIand pMCI) is not given in the baseline data and must be deduced from the lon-gitudinal data. The way these labels were defined in our study is described inthe Materials section and its implementation is available at: https://gitlab.icm-institute.org/aramislab/AD-ML.
Note that some of the image preprocessing steps may have already been per-formed by the dataset provider. However, different preprocessing pipelines can berun on the same dataset, so the name of the dataset does not provide sufficient in-formation to know which methods have been applied to the data. It is thus crucialto describe all the preprocessing steps applied to the subjects’ images.


41
Chapter 2
Early Cognitive, Structural, andMicrostructural Changes inPresymptomatic C9orf72 CarriersYounger Than 40 Years
This chapter has been published as a journal article on JAMA Neurology (Bertrandet al., 2017):
• Bertrand, A., Wen, J. (Co-first author), Rinaldi, D., Houot, M., Sayah, S.,Camuzat, A., Fournier, C., Fontanella, C., Routier, A., Couratier, P., Pasquier,F., Habert, M., Hannequin, D., Martinaud, O., Caroppo, P., Levy, R., Dubois,B., Brice, A., Durrleman, S., Colliot, O., Le Ber, I. Early Cognitive, Structural,and Microstructural Changes in Presymptomatic C9orf72 Carriers YoungerThan 40 Years, JAMA neurology, 75(2), pp.236-245. https://hal.inria.fr/hal-01654000/document.
2.1 Abstract
IMPORTANCE Presymptomatic carriers of chromosome 9 open reading frame 72(C9orf72) mutation, the most frequent genetic cause of frontotemporal lobar de-generation and amyotrophic lateral sclerosis, represent the optimal target popula-tion for the development of disease-modifying drugs. Preclinical biomarkers areneeded to monitor the effect of therapeutic interventions in this population.
OBJECTIVES To assess the occurrence of cognitive, structural, and microstruc-tural changes in presymptomatic C9orf72 carriers.
DESIGN,SETTING,AND PARTICIPANTS The PREVDEMALS study is a prospec-tive, multicenter, observational study of first-degree relatives of individuals car-rying the C9orf72 mutation. Eighty-four participants entered the study betweenOctober 2015 and April 2017; 80 (95%) were included in cross-sectional analyses
42
of baseline data. All participants underwent neuropsychological testing and mag-netic resonance imaging; 63 (79%) underwent diffusion tensor magnetic resonanceimaging. Gray matter volumes and diffusion tensor imaging metrics were calcu-lated within regions of interest. Anatomical and microstructural differences be-tween individuals who carried the C9orf72 mutation (C9+) and those who did notcarry the C9orf72 mutation (C9-) were assessed using linear mixed-effects models.Data were analyzed from October 2015 to April 2017.
MAIN OUTCOMES AND MEASURES Differences in neuropsychological scores,graymatter volume, and white matter integrity between C9+ and C9- individuals.
RESULTS Of the 80 included participants, there were 41 C9+ individuals (24[59%]female; mean [SD] age, 39.8 [11.1] years) and 39 C9- individuals (24 [62%] female;mean [SD] age, 45.2 [13.9] years). Compared with C9- individuals, C9+ individ-uals had lower mean (SD) praxis scores (163.4 [6.1] vs 165.3 [5.9]; P = 0.01) andintransitive gesture scores (34.9 [1.6] vs 35.7 [1.5]; P = 0.004), atrophy in 8 cor-tical regions of interest and in the right thalamus, and white matter alterationsin 8 tracts. When restricting the analyses to participants younger than 40 years,compared with C9- individuals, C9+ individuals had lower praxis scores and in-transitive gesture scores, atrophy in 4 cortical regions of interest and in the rightthalamus, and white matter alterations in 2 tracts.
CONCLUSIONS AND RELEVANCE Cognitive, structural, and microstruc-tural alterations are detectable in young C9+ individuals. Early and subtle praxisalterations, underpinned by focal atrophy of the left supramarginal gyrus, mayrepresent an early and non-evolving phenotype related to neurodevelopmentaleffects of C9orf72 mutation. White matter alterations reflect the future phenotypeof frontotemporal lobar degeneration/amyotrophic lateral sclerosis, while atro-phy appears more diffuse. Our results contribute to a better understanding of thepreclinical phase of C9orf72 disease and of the respective contribution of magneticresonance biomarkers.
2.2 Introduction
Frontotemporal lobar degeneration (FTLD) and amyotrophic lateral sclerosis (ALS)are neurodegenerative dis- eases with common genetic causes, the most frequentbeing a GGGGCC repeat expansion in the chromosome 9 open reading frame 72(C9orf72) gene (DeJesus-Hernandez et al., 2011; Renton et al., 2011). This expan-sion may lead to a loss of C9orf72 function and causes abnormal neuronal ag-gregation of nuclear RNA foci, dipeptides repeats (DPR), and transactive responseDNA-binding protein 43 (TDP-43) inclusions (Cruts et al., 2013). Recent preclinicaldevelopment of disease-modifying drugs, such as antisense oligonucleotides that
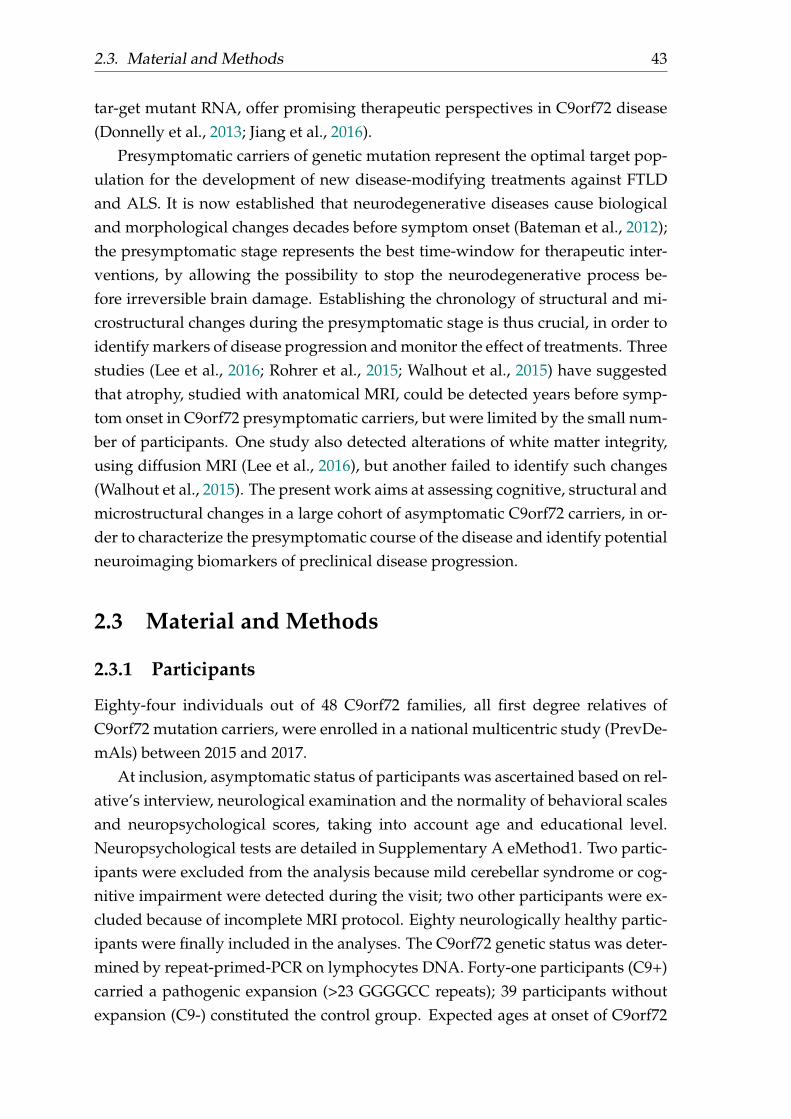
2.3. Material and Methods 43
tar-get mutant RNA, offer promising therapeutic perspectives in C9orf72 disease(Donnelly et al., 2013; Jiang et al., 2016).
Presymptomatic carriers of genetic mutation represent the optimal target pop-ulation for the development of new disease-modifying treatments against FTLDand ALS. It is now established that neurodegenerative diseases cause biologicaland morphological changes decades before symptom onset (Bateman et al., 2012);the presymptomatic stage represents the best time-window for therapeutic inter-ventions, by allowing the possibility to stop the neurodegenerative process be-fore irreversible brain damage. Establishing the chronology of structural and mi-crostructural changes during the presymptomatic stage is thus crucial, in order toidentify markers of disease progression and monitor the effect of treatments. Threestudies (Lee et al., 2016; Rohrer et al., 2015; Walhout et al., 2015) have suggestedthat atrophy, studied with anatomical MRI, could be detected years before symp-tom onset in C9orf72 presymptomatic carriers, but were limited by the small num-ber of participants. One study also detected alterations of white matter integrity,using diffusion MRI (Lee et al., 2016), but another failed to identify such changes(Walhout et al., 2015). The present work aims at assessing cognitive, structural andmicrostructural changes in a large cohort of asymptomatic C9orf72 carriers, in or-der to characterize the presymptomatic course of the disease and identify potentialneuroimaging biomarkers of preclinical disease progression.
2.3 Material and Methods
2.3.1 Participants
Eighty-four individuals out of 48 C9orf72 families, all first degree relatives ofC9orf72 mutation carriers, were enrolled in a national multicentric study (PrevDe-mAls) between 2015 and 2017.
At inclusion, asymptomatic status of participants was ascertained based on rel-ative’s interview, neurological examination and the normality of behavioral scalesand neuropsychological scores, taking into account age and educational level.Neuropsychological tests are detailed in Supplementary A eMethod1. Two partic-ipants were excluded from the analysis because mild cerebellar syndrome or cog-nitive impairment were detected during the visit; two other participants were ex-cluded because of incomplete MRI protocol. Eighty neurologically healthy partic-ipants were finally included in the analyses. The C9orf72 genetic status was deter-mined by repeat-primed-PCR on lymphocytes DNA. Forty-one participants (C9+)carried a pathogenic expansion (>23 GGGGCC repeats); 39 participants withoutexpansion (C9-) constituted the control group. Expected ages at onset of C9orf72

44
carriers were estimated by averaging the ages at onset of affected relatives, simi-larly to previous studies (Rohrer et al., 2015).
2.3.2 MRI acquisition
All MRI acquisitions were performed on a 3T MR system (Siemens Prisma 3Tn= 64; Philips Achieva 3T n= 9; GE 3T n=7), in 3 imaging centers belonging tothe harmonized national network of CATI (Centre d’Acquisition et de Traitementd’Images, cati-neuroimaging.com/) (Operto et al., 2016). CATI performs on-sitevisits for the setup of imaging protocols and regular follow-up. 3DT1 sequenceparameters were similar for the 3 centers, while DTI sequence was performed inonly one center (see Supplementary A eMethod2 for detailed sequence parame-ter). Systematic quality check of MR images were performed by CATI, using adedicated software programme with quantitative and qualitative indices, allow-ing the check for 1) protocol consistency (MRI scanner, software version, type ofreception coil, acquisition slab position, sequence parameters and sequence order);2) presence and localization of artifacts (motion artifacts, spike artifacts, other); 3)overall image quality based on signal-to-noise ratio, contrast-to-noise ratio and in-tensity non-uniformity (Operto et al., 2016). Among the 80 MR dataset, 75 (94%)were considered of good quality and 5 (6%) of acceptable quality.
2.3.3 Anatomical MRI processing
FreeSurfer image analysis software 5.3 (http://surfer.nmr.mgh.harvard.edu) wasused to process the T1-weighted images. The processing pipeline included non-uniformity and intensity correction, skull stripping, grey/white matter segmen-tation, reconstruction of the cortical surface, extraction of cortical ROI volumesusing the Desikan atlas, and subcortical ROI volumes and total intracranial vol-ume (TIV) using the aseg atlas. We used for analyses the normalized volume ofeach ROI, defined as NVROI = (TIVm.VROI)/TIV, where TIVm is the average to-tal intracranial volume computed across all participants, which is constant, andVROI is the volume of the ROI. The role of the constant multiplicative factor TIVmis simply to preserve the order of magnitude of NVROI similar to that of VROI.
2.3.4 Diffusion MRI processing
All raw DWI volumes were aligned to the average b0 image with first 6 degreesof freedom (dof), to correct for head motion, and diffusion directions were ap-propriately updated (Leemans and Jones, 2009). A registration with 12 dof was

2.3. Material and Methods 45
used to correct for eddy current distortions. These registrations were done us-ing the FSL flirt tool (www.fmrib.ox.ac.uk/fsl). Field map image was used tocorrect for echo-planar imaging (EPI) induced susceptibility artifacts (Jezzard andBalaban, 1995) with the FSL prelude/fugue tools. DWI volumes were correctedfor nonuniform intensity using ANTs N4 bias correction algorithm (Tustison andAvants, 2013). A single multiplicative bias field from the averaged b0 image wasestimated (Jeurissen et al., 2014). The DWI datasets were up-sampled at 1mm inorder to improve the registration between the T1-weighted image and the DWI. Adiffusion tensor model was fitted at each voxel to calculate Fractional Anisotropy(FA), Mean Diffusivity (MD), Radial Diffusivity (RD) and Axial Diffusivity (AD)maps. White matter tracts were defined using the JHU white-matter tractographyatlas (Mori et al., 2005), with a 25% probabilistic threshold. For each subject, theFA map was registered onto the JHU atlas template with the ANTs SyN algorithm(Avants et al., 2008). Then, the estimated non-linear deformation was applied tothe parametric maps and we extracted, in each patient, the average values of DTImetrics (FA, MD, RD and AD) within each tract of the JHU atlas.
2.3.5 Statistical analysis
Statistical analyses were performed using R 3.4.0 (The R Foundation for StatisticalComputing, Vienna, Austria) and GraphPad Prism 7.0 (La Jolla, CA, USA). De-mographic characteristics and clinical tests were compared between groups usingchi-squared test (for dichotomous and categorical variables) or Mann-Whitney test(for numerical variables). Structural and microstructural differences between car-riers and non-carriers of the C9orf72 mutation were assessed using linear mixed-effects models. We used real age and group (i.e., mutation status) as fixed effects,and family membership as random effect, with the following model:
yjik = µ + b ⇥ genderi + l ⇥ agei + h ⇥ groupi + Uk + e
jik
where yjik is the response of the jth ROI for the ith subject and the kth family; genderi,
agei and groupi are the fixed effects; µ, b, l and h are their estimated parameters;Uk is the random effect measuring the difference between the average response inthe family and in the whole population; e
jik is the random error.
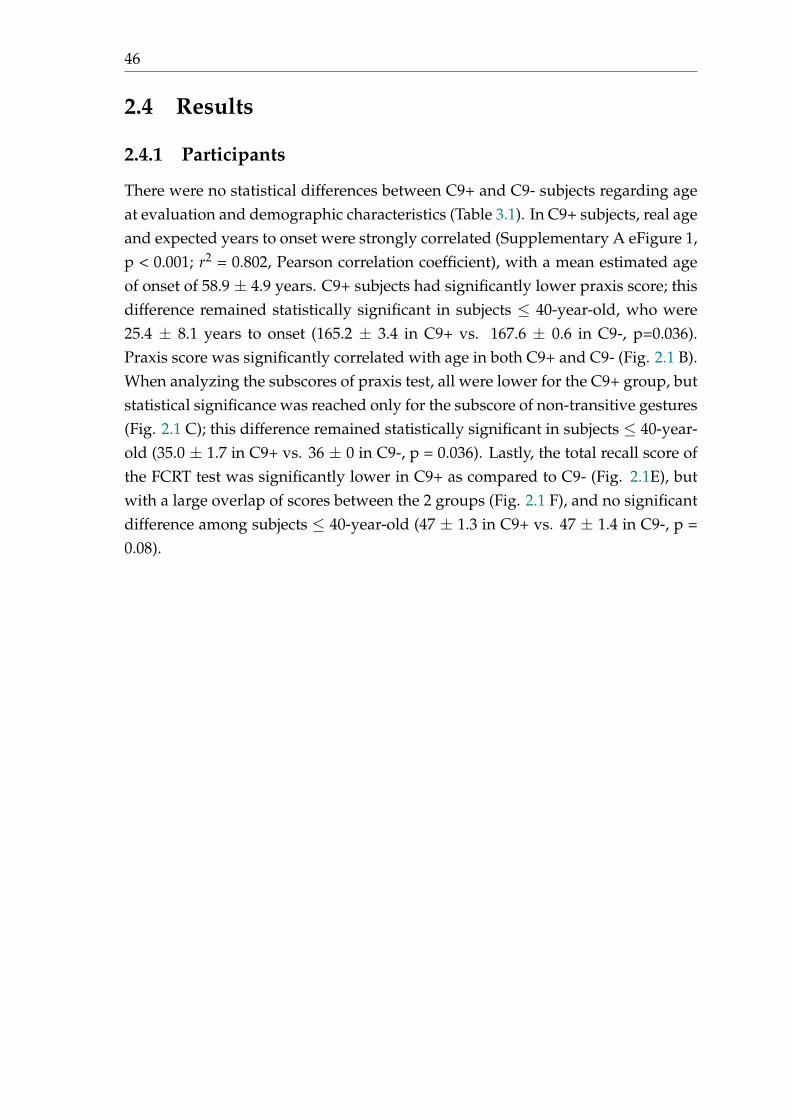
46
2.4 Results
2.4.1 Participants
There were no statistical differences between C9+ and C9- subjects regarding ageat evaluation and demographic characteristics (Table 3.1). In C9+ subjects, real ageand expected years to onset were strongly correlated (Supplementary A eFigure 1,p < 0.001; r2 = 0.802, Pearson correlation coefficient), with a mean estimated ageof onset of 58.9 ± 4.9 years. C9+ subjects had significantly lower praxis score; thisdifference remained statistically significant in subjects 40-year-old, who were25.4 ± 8.1 years to onset (165.2 ± 3.4 in C9+ vs. 167.6 ± 0.6 in C9-, p=0.036).Praxis score was significantly correlated with age in both C9+ and C9- (Fig. 2.1 B).When analyzing the subscores of praxis test, all were lower for the C9+ group, butstatistical significance was reached only for the subscore of non-transitive gestures(Fig. 2.1 C); this difference remained statistically significant in subjects 40-year-old (35.0 ± 1.7 in C9+ vs. 36 ± 0 in C9-, p = 0.036). Lastly, the total recall score ofthe FCRT test was significantly lower in C9+ as compared to C9- (Fig. 2.1E), butwith a large overlap of scores between the 2 groups (Fig. 2.1 F), and no significantdifference among subjects 40-year-old (47 ± 1.3 in C9+ vs. 47 ± 1.4 in C9-, p =0.08).

2.4. Results 47
Characteristic Mean(SD) P ValueC9-(n = 39) C9+(n = 41)
Demographic characteristicsAge, y 45.2 (13.9) 39.8 (11.1) 0.08<40 y, No. (%) 16 (41) 22 (54) NAFemale, No. (%) 24 (62) 24 (59) 0.78Right laterality, No. (%) 33 (85) 35 (85) 0.92Expected time to onset, y NA 19.3 (11.2) NAFamilial phenotype, No. (%)FTLD 15 (38) 18 (44)
0.77ALS 2 (5) 3 (7)Mixed 21 (54) 20 (49)Unavailable 1 (3) 0MMSE score (maximum, 30) 28.8 (1.5) 28.6 (1.3) 0.34MDRS scoreTotal score (maximum, 144) 141.5 (3.2) 141.4 (2.6) 0.54Initiation (maximum, 37) 36.5 (1.3) 36.6 (1.1) 0.72Concept (maximum, 39) 38.3 (1.2) 38.3 (1.1) 0.75Attention (maximum, 37) 36.7 (0.8) 36.7 (0.6) 0.95Construction (maximum, 6) 5.9 (0.2) 6.0 (0.0) 0.23Memory (maximum, 25) 24.0 (1.4) 23.8 (1.6) 0.81FBI 0.8 (1.8) 1.3 (2.6) 0.54FAB score (maximum, 18) 16.8 (1.4) 17.1 (0.9) 0.39Mini-SEAEmotion recognition test (maximum, 35) 29.9 (2.7) 29.8 (2.5) 0.73Faux pas test (maximum, 30) 26.2 (4.7) 25.6 (3.5) 0.13Praxis scoreTotal score (maximum, 168) 165.3 (5.9) 163.4 (6.1) 0.01Finger dexterity (maximum, 36) 35.5 (1.2) 35.4 (1.2) 0.57Melokinetic apraxia (maximum, 24) 23.2 (1.5) 22.8 (2.3) 0.37Nonrepresentational gestures (maximum, 36) 35.7 (0.9) 35.4 (1.2) 0.16Intransitive gestures (maximum, 36) 35.7 (1.5) 34.9 (1.6) 0.004Transitive gestures (maximum, 36) 35.2 (2.0) 34.9 (2.9) 0.79Benson figureCopy (maximum, 17) 16.5 (0.8) 16.6 (0.6) 0.92Recall (maximum, 17) 12.8 (2.2) 13.0 (2.5) 0.52Free and cued recall testFree recall (maximum, 48) 35.6 (4.8) 32.9 (5.5) 0.06Total recall (maximum, 48) 47.1 (1.5) 46.4 (1.5) 0.005Delayed free recall (maximum, 16) 13.2 (2.1) 13.0 (2.2) 0.88Delayed total recall (maximum, 16) 15.5 (1.8) 15.6 (0.9) 0.70Boston naming test (maximum, 30) 27.2 (2.0) 27.2 (2.2) 0.93Fluency tasksCategories (animals) 36.1 (10.3) 36.3 (7.1) 0.82Letter (P) 24.7 (8.0) 23.5 (6.5) 0.23
Table 2.1: Study Group Characteristics. Abbreviations: ALS, amy-otrophic lateral sclerosis; C9-, individuals without the C9orf72 muta-tion; C9+, individuals with the C9orf72 mutation; FAB, frontal assess-ment battery; FBI, Frontal Behavioural Inventory; FTLD, frontotem-poral lobar degeneration ; MMSE, Mini-Mental State Examination;MDRS, Mattis dementia rating scale; NA, not applicable; SEA, Social
Cognition and Emotional Assessment.

48
Figure 2.1: Early Cognitive Changes in C9orf72 Mutation Carriers.Outliers are presented as individual data points. The exact age ofindividuals is not provided to prevent individuals from identifying
their mutation status.
2.4.2 Association of C9orf72 Mutation With Cortical Structures
C9+ participants showed diffuse cortical atrophy within the associative cortex,with a sparring of primary sensorimotor and visual cortex, frontobasal cortex, andsuperior temporal cortex (Figure 2.2A). After correction for multiple comparisons,
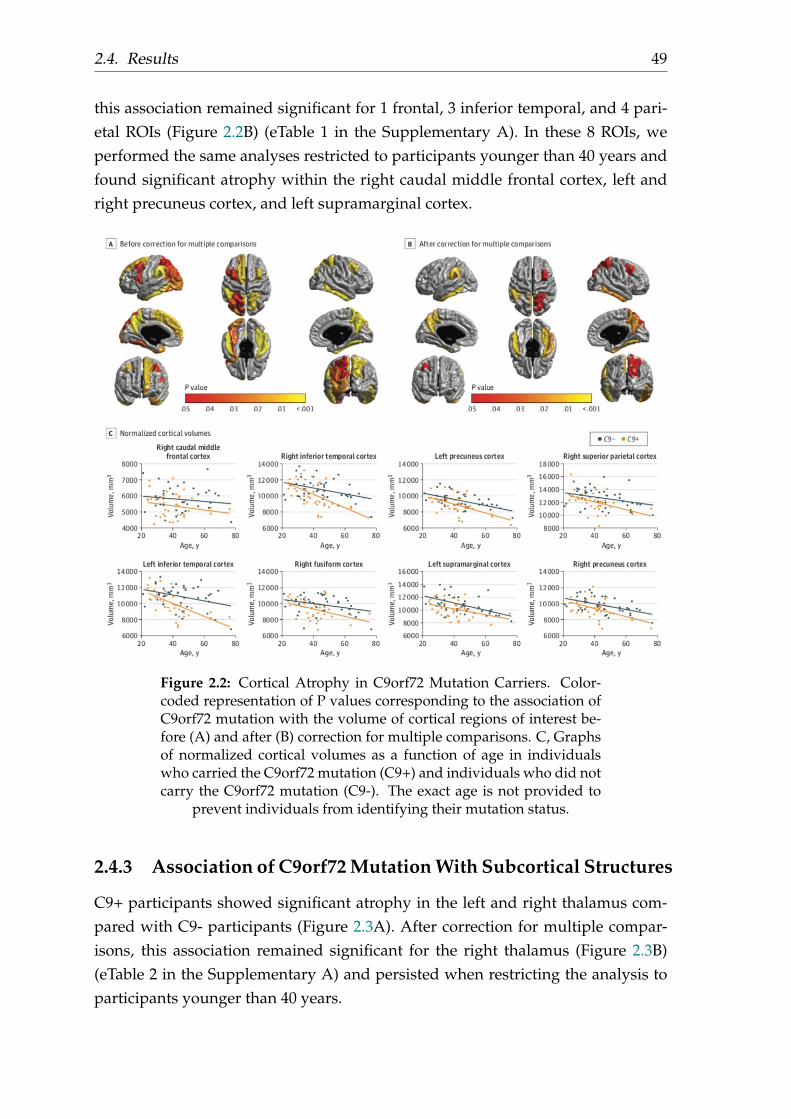
2.4. Results 49
this association remained significant for 1 frontal, 3 inferior temporal, and 4 pari-etal ROIs (Figure 2.2B) (eTable 1 in the Supplementary A). In these 8 ROIs, weperformed the same analyses restricted to participants younger than 40 years andfound significant atrophy within the right caudal middle frontal cortex, left andright precuneus cortex, and left supramarginal cortex.
Figure 2.2: Cortical Atrophy in C9orf72 Mutation Carriers. Color-coded representation of P values corresponding to the association ofC9orf72 mutation with the volume of cortical regions of interest be-fore (A) and after (B) correction for multiple comparisons. C, Graphsof normalized cortical volumes as a function of age in individualswho carried the C9orf72 mutation (C9+) and individuals who did notcarry the C9orf72 mutation (C9-). The exact age is not provided to
prevent individuals from identifying their mutation status.
2.4.3 Association of C9orf72 Mutation With Subcortical Structures
C9+ participants showed significant atrophy in the left and right thalamus com-pared with C9- participants (Figure 2.3A). After correction for multiple compar-isons, this association remained significant for the right thalamus (Figure 2.3B)(eTable 2 in the Supplementary A) and persisted when restricting the analysis toparticipants younger than 40 years.

50
Figure 2.3: Subcortical Atrophy in C9orf72 Mutation Carriers. Color-coded representation of P values corresponding to the association ofC9orf72 mutation with the volume of subcortical structures before (A)and after (B) correction for multiple comparisons. C, Graph of nor-malized thalamic volumes in the left thalamus as a function of age inindividuals who carried the C9orf72 mutation (C9+) and individualswho did not carry the C9orf72 mutation (C9-). D, Graph of normal-ized thalamic volumes in the right thalamus as a function of age inC9+ and C9- individuals. The exact age is not provided to prevent
individuals from identifying their mutation status.
2.4.4 Association of C9orf72 Mutation With White Matter Microstruc-ture
C9+ participants showed diffuse alteration of white matter microstructure (i.e., de-creased fractional anisotropy, increased mean diffusivity, axial diffusivity, and ra-dial diffuivity), predominating in frontal regions and affecting corticospinal tractsbilaterally (Figure 2.4) (eTable 3 and eFigure 2 in the Supplementary A). Only for
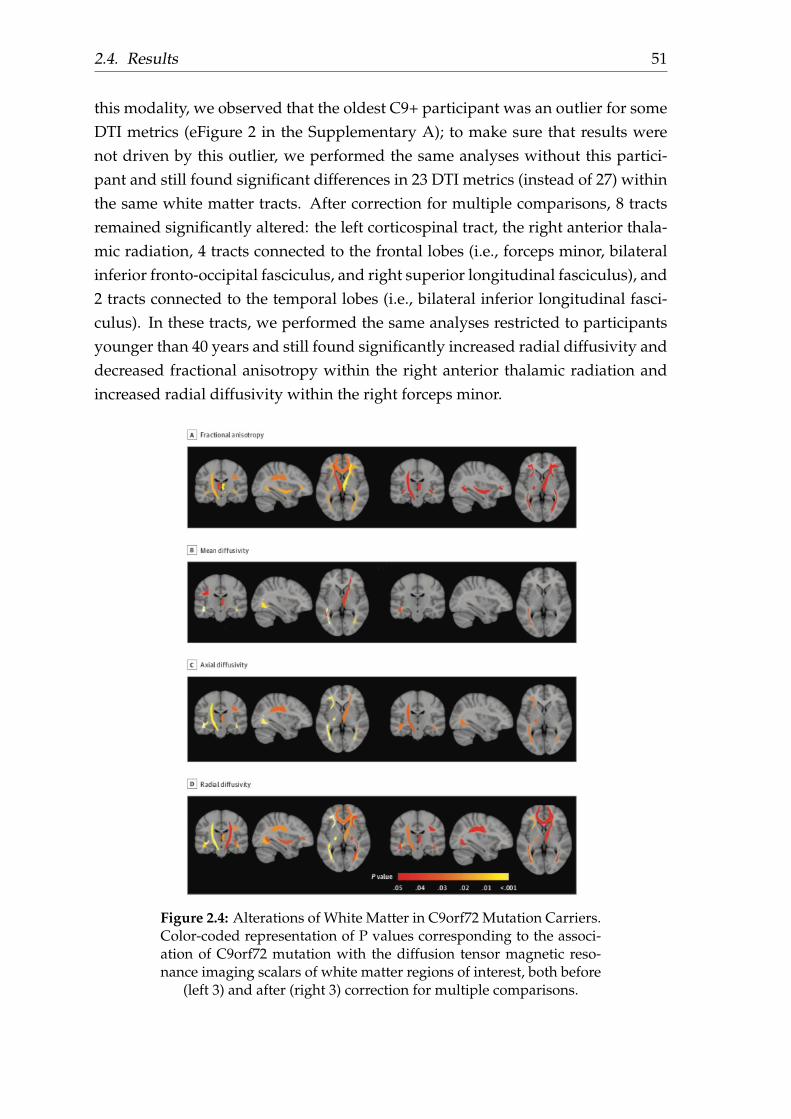
2.4. Results 51
this modality, we observed that the oldest C9+ participant was an outlier for someDTI metrics (eFigure 2 in the Supplementary A); to make sure that results werenot driven by this outlier, we performed the same analyses without this partici-pant and still found significant differences in 23 DTI metrics (instead of 27) withinthe same white matter tracts. After correction for multiple comparisons, 8 tractsremained significantly altered: the left corticospinal tract, the right anterior thala-mic radiation, 4 tracts connected to the frontal lobes (i.e., forceps minor, bilateralinferior fronto-occipital fasciculus, and right superior longitudinal fasciculus), and2 tracts connected to the temporal lobes (i.e., bilateral inferior longitudinal fasci-culus). In these tracts, we performed the same analyses restricted to participantsyounger than 40 years and still found significantly increased radial diffusivity anddecreased fractional anisotropy within the right anterior thalamic radiation andincreased radial diffusivity within the right forceps minor.
Figure 2.4: Alterations of White Matter in C9orf72 Mutation Carriers.Color-coded representation of P values corresponding to the associ-ation of C9orf72 mutation with the diffusion tensor magnetic reso-nance imaging scalars of white matter regions of interest, both before
(left 3) and after (right 3) correction for multiple comparisons.
52
2.4.5 Correlation Between Structural Changes and Clinical Scores
We looked for possible correlations between the neuropsychological scores alteredin C9+ participants (i.e., praxis, intransitive gestures, and free cued and recall testscores) and the markers of structural and microstructural alterations in C9+ partic-ipants (i.e., volume of cortical and subcortical regions and DTI metrics significantlyaltered in C9+ individuals after correction for multiple comparisons). No correla-tion was found between the 3 scores and structural or microstructural changes.
2.5 Discussion
Using a large cohort of presymptomatic C9orf72 carriers, this study reveals unex-pected results. We show that cognitive, structural, and microstructural changescan be detected very early in C9+ individuals aged 20 to 40 years, correspondingto a mean (SD) time to expected onset of 25.4 (8.1) years. We also show that praxisscore appears as the first cognitive do- main to be altered in young C9+ individ-uals. Lastly, we show that presymptomatic C9+ individuals display distinct pat-terns of atrophy and white matter alterations; cortico- subcortical atrophy appearsas a diffuse process, while white matter microstructural changes predominate inthe areas specifically affected during FTLD and ALS.
In this study, we choose to model the effect of C9orf72 mutation on atrophyand white matter microstructure using the real age of subjects. Instead of realage, some authors (Rohrer et al., 2015) have used the distance to mean age of on-set in affected relatives, as an estimation of expected years to onset in presymp-tomatic carriers of C9orf72. However, age of onset is highly variable even withinindividuals of the same family, one of the possible reasons being a possible antic-ipation phenomenon (Van Mossevelde et al., 2017). Thus, it must be highlightedthat quantification of the effects of C9orf72 mutation on brain structure remainscurrently limited by the difficulty to accurately estimate expected age at onset inpresymptomatic carriers.
2.5.1 Cognitive, Structural and Microstructural Changes are De-tected in Young C9+ Subjects
During the preclinical course of neurodegenerative diseases, structural changesare expected 10-15 years and clinical changes 5 years before expected symptomonset, according to the largest presymptomatic FTLD (Rohrer et al., 2015) andAlzheimer’s disease cohorts (Bateman et al., 2012; Benzinger et al., 2013). How-ever, the pace of progression varies depending on the underlying mutation. In
2.5. Discussion 53
C9orf72-FTLD patients, disease duration can be remarkably long (Gómez-Tortosaet al., 2013; Khan et al., 2012; Suhonen et al., 2015) and atrophy progresses at aslow rate (Whitwell et al., 2015), as compared to other genetic or sporadic forms.Thus, it is conceivable that the preclinical phase of C9orf72 disease would lastparticularly long. Our study evidences that subtle cognitive, structural and mi-crostructural alterations can be detected in young C9orf72 carriers before 40 yearsof age. This finding suggests that young subjects may represent the optimal tar-get population for future disease-modifying interventions. Previous studies havesuggested that atrophy emerge in young C9orf72 carriers (Lee et al., 2016; Rohreret al., 2015), either based on group differences obtained on extrapolated measures(Rohrer et al., 2015), or because no acceleration of atrophy was detected duringaging in C9orf72 carriers (Lee et al., 2016). Our results confirm this hypothesis,by showing significant differences of metrics directly measured in young C9+ andC9- subjects.
2.5.2 Praxis Impairment Is an Early Feature of C9orf72 Disease
The evidence of subtle praxis alterations in young C9+ subjects is a surprisingresult. One study has suggested that cognitive and behavioral changes could oc-cur 10 to 15 years from symptom onset in presymptomatic C9orf72 carriers, basedon extrapolated data (Rohrer et al., 2015); however, praxis evaluation was not re-ported. Our result is particularly striking, as a clear separation was visible betweenthe praxis scores of C9+ and C9- young individuals (Figure 2.1B). Praxis scorehas been reported to decrease during normal aging (Peigneux and Linden, 1999;Rodrigues Cavalcante and Caramelli, 2009); similarly, it was inversely correlatedwith age in both C9- and C9+ subjects in our study (Figure 2.1B). The difficultyof this task may explain its sensitivity to detect subtle preclinical changes in C9+subjects. The observed impairment in non-transitive gestures (symbolic gestureswithout the use of an object) is a feature of ideomotor apraxia, which involvesthe posterior part of the left parietal lobe, mainly the left supramarginal gyrus(Króliczak, Piper, and Frey, 2016). Consistently, the impairment in non-transitivegestures in young C9+ subjects was associated with a focal atrophy of this region(i.e., left supramarginal cortex). No correlation was detected between volume ofleft supramarginal cortex and non-transitive gesture score in C9+ subjects; this lackof correlation was likely related to the relatively low variance of the score, whichwas only slightly altered in C9+ (1 to 6 points below the normal score of 36, see Fig-ure 2.1D). Praxis alteration was unexpected, as it is not a salient feature of C9orf72FTLD; although it has been occasionally reported (Floris et al., 2015; Mahoney etal., 2012b; Mahoney et al., 2012a; Van Langenhove et al., 2013), it is usually less

54
marked than executive and behavioral dysfunction (Devenney et al., 2014; Floeteret al., 2017; Sha et al., 2012; Suhonen et al., 2017). Thus, praxis impairment mayrepresent an early-expressed and non-evolving phenotype of C9orf72 mutation.These intriguing findings stress the need to characterize C9orf72 mutation alter-ations on the scale of the entire lifespan of mutation carriers, including childhood,in order to disentangle possible developmental alterations (Lee et al., 2016; Wal-hout et al., 2015), from potential preclinical prognostic markers of C9orf72 disease.It also emphasizes the fact that neuropsychological features of C9orf72 mutationmay extend well beyond the classical spectrum of FTLD, and require extensiveneuropsychological characterization.
Additionally, we also observed a slight decrease in recall performance in C9+carriers. Interestingly, C9orf72 mutation is associated with abnormal depositionof TDP-43, DPR and RNA foci in the hippocampus (Mackenzie, Frick, and Neu-mann, 2014). However, the slight memory impairment we observed appeared lessstriking than praxis impairment: there was a large overlap of values between C9+and C9- subjects, and the difference did not persist when restricting the analysisto subjects 40 years of age. Moreover, we did not detect any significant atrophyin the hippocampus of C9+ subjects.
2.5.3 C9orf72 Mutation Is Associated With Early Thalamic Atro-phy
Thalamic atrophy appears as a reliable effect of C9orf72 mutation. Thalamic atro-phy has been previously reported in smaller cohorts of presymptomatic C9orf72carriers (Lee et al., 2016; Rohrer et al., 2015; Walhout et al., 2015), and also in symp-tomatic C9orf72 carriers with FTLD (Floeter et al., 2016; Mahoney et al., 2012a) orALS (Agosta et al., 2017). Thalamic atrophy may be related to the presence ofpathological deposits, i.e. TDP-43 and/or DPR, but it can also be caused by deaf-ferentation processes secondary to the diffuse cortical atrophy, due to the highnumber of connections between the hemispheric cortex and the thalamus. Thesemechanisms are not exclusive and may be associated, which would explain thehigh sensitivity of previous studies for detecting early thalamic atrophy in C9+subjects.

2.6. Conclusion 55
2.5.4 White Matter Microstructural Changes, but not Cortical At-rophy Reflects the Expected Topography of FTLD-ALS inC9+ Subjects
Our study demonstrates a major difference of pattern between atrophy and whitematter alterations in C9+ subjects. Atrophy appears as a widespread phenomenon,with a relative sparing of primary motor cortex and frontobasal cortex, areas thatare preferentially involved during ALS and FTLD, respectively (Figure 2.2). Con-versely, white matter alterations seem to preferentially target corticospinal tractsand frontal white matter (Figure 2.4). These suggest that in C9+ subjects, whitematter changes may be more predictive of future cognitive and motor deficitsthan cortical atrophy. These different patterns are reminiscent of the topographyof the two histopathological hallmarks of C9orf72 mutation, DPR and TDP-43.Even if this is still debated, DPR deposits have a diffuse distribution unrelatedto the clinical phenotype of patients (Davidson et al., 2016; Davidson et al., 2014;Gomez-Deza et al., 2015; Mackenzie et al., 2015), and seem to precede TDP-43 de-position (Vatsavayai et al., 2016). Conversely, TDP-43 deposits may represent adownstream process more correlated to clinical symptoms. Furthermore, TDP-43deposits are present both in cortical neurons and white matter glial cells (Neu-mann et al., 2007); thus, white matter changes, possibly more reflective of futureclinical deficits, may relate more to TDP-43 pathology than to DPR in presymp-tomatic C9orf72 disease.
2.6 Conclusion
The present work demonstrates that pathological processes emerge during earlyadulthood in C9orf72 mutation carriers. Early and subtle praxis alterations inyoung C9+ subjects, underpinned by a focal atrophy of the left supramarginalgyrus, may represent a non-evolving phenotype, which highlights the possibleoverlaps and intricacy between neurodevelopmental and neurodegenerative pro-cesses. The distinct patterns of atrophy and white matter changes observed inC9+ subjects suggest that white matter integrity might be more reflective of thefuture FTLD/ALS phenotype than atrophy. Our results contribute to a better un-derstanding of the spectrum of C9orf72 disease, and of the respective contributionof MR biomarkers in assessing disease-related changes.


57
Chapter 3
Neurite density is reduced in thepresymptomatic phase of C9orf72disease
This chapter has been published as a journal article on Journal of Neurology, Neu-rosurgery, and Psychiatry (Wen et al., 2019):
• Wen, J., Zhang, H., Alexander, D., Durrleman, S., Routier, A., Rinaldi, D.,Houot, M., Couratier, P., Hannequin, D., Pasquier, F., Zhang, J., Colliot, O.,Le Ber, I. and Bertrand, A. Neurite density is reduced in the presymptomaticphase of C9orf72 disease, J Neurol Neurosurg Psychiatry, pp.jnnp-2018. https://hal.inria.fr/hal-01907482/document.
3.1 Abstract
OBJECTIVE. To assess the added value of neurite orientation dispersion and den-sity imaging (NODDI) compared to conventional DTI and anatomical MRI to de-tect changes in presymptomatic carriers of chromosome 9 open reading frame 72(C9orf72) mutation.
METHODS. The PREVDEMALS study is a prospective, multicenter, observa-tional study of first-degree relatives of individuals carrying the C9orf72 mutation.Sixty-seven participants (38 presymptomatic C9orf72 mutation carriers [C9+], 29non carriers [C9-]) were included in the present cross-sectional study. Each partic-ipant underwent one single-shell, multi-shell diffusion MRI and 3DT1 MRI. Volu-metric measures, DTI and NODDI metrics were calculated within regions of inter-est. Differences in white matter integrity, gray matter volume and free water frac-tion between C9+ and C9- individuals were assessed using linear mixed-effectsmodels.
RESULTS. Compared with C9-, C9+ demonstrated white matter abnormalitiesin 10 tracts with neurite density index, and only 5 tracts with DTI metrics. Effect

58
size was significantly higher for the neurite density index than for DTI metrics intwo tracts. No tract had a significantly higher effect size for DTI than for NODDI.For gray matter cortical analysis, free water fraction was increased in 13 regions inC9+, whereas 11 regions displayed volumetric atrophy.
CONCLUSIONS. NODDI provides higher sensitivity and greater tissue-specificitycompared to conventional DTI for identifying white matter abnormalities in thepresymptomatic C9orf72 carriers. Our results encourage the use of neurite den-sity as biomarker of the preclinical phase.
3.2 Introduction
Frontotemporal lobar degeneration (FTLD) and amyotrophic lateral sclerosis (ALS)are two degenerative diseases that share common genetic causes, the most fre-quent being a GGGGCC repeat expansion in the chromosome 9 open readingframe 72 (C9orf72) gene. DeJesus-Hernandez et al., 2011; Renton et al., 2011.Early stages of C9orf72 carriers have received much interest, because presymp-tomatic carriers represent the optimal target population for the development ofnew disease-modifying treatments against FTLD and ALS. Anatomical magneticresonance imaging (MRI) derived metrics, such as volumetry, have revealed brainatrophy in presymptomatic individuals who carry the C9orf72 mutation (C9+).(Rohrer et al., 2015; Walhout et al., 2015; Lee et al., 2016; Bertrand et al., 2017;Cash et al., 2017; Papma et al., 2017; Popuri et al., 2018). Three studies (Lee etal., 2016; Bertrand et al., 2017; Papma et al., 2017) also detected disruptions ofwhite matter integrity using diffusion tensor imaging (DTI) technique, whereasanother study failed to identify such abnormalities (Walhout et al., 2015). TheDTI results are promising but with limitations. First, DTI metrics, such as frac-tional anisotropy (FA), are non-specific biomarker of microstructural architecture.(Alexander et al., 2007; O’Donnell and Westin, 2011). For instance, FA changescould be underpinned by combinations of neurite density reduction and orienta-tion dispersion changes Zhang et al., 2012. Besides, DTI is limited when an im-age voxel suffers from partial volume effect. Neurite orientation dispersion anddensity imaging (NODDI) was proposed to characterize alterations of microstruc-tural integrity with higher tissue-specificity (Zhang et al., 2012). NODDI derivesa neurite density index (NDI) and orientation dispersion index (ODI) to quantifythe density and angular variation of neurites, respectively. In addition, NODDIincludes a free water fraction (FWF) parameter designed to capture the contami-nation of tissues by free water at the microstructural level.
In the present work, we assess the added value of NODDI compared to conven-tional DTI and anatomical MRI to detect changes at the presymptomatic phase of

3.3. Material and Methods 59
C9orf72 disease. We hypothesize that NDI and ODI offer higher sensitivity thanFA, mean diffusivity (MD), axial diffusivity (AD) and radial diffusivity (RD) fordetecting white matter abnormalities. Additionally, FWF is compared with vol-umetry and may provide complementary information for identifying gray matterchanges.
3.3 Material and Methods
3.3.1 Participants
Eighty-six first-degree relatives of C9orf72 mutation carriers from 48 families wereenrolled in an ongoing national multicentric study (PREVDEMALS) between Oc-tober 2015 and October 2017. This study was approved by the Comité de Préven-tion des Personnes Ile de France VI of the Hôpital Pitié-Salpêtrière, and writteninformed consent was obtained from all participants. At inclusion, asymptomaticstatus of participants was ascertained based on relative’s interview, neurologi-cal examination, and the normality of behavioral scales and neuropsychologicalscores, taking into account age and educational level. In the present study, sixty-seven neurologically healthy participants, who underwent a single-shell diffusionweighted image (DWI) sequence, a multi-shell DWI sequence and a 3DT1 se-quence, were included in the analyses. C9orf72 genetic status was determinedby repeat-primed polymerase chain reaction on lymphocytes DNA. Thirty-eightC9+ participants carried a pathogenic expansion (>23 GGGGCC repeats); twenty-nine control participants did not carry this expansion (C9-). The study populationcharacteristics are shown in Table 3.1. Demographic characteristics and clinicaltests were compared between groups using the c2 test for dichotomous and cat-egorical variables or Mann-Whitney test for numerical variables. There was nostatistical difference between C9+ and C9- regarding age at inclusion (P = 0.18),gender (P = 0.65) and clinical scores (Mini-Mental State Examination, P = 0.83;Mattis dementia rating scale, P = 0.37; Frontal assessment battery, P = 0.40).

60
Characteristic Mean(SD) P ValueC9- (n=29)) C9+(n = 38)
Demographic characteristicsAge, y 44.8 (13.5) 40.7 (11.5) 0.18Female, No. (%) 17 (59) 19 (50) 0.65Right laterality, No. (%) 24 (83) 33 (87) 0.91Expected time to onset, y NA 18.6 (11.4) NAFamilial phenotype, No. (%)FTLD 12 (42) 18 (47)
0.91ALS 2 (7) 3 (8)Mixed 14 (48) 17 (45)Unavailable 1 (3) 0Neuropsychological scoresMMSE score (maximum, 30) 28.7 (1.2) 28.5 (1.5) 0.83FAB (maximum, 18) 16.9 (1.3) 17.1 (1.2) 0.40MDRS score (maximum, 144) 141.9 (2.2) 141.3 (2.7) 0.37
Table 3.1: Study Group Characteristics. Abbreviations: ALS, amy-otrophic lateral sclerosis; FAB, Frontal Assessment Battery; FTLD,frontotemporal lobar degeneration; MDRS, Mattis Dementia Rating
Scale; MMSE, Mini-Mental State Examination; NA, not applicable.
3.3.2 MRI acquisition
All MRI acquisitions were performed on a 3-T MRI system (Siemens Prisma Syngo3T) in a single center (Paris) belonging to the harmonized national network of theCentre d’Acquisition et de Traitement d’Images (http://cati-neuroimaging.com/)(Operto et al., 2016). The Centre d’Acquisition et de Traitement d’Images per-formed onsite visits for the setup of imaging protocols and regular follow-up. Eachparticipant underwent a 3DT1 sequence with the following parameters: voxel size1.1x1.1x1.1 mm3; TE/TR = 2.93/2200 ms; Bandwidth = 240 Hz. One single-shellDWI sequence with two repeats was acquired for DTI with the following param-eters: voxel size 2.5x2.5x2.5 mm3; TE/TR = 90/7300 ms; Bandwidth = 1580 Hz; 64diffusion-weighted directions, b-value = 1000 s/mm2, 9 T2-weighted images (b-value = 0 s/mm2, referred to as b0 image). One field map image was acquired toestimate the susceptibility-induced off-resonance field. One three-shell DWI se-quence with two repeats was acquired with reversed phase encoding directionsfor NODDI model: voxel size 2x2x2 mm3; TE/TR = 70/3000 ms; Bandwidth =2090 Hz; 60, 32 and 9 diffusion-weighted directions at b-value = 2200, 700 and300 s/mm2 respectively; 13 b0 images. Of note, the DTI analysis was based onthe single-shell data (b=1000 s/mm2). Indeed, DTI model is known to be a poorrepresentation of the DWI signals at the high b-value (> 2000). On the other hand,the low b-values (300 and 700) are acquired at prolonged TE designed to accom-modate the high b-value. So these low b-values data are not representative of

3.3. Material and Methods 61
standard DTI data. Systematic quality checks of MRI results were performed bythe Centre d’Acquisition et de Traitement d’Images as in previous work (Bertrandet al., 2017). All images were of satisfactory quality except for one T1 acquisitionand one single-shell DWI acquisition from different individuals. These two imageswere excluded respectively from gray matter and white matter analyses.
3.3.3 Anatomical MRI processing
T1-weighted images were processed with the FreeSurfer image analysis suite (Ver-sion 5.3; https://surfer.nmr.mgh.harvard.edu/), including skull stripping, in-tensity normalization, cortical and subcortical segmentation, cortical surface re-construction and parcellation of the cortex using the Desikan-Killiany atlas (De-sikan et al., 2006). We studied gray matter volumes of 68 cortical regions of interest(ROIs) and 18 subcortical ROIs. The list of regions is provided in SupplementaryB (supplementary-appendix e-1). All ROI volumes were normalized by total in-tracranial volume (TIV).
3.3.4 DTI processing
The single-shell DWI data were processed with the same approach as in previouswork (Bertrand et al., 2017). To summarize, head motion was corrected by rigidlyregistering the raw DWI volumes to the average b0 image, and an affine regis-tration was used to correct for eddy current-induced distortions. The field mapimage was used to estimate the susceptibility-induced off-resonance field (Jenk-inson and Smith, 2001). A single multiplicative bias field from the averaged b0image was estimated and applied to the single-shell DWI data (Jeurissen et al.,2014). FA, MD, RD and AD were estimated using an iteratively reweighted linearleast squares estimator (Tournier, Calamante, and Connelly, 2012). Each individ-ual FA map was aligned onto the JHU white-matter tractography atlas template(Hua et al., 2008) with a rigid plus deformable registration (Avants et al., 2008).MD, AD and RD maps were subsequently registered into the JHU atlas using thetransformation field from the previous step. The regional mean values of FA, MD,AD and RD maps were extracted. The list of regions is provided in SupplementaryB (supplementary-appendix e-2).
3.3.5 NODDI processing
From the pairs of images with reversed phase encoding directions, the susceptibility-induced off-resonance field was estimated using topup tool (Andersson, Skare, and
62
Ashburner, 2003). Besides, eddy current-induced distortions and subject move-ments were corrected by simultaneously modelling the effects of diffusion eddycurrents and movements on the image using eddy tool (Andersson and Sotiropou-los, 2016). The b-vector was subsequently corrected. The NODDI model was thenfitted to the artifact-corrected data, generating NDI, ODI and FWF maps usingNODDI Matlab toolbox (https://www.nitrc.org/projects/noddi_toolbox). Forwhite matter analysis, DTI model was applied to the middle-shell data (b-value =700 s/mm2) to generate the FA map, in order to estimate the transformation fieldfrom the native diffusion space to the JHU space. Then NDI and ODI maps wereregistered into the JHU space using the transformation field obtained from theprevious step. Finally, the regional mean values of NDI and ODI were calculated.
For gray matter analysis, the normalized skull-stripped T1 image in FreeSurferconformed space was rigidly registered onto the first b0 image of the artifact-corrected multi-shell DWIs. Then the inverse transformation field was appliedto register FWF map in the FreeSurfer conformed space with a linear interpola-tion. For subcortical ROI analysis, a 2-voxel morphological erosion operator wasperformed on each segmented subcortical ROI (Pfefferbaum et al., 2010). For cor-tical ROI analysis, FWF signal was projected onto cortical middle surface. Theprojected FWF value was calculated with a weighted average of signals from theseven intermediate surfaces, which were expanded at different fraction of corticalthickness (35%, 40%, 45%, 50%, 55%, 60% and 65%) from the white surface. Subse-quently, the averaged middle surface was registered onto the FsAverage templatein FreeSurfer conformed space using a surface-based registration method (Fischlet al., 1999). The aim of the erosion and middle surface projection approach was toavoid the partial volume effect (i.e., elimination of free water contamination at theedges of ventricle and the borders of the brain parenchyma). Finally, the regionalmean values of FWF were extracted for further cortical and subcortical analyses.
3.3.6 Statistical analysis
All statistical analyses were performed with R Version 3.4.0 (The R Foundation).Structural and microstructural differences between C9+ and C9- participants wereassessed using linear mixed-effects models. We used real age, gender and group(i.e., mutation status) as fixed effects and family membership as random effectmeasuring the difference between the average response in the family and in thewhole population (supplementary B supplementary-appendix e-3). Likelihood ra-tio test was used to test each effect and P values were corrected by the Benjamini-Hochberg method with a significance level of P < 0.05. Besides, the effect size of
3.4. Results 63
each ROI between C9+ and C9- was also reported using Cohen’s f2. Effect sizes ob-tained for different models or metrics (e.g., NODDI vs DTI) were compared usingpermutation tests with 10000 iterations for significant ROIs.
3.4 Results
3.4.1 White matter analysis
Figure 3.1 displays altered white matter tracks after correction for multiple com-parisons. Compared with C9-, C9+ showed extensive alterations in white matterintegrity (i.e., reduced NDI, elevated MD, AD and RD), involving several fronto-temporal related tracts (i.e., bilateral inferior fronto-occipital fasciculus, bilateralinferior longitudinal fasciculus, right uncinate fasciculus, right anterior thalamicradiation, forceps minor) and both cortico-spinal tracts. 10 tracts were significantlyaltered in C9+ with NDI, and only 5 tracts with DTI metrics (MD, AD or RD). Re-sults before correction for multiple comparisons are shown in supplementary B(supplementary-figure e-1). Effect size results confirmed that NDI was more sen-sitive than DTI metrics: among the 11 tracts in which significant differences weredetected in either NDI or DTI metrics (MD, AD or RD), 7 tracts had higher effectsize with NDI than with DTI metrics (Figure 3.2). The effect size was significantlyhigher with NDI than with DTI for two of these tracts: left inferior fronto-occipitalfasciculus (P = 0.009) and right uncinate fasciculus (P = 0.008). None of the tractshad a significantly higher effect size with DTI than with NDI. Effect size resultsare shown in supplementary B (supplementary-table e-1).

64
Figure 3.1: White matter alterations in C9orf72 mutation carriers.Colour-coded representation of p values corresponding to the asso-ciations of C9orf72 mutation with white matter integrity after correc-tion for multiple comparisons. (a) Mean diffusivity (MD), (B) axialdiffusivity (AD), (c) radial diffusivity (RD) and (D) NDI, neurite den-
sity index (NDI).

3.4. Results 65
Figure 3.2: Effect size of white matter alterations in C9orf72 mutationcarriers. Effect size (cohen’s f2) corresponding to the associations ofC9orf72 mutation with white matter integrity. Only ROIs in whichsignificance, after correction for multiple comparisons, was detectedin either NDI or DTI metrics are displayed. aTR, anterior thalamusradiation tract; csT, corticospinal tract; DTI, diffusion tensor imaging;Fmajor, forceps major tract; Fminor, forceps minor tract; IFOF, infe-rior fronto-occipital fasciculus; ILF, inferior longitudinal fasciculus;L, left; NDI, neurite density index; R, right; ROI, region of interest;sLF, superior longitudinal fasciculus; sLFT, superior longitudinal fas-
ciculus (temporal part); UF, uncinate fasciculus.
3.4.2 Cortical gray matter analysis
Figure 3.3 displays altered cortical regions after correction for multiple compar-isons. Compared with C9-, C9+ showed reduced cortical gray matter volume andelevated FWF. 13 ROIs were significantly altered with FWF (4 frontal, 1 temporal,4 parietal, 3 occipital and the left insula), and 11 ROIs with volumetry (2 frontal, 5temporal and 4 parietal ROIs). Results before correction for multiple comparisons
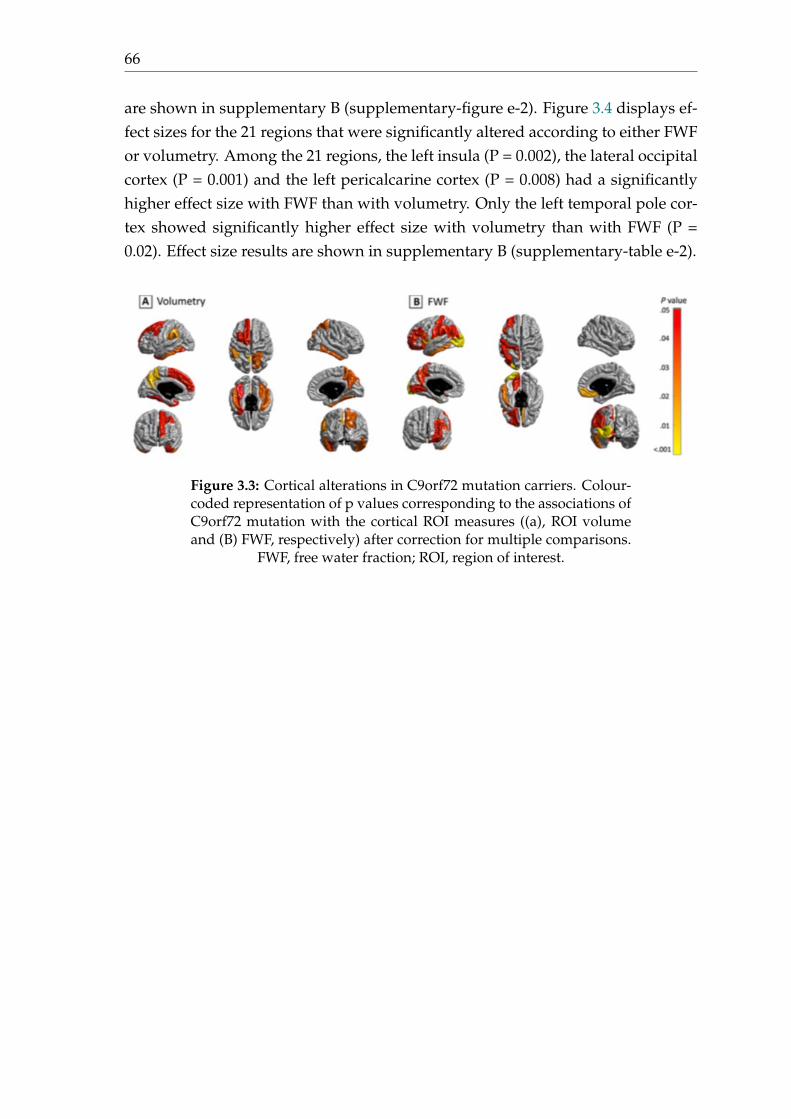
66
are shown in supplementary B (supplementary-figure e-2). Figure 3.4 displays ef-fect sizes for the 21 regions that were significantly altered according to either FWFor volumetry. Among the 21 regions, the left insula (P = 0.002), the lateral occipitalcortex (P = 0.001) and the left pericalcarine cortex (P = 0.008) had a significantlyhigher effect size with FWF than with volumetry. Only the left temporal pole cor-tex showed significantly higher effect size with volumetry than with FWF (P =0.02). Effect size results are shown in supplementary B (supplementary-table e-2).
Figure 3.3: Cortical alterations in C9orf72 mutation carriers. Colour-coded representation of p values corresponding to the associations ofC9orf72 mutation with the cortical ROI measures ((a), ROI volumeand (B) FWF, respectively) after correction for multiple comparisons.
FWF, free water fraction; ROI, region of interest.

3.4. Results 67
Figure 3.4: Effect size of cortical alterations in C9orf72 mutation car-riers. Effect size (cohen’s f2) corresponding to the associations ofC9orf72 mutation with the cortical ROI measures (ROI volume andFWF, respectively). Only ROIs in which significance, after correc-tion for multiple comparisons, was detected in either volumetry orFWF are displayed. CMF, caudal middle frontal cortex; CUN, cuneuscortex; FUS, fusiform; FWF, free water fraction; INS, insula; IP, infe-rior parietal cortex; IT, inferior temporal cortex; L, left; LIN, lingual;LO, lateral occipital cortex; MOF, medial orbitofrontal cortex; PCC,pericalcarine; POC, postcentral cortex; PPC, pars opercularis cortex;PREC, precuneus; R, right; RMF, rostral middle frontal cortex; ROI,region of interest; SM, supramarginal cortex; SP, superior parietal cor-
tex; TP, temporal pole cortex.
3.4.3 Subcortical gray matter analysis
Compared with C9-, C9+ showed subcortical volume reduction of the right thala-mus after correction for multiple comparisons. FWF failed to detect any significantalterations (Figure 3.5). Results before correction for multiple comparisons are pre-sented in supplementary B (supplementary-figure e-3). The right thalamus did not

68
show statistically higher effect size with volumetry than with FWF (P = 0.062). Ef-fect size results are shown in supplementary B (supplementary-table e-3).
Figure 3.5: Subcortical alterations in C9orf72 mutation carriers.Colour-coded representation of p values corresponding to the asso-ciations of C9orf72 mutation with the subcortical ROI measures ((a)ROI volume and (B) FWF) after correction for multiple comparisons.
FWF, free water fraction; ROI, region of interest.
3.5 Discussion
The current study, for the first time, compared NODDI to conventional DTI andanatomical MRI in a large cohort of presymptomatic C9orf72 carriers. There arethree key findings. First, we demonstrate that NODDI provides higher sensitivity

3.5. Discussion 69
than DTI for detecting white matter microstructural changes. Second, the greatertissue-specificity of NODDI suggests that the reduction of neurite density is a morelikely cause of signal changes than the alterations of neurite orientation dispersionduring the presymptomatic stage. Third, the pattern of FWF alterations slightlydiffers from that of gray matter volumetric atrophy, suggesting that both FWFand volumetry provide complimentary information on the integrity of cortical andsubcortical structures.
When comparing the multi-shell DWI sequence with the standard single-shellDWI sequence, we hypothesized that NODDI could be more sensitive than con-ventional DTI for detecting white matter abnormalities during the presymptomaticstage. Previous works have shown that NODDI could be more sensitive than DTIfor detecting white matter changes related to aging (Kodiweera et al., 2016) oryoung onset Alzheimer’s disease (Slattery et al., 2017). Here, for the first time,we show that NODDI outperformed DTI for identifying white matter abnormali-ties during the presymptomatic stage of a neurodegenerative disease. The spatialpattern of white matter changes is consistent with previous findings with conven-tional DTI (Lee et al., 2016; Bertrand et al., 2017; Papma et al., 2017). Specifically,reduced NDI was mainly found in the cortico-spinal tract and frontal-temporalrelated tracts during the presymptomatic stage for C9orf72 carriers, which werepreferentially involved in symptomatic mutation carriers who develop FTLD, ALSor both. On the other hand, to the best of our knowledge, there has been no priorstudy using NODDI in C9orf72 disease, neither at the presymptomatic nor at thesymptomatic stage. The interpretation of specificity for DTI metrics has been dis-cussed (Song et al., 2002; DeBoy et al., 2007), suggesting that RD and AD reflectrespectively demyelination and axonal damage and both provide more specificinformation than FA. However, these interpretations were also argued in the lit-erature (Wheeler-Kingshott and Cercignani, 2009). Compared with DTI, the morebiophysically motivated NODDI model allows more direct analysis of indepen-dent microstructural effects: the loss of neurite density and the alteration of neu-rite orientation dispersion. This potential for greater tissue-specificity has moti-vated application of NODDI in a few neurodegenerative disease studies (Song etal., 2018; Schneider et al., 2017; Kamagata et al., 2016; Slattery et al., 2017; Grussuet al., 2017). In young onset Alzheimer’s disease, one study showed widespreadNDI reduction and regional ODI reduction in the corpus callosum and internalcapsule of patients (Slattery et al., 2017). In Parkinson disease, another studyobserved reduced NDI in the substantia nigra and putamen of patients (Kama-gata et al., 2016). In the present study, we detected widespread NDI decrease inthe white matter, but no alteration of ODI (Figure 3.1). This suggests that the re-duction of neurite density, not the alterations of neurite orientation dispersion, is

70
the predominant pathological process in white matter during the presymptomaticstage of C9orf72 carriers. Interestingly, similar reduction of neurite density withincortico-spinal tract have been found in ALS patients (Broad et al., 2017). Our ob-servation suggests that the neurite loss is the main pathological process, but thisneeds further histological confirmation. We note however that Grussu et al havedemonstrated, in the tissue specimen of multiple sclerosis, that ODI correlatedwell with histological measures of neurite orientation dispersion, and NDI withhistological measures of neurite density (Grussu et al., 2017).
Mapping the free water in tissues is important in order to estimate the vari-ations in extracellular volume (related to free water fraction) due to pathologicalprocesses (Pasternak et al., 2009). FWF has been applied in several neurodegener-ative diseases. Using a bi-tensor model, FWF has been demonstrated as an imag-ing biomarker of progression of Parkinson’s disease in the posterior substantianigra (Planetta et al., 2016; Burciu et al., 2017). Interestingly, a chronic treatmenteffect of rasagiline, an irreversible inhibitor of monoamine oxidase-B as a medi-cal monotherapy, has been verified with FWF in basal ganglia in Parkinson’s dis-ease (Burciu et al., 2016). These findings support the use of FWF as a promisingbiomarker in neurodegenerative diseases to evaluate the free water related alter-ations. In the present study, FWF detected free water alterations mainly in frontaland temporal lobes. This finding is consistent with previous studies using volu-metric measure (Rohrer et al., 2015; Walhout et al., 2015; Lee et al., 2016; Bertrandet al., 2017; Cash et al., 2017; Papma et al., 2017; Popuri et al., 2018). The uniquedifferences detected with FWF in left insula and left lateral occipital lobe were alsoreported in literatures using volumetric measure (Rohrer et al., 2015; Walhout etal., 2015; Lee et al., 2016; Cash et al., 2017). These suggest that macroscopic brainatrophy may accompany free water alterations inside the cortex. Surprisingly,FWF failed to show changes in subcortical structures, such as the thalamic atro-phy where a significant effect of C9orf72 mutation was evidenced by volumetry.These findings suggest that distinct degenerative processes could occur in corticaland subcortical structures at the same time during the presymptomatic stage.
Reliability of an imaging technique is an important issue for its use in clinicaltrials. We do not have test-retest scans in our participants. However, the reliabilityof NODDI has been assessed in previous studies (Tariq et al., 2012; Chang et al.,2015). NODDI metrics were shown to have excellent reproducibility with coeffi-cients of variation below 5% in all measured regions of interest and even below 3%in the vast majority of regions (Chang et al., 2015). Furthermore, the reproducibil-ity of NODDI metrics was shown to be comparable to that of conventional DTI(Tariq et al., 2012). This, together with its higher sensitivity to detect white matteralterations, supports the use of NODDI in clinical trials.

3.6. Limitations 71
3.6 Limitations
Our study has the following limitations. First, the cross-model comparison be-tween NODDI and DTI used two different DWI acquisitions, which were per-formed within one week sequentially for each participant. However, the single-shell and multi-shell DWI sequences were optimized for DTI and NODDI model,respectively. Thus, this systematic comparison helps clarify the added value ofa longer but clinically feasible multi-shell diffusion sequence. Second, cautionshould be exercised in diffusion MRI-based cortical analysis. NODDI, by construc-tion, accounts for partial volume effects from CSF contamination, thus minimizingthe influence of atrophy on the NODDI metrics. Moreover, a recent paper (Parkeret al., 2018) has explicitly looked at the influence of cortical thickness on NODDImetrics, showing that the majority of changes in NODDI metrics persisted follow-ing adjustment for cortical thickness. Nevertheless, the cortex is a thin structurecompared to the resolution of diffusion MRI and partial volume effect may im-pact on the computation of regional FWF measures. Although we implementedspecific image processing procedures to mitigate partial volume effects, it is stillpossible that some partial volume effect remains, impacting on FWF estimates.


73
Chapter 4
Reproducible evaluation of diffusionMRI features for automaticclassification of patients withAlzheimer’s disease
This chapter has been submitted as a journal article to Neuroinformatics (Wen etal., 2018b):
• Wen, J., Samper-González, J., Bottani, S., Routier, A., Burgos, N., Jacquemont,T., Fontanella, S., Durrleman, S., Epelbaum, S., Bertrand, A., and Colliot, O.Reproducible evaluation of diffusion MRI features for automatic classifica-tion of patients with Alzheimer’s disease., Submitted to Neuroinformatics.https://arxiv.org/pdf/1812.11183.pdf.
4.1 Abstract
Diffusion MRI is the modality of choice to study alterations of white matter. Inthe past years, various works have used diffusion MRI for automatic classificationof Alzheimer’s disease. However, the performances obtained with different ap-proaches are difficult to compare because of variations in components such as in-put data, participant selection, image preprocessing, feature extraction, feature se-lection (FS) and cross-validation (CV) procedure. Moreover, these studies are alsodifficult to reproduce because these different components are not readily available.In a previous work (Samper-González et al., 2018), we proposed an open- sourceframework for the reproducible evaluation of AD classification from T1-weighted(T1w) MRI and PET data. In the present paper, we extend this framework to dif-fusion MRI data. The framework comprises: tools to automatically convert ADNIdata into the BIDS standard, pipelines for image preprocessing and feature extrac-tion, baseline classifiers and a rigorous CV procedure. We demonstrate the use of

74
the framework through assessing the influence of diffusion tensor imaging (DTI)metrics (fractional anisotropy - FA, mean diffusivity - MD), feature types, imagingmodalities (diffusion MRI or T1w MRI), data imbalance and FS bias. First, voxel-wise features generally gave better performances than regional features. Secondly,FA and MD provided comparable results for voxel-wise features. Thirdly, T1wMRI performed better than diffusion MRI. Fourthly, we demonstrated that usingnon-nested validation of FS leads to unreliable and over-optimistic results. Allthe code is publicly available: general-purpose tools have been integrated intothe Clinica software (www.clinica.run) and the paper-specific code is available at:https://gitlab.icm-institute.org/aramislab/AD-ML.
4.2 Introduction
Alzheimer’s disease (AD), the most prevalent form of dementia, is expected toaffect 1 out of 85 people in the world by the year 2050 (Brookmeyer et al., 2007).Neuroimaging offers the possibility to study pathological brain changes associatedwith AD in vivo (Ewers et al., 2011). The most common neuroimaging modali-ties used to study AD are T1-weighted (T1w) magnetic resonance imaging (MRI)and positron emission tomography (PET) with various tracers (Frisoni et al., 2010;Vemuri and Jack, 2010). These techniques allow studying different types of alter-ations in the gray matter (GM). However, while AD is often considered primarilya gray matter disease, white matter (WM) is also extensively altered. There hasthus been an increased interest in using diffusion MRI to study alterations in WMas the disease progresses (Fellgiebel et al., 2006; Kantarci et al., 2001; Müller et al.,2007; Müller et al., 2005).
In the past decades, there has been a strong interest in developing machinelearning methods to assist diagnosis and prognosis of AD based on neuroimagingdata (Rathore et al., 2017; Falahati, Westman, and Simmons, 2014; Haller, Lovblad,and Giannakopoulos, 2011). In particular, a large number of studies using ma-chine learning have looked at the potential of diffusion MRI for AD classificationMaggipinto et al., 2017; Dyrba et al., 2015b; Lella et al., 2017; Cui et al., 2012; Xieet al., 2015; Li et al., 2014. Several of these studies make use of the same pub-licly available dataset: the Alzheimer’s Disease Neuroimaging Initiative (ADNI)(adni.loni.usc.edu). However, classification performances are not directly compa-rable across these studies because of differences in participant selection, featureextraction and selection, and performance metrics. It is thus difficult to knowwhich approach performs best and which components of the method have thegreatest influence on classification performances. We recently proposed a frame-work for the reproducible evaluation of machine learning algorithms in AD and

4.3. State of the art 75
demonstrated its use on PET and T1w MRI data (Samper-González et al., 2018).The framework is composed of tools for management of public datasets and inparticular their conversion into the Brain Imaging Data Structure (BIDS) format(Gorgolewski et al., 2016), standardized preprocessing pipelines, feature extrac-tion tools and classification algorithms as well as procedures for evaluation. Thisframework was devoted to T1w MRI and PET data.
In the present work, we extend this framework to diffusion MRI data. We firstperform a systematic review of the previous works devoted to automatic classifi-cation of AD using diffusion MRI data. We then present the different componentsof the framework, namely tools to convert ADNI diffusion MRI data into BIDS,preprocessing pipelines, feature extraction and selection methods and evaluationframework. We finally apply the framework to study the influence of various com-ponents on the classification performance: feature type (voxel-wise or regionalfeatures), imaging modality (T1w or diffusion MRI), data imbalance and featureselection (FS) strategy.
All the code (both of the framework and of the experiments) is publicly avail-able: the general-purpose tools have been incorporated into Clinica (Routier et al.,2018), an open-source software platform that we developed for brain image anal-ysis, and the paper-specific code is available at: https://gitlab.icm-institute.org/aramislab/AD-ML.
4.3 State of the art
AD is associated with altered integrity of WM, in particular the loss of cellularbarriers that constrain free water motion (Xie et al., 2006). The fact that DTI wasdesigned to study WM microstructure has led to the hypothesis that DTI-basedfeatures can be used for AD classification (Selnes et al., 2013). In recent years, alarge body of research has been published for classification of AD using diffusionMRI. Here, we provide a review of these works.
We performed an online search of publications concerning classification of ADusing diffusion MRI. We included only publications in English language, onlyoriginal research publications (excluding review papers) and only peer-reviewedpapers (either in journals or in conference proceedings), thereby excluding ab-stracts and preprints. We first searched on PubMed with the following search crite-ria: i) keywords: “(((classification diffusion MRI alzheimer’s disease[Title/Abstract])OR classification DTI alzheimer’s disease[Title/Abstract]) OR diagnosis DTI alzheimer’sdisease[Title/Abstract]) OR diagnosis diffusion MRI alzheimer’s disease[Title/Abstract]”,ii) publication date: before the 31st October 2018, and iii) study species: humans.

76
We identified 616 studies based on these criteria. Among these studies, 105 re-view papers were excluded. Based on the abstract, we then selected only papersdevoted to AD classification and using at least diffusion MRI. This resulted in 18studies. Secondly, another query was performed on Scopus with the following cri-teria: i) keywords: “(TITLE- ABS-KEY(classification OR diagnosis) AND TITLE-ABS-KEY((diffusion AND mri) OR dti) AND TITLE-ABS-KEY((alzheimer’s ORalzheimer) AND disease))”, and ii) publication date before the search day (the 31stOctober 2018). This resulted in 425 studies. We then excluded 104 review papers.Moreover, limiting to only peer-reviewed journals or conference proceedings re-sulted in 298 studies. Based on the abstract, we selected only papers devoted toAD classification and using at least diffusion MRI, resulting in 27 studies. Aftermerging the studies found by both PubMed and Scopus, we obtained 32 stud-ies. To complete this search, we also did a search on Google Scholar with key-words: “classification diffusion MRI alzheimer’s disease” or “classification DTIalzheimer’s disease” or “diagnosis DTI alzheimer’s disease” or “diagnosis diffu-sion MRI alzheimer’s disease”. Two additional studies were included, resulting ina total of 34 studies which are presented in the current state-of-the-art section.
These 34 studies can be categorized according to the following criteria. i) Stud-ied modality. While the majority used only diffusion MRI, some used multimodaldata (combining diffusion MRI with T1w MRI or functional MRI for instance). ii)Type of features. We subdivided between papers using DTI metric features, suchas fractional anisotropy (FA) and mean diffusivity (MD), and those using more ad-vanced features, such as tract-based or network-based features. iii) Classifiers. Themost commonly used are SVM but RF, LR, NN or NB were also used in some stud-ies. iv) Dataset. The most commonly used dataset is the ADNI although it does notconstitute an overwhelming majority, unlike for T1w-MRI or PET studies. This isprobably because diffusion MRI was not present in ADNI1. v) Classification tasks.Some studies focused on the discrimination between AD patients and CN subjectswhile other tackled classification of patients with MCI or prediction of progressionto AD among MCI patients. A summary of these characteristics for the differentstudies is presented in Table 4.1 (for those using DTI metric features) and Table4.2 (for connectivity or tractography features). Besides, if multimodal imaging ordifferent type of features (i.e., DTI metric and more advanced features) were usedin a study, we reported the accuracy of the best performance.

4.3.State
oftheart
77
Study Subject Modality dMRI Feature Classifier Database Performance
AD MCI CN CN/ CN/ sMCI/ AD/AD MCI pMCI MCI
(Ahmed et al., 2017) 45 58 52 dMRI Hippocampal SVM ADNI 0.901 0.791 – 0.771T1w voxel MD
(Cui et al., 2012) – 0.79b 204 dMRI Regional FA SVM MAS – 0.711 – –T1w(Dyrba et al., 2013) 137 – 143 dMRI Voxel FA, MD SVM EDSD 0.831 – – –
(Dyrba et al., 2015b) – 0.35c 25 dMRI Voxel FA, MD, SVM EDSD – 0.771,d 0.681 –T1w MO
(Dyrba et al., 2015a) 28 – 25 dMRI, T1w, Voxel FA, MD, SVM DZNE 0.892 – – –fMRI MO
(Demirhan et al., 2015) 43 – 70 dMRI Voxel and SVM ADNI 0.881 0.781 – 0.861Regional FA
(Friese et al., 2010) 21 – 20 dMRI, T1w Voxel FA, MD LR Local 0.882 – – –(Graña et al., 2011) 20 – 25 dMRI Voxel FA, MD SVM HSA 1.001 – – –
(Gao et al., 2015) – 41 63 dMRI, T1w, Regional FA – UHG – 0.851 – –fMRI(Jung et al., 2015) 27 18 – dMRI, T1w Regional FA, MD SVM MICPNU – – – 0.871
(Lee, Park, and Han, 2015) 35 73 33 dMRI Voxel FA, MO SVM MICPNU 0.881 – – 0.901
(Lella et al., 2017) 40 – 40 dMRI Voxel FA, MD SVM, RF, NB ADNI 0.781 – – –
(Mesrob et al., 2012) 15 – 16 dMRI Voxel and regional SVM RRMC 1.001 – – –T1w FA, MD(Li et al., 2014) 21 – 15 dMRI, T1w Regional FA SVM TJH 0.941 – – –
(Maggipinto et al., 2017) 90 90 89 dMRI Voxel FA, MD RF ADNI 0.761 0.601 – –
(O’Dwyer et al., 2012) – 19a,14b 40 dMRI Voxel FA, MD, SVM EDSD – 0.931 – –RD, AD(Haller et al., 2013) – 18e, 13 f , 35g – dMRI Voxel FA SVM Local – – 0.991,e, f –
(Schouten et al., 2016) 77 – 173 dMRI, T1w, Regional FA, LR PRODEM 0.952 – – –fMRI MD(Termenon et al., 2011) 15 – 20 dMRI Voxel FA, MD SVM, RVM, NN HSA 0.991 – – –
(Xie et al., 2015) – 64b 64 dMRI, T1w Voxel FA, MD SVM MCXWH – 0.841 – –
(Zhang and Liu, 2018) 48 39h, 75i 51 dMRI Regional FA, SVM, LR ADNI 0.901 – 0.931 –MD, RD, AD
Table 4.1: Summary of the studies using DTI metric features for AD classification. Abbreviations: dMRI: diffusion MRI; T1w: T1-weighted MRI; fMRI: functional MRI;SVM: support vector machine; RVM: relevance vector machine; RF: random forest; NB: naive bayes; LR: logistic regression; NN: nearest neighbor; 1: accuracy; 2: areaunder the curve; EDSD: European DTI Study on Dementia; MAS: Sydney Memory and Aging; RRMC: Research and Resource Memory; HSA: Hospital de Santiago Apostol;PRODEM: Prospective Registry on Dementia study; ADNI: Alzheimer’s Disease Neuroimaging Initiative; IDC: Ilsan Dementia Cohort; MCXWH: Memory Clinical at XuanWu Hospital; TJH: Tong Ji Hospital; MICPNU: Memory Impairment Clinic of Pusan National University Hospital; UHG: University Hospital of Geneva; DZNE: GermanCenter for Neurodegenerative Diseases Rostock database; Local: private database; RD: radial diffusivity; AD: axial diffusivity; MO: mode of anisotropy; a: non-amnesticMild Cognitive Impairment; b: amnestic Mild Cognitive Impairment; c: MCI-Ab 42-; d: MCI-Ab 42+; e: sd-aMCI, single domain amnestic MCI; f: sd-fMCI, single domain
frontal MCI; g: md-aMCI, multiple domains amnestic MCI; h: late MCI; i: early MCI; –, not applicable.

78Study Subject Modality dMRI Feature Classifier Database Performance
AD MCI CN CN/ CN/ sMCI/ AD/AD MCI pMCI MCI
(Amoroso et al., 2017) 47 – 52 dMRI Network measures – ADNI 0.953 – – –
(Cai et al., 2018) 165 – 165 dMRI Network measures LDA ADNI 0.852 – – –T1w
(Doan et al., 2017) 79 55 – dMRI Tract measures, regional LR NorCog – – – 0.71330a FA, MD, RD, AD
(Ebadi et al., 2017) 15 15 15 dMRI Network measures LR, RF, NB, – 0.802 0.702 – 0.802SVM, NN
(Lee, Park, and Han, 2013) – 39 39 dMRI Network measures, voxel SVM ADNI – 1.002 – –and regional FA(Lella et al., 2018) 40 30 52 dMRI Network measures SVM ADNI 0.773 – – –(Nir et al., 2015) 37 113 50 dMRI Tract measures, FA, MD SVM ADNI 0.852 0.792 – –
(Prasad et al., 2015) 38 38b50 dMRI Network measures SVM ADNI 0.782 – 0.632 –74c
(Schouten et al., 2017) 77 – 173 dMRI Network measures, voxel LR PRODEM 0.922 – – –FA, MD, RD, AD
(Wee et al., 2012) – 10 17 dMRI Network measures SVM DUBIAC �� 0.962 – –fMRI
(Wang et al., 2018a) – 169 379 dMRI Network measures SVM, RF ADNI �� 0.753 – –T1w NACC
(Zhu et al., 2014) – 22 22 dMRI Network measures SVM NACC �� 0.952 – –fMRI(Zhan et al., 2015) 39 112 51 dMRI Network measures LR ADNI 0.711 0.571 – 0.691
Table 4.2: Summary of the studies using tract-based or network-based features for AD classification. Abbreviations: dMRI: diffusion MRI; T1w: T1-weighted MRI; fMRI:functional MRI; SVM: support vector machine; LDA: linear discriminant analysis; RF: random forest; NB: naive bayes; LR: logistic regression; NN: nearest neighbor; 1:balanced accuracy; 2: accuracy; 3: area under the curve; DUBIAC: Duke-UNC Brain Imaging and Analysis Center; RRMC: Research and Resource Memory; PRODEM:Prospective Registry on Dementia study; ADNI: Alzheimer’s Disease Neuroimaging Initiative; NACC: National Alzheimer’s Coordinating Center; NorCog: Norwegian
registry for persons being evaluated for cognitive symptoms in specialized health care. a: subjective decline MCI; b: late MCI; c: early MCI; –, not applicable.
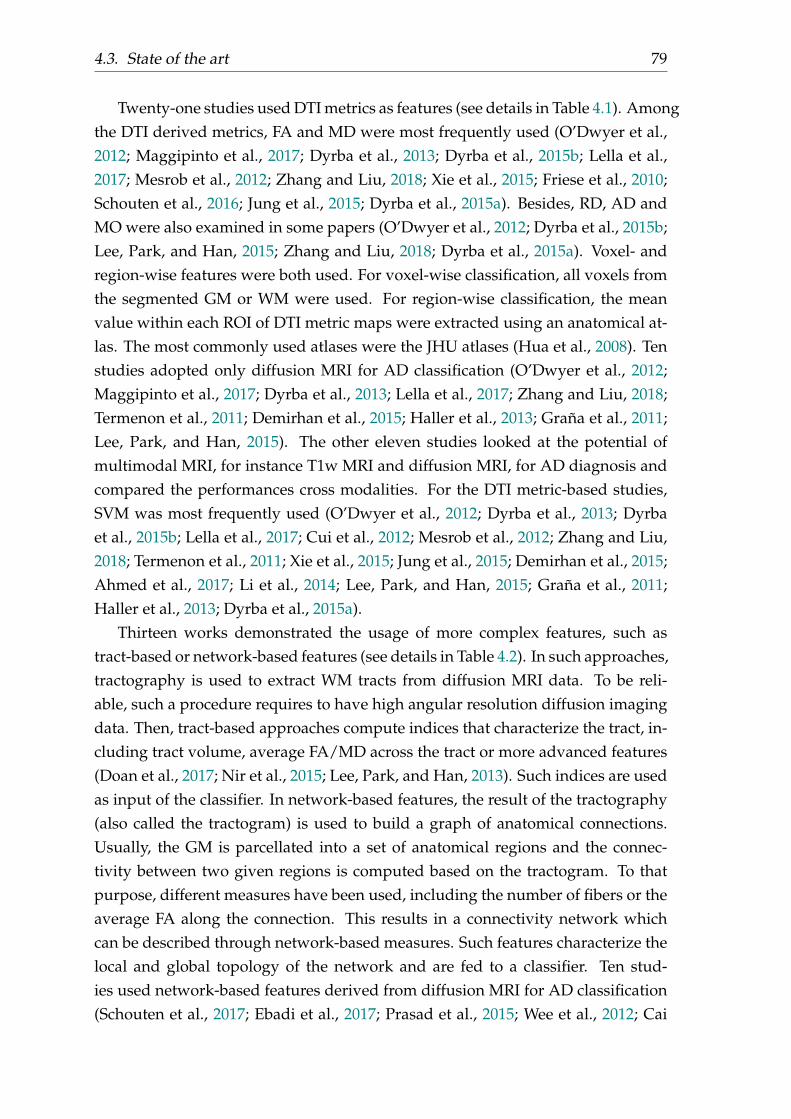
4.3. State of the art 79
Twenty-one studies used DTI metrics as features (see details in Table 4.1). Amongthe DTI derived metrics, FA and MD were most frequently used (O’Dwyer et al.,2012; Maggipinto et al., 2017; Dyrba et al., 2013; Dyrba et al., 2015b; Lella et al.,2017; Mesrob et al., 2012; Zhang and Liu, 2018; Xie et al., 2015; Friese et al., 2010;Schouten et al., 2016; Jung et al., 2015; Dyrba et al., 2015a). Besides, RD, AD andMO were also examined in some papers (O’Dwyer et al., 2012; Dyrba et al., 2015b;Lee, Park, and Han, 2015; Zhang and Liu, 2018; Dyrba et al., 2015a). Voxel- andregion-wise features were both used. For voxel-wise classification, all voxels fromthe segmented GM or WM were used. For region-wise classification, the meanvalue within each ROI of DTI metric maps were extracted using an anatomical at-las. The most commonly used atlases were the JHU atlases (Hua et al., 2008). Tenstudies adopted only diffusion MRI for AD classification (O’Dwyer et al., 2012;Maggipinto et al., 2017; Dyrba et al., 2013; Lella et al., 2017; Zhang and Liu, 2018;Termenon et al., 2011; Demirhan et al., 2015; Haller et al., 2013; Graña et al., 2011;Lee, Park, and Han, 2015). The other eleven studies looked at the potential ofmultimodal MRI, for instance T1w MRI and diffusion MRI, for AD diagnosis andcompared the performances cross modalities. For the DTI metric-based studies,SVM was most frequently used (O’Dwyer et al., 2012; Dyrba et al., 2013; Dyrbaet al., 2015b; Lella et al., 2017; Cui et al., 2012; Mesrob et al., 2012; Zhang and Liu,2018; Termenon et al., 2011; Xie et al., 2015; Jung et al., 2015; Demirhan et al., 2015;Ahmed et al., 2017; Li et al., 2014; Lee, Park, and Han, 2015; Graña et al., 2011;Haller et al., 2013; Dyrba et al., 2015a).
Thirteen works demonstrated the usage of more complex features, such astract-based or network-based features (see details in Table 4.2). In such approaches,tractography is used to extract WM tracts from diffusion MRI data. To be reli-able, such a procedure requires to have high angular resolution diffusion imagingdata. Then, tract-based approaches compute indices that characterize the tract, in-cluding tract volume, average FA/MD across the tract or more advanced features(Doan et al., 2017; Nir et al., 2015; Lee, Park, and Han, 2013). Such indices are usedas input of the classifier. In network-based features, the result of the tractography(also called the tractogram) is used to build a graph of anatomical connections.Usually, the GM is parcellated into a set of anatomical regions and the connec-tivity between two given regions is computed based on the tractogram. To thatpurpose, different measures have been used, including the number of fibers or theaverage FA along the connection. This results in a connectivity network whichcan be described through network-based measures. Such features characterize thelocal and global topology of the network and are fed to a classifier. Ten stud-ies used network-based features derived from diffusion MRI for AD classification(Schouten et al., 2017; Ebadi et al., 2017; Prasad et al., 2015; Wee et al., 2012; Cai

80
et al., 2018; Lella et al., 2018; Wang et al., 2018b; Zhan et al., 2015; Amoroso et al.,2017; Zhu et al., 2014).
There is a high variability in terms of classification performances across stud-ies. For DTI metric features, the classification accuracy ranges from 0.71 to 1 fortask CN vs AD. With regard to the accuracies across types of features, no consis-tency existed across studies. For instance, Nir et al observed that, in their study,the performances of MD outperformed FA (Nir et al., 2015). However, O’Dwyer etal reported higher accuracy for FA than MD in their experiments (O’Dwyer et al.,2012) and another study obtained comparable accuracies for both metrics (Dyrbaet al., 2013). Conflicting results were also reported for the comparison of differentmodalities. Mesrob et al obtained higher accuracy with T1w MRI than with diffu-sion MRI (Mesrob et al., 2012) while Dyrba et al came to the opposite conclusion(Dyrba et al., 2015b). For network- or tract-based features, the classification accu-racy ranges from 0.71 to 0.95 for task CN vs AD, a range which is comparable tothat obtained with DTI metrics.
In this work, we choose to focus on DTI metrics because: i) they are more sim-ple than connectivity or tractography features; ii) they can be easily computedand can make use of standard diffusion MRI sequences, thus are more adapted totranslation to clinical practice, iii) to date, there is no clear evidence that connec-tivity/tractography features lead to higher accuracies for AD classification andiv) conflicting results exist regarding the respective performance of different DTImetrics in this context.
4.4 Materials
The data used in the preparation of this article were obtained from the Alzheimer’sDisease Neuroimaging Initiative database (ADNI) (adni.loni.usc.edu). The ADNIwas launched in 2003 as a public-private partnership, led by Principal Investiga-tor Michael W. Weiner, MD. The primary goal of ADNI has been to test whetherserial MRI, PET, other biological markers, and clinical and neuropsychologicalassessment can be combined to measure the progression of MCI and early AD.Over 1,650 participants were recruited across North America during the first threephases of the study (ADNI1, ADNI GO and ADNI2). Around 400 participantswere diagnosed with AD, 900 with MCI and 350 were control subjects. Three maincriteria were used to classify the subjects (Petersen et al., 2010). The normal sub-jects had no memory complaints, while the subjects with MCI and AD both hadto have complaints. CN and MCI subjects had a MMSE score between 24 and 30(inclusive), and AD subjects between 20 and 26 (inclusive). The CN subjects hada CDR score of 0, the MCI subjects of 0.5 with a mandatory requirement of the

4.4. Materials 81
memory box score being 0.5 or greater, and the AD subjects of 0.5 or 1. The othercriteria can be found in (Petersen et al., 2010).
Five diagnosis groups were considered:
• CN: subjects who were diagnosed as CN at baseline;
• AD: subjects who were diagnosed as AD at baseline;
• MCI: subjects who were diagnosed as MCI, EMCI or LMCI at baseline;
• pMCI: subjects who were diagnosed as MCI, EMCI or LMCI at baseline, werefollowed during at least 36 months and progressed to AD between their firstvisit and the visit at 36 months;
• sMCI: subjects who were diagnosed as MCI, EMCI or LMCI at baseline, werefollowed during at least 36 months and did not progress to AD between theirfirst visit and the visit at 36 months.
Naturally, all participants in the pMCI and sMCI groups are also in the MCIgroup. Note that the reverse is false, as some MCI subjects did not convert to ADbut were not followed long enough to state whether they were sMCI or pMCI.
The DWIs of ADNI were downloaded in October 2016. They all came fromADNI GO and ADNI2 phases. Two different acquisition protocols are describedfor DWIs: Axial DTI (images with “Sequence” field starting by “AX_DTI” and“Axial_DTI” in the file of “IDA_MR_Metadata_Listing.csv”) and Enhanced Ax-ial DTI (images with “Sequence” field equal to “Enhanced_Axial_DTI” in the fileof “IDA_MR_Metadata_Listing.csv”). In total, Axial DTI were available for 1019visits and Enhanced Axial DTI for 102 visits. Only Axial DTI images were avail-able for the baseline visit (222). In the current study, we included the participantswhose diffusion and T1w MRI scans were both available at baseline. These DWIswere acquired with the following parameters: 35 cm field of view, 128⇥128 ac-quired matrix, reconstructed to a 256⇥256 matrix; voxel size: 1.35⇥1.35⇥2.7mm ;scan time = 9 min; 41 diffusion-weighted directions at b-value = 1000 s/mm2 and5 T2-weighted images (b-value = 0 s/mm2, referred to as b0 image). Besides, eachparticipant underwent a T1w MRI sequence with following parameters: 256⇥256matrix; voxel size = 1.2⇥1.0⇥1.0 mm ; TI = 400 ms; TR = 6.98 ms; TE = 2.85 ms;flip angle = 11�. We used QC information provided by ADNI to select participants(see below Section 4.1). Moreover, QC was conducted on the results of the prepro-cessing pipeline (see below Section 4.2). Four participants were excluded becauseof the lower image resolution (4.5⇥4.5⇥4.5mm). Finally, 46 CN, 97 MCI, 54 sMCI,24 pMCI and 46 AD were included.

82
Table 4.3 summarizes the demographics, and the MMSE and global CDR scoresof the participants in this study.
N Age Gender MMSE CDR
CN 46 72.7 ± 6.0[59.8,89.0] 21M/25F 28.9 ± 1.4[24,30] 0:46MCI 97 72.9 ± 7.3[55.0,87.8] 62M/35F 27.7 ± 1.7[24,30] 0.5:97sMCI 54 72.6 ± 7.7[55.0,87.8] 21M/25F 28.0 ± 1.7[24,30] 0.5:54pMCI 24 74.2 ± 6.1[56.5,85.3] 16M/8F 26.8 ± 1.4[24,30] 0.5:24AD 46 74.4 ± 8.4[55.6,90.3] 28M/18F 23.4 ± 1.9[20,26] 0.5:17;1:29
Table 4.3: Summary of participant demographics, mini-mental stateexamination (MMSE) and global clinical dementia rating (CDR)scores. Values are presented as mean ± SD [range]. M: male, F: fe-
male
4.5 Methods
The classification framework is illustrated in Figure 4.1. It includes: tools fordata management, image processing, feature extraction and selection, classifica-tion, and evaluation. Conversion tools allow an easy update of ADNI as new sub-jects become available. To facilitate future development and testing, the differentcomponents were designed in a modular-based architecture: processing pipelinesusing Nipype (Gorgolewski et al., 2011), and classification and evaluation toolsusing the scikit-learn 19 library (Pedregosa et al., 2011). Thus the objective mea-surement of the impact of each component on the results could be clarified. Asimple command line interface is provided and the code can also be used as aPython library.
19http://scikit-learn.org

4.5. Methods 83
Figure 4.1: Overview of the framework.
4.5.1 Converting datasets to a standardized data structure
Public datasets, such as ADNI, are extremely useful to the research community.However, using the ADNI can be difficult because the downloaded raw data doesnot possess a clear and uniform organization. We thus proposed to convert ADNIdata into the BIDS format (Gorgolewski et al., 2016), a community standard whichallows storing multiple neuroimaging modalities as well as clinical and sociode-mographic data. BIDS is based on a file hierarchy rather than on a database man-agement system. It can thus be easily deployed in any research laboratory.
The ADNI to BIDS converter that we developed allows to automatically con-vert the raw dataset downloaded from the ADNI website to BIDS. The converterrequires that the user has downloaded all the ADNI study data (tabular data in csvformat) and the imaging data of interest. Importantly, the downloaded files mustbe kept exactly as they were downloaded. All conversion steps are then performedby the automatic converter, requiring no user intervention.
Details regarding conversion of clinical, sociodemographic and T1w MRI datacan be found in (Samper-González et al., 2018). For the DWIs, first, we selectedfrom the file “IDA_MR_Metadata_Listing.csv”, all entries containing “DTI” in the“Sequence” field. Images with a sequence name containing “Enhanced” were dis-carded. Then, “IMAGEUID” field was matched to corresponding “loni_image”

84
field of ‘MAYOADIRL_MRI_IMAGEQC_12_08_15.csv’ file, to find QC informa-tion for each image. In cases where there existed several scans for a visit, we keptthe one marked as selected (1 in ‘series_selected’ field of QC csv file). If there wasno image marked as selected, then we chose the image with the best quality, (asspecified in “series_quality” field, ranging from 1 to 4, 1 being excellent and 4 be-ing unusable), excluding the images that failed QC (series_quality = 4). If therewere several images for the same visit and QC information was not present, wechose the scan that was acquired the first. Once paths for each of the selected im-ages were gathered, the images in dicom format were converted to nifti formatusing the dcm2niix20 tool, or in case of error the dcm2nii21 tool (Li et al., 2016). Im-ages failing the conversion using both tools were manually discarded. Finally, theconverted images in nifti format were organized in the corresponding BIDS folder.Note that all these steps are automatically performed by the converter.
We also provide tools for subject selection according to the duration of followup and the diagnose. In the present study, all the participants whose T1w MRIand diffusion MRI scans were available at baseline were included. Finally, weorganized all the outputs of the experiments into a BIDS-inspired standardizedstructure.
4.5.2 Preprocessing pipelines
4.5.2.1 Preprocessing of T1w MRI
The image processing pipeline for T1w MRI was previously described in (Samper-González et al., 2018). In brief, the Unified Segmentation procedure (Ashburnerand Friston, 2005) is first used to simultaneously perform tissue segmentation, biascorrection and spatial normalization of the input image. Next, a group templateis created using DARTEL (Ashburner, 2007), from the subjects’ tissue probabilitymaps in native space obtained at the previous step. Lastly, the DARTEL to MNImethod (Ashburner, 2007) is applied, providing a registration of the native spaceimages into the MNI space. Besides, the GM and WM tissue maps from DAR-TEL template were binarized (with a threshold of 0.3) to obtain the correspondingtissue masks that are subsequently used in diffusion MRI pipeline.
20https://github.com/rordenlab/dcm2niix21https://www.nitrc.org/plugins/mwiki/index.php/dcm2nii:MainPage

4.5. Methods 85
4.5.2.2 Preprocessing of diffusion MRI
For each subject, all b0 images were rigidly registered to the first b0 image andthen averaged as the b0 reference. The raw DWIs were corrected for eddy current-induced distortions and subject movements by simultaneously modelling the ef-fects of diffusion eddy currents and movements on the image using eddy tool(Andersson and Sotiropoulos, 2016) from FMRIB Software Library (FSL) software(Jenkinson et al., 2012). To correct for susceptibility-induced distortions, as fieldmapdata were not available in ADNI GO or ADNI2, the T1w MRI was used instead inthis context. The skull-stripped b0 image was registered to the T1w MRI with twosequential steps: first a rigid registration using FSL flirt tool and then a non-linearregistration using SyN registration algorithm from ANTs (Avants et al., 2008). SyNis an inverse-consistent registration algorithm allowing EPI induced susceptibilityartifacts correction (Leow et al., 2007). Finally, the DWI volumes were correctedfor nonuniform intensity using the ANTs N4 bias correction algorithm (Tustisonand Avants, 2013) and the diffusion weighting directions were appropriately up-dated (Leemans and Jones, 2009). The implementation of these different steps isavailable in the dwi-preprocessing-using-t1 pipeline of Clinica.
We performed QC on the results of the preprocessing pipeline. Specifically, weinspected the results for the presence of head motion artifacts and eddy currentartifacts. Registration quality was also visually checked by overlapping the sourceimage onto the target image. All preprocessed data were considered of acceptablequality.
The DTI model was then fitted to generate FA and MD maps using MRtrix(Tournier, Calamante, and Connelly, 2012). FA maps were nonlinearly registeredonto the JHU atlas FA template in MNI space with the ANTs SyN algorithm (Avantset al., 2008). The estimated nonlinear deformation was finally applied to the MDmaps to have all the FA and MD maps in the same space. These procedures wereimplemented in the dwi-processing-dti pipeline of Clinica.
4.5.3 Feature extraction
We extracted two types of features: voxel-wise and regional features. After imagepreprocessing, all T1w MRI and diffusion MRI are in MNI space and we have avoxel-wise correspondence across subjects. Voxel-wise features simply correspondto all the voxels in GM for T1w MRI. In order to extract the DTI-based voxel-wisefeatures, FA and MD maps were masked using the tissue masks (i.e., WM, GMand GM+WM tissue binarized masks) obtained from T1w MRI pipeline. Thena Gaussian smoothing kernel with FWHM at 8 mm was applied to the maskedFA and MD maps. The resulting maps were masked again by the tissue masks.

86
Thus voxels in GM, WM or GM+WM tissue maps were used as voxel-wise fea-tures for diffusion MRI. Regional features correspond to the average value (GMdensity for T1w MRI; FA or MD for diffusion MRI) computed in a set of ROIs ob-tained from different atlases. AAL2 atlas containing 120 ROIs (Rolls, Joliot, andTzourio-Mazoyer, 2015) was used for T1w MRI. Two JHU atlases, ICBM-DTI-81white-matter labels atlas (referred as JHULabel with 48 ROIs) and JHU white-matter tractography atlas with a 25% threshold (referred as JHUTract25 with 20ROIs), were used for diffusion MRI. The different features are shown in Table 4.4.
Modality Feature Type Feature
Diffusion MRIVoxel-wise
WM-FAWM-MDGM-FAGM-MD
WM+GM-FAWM+GM-MD
Region-wise JHULabel-FA/MDJHUTract25-FA/MD
T1w MRI Voxel-wise GM-DensityRegion-wise AAL2
Table 4.4: Summary of the different types of features.
4.5.4 Classification
Classification was performed using a linear SVM for both voxel-wise and regionalfeatures. As output of the classification, we reported the balanced accuracy, AUC,accuracy, sensitivity, specificity. Additionally, the optimal margin hyperplane (OMH)coefficient maps were reported. The OMH coefficient map represents the influenceof each voxel or region on the classification performance. Thus, the OMH coeffi-cient map characterizes the potential anatomical patterns associated to a givenclassifier (Cuingnet et al., 2013).
4.5.5 Cross-validation
As emphasized in the recent literature (Varoquaux et al., 2017), it is important toproperly perform the cross-validation (CV) procedures. In the present work, theCV procedure included two nested loops: an outer loop evaluating the classifica-tion performances and an inner loop used to optimize the hyperparameters of themodel (C for SVM). More precisely, repeated random splits (all of them stratified)with 250 repetitions was used for outer CV. For hyperparameter optimization, we

4.5. Methods 87
used an inner loop with 10-fold CV. For each split, the model with the highestbalanced accuracy is selected, and then these selected models are averaged acrosssplits to profit of model averaging.
When FS is performed, it is crucial that FS is adequately incorporated into theCV procedure. FS is a process to identify relevant features and thereby reducethe dimensionality. It has the potential to reduce overfitting (Bermingham et al.,2015). In the present work, we aim to explore the impact of FS bias. The FS bias,also known as non-nested FS strategy, arises when FS is performed on the entiredataset and not within the CV procedure, thus introducing data leakage. On thecontrary, a nested FS is a procedure blind to the test data and embedded into thenested CV (Maggipinto et al., 2017).
Two different FS algorithms were applied: an ANOVA univariate test and anembedding SVM recursive feature elimination (SVM-RFE) (Guyon et al., 2002;Chandrashekar and Sahin, 2014). Specifically, the ANOVA test can been seen as afilter without taking the classifier into account and was performed for each featureindependently. SVM-RFE uses the coefficients from the SVM models to assess fea-ture importance. Then the least important features, which have the least effect onclassification, are iteratively pruned from the current set of features. The remain-ing features are kept for the next iteration until the desired number of features hasbeen obtained. For both methods, we tested varying numbers of selected features(1% of the total number of features and then from 10% to 100%, increasing by 10%at each step).
4.5.6 Classification experiments
Four different classification tasks were considered: CN vs AD, CN vs pMCI, sMCIvs pMCI and CN vs MCI.
For all classification tasks, we assessed the influence of different componentson the performance. First of all, we compared the performance obtained with dif-ferent DTI metrics (FA, MD), different feature types (voxel, regional) and differentatlases. Secondly, we compared the classification performance between diffusionMRI and T1w MRI. To note, the nested CV procedure, in each iteration, guaranteedthe same subjects for data split (i.e., training and testing data) between modalities.Thirdly, we studied the impact of imbalanced data. Three tasks (i.e., CN vs pMCI,CN vs MCI and sMCI vs pMCI) have imbalanced data: the number of subjects ofthe majority group is nearly twice as many as that of the minority group. To assessthe impact of data imbalance, a random down-sampling technique was used foreach imbalanced task. In each iteration of the outer CV, this technique randomly

88
excluded certain subjects from the majority group to ensure the subject balancebetween groups. Lastly, we evaluated the effect of FS bias.
4.6 Results
Here, we present the results of classification tasks using original data or balanceddata in Tables 4.5 and 4.6. Balanced accuracy was used as performance metric.All the results with other performance metrics are available at https://gitlab.icm-institute.org/aramislab/AD-ML.
Modality Feature CN/AD CN/pMCI sMCI/pMCI CN/MCI
Diffusion MRI
WM-FA 0.73 ± 0.099 0.52 ± 0.108 0.43 ± 0.088 0.57 ± 0.090WM-MD 0.71 ± 0.098 0.53 ± 0.087 0.49 ± 0.048 0.59 ± 0.068GM-FA 0.71 ± 0.097 0.59 ± 0.107 0.48 ± 0.089 0.57 ± 0.088GM-MD 0.76 ± 0.095 0.61 ± 0.115 0.51 ± 0.098 0.60 ± 0.084
WM+GM-FA 0.71 ± 0.099 0.59 ± 0.112 0.47 ± 0.094 0.58 ± 0.086WM+GM-MD 0.76 ± 0.098 0.60 ± 0.118 0.51 ± 0.106 0.60 ± 0.088JHULabel-FA 0.70 ± 0.107 0.51 ± 0.112 0.47 ± 0.088 0.57 ± 0.081JHULabel-MD 0.50 ± 0 0.50 ± 0 0.50 ± 0 0.50 ± 0JHUTract25-FA 0.66 ± 0.102 0.54 ± 0.118 0.47 ± 0.078 0.55 ± 0.077JHUTract25-MD 0.47 ± 0 0.50 ± 0 0.50 ± 0 0.50 ± 0
T1w MRI GM-Density 0.88 ± 0.066 0.73 ± 0.112 0.64 ± 0.113 0.58 ± 0.086AAL2 0.86 ± 0.073 0.69 ± 0.120 0.64 ± 0.118 0.59 ± 0.090
Table 4.5: Results of all the classification experiments using original(imbalanced) data. Balanced accuracy was used as performance met-
ric. Values are presented as mean ± standard deviation (SD).
Modality Feature CN/pMCI sMCI/pMCI CN/MCI
Diffusion MRI
WM-FA 0.55 ± 0.151 0.44 ± 0.150 0.56 ± 0.113WM-MD 0.61 ± 0.140 0.48 ± 0.138 0.55 ± 0.090GM-FA 0.60 ± 0.137 0.47 ± 0.151 0.59 ± 0.107GM-MD 0.62 ± 0.144 0.51 ± 0.146 0.57 ± 0.101
WM+GM-FA 0.61 ± 0.146 0.44 ± 0.156 0.57 ± 0.110WM+GM-MD 0.62 ± 0.139 0.51 ± 0.150 0.57 ± 0.105JHULabel-FA 0.53 ± 0.138 0.47 ± 0.138 0.57 ± 0.101JHULabel-MD 0.55 ± 0.088 0.48 ± 0.142 0.58 ± 0.078JHUTract25-FA 0.57 ± 0.135 0.48 ± 0.142 0.54 ± 0.118JHUTract25-MD 0.64 ± 0.148 0.53 ± 0.144 0.59 ± 0.103
Table 4.6: Results of all the classification experiments using balanceddata. Balanced accuracy was used as performance metric. Values are
presented as mean ± standard deviation (SD).
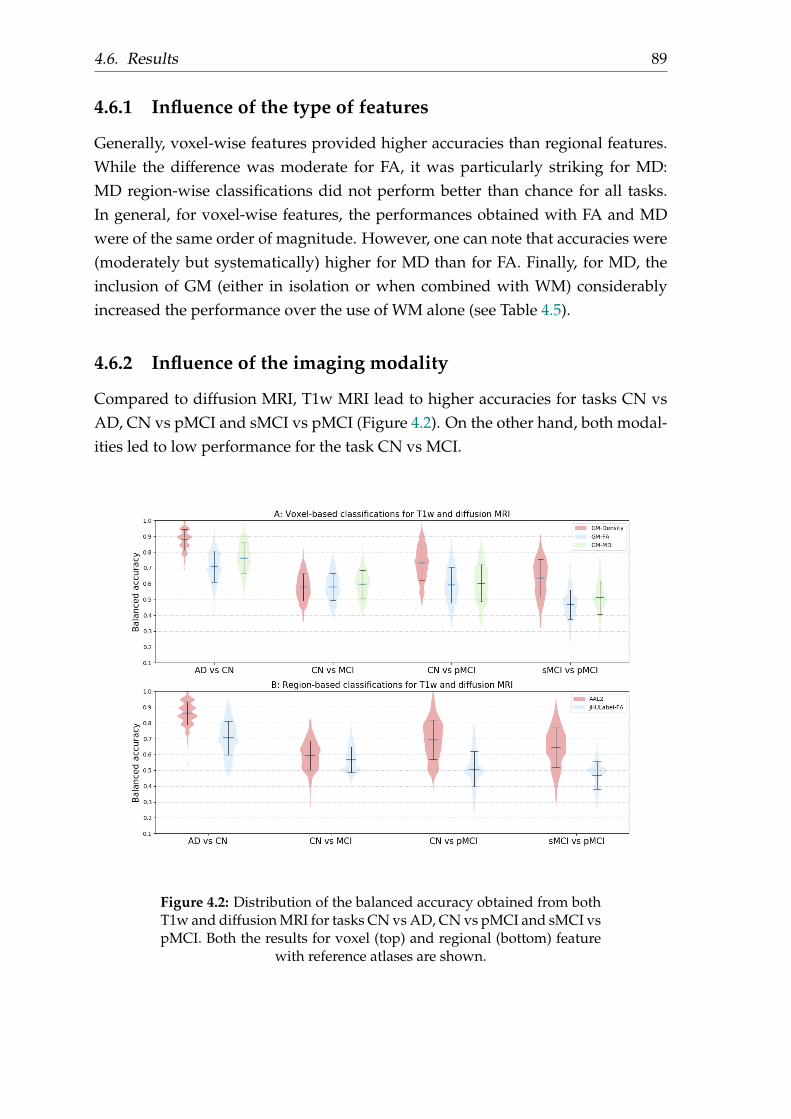
4.6. Results 89
4.6.1 Influence of the type of features
Generally, voxel-wise features provided higher accuracies than regional features.While the difference was moderate for FA, it was particularly striking for MD:MD region-wise classifications did not perform better than chance for all tasks.In general, for voxel-wise features, the performances obtained with FA and MDwere of the same order of magnitude. However, one can note that accuracies were(moderately but systematically) higher for MD than for FA. Finally, for MD, theinclusion of GM (either in isolation or when combined with WM) considerablyincreased the performance over the use of WM alone (see Table 4.5).
4.6.2 Influence of the imaging modality
Compared to diffusion MRI, T1w MRI lead to higher accuracies for tasks CN vsAD, CN vs pMCI and sMCI vs pMCI (Figure 4.2). On the other hand, both modal-ities led to low performance for the task CN vs MCI.
Figure 4.2: Distribution of the balanced accuracy obtained from bothT1w and diffusion MRI for tasks CN vs AD, CN vs pMCI and sMCI vspMCI. Both the results for voxel (top) and regional (bottom) feature
with reference atlases are shown.

90
4.6.3 Influence of the imbalanced data
For voxel-wise classification, compared to the results of classification using im-balanced data, balanced data showed comparable accuracies for all three tasks, asshown in Figure 4.3. For MD region-wise approach, switching from imbalanceddata to balanced data, accuracy considerably increased from 0.5 to 0.64 for taskCN vs pMCI and from 0.5 to 0.59 for task CN vs MCI.
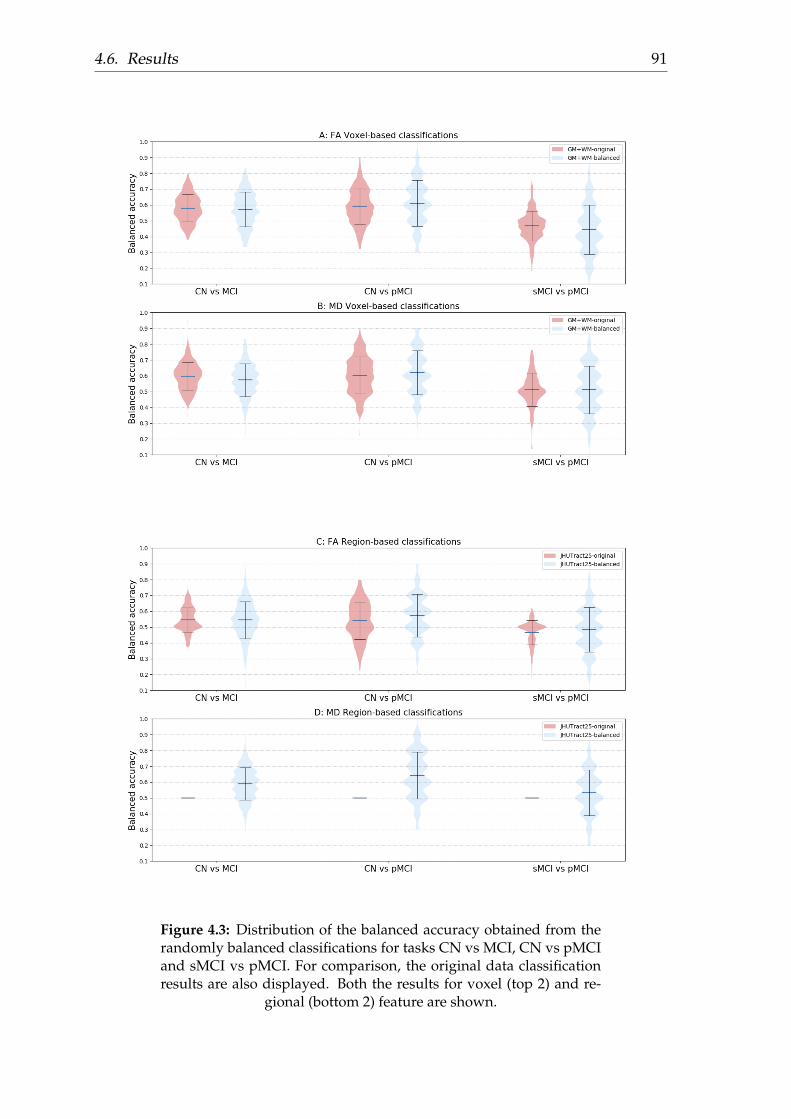
4.6. Results 91
Figure 4.3: Distribution of the balanced accuracy obtained from therandomly balanced classifications for tasks CN vs MCI, CN vs pMCIand sMCI vs pMCI. For comparison, the original data classificationresults are also displayed. Both the results for voxel (top 2) and re-
gional (bottom 2) feature are shown.

92
4.6.4 Influence of the feature selection bias
To assess the influence of FS bias, the experiments were restricted to GM+WM-FA and GM+WM-MD features for task CN vs AD, which are the cases with thehighest number of features and for which the performance is higher. Results arepresented in Figure 4.4.
For both FS algorithms, the non-nested approach resulted in vastly over-optimisticevaluations of performances, from 5% up to 40% increase in balanced accuracy.Specifically, for ANOVA, the highest balanced accuracy was obtained with thefirst 1% most informative voxels for non-nested approach (0.78 for FA and 0.83for MD), and with all available voxels for nested approach (0.71 for FA and 0.76for MD). For SVM-RFE, the highest balanced accuracy was achieved with the first10% most informative voxels for non-nested approach (0.99 for FA and 0.83 forMD), and with the first 70% most informative voxels with FA (0.75) and the first1% most informative voxels with MD (0.77) for nested approach. Compared tonon-FS (no FS was performed), the nested ANOVA FS did not give better perfor-mance. Whilst while the nested SVM-RFE obtained slightly higher accuracies thannon-FS: balanced accuracy increases from 0.71 (non-FS) to 0.75 (nested FS) for FAand 0.76 (non-FS) to 0.77 (nested FS) for MD.

4.6. Results 93
Figure 4.4: Balanced accuracy of CN vs AD obtained varying thenumber of voxels for ANOVA and SVM-RFE approaches. (A)
GM+WM-FA feature; (B) GM+WM-MD feature.
4.6.5 Potential anatomical pattern
Figure 4.5 displays the OMH coefficient maps for the most successful task CNvs AD. For MD features, discriminative voxels were mainly within the GM (hip-pocampus and medial temporal cortex) (Figure 4.5B). When restricting the analy-sis to WM, only small regions were discriminative and these regions where out-side those of the JHUTract25 atlas (Figure 4.5D), which is consistent with the poor

94
performances obtained with MD regional features. For GM- density features (Fig-ure 4.5C), the discriminative voxels also included these regions but were moreextended (including some regions in the lateral temporal cortex and in the parietaland frontal lobes). For FA, discriminative voxels included both GM and WM re-gions (Figure 4.5A). In the GM, discriminative voxels were mainly located withinthe medial temporal lobe. In the WM, they were more diffuse and absent of thedeep WM. These regions were close to the forceps minor and major tracts andinferior fronto-occipital fasciculus.
Figure 4.5: Normalized coefficient maps in MNI space. Task CNvs AD with A) GM+WM-FA features; B) GM+WM-MD features; C)GM-Density features; D) WM-MD features superimposed onto theJHUTract25 atlas (in gray). Warm colors, it means higher likelihood
of classification into AD.
4.7 Discussion
In the present work, we proposed an open-source framework for the reproducibleevaluation of AD classification from diffusion MRI, which extends our previousframework devoted to T1w MRI and PET. We demonstrated its use to assess theinfluence of different components on classification performances, specifically i)feature types, ii) imaging modalities (T1w MRI and diffusion MRI), iii) data im-balance and iv) FS strategies.
Generally, we hopefully contribute to make evaluation of machine learning ap-proaches in AD more reproducible and more objective. Firstly, providing the toolsto fully automatically convert original ADNI diffusion MRI into the communitystandard BIDS, we hope to facilitate the future work of researchers. Secondly, theliterature (Uchida, 2013; Cuingnet et al., 2011; Lu and Weng, 2007) suggested that

4.7. Discussion 95
image processing procedures, including steps such as preprocessing, parcellation,registration and intensity normalization, have a strong influence on classificationresults. Hence, a standard diffusion MRI processing pipeline was proposed inthe present work. Lastly, we proposed rigorous CV procedures following recentbest practices (Varoquaux et al., 2017). The key components are publicly availablein Clinica, a freely available software platform for clinical neuroscience researchstudies. We hope this framework will allow researchers to easily and rigorouslyevaluate their own classification algorithms, FS algorithms or image processingpipelines.
We then aimed to provide a baseline performance for future work. The resultsobtained in our framework were in line with the state-of-the-art. In our experi-ments, we obtained the balanced accuracy with 0.76 for task CN vs AD, 0.60 fortask CN vs MCI and 0.61 for task CN vs pMCI. In general, the performances arelow and support the idea that DTI metrics, alone, are not highly discriminant forAD classification. However, one can note that, in the literature, several studies us-ing DTI-based features reported superior performances over our work (O’Dwyeret al., 2012; Nir et al., 2015; Demirhan et al., 2015; Mesrob et al., 2012; Termenonet al., 2011; Graña et al., 2011). However, these discrepancies may come from i) thedifferences in image quality due to different dataset, ii) different sample size andiii) the FS bias, which we will specifically discuss below.
Different types of DTI-based features were assessed. Generally, voxel-wise fea-tures provided higher accuracies than region-wise features. This was consistentwith a previous study (Demirhan et al., 2015), which reported accuracies of 0.75for region-wise classification and of 0.88 for voxel-wise classification. Of note, themost discriminative voxels for WM-MD classification are outside the regions ofthe JHUTract25 atlas. This finding explains the poor performances obtained us-ing MD regional features. Thus, the atlas used for region-wise approaches shouldbe chosen with care. Moreover, FA and MD gave comparable performances forvoxel-wise classification. This finding was supported by previous studies (Dyrbaet al., 2013; Maggipinto et al., 2017; Lella et al., 2017). One study, which adopted anon-nested FS, reported that MD (accuray of 0.81) outperformed FA (accuracy of0.75) to discriminate CN from AD (Nir et al., 2015).
We also systematically compared the classification performance between T1wand diffusion MRI. The results showed that T1w MRI outperformed diffusionMRI. Several previous studies have compared the performances of these two modal-ities. Mesrob et al found that T1w MRI outperformed diffusion MRI (accuracy ofO.77 for T1w MRI vs 0.69 for FA from DTI) for task CN vs AD (Mesrob et al.,2012). However, their results were biased due to the adoption of a non-nested FS.Cui et al founded superior performance of T1w MRI over diffusion MRI (accuracy
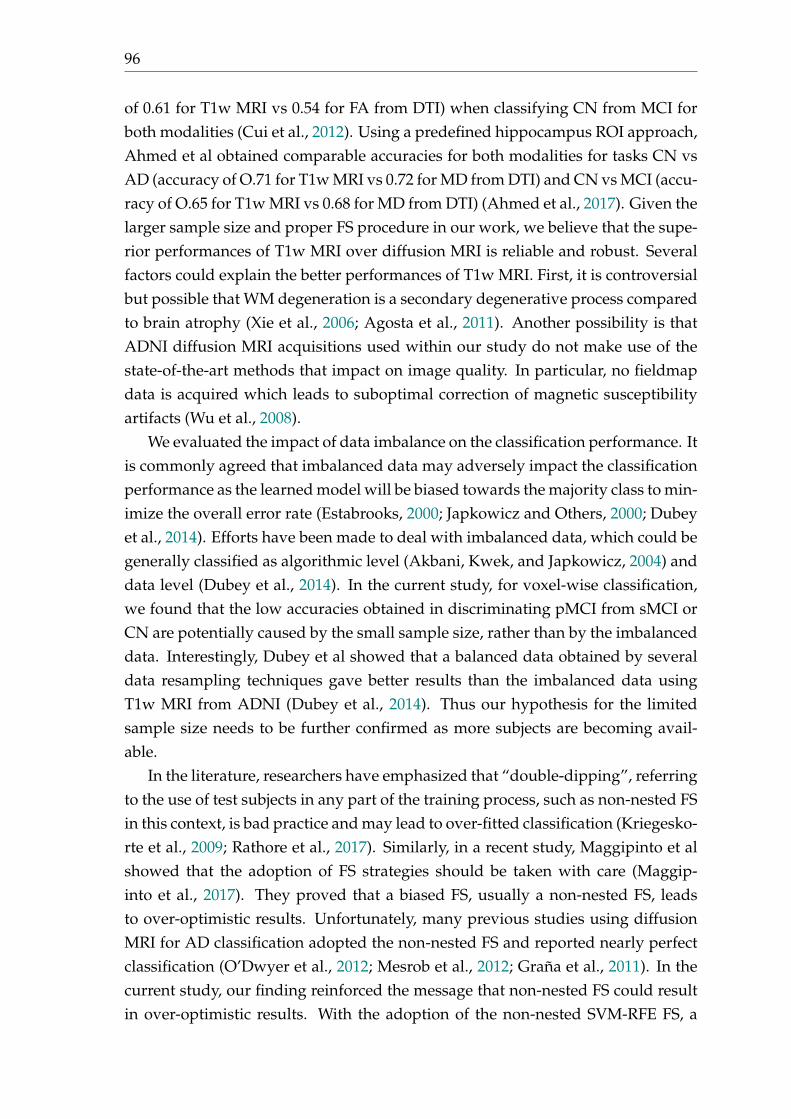
96
of 0.61 for T1w MRI vs 0.54 for FA from DTI) when classifying CN from MCI forboth modalities (Cui et al., 2012). Using a predefined hippocampus ROI approach,Ahmed et al obtained comparable accuracies for both modalities for tasks CN vsAD (accuracy of O.71 for T1w MRI vs 0.72 for MD from DTI) and CN vs MCI (accu-racy of O.65 for T1w MRI vs 0.68 for MD from DTI) (Ahmed et al., 2017). Given thelarger sample size and proper FS procedure in our work, we believe that the supe-rior performances of T1w MRI over diffusion MRI is reliable and robust. Severalfactors could explain the better performances of T1w MRI. First, it is controversialbut possible that WM degeneration is a secondary degenerative process comparedto brain atrophy (Xie et al., 2006; Agosta et al., 2011). Another possibility is thatADNI diffusion MRI acquisitions used within our study do not make use of thestate-of-the-art methods that impact on image quality. In particular, no fieldmapdata is acquired which leads to suboptimal correction of magnetic susceptibilityartifacts (Wu et al., 2008).
We evaluated the impact of data imbalance on the classification performance. Itis commonly agreed that imbalanced data may adversely impact the classificationperformance as the learned model will be biased towards the majority class to min-imize the overall error rate (Estabrooks, 2000; Japkowicz and Others, 2000; Dubeyet al., 2014). Efforts have been made to deal with imbalanced data, which could begenerally classified as algorithmic level (Akbani, Kwek, and Japkowicz, 2004) anddata level (Dubey et al., 2014). In the current study, for voxel-wise classification,we found that the low accuracies obtained in discriminating pMCI from sMCI orCN are potentially caused by the small sample size, rather than by the imbalanceddata. Interestingly, Dubey et al showed that a balanced data obtained by severaldata resampling techniques gave better results than the imbalanced data usingT1w MRI from ADNI (Dubey et al., 2014). Thus our hypothesis for the limitedsample size needs to be further confirmed as more subjects are becoming avail-able.
In the literature, researchers have emphasized that “double-dipping”, referringto the use of test subjects in any part of the training process, such as non-nested FSin this context, is bad practice and may lead to over-fitted classification (Kriegesko-rte et al., 2009; Rathore et al., 2017). Similarly, in a recent study, Maggipinto et alshowed that the adoption of FS strategies should be taken with care (Maggip-into et al., 2017). They proved that a biased FS, usually a non-nested FS, leadsto over-optimistic results. Unfortunately, many previous studies using diffusionMRI for AD classification adopted the non-nested FS and reported nearly perfectclassification (O’Dwyer et al., 2012; Mesrob et al., 2012; Graña et al., 2011). In thecurrent study, our finding reinforced the message that non-nested FS could resultin over-optimistic results. With the adoption of the non-nested SVM-RFE FS, a

4.7. Discussion 97
nearly perfect performance was achieved. Besides, FA outperformed MD for clas-sification accuracies for this non-nested FS approach. Similar patterns were alsowitnessed in the study of Maggipinto et al (Maggipinto et al., 2017). Replacingthe non-nested FS with the nested one, we obtained considerably inferior perfor-mances. On the other hand, we found that, with SVM-RFE not with ANOVA, thenested FS could potentially (slightly) improve the performance compared to thecase no FS was performed. The difference between ANOVA and SVM-RFE maystem from the fact that ANOVA is performed for each feature (voxel) indepen-dently while GM and WM in contiguous voxels are highly correlated (Mechelliet al., 2005). Interestingly, another study found that, with the adoption of ReliefFalgorithm, FS improved the classification accuracy up to 8% compared to the non-FS for task CN vs AD (Demirhan et al., 2015). However, they did not give enoughdetails concerning their validation scheme. In particular, it is not clear if they useda nested FS (Demirhan et al., 2015).
Visualization of optimal margin hyperplane coefficient maps allowed to studywhich voxels contribute the most to the discrimination. FA, MD and GM-Densityfeatures shared a typical AD anatomical pattern: voxels in hippocampus and tem-poral lobe showed more discriminative ability in the classification. These findingswere consistent with the literature. DTI-based group comparison analyses demon-strated altered FA or MD in the hippocampus (Fellgiebel et al., 2006; Kantarci et al.,2001; Müller et al., 2005; Müller et al., 2007; Hanyu et al., 1998) and in the temporallobe (Hanyu et al., 1998; Fellgiebel et al., 2005; Head et al., 2005; Stahl et al., 2007).Moreover, the OMH coefficient map displayed a diffuse pattern for WM voxels inour work. Similar patterns of WM voxels were also witnessed in the FS procedureusing diffusion MRI (Demirhan et al., 2015; Dyrba et al., 2013).
Our study has the following limitations. First, ADNI diffusion MRI data wasnot acquired using the state-of-the-art methods which leads to suboptimal imagequality. Related works have proven the negative impact of low image quality onMRI analyses (Yendiki et al., 2014; Alexander-Bloch et al., 2016; Reuter et al., 2015).It is thus possible that diffusion MRI acquired using more recent protocols wouldprovide higher classification accuracies. Second, our experiments were performedwith a limited data sample size. The limitation came from the data currently avail-able in ADNI. In a previous study (Samper-González et al., 2018), we have demon-strated that increased training set size led to increased classification performances.Thus, both limitations can result in inferior classification performances. Lastly, ourstudy only explored DTI-based features. With a proper CV and FS, more sophisti-cated features, such as brain tractography- or network-based features, could alsobe studied.

99
Chapter 5
Convolutional Neural Networks forClassification of Alzheimer’s Disease:Overview and ReproducibleEvaluation
This chapter has been submitted as a journal article to Medical Image Analysis:
• Wen, J., Thibeau–Sutre, E., Samper-González., J, Routier, A., Bottani, S., Dur-rleman, S., Burgos, N., Colliot, O. Convolutional Neural Networks for Clas-sification of Alzheimer’s Disease: Overview and Reproducible Evaluation,Submitted to Medical Image Analysis. https://arxiv.org/pdf/1904.07773.pdf.
5.1 Abstract
Early and accurate diagnosis of Alzheimer’s disease (AD) is an important andchallenging task. Numerous studies have proposed to address this challenge us-ing machine learning (ML) from brain imaging data. In particular, in the pasttwo years, over 30 papers have proposed to use convolutional neural network(CNN) for AD classification. However, the classification performances across stud-ies are difficult to compare due to variations in components such as participantselection, image preprocessing or validation procedure. Moreover, these stud-ies are hardly reproducible because their frameworks are not publicly accessibleand because implementation details are lacking. Lastly, some of these papersmay reported biased performances due to inadequate or unclear validation pro-cedure and also it is unclear how the model architecture and parameters werechosen. In the present work, we aim to address these limitations through threemain contributions. First, we performed a systematic literature review of studiesusing CNN for AD classification from anatomical MRI. We identified four main

100
types of approaches:i) 2D slice-level, ii) 3D patch-level, iii) ROI-based and iv) 3Dsubject-level CNN. Moreover, we found that more than half of the surveyed pa-pers may have suffered from data leakage and thus reported biased performances.Our second contribution is an open-source framework for classification of AD us-ing CNN and T1-weighted MRI. The framework comprises: tools to automati-cally convert ADNI, AIBL and OASIS data into the BIDS standard, a modularset of image preprocessing procedures, classification architectures and an evalu-ation framework. Thirdly, we used this framework to rigorously compare dif-ferent CNN architectures, which are representative of the existing literature, andto study the influence of key components on classification performances. Impor-tantly, the data was split into training/validation/test sets at the very beginning.Training/validation sets were used in a CV procedure for model selection. Toavoid any overfitting of the test sets by testing different architectures, hyperpa-rameters or preprocessing, the test sets were left untouched until the end of thepeer-review procedure. We included three test sets: one from ADNI to assessgeneralization to different patients from the same study, one from AIBL for gen-eralization to a different study but with similar imaging protocols and inclusioncriteria, one from OASIS to assess generalization to different protocols and inclu-sion criteria. [Results will be modified after peer-review]. On the validation set,the ROI-based (hippocampus) CNN achieved highest balanced accuracy (0.86 forAD vs CN and 0.80 for sMCI vs pMCI) compared to other approaches. Trans-fer learning with autoencoder pre-training did not improve the average accuracybut reduced the variance. Training using longitudinal data resulted in similaror higher performance, depending on the approach, compared to training withonly baseline data. Sophisticated image preprocessing did not improve the re-sults. Lastly, CNN performed similarly to standard SVM for task AD vs CN butoutperformed SVM for task sMCI vs pMCI, demonstrating the potential of deeplearning for challenging diagnostic tasks. All the code of the framework and theexperiments is publicly available: general-purpose tools have been integrated intothe Clinica software (www.clinica.run) and the paper-specific code is available at:https://gitlab.icm-institute.org/aramislab/AD-ML.
5.2 Introduction
Alzheimer’s disease (AD), a chronic neurodegenerative disease causing the deathof nerve cells and tissue loss throughout the brain, usually starts slowly and wors-ens over time (McKhann et al., 1984). AD is expected to affect 1 out of 85 peo-ple in the world by the year 2050 (Brookmeyer et al., 2007). The cost of caring

5.2. Introduction 101
for AD patients is also expected to raise dramatically, thus the need of individualcomputer-aided systems for early and accurate AD diagnosis.
Magnetic resonance imaging (MRI) offers the possibility to study pathologi-cal brain changes associated with AD in vivo (Ewers et al., 2011). Over the pastdecades, neuroimaging data have been increasingly used to characterize AD bymeans of machine learning (ML) methods, offering promising tools for individ-ualized diagnosis and prognosis (Falahati, Westman, and Simmons, 2014; Haller,Lovblad, and Giannakopoulos, 2011; Rathore et al., 2017). A large number of stud-ies have proposed to use predefined features (including regional and voxel-basedmeasurements) from image preprocessing pipelines followed by different types ofclassifiers, such as support vector machines (SVM) or random forests. Such ap-proach is often referred to as conventional ML (LeCun, Bengio, and Hinton, 2015).More recently, deep learning (DL), as a newly emerging ML methodology, hasmade a big leap in the domain of medical imaging (Bernal et al., 2018; Liu et al.,2018a; Selvikvåg Lundervold and Lundervold, 2018; Razzak, Naz, and Zaib, 2018;Wen et al., 2018a). As the most widely used architecture of DL, convolutional neu-ral network (CNN) has attracted huge attention due to its great success in imageclassification (Krizhevsky, Sutskever, and Hinton, 2012). Contrary to conventionalML, DL allows the automatic abstraction of low-to-high level latent feature repre-sentations (e.g. lines, dots, or edges for low level features, and objects or largershapes for high level features). Thus, one can hypothesize that DL depends lesson image preprocessing and requires less prior on other complex procedures, suchas feature selection, resulting in a more objective and less bias-prone process (Le-Cun, Bengio, and Hinton, 2015).
Very recently, numerous studies have proposed to assist diagnosis of AD bymeans of CNNs (Aderghal et al., 2018; Aderghal, Benois-Pineau, and Afdel, 2017;Aderghal et al., 2017; Bäckström et al., 2018; Basaia et al., 2018; Cheng and Liu,2017; Cheng et al., 2017; Farooq et al., 2017; Gunawardena, Rajapakse, and Kodikara,2017; Hon and Khan, 2017; Hosseini Asl et al., 2018; Islam and Zhang, 2018; Islamand Zhang, 2017; Korolev et al., 2017; Lian et al., 2018; Li, Liu, and Alzheimer’sDisease Neuroimaging Initiative, 2018; Li, Cheng, and Liu, 2017; Lin et al., 2018;Liu et al., 2018c; Liu et al., 2018b; Liu et al., 2018e; Qiu et al., 2018; Senanayake,Sowmya, and Dawes, 2018; Shmulev, Belyaev, and The Alzheimer’s Disease Neu-roimaging Initiative, 2018; Taqi et al., 2018; Valliani and Soni, 2017; Vu et al., 2018;Vu et al., 2017; Wang et al., 2019; Wang et al., 2017; Wang et al., 2018b; Wu et al.,2018). However, classification performances among these studies are not directlycomparable because they differ in terms of: i) sets of participants; ii) image pre-processing procedures, iii) cross-validation (CV) procedure and iv) reported eval-uation metrics. It is thus impossible to determine which approach performs best.

102
The generalization ability of these approaches also remains unclear. In DL, the useof fully independent test sets is even more critical than in conventional ML, be-cause of the very high flexibility with numerous possible model architecture andtraining hyperparameter choices. Assessing generalization to other studies is alsocritical to ensure that the characteristics of the considered study have not beenoverfitted. In previous works, the generalization may be questionable due to: i)inadequate validation procedures, ii) absence of independent test set, or iii) test setchosen from the same study.
In our previous studies (Samper-González et al., 2018; Wen et al., 2018b), wehave proposed an open source framework for reproducible evaluation of AD clas-sification using conventional ML methods. The framework comprises: i) toolsto automatically convert three publicly available datasets into the Brain ImagingData Structure (BIDS) format (Gorgolewski et al., 2016) and ii) a modular set of pre-processing pipelines, feature extraction and classification methods, together withan evaluation framework, that provide a baseline for benchmarking the differentcomponents. We demonstrated the use of this framework on positron emissiontomography (PET), T1-weighted (T1w) MRI (Samper-González et al., 2018) anddiffusion MRI data (Wen et al., 2018b).
In the present work, we extended the framework to DL approaches using CNNs.We first reviewed and summarized the different studies using CNNs and anatom-ical MRI for AD classification. In particular, we reviewed their validation proce-dures and the possible presence of data leakage. Then, different CNN architectureswere implemented in our open source framework. We compared the performanceof these approaches and studied the influence of key components on the classifi-cation performance. The proposed CNNs were also compared to a conventionalML approach based on a linear SVM. Lastly, we assessed the generalization abil-ity of the CNN models within (training and testing on ADNI) and across datasets(training on ADNI and testing on AIBL or OASIS).
All the code of the framework and the experiments is publicly available: general-purpose tools have been integrated into Clinica (Routier et al., 2018), an open-source software platform that we developed to process data from neuroimagingstudies, and the paper-specific code is available at: https://gitlab.icm-institute.org/aramislab/AD-ML.
5.3 State of the art
We performed an online search of publications concerning classification of ADusing neural networks based on anatomical MRI in PubMed and Scopus, fromJanuary 1990 to the 15th of January 2019. This resulted in 406 records which were

5.3. State of the art 103
screened according to their abstract, type and content (more details are providedin online supplementary C eMethod 1) to retain only those focused on the classi-fication of AD stages using at least anatomical MRI as input of a neural network.This resulted in 71 studies. Out of these 71, 32 studies used CNN on image datain an end-to-end framework, which is the focus of our work. We found that a sub-stantial proportion of these studies performed a biased evaluation of results, dueto the presence of data leakage, hence we first discuss the data leakage issues thatwe encountered in our bibliography (Section 3.1). We then review the 32 studiesthat used end-to-end CNNs on image data, the main focus of this work (Section3.2). Finally, we briefly describe other studies that were kept in our bibliographybut that are out of our scope (Section 3.3).
5.3.1 Main causes of data leakage
Unbiased evaluation of classification algorithms is critical to assess their potentialclinical value. A major source of bias is data leakage, which refers to the use of testdata in any part of the training process (Kriegeskorte et al., 2009; Rathore et al.,2017). Data leakage can be difficult to detect for DL approaches as they can becomplex and very flexible. We assessed the prevalence of data leakage among thepapers described in section 3.2 and analyzed its causes. The articles were labeledinto three categories: i) Clear when data leakage was explicitly witnessed; ii) Un-clear when no sufficient explanation was offered and iii) None detected. The resultsare summarized in the last of column of Table 5.1. They were further categorizedaccording to the cause of data leakage. Four main causes were identified:
• Bad data split. Not splitting the dataset at the subject-level when definingthe training, validation and test sets can result in data from the same subjectto appear in several sets. This problem can occur when patches or slices areextracted from a 3D image, or when images of the same subject are availableat multiple time points. (Bäckström et al., 2018) showed that, using a lon-gitudinal dataset, a biased dataset split (at the image level) can result in anaccuracy increase of 8 percent points compared to an unbiased split (at thesubject-level).
• Late split. Procedures such as data augmentation, feature selection or AEpre-training must never use the test set and thus be performed after thetraining/validation/test split to avoid biasing the results. For example, ifdata augmentation is performed before isolating the test data from the train-ing/validation data, then images generated from the same original imagemay be found in both sets, leading to a problem similar to the wrong datasplit.

104
• Biased transfer learning. Transfer learning can result in data leakage whenthe source and target domains overlap, for example when a network pre-trained on the AD vs CN task is used to initialize a network for the MCIvs CN task and that the CN subjects in the training or validation sets of thesource task (AD vs CN) are also in the test set of the target task (MCI vs CN).
• Absence of an independent test set. The test set should only be used toevaluate the final performance of the classifier, not to chose the training hy-perparameters (e.g. learning rate) of the model. A separate validation setmust be used beforehand for hyperparameter optimization.
Note that we did not consider data leakage occurring when designing the net-work architecture, possibly chosen thanks to successive evaluations on the test set,as the large majority of the studies does not explicit this step.
All these data leakage causes may not have the same impact on data perfor-mance. For instance, it is likely that a wrong data split in a longitudinal dataset orat the slice-level is more damaging than a late split for AE pre-training.
5.3.2 Classification of AD with end-to-end CNNs
This section focuses on CNNs applied to an Euclidean space (here a 2D or 3Dimage) in an end-to-end framework (from the input to the classification). A sum-mary of these studies can be found in Table 5.1. The table indicates whether dataleakage was potentially present, which can have biased the performance upwards.Below, we categorized studies according to the type of input of the network: i) 2Dslice-level, ii) 3D patch-level, iii) ROI-based and iv) 3D subject-level.
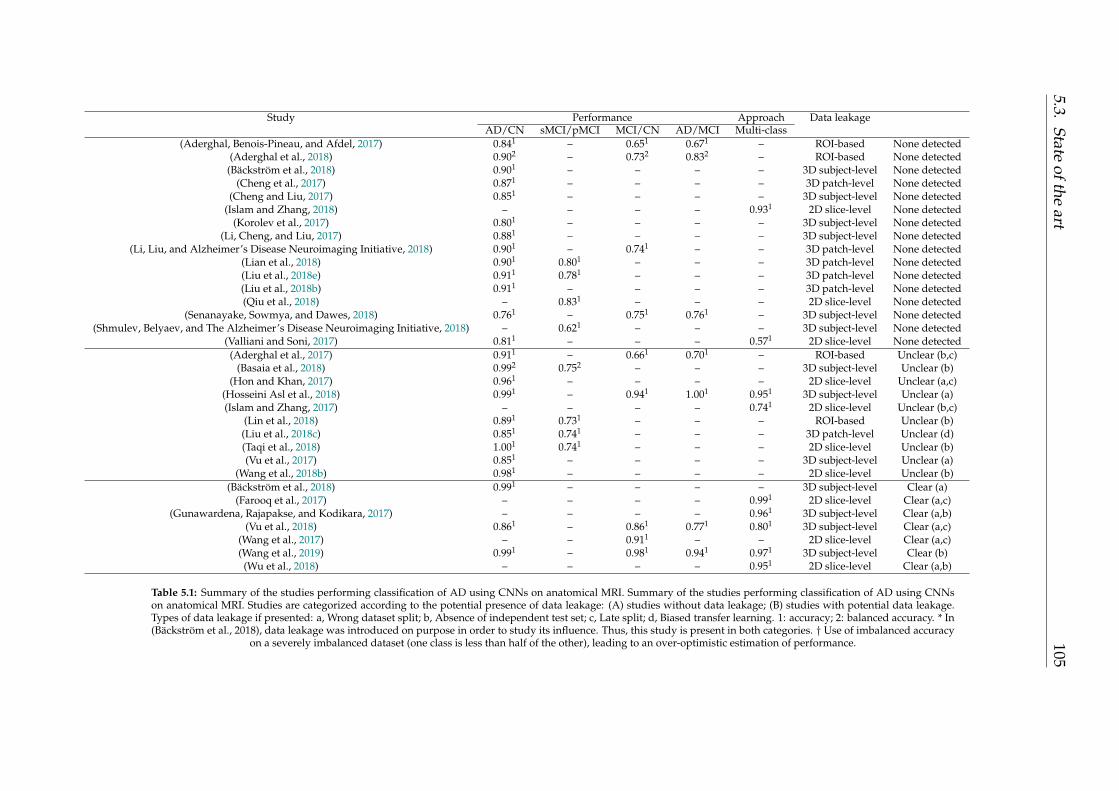
5.3.State
oftheart
105
Study Performance Approach Data leakageAD/CN sMCI/pMCI MCI/CN AD/MCI Multi-class
(Aderghal, Benois-Pineau, and Afdel, 2017) 0.841 – 0.651 0.671 – ROI-based None detected(Aderghal et al., 2018) 0.902 – 0.732 0.832 – ROI-based None detected
(Bäckström et al., 2018) 0.901 – – – – 3D subject-level None detected(Cheng et al., 2017) 0.871 – – – – 3D patch-level None detected
(Cheng and Liu, 2017) 0.851 – – – – 3D subject-level None detected(Islam and Zhang, 2018) – – – – 0.931 2D slice-level None detected
(Korolev et al., 2017) 0.801 – – – – 3D subject-level None detected(Li, Cheng, and Liu, 2017) 0.881 – – – – 3D subject-level None detected
(Li, Liu, and Alzheimer’s Disease Neuroimaging Initiative, 2018) 0.901 – 0.741 – – 3D patch-level None detected(Lian et al., 2018) 0.901 0.801 – – – 3D patch-level None detected(Liu et al., 2018e) 0.911 0.781 – – – 3D patch-level None detected(Liu et al., 2018b) 0.911 – – – – 3D patch-level None detected(Qiu et al., 2018) – 0.831 – – – 2D slice-level None detected
(Senanayake, Sowmya, and Dawes, 2018) 0.761 – 0.751 0.761 – 3D subject-level None detected(Shmulev, Belyaev, and The Alzheimer’s Disease Neuroimaging Initiative, 2018) – 0.621 – – – 3D subject-level None detected
(Valliani and Soni, 2017) 0.811 – – – 0.571 2D slice-level None detected(Aderghal et al., 2017) 0.911 – 0.661 0.701 – ROI-based Unclear (b,c)
(Basaia et al., 2018) 0.992 0.752 – – – 3D subject-level Unclear (b)(Hon and Khan, 2017) 0.961 – – – – 2D slice-level Unclear (a,c)
(Hosseini Asl et al., 2018) 0.991 – 0.941 1.001 0.951 3D subject-level Unclear (a)(Islam and Zhang, 2017) – – – – 0.741 2D slice-level Unclear (b,c)
(Lin et al., 2018) 0.891 0.731 – – – ROI-based Unclear (b)(Liu et al., 2018c) 0.851 0.741 – – – 3D patch-level Unclear (d)(Taqi et al., 2018) 1.001 0.741 – – – 2D slice-level Unclear (b)(Vu et al., 2017) 0.851 – – – – 3D subject-level Unclear (a)
(Wang et al., 2018b) 0.981 – – – – 2D slice-level Unclear (b)(Bäckström et al., 2018) 0.991 – – – – 3D subject-level Clear (a)
(Farooq et al., 2017) – – – – 0.991 2D slice-level Clear (a,c)(Gunawardena, Rajapakse, and Kodikara, 2017) – – – – 0.961 3D subject-level Clear (a,b)
(Vu et al., 2018) 0.861 – 0.861 0.771 0.801 3D subject-level Clear (a,c)(Wang et al., 2017) – – 0.911 – – 2D slice-level Clear (a,c)(Wang et al., 2019) 0.991 – 0.981 0.941 0.971 3D subject-level Clear (b)(Wu et al., 2018) – – – – 0.951 2D slice-level Clear (a,b)
Table 5.1: Summary of the studies performing classification of AD using CNNs on anatomical MRI. Summary of the studies performing classification of AD using CNNson anatomical MRI. Studies are categorized according to the potential presence of data leakage: (A) studies without data leakage; (B) studies with potential data leakage.Types of data leakage if presented: a, Wrong dataset split; b, Absence of independent test set; c, Late split; d, Biased transfer learning. 1: accuracy; 2: balanced accuracy. * In(Bäckström et al., 2018), data leakage was introduced on purpose in order to study its influence. Thus, this study is present in both categories. † Use of imbalanced accuracy
on a severely imbalanced dataset (one class is less than half of the other), leading to an over-optimistic estimation of performance.

106
5.3.2.1 2D slice-level CNN
Several studies used 2D CNNs with input composed of the set of 2D slices ex-tracted from the MRI 3D volume (Farooq et al., 2017; Gunawardena, Rajapakse,and Kodikara, 2017; Hon and Khan, 2017; Islam and Zhang, 2018; Islam andZhang, 2017; Qiu et al., 2018; Taqi et al., 2018; Valliani and Soni, 2017; Wang et al.,2017; Wang et al., 2018b; Wu et al., 2018). The main advantages of this approachare: i) existing CNNs which had huge successes for natural image classificationtasks (e.g. ResNet and VGGNet) can be easily borrowed and used in a transferlearning fashion; ii) the number of training samples is the number of slices, thuspotentially much larger than the number of subjects.
In this subsection of the bibliography, we found only one study in which nei-ther data leakage was detected neither biased metrics were used (Valliani and Soni,2017). They used a single axial slice per subject (taken in the middle of the 3Dvolume) to compare the ResNet to an original CNN with only one convolutionallayer and two FC layers. They studied the impact of both transfer learning by ini-tializing their networks with models trained on ImageNet, and data augmentationwith affine transformations. They conclude that the ResNet architecture is moreefficient than their baseline CNN and that pre-training and data augmentation im-prove the accuracy of the ResNet architecture.
In all other studies, we detected a problem in the evaluation: either data leak-age was present (or at least suspected) (Farooq et al., 2017; Gunawardena, Ra-japakse, and Kodikara, 2017; Hon and Khan, 2017; Islam and Zhang, 2017; Taqiet al., 2018; Wang et al., 2017; Wang et al., 2018b; Wu et al., 2018) or they used animbalanced metric on a severely imbalanced dataset (one class is less than half ofthe other) (Islam and Zhang, 2018; Qiu et al., 2018). Causes of data leakage aredescribed in 3.1 section. Theses studies differ in terms of slice selection: i) onestudy used all slices of a given plane (except the very first and last ones that arenot informative) (Farooq et al., 2017); ii) other studies selected several slices usingan automatic (Hon and Khan, 2017; Wu et al., 2018) or manual criterion (Qiu et al.,2018); iii) one study used only one slice (Wang et al., 2018b). Working with severalslices implies to fuse the classifications obtained at the slice-level to obtain a clas-sification at the subject-level. Only one study (Qiu et al., 2018) explained how theyperformed this fusion. Other studies didn’t implement fusion and reported theslice-level accuracy (Farooq et al., 2017; Gunawardena, Rajapakse, and Kodikara,2017; Hon and Khan, 2017; Wang et al., 2017; Wu et al., 2018) or it is unclear if theaccuracy was computed at the slice- or subject-level (Islam and Zhang, 2018; Islamand Zhang, 2017; Taqi et al., 2018).
The main limitation of the 2D slice-level approach is that MRI is 3-dimensional,whereas the 2D convolutional filters analyze all slices of a subject independently.

5.3. State of the art 107
Moreover, there are many different ways to select slices that are used as input(as all of them may not be informative) and slice-level accuracy and subject-levelaccuracy are often confused.
5.3.2.2 3D patch-level CNN
To compensate for the absence of 3D information in the 2D slice-level approach,more studies focused on the 3D patch-level classification (see Table 5.1). In theseframeworks, the input is composed of a set of 3D patches extracted from an image.In principle, this could results, as in the 2D slice-level approach, in a larger sam-ple size, since the number of samples would be the number of patches (and notthe number of subjects). However, this potential advantage is not used in the sur-veyed papers because they trained independent CNNs for each patch. Additionaladvantages of patches are the lower memory usage which may be useful when onehas limited resources and the lower number of learnt parameters. However, thislast advantage is present only when one uses the same network for all patches.
Two studies (Cheng et al., 2017; Liu et al., 2018c) used very large patches.Specifically, they extracted 27 overlapping 3D patches of size 50x41x40 voxels cov-ering the whole volume of the MRI data (100x81x80 voxels). They individuallytrained 27 convolutional networks (one per patch) comprising four convolutionallayers and two FC layers. Then, an ensemble CNN was trained to provide a deci-sion at the subject level. This ensemble CNN is partly initialized with the weightsof the previously trained CNNs. (Liu et al., 2018c) reused exactly the same archi-tecture than (Cheng et al., 2017) and enriched it with a fusion of PET and MRIinputs. They also gave the results obtained using the MRI modality only, which isthe result reported in Table 5.1.
(Li, Liu, and Alzheimer’s Disease Neuroimaging Initiative, 2018) used smallerpatches (32x32x32). By decreasing the size of the patches, they had to take intoaccount a possible discrepancy between patches taken at the same coordinates fordifferent subjects. To avoid this dissimilarity between subjects without performinga non-linear registration, they clustered their patches using k-means. Then theytrained one CNN per cluster, and assembled the features obtained at the cluster-level in a similar way than (Cheng et al., 2017; Liu et al., 2018c).
The following three studies (Lian et al., 2018; Liu et al., 2018e; Liu et al., 2018b)decided to use even smaller patches (19x19x19). Nevertheless, they did not use allpossible patches from the MRI data but chose only some of them based on anatom-ical landmarks. These anatomical landmarks are found in a supervised manner viaa group comparison between AD and CN subjects. However, this method requiresa non-linear registration in order to build the correspondence between voxels ofdifferent subjects. Similarly to other studies, in (Liu et al., 2018b), one CNN is

108
pre-trained for each patch and the outputs are fused to obtain the diagnosis of asubject. The approach of (Liu et al., 2018e) is slightly different as they consider thatone patch cannot be labelled with a diagnosis, hence they do not train one CNNper patch individually before ensemble learning but train the ensemble networkfrom scratch. Finally (Lian et al., 2018) proposed a weakly-supervised guidance:the loss of the network is based on the final classification scores at the subject-levelas well as the intermediate classification done on the patch- and region-level.
There are far less data leakage problems in this section, with only one doubt onthe validity of the transfer learning between the AD vs CN task and the MCI vsCN task in (Liu et al., 2018c) because of a lack of explanations. Nevertheless thishas no impact on the result of the AD vs CN task for which we didn’t detect anyproblem of data leakage.
As for 2D-slice level in which a selection of slices must be made, one mustchoose the size and stride of patches. The choice of these hyperparameters willdepend on the MRI preprocessing (e.g. a non-linear registration is likely neededfor smaller patches). Nevertheless, note that the impact of these hyperparametershas been studied in the pre-cited studies (which has not been done for the 2D slice-level approaches). The main drawback of these approaches is the complexity of theframework: one network is trained for each patch position and these networks aresuccessively fused and retrained at different levels of representation (region-level,subject-level).
5.3.2.3 ROI-based CNN
3D patch-level methods use the whole MRI by slicing it in smaller inputs. How-ever, most of these patches are not informative as they contain parts of the brainthat are not affected by the disease. Methods based on regions of interest (ROI)overcome this issue by focusing on regions which are known to be informative. Inthis way, the complexity of the framework can be decreased as fewer inputs areused to train the networks. In all the following studies, the ROI chosen was thehippocampus, which is well-known to be affected early in AD (Dickerson et al.,2001; Salvatore et al., 2015; Schuff et al., 2009). Studies differ by the definition ofthe hippocampal ROI.
(Aderghal, Benois-Pineau, and Afdel, 2017; Aderghal et al., 2017; Aderghal etal., 2018) performed a linear registration and defined a 3D bounding box compris-ing all the voxels of the hippocampus according to a segmentation with the AALatlas. As they use only one or three patches (based on hippocampus) per patient,they do not cover the entire region. The first study (Aderghal, Benois-Pineau, andAfdel, 2017) only uses the sagittal view and classifies one patch per patient. Thearchitecture of the CNN is made of two convolutional layers associated with max

5.3. State of the art 109
pooling, and one FC layer. In the second study (Aderghal et al., 2017), all the views(sagittal, coronal and axial) are used to generate patches. Then, three patches aregenerated per subject and accordingly three networks are trained for each viewand then fused. The last study of the same author (Aderghal et al., 2018) focuseson the transfer learning from anatomical MRI to diffusion MRI, which is out of ourscope.
In (Lin et al., 2018) a non-linear registration was performed to obtain a voxelcorrespondence between the subjects, and the voxels belonging to the hippocam-pus were identified after a segmentation implemented with MALP-EM (Ledig etal., 2015). 151 patches were extracted per image with sampling positions fixed dur-ing experiments. Each of them was made of the concatenation of three 2D slicesalong the three possible planes (sagittal, coronal and axial) originated at one voxelbelonging to the hippocampus.
The main drawback of this methodology is that it studies only one (or a few) re-gions while AD alterations span over multiple brain areas. However, it may allowto avoid overfitting because the inputs are smaller ( 3000 voxels in our bibliogra-phy) and fewer than in methods allowing patch combinations.
5.3.2.4 3D subject-level CNN
Recently, with the boost of high-performance computing resources, more studiesused a 3D subject-level approach (see Table 5.1). In this approach, the whole MRI isused at once and the classification is performed at the subject level. The advantageis that the spatial information is fully integrated.
Some studies readapted two classical architectures to fit the whole MRI: theResNet and VGGNet (Korolev et al., 2017; Shmulev, Belyaev, and The Alzheimer’sDisease Neuroimaging Initiative, 2018). In both cases, results obtained on VGGand ResNet are equivalent, and their best results are below those of other studiesof the same section. Another study (Senanayake, Sowmya, and Dawes, 2018) pro-posed to use a set of complex modules from classical architectures such as ResNetand DenseNet (dilated convolutions, dense blocks and residual blocks), also with-out success.
Other studies defined original architectures (Bäckström et al., 2018; Basaia etal., 2018; Cheng and Liu, 2017; Hosseini Asl et al., 2018; Li, Cheng, and Liu, 2017;Vu et al., 2018; Wang et al., 2019). Among these, we did not detect data leakagein only three of them (Bäckström et al., 2018; Cheng and Liu, 2017; Li, Cheng, andLiu, 2017). (Bäckström et al., 2018; Cheng and Liu, 2017) had a similar approachby training one network from scratch on augmented data. One crucial differencebetween these two studies is the preprocessing step: (Bäckström et al., 2018) used anon-linear registration whereas (Cheng and Liu, 2017) performed no registration.

110
(Li, Cheng, and Liu, 2017) proposed a more complex framework fusing the resultsof a CNN and three networks pre-trained with an AE.
For the other studies using original architectures, we suspect data leakage (Bäck-ström et al., 2018; Basaia et al., 2018; Hosseini Asl et al., 2018; Vu et al., 2017; Vuet al., 2018; Wang et al., 2019), hence their performance cannot be fairly comparedto the previous ones. However we noted that (Hosseini Asl et al., 2018; Vu et al.,2017; Vu et al., 2018) studied the impact of pre-training with an AE, and concludedthat it improved their results (accuracy increased from 5 to 10 percent points).
In 3D-subject level approach the number of samples is small compared to thenumber of parameters to optimize. Indeed, there is one sample per subject, typi-cally a few hundreds to thousands subjects in a dataset, thus increasing the risk ofoverfitting.
5.3.2.5 Conclusion
A high number of these 32 studies presented biased performance because of dataleakage: 10 were labeled as Unclear because of lack of explanations, and 6 as Clearin which we assert the presence of data leakage (we do not count here the study ofBackstrom et al (Bäckström et al., 2018) as data leakage was done deliberately tostudy its impact). This means that about 50% of the surveyed studies could reportbiased performances (see Table 1 and Section 3.1 for more details).
In addition to that problem, most studies are not comparable because the datasetsused, subjects selected among them and preprocessing performed are different.Furthermore, these studies often do not motivate the choice of their architectureor hyperparameters. It might be that many of them have been tried (but not re-ported) thereby resulting in biased performances on the test set. Finally, the codeis often not available, neither are key implementation details (such as hyperpa-rameters values) making them difficult if not impossible to reproduce.
5.3.3 Other deep learning approaches for AD classification
Several studies found in our literature search are out of our scope: either CNNswere not used in an end-to-end manner or not applied to images, or other net-work architectures were implemented, or the approach required longitudinal ormultimodal data.
In several studies, the CNN is used as a feature extractor only and the clas-sification is performed using either a random forest (Chaddad, Desrosiers, andNiazi, 2018), SVM with linear or polynomial kernels and logistic regression (Çitak-ER, Goularas, and Ormeci, 2017), extreme ML (Lin et al., 2018), SVM with differ-ent kernels (Shen et al., 2018), or logistic regression and XGBoost (decision trees)
5.3. State of the art 111
(Shmulev, Belyaev, and The Alzheimer’s Disease Neuroimaging Initiative, 2018).Only Shmulev et al compared the results obtained with the CNN classification andthose obtained with other classifiers based on features extracted by the CNN andconcluded that the latter is more efficient. Instead of being directly applied to theimage, CNNs can be applied to pre-extracted features. This is the case of (Suket al., 2017) where the CNN is applied to the outputs of several regression modelsperformed between MRI-based features and clinical scores with different hyper-parameters. CNNs can also be applied to non-Euclidean spaces, such as graphs ofpatients (Parisot et al., 2018) or the cortical surface (Mostapha et al., 2018).
Other architectures have been applied to anatomical MRI. Many studies useda variant of the multilayer perceptron composed of stacked FC layers (Amoroso etal., 2018; Baskar, Jayanthi, and Jayanthi, 2018; Cárdenas-Peña, Collazos-Huertas,and Castellanos-Dominguez, 2017; Cárdenas-Peña, Collazos-Huertas, and Castellanos-Dominguez, 2016; Dolph et al., 2017; Gorji and Haddadnia, 2015; Gutiérrez-Beckerand Wachinger, 2018; Jha, Kim, and Kwon, 2017; Lu et al., 2018; Mahanand et al.,2012; Maitra and Chatterjee, 2006; Ning et al., 2018; Raut and Dalal, 2017; Shams-Baboli and Ezoji, 2017; Zhang et al., 2018; Zhou et al., 2019) or of a probabilisticneural network (Duraisamy, Shanmugam, and Annamalai, 2019; Mathew, Vivek,and Anurenjan, 2018). In other studies, high-level representations of the featuresare extracted using both unsupervised (deep Boltzmann machine (Suk, Lee, andShen, 2014) and AE (Suk, Lee, and Shen, 2015)) and supervised structures (deeppolynomial networks (Shi et al., 2018)), and an SVM is used for classification. Non-CNNs architectures require extensive preprocessing as they have to be applied toimaging features such as cortical thickness, shapes, or texture and regional fea-tures. Moreover, feature selection or embedding is also often required (Amorosoet al., 2018; Dolph et al., 2017; Jha, Kim, and Kwon, 2017; Lu et al., 2018; Mahanandet al., 2012; Mathew, Vivek, and Anurenjan, 2018; Suk, Lee, and Shen, 2015; Suk,Lee, and Shen, 2014) to further reduce dimensionality.
DL-based classification approaches are not limited to cross-sectional anatom-ical MRI. Longitudinal studies exploit information extracted from several timepoints of the same subject. A specific structure, the recurrent neural network, hasbeen used to study the temporal correlation between the images (Bhagwat et al.,2018; Cui, Liu, and Li, 2018; Wang et al., 2018c). Several studies exploit multi-modal data (Aderghal et al., 2018; Cheng and Liu, 2017; Esmaeilzadeh et al., 2018;Li et al., 2015; Liu et al., 2016; Liu et al., 2015; Liu et al., 2018c; Liu et al., 2018d; Lu etal., 2018; Ning et al., 2018; Ortiz et al., 2016; Qiu et al., 2018; Raut and Dalal, 2017;Senanayake, Sowmya, and Dawes, 2018; Shi et al., 2018; Shmulev, Belyaev, andThe Alzheimer’s Disease Neuroimaging Initiative, 2018; Spasov et al., 2018; Suk,Lee, and Shen, 2014; Thung, Yap, and Shen, 2017; Vu et al., 2017; Vu et al., 2018;

112
Zhou et al., 2019; Zhou et al., 2017), such as multiple imaging modalities (positronemission tomography and diffusion tensor imaging), demographic data, genetics,clinical scores, or cerebrospinal fluid biomarkers. Note that multimodal studiesthat also reported results with MRI only (Aderghal et al., 2018; Cheng and Liu,2017; Liu et al., 2018c; Qiu et al., 2018; Senanayake, Sowmya, and Dawes, 2018;Shmulev, Belyaev, and The Alzheimer’s Disease Neuroimaging Initiative, 2018;Vu et al., 2017; Vu et al., 2018) are displayed in Table 5.1. Exploiting multiple time-points and/or modalities is expected to improve the classification performance.However, these studies can be limited by the small number subjects having all therequired time points and modalities.
5.4 Materials
The data used in our study are from three public datasets: ADNI AIBL and OASIS.Information about these datasets is presented in supplementary C eMethod 2. Weused the T1w MRI available in each of these studies. For the detailed MRI proto-cols, one can see (Samper-González et al., 2018). This also describes which T1 MRIwas chosen in case where multiple images for a given visit exist.
The ADNI dataset used in our experiments comprises 1455 participants forwhom a T1w MR image was available at at least one visit. For each ADNI subset,five diagnosis groups were considered:
• CN: sessions of subjects who were diagnosed as CN at baseline and stayedstable during the follow-up;
• AD: sessions of subjects who were diagnosed as AD at baseline and stayedstable during the follow-up;
• MCI: sessions of subjects who were diagnosed as MCI, EMCI or LMCI atbaseline, who did not encounter multiple reversions and conversions andwho did not regress to CN diagnosis;
• pMCI: sessions of subjects who were diagnosed as MCI, EMCI or LMCI atbaseline, and progressed to AD between the current visit and the visit at 36months;
• sMCI: sessions of subjects who were diagnosed as MCI, EMCI or LMCI atbaseline, never progressed to AD months and were followed at least 36 monthsafter the current visit.
Naturally, all sessions of the pMCI and sMCI groups are included in the MCIgroup. Note that the reverse is false, as some MCI subjects did not convert to

5.4. Materials 113
AD but were not followed long enough to state whether they were sMCI. More-over, for 30 sessions, the preprocessing did not pass the quality check (QC) (seethe Method section) and these data were removed from our dataset. 2 subjectswere entirely removed because the preprocessing failed for all their sessions. Ta-ble ?? summarizes the demographics, and the MMSE and global CDR scores of theADNI participants.
Table 5.2 summarizes the demographics, and the MMSE and global CDR scoresof the participants in this study.
Subjects Sessions Age Gender MMSE CDR
CN 330 1830 74.4 ± 5.8[59.8,89.6] 160M/170F 29.1 ± 1.1[24,30] 0:330MCI 787 3458 73.3 ± 7.5[54.4,91.4] 464M/323F 27.5 ± 1.8[23,30] 0:2;0.5:785sMCI 298 1046 72.3 ± 7.4[55.0,88.4] 175M/123F 28.0 ± 1.7[23,30] 0.5:298pMCI 295 865 73.8 ± 6.9[55.1,88.3] 176M/119F 26.9 ± 1.7[23,30] 0.5:293;1:2AD 336 1106 75.0 ± 7.8[55.1,90.9] 185M/151F 23.2 ± 2.1[18,27] 0.5:160;1:175; 2:1
Table 5.2: Summary of participant demographics, mini-mental stateexamination (MMSE) and global clinical dementia rating (CDR)scores for ADNI. Values are presented as mean ± SD [range]. M:
male, F: female
The AIBL dataset considered in this work is composed of 598 participants forwhom a T1w MR image and an age value was available at at least one visit. Thecriteria used to create the diagnosis groups are identical to the ones used for ADNI.Table 5.3 summarizes the demographics, and the MMSE and global CDR scores ofthe AIBL participants. After the preprocessing pipeline, 7 sessions were removedwithout changing the number of subjects.
N Age Gender MMSE CDR
CN 429 72.5 ± 6.2[60,92] 183M/246F 28.8 ± 1.2[25,30] 0:406;0.5:22;1:1MCI 93 75.4 ± 6.9[60,96] 50M/43F 27.0 ± 2.1[20,30] 0:6;0.5:86;1:1sMCI 13 76.7 ± 6.5[64,87] 8M/5F 28.2 ± 1.5[26,30] 0.5:13pMCI 20 78.1 ± 6.6[63,79] 10M/10F 26.7 ± 2.1[22,30] 0.5:20AD 76 73.9 ± 8.0[55,93] 33M/43F 20.6 ± 5.5[6,29] 0.5:31;1:36;2:7;3:2
Table 5.3: Summary of participant demographics, mini-mental stateexamination (MMSE) and global clinical dementia rating (CDR)scores for AIBL. Values are presented as mean ± SD [range]. M: male,
F: female
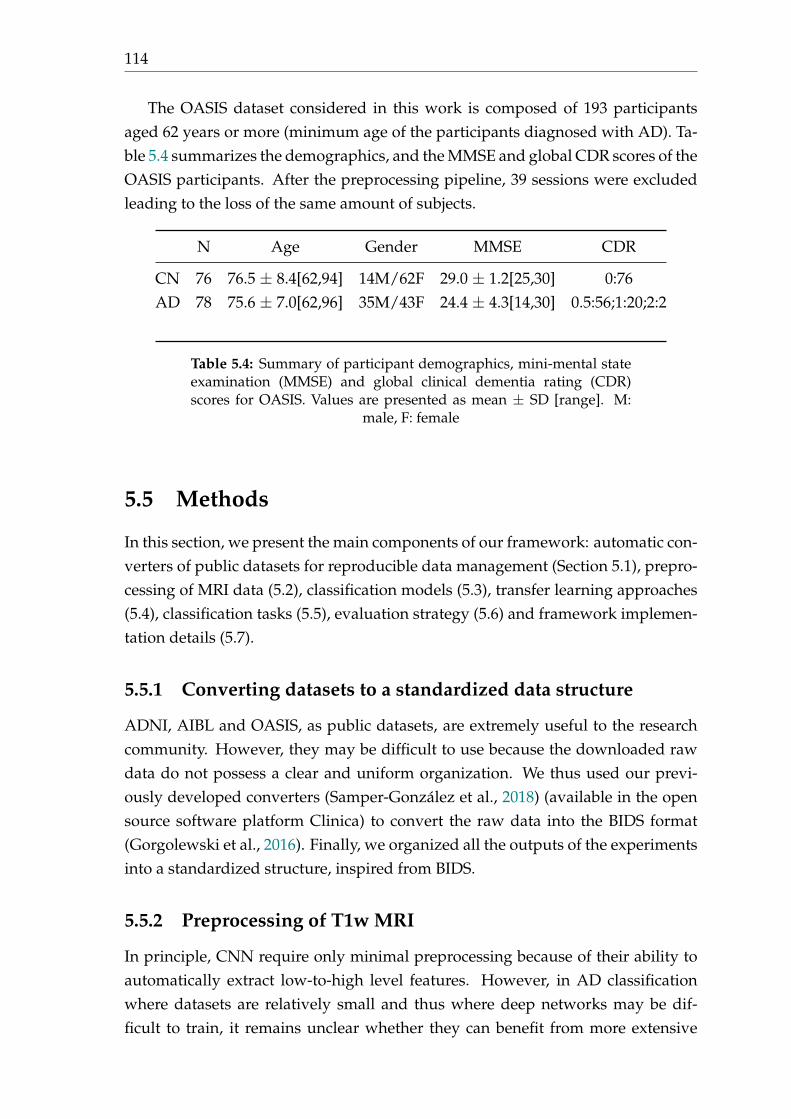
114
The OASIS dataset considered in this work is composed of 193 participantsaged 62 years or more (minimum age of the participants diagnosed with AD). Ta-ble 5.4 summarizes the demographics, and the MMSE and global CDR scores of theOASIS participants. After the preprocessing pipeline, 39 sessions were excludedleading to the loss of the same amount of subjects.
N Age Gender MMSE CDR
CN 76 76.5 ± 8.4[62,94] 14M/62F 29.0 ± 1.2[25,30] 0:76AD 78 75.6 ± 7.0[62,96] 35M/43F 24.4 ± 4.3[14,30] 0.5:56;1:20;2:2
Table 5.4: Summary of participant demographics, mini-mental stateexamination (MMSE) and global clinical dementia rating (CDR)scores for OASIS. Values are presented as mean ± SD [range]. M:
male, F: female
5.5 Methods
In this section, we present the main components of our framework: automatic con-verters of public datasets for reproducible data management (Section 5.1), prepro-cessing of MRI data (5.2), classification models (5.3), transfer learning approaches(5.4), classification tasks (5.5), evaluation strategy (5.6) and framework implemen-tation details (5.7).
5.5.1 Converting datasets to a standardized data structure
ADNI, AIBL and OASIS, as public datasets, are extremely useful to the researchcommunity. However, they may be difficult to use because the downloaded rawdata do not possess a clear and uniform organization. We thus used our previ-ously developed converters (Samper-González et al., 2018) (available in the opensource software platform Clinica) to convert the raw data into the BIDS format(Gorgolewski et al., 2016). Finally, we organized all the outputs of the experimentsinto a standardized structure, inspired from BIDS.
5.5.2 Preprocessing of T1w MRI
In principle, CNN require only minimal preprocessing because of their ability toautomatically extract low-to-high level features. However, in AD classificationwhere datasets are relatively small and thus where deep networks may be dif-ficult to train, it remains unclear whether they can benefit from more extensive
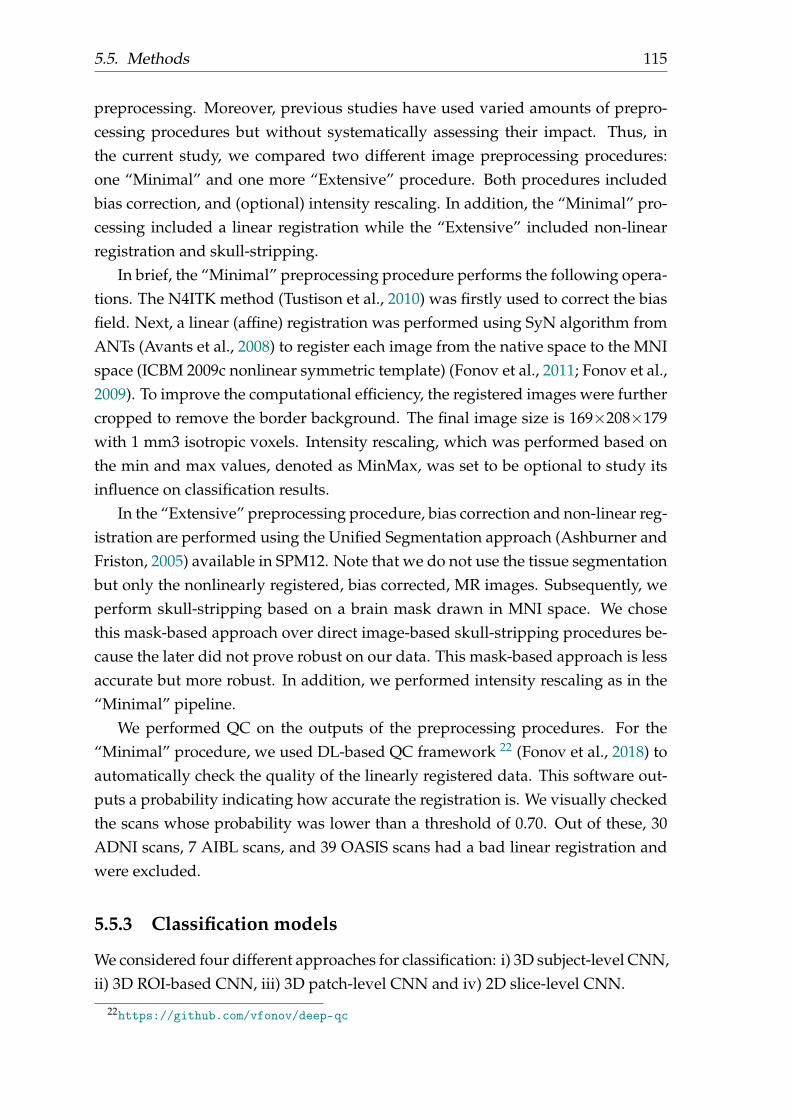
5.5. Methods 115
preprocessing. Moreover, previous studies have used varied amounts of prepro-cessing procedures but without systematically assessing their impact. Thus, inthe current study, we compared two different image preprocessing procedures:one “Minimal” and one more “Extensive” procedure. Both procedures includedbias correction, and (optional) intensity rescaling. In addition, the “Minimal” pro-cessing included a linear registration while the “Extensive” included non-linearregistration and skull-stripping.
In brief, the “Minimal” preprocessing procedure performs the following opera-tions. The N4ITK method (Tustison et al., 2010) was firstly used to correct the biasfield. Next, a linear (affine) registration was performed using SyN algorithm fromANTs (Avants et al., 2008) to register each image from the native space to the MNIspace (ICBM 2009c nonlinear symmetric template) (Fonov et al., 2011; Fonov et al.,2009). To improve the computational efficiency, the registered images were furthercropped to remove the border background. The final image size is 169⇥208⇥179with 1 mm3 isotropic voxels. Intensity rescaling, which was performed based onthe min and max values, denoted as MinMax, was set to be optional to study itsinfluence on classification results.
In the “Extensive” preprocessing procedure, bias correction and non-linear reg-istration are performed using the Unified Segmentation approach (Ashburner andFriston, 2005) available in SPM12. Note that we do not use the tissue segmentationbut only the nonlinearly registered, bias corrected, MR images. Subsequently, weperform skull-stripping based on a brain mask drawn in MNI space. We chosethis mask-based approach over direct image-based skull-stripping procedures be-cause the later did not prove robust on our data. This mask-based approach is lessaccurate but more robust. In addition, we performed intensity rescaling as in the“Minimal” pipeline.
We performed QC on the outputs of the preprocessing procedures. For the“Minimal” procedure, we used DL-based QC framework 22 (Fonov et al., 2018) toautomatically check the quality of the linearly registered data. This software out-puts a probability indicating how accurate the registration is. We visually checkedthe scans whose probability was lower than a threshold of 0.70. Out of these, 30ADNI scans, 7 AIBL scans, and 39 OASIS scans had a bad linear registration andwere excluded.
5.5.3 Classification models
We considered four different approaches for classification: i) 3D subject-level CNN,ii) 3D ROI-based CNN, iii) 3D patch-level CNN and iv) 2D slice-level CNN.
22https://github.com/vfonov/deep-qc

116
In the case of DL, one challenge is to find the “optimal” model (i.e. global min-ima), including the architecture hyperparameters (e.g. number of layers, dropout,batch normalization) and the training hyperparameters (e.g. learning rate, weightdecay).
We first reviewed the architectures used in the literature among the studies inwhich no data leakage problem was witnessed (Table 1A). There was no consensusin the litterature, thus we used the following heuristic strategy for the each of thefour approaches.
For the 3D subject-level approach, we began with an overfitting model that wasvery heavy because of the high number of FC layers (4 convolutional blocks + 5FC layers). Then, we iteratively repeated the following operations:
• the number of FC layers was decreased until accuracy on the validation setdecreased substantially;
• we added one more convolutional block.
In this way, we explored the architecture space from 4 convolutional blocks + 5FC layers to 7 convolutional blocks + 2 FC layers. Among the best performingarchitectures, we chose the shallowest one: 5 convolutional blocks + 3 FC layers.
As the performance was very similar for the different architectures tested withthe 3D subject-level approach and as this search method is time costly, it was notused for the 3D patch-level approach for which only four different architectureswere tested:
• 4 convolutional blocks + 2 FC layers;
• 4 convolutional blocks + 1 FC layer;
• 7 convolutional blocks + 2 FC layers;
• 7 convolutional blocks + 1 FC layer.
The best architecture (4 convolutional blocks + 2 FC layers) was kept and used bothin 3D patch-level and ROI-based approaches. Note that the other architectureswere only slightly worse.
For these 3 approaches, other architecture hyperparameters were explored:with or without batch normalization, with or without dropout.
For the 2D slice-level approach, we chose to use a classical architecture, theResNet-18 with FC layers added at the end of the network. We explored from 1 to3 added FC layers and the best results were obtained with one. We then exploredthe number of layers to fine-tune (2 FC layers or the last residual block + 2 FC
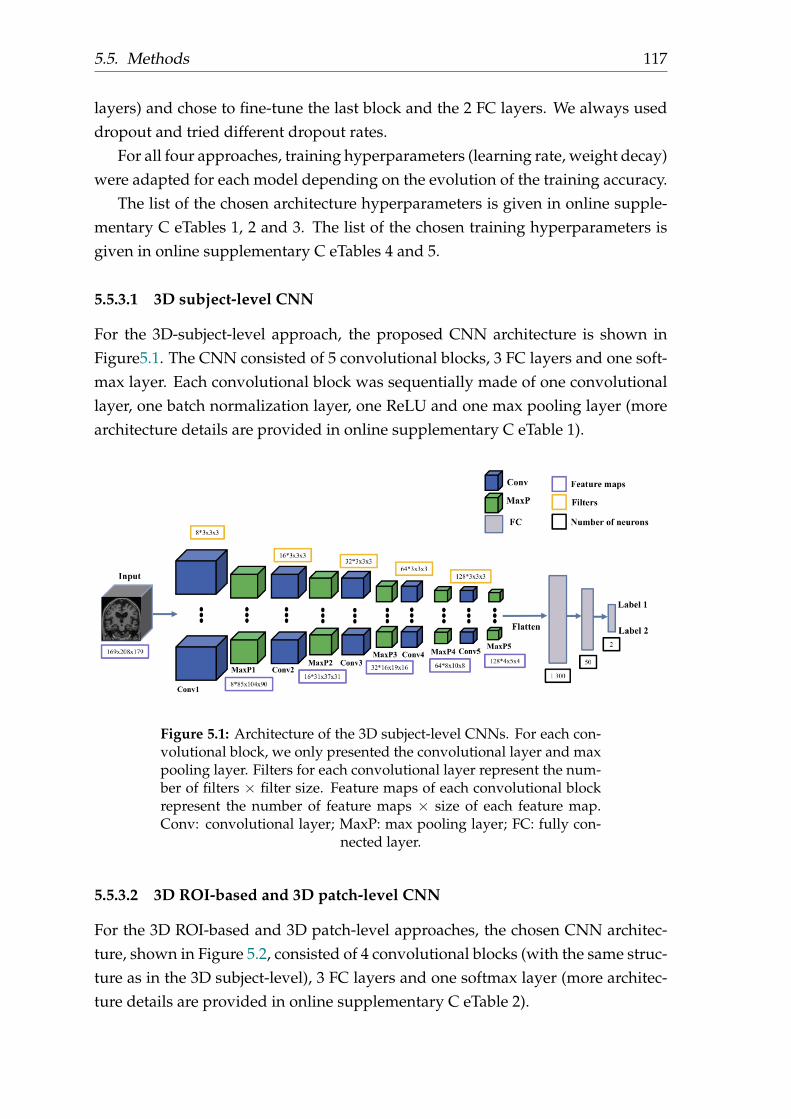
5.5. Methods 117
layers) and chose to fine-tune the last block and the 2 FC layers. We always useddropout and tried different dropout rates.
For all four approaches, training hyperparameters (learning rate, weight decay)were adapted for each model depending on the evolution of the training accuracy.
The list of the chosen architecture hyperparameters is given in online supple-mentary C eTables 1, 2 and 3. The list of the chosen training hyperparameters isgiven in online supplementary C eTables 4 and 5.
5.5.3.1 3D subject-level CNN
For the 3D-subject-level approach, the proposed CNN architecture is shown inFigure5.1. The CNN consisted of 5 convolutional blocks, 3 FC layers and one soft-max layer. Each convolutional block was sequentially made of one convolutionallayer, one batch normalization layer, one ReLU and one max pooling layer (morearchitecture details are provided in online supplementary C eTable 1).
Figure 5.1: Architecture of the 3D subject-level CNNs. For each con-volutional block, we only presented the convolutional layer and maxpooling layer. Filters for each convolutional layer represent the num-ber of filters ⇥ filter size. Feature maps of each convolutional blockrepresent the number of feature maps ⇥ size of each feature map.Conv: convolutional layer; MaxP: max pooling layer; FC: fully con-
nected layer.
5.5.3.2 3D ROI-based and 3D patch-level CNN
For the 3D ROI-based and 3D patch-level approaches, the chosen CNN architec-ture, shown in Figure 5.2, consisted of 4 convolutional blocks (with the same struc-ture as in the 3D subject-level), 3 FC layers and one softmax layer (more architec-ture details are provided in online supplementary C eTable 2).
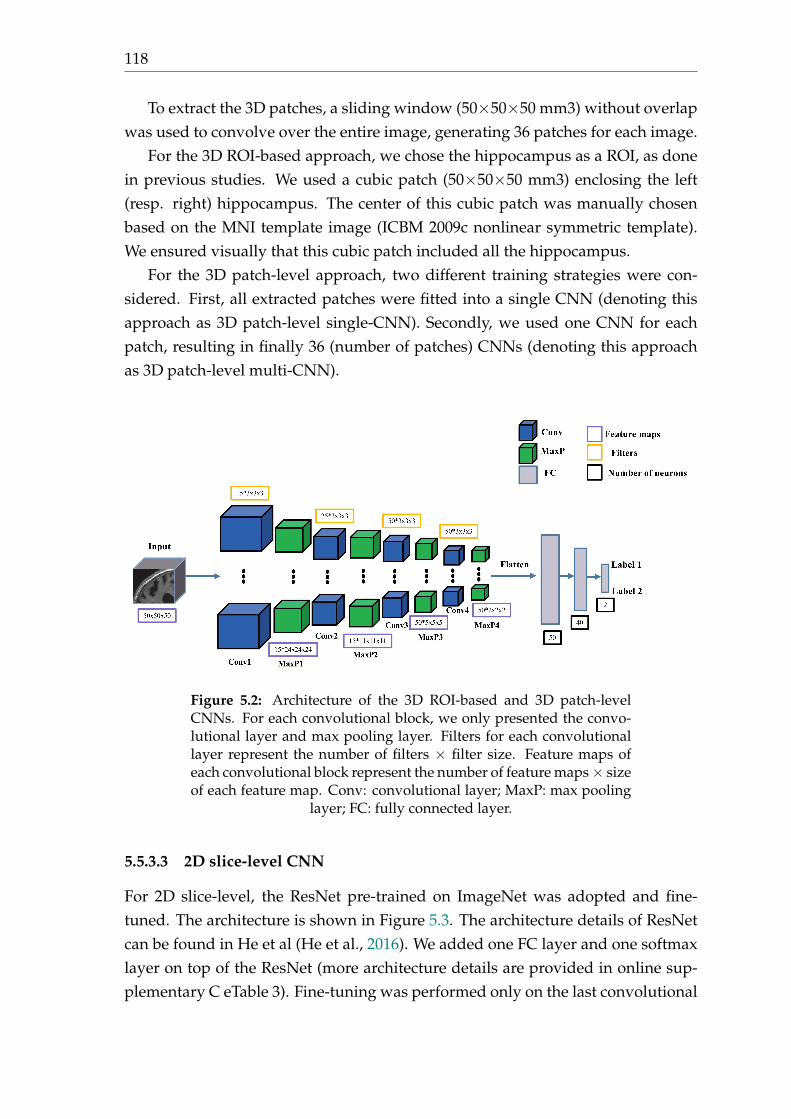
118
To extract the 3D patches, a sliding window (50⇥50⇥50 mm3) without overlapwas used to convolve over the entire image, generating 36 patches for each image.
For the 3D ROI-based approach, we chose the hippocampus as a ROI, as donein previous studies. We used a cubic patch (50⇥50⇥50 mm3) enclosing the left(resp. right) hippocampus. The center of this cubic patch was manually chosenbased on the MNI template image (ICBM 2009c nonlinear symmetric template).We ensured visually that this cubic patch included all the hippocampus.
For the 3D patch-level approach, two different training strategies were con-sidered. First, all extracted patches were fitted into a single CNN (denoting thisapproach as 3D patch-level single-CNN). Secondly, we used one CNN for eachpatch, resulting in finally 36 (number of patches) CNNs (denoting this approachas 3D patch-level multi-CNN).
Figure 5.2: Architecture of the 3D ROI-based and 3D patch-levelCNNs. For each convolutional block, we only presented the convo-lutional layer and max pooling layer. Filters for each convolutionallayer represent the number of filters ⇥ filter size. Feature maps ofeach convolutional block represent the number of feature maps ⇥ sizeof each feature map. Conv: convolutional layer; MaxP: max pooling
layer; FC: fully connected layer.
5.5.3.3 2D slice-level CNN
For 2D slice-level, the ResNet pre-trained on ImageNet was adopted and fine-tuned. The architecture is shown in Figure 5.3. The architecture details of ResNetcan be found in He et al (He et al., 2016). We added one FC layer and one softmaxlayer on top of the ResNet (more architecture details are provided in online sup-plementary C eTable 3). Fine-tuning was performed only on the last convolutional
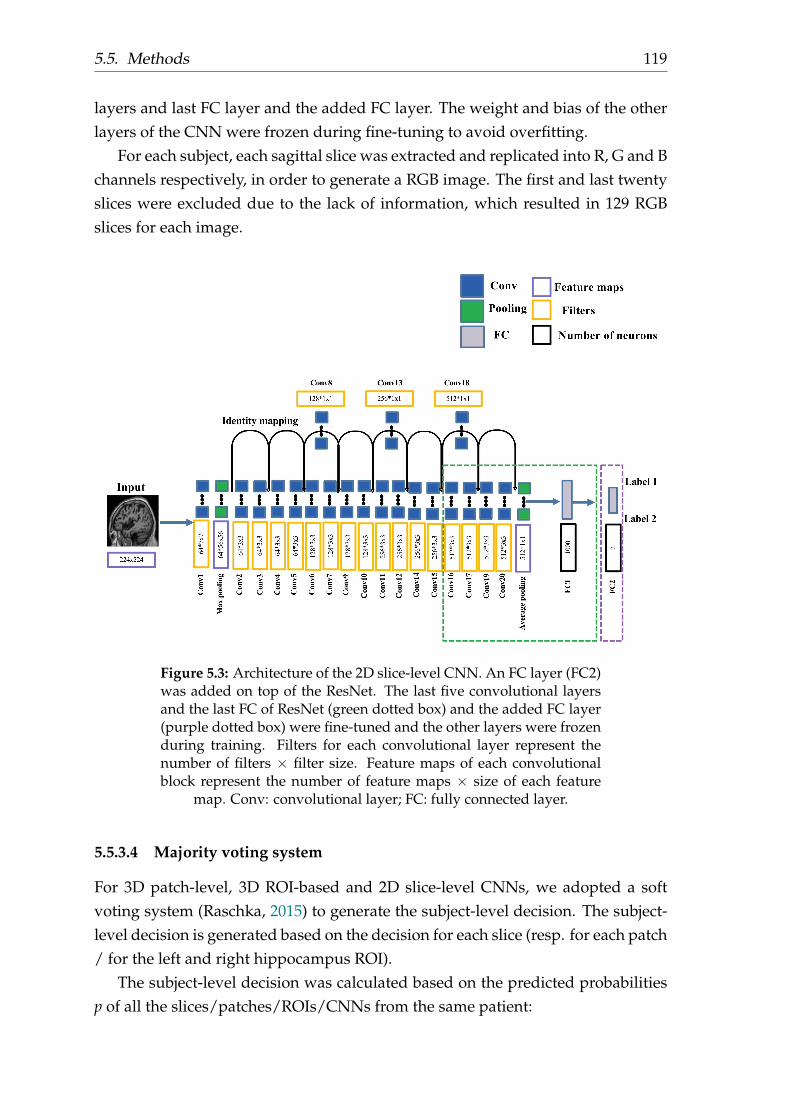
5.5. Methods 119
layers and last FC layer and the added FC layer. The weight and bias of the otherlayers of the CNN were frozen during fine-tuning to avoid overfitting.
For each subject, each sagittal slice was extracted and replicated into R, G and Bchannels respectively, in order to generate a RGB image. The first and last twentyslices were excluded due to the lack of information, which resulted in 129 RGBslices for each image.
Figure 5.3: Architecture of the 2D slice-level CNN. An FC layer (FC2)was added on top of the ResNet. The last five convolutional layersand the last FC of ResNet (green dotted box) and the added FC layer(purple dotted box) were fine-tuned and the other layers were frozenduring training. Filters for each convolutional layer represent thenumber of filters ⇥ filter size. Feature maps of each convolutionalblock represent the number of feature maps ⇥ size of each feature
map. Conv: convolutional layer; FC: fully connected layer.
5.5.3.4 Majority voting system
For 3D patch-level, 3D ROI-based and 2D slice-level CNNs, we adopted a softvoting system (Raschka, 2015) to generate the subject-level decision. The subject-level decision is generated based on the decision for each slice (resp. for each patch/ for the left and right hippocampus ROI).
The subject-level decision was calculated based on the predicted probabilitiesp of all the slices/patches/ROIs/CNNs from the same patient:

120
y = arg maxx
m
Âj
wj pij
where wj is the weight assigned to the j-th patch/slice/ROI/CNN. wj reflects theimportance of each slice/patch/ROI/CNN and is weighted by the normalized ac-curacy of the j-th slice/patch/ROI/CNN.
For 3D patch-level multi-CNN approach, the 36 CNNs were trained indepen-dently. In this case, the weaker classifiers’ weight (accuracy < 0.7) was set to be 0with the consideration that the labels’ probabilities of these classifiers could harmthe majority voting system (e.g. AD and CN has both probabilities near to 0.5).
5.5.3.5 Comparison to a linear SVM on voxel-based features
For comparison purpose, classification was also performed with a linear SVM clas-sifier. The SVM took as input the modulated GM density maps non-linearly reg-istered using the DARTEL method (Ashburner, 2007) as in our previous study(Samper-González et al., 2018).
5.5.4 Transfer learning
Two different approaches were used for transfer learning: i) AE pre-training for3D CNNs; and ii) ResNet pre-trained on ImageNet for 2D CNNs.
5.5.4.1 AE pre-training
The AE was constructed based on the corresponding architecture of CNN. Specif-ically, the encoder part of the AE shared the same architecture with the CNN: theencoder is composed of a sequence of convolutional blocks, each block having oneconvolutional layer, one batch normalization layer, one ReLU and one max pool-ing layer. The architecture of the decoder mirrored that of the encoder, exceptthat the order of the convolution layer and the ReLU was swapped. Of note, thepre-training with AE and classification with CNNs in our experiments used thesame training and validation data splits in order to avoid potential data leakageproblems. Also, each AE was trained on all available data in the training sets. Forinstance, all MCI, AD and CN subjects in training dataset were used to pre-trainthe AE for the AD vs CN classification task.

5.5. Methods 121
5.5.4.2 ImageNet pre-training
For the 2D-slice experiments, we investigated the possibility to transfer a ResNetpre-trained on ImageNet (He et al., 2016) to our specific tasks. Next, the fine-tuning procedure was performed on the chosen layers (see Figure 5.3).
5.5.5 Classification tasks
We performed two tasks in our application: first, the AD vs CN classification, abaseline task to easily compare the results of our different framework. Then thebest frameworks obtained on this task were selected to perform the prediction tasksMCI vs pMCI: the weights and biases of the model learnt on the source task (ADvs CN) were transferred to a new model fine-tuned on the target task (sMCI vspMCI). For SVM, the sMCI vs pMCI was done either training directly on sMCI vspMCI or using training on AD vs CN and applying the trained model to sMCI vspMCI.
5.5.6 Evaluation strategy
5.5.6.1 Validation procedure
Rigorous validation is essential to objectively assess the performance. This is par-ticularly critical in the case of DL as one may easily overfit the validation datasetwhen manually performing model selection and hyperparameter fine-tuning. Anindependent test set should be, at the very beginning, partitioned and concealed.It should not be touched until the CV, based on the training and validation dataset,is finished and the final model is chosen. This test dataset should be used only toassess the performance (i.e. generalization) of a fully specified and trained clas-sifier (Kriegeskorte et al., 2009; Ripley, 1996; Sarle, 1997). Considering this, wechose a classical split into training/validation/test sets. Training/validation setswere used in a CV procedure for model selection while the test set was left un-touched. Of note, as mentioned in the beginning, we have not yet used the test setand will do so only after the review process of the paper has been finished. Onlythe best performing model for each approach (3D subject-level, 3D patch-level, 3DROI-based, 2D slice-level) as defined by the CV on training/validation sets, willbe tested on the test set.
First, the test set was built as follows. ADNI data was split into training/validationand test sets. The ADNI test dataset consisted of 100 randomly chosen age- andsex-matched subjects for each diagnostic class (i.e. 100 CN subjects, 100 AD pa-tients). The rest of ADNI data was used as training/validation set. We ensuredthat age and sex distributions between training/validation and test sets were not

122
significantly different. Two other test sets were composed of all subjects of OASISand AIBL. Thus, as a result, we have three test sets: i) an ADNI test set which willbe used to assess model generalization within the same dataset (thereby assessingthat model choice has not overfitted the training/validation set); ii) an AIBL testset which will be used to assess generalization to another dataset but with similarinclusion criteria and image acquisition parameters to those of ADNI; iii) an OA-SIS test which will be used to assess generalization to other inclusion criteria andimage acquisition parameters.
Secondly, the model selection procedure, including model architecture selec-tion and training hyperparameters fine-tuning, was performed using only thetraining/validation dataset. For that purpose, a 5-fold CV was performed, whichresulted in one fold (20%) of the data for validation and the rest for training. Notethat the 5-fold data split was performed only once for all experiments with a fixedseed number (random_state = 2), thus guaranteeing that all the experiments usedexactly the same subjects during CV. Also, no overlapping exists between the MCIsubjects used for AE pre-training (using all available AD, CN and MCI) and thetest dataset of sMCI vs pMCI. Thus, the evaluation of the cross-task transfer learn-ing (from AD vs CN to sMCI vs pMCI) is unbiased. Finally, for the linear SVM,the hyperparameter C controlling the amount of regularization was chosen usingan inner loop of 10-fold CV (thereby performing a nested CV).
5.5.6.2 Metrics
We computed the following performance metrics: balanced accuracy, AUC, accu-racy, sensitivity and specificity. In the manuscript, for the sake of concision, wereport only the balanced accuracy but all other metrics are available at https://gitlab.icm-institute.org/aramislab/AD-ML.
5.5.7 Implementation details
The image preprocessing procedures were implemented with Nipype (Gorgolewskiet al., 2011). The DL models were built using the Pytorch library 23 (Paszke et al.,2017). The linear SVM was built using scikit-learn (Pedregosa et al., 2011). Tensor-boardX 24 was embedded into the current framework to dynamically monitor thetraining process. Specifically, we evaluated and reported the training and valida-tion accuracy/loss after each epoch or certain iterations. Of note, instead of using
23https://pytorch.org/24https://github.com/lanpa/tensorboardX

5.6. Experiments and results 123
only the current batch of data, the accuracy was evaluated based on all the train-ing/validation data. Moreover, we organized the classification outputs in a hierar-chical way inspired from BIDS, including the TSV files containing the classificationresults, the outputs of TensorboardX for dynamic monitoring of the training andthe best performing models selected based on the validation accuracy.
We applied the following early stopping strategy for all the classification exper-iments: the training procedure does not stop until the validation loss is continu-ously higher than the lowest validation loss for N epochs. Otherwise, the trainingcontinues to the end of the pre-defined number of epochs. The selected modelwas the one which obtained the highest validation accuracy during training. Forthe AE pre-training, the AE was trained to the end of the pre-defined number ofepochs. We then visually check the validation loss and the quality of the recon-structed images.
All experiments were performed on the cluster of the Brain and Spine Institute25 in Paris, which is equipped with 4 NVIDIA P100 GPU cards (64 GB sharedmemory) and 24 CPUs (120 GB shared memory).
5.6 Experiments and results
5.6.1 Results on training/validation set
The different classification experiments and results (validation accuracy during 5-fold CV) are detailed in Table 5.5. For each experiment, the training process of thebest fold (with highest validation accuracy) is presented as illustration (see sup-plementary C eFigures 1-4 for details). Lastly, the training hyperparameters (e.g.learning rate and batch size) for each experiments are presented in supplementaryC eTable 4.
25https://icm-institute.org/

124
Classification Training Image Intensity Data split Training Transfer Task Validation accuracyarchitectures data preprocessing rescaling approach learning
3D subject-level CNN
Baseline MinimalNone
subject-level single-CNN None
AD vs CN
0.50 ± 0.00[0.50,0.50,0.50,0.50,0.50]
MinMax 0.77 ± 0.08[0.78,0.87,0.83,0.75,0.63]AE pre-train 0.78 ± 0.05[0.79,0.83,0.82,0.79,0.68]
LongitudinalMinimal
MinMax subject-level single-CNN AE pre-train
0.85 ± 0.03[0.89,0.87,0.86,0.82,0.82]Extensive 0.85 ± 0.05[0.88,0.91,0.85,0.85,0.78]
Minimal sMCI vs pMCI 0.74 ± 0.03[0.75,0.77,0.70,0.76,0.72]Baseline 0.74 ± 0.03[0.72,0.76,0.72,0.78,0.71]
3D ROI-based CNNBaseline
Minimal MinMax subject-level single-CNN AE pre-train
AD vs CN 0.86 ± 0.03[0.84,0.89,0.86,0.88,0.82]sMCI vs pMCI 0.80 ± 0.03[0.84,0.79,0.75,0.79,0.82]
Longitudinal AD vs CN 0.85 ± 0.02[0.84,0.87,0.86,0.88,0.82]sMCI vs pMCI 0.79 ± 0.03[0.82,0.78,0.73,0.79,0.81]
3D patch-level CNN
Baseline
Minimal MinMax subject-level
single-CNN
AE pre-train
AD vs CN 0.72 ± 0.09[0.75,0.83,0.75,0.73,0.56]Longitudinal 0.72 ± 0.06[0.77,0.74,0.77,0.69,0.61]
Baselinemulti-CNN
AD vs CN 0.81 ± 0.03[0.85,0.81,0.75,0.79,0.83]sMCI vs pMCI 0.76 ± 0.04[0.80,0.75,0.68,0.79,0.78]
Longitudinal AD vs CN 0.79 ± 0.02[0.81,0.75,0.80,0.80,0.80]sMCI vs pMCI 0.76 ± 0.03[0.78,0.77,0.71,0.78,0.76]
2D slice-level CNNBaseline
Minimal MinMax subject-level single-CNN ImageNet pre-train AD vs CN0.79 ± 0.04[0.82,0.83,0.72,0.82,0.76]
Longitudinal 0.79 ± 0.05[0.79,0.85,0.80,0.82,0.70]Baseline slice-level 1.00 ± 0[1.00,1.00,1.00,1.00,1.00]
SVM
Baseline
DartelGM SPM-based subject-level None None
AD vs CN 0.85 ± 0.02[0.85,0.88,0.83,0.86,0.84]sMCIvspMCI1 0.69 ± 0.02[0.71,0.70,0.66,0.67,0.72]sMCIvspMCI2 0.72 ± 0.04[0.67,0.78,0.70,0.76,0.68]
LongitudinalAD vs CN 0.85 ± 0.01[0.87,0.85,0.84,0.86,0.85]
sMCIvspMCI1 0.68 ± 0.07[0.76,0.76,0.59,0.63,0.65]sMCIvspMCI2 0.69 ± 0.03[0.66,0.73,0.70,0.73,0.65]
Table 5.5: Summary of all the classification experiments and validation results in our analyses. MinMax: for CNNs, intensityrescaling was done based on min and max values, resulting all values to be in the range of [0, 1]; SPM-based: the intensityrescaling was performed with SPM; AE: autoencoder. For DL models, sMCI vs pMCI tasks were done with as follows: theweights and biases of the model learnt on the source task (AD vs CN) were transferred to a new model fine-tuned on the targettask (sMCI vs pMCI). For SVM, the sMCI vs pMCI was done either training directly on sMCI vs pMCI or using training on
AD vs CN and applying the trained model to sMCI vs pMCI.

5.6. Experiments and results 125
5.6.1.1 3D subject-level
Influence of intensity rescaling. We first assessed the influence of intensity rescal-ing. Without rescaling, the CNN did not perform better than chance (balanced ac-curacy = 0.50 ± 0.00) and there was an obvious generalization gap (high trainingbut low validation accuracy). With intensity rescaling, the balanced accuracy im-proved to 0.77 ± 0.08. Based on these results, intensity rescaling was used in allsubsequent experiments.
Influence of transfer learning (AE pre-training). The performance was slightlyhigher with AE pre-training (0.78 ± 0.05) than without (0.77 ± 0.08) and the stan-dard deviation was lower. Based on this, we decided to always use AE pre-training, even though the difference is small.
Influence of the training dataset size. We then assessed the influence of theamount of training data, comparing training using only baseline data to those withlongitudinal data. The performance was substantially higher with longitudinaldata (0.85 ± 0.03) compared to baseline data only (0.78 ± 0.05). We choose to con-tinue exploring the influence of this choice because the four different approacheshave a very different number of learnt parameters and the sample size is intrinsi-cally augmented in 2D slice-level and 3D single-CNN patch-level approaches.
Influence of preprocessing. We then assessed the influence of the preprocess-ing comparing the “Extensive” and “Minimal” preprocessing procedures. The per-formance was equivalent with the “Minimal” preprocessing (0.85 ± 0.03) and withthe “Extensive” preprocessing (0.85 ± 0.05). Hence in the following experimentswe kept the “Minimal” preprocessing.
Classification of sMCI vs pMCI. The balanced accuracy was the same for base-line data and for longitudinal data (0.74 ± 0.03).
5.6.1.2 3D ROI-based
For AD vs CN, the balanced accuracy was 0.86 ± 0.03 for baseline data and 0.85± 0.02 for longitudinal data. This is comparable to the results obtained with thesubject-level approach. For sMCI vs pMCI, the balanced accuracy was 0.80 ± 0.03for baseline data and 0.79 ± 0.03 for longitudinal data. This is substantially higherthan with the 3D-subject level approach.
5.6.1.3 3D patch-level
Single CNN. The accuracy was 0.72 ± 0.09 for baseline data and 0.72 ± 0.06 forlongitudinal data.
Multi CNN. For AD vs CN, the accuracy was 0.81 ± 0.03 for baseline data and0.79 ± 0.02 for longitudinal data, thereby outperforming the single CNN approach.

126
For sMCI vs pMCI, the accuracy was 0.76 ± 0.04 for baseline data and 0.76 ± 0.03for longitudinal data. The performance for both tasks is lower than that of the3D ROI-based approach. Compared to the 3D subject-level approach, this methodworks better for sMCI vs pMCI.
5.6.1.4 2D slice-level
In general, the performance of the 2D-slice level approach was lower to that ofthe 3D ROI-based, 3D patch-level multi CNN and 3D subject-level (when trainedwith longitudinal data) approaches but higher than that of the 3D patch-level sin-gle CNN approach. For 2D slice-level, the use of longitudinal data for training didnot improve the performance (0.79 ± 0.04 for baseline data; 0.79 ± 0.05 for longi-tudinal data). Finally, we studied the influence of data leakage using a slice-leveldata split strategy. As expected, the accuracy was 1.00 ± 0.00.
5.6.1.5 Linear SVM
For task AD vs CN, the accuracies were 0.85 ± 0.02 when trained with baselinedata and 0.85 ± 0.01 when trained with longitudinal data. For task sMCI vs pMCI,when training from scratch, the accuracies were 0.690.02 when trained with base-line data and 0.680.07 when trained with longitudinal data. When using transferlearning from the task AD vs CN to the task sMCI vs pMCI, the accuracies were0.720.04 (when trained with baseline data) and0.690. 03 (when trained with longi-tudinal data). The performance of the SVM on AD vs CN is thus higher than thatof most DL models and comparable to the best ones. Whereas for task sMCI vspMCI, the accuracy of the SVM is lower than that of DL models.
5.6.2 Results on the test sets
Results on the three test sets (ADNI, OASIS and AIBL) are presented in Table ??.For each category of approach, we only applied the best models for both baselineand longitudinal data. The results will be computed and presented after the endof the peer-review process.

5.6.Experim
entsand
results127
Classification Training Image Intensity Data split Training Transfer Task Validation ADNI test AIBL test OASIS testarchitectures data preprocessing rescaling approach learning accuracy accuracy accuracy accuracy
3D subject-level CNN
Baseline
Minimal MinMax subject-level single-CNN AE pre-trainAD vs CN 0.78 ± 0.05
Longitudinal 0.85 ± 0.03Baseline sMCI vs pMCI 0.75 ± 0.02
Longitudinal 0.74 ± 0.03
3D ROI-based CNNBaseline
Minimal MinMax subject-level single-CNN AE pre-train
AD vs CN 0.86 ± 0.03sMCI vs pMCI 0.80 ± 0.03
Longitudinal AD vs CN 0.85 ± 0.02sMCI vs pMCI 0.79 ± 0.03
3D patch-level CNNBaseline
Minimal MinMax subject-level single-CNN AE pre-train
AD vs CN 0.81 ± 0.03sMCI vs pMCI 0.76 ± 0.04
Longitudinal AD vs CN 0.79 ± 0.02sMCI vs pMCI 0.76 ± 0.03
2D slice-level CNNBaseline
Minimal MinMax subject-level single-CNN ImageNet pre-trainAD vs CN 0.79 ± 0.04
Longitudinal 0.79 ± 0.05Baseline slice-level 1.00 ± 0
SVMBaseline
DartelGM SPM-based subject-level None None
AD vs CN 0.85 ± 0.02sMCIvspMCI1 0.72 ± 0.04
Longitudinal AD vs CN 0.85 ± 0.01sMCIvspMCI2 0.69 ± 0. 03
Table 5.6: Summary of all the classification experiments and validation results in our analyses. MinMax: for CNNs, intensityrescaling was done based on min and max values, resulting all values to be in the range of [0, 1]; SPM-based: the intensity
rescaling was performed with SPM; AE: autoencoder.
128
5.7 Discussion
The present studies contains three main contributions. First, we performed a sys-tematic and critical literature review, which highlighted several important prob-lems. Then, we proposed an open-source framework for the reproducible evalua-tion of AD classification using CNNs and T1w MRI. Finally, we applied the frame-work to rigorously compare different CNN approaches and to study the impact ofkey components on the performances. We hope that the present paper will pro-vide a more objective assessment of the performance of CNN for AD classificationand constitute a solid baseline for future research.
This paper first proposes a survey of existing CNN methods for AD classifi-cation. We hope to provide a useful overview of the different strategies. How-ever, the survey highlighted several serious problems with the existing literature.First, we found that data leakage was potentially present in half of the 32 surveyedstudies. This problem was evident in six of them and possible (due to inadequatedescription of the validation procedure) in ten others. This is a very serious is-sue, in particular considering that all these studies have undergone peer-review.This was likely to bias the performance upwards. In addition, in our experiments,we simulated one type of data leakage and found, as expected, that it led to abiased evaluation of the accuracy (1.00 instead of 0.79). Similar findings were ob-served in (Bäckström et al., 2018). Moreover, the survey highlighted that manystudies did not motivate the choice of their architecture or training hyperparame-ters. Only two of them (Wang et al., 2019; Wang et al., 2018b) explored and gaveresults obtained with different architecture hyperparameters. However, it is pos-sible that these performances were computed on the test set to help choosing theirfinal model, hence they may be contaminated by data leakage. For other studies,it is also likely that they tried multiple number of choices leading to biased per-formances on the test set.We believe that these issues may potentially be causedby the lack of expertise in medical imaging or DL. For instance, splitting at theslice-level comes from a lack of knowledge of the nature of medical imaging data.We hope that the present paper will help to spread knowledge and good practicesin the field.
Then, we proposed an open-source framework for reproducible experimentson AD classification using CNN. Some studies in our bibliography also providedtheir code on open source platforms (Hon and Khan, 2017; Hosseini-Asl, Gimel’farb,and El-Baz, 2016; Korolev et al., 2017; Liu et al., 2018c). Of note, two studies (Chengand Liu, 2017; Liu et al., 2018c) used the online code of (Hosseini-Asl, Gimel’farb,and El-Baz, 2016) to compare to their framework and neither of them succeeded

5.7. Discussion 129
in reproducing the results of the original study (for the AD vs CN task they re-port both an accuracy of 0.82 while the original study reports an accuracy of 0.99).Our framework comprises unified tools for data management using the commu-nity standard BIDS (Gorgolewski et al., 2016), modular preprocessing pipelines, aset of CNN models which are representative of the literature and rigorous valida-tion procedures. It builds upon our previously proposed framework but extendsit to DL techniques (Samper-González et al., 2018; Wen et al., 2018b). We hope tocontribute in improving the reproducibility and objectivity in application of ADclassification using DL methods. Our open-source framework facilitates the re-producible and objective evaluation of performances. It also allows to rigorouslystudy the impact of the different components. Calls and emphasises have beenmade on reproducibility in both neuroimaging (Gorgolewski and Poldrack, 2016;Poldrack et al., 2017) and ML (Sonnenburg et al., 2007; Stodden, Leisch, and Peng,2014; Vanschoren et al., 2014). We hope that our framework will be useful to futureresearch in the field. Indeed, researchers can easily embed new CNN architecturesor image preprocessing pipelines and study their added value.
We then demonstrated the use of our framework on three public datasets.Through this, we aim to provide a trustworthy baseline performance for the com-munity. On the validation dataset, the diagnostic accuracy of CNNs ranged from0.72 to 0.86 for task AD vs CN and from 0.74 to 0.80 for task sMCI vs pMCI, re-spectively. These baseline performances are in line with the state-of-the-art results(studies without data leakage in Table 1A), where classification accuracy typicallyranged from 0.76 to 0.91 for the task AD vs CN and 0.62 to 0.83 for the task sMCIvs pMCI.
Different approaches, namely 3D subject-level, 3D ROI-based, 3D patch-leveland 2D slice-level CNNs, were compared. Our study is the first one to system-atically compare the performances of the four approaches. In the literature, threestudies (Cheng et al., 2017; Li, Liu, and Alzheimer’s Disease Neuroimaging Ini-tiative, 2018; Liu et al., 2018c) using a 3D patch-level approach compared theirresults with a 3D subject-level approach. In all studies, the 3D patch-level multi-CNN gave better results than the 3D-subject CNN (3 or 4 percent points of dif-ference between the two approaches). However, except for Liu et al (Liu et al.,2018c) who reused the code provided by (Hosseini-Asl, Gimel’farb, and El-Baz,2016), the methods used for the comparison are poorly described and the studieswould thus be difficult, if not impossible, to reproduce. In general, in our com-parative study, the 3D ROI-based approach provided the best performances. The3D subject-level CNN was competitive with 3D ROI-based for AD vs CN classi-fication but not for sMCI vs pMCI. The superior performance of the ROI-basedapproach may appear surprising since it uses only a specific portion of the brain

130
(the hippocampus) while 3D subject-level approach uses all information available.Indeed, even though the hippocampus is affected early and severely by AD (Braakand Braak, 1998), alterations in AD are not confined to the hippocampus and ex-tend to other regions in the temporal, parietal and frontal lobes. A previous com-parative study, using different types of ML techniques but not CNN, has shownthat whole-brain approaches are more effective than methods using only the hip-pocampus (Cuingnet et al., 2011). In the case of DL, it is possible that the ROI-based CNNs work better because they are less complex (fewer learnt parameters)than the 3D subject-level CNNs, thus leading to less overfitting. It may thus bethat whole brain approaches would result in higher performance when trained onlarger samples. Two papers in the literature using hippocampal ROI reported highaccuracies for task AD vs CN (0.84 and 0.90), comparable to ours, even thoughtheir definition of the ROI was different (Aderghal et al., 2018; Aderghal, Benois-Pineau, and Afdel, 2017). As for the 3D subjects (Bäckström et al., 2018; Chengand Liu, 2017; Korolev et al., 2017; Li, Cheng, and Liu, 2017; Senanayake, Sowmya,and Dawes, 2018; Shmulev, Belyaev, and The Alzheimer’s Disease NeuroimagingInitiative, 2018) results of the literature varied across papers, from 0.76 to 0.90. Al-though we cannot prove it directly, we believe that this variability stems from thehigh risk of overfitting. Moreover, 3D patch-level and 2D slice-level approachesled to lower accuracies compared to 3D ROI-based or 3D subject-level CNNs. Onecan hypothesize that this is because the spatial information is not adequately mod-eled by these approaches (no 3D consistency between slices, no consistency at theborder of patches). Other studies with 3D patch-level approaches in the literature(Cheng et al., 2017; Lian et al., 2018; Li, Liu, and Alzheimer’s Disease Neuroimag-ing Initiative, 2018; Liu et al., 2018b; Liu et al., 2018e) reported higher accuracies(from 0.87 to 0.91) than ours (0.81). We hypothesize that it may come from the in-creased complexity of their approach, including patch selection and fusion. Onlyone paper (without data leakage) has explored 2D slice-level using ImageNet pre-trained ResNet (Valliani and Soni, 2017). Their accuracy is very similar to ours(0.81 for task AD vs CN). Here, we provided a direct comparison with other ap-proaches and demonstrated that a 2D slice-level approach leads to lower perfor-mances compared to 3D ROI-based or 3D subject-level CNNs.
For the 3D patch-level, we showed that the multi-CNN approach (0.81) wassuperior to the single-CNN approach (0.72). This is probably because fitting allpatches/slices into one single CNN could lead to losing the voxel correspondenceacross patches/slices. However, the multi-CNN approach (0.81) obtained loweraccuracies compared to the 3D subject-level approach (0.85).
After the peer-review process, when the results on the three test datasets havebeen obtained, we will include a paragraph discussing the results on the test dataset

5.7. Discussion 131
and the implications for the generalizability of the models. We will discuss bothgeneralizability to unseen data of the same study (ADNI) and to other studies withsimilar (AIBL) or different (OASIS) inclusion criteria and imaging parameters.
We studied the influence of several key choices on the performance. First, westudied the influence of AE pre-training and showed that it did not improve theaverage accuracy over training from scratch. However, AE pre-training resulted ina lower variance over the 5-folds of the CV. Three previous papers studied the im-pact of AE pre-training (Hosseini-Asl, Gimel’farb, and El-Baz, 2016; Vu et al., 2017;Vu et al., 2018) and found that it improved the results. However, they are all at leastsuspected of data leakage. We thus conclude that, to date, it is not proven that AEpre-training leads to increased average accuracy. A difficulty in AD classificationusing DL is the limited data sample for training. We demonstrated that train-ing with longitudinal data gave superior (3D subject-level) or comparable (otherapproaches) performances compared to baseline data. This discrepancy across ap-proaches may come from the fact that 3D subject-level CNNs were more complex(more learnt parameters) than other approaches, and thus that more training datahas more impact on this approach. The absence of improvement for the major-ity of cases may be due to several factors. First, training with longitudinal dataimplies training with data from more advanced disease stages, since patients areseen at a later point in the disease course. This may have an adverse effect on theperformance of the model when tested on baseline data, at which the patients areless advanced. Also, since the additional data come from the same patient, thisdoes not provide a better coverage of inter-individual variability. We studied theimpact of image preprocessing. First, as expected, we found that CNNs cannot besuccessfully trained without intensity rescaling. We then studied the influence oftwo different procedures (“Minimal” and “Extensive”). Of note, “Extensive” pro-cedure requires redundantly a non-linear registration, instead of a linear one, andskull stripping compared to “Minimal” procedure. They led to comparable results.In principle, this is not surprising as DL methods do not require extensive prepro-cessing. In the litterature, varied types of preprocessing have been used. . Somestudies used non-linear registration (Bäckström et al., 2018; Basaia et al., 2018; Lianet al., 2018; Liu et al., 2018b; Liu et al., 2018e; Lin et al., 2018; Wang et al., 2019;Wang et al., 2018b) while others used only linear (Aderghal, Benois-Pineau, andAfdel, 2017; Aderghal et al., 2017; Aderghal et al., 2018; Hosseini Asl et al., 2018;Li, Liu, and Alzheimer’s Disease Neuroimaging Initiative, 2018; Liu et al., 2018c;Shmulev, Belyaev, and The Alzheimer’s Disease Neuroimaging Initiative, 2018)or no registration (Cheng and Liu, 2017). None of them compared these differentpreprocessings with the exception of (Bäckström et al., 2018) which compared pre-processed data using FreeSurfer to no preprocessing. They found that training the

132
network with the raw data obtained inferior classification performance (38% dropfor accuracy) compared to the preprocessed data using FreeSurfer (Bäckström etal., 2018). However, FreeSurfer comprises a complex pipeline with many prepro-cessing steps so it is unclear, from their results, which part drives the superiorperformance.
One interesting question is whether DL could perform better than conventionalML methods for AD classification. Here, we chose to compare CNN to a linearSVM. SVM has been used in many AD classification studies and obtained com-petitive performances (Falahati, Westman, and Simmons, 2014; Haller, Lovblad,and Giannakopoulos, 2011; Rathore et al., 2017). In the current study, compared toSVM, CNN gave comparable performances for task AD vs CN and superior per-formances for task sMCI vs pMCI. Note that we used a standard linear SVM withstandard voxel-based features. For task AD vs CN, we do not claim that possiblymore sophisticated DL architectures would not outperform the SVM. However,this is not the case with the architectures that we tested which are representativeof the existing literature on AD classification. Besides, it is possible that CNN willoutperform SVM when larger public dataset are available in the future. On theother hand, the CNN outperformed the SVM for the most difficult (and more in-teresting) sMCI vs pMCI classification task (0.80 vs 0.72). This is an interestingresult which demonstrates the potential of DL for challenging diagnostic tasks.
Unbiased evaluation of the performances is an essential task in ML. This is par-ticularly critical for deep learning because of the extreme flexibility of the modelsand the numerous possible choices that can be made regarding architecture andhyperparameter choices. In particular, it is crucial that such choices are not madeusing the test set. We chose a very strict validation strategy in that respect: the testsets were left untouched until the end of the peer-review process. This guaranteesthat only the final models, after all possible adjustments, are carried to the test set.Moreover, it is important to assess generalization not only to unseen subjects butalso to other studies in which image acquisitions or patient inclusion criteria canvary. In the present paper, we used three test sets from ADNI, AIBL and OASIS toassess generalization to these different conditions.
Our study has the following limitations. First, a very large number of differ-ent choices can be made regarding the model architecture and training hyperpa-rameters. Even though we did our best efforts to make meaningful choices andfor testing a relatively large number of possibilities, we cannot exclude that otherchoices could have led to better results. [Note to reviewers: suggestions for otherchoices are welcome, as long as they are within a reasonable number]. To over-come this limitation, our framework is freely available to the community. We will

5.7. Discussion 133
thus hope that other researchers will use it to propose and validate potentially bet-ter performing models. In particular, with our proposed framework, researcherscan easily try their own models without touching the concealed test dataset. Sec-ondly, the CV procedures were performed only once. Of course, the training is notdeterministic and one would ideally want to repeat the CV to get a more robustestimate of the performance. However, we did not perform this due to limitedcomputational resources. Finally, overfitting always exist in our experiments, al-beit different techniques have been tried (e.g. transfer learning, dropout or weightdecay). This phenomenon occurs mainly due to our small data sample in AD clas-sification. It is likely that training with much larger datasets would result in higherperformance models. However, in the field of AD, such very large datasets are notyet publicly available.

135
Conclusion & Perspectives
The objectives of this dissertation are to advance: i) the discovery of biomarkers ofthe presymptomatic phase of genetic forms of FTLD due to C9orf72 disease, andii) the computer-aided diagnosis and prognosis of AD based on machine learningtechniques. Specifically, for C9orf72 carriers, with promising disease-modifyingtherapies tested in clinical trials, we currently lack robust biomarkers for moni-toring the therapeutic effect. These biomarkers are also essential for improvingstaging, prognosis and onset prediction. We have therefore investigated and com-pleted the clinical spectrum for potential markers based on neuroimaging dataand neuropsychological tests in presymptomatic C9orf72 carriers. For AD classifi-cation, we critically and objectively reviewed the state-of-the-art in the field, point-ing out the bad practices and tricky traps regarding both neuroimaging and MLaspects. We then proposed our open source framework, demonstrated its use onthree public datasets, and studied the influences of key components in the frame-work on the classification performances. With all these, we hope to provide abaseline performance and facilitate future researchers with the improvement oftransparency, reproducibility and objectivity.
Early cognitive, structural, and microstructural mark-ers in presymptomatic C9orf72 carriers younger than 40years
We evidenced that subtle cognitive, structural, and microstructural alterations canbe detected in C9orf72 carriers younger than 40 years. This finding indicate thatthe young C9orf72 carriers may represent the best target population for futuredisease-modifying clinical trials. First, praxis impairment is an early and intrigu-ing feature of C9orf72 disease. This finding is surprising and indicates an early-expressed and non-evolving phenotype of C9orf72 mutation and encourages toexamine extensive neuropsychological tests during the entire lifespan of C9orf72carriers. Secondly, early thalamic atrophy seems to be a reliable hallmark at early

136
stage of C9orf72 mutation carriers. Two mechanisms may exist and are not ex-clusive with each other for this phenomenon: i) thalamic atrophy may be relatedto the presence of pathological deposits, ie, TDP-43 and/or DPR or ii) it can alsobe caused by deafferentation processes secondary to the diffuse cortical atrophyowing to the high number of connections between the hemispheric cortex and thethalamus. Lastly, microstructural WM integrity corruption but not cortical atrophyreflects the expected topography of C9orf72 disease. Our study demonstrated twodistinct patterns between WM and GM. Atrophy demonstrates a widespread pat-tern and WM conversely targets corticospinal tracts and frontal WM, suggestingthat WM changes may be more predictive of future cognitive and motor deficitsthan cortical atrophy. Our results contribute to a better understanding of the pre-clinical phase of C9orf72 disease and of the respective contribution of magneticresonance biomarkers. However, the main limitation of our study is its cross-sectional design. Our findings need to be confirmed on longitudinal study design.
NODDI offers promising biomarkers with higher speci-ficity and sensitivity at presymptomatic stage
In a second study, we hope to find more sensitive and more specific biomark-ers in presymptomatic C9orf72 carriers. More specifically, this study evaluatedthe added value of NODDI in the detection of brain microstructural changes inpresymptomatic C9orf72 carriers compared to conventional techniques, namelyDTI and volumetric analysis based on T1w MRI. In conclusion, NODDI offershigher sensitivity compared with conventional DTI for detecting white matter in-tegrity abnormalities. Moreover, it offers the potential to reveal a more specificsubstrate of white matter damage, suggesting here that it consists mainly of re-duced neurite density during the presymptomatic stage. These findings encour-age the use of NODDI, a multishell DWI sequence taking nearly 30 minutes, inclinical studies. Our work highlights the potential use of NODDI for biomarkertracking, disease staging and diagnosis, and therapeutic treatment monitoring inneurodegenerative diseases.
The currents study has the following limitations. First, the cross-model com-parison between NODDI and DTI used two different DWI acquisitions. How-ever, the single-shell and multishell DWI sequences were optimized for DTI andNODDI model, respectively. Thus, this systematic comparison helps clarify the

Conclusion & Perspectives 137
added value of a longer but clinically feasible multishell diffusion sequence. Sec-ond, caution should be exercised in diffusion MRI-based cortical analysis. NODDI,by construction, accounts for partial volume effects from cerebrospinal fluid (CSF)contamination, thus minimizing the influence of atrophy on the NODDI metrics.Nevertheless, the cortex is a thin structure compared with the resolution of diffu-sion MRI, and partial volume effect may impact on the computation of regionalFWF measures. Although we implemented specific image processing proceduresto mitigate partial volume effects, it is still possible that some partial volume effectremains, impacting on FWF estimates.
Challenges and cautions in classification of AD: a longbut promising pathway to clinical translation with deeplearning
Another important contribution of this dissertation is to clarify where we currentlyare and how far we are away from the translation to clinical practice regardingclassification of AD using neuroimaging and ML techniques. The last two studiesextended the previous work of a colleague (Samper-González et al., 2018), whichproposed a reproducible framework based on conventional ML methods for ADclassification and demonstrated its use on T1w MRI and PET data. In this disser-tation, we expanded this framework to diffusion MRI with conventional ML, andT1w MRI with DL methods.
The main contributions are summarized as follows. First, our exhaustive liter-ature overview of the state-of-the-art revealed bad practices in the field. These in-clude various traps for data leakage and the biased metrics for classification perfor-mance quantification (e.g., imbalanced dataset), resulting in often over-optimisticresults. In the current dissertation, we demonstrated two sources of data leakagewith our experiments. The first scenario is the adoption of a non-nested featureselection using SVM. The second example is the adoption of a bad data split strat-egy in DL methods. Other types of data leakage also exist in the filed and lead tounreliable and over-optimistic results. This is a serious obstacle for future clinicaltranslation as these models may have poor generalization power for unseen data.Secondly, we proposed our open source framework for reproducible evaluationof these classification methods. It consist of a set of tools for automatic conver-sion of the three public databases, standard image preprocessing pipelines andML tools following current best practices. Thirdly, we demonstrated the use of

138
the framework on two applications: i) conventional ML methods with DTI-basedfeatures and ii) CNNs with T1w MRI from the three public datasets. These base-line performances are in line with the state-of-the-art results. We systematicallystudied the impacts of key components, such as type of features and image pre-pocessing procedure, on the classification performance. Moreover, in conjunctionwith our previous work (Samper-González et al., 2018), the last two studies in thisdissertation clarify that PET, T1w MRI and diffusion MRI obtained inferior perfor-mance one after another by using conventional ML methods. DL methods did notboost the classification performance compared to conventional ML models, suchas SVM, possibly due to the fact that very large neuroimaging datasets, compa-rable to ImageNet dataset, are not available yet. Lastly, we stressed our opinionsand suggestions regarding the existing issues and challenges in the field. Specifi-cally, the data leakage problem is not trivial and should be strictly avoided duringexperiment design. Another open question regards the architecture and hyperpa-rameter optimization in DL. In this dissertation, we explicitly explained how thisoptimization was performed. Moreover, one is encouraged to split an independenttest dataset at the very beginning in order to avoid the data leakage and quantifythe generalizability power of the trained model to unseen data.
Compared to conventional ML methods, DL seems to be more promising inclinical translation. The first prerequisite is the robustness and reliability of theclassification performance. This means that the experimental design should strictlyfollow the good practices and avoid the potential biased results. As emphasizedin the current dissertation, we hope to attract the attention of the whole commu-nity to follow those good practices. Moreover, another advantage of DL is thefeasibility of real-time (or near real-time) application in clinical practice. In theapplication of conventional ML techniques, data preprocessing is dedicated andtime-consuming (usually hours for one MRI). Alternatively, DL methods has mini-mum dependency on image preprocessing, which requires nearly 10 to 30 minutesfor one MRI. Also, once trained, the model can be simultaneously applied to newpatients, thus generating interpretable outputs from imaging data for immediateuse in clinical decision making. One obstacle for this pathway is the poor perfor-mance precision, such as for task sMCI vs pMCI. This poor performance could beboosted when big data of medical image are available. Researchers are advancingthis in the right direction. First, databases, such as ADNI, OASIS, AIBL, have beenmade publicly accessible in recent decades. Moreover, research hot topic has beenfocused on few-shot learning, which requires only a small sample of training data.
Limitations also exist in our last two studies. For conventional ML methodswith diffusion MRI data, first, the diffusion MRI from ADNI has a limited samplesize and was not acquired using the state-of-the-art methods. Better performance

Conclusion & Perspectives 139
could be possibly obtained with more recent protocols or larger samples. Secondly,we only explored the potential of DTI-based features, while more advanced fea-tures, such as brain tractography- or network-based features, could also be stud-ied. Regarding DL methods with T1w MRI, first, we experimented with a set ofreasonable set of model architecture and training hyperparameters, but did notperform an extensive search due to the limited time and computational power.To overcome this limitation, our framework is freely available to the community.Thus we call for researchers to assist the search of the optimal model by using ourframework. Moreover, overfitting always exist in our experiments, albeit differenttechniques have been tried (e.g. transfer learning, dropout or weight decay).
Release of open source software packages for scientificreproducibility
In this dissertation, another important contribution is the development and releaseof open source software packages to the community. This thesis highly depends onthese open source software packages and conversely contributes to their develop-ment. First, Clinica software platform (http://www.clinica.run) offers the toolsfor automatic conversion of three public databases, standardized image prepro-cessing pipelines, and general implementation of statistical and ML models. Thefour studies highly relies on Clinica for data conversion, image preprocessing forfeature extraction and data analysis. Secondly, the implementation of classical sta-tistical models, which was used for the statistical analysis in the first two studies(Chapter 2 and Chapter 3), is publicly accessible on GitHub (https://github.com/anbai106/NeuroStatisticR). Lastly, another software package (https://gitlab.icm-institute.org/aramislab/AD-ML), for reproducible evaluation of ML meth-ods for AD classification, was made publicly accessible. This not only includesthe general implementation of ML models (both conventional ML and DL mod-els), but also the experiments results and pre-trained models, which are specific tothe last two studies in the dissertation (Chapter 4 and Chapter 5). We hope thatour framework, the experimental results and the saved pre-trained models will beuseful to researchers working in the field, allowing them to objectively evaluateand compare their new approaches.
* **
There are multiple perspectives to our work.

140
First, we hope to advance our work on presymptomatic C9orf72 carriers withthe design of longitudinal studies. A previous study (Rohrer et al., 2015) pro-posed a hypothetical pattern of biomarker changes in family FTLD: from earlypresymptomatic phase to symptom onset, CSF biomarkers are firstly visible, fol-lowed by markers from PET tracer binding. Later at the presymptomatic stage,neuroimaging changes, including lower functional and structural connectivity andGM volume, appear. Shortly before or around symptom onset, behavioural symp-toms and deficits in social cognition can be objectified. Functional changes anddeficits in other cognitive domains are often only quantifiable after symptom on-set (Rohrer et al., 2015; Jiskoot, 2018). However, this was obtained using extrapo-lated measures. Longitudinal studies would not only shed light on the temporaland spatial cascade of pathological changes in a larger lifespan, but also allow thevalidation of biomarkers robustness and disease-modifiying therapies response.
Secondly, we are interested in advancing computer-aided diagnosis of demen-tias. As mentioned above, one of the limitations using conventional ML methodsand diffusion MRI is the use of only DTI-based feature, we hope to explore moreadvanced features, such as tractography- and network-based features, under strictevaluation conditions. Moreover, in our framework, we only considered a uni-modal approach and a single type of classifier. Another prospective is to extendour work to the multimodal or ensemble learning approach, as such approacheswere also present in the literature and obtained competitive performances.
Another perspective is to advance the work on reproducible evaluation of CNNsfor AD classification. First of all, we will quantify the generalization power of ourtrained models on the unseen independent datasets after the peer-review process(Chapter 5 is submitted to Medical Image Analysis and under review). This pro-cess ensures no contamination for the test dataset and thus avoids the potentialdata leakage during the revision stage. Moreover, we currently implemented onlybinary classifiers, distinguishing between two types of conditions. This is not thenatural use case in clinical practice where multiple diagnostic situations exist. Asthe huge success of ImageNet classification which is a multiclass classification task,we naturally thought to extend our current work to multiclass scenarios. Instead ofusing one-vs-one or one-vs-all strategy, for instance, in the case of SVM, DL mod-els were designed to solve the multiclass classification with a more direct fashion:softmax function offers the probability of being classified into each category foreach subject. Lastly, we hope that the saved pre-trained models could be usefulfor transfer learning and application transplantation. For instance, our modelspre-trained on AD classification (source task) may be transferred to another targettask, such as classification of different phenotypes of FTLD (target task).
Conclusion & Perspectives 141
Another interesting proposal, such as Kaggle online competition 26, could beestablished to the whole community for the search of optimal models. We need theefforts of the whole community for the search of the optimal model for AD classifi-cation due to the above-mentioned limitations. Following the rigorous evaluationprocedures, such as adoption of subject-level data split, concealing independenttest dataset and use of balanced accuracy, participants can easily use our open-source framework for automatic data downloading and converting, image prepro-cessing, and network architecture construction. Different approaches and modelsthus could be objectively compared.
One further step may be decided. One can notice that our DL models alwayssuffer from overfitting although strategies, such as drop out, batch normaliza-tion and weight decay, have been adopted. Two possible solutions could be con-sidered. First, the community works together to build the medical "ImageNet"dataset. Similar proposition has been made (http://langlotzlab.stanford.edu/projects/medical-image-net/. Notwithstanding that the community is advanc-ing in the right direction, such as the availability of open access dataset ADNI,OASIS and AIBL, this may be difficult since medical data is sensitive. Alterna-tively, data augmentation could be taken into account. Recent huge advances indeep unsupervised learning, especially GANs, enable neural networks to dupli-cate the true data under similar data distribution. Hopefully, these approachescould satisfy the huge appetite of DL models.
26https://www.kaggle.com


143
Appendix A
Early Cognitive, Structural, andMicrostructural Changes inPresymptomatic C9orf72 CarriersYounger Than 40 Years
This appendix is the supplementary material of the Chapter 2, which has beenpublished as a journal article on JAMA Neurology (Bertrand et al., 2017):
• Bertrand, A., Wen, J. (Co-first author), Rinaldi, D., Houot, M., Sayah, S.,Camuzat, A., Fournier, C., Fontanella, C., Routier, A., Couratier, P., Pasquier,F., Habert, M., Hannequin, D., Martinaud, O., Caroppo, P., Levy, R., Dubois,B., Brice, A., Durrleman, S., Colliot, O., Le Ber, I. Early Cognitive, Structural,and Microstructural Changes in Presymptomatic c9orf72 Carriers YoungerThan 40 Years, JAMA neurology, 75(2), pp.236-245. https://hal.inria.fr/hal-01654000/document.

© 2017 American Medical Association. All rights reserved.
Supplementary Online Content
Bertrand A, Wen J, Rinaldi D, et al; the Predict to Prevent Frontotemporal Lobar Degeneration and Amyotrophic Lateral Sclerosis (PREV-DEMALS) Study Group. Early cognitive, structural, and microstructural changes in C9orf72 presymptomatic carriers younger than 40 years. JAMA Neurol. Published online December 2, 2017. doi:10.1001/jamaneurol.2017.4266
eMethods 1. Neuropsychological and behavioral tests eMethods 2. Magnetic resonance imaging sequence parameters eFigure 1. Correlation between age and expected years to onset eFigure 2. Diffusion tensor magnetic resonance imaging metrics eTable 1. Effect of C9orf72 mutation on volume of cortical regions of interest eTable 2. Effect of C9orf72 mutation on volume of subcortical structures eTable 3. Effect of C9orf72 mutation on diffusion tensor magnetic resonance imaging metrics eReferences.
This supplementary material has been provided by the authors to give readers additional information about their work.

© 2017 American Medical Association. All rights reserved.
eMethods 1. Neuropsychological and behavioral tests All the participants underwent a comprehensive neuropsychological and behavioral evaluation, based on internationally validated scales. Behavioral disorders were assessed using the Frontal Behavioural Inventory (FBI), the Neuropsychiatric Inventory (NPI), the Frontal Behavioural scale, the Frontotemporal dementia Rating Scale (FRS), the CBI-R and Starskein apathy scale. Functional disability was assessed using the Frontal CDR and DAD scale (Disability Assessment for Dementia). Depression and anxiety were assessed using the STAI and BDI-II scale. All the participants also underwent a detailed neuropsychological battery evaluating global cognitive efficiency (Mini Mental State Examination (MMSE)1, MATTIS dementia rating scale (MDRS2); executive functions (Frontal Assessment battery3); social cognition and theory of mind (Social Emotion Assessment 4); episodic memory (Free and cued recall test); language (verbal fluencies, Boston Naming test) visuospatial processing (Benson figure copy) and gestural praxis. Gestural praxis were assessed with a shortened version of the Batterie d’Evaluation des Praxies5 with 5 testing conditions: (a) manual dexterity, using imitation of finger configuration, (b) melokinetic apraxia, using motor programming and alternate gestures, (c) imitation of non-representational gestures, (d) pantomime of intransitive gestures, (e) pantomime of transitive gestures.

© 2017 American Medical Association. All rights reserved.
eMethods 2. Magnetic resonance imaging sequence parameters Parameters of 3DT1 sequence were as follow: spatial resolution = (1.1x1.1x1.1) mm3; TE/TR = 2.8-3ms/minimum; Bandwidth: 240-255 Hz. The 64 subjects imaged on a Siemens MR also underwent DTI with the following parameters: spatial resolution = (2x2x2.5) mm3; TE/TR = 90/7300ms; Bandwidth = 1580 Hz. Each DTI scan comprised 64 directions diffusion-weighted images (b value = 1000 s/mm2), 9 T2-weighted images (b value = 0 s/mm2) and a B0 field map.

© 2017 American Medical Association. All rights reserved.
eFigure 1. Correlation between age and expected years to onset
In c9+ subjects, real age and expected years to onset (based on the mean familial age at onset) showed strong correlation with high shared variance (Pearson correlation coefficient, p < 0.0001; r2 = 0.802).

© 2017 American Medical Association. All rights reserved.
eFigure 2. Diffusion tensor magnetic resonance imaging metrics
Graphs of DTI metrics as a function of age in c9+ and c9- subjects. The exact position of x-values (age) is not provided, in order to prevent individual subjects from identifying their mutation status.
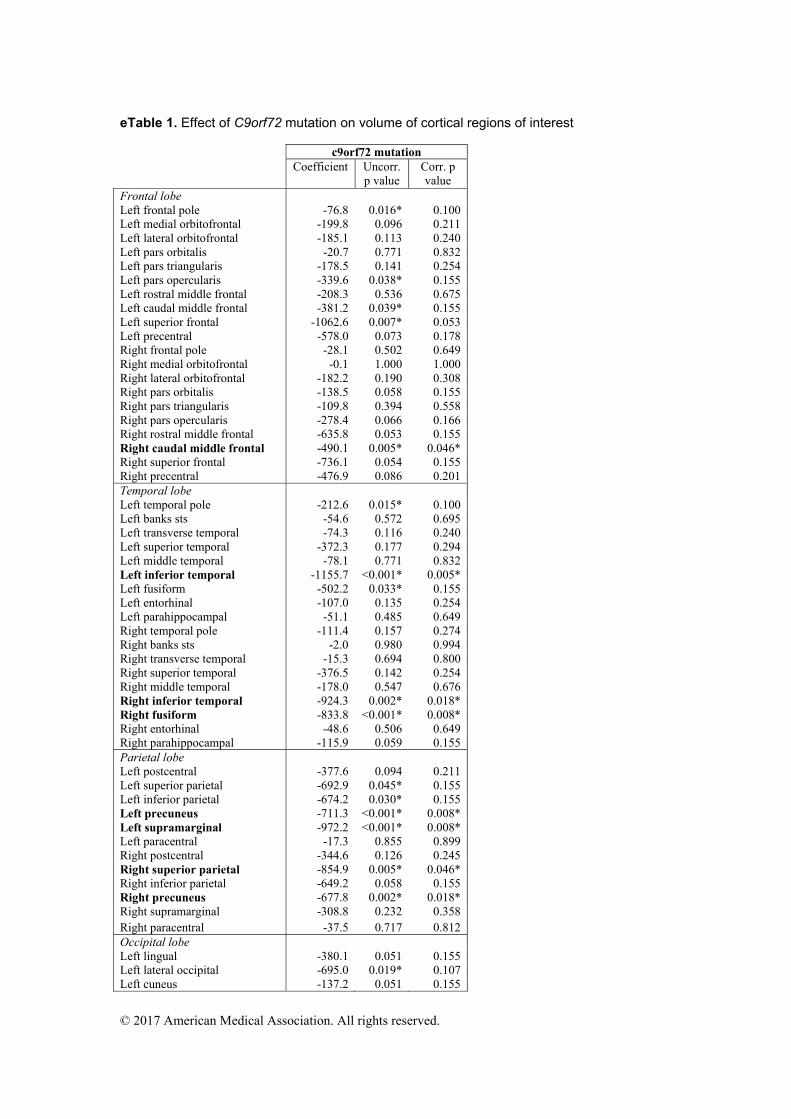
© 2017 American Medical Association. All rights reserved.
eTable 1. Effect of C9orf72 mutation on volume of cortical regions of interest c9orf72 mutation Coefficient Uncorr.
p value Corr. p value
Frontal lobe Left frontal pole -76.8 0.016* 0.100Left medial orbitofrontal -199.8 0.096 0.211 Left lateral orbitofrontal -185.1 0.113 0.240 Left pars orbitalis -20.7 0.771 0.832Left pars triangularis -178.5 0.141 0.254 Left pars opercularis -339.6 0.038* 0.155 Left rostral middle frontal -208.3 0.536 0.675Left caudal middle frontal -381.2 0.039* 0.155 Left superior frontal -1062.6 0.007* 0.053 Left precentral -578.0 0.073 0.178Right frontal pole -28.1 0.502 0.649 Right medial orbitofrontal -0.1 1.000 1.000 Right lateral orbitofrontal -182.2 0.190 0.308Right pars orbitalis -138.5 0.058 0.155 Right pars triangularis -109.8 0.394 0.558 Right pars opercularis -278.4 0.066 0.166Right rostral middle frontal -635.8 0.053 0.155 Right caudal middle frontal -490.1 0.005* 0.046* Right superior frontal -736.1 0.054 0.155 Right precentral -476.9 0.086 0.201 Temporal lobe Left temporal pole -212.6 0.015* 0.100 Left banks sts -54.6 0.572 0.695 Left transverse temporal -74.3 0.116 0.240 Left superior temporal -372.3 0.177 0.294 Left middle temporal -78.1 0.771 0.832 Left inferior temporal -1155.7 <0.001* 0.005* Left fusiform -502.2 0.033* 0.155 Left entorhinal -107.0 0.135 0.254 Left parahippocampal -51.1 0.485 0.649 Right temporal pole -111.4 0.157 0.274 Right banks sts -2.0 0.980 0.994 Right transverse temporal -15.3 0.694 0.800 Right superior temporal -376.5 0.142 0.254 Right middle temporal -178.0 0.547 0.676 Right inferior temporal -924.3 0.002* 0.018* Right fusiform -833.8 <0.001* 0.008* Right entorhinal -48.6 0.506 0.649 Right parahippocampal -115.9 0.059 0.155 Parietal lobe Left postcentral -377.6 0.094 0.211 Left superior parietal -692.9 0.045* 0.155 Left inferior parietal -674.2 0.030* 0.155 Left precuneus -711.3 <0.001* 0.008* Left supramarginal -972.2 <0.001* 0.008* Left paracentral -17.3 0.855 0.899 Right postcentral -344.6 0.126 0.245 Right superior parietal -854.9 0.005* 0.046* Right inferior parietal -649.2 0.058 0.155 Right precuneus -677.8 0.002* 0.018* Right supramarginal -308.8 0.232 0.358 Right paracentral -37.5 0.717 0.812 Occipital lobe Left lingual -380.1 0.051 0.155Left lateral occipital -695.0 0.019* 0.107 Left cuneus -137.2 0.051 0.155

© 2017 American Medical Association. All rights reserved.
Left pericalcarine 76.2 0.213 0.336 Right lingual -132.0 0.501 0.649 Right lateral occipital -590.6 0.051 0.155 Right cuneus -117.5 0.163 0.277 Right pericalcarine 111.1 0.122 0.245 Cingulate gyrus Left rostral anterior cingulate -74.8 0.349 0.505 Left caudal anterior cingulate -38.2 0.728 0.812 Left isthmus cingulate -142.3 0.059 0.155 Left posterior cingulate -13.7 0.890 0.917 Right rostral anterior cingulate -93.2 0.265 0.400 Right caudal anterior cingulate 18.5 0.859 0.899 Right isthmus cingulate -32.6 0.670 0.785 Right posterior cingulate 42.8 0.589 0.702 Insula Left insula -111.3 0.320 0.473 Right insula -96.1 0.441 0.613 Effect of c9orf72 mutation on volume of cortical ROI, with age and sex as covariates. Uncorr.: uncorrected for multiple comparison; Corr.: corrected for multiple comparisons. Cortical ROI showing significant p-value after correction are shown in bold.

© 2017 American Medical Association. All rights reserved.
eTable 2. Effect of C9orf72 mutation on volume of subcortical structures c9orf72 mutation Coefficient Uncorr. p
value Corr. p value
Left cerebellum cortex -1043.4 0.385 0.629 Right cerebellum cortex -687.2 0.570 0.790
Left ventral diencephalon -31.3 0.704 0.810 Right ventral diencephalon -7.8 0.915 0.935
Left putamen -141.9 0.302 0.556 Right putamen -176.0 0.176 0.420 Left pallidum -84.6 0.065 0.342
Right pallidum -57.1 0.186 0.420 Left caudate -25.8 0.720 0.810
Right caudate -6.6 0.935 0.935 Left accumbens area -18.5 0.480 0.720
Right accumbens area -24.5 0.309 0.556 Left amygdala -20.2 0.659 0.810
Right amygdala -71.1 0.151 0.420 Left thalamus proper -383.0 0.022* 0.202
Right thalamus proper -444.1 0.001* 0.010* Left hippocampus -161.6 0.100 0.360
Right hippocampus -175.6 0.076 0.342 Effect of c9orf72 mutation on volume of subcortical structures, with age and sex as covariates. Uncorr.: uncorrected for multiple comparison; Corr.: corrected for multiple comparisons. Subcortical ROI showing significant p-value after correction is shown in bold.
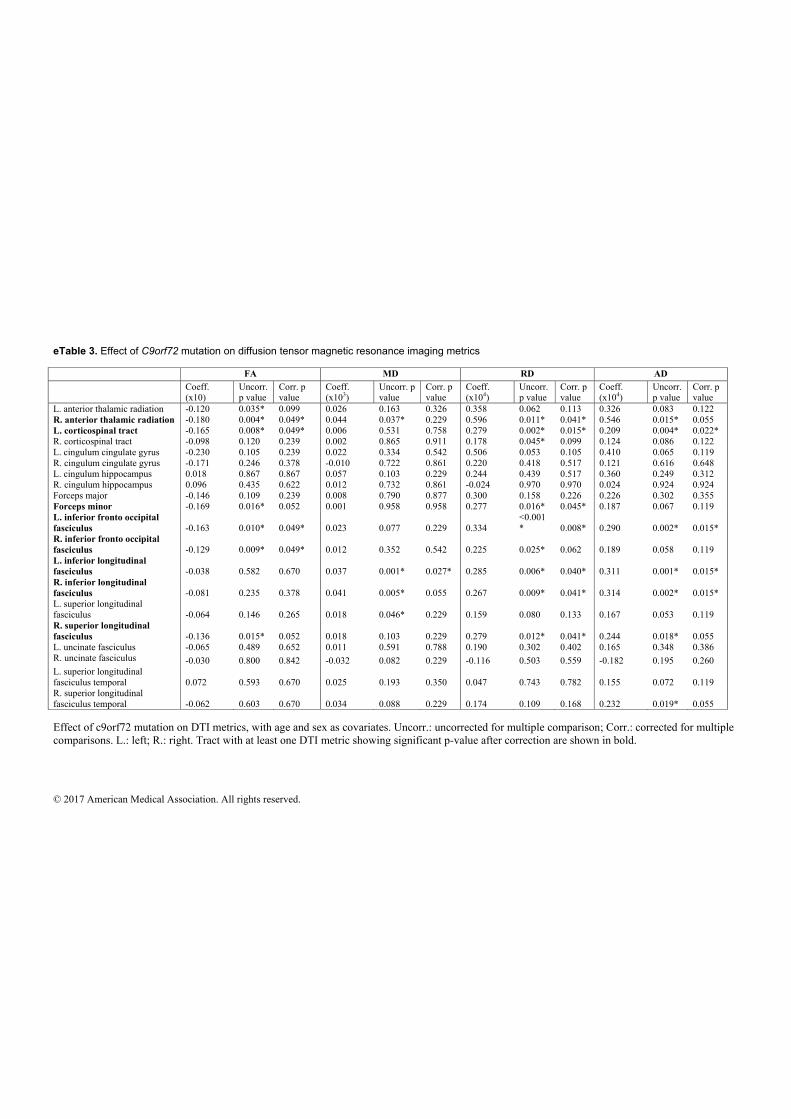
© 2017 American Medical Association. All rights reserved.
eTable 3. Effect of C9orf72 mutation on diffusion tensor magnetic resonance imaging metrics FA MD RD AD Coeff.
(x10) Uncorr. p value
Corr. p value
Coeff. (x103)
Uncorr. p value
Corr. p value
Coeff. (x104)
Uncorr. p value
Corr. p value
Coeff. (x104)
Uncorr. p value
Corr. p value
L. anterior thalamic radiation -0.120 0.035* 0.099 0.026 0.163 0.326 0.358 0.062 0.113 0.326 0.083 0.122 R. anterior thalamic radiation -0.180 0.004* 0.049* 0.044 0.037* 0.229 0.596 0.011* 0.041* 0.546 0.015* 0.055 L. corticospinal tract -0.165 0.008* 0.049* 0.006 0.531 0.758 0.279 0.002* 0.015* 0.209 0.004* 0.022* R. corticospinal tract -0.098 0.120 0.239 0.002 0.865 0.911 0.178 0.045* 0.099 0.124 0.086 0.122 L. cingulum cingulate gyrus -0.230 0.105 0.239 0.022 0.334 0.542 0.506 0.053 0.105 0.410 0.065 0.119 R. cingulum cingulate gyrus -0.171 0.246 0.378 -0.010 0.722 0.861 0.220 0.418 0.517 0.121 0.616 0.648 L. cingulum hippocampus 0.018 0.867 0.867 0.057 0.103 0.229 0.244 0.439 0.517 0.360 0.249 0.312 R. cingulum hippocampus 0.096 0.435 0.622 0.012 0.732 0.861 -0.024 0.970 0.970 0.024 0.924 0.924 Forceps major -0.146 0.109 0.239 0.008 0.790 0.877 0.300 0.158 0.226 0.226 0.302 0.355 Forceps minor -0.169 0.016* 0.052 0.001 0.958 0.958 0.277 0.016* 0.045* 0.187 0.067 0.119 L. inferior fronto occipital fasciculus -0.163 0.010* 0.049* 0.023 0.077 0.229 0.334
<0.001* 0.008* 0.290 0.002* 0.015*
R. inferior fronto occipital fasciculus -0.129 0.009* 0.049* 0.012 0.352 0.542 0.225 0.025* 0.062 0.189 0.058 0.119 L. inferior longitudinal fasciculus -0.038 0.582 0.670 0.037 0.001* 0.027* 0.285 0.006* 0.040* 0.311 0.001* 0.015* R. inferior longitudinal fasciculus -0.081 0.235 0.378 0.041 0.005* 0.055 0.267 0.009* 0.041* 0.314 0.002* 0.015* L. superior longitudinal fasciculus -0.064 0.146 0.265 0.018 0.046* 0.229 0.159 0.080 0.133 0.167 0.053 0.119 R. superior longitudinal fasciculus -0.136 0.015* 0.052 0.018 0.103 0.229 0.279 0.012* 0.041* 0.244 0.018* 0.055 L. uncinate fasciculus -0.065 0.489 0.652 0.011 0.591 0.788 0.190 0.302 0.402 0.165 0.348 0.386 R. uncinate fasciculus -0.030 0.800 0.842 -0.032 0.082 0.229 -0.116 0.503 0.559 -0.182 0.195 0.260 L. superior longitudinal fasciculus temporal 0.072 0.593 0.670 0.025 0.193 0.350 0.047 0.743 0.782 0.155 0.072 0.119 R. superior longitudinal fasciculus temporal -0.062 0.603 0.670 0.034 0.088 0.229 0.174 0.109 0.168 0.232 0.019* 0.055 Effect of c9orf72 mutation on DTI metrics, with age and sex as covariates. Uncorr.: uncorrected for multiple comparison; Corr.: corrected for multiple comparisons. L.: left; R.: right. Tract with at least one DTI metric showing significant p-value after correction are shown in bold.

© 2017 American Medical Association. All rights reserved.
eReferences. 1. Folstein MF, Folstein SE, McHugh PR. “Mini-mental state”. A practical method for grading the cognitive state of patients for the clinician. J Psychiatr Res. 1975;12(3):189-198. 2. Mattis S. Mental status examination for organic mental syndrome in the elderly patients. In: Geriatrics Psychiatry: A Handbook for Psychiatrists and Primary Care Physicians. New York: Grune & Stratton; 1976:77-121. 3. Dubois B, Slachevsky A, Litvan I, Pillon B. The FAB: a Frontal Assessment Battery at bedside. Neurology. 2000;55(11):1621-1626. 4. Funkiewiez A, Bertoux M, de Souza LC, Lévy R, Dubois B. The SEA (Social cognition and Emotional Assessment): a clinical neuropsychological tool for early diagnosis of frontal variant of frontotemporal lobar degeneration. Neuropsychology. 2012;26(1):81-90. doi:10.1037/a0025318. 5. Peigneux P, Van Der Linden M. Présentation d’une batterie neuropsychologique et cognitive pour l’évaluation de l’apraxie gestuelle. Rev Neuropsychol. 2000;10(2):311-362.


155
Appendix B
Neurite density is reduced in thepresymptomatic phase of C9orf72disease
This appendix is the supplementary material of the Chapter 3, which has beenpublished as a journal article on Journal of Neurology, Neurosurgery, and Psychi-atry (wen_neurite_nodate):
• Wen, J., Zhang, H., Alexander, D., Durrleman, S., Routier, A., Rinaldi, D.,Houot, M., Couratier, P., Hannequin, D., Pasquier, F., Zhang, J., Colliot, O.,Le Ber, I. and Bertrand, A. Neurite density is reduced in the presymptomaticphase of C9orf72 disease, J Neurol Neurosurg Psychiatry, pp.jnnp-2018. https://hal.inria.fr/hal-01907482/document.

Wen supplementary
1
Supplementary material Appendix e-1: Regions for gray matter analyses. Appendix e-2: Regions for white matter analyses. Appendix e-3: Mixed effects model. Figure e-1: Color-coded representation of P values corresponding to the associations of C9orf72 mutation with white matter integrity before correction for multiple comparisons. Figure e-2: Color-coded representation of P values corresponding to the associations of C9orf72 mutation with the cortical ROI measures before correction for multiple comparisons. Figure e-3: Color-coded representation of P values corresponding to the associations of C9orf72 mutation with the subcortical ROI measures before correction for multiple comparisons. Table e-1: Effect sizes for DTI metrics and for NDI in white matter tracts. Table e-2: Effect sizes for FWF and gray matter volume in cortical regions. Table e-3: Effect sizes for FWF and gray matter volume in subcortical regions.

Wen supplementary
2
Appendix e-1. Regions for gray matter analyses. We studied the following 68 cortical regions obtained from the Desikan-Killiany atlas: Frontal lobe: left frontal pole, left medial orbitofrontal, left lateral orbitofrontal, left pars orbitalis, left pars triangularis, left pars opercularis, left rostral middle frontal, left caudal, middle frontal, left superior frontal, left precentral, right frontal pole, right medial orbitofrontal, right lateral orbitofrontal, right pars orbitalis, right pars triangularis, right pars opercularis, right rostral middle frontal, right caudal middle frontal, right superior frontal, right precentral. Temporal lobe: left temporal pole, left banks sts, left transverse temporal, left superior temporal, left middle temporal, left inferior temporal, left fusiform, left entorhinal, left parahippocampal, right temporal pole, right banks sts , right transverse temporal, right superior temporal, right middle temporal, right inferior temporal, right fusiform, right entorhinal, right parahippocampal. Parietal lobe: left postcentral, left superior parietal, left inferior parietal, left precuneus, left supramarginal, left paracentral, right postcentral, right superior parietal, right inferior parietal, right precuneus, right supramarginal, right paracentral. Occipital lobe: left lingual, left lateral occipital, left cuneus, left pericalcarine, right lingual, right lateral occipital, right cuneus, right pericalcarine. Cingulate gyrus: left rostral anterior cingulate, left caudal anterior cingulate, left isthmus cingulate, left posterior cingulate, right rostral anterior cingulate, right caudal anterior cingulate, right isthmus cingulate, right posterior cingulate. Insula: left insula, right insula. The following 18 subcortical regions were included for gray matter volume analyses: left cerebellum cortex, right cerebellum cortex, left ventral diencephalon, right ventral diencephalon, left putamen, right putamen, left pallidum, right pallidum, left caudate, right caudate, left accumbens area, right accumbens area, left amygdala, right amygdala, left thalamus proper, right thalamus proper, left hippocampus, right hippocampus. The following 12 subcortical regions were included for gray matter FWF analyses. The other 6 ROIs were excluded because, after the 2-voxel erosion procedure, they were too small to produce reliable regional estimates. left putamen, right putamen, left pallidum, right pallidum, left caudate, right caudate, left amygdala, right amygdala, left thalamus proper, right thalamus proper, left hippocampus, right hippocampus. Appendix e-2: Regions for white matter analyses. We studied the following 20 tracts based on JHU atlas for white matter analyses: left anterior thalamic radiation, right anterior thalamic radiation, left corticospinal tract, right corticospinal tract, left cingulum cingulate gyrus, right cingulum cingulate gyrus, left cingulum hippocampus, right cingulum hippocampus, forceps major, forceps major, left inferior fronto-occipital fasciculus, right inferior fronto-occipital fasciculus, left inferior longitudinal fasciculus, right inferior longitudinal fasciculus, left superior longitudinal fasciculus, right superior longitudinal fasciculus, right uncinate fasciculus, left uncinate fasciculus, left superior longitudinal fasciculus temporal, right superior longitudinal fasciculus temporal.
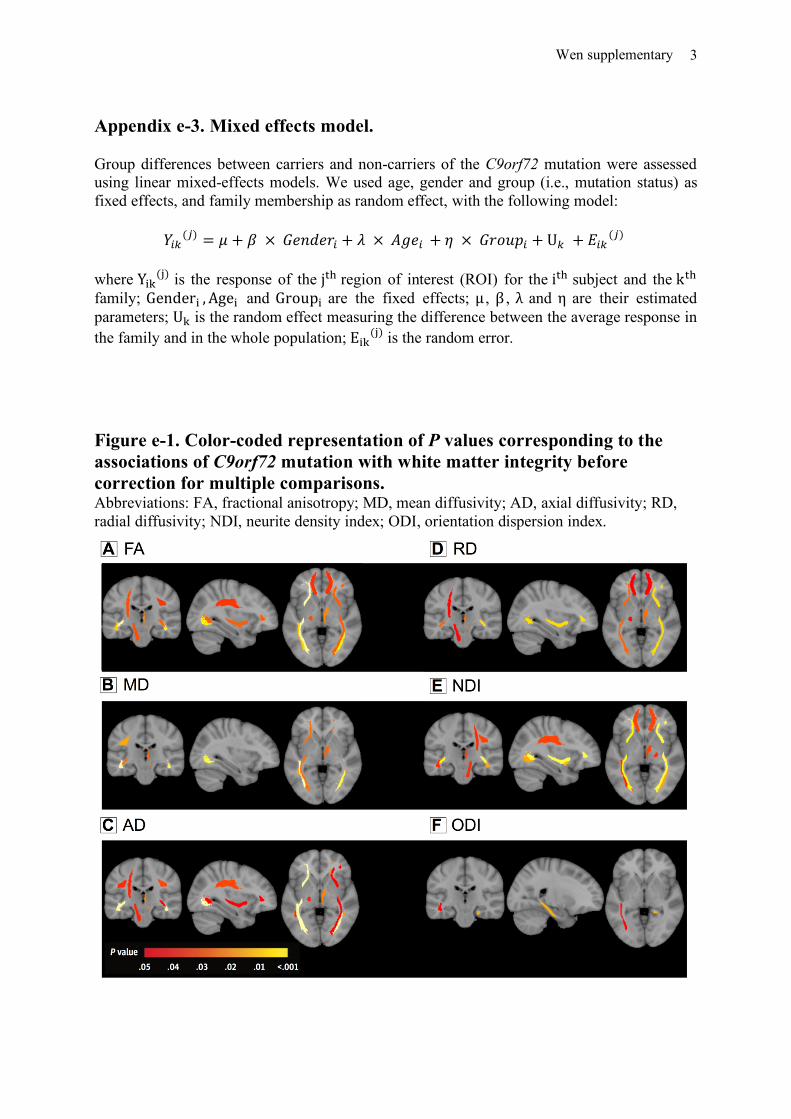
Wen supplementary
3
Appendix e-3. Mixed effects model. Group differences between carriers and non-carriers of the C9orf72 mutation were assessed using linear mixed-effects models. We used age, gender and group (i.e., mutation status) as fixed effects, and family membership as random effect, with the following model:
!"#(%) = ( + * ×-./0.1" + 2 ×34." + 5 ×-1678" + U# + :"#
(%) where Y<=(>) is the response of the j@Aregion of interest (ROI) for the i@A subject and thek@A family; Gender<, Age< and Group< are the fixed effects; µ , β , λ and η are their estimated parameters; U= is the random effect measuring the difference between the average response in the family and in the whole population; E<=(>)is the random error. Figure e-1. Color-coded representation of P values corresponding to the associations of C9orf72 mutation with white matter integrity before correction for multiple comparisons. Abbreviations: FA, fractional anisotropy; MD, mean diffusivity; AD, axial diffusivity; RD, radial diffusivity; NDI, neurite density index; ODI, orientation dispersion index.

Wen supplementary
4
Table e-1. Effect sizes for DTI metrics and for NDI in white matter tracts. The effect sizes for both NDI and DTI are shown below. For DTI, only the largest effect size among the different DTI metrics is shown. For regions for which a significant difference between C9+ and C9- was detected for any of the metrics, we compared the effect size of NODDI to that of DTI using a permutation test procedures with 10000 iterations. The table presents the P values corresponding to these permutation tests (with a significance level of P < 0.05). Abbreviations: ART, anterior thalamus radiation tract; CST, cortico-spinal tract; CCG, Cingulum (cingulate gyrus) tract; CH, Cingulum (hippocampus) tract; Fmajor, forceps major tract; Fminor, forceps minor tract; IFOF, inferior fronto-occipital fasciculus; ILF, inferior longitudinal fasciculus; SLF, superior longitudinal fasciculus; UF, uncinate fasciculus; SLFT, superior longitudinal fasciculus (temporal part); R., right; L., left; NDI, neurite density index; DTI, diffusion tensor imaging; NA, not applicable.
ROI Effect size (NDI/DTI)
P value ROI Effect size (NDI/DTI)
P value
L.ART 0.06/0.04 NA L.IFOF 0.2/0.21 0.773 R.ATR 0.12/0.09 0.365 R.IFOF 0.27/0.11 0.009* L.CST 0.05/0.07 NA L.ILF 0.09/0.23 0.051 R.CST 0.09/0.03 0.154 R.ILF 0.16/0.17 0.719 L.CCG 0.03/0.04 NA L.SLF 0.08/0.06 NA R.CCG 0.02/0.02 NA R.SLF 0.13/0.07 0.139 L.CH 0.01/0.05 NA L.UF 0.03/0.02 NA R.CH 0.07/0.01 NA R.UF 0.17/0.01 0.008*
Fmajor 0.09/0.05 0.207 L.SLFT 0.06/0.05 NA Fminor 0.1/0.06 0.307 R.SLFT 0.06/0.1 0.258
Figure e-2. Color-coded representation of P values corresponding to the associations of C9orf72 mutation with the cortical ROI measures before correction for multiple comparisons. Abbreviations: FWF, free water fraction.

Wen supplementary
5
Table e-2: Effect sizes for FWF metrics and gray matter volume in cortical regions. The effect sizes for both FWF and gray matter volume in cortical regions are shown below. For regions for which a significant difference between C9+ and C9- was detected for any of the metrics, we compared the effect size of FWF to that of volumetry using a permutation test procedures with 10000 iterations. The table presents the P values corresponding to these permutation tests (with a significance level of P < 0.05). Abbreviations: CMF, caudal middle frontal cortex; CUN, cuneus cortex; FUS, fusiform; IP, inferior parietal cortex; IT, inferior temporal cortex; INS, insula; LO, lateral occipital cortex; LIN, lingual; PPC, pars opercularis cortex; PCC, pericalcarine; POC, postcentral cortex; PREC, precuneus; RMF, rostral middle frontal cortex; SP, superior parietal cortex; SM, supramarginal cortex; TP, temporal pole cortex; MOF, medial orbitofrontal cortex; BK, bankssts cortex; CAC, caudal anterior cingulate cortex; ENT, entorhinal cortex; FP, frontal pole cortex; IC, isthmus cingulate cortex; LOF, lateral orbitofrontal cortex; MT, middle temporal cortex; PAC, paracentral cortex; PHC, para hippocampal cortex; PB, pars orbitalis cortex; PTR, pars triangularis cortex; PCG, posterior cingulate cortex; PRC, precentral cortex; RAC, rostral anterior cingulate cortex; SF, superior frontal cortex; ST, superior temporal cortex; TT, transverse temporal cortex; R., right; L., left; FWF, free water fraction; NA, not applicable.
ROI Effect size (FWF/Volumetry)
P value ROI Effect size (FWF/Volumetry)
P value
L.CMF 0.06/0.12 0.734 L.PREC 0.12/0.23 0.466 L.CUN 0.06/0.03 0.653 L.RMF 0.1/0 0.052 L.FUS 0.09/0.12 0.305 L.SP 0.1/0.09 0.712 L.IP 0.11/0.01 0.072 L.SM 0.11/0.18 0.639 L.IT 0.17/0.14 0.259 L.TP 0/0.12 0.025*
L.INS 0.19/0 0.002* R.FUS 0.06/0.17 0.096 L.LO 0.32/0.09 0.001* R.IT 0.07/0.15 0.406 L.LIN 0.11/0.06 0.092 R.MOF 0.12/0.02 0.051 L.PPC 0.12/0.06 0.201 R.PREC 0.07/0.14 0.483 L.PCC 0.12/0.01 0.008* R.SP 0.03/0.14 0.140 L.POC 0.09/0.08 0.558 L.PB 0.08/0 NA R.CMF 0.04/0.06 NA L.PTR 0.08/0.01 NA L.BK 0.08/0.01 NA L.PCG 0.06/0 NA
L.CAC 0.04/0.01 NA L.PRC 0.07/0.09 NA L.ENT 0.02/0.01 NA L.RAC 0/0.01 NA L.FP 0.02/0.1 NA L.SF 0.06/0.11 NA L.IC 0.01/0.02 NA L.ST 0.01/0.04 NA
L.LOF 0.11/0.06 NA L.TT 0.01/0.04 NA L.MOF 0.01/0.01 NA R.BK 0.05/0.01 NA L.MT 0.08/0.01 NA R.CAC 0.04/0.03 NA L.PAC 0.02/0.02 NA R.CUN 0/0.04 NA L.PHC 0.07/0 NA R.ENT 0.06/0 NA R.FP 0.04/0 NA R.IP 0.01/0.01 NA R.INS 0.05/0.02 NA R.IC 0.04/0 NA R.LOF 0.08/0.01 NA R.LO 0.06/0.04 NA R.LIN 0.04/0.02 NA R.MT 0.06/0.07 NA R.PAC 0.05/0.03 NA R.PRC 0.03/0.06 NA R.PHC 0.03/0.09 NA R.RAC 0.08/0.02 NA R.PPC 0.09/0.03 NA R.RMF 0.06/0.02 NA

Wen supplementary
6
R.PB 0.04/0.08 NA R.SF 0.09/0.08 NA R.PTR 0.04/0.03 NA R.ST 0.07/0.04 NA R.PCC 0.09/0.01 NA R.SM 0.03/0.05 NA R.POC 0.05/0.05 NA R.TP 0.04/0.06 NA R.PCG 0.09/0 NA R.TT 0/0.01 NA
Figure e-3. Color-coded representation of P values corresponding to the associations of C9orf72 mutation with the subcortical ROI measures before correction for multiple comparisons. Abbreviations: FWF, free water fraction.
Table e-3. Effect sizes for FWF metrics and gray matter volume in subcortical regions. The effect sizes for both FWF and gray matter volume in subcortical regions are shown below. For regions for which a significant difference between C9+ and C9- was detected for any of the metrics, we compared the effect size of FWF to that of volumetry using a permutation test procedures with 10000 iterations. The table presents the P values corresponding to these permutation tests (with a significance level of P < 0.05). For FWF effect size analysis, 6 ROIs were excluded because, after the 2-voxel erosion procedure, they were too small to produce reliable regional estimates. Abbreviations: CB, cerebellum cortex; VD, ventral diencephalon; PUT, putamen; PAL, pallidum; CAU, caudate; ACC, accumbens area; THA, thalamus; HIP, hippocampus; FWF, free water fraction; NA, not applicable.
ROI Effect size (FWF/Volumetry)
P value ROI Effect size (FWF/Volumetry)
P value
L. CB NA/0 NA R.CAU 0.01/0 NA R.CB NA/0 NA L.ACC NA/0 NA

Wen supplementary
7
L.VD NA/0 NA R.ACC NA/0 NA R.VD NA/0 NA L.AMY 0/0.03 NA L.PUT 0.05/0.03 NA R.AMY 0/0.04 NA R.PUT 0.03/0.05 NA L.THA 0.06/0.05 NA L.PAL 0/0.02 NA R.THA 0.03/0.16 0.062 R.PAL 0.09/0.02 NA L.HIP 0/0.10 NA L.CAU 0.02/0.00 NA R.HIP 0/0.11 NA

163
Appendix C
Convolutional Neural Networks forClassification of Alzheimer’s Disease:Overview and ReproducibleEvaluation
This appendix is the supplementary material of the Chapter 5, which has beensubmitted to a journal article on to Medical Image Analysis:
• Wen, J., Thibeau–Sutre, E., Samper-González., J, Routier, A., Bottani, S., Dur-rleman, S., Burgos, N., Colliot, O. Convolutional Neural Networks for Clas-sification of Alzheimer’s Disease: Overview and Reproducible Evaluation,Submitted to Medical Image Analysis. https://arxiv.org/pdf/1904.07773.pdf.

Convolutional Neural Networks for Classification of
Alzheimer’s Disease: Overview and Reproducible Evaluation
Supplementary Material
Junhao Wen a,b,c,d,e, Elina Thibeau--Sutre a,b,c,d,e, Jorge Samper-González e,a,b,c,d, Alexandre Routier e,a,b,c,d,, Simona Bottanie,a,b,c,d, Stanley Durrleman e,a,b,c,d, Ninon Burgos a,b,c,d,e, Olivier
Colliota,b,c,d,e,f , for the Alzheimer’s Disease Neuroimaging Initiative and the Australian Imaging Biomarkers and Lifestyle flagship study of ageing
aInstitut du Cerveau et de la Moelle épinière, ICM, F-75013, Paris, France
bSorbonne Université, F-75013, Paris, France
cInserm, U 1127, F-75013, Paris, France
dCNRS, UMR 7225, F-75013, Paris, France
eInria, Aramis project-team, F-75013, Paris, France
fAP-HP, Hôpital de la Pitié Salpêtrière, Department of Neurology and Neuroradiology, F-75013,
Paris, France
We present additional methodological explanations, tables and figures in this supplementary material. More specifically, we first present in detail the methodology of our literature review (eMethod 1). We then describe the datasets used in our study in eMethod 2. From eTable1 to eTable3, we present the architecture hyperparameters for the chosen models. The training hyperparameters for autoencoder pre-training and classification are shown in eTable 4 and eTable 5, respectively. Lastly, the monitoring of training process, including the display of the training/validation loss and accuracy, is presented from eFigure 1 to eFigure 4.
eMethod 1. Literature search method
eMethod 2. Datasets used in our study
eTable 1. Architecture for 3D subject-level CNN. eTable 2. Architecture for 3D ROI-based and patch-level CNN eTable 3. Architecture for 2D slice-level CNN eTable 4 . Training hyperparameters for classification experiments. eTable 5 . Training hyperparameters for autoencoder pretraining experiments. eFigure 1. Training process monitoring for 3D subject-level CNN eFigure 2. Training process monitoring for 3D ROI-based CNN eFigure 3. Training process monitoring for 3D patch-level CNN eFigure 4. Training process monitoring for 2D slice-level CNN

eMethod 1. Literature search methodology
We searched PubMed and Scopus for articles published up to the time of the search (15th of January 2019). Our request contains words linked to four different concepts: Alzheimer’s disease, classification, deep learning and neuroimaging. The words matching these concepts were identified in the abstracts and titles of the articles of a first bibliography done on Google Scholar. In Scopus a restriction was added to remove the articles linked to electroencephalography that appeared with our query and were out of our scope. This restriction was not applied in PubMed as it concerns only a few articles (less than 10). The line of the query linked to the neuroimaging concept was extended to all fields, as some authors do not mention at all in the title, abstract or keywords the modalities that they employed. Scopus query:
TITLE-ABS-KEY ( alzheimer's OR alzheimer OR "Mild Cognitive Impairment" ) AND TITLE-ABS-KEY ( classification OR diagnosis OR identification OR detection OR recognition ) AND TITLE-ABS-KEY ( cnn OR "Convolutional Network" OR "Deep Learning” OR "Neural Network" OR autoencoder OR gan ) AND ALL ( mri OR "Magnetic Resonance Imaging" OR "Structural Magnetic Resonance Imaging" OR neuroimaging OR brain-imaging ) AND NOT TITLE-ABS-KEY ( eeg OR eegs OR electroencephalogram OR electroencephalographic ) PubMed query:
(alzheimer's [Title/Abstract] OR alzheimer [Title/Abstract] OR "Mild Cognitive Impairment" [Title/Abstract] ) AND (cnn OR "Convolutional Network" [Title/Abstract] OR "Deep Learning" [Title/Abstract] OR "Neural Network" [Title/Abstract] OR autoencoder [Title/Abstract] OR gan [Title/Abstract] ) AND (classification [Title/Abstract] OR diagnosis [Title/Abstract] OR identification [Title/Abstract] OR detection [Title/Abstract] OR recognition [Title/Abstract] ) AND (mri OR "Magnetic Resonance Imaging" OR "Structural Magnetic Resonance Imaging" OR neuroimaging OR brain-imaging)
391 records were found with Scopus and 80 records were found with PubMed. After merging the two sets and removing duplicates, 406 records were identified. Before filtering the result, we removed from this list 10 conference proceedings books and 1 non-english article. We finally ended with 395 records to filter.
Once identified, all records were filtered in a 3-step process. We selected the records based on the abstract, the type and the content.
1.1. Record screening based on abstract
During this step, the abstracts of the articles were read to keep only the methods corresponding to the following criteria:
- use of anatomical MRI (when the modality was specified), - classification of AD stages, then we excluded papers using deep learning to preprocess, segment or
complete data, as well as the classification of different diseases or classification of different symptoms in AD population (depression, ICD…),
- exclusion of animal models, - exclusion of reviews.

We chose to exclude the 31 reviews of our set as none of them focused on our topic. We did not detail the reasons of the exclusion of the papers in the diagram as many papers cumulate several criteria of exclusion. After this screening phase, we were left with 124 records.
1.2. Record screening based on type
Our search on PubMed and Scopus comprises only peer-reviewed items. However, there is a different level of peer-review between conference papers and journal articles, hence we kept all journal articles and recent conference papers (published since 2017). We decided to not only restrict to journal articles because it would have reduced the number of items to 48. We decided to keep recent conference papers because we considered that if the older ones were not transformed into journal articles it may mean that their contributions were not sufficient. After this step, the set contained 93 items.
1.3. Record screening based on content
This step was mainly used to sort the papers between the different sections of our state-of-the art. We detected in this way papers that were out of the scope of our review (longitudinal and multimodal studies, deep learning techniques other than CNN). We excluded only 22 papers because of i) use of another modality (1 paper); ii) duplicate content (2 papers); iii) lack of explanation on the method employed (7 papers); iv) no access to the content (12 papers). This step was reviewed by another member of the team to confirm the exclusions. In the end, our search resulted in 71 conference and journal articles, including 32 that are centered on our topic.
Diagram summarizing the bibliographic methodology
eMethod 2. Datasets used in our study
Part of the data used in the preparation of this article were obtained from the Alzheimer’s Disease Neuroimaging Initiative database (adni.loni.usc.edu). The ADNI was launched in 2003 as a public-private partnership, led by Principal Investigator Michael W. Weiner, MD. The primary goal of ADNI has been to test whether serial MRI, PET, other biological markers, and clinical and neuropsychological assessment can be combined to measure the progression of mild cognitive impairment (MCI) and early AD. Over 1,650 participants were recruited across North America during the three phases of the study (ADNI1, ADNI GO and ADNI2). Around 400 participants were diagnosed with AD, 900 with MCI and 350 were control subjects. Three main criteria were used to classify the subjects (Petersen et al. 2010). The normal subjects had no memory complaints, while the subjects with MCI and AD both had to have complaints. CN and MCI subjects had a mini-mental state examination (MMSE) score between 24 and 30 (inclusive), and AD subjects between 20 and 26 (inclusive). The CN subjects had a clinical dementia rating (CDR) score of 0, the MCI subjects of 0.5 with a mandatory requirement of the memory box score being 0.5 or greater, and the AD subjects of 0.5 or 1. The other criteria can be found in (Petersen et al. 2010).
We also used data collected by the AIBL study group. Similarly to ADNI, the Australian Imaging, Biomarker & Lifestyle Flagship Study of Ageing seeks to discover which biomarkers, cognitive characteristics, and health and lifestyle factors determine the development of AD. AIBL has enrolled 1100 participants and collected over 4.5 years worth of longitudinal data: 211 AD patients, 133 MCI patients and 768 comparable healthy controls. AIBL study methodology has been reported previously (Ellis et al. 2009; Ellis et al. 2010). Briefly, the MCI diagnoses were made according to a protocol based on the criteria of, (Winblad et al. 2004) and the AD diagnoses on the NINCDS-ADRDA criteria (McKhann et al. 1984). Note that about half of the subjects diagnosed as healthy controls reported memory complaints (Ellis et al. 2009; Ellis et al. 2010).
Finally, we used data from the Open Access Series of Imaging Studies project whose aim is to make MRI datasets of the brain freely available to the scientific community. We focused on the "Cross-sectional MRI Data in Young, Middle Aged, Nondemented and Demented Older Adults" set (Marcus et al. 2007), which consists of a cross-sectional collection of 416 subjects aged 18 to 96. 100 of the included subjects over the age of 60 have been clinically diagnosed with very mild to moderate AD. The criteria used to evaluate the diagnosis was the CDR score. All participants with a CDR greater than 0 were diagnosed with probable AD. Note that there are no MCI subjects in OASIS.
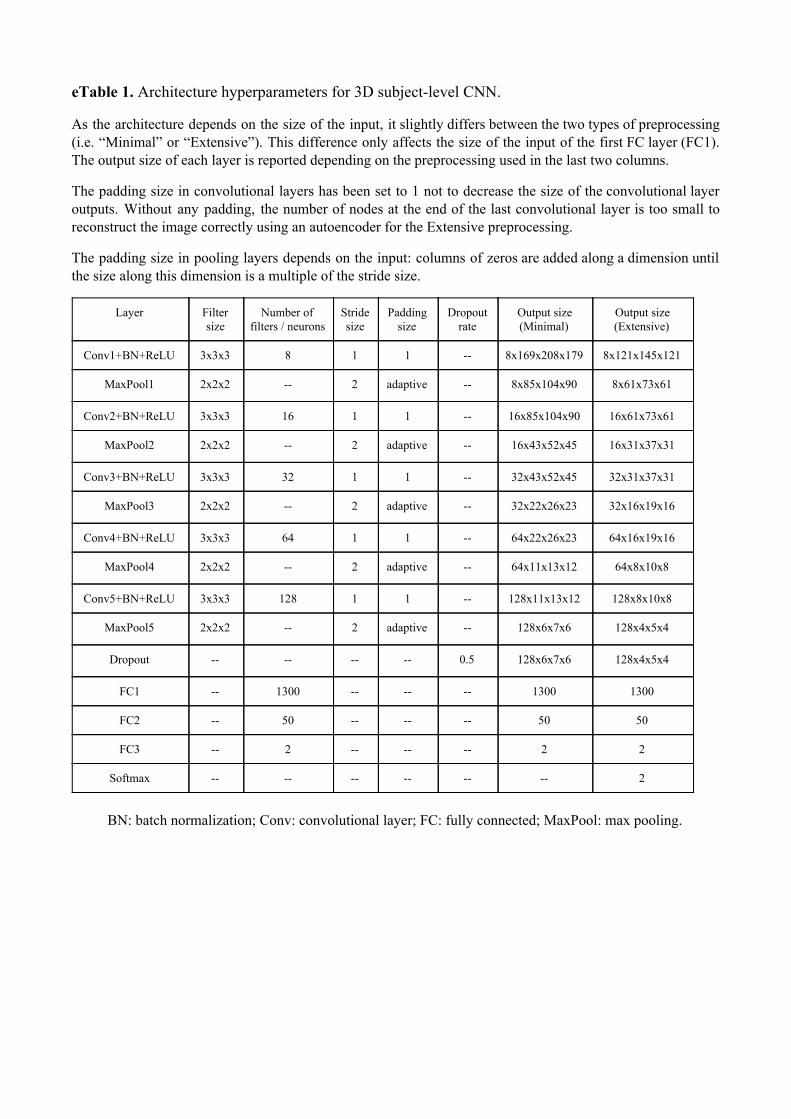
eTable 1. Architecture hyperparameters for 3D subject-level CNN.
As the architecture depends on the size of the input, it slightly differs between the two types of preprocessing (i.e. “Minimal” or “Extensive”). This difference only affects the size of the input of the first FC layer (FC1). The output size of each layer is reported depending on the preprocessing used in the last two columns.
The padding size in convolutional layers has been set to 1 not to decrease the size of the convolutional layer outputs. Without any padding, the number of nodes at the end of the last convolutional layer is too small to reconstruct the image correctly using an autoencoder for the Extensive preprocessing.
The padding size in pooling layers depends on the input: columns of zeros are added along a dimension until the size along this dimension is a multiple of the stride size.
Layer Filter size
Number of filters / neurons
Stride size
Padding size
Dropout rate
Output size (Minimal)
Output size (Extensive)
Conv1+BN+ReLU 3x3x3 8 1 1 -- 8x169x208x179 8x121x145x121
MaxPool1 2x2x2 -- 2 adaptive -- 8x85x104x90 8x61x73x61
Conv2+BN+ReLU 3x3x3 16 1 1 -- 16x85x104x90 16x61x73x61
MaxPool2 2x2x2 -- 2 adaptive -- 16x43x52x45 16x31x37x31
Conv3+BN+ReLU 3x3x3 32 1 1 -- 32x43x52x45 32x31x37x31
MaxPool3 2x2x2 -- 2 adaptive -- 32x22x26x23 32x16x19x16
Conv4+BN+ReLU 3x3x3 64 1 1 -- 64x22x26x23 64x16x19x16
MaxPool4 2x2x2 -- 2 adaptive -- 64x11x13x12 64x8x10x8
Conv5+BN+ReLU 3x3x3 128 1 1 -- 128x11x13x12 128x8x10x8
MaxPool5 2x2x2 -- 2 adaptive -- 128x6x7x6 128x4x5x4
Dropout -- -- -- -- 0.5 128x6x7x6 128x4x5x4
FC1 -- 1300 -- -- -- 1300 1300
FC2 -- 50 -- -- -- 50 50
FC3 -- 2 -- -- -- 2 2
Softmax -- -- -- -- -- -- 2
BN: batch normalization; Conv: convolutional layer; FC: fully connected; MaxPool: max pooling.
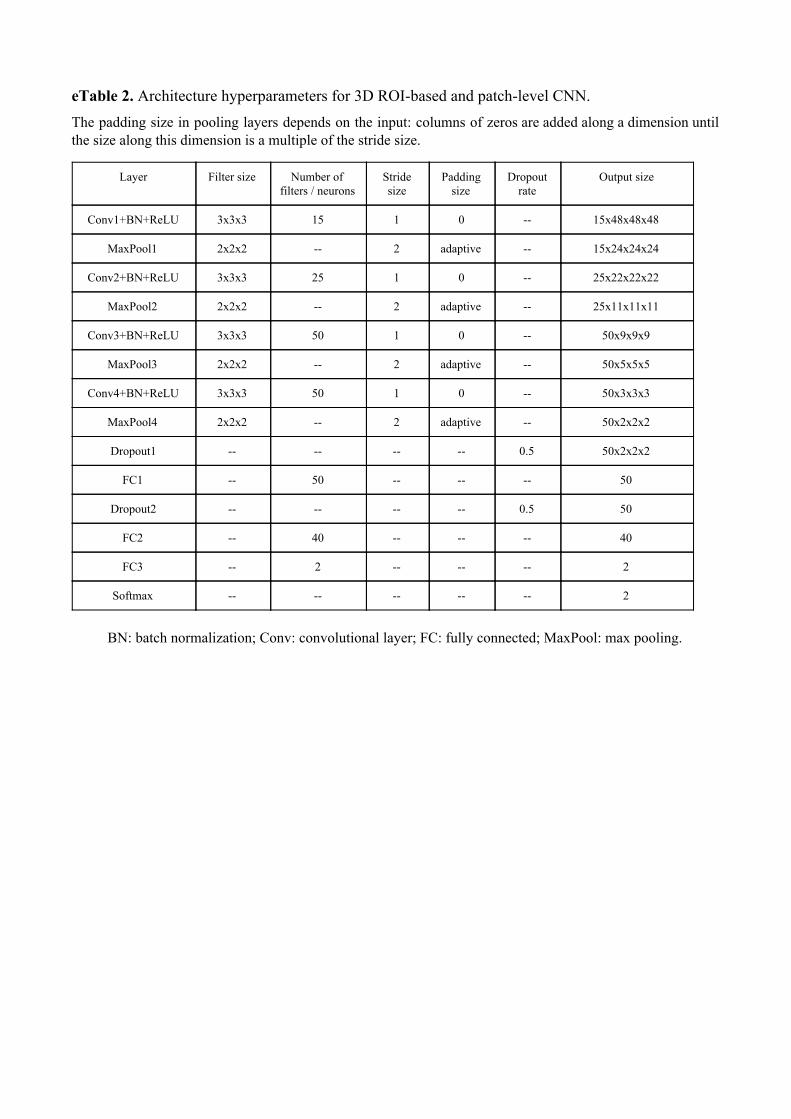
eTable 2. Architecture hyperparameters for 3D ROI-based and patch-level CNN. The padding size in pooling layers depends on the input: columns of zeros are added along a dimension until the size along this dimension is a multiple of the stride size.
Layer Filter size Number of filters / neurons
Stride size
Padding size
Dropout rate
Output size
Conv1+BN+ReLU 3x3x3 15 1 0 -- 15x48x48x48
MaxPool1 2x2x2 -- 2 adaptive -- 15x24x24x24
Conv2+BN+ReLU 3x3x3 25 1 0 -- 25x22x22x22
MaxPool2 2x2x2 -- 2 adaptive -- 25x11x11x11
Conv3+BN+ReLU 3x3x3 50 1 0 -- 50x9x9x9
MaxPool3 2x2x2 -- 2 adaptive -- 50x5x5x5
Conv4+BN+ReLU 3x3x3 50 1 0 -- 50x3x3x3
MaxPool4 2x2x2 -- 2 adaptive -- 50x2x2x2
Dropout1 -- -- -- -- 0.5 50x2x2x2
FC1 -- 50 -- -- -- 50
Dropout2 -- -- -- -- 0.5 50
FC2 -- 40 -- -- -- 40
FC3 -- 2 -- -- -- 2
Softmax -- -- -- -- -- 2
BN: batch normalization; Conv: convolutional layer; FC: fully connected; MaxPool: max pooling.

eTable 3. Architecture hyperparameters for 2D slice-level CNN. Table B explicits the architecture of our 2D slice-level CNN. Shortcuts are displayed with arrows and are adding the two feature maps linked together and applying ReLU to form a new feature map given to the following layer. When shortcuts are linking feature maps of different sizes, the arrow is associated with a downsampling layer (see table A) applied to the largest feature map.
A. Characteristics of the downsampling layers
Layer Filter size Number of filters / neurons
Stride size
Padding size
Dropout rate
Conv8 1x1 128 2 0 --
Conv13 1x1 256 2 0 --
Conv18 1x1 512 2 0 --
B. Architecture of the 2D slice-level CNN (adaptation of the ResNet-18)

eTable 4. Training hyperparameters for classification experiments. A summary of the experiments can be found in Table A. The corresponding hyperparameters are listed in Table B indicated by the experiments numbers. Common hyperparameters for all experiments: optimizer: Adam; Adam parameters: betas=(0.9, 0.999), epsilon=1e-8; loss: cross entropy. When transfer learning is applied, the corresponding experiment number is given between brackets and can be found in eTable 5 for AE pretraining (AE) and eTable 4 for cross-task transfer learning (CTT).
A. Summary of experiments performed
Experiment number
Classification architectures
Training data
Image preprocessing
Intensity rescaling
Data split Training approach
Transfer learning
Task
1
3D subject-level
CNN
Baseline Minimal
None
subject-level single-CNN
None
AD vs CN
2 MinMax
3 AE (1)
4
Longitudinal
Minimal MinMax subject-level single-CNN AE (1)
5 Extensive
MinMax subject-level single-CNN
AE (2)
6 Minimal
CTT (4) sMCI vs pMCI
7 Baseline CTT (3)
8
3D ROI-based CNN
Baseline
Minimal MinMax subject-level single-CNN
AE (3) AD vs CN
9 CTT (8) sMCI vs pMCI
10 Longitudinal
AE (4) AD vs CN
11 CTT (10) sMCI vs pMCI
12
3D patch-level CNN
Baseline Minimal MinMax subject-level single-CNN
AE (5) AD vs CN
13 Longitudinal AE (6)
14
Baseline
Minimal MinMax subject-level multi-CNN
AE (7) AD vs CN
15 CTT (14) sMCI vs pMCI
16 Longitudinal
AE (8) AD vs CN
17 CTT (16) sMCI vs pMCI
18
2D slice-level CNN
Baseline Minimal MinMax subject-level single-CNN
ImageNet pre-train AD vs CN
19 Longitudinal
20 Baseline Minimal MinMax slice-level
(data
leakage)
single-CNN ImageNet pre-train AD vs CN

B. Hyperparameters corresponding to experiments described in Table A.
Approach Experiment Number of epochs
Learning rate
Batch size Dropout rate
Weight decay Patience
3D subject-level CNN
1 50 1e-4 12 0.5 1e-4 10 2 50 1e-4 12 0.5 1e-4 10 3 50 1e-4 12 0.5 1e-4 10 4 50 1e-4 12 0.5 1e-4 5 5 50 1e-4 12 0.5 1e-4 5 6 50 1e-5 12 0.5 1e-4 10 7 50 1e-5 12 0.5 1e-4 20
3D ROI-based CNN
8 200 1e-5 32 0.5 1e-4 10 9 200 1e-5 32 0.5 1e-3 20
10 200 1e-5 32 0.5 1e-4 10 11 200 1e-5 32 0.5 1e-3 20
3D patch-level CNN
12 200 1e-5 32 0.5 1e-3 20 13 200 1e-5 32 0.5 1e-3 20 14 200 1e-5 32 0.5 1e-4 15 15 200 1e-5 32 0.5 1e-3 20 16 200 1e-5 32 0.5 1e-4 15 17 200 1e-5 32 0.5 1e-3 20
2D slice-level CNN
18 50 1e-6 32 0.8 1e-4 15 19 100 1e-6 32 0.8 1e-4 15 20 50 1e-6 32 0.8 1e-4 15

eTable 5. Training hyperparameters for autoencoder pretraining experiments. A summary of the experiments can be found in table A. The corresponding hyperparameters are listed in Table B using the same experiments numbers. Common hyperparameters for all experiments: optimizer: Adam; Adam parameters: betas=(0.9, 0.999), epsilon=1e-8; loss: mean squared entropy loss; training data: AD + MCI + CN; data split: subject-level. The stopping criterion is the maximal number of epochs.
A. Summary of autoencoder pretraining experiments performed.
Experiment number
Classification architectures Training data Image
preprocessing Intensity rescaling
Training approach
1 3D subject-level
CNN Baseline
Minimal MinMax single-CNN
2 Extensive
3 3D ROI-based CNN
Baseline Minimal MinMax single-CNN
4 Longitudinal
5
3D patch-level CNN
Baseline
Minimal MinMax
single-CNN 6 Longitudinal
7 Baseline multi-CNN
8 Longitudinal
B. Hyperparameters corresponding to autoencoder pretraining experiments described in Table A.
Approach Experiment Number of epochs
Learning rate
Batch size Weight decay
3D subject-level CNN
1 50 1e-4 12 1e-4 2 30 1e-4 12 1e-4
3D ROI-based CNN
3 200 1e-5 32 0 4 100 1e-5 32 0
3D patch-level CNN
5 20 1e-5 32 0 6 15 1e-5 32 0 7 15 1e-5 32 0 8 15 1e-5 32 0
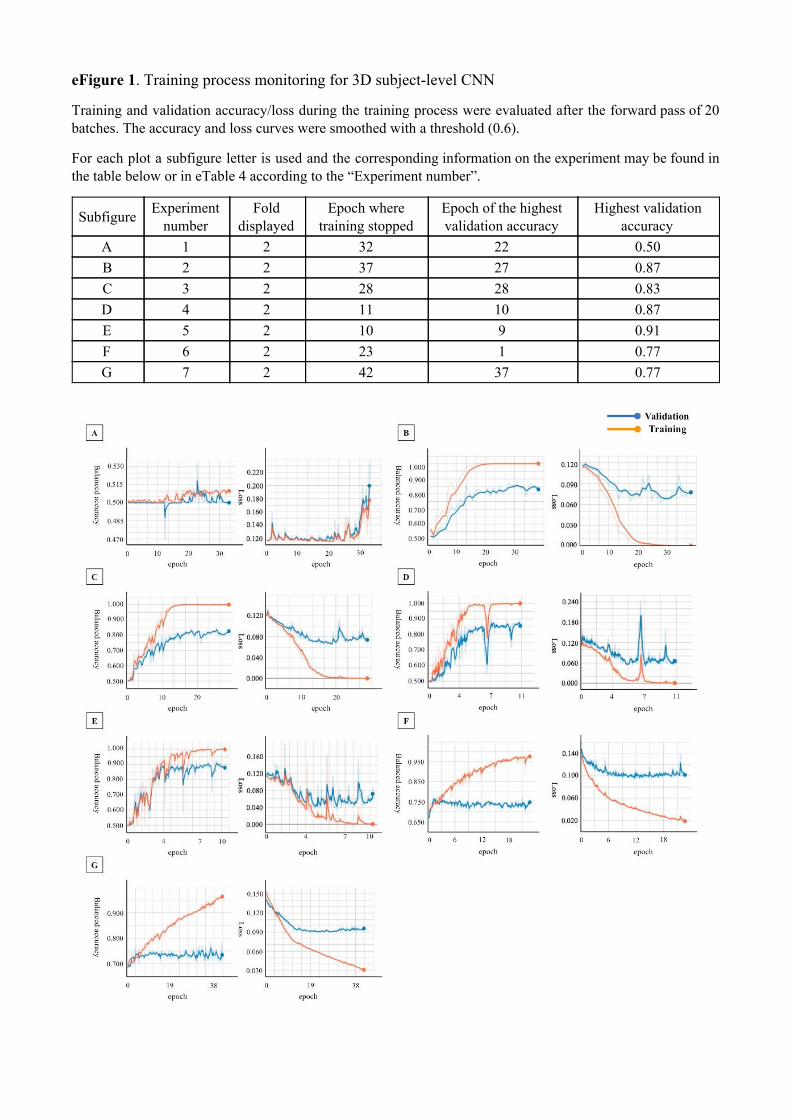
eFigure 1 . Training process monitoring for 3D subject-level CNN
Training and validation accuracy/loss during the training process were evaluated after the forward pass of 20 batches. The accuracy and loss curves were smoothed with a threshold (0.6).
For each plot a subfigure letter is used and the corresponding information on the experiment may be found in the table below or in eTable 4 according to the “Experiment number”.
Subfigure Experiment number
Fold displayed
Epoch where training stopped
Epoch of the highest validation accuracy
Highest validation accuracy
A 1 2 32 22 0.50 B 2 2 37 27 0.87 C 3 2 28 28 0.83 D 4 2 11 10 0.87 E 5 2 10 9 0.91 F 6 2 23 1 0.77 G 7 2 42 37 0.77

eFigure 2 . Training process monitoring for 3D ROI-based CNN.
Training and validation accuracy/loss during the training process were evaluated after each epoch. The accuracy and loss curves were smoothed with a threshold (0.6).
For each plot a subfigure letter is used and the corresponding information on the experiment may be found in the table below or in eTable 4 according to the “Experiment number”.
Subfigure Experiment number
Fold displayed
Epoch where training stopped
Epoch of the highest validation accuracy
Highest validation accuracy
A 8 2 141 125 0.89
B 9 1 60 60 0.84
C 10 3 89 51 0.88
D 11 3 55 48 0.82

eFigure 3 . Training process monitoring for 3D patch-level CNN
Training and validation accuracy/loss during the training process were evaluated after each epoch. The accuracy and loss curves were smoothed with a threshold (0.6).
For each plot a subfigure letter is used and the corresponding information on the experiment may be found in the table below or in eTable 4 according to the “Experiment number”. For multi-CNN experiments the CNN number is provided.
Subfigure Experiment number
Fold displayed
CNN number
Epoch where training stopped
Epoch of the highest validation accuracy
Highest validation accuracy
A 12 2 -- 51 31 0.83
B 13 2 -- 51 31 0.83
C 14 1 5 110 110 0.85
D 15 1 19 148 46 0.80
E 16 1 29 96 86 0.81
F 17 1 19 58 30 0.78
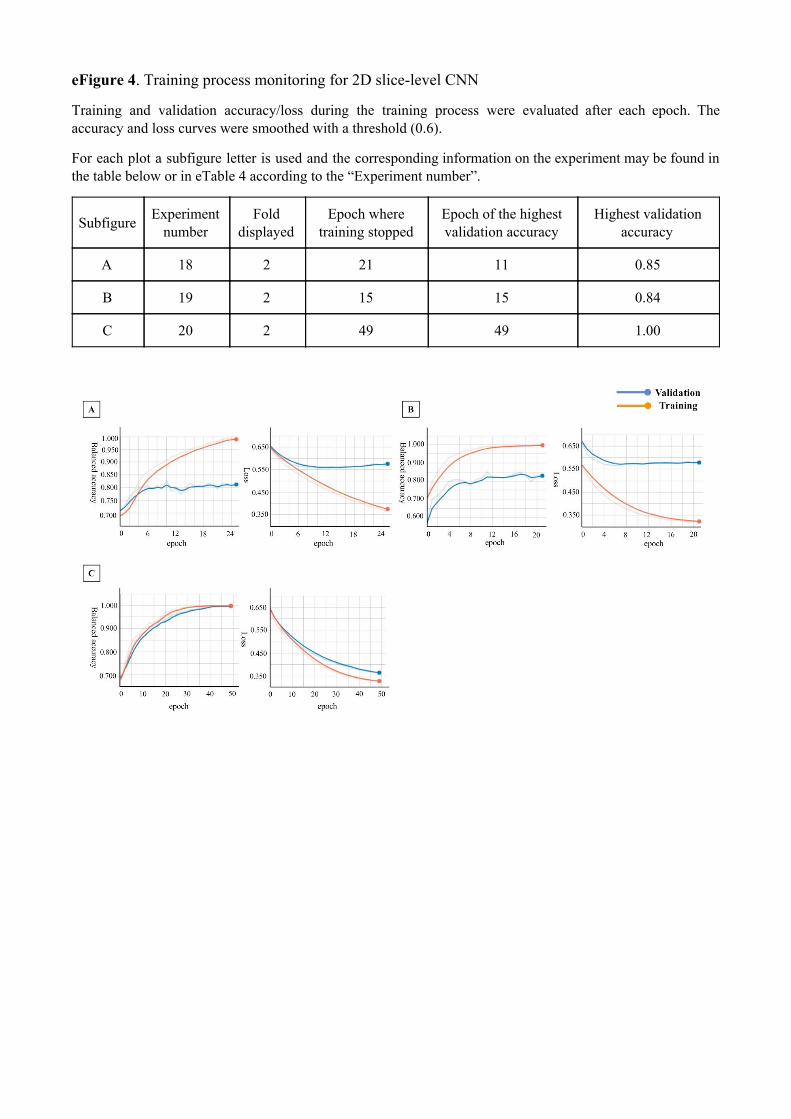
eFigure 4 . Training process monitoring for 2D slice-level CNN
Training and validation accuracy/loss during the training process were evaluated after each epoch. The accuracy and loss curves were smoothed with a threshold (0.6).
For each plot a subfigure letter is used and the corresponding information on the experiment may be found in the table below or in eTable 4 according to the “Experiment number”.
Subfigure Experiment number
Fold displayed
Epoch where training stopped
Epoch of the highest validation accuracy
Highest validation accuracy
A 18 2 21 11 0.85
B 19 2 15 15 0.84
C 20 2 49 49 1.00
References
Ellis, K.A. et al., 2010. Addressing population aging and Alzheimer’s disease through the Australian Imaging Biomarkers and Lifestyle study: Collaboration with the Alzheimer's Disease Neuroimaging Initiative. Alzheimer’s & Dementia, 6(3), pp.291–296. Available at: http://dx.doi.org/10.1016/j.jalz.2010.03.009.
Ellis, K.A. et al., 2009. The Australian Imaging, Biomarkers and Lifestyle (AIBL) study of aging: methodology and baseline characteristics of 1112 individuals recruited for a longitudinal study of Alzheimer’s disease. International Psychogeriatrics , 21(04), p.672. Available at: http://dx.doi.org/10.1017/s1041610209009405.
Marcus, D.S. et al., 2007. Open Access Series of Imaging Studies (OASIS): cross-sectional MRI data in young, middle aged, nondemented, and demented older adults. Journal of cognitive neuroscience, 19(9), pp.1498–1507.
McKhann, G. et al., 1984. Clinical diagnosis of Alzheimer’s disease Report of the NINCDS-ADRDA Work Group* under the auspices of Department of Health and Human Services Task Force on Alzheimer's Disease. Neurology, 34(7), pp.939–939.
Petersen, R.C. et al., 2010. Alzheimer’s Disease Neuroimaging Initiative (ADNI): clinical characterization. Neurology, 74(3), pp.201–209.
Winblad, B. et al., 2004. Mild cognitive impairment–beyond controversies, towards a consensus: report of the International Working Group on Mild Cognitive Impairment. Journal of internal medicine. Available at: https://onlinelibrary.wiley.com/doi/abs/10.1111/j.1365-2796.2004.01380.x.

179
Bibliography
Aderghal, K et al. (2018). “Classification of Alzheimer Disease on Imaging Modali-ties with Deep CNNs Using Cross-Modal Transfer Learning”. In: 2018 IEEE 31stInternational Symposium on Computer-Based Medical Systems (CBMS), pp. 345–350.
Aderghal, K., J. Benois-Pineau, and K. Afdel (2017). “Classification of sMRI forAlzheimer’s Disease Diagnosis with CNN: Single Siamese Networks with 2D+?Approach and Fusion on ADNI”. In: Proceedings of the 2017 ACM on Interna-tional Conference on Multimedia Retrieval. ICMR ’17. New York, NY, USA: ACM,pp. 494–498.
Aderghal, K. et al. (2017). “FuseMe: Classification of sMRI images by fusion ofDeep CNNs in 2D+e projections”. In: Proceedings of the 15th International Work-shop on Content-Based Multimedia Indexing. ACM, p. 34.
Agosta, F. et al. (2011). “White Matter Damage in Alzheimer Disease and Its Re-lationship to Gray Matter Atrophy”. In: Radiology 258.3, pp. 853–863. DOI: 10.1148/radiol.10101284.
Agosta, F. et al. (2012). “Resting state fMRI in Alzheimer’s disease: beyond thedefault mode network”. In: Neurobiology of Aging 33.8, pp. 1564–1578. DOI: 10.1016/j.neurobiolaging.2011.06.007.
Agosta, F. et al. (2017). “Structural and functional brain signatures of C9orf72 inmotor neuron disease”. In: Neurobiology of Aging. DOI: 10.1016/j.neurobiolaging.2017.05.024.
Ahmed, O. B. et al. (2017). “Recognition of Alzheimer’s disease and Mild CognitiveImpairment with multimodal image-derived biomarkers and Multiple KernelLearning”. In: Neurocomputing 220, pp. 98–110.
Aisen, P. S. et al. (2010). “Clinical Core of the Alzheimer’s Disease NeuroimagingInitiative: progress and plans”. In: Alzheimers. Dement. 6.3, pp. 239–246.
Akbani, R., S. Kwek, and N. Japkowicz (2004). “Applying Support Vector Ma-chines to Imbalanced Datasets”. In: Machine Learning: ECML 2004. SpringerBerlin Heidelberg, pp. 39–50.
Albert, M. S. et al. (2011). “The diagnosis of mild cognitive impairment due toAlzheimer’s disease: recommendations from the National Institute on Aging-Alzheimer’s Association workgroups on diagnostic guidelines for Alzheimer’s
180 BIBLIOGRAPHY
disease”. In: Alzheimer’s & Dementia: The Journal of the Alzheimer’s Association7.3, pp. 270–279. DOI: 10.1016/j.jalz.2011.03.008.
Alexander, A. L. et al. (2007). “Diffusion Tensor Imaging of the Brain”. In: Neu-rotherapeutics : the journal of the American Society for Experimental NeuroTherapeu-tics 4.3, pp. 316–329. DOI: 10.1016/j.nurt.2007.05.011.
Alexander-Bloch, A. et al. (2016). “Subtle in-scanner motion biases automated mea-surement of brain anatomy from in vivo MRI”. In: Hum. Brain Mapp. 37.7,pp. 2385–2397.
Amoroso, N. et al. (2017). “Topological Measurements of DWI Tractography forAlzheimer’s Disease Detection”. In: Comput. Math. Methods Med. 2017, p. 5271627.
Amoroso, N. et al. (2018). “Deep learning reveals Alzheimer’s disease onset in MCIsubjects: Results from an international challenge”. In: J. Neurosci. Methods 302,pp. 3–9.
Andersson, J. L. R., M. Jenkinson, and S. Smith (2010). “Non-linear registration akaSpatial normalisation”. In: FMRIB Technial Report TR07JA2.
Andersson, J. L. R. and S. N. Sotiropoulos (2016). “An integrated approach to cor-rection for off-resonance effects and subject movement in diffusion MR imag-ing”. In: NeuroImage 125, pp. 1063–1078. DOI: 10.1016/j.neuroimage.2015.10.019.
Andersson, J. L., S. Skare, and J. Ashburner (2003). “How to correct susceptibil-ity distortions in spin-echo echo-planar images: application to diffusion tensorimaging”. In: NeuroImage 20.2, pp. 870–888. DOI: 10.1016/S1053- 8119(03)00336-7.
Ashburner, J. (2007). “A fast diffeomorphic image registration algorithm”. In: Neu-roimage 38.1, pp. 95–113.
Ashburner, J. and K. J. Friston (2000). “Voxel-Based Morphometry—The Meth-ods”. In: Neuroimage 11.6, pp. 805–821.
— (2005). “Unified segmentation”. In: Neuroimage 26.3, pp. 839–851.Avants, B. B. et al. (2008). “Symmetric Diffeomorphic Image Registration with
Cross-Correlation: Evaluating Automated Labeling of Elderly and Neurode-generative Brain”. In: Medical image analysis 12.1, pp. 26–41. DOI: 10.1016/j.media.2007.06.004.
Avants, B. B. et al. (2014). “The Insight ToolKit image registration framework”. In:Front. Neuroinform. 8, p. 44.
Bäckström, K et al. (2018). “An efficient 3D deep convolutional network for Alzheimer’sdisease diagnosis using MR images”. In: 2018 IEEE 15th International Symposiumon Biomedical Imaging (ISBI 2018), pp. 149–153.

BIBLIOGRAPHY 181
Baker, M. et al. (2006). “Mutations in progranulin cause tau-negative frontotempo-ral dementia linked to chromosome 17”. In: Nature 442.7105, pp. 916–919. DOI:10.1038/nature05016.
Ballard, C. et al. (2011). “Alzheimer’s disease”. In: The Lancet 377.9770, pp. 1019–1031. DOI: 10.1016/S0140-6736(10)61349-9.
Bankman, I. (2008). Handbook of Medical Image Processing and Analysis. Elsevier.Basaia, S. et al. (2018). “Automated classification of Alzheimer’s disease and mild
cognitive impairment using a single MRI and deep neural networks”. In: Neu-roImage: Clinical, p. 101645. DOI: 10.1016/j.nicl.2018.101645.
Baskar, D, V. S. Jayanthi, and A. N. Jayanthi (2018). “An efficient classification ap-proach for detection of Alzheimer’s disease from biomedical imaging modali-ties”. In: Multimed. Tools Appl. Pp. 1–33.
Bateman, R. J. et al. (2012). “Clinical and biomarker changes in dominantly in-herited Alzheimer’s disease”. In: The New England Journal of Medicine 367.9,pp. 795–804. DOI: 10.1056/NEJMoa1202753.
Behrens, T. E. J. et al. (2007). “Probabilistic diffusion tractography with multiplefibre orientations: What can we gain?” In: NeuroImage 34.1, pp. 144–155. DOI:10.1016/j.neuroimage.2006.09.018.
Bengio, Y. and Y. Grandvalet (2004). “No Unbiased Estimator of the Variance ofK-Fold Cross-Validation”. In: p. 17.
Benjamin, D. J. et al. (2018). “Redefine statistical significance”. In: Nature HumanBehaviour 2.1, p. 6. DOI: 10.1038/s41562-017-0189-z.
Benzinger, T. L. S. et al. (2013). “Regional variability of imaging biomarkers in au-tosomal dominant Alzheimer’s disease”. In: Proceedings of the National Academyof Sciences of the United States of America 110.47, E4502–4509. DOI: 10.1073/pnas.1317918110.
Bermingham, M. L. et al. (2015). “Application of high-dimensional feature selec-tion: evaluation for genomic prediction in man”. In: Sci. Rep. 5, p. 10312.
Bernal, J. et al. (2018). “Deep convolutional neural networks for brain image analy-sis on magnetic resonance imaging: a review”. In: Artificial Intelligence in Medicine.DOI: 10.1016/j.artmed.2018.08.008.
Bertrand, A. et al. (2017). “Early Cognitive, Structural, and Microstructural Changesin Presymptomatic C9orf72 Carriers Younger Than 40 Years”. In: JAMA neurol-ogy. DOI: 10.1001/jamaneurol.2017.4266.
Bhagwat, N. et al. (2018). “Modeling and prediction of clinical symptom trajec-tories in Alzheimer’s disease using longitudinal data”. In: PLoS Comput. Biol.14.9, e1006376.

182 BIBLIOGRAPHY
Bishop, C. M. (2009). Pattern recognition and machine learning. Corrected at 8th print-ing 2009. Information science and statistics. New York, NY: Springer. ISBN: 978-0-387-31073-2 978-1-4939-3843-8.
Boer, P.-T. de et al. (2005). “A Tutorial on the Cross-Entropy Method”. In: Ann.Oper. Res. 134.1, pp. 19–67.
Bonin-Guillaume, S. et al. (2005). “Impact économique de la démence”. In: La PresseMédicale 34.1, pp. 35–41. DOI: 10.1016/S0755-4982(05)83882-5.
Bourlard, H and Y Kamp (1988). “Auto-association by multilayer perceptrons andsingular value decomposition”. In: Biol. Cybern. 59.4-5, pp. 291–294.
Braak, H and E Braak (1998). “Evolution of neuronal changes in the course ofAlzheimer’s disease”. In: Ageing and Dementia. Ed. by K Jellinger, F Fazekas,and M Windisch. Vol. 53. Journal of Neural Transmission. Supplementa. Vi-enna: Springer Vienna, pp. 127–140.
Broad, R. et al. (2017). “Neurite Orientation Dispersion and Density Imaging (NODDI)highlights axonal degeneration of the motor tracts as the core feature underly-ing Amyotrophic Lateral Sclerosis. (S53.008)”. In: Neurology 88.16 Supplement,S53.008.
Brookmeyer, R. et al. (2007). “Forecasting the global burden of Alzheimer’s dis-ease”. In: Alzheimers. Dement. 3.3, pp. 186–191.
Burciu, R. G. et al. (2016). “Free-Water and BOLD Imaging Changes in Parkinson’sDisease Patients Chronically Treated with a MAO-B Inhibitor”. In: Human brainmapping 37.8, pp. 2894–2903. DOI: 10.1002/hbm.23213.
Burciu, R. G. et al. (2017). “Progression marker of Parkinson’s disease: a 4-yearmulti-site imaging study”. In: Brain: A Journal of Neurology 140.8, pp. 2183–2192.DOI: 10.1093/brain/awx146.
Burns, A. and S. Iliffe (2009a). “Alzheimer’s disease”. In: BMJ 338.feb05 1, b158–b158. DOI: 10.1136/bmj.b158.
Burns, A. and S. Iliffe (2009b). “Dementia”. In: BMJ 338, b75. DOI: 10.1136/bmj.b75.
Cabral, C. et al. (2015). “Predicting conversion from MCI to AD with FDG-PETbrain images at different prodromal stages”. In: Computers in Biology and Medicine58, pp. 101–109. DOI: 10.1016/j.compbiomed.2015.01.003.
Cai, S. et al. (2018). “Potential biomarkers for distinguishing people with Alzheimer’sdisease from cognitively intact elderly based on the rich-club hierarchical struc-ture of white matter networks”. In: Neurosci. Res.
Cárdenas-Peña, D., D. Collazos-Huertas, and G. Castellanos-Dominguez (2016).“Centered Kernel Alignment Enhancing Neural Network Pretraining for MRI-Based Dementia Diagnosis”. In: Comput. Math. Methods Med. 2016, p. 9523849.

BIBLIOGRAPHY 183
— (2017). “Enhanced Data Representation by Kernel Metric Learning for Demen-tia Diagnosis”. In: Front. Neurosci. 11, p. 413.
Cash, D. M. et al. (2017). “Patterns of grey matter atrophy in genetic frontotem-poral dementia: results from the GENFI study”. In: Neurobiology of Aging. DOI:10.1016/j.neurobiolaging.2017.10.008.
Chaddad, A, C Desrosiers, and T Niazi (2018). “Deep Radiomic Analysis of MRIRelated to Alzheimer’s Disease”. In: IEEE Access 6, pp. 58213–58221.
Chandrashekar, G. and F. Sahin (2014). “A survey on feature selection methods”.In: Computers & Electrical Engineering 40.1, pp. 16–28. DOI: 10.1016/j.compeleceng.2013.11.024.
Chang, Y. S. et al. (2015). “White Matter Changes of Neurite Density and FiberOrientation Dispersion during Human Brain Maturation”. In: PLOS ONE 10.6.Ed. by G. Gong, e0123656. DOI: 10.1371/journal.pone.0123656.
Cheng, D. and M. Liu (2017). “CNNs based multi-modality classification for ADdiagnosis”. In: 2017 10th International Congress on Image and Signal Processing,BioMedical Engineering and Informatics (CISP-BMEI), pp. 1–5. DOI: 10 . 1109 /CISP-BMEI.2017.8302281.
Cheng, D. et al. (2017). “Classification of MR brain images by combination ofmulti-CNNs for AD diagnosis”. In: ed. by C. M. Falco and X. Jiang, p. 1042042.DOI: 10.1117/12.2281808.
Ciresan, D. C. et al. (2011). “Flexible, high performance convolutional neural net-works for image classification”. In: IJCAI Proceedings-International Joint Confer-ence on Artificial Intelligence. Vol. 22. Barcelona, Spain, p. 1237.
Çitak-ER, F., D. Goularas, and B. Ormeci (2017). “A novel Convolutional NeuralNetwork Model Based on Voxel-based Morphometry of Imaging Data in Pre-dicting the Prognosis of Patients with Mild Cognitive Impairment”. In: J. Neu-rol. Sci. Turk. 34.1.
Cruts, M. et al. (2006). “Null mutations in progranulin cause ubiquitin-positivefrontotemporal dementia linked to chromosome 17q21”. In: Nature 442.7105,p. 920. DOI: 10.1038/nature05017.
Cruts, M. et al. (2013). “Current insights into the C9orf72 repeat expansion diseasesof the FTLD/ALS spectrum”. In: Trends in Neurosciences 36.8, pp. 450–459. DOI:10.1016/j.tins.2013.04.010.
Cui, R, M Liu, and G Li (2018). “Longitudinal analysis for Alzheimer’s diseasediagnosis using RNN”. In: 2018 IEEE 15th International Symposium on BiomedicalImaging (ISBI 2018), pp. 1398–1401.
Cui, Y. et al. (2012). “Automated detection of amnestic mild cognitive impairmentin community-dwelling elderly adults: a combined spatial atrophy and whitematter alteration approach”. In: Neuroimage 59.2, pp. 1209–1217.

184 BIBLIOGRAPHY
Cuingnet, R. et al. (2011). “Automatic classification of patients with Alzheimer’sdisease from structural MRI: a comparison of ten methods using the ADNIdatabase”. In: Neuroimage 56.2, pp. 766–781.
Cuingnet, R. et al. (2013). “Spatial and Anatomical Regularization of SVM: A Gen-eral Framework for Neuroimaging Data”. In: IEEE Trans. Pattern Anal. Mach.Intell. 35.3, pp. 682–696.
Davidson, Y. et al. (2016). “Neurodegeneration in frontotemporal lobar degenera-tion and motor neurone disease associated with expansions in C9orf72 is linkedto TDP-43 pathology and not associated with aggregated forms of dipeptiderepeat proteins”. In: Neuropathology and Applied Neurobiology 42.3, pp. 242–254.DOI: 10.1111/nan.12292.
Davidson, Y. S. et al. (2014). “Brain distribution of dipeptide repeat proteins infrontotemporal lobar degeneration and motor neurone disease associated withexpansions in C9ORF72”. In: Acta Neuropathologica Communications 2, p. 70. DOI:10.1186/2051-5960-2-70.
DeBoy, C. A. et al. (2007). “High resolution diffusion tensor imaging of axonaldamage in focal inflammatory and demyelinating lesions in rat spinal cord”.In: Brain: A Journal of Neurology 130.Pt 8, pp. 2199–2210. DOI: 10.1093/brain/awm122.
DeJesus-Hernandez, M. et al. (2011). “Expanded GGGGCC Hexanucleotide Re-peat in Noncoding Region of C9ORF72 Causes Chromosome 9p-Linked FTDand ALS”. In: Neuron 72.2, pp. 245–256. DOI: 10.1016/j.neuron.2011.09.011.
Demirhan, A. et al. (2015). “FEATURE SELECTION IMPROVES THE ACCURACYOF CLASSIFYING ALZHEIMER DISEASE USING DIFFUSION TENSOR IM-AGES”. In: Proc. IEEE Int. Symp. Biomed. Imaging 2015, pp. 126–130.
Deng, J. et al. (2009). ImageNet: A large-scale hierarchical image database.Desikan, R. S. et al. (2006). “An automated labeling system for subdividing the
human cerebral cortex on MRI scans into gyral based regions of interest”. In:NeuroImage 31.3, pp. 968–980. DOI: 10.1016/j.neuroimage.2006.01.021.
Despotovic, I., B. Goossens, and W. Philips (2015). MRI Segmentation of the Hu-man Brain: Challenges, Methods, and Applications. Research article. DOI: 10.1155/2015/450341.
Devenney, E. et al. (2014). “Frontotemporal Dementia Associated With the C9ORF72Mutation: A Unique Clinical Profile”. In: JAMA Neurology 71.3, pp. 331–339.DOI: 10.1001/jamaneurol.2013.6002.
Dickerson, B. C. et al. (2001). “MRI-derived entorhinal and hippocampal atrophyin incipient and very mild Alzheimer’s disease*”. In: Neurobiol. Aging 22.5,pp. 747–754.

BIBLIOGRAPHY 185
Doan, N. T. et al. (2017). “Dissociable diffusion MRI patterns of white matter mi-crostructure and connectivity in Alzheimer’s disease spectrum”. In: Sci. Rep. 7,p. 45131.
Dolph, C. V. et al. (2017). “Deep learning of texture and structural features for mul-ticlass Alzheimer’s disease classification”. In: 2017 International Joint Conferenceon Neural Networks (IJCNN), pp. 2259–2266.
Donnelly, C. J. et al. (2013). “RNA toxicity from the ALS/FTD C9ORF72 expansionis mitigated by antisense intervention”. In: Neuron 80.2, pp. 415–428. DOI: 10.1016/j.neuron.2013.10.015.
Dubey, R. et al. (2014). “ANALYSIS OF SAMPLING TECHNIQUES FOR IMBAL-ANCED DATA: AN N=648 ADNI STUDY”. In: NeuroImage 87, pp. 220–241.DOI: 10.1016/j.neuroimage.2013.10.005.
Dubois, B. and M. L. Albert (2004). “Amnestic MCI or prodromal Alzheimer’s dis-ease?” In: The Lancet. Neurology 3.4, pp. 246–248. DOI: 10.1016/S1474-4422(04)00710-0.
Dubois, B. et al. (2007). “Research criteria for the diagnosis of Alzheimer’s disease:revising the NINCDS-ADRDA criteria”. In: The Lancet. Neurology 6.8, pp. 734–746. DOI: 10.1016/S1474-4422(07)70178-3.
Dubois, B. et al. (2014). “Advancing research diagnostic criteria for Alzheimer’sdisease: the IWG-2 criteria”. In: The Lancet. Neurology 13.6, pp. 614–629. DOI:10.1016/S1474-4422(14)70090-0.
Dubois, B. et al. (2016). “Preclinical Alzheimer’s disease: Definition, natural his-tory, and diagnostic criteria”. In: Alzheimer’s & Dementia: The Journal of the Alzheimer’sAssociation 12.3, pp. 292–323. DOI: 10.1016/j.jalz.2016.02.002.
Dumoulin, V. and F. Visin (2016). “A guide to convolution arithmetic for deeplearning”. In:
Duraisamy, B., J. V. Shanmugam, and J. Annamalai (2019). “Alzheimer disease de-tection from structural MR images using FCM based weighted probabilisticneural network”. In: Brain Imaging Behav. 13.1, pp. 87–110.
Duyckaerts, C., B. Delatour, and M.-C. Potier (2009). “Classification and basic pathol-ogy of Alzheimer disease”. In: Acta Neuropathologica 118.1, pp. 5–36. DOI: 10.1007/s00401-009-0532-1.
Dyrba, M. et al. (2013). “Robust automated detection of microstructural white mat-ter degeneration in Alzheimer’s disease using machine learning classificationof multicenter DTI data”. In: PLoS One 8.5, e64925.
Dyrba, M. et al. (2015a). “Multimodal analysis of functional and structural discon-nection in Alzheimer’s disease using multiple kernel SVM”. In: Human BrainMapping 36.6, pp. 2118–2131. DOI: 10.1002/hbm.22759.

186 BIBLIOGRAPHY
Dyrba, M. et al. (2015b). “Predicting Prodromal Alzheimer’s Disease in Subjectswith Mild Cognitive Impairment Using Machine Learning Classification ofMultimodal Multicenter Diffusion-Tensor and Magnetic Resonance ImagingData”. In: J. Neuroimaging 25.5, pp. 738–747.
Eaton-Rosen, Z. et al. (2017). “Investigating the maturation of microstructure andradial orientation in the preterm human cortex with diffusion MRI”. In: Neu-roImage 162, pp. 65–72. DOI: 10.1016/j.neuroimage.2017.08.013.
Ebadi, A. et al. (2017). “Ensemble Classification of Alzheimer’s Disease and MildCognitive Impairment Based on Complex Graph Measures from Diffusion Ten-sor Images”. In: Front. Neurosci. 11, p. 56.
Ellis, K. A. et al. (2009). “The Australian Imaging, Biomarkers and Lifestyle (AIBL)study of aging: methodology and baseline characteristics of 1112 individualsrecruited for a longitudinal study of Alzheimer’s disease”. In: Int. Psychogeriatr.21.4, pp. 672–687.
Ellis, K. A. et al. (2010). Addressing population aging and Alzheimer’s disease throughthe Australian Imaging Biomarkers and Lifestyle study: Collaboration with the Alzheimer’sDisease Neuroimaging Initiative. Vol. 6. 3.
Erhan, D. et al. (2010). “Why Does Unsupervised Pre-training Help Deep Learn-ing?” In: J. Mach. Learn. Res. 11, pp. 625–660.
Eskildsen, S. F. et al. (2013). “Prediction of Alzheimer’s disease in subjects withmild cognitive impairment from the ADNI cohort using patterns of corticalthinning”. In: NeuroImage 65, pp. 511–521. DOI: 10.1016/j.neuroimage.2012.09.058.
Esmaeilzadeh, S. et al. (2018). “End-To-End Alzheimer’s Disease Diagnosis andBiomarker Identification: 9th International Workshop, MLMI 2018, Held in Con-junction with MICCAI 2018, Granada, Spain, September 16, 2018, Proceed-ings”. In: Machine Learning in Medical Imaging. Ed. by Y. Shi, H.-I. Suk, and M.Liu. Vol. 11046. Lecture Notes in Computer Science. Cham: Springer Interna-tional Publishing, pp. 337–345.
Estabrooks, A. (2000). “A combination scheme for inductive learning from imbal-anced data sets”. PhD Thesis. DalTech.
Ewers, M. et al. (2011). “Neuroimaging markers for the prediction and early diag-nosis of Alzheimer’s disease dementia”. In: Trends Neurosci. 34.8, pp. 430–442.
Falahati, F., E. Westman, and A. Simmons (2014). “Multivariate Data Analysis andMachine Learning in Alzheimer’s Disease with a Focus on Structural MagneticResonance Imaging”. In: Journal of Alzheimer’s Disease 41.3, pp. 685–708. DOI:10.3233/JAD-131928.

BIBLIOGRAPHY 187
Farhan, S., M. A. Fahiem, and H. Tauseef (2014). An Ensemble-of-Classifiers BasedApproach for Early Diagnosis of Alzheimer’s Disease: Classification Using StructuralFeatures of Brain Images. Research article. DOI: 10.1155/2014/862307.
Farooq, A et al. (2017). “A deep CNN based multi-class classification of Alzheimer’sdisease using MRI”. In: 2017 IEEE International Conference on Imaging Systemsand Techniques (IST), pp. 1–6.
Fellgiebel, A. et al. (2005). “Color-coded diffusion-tensor-imaging of posterior cin-gulate fiber tracts in mild cognitive impairment”. In: Neurobiol. Aging 26.8,pp. 1193–1198.
Fellgiebel, A. et al. (2006). “Predicting conversion to dementia in mild cognitiveimpairment by volumetric and diffusivity measurements of the hippocampus”.In: Psychiatry Res. 146.3, pp. 283–287.
Ferri, C. P. et al. (2005). “Global prevalence of dementia: a Delphi consensus study”.In: Lancet (London, England) 366.9503, pp. 2112–2117. DOI: 10 . 1016 / S0140 -6736(05)67889-0.
Fischl, B. et al. (1999). “High-resolution intersubject averaging and a coordinatesystem for the cortical surface”. In: Human Brain Mapping 8.4, pp. 272–284.
Fischl, B. (2012). “FreeSurfer”. In: NeuroImage 62.2, pp. 774–781. DOI: 10.1016/j.neuroimage.2012.01.021.
Fisher, R. A. (1992). “The Arrangement of Field Experiments”. In: Breakthroughsin Statistics: Methodology and Distribution. Ed. by S. Kotz and N. L. Johnson.New York, NY: Springer New York, pp. 82–91. ISBN: 978-1-4612-4380-9. DOI:10.1007/978-1-4612-4380-9_8.
Floeter, M. K. et al. (2017). “Disease progression in C9orf72 mutation carriers”. In:Neurology, 10.1212/WNL.0000000000004115. DOI: 10.1212/WNL.0000000000004115.
Floeter, M. K. and T. F. Gendron (2018). “Biomarkers for Amyotrophic Lateral Scle-rosis and Frontotemporal Dementia Associated With Hexanucleotide Expan-sion Mutations in C9orf72”. In: Frontiers in Neurology 9. DOI: 10.3389/fneur.2018.01063.
Floeter, M. K. et al. (2016). “Longitudinal imaging in C9orf72 mutation carriers:Relationship to phenotype”. In: NeuroImage: Clinical 12, pp. 1035–1043. DOI: 10.1016/j.nicl.2016.10.014.
Floris, G. et al. (2015). “Constructional apraxia in frontotemporal dementia associ-ated with the C9orf72 mutation: broadening the clinical and neuropsycholog-ical phenotype”. In: Amyotrophic Lateral Sclerosis & Frontotemporal Degeneration16.1-2, pp. 8–15. DOI: 10.3109/21678421.2014.959450.
Fonov, V. S. et al. (2009). “Unbiased nonlinear average age-appropriate brain tem-plates from birth to adulthood”. In: Neuroimage Supplement 1.47, S102.

188 BIBLIOGRAPHY
Fonov, V. et al. (2011). “Unbiased average age-appropriate atlases for pediatricstudies”. In: Neuroimage 54.1, pp. 313–327.
Fonov, V. et al. (2018). “Deep learning of quality control for stereotaxic registrationof human brain MRI”.
Friese, U. et al. (2010). “Diagnostic utility of novel MRI-based biomarkers for Alzheimer’sdisease: diffusion tensor imaging and deformation-based morphometry”. In: J.Alzheimers. Dis. 20.2, pp. 477–490.
Frisoni, G. B. et al. (2010). “3-The clinical use of structural MRI in Alzheimer dis-ease”. In: Nature Reviews Neurology 6.2, pp. 67–77. DOI: 10.1038/nrneurol.2009.215.
Friston, K. J. et al. (1995). “Analysis of fMRI time-series revisited”. In: Neuroimage2.1, pp. 45–53.
Gao, Y. et al. (2015). “MCI Identification by Joint Learning on Multiple MRI Data”.In: Med. Image Comput. Comput. Assist. Interv. 9350, pp. 78–85.
Glorot, X., A. Bordes, and Y. Bengio (2011). “Deep sparse rectifier neural networks”.In: Proceedings of the fourteenth international conference on artificial intelligence andstatistics, pp. 315–323.
Godenschweger, F. et al. (2016). “Motion correction in MRI of the brain”. In: Physicsin Medicine and Biology 61.5, R32–56. DOI: 10.1088/0031-9155/61/5/R32.
Gomez-Deza, J. et al. (2015). “Dipeptide repeat protein inclusions are rare in thespinal cord and almost absent from motor neurons in C9ORF72 mutant amy-otrophic lateral sclerosis and are unlikely to cause their degeneration”. In: ActaNeuropathologica Communications 3, p. 38. DOI: 10.1186/s40478-015-0218-y.
Gómez-Tortosa, E. et al. (2013). “C9ORF72 hexanucleotide expansions of 20-22repeats are associated with frontotemporal deterioration”. In: Neurology 80.4,pp. 366–370. DOI: 10.1212/WNL.0b013e31827f08ea.
Goodfellow, I. (2016). “NIPS 2016 Tutorial: Generative Adversarial Networks”. In:Goodfellow, I. et al. (2016). Deep learning. Vol. 1. MIT press Cambridge.Gorgolewski, K. et al. (2011). “Nipype: a flexible, lightweight and extensible neu-
roimaging data processing framework in python”. In: Front. Neuroinform. 5,p. 13.
Gorgolewski, K. J. and R. A. Poldrack (2016). “A Practical Guide for ImprovingTransparency and Reproducibility in Neuroimaging Research”. In: PLoS Biol.14.7, e1002506.
Gorgolewski, K. J. et al. (2016). “The brain imaging data structure, a format fororganizing and describing outputs of neuroimaging experiments”. In: Sci Data3, p. 160044.
BIBLIOGRAPHY 189
Gorji, H. T. and J Haddadnia (2015). “A novel method for early diagnosis of Alzheimer’sdisease based on pseudo Zernike moment from structural MRI”. In: Neuro-science 305, pp. 361–371.
Graña, M et al. (2011). “Computer aided diagnosis system for Alzheimer diseaseusing brain diffusion tensor imaging features selected by Pearson’s correla-tion”. In: Neurosci. Lett. 502.3, pp. 225–229.
Greve, D. N. and B. Fischl (2009). “Accurate and robust brain image alignmentusing boundary-based registration”. In: Neuroimage 48.1, pp. 63–72.
Grussu, F. et al. (2017). “Neurite dispersion: a new marker of multiple sclerosisspinal cord pathology?” In: Annals of Clinical and Translational Neurology 4.9,pp. 663–679. DOI: 10.1002/acn3.445.
Gunawardena, K. A.N.N. P., R. N. Rajapakse, and N. D. Kodikara (2017). “Ap-plying convolutional neural networks for pre-detection of alzheimer’s diseasefrom structural MRI data”. In: IEEE, pp. 1–7. ISBN: 978-1-5090-6546-2. DOI: 10.1109/M2VIP.2017.8211486.
Gutiérrez-Becker, B. and C. Wachinger (2018). “Deep Multi-structural Shape Anal-ysis: Application to Neuroanatomy: 21st International Conference, Granada,Spain, September 16-20, 2018, Proceedings, Part III”. In: Medical Image Comput-ing and Computer Assisted Intervention – MICCAI 2018. Ed. by A. F. Frangi et al.Vol. 11072. Lecture Notes in Computer Science. Cham: Springer InternationalPublishing, pp. 523–531.
Guyon, I. et al. (2002). “Gene Selection for Cancer Classification using SupportVector Machines”. In: Mach. Learn. 46.1, pp. 389–422.
Haller, S et al. (2013). “Individual classification of mild cognitive impairment sub-types by support vector machine analysis of white matter DTI”. In: AJNR Am.J. Neuroradiol. 34.2, pp. 283–291.
Haller, S., K. O. Lovblad, and P. Giannakopoulos (2011). “Principles of classifica-tion analyses in mild cognitive impairment (MCI) and Alzheimer disease”. In:J. Alzheimers. Dis. 26 Suppl 3, pp. 389–394.
Hampel, H. et al. (2014). “Perspective on future role of biological markers in clin-ical therapy trials of Alzheimer’s disease: a long-range point of view beyond2020”. In: Biochemical Pharmacology 88.4, pp. 426–449. DOI: 10.1016/j.bcp.2013.11.009.
Hanyu, H. et al. (1998). “Diffusion-weighted MR imaging of the hippocampus andtemporal white matter in Alzheimer’s disease”. In: Journal of the NeurologicalSciences 156.2, pp. 195–200.
Hardy, J. and D. Allsop (1991). “Amyloid deposition as the central event in the aeti-ology of Alzheimer’s disease”. In: Trends in Pharmacological Sciences 12, pp. 383–388. DOI: 10.1016/0165-6147(91)90609-V.

190 BIBLIOGRAPHY
He, K. et al. (2016). “Deep residual learning for image recognition”. In: Proceedingsof the IEEE conference on computer vision and pattern recognition, pp. 770–778.
Head, D. et al. (2005). “Frontal-hippocampal double dissociation between normalaging and Alzheimer’s disease”. In: Cereb. Cortex 15.6, pp. 732–739.
Hinton, G. E. and R. S. Zemel (1994). “Autoencoders, Minimum Description Lengthand Helmholtz Free Energy”. In: Advances in Neural Information Processing Sys-tems 6. Ed. by J. D. Cowan, G Tesauro, and J Alspector. Morgan-Kaufmann,pp. 3–10.
Ho, T. K. (1995). “Random decision forests”. In: Proceedings of 3rd International Con-ference on Document Analysis and Recognition. Vol. 1, 278–282 vol.1. DOI: 10 .1109/ICDAR.1995.598994.
Hon, M and N. M. Khan (2017). “Towards Alzheimer’s disease classification throughtransfer learning”. In: 2017 IEEE International Conference on Bioinformatics andBiomedicine (BIBM), pp. 1166–1169.
Hosseini-Asl, E., G. Gimel’farb, and A. El-Baz (2016). “Alzheimer’s Disease Diag-nostics by a Deeply Supervised Adaptable 3D Convolutional Network”. In:
Hosseini Asl, E. et al. (2018). “Alzheimer’s disease diagnostics by a 3D deeplysupervised adaptable convolutional network”. In: Front. Biosci. 23.2, pp. 584–596.
Hua, K. et al. (2008). “Tract probability maps in stereotaxic spaces: analyses ofwhite matter anatomy and tract-specific quantification”. In: NeuroImage 39.1,pp. 336–347. DOI: 10.1016/j.neuroimage.2007.07.053.
Huang, G. et al. (2017). “Densely connected convolutional networks”. In: Proceed-ings of the IEEE conference on computer vision and pattern recognition, pp. 4700–4708.
Hutton, M. et al. (1998). “Association of missense and 5’-splice-site mutations intau with the inherited dementia FTDP-17”. In: Nature 393.6686, pp. 702–705.DOI: 10.1038/31508.
Ioffe, S. and C. Szegedy (2015). “Batch Normalization: Accelerating Deep NetworkTraining by Reducing Internal Covariate Shift”. In: arXiv:1502.03167 [cs].
Islam, J. and Y. Zhang (2017). “A Novel Deep Learning Based Multi-class Classi-fication Method for Alzheimer’s Disease Detection Using Brain MRI Data”. In:Brain Informatics. Ed. by Y. Zeng et al. Vol. 10654. Lecture Notes in ComputerScience. Cham: Springer International Publishing, pp. 213–222.
— (2018). “Brain MRI analysis for Alzheimer’s disease diagnosis using an ensem-ble system of deep convolutional neural networks”. In: Brain Inform 5.2, p. 2.
Janocha, K. and W. M. Czarnecki (2017). “On Loss Functions for Deep Neural Net-works in Classification”. In:
BIBLIOGRAPHY 191
Japkowicz, N. and Others (2000). “Learning from imbalanced data sets: a compar-ison of various strategies”. In: AAAI workshop on learning from imbalanced datasets. Vol. 68. Menlo Park, CA, pp. 10–15.
Jenkinson, M. and S. Smith (2001). “A global optimisation method for robust affineregistration of brain images”. In: Medical Image Analysis 5.2, pp. 143–156.
Jenkinson, M. et al. (2002). “Improved optimization for the robust and accuratelinear registration and motion correction of brain images”. In: NeuroImage 17.2,pp. 825–841.
Jenkinson, M. et al. (2012). “FSL”. In: Neuroimage 62.2, pp. 782–790.Jeurissen, B. et al. (2014). “Multi-tissue constrained spherical deconvolution for im-
proved analysis of multi-shell diffusion MRI data”. In: NeuroImage 103, pp. 411–426. DOI: 10.1016/j.neuroimage.2014.07.061.
Jezzard, P and R. S. Balaban (1995). “Correction for geometric distortion in echoplanar images from B0 field variations”. In: Magn. Reson. Med. 34.1, pp. 65–73.
Jha, D., J.-I. Kim, and G.-R. Kwon (2017). “Diagnosis of Alzheimer’s Disease Us-ing Dual-Tree Complex Wavelet Transform, PCA, and Feed-Forward NeuralNetwork”. In: J. Healthc. Eng. 2017, p. 9060124.
Jiang, J. et al. (2016). “Gain of Toxicity from ALS/FTD-Linked Repeat Expansionsin C9ORF72 Is Alleviated by Antisense Oligonucleotides Targeting GGGGCC-Containing RNAs”. In: Neuron 90.3, pp. 535–550. DOI: 10.1016/j.neuron.2016.04.006.
Jiskoot, L. (2018). Neuroimaging and Clinical Biomarkers in the Familial and SporadicFTD Spectrum – from the Presymptomatic to the Symptomatic Disease Stage. ISBN:978-94-028-1164-3.
Jung, W. B. et al. (2015). “Automated Classification to Predict the Progression ofAlzheimer’s Disease Using Whole-Brain Volumetry and DTI”. In: PsychiatryInvestig. 12.1, pp. 92–102.
Juszczak, P., D Tax, and R. P. W. Duin (2002). “Feature scaling in support vectordata description”. In: Proc. ASCI. Citeseer, pp. 95–102.
Kalavathi, P and V. B. S. Prasath (2016). “Methods on Skull Stripping of MRI HeadScan Images-a Review”. In: J. Digit. Imaging 29.3, pp. 365–379.
Kamagata, K. et al. (2016). “Neurite orientation dispersion and density imagingin the substantia nigra in idiopathic Parkinson disease”. In: European Radiology26.8, pp. 2567–2577. DOI: 10.1007/s00330-015-4066-8.
Kantarci, K et al. (2001). “Mild cognitive impairment and Alzheimer disease: re-gional diffusivity of water”. In: Radiology 219.1, pp. 101–107.
Khan, B. K. et al. (2012). “Atypical, slowly progressive behavioural variant fron-totemporal dementia associated with C9ORF72 hexanucleotide expansion”. In:
192 BIBLIOGRAPHY
Journal of Neurology, Neurosurgery, and Psychiatry 83.4, pp. 358–364. DOI: 10.1136/jnnp-2011-301883.
Klöppel, S. et al. (2008). “Automatic classification of MR scans in Alzheimer’s dis-ease”. In: Brain: A Journal of Neurology 131.Pt 3, pp. 681–689. DOI: 10.1093/brain/awm319.
Kodiweera, C. et al. (2016). “Age effects and sex differences in human brain whitematter of young to middle-aged adults: A DTI, NODDI, and q-space study”.In: NeuroImage 128, pp. 180–192. DOI: 10.1016/j.neuroimage.2015.12.033.
Korolev, S et al. (2017). “Residual and plain convolutional neural networks for 3Dbrain MRI classification”. In: 2017 IEEE 14th International Symposium on Biomed-ical Imaging (ISBI 2017), pp. 835–838.
Kriegeskorte, N. et al. (2009). “Circular analysis in systems neuroscience: the dan-gers of double dipping”. In: Nat. Neurosci. 12.5, pp. 535–540.
Krizhevsky, A., I. Sutskever, and G. E. Hinton (2012). “ImageNet Classificationwith Deep Convolutional Neural Networks”. In: Advances in Neural InformationProcessing Systems 25. Ed. by F Pereira et al. Curran Associates, Inc., pp. 1097–1105.
Krogh, A. and J. A. Hertz (1992). “A Simple Weight Decay Can Improve Gener-alization”. In: Advances in Neural Information Processing Systems 4. Ed. by J. E.Moody, S. J. Hanson, and R. P. Lippmann. Morgan-Kaufmann, pp. 950–957.
Króliczak, G., B. J. Piper, and S. H. Frey (2016). “Specialization of the left supra-marginal gyrus for hand-independent praxis representation is not related tohand dominance”. In: Neuropsychologia 93.Pt B, pp. 501–512. DOI: 10.1016/j.neuropsychologia.2016.03.023.
Le Ber, I. (2013). “Genetics of frontotemporal lobar degeneration: an up-date anddiagnosis algorithm”. In: Revue Neurologique 169.10, pp. 811–819. DOI: 10.1016/j.neurol.2013.07.014.
Le Ber, I. et al. (2008). “Phenotype variability in progranulin mutation carriers: aclinical, neuropsychological, imaging and genetic study”. In: Brain 131.3, pp. 732–746. DOI: 10.1093/brain/awn012.
Le Ber, I. et al. (2013). “SQSTM1 mutations in French patients with frontotemporaldementia or frontotemporal dementia with amyotrophic lateral sclerosis”. In:JAMA neurology 70.11, pp. 1403–1410. DOI: 10.1001/jamaneurol.2013.3849.
Le Bihan, D. et al. (1986). “MR imaging of intravoxel incoherent motions: appli-cation to diffusion and perfusion in neurologic disorders”. In: Radiology 161.2,pp. 401–407. DOI: 10.1148/radiology.161.2.3763909.
Lecun, Y. et al. (1998). “Gradient-based learning applied to document recognition”.In: Proceedings of the IEEE 86.11, pp. 2278–2324. DOI: 10.1109/5.726791.

BIBLIOGRAPHY 193
LeCun, Y., Y. Bengio, and G. Hinton (2015). “Deep learning”. In: Nature 521.7553,pp. 436–444.
Ledig, C. et al. (2015). “Robust whole-brain segmentation: application to traumaticbrain injury”. In: Med. Image Anal. 21.1, pp. 40–58.
Lee, S. E. et al. (2016). “Network degeneration and dysfunction in presymptomaticC9ORF72 expansion carriers”. In: NeuroImage : Clinical 14, pp. 286–297. DOI:10.1016/j.nicl.2016.12.006.
Lee, W., B. Park, and K. Han (2013). “Classification of diffusion tensor imagesfor the early detection of Alzheimer’s disease”. In: Comput. Biol. Med. 43.10,pp. 1313–1320.
— (2015). “SVM-Based Classification of Diffusion Tensor Imaging Data for Di-agnosing Alzheimer’s Disease and Mild Cognitive Impairment”. In: IntelligentComputing Theories and Methodologies. Ed. by D.-S. Huang, K.-H. Jo, and A. Hus-sain. Vol. 9226. Lecture Notes in Computer Science. Cham: Springer Interna-tional Publishing, pp. 489–499.
Leemans, A. and D. K. Jones (2009). “The B-matrix must be rotated when correct-ing for subject motion in DTI data”. In: Magnetic Resonance in Medicine 61.6,pp. 1336–1349. DOI: 10.1002/mrm.21890.
Lella, E. et al. (2017). “Machine learning for the assessment of Alzheimer’s diseasethrough DTI”. In: Applications of Digital Image Processing XL. Vol. 10396. Inter-national Society for Optics and Photonics, p. 1039619.
Lella, E. et al. (2018). “Communicability disruption in Alzheimer’s disease connec-tivity networks”. In: J Complex Netw.
Leow, A. D. et al. (2007). “Statistical properties of Jacobian maps and the realizationof unbiased large-deformation nonlinear image registration”. In: IEEE Trans.Med. Imaging 26.6, pp. 822–832.
Li, F., D. Cheng, and M. Liu (2017). “Alzheimer’s disease classification based oncombination of multi-model convolutional networks”. In: 2017 IEEE Interna-tional Conference on Imaging Systems and Techniques (IST), pp. 1–5. DOI: 10.1109/IST.2017.8261566.
Li, F., M. Liu, and Alzheimer’s Disease Neuroimaging Initiative (2018). “Alzheimer’sdisease diagnosis based on multiple cluster dense convolutional networks”. In:Comput. Med. Imaging Graph. 70, pp. 101–110.
Li, F. et al. (2015). “A Robust Deep Model for Improved Classification of AD/MCIPatients”. In: IEEE J Biomed Health Inform 19.5, pp. 1610–1616.
Li, M. et al. (2014). “Discriminative analysis of multivariate features from struc-tural MRI and diffusion tensor images”. In: Magn. Reson. Imaging 32.8, pp. 1043–1051.

194 BIBLIOGRAPHY
Li, X. et al. (2016). “The first step for neuroimaging data analysis: DICOM to NIfTIconversion”. In: J. Neurosci. Methods 264, pp. 47–56.
Lian, C. et al. (2018). “Hierarchical Fully Convolutional Network for Joint Atro-phy Localization and Alzheimer’s Disease Diagnosis using Structural MRI”.In: IEEE Trans. Pattern Anal. Mach. Intell.
Lillemark, L. et al. (2014). “Brain region’s relative proximity as marker for Alzheimer’sdisease based on structural MRI”. In: BMC Medical Imaging 14.1, p. 21. DOI:10.1186/1471-2342-14-21.
Lin, W. et al. (2018). “Convolutional Neural Networks-Based MRI Image Analysisfor the Alzheimer’s Disease Prediction From Mild Cognitive Impairment”. In:Front. Neurosci. 12, p. 777.
Liu, J. et al. (2018a). “Applications of deep learning to MRI images: A survey”. In:Big Data Mining and Analytics 1.1, pp. 1–18. DOI: 10.26599/BDMA.2018.9020001.
Liu, J. et al. (2016). “Multi-view ensemble learning for dementia diagnosis fromneuroimaging: An artificial neural network approach”. In: Neurocomputing 195,pp. 112–116.
Liu, M. et al. (2018b). “Anatomical Landmark based Deep Feature Representationfor MR Images in Brain Disease Diagnosis”. In: IEEE Journal of Biomedical andHealth Informatics PP.99, pp. 1–1. DOI: 10.1109/JBHI.2018.2791863.
Liu, M. et al. (2018c). “Multi-Modality Cascaded Convolutional Neural Networksfor Alzheimer’s Disease Diagnosis”. In: Neuroinformatics 16.3-4, pp. 295–308.
Liu, M. et al. (2018d). “Joint Classification and Regression via Deep Multi-TaskMulti-Channel Learning for Alzheimer’s Disease Diagnosis”. In: IEEE Trans.Biomed. Eng.
— (2018e). “Landmark-based deep multi-instance learning for brain disease diag-nosis”. In: Med. Image Anal. 43, pp. 157–168.
Liu, S. et al. (2015). “Multimodal neuroimaging feature learning for multiclass di-agnosis of Alzheimer’s disease”. In: IEEE Trans. Biomed. Eng. 62.4, pp. 1132–1140.
Loy, C. T. et al. (2014). “Genetics of dementia”. In: The Lancet 383.9919, pp. 828–840.DOI: 10.1016/S0140-6736(13)60630-3.
Lu, D. and Q. Weng (2007). “A survey of image classification methods and tech-niques for improving classification performance”. In: International Journal of Re-mote Sensing 28.5, pp. 823–870. DOI: 10.1080/01431160600746456.
Lu, D. et al. (2018). “Multimodal and Multiscale Deep Neural Networks for theEarly Diagnosis of Alzheimer’s Disease using structural MR and FDG-PET im-ages”. In: Sci. Rep. 8.1, p. 5697.
Maas, A. L., A. Y. Hannun, and A. Y. Ng (2013). “Rectifier nonlinearities improveneural network acoustic models”. In: Proc. icml. Vol. 30, p. 3.
BIBLIOGRAPHY 195
Mackenzie, I. R. A., P. Frick, and M. Neumann (2014). “The neuropathology asso-ciated with repeat expansions in the C9ORF72 gene”. In: Acta Neuropathologica127.3, pp. 347–357. DOI: 10.1007/s00401-013-1232-4.
Mackenzie, I. R. A. et al. (2015). “Quantitative analysis and clinico-pathologicalcorrelations of different dipeptide repeat protein pathologies in C9ORF72 mu-tation carriers”. In: Acta Neuropathologica 130.6, pp. 845–861. DOI: 10 . 1007 /s00401-015-1476-2.
Madabhushi, A. and J. K. Udupa (2005). “Interplay between intensity standardiza-tion and inhomogeneity correction in MR image processing”. In: IEEE Trans.Med. Imaging 24.5, pp. 561–576.
Maggipinto, T. et al. (2017). “DTI measurements for Alzheimer’s classification”.In: Physics in Medicine and Biology 62.6, pp. 2361–2375. DOI: 10.1088/1361-6560/aa5dbe.
Magnin, B. et al. (2009). “Support vector machine-based classification of Alzheimer’sdisease from whole-brain anatomical MRI”. In: Neuroradiology 51.2, pp. 73–83.DOI: 10.1007/s00234-008-0463-x.
Mahanand, B. S. et al. (2012). “Identification of brain regions responsible for Alzheimer’sdisease using a Self-adaptive Resource Allocation Network”. In: Neural Netw.32, pp. 313–322.
Mahoney, C. J. et al. (2012a). “Frontotemporal dementia with the C9ORF72 hex-anucleotide repeat expansion: clinical, neuroanatomical and neuropathologicalfeatures”. In: Brain 135.3, pp. 736–750. DOI: 10.1093/brain/awr361.
Mahoney, C. J. et al. (2012b). “Longitudinal neuroimaging and neuropsychologicalprofiles of frontotemporal dementia with C9ORF72 expansions”. In: Alzheimer’sresearch & therapy 4.5, p. 41.
Maitra, M. and A. Chatterjee (2006). “A Slantlet transform based intelligent systemfor magnetic resonance brain image classification”. In: Biomed. Signal Process.Control 1.4, pp. 299–306.
Marcus, D. S. et al. (2007). “Open Access Series of Imaging Studies (OASIS): cross-sectional MRI data in young, middle aged, nondemented, and demented olderadults”. In: J. Cogn. Neurosci. 19.9, pp. 1498–1507.
Mathew, N. A., R. S. Vivek, and P. R. Anurenjan (2018). “Early Diagnosis of Alzheimer’sDisease from MRI Images Using PNN”. In: 2018 International CET Conference onControl, Communication, and Computing (IC4), pp. 161–164.
McCullagh, P. (2018). Generalized Linear Models. Routledge. ISBN: 978-1-351-44584-9.
McKhann, G. et al. (1984). “Clinical diagnosis of Alzheimer’s disease Report of theNINCDS-ADRDA Work Group* under the auspices of Department of Health
196 BIBLIOGRAPHY
and Human Services Task Force on Alzheimer’s Disease”. In: Neurology 34.7,pp. 939–939.
McKhann, G. M. et al. (2011). “The diagnosis of dementia due to Alzheimer’s dis-ease: recommendations from the National Institute on Aging-Alzheimer’s As-sociation workgroups on diagnostic guidelines for Alzheimer’s disease”. In:Alzheimer’s & Dementia: The Journal of the Alzheimer’s Association 7.3, pp. 263–269. DOI: 10.1016/j.jalz.2011.03.005.
McRobbie, D. W. (2006). MRI from picture to proton. Cambridge, UK; New York:Cambridge University Press. ISBN: 978-0-511-34944-7 978-0-511-34849-5 978-0-511-54540-5.
Mechelli, A. et al. (2005). “Voxel-Based Morphometry of the Human Brain: Meth-ods and Applications”. In: Curr. Med. Imaging Rev. 1.2, pp. 105–113.
Merboldt, K.-D., W. Hanicke, and J. Frahm (1985). “Self-diffusion NMR imagingusing stimulated echoes”. In: Journal of Magnetic Resonance (1969) 64.3, pp. 479–486. DOI: 10.1016/0022-2364(85)90111-8.
Mesrob, L. et al. (2012). “DTI and Structural MRI Classification in Alzheimer’sDisease”. In: AMI 02.02, pp. 12–20.
Misra, C., Y. Fan, and C. Davatzikos (2009). “Baseline and longitudinal patterns ofbrain atrophy in MCI patients, and their use in prediction of short-term con-version to AD: results from ADNI”. In: NeuroImage 44.4, pp. 1415–1422. DOI:10.1016/j.neuroimage.2008.10.031.
Mori, S. et al. (2005). MRI Atlas of Human White Matter. Amsterdam: Elsevier.Mostapha, M. et al. (2018). “Non-Euclidean, convolutional learning on cortical
brain surfaces”. In: 2018 IEEE 15th International Symposium on Biomedical Imag-ing (ISBI 2018), pp. 527–530. DOI: 10.1109/ISBI.2018.8363631.
Mudher, A. and S. Lovestone (2002). “Alzheimer’s disease – do tauists and baptistsfinally shake hands?” In: Trends in Neurosciences 25.1, pp. 22–26. DOI: 10.1016/S0166-2236(00)02031-2.
Müller, M. J. et al. (2005). “Functional implications of hippocampal volume anddiffusivity in mild cognitive impairment”. In: Neuroimage 28.4, pp. 1033–1042.
Müller, M. J. et al. (2007). “Diagnostic utility of hippocampal size and mean dif-fusivity in amnestic MCI”. In: Neurobiology of Aging 28.3, pp. 398–403. DOI:10.1016/j.neurobiolaging.2006.01.009.
Nadeau, C. and Y. Bengio (2000). “Inference for the Generalization Error”. In: Ad-vances in Neural Information Processing Systems 12. Ed. by S. A. Solla, T. K. Leen,and K Müller. MIT Press, pp. 307–313.
Nair, V. and G. E. Hinton (2010). “Rectified linear units improve restricted boltz-mann machines”. In: Proceedings of the 27th international conference on machinelearning (ICML-10), pp. 807–814.
BIBLIOGRAPHY 197
Nelder, J. A. and R. W. M. Wedderburn (1972). “Generalized Linear Models”. In:Journal of the Royal Statistical Society. Series A (General) 135.3, p. 370. DOI: 10.2307/2344614.
Neumann, M. et al. (2006). “Ubiquitinated TDP-43 in frontotemporal lobar degen-eration and amyotrophic lateral sclerosis”. In: Science (New York, N.Y.) 314.5796,pp. 130–133. DOI: 10.1126/science.1134108.
Neumann, M. et al. (2007). “TDP-43-positive white matter pathology in frontotem-poral lobar degeneration with ubiquitin-positive inclusions”. In: Journal of Neu-ropathology and Experimental Neurology 66.3, pp. 177–183. DOI: 10.1097/01.jnen.0000248554.45456.58.
Ning, K. et al. (2018). “Classifying Alzheimer’s disease with brain imaging and ge-netic data using a neural network framework”. In: Neurobiol. Aging 68, pp. 151–158.
Nir, T. M. et al. (2015). “Diffusion weighted imaging-based maximum densitypath analysis and classification of Alzheimer’s disease”. In: Neurobiol. Aging36 Suppl 1, S132–40.
O’Donnell, L. J. and C.-F. Westin (2011). “An introduction to diffusion tensor imageanalysis”. In: Neurosurgery clinics of North America 22.2, pp. 185–viii. DOI: 10.1016/j.nec.2010.12.004.
O’Dwyer, L. et al. (2012). “Using support vector machines with multiple indices ofdiffusion for automated classification of mild cognitive impairment”. In: PLoSOne 7.2, e32441.
Oliveira, F. P. M. and J. M.R. S. Tavares (2014). “Medical image registration: a re-view”. In: Comput. Methods Biomech. Biomed. Engin. 17.2, pp. 73–93.
Operto, G. et al. (2016). “CATI: A Large Distributed Infrastructure for the Neu-roimaging of Cohorts”. In: Neuroinformatics 14.3, pp. 253–264. DOI: 10.1007/s12021-016-9295-8.
Ortiz, A. et al. (2016). “Ensembles of Deep Learning Architectures for the EarlyDiagnosis of the Alzheimer’s Disease”. In: Int. J. Neural Syst. 26.7, p. 1650025.
Panigrahi, A., Y. Chen, and C C. Jay Kuo (2018). “ANALYSIS ON GRADIENTPROPAGATION IN BATCH NORMALIZED RESIDUAL NETWORKS”.
Papma, J. M. et al. (2017). “Cognition and gray and white matter characteristics ofpresymptomaticC9orf72repeat expansion”. In: Neurology 89.12, pp. 1256–1264.DOI: 10.1212/WNL.0000000000004393.
Parisot, S. et al. (2018). “Disease prediction using graph convolutional networks:Application to Autism Spectrum Disorder and Alzheimer’s disease”. In: Med.Image Anal. 48, pp. 117–130.

198 BIBLIOGRAPHY
Parker, T. D. et al. (2018). “Cortical microstructure in young onset Alzheimer’sdisease using neurite orientation dispersion and density imaging”. In: HumanBrain Mapping 39.7, pp. 3005–3017. DOI: 10.1002/hbm.24056.
Pasternak, O. et al. (2009). “Free water elimination and mapping from diffusionMRI”. In: Magnetic Resonance in Medicine 62.3, pp. 717–730. DOI: 10.1002/mrm.22055.
Paszke, A. et al. (2017). “Automatic differentiation in PyTorch”.Pedregosa, F. et al. (2011). “Scikit-learn: Machine Learning in Python”. In: J. Mach.
Learn. Res. 12.Oct, pp. 2825–2830.Peigneux, P. and M. van der Linden (1999). “Influence of ageing and educational
level on the prevalence of body-part-as-objects in normal subjects”. In: Journalof Clinical and Experimental Neuropsychology 21.4, pp. 547–552. DOI: 10.1076/jcen.21.4.547.881.
Perez, L. and J. Wang (2017). “The Effectiveness of Data Augmentation in ImageClassification using Deep Learning”. In:
Petersen, R. C. et al. (2010). “Alzheimer’s Disease Neuroimaging Initiative (ADNI):clinical characterization”. In: Neurology 74.3, pp. 201–209.
Pfefferbaum, A. et al. (2010). “Diffusion tensor imaging of deep gray matter brainstructures: Effects of age and iron concentration”. In: Neurobiology of Aging 31.3,pp. 482–493. DOI: 10.1016/j.neurobiolaging.2008.04.013.
Planetta, P. J. et al. (2016). “Free-water imaging in Parkinson’s disease and atypicalparkinsonism”. In: Brain: A Journal of Neurology 139.Pt 2, pp. 495–508. DOI: 10.1093/brain/awv361.
Poldrack, R. A. et al. (2017). “Scanning the horizon: towards transparent and re-producible neuroimaging research”. In: Nat. Rev. Neurosci. 18.2, pp. 115–126.
Popuri, K. et al. (2018). “Gray matter changes in asymptomatic C9orf72 and GRNmutation carriers”. In: NeuroImage: Clinical. DOI: 10.1016/j.nicl.2018.02.017.
Prasad, G. et al. (2015). “Brain connectivity and novel network measures for Alzheimer’sdisease classification”. In: Neurobiol. Aging 36 Suppl 1, S121–31.
Prechelt, L. (2012). “Early Stopping — But When?” In: Neural Networks: Tricks of theTrade: Second Edition. Ed. by G. Montavon, G. B. Orr, and K.-R. Müller. Berlin,Heidelberg: Springer Berlin Heidelberg, pp. 53–67.
Qiu, S. et al. (2018). “Fusion of deep learning models of MRI scans, Mini–MentalState Examination, and logical memory test enhances diagnosis of mild cogni-tive impairment”. In: Alzheimer’s & Dementia: Diagnosis, Assessment & DiseaseMonitoring 10, pp. 737–749.

BIBLIOGRAPHY 199
Querbes, O. et al. (2009). “Early diagnosis of Alzheimer’s disease using corticalthickness: impact of cognitive reserve”. In: Brain: A Journal of Neurology 132.Pt8, pp. 2036–2047. DOI: 10.1093/brain/awp105.
Rabinovici, G. D. and B. L. Miller (2010). “Frontotemporal Lobar Degeneration”.In: CNS drugs 24.5, pp. 375–398. DOI: 10.2165/11533100-000000000-00000.
Raschka, S. (2015). Python Machine Learning. Packt Publishing Ltd.Rathore, S. et al. (2017). “A review on neuroimaging-based classification studies
and associated feature extraction methods for Alzheimer’s disease and its pro-dromal stages”. In: Neuroimage 155, pp. 530–548.
Raut, A and V Dalal (2017). “A machine learning based approach for detectionof alzheimer’s disease using analysis of hippocampus region from MRI scan”.In: 2017 International Conference on Computing Methodologies and Communication(ICCMC), pp. 236–242.
Razzak, M. I., S. Naz, and A. Zaib (2018). “Deep Learning for Medical Image Pro-cessing: Overview, Challenges and the Future”. In: Classification in BioApps.Lecture Notes in Computational Vision and Biomechanics. Springer, Cham,pp. 323–350. ISBN: 978-3-319-65980-0 978-3-319-65981-7. DOI: 10.1007/978-3-319-65981-7_12.
Renton, A. E. et al. (2011). “A hexanucleotide repeat expansion in C9ORF72 is thecause of chromosome 9p21-linked ALS-FTD”. In: Neuron 72.2, pp. 257–268. DOI:10.1016/j.neuron.2011.09.010.
Reuter, M. et al. (2015). “Head motion during MRI acquisition reduces gray mattervolume and thickness estimates”. In: Neuroimage 107, pp. 107–115.
Ripley, B. D. (1996). Pattern Recognition and Neural Networks by Brian D. Ripley. Cam-bridge University Press.
Rodrigues Cavalcante, K. and P. Caramelli (2009). “Evaluation of the performanceof normal elderly in a limb praxis protocol: influence of age, gender, and educa-tion”. In: Journal of the International Neuropsychological Society: JINS 15.4, pp. 618–622. DOI: 10.1017/S1355617709090663.
Rohrer, J. et al. (2013). “Presymptomatic studies in genetic frontotemporal demen-tia”. In: Revue Neurologique 169.10, pp. 820–824. DOI: 10.1016/j.neurol.2013.07.010.
Rohrer, J. D. et al. (2015). “Presymptomatic cognitive and neuroanatomical changesin genetic frontotemporal dementia in the Genetic Frontotemporal dementiaInitiative (GENFI) study: a cross-sectional analysis”. In: The Lancet Neurology14.3, pp. 253–262.
Rolls, E. T., M. Joliot, and N. Tzourio-Mazoyer (2015). “Implementation of a newparcellation of the orbitofrontal cortex in the automated anatomical labelingatlas”. In: Neuroimage 122, pp. 1–5.

200 BIBLIOGRAPHY
Routier, A et al. (2018). “Clinica: an open source software platform for reproducibleclinical neuroscience studies”. In: Annual meeting of the.
Salvatore, C. et al. (2015). “Magnetic resonance imaging biomarkers for the earlydiagnosis of Alzheimer’s disease: a machine learning approach”. In: Front. Neu-rosci. 9, p. 307.
Samper-González, J. et al. (2018). “Reproducible evaluation of classification meth-ods in Alzheimer’s disease: framework and application to MRI and PET data”.In: DOI: 10.1101/274324.
Sarle, W. S. (1997). “Neural Network FAQ, part 1 of 7”. In: Introduction, periodic post-ing to the Usenet newsgroup comp. ai. neural-nets URL: ftp://ftp. sas. com/pub/neural/FAQ.html.
Scherer, D., A. Müller, and S. Behnke (2010). “Evaluation of Pooling Operations inConvolutional Architectures for Object Recognition”. In: Artificial Neural Net-works – ICANN 2010. Springer Berlin Heidelberg, pp. 92–101.
Schmitt, F., M. K. Stehling, and R. Turner (1998). Echo-Planar Imaging: Theory, Tech-nique and Application. Berlin Heidelberg: Springer-Verlag. ISBN: 978-3-642-80445-8.
Schneider, T. et al. (2017). “Sensitivity of multi-shell NODDI to multiple sclerosiswhite matter changes: a pilot study”. In: Functional Neurology 32.2, pp. 97–101.DOI: 10.11138/FNeur/2017.32.2.097.
Schouten, T. M. et al. (2016). “Combining anatomical, diffusion, and resting statefunctional magnetic resonance imaging for individual classification of mild andmoderate Alzheimer’s disease”. In: Neuroimage Clin 11, pp. 46–51.
Schouten, T. M. et al. (2017). “Individual classification of Alzheimer’s disease withdiffusion magnetic resonance imaging”. In: Neuroimage 152, pp. 476–481.
Schuff, N et al. (2009). “MRI of hippocampal volume loss in early Alzheimer’s dis-ease in relation to ApoE genotype and biomarkers”. In: Brain 132.Pt 4, pp. 1067–1077.
Selnes, P. et al. (2013). “Diffusion tensor imaging surpasses cerebrospinal fluid aspredictor of cognitive decline and medial temporal lobe atrophy in subjectivecognitive impairment and mild cognitive impairment”. In: J. Alzheimers. Dis.33.3, pp. 723–736.
Selvikvåg Lundervold, A. and A. Lundervold (2018). “An overview of deep learn-ing in medical imaging focusing on MRI”. In: Zeitschrift für Medizinische Physik.DOI: 10.1016/j.zemedi.2018.11.002.
Senanayake, U, A Sowmya, and L Dawes (2018). “Deep fusion pipeline for mildcognitive impairment diagnosis”. In: 2018 IEEE 15th International Symposium onBiomedical Imaging (ISBI 2018), pp. 1394–1997.

BIBLIOGRAPHY 201
Sha, S. J. et al. (2012). “Frontotemporal dementia due to C9ORF72 mutations”. In:Neurology 79.10, pp. 1002–1011. DOI: 10.1212/WNL.0b013e318268452e.
Shams-Baboli, A and M Ezoji (2017). “A Zernike moment based method for classi-fication of Alzheimer’s disease from structural MRI”. In: 2017 3rd InternationalConference on Pattern Recognition and Image Analysis (IPRIA), pp. 38–43.
Shattuck, D. W. et al. (2001). “Magnetic resonance image tissue classification usinga partial volume model”. In: Neuroimage 13.5, pp. 856–876.
Shen, T et al. (2018). “Decision Supporting Model for One-year Conversion Prob-ability from MCI to AD using CNN and SVM”. In: 2018 40th Annual Interna-tional Conference of the IEEE Engineering in Medicine and Biology Society (EMBC),pp. 738–741.
Shi, J. et al. (2018). “Multimodal Neuroimaging Feature Learning With MultimodalStacked Deep Polynomial Networks for Diagnosis of Alzheimer’s Disease”. In:IEEE J Biomed Health Inform 22.1, pp. 173–183.
Shmulev, Y., M. Belyaev, and The Alzheimer’s Disease Neuroimaging Initiative(2018). “Predicting Conversion of Mild Cognitive Impairments to Alzheimer’sDisease and Exploring Impact of Neuroimaging: Second International Work-shop, GRAIL 2018 and First International Workshop, Beyond MIC 2018, Heldin Conjunction with MICCAI 2018, Granada, Spain, September 20, 2018, Pro-ceedings”. In: Graphs in Biomedical Image Analysis and Integrating Medical Imag-ing and Non-Imaging Modalities. Ed. by D. Stoyanov et al. Vol. 11044. LectureNotes in Computer Science. Cham: Springer International Publishing, pp. 83–91.
Simonyan, K. and A. Zisserman (2014). “Very Deep Convolutional Networks forLarge-Scale Image Recognition”. In:
Slattery, C. F. et al. (2017). “ApoE influences regional white-matter axonal densityloss in Alzheimer’s disease”. In: Neurobiology of Aging 57, pp. 8–17. DOI: 10.1016/j.neurobiolaging.2017.04.021.
Sled, J. G., A. P. Zijdenbos, and A. C. Evans (1998). “A nonparametric method forautomatic correction of intensity nonuniformity in MRI data”. In: IEEE Trans.Med. Imaging 17.1, pp. 87–97.
Smith, S. M. (2002). “Fast robust automated brain extraction”. In: Hum. Brain Mapp.17.3, pp. 143–155.
Smith, S. M. et al. (2004). “Advances in functional and structural MR image analy-sis and implementation as FSL”. In: Neuroimage 23 Suppl 1, S208–19.
Snowden, J. S. et al. (2006). “Progranulin gene mutations associated with fron-totemporal dementia and progressive non-fluent aphasia”. In: Brain: A Journalof Neurology 129.Pt 11, pp. 3091–3102. DOI: 10.1093/brain/awl267.

202 BIBLIOGRAPHY
Snowden, J. S. et al. (2012). “Distinct clinical and pathological characteristics offrontotemporal dementia associated with C9ORF72 mutations”. In: Brain: AJournal of Neurology 135.Pt 3, pp. 693–708. DOI: 10.1093/brain/awr355.
Song, S.-K. et al. (2002). “Dysmyelination revealed through MRI as increased radial(but unchanged axial) diffusion of water”. In: NeuroImage 17.3, pp. 1429–1436.
Song, Y.-K. et al. (2018). “A study of neurite orientation dispersion and densityimaging in wilson’s disease”. In: Journal of magnetic resonance imaging: JMRI48.2, pp. 423–430. DOI: 10.1002/jmri.25930.
Sonnenburg, S. et al. (2007). “The Need for Open Source Software in MachineLearning”. In: J. Mach. Learn. Res. 8.Oct, pp. 2443–2466.
Spasov, S. E. et al. (2018). “A Multi-modal Convolutional Neural Network Frame-work for the Prediction of Alzheimer’s Disease”. In: Conf. Proc. IEEE Eng. Med.Biol. Soc. 2018, pp. 1271–1274.
Sperling, R. A. et al. (2011). “Toward defining the preclinical stages of Alzheimer’sdisease: recommendations from the National Institute on Aging-Alzheimer’sAssociation workgroups on diagnostic guidelines for Alzheimer’s disease”. In:Alzheimer’s & Dementia: The Journal of the Alzheimer’s Association 7.3, pp. 280–292. DOI: 10.1016/j.jalz.2011.03.003.
Srivastava, N. et al. (2014). “Dropout: a simple way to prevent neural networksfrom overfitting.” In: Journal of Machine Learning Research 15.1, pp. 1929–1958.
Stahl, R et al. (2007). “White Matter Damage in Alzheimer Disease and Mild Cogni-tive Impairment: Assessment with Diffusion-Tensor MR Imaging and ParallelImaging Techniques1”. In: Radiology.
Stodden, V., F. Leisch, and R. D. Peng (2014). Implementing Reproducible Research.CRC Press.
Suhonen, N.-M. et al. (2015). “Slowly progressive frontotemporal lobar degenera-tion caused by the C9ORF72 repeat expansion: a 20-year follow-up study”. In:Neurocase 21.1, pp. 85–89. DOI: 10.1080/13554794.2013.873057.
Suhonen, N.-M. et al. (2017). “Neuropsychological Profile in the C9ORF72 Asso-ciated Behavioral Variant Frontotemporal Dementia”. In: Journal of Alzheimer’sDisease 58.2, pp. 479–489. DOI: 10.3233/JAD-161142.
Suk, H.-I., S.-W. Lee, and D. Shen (2014). “Hierarchical Feature Representation andMultimodal Fusion with Deep Learning for AD/MCI Diagnosis”. In: NeuroIm-age 101, pp. 569–582. DOI: 10.1016/j.neuroimage.2014.06.077.
— (2015). “Latent feature representation with stacked auto-encoder for AD/MCIdiagnosis”. In: Brain structure & function 220.2, pp. 841–859. DOI: 10 . 1007 /s00429-013-0687-3.
Suk, H.-I. et al. (2017). “Deep ensemble learning of sparse regression models forbrain disease diagnosis”. In: Med. Image Anal. 37, pp. 101–113.

BIBLIOGRAPHY 203
Sullivan, G. M. and R. Feinn (2012). “Effect-size-Using Effect Size—or Why the PValue Is Not Enough”. In: Journal of Graduate Medical Education 4.3, pp. 279–282.DOI: 10.4300/JGME-D-12-00156.1.
Susumu Mori and J-Donald Tournier (2013). Introduction to Diffusion Tensor Imaging- 1st Edition.
Szegedy, C. et al. (2015). “Going deeper with convolutions”. In: Proceedings of theIEEE conference on computer vision and pattern recognition, pp. 1–9.
Taqi, A. M. et al. (2018). “The Impact of Multi-Optimizers and Data Augmentationon TensorFlow Convolutional Neural Network Performance”. In: 2018 IEEEConference on Multimedia Information Processing and Retrieval (MIPR), pp. 140–145.
Tariq, M. et al. (2012). Scan-rescan reproducibility of neurite microstructure estimates us-ing NODDI. Proceedings paper. DOI: http://discovery.ucl.ac.uk/1353710/1/Alexander_miua_final.pdf.
Termenon, M et al. (2011). “Alzheimer Disease Classification on Diffusion WeightedImaging Features”. In: New Challenges on Bioinspired Applications. Springer BerlinHeidelberg, pp. 120–127.
Thung, K.-H., P.-T. Yap, and D. Shen (2017). “Multi-stage Diagnosis of Alzheimer’sDisease with Incomplete Multimodal Data via Multi-task Deep Learning”. In:Deep Learn Med Image Anal Multimodal Learn Clin Decis Support (2017) 10553,pp. 160–168.
Tournier, J.-D., F. Calamante, and A. Connelly (2012). “MRtrix: Diffusion Tractog-raphy in Crossing Fiber Regions”. In: Int. J. Imaging Syst. Technol. 22.1, pp. 53–66. DOI: 10.1002/ima.22005.
Trafimow, D. et al. (2018). “Manipulating the Alpha Level Cannot Cure Signifi-cance Testing”. In: Frontiers in Psychology 9. DOI: 10.3389/fpsyg.2018.00699.
Tustison, N. J. and B. B. Avants (2013). “35-Explicit B-spline regularization in dif-feomorphic image registration”. In: Frontiers in Neuroinformatics 7. DOI: 10 .3389/fninf.2013.00039.
Tustison, N. J. et al. (2010). “N4ITK: improved N3 bias correction”. In: IEEE Trans.Med. Imaging 29.6, pp. 1310–1320.
Uchida, S. (2013). “Image processing and recognition for biological images”. In:Dev. Growth Differ. 55.4, pp. 523–549.
Valliani, A. and A. Soni (2017). “Deep Residual Nets for Improved Alzheimer’s Di-agnosis”. In: Proceedings of the 8th ACM International Conference on Bioinformatics,Computational Biology,and Health Informatics. ACM, pp. 615–615.
Van Langenhove, T. et al. (2013). “Distinct clinical characteristics of C9orf72 ex-pansion carriers compared with GRN, MAPT, and nonmutation carriers in

204 BIBLIOGRAPHY
a Flanders-Belgian FTLD cohort”. In: JAMA neurology 70.3, pp. 365–373. DOI:10.1001/2013.jamaneurol.181.
Van Mossevelde, S. et al. (2017). “Clinical Evidence of Disease Anticipation inFamilies Segregating a C9orf72 Repeat Expansion”. In: JAMA neurology 74.4,pp. 445–452. DOI: 10.1001/jamaneurol.2016.4847.
Vanschoren, J. et al. (2014). “OpenML: Networked Science in Machine Learning”.In: SIGKDD Explor. Newsl. 15.2, pp. 49–60.
Varoquaux, G. et al. (2017). “Assessing and tuning brain decoders: Cross-validation,caveats, and guidelines”. In: NeuroImage 145, pp. 166–179. DOI: 10.1016/j.neuroimage.2016.10.038.
Vatsavayai, S. C. et al. (2016). “Timing and significance of pathological featuresin C9orf72 expansion-associated frontotemporal dementia”. In: Brain 139.12,pp. 3202–3216. DOI: 10.1093/brain/aww250.
Vemuri, P. and C. R. Jack Jr (2010). “Role of structural MRI in Alzheimer’s disease”.In: Alzheimers. Res. Ther. 2.4, p. 23.
Vemuri, P. et al. (2008). “Alzheimer’s disease diagnosis in individual subjects usingstructural MR images: validation studies”. In: NeuroImage 39.3, pp. 1186–1197.DOI: 10.1016/j.neuroimage.2007.09.073.
Vos, T. et al. (2016). “Global, regional, and national incidence, prevalence, andyears lived with disability for 310 diseases and injuries, 1990–2015: a systematicanalysis for the Global Burden of Disease Study 2015”. In: The Lancet 388.10053,pp. 1545–1602. DOI: 10.1016/S0140-6736(16)31678-6.
Vovk, U., F. Pernus, and B. Likar (2007). “A review of methods for correction ofintensity inhomogeneity in MRI”. In: IEEE Trans. Med. Imaging 26.3, pp. 405–421.
Vu, T. D. et al. (2017). “Multimodal learning using Convolution Neural Networkand Sparse Autoencoder”. In: 2017 IEEE International Conference on Big Data andSmart Computing (BigComp), pp. 309–312.
Vu, T.-D. et al. (2018). “Non-white matter tissue extraction and deep convolu-tional neural network for Alzheimer’s disease detection”. In: Soft Comput 22.20,pp. 6825–6833.
Walhout, R. et al. (2015). “Brain morphologic changes in asymptomatic C9orf72repeat expansion carriers”. In: Neurology 85.20, pp. 1780–1788.
Wang, H. et al. (2019). “Ensemble of 3D densely connected convolutional networkfor diagnosis of mild cognitive impairment and Alzheimer’s disease”. In: Neu-rocomputing 333, pp. 145–156.
Wang, Q. et al. (2018a). “The Added Value of Diffusion-Weighted MRI-DerivedStructural Connectome in Evaluating Mild Cognitive Impairment: A Multi-Cohort Validation1”. In: J. Alzheimers. Dis. 64.1, pp. 149–169.

BIBLIOGRAPHY 205
Wang, S.-H. et al. (2018b). “Classification of Alzheimer’s Disease Based on Eight-Layer Convolutional Neural Network with Leaky Rectified Linear Unit andMax Pooling”. In: J. Med. Syst. 42.5, p. 85.
Wang, S. et al. (2017). “Automatic Recognition of Mild Cognitive Impairment fromMRI Images Using Expedited Convolutional Neural Networks”. In: ArtificialNeural Networks and Machine Learning – ICANN 2017. Springer InternationalPublishing, pp. 373–380.
Wang, X. et al. (2018c). “Temporal Correlation Structure Learning for MCI Con-version Prediction: 21st International Conference, Granada, Spain, September16-20, 2018, Proceedings, Part III”. In: Medical Image Computing and ComputerAssisted Intervention – MICCAI 2018. Ed. by A. F. Frangi et al. Vol. 11072. LectureNotes in Computer Science. Cham: Springer International Publishing, pp. 446–454.
Wee, C.-Y. et al. (2012). “Identification of MCI individuals using structural andfunctional connectivity networks”. In: Neuroimage 59.3, pp. 2045–2056.
Wee, C.-Y. et al. (2013). “Prediction of Alzheimer’s disease and mild cognitiveimpairment using cortical morphological patterns”. In: Human Brain Mapping34.12, pp. 3411–3425. DOI: 10.1002/hbm.22156.
Wen, D. et al. (2018a). “Deep Learning Methods to Process fMRI Data and TheirApplication in the Diagnosis of Cognitive Impairment: A Brief Overview andOur Opinion”. In: Front. Neuroinform. 12, p. 23.
Wen, J. et al. (2018b). “Reproducible evaluation of diffusion MRI features for auto-matic classification of patients with Alzheimers disease”. In:
Wen, J. et al. (2019). “Neurite density is reduced in the presymptomatic phase ofC9orf72 disease”. In: J Neurol Neurosurg Psychiatry 90.4, pp. 387–394. DOI: 10.1136/jnnp-2018-318994.
Wheeler-Kingshott, C. A. M. and M. Cercignani (2009). “About "axial" and "radial"diffusivities”. In: Magnetic Resonance in Medicine 61.5, pp. 1255–1260. DOI: 10.1002/mrm.21965.
Whitwell, J. L. et al. (2012). “Neuroimaging signatures of frontotemporal dementiagenetics: C9ORF72, tau, progranulin and sporadics”. In: Brain 135.3, pp. 794–806. DOI: 10.1093/brain/aws001.
Whitwell, J. L. et al. (2015). “Brain atrophy over time in genetic and sporadic fron-totemporal dementia: a study on 198 serial MRI”. In: European journal of neu-rology : the official journal of the European Federation of Neurological Societies 22.5,pp. 745–752. DOI: 10.1111/ene.12675.
Wolz, R. et al. (2011). “Multi-method analysis of MRI images in early diagnostics ofAlzheimer’s disease”. In: PloS One 6.10, e25446. DOI: 10.1371/journal.pone.0025446.

206 BIBLIOGRAPHY
Wu, C. et al. (2018). “Discrimination and conversion prediction of mild cogni-tive impairment using convolutional neural networks”. In: Quant. Imaging Med.Surg. 8.10, pp. 992–1003.
Wu, M. et al. (2008). “Comparison of EPI Distortion Correction Methods in Dif-fusion Tensor MRI Using a Novel Framework”. In: Medical Image Computingand Computer-Assisted Intervention – MICCAI 2008. Ed. by D. Metaxas et al.Vol. 5242. Lecture Notes in Computer Science. Berlin, Heidelberg: SpringerBerlin Heidelberg, pp. 321–329.
Xie, S et al. (2006). “Voxel-based detection of white matter abnormalities in mildAlzheimer disease”. In: Neurology 66.12, pp. 1845–1849.
Xie, Y. et al. (2015). “Identification of Amnestic Mild Cognitive Impairment UsingMulti-Modal Brain Features: A Combined Structural MRI and Diffusion TensorImaging Study”. In: J. Alzheimers. Dis. 47.2, pp. 509–522.
Yann, L (1987). “Modeles connexionnistes de lapprentissage”. PhD Thesis. PhDthesis, These de Doctorat, Universite Paris 6.
Yao, Y., L. Rosasco, and A. Caponnetto (2007). “On Early Stopping in GradientDescent Learning”. In: Constr. Approx. 26.2, pp. 289–315.
Yendiki, A. et al. (2014). “Spurious group differences due to head motion in a dif-fusion MRI study”. In: NeuroImage 88, pp. 79–90. DOI: 10.1016/j.neuroimage.2013.11.027.
Zhan, L et al. (2015). “Boosting Classification Accuracy of Diffusion MRI DerivedBrain Networks for the Subtypes of Mild Cognitive Impairment Using HigherOrder Singular Value Decomposition”. In: Proc. IEEE Int. Symp. Biomed. Imaging2015, pp. 131–135.
Zhang, H. et al. (2012). “NODDI: Practical in vivo neurite orientation dispersionand density imaging of the human brain”. In: NeuroImage 61.4, pp. 1000–1016.DOI: 10.1016/j.neuroimage.2012.03.072.
Zhang, T. and B. Yu (2005). “Boosting with early stopping: Convergence and con-sistency”. In: Ann. Stat. 33.4, pp. 1538–1579.
Zhang, Y, M Brady, and S Smith (2001). “Segmentation of brain MR images througha hidden Markov random field model and the expectation-maximization algo-rithm”. In: IEEE Trans. Med. Imaging 20.1, pp. 45–57.
Zhang, Y.-T. and S.-Q. Liu (2018). “Individual identification using multi-metric ofDTI in Alzheimer’s disease and mild cognitive impairment*”. In: Chin. PhysicsB 27.8, p. 088702.
Zhang, Y. et al. (2018). “Multivariate Approach for Alzheimer’s Disease Detec-tion Using Stationary Wavelet Entropy and Predator-Prey Particle Swarm Op-timization”. In: J. Alzheimers. Dis. 65.3, pp. 855–869.

BIBLIOGRAPHY 207
Zhou, T. et al. (2017). “Feature Learning and Fusion of Multimodality Neuroimag-ing and Genetic Data for Multi-status Dementia Diagnosis”. In: Mach Learn MedImaging 10541, pp. 132–140.
— (2019). “Effective feature learning and fusion of multimodality data using stage-wise deep neural network for dementia diagnosis”. In: Hum. Brain Mapp. 40.3,pp. 1001–1016.
Zhu, D. et al. (2014). “Connectome-scale assessments of structural and functionalconnectivity in MCI”. In: Hum. Brain Mapp. 35.7, pp. 2911–2923.
Zlokovic, R. D.a.B. V. (2007). Role of the Blood-Brain Barrier in the Pathogenesis ofAlzheimers Disease.
Copyright © 2022 FDOKUMEN