Neuroimaging and Machine Learning for Dementia Diagnosis
16
IEEE REVIEWS IN BIOMEDICAL ENGINEERING, VOL. XX, NO. XX, XXXX ,XXXX 1 Neuroimaging and Machine Learning for Dementia Diagnosis Md Rishad Ahmed, Yuan Zhang * , Senior Member, IEEE, Zhiquan Feng, Benny Lo, Senior Member, IEEE, Omer T. Inan, Senior Member, IEEE and Hongen Liao * , Senior Member, IEEE Abstract—Dementia, a chronic and progressive cognitive dec- lination of brain function due to disease or impairment, is becoming more prevalent due to the aging population. A major challenge in dementia is achieving the accurate and timely diagnosis. In recent years, neuroimaging with computer-aided algorithms have made remarkable advances in addressing this challenge. Much of the success of these approaches can be at- tributed to the application of machine learning and deep learning techniques for neuroimaging. In this review paper, we present a comprehensive survey of automated diagnostic approaches for dementia using medical image analysis and machine learning algorithms published in the previous five years (2013-2018). Based on the rigorous review of the existing works, we have found that while most of the studies focused on Alzheimer’s disease have demonstrated reasonable performance, the identification of other types of dementia remains a major challenge. Hybrid imaging analysis through deep learning approaches may hold promises for early diagnosis of these other types of dementia, and warrant further investigation in the future. The main contributions of this review paper are as follows: 1. Based on the detailed analysis of the existing literature, this paper discusses the most recent neuroimaging procedures for dementia diagnosis, and 2. It systematically explains the machine learning techniques and, in particular, deep learning approaches for early detection of dementia. Index Terms—Dementia, Neuroimaging, Computer-Aided Di- agnosis (CAD), Image Processing, Machine Learning, Deep Learning. I. I NTRODUCTION O VER the years, the prevalence of infectious diseases and chronic conditions has been increasing due to demo- graphic shifts in the developed nations associated with aging. One severe chronic condition in particular that has garnered significant interest in the mental health research community is dementia, due to (1) its high prevalence among older adults, and (2) its deleterious effects on cognitive skills and abilities required for daily activities [1]–[3]. Dementia is a neurocognitive mental disorder that is a general term covering several diseases causing dependency and disability among older adults worldwide [4]–[6]. According to the World Health Organization (WHO), approximately 47 million people are living with dementia worldwide, and this number is expected Md Rishad Ahmed, Yuan Zhang * and Zhiquan Feng are with Shandong Provincial Key Laboratory of Network Based Intelligent Computing, Univer- sity of Jinan, China. e-mail: [email protected]. Benny Lo is with the Hamlyn Centre, Imperial College London, UK. Omer T. Inan is with School of Electrical and Computer Engineering, Georgia Institute of Technology, USA. Hongen Liao * is with the Department of Biomedical Engineering, School of Medicine, Tsinghua University, China. e-mail: [email protected] to increase to 82 million in 2030 and 150 million by 2050. The underlying causes of dementia can due to neurodegeneration, the weakening of brain interconnects resulting in impaired decision making and memory, and it can also due to non- neurodegenerative mechanisms such as in vascular dementia. The most prevalent types of dementia are depicted in Figure 1, grouped based on whether they can be characterized as neurodegenerative or non-neurodegenerative [7]–[10]. Figure 1: Significant types of Dementia. Neurodegeneration is the main cause of dementia in the elderly. Alzheimer disease, vascular dementia, dementia with Lewy bodies, frontotemporal lobar degeneration, and Parkin- son diseases often appear among older adults can be con- sidered as degenerative dementia [11]–[14]. Examples of non-neurodegenerative dementia include mild cognitive im- pairment, normal pressure hydrocephalus, chronic alcohol abuse, hypothyroidism, intracranial masses (e.g., subdural hematomas, brain tumors), vitamin deficiencies (e.g., B12, thiamine), traumatic brain injury, psychiatric illness (profound depression/anxiety), chemotherapy-related cognitive dysfunc- tion and infections (e.g., human immunodeficiency virus) [15]–[18]. Due to the rapid growth of dementia population, the world- wide death-factor is increasing day by day. Therefore, the early clinical diagnosis of dementia is essential to detect degen- erative histological changes, containing the amyloid plaques, hypo-metabolism, and neurological disorders (atrophy) which indicate biological and pathological processes as a biomarker. Trustworthy biomarkers can help us to differentiate and pre- dict the dementia progression. Over the last few decades, researchers have introduced biomarkers in the form of neu- roimaging techniques which is widely used for diagnosis and suggest a specific pathology underlying the clinical dementia syndrome. Neuroimaging techniques such as Magnetic Reso- nance Imaging (MRI), Positron Emission Tomography (PET) and single-photon emission computed tomography (SPECT) are proficient to diagnose the functional and anatomical infor-
-
Upload
khangminh22 -
Category
Documents
-
view
1 -
download
0
Transcript of Neuroimaging and Machine Learning for Dementia Diagnosis

IEEE REVIEWS IN BIOMEDICAL ENGINEERING, VOL. XX, NO. XX, XXXX ,XXXX 1
Neuroimaging and Machine Learning for DementiaDiagnosis
Md Rishad Ahmed, Yuan Zhang∗, Senior Member, IEEE, Zhiquan Feng, Benny Lo, SeniorMember, IEEE, Omer T. Inan, Senior Member, IEEE and Hongen Liao∗, Senior Member, IEEE
Abstract—Dementia, a chronic and progressive cognitive dec-lination of brain function due to disease or impairment, isbecoming more prevalent due to the aging population. A majorchallenge in dementia is achieving the accurate and timelydiagnosis. In recent years, neuroimaging with computer-aidedalgorithms have made remarkable advances in addressing thischallenge. Much of the success of these approaches can be at-tributed to the application of machine learning and deep learningtechniques for neuroimaging. In this review paper, we present acomprehensive survey of automated diagnostic approaches fordementia using medical image analysis and machine learningalgorithms published in the previous five years (2013-2018). Basedon the rigorous review of the existing works, we have found thatwhile most of the studies focused on Alzheimer’s disease havedemonstrated reasonable performance, the identification of othertypes of dementia remains a major challenge. Hybrid imaginganalysis through deep learning approaches may hold promisesfor early diagnosis of these other types of dementia, and warrantfurther investigation in the future. The main contributions ofthis review paper are as follows: 1. Based on the detailedanalysis of the existing literature, this paper discusses the mostrecent neuroimaging procedures for dementia diagnosis, and 2.It systematically explains the machine learning techniques and,in particular, deep learning approaches for early detection ofdementia.
Index Terms—Dementia, Neuroimaging, Computer-Aided Di-agnosis (CAD), Image Processing, Machine Learning, DeepLearning.
I. INTRODUCTION
OVER the years, the prevalence of infectious diseases andchronic conditions has been increasing due to demo-
graphic shifts in the developed nations associated with aging.One severe chronic condition in particular that has garneredsignificant interest in the mental health research communityis dementia, due to (1) its high prevalence among olderadults, and (2) its deleterious effects on cognitive skills andabilities required for daily activities [1]–[3]. Dementia is aneurocognitive mental disorder that is a general term coveringseveral diseases causing dependency and disability amongolder adults worldwide [4]–[6]. According to the World HealthOrganization (WHO), approximately 47 million people areliving with dementia worldwide, and this number is expected
Md Rishad Ahmed, Yuan Zhang∗ and Zhiquan Feng are with ShandongProvincial Key Laboratory of Network Based Intelligent Computing, Univer-sity of Jinan, China. e-mail: [email protected].
Benny Lo is with the Hamlyn Centre, Imperial College London, UK.Omer T. Inan is with School of Electrical and Computer Engineering,
Georgia Institute of Technology, USA.Hongen Liao∗ is with the Department of Biomedical Engineering, School
of Medicine, Tsinghua University, China. e-mail: [email protected]
to increase to 82 million in 2030 and 150 million by 2050. Theunderlying causes of dementia can due to neurodegeneration,the weakening of brain interconnects resulting in impaireddecision making and memory, and it can also due to non-neurodegenerative mechanisms such as in vascular dementia.The most prevalent types of dementia are depicted in Figure1, grouped based on whether they can be characterized asneurodegenerative or non-neurodegenerative [7]–[10].
Figure 1: Significant types of Dementia.
Neurodegeneration is the main cause of dementia in theelderly. Alzheimer disease, vascular dementia, dementia withLewy bodies, frontotemporal lobar degeneration, and Parkin-son diseases often appear among older adults can be con-sidered as degenerative dementia [11]–[14]. Examples ofnon-neurodegenerative dementia include mild cognitive im-pairment, normal pressure hydrocephalus, chronic alcoholabuse, hypothyroidism, intracranial masses (e.g., subduralhematomas, brain tumors), vitamin deficiencies (e.g., B12,thiamine), traumatic brain injury, psychiatric illness (profounddepression/anxiety), chemotherapy-related cognitive dysfunc-tion and infections (e.g., human immunodeficiency virus)[15]–[18].
Due to the rapid growth of dementia population, the world-wide death-factor is increasing day by day. Therefore, the earlyclinical diagnosis of dementia is essential to detect degen-erative histological changes, containing the amyloid plaques,hypo-metabolism, and neurological disorders (atrophy) whichindicate biological and pathological processes as a biomarker.Trustworthy biomarkers can help us to differentiate and pre-dict the dementia progression. Over the last few decades,researchers have introduced biomarkers in the form of neu-roimaging techniques which is widely used for diagnosis andsuggest a specific pathology underlying the clinical dementiasyndrome. Neuroimaging techniques such as Magnetic Reso-nance Imaging (MRI), Positron Emission Tomography (PET)and single-photon emission computed tomography (SPECT)are proficient to diagnose the functional and anatomical infor-

IEEE REVIEWS IN BIOMEDICAL ENGINEERING, VOL. XX, NO. XX, XXXX ,XXXX 2
mation about the neurodegeneration. Hereafter, the widespreadapplications of medical imaging have led to a new directionin early diagnosis and prediction of dementia [19]–[22].
In the past few years, researchers have presented severalreview papers detailing the technological advancements inbiomedical image processing for dementia diagnosis. In [23],structural, functional and molecular imaging techniques arediscussed for only four types of dementia in the early stagesin 2014. Most recently, authors reviewed MRI and PETbrain image analysis techniques focused on assessing synapticdysfunction and identification of diverse phenotypes [24]–[27]. Since then, many new technological tools for integratedanalysis of distinct neuroimaging data have been proposed, andthese approaches also include methods beyond MRI / PET;with these more recent approaches, the ability to automati-cally quantify brain morphology, function, connectivity, andpathology has improved considerably. Certain trade-offs mustbe made according to the priorities and constraints of eachstudy, and as new technologies are introduced to adapt thesetrade-offs. This review paper provides a detailed overview ofthe most recent years’ research in dementia diagnosis usingbiomedical image processing with machine learning and deeplearning techniques. Thus, the state of the art in neuroimaging,brain anatomy assessment and neurodegenerative conditiondiagnosis is presented.
We thoroughly researched leading databases, namely,IEEE Xplore, ScienceDirect, PubMed, ACM Digital Library,Springer and Nature for dementia diagnosis by medical im-age processing from the year 2013 to 2018. Searching thedatabases based on keywords, such as, “image processingfor dementia diagnosis,” myriad of research articles werefound, from which approximately 300 were selected aftercarefully assessing the relevance of the article based on theirabstracts. Then, follow by a detailed assessment on the fulltext of these 300 papers and the total number of papersanalyzed in depth was narrowed down to 100 papers, fromwhich 45 papers were selected for discussion in the followingsections. The main contributions of this paper are as follows:1. discuss the most recent neuroimaging procedures in thefield of dementia diagnosis for clinical applications and 2.systematically evaluate the machine learning techniques and,in particular, deep learning approaches in early detection ofdementia.
This review is organized as follows: Section 2 discusses themedical imaging analysis in dementia care based on clinicaland statistical approaches. In Section 3, conventional andrecent machine learning approaches to classify dementia aredescribed. Performance measurement is discussed based on thecriteria defined in Section 4. Challenges and future prospectsof the present research on dementia are outlined in Section5. In Section 6, the paper is concluded and future researchdirections are proposed.
II. CLINICAL/STATISTICAL ANALYSIS OF NEUROIMAGINGFOR DEMENTIA DIAGNOSIS
Early diagnosis, subsequent treatment and support is essen-tial for patients in presymptomatic / predementia stages to slow
the deleterious effects and preserve quality of life as long aspossible. Biomedical imaging is a means of visualizing degen-erative histological changes, which include hypo-metabolism,amyloid plaques, and atrophy. Specifically, imaging can yieldquantitative biomarkers suggesting a particular pathology andprognosis for dementia [28], [29]. Figure 2 depicts differentimaging modalities available for such biomarker derivation inthe form of MRI/PET/SPECT images (datasets are discussedin below) which has advantages to capture the brain anomaliesand neural vulnerability factors related to dementia.
There exists several publicly available neuroimagingdatabases, including Alzheimer’s Disease Neuroimaging Ini-tiative (ADNI) established in 2004 [30], Open Access Seriesof Imaging Studies (OASIS) first released in 2007 [31], TheAustralian Imaging, Biomarker & Lifestyle Flagship Study ofAgeing (AIBL) launched in 2006 [32] and CADDementia,structural brain MRI scans [33]. These databases have beenextendedly used in many studies and greatly supported theresearch in dementia.
Figure 2: Biomedical imaging modalities.
In this section, we discuss the most salient imaging modali-ties and analysis algorithms to evaluate the early development,aging and pathological stages of the brain to assist dementiadiagnosis based on clinical and statistical approaches.
A. MRI Modalities
A non-invasive procedure, Magnetic Resonance Imaging(MRI) uses powerful magnets to generate magnetic waves toform two- or three-dimensional images of the brain anatomywithout radioactive tracers, enabling researchers to study boththe functional and structural brain abnormalities including de-mentia. Patients with neurodegenerative diseases can quicklybe assessed safely by this neuroimaging methodology, whichpermits evaluation of functional neural activity and imagingof cortical regions [34], [35]. The functional connectivitybetween the right hippocampus and the set of regions such asthe medial prefrontal cortex (MPFC), ventral anterior cingulatecortex (vACC), right inferior temporal, precuneus cortex, rightsuperior, left cuneus and middle temporal gyrus and posteriorcingulate cortex (PCC), were found to be interrupted in AD[36]. Figure 3 shows some representative examples of MRIscans for dementia diagnosis.

IEEE REVIEWS IN BIOMEDICAL ENGINEERING, VOL. XX, NO. XX, XXXX ,XXXX 3
(a) (b) (c) (d)
Figure 3: MRI scans of Healthy Control (a-b) and AD (c-d),[37].
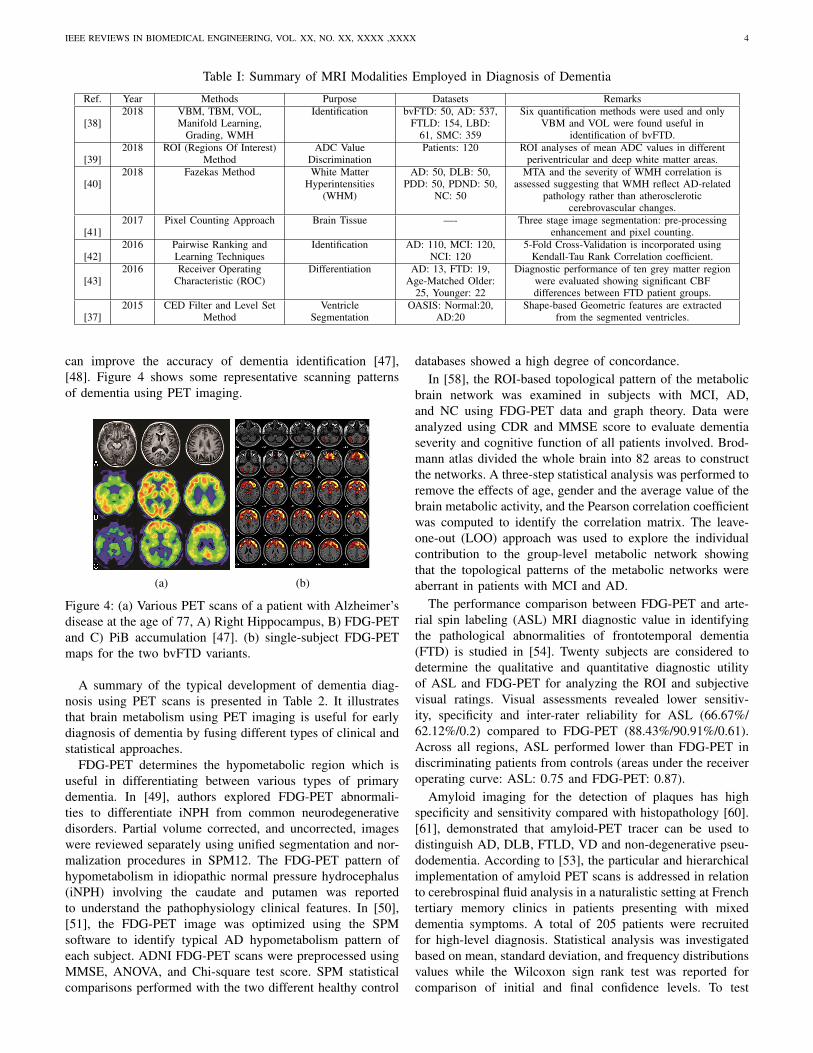
Table 1 summarizes the recent advancements in dementiadiagnosis using various forms of MRI scans. It is apparentthat many different forms of technical and clinical methodshave been developed and utilized for classifying or identifyingbrain pattern for early diagnosis of dementia.
Arterial spin labeling (ASL) - MRI is a noninvasive emerg-ing technique to measure brain perfusion, and augment routinediagnoses as well as differential diagnoses. ASL can reliablyassess the cerebral blood flow (CBF) of a given brain areain patients with dementia [44]. In [43], early diagnosis anddifferentiation between AD and FTD were assessed by in-vestigating ASL-MRI. CBF and Gray matter (GM) volumewith corrected partial volume effects were quantified using3D pseudo-continuous ASL-MRI data and tissue segmentationmethods of SPM8 in the entire supratentorial cortex andten GM regions. Chi-square test and ANOVA were used togroup the patients and their age respectively. MMSE (Mini-Mental State Examination) was used to distinguish betweenAD and FTD patients and control subjects. Receiver operatingcharacteristic (ROC) analysis was considered to evaluate sen-sitivity and specificity showing significant CBF differences.The region of interest (ROI) was different compared withthe functional definition of ROIs which affect hypoperfusionexamination.
In [42], the authors proposed an ASL-fMRI immersivetool based on pairwise ranking and learning techniques fordementia disease diagnosis. Standard regression methods wereused for Partial Volume Effects (PVE) correction, includ-ing fractional Gray Matter (GM), White Matter (WM), andCerebro-Spinal Fluid (CSF) tissue volume. Tissue segmenta-tion was performed via the SPM toolbox on the left & righthippocampus, the left & right parahippocampal gyrus, the left& right putamen, and the left & right thalamus of the brainto calculate mean ASL signal. To validate the immersive toolthey used continuous and differentiable surrogated Kendall-Tau rank correlation coefficient. The extensive experimentsand comprehensive statistical analysis show that the proposedmethod outperform conventional methods.
White matter hyperintensities (WMH) indicate the presenceof cerebrovascular changes: specifically, the loss of vascularintegrity of the brain in asymptomatic elderly subjects. Theunderlying pathology of the WMH signal is heterogeneous andmay vary depending on the image intensity [45]. In [40], AD-related pathology was examined among patients with DLB,PDD, and non-demented PD by associating the WMH severityand medial temporal lobe atrophy. Each subject underwent oneor more cognitive evaluations, such as the revised Hasegawa’s
dementia scale (HDS-R) and MMSE. Group comparisons wereperformed through Student’s t-test and the χ2 test. Fazekasmethods were used to semi-quantify the images, and medialtemporal lobe atrophy (MTA) score was applied to visualizethe MTA. The WMH evaluation shows that DLB and AD havemore severe WMH than PDD.
In [38], the differential diagnosis of behavioral-variant fron-totemporal dementia (bvFTD) from AD, DLB and subjec-tive memory complaints (SMC) is evaluated using six MRIquantification methods, namely VOL, TBM, VBM, Manifold,grading and WMH. Image quantification was examined basedon the utility of the T1-weighted and FLAIR MRI sequencesand DSI (Disease State Index) score. The authors also studiedthe role of the related genetic status in the distinction of thecarriers and noncarriers sensitivity. The demographic and theclinical statistical utility were analyzed by applying Studentt-tests and Pearson χ2 tests for measuring sensitivity usingIBM-SPSS. Only VBM and VOL were found to be convenientin the differentiation of bvFTD from other diseases. In [46],the researchers also used T1 and FLAIR to identify WMSA.
ADC (Apparent Diffusion Coefficient), a measure of tissuewater diffusivity, depends on the interactions between watermolecules and the chemical environment. The ROI (Regionof Interest) is a method to measure the ADC value usingthe following sequences diffusion-weighted imaging, axial T2-weighted image (WI) FLAIR, 3D Inversion recovery T1-WI.A total of sixteen ROIs per subject were drawn per side tocheck the white matter of corona radiate hemispheres: frontal,caudate nuclei and parietal, and lenticular nuclei in [39], todiscriminate in periventricular and deep white matter diffusionpatterns in patients with AD, sVD, normal aging (NA) andpossible iNPH.
Additionally, ventricle enlargement is an essential structuralbiomarker for the diagnosis of dementia using MRI scans tovisualize the brain structures. In [37], modified distance regu-larized level set methods are used to segment ventricles, andextract geometric features to identify the clinical significanceof AD diagnosis based on the OASIS database. Pixel countingapproach is another way to analysis the brain tissue. In [41],used MRI head scans to determine caudate and putamenfor identifying the existence of brain tissue of Creutzfeldt-Jakob Disease (CJD) with the help of pixel counting approachthrough analyzing the image block by block, and three stagesimage segmentation.
B. PET Modalities
By injecting radio-tracers into the bloodstream, PositronEmission Tomography (PET) measures emissions to producetwo- or three-dimensional images of the chemical distributionthroughout the brain. The primary benefit of PET imagingis that blood flow, oxygen and glucose metabolism in theworking brain tissues are easily visible, thus reflecting brainactivity and providing insight into its function. For diagnosingprogressive neurodegenerative disease, biomarkers may beable to provide the pathophysiological objective measurementbased on the metabolism images obtained from PET scans.In addition, the combination of PET with structural MRI
IEEE REVIEWS IN BIOMEDICAL ENGINEERING, VOL. XX, NO. XX, XXXX ,XXXX 4
Table I: Summary of MRI Modalities Employed in Diagnosis of Dementia
Ref. Year Methods Purpose Datasets Remarks
[38]2018 VBM, TBM, VOL,
Manifold Learning,Grading, WMH
Identification bvFTD: 50, AD: 537,FTLD: 154, LBD:
61, SMC: 359
Six quantification methods were used and onlyVBM and VOL were found useful in
identification of bvFTD.
[39]2018 ROI (Regions Of Interest)
MethodADC Value
DiscriminationPatients: 120 ROI analyses of mean ADC values in different
periventricular and deep white matter areas.
[40]2018 Fazekas Method White Matter
Hyperintensities(WHM)
AD: 50, DLB: 50,PDD: 50, PDND: 50,
NC: 50
MTA and the severity of WMH correlation isassessed suggesting that WMH reflect AD-related
pathology rather than atheroscleroticcerebrovascular changes.
[41]2017 Pixel Counting Approach Brain Tissue —- Three stage image segmentation: pre-processing
enhancement and pixel counting.
[42]2016 Pairwise Ranking and
Learning TechniquesIdentification AD: 110, MCI: 120,
NCI: 1205-Fold Cross-Validation is incorporated using
Kendall-Tau Rank Correlation coefficient.
[43]2016 Receiver Operating
Characteristic (ROC)Differentiation AD: 13, FTD: 19,
Age-Matched Older:25, Younger: 22
Diagnostic performance of ten grey matter regionwere evaluated showing significant CBFdifferences between FTD patient groups.
[37]2015 CED Filter and Level Set
MethodVentricle
SegmentationOASIS: Normal:20,
AD:20Shape-based Geometric features are extracted
from the segmented ventricles.
can improve the accuracy of dementia identification [47],[48]. Figure 4 shows some representative scanning patternsof dementia using PET imaging.
(a) (b)
Figure 4: (a) Various PET scans of a patient with Alzheimer’sdisease at the age of 77, A) Right Hippocampus, B) FDG-PETand C) PiB accumulation [47]. (b) single-subject FDG-PETmaps for the two bvFTD variants.
A summary of the typical development of dementia diag-nosis using PET scans is presented in Table 2. It illustratesthat brain metabolism using PET imaging is useful for earlydiagnosis of dementia by fusing different types of clinical andstatistical approaches.
FDG-PET determines the hypometabolic region which isuseful in differentiating between various types of primarydementia. In [49], authors explored FDG-PET abnormali-ties to differentiate iNPH from common neurodegenerativedisorders. Partial volume corrected, and uncorrected, imageswere reviewed separately using unified segmentation and nor-malization procedures in SPM12. The FDG-PET pattern ofhypometabolism in idiopathic normal pressure hydrocephalus(iNPH) involving the caudate and putamen was reportedto understand the pathophysiology clinical features. In [50],[51], the FDG-PET image was optimized using the SPMsoftware to identify typical AD hypometabolism pattern ofeach subject. ADNI FDG-PET scans were preprocessed usingMMSE, ANOVA, and Chi-square test score. SPM statisticalcomparisons performed with the two different healthy control
databases showed a high degree of concordance.In [58], the ROI-based topological pattern of the metabolic
brain network was examined in subjects with MCI, AD,and NC using FDG-PET data and graph theory. Data wereanalyzed using CDR and MMSE score to evaluate dementiaseverity and cognitive function of all patients involved. Brod-mann atlas divided the whole brain into 82 areas to constructthe networks. A three-step statistical analysis was performed toremove the effects of age, gender and the average value of thebrain metabolic activity, and the Pearson correlation coefficientwas computed to identify the correlation matrix. The leave-one-out (LOO) approach was used to explore the individualcontribution to the group-level metabolic network showingthat the topological patterns of the metabolic networks wereaberrant in patients with MCI and AD.
The performance comparison between FDG-PET and arte-rial spin labeling (ASL) MRI diagnostic value in identifyingthe pathological abnormalities of frontotemporal dementia(FTD) is studied in [54]. Twenty subjects are considered todetermine the qualitative and quantitative diagnostic utilityof ASL and FDG-PET for analyzing the ROI and subjectivevisual ratings. Visual assessments revealed lower sensitiv-ity, specificity and inter-rater reliability for ASL (66.67%/62.12%/0.2) compared to FDG-PET (88.43%/90.91%/0.61).Across all regions, ASL performed lower than FDG-PET indiscriminating patients from controls (areas under the receiveroperating curve: ASL: 0.75 and FDG-PET: 0.87).
Amyloid imaging for the detection of plaques has highspecificity and sensitivity compared with histopathology [60].[61], demonstrated that amyloid-PET tracer can be used todistinguish AD, DLB, FTLD, VD and non-degenerative pseu-dodementia. According to [53], the particular and hierarchicalimplementation of amyloid PET scans is addressed in relationto cerebrospinal fluid analysis in a naturalistic setting at Frenchtertiary memory clinics in patients presenting with mixeddementia symptoms. A total of 205 patients were recruitedfor high-level diagnosis. Statistical analysis was investigatedbased on mean, standard deviation, and frequency distributionsvalues while the Wilcoxon sign rank test was reported forcomparison of initial and final confidence levels. To test

IEEE REVIEWS IN BIOMEDICAL ENGINEERING, VOL. XX, NO. XX, XXXX ,XXXX 5
Table II: Summary of PET Image Modalities in Diagnosis of Dementia.
Ref. Year Methods Purpose Datasets Remarks
[52]2018 Voxel-based SPM Prediction of AD MCI: 80 classification and CSF Aβ Significantly predicted
the conversion from MCI to AD dementia.
[49]2018 SPM12, Gaussian Kernel,
t-TestPattern of
HypometabolismHC: 21, AD: 14,DLB/PDD: 14,
bvFTD: 7, iNPH: 7
Group statistical comparisons of striatummetabolism were performed using a one-way
ANOVA test with Tukey HSD post hoc pairwiseanalysis to compare the iNPH group with others.
[53]2018 Clinical Study Cerebrospinal Fluid
AnalysisAD: 205 Results are interpreted based on regional cortical
tracer uptake assessment.
[54]2018 Jaccard similarity index
(JI)Pathological
AbnormalitiesFTD: 10, HC: 10 Regional mean values in thirteen a priori regions
of interest (ROI) were analyzed to identify FTD.
[55]2017 Clinical Assessment The Propagation Of
Tau Pathology18 Imaging profiles were collected from illustrative
patients with baseline diagnoses of prodromalAD, AD dementia and CBS
[56]2017 optimized SPM AD conversion MCI:30 Combining the biomarkers, FDG- and
Amyloid-PET improved classification accuracy.
[57]2017 Clinical Diagnosis Impact of the
amyloid-PETPatients:211 The clinical diagnosis and visual rating analog
scale was assessed to improve the diagnosis.
[58]2017 Robustness and
Leave-One-OutMetabolic Brain
NetworksMCI:86, AD:89,
NCs:97The combination of robustness analysis and LOO
approach, shows abnormal organization of themetabolic networks.
[59]2016 Atlas-based and
voxel-based analysesPattern Comparison DLB: 19, AD: 19,
NC: 95Tau and Amyloid PET in DLB with MRI are
investigated.
[51]2014 SPM Cerebral Glucose
MetabolismAD:36, MCI:12,bvFTD:6, DLB:6
Multiple center images were used to create adementia specific template and validated by a
spatial normalization.
variables, Kruskal-Wallis ANOVA with Dunn’s multiple com-parisons and Mann- Whitney tests were performed. Frequencycomparison was made by Fisher exact test and the Cochran-Armitage test was applied for distinguishing trends. PETfindings resulted in enhancing self-confidence in patients.
In [57], the amyloid PET imaging was assessed using flute-tamol tracer for early diagnosis of dementia based on atypicalclinical symptoms, regarding the diagnosis and patient man-agement plan. Data was analyzed using the MMSE score aftera routine diagnosis which was interpreted as amyloid-negativeor amyloid-positive based on visual rating. Kruskal–Wallistests, and Pearson χ2 tests were assessed among groups andfor the patient management plan. Their clinical diagnosisincreased the overall diagnostic confidence and altered thepatient management plan.
In [56], both FDG-PET and amyloid PET were assessed in aclinical setting to predict AD from MCI using a database of theKarolinska Institutet Stockholm, Sweden. Data were classifiedaccording to the diagnosis criteria. Image analysis accuracywas carried out with SPM5 software and Matlab. ROC analysisand AUC were applied to calculate the sensitivity, accuracy,and specificity for both PET biomarkers with SPSS software.The results have shown that the brain glucose metabolism andamyloid load yield a high accuracy for predicting MCI to ADconversion.
Tau pathology with the comparison of an amyloid PETis another suitable way to investigate the cerebrospinal fluid(CSF), lumbar puncture and preclinical spectrum of dementia.A pattern determination was studied in [59] using tau tracerAV-1451, with probable dementia with Lewy bodies, comparedto AD, and its relationship to β-amyloid deposition on PET.Multimodal neuroimaging data were collected at the MayoClinic Alzheimer’s Disease Research Center (ADRC). MMSE,DRS and CDR score was used to quantify dementia severity.Subjective characteristics were compared among the clinical
groups with the Fisher’s exact test, student’s t-test, or varianceanalysis followed by Tukey Honest Significant Differencestest. The area under the receiver operating characteristic curves(AUROC) was calculated to distinguish DLB and CN, andDLB and AD groups using median SUVr of each atlas ROIafter combining the left and right hemispheric ROIs. FDG-PETbrain metabolism and CSF (tau) classification were used topredict AD and non-AD, in [52]. Data was collected based onneurological and neuropsychological assessments, and clinicalfollow-up. FDG-PET data were analyzed with a validatedvoxel-based SPM method.
Neuroinflammation is a significant way to deposition ofbeta-amyloid plaques and microglia in dementia and can occurin both the gray and white matter due to the heterogeneity. Therelationship between tau pathology and glucose metabolismis assessed in [55] to determine the propagation among pro-dromal and Alzheimer’s disease dementia using PET scanswith tau deposition, FDG (glucose metabolism) and amyloid-β deposition.
C. SPECT Modalities
Single-Photon Emission Computed Tomography (SPECT)imaging is a functional nuclear imaging technique to evaluatethe regional cerebral perfusion of the brain depending onthe radioactive tracer or SPECT agent and, two- or three-dimensional images are captured. Figure 5 shows the scanningpatterns of SPECT modalities of DLB vs. NC.
Table 3 represents the recent technological advancementsof SPECT imaging in dementia diagnosis. It indicates that itis possible to differentiate among various types of dementiaby analyzing brain blood flow or perfusion based on SPECTimages using clinical approaches as well as statistical methods.
SPECT by using ligands of the presynaptic dopaminetransporter (DAT) is a suitable tool for investigating the

IEEE REVIEWS IN BIOMEDICAL ENGINEERING, VOL. XX, NO. XX, XXXX ,XXXX 6
Table III: Summary of SPECT Image Modalities in Diagnosis of Dementia.
Ref. Year Methods Purpose Datasets Remarks
[63]2018 3d-SSP Statistical
AnalysisCerebral Blood Flow
StudyPatient: 1 (Case
Study)Posterior Associative and Cingulate Cortex is
analyzed for the diagnosis of SD.
[62]2017 VOIs using eZIS software Brain Perfusion DLB: 13, AD: 13 Optimization of cingulate island sign (CIS).
[64]2017 Grober and Buchske,
Isaac Set test, visualDiscrimination and
Wechsler tests
Subcortical in VivoStudies
DLB: 11, HC: 12 By using Walker and Neuropsychiatric scales,cognitive fluctuations and apathy were assessed.
[65]2017 Butterworth Filter Dopamine
Transporter BindingFinding
PRD-DLB: 20,CLIN-DLB: 18, AD:
10
Correlations between SBR scores and clinicalsymptoms are investigated.
[66]2017 Conventional and DWH
SBR methodsSBR DLB: 50 McNemar’s test is used to inspect the proportion
of proper VOI definition using DWH comparedwith conventional method.
[67]2016 t-test, χ2-test Differentiating DLB
from ADAD: 57, DLB: 76 A combination of DAT SPECT and MIBG
myocardial scintigraphy is studied.
[68]2014 Univariate Analysis and
Multivariate AnalysisBrain Perfusion and
MyocardialScintigraphy
Probable DLB: 72,Without DLB: 180
AUC values used to assess the indexed diagnosticmeasurement for the discrimination of dementia
with Lewy bodies (DLB).
[69]2014 SPM Cerebral Blood Flow SIVaD:28, HC:33 Cognitive dysfunction Mild Subcortical Ischemic
Vascular Dementia may be related to theseregional CP arrears.
[70]2013 Semi-quantitative
Circumferential ProfilerCBF AD:11, WM-VaD:20,
NC:17All subjects underwent both MRI and Tc-99m
HMPAO SPECT to analysis rCBF.
Figure 5: Group analysis of gray matter accumulation betweenthe DLB and Normal Controls using SPECT scans [62].
functional integrity of dopaminergic nigrostriatal, which canbe a pathway for dementia diagnosis [71]. In [66], the specificbinding ratio (SBR) is an index to measure DAT densityfrom Dopamine transporter single photon emission CT (DAT-SPECT), and distance-weighted histogram (DWH) is used toimprove SBR for dementia with Lewy bodies (DLB). Twoweeks evaluation of patients was performed enduring brainMRI, DAT-SPECT, and cerebral blood flow SPECT with I-123 IMP. Using scatter correction with a Butterworth filter anda standard filtered back-projection algorithm without attenua-tion, the cerebral blood flow SPECT data were reconstructed.SBR of the striatum was calculated using conventional andDWH SBR methods. Two experienced nuclear medicine physi-cians (NM1 and NM2) and brain MRI and CBF SPECTvisualization were evaluated based on VOI definition. Also, thevalidation of inter-observer reproducibility, conventional andDWH SBRs were independently evaluated by NM1 and NM2.McNemar’s test examines the VOI definition changing byDWH with the conventional method through visual evaluation.To improve inter- and intra-observer reproducibility of SBR,DWH may be useful. In [65], the limited prodromal stageof dementia with Lewy bodies (DLB) has been addressedby measuring the dopamine transporter binding, and clinical
relevance of I-FP-CIT SPECT resulting with the long-termolfactory dysfunction and RBD may indicate more severedegeneration of the nigrostriatal dopaminergic pathway.
MIBG myocardial scintigraphy may be a comprehensive di-agnostic tool comparing the differential diagnosis of dementiabased on brain perfusion SPECT. In [68], the combination ofI-MIBG myocardial scintigraphy and I-IMP brain perfusionSPECT was assessed to discriminate DLB. Data was collectedusing consecutive both IMP brain perfusion SPECT and I-MIBG myocardial scintigraphy examination in a clinical setup.The relationship between variables and presence or absenceof DLB in the groups was analyzed by using univariateanalysis while multivariate analysis was performed to obtaina combined index value that forecasts the possibility of DLB.ROC curve with a cutoff value was assessed to calculate thediagnostic value of the index. However, in [62], [67], the useof the combination of DAT-SPECT and MIBG myocardialscintigraphy was assessed for differentiating DLB only fromthe AD. The sensitivity, specificity, and accuracy of bothmethods, as well as their combined use, were assessed fordifferentiating DLB.
In addition, in [69], the mechanism of cognitive dysfunc-tion of subcortical ischemic vascular dementia (SIVaD) wasinvestigated and compared with the distribution of regionalcerebral perfusion (CP) changes in the mild forms of SIVaD,using technetium-99m hexamethylproplyeneamineoxime (Tc-99m HMPAO) SPECT analyzed by SPM. Patients were re-cruited to undergo SPECT imaging for a time duration. Usingthe SPSS software, all statistical analyses for demographicfactors were performed, and independent t-test was used forthe comparison of continuous variables, and Pearson’s chi-squared analyses were used to compare categorical variables.Whereas in [70], semi-quantitative circumferential-profile wasanalyzed between Alzheimer’s disease (AD) and white mattervascular dementia (WM-VaD). Regional cerebral blood flow

IEEE REVIEWS IN BIOMEDICAL ENGINEERING, VOL. XX, NO. XX, XXXX ,XXXX 7
(rCBF) patterns comparison was estimated by underwent MRI,and Tc-99m HMPAO SPECT.
A case study on Semantic Dementia (SD) is done in [63],which is a type of primary progressive aphasia with languagedysfunction. They present a finding based on SPECT byshowing the involvement of the right inferior parietal area, theposterior cingulate cortex and adjacent precuneus compatiblewith new hypo-perfused areas have seen in AD. In [80], thein vivo subcortical level in DLB has been evaluated using I-iodobenzovesamicol, a Single Photon Emission Computed To-mography (SPECT) radiotracer of the Vesicular AcetylcholineTransporter (VAChT), in three cholinergic pathways: sep-tohippocampal, innominate-cortical and Ponto-thalamic andthe involvement of the cholinergic system in cognitive andneuropsychiatric disorders of DLB patients has been assessed.
III. MACHINE LEARNING APPROACHES FOR DEMENTIADIAGNOSIS
Neuroimaging diagnosis for dementia identification is a verycomplicated process and involves a myriad of factors depend-ing on the imaging modalities. Predicting brain phenotypesand morphology (e.g., white and grey matter tractography)from neuroimaging is still challenging. Machine Learningprovides the clinical diagnostic decision by automaticallyclassifying and predicting dementia using computer-aideddiagnosis (CAD) techniques. The fundamental step by stepcomputer-aided diagnosis of dementia using Machine Learningapproaches is shown in Figure 6. Images were preprocessedusing software like SPM or SeeCAT [72] depends on theparameters selection. For feature extractor and relevant featureselection, different statistical methods [73] were used, andcross-validation [74] optimization was used to ensure the gen-eration of the methods. Finally, machine learning approaches,such as SVM, [75] has been applied to classify, predictor distinguish dementia. In this section, the state-of-the-artmachine learning methods used in dementia research has beensystematically discussed.
A. Conventional Machine Learning Approaches for DementiaDiagnosis
Different types of machine learning approaches with theirpurposes and accuracy is depicted in Table 4, with differentimaging modality. It shows that most of the recent literatureused SVM, PCA, ensemble classifier approaches with MRIscans to detect or classify AD type’s dementia.
Supervised learning technique SVM, used for classification,regression or other related tasks by drawing a hyperplane ora set of hyperplanes in a high dimensional space [87]. It isone of the most commonly used classifiers which can performwell with limited training samples and yield low generalizationerror. In multivariate classification and to predict an earlydiagnosis of dementia, SVM is the most frequently usedclassifier. In [84], SVM based classification of the AD inearly-stage diagnosis using three sections of the brain byreferencing OASIS MRI database. The proposed system yieldsa 90.66% accuracy in the early diagnosis of the AD. In [74],SVMs were trained to classify AD-CN, FTD-CN, AD-FTD,
Figure 6: The fundamental step by step computer-aided diag-nosis of dementia using Machine Learning approaches.
and AD-FTD-CN, using voxelwise feature maps derived fromstructural MRI, ASL, and DTI. AUC and SVM significancemaps were analyzed for performance validation and regionalbrain contributions respectively. In [75], using either linearor an RBF kernel selection method to ensemble SVM formulti-class classification of NC, MCI, cMCI and AD based onADNI MRI features. The ensemble SVM outperformed singleSVM with accuracy up to 59.1%. Early detection of the AD ina fully automatic computer-aided diagnosis (CAD) based onSPECT image classification using RBF SVM was assessed in[72]. They found that coronal standard deviation and sagittalcorrelation parameters are the most effective among all thefeatures using ROIs and improving the accuracy of the systemas of 90.38% comparing voxel-as-features (VAF) approach.A personalized diagnostic approach has been proposed usingSVM and MRI brain data in [76], where, bvFTD is classifiedand predicted in a group comparison as well as each subjectusing brain atrophy from MRI scans across the whole brainand frontotemporal, insular and basal ganglia most affected re-gions with the whole brain accuracy as of 86.5%. Combinationof SVM, GPC, and AdaBoost to classify AD using MLNeChMRI data feature vectors of high dimensionality was evaluatedin [77]. Different techniques of feature selection/reduction areassociated to evade the curse-of-dimensionality problem. In[73], comparative study on feature selection method based on

IEEE REVIEWS IN BIOMEDICAL ENGINEERING, VOL. XX, NO. XX, XXXX ,XXXX 8
Table IV: Summary of Machine Learning Techniques in Diagnosis of Dementia.
Ref. Year Application ImageModality
Methods Datasets ValidationSystem
Number ofFeature
Accuracy(%)
[75]2018 Classification: NC
vs. MCI vs. cMCIvs. AD
MRI Ensemble SVM(Linear+ RBF)
NC: 100, MCI:100, cMCI: 100,
AD: 100
Learning:240,Testing: 160
426 55.6/55.0
[76]2017 Pattern
Classification:bvFTD vs HC
MRI VBM+SVM bvFTD: 52, HC:52
Leave One Out —– 83
[77]2017 Classification: AD
vs MCI,HCT1 MRI SVM+GPC+AdaBoost HC: 100, AD:
100, MCI: 100,nMCI: 100
Training: 240,Testing: 160(4-fold crossvalidation)
More than400
57.1
[78]2017 Classification: ND
vs VMD vs MDOASIS-
MRIPSO ND:135,
VMD:70, MD:30Training: 113,Testing: 112
64features ofan image
77.4
[79]2017 Discrimination: NC
vs MCI vs ADADNI-T1
MRIELM+RFE-SVM MCI-NC: 281,
MCI-C: 69, NC:208, AD: 160
10-fold crossvalidation
323 (80selected)
92.84
[74]2017 Classification:
AD-CN, FTD-CN,AD-FTD,
AD-FTD-CN
ASL/DTIMRI
SVM AD: 24, FTD:33, CN: 34
4-fold crossvalidation
voxel-wisefeatures
84
[80]2017 Distinguish: AD vs
bvFTDMRI RF+WM EOAD: 62,
bvFTD:27—- Spatial,
TemporalFeatures
82
[81]2016 Metabolic Patterns FDG-PET SPM+PCA bvFTD: 52 —- Neuro-
psychologicalFeatures
—-
[82]2016 Classification: AD
vs DLB vs FTD vsHC
T1-MRI SVC AD:101, DLB:28, FTD: 55,
HC: 73
Leave-one out —- 68–93
[83]2016 Classification: AD
vs NC, MCI vs NCADNIMRI
SVM AD:200,MCI:400,NC:231
10-foldcross-validation
1000 84.6/ 79.7
[84]2016 Detection: AD vs
MCI vs NCOASISMRI
SVM NC: 50, MCI:17, AD: 8
ROIs —– 90.66
[73]2015 Classification: CN
vs AD vs MCI vsMCIc vs MCInc
ADNIMRI
SVM AD: 137, MCIc:76, MCInc : 134,
CN: 162
k-fold (k=100,2) 200 90.0/64.8
[85]2014 Classification: CN
vs AD, PMCI vsSMCI
ADNIMRI
mi-Graph + LSVM CN: 231, SMCI:238, PMCI: 167,
AD: 198
Leave-One-Outand 10-Fold
—- 89/70
[86]2013 Classification:CTR
vs AD vs FTDSPECT PCA+SVM CTR: 26, AD:
26, FTD: 215-fold crossvalidation
—- 92.66
[72]2013 Detection: AD SPECT SVM NOR:23,
ATD:29Leave-Five-Out FDR-
based90.38
SVM weights as a significance map (p-map), SVM weightvector directly, t-statistics and expert knowledge were evalu-ated using ADNI MRI data for classifying MCI who convertedto AD (MCIc), MCI patients who did not convert to AD(MCInc), AD, and cognitively normal controls (CN). In [79],T1 MRI, to discriminate the AD, MCI from normal control(NC) using extreme learning machine (ELM) classifier incombination with linear kernel support vector machine (SVM)is studied. Also employed SVM-based recursive feature elim-ination (RFE-SVM) algorithm to find the optimal subset offeatures and the result shows that RFE-SVM with ELM has thesuperior classification accuracy to that of linear kernel SVM.In [82], Six MRI visual rating scales were exposed to collectT1-weighted images of confirmed dementia with the AD,DLB, and FTD. Voxel-based morphometry feature was usedfor performance measurement using a support vector classifier(SVC). In [83], two classification problems: AD vs. NC andMCI vs. NC using MRI voxel-based feature was classified bySVM, with or without filter-based feature selection.
Principal component analysis (PCA) based Correlationanalyses between neuropsychological is a meaningful wayto identify dementia brain dysfunction. In [81], FDG-PETmetabolic patterns were retrospectively analyzed to identifyprobable bvFTD. ROIs based cluster analysis was performedand validated by PCA. They found distinct patterns of braindysfunction. Both SPECT and PET images were used todiagnosis AD, and FTD in [86], here an extensive and com-parative evaluation has been studied using PCA and PLS).Three classification methods comprising elastic-net logisticregression (ENLR), multiple discriminant analysis (MDA),and SVM were used to classify AD, asymptomatic controls(CTR) and FTD participants. In [88], MRI of multi-typedementia is used to reduce the dimensionality of an extract keyfeatures using sparse autoencoder (SAE), and PCA approachused to train a LDA and LR classifiers to compare theirprediction accuracy.
The combination of structural (cortical thickness [89], [90]and white matter microstructure) with functional MRI has

IEEE REVIEWS IN BIOMEDICAL ENGINEERING, VOL. XX, NO. XX, XXXX ,XXXX 9
been explored to distinguish AD and bvFTD using randomforest and receiver operator characteristic curve in classifyingthe two clinical syndromes in [80]. In [85], to detect ADand MCI from ADNI MRI scans using a multiple instancelearning (MIL) method is proposed based on leave-one-outcross-validation. OASIS MRI dementia data is used to classifythree dementia classes: non-dementia, very mild dementiaand mild dementia using particle swarm optimization (PSO)providing automated clinical decisions to diagnose dementiawith an accuracy 77.4%, [78].
B. Deep Learning Approaches for Dementia Diagnosis
Another class of machine learning techniques is deep learn-ing which uses multilayer of nonlinear information processingto recognize feature quantities from data like text, image andso on. The main advantage of deep learning is that highly accu-rate mathematical model from a certain amount of large datasetwith improvements in computational power, fast data storage,and parallelization, can easily be obtained without knowingthe detailed internal process. Deep learning algorithms havepromptly become an emerging methodology to the researchersfor analyzing medical images employing image classification,segmentation, registration and other tasks due to its predictivepower and ability to generate automatically optimized high-level features and semantic interpretation from the input data[91], [92]. Figure 7 shows a deep learning based biomarkerusing Softmax as a classifier for early diagnosis of dementia.
Figure 7: Deep learning CNN based hierarchical feature learn-ing and classification to prognosis dementia using Softmaxclassifier [88], [92], [93].
Biomedical imaging modalities with deep learning methodsin early prediction and detection of dementia are summarizedin Table 5, showing that deep neural network depends on thelayer, has better accuracy than conventional machine learningmethods.
An artificial neural network (ANN) is one of the construc-tions of deep learning and has been applied for a diversity oftasks comprising medical image processing. In [94], a two-layered feed-forward neural network designed with sigmoidfunction is trained using the Levenberg-Marquardt supervisedalgorithm to classify the images as normal or demented. TheTwo-Threshold Binary Decomposition algorithm breaks downthe input grayscale image into binary images. Segmentationbased Fractal Texture Analysis (SFTA) technique was used forthe extraction of features. In [95], proposed a novel ensemblelearning framework to identify neuroimaging abnormalities ofbrain MRI, PET and PET-MRI scan based on four layeredANN for classifying AD and MCI which solved the featurefusion learning problem as well as the prediction problemsimultaneously. Comparing the Baseline methods LR, SVM,LGR and NB they have higher accuracy.
In [96], presented a multi-modal imaging marker using anew deep learning algorithm named randomized denoisingautoencoder marker (rDAM) and ADNI MCI data to predictfuture cognitive and neural decline from FDG-PET, amyloidflorbetapir PET, and structural MRI scans. While [97] usedonly stacked auto-encoder (SAE) deep neural networks (DNN)to classify AD from cognitive normal (CN) and mild cognitiveimpairment (MCI) in dementia patients.
The prognosis and diagnosis of AD and MCI for clinicaldecision making using a Deep Ensemble Sparse RegressionNetwork are proposed in [99], where two conceptually differ-ent methods of sparse regression and deep learning are com-bined. They experimented propose model in ADNI cohort byachieving highest diagnostic accuracies in three classificationtask. However, in [98], Deep Belief Network was analyzed todetect Alzheimer’s disease from Structural MRI Classification.They considered a voxel-based morphometric approach forimage preprocessing and feature extraction. Their DBN wasconsisted using 3-hidden layer, fine-tuned three parametersincluding epoch, momentum and the number of nodes in eachlayer.
With the comparison of SVM (67.01%), Logistics regres-sion(67.04%) and CNN with softmax layer (61%), the pro-posed method in [88], [93], combined convolutional neuralnetworks and logistic regression show better performance(74.93%) by training them on MRI scans of the AD. Wherethey used six convolutional layers, six max-pooling layers, sixlocal normalization layers, three fully connection layers, andtwo dropout layers in CNN learning. On the other hand in[100], a very deep convolutional network and the Open AccessSeries of Imaging Studies (OASIS) database was analyzed formulti-Class Alzheimer’s disease detection where a stem layerincludes several 3 * 3 convolution layers, 1 * 1 convolutionlayer, and max-pooling layer and seven 3 * 3 convolution layerconnected in different stages and two filter expansion layers.
IV. PERFORMANCE MEASUREMENT
Computer-aided diagnosis of dementia depends on differentalgorithms using neuroimaging modalities have shown highperformance in the previous literature, but their performanceis varied as data sets, and evaluation methodology is different,

IEEE REVIEWS IN BIOMEDICAL ENGINEERING, VOL. XX, NO. XX, XXXX ,XXXX 10
Table V: Summary of Deep Learning Techniques in Diagnosis of Dementia.
Ref. Year Purpose ImageModality
Datasets Methods NetworkStructure
FeatureVectorSize
Number ofFeature
Accuracy(%)
[94]2017 Feature Extraction
and ClassificationOASIS:
MRINC: 40, MD: 40 SFTA+
feedfor-wardNN
2-layered 80*6 3 for eachof thebinaryimage
97.5
[97]2017 Classification of
ADADNI:MRI
CN: 171, MCI:232, AD: 101
SAE+DNN 3-layered —- 311 withFDCM:
5000
56.6/73.3
[98]2017 Classification OASIS:
MRIAD: 49, HC: 49 DBN 3-hidden
layered—- 3635 91.76
[99]2017 AD vs. NC , MCI
vs. NC, pMCI vs.sMCI
ADNI:MRI
AD: 186, MCI:393, NC: 226
DESRN 5-layered 3*4,3*1,2*1
93 90.28
[93]2017 Differentiating
Types of DementiaMRI OASIS: 74 CNN 23-layered 176*208 —- 70.97
[100]2017 Multi-class
ClassificationOASIS:
MRI416 CNN 7-layered 299*299 —- 73.75
[95]2016 AD/MCI related
classificationADNI:
MRI+PETAD: 51, MCI:99,
NC:52ANN 4-layered —- Binary
featureSPE
96.7/SPE0.62
[96]2015 Prediction of
DementiaADNI2:
PET+MRIAD: 101, HC:148, MCI: 267
rDA 2-levelrandomi-
zation
—- —- NaN
so it is difficult to address their performance comparability,generalizability, and clinical applicability issues. The perfor-mance is being reckoned through the calculation of variousmeasures, such as Sensitivity, Specificity, Predictive Values,Accuracy, Precision, Confusion Matrix, and sometimes miss-ing value assumption. Most of the literature showed theirmethods validation based on either in accuracy or sensitivity orspecificity. However, for an acceptable, accurate and suitabletool for dementia diagnosis there need to validate the proposedmethods through the calculation of various measures ratherthan accuracy or sensitivity or specificity as discussed below.
1) Classification Accuracy: The differentiating betweenpatients with dementia and normal controls, the accuracyof the image interpretation is one of the key performancemeasurement for computer-aided diagnosis of dementia. Thepercentage of predictions in identifying patients with onsetdementia syndromes to the total number of the dataset is givenby the equation below.
acc = Trp+Trn
a+ b+ c+ d
Where a+ b+ c+ d denotes the total number of subjects.2) Confusion Matrix: The two-dimensional matrix where
each column presents a predicted class while each row rep-resents an actual class. In performance measurement of aCAD algorithm to diagnose dementia with known ground truthdiagnosis against a test dataset, each matrix cell representseither predict class or actual class in a row-column way.
3) Precision: To get the high-performance computer-aideddiagnosis of neuroimaging, the proportion of predict subjectsto the total actual subjects is being considered, which is calledprecision.
4) Sensitivity: The probability of diagnostic assessmentsto recognize the subjects who have dementia. The CADsensitivity can be defined by,
Sensitivity =a
a+ c
Where a is the total number of patients having dementia asa positive test and c refers to the total number of dementiapeople with a negative test. Thus, a + c represents the totalnumber of subjects with dementia.
5) Specificity: The probability of negative test identificationamong the subjects without dementia. The CAD specificity isgiven by,
Specificity =d
d+ b
Where, d indicates the patients as not having dementia, brefers the subjects without dementia by negative test and d+brepresents the total number of subjects without dementia.
6) Predictive values (PV): It is defined as the added valueof correctly identified as people having dementia, i.e., truepositive (TrP ) and not having dementia, i.e., true negatives(TrN ). PV is given by,
PV = TrP + TrN
7) Missing Values Confiscation: The performance of amodel can be different due to the missing value of thetraining data, it may affect the performance like it is wrong orimprecise predictions. Various methods have been suggestedbased on clinical dementia rating (CDR), to improve theclassification accuracy as well as ignore the performance issue.
The validation of each model proposed in early diagnosisof dementia is signified by investigating the capability ofthese biomarkers to distinguish between HC and patients withdementia as well as types of dementia. Therefore, in the futureresearch, researchers need to consider these validation criteriafor the better diagnosis of dementia patients.
V. MAJOR CHALLENGES AND FUTURE PROSPECTS
The concept of assisting radiologists in neuroimaging anal-ysis based on computer-aided diagnosis (CAD) is growing in

IEEE REVIEWS IN BIOMEDICAL ENGINEERING, VOL. XX, NO. XX, XXXX ,XXXX 11
acceptance over the recent years, and particularly holds meritfor the prediction and earl detection fo dementia.
The state-of-the-art has focused on discriminatingAlzheimer’s disease multistate mostly, so the diagnosis ofvarious types of dementia is remaining a significant gap.However, the diagnosis of dementia for early detection andprediction is a vast, challenging work according to the humanbrain irregularities like the cognitive function of the brain,neuroimaging quality, noise and related reasons.
Based on the details discussion of the recent research arti-cles we have found several challenges in dementia diagnosis:1) Radio-tracer used in image collection which may have someside effects, 2) Large neuroimaging dataset needs a sufficientamount of labeling time to train a machine learning system,3) Another limiting factor is noise, 4) Data heterogeneity,and 5) Finally, clinical features in medical imaging sometimesdefends on physicians collection. Therefore, researcher’s needto focus here to discover an indicative biomarker regardingdementia diagnosis that can enhance our understanding ofneuroimaging.
In the future, there needs a routine clinical practice ofneuroimaging to diagnostic dementia. Deep learning will bemore accessible to learn from examples and prior knowledgeof more data sources which are playing an essential rolein the diagnostic application. Using deep learning architec-ture recently the visualization and quantification of brainblood flow, and image interpretation like classification taskis made successfully [101]. Such as [102], [103], they dis-criminated AD from MCI using deep learning unsupervisedStacked-autoencoder method to learn the hidden patterns usingthe segmentation of the gray-matter of MRI and FDG-PETscans, which has higher accuracy compared with SVM andPCA+SVM approaches. In [104], stacked autoencoder andsoftmax classifier are used to classify AD using R-fMRIdata, comparing with LDA, LR, SVM their accuracy increasemaximum 18.75% improvement in classification performance.So we forecast that deep learning leveraging technologies havean enormous impact on neuroimaging modalities analysis todiagnose dementia for early detection and prediction.
It is predicted that multi-modal molecular imaging canseizure the corresponding information of a patient in a singlescan such as the recent development PET/MRI or SPECT/MRIor PET/CT or SPECT/CT which has the advantages includingspatial and temporal resolution, functional anatomical basis,targeting disease biomarkers with high accuracy in brainresearch. Temporal and spatial registration of simultaneousPET/MRI is assessed in [105], where Arterial Spin Labeling(ASL) is shown to be an alternative of FDG-PET for clinicaldiagnosis of bvFTD. So based on the recent advancementof medical image modalities along with their analysis tech-nologies in dementia diagnosis, the performance of automaticdementia diagnosis is noticeably improving.
On the supplementary, Electroencephalography (EEG), re-flects the unseen brain anomalies which can be employed todetermine and distinguish certain brain function conditions.EEG brain signal analysis using computerized methods hasrevealed the cognitive dysfunction of dementia diagnosis.Therefore EEG can be used as a yardstick to early diagnosis
of dementia using deep learning method [106]. According to[107], deep learning CNN was exploited to classify AD fromMCI and HC using EEG patterns. EEG data were collectedbased on the golden standard of 119 dementia patients. Twolayered CNN was subjugated where second convolutional layerwas generated as of an auto-encoder MLP. The performanceresult (80%) was satisfying comparing with others conven-tional methods. In [108], multilayer neural networks (MLP-NN) was assessed to differentiate CJD patients from AD usingEEG data with an accuracy of 89%.
Instantaneous detection of dementia can prevent the patientsfrom significant type’s severity like stroke, death. Despite neu-roimaging and EEG, wearable sensor-based diagnosis for earlydetection and treatment of dementia are now widely used forcontinuous sensing the physiological parameters. Behavioraland environmental sensing and intervention (BESI), which cansense behavioral activities using wearable and monitor ambientparameters within the home. With this real-time behavioraldata, it is possible to give real-time notifications for earlytreatment of dementia type patients [109]. Recently in [110],deep learning recurrent neural network (RNN) based on longshort-term memory (LSTM, was examined the patterns of thePWD inertial motion data to build a sequential behavior modelfor inferring physical agitation in dementia.
VI. CONCLUSION
This review paper augments the existing literature by pro-viding a comprehensive survey of all relevant neuroimagingmodalities and associated analysis techniques presented inthe past five years for diagnosing dementia. Previous reviewpapers have focused only on a particular imaging modalitysuch as MRI or PET, or on one specific type of dementiaonly such as AD. We aimed to cover a broader space ofimaging and machine learning / deep learning technologies fordementia diagnostics such that researchers in the field couldreadily identify the state of the art in the domain. Moreover,we emphasize the importance of early detection and predictionof dementia, such that treatment and support can be providedto patients as soon as possible—this would, in turn, slow thedegenerative processes and sustain the patient’s quality of lifefor as long as possible. Our review can be divided into twocategories: (1) a discussion of the most recent neuroimagingprocedures in the field of dementia diagnosis for criticalclinical applications, and (2) a systematic description of themachine learning techniques and, in particular, deep learningapproaches for early detection of dementia. We summarizedthe most recent neuroimaging modalities—MRI, PET, andSPECT—and machine learning and deep learning technologiesfor feature extraction and classification methods in diagnosingvarious forms of dementia. We concluded based on the per-formance measures among algorithms in the existing literaturethat the ability to diagnose AD using MRI scans is promisingbut substantial progress is needed for diagnosing other types ofdementia such as FTD, VD, and PD. We further found that thedeep learning approaches for analyzing brain images obtainedwith state-of-the-art imaging techniques perform better thanconventional machine learning and imaging methods—the
IEEE REVIEWS IN BIOMEDICAL ENGINEERING, VOL. XX, NO. XX, XXXX ,XXXX 12
field is thus progressing rapidly in the direction of deliveringthe accurate and early diagnosis of dementia in its variousforms. However, more research is needed to perform betterclassification for diagnosing dementia and, in particular, forproviding earlier detection for enabling early onset treatment.
ACKNOWLEDGMENT
The authors acknowledge supports from National NaturalScience Foundation of China (61572231, 81427803,81771940, 61472163), National Key Research andDevelopment Program of China (2017YFC0108000,2018YFB1004900), Beijing National Science Foundation(7172122, L172003), and Shandong Provincial Key Research& Development Project (2017GGX10141).
REFERENCES
[1] “2018 alzheimer’s disease facts and figures,” Alzheimer’s & Dementia,vol. 14, no. 3, pp. 367 – 429, 2018.
[2] B. Poblador-Plou, A. Calderon-Larranaga, J. Marta-Moreno, J. Hancco-Saavedra, A. Sicras-Mainar, M. Soljak, and A. Prados-Torres, “Co-morbidity of dementia: a cross-sectional study of primary care olderpatients,” BMC Psychiatry, vol. 14, no. 1, p. 84, Mar 2014.
[3] A. L. Dallora, S. Eivazzadeh, E. Mendes, J. Berglund, and P. An-derberg, “Prognosis of dementia employing machine learning andmicrosimulation techniques: A systematic literature review,” ProcediaComputer Science, vol. 100, pp. 480 – 488, 2016.
[4] M. Prince, M. Guerchet, and M. Prina, The Epidemiology and Impact ofDementia: Current State and Future Trends. WHO Thematic Briefing.World Health Organization, 3 2015.
[5] I. E. van de Vorst, I. Vaartjes, M. I. Geerlings, M. L. Bots, and H. L.Koek, “Prognosis of patients with dementia: results from a prospectivenationwide registry linkage study in the netherlands,” BMJ open, vol. 5,no. 10, p. e008897, October 2015.
[6] “Who,” http://www.who.int/news-room/facts-in-pictures/detail/dementia, accessed: 2018-05-25.
[7] “Alzheimer’s association,” https://www.alz.org/dementia/types-of-dementia.asp, accessed: 2018-05-28.
[8] M. F. Mendez, “Early-onset alzheimer disease,” Neurologic Clinics,vol. 35, pp. 263–281, 05 2017.
[9] R. Sperling, E. Mormino, and K. Johnson, “The evolution of preclinicalalzheimer’s disease: Implications for prevention trials,” Neuron, vol. 84,no. 3, pp. 608 – 622, 2014.
[10] “National institute on aging-nih,” https://www.nia.nih.gov/health/types-dementia, accessed: 2018-05-28.
[11] S. Haller, D. Fallmar, and E.-M. Larsson, “Susceptibility weightedimaging in dementia with lewy bodies: will it resolve the blind spotof mri?” Neuroradiology, vol. 58, no. 2, pp. 217–218, Feb 2016.
[12] F. Agosta, F. Caso, and M. Filippi, “Dementia and neuroimaging,”Journal of Neurology, vol. 260, no. 2, pp. 685–691, Feb 2013.
[13] K. A. Jellinger, “Dementia with lewy bodies and parkinson’s disease-dementia: current concepts and controversies,” Journal of neural trans-mission (Vienna, Austria : 1996), vol. 125, no. 4, p. 615—650, April2018.
[14] J. J. Chen, “Functional mri of brain physiology in aging and neurode-generative diseases,” NeuroImage, 2018.
[15] E. C. Finger, “Frontotemporal dementias,” Continuum (Minneapolis,Minn.), vol. 22, no. 2 Dementia, p. 464—489, April 2016.
[16] S. Ghosh and C. F. Lippa, “Clinical subtypes of frontotemporal de-mentia,” American journal of Alzheimer’s disease and other dementias,vol. 30, no. 7, p. 653—661, November 2015.
[17] Z. Walker, K. L. Possin, B. F. Boeve, and D. Aarsland, “Lewybody dementias,” Lancet (London, England), vol. 386, no. 10004, p.1683—1697, October 2015.
[18] N. T. Olney, S. Spina, and B. L. Miller, “Frontotemporal dementia,”Neurologic Clinics, vol. 35, no. 2, pp. 339 – 374, 2017.
[19] F. L. Seixas, B. Zadrozny, J. Laks, A. Conci, and D. C.Muchaluat Saade, “A bayesian network decision model for supportingthe diagnosis of dementia, alzheimer’s disease and mild cognitiveimpairment,” Computers in biology and medicine, vol. 51, p. 140—158,August 2014.
[20] M. Liu, D. Zhang, and D. Shen, “Relationship induced multi-templatelearning for diagnosis of alzheimer’s disease and mild cognitive im-pairment,” IEEE transactions on medical imaging, vol. 35, no. 6, p.1463—1474, June 2016.
[21] T. Zhou, K.-H. Thung, X. Zhu, and D. Shen, “Feature learning andfusion of multimodality neuroimaging and genetic data for multi-status dementia diagnosis,” in Machine Learning in Medical Imaging,Q. Wang, Y. Shi, H.-I. Suk, and K. Suzuki, Eds. Cham: SpringerInternational Publishing, 2017, pp. 132–140.
[22] J. Kurth, M. Sakretz, S. Teipel, and B. J. Krause, “Molecular imagingof dementia,” Geriatric Mental Health Care, vol. 1, no. 3, pp. 56 – 62,2013.
[23] V. Valkanova and K. P. Ebmeier, “Neuroimaging in dementia,” Matu-ritas, vol. 79, no. 2, pp. 202 – 208, 2014.
[24] W. J. Niessen, “Mr brain image analysis in dementia: From quantitativeimaging biomarkers to ageing brain models and imaging genetics,”Medical Image Analysis, vol. 33, pp. 107 – 113, 2016.
[25] O. M. Henriksen, L. Marner, and I. Law, “Clinical pet/mr imaging indementia and neuro-oncology,” PET Clinics, vol. 11, no. 4, pp. 441 –452, 2016.
[26] T. Kato, Y. Inui, A. Nakamura, and K. Ito, “Brain fluorodeoxyglucose(fdg) pet in dementia,” Ageing Research Reviews, vol. 30, pp. 73 – 84,2016.
[27] A. Arab, A. Wojna-Pelczar, A. Khairnar, N. Szabo, and J. Ruda-Kucerova, “Principles of diffusion kurtosis imaging and its role in earlydiagnosis of neurodegenerative disorders,” Brain Research Bulletin, vol.139, pp. 91 – 98, 2018.
[28] V. Valkanova and K. P. Ebmeier, “Neuroimaging in dementia,” Matu-ritas, vol. 79, no. 2, pp. 202 – 208, 2014.
[29] A. Arab, A. Wojna-Pelczar, A. Khairnar, N. Szabo, and J. Ruda-Kucerova, “Principles of diffusion kurtosis imaging and its role in earlydiagnosis of neurodegenerative disorders,” Brain Research Bulletin, vol.139, pp. 91 – 98, 2018.
[30] C. R. Jack, M. A. Bernstein, N. C. Fox, P. Thompson, G. Alexander,D. Harvey, B. Borowski, P. J. Britson, J. L. Whitwell, and C. Ward,“The alzheimer’s disease neuroimaging initiative (adni),” Journal ofMagnetic Resonance Imaging, vol. 9, no. 1, p. 101, 2015. [Online].Available: http://adni.loni.usc.edu/
[31] D. S. Marcus, T. H. Wang, J. Parker, J. G. Csernansky, J. C. Morris, andR. L. Buckner, “Open access series of imaging studies (oasis): Cross-sectional mri data in young, middle aged, nondemented, and dementedolder adults,” Journal of Cognitive Neuroscience, vol. 19, no. 9, pp.1498–1507, 2007. [Online]. Available: http://www.oasis-brains.org/
[32] V. L. Villemagne, “Aibl (australian imaging, biomarkers and lifestyle)flagship study of aging,” Alzheimers & Dementia, vol. 5, no. 4, pp.P1–P2, 2009. [Online]. Available: https://aibl.csiro.au/
[33] E. E. Bron, M. Smits, W. M. van der Flier, H. Vrenken, F. Barkhof,P. Scheltens, J. M. Papma, R. M. Steketee, C. M. Orellana,R. Meijboom, M. Pinto, J. R. Meireles, C. Garrett, A. J. Bastos-Leite, A. Abdulkadir, O. Ronneberger, N. Amoroso, R. Bellotti,D. Cardenas-Pena, A. M. Alvarez Meza, C. V. Dolph, K. M.Iftekharuddin, S. F. Eskildsen, P. Coupe, V. S. Fonov, K. Franke,C. Gaser, C. Ledig, R. Guerrero, T. Tong, K. R. Gray, E. Moradi,J. Tohka, A. Routier, S. Durrleman, A. Sarica, G. D. Fatta, F. Sensi,A. Chincarini, G. M. Smith, Z. V. Stoyanov, L. Sørensen, M. Nielsen,S. Tangaro, P. Inglese, C. Wachinger, M. Reuter, J. C. van Swieten,W. J. Niessen, and S. Klein, “Standardized evaluation of algorithmsfor computer-aided diagnosis of dementia based on structural mri: Thecaddementia challenge,” NeuroImage, vol. 111, pp. 562 – 579, 2015.[Online]. Available: https://caddementia.grand-challenge.org/home/
[34] G. G. Lakshmi and A. Suruliandi, “Anatomical structure segmentationin mri brain images,” in 2011 International Conference on EmergingTrends in Electrical and Computer Technology, March 2011, pp. 786–791.
[35] B. Bhuvaneshwari and A. Kavitha, “Investigations on the brain con-nectivity patterns in progression of alzheimer’s disease using functionalmr imaging and graph theoretical measures,” in 2017 IEEE 16th Inter-national Conference on Cognitive Informatics & Cognitive Computing(ICCI*CC), vol. 00, July 2017, pp. 151–160.
[36] S. C, V. S, G. R. S, S. P. B, and K. A, “Assessment of functionalconnectivity in autistic brain fmri,” in 2015 IEEE 14th InternationalConference on Cognitive Informatics Cognitive Computing (ICCI*CC),July 2015, pp. 169–174.
[37] K. R. Anandh, C. M. Sujatha, and S. Ramakrishnan, “Analysis ofventricles in alzheimer mr images using coherence enhancing diffusionfilter and level set method,” in 2014 International Conference onInformatics, Electronics Vision (ICIEV), May 2014, pp. 1–4.

IEEE REVIEWS IN BIOMEDICAL ENGINEERING, VOL. XX, NO. XX, XXXX ,XXXX 13
[38] A. Cajanus, A. Hall, J. Koikkalainen, E. Solje, A. Tolonen, T. Urhemaa,Y. Liu, R. M. Haanpaa, P. Hartikainen, S. Helisalmi, V. Korhonen,D. Rueckert, S. Hasselbalch, G. Waldemar, P. Mecocci, R. Vanninen,M. van Gils, H. Soininen, J. Lotjonen, and A. M. Remes, “Automaticmri quantifying methods in behavioral-variant frontotemporal dementiadiagnosis,” Dementia and geriatric cognitive disorders extra, vol. 8,no. 1, p. 51—59, 2018.
[39] A. Goujon, M. Mejdoubi, Y. Purcell, R. Banydeen, S. Colombani,and A. Arrigo, “Can mri water apparent diffusion coefficient (adc)value discriminate between idiopathic normal pressure hydrocephalus,alzheimer’s disease and subcortical vascular dementia?” Journal ofneuroradiology. Journal de neuroradiologie, vol. 45, no. 1, p. 15—22,February 2018.
[40] H. Joki, Y. Higashiyama, Y. Nakae, C. Kugimoto, H. Doi, K. Kimura,H. Kishida, N. Ueda, T. Nakano, T. Takahashi, S. Koyano, H. Takeuchi,and F. Tanaka, “White matter hyperintensities on mri in dementiawith lewy bodies, parkinson’s disease with dementia, and alzheimer’sdisease,” Journal of the Neurological Sciences, vol. 385, pp. 99 – 104,2018.
[41] A. J. Islam, K. T. Ahammad, B. Barua, S. S. Alam, and A. Biswas,“A new approach of brain mri analysis for identifying creutzfeldt-jakob disease (cjd),” in 2017 3rd International Conference on ElectricalInformation and Communication Technology (EICT), Dec 2017, pp. 1–5.
[42] W. Huang, S. Zeng, J. Li, and G. Chen, “A new image-based immersivetool for dementia diagnosis using pairwise ranking and learning,”Multimedia Tools Appl., vol. 75, no. 9, pp. 5359–5376, May 2016.
[43] R. M. E. Steketee, E. E. Bron, R. Meijboom, G. C. Houston, S. Klein,H. J. M. M. Mutsaerts, C. P. Mendez Orellana, F. J. de Jong, J. C. vanSwieten, A. van der Lugt, and M. Smits, “Early-stage differentiationbetween presenile alzheimer’s disease and frontotemporal dementiausing arterial spin labeling mri,” European radiology, vol. 26, no. 1,p. 244—253, January 2016.
[44] C. E. Wierenga, C. C. Hays, and Z. Z. Zlatar, “Cerebral blood flowmeasured by arterial spin labeling mri as a preclinical marker ofalzheimer’s disease,” Journal of Alzheimer’s disease : JAD, vol. 42Suppl 4, p. S411—9, 2014.
[45] D. Salat, “Imaging small vessel-associated white matter changes inaging,” Neuroscience, vol. 276, p. 174—186, September 2014.
[46] J. M. Riphagen, E. H. Gronenschild, D. H. Salat, W. M. Freeze,D. Ivanov, L. Clerx, F. R. J. Verhey, P. Aalten, and H. I. L. Jacobs,“Shades of white: diffusion properties of t1- and flair-defined whitematter signal abnormalities differ in stages from cognitively normal todementia,” Neurobiology of aging, vol. 68, p. 48—58, April 2018.
[47] K. Ishii, “Pet approaches for diagnosis of dementia,” AJNR. Americanjournal of neuroradiology, vol. 35, no. 11, p. 2030—2038, 2014.
[48] L. B. Eisenmenger, E. J. Huo, J. M. Hoffman, S. Minoshima, M. C.Matesan, D. H. Lewis, B. J. Lopresti, C. A. Mathis, D. O. Okonkwo,and J. M. Mountz, “Advances in pet imaging of degenerative, cere-brovascular, and traumatic causes of dementia,” Seminars in nuclearmedicine, vol. 46, no. 1, p. 57—87, January 2016.
[49] R. A. Townley, H. Botha, J. Graff-Radford, B. F. Boeve, R. C. Petersen,M. L. Senjem, D. S. Knopman, V. Lowe, C. R. Jack, and D. T. Jones,“18f-fdg pet-ct pattern in idiopathic normal pressure hydrocephalus,”NeuroImage: Clinical, vol. 18, pp. 897 – 902, 2018.
[50] L. Presotto, T. Ballarini, S. P. Caminiti, V. Bettinardi, L. Gianolli,and D. Perani, “Validation of 18f-fdg-pet single-subject optimized spmprocedure with different pet scanners,” Neuroinformatics, vol. 15, no. 2,p. 151—163, April 2017.
[51] P. A. Della Rosa, C. Cerami, F. Gallivanone, A. Prestia, A. Caroli,I. Castiglioni, M. C. Gilardi, G. Frisoni, K. Friston, J. Ashburner,D. Perani, and EADC-PET Consortium, “A standardized [18f]-fdg-pet template for spatial normalization in statistical parametric mappingof dementia,” Neuroinformatics, vol. 12, no. 4, p. 575—593, October2014.
[52] S. P. Caminiti, T. Ballarini, A. Sala, C. Cerami, L. Presotto, R. Santan-gelo, F. Fallanca, E. G. Vanoli, L. Gianolli, S. Iannaccone, G. Magnani,D. Perani, and BIOMARKAPD Project, “Fdg-pet and csf biomarkeraccuracy in prediction of conversion to different dementias in a largemulticentre mci cohort,” NeuroImage. Clinical, vol. 18, p. 167—177,2018.
[53] M. Ceccaldi, T. Jonveaux, A. Verger, P. Krolak-Salmon, C. Houzard,O. Godefroy, T. Shields, A. Perrotin, R. Gismondi, S. Bullich, A. Jo-valekic, N. Raffa, F. Pasquier, F. Semah, B. Dubois, M.-O. Habert,D. Wallon, M. Chastan, P. Payoux, A. Stephens, and E. Guedj, “Addedvalue of 18f-florbetaben amyloid pet in the diagnostic workup of
most complex patients with dementia in france: A naturalistic study,”Alzheimer’s & Dementia, vol. 14, no. 3, pp. 293 – 305, 2018.
[54] U. C. Anazodo, E. Finger, B. Y. M. Kwan, W. Pavlosky, J. C. Warring-ton, M. Gunther, F. S. Prato, J. D. Thiessen, and K. S. St Lawrence,“Using simultaneous pet/mri to compare the accuracy of diagnosingfrontotemporal dementia by arterial spin labelling mri and fdg-pet,”NeuroImage. Clinical, vol. 17, p. 405—414, 2018.
[55] K. Chiotis, L. Saint-Aubert, E. Rodriguez-Vieitez, A. Leuzy,O. Almkvist, I. Savitcheva, M. Jonasson, M. Lubberink, A. Wall,G. Antoni, and A. Nordberg, “Longitudinal changes of tau pet imagingin relation to hypometabolism in prodromal and alzheimer’s diseasedementia,” Molecular psychiatry, May 2017.
[56] L. Iaccarino, K. Chiotis, P. Alongi, O. Almkvist, A. Wall, C. Cerami,V. Bettinardi, L. Gianolli, A. Nordberg, and D. Perani, “A cross-validation of fdg- and amyloid-pet biomarkers in mild cognitive im-pairment for the risk prediction to dementia due to alzheimer’s diseasein a clinical setting,” Journal of Alzheimer’s disease : JAD, vol. 59,no. 2, p. 603—614, 2017.
[57] M. D. Zwan, F. H. Bouwman, E. Konijnenberg, W. M. van der Flier,A. A. Lammertsma, F. R. J. Verhey, P. Aalten, B. N. M. van Berckel,and P. Scheltens, “Diagnostic impact of [18f]flutemetamol pet in early-onset dementia,” Alzheimer’s research & therapy, vol. 9, no. 1, p. 2,January 2017.
[58] Z. Yao, B. Hu, X. Chen, Y. Xie, J. Gutknecht, and D. Majoe, “Learningmetabolic brain networks in mci and ad by robustness and leave-one-out analysis: An fdg-pet study,” American journal of Alzheimer’sdisease and other dementias, vol. 33, no. 1, p. 42—54, February 2018.
[59] K. Kejal, L. V. J., B. B. F., S. M. L., T. Nikki, L. T. G., S. A. J., G. J. L.,F. J. A., G. Jonathan, F. T. J., J. D. T., M. M. E., K. D. S., J. C. R., andP. R. C., “Av-1451 tau and β-amyloid positron emission tomographyimaging in dementia with lewy bodies,” Annals of Neurology, vol. 81,no. 1, pp. 58–67, November 2016.
[60] O. Sabri, M. N. Sabbagh, J. Seibyl, H. Barthel, H. Akatsu, Y. Ouchi,K. Senda, S. Murayama, K. Ishii, M. Takao, T. G. Beach, C. C.Rowe, J. B. Leverenz, B. Ghetti, J. W. Ironside, A. M. Catafau, A. W.Stephens, A. Mueller, N. Koglin, A. Hoffmann, K. Roth, C. Reininger,and W. J. Schulz-Schaeffer, “Florbetaben pet imaging to detect amyloidbeta plaques in alzheimer’s disease: Phase 3 study,” Alzheimer’s &Dementia, vol. 11, no. 8, pp. 964 – 974, 2015.
[61] T. Higashi, R. Nishii, S. Kagawa, Y. Kishibe, M. Takahashi, T. Okina,N. Suzuki, H. Hasegawa, Y. Nagahama, K. Ishizu, N. Oishi, H. Kimura,H. Watanabe, M. Ono, H. Saji, and H. Yamauchi, “18f-fpybf-2, a new f-18-labelled amyloid imaging pet tracer: first experience in 61 volunteersand 55 patients with dementia,” Annals of Nuclear Medicine, vol. 32,no. 3, pp. 206–216, Apr 2018.
[62] E. Imabayashi, T. Soma, D. Sone, T. Tsukamoto, Y. Kimura, N. Sato,M. Murata, and H. Matsuda, “Validation of the cingulate island signwith optimized ratios for discriminating dementia with lewy bodiesfrom alzheimer’s disease using brain perfusion spect,” Annals ofnuclear medicine, vol. 31, no. 7, p. 536—543, August 2017.
[63] Y. Takano, K. Kunitoki, Y. Tatewaki, T. Mutoh, T. Totsune, H. Shi-momura, M. Nakagawa, H. Arai, and Y. Taki, “Posterior associativeand cingulate cortex involvement of brain single-photon emissioncomputed tomography (spect) imaging in semantic dementia withprobable alzheimer disease pathology: A case report,” The Americanjournal of case reports, vol. 19, p. 153—157, February 2018.
[64] J. Mazere, F. Lamare, M. Allard, P. Fernandez, and W. Mayo, “123i-iodobenzovesamicol spect imaging of cholinergic systems in dementiawith lewy bodies,” Journal of nuclear medicine : official publication,Society of Nuclear Medicine, vol. 58, no. 1, p. 123—128, January 2017.
[65] K. Kasanuki, E. Iseki, K. Ota, D. Kondo, Y. Ichimiya, K. Sato,and H. Arai, “123i-fp-cit spect findings and its clinical relevance inprodromal dementia with lewy bodies,” European journal of nuclearmedicine and molecular imaging, vol. 44, no. 3, p. 358—365, March2017.
[66] A. Okizaki, M. Nakayama, K. Nakajima, T. Katayama, T. Uno,F. Morikawa, J. Naoe, and K. Takahashi, “Inter- and intra-observerreproducibility of quantitative analysis for fp-cit spect in patientswith dlb,” Annals of nuclear medicine, vol. 31, no. 10, p. 758—763,December 2017.
[67] S. Shimizu, K. Hirao, H. Kanetaka, N. Namioka, H. Hatanaka, D. Hi-rose, R. Fukasawa, T. Umahara, H. Sakurai, and H. Hanyu, “Utilityof the combination of dat spect and mibg myocardial scintigraphyin differentiating dementia with lewy bodies from alzheimer’s dis-ease,” European Journal of Nuclear Medicine and Molecular Imaging,vol. 43, no. 1, pp. 184–192, Jan 2016.

IEEE REVIEWS IN BIOMEDICAL ENGINEERING, VOL. XX, NO. XX, XXXX ,XXXX 14
[68] F. Sakamoto, S. Shiraishi, M. Yoshida, S. Tomiguchi, T. Hirai,T. Namimoto, M. Hashimoto, M. Ikeda, H. Uetani, and Y. Yamashita,“Diagnosis of dementia with lewy bodies: diagnostic performance ofcombined 123i-imp brain perfusion spect and 123i-mibg myocardialscintigraphy,” Annals of nuclear medicine, vol. 28, no. 3, p. 203—211,April 2014.
[69] S. Y. Park, H. Yoon, N. Lee, J. K. Oh, I. R. Yoo, S. H. Kim, and Y. A.Chung, “Analysis of cerebral blood flow with single photon emissioncomputed tomography in mild subcortical ischemic vascular dementia,”Nuclear medicine and molecular imaging, vol. 48, no. 4, p. 272—277,December 2014.
[70] Y. J. Chen, G. Deutsch, R. Satya, H.-G. Liu, and J. M. Mountz,“A semi-quantitative method for correlating brain disease groups withnormal controls using spect: Alzheimer’s disease versus vascular de-mentia,” Computerized Medical Imaging and Graphics, vol. 37, no. 1,pp. 40 – 47, 2013.
[71] F. Brigo, G. Turri, and M. Tinazzi, “123i-fp-cit spect in the differentialdiagnosis between dementia with lewy bodies and other dementias,”Journal of the Neurological Sciences, vol. 359, no. 1, pp. 161 – 171,2015.
[72] J. Ramırez, J. Gorriz, D. Salas-Gonzalez, A. Romero, M. Lopez,I. Alvarez, and M. Gomez-Rıo, “Computer-aided diagnosis ofalzheimer’s type dementia combining support vector machines anddiscriminant set of features,” Information Sciences, vol. 237, pp. 59– 72, 2013.
[73] E. E. Bron, M. Smits, W. J. Niessen, and S. Klein, “Feature selectionbased on the svm weight vector for classification of dementia,” IEEEJournal of Biomedical and Health Informatics, vol. 19, no. 5, pp. 1617–1626, Sept 2015.
[74] E. E. Bron, M. Smits, J. M. Papma, R. M. E. Steketee, R. Meijboom,M. de Groot, J. C. van Swieten, W. J. Niessen, and S. Klein, “Multipara-metric computer-aided differential diagnosis of alzheimer’s disease andfrontotemporal dementia using structural and advanced mri,” EuropeanRadiology, vol. 27, no. 8, pp. 3372–3382, Aug 2017.
[75] L. Sørensen and M. Nielsen, “Ensemble support vector machineclassification of dementia using structural mri and mini-mental stateexamination,” Journal of Neuroscience Methods, vol. 302, pp. 66 – 74,2018.
[76] S. Meyer, K. Mueller, K. Stuke, S. Bisenius, J. Diehl-Schmid, F. Jessen,J. Kassubek, J. Kornhuber, A. C. Ludolph, J. Prudlo, A. Schneider,K. Schuemberg, I. Yakushev, M. Otto, M. L. Schroeter, and FTLDcStudy Group, “Predicting behavioral variant frontotemporal dementiawith pattern classification in multi-center structural mri data,” NeuroIm-age. Clinical, vol. 14, p. 656—662, 2017.
[77] L. Nanni, A. Lumini, and N. Zaffonato, “Ensemble based on static clas-sifier selection for automated diagnosis of mild cognitive impairment,”Journal of Neuroscience Methods, vol. 302, pp. 42 – 46, 2018.
[78] N. Bharanidharan and H. Rajaguru, “Performance analysis of particleswarm optimization technique in classification of dementia using mriimages,” in 2017 2nd International Conference on Communication andElectronics Systems (ICCES), Oct 2017, pp. 311–315.
[79] J. Kim and B. Lee, “Automated discrimination of dementia spectrumdisorders using extreme learning machine and structural t1 mri fea-tures,” in 2017 39th Annual International Conference of the IEEEEngineering in Medicine and Biology Society (EMBC), July 2017, pp.1990–1993.
[80] E. Canu, F. Agosta, G. Mandic-Stojmenovic, T. Stojkovic, E. Stefanova,A. Inuggi, F. Imperiale, M. Copetti, V. S. Kostic, and M. Filippi,“Multiparametric mri to distinguish early onset alzheimer’s disease andbehavioural variant of frontotemporal dementia,” NeuroImage: Clinical,vol. 15, pp. 428 – 438, 2017.
[81] C. Cerami, A. Dodich, G. Lettieri, S. Iannaccone, G. Magnani, A. Mar-cone, L. Gianolli, S. F. Cappa, and D. Perani, “Different fdg-petmetabolic patterns at single-subject level in the behavioral variant offronto-temporal dementia,” Cortex, vol. 83, pp. 101 – 112, 2016.
[82] L. Harper, G. G. Fumagalli, F. Barkhof, P. Scheltens, J. T. O’Brien,F. Bouwman, E. J. Burton, J. D. Rohrer, N. C. Fox, G. R. Ridgway, andJ. M. Schott, “Mri visual rating scales in the diagnosis of dementia:evaluation in 184 post-mortem confirmed cases,” Brain, vol. 139, no. 4,pp. 1211–1225, 2016.
[83] J. Tohka, E. Moradi, H. Huttunen, and Alzheimer’s Disease Neuroimag-ing Initiative, “Comparison of feature selection techniques in machinelearning for anatomical brain mri in dementia,” Neuroinformatics,vol. 14, no. 3, p. 279—296, July 2016.
[84] A. B. Rabeh, F. Benzarti, and H. Amiri, “Diagnosis of alzheimerdiseases in early step using svm (support vector machine),” in 2016
13th International Conference on Computer Graphics, Imaging andVisualization (CGiV), March 2016, pp. 364–367.
[85] T. Tong, R. Wolz, Q. Gao, R. Guerrero, J. V. Hajnal, and D. Rueckert,“Multiple instance learning for classification of dementia in brain mri,”Medical Image Analysis, vol. 18, no. 5, pp. 808 – 818, 2014.
[86] Z. Wang, P. J. Markiewicz, G. Platsch, J. Kornhuber, T. Kuwert, andD. Merhof, “Comparison of methods for classification of alzheimer’sdisease, frontotemporal dementia and asymptomatic controls,” in 2013IEEE Nuclear Science Symposium and Medical Imaging Conference(2013 NSS/MIC), Oct 2013, pp. 1–6.
[87] B. E. Boser, I. M. Guyon, and V. N. Vapnik, “A training algorithm foroptimal margin classifiers,” Proceedings of Annual Acm Workshop onComputational Learning Theory, vol. 5, pp. 144–152, 1992.
[88] E. M. Alkabawi, A. R. Hilal, and O. A. Basir, “Feature abstraction forearly detection of multi-type of dementia with sparse auto-encoder,” in2017 IEEE International Conference on Systems, Man, and Cybernetics(SMC), Oct 2017, pp. 3471–3476.
[89] Z. Yao, Y. Zhang, L. Lin, Y. Zhou, C. Xu, T. Jiang, and Alzheimer’sDisease Neuroimaging Initiative, “Abnormal cortical networks in mildcognitive impairment and alzheimer’s disease,” PLoS computationalbiology, vol. 6, no. 11, p. e1001006, November 2010.
[90] W. Zheng, Z. Yao, B. Hu, X. Gao, H. Cai, and P. Moore, “Novel corticalthickness pattern for accurate detection of alzheimer’s disease,” Journalof Alzheimer’s disease : JAD, vol. 48, no. 4, p. 995—1008, 2015.
[91] G. Litjens, T. Kooi, B. E. Bejnordi, A. A. A. Setio, F. Ciompi,M. Ghafoorian, J. A. W. M. van der Laak, B. van Ginneken, andC. I. Sanchez, “A survey on deep learning in medical image analysis,”Medical image analysis, vol. 42, p. 60—88, December 2017.
[92] D. Ravı, C. Wong, F. Deligianni, M. Berthelot, J. Andreu-Perez, B. Lo,and G. Z. Yang, “Deep learning for health informatics,” IEEE Journalof Biomedical and Health Informatics, vol. 21, no. 1, pp. 4–21, Jan2017.
[93] E. M. Alkabawi, A. R. Hilal, and O. A. Basir, “Computer-aided classi-fication of multi-types of dementia via convolutional neural networks,”in 2017 IEEE International Symposium on Medical Measurements andApplications (MeMeA), May 2017, pp. 45–50.
[94] J. A. Akhila, C. Markose, and R. P. Aneesh, “Feature extraction andclassification of dementia with neural network,” in 2017 InternationalConference on Intelligent Computing, Instrumentation and ControlTechnologies (ICICICT), July 2017, pp. 1446–1450.
[95] J. Liu, S. Shang, K. Zheng, and J.-R. Wen, “Multi-view ensemblelearning for dementia diagnosis from neuroimaging: An artificial neuralnetwork approach,” Neurocomputing, vol. 195, pp. 112 – 116, 2016.
[96] V. K. Ithapu, V. Singh, O. C. Okonkwo, R. J. Chappell, N. M.Dowling, and S. C. Johnson, “Imaging-based enrichment criteria usingdeep learning algorithms for efficient clinical trials in mild cognitiveimpairment,” Alzheimer’s & Dementia, vol. 11, no. 12, pp. 1489 –1499, 2015.
[97] C. V. Dolph, M. Alam, Z. Shboul, M. D. Samad, and K. M.Iftekharuddin, “Deep learning of texture and structural features formulticlass alzheimer’s disease classification,” in 2017 InternationalJoint Conference on Neural Networks (IJCNN), May 2017, pp. 2259–2266.
[98] M. Faturrahman, I. Wasito, N. Hanifah, and R. Mufidah, “Structuralmri classification for alzheimer’s disease detection using deep beliefnetwork,” in International Conference on Information & Communica-tion Technology and System, 2017, pp. 37–42.
[99] H.-I. Suk, S.-W. Lee, D. Shen, and Alzheimer’s Disease NeuroimagingInitiative, “Deep ensemble learning of sparse regression models forbrain disease diagnosis,” Medical image analysis, vol. 37, p. 101—113,April 2017.
[100] J. Islam and Y. Zhang, “A novel deep learning based multi-classclassification method for alzheimer’s disease detection using brain mridata.” Springer International Publishing, 2017, pp. 213–222.
[101] H. Choi, “Deep learning in nuclear medicine and molecular imaging:Current perspectives and future directions,” Nuclear Medicine andMolecular Imaging, vol. 52, no. 2, pp. 109–118, Apr 2018.
[102] D. Lu, K. Popuri, G. W. Ding, R. Balachandar, M. F. Beg, andAlzheimer’s Disease Neuroimaging Initiative, “Multimodal and mul-tiscale deep neural networks for the early diagnosis of alzheimer’sdisease using structural mr and fdg-pet images,” Scientific reports,vol. 8, no. 1, p. 5697, April 2018.
[103] D. Lu, K. Popuri, G. W. Ding, R. Balachandar, M. F. Beg, and ADNI,“Multiscale deep neural network based analysis of fdg-pet images forthe early diagnosis of alzheimer’s disease,” Medical image analysis,vol. 46, p. 26—34, May 2018.

IEEE REVIEWS IN BIOMEDICAL ENGINEERING, VOL. XX, NO. XX, XXXX ,XXXX 15
[104] R. Ju, C. Hu, p. zhou, and Q. Li, “Early diagnosis of alzheimer’s diseasebased on resting-state brain networks and deep learning,” IEEE/ACMTransactions on Computational Biology and Bioinformatics, pp. 1–1,2017.
[105] U. C. Anazodo, E. Finger, B. Y. M. Kwan, W. Pavlosky, J. C. Warring-ton, M. Gunther, F. S. Prato, J. D. Thiessen, and K. S. St Lawrence,“Using simultaneous pet/mri to compare the accuracy of diagnosingfrontotemporal dementia by arterial spin labelling mri and fdg-pet,”NeuroImage. Clinical, vol. 17, p. 405—414, 2018.
[106] N. K. Al-Qazzaz, S. H. B. M. Ali, S. A. Ahmad, K. Chellappan, M. S.Islam, and J. Escudero, “Role of eeg as biomarker in the early detectionand classification of dementia,” TheScientificWorldJournal, vol. 2014,p. 906038, 2014.
[107] F. C. Morabito, M. Campolo, C. Ieracitano, J. M. Ebadi, L. Bonanno,A. Bramanti, S. Desalvo, N. Mammone, and P. Bramanti, “Deepconvolutional neural networks for classification of mild cognitiveimpaired and alzheimer’s disease patients from scalp eeg recordings,”in 2016 IEEE 2nd International Forum on Research and Technologiesfor Society and Industry Leveraging a better tomorrow (RTSI), Sept2016, pp. 1–6.
[108] F. C. Morabito, M. Campolo, N. Mammone, M. Versaci,S. Franceschetti, F. Tagliavini, V. Sofia, D. Fatuzzo, A. Gambardella,A. Labate, L. Mumoli, G. G. Tripodi, S. Gasparini, V. Cianci,C. Sueri, E. Ferlazzo, and U. Aguglia, “Deep learning representationfrom electroencephalography of early-stage creutzfeldt-jakob diseaseand features for differentiation from rapidly progressive dementia,”International journal of neural systems, vol. 27, no. 2, p. 1650039,March 2017.
[109] R. Alam, J. Dugan, N. Homdee, N. Gandhi, B. Ghaemmaghami,H. Meda, A. Bankole, M. Anderson, J. Gong, T. Smith-Jackson, andJ. Lach, “Besi: Reliable and heterogeneous sensing and intervention forin-home health applications,” in 2017 IEEE/ACM International Con-ference on Connected Health: Applications, Systems and EngineeringTechnologies (CHASE), July 2017, pp. 147–156.
[110] R. Alam, M. Anderson, A. Bankole, and J. Lach, “Inferring physical ag-itation in dementia using smartwatch and sequential behavior models,”in 2018 IEEE EMBS International Conference on Biomedical HealthInformatics (BHI), March 2018, pp. 170–173.
Md Rishad Ahmed is a Chinese Government Schol-arship holder with Shandong Provincial Key Lab-oratory of Network Based Intelligent Computing,University of Jinan, China where he is currentlya Computer Science Masters Degree student. Hereceived his M.Sc. and B.Sc. in Applied Physics andElectronic Engineering from University of Rajshahi,Bangladesh. His research interests are biomedicalimage processing, machine learning, deep learning,pattern recognition, and classification.
Yuan Zhang received his M.S. degree in Commu-nication Systems and Ph.D. degree in Control The-ory & Engineering both from Shandong University,China, in 2003 and 2012 respectively. He is currentlyan Associate Professor at University of Jinan, China.Dr. Zhang was a visiting professor at Computer Sci-ence Department, Georgia State University, USA, in2014. As the first author or corresponding author hehas published more than 50 peer reviewed papers ininternational journals and conference proceedings, 1book chapters, and 6 patents in the areas of wireless
networks and M-Health. He has served as Leading Guest Editor for five specialissues of IEEE, Elsevier, Springer and InderScience publications, includingIEEE Internet of Things Journal special issue on Wearable Sensor Based BigData Analysis for Smart Health, and has served on the technical programcommittee for numerous international conferences. He is an associate editorfor IEEE Access. Dr. Zhang’s research interests are in smart sensing systemand mHealth, currently focusing on wearable sensing and big data analytics inhealthcare domain. His research has been extensively supported by the NaturalScience Foundation of China, China Postdoctoral Science Foundation, andNatural Science Foundation of Shandong Province with total grant fundingover one million RMB. Dr. Zhang is a Senior Member of both IEEE and ACM.For more information, please refer to http://uslab.ujn.edu.cn/index.html.
Zhiquan Feng received his M.S. degree in Com-puter Software from Northwestern PolytechnicalUniversity, China, in 1995, and Ph.D. degree inComputer Science & Engineering from ShandongUniversity, China, in 2006. He is currently a Profes-sor at University of Jinan, China. Dr. Feng is a visit-ing Professor of Sichuang Mianyang Normal Univer-sity. As the first author or corresponding author hehas published more than 100 papers in internationaljournals and conference proceedings, 2 books, and30 patents in the areas of human hand recognition
and human-computer interaction. He has served as the Deputy Director ofShandong Provincial Key Laboratory of Network based Intelligent Computing,group leader of Human Computer Interaction based on natural hand, editorialboard member of Computer Aided Drafting Design and Manufacturing,CADDM, and also an editorial board member of The Open Virtual RealityJournal. He is a deputy editor of World Research Journal of Pattern Recogni-tion and a member of Computer Graphics professional committee. Dr. Feng’sresearch interests are in human hand tracking/recognition/interaction, virtualreality, human-computer interaction, and image processing. His research hasbeen extensively supported by the Key R&D Projects of the Ministry ofScience and Technology, Natural Science Foundation of China, Key Projectsof Natural Science Foundation of Shandong Province, and Key R&D Projectsof Shandong Province with total grant funding over three million RMB. Formore information, please refer to http://nbic.ujn.edu.cn/nbic/index.php.

IEEE REVIEWS IN BIOMEDICAL ENGINEERING, VOL. XX, NO. XX, XXXX ,XXXX 16
Dr. Benny Lo is a Senior Lecturer of the HamlynCentre and the Department of Surgery and Cancer,Imperial College London. He obtained his BAScin Electrical Engineering from the University ofBritish Columbia, Canada, MSc (Distinction) inElectronics from King’s College London and PhD inComputing from Imperial College London. Dr Lo’sresearch mainly focuses on Body Sensor Networks(BSN) and Wearable Technologies for healthcareand wellbeing. As one of the pioneers in BSN, Dr Lohas introduced numerous new platform technologies,
and novel approaches for wellbeing, and healthcare applications. Much of hisresearch has translated for clinical applications, and he has also led a fewpioneering clinical trials of novel sensing technologies, such as the clinicalvalidation of a new spectroscopic sensor for blood perfusion monitoringfor microvascular surgeries. His innovative work has been recognised withnumerous innovation awards, such as the IMAGINE challenge. The impactof his research is apparent from his many highly cited publications. Hehas published over 150 peer reviewed publications in the field of BSN.His work has led to numerous awards, such as the Medical Futures Award.He is a Senior Member of IEEE, an Associate Editor of the IEEE Journalof Biomedical Health Informatics, Chair of the IEEE EMBS WearableBiomedical Sensors and Systems Technical Committee, and a member ofthe IEEE EMBS Standards Committee. His expertise has been well regardedby his peers and he has been invited as expert reviewers and expert panelmembers, such as the panel for the Research Assessment Exercise of TampereUniversity of Technology and the International Advisory Board Member forIOP Physiological measurement.
Dr. Omer T. Inan (S’06, M’09, SM’15) receivedthe B.S., M.S., and Ph.D. degrees in electrical engi-neering from Stanford University, Stanford, CA, in2004, 2005, and 2009, respectively. He joined ALZACorporation (A Johnson and Johnson Company)in 2006, where he designed micropower circuitsfor iontophoretic drug delivery. In 2007, he joinedCountryman Associates, Inc., Menlo Park, CA wherehe was Chief Engineer, involved in designing anddeveloping high-end professional audio circuits andsystems. From 2009-2013, he was also a Visiting
Scholar in the Department of Electrical Engineering, Stanford University.Since 2013, Dr. Inan is an Assistant Professor of Electrical and ComputerEngineering at the Georgia Institute of Technology. He is also an AdjunctAssistant Professor in the Wallace H. Coulter Department of BiomedicalEngineering. His research focuses on non-invasive physiologic sensing andmodulation for human health and performance, including for chronic diseasemanagement, acute musculoskeletal injury recovery, and pediatric care. Dr.Inan is an Associate Editor of the IEEE Journal of Biomedical and HealthInformatics, Associate Editor for the IEEE Engineering in Medicine andBiology Conference and the IEEE Biomedical and Health Informatics Con-ference, Invited Member of the IEEE Technical Committee on TranslationalEngineering for Healthcare Innovation and the IEEE Technical Committeeon Cardiopulmonary Systems, and Technical Program Committee Memberor Track Chair for several other major international biomedical engineeringconferences. He has published more than 125 technical articles in peer-reviewed international journals and conferences, and has multiple issuedpatents. Dr. Inan received the Gerald J. Lieberman Fellowship in 2009,the Lockheed Dean’s Excellence in Teaching Award in 2016, the SigmaXi Young Faculty Award in 2017, the Office of Naval Research YoungInvestigator Award in 2018, and the National Science Foundation CAREERAward in 2018. He was a National Collegiate Athletic Association (NCAA)All-American in the discus throw for three consecutive years (2001-2003).
Hongen Liao is Professor and Vice Chairman of theDepartment of Biomedical Engineering, School ofMedicine, Tsinghua University, China. He receivedhis Ph.D. degrees in biomedical precision engineer-ing from the University of Tokyo, Tokyo, Japan in2003. He was a Research Fellow of Japan Societyfor the Promotion of Science (JSPS). From 2004,he was a faculty member at the Graduate Schoolof Engineering, The University of Tokyo, wherehe became an Associate Professor in 2007. He hasbeen selected as National “Thousand Talents” Dis-
tinguished Professor, National Recruitment Program of Global Experts, Chinasince 2010. He is Director and Founder of the Advanced Theranostics and 3-DImaging Laboratory, Tsinghua University. Professor Liao’s research interestsinclude 3D medical image, image-guided surgery, medical robotics, computer-assisted surgery, and fusion of these innovative healthcare technologies forminimally invasive precision diagnosis and therapy. He has also been involvedin long viewing distance autostereoscopic display and 3D visualization. Heis the author and co-author of more than 250 peer-reviewed articles andproceedings papers, as well as over 40 patents, 290 abstracts and numerousinvited lectures. Dr. Liao was distinguished by receiving multiple governmentawards and various Best Paper Awards from different academic societies. Prof.Liao is an Associate Editor of IEEE Engineering in Medicine and BiologySociety Conference, the General Chair, Program Chair and OrganizationChair of multiple international conferences including MIAR, MICCAI, andACCAS. He is a President of Asian Society for Computer Aided Surgery andSecretary of Asian-Pacific Activities Working Group, International Federationfor Medical and Biological Engineering.