
Computer-aided diagnosis of Alzheimer’s type dementia combining support vector machines and...
14
Computer-aided diagnosis of Alzheimer’s type dementia combining support vector machines and discriminant set of features q J. Ramírez a,⇑ , J.M. Górriz a , D. Salas-Gonzalez a , A. Romero a , M. López a , I. Álvarez a , M. Gómez-Río b a Dpto. Teoría de la Señal, Telemática y Comunicaciones, Periodista Daniel Saucedo Aranda s/n, 18071 Granada, Spain b Department of Nuclear Medicine, Hospital Universitario Virgen de las Nieves, Avda. de las Fuerzas Armadas, 2, Granada, Spain article info Article history: Received 9 July 2008 Received in revised form 22 April 2009 Accepted 21 May 2009 Available online 30 May 2009 Keywords: Support vector machines Computer-aided diagnosis Alzheimer’s type dementia Feature extraction abstract Alzheimer’s disease (AD) is the most common cause of dementia in the elderly and affects approximately 30 million individuals worldwide. With the growth of the older population in developed nations, the prevalence of AD is expected to triple over the next 50 years while its early diagnosis remains being a difficult task. Functional imaging modalities including Single Photon Emission Computed Tomography (SPECT) and positron emission tomography (PET) are often used with the aim of achieving early diagnosis. However, conventional evaluation of SPECT images often relies on manual reorientation, visual read- ing of tomographic slices and semiquantitative analysis of certain regions of interest (ROIs). These steps are time consuming, subjective and prone to error. This paper shows a fully automatic computer-aided diagnosis (CAD) system for improving the early detection of the AD. The proposed approach is based on image parameter selection and support vector machine (SVM) classification. A study is carried out in order to finding the ROIs and the most discriminant image parameters with the aim of reducing the dimensionality of the input space and improving the accuracy of the system. Among all the features evaluated, coronal standard deviation and sagittal correlation parameters are found to be the most effective ones for reducing the dimensionality of the input space and improving the diag- nosis accuracy when a radial basis function (RBF) SVM is used. The proposed system yields a 90.38% accuracy in the early diagnosis of the AD and outperforms existing techniques including the voxel-as-features (VAF) approach. Ó 2009 Elsevier Inc. All rights reserved. 1. Introduction Emission Computed Tomography (ECT) has been widely used in biomedical research and clinical practice during the last three decades. ECT differs from many other medical imaging modalities such as magnetic resonance imaging (MRI) in pro- ducing a mapping of physiological functions instead of imaging anatomical structures. In this way, tomographic radiophar- maceutical imaging provides in vivo three-dimensional maps of a pharmaceutical labeled with a gamma ray emitting 0020-0255/$ - see front matter Ó 2009 Elsevier Inc. All rights reserved. http://dx.doi.org/10.1016/j.ins.2009.05.012 q This work was partly supported by the MICINN under the PETRI DENCLASES (PET2006-0253), TEC2008-02113, NAPOLEON (TEC2007-68030-C02-01) and HD2008-0029 projects and the Consejería de Innovación, Ciencia y Empresa (Junta de Andalucía, Spain) under the Excellence Project (TIC-02566). ⇑ Corresponding author. Tel.: +34 958240842; fax: +34 958240831. E-mail address: [email protected] (J. Ramírez). Information Sciences 237 (2013) 59–72 Contents lists available at SciVerse ScienceDirect Information Sciences journal homepage: www.elsevier.com/locate/ins
-
Upload
independent -
Category
Documents
-
view
0 -
download
0
Transcript of Computer-aided diagnosis of Alzheimer’s type dementia combining support vector machines and...
Information Sciences 237 (2013) 59–72
Contents lists availabl e at SciVerse ScienceDi rect
Inf ormation Sciences
journal homepage: www.elsevier .com/locate / ins
Computer-aided diagnosis of Alzheimer’s type dementia combining support vector machines and discriminant set of features q
0020-0255/$ - see front matter � 2009 Elsevier Inc. All rights reserved.http://dx.doi.org/10.1016/j.ins.2009.05.012
q This work was partly supported by the MICINN under the PETRI DENCLASES (PET2006-0253), TEC2008-02113, NAPOLEON (TEC2007-68030and HD2008-0029 projects and the Consejería de Innovación, Ciencia y Empresa (Junta de Andalucía, Spain) under the Excellence Project (TIC-0⇑ Corresponding author. Tel.: +34 958240842; fax: +34 958240831.
E-mail address: [email protected] (J. Ramírez).
J. Ramírez a,⇑, J.M. Górriz a, D. Salas-Gonzalez a, A. Romero a, M. López a,I. Álvarez a, M. Gómez-Río b
a Dpto. Teoría de la Señal, Telemática y Comunicaciones, Periodista Daniel Saucedo Aranda s/n, 18071 Granada, Spain b Department of Nuclear Medicine, Hospital Universitario Virgen de las Nieves, Avda. de las Fuerzas Armadas, 2, Granada, Spain
a r t i c l e i n f o
Article history:Received 9 July 2008 Received in revised form 22 April 2009 Accepted 21 May 2009 Available online 30 May 2009
Keywords:Support vector machines Computer-aided diagnosis Alzheimer’s type dementia Feature extraction
a b s t r a c t
Alzheimer’s disease (AD) is the most common cause of deme ntia in the elderly and affects approximately 30 million individuals worldwide. With the growth of the older population in developed nations , the prevalence of AD is expected to triple over the next 50 years while its early diagnosis remains being a difficult task. Functional imaging modalities including Single Photon Emission Computed Tomography (SPECT) and positron emission tomography (PET) are often used with the aim of achieving early diagnosis. However,conventional evaluation of SPECT images often relies on manual reorientation, visual read- ing of tomographic slices and semiquantitative analysis of certain regions of interest (ROIs).These steps are time consuming, subjective and prone to error. This paper shows a fully automatic computer-aided diagnosis (CAD) system for improving the early detection ofthe AD. The proposed approach is based on image parameter selection and support vector machine (SVM) classification. A study is carried out in order to finding the ROIs and the most discriminant image parameters with the aim of reducing the dimensionality of the input space and improving the accuracy of the system. Among all the features evaluated,coronal standard deviation and sagittal corr elation parameters are found to be the most effective ones for reducing the dimensionality of the input space and improving the diag- nosis accuracy when a radial basis function (RBF) SVM is used. The proposed system yields a 90.38% accuracy in the early diagn osis of the AD and outperforms existing techniques including the voxel-as-features (VAF) app roach.
� 2009 Elsevier Inc. All rights reserved.
1. Introductio n
Emission Computed Tomograp hy (ECT) has been widely used in biomedical research and clinical practice during the last three decades. ECT differs from many other medical imaging modalities such as magnetic resonance imaging (MRI) in pro- ducing a mapping of physiologica l functions instead of imaging anatomical structure s. In this way, tomograp hic radiophar- maceutical imaging provides in vivo three-dim ensional maps of a pharmac eutical labeled with a gamma ray emitting
-C02-01)2566).
60 J. Ramírez et al. / Information Sciences 237 (2013) 59–72
radionuclid e. The distribution of radionuc lide concentrations are estimated from a set of projectional images acquired atmany different angles around the patient [5].
Single Photon Emission Computed Tomography (SPECT) is an ECT imaging technique developed in the 1960s, but not widely used in clinical practice until the 1980s. It is a noninvasive, three-dimens ional functional imaging modality that pro- vides clinical information regarding biochemical and physiologic processes in patients. SPECT images are produced by the disintegrati on of the nucleus of a radioisotope that leads to the emission of a gamma photon with a random direction and uniformly distributed in the sphere surrounding the nucleus. If the photon does not suffer a collision with electrons or other particles with-in the body, its trajectory will be a straight line or ‘‘ray’’. In order to discriminate the direction ofincidence using a photon detector external to the patient, a physical collimation is required. Typically, a collimator is placed prior to the detector in such a manner that photons incident from all but a single direction are blocked by the plates. This guarantees that only photons incident from the desired direction will strike the photon detector. SPECT is essential for imag- ing the brain with either regional cerebral blood flow (rCBF) agents or brain receptors, and for imaging myocardial perfusion.For the past two decades, brain SPECT has become an important diagnost ic and research tool in nuclear medicine [2,32]. The ultimate value of this technology depends on good technique for image acquisition and proper data reconstruction [38,50].
Alzheimer’s disease (AD) is a progressive neurodegen erative disorder first affecting memory functions and then gradually affecting all cognitive functions with behavioral impairment s and eventually causing death. Its diagnosis is based on the information provided by a careful clinical examina tion, a thorough interview of the patient and relatives, and a neuropsy- chological assessment. A SPECT rCBF study is frequent ly used as a complimentar y diagnost ic tool in addition to the clinical findings [24,43,23]. However, in late-onset AD there are minimal perfusion in the mild stages of the disease, and age-related changes, which are frequently seen in healthy aged people, have to be discrimin ated from the minimal disease-speci ficchanges. These minimal changes in the images make visual diagnosis a difficult task that requires experienced explorers.Even with this problem still unsolved, the potential of computer-a ided diagnosis (CAD) has not been explored in this area.
Several approach es for designing CAD systems of the AD can be found in the literature [33,26,45]. The first family is based on the analysis of regions of interest (ROI) by means of some discriminant functions. The second approach is the statistical parametric mapping (SPM) [15] software tool and its numerous variants. SPM is widely used in neuroscience. It was not developed specifically to study a single image, but for comparing groups of images. SPM has been designed as a univariate approach since the classical multivariate techniques such as MANCOVA [47] require the number of observations (i.e. scans)to be greater than the number of components (i.e. voxels) of the multivariate observation. The importance of multivariate approaches is that the effects due to activations , confounding effects and error effects are assessed statistically, both in terms of effects at each voxel, and interactions among voxels [15]. On the other hand, statistical learning classification methods have not been explored in depth for AD CAD, quite possibly due to the fact that images represent large amounts of data and most imaging studies have relatively few subjects (generally < 100) [26,46,44 ].
Since their introduct ion in the late seventies [51], Support vector machines (SVMs) marked the beginning of a new era in the learning from examples paradigm [6,27]. SVMs have focussed recent attention from the pattern recognition community due toa number of theoretical and computational merits derived from the Statistical Learning Theory (SLT) [52,53] developed by Vla- dimir Vapnik at AT&T. Moreove r, recent developments in defining and training statistical classifiers make it possible to build reliable classifiers in very small sample size problems [12] since pattern recognition systems based on SVM circumvent the curse of dimensionali ty, and even may find nonlinear decision boundaries for small training sets. These techniques have been successfully used in a number of applications [7,49] including voice activity detection (VAD) [13,14,37,40 ,39,56,21,20] ,content-bas ed image retrieval [48], texture classification [29] and medical imaging diagnosis [16,28,57,35].
This paper shows a complete CAD system for the early detection of the Alzheimer ’ type dementia (ATD) by SPECT image classification. The proposed method combining SVM and advanced feature extraction schemes is developed with the aim ofreducing the subjectiv ity in visual interpretation of SPECT scans by clinicians, thus improving the detection of the AD in its early stage. The paper is organized as follows. Section 2 provides a background on SVM classification. Section 3 summarizes the key ROIs where the disease becomes observable in its early stage. Section 4 shows the acquisition setup, reconstru ction algorithm as well as the template-base d spatial normalization techniques used for obtaining an accurate and anatomicall y standardi zed model of the functional brain activity provided by SPECT images. Section 5 defines first- and second-o rder statistics that are evaluated for building the classifier based on their discriminati on ability. Finally, Section 6 shows the experiments that were conducted in order to evaluate the proposed SVM classifier as a diagnostic tool for the early detection of the AD.
2. Support vector machines
Support vector machines [6,52,53] are widely used for pattern recogniti on in a number of applications by its ability tolearn from experimental data. The reason is that SVM often performs better than other conventional parametric classifiers[27,19]. SVM separate a given set of binary labeled training data by means of a hyperplane that is maximally distant from the two classes (known as the maximal margin hyperplane). The objective is to build a function f : RN ! f�1g using training data that is, N-dimension al patterns x i and class labels yi:
ðx1; y1Þ; ðx2; y2Þ; . . . ; ðxl; ylÞ 2 RN � f�1g; ð1Þ
so that f will correctly classify new unseen examples ðx; yÞ.

J. Ramírez et al. / Information Sciences 237 (2013) 59–72 61
Linear discriminant functions define decision hypersur faces or hyperplanes in a multidimensiona l feature space, that is:
gðxÞ ¼ wT xþw0 ¼ 0; ð2Þ
where w is known as the weight vector and w0 as the threshold. The weight vector w is orthogonal to the decision hyper- plane and the optimization task consists of finding the unknown parameters wi, i ¼ 1; . . . ;N, defining the decision hyperplane.
Let xi, i ¼ 1;2; . . . ; l, be the feature vectors of the training set, X. These belong to either of the two classes, x1 or x2. If the classes were linearly separable the objective would be to design a hyperpla ne that classifies correctly all the training vectors.The hyperplane is not unique and the selection process focusses on maximizing the generalization performanc e of the clas- sifier, that is, the ability of the classifier, designed using the training set, to operate satisfactorily with new data. Among the different design criteria, the maximal margin hyperplane is usually selected since it leaves the maximum margin of separa- tion between the two classes. Since the distance from a point x to the hyperpla ne is given by z ¼ jgðxÞj=jjwjj, scaling w and w0
so that the value of gðxÞ is +1 for the nearest point in x1 and �1 for the nearest points in x2, reduces the optimization prob- lem to maximizing the margin: 2=jjwjj with the constrain ts:
wT xþw0 P 1; 8x 2 x1;wT xþw0 6 1; 8x 2 x2; ð3Þ
or equivalently , minimizing the cost function JðwÞ ¼ ð1=2Þjjwjj2 subject to:
yiðwT xi þw0ÞP 1; i ¼ 1;2; . . . ; l: ð4Þ
Thus, designing the classifier leads to a nonlinear (quadratic) optimization task subject to a set of linear inequality con- straints. By using the optimization methodol ogy adopted by Karush-Kuhn-Tuc ker [6], the solution w is found to be a linear combination of Ns 6 l feature vectors named support vectors and the optimum hyperplane is called the support vector ma- chine. The support vectors are the training vectors that are closest to the linear classifier since lie on either of the two hyper- planes, i.e. wT xþw0 ¼ �1. On the other hand, the optimization process with inequality constraints guarante e any local minimum is also global and unique so that the optimal maximal margin hyperpla ne defining the support vector machine is unique.
For non-separab le classes, the optimization process needs to be modified in an efficient and elegant manner. In mathe- matical terms, the maximal margin hyperplane for non-separable data is selected by minimizing the cost function:
Jðw;w0; nÞ ¼12jjwjj2 þ C
Xl
i¼1
ni; ð5Þ
subject to the constraints:
yi½wT xi þw0�P 1� ni; ni P 0 i ¼ 1;2; . . . ; l:; ð6Þ
where the variables ni are known as slack variables. Note that, the goal of the optimization task is to make the margin as large as possible and reduce the number of points with n > 0. The parameter C is a positive constant that controls the relative influence of the two competing terms.
When no linear separation of the training data is possible, SVM can work in combinati on with kernel techniques so that the hyperpla ne defining the SVM correspond s to a nonlinear decision boundary in the input space. If the data is mapped tosome other (possibly infinite dimensio nal) Euclidean space using a mapping UðxÞ, the training algorithm only depends on the data through dot products in such an Euclidean space, i.e. on functions of the form UðxiÞ �UðxjÞ. If a ‘‘kernel function’’ K isdefined such that Kðxi; xjÞ ¼ UðxiÞ �UðxjÞ, it is not necessar y to know the U function during the training process. In the test phase, an SVM is used by computing dot products of a given test point x with w, or more specifically by computing the sign of
f ðxÞ ¼XNS
i¼1
aiyiUðsiÞ �UðxÞ þw0 ¼XNS
i¼1
aiyiKðsi; xÞ þw0; ð7Þ
where si are the support vectors.Thus, the use of kernels in SVM enables to map the data into some other dot product space (called feature space) F via a
nonlinear transformat ion U : RN ! F and perform the above linear algorithm in F. Fig. 1 illustrates this process where the 2-D input space is mapped to a 3-D feature space. Note that, all the points belonging to a given class remain at a given side ofthe separating hyperpla ne and the data become linearly separable. In the input space, the hyperplane corresponds to a non- linear decision function whose form is determined by the kernel. There are three common kernels that are used by SVM prac- titioners for the nonlinear feature mapping:
� Polynomial
Kðx; yÞ ¼ ½cðx � yÞ þ c�d: ð8Þ
� Radial basis function (RBF)

Fig. 1. Effect of mapping the input space to the feature space where the separation boundary becomes linear.
62 J. Ramírez et al. / Information Sciences 237 (2013) 59–72
Kðx; yÞ ¼ expð�cjjx� yjj2Þ: ð9Þ
� Sigmoid
Kðx; yÞ ¼ tan hðcðx � yÞ þ cÞ: ð10Þ
Thus, the decision function is nonlinear in the input space
f ðxÞ ¼ sgnXNs
i¼1
aiyiKðsi; xÞ þw0
( )ð11Þ
and the parameters ai are the solution of a quadratic optimization problem that are usually determined by Quadratic Pro- gramming (QP) or the well known Sequenti al Minimal Optimiza tion (SMO) algorithm [36]. Many classification problems are separable in the feature space and are able to obtain better results by using RBF kernels instead of linear and polynomial kernel functions [9,17].
3. Diagnosis of Alzheimer’s type dementia by means of SPECT
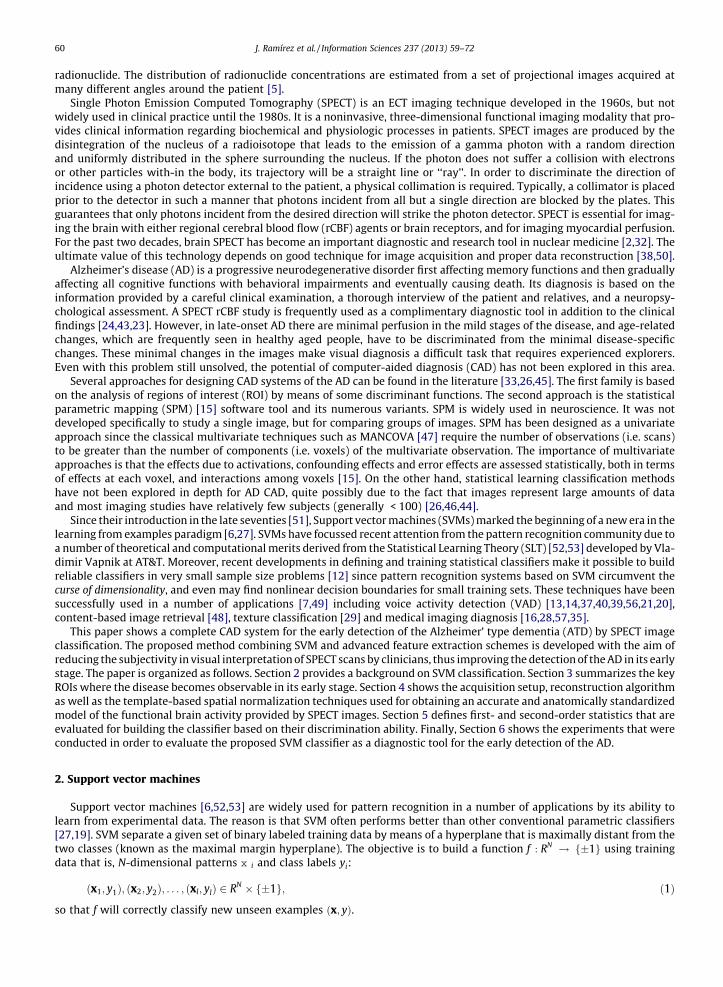
Functional SPECT imaging providing information about the rCBF have been found to be a valuable aid for the early diag- nosis of the AD [18]. Fig. 2 shows typical brain perfusion patterns of a normal subject and a patient affected by AD. Although many studies exist no final agreement has been achieved for the best regions of the brain to be quantified when diagnosing AD:
� Many studies have shown the temporo-par ietal region to be practical for the early detection of the disease in patients that are no longer characterized by specific cognitive impairment but by general cognitive decline [10]. Although bilateral temporo-par ietal abnormalities , with or without other regional defects, are known as the predomin ant pattern for AD,they appear to be neither sensitive nor specific of the early AD.� Perfusion deficits in posterior cingulate gyri and precunei regions are probably more specific and more frequent in early
AD than temporo-par ietal deficits [30].� Hypo-perfus ion in the medial temporal lobe and hippocamp us is not found in mild AD due to the difficulties of imaging
these deep brain structures [4].
As a conclusion, not all the informat ion found in a complete SPECT scan will be of interest for the diagnosis of the disease during its early stage. An study of the regions in the brain that are more effective for diagnosing the ATD is conducted inSection 5.
4. SPECT image acquisition and preprocessin g
The ultimate value of a CAD system strongly depends on effective techniqu es for image acquisition, proper data recon- struction and image registration [1,42]. After introducing all the necessary knowledge and tools for building the diagnosis system, this section shows the image acquisition setup and preproces sing steps of the SPECT scans that are needed prior to defining the classifier.
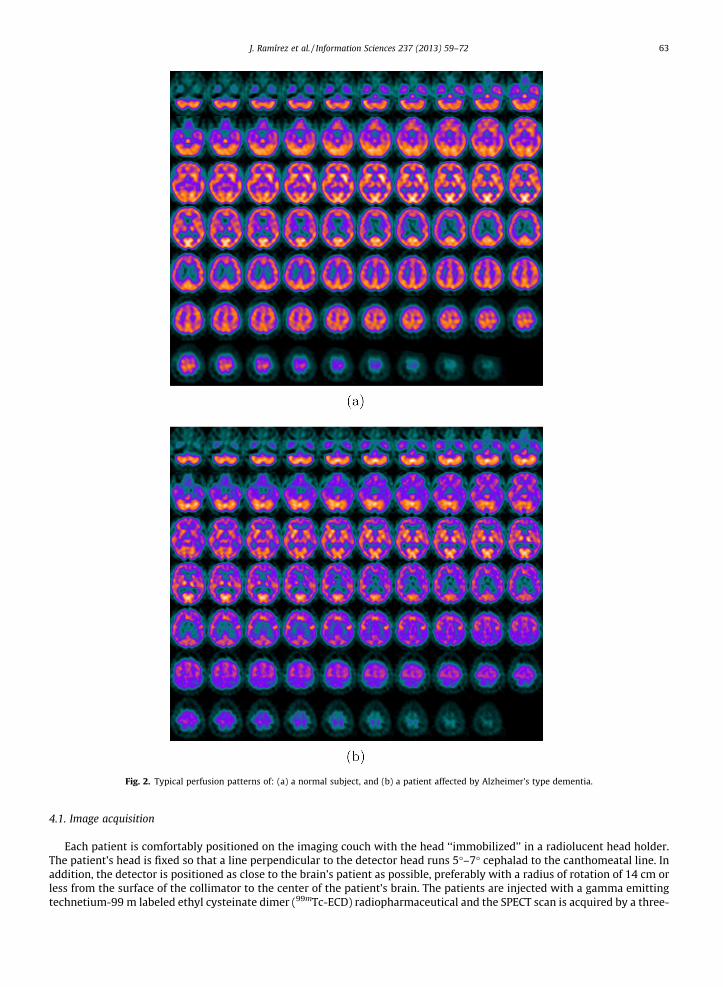
Fig. 2. Typical perfusion patterns of: (a) a normal subject, and (b) a patient affected by Alzheimer’s type dementia.
J. Ramírez et al. / Information Sciences 237 (2013) 59–72 63
4.1. Image acquisition
Each patient is comfortably positioned on the imaging couch with the head ‘‘immobilize d’’ in a radiolucent head holder.The patient’s head is fixed so that a line perpendicular to the detector head runs 5�–7� cephalad to the canthomeatal line. Inaddition, the detector is positioned as close to the brain’s patient as possible, preferably with a radius of rotation of 14 cm orless from the surface of the collimator to the center of the patient’s brain. The patients are injected with a gamma emitting technetium -99 m labeled ethyl cysteinate dimer (99mTc-ECD) radiopharm aceutical and the SPECT scan is acquired by a three-

64 J. Ramírez et al. / Information Sciences 237 (2013) 59–72
head Picker Prism 3000 gamma camera. A total of 180 projections are taken for each patient with a 2-degree angular reso- lution. Finally, images of the brain cross sections are reconstru cted from the projection data using the filtered backproject ion (FBP) algorithm described below in combinati on with a Butterwo rth noise removal filter.
4.2. Image reconstruction
Cross-sectional images of the brain can be reconstru cted from projection data [31,54,25,5,8]. Assumuing ideal conditions,projections are a set of measurements of the integrated values of some parameter of the object along a line path. If the object is represented by a two-dimensi onal function f ðx; yÞ, the line integral computed over the line x cos hþ y sin h ¼ t is definedas:
PhðtÞ ¼Z þ1
�1
Z þ1
�1f ðx; yÞdðx cos hþ y sin h� tÞdxdy; ð12Þ
where PhðtÞ is known as the Radon transform of the function f ðx; yÞ. Note that, it is related with the sum of radioactive counts recorded in any time interval at point t when the detector is at angle h.
The key to tomograp hic imaging is the Fourier Slice Theorem which relates the measure d projection data to the 2-D Fourier transform of the object cross section. Thus, the Fourier transform ShðwÞ of a parallel projection PhðtÞ of an image f ðx; yÞ takenat angle h and defined to be:
ShðwÞ ¼Z þ1
�1PhðtÞ expð�j2pwtÞdt; ð13Þ
gives a slice of the two-dimens ional Fourier transform:
Fðu;vÞ ¼Z þ1
�1
Z þ1
�1f ðx; yÞ expð�j2pðuxþ vyÞÞdxdy; ð14Þ
subtending an angle h with the u-axis’’, that is,
ShðwÞ ¼ Fðu ¼ w cos h; v ¼ w sin hÞ: ð15Þ
The above result is the key of straight ray tomography and indicates that by having projections of an object function at anumber of angles h1; h2; . . . ; hk and taking the Fourier transform of them, the values of Fðu;vÞ can be determined on radial lines. In practice, only a finite number of projections are taken so that the function Fðu;vÞ is only known along a finite num- ber of radial lines.
Projection data used in this study are reconstru cted using the filtered backprojection (FBP) algorithm that is easily derived from the Fourier Slice Theorem. The image of the cross section f ðx; yÞ of an object is obtained by:
f ðx; yÞ ¼Z p
0Q hðx cos hþ y sin hÞdh; ð16Þ
where
Q hðtÞ ¼Z þ1
�1ShðwÞjwj expðj2pwtÞdw: ð17Þ
The FBP algorithm then consists of two steps: the filtering part, which can be visualized as a simple weighting of each pro- jection in the frequency domain, and the backprojection part.
A major drawback of FBP is the undesired amplification of the high frequency noise and its impact on the quality of the reconstructed image. These effects are caused by the filtering operation or multiplication of ShðwÞ by jwj in Eq. (17). In order to attenuate the high frequency noise amplified during FBP reconstructi on, several window functions have been proposed.The reconstructi on method is then described by Eqs. (16) and (17) and is normally redefined by applying a frequency win- dow which returns to zero as the frequency tends to p. Among the most common window functions used for FBP reconstruc- tion are: (i) sinc (Shepp-Logan filter), (ii) cosine, (iii) Hamming and, (iv) Hanning window functions. However , even when the reconstructi on noise is kept low using a noise controlled FBP approach, the noise captured by the acquisition system needs tobe filtered out to improve the quality of the reconstru cted images. In this way, the preprocessing stage of most automatic SPECT image processing systems often incorporates prefiltering, reconstructi on and postfiltering to minimize the noise ac- quired by the gamma camera as well as the noise amplified during FBP reconstruction.
4.3. Image registration
The complexi ty of brain structures and the differenc es between brains of different subjects make necessary the normal- ization of the images with respect to a common fixed-size template. This step allows us to compare the voxel intensities ofthe brain images of different subjects.

J. Ramírez et al. / Information Sciences 237 (2013) 59–72 65
The SPECT images used in this work are first spatially normalized using the SPM software [15] in order to ensure that agiven voxel in different images refer to the same anatomical position in the brain. The normalizati on method assumes a gen- eral affine model with 12 parameters [55] and a cost function which presents an extreme value when the template and the image are matched together. For each voxel x ¼ ðx1; x2; x3Þ in an image, the affine transformat ion into the coordinates y ¼ ðy1; y2; y3Þ is expresse d by a matrix multiplication y ¼ Mx.
y1
y2
y3
1
0BBB@
1CCCA ¼
m11 m12 m13 m14
m21 m22 m23 m24
m31 m32 m33 m34
0 0 0 1
0BBB@
1CCCA
x1
x2
x3
1
0BBB@
1CCCA: ð18Þ
The objective function CF to be optimized is the mean squared difference between the source and the template:
cf ¼X
i
ðf ðMxiÞ � gðxiÞÞ2; ð19Þ
where f and g denote the source image and the template, respectively . Once the image is normalized by means of an affinetransformat ion, it is registered using a more complex non-rigid spatial transformation model. The deformations are param- eterized by a linear combination of the lowest-frequency components of the three-dimensio nal cosine transform bases [3]. Asmall-deform ation approach is used and regularization is achieved by the bending energy of the displacemen t field. After the spatial normalizati on, a 95 � 69 � 79 voxel representat ion of each subject is obtained. Each voxel represents a brain volume of 2.18 � 2.18 � 3.56 mm3.
Fig. 3 shows an example of the operation of the normalization process on SPECT images. Left column shows arbitrary source images in the dataset, central column shows the template used for image registrati on, and finally the correspondi ngnormalized images are shown in the right column. It is clearly shown that the transformed image matches the shape of the template.
Finally, intensity level of the SPECT images is normalized to the maximum intensity, which is individually computed for each volume by averaging over the 3% of the highest voxel intensities following a procedure similar to [41].
5. Discrimina nt statistics of Alzheimer’s type dementia
A major problem associated with pattern recognition systems is the so-called curse of dimensionali ty, that is, the number of available features for designing the classifier can be very large compared with the number of available training examples.Under these conditions, the difficulty of an estimation problem increases drastically with the dimension of the space, since
Fig. 3. Three SPECT images. Left column : source image. Central column : template. Right column : transformed image.

66 J. Ramírez et al. / Information Sciences 237 (2013) 59–72
one needs an exponential increasing number of patterns to sample the space properly. This well known statement induces some doubts about where it is a good idea to go to a high dimensional feature space for learning when using SVM. However,Statistical Learning Theory tell us that the contrary can be true: learning in high dimensio n feature space can be simpler if alow-complex ity, i.e. simple class of decision rule (e.g. linear classifiers) is used. As a conclusio n, not the dimensionality but the complexi ty of the function class matters [34]. Moreove r, recent developmen ts in defining and training statistical classi- fiers make it possible to build reliable classifiers in very small sample size problems [12] since pattern recognition systems based on SVM circumvent the curse of dimensional ity, and even may find nonlinear decision boundaries for small training sets.
Independently of the classifier to be used, there are clear motivations for reducing the dimensionality of the input space to a reasonabl e minimum:
(1) reduction of the computational cost of the training and testing algorithms,(2) eliminati on of correlation between input data, and (3) selection of the most discriminant set of input data.
Next sections review the definition of the image statistics that have been evaluated in this work for designing the CAD system.
5.1. First-order statistics
Let I be the random variable representing the Ng intensity levels of the image and PðIÞ its first-order histogram. Its mo- ments mi and central moments m̂i are defined by:
mi ¼ E½Ii� ¼XNg�1
I¼0
IiPðIÞ; m̂i ¼ E½ðI � E½I�Þi� ¼XNg�1
I¼0
ðI �m1ÞiPðIÞ: ð20Þ
The most frequent used central moments are the mean l ¼ m1 ¼ E½I� and variance r2 ¼ m̂2. Other paramete r that results from the first-order histogram is the entropy:
H ¼ �E½log2PðIÞ� ¼ �XNg�1
I¼0
PðIÞlog2PðIÞ; ð21Þ
which is a measure of histogram uniformity. The closer to the uniform distribution, the higher the entropy.
5.2. Second-order statistics
First-order statistics provide information related to the intensity level distribution of the image, but they do not give any information about relative positions of the various intensity levels with-in the image. This information can be extracted from the second-order statistics, where the pixels are considered in pairs.
Second-order statistics derived from the co-occurrence matrix [22] are defined as follows. Let d be the relative distance measured in pixel numbers. The orientation / is quantized in four directions: horizontal, diagonal , vertical and antidiago nal (0�, 45�, 90� and 135 �). For each combination of d and / a two-dimensi onal histogram is defined. In this work, only the dependence of horizontally adjacent pixels (d = 1, / ¼ 0) is considered being its spatial dependence matrix or co-occurrence matrix defined as:
P ¼ ðIðm;nÞ ¼ I1; Iðm� d;nÞ ¼ I2Þ ¼# of pairs at distance d with values ðI1; I2Þ
total # of possible pairs : ð22Þ
From the definition of the co-occurrence matrix, a number of second-order statistics parameters can be defined:
� Angular second moment
ASM ¼XNg�1
i¼0
XNg�1
j¼0
ðPði; jÞÞ2: ð23Þ
� Contrast
CON ¼XNg�1
n¼0
n2XNg�1
i¼0;j¼0;ji�jj¼n
Pði; jÞ: ð24Þ

J. Ramírez et al. / Information Sciences 237 (2013) 59–72 67
� Inverse difference moment
IDF ¼ �XNg�1
i¼0
XNg�1
j¼0
Pði; jÞ1þ ði� jÞ2
: ð25Þ
� Entropy
Hxy ¼ �XNg�1
i¼0
XNg�1
j¼0
Pði; jÞlog2Pði; jÞ: ð26Þ
� Correlation
COR ¼ 1rxry
XNg�1
i;j¼0
ijPði; jÞ � lxly
" #: ð27Þ
The proposed feature selection method aims at automaticall y finding the most discriminant statistics of the SPECT images and the ROIs without having knowledge of the disease but analyzing the set of available images in a database.
5.3. Feature selection
In order to evaluate different sets of image parameters for the early detection of the AD, a study was carried out to assess the values the statistics take for the different classes, say x1, x2, and if they differ significantly. The main objective of the study is to combine different paramete rs and end up with the ‘‘best’’ input vector for classification. The analysis considered first- and second-order statistics of sagittal, coronal and transversal slices of the brain while the Fisher linear discriminant ratio (FDR) defined by:
FDR ¼ ðl1 � l2Þ2
r21 þ r2
2
ð28Þ
was used as class separability measure, where l1 and l2 denote the with-in class mean value of the input feature, respec- tively, and r2
1 and r22 their variances.
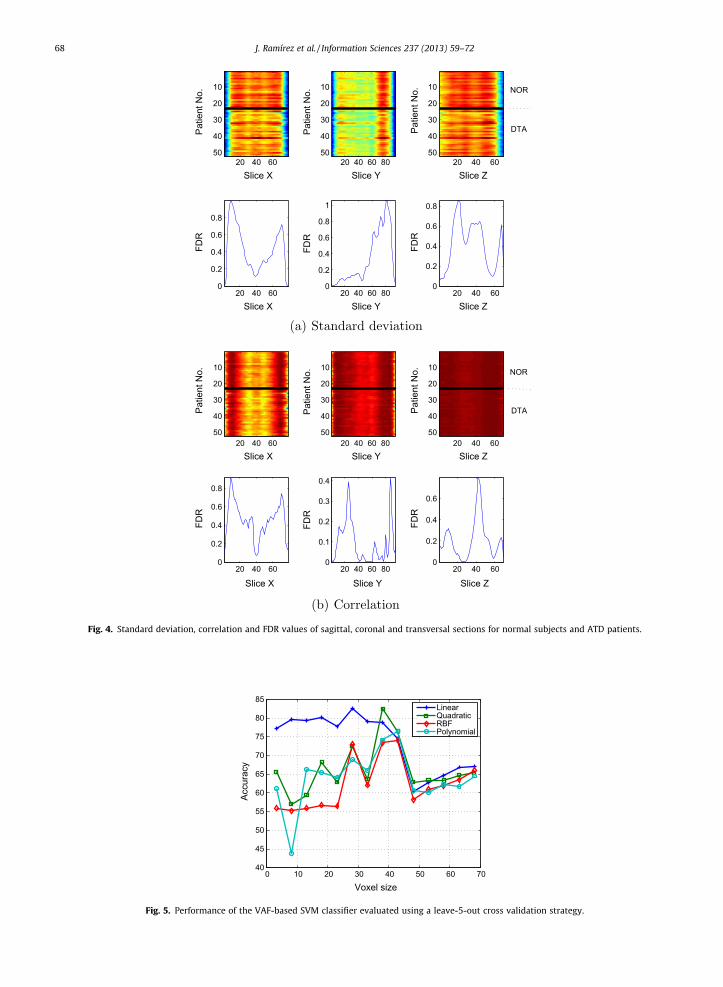
Fig. 4 shows an example of the procedure for selecting the most discriminant slices based on the computati on of the FDR when the standard deviation and correlation are considered as inputs for classification. The first row of each figure is a 2-D image showing the value of the correspondi ng statistic for each patient and each of the x (sagittal), y (coronal) and z (trans-versal) slices. Note that, normal and ATD subjects are grouped and separated by an horizontal black line to easily show the differences in the value of the statistic among the two classes. The value of the FDR is also plotted below each 2-D feature image. The most discrimin ant slices are those which yields the maximum value of the FDR and identify the ROIs (slices) for detecting the AD as discussed in Section 3. This study was extended to all the first and second-order statistics that were de- fined previously in Section 5. It can be concluded that not all the slices in the volume element provide the same discriminant value. Among all the statistics evaluated, the standard deviation of the y (coronal) slices and correlation of the x (sagittal)slices yielded the maximum value of the FDR and were found to be the most discriminant input vectors of the AD.
6. Evaluation results
This section shows the experimental results carried out in order to evaluate the performance of the classification system and its utility as a CAD system for the early AD. First, a baseline system based on the voxel-as-featu res (VAF) [45,46,44] par-adigm is impleme nted for reference. Second, the experimental results that were conducted to evaluate the proposed system are shown.
The SPECT images used in this work were initially labeled by experienced clinicians of the ‘‘Virgen de las Nieves’’ hospital (Granada, Spain) using 4 different labels: normal (NOR) for patients without any symptoms of ATD and possible ATD (ATD-1), probable ATD (ATD-2) and certain ATD (ATD-3) to distinguish between different levels of the presence of typical charac- teristics for ATD. In total, the database consists of 52 patients: 23 NOR, 13 ATD-1, 12 ATD-2 and 4 ATD-3. The latter three labels were combined and only two classes (NOR and ATD) were finally used.
6.1. Baseline voxel-as-fea tures classification
A SVM classifier based on the VAF paradigm [45,46,44] was develope d for reference. The dimension of the 95 � 69 � 79-voxel volume representing the rCBF of each subject was reduced by averaging n� n� n voxels. A SVM-based classifier using the voxel intensities as features was trained and tested by means of a leave- M-out (M = 5) cross validation strategy. The clas- sifier is trained with all but M images of the database. The remaining images, which are not used to define the classifier, are then categorized. In this way, all SPECT images are classified and the success rate is computed from a number of correctly
0 10 20 30 40 50 60 7040
45
50
55
60
65
70
75
80
85
Voxel size
Accu
racy
LinearQuadraticRBFPolynomial
Fig. 5. Performance of the VAF-based SVM classifier evaluated using a leave-5-out cross validation strategy.
Patie
nt N
o.
Slice X20 40 60
10
20
30
40
50
Patie
nt N
o.
Slice Y20 40 60 80
10
20
30
40
50
Patie
nt N
o.
Slice Z20 40 60
10
20
30
40
50
20 40 600
0.2
0.4
0.6
0.8
Slice X
FDR
20 40 60 800
0.2
0.4
0.6
0.8
1
Slice YFD
R20 40 60
0
0.2
0.4
0.6
0.8
Slice Z
FDR
DTA
NOR
Patie
nt N
o.
Slice X20 40 60
10
20
30
40
50
Patie
nt N
o.
Slice Y20 40 60 80
10
20
30
40
50
Patie
nt N
o.
Slice Z20 40 60
10
20
30
40
50
20 40 600
0.2
0.4
0.6
0.8
Slice X
FDR
20 40 60 800
0.1
0.2
0.3
0.4
Slice Y
FDR
20 40 600
0.2
0.4
0.6
Slice Z
FDR
NOR
DTA
Fig. 4. Standard deviation, correlation and FDR values of sagittal, coronal and transversal sections for normal subjects and ATD patients.
68 J. Ramírez et al. / Information Sciences 237 (2013) 59–72
J. Ramírez et al. / Information Sciences 237 (2013) 59–72 69
classified subjects. Fig. 5 shows the accuracy of the VAF-based SVM classifier as a function of the voxel size n for different kernels including linear, quadratic, RBF and polynomial kernels. Among all the kernels, the linear kernel is the one that yields the best accuracy for a VAF system in discriminating normal subjects from patients affected by ATD given the high dimension of the input space [11]. The performanc e of the linear kernel is reduced as the voxel size increases motivated by two reasons:(i) dimensio nality of the input space is progressive ly reduced and, (ii) information is lost after averaging large volume ele- ments. As a conclusio n, the accuracy of the SVM-based VAF system proposed in [16] (below 85% for a linear kernel) needs tobe improved for developing a more accurate CAD system for the early detection of the ATD.
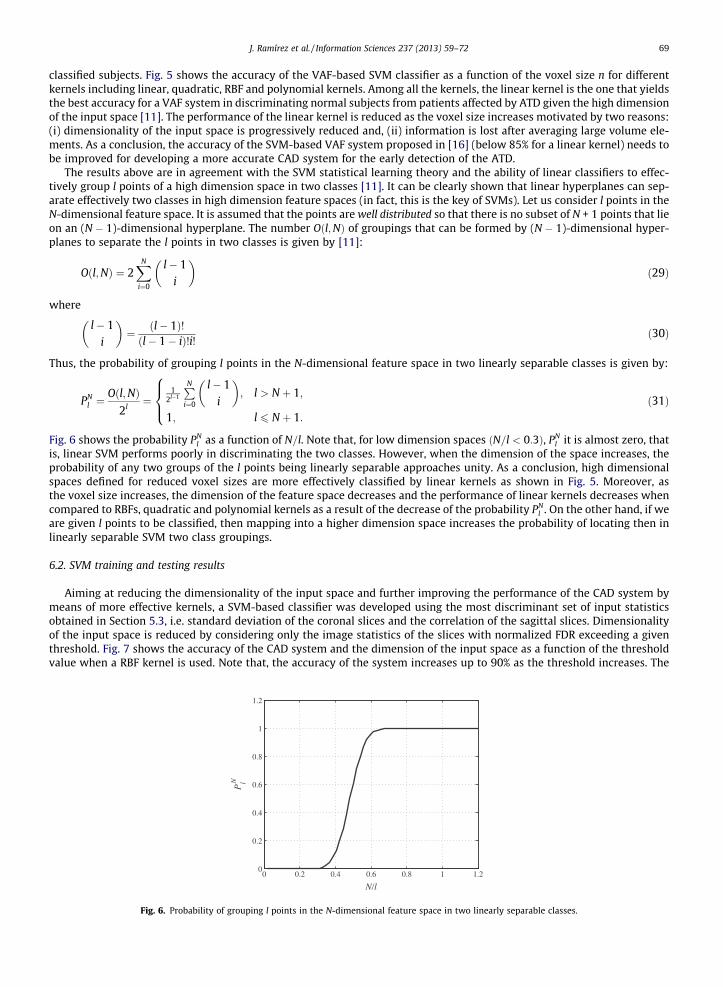
The results above are in agreement with the SVM statistical learning theory and the ability of linear classifiers to effec- tively group l points of a high dimension space in two classes [11]. It can be clearly shown that linear hyperplanes can sep- arate effectively two classes in high dimension feature spaces (in fact, this is the key of SVMs). Let us consider l points in the N-dimension al feature space. It is assumed that the points are well distribute d so that there is no subset of N + 1 points that lie on an (N � 1)-dimensional hyperpla ne. The number Oðl;NÞ of groupings that can be formed by (N � 1)-dimensional hyper- planes to separate the l points in two classes is given by [11]:
Oðl;NÞ ¼ 2XN
i¼0
l� 1i
� �ð29Þ
where
l� 1i
� �¼ ðl� 1Þ!ðl� 1� iÞ!i! ð30Þ
Thus, the probability of grouping l points in the N-dimension al feature space in two linearly separable classes is given by:
PNl ¼
Oðl;NÞ2l
¼1
2l�1
PNi¼0
l� 1i
� �; l > N þ 1;
1; l 6 N þ 1:
8><>: ð31Þ
Fig. 6 shows the probability PNl as a function of N=l. Note that, for low dimension spaces ðN=l < 0:3Þ, PN
l it is almost zero, that is, linear SVM performs poorly in discrimin ating the two classes. However, when the dimension of the space increases, the probability of any two groups of the l points being linearly separable approach es unity. As a conclusion, high dimensional spaces defined for reduced voxel sizes are more effectively classified by linear kernels as shown in Fig. 5. Moreover, asthe voxel size increases, the dimension of the feature space decreases and the performance of linear kernels decrease s when compared to RBFs, quadratic and polynomial kernels as a result of the decrease of the probability PN
l . On the other hand, if weare given l points to be classified, then mapping into a higher dimension space increases the probability of locating then inlinearly separable SVM two class groupings.
6.2. SVM training and testing results
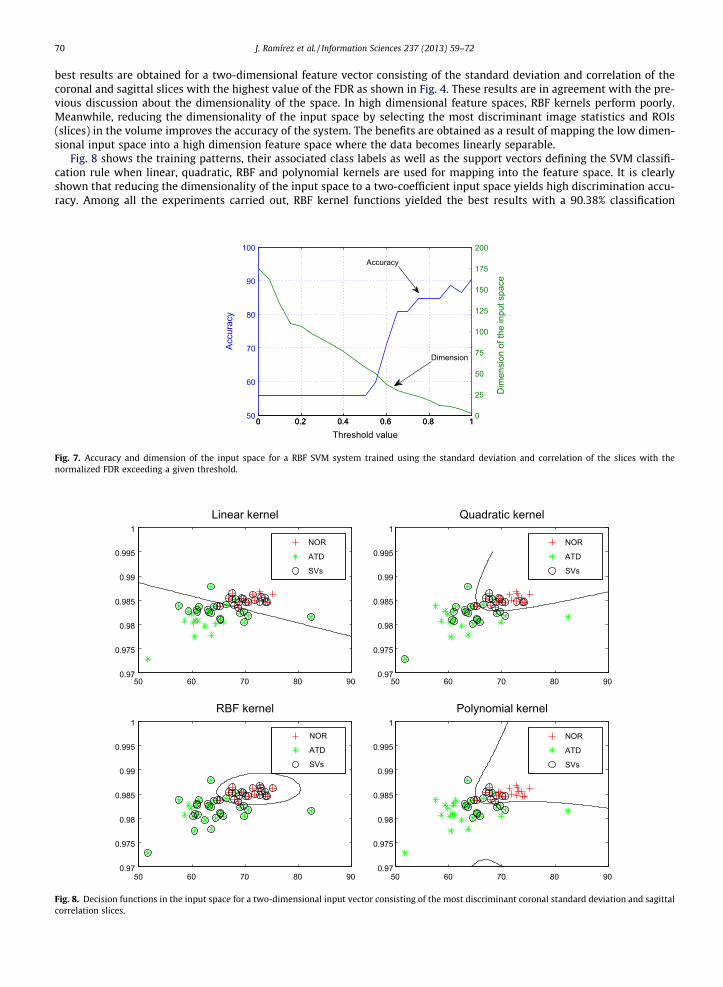
Aiming at reducing the dimensionality of the input space and further improving the performanc e of the CAD system bymeans of more effective kernels, a SVM-based classifier was developed using the most discriminant set of input statistics obtained in Section 5.3, i.e. standard deviation of the coronal slices and the correlation of the sagittal slices. Dimensional ity of the input space is reduced by considering only the image statistics of the slices with normalized FDR exceeding a given threshold. Fig. 7 shows the accuracy of the CAD system and the dimension of the input space as a function of the threshold value when a RBF kernel is used. Note that, the accuracy of the system increases up to 90% as the threshold increases. The
0 0.2 0.4 0.6 0.8 1 1.20
0.2
0.4
0.6
0.8
1
1.2
N/l
PlN
Fig. 6. Probability of grouping l points in the N-dimensional feature space in two linearly separable classes.
70 J. Ramírez et al. / Information Sciences 237 (2013) 59–72
best results are obtained for a two-dimens ional feature vector consisting of the standard deviation and correlation of the coronal and sagittal slices with the highest value of the FDR as shown in Fig. 4. These results are in agreement with the pre- vious discussion about the dimensional ity of the space. In high dimensional feature spaces, RBF kernels perform poorly.Meanwhile, reducing the dimensional ity of the input space by selecting the most discriminant image statistics and ROIs (slices) in the volume improves the accuracy of the system. The benefits are obtained as a result of mapping the low dimen- sional input space into a high dimension feature space where the data becomes linearly separable.
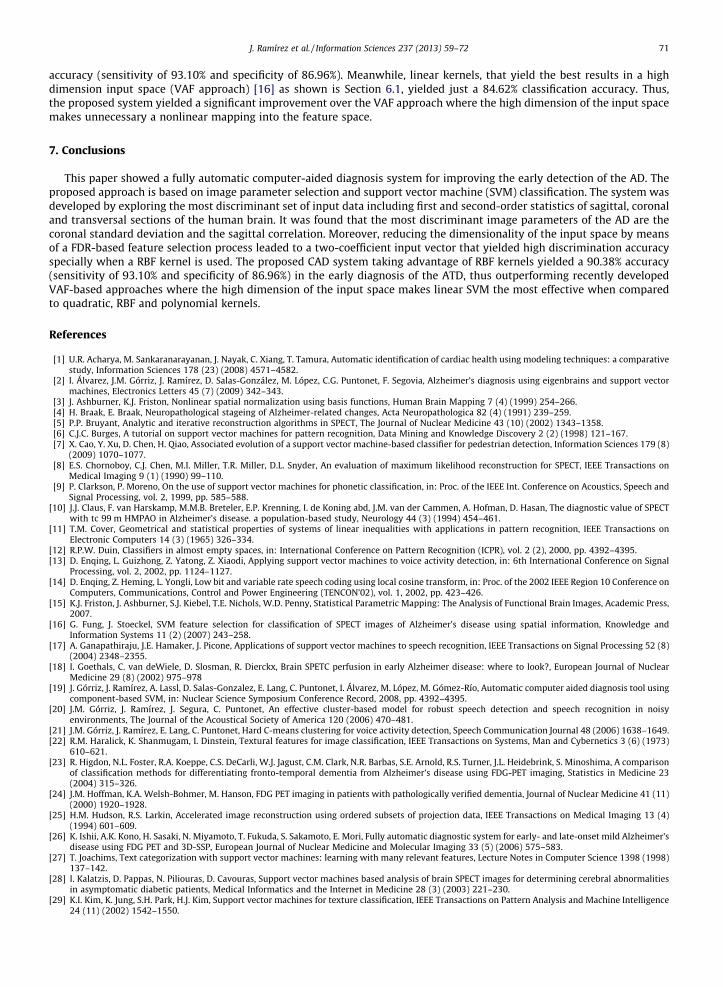
Fig. 8 shows the training patterns, their associate d class labels as well as the support vectors defining the SVM classifi-cation rule when linear, quadratic, RBF and polynomial kernels are used for mapping into the feature space. It is clearly shown that reducing the dimensionality of the input space to a two-coef ficient input space yields high discriminati on accu- racy. Among all the experiments carried out, RBF kernel functions yielded the best results with a 90.38% classification
0 0.2 0.4 0.6 0.8 150
60
70
80
90
100
Accu
racy
0 0.2 0.4 0.6 0.8 10
25
50
75
100
125
150
175
200
Dim
ensi
on o
f the
inpu
t spa
ce
Threshold value
Accuracy
Dimension
Fig. 7. Accuracy and dimension of the input space for a RBF SVM system trained using the standard deviation and correlation of the slices with the normalized FDR exceeding a given threshold.
50 60 70 80 900.97
0.975
0.98
0.985
0.99
0.995
1Linear kernel
NOR
ATD
SVs
50 60 70 80 900.97
0.975
0.98
0.985
0.99
0.995
1Quadratic kernel
NOR
ATD
SVs
50 60 70 80 900.97
0.975
0.98
0.985
0.99
0.995
1RBF kernel
NOR
ATD
SVs
50 60 70 80 900.97
0.975
0.98
0.985
0.99
0.995
1Polynomial kernel
NOR
ATD
SVs
Fig. 8. Decision functions in the input space for a two-dimensional input vector consisting of the most discriminant coronal standard deviation and sagittal correlation slices.
J. Ramírez et al. / Information Sciences 237 (2013) 59–72 71
accuracy (sensitivity of 93.10% and specificity of 86.96%). Meanwhi le, linear kernels, that yield the best results in a high dimension input space (VAF approach) [16] as shown is Section 6.1, yielded just a 84.62% classification accuracy. Thus,the proposed system yielded a significant improvement over the VAF approach where the high dimension of the input space makes unnecessar y a nonlinear mapping into the feature space.
7. Conclusion s
This paper showed a fully automatic computer-a ided diagnosis system for improving the early detection of the AD. The proposed approach is based on image parameter selection and support vector machine (SVM) classification. The system was developed by exploring the most discriminant set of input data including first and second-o rder statistics of sagittal, coronal and transversal sections of the human brain. It was found that the most discrimin ant image parameters of the AD are the coronal standard deviation and the sagittal correlation. Moreover, reducing the dimensionality of the input space by means of a FDR-based feature selection process leaded to a two-coefficient input vector that yielded high discriminati on accuracy specially when a RBF kernel is used. The proposed CAD system taking advantage of RBF kernels yielded a 90.38% accuracy (sensitivity of 93.10% and specificity of 86.96%) in the early diagnosis of the ATD, thus outperforming recently develope dVAF-based approaches where the high dimension of the input space makes linear SVM the most effective when compared to quadratic, RBF and polynomial kernels.
References
[1] U.R. Acharya, M. Sankaranarayanan, J. Nayak, C. Xiang, T. Tamura, Automatic identification of cardiac health using modeling techniques: a comparative study, Information Sciences 178 (23) (2008) 4571–4582.
[2] I. Álvarez, J.M. Górriz, J. Ramírez, D. Salas-González, M. López, C.G. Puntonet, F. Segovia, Alzheimer’s diagnosis using eigenbrains and support vector machines, Electronics Letters 45 (7) (2009) 342–343.
[3] J. Ashburner, K.J. Friston, Nonlinear spatial normalization using basis functions, Human Brain Mapping 7 (4) (1999) 254–266.[4] H. Braak, E. Braak, Neuropathological stageing of Alzheimer-related changes, Acta Neuropathologica 82 (4) (1991) 239–259.[5] P.P. Bruyant, Analytic and iterative reconstruction algorithms in SPECT, The Journal of Nuclear Medicine 43 (10) (2002) 1343–1358.[6] C.J.C. Burges, A tutorial on support vector machines for pattern recognition, Data Mining and Knowledge Discovery 2 (2) (1998) 121–167.[7] X. Cao, Y. Xu, D. Chen, H. Qiao, Associated evolution of a support vector machine-based classifier for pedestrian detection, Information Sciences 179 (8)
(2009) 1070–1077.[8] E.S. Chornoboy, C.J. Chen, M.I. Miller, T.R. Miller, D.L. Snyder, An evaluation of maximum likelihood reconstruction for SPECT, IEEE Transactions on
Medical Imaging 9 (1) (1990) 99–110.[9] P. Clarkson, P. Moreno, On the use of support vector machines for phonetic classification, in: Proc. of the IEEE Int. Conference on Acoustics, Speech and
Signal Processing, vol. 2, 1999, pp. 585–588.[10] J.J. Claus, F. van Harskamp, M.M.B. Breteler, E.P. Krenning, I. de Koning abd, J.M. van der Cammen, A. Hofman, D. Hasan, The diagnostic value of SPECT
with tc 99 m HMPAO in Alzheimer’s disease. a population-based study, Neurology 44 (3) (1994) 454–461.[11] T.M. Cover, Geometrical and statistical properties of systems of linear inequalities with applications in pattern recognition, IEEE Transactions on
Electronic Computers 14 (3) (1965) 326–334.[12] R.P.W. Duin, Classifiers in almost empty spaces, in: International Conference on Pattern Recognition (ICPR), vol. 2 (2), 2000, pp. 4392–4395.[13] D. Enqing, L. Guizhong, Z. Yatong, Z. Xiaodi, Applying support vector machines to voice activity detection, in: 6th International Conference on Signal
Processing, vol. 2, 2002, pp. 1124–1127.[14] D. Enqing, Z. Heming, L. Yongli, Low bit and variable rate speech coding using local cosine transform, in: Proc. of the 2002 IEEE Region 10 Conference on
Computers, Communications, Control and Power Engineering (TENCON’02), vol. 1, 2002, pp. 423–426.[15] K.J. Friston, J. Ashburner, S.J. Kiebel, T.E. Nichols, W.D. Penny, Statistical Parametric Mapping: The Analysis of Functional Brain Images, Academic Press,
2007.[16] G. Fung, J. Stoeckel, SVM feature selection for classification of SPECT images of Alzheimer’s disease using spatial information, Knowledge and
Information Systems 11 (2) (2007) 243–258.[17] A. Ganapathiraju, J.E. Hamaker, J. Picone, Applications of support vector machines to speech recognition, IEEE Transactions on Signal Processing 52 (8)
(2004) 2348–2355.[18] I. Goethals, C. van deWiele, D. Slosman, R. Dierckx, Brain SPETC perfusion in early Alzheimer disease: where to look?, European Journal of Nuclear
Medicine 29 (8) (2002) 975–978[19] J. Górriz, J. Ramírez, A. Lassl, D. Salas-Gonzalez, E. Lang, C. Puntonet, I. Álvarez, M. López, M. Gómez-Río, Automatic computer aided diagnosis tool using
component-based SVM, in: Nuclear Science Symposium Conference Record, 2008, pp. 4392–4395.[20] J.M. Górriz, J. Ramírez, J. Segura, C. Puntonet, An effective cluster-based model for robust speech detection and speech recognition in noisy
environments, The Journal of the Acoustical Society of America 120 (2006) 470–481.[21] J.M. Górriz, J. Ramírez, E. Lang, C. Puntonet, Hard C-means clustering for voice activity detection, Speech Communication Journal 48 (2006) 1638–1649.[22] R.M. Haralick, K. Shanmugam, I. Dinstein, Textural features for image classification, IEEE Transactions on Systems, Man and Cybernetics 3 (6) (1973)
610–621.[23] R. Higdon, N.L. Foster, R.A. Koeppe, C.S. DeCarli, W.J. Jagust, C.M. Clark, N.R. Barbas, S.E. Arnold, R.S. Turner, J.L. Heidebrink, S. Minoshima, A comparison
of classification methods for differentiating fronto-temporal dementia from Alzheimer’s disease using FDG-PET imaging, Statistics in Medicine 23(2004) 315–326.
[24] J.M. Hoffman, K.A. Welsh-Bohmer, M. Hanson, FDG PET imaging in patients with pathologically verified dementia, Journal of Nuclear Medicine 41 (11)(2000) 1920–1928.
[25] H.M. Hudson, R.S. Larkin, Accelerated image reconstruction using ordered subsets of projection data, IEEE Transactions on Medical Imaging 13 (4)(1994) 601–609.
[26] K. Ishii, A.K. Kono, H. Sasaki, N. Miyamoto, T. Fukuda, S. Sakamoto, E. Mori, Fully automatic diagnostic system for early- and late-onset mild Alzheimer’s disease using FDG PET and 3D-SSP, European Journal of Nuclear Medicine and Molecular Imaging 33 (5) (2006) 575–583.
[27] T. Joachims, Text categorization with support vector machines: learning with many relevant features, Lecture Notes in Computer Science 1398 (1998)137–142.
[28] I. Kalatzis, D. Pappas, N. Piliouras, D. Cavouras, Support vector machines based analysis of brain SPECT images for determining cerebral abnormalities in asymptomatic diabetic patients, Medical Informatics and the Internet in Medicine 28 (3) (2003) 221–230.
[29] K.I. Kim, K. Jung, S.H. Park, H.J. Kim, Support vector machines for texture classification, IEEE Transactions on Pattern Analysis and Machine Intelligence 24 (11) (2002) 1542–1550.

72 J. Ramírez et al. / Information Sciences 237 (2013) 59–72
[30] D. Kogure, H. Matsuda, T. Ohnishi, T. Asada, M. Uno, T. Kunihiro, S. Nakano, M. Takasaki, Longitudinal evaluation of early Alzheimer disease using brain perfusion SPECT, The Journal of Nuclear Medicine 41 (7) (2000) 1155–1162.
[31] K. Lange, R. Carson, EM reconstruction for emission and transmission tomography, Journal of Computer Assisted Tomography 8 (1984) 306–312.[32] M. López, J. Ramírez, J.M. Górriz, D. Salas-González, I. Álvarez, F. Segovia, C.G. Puntonet, Automatic tool for the Alzheimer’s disease diagnosis using PCA
and bayesian classification rules, Electronics Letters 45 (8) (2009) 389–391.[33] S. Minoshima, K.A. Frey, R.A. Koeppe, N.L. Foster, D.E. Kuhl, A diagnostic approach in Alzheimer’s disease using three dimensional stereotactic surface
projections of fluorine-18-FDG PET, Journal of Nuclear Medicine 36 (7) (1995) 1238–1248.[34] K.R. Müller, S. Mika, G. Rätsch, K. Tsuda, B. Schölkopf, An introduction to kernel-based learning algorithms, IEEE Transactions on Neural Networks 12
(2) (2001) 181–201.[35] B. Pang, D. Zhang, K. Wang, Tongue image analysis for appendicitis diagnosis, Information Sciences 175 (3) (2005) 160–176.[36] J.C. Platt, Advances in Kernel Methods – Support Vector Learning, chap. Fast Training of Support Vector Machines using Sequential Minimal
Optimization, MIT Press, 1999.[37] F. Qi, C. Bao, Y. Liu, A novel two-step SVM classifier for voiced/unvoiced/silence classification of speech, in: International Symposium on Chinese
Spoken Language Processing, 2004, pp. 77–80.[38] J. Ramírez, J.M. Górriz, M. Gómez-Río, A. Romero, R. Chaves, A. Lassl, A. Rodríguez, C.G. Puntonet, F. Theis, E. Lang, Effective emission tomography image
reconstruction algorithms for SPECT data, Lecture Notes in Computer Science 5101 (2008) 741–748.[39] J. Ramírez, P. Yélamos, J.M. Górriz, C.G. Puntonet, J.C. Segura, SVM-enabled voice activity detection, Lecture Notes in Computer Science 3972 (2006)
676–681.[40] J. Ramírez, P. Yélamos, J.M. Górriz, J.C. Segura, SVM-based speech endpoint detection using contextual speech features, Electronics Letters 42 (7) (2006)
877–879.[41] P. Saxena, D.G. Pavel, J.C. Quintana, B. Horwitz, An automatic thresholdbased scaling method for enhancing the usefulness of Tc-HMPAO SPECT in the
diagnosis of Alzheimers disease, Medical Image Computing and Computer-Assisted Intervention – MICCAI, Lecture Notes in Computer Science 1496 (1998) 623–630.
[42] D.D. Sha, J.P. Sutton, Towards automated enhancement, segmentation and classification of digital brain images using networks of networks,Information Sciences 138 (1–4) (2001) 45–77.
[43] D.H. Silverman, G.W. Small, C.Y. Chang, Positron emission tomography in evaluation of dementia: regional brain metabolism and long-term outcome,Journal of the American Medical Association 286 (17) (2001) 2120–2127.
[44] J. Stoeckel, N. Ayache, G. Malandain, P.M. Koulibaly, K.P. Ebmeier, J. Darcourt, Automatic classification of SPECT images of Alzheimer’s disease patients and control subjects, Lecture Notes in Computer Science 3217 (2004) 654–662.
[45] J. Stoeckel, G. Fung, SVM feature selection for classification of SPECT images of Alzheimer’s disease using spatial information, in: Proc. of the Fifth International Conference on Data Mining (ICDM05), 2005, pp. 410–417.
[46] J. Stoeckel, G. Malandain, O. Migneco, P.M. Koulibaly, P. Robert, N. Ayache, J. Darcourt, Classification of SPECT images of normal subjects versus images of Alzheimer’s disease patients, Lecture Notes in Computer Science 2208 (2001) 666–674.
[47] B.G. Tabachnick, L.S. Fidell, Computer-Assisted Research and Design Analysis, Pearson Education, 2000.[48] D. Tao, X. Tang, X. Li, X. Wu, Asymmetric bagging and random subspace for support vector machines-based relevance feedback in image retrieval, IEEE
Transactions on Pattern Analysis and Machine Intelligence 28 (7) (2006) 1088–1099.[49] H.-H. Tsai, D.-W. Sun, Color image watermark extraction based on support vector machines, Information Sciences 177 (2) (2007) 550–569.[50] S. Vandenberghea, Y. D’Asselera, R.V. de Wallea, T. Kauppinenb, M. Koolea, L. Bouwensa, K.V. Laerec, I. Lemahieua, R. Dierckx, Iterative reconstruction
algorithms in nuclear medicine, Computerized Medical Imaging and Graphics (25) (2001) 105–111.[51] V.N. Vapnik, Estimation of Dependences Based on Empirical Data, Springer-Verlag, New York, 1982.[52] V.N. Vapnik, The Nature of Statistical Learning Theory, Springer-Verlag, Berlin, 1995.[53] V.N. Vapnik, Statistical Learning Theory, John Wiley and Sons Inc., New York, 1998.[54] Y. Vardi, L.A. Shepp, L. Kaufman, A statistical model for positron emission tomography, Journal of the American Statistical Association 80 (389) (1985)
8–20.[55] R.P. Woods, Spatial transformation models, in: I.N. Bankman (Ed.), Handbook of Medical Imaging, Academic Press, San Diego, 2000, pp. 465–490
(Chapter 29).[56] P. Yélamos, J. Ramírez, J.M. Górriz, C.G. Puntonet, J.C. Segura, Speech event detection using support vector machines, Lecture Notes in Computer Science
3991 (2006) 356–363.[57] S.-M. Zhou, J.Q. Gan, F. Sepulveda, Classifying mental tasks based on features of higher-order statistics from EEG signals in brain-computer interface,
Information Sciences 178 (6) (2008) 1629–1640.