Aided Sensing in Post-Disaster Situations
99
Aided Sensing in Post-Disaster Situations Simon Johann Joecks June 9, 2011 Supervised by Prof. Dr. Odej Kao, Technical University Berlin
Transcript of Aided Sensing in Post-Disaster Situations

Aided Sensing in Post-Disaster Situations
Simon Johann Joecks
June 9, 2011
Supervised by Prof. Dr. Odej Kao, Technical University Berlin

Technische Universität BerlinInstitut für Komplexe und Verteilte IT-SystemeOrginaltitel vor der Änderung: Aided Sensing in Post-Disaster SituationsGeänderter Titel: Smartphone Assisted Participatory Sensing
ii

Contents
1. Introduction 11.1. Abstract . . . . . . . . . . . . . . . . . . . . . . . . . . . . . . . . . . . . . 1
1.1.1. Keywords . . . . . . . . . . . . . . . . . . . . . . . . . . . . . . . . 11.2. Zusammenfassung . . . . . . . . . . . . . . . . . . . . . . . . . . . . . . . 11.3. Problem Introduction . . . . . . . . . . . . . . . . . . . . . . . . . . . . . 2
2. Problem Discussion and Analysis - Human Sensors 42.1. Applications of Collecting, Accessing and Distributing Data . . . . . . . . 5
2.1.1. Operational Areas . . . . . . . . . . . . . . . . . . . . . . . . . . . 52.1.2. Lessons . . . . . . . . . . . . . . . . . . . . . . . . . . . . . . . . . 10
2.2. Project driven Data Collection . . . . . . . . . . . . . . . . . . . . . . . . 112.3. Sensing the Context . . . . . . . . . . . . . . . . . . . . . . . . . . . . . . 132.4. Privacy . . . . . . . . . . . . . . . . . . . . . . . . . . . . . . . . . . . . . 142.5. Data Interpretation . . . . . . . . . . . . . . . . . . . . . . . . . . . . . . 142.6. Project Interfaces . . . . . . . . . . . . . . . . . . . . . . . . . . . . . . . . 162.7. Mobile Devices as Sensing Tools . . . . . . . . . . . . . . . . . . . . . . . . 17
2.7.1. Infrastructure Limitations and Opportunities? . . . . . . . . . . . . 182.7.2. Input Methods . . . . . . . . . . . . . . . . . . . . . . . . . . . . . 192.7.3. Sensors and Context sensing Capabilities of mobile Devices . . . . 20
3. Related Work 23
4. Framework Concept 274.1. Use-Cases . . . . . . . . . . . . . . . . . . . . . . . . . . . . . . . . . . . . 27
4.1.1. System - Initiator . . . . . . . . . . . . . . . . . . . . . . . . . . . . 284.1.2. System - Gatherer - Client . . . . . . . . . . . . . . . . . . . . . . . 284.1.3. System - Evaluator . . . . . . . . . . . . . . . . . . . . . . . . . . . 294.1.4. System-Analyzer . . . . . . . . . . . . . . . . . . . . . . . . . . . . 29
4.2. Architecture . . . . . . . . . . . . . . . . . . . . . . . . . . . . . . . . . . 294.3. Concept Overview . . . . . . . . . . . . . . . . . . . . . . . . . . . . . . . 31
4.3.1. Sensor Data . . . . . . . . . . . . . . . . . . . . . . . . . . . . . . 314.3.2. Clients . . . . . . . . . . . . . . . . . . . . . . . . . . . . . . . . . . 344.3.3. Annotations . . . . . . . . . . . . . . . . . . . . . . . . . . . . . . . 354.3.4. Views . . . . . . . . . . . . . . . . . . . . . . . . . . . . . . . . . . 364.3.5. User System . . . . . . . . . . . . . . . . . . . . . . . . . . . . . . . 40
4.4. Model and Protocol Details . . . . . . . . . . . . . . . . . . . . . . . . . . 404.4.1. Context and Sensor Data . . . . . . . . . . . . . . . . . . . . . . . 40
iii

Contents
4.4.2. Request Model . . . . . . . . . . . . . . . . . . . . . . . . . . . . . 424.4.3. Sensor Model . . . . . . . . . . . . . . . . . . . . . . . . . . . . . . 454.4.4. Annotation Model . . . . . . . . . . . . . . . . . . . . . . . . . . . 504.4.5. Mapping Models to Objects . . . . . . . . . . . . . . . . . . . . . . 51
5. Implementation 535.1. Client . . . . . . . . . . . . . . . . . . . . . . . . . . . . . . . . . . . . . . 53
5.1.1. System Integration . . . . . . . . . . . . . . . . . . . . . . . . . . . 535.1.2. User Interaction . . . . . . . . . . . . . . . . . . . . . . . . . . . . 555.1.3. Class Diagram . . . . . . . . . . . . . . . . . . . . . . . . . . . . . 555.1.4. Techniques . . . . . . . . . . . . . . . . . . . . . . . . . . . . . . . 58
5.2. Server . . . . . . . . . . . . . . . . . . . . . . . . . . . . . . . . . . . . . . 605.2.1. Scaleability . . . . . . . . . . . . . . . . . . . . . . . . . . . . . . . 605.2.2. Design Pattern . . . . . . . . . . . . . . . . . . . . . . . . . . . . . 615.2.3. Services . . . . . . . . . . . . . . . . . . . . . . . . . . . . . . . . . 62
6. Scenarios 656.1. Oil Spill . . . . . . . . . . . . . . . . . . . . . . . . . . . . . . . . . . . . . 65
6.1.1. The Goals of the Project . . . . . . . . . . . . . . . . . . . . . . . 656.1.2. Defining the Protocol . . . . . . . . . . . . . . . . . . . . . . . . . 666.1.3. Gathering Data . . . . . . . . . . . . . . . . . . . . . . . . . . . . . 676.1.4. Verify the Data . . . . . . . . . . . . . . . . . . . . . . . . . . . . . 696.1.5. Analysis and Interpretation of Data . . . . . . . . . . . . . . . . . 70
6.2. Monitoring Noise Pollution . . . . . . . . . . . . . . . . . . . . . . . . . . 716.2.1. Defining the Protocol . . . . . . . . . . . . . . . . . . . . . . . . . 726.2.2. Gathering Data . . . . . . . . . . . . . . . . . . . . . . . . . . . . . 726.2.3. Analysis and Interpretation of Data . . . . . . . . . . . . . . . . . 73
7. Post Analysis and Future Work 747.1. User Evaluation . . . . . . . . . . . . . . . . . . . . . . . . . . . . . . . . . 747.2. Conclusion . . . . . . . . . . . . . . . . . . . . . . . . . . . . . . . . . . . . 757.3. Future Work . . . . . . . . . . . . . . . . . . . . . . . . . . . . . . . . . . 77
A. Appendix 78A.1. Request Scheme . . . . . . . . . . . . . . . . . . . . . . . . . . . . . . . . . 78A.2. Noise Pollution Scenario Request . . . . . . . . . . . . . . . . . . . . . . . 87
Bibliography 89
iv

Declaration of authorship
I certify that the work presented here is, to the best of my knowledge and belief, origi-nal and the result of my own investigations, except as acknowledged, and has not beensubmitted, either in part or whole, for a degree at this or any other University.
Simon JoecksBerlin
v

Erklärung über die Urheberschaft
Ich erkläre hiermit an Eides statt, dass ich die vorliegende Arbeit ohne Hilfe Dritterund ohne Benutzung anderer als der angegebenen Hilfsmittel angefertigt habe. Die ausfremden Quellen direkt oder indirekt übernommenen Gedanken sind als solche kenntlichgemacht. Die Arbeit wurde bisher in gleicher oder ähnlicher Form in keiner anderenPrüfungsbehörde vorgelegt und auch noch nicht veröffentlicht.
Simon JoecksBerlin, den
vi

Contents
Acknowledgments
This thesis was inspired by a public protest I was attending in 2009, where I experiencedhow useful location based information could be, when everyone would contribute in gath-ering it.
My special thanks is going to my advisor Prof. Dr, Odej Kao, who helped me to conductthis work and focus on the essentials.
Martin had always listen to my ideas and discussed them and helped me a lot by proof-reading my thesis. Thanks.Nadim thank you for finally proofreading and Wenke thank you a lot for your feedback.
My deepest thanks goes to Fei, my girlfriend who supported me with all her questioning,love and patience and thank you a lot for proofreading.
Finally I would like to thank my friends and my colleagues and especially my familyfor their great support during the years of study.
vii
Given enough eyeballs, all bugs are shallow.
- Linus Torvalds

1. Introduction
1.1. Abstract
In this work we present the design and implementation of our participatory sensingsmartphone framework. Our framework enables participants to collect data for vari-ous predefined tasks, with dedicated features for collection-control, data-verification anddata-visualization. We implemented and tested our findings on a prototype for Androidsmartphones with features for context-aware device control, survey rendering and sensordata extraction. We designed a corresponding abstract extraction and collection controlprotocol, which allows to declarative define user surveys, sensor access and context-aware collection rules, including remote device control for coordination and triggeringrule based data collection. The platform operation is finally discussed, in detail for twosample scenarios, with focus on disaster relief application and urban management, andtested during our user evaluation.
1.1.1. Keywords
participative sensing, human sensors, disaster relief, smartphone assistance, geo-locationapplications
1.2. Zusammenfassung
In dieser Arbeit präsentieren wir den Entwurf und die Implementierung unseres Frame-works, welches dazu dient auf der Grundlage von Smartphones das kollektive Erhebenvon Daten zu ermöglichen. Unser Framework erlaubt Teilnehmer an der Datenerhe-bung zahlreicher Anwendungen teilzunehmen, und erlaub darüber hinaus die Kontrolledes Erhebungsprozesses, das Verifizieren der Daten und schließlich das Visualisieren derDaten. Wir haben unseren Entwurf implementiert und dem Prototypen für AndroidSmartphones getestet. Der Prototyp umfasst eine kontextsensitive Kontrolle des Daten-erhebungsprozesses, das Darstellen von Benutzerabfragen und das Abgreifen von Sen-sorendaten, die von dem Smartphone bereitgestellt werden. Für die Kommunikationhaben wir ein entsprechendendes abstraktes Protokoll entworfen, welches uns ermöglichtDatenerfassungziele deklerativ zu beschreiben. Die Anwendung unseres Frameworkswurde abschließend ausführlich für zwei Beispielszenarien beschrieben, welche sich aufdie Katerstrophenbewältigung und Stadtentwicklung konzentrieren, und dann währendeiner Benutzerevaluierung getestet.
1

1. Introduction
1.3. Problem Introduction
In January 2010 Haiti was hit by a large earthquake, which caused thousands of causalitiesand a common brake-down of the already poor deployed infrastructure in almost all areas.The disaster was quickly tackled by a massive international aid-program, accompaniedby rescue, medical, humanitarian, and reconstruction help, as well as military forces.In the same time outside of Haiti voluntaries of the CrisisCommons group gathered incrisis camps to discuss and establish methods to provide technical relief for the in fieldoperations. A major outcome of these gatherings was the deployment of CrisisMapbased on Ushahidi, the 4636 project and a significant effort to update the Haiti mappingbased on OpenStreetMap (OSM). The result was that local in-field operations in Port-au-Prance could rely and find their way based on OSM, which they couldn’t before since,no detailed map was available. Ground forces could coordinate their work based on infiled local reports thought SMS, issued by Haitians, like for instance:LOCATION Fontamara 43 Rue Menos , JAN 17 2010, SMScreole(orginal): Koman nou ka jwenn sekou ak manje nan fontamara 43 ru
menos cite la bel???english: how can we find aid and food in fontamara (carrefour)
distribution
Listing 1.1: Issuied on haiti.ushahidi.com
The 4636 project provided the necessary linking with a SMS gateway and establishedthe 4636 phone number in combination with a display of the reports on a geo-locationmap based on Ushahidi. Further more a community based translation service was set upin order to translate and categorize messages based on their context, so that relief forcescould understand and quickly react upon urgent matters Zook et al. [2010]. The overallsignificance of the mapping and reporting tools was afterwards summarized by the USMarine Corps officer Clark Craig:
I cannot overemphasize to you what the work of the Ushahidi/Haiti hasprovided. It is saving lives every day.1
All of the mapping and reporting services are based on web 2.0 architectures and there-fore requiring internet access to communicate and contribute for users. But only 30% ofthe worlds population has internet access, where as 78% have access to cellular commu-nication 2, which is showing the difficulties to participate for such projects. NeverthelessUshahidi was very successful in showing that cell phones are dual purpose devices, whichmay provide a link to such services and so being reused for disaster relief assistance.Extending the image of dual usage for cell phones to modern mobile devices, as for
instance smartphones, is an evident step because of the rise of popularity of such devices.Smartphones are at the present time equipped with plenty of capabilities for detectingphysical features, in addition to communicating and interacting with the user. In fact
1http://blog.ushahidi.com/index.php/2010/02/06/ushahidi-how-we-are-doing/[English,03/05/11]
2http://www.itu.int/ITU-D/ict/statistics/[English, 03/05/11]
2

1. Introduction
the ubiquitous of smart phones, with high processing capabilities, makes a vast of dualusage scenarios possible, where one of is solving tasks in participation by using the deviceas assistance. The so called concept of participatory sensing (PS) as a future conceptwas researched by Burke et al. [2006] and is picked up and extended by this work.We show that PS in combination with smartphones is an universal method to collect
data for a large set of applications. Therefore we developed and showcased a frameworkfor PS tasks. The framework intents to enable a controlled collection process of data, addsa verification layer and enables easy and extendable methods to visualize the data. Inparticular we focused on solving aspects of disaster relief operations with our framework,which we demonstrate by an example scenario. The scenario describes an oil-spill disaster,where participants collect data about the effected environment. Their effort is resultingin a status map, showing the caused damage. While collecting data participants willinfluence the collection strategies of other participants, through rule based notifications.This method introduces context-aware collection of in field operations.The work is structured in seven chapters. In the second chapter, after the introduction,
we analyze the potentials of PS applications, extract a project based scheme for PStasks, and show the usefulness of smartphones as collecting tools. In the third chapterwe discuss the related work. In the fourth chapter we introduce our framework concept,which consists of an architecture overview and in depth descriptions of the used protocolsand models. In the fifth chapter we discuss the implementation of our prototype, whichincludes algorithms and methods especially for the collection client. In the sixth chapterwe discuss two example scenarios, which are designed to match a real life scenario, whereour framework is used. In the seventh chapter we discuss an evaluation of the frameworkbased on a deploy application, and then finally discuss future work and conclude ourfindings.
3

2. Problem Discussion and Analysis -Human Sensors
Sensing the environment is an action which happens everyday to anyone. Also to talkabout it and exchange opinions is a natural process for the sake of getting a better pictureof a complex scene. The industry is widely using this in different ways for leveragingbusinesses matters. So are telecommunication companies interested in bandwidth usage,government organizations are interested in traffic jam monitoring and the public mediain after-election opinion polling. Usually industries spend high quantities of their budgeton monitoring or polling, but they keep their networks or channels closed from the public.That is why there is usually no way of reusing the data for a different and public purposes.On the other hand millions of users are participating in open or closed social networks,
such as Facebook, Twitter or Orkut, to exchange information about themselves or discussvarious kinds of topics. This data is usually trapped inside the service, only used by theservice itself. The popularity of such networks shows that there is a high willingness forcommon people to participate in generating data. This chapter is dedicated to show thatthere is also public demand for applications, which leverages the will to gather data andto participate in sensing a subject.Shifting sensing capabilities towards the public enables new useful and sometimes des-
perately needed applications. As participants and their perceptive faculty are the atomicpart of the architecture, we will call them “human as sensors”, “social sensors” or “people-centric sensors”, to address the participants and their vast of sensing abilities. Thoseabilities, but also inabilities, will introduce new problems of verification and interpre-tation of data. Thus data management must be shifted from centralized to distributedmanagement, where human as sensors are also acting inside community processes, forthe sake of making data valuable.The democratization of sensing-tasks also forces a change of tools, whereas pen-and-
paper work usually enforces centralized models, cell phones and mobile computers canbe utilized for distributed data collection and verification. Furthermore smartphones,as a symbiosis of mobile computing, cell phone connectivity and convenience, aids so-cial sensors with additional conventional sensors, like GPS, compass or accelerometer.Smartphones as ubiquitous devices can even help make its user understand what his/hersensing task is about in various ways, so that language and cultural barriers may beovercome.As consequence of the open participation concept, data delivery and the interpretation
of data is intended to be open and extendable for reuse. Hence it is desirable to intercon-nect existing open data subsumption, interpretation and visualization concepts in orderto set for an open process, where everybody may generate their own interpretations of
4

2. Problem Discussion and Analysis - Human Sensors
the data.
2.1. Applications of Collecting, Accessing and DistributingData
The concept of collecting data collaboratively may be referred as Participatory Sensing(PS). PS is useful for several reasons in different domains, as Burke et al. [2006] sketchedprojects for health, urban, culture and science sectors. In this section we will discussand analyze such project’s underneath. Analyzing the motivation of participants andthe profit of such projects yields a deep understanding of problems and opportunitiesfor sensing projects, and it also shows the usefulness of applications in each sectors. Incontrast to Burke we will also focus on disaster relief applications, which are proven tobe beneficial, i.e. at the massive involvement of voluntary reporting, geo-mapping andsocial media in the earthquake disaster in Haiti, 2010. Furthermore we will address theusefulness of mobile devices in PS-projects. We will also discuss a sample scenario insection 6.1 for an oil spill disaster, in which our findings are utilized. In the end of theanalysis, lessons will be extracted to show its common properties.
2.1.1. Operational Areas
Health
The health sector has many applications which focus on communication and collection ofdata. Those applications stretch from daily monitoring patient’s vital values to informdoctors about urgent events, i.e. the birth of a child. Those applications have differentlife-cycles and preconditions based on the development-state of the underlying infras-tructure. In a developed country like Germany, medical care processes are quick andpredefined, yet mandatory and well brought in, hence there might be less gains for effi-ciency in terms of communication. However prevention is a continues changing process,especially in modern societies, where lifestyle, environment-factors and nutrients-habitschange quickly and new applications for different diseases and circumstances will bedeveloped. In this environment society can benefit from rapid and cheap monitoringapplications based on preexisting infrastructure. For instance Smart Senior, a Germanresearch project, focuses on how to integrate modern technologies with the aging society.A sub goal of the project is to provide automated monitoring capabilities to risk-patientsfor rapid reaction in the case of heart attack or stroke[Chinnow et al., 2011].Introducing mobile technology to monitor vital data and poll for user opinions about
medical treatment is enabling substantial benefits to such applications:
Preventive centralized vital data collection helps to see vitality changes even be-fore the patient feels the difference and makes it possible to match the sequence of eventsagainst modern recognition methods, to estimate risks and to trigger specific treatmentor expert consolidation. The collection of data is also providing a solid base to train
5

2. Problem Discussion and Analysis - Human Sensors
recognition software, in order to estimate context aware risks. Medications or treat-ments, which are new or difficult to probe, can then be tested much cheaper and itseffect monitored even after official approval.
For developing countries, with weaker infrastructure and especially bad access tomedical personal, communication, monitoring and prevention can be efficiently addressed.Under those issues communication can benefit from PS the most. In many cases, like out-braking diseases or undernourishment for new born children, quick access to medicationcan prevent long-term consequences. However local communities usually report those in-cidences too late, and as a result lose valuable time just on communication. The UNICEFRapid SMS program [Underwood, 2010] directly addresses this issue by introducing anSMS based communication infrastructure with a customizable communication protocol.Local community members have been trained to send or to train affected persons. Bysending messages directly after an incidence, the communication path between a patientand medical personal was shortened. Such SMS are composed of place-time descriptionsand specified codes for vital data monitoring, household details and personal data. Inconsequence medication shipment could be triggered in a direct manner and suppliescould be ordered and stored, preventive and deficiencies could be avoided. RapidSMSshows that under a few preconditions little technical help can vastly boost efficiency. Thepreconditions are cost, dependency and adaption; mobile phones are cheap and availableto most areas, and the use of SMS for data based communication is affordable. And byintroducing direct communication between beneficial and provider, slow and hazardouscommunication paths may be omitted and identified. Finally a communication systemmust be based and adopted on the underlying infrastructure, meaning not just the clientsand the network, but also the local community habits with regards on education.
Disaster Coordination
Disasters take place and dissolve quickly, but there consequences are usually difficult toovercome. There may be a difference between developed and undeveloped countries, butin both cases preinstalled infrastructure can become unusable under similar influences.In other words disaster relief is not particularly dependent on preinstalled infrastruc-ture. Quick and coordinated first responses after disasters are however essential to limitthe number of casualties and to get a grip on diseases, like i.e. cholera. Here we willdistinguish disaster relief in three phases: pre-disaster detection, like tsunami earlywarning systems, first response management, and after-care and documentation.
Technical methods for early recognition of disasters are limited to detection of nat-ural or slow initiated disasters, like tsunamis, typhoons and forest fires, and it is usuallydone by static deployed sensor (thermal, seismic) and by satellites. Deployed sensorsmust cover a vast area in order to provide credible results whereas they stay usually idleand need to be maintained frequently. Sakaki et al. [2010] addressed disaster detection,in contrast to conventional sensors, through social sensors, meaning twitter users postingmessages (tweets) about a particular large event. Twitter is a micro blogging service,
6

2. Problem Discussion and Analysis - Human Sensors
with about 190 million users all over the world, in which 65 million1 tweets are posteddaily. Defining tweets as sensor data and users as noisy sensors, which tweet irregularlyand unpredictably, it was the goal for Sakaki to extract target information from a streamof noisy sensor data, which is an usual task in data-mining. By defining keywords and alocal context (time, place) as features of a classifier and using particle filters it was shownthat prediction and progress estimation is possible with a probability of 96%. Comparedto conventional sensors and reporting systems, an installed earthquake service in Japanbased on twitter, delivered faster reports to registered users than other conventional me-dia. This example shows that social sensors are efficient and reasonable enough to delivercrucial information about large events.
First response management is incorporated deployed in developed countries, whereforces can backup on robust emergency infrastructure, like for instance the europeanTerrestrial Trunked Radio (TETRA), and follow strict scheduled action schemes like theGerman Katastrophenschutzplan. In less developed countries, emergency plans are maybe deployed, but still fail because of missing executors, equipment or unreliable commu-nication infrastructure, seen in Haiti-earthquake 2010 or the Tsunami 2004 in Asia. Inany case disaster relief efforts rely on a centralized command and order coordination.Aldunate et al. [2005] describes such a relief handling as a potential communication andcoordination bottleneck. A proposed scheme for macro management is described inhis work about distributed decision-making processes. The scheme borrows from honeybees, where tasks are solved in local ad-hoc groups with instant communication abilities.If tasks are solvable in a local cell, there is no external orders needed, and if not, aneighboring group of participants will be contacted and involved in the process. Suchdistributed scenarios ad-hoc communication, like disruption tolerant networks (DTN),are more suitable for the need of infrastructure-independent communication, than con-ventional always-connected approaches, since data communication does not depend ona static and potentially fallible network, but on the participants movement and dissem-ination. DTN is well researched and a serious approach on connectivity-less communi-cation[Kannan et al., 2010], therefore it is also considered to overcome communicationproblems in micro management, as for instance Triage. Triage is a prioritizationprocess to mark the condition of causalities based on static tags, which is a necessaryprocedure to sort and coordinate work with causalities in first response. However con-ventional Triage has no considerations for dynamic conditions, context awareness andinstant communication, all important qualities which are needed in disaster situations.Mobile devices may assist the Triage process based on DTN, where intelligent tags areattached to patients, like pictures, positions or live vital data. These data is then prop-agated through crossing personal, until it reaches an not occupied specialist or a localcoordination sink [Crowcroft et al., 2010].
The after disaster organization, for distributing food, medication (see 2.1.1), re-construction and avoiding local hazards is as important as a well organized first response.
1http://techcrunch.com/2010/06/08/twitter-190-million-users/[english,11/15/10]
7
2. Problem Discussion and Analysis - Human Sensors
It might become even more important, when missing hygiene or contaminated water sup-ports the distribution of diseases, like the spread of cholera in Haiti 2010. Here, publicavailable information and documentation was needed to understand and avoid dangerousplaces and habits. Beside the media, citizen actively reported local hazards and helpedto get a complete picture of the disaster by using crowed-sourcing tools like the rapidlycustomized reporting tool Ushahidi[Zook et al., 2010] in the 4636 project[Munro, 2010].With Ushahidi everybody who owns a cellphone could report an incident by sendingan SMS, with description about the local context and class of incidence. The plat-form became the most universal and relevant information resource, which helped to savehundreds of life’s. Nevertheless for foreign helpers language barriers and a lack of under-standing the local context limited this approach somehow in first place, which eventuallybecame compensated by a volunteer translation effort - Haiti Creole to English. Thenit was possible to re-feed the sent messages to the geo-information map, which was usedmainly by international organizations. Later a local Haitian2 solution replaced Ushihidato support the Haitian economy.
Urban Management
PS in urban areas has two special conditions: communication infrastructure is well de-ployed and a large group of participants (social sensors) are willingly to participate. Onthe other side a vast of public applications are reasonable in the urban space, because ofthe density of social and economical demands. We will focus on two kind of applications:surveys and public transport organization. We assume that similar problems could besolved in developing countries as well or even with higher participation, where a higher de-mand for urban and social service exists due to a lack of official public service alternatives.
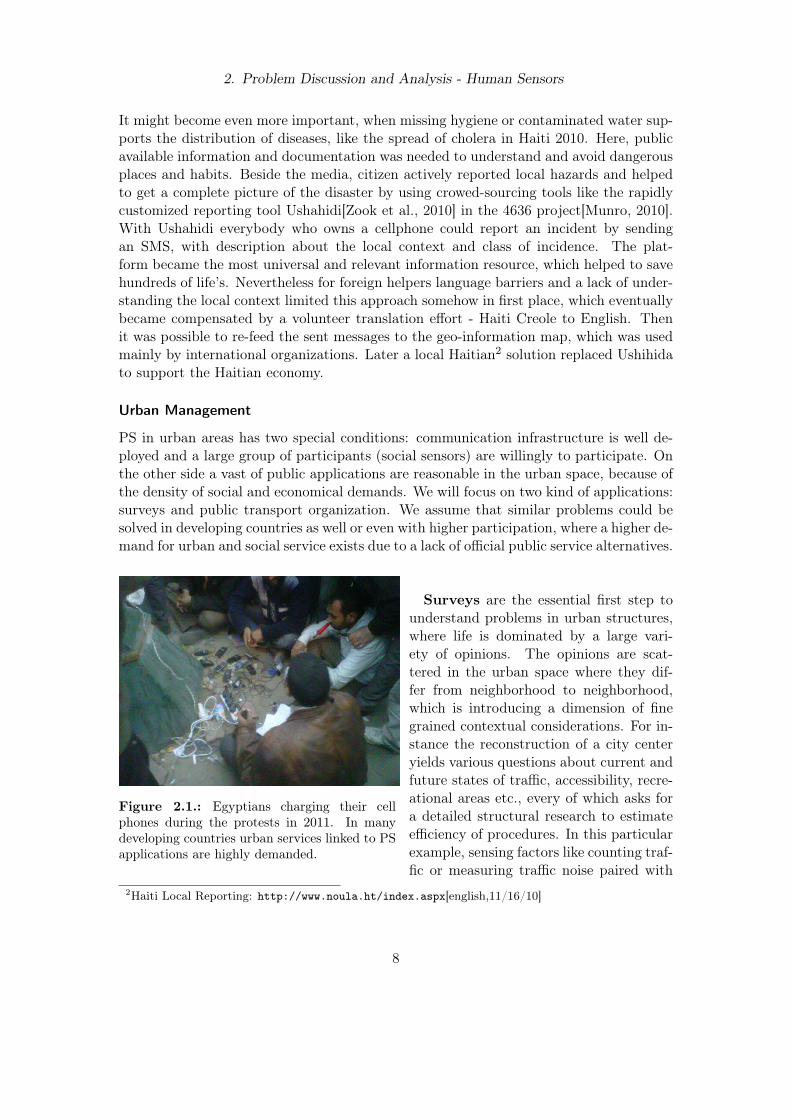
Figure 2.1.: Egyptians charging their cellphones during the protests in 2011. In manydeveloping countries urban services linked to PSapplications are highly demanded.
Surveys are the essential first step tounderstand problems in urban structures,where life is dominated by a large vari-ety of opinions. The opinions are scat-tered in the urban space where they dif-fer from neighborhood to neighborhood,which is introducing a dimension of finegrained contextual considerations. For in-stance the reconstruction of a city centeryields various questions about current andfuture states of traffic, accessibility, recre-ational areas etc., every of which asks fora detailed structural research to estimateefficiency of procedures. In this particularexample, sensing factors like counting traf-fic or measuring traffic noise paired with
2Haiti Local Reporting: http://www.noula.ht/index.aspx[english,11/16/10]
8

2. Problem Discussion and Analysis - Human Sensors
user opinions may unveil that citizen are more unhappy with a current noise protec-tion than the lack of parks in a certain area. Conventional surveys, as pushed by citygovernments, have two major drawbacks: cost and time-dependency. Cost is always abudget problem, whereas time-dependency results from the difficulty of repeatability.To repeat surveys may be inconvenient and time wasting for the citizens and expensivefor the government, but in order to measure the subjective efficiency of a project it isessential. So the task is to introduce annoyance avoiding methods, adapted to the lifesituation of the citizen, which are repeatable, but not time wasting. Smartphones withall their sensing capabilities could introduce a simple and cheap tool for urban manage-ment, which may also result in a raise of citizen participation and in quicker and cheaperresults. For instance the Brandenburg Maerker Project3, a community platform whichfocuses on citizen’s reports about any damage or enhancement in their region, yield agreat response in participation. But it was not mainly for the democratic participation- which would not be anyway different to other report schemes - but due to an instantview of all reports on a map with an official notification and status report of the relevantadministrative office.
Another class of applications in urban life, which vastly profits from PS, is trafficand public transport. To report police using mobile radar, fuzzy bus schedules, detectbottlenecks in transport, organize commuter-communities, or recognize bicycling routesare just a few possible benefits. An example for such an application is shown by Reddyet al. [2010] with Biketastic. With Biketastic bicycle commuters report about new foundroutes and street quality with their smartphones and the build-in accelerometer. The ser-vice enabled public access to the routes and a quality comparison on features like slope,asphalt quality or traffic conditions. The data collection was performed by the partic-ipants aided by their smartphones, which recorded a GPS track and sensed the streetquality based on the phones sensors. In post processing, participants could annotate thetracks with additional information, such as traffic condition.
Culture Management
Sensing in cultural context can express a cultural or artistic view, or document a culturalvaluable habit or property. The most important mediums used in such applications arevideo, audio and photo, and therefore natural or artistic processes become projectionsonto data. These data does introduce some difficulties based on their properties. Forinstance video and audio work inhabit a vase of layered-informations depending on thetime, place and point-of-view, which makes it difficult to automatically classify and verifydata. Captured data as described transport the surveyed environment to other places,where others may re-sense information (in a different time/place context) manually byreviewing it. But in general it is difficult for machines to interpret these data, as an resultextracting reusable information is based on the viewers context. Therefore applicationsneed to enable certain pre- or post- processing functions on the captured data, involving
3Brandenburg Maerker: http://maerker.brandenburg.de/[German,11/17/10]
9

2. Problem Discussion and Analysis - Human Sensors
either high device processing power or community work, in order to transport or attachcontextual preconditions. The popular social network Facebook with approximately 500Million users inhabits all of the mentioned aspects. Users upload data (image/video) andapply annotations to it by providing time/place and social context. Afterwards otherusers can add or correct social connections and contextual information in the images andby doing so opening the data to all involved participants of the social event. The benefitfor the user is the joy and pain of being identified in certain interesting situations and sogaining popularity in his/her social circle. Whereas the benefit of Facebook is a detailedand well exploitable profile of user behaviors. Another interesting work is “Finding PathThrough the World’s Photos” from Snavely et al. [2008] in which they use a huge amountof uploaded photos from Flickr about a certain famous sight (i.e. the Statue of Liberty)to generate a browsing application which allows users to walk around and explore thesight virtually and seamlessly. With this finding it is possible to reuse a library of alreadygathered data and provide a meaningful visualization.
2.1.2. Lessons
From the above discussed examples about participative data collection we can identifyfollowing common design principles:
• Application-design is different for underlying infrastructure conditions. Whereinfrastructure means telecommunication networks or structural processes. If oldcommunication is sufficient enough, it is difficult to establish new communicationmethods, even if they promise to be more efficient. So it is more promising to reuseestablished methods like SMS, internet or cellphone communication to succeed ina participatory project.
• Since collecting data is an ongoing task for the participant, sensing applicationsmust be integrated into the daily life or work routines, where the process of col-lecting data does not waste the participants time.
• Responses or reports about the role of the collected data is a trivial, but a vitalpart of voluntary participation. Providing quick reactions, progress updates orinstant views for submitted data is an important motivation to make the userunderstand his/her role in a project. Also transparency eases the frustration aboutthe sometimes slow project progress.
• Communication is a two way process, where sensing is initiated by the participantor by the project management depending on the project definition, which mightrequire to query for data in a specific context. Hence communication tools mustensure connectivity or application-context awareness.
• Data collection always happens in context. For most of the tasks place and timecontext are usually sufficient, however more detailed sensor data can introduce ahigher relevancy also for reuse of the data in other arbitrary projects. Therefore
10

2. Problem Discussion and Analysis - Human Sensors
providing a generic sensor interface to the collection tools makes it possible tocollect information about the context as detailed as possible.
• PS is usually a local, in field collection task. Communication should meet thismaxim; whereas some applications might depend entirely on pre-existing infras-tructure, others will need to communicate on an ad-hoc or alternative basis toovercome the lack of infrastructure.
• Participants are usually more than simple data collectors, they might be involved onvarious layers of the whole task. To avoid inefficiency through centralization thereshould be interfaces for quick response or pre-sorting to enable new mechanisms inorder to solve uprising problems.
• Users of participatory applications should understand their task intuitively. Sensingtools should meet accessibility requirements such as language, usability, habits orany other cultural precondition.
• Data-collection is entirely about how to reuse and enable access to the sensed data.Post processing and analyzing processes of collected data is therefore an essentialstep to transform useless bulk data to rich conclusions.
• Visualization makes PS applications useful and understandable, but different viewpoints may exist for the same data. To allow the visualization easy to changeand reconfigurable due to the user’s needs introduces a new layer of collectiveinterpretations.
2.2. Project driven Data Collection
The examples of section 2.1.1 showed that PS is a project driven task, where several layersof work interact with each other. The 4636 project (2.1.1) for instance was structured infour layers: reporting, translating/contextualizing, verifying and annotating; and in theend the visualization of the data. Finally communication was established between localHaitian reporters and emergency forces, and the first response management received anadditional source of credible information. Layered work sharing is a consequence of thenature of distributed projects, and on each layer personnel and participants are mappedto certain roles. Burke et al. [2006] identified four roles in a PS project:
(1) Initiators, who create campaigns and specify data collection challenges;(2) Gatherers, mobile users who participate in opportunistic data gather-ing that may be network-triggered, user-initiated or continuously captured,tagged and shared [...]; (3) Evaluators, who verify and classify collected dataon behalf of the campaign; (4) Analysts, who process, interpret and presentdata and conclusions.
Corresponding to Burke we identify four major process layers: the initiation, the collec-tion, the evaluation and the interpretation. The above mentioned roles interact on theselayers, as shown in figure 2.2:
11

2. Problem Discussion and Analysis - Human Sensors
1. In the initialization process protocols and project-roles are applied by the initiatorson collection-goals. The goal of the initiation is a static layout with a data protocol,terms and project properties.
2. After the initialization the gatherers collect and report the sensed data based onthe initiator’s protocol. In a single iteration gathering might quickly end or be along term repeating task, as for instance in health monitoring. In other applicationsquick iterations can be followed in change of the protocol, makes it more applicablefor a non-static situation.
3. After gathering data becomes verified, filtered and annotated by the evaluators, thisprocess introduces a variety of tasks: such as merging, abandoning, translating andstructuring the data. The additional information support the collected data, thisis helpful for a correct and relevant interpretation of the data in later steps.
4. Finally data will be visualized by generic maps and graphs, which represent theanalyzation and visualization phase. In this phase data from different sources getjoined and filtered to suit for visualization statements, which are the base to under-stand and interpret the collected data. The additional metadata, provided in thethird phase, make it easier to densify the output for quality aspects. The analyz-ers may also taking actions based on the data, i.e. start additional contextualizedgathering iterations or contact participants for additional information.
InitiationVeryfication
Gathering
Interpretation
Initiators
Gatherers /
Users
Evaluators
Analyzer
ProjectKnowledge
Protocol/ Rules
Sensed Data
VerifyedData
- collecting Data
- reporting
- claiming
- verification
- translation
- contexualization
- visualization
- secondary
actions
- re/designing
- role assignment
- continues sensing /
network triggered
Figure 2.2.: The circle of a data gathering project. Even the structure is sequential, processesoccur in parallel, especially verification and interpretation, quickly follow data collection. Thementioned roles are abstract and it is assumed that for instance verification and gathering migthbe done by the same group op participants.
12
2. Problem Discussion and Analysis - Human Sensors
The project structure is partially comparable with an Extract Transform Load process(ETL) for processing and transforming large data quantities into a Warehouse process.In ETL data is first extracted from a raw data source, than applied to transformationsand data cleansing, and finally loaded to a target data table, where it suites the businesspurpose of the target system. In contrast to ETL manual, actions are required in aPS project. The data is extracted with the help of participants, verified manually bythe community, transformed, filtered and enriched before being loaded for visualization.The last two steps are automatic and if no verification is required, as in a scenario,where all participants are trustful or data is only extracted by sensors (i.e. location andWiFi networks ), data may be passed through all steps and reviewed immediately in thevisualization.
2.3. Sensing the Context
Context is an implicit concept of all PS application and hence it is highly important.What is context, why it is needed for PS application and how to determine it? Context,as often used in the PS application examples (2.1.1), is data abstracted form the usersenvironment, especially geo-location and implicitly time. It is not surprising that space-time context is often used in projects gathering data in a certain location and time. Geo-location enables us to sort a certain tagged statement in a variety of social, geo-politicalor environmental contexts, determined by common knowledge and so being the only mostexploitable information. Geo-location however is not always the necessary abstraction ofthe desired context/ Social background, like income or work-specialization could be moreuseful for political polls, to know if a participant is running or walking can be useful forhealth monitoring. But since geo-location can be automatically determined everywhere inthe world, makes it an universal accessible information for most PS applications. Whereassocial or complex context data must be manually provided or intensively measured. Alsocontext is mostly not the core of the desired information, therefore to determine contextshould not introduce additional tasks to participants. That is why it is desirable touse known or easy detectable network and automatically sense data with the collectiontools. For geo location information it is already a common practice to reuse networkdata, like cell tower ids and WiFi base station ids to classify the location of the user.Other concepts, like determining the social “floating” environment may be extracted fromBluetooth ids or ZigBee. Such concepts are discussed in 2.7.3.Using context data in PS applications enables structural and process benefits as for
instance shown in the fire station example (section 2.6). Here, generating maps - astructural feature - and triggering secondary actions - a process feature - are two examplesfor such benefits. Another structural aspect is that additional not know or unclearassumption can be concluded from contextual data. A simple example may be providedby extending the oil spill scenario 6.1 where users need to count wounded and dead
13

2. Problem Discussion and Analysis - Human Sensors
animals for Request 2. While classifying the area participants are looking at the sceneand hence their view-angle, extracted by the device compass, could to be taken intoaccount, so that more accurate assumptions about the situation may be drawn, suchthat the sensed number may be mapped to a more restricted area.
2.4. Privacy
For the sake of participant to system binding, where users work on several layers of aproject, user identifiers are useful for credibility estimation and project specific responses.But combining context-aware responses and unique user identifiers provides a huge poten-tial to exploit the privacy of participants or to weaken the fidelity of a project. Providinga complete discussion on privacy however is out of scope, but here we will address majorsecurity problems of PS applications.Users are often involved in providing data about certain subjects, thereby they log
a detailed tail of their movements or opinions on the system-side. This informationmakes it possible to track participants. To prevent context logging, user identification- necessary for exclusive participation - should be separated from project specific useridentifiers, or excluded from content logs.Project specific identifiers may be nevertheless linked to the sensed data for estimation
of participation or credibility score, which is an important quality assurance process.Since it is difficult to estimate the reservations of participants, such linking must bevoluntary and by default op-out.Data transport security is an issue as well, but on the one hand already well investigated
for many implementation specific aspects, as for instance HTTP based communication,which could be secured with SSL encryption. And on the other hand data transport se-curity is difficult to establish, as for instance with SMS communication, which introducesa third-party provider, capable to read messages and identify the sender easily. In thiscase pre-shared-key encryption may partially solve this problem, but nevertheless SMSwill always be a not privacy aware communication.
2.5. Data Interpretation
Data views are the interpretation layer in the project lifecycle (2.2) handled by analyzers.Here data is transformed in statements matching the projects goal in different faces likegraphs, images, maps and reports. The analyzation process may only involve a simplefiltered statistic view of the collected data, or a complex calculated interpretation ofit (context section 2.3). Projects, even with different goals, will use similar views allover, just with little modifications in layouts. Hence it is desirable to design and rely oncompatible generic data and view interfaces.We identified three kind of generic views which may depend on each other:
14

2. Problem Discussion and Analysis - Human Sensors
• Data or statistic tables: data tables are the raw view of the collected data, withonly applying filters and merging actions changing the shown result. Filters aregenerically speaking all restrictions applicable on the data type domain and mergingdata tables provides additional links to obscured identifiers. Whereas statistictables are statements about certain subsumed data. A statistic table is introducinga new source of information reusable for other views.
• Graphs are a visual sink for data, showing data in relationship to each other,sketched on 2 or 3 dimensional views. There is a vast diversity of graphs fromannotated timelines to simple pie charts fulfilling this definition. But in generalall kind of graphs are based on data rows iterating about a certain aspect, as forinstance time.
• Maps are a special sub-group of graphs. In maps information are projected on atwo-dimensional geographical view. They are the most important visualization oflocation dependent data, which is used in the majority of PS projects. Showingpoints or areas of certain interest requires a vector containing latitude, longitudeand eventually altitude values.
Those three basic views may be filtered and designed to match a certain style, but theunderlying data is always represented by one dimensional vectors, with certain specificfields, like location and time. Based on this approach, views and chart libraries maybe quickly adopted to fit arbitrary data-sets. The resulting interpretations are highlycustomizable to the needs of users, by minimal property or formula modification,. Henceusers may even change and adopt the view-point to better understand a specific problemand then share and comment user view-points.
Data Manipulation Chain
Figure 2.3.: Data manipulation chain for a configurable visu-alization.
Taking an open approach on the data asa table of data vectors, visualization mayresult in just plugging component togetheras seen in figure 2.3. Data is basically han-dled by template processes with interfacesfor certain values, like numerical or geo-spatial data. Each instances apply manip-ulations to the data tables based on anminimal user configuration, resulting in aindividualized view, in which (1) providesa restriction API for privacy/access and
for data selection, very much like the SQL SELECT command . (2) transforms/ normalizes/ subsumes data fields based on generic scripts and (3) merges tables and filters entries,similar to CREATE VIEW , in order to provide the resulting table to view elements, likedefined above. User only interacts with certain SQL like commands and apply minimalprogrammatic scripts, like known from spreadsheet calculations on the data.
15

2. Problem Discussion and Analysis - Human Sensors
2.6. Project Interfaces
Remote Project
Context
Own Project Context
initiation gathering verification interpretation
initiation gatheringAction in
Context ...
Data
Classification
User/Auto Trigger
User/Auto Trigger Verification
Figure 2.4.: Triggering actions in the same or anotherproject based on either classified data or on auto triggers.
PS projects follow the goal to understandand sense an unknown or difficult to per-ceive subject. In contrast to a completein-field operation, data gathering is onlya single-way process which must be suc-ceeded by actions. PS is important to formthe basis for such an actions, but coor-dination still an operator’s task, and is aseparated and complex task, which is nota focus in this work. However interfacesto coordinate data gathering inside sens-ing projects are desirable in order to reusethe already intensive focus on data anal-
ysis and the device capabilities to execute remote orders. Such a mechanisms may bemodeled as followed: while verifying and sorting data in the evaluation process, dataclassified in urgent categories follows immediately actions, like contacting personnel incharge. These actions may be forwarded to a proxy organization, where responsibilitiesare coordinated. Such organization will benefit from provided contextual information tohelp to coordinate the staff which is already on the spot. Assuming that the second orga-nization is also gathering data for a different but quiet similar subject, both organizationsmay profit from interacting with each other. The second organization would receive anotification for a possible relevant data collection and the first organization a implicitverification method, sketched in figure 2.4. Action are triggered either by a matching ruleor by a manual user action. The automatic rule based decision process however involvesdetection of anomalies and data classifying in a single or a batch of data. Such tasksmay be achieved by learning or classifying algorithm as used in the Weka framework4,which however is not performing for large data quantities. Involvement of participantsfor manually triggering eases the conceptual design and keeps the decision process rea-sonable and under the control of the project. In such scenario users conduct actionsupon the data, like tagging or rating, and by doing so also provide metadata for directtriggering. The triggered action may be consumed immediately or stay sticky till a cer-tain condition is fulfilled. Immediate consumed actions are for instance notifications to aremote project (since they are not dependent to an own participants context). And rel-evant PS conditional actions which stay sticky till fulfillment are time-place dependentconditions. The time-place conditions are evaluated against the participants context,hence the participation statistics and the geo location and movement of the participantare involved.An example for this interoperability could be pictured in a forest fire situation: an
4http://www.cs.waikato.ac.nz/ml/weka/[English, 03/12/11]
16

2. Problem Discussion and Analysis - Human Sensors
voluntary reporter senses smoke over a certain area, while driving through it. He re-ports this emergency based on a generic protocol which includes any kind of hazardsand the current location. His report is going through the systems chain as describedabove. During the verification, the keyword fire triggers an urgent action, which notifiesan voluntary-fire-fighter umbrella organization, which automatically issues an Request toa station close to the area. The fire-fighter in charge is then driving to the area andconfirming the fire by answering the Request. The answer is automatically increasing thevalue of the reporter’s first statement. Then in the analyzation phase the first organiza-tion updates its maps, and triggers a notification to a close radio station, which reportsthe fire. A more specific and detailed discussion of using conditional triggers is discussedin the oil spill scenario 6.1.
2.7. Mobile Devices as Sensing Tools
Conventional sensors are maybe accurate and usually unfailing once deployed, but staticdeployment and single purposeless makes them useless for dynamic applications, like inPS Projects. Mobile devices however like smart phones and mobile computers eventuallyprovide not as accurate, but still relevant data from its sensors like GPS or compasssensors. They are highly customizable in order to provide data from its smartest andmost universal sensor: the human controlling the device. On the one hand such devicesprovide great capabilities for input, display, notification and context-awareness, but onthe other hand drawbacks for using all their features frequently and everywhere. Firstwe will look on its capabilities for data gathering in PS applications and then analyzeproblems and potential solutions. Android smart phones are the main focus in thisanalysis, since features and capabilities are well accessible from the engineering point ofview.For in-field operations or community based PS tasks strong computation and com-
munication capabilities enables smart phones to fulfill tasks autonomously with no userinteraction. In particular the framework build around an Android smartphone allows toschedule future tasks and background computation, while being able to access the sensingand communication modules and provide an persistent application model, where compu-tation states may be preserved even over shutdown times and communication lacks. Thisis interesting for collecting samples over long terms, like WiFi networks or position tracks,which is discussed in paragraph 2.7.3 and also for transporting messages asynchronously,with no stable internet connection or even ad-hoc between mobile devices (paragraph2.7.1). Also collecting data in order to sense an expected and static context, pre definedwithin the PS collection goals, may allow users to sent dynamic and context-aware queryand therefore provide relevant reports to the system.The dedicated inter-application communication via Intents in Android allows to build
extendable applications supported by existing modules. Such extensibility may be re-flected by the communication protocol to request data from different applications and bydoing so extends sensor capabilities, like a heart beat monitor accessed via Bluetooth orBLE (Bluetooth Low Energy), and in some cases via the USB-host function. The basic
17

2. Problem Discussion and Analysis - Human Sensors
hardware setup is complemented by excellent input and displaying capabilities (see 2.7.2).It enables the input of arbitrary data and provides assistance to understand and validatethe data, while using the large screen and rich visualization to display the outcome ofthe collection.
2.7.1. Infrastructure Limitations and Opportunities?
Most smartphones relay on plenty of communication capabilities for phone calls, inter-net access and peripheral device access (like headsets). In a non-disaster situation inurban developed areas two way communication between a server system and the deviceis guaranteed. Many PS applications are defined and rely upon such context, hence com-munication is synchronous and acknowledgments arrive immediately. In such a set-updevices may report proactive context changes, such as entering in a specific area or asocial context (sensed via Bluetooth neighbors), and so updating the server based clientmodel, which may be exploited for server side decisions in order to contact the devices.Push communication allows sending messages directly to the client and hence trigger-ing actions on the device. This may be used for querying a user for reporting abouta context-dependent subject, for signaling recent changes about an outcome or to alertuser for urgent actions or caution. Using remote queries allows to restrict data flow anduser annoyance to relevant queries, and provided - in contrast to static local rules - ahigh-level access to data collection. Push notification is unfortunately not always avail-able, like with poor deployed infrastructure, and since PUSH requires a long term openedTCP socket such connections may not be possible. In such case different approaches maybe deployed, like transporting queries piggyback on context updates or using SMS forsignaling.But outside of the usual deployment, devices may not be able to even access an GPRS
internet connection. In that case it is possible to backup on an shortened communi-cation protocol and use SMS as communication medium [Colbrant et al., 2010]. TheRapidandroid project extends the RapidSMS UNICEF project, showed such a reliablecommunication based on SMS and also showed the capabilities for Android as universaldata input and transport device5.But what if infrastructure collapsed completely and even SMS communication is not
feasible. In such scenarios communication may be vital for the general public, as forinstance for information about where to access clean water sources or if diseases arebreaking out. Store and forward communication based on DTN is a solution for sucha scenario. With DTN messages are wrapped in bundles and those are stored till anacknowledgment arrives and that the data reached the target address. During that time,the device tries to forward the bundle to another passing-by device in its range. DTNas for instance implemented by the Haggle project opportunistic leverages all ad-hoccommunication, like WiFi or Bluetooth and so data may be transmitted over short orlong range. When a copy of the originated data reached its target an acknowledgment istransported on the same way back, and signals to stop further distribution Nordstroem
5http://rapidandroid.org/[English, 01/31/11]
18

2. Problem Discussion and Analysis - Human Sensors
et al. [2009][Kannan et al., 2010].
2.7.2. Input Methods
Some hardware sensors, like the accelerometer, the orientation sensor and the microphonemay assist the standard input methods by screen or hardware buttons, neverthelessconcepts of touch input are not fully exhausted with default mobile devices. Such differentuser interaction concepts may provide certain comfort in-field operations by driving theuser away from screen interaction or non flexible input methods.User interaction on mobile devices is mostly done through soft or hardware keys,
which follow the concept of a standard keyboard. It is flexible in respect to some inputlayouts, like for numbers or web addresses and might be customized for a desired countrylayout. However the concept is always forcing eye focus to the display and inherits typingdifficulties from the small button sizes. In this case human interaction does not meanthat the user interface is build for human needs, but for devices control. In considerationof the fact that such mobile devices provide plenty of input methods, beside of directlytyping, this is highly insufficient. In-field operations may benefit from well supportedspoken language tools, like the text-to-speech (TTS) generator and the Google speechrecognition. The Eyes-Free project6 showcases the capabilities of using TTS for variousapplications and to control the phone. For instance the Eyes-Free Shell provides aninterface to control all launcher operations, like launching apps or making phone callswith no eyes focus on the screen. The shell is using an minimal keyboard, which isaccessed by touch and swipe gestures anywhere on the screen, whereas any letter andchosen menu uses TTS and vibration for indications. After short training the shellbecomes efficiently usable. In an in-field scenario the eyes-free concept may allow usersto stay focused on their current task while quickly answering a request by small gesturesand voice input, the immediate voice feedback reassures that correct input was provided.
! arg min "" ""#, s.t. Y = Q$ + (8)
where = W .
Recall again that the acceleration waveforms constitute of three signals: in the x-, y-, and z- directions. Therefore, when applying the above formulation to the gesture recognition problem,
will be in fact three vectors, R will be three matrices and will be three vectors. Since is of three vectors, then
! $ %$ % (9)
For user-independent recognition, s that belong to the same user for the same class are added together as well, and then the the class with the highest is recognized as the correct class.
3. PR O T O T YPE IM PL E M E NT A T I O N
The acceleration data corresponding to the different gestures is collected using a Wiimote, which has a built-in 3-axis accelerometer. A gesture repetition starts by pressing and holding the "trigger" button or "B" button on the bottom of the remote and it ends by releasing the button and thus the problem of gesture spotting is solved.
3.1. Gesture Vocabulary:
A dictionary of 18 gestures is created as is shown in figure 1. Our dictionary of gestures is the largest in published studies for accelerometer-based gesture recognition systems. The defined gestures are not limited only to one plane as is the case in [6][7], but span the two planes: XZ and YZ planes. Each gesture is referred to as a class and each run of a gesture is referred to as a repetition.
Figure 1. The dictionary of gestures created with 18 classes.
3.2. Gesture Database collection:
The database consists of 3,780 repetitions and is built by acquiring gesture sequences from 7 participants (2 females and 5 males) using the Wiimote. Each participant is asked to repeat each class 30 times resulting in a total of 540 repetitions for all classes per participant or a total of 210 repetitions from all participants per class.
All participants are asked to keep the remote straight because the remote and, in turn, the accelerometer can be tilted around any of the three axes. The acceleration waveforms from the same person corresponding to a class can differ drastically if the
accelerometer happens to be tilted differently each time. We have already started looking into the issue of tilting however it is not yet taken into account in the current version of our gesture recognition system.
4. SIM U L A T I O N & R ESU L TS
4.1. T raining Phase:
The training phase is the first main phase in our proposed gesture recognition system and is depicted in figure 2.
Figure 2. Training Phase. User Dependent Training: The training set is created by
randomly choosing M repetitions from each class. All the chosen repetitions are then temporally compressed in order to remove any noise that might have been added by inevitable hand shaking or remote tilting. DTW is then implemented to find the similarity or the cost between each two repetitions and thus forming the similarity matrix S. Next, AP works on S and partitions the training set into different clusters each represented by an exemplar. AP in the case of user-dependent recognition is forced to partition the data into N clusters where N is the number of classes in the dictionary. In other words, all repetitions pertaining to one class form one cluster. As a result, the output of the training phase is a set of N exemplars, one for each class.
User Independent Training: The training set is created by randomly choosing M repetitions from each class from K users only, resulting in a total of KM repetitions from each class. Again, all repetitions are temporally compressed for noise removal and DTW is implemented in order to produce the similarity matrix. Next, AP is run in order to partition the repetitions into different clusters. However, in this case, although AP is forced to create a cluster for each class, it doesn't succeed and consequently, repetitions from one class can fall into different clusters. Yet, repetitions from the same user for a class always stick together in one cluster. In other words, a cluster doesn't necessarily contain repetitions from the same class anymore but may contain repetitions from other classes and other users too. As a result, exemplars of all resulting clusters are stored and thus the output of the training phase is an arbitrary number of exemplars which are not distinctive to each class.
4.2. T esting Phase:
The testing phase is the second main phase in our proposed gesture recognition system and is depicted in figure 3.
Figure 3. Testing Phase
Figure 2.5.: Tabel of 18 possible gestures[Akland Valaee, 2010]
Another way of answering Request couldbe achieved by using the accelerometer,orientation and the gyroscope for gesturedetection. The high sensibility of this sen-sors allows to map physical gestures to ar-bitrary input. The best example of suchcontrolling is the Wii Remote - a ges-ture based game controller, which controlsgames by tilled, rolling and moving theremote in space, and then applying ac-tions to the game context. Android de-vices may inhabit the same functionality,to assure the application context and byusing a framework for gesture recognition,in order to map the continues sensor data
6http://code.google.com/p/eyes-free/[English, 01/28/11]
19

2. Problem Discussion and Analysis - Human Sensors
to context-dependent gestures. Wiigee7 - an open source gesture recognition frameworkand its android port andgee8 - showed that user independent gesture recognition is fea-sible on Android, and studies showed that sets of 18 user-dependent gestures, as shownin figure 2.5 may be recognized with an accuracy of 99.7% [Akl and Valaee, 2010], whileuser-independent gesture recognition may achieve an accuracy of 87.36%[He et al., 2009]based on a cell phone accelerometer. An simple example for such interaction is an in-fieldclassifying task, where a user needs to count and classifying objects. In such scenario thephone may be shook vertically in different angles to count and classify objects.The camera is another well suitable input method for in-field operations. Especially
computer vision (CV) methods could help to recognize data in images. In the CV fieldof studies many recognition problems, for example face or object detection, are wellresearched and implemented using OpenCV, an open source library, which has beenfortunately ported to Android. An simple example could be classifying public buildingsfor color-blind accessibility, by walking along the building and using the camera to findspots where for instance green and red labels lie close to each other. In such scenarioscollecting data from images is to filter the image for a single information, so that most ofsuch application are bound to a specific questions. One of the more generic applicationsis a barcode scanner, which may scan 1D and 2D (QR) barcodes, which allows a quickentering of long numerical or textual data.
2.7.3. Sensors and Context sensing Capabilities of mobile Devices
The processing power of an common smartphone as for instance a Nokia N7, an iPhoneor most of the Android phones is adequate enough to autonomously fulfill complicatedtasks. The kind of tasks may compensate missing preinstalled hardware capabilities,shift complex sensing to the CPU. Additionally sufficient memory is usually available forstoring and retrieving pre-computed results. Finally physical sensors like shown in table4.2 provide raw data, which could be cumulated and processed to higher level sensors, alsocalled virtual sensors (4.3.1). The CenceMe [Miluzzo et al., 2007] project followed thisapproach and implemented various sensors in order to understand the physical and socialcontext of the smartphone users. The sensors included movement or scene detection byusing the accelerometer, camera or microphone. In the following we will discuss someof the sensors capabilities, which PS projects may take advantage of. For other sensors,subsuming data is not useful or necessary in preprocessing on the client, this data isalready reflecting a dense state, and may be directly exposed and exploited, which makesthose data more flexible to interpret.In the CenceMe project it was necessary to gain information about the current user
status, which may be classified by the users voice activity, respectively talking or nottalking. For that reason periodically audio samples are collected and classified by thetest phone. The audio classifier is based on a supervised learning algorithm, whichclustered voice and noise samples based on the spectrum of power consumed in at aspecific frequency. The algorithm was optimized for the human voice band at v250Hz
7http://www.wiigee.org/[English,01/31/11]8http://code.google.com/p/andgee/[English,01/31/11]
20
2. Problem Discussion and Analysis - Human Sensors
to v600Hz. The clustering features have been based on the standard deviation and themean deviation of the power distribution. The result was a quick and efficient audioclassifier, which could split common noise activity from voice. This kind of sensor maybe used for user activity measurements, communication statistics, gender or age specificmeasurements and also for sound meters, in order to determine the noise pollution ata certain area. Such a sound meter is even easier to implement based on the soundpressure level (SPL) calculation, which basically calculates the logarithmic SPL metricby determining frequency and amplitude from a microphone audio sample using a Fouriertransformation. Unfortunately, the SPL depends on the device capabilities and must becalibrated before returning meaningful results and smartphone microphones are usuallyoptimized for the human voice. Hence its maximum SPL may only represent the soundof busy traffic.Sensing activity, like standing, sitting, walking or running, was also showed in the
CenceMe work. The activity detection is based on a precomputed J48 decision tree,which was build by several collected samples. The classifier accesses a database of fetchedaccelerometer data for the tree axis and then filters it Based on the mean and standarddeviation. The algorithm based on the resulting attribute vector can then differentiatethe users state of movement. Such sensors help to understand the postures, activity andintensity in which users are involved, nevertheless the classifier must be trained subjectdependently in order to achieve over 90% accuracy, and additional sensors, like heartbeat meters are needed [Tapia et al., 2007]. But for the simple movement detection as inthe CenceMe scenario the data of the single accelerometer achieved the desired results.A Bluetooth scan may exposes the current social and mobile state of users by comparing
similarities of previously detected Bluetooth RSSIDs. Social relationships and the usersrelative social location may be estimated. For example, it might be possible to estimateif a users is frequently meeting friends or known person (if the similar RSSIDs are shownoften). This sensor data is useful either as a cumulated preprocessed state or as a singlepicture depicting the current context and hence exploited in post processing.The GPS receiver may obtain the current location, which is probably the most impor-
tant sensor for PS applications. The data is frequently used in order to determine thegeo-location/ -social and -political context, so that the relationship between participantand sensed object may be concluded. By collecting location data over time a movementpattern, speed and distance may be processed on the phone.Sensing WiFi networks can reveal a part of the current communication infrastructure
the user is located in. Location services like Skyhook or the Google Location serviceare already exploiting the fact that WiFi hotspots are statically deployed and long timemaintained, in order to provide location estimation via triangulation. So that data mightbe collected and such database build up for the same reason (as for instance in-doorlocalization) or for measuring the quality of provided infrastructure. Security statisticsabout open or not well encrypted WiFi networks may assist scientific and maintenancework.The orientation sensor provides an effective prediction of the users orientation to sup-
port queries, which may relay on the user’s viewing angle . In such case taking picturesor counting object is annotated with the relative orientation (by assuming the non-
21
2. Problem Discussion and Analysis - Human Sensors
peripheral average human field of view of 140˚), hence more accurate assumptions maybe drawn about the data context.
22

3. Related Work
In this chapter we will introduce the related concepts to our work, which is coveredby three main topics: First the formal concepts of participatory sensing applications,second the recent relevant applications driven by user participation in the area of disas-ter relief and political documentation, and the third topic is the sensing capabilities ofsmartphones.
Participatory sensing Participatory sensing and its fundamental principles based onmobile devices is introduced by Burke et al. [2006]. Burke sketches the Partisan frame-work for mobile distributed community sensing, with important considerations for publicneeds, anonymity and constraints upon mobile devices and new analyzing tools. Theworks’ motivation, for community and citizen sensing based on mobile devices, arises fromfour sectors: public health, urban planning, cultural identity and creative expression, andnatural resource management. It is suggested that common architectures/technologiesbased on public infrastructure are needed to support campaigns inside those sectors. Onthe network and operator level new algorithms for verification, naming, disseminationand aggregation are needed, very much like DNS or network-layer identification for mo-bile nodes. Then any collected data must be seen inside its place-time context, hencegeo-data and timestamps will be the most important analyzation and verification fac-tor, thus the network infrastructure needs to provide methods for context determination.Using ubiquitous mobile devices it is possible to sense rich physical context information,like audio, video or orientation data, which enriches the context, and enables broadersensing capabilities. And finally it is proposed that users should be able to control theresolution of data, based on rules, for privacy.Partisan is described as a “grassroots sensing” architecture, where bottom-up infor-
mation gathering is accomplished or enabled through public campaigns or peer-to-peerincentives based on the network infrastructure, with the base assumption that participa-tion is increasing the quality of data, in the sense that reporters are citizen and so, beingcloser to the context. Campaigns, meaning a project from gathering to interpretation ofdata, are described as a multi peered concept, where certain roles are defined: “(1) Initia-tors, who create campaigns and specify data collection challenges; (2) Gatherers, mobileusers who participate in opportunistic data gathering that may be network-triggered,user-initiated or continuously captured, tagged and shared [...]; (3) Evaluators, who ver-ify and classify collected data on behalf of the campaign; (4) Analysts, who process,interpret and present data and conclusions. ”.
Micro Blog An implementation of a user centric participatory sensing application wasrealized by Gaonkar et al. [2008] in the Micro Blog application. Micro blogs are location-
23

3. Related Work
aware documents, based on a mixture of human-sensed data and automatic retrieveddata from smart phones. While running the Micro Blog application on a mobile phone,its current position is reported to a web-server. A web interfaces allows to access themobile users and ask an explicit context-dependent formless question. The question ispushed to the device via SMS and the user may answer it on-site. Proactive reports, andthe dialog based on the location, are forming a Micro Blog, available over a web view andfor other mobile devices through a channel view. The concept allows creating locationannotations and querying users for informations remotely, by using human language,hence maximizing context-awareness, and leverage human capabilities as sensor input.Further more the work describes design principles of energy aware mobile applications,by optimizing position estimation, while minimizing system activeness. The proposedstrategy is based on a multi mode position estimation, where WIFI , cellular-id and GPSare mixed to estimate an optimal energy efficient estimate. The work concludes thatcell-phones are people-centric sensors, extending web services with information telescopesreaching out to the real world.
Ushahidi Ushahidi, which stands for "testimony" or "witness” in Kiswahili, is anopen-source crowd-sourcing project created in 2007 after the elections took place inKenya. After the elections violence broke out and the government banned live-mediaand mainstream-media censored it self, so no source of public information was available.In this time Okolloh [2009] evolved the idea of a news portal where citizen could filereports anonymously. Under the circumstances Ushahidi evolved as a rapid developedproject; showing incidences on a geo-location map, filed by SMS reports or by an anony-mous web-form. Ushahidi helped to establish an additional information source with veryrecent information and helped to document and understand the course of events. Fromtheir first experience the Ushahidi team had to overcome reliability problems with falseor malicious data, that may conclude a different picture, and provoke even serious con-sequences. Thats why data had to be checked and confirmed before it was published byreliable reporters to confirmations, this introduced another layer of service interaction,in which external personal or local civilians helped to sort, translate and rate the re-ports. Under a positive impression of the impact of the geo blog, the software was opensourced and continuously developed as a geo-reporting tool. The Ushahidi project con-sists now of three related applications, including SwiftRiver1, Crowdmap2 and Ushahidiitself. SwiftRiver is a collaborative data mining and filtering platform for real time data,which provides APIs to import data from sources like SMS or twitter, run applicationson it including collaborative tagging and filtering (Sweeper) and to export the data tovisualization applications like the Ushahidi map. The Crowdmap is the free deploymentplatform, where Ushahidi project may be created instantly for any purpose with a genericmap view.In 2011 Ushahidi projects are used for different events reaching from mapping crime
1http://swift.ushahidi.com/[English,02/18/11]2http://crowdmap.com/[English,02/18/11]
24

3. Related Work
delicts in Atlanta3 to monitoring elections in Liberia. The most discussed value ofUshahidi was seen during the earthquake disaster in Haiti 20104. A joined effort ofthe 4636 SMS reporting project and Ushahidi helped to document hazards by citizen re-porters, and provide urgent information to helping Teams. The project won the re:publicaprice 2010 as the “Best of Blogs”5.
RapidSMS - UNICEF Innovation RapidSMS [2010] was developed by UNICEF inno-vation as a quick and easy to install communication concept for rural areas with weakinfrastructure and in field operations. The system should ease UNICEF operations wheretimely and accurate informations are needed to carry out duties. RapidSMS is based on aSMS server, where users send SMS messages to, based on a predefined pattern, to informabout current emergencies or medical and supply status. The predefined SMS messagepatterns are similar to phone codes, with some additional variables for each message type,so any participant is capable to send such messages only by using a cellphone and with lit-tle training. As an example application using RapidSMS the ChildCount6 application isused to provide prevention and monitoring for children and maternal health. The systemsfocuses on 5 goals: Registration - all children under the age of 5 should be in a com-mon registration, screen children for malnutrition every 90 days, monitor for malaria andother illnesses, supporting to immunize children and to report all local births and deaths.To reach this goal a SMS gateway was configured for code mapping each of the goals, asfor instance new child birth would be entered in the form NEW LAST FIRST GENDER(M/F)which results in SMS like new diallo fatimata f 080408 Amie. The SMS are sent bya community member introduced to the system, which also measured health and nour-ishment facts. The system proved to be efficient for the set up goals, as participantslearned to use the system correctly and its impact for early identifying health risks. Asdescribed by Underwood [2010] RapidSMS follows the dual-use principle where commontechnology like cell-phone may be reused in disaster-relief situations to act as humansensors. In the case of ChildCount the system was also cost efficient and thus capable ofbeing used in rural and less developed area with undeveloped medical infrastructure.
CenceMe CenceMe is a smart phone based project, leveraging physical and virtualsensors in order to reflect the activity and state of the participating user, developed byMiluzzo et al. [2007]. The concept was shown on a Nokia N95, which was equipped,with accelerometer, camera, WiFi, Bluetooth and a GPS receiver. Sensor have beenexploited to deliver data for different activities detection: The accelerometer was usedin order to measure posture and walking activities, GPS for determining the locationcontext and movement, Bluetooth for detecting known neighbor CenceMe users, thecamera for detecting the current scene by shooting random pictures and the microphonefor recognizing if an user is busy in a conversation or in a busy spot. Some of the sensors
3http://crime.mapatl.com/[English,02/18/11]4http://haiti.ushahidi.com/[English,01/05/11]5http://www.heise.de/newsticker/meldung/re-publica-Best-of-the-Blogs-gekuert-978979.html[German,01/05/11]
6http://www.childcount.org/[English,02/18/11]
25

3. Related Work
like the accelerometer and the audio input are analyzed on the phone using classifiers,others like photos or position have been classified on server side, for performance reasons.Then by subsuming the sensor data to logical sensors, high-level context was detected, asfor instance if a user is on a party. The current activity state was exposed in a protectedprofile, indicating the involvement and presence of the participant, hence the physicaland logical detectable context.Miluzzo et al. [2007] discussed in his work the problems of implementing an applica-
tion leveraging almost all sensing capabilities and evaluated the performance and useracceptance in a study of 22 participants. Making it a reference to understand the de-ployment challenges, especially for classifying and transporting data in an energy limitedenvironment.
26

4. Framework Concept
For participatory sensing based on mobile devices three reflections as followed describethe architecture of the intended framework. How to obtain and access data on themobile device, how to make users participate on the sensing task and finally how todesign the chain from accessing data to visualization. Those reflections are meant tomap real life applications like discussed in 2.1 to a framework following the Projectconcept in(2.2). They outline how specification, collection, analysis and interpretationof data-collection can be managed. The mobile clients in this framework interact (as ageneric mobile data collection tool) with the server components, based on a proposedprotocol to render a request. The server stores, processes the data and provides aninterface to add additional information for the verification of the data. Also a specificdevice management is introduced, which is capable of querying participating devices, ornotifying users for desired samples. Finally, the proposed framework covers a data chainfor an easy and adaptive visualization, which is needed to make data for PS projectstangible more useful.The interaction of server and client in this framework is based on standard communi-
cation methods, it includs XML and JSON messages transported via HTTP interfaces.Because of these it is a web service framework and feasible to interact with other servicesfor data mining or visualization purposes. The prototype, we described in the implemen-tation chapter, will build upon some of the services like Googles C2DM, Fusion Tables orthe Chart API, and by doing so leverages some already existing mature concepts. Thepurpose of the following discussion is also to indicate the interface’s relevancy to ourparticipative collection process.Below, we will first discuss the use-cases for which the framework is designed, then we
will introduce the architecture of the framework, then continue to describe a conceptoverview and finally we will discuss the protocol and model details.
4.1. Use-Cases
The use-cases describe the system centric process in order to reach a certain goal in aProject. Hereby we focus on common interactions, where initiators, gatherers, evaluatorsand analysts are involved with the system and the gathering client. In PS applicationsthe use-cases are restricted to the common tasks. Obvious actions or those beyond thecontext, such like users management or system administration, will not be mentioned.
27

4. Framework Concept
4.1.1. System - Initiator
1. [Add a new Request ] The initiator logs in and uploads a Request definition tothe system. The system checks if it compiles with the Request scheme, if she hasthe write-request right and if the Request is unique. The system adds the Requestto a list if no error occurs or returns an error message.
2. [Add remote trigger rules] The initiator opens the list of remote triggeringrules. She edits an existing rule or starts a new one. She commits the rule. Thesystem checks it for compiling errors and returns an error, or a success message.After the rule committal was successful the rule is added to the rule queue andused for future triggers. The initiator may add or remove Request to be boundwith the rule.
3. [Add annotation options] The initiator adds annotation option, correspondingto a certain Request. The system checks if it compiles with the preset optionsand if the initiator has the write-annotation right. If it conforms, the options areadded to the system and its defined thresholds are applied for the status of alreadyannotated responses.
4.1.2. System - Gatherer - Client
1. [Requesting a list of Request ] The gatherer requests a list of Requests from thesystem, by using her login id and password, if it is necessary. The system returnsa list of requests. She choses a request, which then becomes stored locally on thedevice.
2. [Registering for remote queries] The gatherer registers with the system for re-mote queries. If there was no registeration before, a random unique client identifierwill be send to the system. The system enqueues the client for remote queries andcreates/updates a global and request-dependent context model. The client startsto collect periodically location updates.
3. [Registering for locally triggered queries] The gatherer registers a Request forlocally triggered Requests. The client starts to collect periodically location updates.
4. [Device reports the local context] The client computes the current context(location, time, movement). If a Requests is registered for remote queries insidethe context, a location update will be send to the system. A delay is calculatedbased on the movement or a static definition, and the report will become scheduledagain.
5. [Locally triggered Request ] The gatherer enters a certain context (location,time, movement). The client checks if Requests are registered inside the context. Ifa Request matches, the Request starts by asking the gatherer if she is in the desiredstate, under the assumption such a question was defined. If the gatherer affirmsthe question or if no question is defined, the Request starts.
28

4. Framework Concept
6. [Remotely triggered Request ] The client updates the system-side client modelperiodically, if a Request was registered with a remote trigger. The system checksif the clients-model matches a rule. If a rule matches, a query will be send to theclient. The client then starts the Request.
7. [Starting a Request ] A Request is either started by the gatherer, a remote triggeror a local trigger. The client checks, if the gatherer starts the Request, whether shehas the permission to start the Request or not. If no user interaction is needed, theclient replies automatically after a short notice. When user interaction is requiredthe client starts to notify the gatherer. If she is not replying to the notification, thenotification process restarts after a delay. If the gatherer replies to the notification,the Request will be rendered and presented to the gatherer. After she replied to theRequest, all sensor-data will be gathered and a response will be send to the system.
4.1.3. System - Evaluator
1. [Annotate a response] The evaluator requests a list of responses to a Request byusing her login. The system returns a list of responses, sorted by date or anotheruser preference, and marked as new if they were not checked before. The evaluatoropens a response to the annotation process. She follows the annotation process(i.e. Verification workflow ) and submits the annotation. The system checks ifthresholds for annotation options may trigger some state change and applies it tothe response.
2. [Proposing a delegation to a user] The evaluator proposed a delegation to aresponse. The addressed user is notified by the next login, by an email or if she isregistered and identified as a gatherer, by a message to the client.
3. [Proposing an action for remote queries] The evaluator proposes an actionto a response. She defines the target Request and the action context. A sticky ruleis enqueued to the target request queue. If a gatherer enters the defined context, aremote query starts (see 6).
4.1.4. System-Analyzer
1. [Retrieve Responses] Analyzers access the response database, by querying thesystem for the corresponding Request, she might add filters for status, score or flagsfrom the annotations and other data filters. The system checks the permissions andreturns a filter applied list of responses.
4.2. Architecture
It is possible to apply PS tasks to different areas, as it was identified in the Project life-cycle, by reusing the same actions and mechanisms for solving tasks. In order to providea generic approach to a diversity of projects, we identified common goals for a framework,
29

4. Framework Concept
Sensor Clients
Core Service
Mobile Client
Physical Sensors
User input - Virtual Sensor
Storage
Client Managment
Data Processing
Rule Engine
Community Interface
Interpretation
AnalyzationResponseRequest
Figure 4.1.: The core architecture with external interfaces.
which bases on open solutions. Below are the goals and motivations for the underlyingarchitecture, with a summary of its desired features , followed by detailed explanations:
• access phone sensing- and survey-capabilities, and map them to a single data for-mat, based on a customizable protocol
• access mobile clients for the sake of controlling the collection process
• community based verification
• access and restrict the collected data
• build visualizations based on an open approach
To access the sensing capabilities of a smartphone and to provide interactive surveys withthe device’s assistance imply insights about the the built-in sensors. Those insights alsohelp to leverage the input abilities. Both, surveys and sensor access, are represented bythe Request protocol, an XML specified description about requesting data in a Project.Request is mainly designed to leverage the device as a sample collection tool, rather thana survey tool. The protocol also defines sampling rules based on time and location coordi-nates, which describes how to collect samples independently and disconnected or how togain user attention for answering a request. An interface for querying devices remotely,
30

4. Framework Concept
which is an integrated part of the server services, is also introduced. Figure 4.1 visualizeshow the abstract services interact together in the concept. Here the client managementis responsible to manage the aspects of a two way communication with registered clients,which introduces remote control. In such scenario devices report their local context to theserver, which on the other side triggers actions based on user programmed rules, so thatsample-collection may follow a global scheme. The data processing module is anotherintegrated service for retrieving, annotating and accepting collected data. It accepts andverifies responses based on a static scheme and introduces a database-like interface forretrieving the data, and an annotation interface for community verification work. Theannotation concept is a community interface, through which it is possible to add extrainformation about each collected sample. Both the annotations and the response dataare retrieved through a single interface, which delivers the data in a table similar to aCSV format. The format is also consistently used throughout the visualization chain,which in the end provides meaningful visualizations. The visualization chain is based onan extension of an already existing concept, so that visualization is well supported. Inthe concept, based on Google Fusion tables, data may be restructured (filter, reposition)and partially manipulated (transformation, subsuming), so that it can be integrated tovisualization based on the Google Chart API.
4.3. Concept Overview
In this section we discuss the main concepts of the framework. First we introduce theconcept of sensor data, which are collected by clients based on Android. Then wediscuss the concept of user verification through annotations and data analysis by usingviews. Finally we address the role of the users in the framework.
4.3.1. Sensor Data
Life-line
data
annotation
view/visualization
simple semantics, low-level valid, device
dependent, annonym
data-centric user validation, reliability and
high level validity
user-centric, well contextualized, human
interpreted and interpretable
Abstraction to system model
request / response schema
annotation schema
view mode, by extern view api (gva)
user/device
request data
annotations
Figure 4.2.: The relationship of abstract layered semantics, the system model and finally theuser interaction.
For the sake of clarity we focus on requested data as textual or numerical data, whichcan be easily validated automatically. Furthermore it is a direct projection to device
31

4. Framework Concept
sensors or human input methods, as will be exemplified later.Sensors as abstracted in the survey on context-aware systems from Baldauf et al. [2007]
can be distinguished in three categories: physical sensors, virtual sensors and logicalsensors, whereas only physical and virtual sensors will be included in the requested data:
Physical sensors are the most frequently used sensors and they are capable of sensingalmost any physical phenomena. For smartphones the relevant subset ofphysical sensors and an outtake of possible virtual sensors are shown in table4.2.
Virtual sensors are capturing user generated data or subsumed physical sensor data,which is usually sensed over a period of time. Virtual sensors produce data,which represent statements about virtual phenomena in the context of a user,like social context or whether a user is running or walking. In this work animportant virtual sensor is the user herself, who generates data by subsumingand sensing facts, and provides them to the system by using a mobile device.
Logical sensors abstract processes and sensed states to a new logical view. The resultsare interpreted and abstracted data, which however are not important forthe request and gathering process itself. In higher levels of the Project lifecy-cle, logical sensors are immanently useful and should be implemented in theanalysis and validation process.
The physical and user generated data is logically distinguished in statement-data andcontext. The statement-data is a projection to later statements about the gathered data,especially in the interpretation. Whereas the context enriches the statement in order tomakes it more viable and viewable. Statement data can be collected manually, primarilyby the user or automatically by device sensors or other deployed virtual sensors on thedevice. Enabling user-input as sensor data makes it difficult to predict its content, hencea detailed description or even an automatic validation must be in place, so the user mightunderstand the purpose of the request. The resulting semantics of a certain statementhowever can still be difficult to evaluate, therefore different contextual layers are modeledin this work to overcome the lack of client intelligence, as seen in Figure 4.2:
Data-centric semantics of the request (on the gathering layer of a Project), are defined byvalidation of data based on low-level types. Naturally user input is difficultto validate, so this validation is shifted towards the next layer.
Data-centric semantics of validity and reliability (on the analysis layer of a Project), onthis layer users validate user input, by confirming, rejecting and annotating astatement. A user trust value and an acceptance-threshold ensures the trans-parency of decisions. This layer is optional but significant for any operationwith a broad group of participants and a major user-input section.
User-centric semantics of interpretation through visualization (on the interpretation layerof a Project), on this layer users are confronted with an interpretation of the
32

4. Framework Concept
underlying data, through graphs, tables and maps. This visualization is heav-ily depending on the operator’s point of view. To minimize this fact, datais provided based on a open standard, like Googles Visualization API so anyuser might change/influence the interpretation by herself, just by rewritingthe visualization.
The layers are exemplified in the oil spill scenario (6.1), in which each of the approacheson the semantics is used in a real life example.
Requests
Request is the name of the protocol used to define a collection request, so it is theinstruction catalog of what should be collected, in which scope, by whom. Clearly itis useful to put constraints upon such a broad definition, hence the what is restrictedto textual or numerical input data, which is easy to validate and interpretable, evenautomatically on all Project layers. Presently this does not exclude image nor audio dataexplicitly, but for the purpose of clarity we will only address simple data types, becauseautomatic validation and interpretation of image, audio and raw data is an own researchsubject. The scope are restrictions on the space-time coordinates of a user, which is thebasic context of usual PS applications. And this scope is not only validated by the clientlocally, but also remotely in order to provide a system-control over the client peers. Thewho are standard role-based user representations, just for the sake of completeness.From the analysis we found important features to be addressed by a Request scheme:
• Sensor and context data restrict statements. Automatically generated sensordata are like physical or virtual sensors. They are highly useful to restrict or clarifya user generated statement, to provide the possibility to remove ambiguity and tofilter statements in higher layers. Some application may even solely rely on sucha sensor data, to make the user only responsible to control or allow the process.Context and sensor data is described in detail in 4.4.1 and the used Request modelis described in 4.4.2.
• Based on simple data types data collected through Request is based on simpledata types and lists of data. Simplification of the data source eases the verificationand the interpretation of the data later and enables verification during the user’sinput.
• Validity of time and location: time and location is a special context prevailingused in PS applications. Requests should include interfaces to regulate the validcontext, based on the location and the time the user interacts. Other contextrestrictions are imaginable (like a floating Bluetooth social context) but too specificand limited in its validity. The mechanisms are described in the local Requesttrigger 4.4.2 and for remote control 4.4.2.
• Complex Descriptions for user generated data are required on the client side, inorder to prevent ambiguity in the verification- and analysis-layer. When providing
33

4. Framework Concept
statements, it is due to the complex human nature, that given statements may beambiguously or misleading, because of inexplicit requests. To minimize ambiguityadditional context data (as above), complex client-side validation-scripts and richdescriptions must be in place. Here we will concentrate on text-based descriptionsand transportable script validation (see section 4.4.3).
Requests are defined by an XML scheme, in which all data types and options can bedeclared. For further description also see section 4.4.2.
4.3.2. Clients
Android as a Reference Client System
In this part we will focus on Android as an open smartphone operating system, which iseasy to develop on and enjoys a rise of popularity, so it is possible to widen our testbedby providing the system to other Android users. Android based handhelds are by defaultequipped with plenty of sensors (see Table 4.2) and since the system is based on anopen source project, it is possible to customize the software and extend the support ofadditional sensing methods. The open source character is also an important benefit.Besides of a well documented API reference1, it has a broad developer and communitysupport. Other important reasons are:
• The way to input data is not restricted to screen input. It is possible to use built-inspeech-to-text recognition, the gestures or the orientation or accelerometer sensors,which is analyzed in section 2.7.3.
• Strong processing power of normal Android devices enables opportunities for com-plicated tasks, like sensor based step-counting, GPS tracking or noise recognition,which turns any Android handheld to a multifunctional mobile computer. Androidprovides native visualization capabilities, like OpenGL, native drawing, map-viewsand well implemented HTML and CSS support.
• With Android Froyo (2.2) Google introduced a push notification service, Cloud toDevice Messaging (C2DM) which is accessible for any Android based application.C2DM will be used as a push method to request server side responses from theuser.
Other mobile Clients Most of the functions and features are discussed and analyzedfor Android but are also applicable for other smartphones and mobile devices, like theiOS based product family, MeeGo or Symbian OS devices. It would be even possibleto deploy some of the functionality to web browsers, with JavaScript support, as forinstance Firefox or Chrome, which both support a geo-location service, for estimating theposition of a computer by wifi triangulation, based on the W3C Geolocation API2. Interapplication communication support and sensor access is fairly limited on web browsers,
1Android developers: http://developer.android.com/reference/packages.html2http://dev.w3.org/geo/api/spec-source.html[English, 03/08/11]
34

4. Framework Concept
and so web browsers are less interesting for this work. Web support will be primarilydiscussed and exploited for visualization support of data.
4.3.3. Annotations
Annotations are the community’s aspect of a requests. They provide the option tocomment and evaluate responses based on a request. Hence annotations are the data-centric validation of responses provided by users. Since user ratings and comments arebasically out of the scope of a request in the sense of original requested data, they serve,additionally to the response, as annotated data. So any response is by default annotatedwith a mock annotation, defined by annotation-settings. Annotation-settings also definerequirements for the annotation process and values for certain status transitions. Thestatus of a response is a straightforward definition of acceptance and validation aspects,like accepted, rejected and pending. So a status transition depends on the cumulatedvotes, given for the response by the participant. A user’s vote is either positive or negativeand weighted with the user’s credibility score, which is a value in [0, 1], determined byuser’s participation, calculated with respect of user’s number of responses, number ofannotations and number of accepted responses.The final vote results in a value in [−1, 1],where negative values induce rejection. After crossing defined thresholds responses gaina new status and after a certain time of inactivity a permanent flag, which indicatesthat no further ratings are possible. Alternatively dedicated reviewers might change thestatus manually at anytime, which is indicated with an additional flag.Beside of ratings, users might add several comments to responses. Comments help to
understand a rejection or a acceptance and provide further information on the subject,as for instance circumstances or productivity discussions. Standard comments are usualin community systems, however they are also a mighty tool to indicate cross-response orresponse-to-user relationships.The actual interaction of participants in the verification is not defined here, since it
depends on the respectively Project design. But an example on how to achieve a workingcommunity process is showed in the oil spill scenario 6.1.4.
Joining responses link two or more responses bidirectional to a group, hence indicat-ing similarities of circumstances or redundancy. Links are proposed by users andconfirmed by users with reviewing rights. Once a link gets confirmed non of theinvolved responses will be delivered any more, except a representative one. If a sin-gle element in a group has a confirmed or rejected status, all other group elementswill gain the same status. Conflicts must be resolved manually. All participantsinvolved in the gathering of the elements will benefit successively from a rise intheir credibility score, if the acceptance status was propagated.A semi-automatic linking is possible by linking messages, when the number of pro-posed links by users exceeds a certain threshold. Full automatic linking also can beaccomplished by comparing similarities. Therefore we first define a vector of hashfunctions v = [f1, f2, .., fn], where each function fm : c 7−→ r hashes two similar in-put values c1 w c2 - these are the column values of a response - to similar values r1 =
35

4. Framework Concept
r2. The resulting vector h1 = [r1, r2, .., rn] is then hashed again by a hash-functionwhich results in a single comparable value. The single comparable value states thesimilarity between two responses. A simple example is a function vector v = [f1, f2],where f1 strips away the last digits of a latitude and longitude location pair and usesa string hash, like (52.4992199,13.36533495) -> "52.499:13.365".hashValue()),and f2 removes the time information of a date-time value. The a resulting hashVector is then hashed again by a simple string hash("52.499:13.365".hashValue()+"13 Feb 2011".hashValue()).hashValue() , whichfinally groups all responses from a certain region and a specific date.The actual computation of a representative value is subject of the visualization andwill be discussed later.
Delegating responses to other users by mentioning the user in the annotation builds aresponse to user’s relationship. This relationship is useful for noticing other userswith a better sentence for reviewing the response. The receiving user can be notifieddirectly on her device about the response, if she belongs to a gatherer group and islinked to the verification layer. By introducing virtual users, which are representinginterfaces of other Projects, inter Project relationships may be achieve.
Flagging is useful for post removing, hiding or prioritizing a response, for actions andhigh-level grouping. A set of flags is defined inside the annotation options. Cer-tainly useful are flags to praise a response with a high priority, for urgent actionsor marking a response as spam or already processed.
Annotations provide a higher level of validation and Project management, therefore anno-tations need to be a part of the finally delivered data. Certainly not all of the annotationfeatures are required to show up in the response stream, but only the generic and crucialvalidation features, such like the acceptance status, accumulated user ratings and theflags. This features are accessed and filtered like all other response data by the datasource API, which provides convenient SQL-like statements such as SELECT WHERE andGROUP BY. So the way how to access user generated data must not be changed for the vi-sualization,. Therefore a simple example for a query, which filters rejected entries, wouldbe SELECT * WHERE status = "accepted" .
4.3.4. Views
Data views are user-centric and provider-dependent interpretations of collected data,which means that the visualizations are always cosumed by users, but usually generatedand interpreted by the provider. Keeping the user-centric character of visualizations inmind, it is sensible to offer users the capablity of changing the visualization to theirneeds. More radically, users would become their own provider of interpretations. In sucha system users should be capable of choosing a data provider, applying transformationsand modifications on the data, and choosing the final visualization method. For eachof the aspects interoperability is an important consideration, therefore we focused onproviding data based on a common format, which can be easily manipulated and finallyprovided to arbitrary visualizations.
36

4. Framework Concept
The goal for the final data analyzation is to enable the construction of arbitrary visual-izations on a set of data, in order to fully leverage the hidden capabilities of the collectioneffort, in a way that even late questions on the data may still be answered with a minimalprogramatic user effort. Therefore we provide data based on the Visualization APIs ofGoogle (GVA), which enables virtually all of the above mentioned requirements. Belowwe will discuss the visualization chain, which needs to be passed in order to visualizedata based on widgets and frameworks.
Visualization Chain
The visualization chain is a pipeline of operations which transforms raw data to usefuland meaningful visualizations. A solution for such a chain is already outlined in theproblem analysis in 2.3, and here we will discuss the concrete concept.Data must be retrieved, filtered, restructured, merged and modified for the final jus-
tification for arbitrary visualizations. Some of these operations can be found in ourframework, others are achieved more conveniently by external services. We will compareour included concept, which is based on a server-side GVA library, to the cloud basedGoogle Fusion Tables service, which is build for storing, managing and converting data.Both systems are compatible to the GVA Query language3, which introduces URL basesquerying operations.
Retrieval of data is done by the GVA library based on JSON maps or CSV tables, whichare nowadays common data transport formats. Especially JSON is important,since it is directly mapped to the programming context of JavaScript, whichis a mayor programming target of the visualization frameworks (see 4.3.4).Fusion Tables are only capable of importing data, statically based on GoogleSpreadsheets, CSV files or a JAVA based data library. Therefore retrieval isbased on the static storage, which must be programmatically updated by aserver script. Hence Fusion Tables are well suited for static visualization.
Filtering of data is based on the WHERE keyword in the GVA, which is applicable to con-ditions based on arithmetic or string functions. Filtering statements is partic-ularly necessary for preventing a high load on the client side, as for instance todisplay markers on a map (i.e. SELECT * WHERE (‘position.lat‘>52.5130)and (‘position.lat‘<52.5139) - for filtering entries for a specific latituderange). Similar filtering capabilities are available for Fusion Tables, whichalso allow to define views for the filtered values. The defined views can bestored and shared afterwards individually.
Restructuring data is to change the column positions, sort and limit the data so thatit can be provided directly to visualization widgets. Such a approach is nec-essary for unified widget interfaces, where no programatic layer is available.The server side GVA library supports SELECT for repositioning and excluding
3http://code.google.com/apis/visualization/documentation/querylanguage.html[English,03/09/11]
37

4. Framework Concept
columns, LABEL for renaming columns, ORDER BY for ordering columns basedon comparable column values and PIVOT for building columns from distinctrow values. Similar functionalities are also available for Fusion Tables, whichare accessible by a web interface, where possible selections can be combinedquickly.
Merging data is to put raw data tables together according to a common identifier. Acommon use case for merging data is to provide an KML outline to a tableof statistical data, so that references or identifies may be visualized as well.Fusion Tables support data merging, but the GVA library does not.
Modifications are applied on the data in order to format, transform or scale values in acolumn. The GVA library and Fusion Tables have a built-in support for suchfeatures. For example aggregation is based on functions like sum, max, min,etc, and also scalar transformations or reformatting of certain value types(i.edate) are possible. Unfortunately both libraries does not support any kindof mechanism to merge or splitt columns. Those operations are useful foradvanced operations, as for instance merging columns of positions to a singleKML representation, which is necessary to draw polygons on a map.
It is possible either to work with both the GVA server library and the Fusion Tables, oronly one of them, to provide data suited and acceptable for visualizations. The biggestbenefit of the GVA server library is to deliver most recently generated data. FusionTables on the other hand always require external pushed updates, but the service takesover all responsibilities for a performable and extendable data storage and delivery. Butsince both concepts are based on the GVA Query language, a set of specific designedvisualization can be used out of the box. We will discuss it below.
Widget based Visualization
As shown in table 4.1, there are several visualization frameworks available to build genericdata views. By using the Google Chart Tools, it is relatively easy to plug widgets anddata sources together, with almost no programatic manipulation. The Google Charts canbe used for rendering static image- or interactive charts. Both visualization methods arebased on the Google Chart service, which is not deployable on one’s own server. Howeverthe service bridges the need for directly generated visualization and public available data.The most relevant example for this bridge is the map visualization. It allows to generategeo-location dependent data layers upon a map view, which is conveniently supported byFusion Tables. The other frameworks listed in the table are all dependent to client sideJavaScript libraries, hereby data is loaded by a JavaScript environment and then appliedto usually simple construction methods. Some of the libraries, like SIMILE or FLOT arealso based on the <canvas/> HTML5 tag, which is supported by mobile browsers, andhence suited for rendering charts on smartphones.
38
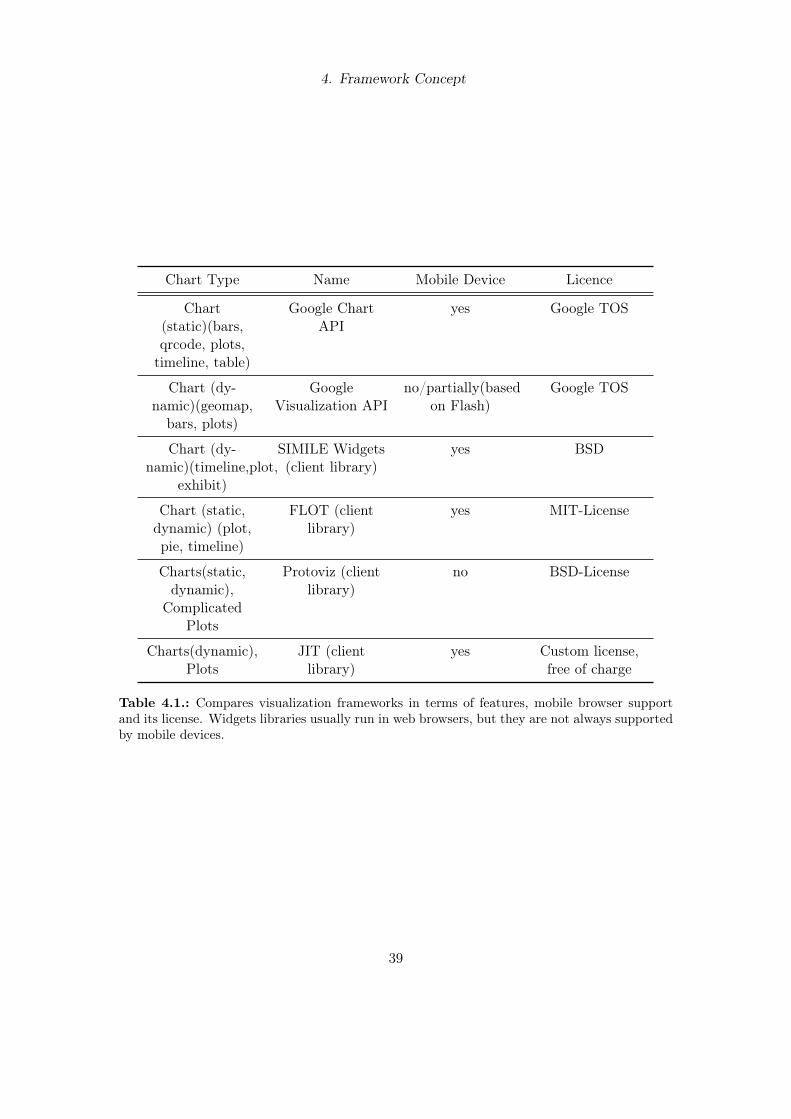
4. Framework Concept
Chart Type Name Mobile Device Licence
Chart(static)(bars,qrcode, plots,timeline, table)
Google ChartAPI
yes Google TOS
Chart (dy-namic)(geomap,
bars, plots)
GoogleVisualization API
no/partially(basedon Flash)
Google TOS
Chart (dy-namic)(timeline,plot,
exhibit)
SIMILE Widgets(client library)
yes BSD
Chart (static,dynamic) (plot,pie, timeline)
FLOT (clientlibrary)
yes MIT-License
Charts(static,dynamic),
ComplicatedPlots
Protoviz (clientlibrary)
no BSD-License
Charts(dynamic),Plots
JIT (clientlibrary)
yes Custom license,free of charge
Table 4.1.: Compares visualization frameworks in terms of features, mobile browser supportand its license. Widgets libraries usually run in web browsers, but they are not always supportedby mobile devices.
39

4. Framework Concept
4.3.5. User System
The identification of a user in the framework depends on the Project setup, which mayrely on a broad user basis of unknown collaborators or a well known group of participants.Generally user identification dependents on the layer of user participation: A gatherer isnot obligated to be represented inside the system, since she usually does not provid userspecific data, but environmental information. Whereas evaluators participate in gradingand manipulating the data stream, and therefore underly certain responsibilities to pre-serve credibility. Responsibilities are connected to certain user rights like reviewing ormoderating the evaluation process. The roles may be dynamically associated based onthe user’s credibility score. The score is a measurement of relevant user participation,and influenced by primary factors like participation and secondary factors like acknowl-edgments from other users. A certain user credibility scheme, beside the mechanism usedfor the annotation voting, is not proposed in this work.For some tasks anonymity must be guaranteed, especially in situations where user
reports might lead to threats to the user. To minimize this factor inside the servermodel only remote request conditions (4.4.2) will represent the participant’s client, if notdemanded by the request otherwise. If there is a request-case, in which participants mustbe represented within the response data, we can use random ids combined with aliases.These information can be requested from user’s client, but only to the extend that theparticipant is willing to verify her id and/or login credentials.
4.4. Model and Protocol Details
Here we take a closer look on the available sensors and provided data. And we discussthe structure of the Request protocol and the model of the annotation services.
4.4.1. Context and Sensor Data
Context and sensor data are any automatically provided data, either by the physicalsensors (in this work WiFi, GPS and Bluetooth are also included to the set of physicalsensors, even though they do not sense physical phenomena, but technical protocols) andadditional virtual sensors, or external connected devices, like heart beat monitors. Thetable 4.2 gives an overview of sensor types provided by an HTC Desire Android Devicewhich is a reference client for this work (most Android handsets have similar capabilities).Some available and tested virtual sensors on Android and other connectable sensors arelisted, in order to show the scope of available sensors.The data of some of the physical sensors dependents on the immediate sensing context,
i.e. the moment a user uses the device the data must be collected instantly. Becausedata collection often involves user interaction, the collection process and the deployedclient is designed rather as a user-centric than a device- or sensor-centric client concept.Using sensor data in a user-centric context provides a deeper understanding of the usergenerated data (4.4.3), as discussed in the section 2.3.
40

4. Framework Concept
Sensor Data Access Description
ReferenceClient (HTCDesire)
Position location (2 floats) GPS, Wifi,Network
available even whendevice is suspended (wake
lock)Time DateTime value Android System -
Magneticfield
3-axis float in µT SensorManager Does not work on somedevices when screen isdisabledAcceleration 3-axis float in
m/s2SensorManager
Orientation 3- axis float(Azimuth, Pitch,
Roll)
SensorManager
Light light level inLUX
SensorManager
Bluetooth vector(BT_ID,RSSI, profiles)
BluetoothManager Service Discovery, directquerying only to know BT IDs
Wifi vector (BSSID,SSID, flags,
RSSI, frequency)
WifiManager
Microphone raw audio data MediaManager codecs and quality may bespecified
Camera raw image/ videodata
Camera codecs are raw and jpeg
VirtualSensors,applicable onstandardAndroiddevices
Pedometer steps/min deviceaccelerometer
implementation availableunder GPLv34
SoundMeter
SPL in dB Microphone must be calibrated perdevice, available under
GPLv25
FaceDetection
faces per image,pose per face,face details
device camera andandroid.media.FaceDetector
built in
PostureDetection
Enum=[walk,run,stand,sit]
phoneaccelerometer
showcased in CenceMe
SocialContext
- BT ID graphbuilding / matching
used in services like aka-aki,next2friends
ExternalSensors(Devices likeXperia, X8, X10)
Heart RateMonitor
beats/sec ANT+ i.e. chest worn monitor
StrideDistanceMonitor
strides/sec ANT+ a personal worn sensor close tothe shoe
Table 4.2.: Most of the listed sensor types are built-in sensors on Android devices. . But wealso listed some virtual and external sensors to demonstrate the potential capabilities.
41

4. Framework Concept
Data generated by the physical sensors introduces a similar problem as stated forimage and audio data. The stream of the output is difficult to interpret and needs to befiltered and subsumed. In this case preprocessing is necessary, which is a problem to thegeneric approach of the platform. We solved this by using addressable plugins, whichprovide and collect data on the phone. Two examples of such plugins are a Sound Meter,which collects data from the microphone and transforms it to a sound pressure level, andthe Posture Detection, which filters and processes accelerometer and orientation data todetect the posture of a user.
4.4.2. Request Model
A Request is a meta definition of data, which is provided by a context-aware sensor - theclient. This meta definition is categorized in two types: automatically and user generateddata. The data model is context independent, meaning that the Request itself explainsthe resulting data. Therefore it is the basis for confirmation of corresponding responses.As a consequence Requests must be accessible together with the generated data.The circumstances under which a user replies to a Request is not entirely specified by
the Request itself, since time and conditions, under which a Requests were asked, mayvary in respect to the user’s situation or the client capabilities. We show ways to providecertain control to the collection process based on time, location and user’s behavior, butonce user’s interaction is needed for the collection process, the proposed methods willonly assist the process rather control it. The Request protocol provides only assertivecontrol to the collected data. Two methods are proposed to provide control for thecollection process - remote execution (4.4.2) and local conditions (4.4.2). Together withthe possibility of requesting users based on an external event (2.6) and the users owndecision to provide data, four situations are possible to reply to a Request. The executedsituation is documented in the response to a Request. Any requested data, especiallyuser-depended data, must be accomplished by user-readable descriptions and if possibleby script restrictions, so that the user receives aid in understanding the purpose of theRequest.For the sake of documentation and portability, the document type of Requests (and
all other Project specific documents) is defined by an XML scheme (http://suur.de/wr/schema/request.xsd, see also the appendix A.1), which also includes a certain levelof typed logic. This helps to ease the implementation of a reference client. The schemeis divided in two main sections options and sensorData (it also includes a field for anunique identifier uuid, notifications and a description), which are explained below.
Options
The options define the collection control. The collection control includes two condi-tions - autonomous querying and a permission for users to start the Request by themself (allowUserExecution). The local and the remote execution conditions are similarlystructured, both include time and location rules for starting an action. If the local execu-tion condition occurred, the action would be starting a Request, if the remote execution
42

4. Framework Concept
condition occurred, the action would be posting a location update to the server. Bothconditions are explained below.
Local Execution Condition
Figure 4.3.: Location window state machine, of the local condition. Location windows arerestricting the number of Requests.
The local execution condition is a model, which allows the client to autonomouslyreissue Requests based on location and time. The time condition is defined by a crontabschedule pattern, which allows a static scheduling. The moving condition triggers whena user covert a certain distance after the last answered Request. And similarly to themoving condition a fixed time delay can also trigger a Request. Movement and time-delaytriggers can be restricted by the location condition. Once entered a location, which iscalled a window, the other conditions are checked, and a Request is eventually started.The window mechanism, which restricts the number of repetitions in a specific location,is covered in the state chart 4.3.The Listing 4.1 below exemplifies an options block. In section <repeatOnLocalCondition>
a location and a movement condition are shown. The location condition restricts all otherconditions to a certain location. Therefore the moving condition is only valid inside theshown polygon. Besides of polygons it is also possible to define circles and boundingboxes for including or excluding locations. In fact defining a location condition requiresto monitor the user’s movement, which can quickly drain the battery. An adaptivebattery life saving algorithm is proposed in section 5.1.4.
Remote Execution Condition
The remote request trigger allows operators to query mobile devices remotely. The pro-tocol is shown in figure 4.4, where mobile devices report their location status proactively,based on a similar set of conditions like discussed in the local execution condition. Forinstance by moving, static scheduling or a delay to the last update. If no location updatesare needed, the mobile devices stays idle until a push messages triggers a new Request.Remote triggering shifts the complexity of decisions to the server, where high-level
or abstract rules are applied to dynamically query clients, which gives operators a tool
43

4. Framework Concept
Client Server
Context update
Request for response (Push)
On rule matched
responseInteractive/automatic
register Updates (client id, uuid)
update client context
Figure 4.4.: The figure shows the remote requesting protocol. The client initiates the process byregistering at the server, then the client sends context updates based on fixed delays or locationconditions. On the server side a push request for a reply is issued, if a rule matches, and thenthe client starts a new Request. The rule complexity is hidden by the server, that makes therequesting process transparent on one hand and dynamic on the other hand.
to quickly and individually react on dynamic situations. Such queries might even allowto query a client for a different Request than initially registered, enables consecutiveRequest to investigate a problem from a different aspect. Such a scenario is showed inthe interaction of Request 1 and 2 in the oil spill scenario (6.1). The example in listing4.1 shows a remote request condition, which triggers updates periodically based on astatic schedule scheme.Other ways of remote access, besides the push notifications, will be discussed in section
5.1.4.
44

4. Framework Concept
<options >2 <allowUserExecution >true</allowUserExecution >
<repeatOnLocalCondition ><locationCondition >
<inside ><polygon >52.513009 13.319721
7 52.517905 13.32128852.519616 13.32328352.512055 13.31997952.513009 13.319721 </polygon >
</inside >12 </locationCondition >
<triggerAfterMovingXMeter >50</triggerAfterMovingXMeter ><question >Do you might to answer the Request now?</question >
</repeatOnLocalCondition ><repeatOnServerCondition >
17 <cron>*/10 10-17 * * *</cron></repeatOnServerCondition >
</options >
Listing 4.1: collectSpl.xml - Request Options
4.4.3. Sensor Model
The client is a context aware sensor. It includes not only the sensing capabilities of themobile device itself, but also all declarative capabilities of the human, who controlls thedevice. This extension of an usual physical sensor introduces a great source of samplingthe meta-physical environment on the one hand and a huge inaccuracy on the other hand.Hence declaring user dependent input must mediate restriction and sensing freedom,which however might be partly achieved by declarative elements, like HTML descriptionsor type restriction and by an validation logic. Client side validation is also achieved byinjecting JavaScript, which is capable of validating syntax and partially semantics. Deepsemantic validation is discussed in the analysis part of the Project specification (see 4.3.3and 4.4.4). The following input and sensor definitions are executed and rendered basedon their position in the Request. We have not covered a complete document tree forgenerating surveys, but only the document elements. Designing a document structure isa subject to future work.
Automatic Sensors
Sensor data is partially obtained by automatic sensor, which was introduced in section4.3.1. The Request scheme defines a set of pre-defined sensors, which are aligned tothe Android device capabilities. All sensors are defined in the <sensorData> tag. Eachsensor may be adjusted in its output in individual option types. Below we will introducesome of those options but for a complete reference review the Request scheme in theappendix A.1.All relevant device information and also some radio properties are included with the
45

4. Framework Concept
<device> virtual sensor. The device data is useful to determine the hardware platform ofa device and therefore it is possible to rescale values, if a specific device delivers incorrectdata. The built-in sensors, such as the magnetic-field sensor or accelerometer, are definedby the <sensor> tag, which covers all device sensors (see table 4.2). The sensor definitionis adopted from the Sensor class of Android6. The WiFi sensor <wifi> is defined by adetailed filter for certain WiFi flags or addresses, which is also exemplified in the listing4.2, which shows a filter for all open networks with an eduroam SSID. In order to accessother sensors installed as plugins, it is possible to use the <virtual> sensor, which isclosely designed based on the Android Intent7 concept. A defined virtual sensor is eitherlaunching an external application with user interaction in the foreground and with nointeraction in the background. In the foreground case a given URI is interpreted as theclass to be launched, and in the background case as an intent action. But in both casesthe receiving routines must be implemented by the corresponding plugin. An optionaloption’s string is then passed to the plugin. The resulting value is passed back andwrapped to an response value, which includes the value and optional value additions. Anexample for a pedometer virtual plugin is listed below.
<wifi><name>wifi</name><maxEntries >20</maxEntries ><filter >
5 <including ><entry >
<key>ssid</key><value >eduroam </value>
</entry >10 </including >
<excluding ><entry >
<key>flags </key><value >WPA WEP WPA2</value >
15 </entry ></excluding >
</filter ></wifi>
Listing 4.2: requestSample.xml - wifi filter
6http://developer.android.com/reference/android/hardware/Sensor.html[English, 03/11/11]7http://developer.android.com/reference/android/content/Intent.html[English,03/11/11]
46

4. Framework Concept
<virtual ><name>stepcounter </name><required >true</required ><type>int</type>
5 <userInteraction >false</userInteraction ><uri>name.bagi.levente.pedometer.StepService </uri><options >collect:1000 </options ><installLocation >http://code.google.com/p/pedometer/</installLocation >
</virtual >
Listing 4.3: An example virtual sensor entry, which is accessing a pedometer.
User Generated Data
In Requests users may be asked explicitly about environmental facts or personal state-ments. We refer to this data as user generated data. User generated data is based on atextual representation and can be provided in a free form or by a restricted form basedon types. A type in a Request is either a simple data type, like boolean or integer, or acustom restricted type. A custom restriction can be defined by three methods: regularexpressions, enumerations and script validation. The reason for such a variety of restric-tion lies in the complexity of possible input, since it is difficult to predict and to guaranteethat a user, who answers a Request, understands its intention. Regular expressions arebased on the JAVA regexp classes8 and enumerations are provided by a list of choicesto the user. The script validation is based on JavaScript and therefore it provides thenecessary freedom of actions for complex validation. An example and a deep descriptionis found below in paragraph 4.4.3.The tag for usual data input is <simple> (see example 4.5)and <choice> (4.4) for
single and multiple choice input. Both types are required to provide an identifier and adescription, which can be defined by using HTML with no CSS support.
8http://download.oracle.com/javase/1.4.2/docs/api/java/util/regex/package-summary.html[English, 03/11/11]
47

4. Framework Concept
Application Environment
Script Environment(BeanShell, JavaScript)
Request
Validation Script
inject Script
call validate(input)
async error(validationError)
async setValue(value)
terminate onTimeOut
Figure 4.5.: Script injection to a secure script environment provides a rich validation to anykind of value. This is a simple value validation, without GUI interaction.
1 <choice ><name>selfEstimation </name><required >true</required ><type>string </type><description ><![CDATA[<h1>Stresslevel </h1 > <p>How much does the
noise disturb you? 0 = not at all , 5 = very disturbing </p>]]> </description >
6 <choiceType >singelChoice </choiceType ><enum>
<element >0</element ><element >1</element ><element >2</element >
11 <element >3</element ><element >4</element ><element >5</element >
</enum></choice >
Listing 4.4: collectingSpl.xml - choice tag.
<simple ><name>comment </name>
3 <required >false</required ><type>string </type><description ><![CDATA[<h1>Any comments about the location?</h1>]]><
/description ><regexp >\w{6,}</regexp >
</simple >
Listing 4.5: collectingSpl.xml - simple type tag.
Script Injection Validation Using a mighty script language is probably the easiest wayto accomplish Request defined restriction of user data. So we propose a script injectingmethod to verify values. This method uses asynchronous communication between script
48
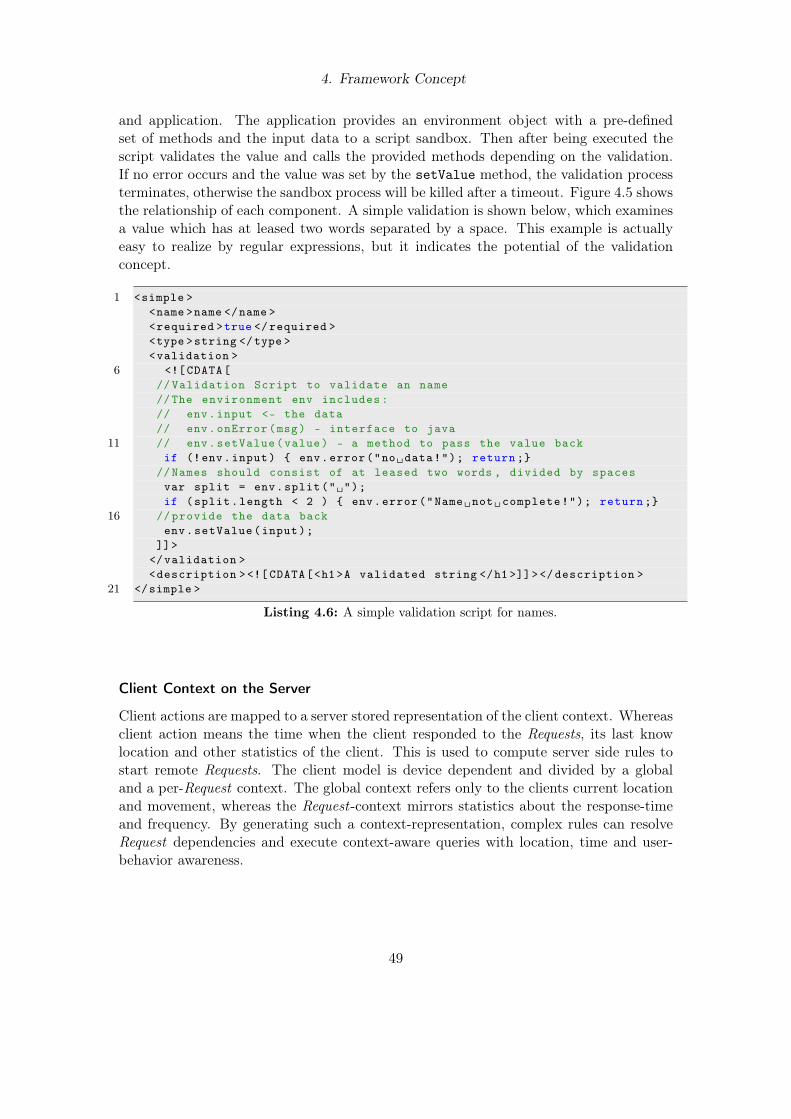
4. Framework Concept
and application. The application provides an environment object with a pre-definedset of methods and the input data to a script sandbox. Then after being executed thescript validates the value and calls the provided methods depending on the validation.If no error occurs and the value was set by the setValue method, the validation processterminates, otherwise the sandbox process will be killed after a timeout. Figure 4.5 showsthe relationship of each component. A simple validation is shown below, which examinesa value which has at leased two words separated by a space. This example is actuallyeasy to realize by regular expressions, but it indicates the potential of the validationconcept.
1 <simple ><name >name </name ><required >true </required ><type >string </type ><validation >
6 <![CDATA[// Validation Script to validate an name//The environment env includes:// env.input <- the data// env.onError(msg) - interface to java
11 // env.setValue(value) - a method to pass the value backif (!env.input) { env.error("no␣data!"); return ;}
//Names should consist of at leased two words , divided by spacesvar split = env.split("␣");if (split.length < 2 ) { env.error("Name␣not␣complete!"); return ;}
16 // provide the data backenv.setValue(input);
]]></validation ><description ><![ CDATA[<h1>A validated string </h1 >]]></ description >
21 </simple >
Listing 4.6: A simple validation script for names.
Client Context on the Server
Client actions are mapped to a server stored representation of the client context. Whereasclient action means the time when the client responded to the Requests, its last knowlocation and other statistics of the client. This is used to compute server side rules tostart remote Requests. The client model is device dependent and divided by a globaland a per-Request context. The global context refers only to the clients current locationand movement, whereas the Request-context mirrors statistics about the response-timeand frequency. By generating such a context-representation, complex rules can resolveRequest dependencies and execute context-aware queries with location, time and user-behavior awareness.
49

4. Framework Concept
4.4.4. Annotation Model
The annotation object and the annotation history are defined by the annotations XMLscheme (http://suur.de/wr/schema/annotation.xsd). The objects include the flatvalues of a response annotation, including status, score, flags and eventually a responsegroup. The values in the object are documented by a feed of actions applied on theannotation. The possible actions are, accordingly to the annotation description (4.3.3),joining, voting, flagging and delegating and additionally comments. Listing 4.7 showsan example annotation preamble with all values set, which are delivered together withresponses. The values are partly resulted from a direct user influence, like the score andthe applied flags, shown in the annotation feed 4.8 below. The status however changesautomatically based on predefined thresholds of the score value. And since joining isa proposal to add a response to a response group (seen in listing 4.8 line 12-14 ), itneeds to be confirmed by an operator, which is done later in the example. Note that thejoinGroup has a different id than the linked element, so joining requires to build up agroup data structure, where responses point to group-ids.
<score >3.5</score><status >pending </status ><requestUuid >23</requestUuid >
4 <responseUuid >233213 </responseUuid ><joinGroup >354354 </joinGroup ><flags >urgent medical </flags >
Listing 4.7: annotationSample.xml - preamble
<feed><element >
<user><name>greatUser </name>
5 <score >1.0</score></user><date>2010 -10 -10 T12:00:00 -05:00</date><action >
<vote>10 <score >1.0</score>
</vote><join>
<joinWith >654846 </joinWith ></join>
15 <flag><setFlags >urgent medical</setFlags >
</flag>20 </action >
<comment >Patient found but is the same report like @654846 vote -with 1.0
</comment ></element >
25 <element >
50

4. Framework Concept
<user><name>operator </name><score >1.0</score>
</user>30 <date>2010 -10 -10 T13:00:00 -05:00</date>
<action ><vote>
<score >1.0</score></vote>
35 </action ><comment >
confirmed! and linked with @654846 vote -with 1.0</comment >
</element >
Listing 4.8: annotationSample.xml - feed element
4.4.5. Mapping Models to Objects
Interfaces
Model
XML
Schema
JAXB Generator
Class Model
JAXB marshaling/
unmarshaling
XML
Model unaware
Client
Shared Model
Client
Figure 4.6.: Sketching the process of XML scheme object mapping, using JAXB. The model isdefined by XML schemes. JAXB generates the class model and provides a marshaling/unmar-shaling communication layer. On the bottom, we are able to access the data layer, by directobject communication and XML messages.
The models, except the server side context representation, are specified by XMLschemes. Hence it is possible to auto-generate a programmatic object representation byusing JAXB. JAXB, the java architecture for XML binding, supports xml to java beans
51

4. Framework Concept
marshaling, and the generating of schemes and class models. So it implicitly delivers aflexible way to communicate via validated XML messages. The most important aspectsof this setup are that the programming model is tightly bound to the XML scheme andtherefore it is always up to date, and messages can be automatically validated. Settlingfor a RESTful server API it is then easy to provide client to server communication onvarious points of the architecture. Like pictured in figure 4.6, it is possible to use val-idated XML messages with clients unaware of the underlying programatic model, andwith clients sharing the same model, both based on the same XML scheme.Making the scheme the single point of coherence, clients may be designed as interpreters
in respect to the design goals, very much like HTML defined elements for web basedvisualization.
52

5. Implementation
The Project lifecycle for gathering data in field operations and for general PS tasksis showcased by our implementation. The prototype consists of two components: aclient based on Android and a server. The Android client renders the Request protocol,implements the collection control mechanisms and generates the requested sensor data.The server incorporates data management, user management and a community interfacefor annotating data.
5.1. Client
The Android client is an important part of the architecture, since it is the referenceimplementation of the Request scheme and also an practical documentation. The Requestclient is comparable to a web browser, in the sense that it renders Requests as documentsand provides elements for user interaction. But the client was neither designed as agraphics nor layout tool, but to map the sensing capabilities of the Android system tothe Request scheme and to enable requesting quantitative data from the user. Thereforinput methods are designed with extensibility in mind, in order to fit user’s behavior fordata collection, and it is tailored to obtain the sensing capabilities of the phone. TheProject workflow is meant for continuous data collection in a defined context, in order tounderstand the meaning of the collected data. Hence context determination and tests areessential parts of the client, which are implemented by using local and remotely triggeredquerying. The client’s task is to achieve reachability and context awareness, if certainRequest are registered. From the phone’s boot up to its shutdown it should not disturbthe user’s other activities on the phone. So the client effectively transforms the phone toa data collection tool with certain features: Robustness, system integration, extensibilityto other sensor plugins and adaption for input methods.
5.1.1. System Integration
Figure 5.1.: BroadcastReceiver.onReceive()
The Android application design recommends tofollow the activity lifecycle, which is tightly inte-grated with phone states, like shutdown, suspend,sleep etc. In that sense applications should ex-ploit the system APIs and notifications to reacton state transitions or to implement monitoringtasks, rather than running long time backgroundtasks, which may drain the battery. The clientuses several Android services and APIs, which are
53
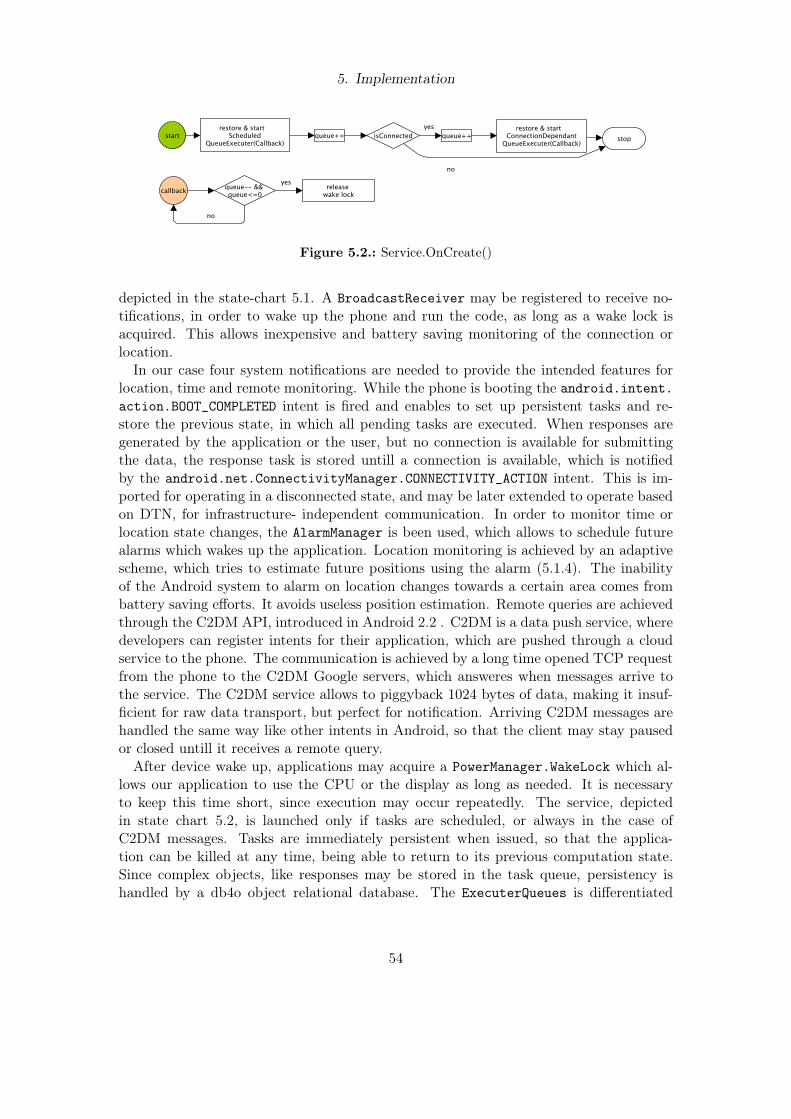
5. Implementation
Figure 5.2.: Service.OnCreate()
depicted in the state-chart 5.1. A BroadcastReceiver may be registered to receive no-tifications, in order to wake up the phone and run the code, as long as a wake lock isacquired. This allows inexpensive and battery saving monitoring of the connection orlocation.In our case four system notifications are needed to provide the intended features for
location, time and remote monitoring. While the phone is booting the android.intent.action.BOOT_COMPLETED intent is fired and enables to set up persistent tasks and re-store the previous state, in which all pending tasks are executed. When responses aregenerated by the application or the user, but no connection is available for submittingthe data, the response task is stored untill a connection is available, which is notifiedby the android.net.ConnectivityManager.CONNECTIVITY_ACTION intent. This is im-ported for operating in a disconnected state, and may be later extended to operate basedon DTN, for infrastructure- independent communication. In order to monitor time orlocation state changes, the AlarmManager is been used, which allows to schedule futurealarms which wakes up the application. Location monitoring is achieved by an adaptivescheme, which tries to estimate future positions using the alarm (5.1.4). The inabilityof the Android system to alarm on location changes towards a certain area comes frombattery saving efforts. It avoids useless position estimation. Remote queries are achievedthrough the C2DM API, introduced in Android 2.2 . C2DM is a data push service, wheredevelopers can register intents for their application, which are pushed through a cloudservice to the phone. The communication is achieved by a long time opened TCP requestfrom the phone to the C2DM Google servers, which answeres when messages arrive tothe service. The C2DM service allows to piggyback 1024 bytes of data, making it insuf-ficient for raw data transport, but perfect for notification. Arriving C2DM messages arehandled the same way like other intents in Android, so that the client may stay pausedor closed untill it receives a remote query.After device wake up, applications may acquire a PowerManager.WakeLock which al-
lows our application to use the CPU or the display as long as needed. It is necessaryto keep this time short, since execution may occur repeatedly. The service, depictedin state chart 5.2, is launched only if tasks are scheduled, or always in the case ofC2DM messages. Tasks are immediately persistent when issued, so that the applica-tion can be killed at any time, being able to return to its previous computation state.Since complex objects, like responses may be stored in the task queue, persistency ishandled by a db4o object relational database. The ExecuterQueues is differentiated
54

5. Implementation
by its dependency on resources, which is an internet connection or schedule time. TheScheduledExecuterQueue is enqueueing tasks based on an execution point of time, whichis also always set as the current alarm, so that the application guarantees the execution.Whereas the ConnectionDependantQueueExecuter executes tasks based on an estab-lished connection (5.1.4).
5.1.2. User Interaction
Users are introduced as sensors in this work, nevertheless they are not as predictable andcontrollable as physical sensors. As an result the clients use-cycle dependents on andadopts the users behavior. The standard Android design pattern approach is to keep theUI always responsive, whereas tasks are asynchronously shifted to the background. Theinteraction chart 5.3 pictures an actively issued Request by the user, which is intended tobe responded immediately. For stability the Request task is treated the same like everyother tasks. It becomes enqueued to the scheduled queue for immediate execution. Fromthis point Request execution is similar for any other interaction case, as for instancescheduled or remotely triggered Requests. After dequeueing the task, conditions arechecked and user attention is drawn by notification. When the user does not reactingon notification, the task becomes rescheduled for an exponential backoff time. Collecteddata is subsumed to a response and submitted to the connection dependent queue, whichexecutes task, the moment an internet connection is established.
5.1.3. Class Diagram
The client application classes are structured in four parts representing dedicated mod-ules involved in any of the tasks described above (shown in the class diagram 5.4). Theapplication control consists of the Application and the MainActivity. The MainActiv-ity defines the user entry point, where all UI control and monitoring mechanisms areconduced. The Application is the central controller for all common procedures, suchas scheduling Tasks (5.1.4), starting to render a Request or using the server Http API.This is also the place where a common model is maintained, which enables the listen-ing and registering for property changes, in order to react on async events. The modelpersistency is enabled by using db4o - an object oriented data base, which supports thepersistency of the current application state. A system dependent entry point is definedby the Intent broadcast receiver, which may receive system wide events, as described inthe system integration (5.1.1). The receiver is registered throughout the system, so thatthe application can reacted on certain events by not being active. The events cover thephone states, in which our application needs to monitor location, connectivity or alarmchanges, so that robustness is achieved with no direct control.All background tasks are submitted to the service, which controls and guarantees the
persistency and execution. The main task for the service is to achieve the monitoring
55

5. Implementation
Fig
ure
5.3.
:The
processof
registeringa
Req
uest
bytheuser,span
ning
from
theuser
action
totheba
ckgrou
ndtask.Thisillustrates
thecommon
task
ofuser
interaction,
inwhich
theuser
may
cancel
orsnoo
zea
Req
uest
ifnecessary,
andgets
notifiedby
sign
als(sim
ilar
toan
alarm)whenanew
Req
uest
shou
ldbe
answ
ered.
56

5. Implementation
Fig
ure
5.4.
:The
And
roid
classdiagram.
57

5. Implementation
of location changes by mapping the task to a scheduled future test (5.1.4), and to trig-ger Requests on time. The service also implements a store and transmits concept forresponses, if connectivity is not available, so that offline gathered responses can be sub-mitted later. This is fairly not a infrastructure independent approach as DTN (2.7.1),but provides a certain communication assurance.Request rendering and response building is done by the ResponseBuilder, which uses
the ResponseActivity to render Requests to the users and Plugins to gather the sensordata and to display the content. The plugins independently try to gather sensor data,which may involve a minimum user interaction for agreeing to use certain sensors, afterthe user completed the rendered survey. The survey components are rendered by View-Plugins. It needs to access the ViewActivity, in which the components are composedbased on the order defined in the Request. If alternative input methods are needed toinput the sample data, they may be accessed by the InputAdapter interface, which trig-gers an external application (as for instance a barcode scanner).The input data can bein any string representable format. Other external sensors, as for instance virtual sen-sors, perform a long time data gathering. Those sensors may be installed and deployedseparately from the internal plugin management. But they will be accessed through theonActivityResult Android interface, which allows the launching of external applicationsfor data.
5.1.4. Techniques
Local Condition Trigger
Figure 5.5.: A timer triggers the position estimation shortly before the request-time-conditionkicks in. The algorithm estimates the current position by taking the accuracy and speed of move-ment into account. Every more accurate location will be tested against the position condition.While estimating the position by GPS, the current speed vector will be calculated and if cuttingthe condition area is likely more GPS samples will be taken.
In order to preserve battery-life location conditions must follow an adaptive schemeof current available position metrics. An algorithm should prohibit exhausting batteryusage by heavyly relying on GPS localization. Other metrics like cellId-localization andWiFi-triangulation should be implied. In the flow-chart 5.5 we propose to include coarse
58

5. Implementation
Figure 5.6.: The location condition task, which is part of the local condition task, running tomonitor the current context.
position estimations and stepwise refine the result by using cellId-localization (net), thenWiFi-triangulation (WiFi) and in the end GPS localization. The predictive positiondetection is used in the LocationConditionTask, which is scheduled when a Requestwith location condition is registered. It basically probes every default time elapse if theclient is approaching to the desired location, if so it queues the task again for the estimateposition entry, calculated by the approach speed and distance to the goal, depicted infigures 5.6 state chart. It also shows how the location window concept described inparagraph 4.4.2 is implemented.
Task Queueing
Every task, even immediate issued Requests by the user, is scheduled through two queues,in order to provide robustness and control for tasks. The queues integration is mentionedabove, whereas its functionality is depicted in the state-chart 5.7. The queue blocksfurther executions as long as an internal callback is not visited, in order to indicate thesuccessful termination of the task.
59

5. Implementation
Figure 5.7.: The abstract QueueExecuter function.
Problems of Push and Solutions
A problem arises when clients are not capable of using push notifications to reissue anew Request. The clients must send regular messages through a different path and askif the condition is fulfilled. This might not be always an efficient solution in respectto bandwidth usage and client battery life, especially when remote conditions stay un-changed for some time. Alternatively the server computes a local-condition model basedon the current client state and the server logics. This model is fetched once by the clientand rechecked after an expiration date. This method allows a relatively dynamic con-text aware execution without a server-maintained client model and by only fetching newconditions on a preset time.
5.2. Server
The server system is designed in order to manage the Project lifecycle. The componentsare: the document verification and management, storage, data access and communityaccess for verification. Each component has a dedicated service module in the server’sarchitecture, which is discussed in the service section below. After a remark on scalabilityof the server we will introduce the design pattern, which was followed throughout thedevelopment.
5.2.1. Scaleability
The primary focus of the server is not to show its robustness, but to showcase andmap principles of a PS application’s workflow. Hence scaleability is not a primary goal.Whereas for later deployment, components are designed as abstract as still useful with
60

5. Implementation
Figure 5.8.: The general design pattern of the server, viewed as an MVC pattern from theservers perspective.
the Inversion of Control pattern in mind (IoC12). Therefore later re-usage and adaptionto scalable platforms like the Google App Engine or the Amazon E2C platform wouldbe possible. We already showed that providing data to visualizations (see 4.3.4) canbe achieved by scalable services, so that data collection, manipulation and delivery isprepared to be used in distributed scenarios.
5.2.2. Design Pattern
The server components are designed based on the IoC scheme used in the Spring frame-work. The IoC scheme relies on designing components separated by interfaces and inthe POJO (Plain Old Java Objects) style in order to make them reusable or replace-able with minimal effort. The components are glued together by an XML configurationfile, which enables changing the components rather by configuration than programmat-ically. The diagram 5.8 shows the abstract design pattern, in which model, service andcontroller define the core server components. The services, respectively for Requests, re-sponses, annotations, C2DM and Registration, are accessed via interfaces either directlyby GWT-RPC or an REST HTTP interface. The GWT-RPC servlet server is a cus-
1http://en.wikipedia.org/wiki/Inversion_of_control[English, 01/14/11]2The Spring IoC container: http://static.springsource.org/spring/docs/3.0.x/reference/beans.html[English, 13.03.2011]
61

5. Implementation
tom HttpServlet, which provides RPC to communicate with internal GWT clients. TheREST interface, developed by a Spring web MVC controller3, wraps usual JAVA methodto REST Http requests. So it is easily and quickly extendable to deploy the HTTP APIfor external clients, such as a custom visualization or the Android client. The controllermay render responses in different formats, including verified XML documents or plainXML serialization, using XStream. The ResponseController renders responses in theGoogle Data Source format, a custom JSON format, in which data is delivered sequen-tially in data rows, each representing a single collected sample. Each Service accessesthe db4o database through an abstraction layer of managers, in which the db4o specificdatabase calls are conducted. In later deployments, for instance in an distributed cloudbased architecture, this layer may be replaced by the target database system.
5.2.3. Services
There are five services in the server environment, which manage the logics of the server.Each service allows to be tethered through an interface, which is mainly used by a GWTRPC communication and a HTTP REST API. The services are developed as interfacesfor the first access in the system, so that authentication and restrictions are checkedon the service layer, but not on the transport layer. All authentication go through aAuthentication Service, which checks the user’s rights and credentials.
RequestService
Figure 5.9.: The RequestService Architecture,with the Spring WEB MVC controller design.The controller marshals XML messages to PO-JOs, or serializes objects to JSON.
The RequestService controls the Requestdocument access. This involves storing,deleting and retrieval of the Requests.As stated in the 4.4.5 section, the Re-quest object is directly compiled fromthe request.xsd (A.1) Request definition.And therefore the Service only uses an ob-ject reference of the document, which isnot checked for data integrity by the ser-vice. The XML verification is be donethe Spring WEB MVC framework. TheRequestController as shown in the classdiagram 5.9 enables the verification ofthe XML documents by directly testing itagainst the scheme. The actual processis depicted in the Spring HTTP messagehandling, where a JAXB XML marshallerchecks and converts the documents. This
3Spring WEB-MVC: http://static.springsource.org/spring/docs/3.0.x/reference/mvc.html[English, 13.03.2011]
62

5. Implementation
class diagram is also an example for other controllers, like the Response-, Registration-,Authentication- and AnnotationController.
ResponseService
The ResponseService is responsible for receiving responses and for delivering the for-matted data to external clients. The incoming data is checked for compatibility againstthe associated Request. The response is then transformed to a data row representation,similar to the CSV format. Unlike the RequestController, the rendering of the responsedata is not solved by a ViewResolver, but by the DataSourceHelper. The DataSource-Helper is a helper class from the data source JAVA library4, which provides the dataoutput and processes the HTTP request parameters. Based on the Google Query API,the library allows to filter the data with parameters like SELECT, WHERE, GROUPBY statements (similar to SQL). The resulting data feed may be rendered to variousdata formats like CSV, TSV, HTML tables or JSON, so that it can be reused in otherapplications. Examples of how to use the data stream are provided in the section 4.3.4.Annotation data, if existent, will be attached to the data feed, by providing an additionalrequest parameter, so that it is possible to filter the data stream based on the above ref-erenced query API. If a response is joined with other responses in a group, only a mockrepresentation is delivered, which contains an additional field for the response group’s id.The list with the group members may be then obtain through the identifier.
AnnotationService
The Annotation Service manages the response annotation, which includes actions forvoting, tagging, delegating and commenting a response (4.3.3). Voting changes the cred-ibility score of the response, witch directly influences its state. The transition thresholdsto change the states is defined in the annotation options. The annotation options aremanaged per Request, whereas every new Request is getting a set of default options.A certain state does not change the handling of the response, since the visualization isresponsible to filter data based on certain queries. When a response is connected to a cer-tain registered user, she receives a credibility score change, if the response got accepted.This reflects that the user, who also participats in verification, provides credible data. Auser is only allowed to vote for a response once. Therefor any users action needs to belogged in the response feed. Joining is to put two or more responses together to a group.A group is a data structure, which is bidirectional, linked with its including responsesand contains a mock representation of a response. Joining two responses from differentRequests is not possible. A joined group induces a change in the state of its members.For instance when a member is accepted/rejected, all other members will gain its state.Conflicting states are ignored and must be resolved by an moderator. As an annotationaction a user may propose a join between two responses, but a moderator must inducethe actual joining. Tags are defined in a static list in the response options, which can
4http://code.google.com/apis/visualization/documentation/dev/implementing_data_source.html[English, 02/15/11]
63

5. Implementation
be retrieved through the AnnotationController. Users then may apply a tag to a re-sponse, which is successional attached to the response. Delegating is solved by attachinga notification together with a reference to the response, to the target user model.The actual implementation of the AnnotationService was not needed for our prototype,
therefore we only specified the processes and the model.
RegistrationService
The RegistrationService registers devices for remote triggering and rule management. Ef-fectively only one method was implemented to trigger devices, which is based on C2DM.Therefore each device-holder must obtain an authentication token, issued exclusively forone device and service. The process is easily integrated in Android and involves only theacceptance of a single permission, which may be withdrawn at any time. The servicehowever is identified by a Google account, hence the service needs to hold the authenti-cation for the account in order to send the C2DM messages to the Google servers. Forcompleting the process the Android client transmits the token to the RegistrationSer-vice. Every Request, which includes the remote triggering option, and is registered onthe device, will be represented in the RegistrationService by generating a device and aRequest specific context. The device context holds information about position and ac-cess statistics, whereas the Request context holds statistics about the certain answeredRequest, like the count and time of the last response. The context information is thenprovided to the rule, which is executed in a sandbox environment, in order to determinewhether an Request should be triggered. The rules are added and edited also in the Reg-istrationService, which performs a simple syntax and semantic check,based on a mockcontext. The rules are written in MVEL - a JAVA based scripting language with a verysimilar syntax to JAVA.
AuthenticationService
The AuthenticationService manages the credentials, permissions and the user model in aProject setup. The permissions are enumerated by possible actions a user may perform(i.e. READ_REQUEST, SEND_RESPONSE). By default two users are preset in thesystem, the admin users, who has all permissions, and the anonymous user, who isallowed to read Requests, send responses and read responses. This settings may bechange in the application’s preferences. The user may hold an authentication token,which is valid for a short time and bound to the IP the user is communicating from, oralways use password and id to perform actions. An user identification is only needed,if the user participates in a close gathering process or as evaluator. An user model iscreated for every identified user, which includes a credibility score, a total action scoreand user permissions. The credibility score is updated through certain user actions, likeparticipation on verification, commenting or gathering data. We took a simple approachon estimating the user credibility by summing up all user actions to a total action score,which is then compared to a static defined milestone list. The user obtains a credibilityscore of 1 when she reaches the last milestone.
64

6. Scenarios
This Chapter is dedicated to demonstrate examples of Projects which may be realizedwith the help of the proposed Framework. The notation of the below discussed Requestsis simplified, for the sake of readability. An original Request for the second scenario isadded to the appendix.
6.1. Oil Spill
This example is motivated by the 2010 Deepwater Horizon Oil Spill Disaster, which haslasted for 3 months in which 4.9 million barrels oil 1 have been spilled into the Golf ofMexico. The impact on the environment, the economy and health was huge, and is stillgoing on. Many helpers and organizations tried do their share, to overcome the mosthazardous aspects of the spill during and after the catastrophe. In that time work neededto be coordinated and hazards must be classified, while health risks had to be monitoredof participants and civilians.
6.1.1. The Goals of the Project
The goals of the project involve classification of damage to coasts, animal’s and plant’slife and monitoring health risks of involved staff. It is divided in three Requests involvingthe different aspects, and spanned over two questions: which data should be collectedand what hypothesis should be proved?
1. Primary coast damage classification; dedicated teams of participants classifythe degree of contamination in the involved area and the distribution. Additionallyanimal injuries may be reported. The data should show the course of oil contami-nation in respect to time and extent, for documentation and coordination.
2. Animal injuries reports; participants already classifying oil spill damage or oth-ers, are also reporting sightings of animals contaminated by oil or dead animalsrelated to the disaster. Reports should trigger urgent actions where animal arein danger and should provide statistics on how many and how far animals are in-volved, during the disaster and after wards. So teams may coordinate their workand studies based on how far animals life is influenced by an oil spill.
3. Health risks monitoring: anyone involved in any of the two above discussedreports and activities, receives questions about health problems, like headaches,
1http://www.pbs.org/newshour/rundown/2010/08/new-estimate-puts-oil-leak-at-49-million-barrels.html[English, 01/22/11]
65

6. Scenarios
fatigue or feelings of sickness. Monitoring staff may break down the effect of directexposure to raw-oil and to the used dispersants.
The groups involved in gathering the data, especially participants from (1) and (2),are also asked to participate in verifying the data via an online board, where incomingsightings are classified, joined or special actions may be triggered. In General all groupsare asked to provide contact information in order to react on reappearing signals ofsickness.The participants of (3) will be monitored and verified by a group of medical trained
staff in order to quickly understand the underlying sickness or to report to different - nothere and yet specified - Requests.
6.1.2. Defining the Protocol
The protocol, which includes the Requests and annotation-options is defined in XMLdocuments based on the corresponding schema. Every of the above mentioned subjectsreceives its own Request and Annotation definition and will be discussed based on itsintention and impact.
Primary coast damage
The Request definition for (1) is based on a list of single point observations sketchinga specific area where the oil spill is observed. Hence the resulting report includes somepreamble questions and a list of location coordinates of the contaminated area:
1 Request 1Choice:Kind of coast line?{multi , values{Beach , Rocks , River , Open Water }}
Choice:Degree of contamination?{multi , values{Light , Mousse , Tar -Balls}}
6 Simple: Are animals involved?{Boolean}
Simple: Course of Spill. Walk along the area and mark every 30m theadvance of the contamination.
{Position , batch}LocationInfo , DeviceInfo
The Request is initiated by the staff on demand.During the gathering process verification data might be annotated with the following
Annotation Options:
Annotation Options 1status -values: pending , verifyied {>=2}, declined {<-2}
Animal Injuries
This subsequent Request to (1) is dealing with animal injuries, where participants shouldclassify the single case of the affected animal group in a report. The Request includes
66

6. Scenarios
the animal group, the approximate number of the affected or dead animals:
Request 2Choice:Kind of animal?
3 {single , values{Bird , Fish , Sea Mammal , Mammal , others }}Simple: How many animals are involved approximatly?{Integer}
Simple: How many animals are dead?{Integer}
8 LocationInfo , DeviceInfo
This Request may be successive triggered by the positive outcome of the question “areanimals involved?” in Request (1). The triggering rule takes the staffs position of theanimal-responsible organization into account and tries to send requests to close members,so they may report about the incidents more in detail. In the analyze phase participantsmust verify data similar to (1).
Health Risks
Every participant, who collects data of (1) and (2), will receive automatically a Requestfor their health, which includes questions about sickness symptoms and its appearance:
Request 32 Choice: Do you feel somehow strange or sick? What kind
of sickness?{multi , values{Fatigue , Hadache , Nausea , stomach sickness ,slackness }}
Simple: Others?7 {String}
Simple: How strong does/did it feel?{Integer , min:1, max:5}
Choice: When did it occur?{multi , values{Morning , Forenoon , Noon , Afternoon , Evening ,
12 Midnight , Night}}LocationInfo , DeviceInfo , UserInfo
The community, i.e. the medical trained staff analyzes the data based on an internalclassification, which is modeled by using flags. The verification protocol is little differentto the one in (1), but that data is trustful by default and be declined by a single vote:
Annotation Options 12 status -values: verifyied {0}, declined {<-1}
tags: striking , observence , disabled , harmless , urgent
6.1.3. Gathering Data
Gathering data samples may be done autonomously by participants or they might bedirectly queried in order to provide a response. Two groups are involved in the process,which are introduced to the scenario by their organization. The group gathering data
67

6. Scenarios
(a) Request 1; gathering successive data for oneresponse. Every red dot is a location sample.
2
1
3
(b) Request 2; different responses, close to eachother. Every red animal is dead and others arecontaminated.
for (1) and (2) may be volunteers, cleaning or monitoring the damage on the spot. Theyare advised to provide reports every time they arrive at a new contaminated spot. Thebasic procedure is that they are ascertain data while they are close to the sighting. For(1) a participant starts to walk along the dirty beach as seen in figure 6.1a and takesdata samples every few meters, which are location marks in that case. The procedurefor (2) is different, since single reports - on the spot from the participants perspective -are enough, multiple reports then may deliver an accurate picture of the complete sceneas shown in figure 6.1b.While collecting data samples for (1), based on the question “if animals are involved”,
participants for (2) are informed close to the area. In that case approaching partici-pants of group (2) will be involved in the case as in rule listing 6.1 shown. The rule isparametrized for the single case and was inserted to the rule-list after getting a posi-tive response arrived for (1), hence the context is the particular response. The methodgetResponsesByResponseRef returns the responses based on the issuing method id.
if (getResponsesByResponseRef(response.uuid).size() < 5){2 users = getAllUsersForRequest (2);
for (u : users){if (closeTo(u.pos , response.pos , 1000m))
triggerRequest (2, u);}
7 }} else {
removeSelf ();}
Listing 6.1: Trigger for Request 2, for approaching participants.
The procedure of gathering data for (3) is different to the other procedures, in theway that it is not directly related to the oil spill contamination, but to the health of the
68

6. Scenarios
“sensor”. Any participant of (1) and (2) is requested to answer the questions of (3) once aday, which is triggered locally. In this procedure Request (3) will be remotely introducedto the client, which includes a local trigger:
Request 3 OptionslocalTrigger: Do you have time for some medical questions?{cancable=false , snoozeable=true , snoozeTime =45min , cron ="00 30 16 * *
*", start ="1 Jan 2011" , end="1 April 2011" }
The local trigger may not be canceled but snoozed by the users and always asks himat 16:30 to respond to the questions of (3). The Request is valid till April, but may beextended by another remote request.
6.1.4. Verify the Data
Figure 6.1.: Verification work-flow
While gathering data staff also verifies the content toensure that no false or redundant data was posted. Theprocess here is defined by the internal community rules,which are not part of the Project specification. Howeveran example work-flow might show the basic principlesand provide an understanding of how the verificationprocess should work. The flow in figure 6.1 shows theverification steps from a common participants perspec-tive, when new responses are available. In any caseat the end of each process users should rate responsesin order to trigger a status change. Nevertheless man-agement users may break this flow by directly applyingstatuses, hence overriding the rating process. Dedicatedusers may be informed by a delegation with the case-data, so that they may check on the response and com-ment on the status.In the particular oil spill scenario two groups are in-
volved to verify the data; for verifying the content of(1) and (2) users with no specific but local knowledge,reporters and participants from the gathering processmay be involved, whereas for (3) participants with med-ical training review the data. Data in all three Re-quests must be verified for coherence, which is doneby votes, weighted by the users credibility. Users maygroup similar responses from (1) and (2) in order toindicate redundancy or completion, where similar in-cidences may indicate the same object. Experts mayreceive a delegation, which indicates a special case toreview, like a medical problem. In the case partici-pants must find an expert, they may probably review
69

6. Scenarios
the user credibility score or the projects must dedicate users in advance. Some casesin (3) may be urgent medical problems, which is why Requests also include UserInfosin order to provide a contact to the user (note that usually Request try to omit par-ticipation identification). In (2) animal rescue staff for instance may be informed bydelegation or by rule based automatic triggers. In the particular rule listing 6.2 closeparticipants of (3) are informed about contaminated animals close to their position.
if (response.animalCount > 100 && response.status == verified ){2 users = getUsersByRequest(response.request);
for (u : users){if (closeTo(u.pos , response.pos , 1000m))
inform(u, response);}
7 }
Listing 6.2: Rule to inform close participants
6.1.5. Analysis and Interpretation of Data
Collected and verified data for (1) and (2), hence approved by more than one participant,may be taken into account for the analysis and interpretation. Whereas all data sets from(3), if not redundant, are relevant. There may be a lot of interpretation aspects to coverfor each Request, but we will focus on the hypothesis from above.For (1) the goal was to document the geographic and historic course of the oil spill.
Every response includes a set of points collected along the coast line, representing a geo-located snapshot of the current oil spill progress. Focusing on coarse timestamps, in orderto grouping related events to each other, overlaps may occur in the visualization. A so-lution for displaying an accurate course is achieved by group data points based on a com-puted hash of coarse time and location points (i.e. "52.3:32.6:April20th".hashCode()).The resulting location is then the mediated average location of all responses listed underthe hash-key. If datasets have already been grouped by annotation, their position willbe mediated time-stamp independently. The representation finally displays a continu-ous line of contamination progress in respect to time intervals, hence navigation on themap is achieved in respect to three-axis, two for the location and one by a time intervalpicker. The degree of contamination is then displayed by different color fills and animalinvolvement by an icon.The reports for (2) are also displayed based on a map in respect to time intervals. The
data points however are single observations about a specific area, since it is unknownwhich part of the area is observed, we assume that subjects are scattered equally in acircle around the observers point. The radius of the circle is an assumption about thedistance of viewing, where approximations are still correct ( note that by additionally
70

6. Scenarios
requesting orientation in (2), the angle of viewing may be used to restrict the consideredarea). If two circles intersect in the same time interval, the enclosed area is doublecounted. The size of the enclosed plane Ain in contrast to the whole circle Ai, Ak isthe fraction v of samples si, sk which must be corrected. Both reports ri, rk may havedifferent approximations about the animal count, hence each count is subtracted by thefraction of its samples and then gets added the half of the average fractal of the commonsample size 6.2:
v = vi,k =Ain
Aci
=Ain
Ack
in = ci ∩ ck c = circlediststatic(posri), ri, rk ∈ R (6.1)
s‘i = si − siv + (vsi + vsk
4) si = |sample(ri)| (6.2)
The resulting view represents the density of spotted animals on the map. The den-sity is distinguished by color hue intensity, whereas animal kinds are differentiated bydifferent colors. All variations for kind and condition are customizable by a filter. Allgrouped reports are summarized to a single one by taking the average of the numbersand mediating the positions.In (3) reports follow the purpose of monitoring the health state of participants. This
is less illustrative than the location centric reports of (1) and (2), never the less manyinterpretations are feasible for the responses. But two main categories must be shown:The users centric view, hence the health state over time by user and the overall healthconditions over time filtered by sickness and strength. The resulting individual reportmay show potential increase of symptoms, during intervals and in contrast to the begin-ning and end of the in-field operation (Note that in order to provide relevant correlationstatistics, an additional Request about the work and expose state users are involved in,must be filed). This view may be represented by a time-graph per single and cumulatedsickness symptoms and a table of computed statistics (Note that by introducing a one-time Request users may be asked about their age and health state before the monitoringstarts. This omits a central database and data schema for additional user-centric data).The general overview, should show the overall effect by location and sickness, hence anindex of sickness weighted by the strengths and kind in correlation to a coarse locationand in a time-interval. The resulting view consists of bars indicating increase or decreaseof the index shown on a mock coarse location.
6.2. Monitoring Noise Pollution
Noisy streets in urban areas may cause health problems lead to stress symptoms, butcitizens may not even recognize the impact. In this scenario participants should collectnoise samples in a specific area around the Technical University Berlin campus andadditionally add a subjective ratings about stress caused by the noise pollution. Thescenario aims to provide understanding about the noise effect in contrast to location,time , current task and personal feelings about the inconvenience, so that environmentalfactors may be brought together with the citizens opinion.
71

6. Scenarios
The analysis should provide an visual and statistical view on correlation between thefactors. This might be achieved by a map showing the average SPL value, the personalrating and an aberration between both.
6.2.1. Defining the Protocol
The main Request queries for an user opinion, the users current task, location, a deviceidentifier, device-infos and an average Sound Pressure Level (SPL) sample measured indB. Measuring SPL is not trivial (see an explanation in 2.7.3) and needs a per devicecalibration, which must be done before using the meter . The SPL meter applicationis accessed through an intent plugin, which may start an application for a result. Thedelivered result is a 10 sec average noise samples, and the current calibration offset,in order to reproduce and normalize values afterwards. The question for the personalopinion is based on a statistical standard five values scale and the question for the currenttask is an intended open field, so users may not feel restricted in the choice. The opennessis also introducing the problem of interpretation, so that this is work done by the nextanalysis level.
Request Noise PollutionSPLMeter : The SPL value represents the noise level recorded with your
phones microphone. So hold the device microphone away from you andwait for 10sec , till a sample is collected.
3 {sample :10sec , value:average , calibration:true}Simple: On a scale (1..5) how much does the noise pollution stress you.
{Integer , min:1, max:5}Simple: What are you doing right now?
{type:String , requiered:true}8 Simple: Any comment you like to provide?
{type:String , requiered:false}LocationInfo , DeviceInfo , UserInfo
Listing 6.3: Noise Pollution Request
At the beginning of the data collection, an initial survey about personal data is providedto the users, which is helping to understand more preconditions, as for instance genderor age influence. The survey may only involve a small set of typical questions, as age,gender and occupation, with no further automatic mechanisms.
6.2.2. Gathering Data
Figure 6.2.: Cam-pus map.
The data gathering is performed by the participants in theclose area of the TU Berlin campus in Charlottenburg, whichis described as a restricted area in the location condition,shown in 6.2. The participants move in this area at anyday time, and mainly leave at afternoon, so time conditionsare only restricting start and stop date of the collection.While participants move inside the area, they will not leavea location window, hence they get a notification after moving
72

6. Scenarios
a certain distance. While staying at a single place noise levels may change, so users willbe notified every hour to provide a new sample. There is no maximum number of samplesto be taken, and the participant may answering the Request autonomously.
Local Conditiontime condition: {start: xxx , stop: xxx}location condition: {
where:{ inside :{ triangle :"XXX"},inside :{ triangle :"XXX"},inside :{ circle :"XX"}
5 ,inside :{ circle :"XX"}}action: {delay :3600, moving :50m}
}}
Listing 6.4: Local condition
6.2.3. Analysis and Interpretation of Data
Some data samples may be wrong or not trustful as for instance when devices are incor-rectly calibrated, or positions are too coarse for being relevant, in such cases responsesmay be annotated and down voted in order to restrict their usage in the final interpre-tation. Since samples are intended to be collected from trustful and known participants,responses are accepted by default. The question about the current task however intro-duces a variety of additional factors to generate, such as a classification of the kind ofwork. The participants will be asked to verify and tag the data on the platform, so thatnew interesting questions are involved.The data view however is already publicly viewable during the time of collection,
so that participants can follow the progress of the project, which intents to provide adirect incentive for successive gathering. The view may be designed of a map view,a timeline and filters. The map view shows the collected samples colored by the SPLlevel. The average value is taken for dense samples, based on the map zoom level,where low transparency indicates a high sample basis and stark transparent markers alow basis. The the map shows three layers, the sensed SPL value, the personal ratingand the aberration between the two values. For calculating the aberration value, thepersonal ratings must be scaled to the range of minimal to maximum SPL. Silence equalsapproximately 20dB SPL and a Vuvuzela at the distance of 1m equals approximately120dB SPL, therefore we will use these bounds for rescaling the user rating. The resultaberration reflects if the user is bothered with low noise or fine with high noise.
73

7. Post Analysis and Future Work
In this final chapter we will discuss an user evaluation, which provides some insight inthe practical PS project design and execution. Then we will draw our final conclusionabout our work and finally we will discuss possible future aspects of our work.
7.1. User Evaluation
To show the effectiveness of our work we conducted a small user evaluation based on thenoise pollution scenario described in section 6.2. With about 5 participants we collecteddata on the campus of the Technical University Berlin. The request proposed to the useris based on two questions: the current SPL value and a user’s statement about how muchthe he/her feels disturbed by the noise.The client application and the rendered Request is depicted in figure 7.2. A translation
of the original Request can be found in the appendix A.2. We only performed the datagathering and analyzation process in the test, but no community based verification wasimplemented. We build a detailed visualization to show the noise samples on a mapand to compared it with the user’s statements. The actual visualization was based onJavaScript and the Google maps APIv3, the latter allows to draw overlays on the map.At the end of the evaluation we provided a small user survey over our platform, but dueto a lack of participation those values are less significant.We had little focus on the actual statistical relevance of the gathered data, because of
the little number of participants in the evaluation. But the outcome of the visualizationshows that even a small number of samples (approximately 100 samples) can draw a goodillustration for the actual situation. As showed in the images in 7.1, participants gath-ered data mainly around the building of the mathematics faculty on the campus, whichincludes the canteen and the library. The participant successfully used the notificationsystem, which notified users to provide new samples the moment they walk inside a closepolygon around the campus defined in 6.2. From conversation with 3 of the users weconducted that the battery life was not noticeable affected by the monitoring process.Some problems arose with the accuracy of the location estimation. When a participant
answers consecutive Requests with little delay in between two Request, the device willreuse the same location, since it is “accurate enough”. This problem can be easily solvedby introducing a continuous sampling mode, which the participant may choose or thedevice may detect, to estimate the position as long as the users is actively providingsamples. It is also needed that the participant can check the location and if considerednecessary adjust it inside the accuracy range.We conclude that it is possible and feasible to use our framework for gather and
interpret data. We were able to design and perform a data collection task solely by spec-
74

7. Post Analysis and Future Work
(a) The user statement about theannoyance level. .
(b) The measured SPL value. (c) The scaled difference betweenuser statement and SPL.
Figure 7.1.: The images show the visualization of the gathered data. The size and the trans-parency of the circle is proportional to the GPS accuracy in meter. The color indicates the values,whereas in image (a) and (b) blue meas low value and pink high value. Image (c) is different,since a low value (green colored) means that a user is not bothered with much noise, and a highvalue (pink colored) means that he/she is annoyed with only less noise. A value around zero(grey colored) means that the noise matches the user’s statement.
ifying a Request document, and with little programatic work on the visualization. Userssuccessfully gathered data to create a noise pollution map, which can be a importantpreparatory work to provide insights for urban development and environmental impact.
7.2. Conclusion
We discussed numerous applications, including aspects of health, urban life, cultural man-agement and disaster relief, where PS tasks can be highly useful and successfully solved.From this analysis we could show that smartphones are suitable to be used as secondarypurpose devices with well suited sensing capabilities. In the following we analyzed theproperties of a generic data gathering platform and abstracted the processes and layerswhich are needed for PS projects. The outcome of the abstraction was used to designa PS platform with various considerations for data extraction, collection control, datadelivery and visualization. We designed the Request protocol as an extendable protocolfor data extraction on smartphones, which supports the automatic sensors, user inputsand is extendable to other sensors used within the target system. We introduced clientand server side methods to control the collection process on the device, and integratedthese methods to the protocol. Then we showed methods to verify the data based on acommunity process, which allows to manipulated and rate the data. The data deliveryand visualization was shown as a modular task, where it is possible to plug data sourceand visualization with ease together.Based on our framework design we discussed two scenarios for PS projects, which
75

7. Post Analysis and Future Work
are assisted by our framework. The oil-spill scenario describes in detail operations andmanagement of the data collection and control process, and discusses the verificationand aftermath analyzation methods. Overall this example showed that our framework isfeasible for disaster relief operations, which was one of our major interest. We conducteda small user evaluation based on the second scenario, which demonstrated a PS task inan urban environment. The prototype used in the scenario, proofed that our protocoland the platform design are capable to perform the intended functions.Nevertheless we could not test a full scaled PS project’s life cycle as it was intended
at the beginning. We learned that it is important to provide an high incentive forparticipation, when constructing an example. Therefore it is necessary to set for anexisting meaningful public project in order to motivate participation on all layers of a PSproject. We have not tested our framework for a disconnected scenario, where only GSMcommunication is possible. Such test and adoption would show that our application isactually deployable for disaster situations.
(a) The main screen of the WhiteR-abbit collection client.
(b) The rendered Request, it alsoobtains location and device data forthis request.
Figure 7.2.: The Android data collection client.
76

7. Post Analysis and Future Work
7.3. Future Work
During our work we found that conducting a full scaled users study based on a dis-connected disaster situation would draw deeper conclusions about communication andcontrol mechanisms for our platform. In such a scenario it would be a main interest tofind out if DTN can solve the communication drawbacks and if it is possible to use itslocal distribution character to deploy and investigate a distributed data collection plat-form. Finally we will extend the Request protocol to a full survey document structurefor complete data extraction capabilities, and a Android visualization framework similarto the extensibility of the Google visualization framework.
77

A. Appendix
A.1. Request Scheme
Below can be found the Request scheme, which is defined as an XML scheme.1 <?xml version="1.0" encoding="ISO -8859 -1" ?>
<xs:schema xmlns:xs="http://www.w3.org /2001/ XMLSchema"jxb:version="2.0" xmlns:jxb="http://java.sun.com/xml/ns/jaxb"elementFormDefault="qualified" version="1.0" targetNamespace="request"xmlns="request" xmlns:xsi="http://www.w3.org /2001/ XMLSchema -instance"
6 xsi:schemaLocation="http://java.sun.com/xml/ns/jaxb http://java.sun.com/xml/ns/jaxb/bindingschema_2_0.xsd">
<xs:annotation ><xs:documentation xml:lang="en">
11 A Request is a metaspecification for sensor and user generated data obtained by aclient , capable of rendering user input methods and bidirectionalcommunication. It contains an implicit context model , which isessential for a Participatory Sensing Project , which basically
16 involves location and time.</xs:documentation ><xs:appinfo >
<jxb:globalBindings collectionType="java.util.ArrayList"generateElementProperty="false">
21 <jxb:serializable uid="1" /><!-- <jxb:javaType name="java.util.Calendar" xmlType="xs:dateTime" --><!-- parseMethod="javax.xml.bind.DatatypeConverter.parseDateTime" --><!-- printMethod="javax.xml.bind.DatatypeConverter.printDateTime" /> --><jxb:javaType name="java.util.Date" xmlType="xs:dateTime"
26 parseMethod="de.suur.wr.utils.DateConverter.parseDate" printMethod="de.suur.wr.utils.DateConverter.printDate" />
</jxb:globalBindings ></xs:appinfo >
</xs:annotation >31
<xs:element name="request"><xs:annotation >
<xs:documentation >The request specification provides the minimalscheme for implementing clients. It provides capabilities of
36 defining server/client logics to enable a request and a basicdefinition of sensor providers.
</xs:documentation ></xs:annotation >
41 <xs:complexType ><xs:sequence >
<xs:element name="uuid" type="xs:long" maxOccurs="1"minOccurs="1" />
46 <xs:element name="options" type="OptionsType" maxOccurs="1"minOccurs="1" />
<xs:element name="notification" type="NotificationType"maxOccurs="1" minOccurs="0">
51 <xs:annotation ><xs:documentation >A triggered or arrived request might notify the
user so he can answer it.</xs:documentation ></xs:annotation >
</xs:element >56
78

A. Appendix
<xs:element name="sensorData" type="SensorDataType"maxOccurs="1" minOccurs="0"><xs:annotation >
<xs:documentation >The data you harvest. A list of named fields61 whish
are either filled by the user , with a proper description orautomaticly , by a on board sensor. The list of automatic filledvalues is the implicid device requriment. </xs:documentation >
</xs:annotation >66 <xs:unique name="UniqueVariableName">
<xs:selector xpath="*" /><xs:field xpath="@name" />
</xs:unique ></xs:element >
71
<xs:element name="description" type="DescriptionType"maxOccurs="1" minOccurs="0"><xs:annotation >
76 <xs:documentation >A description of the whole request , in order toinform about the purpose </xs:documentation >
</xs:annotation ></xs:element >
81</xs:sequence >
</xs:complexType ></xs:element >
86
<xs:complexType name="OptionsType"><xs:annotation >
91 <xs:documentation ></xs:documentation ></xs:annotation ><xs:sequence minOccurs="1">
<xs:element name="allowUserExecution" type="xs:boolean"maxOccurs="1" minOccurs="0" default="true" />
96<xs:element name="repeatOnLocalCondition" maxOccurs="1"
minOccurs="0"><xs:annotation >
<xs:documentation >A local condition is triggering a request on the101 users device , without communicating to the server , so the
requestscondition is not influenced externaly. The list is unitedby alogical AND.</xs:documentation >
106 </xs:annotation ><xs:complexType >
<xs:sequence minOccurs="1"><xs:element name="userExecutionDependsOnCondition"
type="xs:boolean" maxOccurs="1" minOccurs="0" default="true" />111 <xs:element name="cron" type="xs:string" minOccurs="0"
maxOccurs="1"><xs:annotation >
<xs:documentation >The standart cron notation is used as incrontabs , implemented by the cron4j
116 (http://www.sauronsoftware.it/projects/cron4j/manual.php)implementation.</xs:documentation >
</xs:annotation ></xs:element ><xs:element name="locationScheduledDelay" type="xs:long"
121 minOccurs="0" maxOccurs="1"><xs:annotation >
<xs:documentation >After entering a location window , which isthestate after a request is issued or the location condition
126 turnstrue. When the location condition statys true everylocationSchedulDelay a new request will be reissued but onlymaxRequestsAWindow times and in total onlymaxRequestsTotal.
79

A. Appendix
131 Afterthe location condition turns false , the state is resetandmaxRequestsAWindow request may be reissued.The delay is
136 relativeto the completed response time.
</xs:documentation ></xs:annotation >
</xs:element >141 <xs:element name="maxRequestsAWindow" type="xs:int"
default="0" minOccurs="0" maxOccurs="1"><xs:annotation >
<xs:documentation >A max number of request within a singleLocation
146 state. If the location condition is fulfilled requestwill bescheduled based on the relate locationCron schedule ,butthis
151 might be to many so the per location window count mayberestricted. 0 = unbound </xs:documentation >
</xs:annotation ></xs:element >
156 <xs:element name="maxRequestsTotal" type="xs:int"default="0" minOccurs="0" maxOccurs="1"><xs:annotation >
<xs:documentation >the total count of request which are issued.0
161 = unbound </xs:documentation ></xs:annotation >
</xs:element ><xs:element name="locationCondition" type="LocationConditionType"
minOccurs="0" maxOccurs="1">166 <xs:annotation >
<xs:documentation >Defines a location based request condition.Triggers a request when met , is not ensuring an instantaction.This features requires a continues location monitoring.
171 </xs:documentation ></xs:annotation >
</xs:element ><xs:element name="triggerAfterMovingXMeter" type="xs:int"
maxOccurs="1" minOccurs="0" />176 <xs:element name="question" type="xs:string" maxOccurs="1"
minOccurs="1" /><xs:element name="suspend" type="xs:boolean" default="true"
minOccurs="0" maxOccurs="1" /><!-- 15min snooz -->
181 <xs:element name="snoozeTime" type="xs:long" default="900000"minOccurs="0" maxOccurs="1" />
</xs:sequence >
</xs:complexType >186 </xs:element >
<xs:element name="repeatOnServerCondition"><xs:complexType >
<xs:sequence ><xs:element name="cron" type="xs:string" minOccurs="0"
191 maxOccurs="1"><xs:annotation >
<xs:documentation >Repeats the server updates , based on the rule.The standard cron notation is used as incrontabs , implemented
196 by the cron4j(http://www.sauronsoftware.it/projects/cron4j/manual.php)implementation.</xs:documentation >
</xs:annotation ></xs:element >
201 <xs:element name="locationCondition" type="LocationConditionType"minOccurs="0" maxOccurs="1"><xs:annotation >
<xs:documentation >Similar to the local condition updates are
80

A. Appendix
only triggered if users are in a certain area.206 </xs:documentation >
</xs:annotation ></xs:element ><xs:element name="triggerAfterMovingXMeter" type="xs:int"
maxOccurs="1" minOccurs="0" />211 </xs:sequence >
</xs:complexType ></xs:element >
</xs:sequence ></xs:complexType >
216
<xs:complexType name="SensorDataType"><xs:sequence maxOccurs="unbounded">
<xs:choice >221 <xs:element name="choice" type="ChoiceOptionsType" />
<xs:element name="simple" type="SimpleTypedOptionsType" /><xs:element name="virtual" type="VirtualSensorOptionsType" /><xs:element name="device" type="DeviceInfoOptionsType" /><xs:element name="gps" type="GPSOptionsType" />
226 <xs:element name="wifi" type="WifiOptionsType" /><xs:element name="sensor" type="SensorOptionsType" />
</xs:choice ></xs:sequence >
</xs:complexType >231
<xs:complexType name="ICustomType"><xs:complexContent >
<xs:extension base="PluginType"><xs:sequence >
236 <xs:element name="type" type="TypeEnum" maxOccurs="1"minOccurs="1" />
<xs:element name="description" type="DescriptionType"maxOccurs="1" minOccurs="1" />
</xs:sequence >241 </xs:extension >
</xs:complexContent ></xs:complexType >
246<xs:complexType name="INamedDataType">
<xs:complexContent ><xs:extension base="PluginType"></xs:extension >
251 </xs:complexContent ></xs:complexType >
<xs:complexType name="PluginType"><xs:sequence >
256 <xs:element name="name" maxOccurs="1" minOccurs="1"type="xs:string" />
<xs:element name="required" type="xs:boolean" maxOccurs="1"minOccurs="0" />
</xs:sequence >261 </xs:complexType >
<xs:complexType name="WifiOptionsType"><xs:complexContent >
<xs:extension base="INamedDataType">266 <xs:sequence >
<xs:element name="maxEntries" type="xs:positiveInteger"maxOccurs="1" minOccurs="0" />
<xs:element name="filter" maxOccurs="1" minOccurs="0"type="WifiFilterType" />
271 </xs:sequence ></xs:extension >
</xs:complexContent ></xs:complexType >
276 <xs:complexType name="WifiFilterType"><xs:sequence >
<xs:element name="including" type="wifiEntries" maxOccurs="1"
81

A. Appendix
minOccurs="0" /><xs:element name="excluding" type="wifiEntries" maxOccurs="1"
281 minOccurs="0" /></xs:sequence >
</xs:complexType >
<xs:complexType name="wifiEntries">286 <xs:sequence minOccurs="1" maxOccurs="1">
<xs:element name="entry" type="WifiEntryType" maxOccurs="unbounded"minOccurs="1" />
</xs:sequence ></xs:complexType >
291<xs:complexType name="WifiEntryType">
<xs:sequence ><xs:element name="key" type="WifiEntriesEnum" maxOccurs="1"
minOccurs="1" />296 <xs:element name="value" maxOccurs="1" minOccurs="1"
type="xs:string" /></xs:sequence >
</xs:complexType >
301 <xs:simpleType name="WifiEntriesEnum"><xs:restriction base="xs:string">
<xs:enumeration value="bssid" /><xs:enumeration value="ssid" /><xs:enumeration value="frequency" />
306 <xs:enumeration value="min_signal_level" /><xs:enumeration value="max_signal_level" /><xs:enumeration value="flags" />
</xs:restriction ></xs:simpleType >
311
<xs:complexType name="ChoiceOptionsType"><xs:complexContent >
<xs:extension base="ICustomType">316 <xs:sequence >
<xs:element name="choiceType" minOccurs="1" maxOccurs="1"type="ChoiceType" />
<xs:element name="minSelection" type="xs:positiveInteger"minOccurs="0" maxOccurs="1" />
321 <xs:element name="maxSelection" type="xs:positiveInteger"minOccurs="0" maxOccurs="1" />
<xs:element name="default" type="xs:nonNegativeInteger"default="0" minOccurs="0" maxOccurs="1" />
<xs:element name="enum">326 <xs:complexType >
<xs:sequence minOccurs="1" maxOccurs="1"><xs:element name="element" minOccurs="2" maxOccurs="unbounded"
type="xs:string" /></xs:sequence >
331 </xs:complexType ></xs:element >
</xs:sequence ></xs:extension >
</xs:complexContent >336 </xs:complexType >
<xs:simpleType name="ChoiceType"><xs:restriction base="xs:string">
<xs:enumeration value="singelChoice" />341 <xs:enumeration value="multipleChoice" />
</xs:restriction ></xs:simpleType >
<xs:complexType name="SimpleTypedOptionsType">346 <xs:complexContent >
<xs:extension base="ICustomType"><xs:sequence >
<xs:element name="regexp" type="xs:string" default="0"minOccurs="0" maxOccurs="1" />
351 </xs:sequence ></xs:extension >
82

A. Appendix
</xs:complexContent ></xs:complexType >
356 <xs:complexType name="VirtualSensorOptionsType"><xs:complexContent >
<xs:extension base="ICustomType"><xs:sequence >
<xs:element name="userInteraction" type="xs:boolean"361 minOccurs="1" maxOccurs="1">
<xs:annotation ><xs:documentation >If the plugin is not requeierd to be started
the user it might be run in the background. </xs:documentation ></xs:annotation >
366 </xs:element ><xs:element name="uri" type="xs:string" minOccurs="1"
maxOccurs="1"><xs:annotation >
<xs:documentation >The uri for starting an external application ,371 this can be either in the form com.example.some.Class , or a
content uri , see the Intent documentation for more information:http: // developer.android.com/reference/android/content/Intent.html
</xs:documentation ></xs:annotation >
376 </xs:element ><xs:element name="options" minOccurs="0" maxOccurs="1"
type="xs:string" ><xs:annotation >
<xs:documentation >A key:value comma seperated list of options provided to the plugin.</xs:documentation >
381 </xs:annotation ></xs:element ><xs:element name="installLocation" minOccurs="1"
maxOccurs="1" type="xs:string" ><xs:annotation >
<xs:documentation >A location where to obtain the plugin , if not installed.</xs:documentation >386 </xs:annotation ></xs:element >
</xs:sequence ></xs:extension >
</xs:complexContent ></xs:complexType >
391<xs:complexType name="DeviceInfoOptionsType">
<xs:complexContent ><xs:extension base="INamedDataType">
<xs:sequence >396 <xs:element name="deviceModel" type="xs:boolean"
default="true" minOccurs="0" maxOccurs="1" /><xs:element name="deviceOS" type="xs:boolean" default="true"
minOccurs="0" maxOccurs="1" /><xs:element name="deviceOSKernelVersion" type="xs:boolean"
401 default="true" minOccurs="0" maxOccurs="1" /><xs:element name="deviceNetworkProviderName" type="xs:boolean"
default="false" minOccurs="0" maxOccurs="1" /><xs:element name="deviceNetworkProviderNetworkType"
type="xs:boolean" default="false" minOccurs="0" maxOccurs="1" />406 <xs:element name="deviceNetworkProviderPhoneType" type="xs:boolean"
default="false" minOccurs="0" maxOccurs="1" /><xs:element name="deviceNetworkProviderRssi" type="xs:boolean"
default="false" minOccurs="0" maxOccurs="1" /><xs:element name="deviceNetworkProviderCid" type="xs:boolean"
411 default="false" minOccurs="0" maxOccurs="1" /><xs:element name="deviceNetworkProviderLac" type="xs:boolean"
default="false" minOccurs="0" maxOccurs="1" /><xs:element name="deviceNetworkProviderBaseStationId"
type="xs:boolean" default="false" minOccurs="0" maxOccurs="1" />416 <xs:element name="deviceNetworkProviderNetworkId" type="xs:boolean"
default="false" minOccurs="0" maxOccurs="1" /><xs:element name="deviceNetworkProviderSystemId" type="xs:boolean"
default="false" minOccurs="0" maxOccurs="1" /><xs:element name="deviceNetworkProviderBaseStationPosition"
421 type="xs:boolean" default="false" minOccurs="0" maxOccurs="1" />
</xs:sequence ></xs:extension >
</xs:complexContent >
83
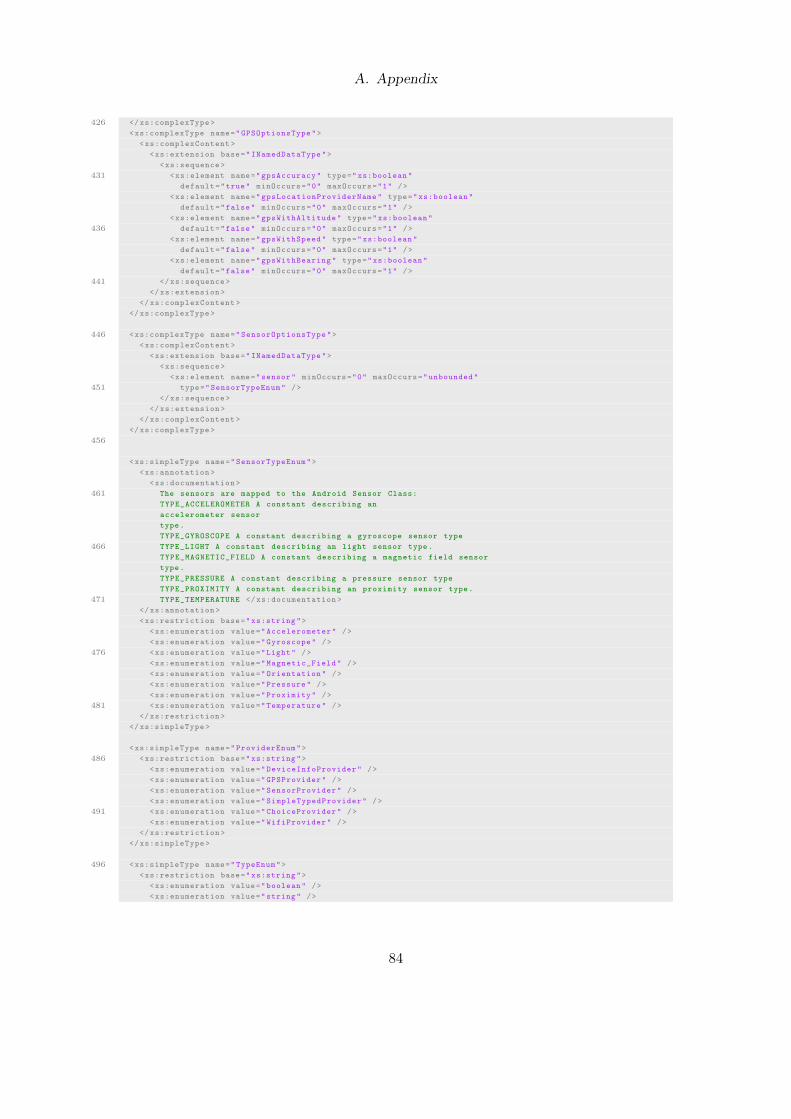
A. Appendix
426 </xs:complexType ><xs:complexType name="GPSOptionsType">
<xs:complexContent ><xs:extension base="INamedDataType">
<xs:sequence >431 <xs:element name="gpsAccuracy" type="xs:boolean"
default="true" minOccurs="0" maxOccurs="1" /><xs:element name="gpsLocationProviderName" type="xs:boolean"
default="false" minOccurs="0" maxOccurs="1" /><xs:element name="gpsWithAltitude" type="xs:boolean"
436 default="false" minOccurs="0" maxOccurs="1" /><xs:element name="gpsWithSpeed" type="xs:boolean"
default="false" minOccurs="0" maxOccurs="1" /><xs:element name="gpsWithBearing" type="xs:boolean"
default="false" minOccurs="0" maxOccurs="1" />441 </xs:sequence >
</xs:extension ></xs:complexContent >
</xs:complexType >
446 <xs:complexType name="SensorOptionsType"><xs:complexContent >
<xs:extension base="INamedDataType"><xs:sequence >
<xs:element name="sensor" minOccurs="0" maxOccurs="unbounded"451 type="SensorTypeEnum" />
</xs:sequence ></xs:extension >
</xs:complexContent ></xs:complexType >
456
<xs:simpleType name="SensorTypeEnum"><xs:annotation >
<xs:documentation >461 The sensors are mapped to the Android Sensor Class:
TYPE_ACCELEROMETER A constant describing anaccelerometer sensortype.TYPE_GYROSCOPE A constant describing a gyroscope sensor type
466 TYPE_LIGHT A constant describing an light sensor type.TYPE_MAGNETIC_FIELD A constant describing a magnetic field sensortype.TYPE_PRESSURE A constant describing a pressure sensor typeTYPE_PROXIMITY A constant describing an proximity sensor type.
471 TYPE_TEMPERATURE </xs:documentation ></xs:annotation ><xs:restriction base="xs:string">
<xs:enumeration value="Accelerometer" /><xs:enumeration value="Gyroscope" />
476 <xs:enumeration value="Light" /><xs:enumeration value="Magnetic_Field" /><xs:enumeration value="Orientation" /><xs:enumeration value="Pressure" /><xs:enumeration value="Proximity" />
481 <xs:enumeration value="Temperature" /></xs:restriction >
</xs:simpleType >
<xs:simpleType name="ProviderEnum">486 <xs:restriction base="xs:string">
<xs:enumeration value="DeviceInfoProvider" /><xs:enumeration value="GPSProvider" /><xs:enumeration value="SensorProvider" /><xs:enumeration value="SimpleTypedProvider" />
491 <xs:enumeration value="ChoiceProvider" /><xs:enumeration value="WifiProvider" />
</xs:restriction ></xs:simpleType >
496 <xs:simpleType name="TypeEnum"><xs:restriction base="xs:string">
<xs:enumeration value="boolean" /><xs:enumeration value="string" />
84

A. Appendix
<xs:enumeration value="int" />501 <xs:enumeration value="double" />
<xs:enumeration value="float" /><xs:enumeration value="dateTime" /><xs:enumeration value="date" /><xs:enumeration value="timePoint" />
506 <xs:enumeration value="timeInterval" /><xs:enumeration value="position" /><xs:enumeration value="splDb" />
</xs:restriction ></xs:simpleType >
511
<xs:simpleType name="double3"><xs:list itemType="xs:double" />
516 </xs:simpleType ><xs:simpleType name="double3_res">
<xs:restriction base="double3"><xs:length value="3" />
</xs:restriction >521 </xs:simpleType >
<xs:simpleType name="double2"><xs:list itemType="xs:double" />
526 </xs:simpleType ><xs:simpleType name="double2_res">
<xs:restriction base="double2"><xs:length value="2" />
</xs:restriction >531 </xs:simpleType >
<xs:simpleType name="float3"><xs:list itemType="xs:float" />
536 </xs:simpleType ><xs:simpleType name="float3_res">
<xs:restriction base="float3"><xs:length value="3" />
</xs:restriction >541 </xs:simpleType >
<xs:simpleType name="float2"><xs:list itemType="xs:float" />
</xs:simpleType >546 <xs:simpleType name="float2_res">
<xs:restriction base="float2"><xs:length value="2" />
</xs:restriction ></xs:simpleType >
551<xs:complexType name="IConditionType"></xs:complexType >
<xs:complexType name="ConditionType">556
</xs:complexType >
<xs:complexType name="LocationConditionType">561 <xs:complexContent >
<xs:extension base="IConditionType"><xs:sequence minOccurs="1">
<xs:element name="inside" type="BoundingLocationType"minOccurs="0" maxOccurs="1" />
566 <xs:element name="outside" type="BoundingLocationType"minOccurs="0" maxOccurs="1" />
</xs:sequence ></xs:extension >
</xs:complexContent >571 </xs:complexType >
<xs:simpleType name="BoxType">
85

A. Appendix
<xs:annotation ><xs:documentation >Two pairs of [lat lng] elements , composing a
576 boxwith NW and SE points of compass. </xs:documentation >
</xs:annotation ><xs:restriction >
<xs:simpleType >581 <xs:list itemType="xs:double" />
</xs:simpleType ><xs:length value="4" />
</xs:restriction ></xs:simpleType >
586<xs:simpleType name="CircleType">
<xs:annotation ><xs:documentation >A circle composed of [lat lng radius] measured
in591 meter. </xs:documentation >
</xs:annotation ><xs:restriction >
<xs:simpleType ><xs:list itemType="xs:double" />
596 </xs:simpleType ><xs:length value="3" />
</xs:restriction ></xs:simpleType >
601 <xs:simpleType name="PolygonType"><xs:annotation >
<xs:documentation >A polygon is composed of [lat lng lat lng ...]pairs specifyed in counter clock order. A serias of 3 pairs isvalid. </xs:documentation >
606 </xs:annotation ><xs:restriction >
<xs:simpleType ><xs:list itemType="xs:double" />
</xs:simpleType >611 <xs:minLength value="6" />
</xs:restriction ></xs:simpleType >
<!--TODO Find a way to avoid generating JAXBElemet , thus db4o is not interfearing616 with the simple type definition -->
<xs:complexType name="BoundingLocationType"><xs:sequence >
<xs:choice ><xs:element name="box" type="BoxType" />
621 <xs:element name="circle" type="CircleType" /><xs:element name="polygon" type="PolygonType" />
</xs:choice ></xs:sequence >
</xs:complexType >626
<xs:simpleType name="DescriptionType"><xs:restriction base="xs:string">
<xs:minLength value="10" /></xs:restriction >
631 </xs:simpleType >
<xs:complexType name="NotificationType"><xs:annotation >
<xs:documentation >How to notify the user , when a request condition636 kicks in. A list of methods , with attributes to repeat a
notification , the time between the a notification sequence and thenotification sequence wich is a list of ints where every odd valueis the duration of a signal and every even a pause (in msec).
</xs:documentation >641 </xs:annotation >
<xs:sequence ><xs:element name="notifyBySound" minOccurs="0" maxOccurs="1">
<xs:complexType ><xs:group ref="repeatNotificationGroup" />
646 </xs:complexType ></xs:element >
86

A. Appendix
<xs:element name="notifyByDisplay" minOccurs="0"maxOccurs="1"><xs:complexType >
651 <xs:group ref="repeatNotificationGroup" /></xs:complexType >
</xs:element ><xs:element name="notifyByVibration" minOccurs="0"
maxOccurs="1">656 <xs:complexType >
<xs:group ref="repeatNotificationGroup" /></xs:complexType >
</xs:element ></xs:sequence >
661</xs:complexType >
<xs:group name="repeatNotificationGroup">666 <xs:sequence >
<xs:element name="repeatXTimes" type="xs:nonNegativeInteger"minOccurs="0" maxOccurs="1" />
<xs:element name="pauseBetweenRepeat" type="xs:nonNegativeInteger"minOccurs="0" maxOccurs="1" />
671 <xs:element name="sequence" minOccurs="0" maxOccurs="1"><xs:simpleType >
<xs:list itemType="xs:nonNegativeInteger" /></xs:simpleType >
</xs:element >676 </xs:sequence >
</xs:group >
</xs:schema >
Listing A.1: request.xsd - The Request schema.
A.2. Noise Pollution Scenario Request
Below is the example Request, which is based on the Request scheme and used in thenoise pollution scenario, which was also conducted a small user evaluation.
1 <?xml version="1.0" encoding="UTF -8"?>
<request xmlns:xsi="http://www.w3.org /2001/ XMLSchema -instance"xsi:schemaLocation="request request.xsd" xmlns="request">
6 <uuid>19</uuid><options >
<allowUserExecution >true</allowUserExecution ><repeatOnLocalCondition >
<locationCondition >11 <inside >
<polygon >52.513009 13.31972152.517905 13.32128852.519616 13.323283
16 52.519067 13.32639552.515777 13.33186652.513609 13.33572952.508973 13.33270352.50674 13.330643
21 52.508947 13.32431352.512055 13.31997952.513009 13.319721
</polygon ></inside >
26 </locationCondition ><triggerAfterMovingXMeter >50</triggerAfterMovingXMeter ><question >Do you might to answer the Request now?</question >
</repeatOnLocalCondition >
87
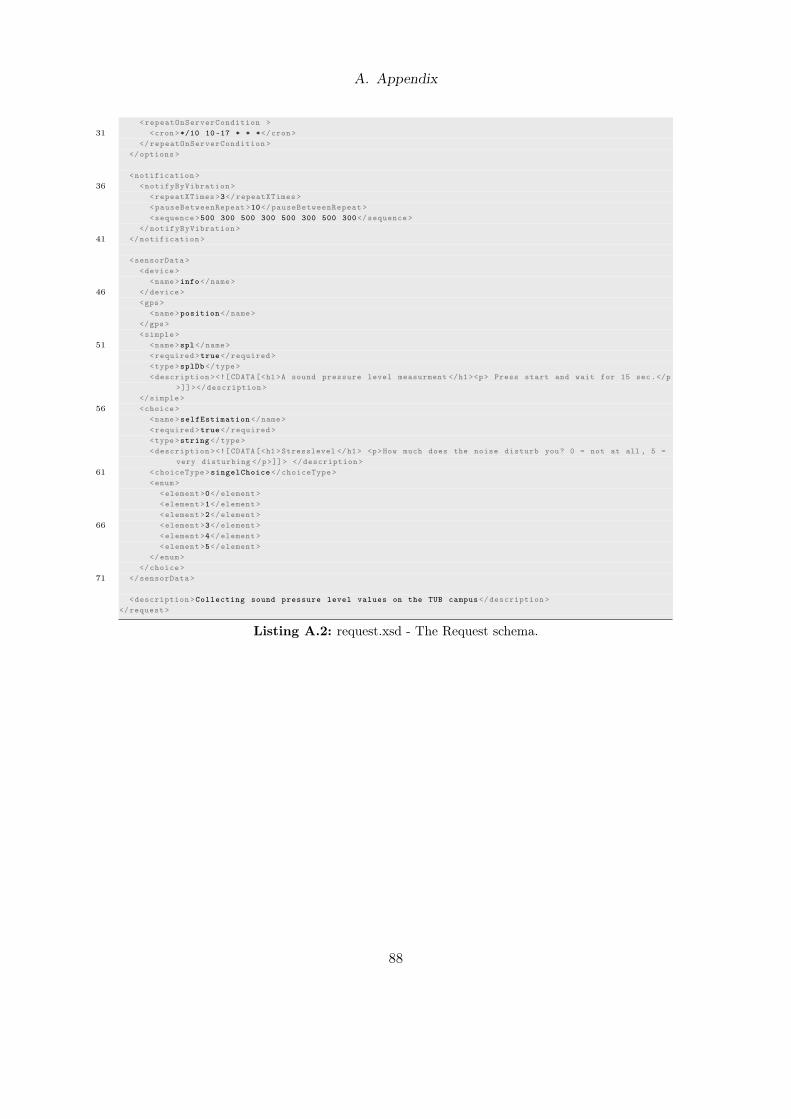
A. Appendix
<repeatOnServerCondition >31 <cron>*/10 10-17 * * *</cron>
</repeatOnServerCondition ></options >
<notification >36 <notifyByVibration >
<repeatXTimes >3</repeatXTimes ><pauseBetweenRepeat >10</pauseBetweenRepeat ><sequence >500 300 500 300 500 300 500 300</sequence >
</notifyByVibration >41 </notification >
<sensorData ><device >
<name>info</name>46 </device >
<gps><name>position </name>
</gps><simple >
51 <name>spl</name><required >true</required ><type>splDb </type><description ><![CDATA[<h1>A sound pressure level measurment </h1><p> Press start and wait for 15 sec.</p
>]]></description ></simple >
56 <choice ><name>selfEstimation </name><required >true</required ><type>string </type><description ><![CDATA[<h1>Stresslevel </h1> <p>How much does the noise disturb you? 0 = not at all , 5 =
very disturbing </p>]]> </description >61 <choiceType >singelChoice </choiceType >
<enum><element >0</element ><element >1</element ><element >2</element >
66 <element >3</element ><element >4</element ><element >5</element >
</enum></choice >
71 </sensorData >
<description >Collecting sound pressure level values on the TUB campus </description ></request >
Listing A.2: request.xsd - The Request schema.
88

Bibliography
AO Adewumi and JO Daramola. Enhancing Election Monitoring and Observation usingE-Messaging Tools. Realising a Stable Democratic Political System in Nigeria: IT Tools& Strategies (RESDEMIT 2010), 2010. URL http://eprints.covenantuniversity.edu.ng/1/1/REsdemit_2010_paper_template-2.pdf. 3
A. Akl and S. Valaee. Accelerometer-based gesture recognition via dynamic-time warping,affinity propagation, & compressive sensing. In Acoustics Speech and Signal Processing(ICASSP), 2010 IEEE International Conference on, pages 2270–2273. IEEE, 2010.URL http://www.comm.toronto.edu/~valaee/Publications/10-Akl-ICASSP.pdf.2.5, 2.7.2
R.G. Aldunate, F. Pena-Mora, and G.E. Robinson. Collaborative distributed decisionmaking for large scale disaster relief operations: Drawing analogies from robust naturalsystems. Complexity, 11(2):28–38, 2005. ISSN 1099-0526. 2.1.1
M. Baldauf, S. Dustdar, and F. Rosenberg. A survey on context-aware systems. In-ternational Journal of Ad Hoc and Ubiquitous Computing, 2(4):263–277, 2007. ISSN1743-8225. 4.3.1
J. Burke, D. Estrin, M. Hansen, A. Parker, N. Ramanathan, S. Reddy, and M. B. Sri-vastava. Participatory sensing. In In: Workshop on World-Sensor-Web (WSWÕ06):Mobile Device Centric Sensor Networks and Applications, pages 117–134, 2006. doi:10.1.1.122.3024. 1.3, 2.1, 2.2, 3
J. Chinnow, V. Helmut, A. Kraft, and B. Seitz. Architektur und fallbeispiel der geraete-und software-fernwartung in smartsenior. Ambient Assisted Living-AAL, 2011. 2.1.1
Audrey Colbrant, Jacques Lemordant, and Phuntsok Dorjee. A Low-Cost Global Net-work for Data Collection and Query. In 2nd Extreme Workshop on Communica-tion, pages http://www.cs.st–andrews.ac.uk/ fehmi/extremecom/2010/program.html,Dharamsala Inde, 09 2010. URL http://hal.inria.fr/docs/00/54/03/72/PDF/ExtremeCom10.pdf. 2.7.1
J. Crowcroft, E. Yoneki, R. Martí, and C. Martínez-García. Using Haggle to Create anElectronic Triage Tag. 2010. 2.1.1
S. Gaonkar, J. Li, R.R. Choudhury, L. Cox, and A. Schmidt. Micro-blog: Sharing andquerying content through mobile phones and social participation. In Proceeding ofthe 6th international conference on Mobile systems, applications, and services, pages174–186. ACM, 2008. 3
89

Bibliography
Z. He, L. Jin, L. Zhen, and J. Huang. Gesture recognition based on 3D accelerometerfor cell phones interaction. In Circuits and Systems, 2008. APCCAS 2008. IEEE AsiaPacific Conference on, pages 217–220. IEEE, 2009. URL http://ieeexplore.ieee.org/stamp/stamp.jsp?tp=&arnumber=4745999. 2.7.2
K.F.G.I.J. Kannan, F. Silveira, and N. Taft. A Disruption-Tolerant Architecture forSecure and Efficient Disaster Response Communications. 2010. 2.1.1, 2.7.1
E. Miluzzo, N. Lane, S. Eisenman, and A. Campbell. CenceMe–injecting sensing presenceinto social networking applications. Smart Sensing and Context, pages 1–28, 2007. URLhttp://nslab.ee.ntu.edu.tw/NetworkSeminar/papers/sensys08.pdf. 2.7.3, 3
R. Munro. Haiti Emergency Response: the power of crowdsourcing and SMS. Haiti CrisisRelief, 2, 2010. URL http://www.mission4636.org/media//2010/03/mission4636.pdf. 2.1.1
E. Nordstroem, P. Gunningberg, and C. Rohner. A search-based network architecturefor mobile devices. Technical report, Technical Report 2009-003, Uppsala University,2009. 2.7.1
O. Okolloh. Ushahidi, or" testimony": Web 2.0 tools for crowdsourcing crisis in-formation. Change at Hand: Web 2.0 for development, 59:65–70, 2009. URLhttp://www.kmafrica.com/files/Web. 3
Sasank Reddy, Katie Shilton, Gleb Denisov, Christian Cenizal, Deborah Estrin, andMani B. Srivastava. Biketastic: sensing and mapping for better biking. In Elizabeth D.Mynatt, Don Schoner, Geraldine Fitzpatrick, Scott E. Hudson, W. Keith Edwards, andTom Rodden, editors, CHI, pages 1817–1820. ACM, 2010. ISBN 978-1-60558-929-9.URL http://doi.acm.org/10.1145/1753326.1753598. 2.1.1
Takeshi Sakaki, Makoto Okazaki, and Yutaka Matsuo. Earthquake shakes twitter users:real-time event detection by social sensors. In Proceedings of the 19th internationalconference on World wide web, WWW ’10, pages 851–860, New York, NY, USA, 2010.ACM. ISBN 978-1-60558-799-8. doi: http://doi.acm.org/10.1145/1772690.1772777.URL http://doi.acm.org/10.1145/1772690.1772777. 2.1.1
Noah Snavely, Rahul Garg, Steven M. Seitz, and Richard Szeliski. Finding paths throughthe world’s photos. ACM Transactions on Graphics (Proceedings of SIGGRAPH 2008),27(3):11–21, 2008. 2.1.1
Emmanuel Munguia Tapia, Stephen S. Intille, William Haskell, Kent Larson, JulieWright, Abby King, and Robert Friedman. R.: Real-time recognition of physicalactivities and their intensities using wireless accelerometers and a heart monitor. InIn: Proc. Int. Symp. on Wearable Comp, 2007. URL http://web.media.mit.edu/~intille/papers-files/MunguiaTapiaIntilleETAL07.pdf. 2.7.3
90

Bibliography
Sarah Underwood. Improving disaster management. Commun. ACM, 53:18–20, February2010. ISSN 0001-0782. doi: http://doi.acm.org/10.1145/1646353.1646362. URL http://doi.acm.org/10.1145/1646353.1646362. 2.1.1, 3
M. Zook, M. Graham, T. Shelton, and S. Gorman. Volunteered geographic informationand crowdsourcing disaster relief: a case study of the Haitian earthquake. World Med-ical & Health Policy, 2(2):2, 2010. URL http://www.psocommons.org/wmhp/vol2/iss2/art2. 1.3, 2.1.1
91