Disaster Logistics - http
80
Disaster Logistics A study on logistics performance management in disasters K. Koenen 13/08/2007
-
Upload
khangminh22 -
Category
Documents
-
view
3 -
download
0
Transcript of Disaster Logistics - http
Disaster Logistics
A study on logistics performance management in disasters
K. Koenen
13/08/2007

Kevin Koenen - 2 - 13/08/2007
Disaster Logistics
A study on logistics performance management in disasters
Core text = 14 997 words / 40 pages
Master Thesis Logistics & Operations Management
Department of Organization & Strategy
Faculty of Economics and Business Administration
Tilburg University
K. Koenen
13/08/2007
Supervisor: Dr. Ir. Cindy M.H. Kuijpers Second reader: Prof. Dr. Ir. Hein A. Fleuren

Kevin Koenen - 3 - 13/08/2007
Management summary
Disaster logistics is defined as: The planning, implementation and control of all activities
relating to the flow of goods, materials, personnel and the associated information and capital,
from the source (f.e. the supplier or donor) to the final user (f.e. the beneficiaries) in times of
disaster. This task is performed in an uncertain and ad-hoc environment and the ultimate
goal is to perform the task as efficient and cost-effective as possible in order to alleviate the
suffering of weak and vulnerable people in affected areas as soon as possible.
Specific challenges to the disaster logistics function of aid agencies are the aid agency
principles and the concept of the humanitarian space. Moreover, operational challenges, the
complexity of disaster situations, the different stakeholders involved and the collaboration
between them is also a big challenge for disaster logistics. Finally, also learning challenges,
information technology challenges and organizational challenges occur in disaster logistics.
Business sector performance measures and standards in the functional areas of
transportation, warehousing, inventory, purchasing, production and order processing can be
transferred to disaster logistics; however, some measures need adjustments. Similarly,
supply chain comprehensive measures can be applicable to disaster logistics.
In terms of standards setting, the use of internal improvement standards, historical standards
and (non-)competitive benchmarking are the most appropriate ones to be transferred to
disaster logistics. The Sphere-approach to setting standards in aid agencies is useful but
further extension is required in order to be useful for disaster logistics.
The use of scorecard-like measurement systems is also applicable in disaster logistics. The
balanced scorecard from the business sector, together with the Davidson (2006) attempt in
disaster logistics provide a good basis which should be extended even more in the future.
The main benefits for disaster logistics to apply performance management include the
improvement possibility the concept has for disaster logistics as a function, but also for aid
agency operations as a whole. Moreover, performance management can keep track of the
amount of logistical knowledge in the field and thereby limit the learning challenges within
disaster logistics. Another benefit includes the fact that performance management also
means standardization, which helps in improving collaboration and coordination among
stakeholders in disaster logistics.
Also, the use of performance management provides a way for aid agency to objectively proof
their effectiveness and efficiency by means of hard, quantitative data. This first of all tackles
the accountability challenges imposed by donors, but it can also be used to transfer disaster
logistics from a peripheral function to a strategic function within aid agencies.
Kevin Koenen - 4 - 13/08/2007
Preface
This is my Masters Thesis, which will form the closure of the 2006-2007 program of Logistics
& Operations Management at Tilburg University. The topic is performance management in
disaster logistics, bringing together two different fields: the business world including
conventional logistics and performance management on the one hand, and the humanitarian
world including aid agencies and disaster logistics on the other.
Up until five to ten years ago these two fields did not see any benefit in cooperating: the
business world was too focussed on making money, while the humanitarian world was trying
to save lives and do good at any cost.
In the last ten years, practise has shown that the two distinct fields grew towards each other,
needed each other and actually should learn from each other. The business world is
increasingly focussing on corporate social responsibility and recognizes it can learn from the
complexity associated with disasters. The humanitarian world recognizes that it can learn
from the business world in terms of efficiency and can benefit from the resources the
business world has to offer.
This thesis tries to extend this view within the field of logistics performance management. I
hope people like to read this thesis and afterwards they will share my opinion that the
business world and the humanitarian world should increase their cooperation.
Under the assumption that I survive my defence on August 28th 2007 I do need to thank a
few people for their help and support throughout my seven months of writing. First of all I
would like to thank my friends, roommates and family for supporting me throughout my
studies. Especially my parents deserve a big thanks for giving me the opportunity to study for
five years and for supporting me in everything I did during these five years.
Second, I would like to thank my supervisor, Cindy Kuijpers. Your comments were some
times frustrating for me and sometimes I wondered if I was doing all right. But in the end I
can say that most of the comments you gave were valid and made me think about what I
wrote more critically.
Finally, I would like to thank Krista Kammeraad for being able to discuss our ideas about
disaster logistics, and Mr. Nicolas Romero and Ms. Esther Bosgra of TNT’s ‘Moving the
World’ for providing the background and practical information on the TNT-WFP partnership.
Kevin Koenen,
13/08/2007.

Kevin Koenen - 5 - 13/08/2007
Table of content
MANAGEMENT SUMMARY 3
PREFACE 4
TABLE OF CONTENT 5
CHAPTER 1 INTRODUCTION 7
Section 1.1 Background 7
Section 1.2 Problem indication 8
Section 1.3 Problem statement 9
Section 1.4 Research questions 9
Section 1.5 Research design 10
Section 1.6 Structure 11
CHAPTER 2 DISASTER LOGISTICS 12
Section 2.1 Introduction 12
Section 2.2 Defining disaster 12
Section 2.3 Defining disaster logistics 14
Section 2.4 Disaster management phases 16
CHAPTER 3 PROCESSES AND CHALLENGES IN DISASTER LOGISTICS 17
Section 3.1 Introduction 17
Section 3.2 Disaster logistics stakeholders 17
Section 3.3 Disaster logistics activities 20
Section 3.4 Disaster logistics flows 21
Section 3.5 Disaster logistics processes 22
Section 3.6 Aid agency principles 24
Section 3.7 Operational challenges 25
Section 3.8 Disaster logistics learning challenges 26
Section 3.9 Other challenges 27
CHAPTER 4 PERFORMANCE MEASUREMENT AND –MANAGEMENT 28
Section 4.1 Introduction 28
Section 4.2 Performance, performance measurement and –management 28
Section 4.3 Logistical performance measures 29
Section 4.4 Standards & benchmarks 30
Section 4.5 Performance management systems 31
CHAPTER 5 DISASTER LOGISTICS PERFORMANCE MANAGEMENT 33
Section 5.1 Introduction 33
Section 5.2 Disaster logistics performance 33

Kevin Koenen - 6 - 13/08/2007
Section 5.3 Sphere’s minimum standards 33
Section 5.4 Participatory performance management 34
Section 5.5 Davidson’s performance indicators for disaster logistics 35
Section 5.6 Obstacles to performance management in disaster logistics 36
CHAPTER 6 APPLYING BUSINESS SECTOR PERFORMANCE
MANAGEMENT APPROACHES TO DISASTER LOGISTICS 38
Section 6.1 Introduction 38
Section 6.2 Performance measures in disaster logistics 38
Section 6.3 Standards & benchmarks in disaster logistics 39
Section 6.4 Balanced scorecard in disaster logistics 40
Section 6.5 Benefits for disaster logistics 41
CHAPTER 7 CONCLUSIONS, RECOMMENDATIONS & LIMITATIONS 44
Section 7.1 Conclusions 44
Section 7.2 Recommendations 45
Section 7.3 Limitations 46
REFERENCES 47
APPENDIX A DISASTER FIGURES 54
APPENDIX B DISASTER DEFINITIONS 56
Section B.1 Natural disasters 56
Section B.2 Technological disasters 58
Section B.3 Other disasters 59
APPENDIX C IFRC PRINCIPLES 60
APPENDIX D BUSINESS SECTOR PERFORMANCE MEASURES 61
APPENDIX E TNT-WFP KEY PERFORMANCE INDICATORS 68
Section E.1 Key performance indicators 68
Section E.2 Further explanation of the KPI’s 68
Section E.3 Discussion 70
APPENDIX F SPHERE-PROJECT STANDARDS 72
Section F.1 Common standards 72
Section F.2 Minimum standards in water supply, sanitation and hygiene 73
Section F.3 Minimum standards in food security, nutrition and food aid 74
Section F.4 Minimum standards in shelters, settlements & non-food-items 75
Section F.5 Minimum standards in health services 77
APPENDIX G Alphabetical index 79

Kevin Koenen - 7 - 13/08/2007
Chapter 1 Introduction
Section 1.1 Background
Hurricane Katrina, the Asian Tsunami, the 2005 Pakistan earthquake, the 9-11 world trade
centre drama and the 2005-2006 Malawi food crisis, are just a few disasters which struck the
world during the last few years and there is no reason the believe that these types of
humanitarian crisis’s will decrease. On the contrary, from 1975 until 2006, natural disasters
have increased by 5,8% annually (figure 1.1) and especially the number and impact of
natural disasters has rapidly increased over the last few decades (figure A.1, appendix A).
Moreover, aid donors are hard to find and aid agency budgets are generally low. Therefore
better and more efficient operations are important and aid agencies should invest in
improving its operations in order to cope with the trend of increasing numbers of disasters
(figure A.1 & A.3, appendix A) and the growth trend in numbers of people affected and killed
by disasters (figure A.2 & A.4, appendix A).
Figure 1.1, Time trend of natural disasters 1975-2006 (EM-DAT, 2007)
But why should these aid agencies improve? Where in the organization are the opportunities
to improve? And in what way should these organizations improve? These are all questions
that remain and an answer to these questions could be provided by means of measuring
actual performance, reporting quantitative data and by making informed improvement
decisions based on these reports. So, one area for aid agencies to improve in is performance
management. Especially performance management of logistical performance in disaster
relief efforts, so-called disaster logistics. For now, a suitable definition of disaster logistics is
the management, storage and movement of all goods and information to a disaster area.
This chapter introduces the topic of this thesis more extensively and the main aim of the
research is covered. Section 1.2 provides a description of the ‘problem’, which results in a
problem statement that is formed in section 1.3. From this problem statement several
research questions are derived, which are covered in section 1.4. Then section 1.5 covers
research design and data collection, while section 1.6 discusses the structure of this thesis.

Kevin Koenen - 8 - 13/08/2007
Section 1.2 Problem indication
As suggested, improvement in disaster logistics is important for the future operations of aid
agencies, moreover performance measurement could help in improving. Several
humanitarian institutions, such as the Fritz Institute and the Humanitarian Practise Network
also suggest this as an area to improve in. Performance management and -measurement
are concepts commonly used in business settings to monitor and improve company
performance. This already highlights one point why it is very interesting to look at
performance measurement and –management in disaster logistics, namely its improvement
potential. Specific areas in which performance measurement can support improvements
include policy- and process improvements within disaster logistics or programmes and
projects aimed at upgrading the disaster logistics function of aid agencies (IFRC, 2007;
Thomas & Kopczak, 2005; Fritz Institute, 2004).
Another reason why it is very interesting to study performance measurement within disaster
logistics is the observation that several stakeholders have an interest in aid agencies and the
services they provide. In the first place, there are the people in need, actually receiving aid,
the so-called beneficiaries. Second, individuals, companies and countries providing money or
donating goods, the donors, also have an interest. Finally, the media are also very interested
in the services aid agencies provide. According to several authors these stakeholders would
like to know how quickly and efficiently aid agencies are able to respond (Davidson, 2006;
Thomas, 2006), what the impact is of all the money spent (Thomas, 2006; Fritz & Thomas,
2004, Macrae et. al., 2002), and that aid agencies are actually reaching the people in need
(Van Wassenhove, 2006). When aid agencies’ performance and more specifically their
logistics performance is accurately measured and quantified these questions of stakeholders
can be clearly answered and supported by actual facts.
So, there seems to be potential for performance measurement and –management within
disaster logistics and there are interesting reasons to study it. But currently several authors
are indicating that aid agencies are lagging behind in both logistics and performance
management. However these authors remain positive and propose a solution: aid agencies
should learn from normal businesses and their logistics divisions. This so-called business
sector and specifically its performance management approaches within logistics are
suggested to have a large value for aid agencies and disaster logistics (CRED, 2007; Van
Wassenhove, 2006; Davidson, 2006; Hofmann, Roberts, Shoham & Harvey, 2004; Fritz &
Thomas, 2004; Thomas & Mizushima, 2005).
Concluding, studying performance management in disaster logistics is a valid and interesting
concept to study. One the one hand it could support improvements within disaster logistics.
One the other hand it could answer difficult questions of stakeholders. But there still is a long
way to go, because currently performance management in disaster logistics lags behind. And
although business sector approaches could help, the question that still remains is how these
approaches could help!

Kevin Koenen - 9 - 13/08/2007
Section 1.3 Problem statement
From the problem indication, this problem statement was developed:
How can business sector performance management approaches be used to improve disaster
logistics?
The concept of disaster logistics will be further elaborated in the remainder of this thesis, but
it will always be referred to in relation to aid agencies. So whenever disaster logistics is used,
it means disaster logistics for aid agencies involved in relief efforts.
Section 1.4 Research questions
In order to investigate the problem statement these research questions were formed:
What is disaster logistics?
This research question is intended to clarify the concepts of disaster, disaster logistics and
disaster management and forms the basis for covering the other research questions (figure
1.2).
What are the logistical processes and corresponding challenges within disaster logistics?
This second research question will provide the first ‘building block’ for answering the problem
statement (figure 1.2). This research question will result in an overview of the processes,
stakeholders, activities and flows within disaster logistics. Moreover, it will also cover the
principles and challenges associated with disaster logistics.
What are the approaches to logistics performance management in the business sector?
This research question is another ‘building block’ for answering the problem statement (figure
1.2). This research question covers the concept of performance and reviews logistics
performance management within the business sector.
How is disaster logistics performance currently managed?
This research question is the third and final ‘building block’ for answering the problem
statement (figure 1.2). This research question discusses how aid agencies currently manage
and measure their logistical performance and includes a discussion on the concept of
performance and the obstacles to performance management in disaster logistics.
Which business sector performance management approaches can be applied to disaster
logistics and how?
The three ‘building blocks’ are combined in this fourth research question. This research
question results in a discussion on the benefits of applying business sector performance
management to disaster logistics and how it addresses the challenges of disaster logistics
(figure 1.2).

Kevin Koenen - 10 - 13/08/2007
Section 1.5 Research Design
Sekaran (2003) distinguishes two research purposes. The first is an exploratory study, which
is ‘undertaken when not much is known about a situation at hand, or no information is
available on how similar problems or research issues have been solved in the past’. The
second is a descriptive study, which is ‘undertaken in order to ascertain and be able to
describe the characteristics of the variables of interest in a situation’. The first research
questions of this thesis are descriptive since they are meant to define the concepts used, to
describe processes and challenges of disaster logistics and to describe logistics performance
management. However, the final research question and thus the main problem statement of
this thesis can be labelled as exploratory in nature.
The research method used to tackle the problem statement is the literature review, which
includes the documentation of a comprehensive and critical analysis of relevant work of
business- and management research in the area of specific interest to the writer (Maylor &
Blackmon, 2005; Sekaran, 2003). Since the main research method is the literature review,
the most appropriate data collection method is secondary data collection. This is defined as
‘data gathered through already existing sources, including statistical bulletins, government
publications, (un)published information from within or outside organisations, case studies,
library records, online data, websites, etcetera’ (Sekaran, 2003). The entire list of references
and secondary data sources used are available in the references list at the end of this thesis.
The secondary data sources used are sampled from top-journals in the field logistics and
supply chain management or from books published by world renowned publishers. Next to
the academic resources, more practise oriented data sources are used such as the Fritz
Institute, Humanitarian Practise Network and the forced migration review. These sources
give a more practical insight in the humanitarian sector and the current practise in this field.
Also, on 02-07-2007 an interview was performed with Mr. Nicholas Romero at the TNT
headquarters in Hoofddorp, The Netherlands. Mr. Romero is working at the TNT-WFP
partnership called ‘moving the world’. This interview also provided practical insight into
disaster logistics and aid agencies (WPF in particular).
Reliability refers to the extent to which a measure is without bias and ensures consistent
measurement across time. Moreover it is an indication of stability and consistency with which
the instrument measures the concept and helps to assess the ‘goodness’ of a measure
(Sekaran, 2003). The literature used in this thesis is obtained from various source. First there
are the articles from well respected journals. Because their review process ensures that only
high quality articles are published these journals can be regarded as reliable. However, also
less well known journals and aid agency websites were used as sources. Since these
sources do not have such a strict review process, or because they serve a subjective goal of
the organization, the reliability of these sources could be questioned. This problem is tackled
by means of data triangulation, using different sources to verify claims made by the different
sources.

Kevin Koenen - 11 - 13/08/2007
Validity can be divided in internal- and external validity. Internal validity refers to the
confidence one can place in the cause-and-effect relationship. External validity is defined as
the extent of generalizability of the results of a study to other settings, people, or events
(Sekaran, 2003). Although aid agencies have extensive experience in disaster logistics, the
researcher himself has not. Given this observation, the researcher still feels that the research
is valid and can be translated to other disaster settings. Still one has to note that the
prescriptions in this thesis are not one-size-fit-all and are still dependent on each specific
disaster situation.
Section 1.6 Structure
The structure of this thesis is quite straightforward, since each research question will be
covered in a separate chapter. First, research question one is covered in chapter two. Then
the three ‘building blocks’ are covered subsequently in chapters three to five. Thereafter, the
‘building blocks’ are combined in chapter six (figure 1.2). This structure ultimately leads to
chapter seven, in which conclusions, recommendations and limitations are covered.
Figure 1.2, Thesis Structure
Because the fields of performance management and disaster logistics use a lot of technical
terms, this thesis introduces every new and important item in an italic font. Thereby, the
reader will know that the term is an important technical term, which is relevant for this thesis.
In appendix G all italic technical terms will be listed in an alphabetical index.

Kevin Koenen - 12 - 13/08/2007
Chapter 2 Disaster logistics
Section 2.1 Introduction
In this chapter, an important starting point for this thesis will be covered. As the problem
statement deals with disaster logistics, it is very important to accurately define what is meant
when using this term. In order to do this the definition of a disaster should be clear, therefore
section 2.2 will go into this definition. Thereafter section 2.3 will cover the definition of
disaster logistics. Finally, section 2.4 will discuss the different phases within disaster
management.
Section 2.2 Defining disaster
In this section several sources and their definition of disaster will be reviewed, also types and
groups of specific disasters will be treated. Based on this review, a common definition will be
proposed, which will be used throughout the rest of this thesis.
When looking at the definition provided by the dictionary, the word disaster refers to ‘an
occurrence causing widespread destruction and distress; a catastrophe or a grave
misfortune’ (Houghton Mifflin Company, 2006). Aid agencies and organizations involved in
disaster relief efforts, such as the United Nations state that a disaster is ‘a serious disruption
of the functioning of a community or a society causing widespread human, material,
economic or environmental losses which exceed the ability of the affected community or
society to cope using its own resources’ (UN/ISDR, 2007). So, next to the focus on
communities this definition of a disaster also implies that a disaster is only a disaster when a
community cannot handle the consequences on its own.
Another aid agency, the World Health Organization (W.H.O.), maintains a database called
EM-DAT. This EM-DAT database includes data on occurrences and effects of more then
10.000 disasters, which occurred from 1900 to present. For a disaster to be entered into this
database EM-DAT (2007) requires that one of these rather strict criteria should be met:
• 10 or more people should be reported killed because of the disaster (including persons
confirmed as dead and persons missing and presumed dead).
• Minimal 100 people should be reported affected by the disaster (meaning injured,
homeless or requiring assistance).
• The declaration of a state of emergency by local authorities.
• A call for international assistance Samii & van Wassenhove, 2002).
With these definitions in mind, one can think of several types of disaster. Some examples
include: drought, earthquakes, epidemics, extreme temperatures, flood, insect infestation,
slides, volcanic eruption, wild fires, wind storms, industrial accidents and transport accident
(UN/ISDR, 2007; EM-DAT, 2007). For the interested reader, specific definitions of these

Kevin Koenen - 13 - 13/08/2007
different disaster types are provided in appendix B. The different types of disasters can be
labelled as:
• Natural disasters, disasters caused by natural processes or phenomena,
• Technological disasters, disasters caused by technological-, industrial- or infrastructural
accidents often due to human activities,
• Other disasters, any disaster not being natural or technological, an example includes
people movement such as refugees (UN/ISDR, 2007; IFRC, 2007).
The natural disasters can be further classified in three broad groups being biological-, hydro-
meteorological- and geological disasters. A biological disaster is a disaster with an organic or
biological origin, examples include epidemics and plant- or animal contagion. The hydro-
meteorological disaster is a disaster occurring because of weather and climate related issues.
Some examples include tropical cyclones, extreme temperatures and droughts or floods.
Finally, the geological disasters include all disasters related to earth processes or
phenomena, such as volcanic eruptions and earthquakes (UN/ISDR, 2007). Again, specific
technical definitions of these different disaster groups are provided in appendix B. Classifying
the disaster types as one of the disaster groups identified here, results in table 2.1.
Table 2.1, Disaster groups (EM-DAT, 2007; IFRC, 2007)
The World Health Organization and the United Nations distinguish between natural disasters
and technological disasters. This last group was said to often have a human cause.
Therefore, technological disasters can also be labelled as man-made disasters, a term van
Wassenhove (2006) uses. However, the distinction between natural disasters and man-made,
disasters is not as black-and-white as one might think. Actually it is rather artificial as most
disasters can be a result of natural disasters combined with human vulnerability (House of
Commons, 2006), an example are floods. They are labelled natural disasters, but the reality
is that they are caused by rising water levels, which are a result of global warming, so
actually they are man-made.

Kevin Koenen - 14 - 13/08/2007
Van Wassenhove (2006) also proposes another way to distinguish disasters; he identifies
slow onset- and sudden onset disasters. Slow onset disasters are disasters from which the
causes have been present and evolving for years, but which are named disasters when
these causes and characteristics become unmanageable and when the resulting outcomes
become too difficult to handle. Examples include famine, poverty and political crisis’s (see
figure 2.2). Sudden onset disasters are disasters, whose exact occurrence cannot be
predicted far in advance, although they are expected to happen someday. These disasters
therefore occur suddenly and unexpectedly and usually involve a large number of people
affected and damage reported. Examples include earthquakes, tornados and terrorist attacks
(see figure 2.2). Combining the two disaster distinctions proposed by van Wassenhove (2006)
results in the matrix of figure 2.2.
Figure 2.2, Explaining disasters (van Wassenhove, 2006)
After reviewing several definitions of disaster, discussing several types of disasters and after
considering several ways to group disaster types, now it is time to conclude this section with
a common definition of disaster, which will be used throughout this thesis. Based on the
literature review of this section, this thesis defines the concept of disaster as:
An event of grave misfortune, distress or destruction, which disrupts the functioning of a
society and requires a state of emergency and (international) assistance because the society
cannot cope using its own resources. This event can be due to natural- or mad-made
reasons and it can occur suddenly or slowly, but it always involves great levels of human-,
material-, economic- or environmental damage and loss.
Section 2.3 Defining disaster logistics
In order to define disaster logistics, a first step is to unravel the traditional definition of the
term logistics. When looking at the dictionary a military definition of logistics appears: ‘the
aspect of military operations that deals with the procurement, distribution, maintenance, and
replacement of materiel and personnel’ (Houghton Mifflin Company, 2006). This definition is
rather similar to the one used by the Department of Defence (2002), who explicitly include
planning and execution of movement into their definition. Although the concept of logistics
originated from the military, today it is mostly used in the business sector.

Kevin Koenen - 15 - 13/08/2007
Reviewing and combining the definitions used in the business sector results in a definition of
logistics, which includes the planning and execution of procurement, movement and storage
of materials, parts, work-in-progress inventory, finished goods and the associated
information- and capital flows. This work is done throughout the supply chain, from the
source (f.e. the supplier) to the final customer (f.e. the consumer), in a way that is as cost-
effective and profitable as possible (Bowersox, Closs & Cooper, 2002; Christopher, 1998;
Harrison & van Hoek, 2002; Ernst, 2003; van Wassenhove, 2006). According to Ernst (2003)
aid agencies rely on logistics for the same basic reasons as the business sector does for
managing the flow from suppliers (f.e. the donors) to the recipients (f.e. the affected people).
But how can disaster logistics be defined? Several answers to this questions have been
proposed, but a first anecdote about disaster logistics tells us that it is like ‘having the client
from hell: you never know beforehand what they want, when they want it, how much they
want and even where they want it sent’ (Arminas, 2005). Another anecdote about disaster
logistics is provided by John Rickard, Director of Logistics of the I.R.C. who learned of a new
project when the actual purchase requisition appeared on his desk and who received a
vehicle requisition 20 minutes before it was urgently required (Rickard, 2004; Thomas; 2004).
So, disaster logistics is a very uncertain and ad-hoc environment to operate.
A rather extensive definition is proved by Thomas & Kopczak (2005), who state that it is the
process of planning, implementing and controlling the efficient, cost-effective flow and
storage of goods and materials, as well as related information, from the point of origin to the
point of consumption for the purpose of alleviating the suffering of vulnerable people. This
function encompasses a range of activities, including purchasing, production, warehousing
and inventory and transportation. This definition of disaster logistics is rather similar to
traditional business sector definition of logistics, however the definitions also differ somewhat.
To the business sector logistics is performed in order to satisfy the end-customer, the
consumer. With respect to disaster logistics this ‘customer-focus’ is rather odd or as Ernst
(2003) put it: ‘the customers (the people who are assisted) are not generating a ‘voluntary’
demand and hopefully will not generate a ‘repeat purchase’ (Ernst, 2003). Therefore aid
agencies rather speak of aid beneficiaries. Thus, the ultimate goal of disaster logistics is to
‘satisfy’ beneficiaries and to reduce the suffering of weak and vulnerable people in affected
areas as soon as possible.
Concluding this section this thesis defines disaster logistics as:
The planning, implementation and control of all activities relating to the flow of goods,
materials, personnel and the associated information and capital, from the source (f.e. the
supplier or donor) to the final user (f.e. the beneficiaries) in times of disaster. This task is
performed in an uncertain and ad-hoc environment and the ultimate goal is to perform the
task as efficient and cost-effective as possible in order to alleviate the suffering of weak and
vulnerable people in affected areas as soon as possible.
Kevin Koenen - 16 - 13/08/2007
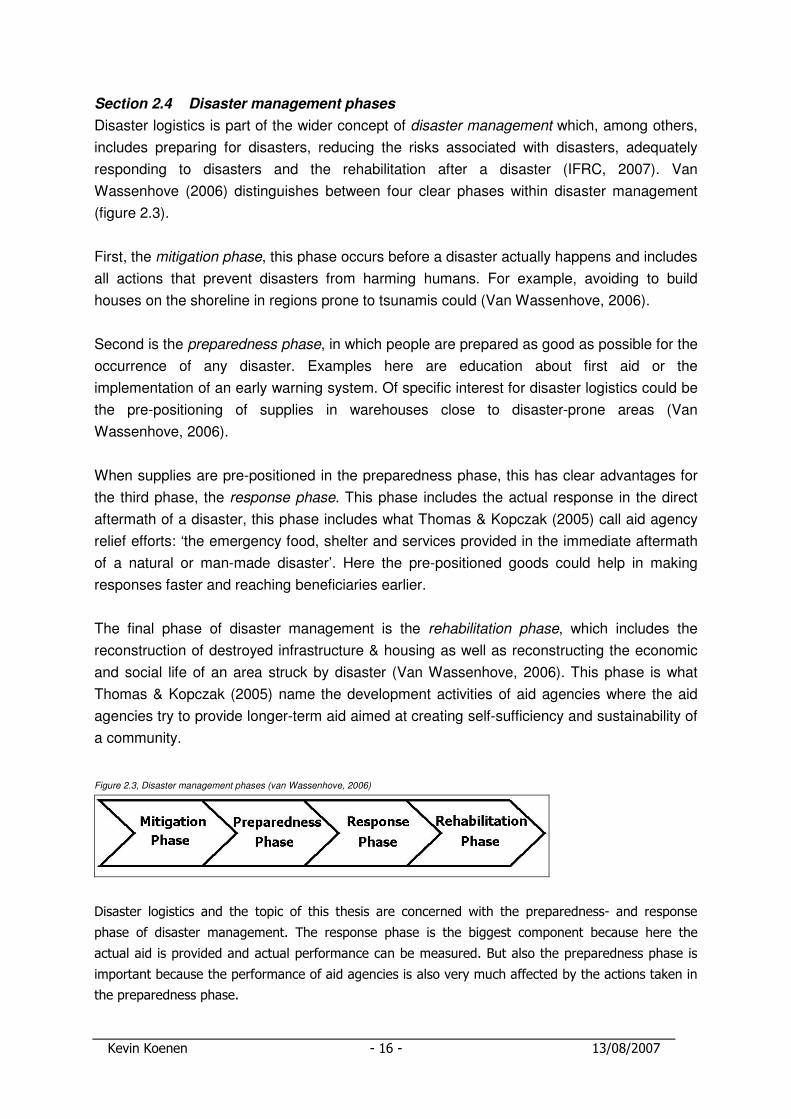
Section 2.4 Disaster management phases
Disaster logistics is part of the wider concept of disaster management which, among others,
includes preparing for disasters, reducing the risks associated with disasters, adequately
responding to disasters and the rehabilitation after a disaster (IFRC, 2007). Van
Wassenhove (2006) distinguishes between four clear phases within disaster management
(figure 2.3).
First, the mitigation phase, this phase occurs before a disaster actually happens and includes
all actions that prevent disasters from harming humans. For example, avoiding to build
houses on the shoreline in regions prone to tsunamis could (Van Wassenhove, 2006).
Second is the preparedness phase, in which people are prepared as good as possible for the
occurrence of any disaster. Examples here are education about first aid or the
implementation of an early warning system. Of specific interest for disaster logistics could be
the pre-positioning of supplies in warehouses close to disaster-prone areas (Van
Wassenhove, 2006).
When supplies are pre-positioned in the preparedness phase, this has clear advantages for
the third phase, the response phase. This phase includes the actual response in the direct
aftermath of a disaster, this phase includes what Thomas & Kopczak (2005) call aid agency
relief efforts: ‘the emergency food, shelter and services provided in the immediate aftermath
of a natural or man-made disaster’. Here the pre-positioned goods could help in making
responses faster and reaching beneficiaries earlier.
The final phase of disaster management is the rehabilitation phase, which includes the
reconstruction of destroyed infrastructure & housing as well as reconstructing the economic
and social life of an area struck by disaster (Van Wassenhove, 2006). This phase is what
Thomas & Kopczak (2005) name the development activities of aid agencies where the aid
agencies try to provide longer-term aid aimed at creating self-sufficiency and sustainability of
a community.
Figure 2.3, Disaster management phases (van Wassenhove, 2006)
Disaster logistics and the topic of this thesis are concerned with the preparedness- and response
phase of disaster management. The response phase is the biggest component because here the
actual aid is provided and actual performance can be measured. But also the preparedness phase is
important because the performance of aid agencies is also very much affected by the actions taken in
the preparedness phase.

Kevin Koenen - 17 - 13/08/2007
Chapter 3 Processes and challenges in disaster logistics
Section 3.1 Introduction
In this chapter the first of three ‘building blocks’ is covered: the processes and challenges
that are occurring within disaster logistics. First the stakeholders involved in disaster logistics
will be identified (section 3.2). Then disaster logistics activities are discussed (section 3.3),
followed by disaster logistics flows (section 3.4), continuing with disaster logistics processes
in section 3.5. Section 3.6 is about aid agencies principles, section 3.7 is concerned with
operational challenges, section 3.8 will go into challenges related to learning within disaster
logistics, while section 3.9 will cover technology and organizational challenges within disaster
logistics.
Section 3.2 Disaster logistics stakeholders
Beneficiaries
The single most important stakeholder in the disaster logistics process is the ultimate
beneficiary of the aid provided: the person in need. All other stakeholders in disaster logistics
act because of the needs of these people. In conventional supply chain terminology, this
beneficiary could be labelled the ‘end-customer’ of the entire aid agency ‘supply chain’. This
aid agency supply chain is meant to ‘satisfy the demand’ of the end customer. But as Ernst
(2003) stated this customer focus in disaster logistics is rather odd since the beneficiaries are
not generating a ‘voluntary’ demand and will hopefully not return to the ‘market’ for a ‘repeat
purchase’.
Donor countries
A lot of international aid flows from the world’s richest countries to the poorer and less-
developed countries. For example, the United States and the European Union have
represented roughly 33% and 10% of total aid (in cash, kind and services) in recent years
(IFRC, 2007; Thomas & Kopczak, 2005). There are also less well developed countries, such
as India, who serve both as a donor and as a beneficiary (IFRC, 2007; Thomas & Kopczak,
2005). These donor countries are an important stakeholder in disaster logistics and they
have a strong influence on the process of providing aid. The donations of these countries
and the speed of their reaction to disasters are really important to the timeliness and
effectiveness of relief efforts (IDC, 2006b).
A donor countries’ decision to respond to disasters is mainly based on the aid agency
assessment of unmet needs in the disaster area. But also resources available, attention paid
by other stakeholders (f.e. the media and other governments) and national- and global
politics influence this decision (IDC, 2006b; Samii & van Wassenhove, 2002). An example of
political influence could be that the Netherlands is more inclined to donate to Indonesia
because of the colonial history of the two countries.

Kevin Koenen - 18 - 13/08/2007
Finally, the donating governments are becoming more demanding: besides donating funds
and goods to aid agencies the governments also want to know what is done with these funds
and goods. They want to see the concrete results and output from their donations, a fact
known as donor accountability (IDC, 2006b; Samii & van Wassenhove, 2002).
Business sector
The business sector is also a large donor to aid agencies. Business sector contributions can
vary from monetary and in-kind donations to profit-oriented activities. An example of these
profit-oriented activities is tendering for a reconstruction contract after a disaster (IDC, 2006a;
IDC, 2006b). Examples of donations in kind include delivery of company services, but also
excesses in inventories (Gustavsson, 2003). An example is TNT’s cooperation with the
World Food Program (WFP). TNT, a multinational mail and express company, is supporting
WFP with so-called 48-hr emergency response teams (Romero, 2007; TNT, 2007; Scott-
Bowden, 2003; Hoffman, 2006).
Besides being a donor, the business sector is also involved as a partner for aid agencies.
Collaboration between the two is increasing and is based on using the skills, expertise and
knowledge available in the business sector to improve operations in disaster relief efforts
(IDC, 2006b; Gustavsson, 2003). An example is Ericsson who was one of the first companies
to cooperate with aid agencies by providing mobile telecommunication in disaster areas
(Scott-Bowden, 2003). Also, TNT provides services such as air transport, transport- and
warehouse coordination and reporting assistance to their WFP partner (Romero, 2007).
A reason for the business sector to donate to- or cooperate with aid agencies is a growing
focus on corporate social responsibility (IDC, 2006a; 2006b). This is a focus on sustainable
development, social- and environmental responsibility in all aspects of a business’ operations
(Habisch, Wegner, Schmidpeter & Jonker, 2005). Another reason for the business sector to
donate is the believe that this improves the company’s reputation together with increased
market knowledge of the disaster area (Arminas, 2005). A final reason is that the business
sector itself can also learn from the challenging circumstances of disaster logistics,
incorporating it into their own supply chains (Van Wassenhove, 2006).
General public
The general public, are also important donors for aid agencies. In fact according to a study,
monetary donations of the general public were the biggest donor to the Indian Ocean
tsunami in 2004 (Reuters, 2005). In addition to monetary donations, the general public often
also makes so-called in-kind donations. These are donations such as second hand clothing
and household items usually gathered by groups of individuals such as religious
organizations or neighbourhood centres. When these donations are not specifically asked for,
aid agencies refer to them as unsolicited donations. These in-kind donations fulfil specific
unmet needs and may be useful; however they may also be inappropriate and even hinder
relief efforts (Romero, 2007). This is a challenge, which will be further covered in section 3.7.

Kevin Koenen - 19 - 13/08/2007
Aid agencies
Generally speaking there are three categories of aid agencies receiving donations: (1)
agencies operating under United Nations umbrella (f.e. the World Health Organization) (2)
international organization operating as a federation with country subsidiaries (f.e.
International Federation of Red Cross and Red Crescent) and (3) Non-governmental
organizations operating with no affiliation with country governments (f.e. World Vision)
(Thomas & Kopczak, 2005). In order not to complicate matters throughout this thesis all
these categories will be labelled aid agencies.
The goals of these aid agencies include: lobbying and creating awareness of disasters,
policy development and of course the provision of actual aid (IDC, 2006b). Basically, the aid
agencies are the intermediaries between the donors and the beneficiaries, matching the
supply of donated goods with the demands of beneficiaries.
A specific job of aid agencies is to provide reliable needs assessments in the immediate
aftermath of a disaster. This assessment includes an overview of the disaster situation, the
most urgent beneficiary needs and the suggested plan of action. Due to this needs
assessment, donors know what and where they can contribute (IDC, 2006b; IFRC, 2007).
Military
In many disasters the military, but also institutions such as the police and the navy, is a
stakeholder. These institutions collaborate with aid agencies in disaster relief efforts,
although on a much lower scale then the business sector does (Fritz Institute, 2005c). One
reason is that the military operates from different principles then aid agencies do. The
military’s operations are guided by the term ‘force for good’, meaning they will use force in
order to do good. However, aid agency operations are guided from a ‘do-no-harm’
perspective (Wieloch, 2003).
When the military is helping with disaster relief it is either because there are circumstances,
where aid agencies are not able to provide aid, for example during combat situations. Or the
military operates as a sub-contractor of aid agencies. In this case the aid agency has to
coordinate, guide and provide direction to the military, because they view the provision of
disaster relief as a responsibility of aid agencies (Wieloch, 2003).
Media
The role of the media in disaster logistics is to report the occurrence of the disaster and the
relief efforts afterwards. The media’s relation with aid agencies is one, which Van
Wassenhove (2006) describes as a love-hate relationship. First, aid agencies need media
coverage in order to create awareness and attract attention, thereby hopefully generating
more funding (IFRC, 2005; IDC, 2006B). Chopra (2001) indicates that there is indeed a
causal link between the amount of media coverage for a disaster and the amount of
resources and funding donated.

Kevin Koenen - 20 - 13/08/2007
Second, many aid agencies view media coverage of disasters as rather selective, superficial
and stereotyped (IRC, 2005; Chopra, 2001), focused on what is going wrong with disaster
relief (Ross, 2004). Moreover, since the media is driven by financial imperatives and
audience requirements they tend to focus on unusual disasters which involve considerable
death or destruction thereby ignoring ‘less spectacular’ disasters. Therefore sudden onset
disasters tend to receive more media coverage then slow onset disasters, which results in
more funding for sudden-onset and less for slow-onset disasters (IDC, 2006b; IFRC, 2005).
Beneficiary country government
Beneficiary country governments and the political climate are also important in disaster
logistics. Initially, the beneficiary country government is the stakeholder responsible for
coordinating and organizing disaster relief efforts.
This task is often shared with international aid agencies, because disasters have paralyzed
the government and harmed the employees and structures (EIU, 2005). However, as
Romero (2007) indicated, beneficiary country governments have to take the first step. When
a disaster happens, the country’s government must ask aid agencies for help and give them
access to the country. When this does not happen, aid agencies are not allowed to enter the
country and provide aid.
There are situations in which cooperation between beneficiary country governments and aid
agencies is not very fruitful. Beneficiary countries may, require a different set of rules and
regulations (f.e. import laws) then the aid agencies are used to, thereby making disaster
logistics more difficult (Arminas, 2005).
Section 3.3 Disaster logistics activities
Within disaster logistics several activities are performed. Activities to think about include
order processing, purchasing, production, warehousing, inventory and transportation.
Order processing, in its conventional logistics meaning is concerned with order entry,
communication and invoicing of logistical activities. However, the ‘order’ in disaster logistics
is very different, meaning that disaster logistics order processing activities are also different.
An example of an order processing activity in disaster logistics is the needs assessment
discussed in section 3.2.
The purchasing activities also differ in disaster logistics. The conventional definition includes,
selecting and evaluating (potential) suppliers and buying the inputs for a given organization.
This is also true in disaster logistics, however the purchasing activities might also include
policies to receive the right in-kind donations and to limit the amounts of unsolicited
donations. A concrete example of purchasing within disaster logistics is the establishment of
supply contracts by an aid agency called ‘Save the Children’. This agency has set up deals

Kevin Koenen - 21 - 13/08/2007
with supplier guaranteeing the supply of essential goods in the event of disaster (Arminas,
2005).
Production is the logistical activity responsible for physically making products that must run
through the logistics process. It is assumed that disaster logistics is mainly performed by aid
agencies and because their core business is providing aid, not producing goods, it is likely
that production is an activity which is less relevant for aid agencies.
Warehousing is about holding inventory. The benefits of holding inventory in warehouses
also includes reducing transportation cost, consolidating shipments to profit from economies
of scale, postponing finale configuration of shipments etcetera (Bowersox et. al., 2002).
These advantages also hold in the context of disaster logistics, for example warehouses
strategically located in a disaster area can greatly enhance the efficiency of the entire
logistics operation (Fritz Institute, 2007). This does actually occur in the TNT-WFP
partnership, as WFP strategically located its five warehouses in Dubai, Ghana, Malaysia,
Panama and Italy (Romero, 2007).
Closely related to warehousing are inventory-related activities, including planning, ordering
and holding inventory. The main reasons to hold inventory include product availability for
future sales, operational support and optimization of transportation or manufacturing
equipment used. The downside of inventory is that it increases costs and thereby usually
limits efficiency. A concrete example of inventory related activities in disaster logistics is the
pre-positioning of first-aid kits in warehouses across the globe in anticipation of disasters
(Fritz Institute, 2004a; 2005a)
Transportation activities include the storage and movement of products from point of origin to
a destination. This can be done by means of different transportation modes such as motor,
rail, air, water and pipeline. In general transportation activities can benefit from two important
principles: economy of scale and economy of scope. These mean that larger shipments or
longer distances can decrease transportation cost per unit, making the activity more efficient
(Bowersox et. al., 2002). These economies and transportation activities also apply to disaster
logistics and probably are the biggest area of interest in disaster logistics today (Fritz Institute,
2007).
Section 3.4 Disaster logistics flows
Within disaster logistics one can distinguish between several different flows. The funding flow,
f.e. the flow of monetary donations, is not the only financial flow that is occurring in disaster
logistics, although it is a critical one. Also other financial flows such as credit terms, payment
schedules and consignment arrangements constitute an important flow in disaster logistics
(van Wassenhove, 2006; Kleindorfer & van Wassenhove, 2004).

Kevin Koenen - 22 - 13/08/2007
A second flow in disaster logistics is the material flow, representing the flow of physical
products from suppliers or donors to the beneficiaries (van Wassenhove, 2006; Kleindorfer &
van Wassenhove, 2004). Material flows to think about include the provision of food,
medicines and shelter. But also materials for sanitation, water supply and reconstruction are
important examples.
People flow is a third flow in disaster logistics. It includes people moving out of a disaster
area, the so-called displaced people, refugees or asylum seekers (appendix B). But it also
includes people moving into the disaster area. Here one can think about aid agency staff,
medical doctors, and business sector professionals (IFRC, 2007).
A final flow in disaster logistics is the information flow between the different stakeholders
(van Wassenhove, 2006; Kleindorfer & van Wassenhove, 2004). This flow represents all
information necessary to perform disaster logistics and can include information about
beneficiary needs, order tracking and infrastructural conditions, but also the information
donors require, such as aid agency performance information (Thomas & Kopczak, 2005).
Section 3.5 Disaster logistics processes
In section 3.2 several disaster logistics stakeholders were identified. These stakeholders all
have an influence on the processes of disaster logistics. As Tomasini and van Wassenhove
(2004a) indicate, the diversity of stakeholders involved in the disaster logistics process adds
to the complexity of the disaster relief effort.
Because existing figures were either too complex or inappropriate to explain the processes of
disaster logistics, a model was developed. Based on the different flows and stakeholders
within disaster logistics the model tries to explain the processes of disaster logistics more
clearly. In figure 3.1 on the next page, the stakeholders are identified in boxes and the
relationships between them are displayed by arrows, which will be shortly explained.
Kevin Koenen - 23 - 13/08/2007
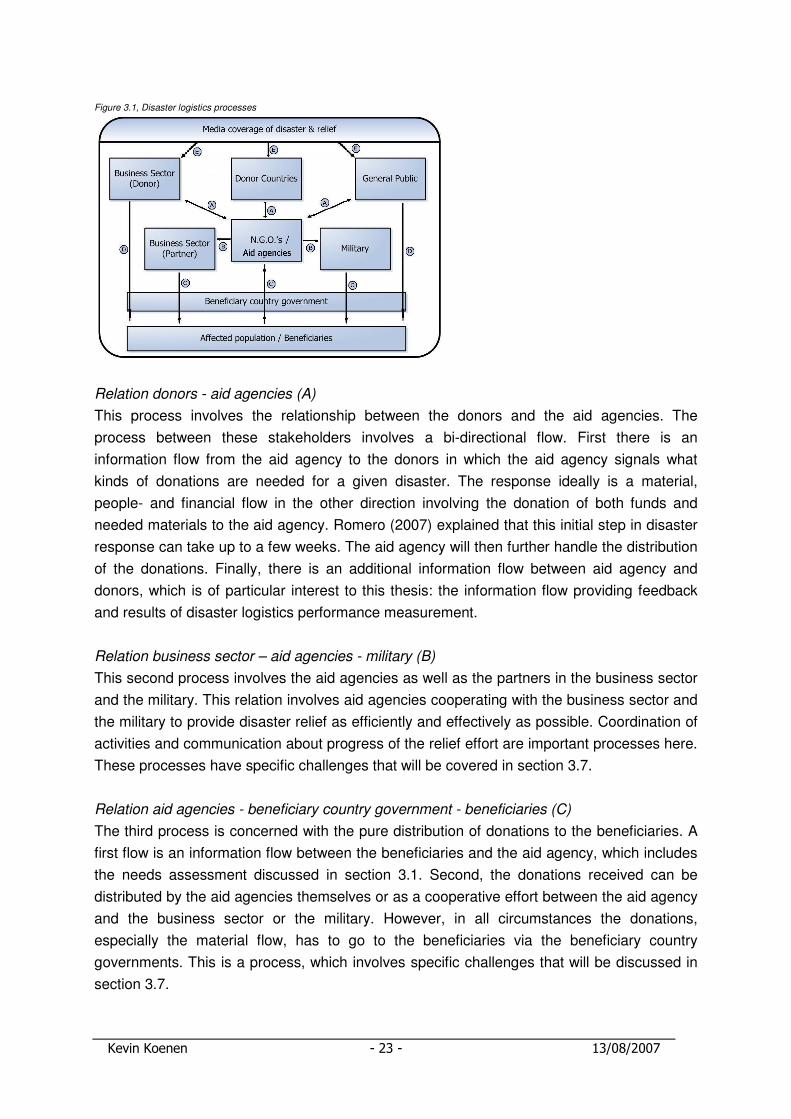
Figure 3.1, Disaster logistics processes
Relation donors - aid agencies (A)
This process involves the relationship between the donors and the aid agencies. The
process between these stakeholders involves a bi-directional flow. First there is an
information flow from the aid agency to the donors in which the aid agency signals what
kinds of donations are needed for a given disaster. The response ideally is a material,
people- and financial flow in the other direction involving the donation of both funds and
needed materials to the aid agency. Romero (2007) explained that this initial step in disaster
response can take up to a few weeks. The aid agency will then further handle the distribution
of the donations. Finally, there is an additional information flow between aid agency and
donors, which is of particular interest to this thesis: the information flow providing feedback
and results of disaster logistics performance measurement.
Relation business sector – aid agencies - military (B)
This second process involves the aid agencies as well as the partners in the business sector
and the military. This relation involves aid agencies cooperating with the business sector and
the military to provide disaster relief as efficiently and effectively as possible. Coordination of
activities and communication about progress of the relief effort are important processes here.
These processes have specific challenges that will be covered in section 3.7.
Relation aid agencies - beneficiary country government - beneficiaries (C)
The third process is concerned with the pure distribution of donations to the beneficiaries. A
first flow is an information flow between the beneficiaries and the aid agency, which includes
the needs assessment discussed in section 3.1. Second, the donations received can be
distributed by the aid agencies themselves or as a cooperative effort between the aid agency
and the business sector or the military. However, in all circumstances the donations,
especially the material flow, has to go to the beneficiaries via the beneficiary country
governments. This is a process, which involves specific challenges that will be discussed in
section 3.7.

Kevin Koenen - 24 - 13/08/2007
Relation donors - aid agencies (D)
Although the desired process of disaster logistics moves via the centralized structure of the
aid agencies, a secondary process is also occurring. This includes the direct flow of
donations from donors to beneficiaries. Because donor countries only provide aid via aid
agencies, this secondary flow of materials is guided by the business sector or the general
public. This process of disaster logistics is largely beyond the control of aid agencies, but it
does provide additional challenges to the process of disaster logistics, which will be covered
in section 3.7.
Media influence (E)
A final issue in disaster logistics is the role of the media. Although it is not a process in itself,
the media has a significant influence on the entire process of disaster logistics. As the model
in figure 3.1 tries to show, the media cover the disaster itself, but also the process of disaster
relief. This coverage influences donor opinions about aid agencies which ultimately guide
donation decisions. This provides challenges to the disaster logistics process, which will be
covered in section 3.7.
Section 3.6 Aid agency principles
Disaster logistics and conventional logistics have similarities as well as differences. One of
these differences are the specific principles aid agencies wish to adhere to. For example, the
International Federation of Red Cross and Red Crescent (IFRC, 2007) always operates
based on seven fundamental principles which they have identified. These principles are the
core of IFRC’s thinking and guide the agency’s operations whenever no specific policy
applies. The seven IFRC principles include (1) Humanity, (2) Impartiality, (3) Neutrality, (4)
Independence, (5) Voluntary service, (6) Unity, (7) Universality. For elaboration of these
seven principles the interested reader is referred to appendix C.
Closely related to the seven IFRC principles is the concept of the humanitarian space. In
figure 3.2 one can see that the humanitarian space is made up of a triangle between the
principles of humanity, neutrality and impartiality. The space in between guides, but also
limits, the ways in which aid agencies perform their task.
Figure 3.2, Humanitarian space (Tomasini & van Wassenhove, 2004b)

Kevin Koenen - 25 - 13/08/2007
The concept of the humanitarian space represents a calm and tranquil space for aid
agencies to do their job in times of armed- or political conflict. However, there are several
examples that the lines between the humanitarian space these conflicts are rather blurred
(Van Wassenhove, 2006). For example, providing aid to wounded people may mean helping
the aggressive party in an armed conflict. And supplying food may disturb traditional
economies in the disaster area (Van Wassenhove, 2006). So, the boundaries of the
humanitarian space constitute a really fine line and it is a challenge to address beneficiary
needs without comprising the principles aid agencies adhere to.
Section 3.7 Operational challenges
Operational challenges
One challenge related to disaster logistics operations is the destructive nature of most
disasters, which influences the stages of infrastructure. Roads, bridges and airports can be
destroyed, fuel supply may be very difficult to access and transport capacity could be
extremely limited (Thomas & Kopczak, 2005; Aminas, 2005; Gustavsson, 2003). Also, the
sudden increase of trucks, boats and airplanes into a disaster area can cause extreme
congestion, further challenging disaster logistics. An interesting example here is provided by
Simpson (2005), who states that when Iran was hit by an earthquake in 2003 most aid
agency flights were turned away by the authorities because the runways were blocked by
piles of relief supplies and planes being unloaded too slowly.
Another operational challenge is the difference in cultural norms, local conditions, country
values and people’s religious beliefs. Moreover, a multitude of national governments,
regional organizations and local bureaucracies are involved in international disaster logistics,
each with their own set of laws and regulations (Thomas, 2005b; Aminas, 2005).
Also the large amount of unsolicited donations, make disaster logistics much more
challenging then business logistics. For example, these unsolicited donations can cause
bottlenecks in the supply chain because much-needed resources, including personnel and
transportation, are sacrificed to sort through and transport the supplies (Van Wassenhove,
2006). The TNT-WFP partnership also recognizes this challenge and tries to create
awareness of this issue. Together with other logistics service providers such as UPS and
FedEx they try to agree to postpone delivery of these unsolicited goods, first the priority
items (such as food and shelter) have to be delivered (Romero, 2007).
Collaboration & coordination
Section 3.2 identified a large amount of stakeholders involved in disaster relief efforts,
ultimately most of the aid agencies have similar goals. However, although the goals are
similar, collaboration and coordination between aid agencies is rather limited in disaster
logistics (Sowinsky, 2003; Thomas, 2004; Fritz Institute, 2005a). Currently aid agencies
operate primarily on an ad-hoc, immediate needs basis and even compete with each other

Kevin Koenen - 26 - 13/08/2007
for funding, warehouse space and transport capacity (Romero, 2007; IDC, 2006B; Fritz
Institute, 2005b; Thomas and Kopczak, 2005).
Stakeholder challenges
Stakeholders in disaster logistics can also have different goals. For example, the donor
countries may have different motivations for providing aid then the business sector does.
Also, the role and power of the media in disaster relief efforts is another important variable to
consider in disaster logistics (van Wassenhove, 2006). An example of this media power is
the observation that increased media attention also increases unsolicited donations, thereby
making disaster logistics more challenging (Romero, 2007).
A specific stakeholder challenge which is especially relevant in the context of this thesis is
the increased focus of donors on the efficiency of aid agency response and the ways in
which aid agencies spend their money. Donors would like to know if aid agencies are actually
reaching the people in need. This observation can also be named and increased focus on aid
agency accountability.
Complexity
Finally, logistics in times of disasters is by definition complex, dynamic, unexpected and
unpredictable. Conditions and circumstances are quickly changing and uncertainty is very
large in terms of demand and supply of aid (Gustavsson, 2003; Thomas, 2005a; Van
Wassenhove, 2006). The diversity of challenges, the interactivity among challenges, and the
invisibility and inability to anticipate challenges can all add to this complexity of disaster
logistics (Richardson, 1994).
Section 3.8 Disaster logistics learning challenges
Employee turnover
Trained or experienced aid agency employees tend to leave the aid agency rather soon and
new employees are hard to find. This fact is named employee turnover and is mainly due to
burnouts resulting from stressful and mentally challenging jobs in disaster relief. On average,
each year one out of three employees quits (Thomas, 2004; Van Wassenhove, 2006;
Gustavsson, 2003). A concrete example of the consequences of large numbers of employee
turnover is that in the aftermath of the 2004 Tsunami, 88% of all aid agencies had to
reallocate employees with logistical expertise from other assignments to support the disaster
relief efforts in South-East Asia (Fritz Institute, 2005b).
Lack of logistical knowledge
The aid agency employees working in disaster logistics generally do not have any training or
education in logistics and learned their skills on the job (Gustavsson, 2003; Thomas &
Kopczak, 2005). This challenge is also recognized by the TNT-WFP partnership, Romero
(2007) indicates that logistical knowledge in aid agencies is really operational; people get

Kevin Koenen - 27 - 13/08/2007
things done, however often not as efficient as it could be. So, the lack of logistical knowledge,
both in the field as well as at senior level, is a challenge in disaster logistics.
Lack of institutional memory
Because of the high amounts of employee turnover and the intensity of the disaster relief
efforts the mistakes made and lessons learned from one disaster are not transferred to the
next (Sowinski, 2003; Thomas, 2004; 2005a; Thomas and Kopczak, 2005; Gustavsson,
2003). Thomas (2005a) calls this challenge a lack of institutional memory. This challenge is
also reinforced by aid agency responses to disasters, which tend to be ad-hoc rather then
strategic. This is named a project-to-project mentality (Van Wassenhove, 2006).
Lack of professionalisation
Thomas (2004) also mentions a lack of professionalisation as a challenge to disaster
logistics. This encompasses inadequate needs assessments (Fritz Institute, 2005), an
absence of performance standards and certification and an underdeveloped system of
performance measurements. These challenges together with the ones covered before add
up to hindering aid agency learning, failing to record operational best-practices and thus
limiting the improvement of disaster logistics performance.
Section 3.9 Other challenges
Information technology challenge
Although information technology and communication systems are widely used in business
logistics, its use in disaster logistics remains relatively underdeveloped according to several
authors (Sowinski, 2003; Thomas, 2005a; Fritz Institute, 2005a; Van Wassenhove, 2006). In
disaster logistics the use of information technology is extremely fragmented. Most of the time,
error sensitive manual processes are still used (Thomas, 2004; Thomas & Kopczak, 2005).
Also the main communication in disaster logistics is still dependent on phone and fax,
resulting in large challenges concerning tracking and tracing of supplies. A reason for this
underdeveloped use of technology is the project-to-project mentality and a lack of funding to
invest in longer term, strategic solutions, such as advanced information technology and
communication systems.
Organizational challenges
An organizational challenge for disaster logistics departments is their quest for recognition in
the overall aid agency. Just as logistics was not considered as a department of interest in the
business sector some twenty to thirty years ago (Sowinsky, 2003; Thomas, 2003), currently
disaster logistics faces the same challenges. Disaster logistics is regarded a support function
meant to execute decisions once they are taken by senior policy makers (Thomas, 2005a).
Because logistics is not involved in structuring operations, understanding between policy
makers and logistics decreases, resulting in tension and a large distance between the two.

Kevin Koenen - 28 - 13/08/2007
Chapter 4 Performance measurement and -management
Section 4.1 Introduction
Performance, performance measurement and performance management are all rather broad
concepts and people can attach different meanings to these concepts. In order to overcome
this, section 4.2 is intended to define these concepts. Then, in section 4.3, an overview will
be given of the different measures that can be used in organizations. But since measures do
not mean anything by themselves, also standards or benchmarks have to be developed to
compare the measures against. This is what section 4.4 will be covering. Finally, section 4.5
will cover one performance management system used in the business sector. Together,
these sections will form the second ‘building block’ of this thesis.
Section 4.2 Performance, performance measurement and -management
Everybody has an intuitive idea about the meaning of the word performance, however these
meanings differ from person to person. Looking at the dictionary, this ambiguity also remains,
as performance is defined as ‘the way in which someone or something functions’ (Houghton
Mifflin Company, 2006). The different ideas about the concept of performance also occurs
between companies, and even between divisions or individuals within companies (Neely &
Adam, 2001).
Agreement on the concept of performance measurement and its definition is also difficult. For
example the Government Accountability Office defines performance measurement as ‘an
assessment of an organization’s performance, including the measures of productivity,
effectiveness, quality and timeliness’ (CDGP, 2005). Another definition is proposed by Neely
(1998) as ‘the process of quantifying the efficiency and effectiveness of past actions through
acquisition, collation, sorting, analysis, interpretation and dissemination of appropriate data’.
The outcome of performance measurement is usually quantitative however, this quantitative
output does not have a meaning by itself. It does not add any value unless company
managers add a meaning to these outputs. In order for them to do this, it is necessary to
establish performance standards to compare the numbers against.
When performance measures and the standards are known, appropriate management action
can be taken based on them, this is called performance management. Performance
management is the process of using performance measures to monitor, control and direct
the operations of an organization (Bowersox et. al., 2002). Monitoring is about tracking the
performance by periodically reviewing the output of measurement. Control is about taking
appropriate actions when the measurements are below standards. Directing performance
occurs when the measurement system is used as a basis for motivating and rewarding
employees (Bowersox et. al., 2002).
Kevin Koenen - 29 - 13/08/2007
Performance can be managed at different levels within the supply chain. Hofman (2004)
suggests four main levels of performance management levels.
1. Project level, measuring and managing the performance of a particular logistical project.
2. Organizational level, measuring and managing the performance of a specific organization.
3. Country level, measuring and managing the performance of organizations in a country.
4. Time-frame level, measuring and managing the performance of organizations during a
given time frame (Hofman, 2004).
Section 4.3 Logistical performance measures
The process of logistics consists of several major categories of activities that should be
pursued in order for logistics to function properly. These so-called functional areas provide a
basis for performance measures and were covered in section 3.3, but here examples of
performance measures will be reviewed.
Transport function
The transportation function is concerned with the physical transport of supplies into the firm
as well as transport of end-product out of the firm. In appendix D, figure D.1 an overview is
given of several so-called input-output ratios. On the horizontal axis are the inputs into the
organization, such as labour, facilities, equipment, energy and costs. On the vertical axis
several activities within the transport function are distinguished. An ‘X’ in a cell means that
A.T. Kearney (1984) suggests this ratio as an appropriate performance measure. For
example there is an ‘X’ in the cell labour * loading, meaning that the ratio of labour hours
used in loading over the road trucks can be used to measure transportation performance.
Moreover, appendix D, figure D.2 and D.3 give other examples of transportation measures
divided in a productivity-, utilization- and performance category.
Warehousing function
The warehousing function includes materials handling activities and storage facilities. Again
examples of performance measures include input-output ratios and productivity-, utilization-
and performance measures (figure D.4, D.5 & D6., appendix D).
Purchasing function
The purchasing function is involved with buying the inputs for a given firm. Within this
functional area it is also possible to calculate input-output ratios as a performance measure,
examples are given in figure D.7 of appendix D.
Inventory function
The inventory function is about the financial aspect (cost) and the operational aspect
(efficiency) of holding products in stock. In appendix D, figure D.8 examples of input-output
ratios are shown, figure D.9 and D.10 gives examples of productivity-, utilization- and
performance measures for the inventory function.

Kevin Koenen - 30 - 13/08/2007
Production function
The production function, a function actually making products, is not always present in every
organization. However it does provide an adequate area for performance measures.
Especially the input-output ratios are very common in this area. Examples of these ratios are
shown in figure D.11, appendix D.
Order processing function
A final functional area is the order processing function involved with order entry,
communication and invoicing of logistical activities. For this area there are also examples of
input-output ratios (figure D.12, appendix D) and productivity-, utilization- and performance
measures (figure D.13 & D.14, appendix D).
Although functional performance measures are a good basis for performance management,
it also has a major drawback. This is the fact that functional performance measures fail to
take the entire logistics process into account and only look at a small part of the entire
process. According to Robeson et. al. (1994) this could result in functions optimizing their
own performance at the expense of total logistics performance. An example could be that the
production function keeps producing in order to optimize the utilization rates, thereby
increasing the amounts of stock and harming the performance of the inventory function.
Since this is an undesirable situation, there is a need for measures reflecting the
performance of the entire process of logistics (Bowersox et. al., 2002).
In a logistics measurement survey performed in 2002 (Harrison & van Hoek, 2002) it
appeared that only 9% of the responding organizations were using performance measures
that spanned the entire process of logistics, the so-called supply chain comprehensive
performance measures. These measures are meant to give an integrated view on logistics
performance, which is consistent across different functions and which can even be
comparable across different firms in the supply chain (Bowersox et. al., 2002). Specific
examples of these measures are provided in figure D.15 and D.16 of appendix D and include
among others: cash-to-cash conversion, dwell time, supply chain response time, internal
defect rates and stock turns.
Section 4.4 Standards & benchmarks
The performance measures discussed in section 4.3, do not mean anything by themselves.
In order for them to have a meaning, the next step in logistics performance management is to
develop performance standards to compare actual performance against (Stock & Lambert,
1987; Slack & Lewis, 2002).
Standards can be established on several different bases, a first way is to develop standards
based on historical data. A drawback of this method is that it is backward looking and that it
may result in continuously focusing on sub-optimal performance (Monczka, Trent & Handfield,

Kevin Koenen - 31 - 13/08/2007
2005; Slack & Lewis, 2002). A second way is to base standards on internal improvement
goals. The drawback of this method is that it does not take competitor performance into
account (Monczka et. al., 2005; Slack & Lewis, 2002). The third basis for standards is
comparing performance against competitors. This is a promising method but the main
drawback is that generally competitor performance data is hard to obtain (Monczka et. al.,
2005; Slack & Lewis, 2002). The final basis for standards is comparing an organization’s
performance to absolute performance. Meaning that performance is compared against
perfection (Monczka et. al., 2005).
Closely related to the development of performance standards is the concept of benchmarking,
which is defined as ‘the continuous process of measuring products, services, processes,
activities and practices against the company’s best competitors or those companies
renowned as the industry- or functional leaders’ (Robeson et. al., 1994; Camp, 1994;
Monczka et. al., 2005). Basically, benchmarking can also be seen as developing standards
to compare performance against. Four different types of benchmarking can be identified:
1. Internal benchmarking, or performance benchmarking, involves comparing similar
functions within a given company with each other (Robeson et. al., 1994; Camp, 1994;
Van Vliet, 1998; Bowersox et. al., 2002; Slack & Lewis, 2002).
2. Competitive benchmarking is comparing practices and work processes with those of a
company’s main- or best competitors (Robeson et. al., 1994; Camp, 1994; Van Vliet,
1998; Bowersox et. al., 2002; Slack & Lewis, 2002).
3. Functional benchmarking, or non-competitive benchmarking, is comparing work
processes with those of the functional leader in the given function. Most of the time this is
an organization from a completely different industry (Robeson et. al., 1994; Camp, 1994;
Slack & Lewis, 2002).
4. Generic process benchmarking, is comparing the actual process itself, the so-called
generic process. Ultimately, a lot of processes in organizations are similar so they can
provide a basis for performance management (Robeson et. al., 1994; Camp, 1994; Van
Vliet, 1998).
Section 4.5 Performance management systems
Over time, performance measures have been combined into systems meant to manage
organizational performance. These performance management systems vary considerably
and all of them have a unique perspective on performance. They all provide managers with a
different set of lenses through which the organizational performance can be managed,
according to Neely & Adams (2001). In this section one of these performance management
systems will be discussed: the balanced scorecard.
The reason for covering this performance management system is based on literature review.
First, Pun & White (2005) compared a total of ten performance management systems on
Kevin Koenen - 32 - 13/08/2007
three sets of evaluation criteria, being (1) Dimensions of performance, (2) Performance
measure characteristics and (3) Specifications and requirements of Performance
measurement development. Second, Gijsbrechts (2007) also compared five performance
measurement systems on types, aspects and dimensions of performance. In both of the
papers, the balanced scorecard model was among the top of performance management
systems. Meaning that this system complied with most of the evaluation criteria and was
among the most inclusive performance management systems.
The balanced scorecard approach (Kaplan & Norton, 1996) uses four perspectives to view
an organization from and it includes performance measures based on each of these four
perspectives. The exact perspectives are:
1. Learning and Growth, including employee training and corporate attitudes related to both
individual and corporate self-improvement.
2. Business Process, refers to internal business processes and includes the strategic
management process, but also support processes.
3. Customer, involved with the important area of customer focus and includes measures
related to customer satisfaction.
4. Financial, involved with the traditional performance measures focusing on costs and
benefits (Balanced Scorecard Institute, 2007).
One of the distinguishing features of the balanced scorecard system is that it ‘balances’ the
indicators used. This means that a weight is attached to each specific indicator: the more
important indicators receive a higher weight, the less important indicators receive a lower
weight. Assigning these weights is done by each organization using the balanced scorecard,
therefore it is subjective and there is no one-size-fit-all weighing schedule (Balanced
Scorecard Institute, 2007).

Kevin Koenen - 33 - 13/08/2007
Chapter 5 Disaster logistics performance management
Section 5.1 Introduction
Chapter 4 dealt with logistics performance management in the business sector, in this
chapter the focus will be on current approaches to disaster logistics performance
management. This is the third and final ‘building block’ of this thesis. First, disaster logistics
performance is considered in section 5.2. Then, section 5.3 is about standards and indicators
in use today, section 5.4 covers the views of aid beneficiaries on performance of aid
agencies and section 5.5 discusses a scorecard for disaster logistics performance
management. Finally section 5.6 covers some important obstacles to performance
management in disaster logistics.
Section 5.2 Disaster logistics performance
Although the definition of disaster logistics is similar to the definition of conventional logistics,
performance may mean different things for the two fields. As Slack (1991) and Harrison &
van Hoek (2002) propose, logistics performance may include five objectives: speed,
dependability, quality, flexibility and cost. Depending on the organization’s strategy one or
two of these objectives prevail. However when looking at the disaster logistics definition,
three performance objectives prevail: speed, flexibility and cost.
In the first 72 hours after a disaster, speed of delivery is crucial, together with flexibility in
handling disaster logistics challenges. At this point in time, cost and efficiency are of less
importance. Later in the disaster management process (see section 2.3), the focus shifts to a
mixture of speed and flexibility while doing it at reasonable cost and as efficient as possible
(van Wassenhove, 2006).
In the next three sections, a review will be given of three initiatives to disaster logistics
performance management, which are currently used by aid agencies: the Sphere project,
URD’s participatory performance management and Davidson’s performance indicators.
Section 5.3 Sphere’s minimum standards
One of the initiatives to performance management in disaster logistics is the Sphere project
(Hofman, 2004). This project was launched by a group of NGOs and the IFRC in 1997. The
aim of the Sphere project is ‘to improve the quality of assistance provided to people affected
by disasters and to enhance the accountability of the humanitarian system in disaster
response’ (Sphere, 2004). In order to achieve this aim, the Sphere handbook was developed,
in which minimum standards and -indicators for disaster response were set out.
These standards have been developed by using aid agency employees. Most of the
standards are not new, but they were adapted and consolidated from existing aid agency
Kevin Koenen - 34 - 13/08/2007
knowledge and current practice. First, the Sphere handbook (Sphere, 2004) identified
common standards for aid agencies. These include assessment-, response- and evaluation-
standards, which are further elaborated in appendix E.1. These standards in the Sphere
handbook are qualitative in nature and are meant to be applicable in any disaster. Second,
the Sphere handbook (Sphere, 2004) also identifies standards in six specific sectors:
1. Water supply, sanitation and hygiene standards, examples are provided in appendix E.2.
2. Food security standards, examples are provided in appendix E.3.
3. Nutrition standards, examples are provided in appendix E.3.
4. Food aid standards, examples are provided in appendix E.3.
5. Shelter standards, settlements and non-food, examples are provided in appendix E.4
6. Health services standards, examples are provided in appendix E.5.
From these standards, several key indicators were developed to put the standards into
practice. These indicators are measures to the standards and can be qualitative or
quantitative. They are the tool to measure the impact of aid agency relief efforts (Sphere,
2004). It is also stated that without the indicators ‘the standards would be little more than
statements of good intent, difficult to put into practice’ (Sphere, 2004).
Several aid agencies have used the Sphere project and especially the Sphere handbook and
its minimum standards in practise. NGOs such as Oxfam, Care, World Vision and the IFRC
reported positive results (Sphere, 2007). However, these aid agencies also reported
implementation problems of the minimum standards and made suggestions for the extension
of the Sphere standards. A concrete example is the inclusion of the food security standards
in 2004, in the first version of the handbook (Sphere, 2002) these standards were still absent.
Another example of extending the Sphere standards is the inclusion of logistical standards.
Up until 2007 standards like this are not included into the Sphere handbook although disaster
logistics is getting increased attention and is gaining increased strategic relevance in aid
agencies (Thomas, 2004).
Section 5.4 Participatory performance management
Another initiative to performance management in disaster logistics is the quality-project
undertaken by the French NGO URD (URD, 2007). This project measures performance by
means of surveys, research and interviews among aid beneficiaries. This so called
participatory approach to performance management was also applied by the Fritz Institute
(2005) in the aftermath of the Indian Ocean tsunami. Examples of questions asked by the
Fritz Institute (2005) are: in the first 48hours after a disaster which organizations came to
help? Or which services did the aid agencies provide in the first 48hours after a disaster?
The institute stated that surveys and questionnaires offered significant and substantial input
to the management of aid operations. Especially the beneficiary perspectives of the
assistance received across hundreds of affected villages was very helpful in managing
performance (Fritz Institute, 2005).

Kevin Koenen - 35 - 13/08/2007
The participatory approach also has important drawbacks. One of the most important is the
fact that aid agency employees do not have the statistical knowledge to take valid samples
and to statistically analyze the results of a survey (Romero, 2007; Hofmann, 2004). The
result often is a poorly conducted survey which is not very useful for performance
management. Several authors (Garfield, 2001; Shoham et. al. 2001; SMART, 2002) have
provided examples of such poorly conducted surveys.
Section 5.5 Davidson’s performance indicators for disaster logistics
A third initiative to performance management in disaster logistics is the indicator model as
developed by Davidson (2006). She developed a four indicator model for disaster logistics,
based on the principles of commercial- and military performance measurement, because she
found that disaster logistics faces many of the same issues. The indicators used and the
resulting framework were developed by interviewing IFRC professionals and by using the
data analysis of the 2005 South Asia earthquake (Davidson, 2006).
The resulting set of indicators includes the following four:
1. Appeal coverage, intended to indicate how well the organization is meeting its appeal for
an operation in terms of finding donors and delivering items. Two specific measures were
suggested: (1) Appeal coverage = pledged items / items needed, (2) % of items delivered
= (items delivered on site / items needed) * 100%.
2. Donation-to-delivery-time, intended to measure how long it takes for an item to be
delivered to the destination country after a donor has pledged to donate it. This is
measured by either (1) mean number of days or (2) median number of days.
3. Financial efficiency, intended to incorporate the financial aspect of providing aid. Three
metrics were suggested: (1) relative metric = (Actual cost – budgeted cost)/budgeted cost,
(2) absolute metric = actual cost – budget cost, (3) transportation cost = transport cost /
total cost.
4. Assessment accuracy, is intended to indicate how much the operation’s final budget
changed over time from the original budget. This not only includes the financial changes,
but also changes in quantity of goods needed.
The indicators discussed are combined in a scorecard, an example of which is shown in
figure 5.1. This final scorecard has a few interesting characteristics. First, the scorecard has
a specific column to define quantitative goals for each indicator in the ‘Total Op Target’
column. In chapter 4 it was already stated that setting standards is the critical factor in any
performance management system (Davidson, 2006). Second, the scorecard can be
prepared at different points in time, thereby keeping track of performance over time
(Davidson, 2006). Finally, the scorecard includes a systematic way of defining ‘priority items’
per disaster relief operation (column 3 and 4 in figure 5.1). In this way the scorecard
facilitates communication across the relief operation about what items have priority in
logistics. Moreover, because of the prominent place on the scorecard the aid agency can
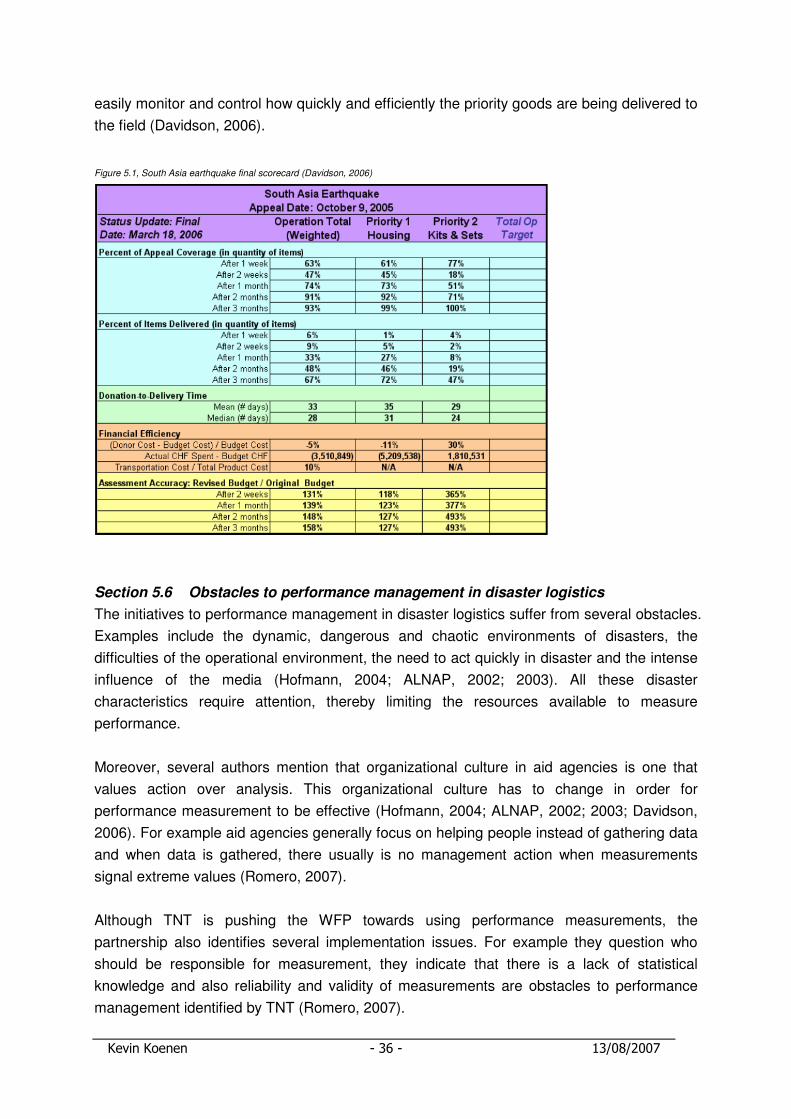
Kevin Koenen - 36 - 13/08/2007
easily monitor and control how quickly and efficiently the priority goods are being delivered to
the field (Davidson, 2006).
Figure 5.1, South Asia earthquake final scorecard (Davidson, 2006)
Section 5.6 Obstacles to performance management in disaster logistics
The initiatives to performance management in disaster logistics suffer from several obstacles.
Examples include the dynamic, dangerous and chaotic environments of disasters, the
difficulties of the operational environment, the need to act quickly in disaster and the intense
influence of the media (Hofmann, 2004; ALNAP, 2002; 2003). All these disaster
characteristics require attention, thereby limiting the resources available to measure
performance.
Moreover, several authors mention that organizational culture in aid agencies is one that
values action over analysis. This organizational culture has to change in order for
performance measurement to be effective (Hofmann, 2004; ALNAP, 2002; 2003; Davidson,
2006). For example aid agencies generally focus on helping people instead of gathering data
and when data is gathered, there usually is no management action when measurements
signal extreme values (Romero, 2007).
Although TNT is pushing the WFP towards using performance measurements, the
partnership also identifies several implementation issues. For example they question who
should be responsible for measurement, they indicate that there is a lack of statistical
knowledge and also reliability and validity of measurements are obstacles to performance
management identified by TNT (Romero, 2007).

Kevin Koenen - 37 - 13/08/2007
Finally, the use of performance management in disaster logistics potentially creates rather
odd incentives. For example, aid agencies could take fewer risks and stick to operations
which outcomes can be measured easily or operations which outcomes are expected to be
positive (IFRC, 2003). Also, it could result in limited cooperation between aid agencies,
because in that case performance of separate agencies is harder to measure (Hofman, 2004;
IFRC, 2003).

Kevin Koenen - 38 - 13/08/2007
Chapter 6 Applying business sector performance management approaches to
disaster logistics
Section 6.1 Introduction
In chapter 4 performance management was covered for the business sector. Chapter 5
covered the current state of performance management within disaster logistics. This chapter
is meant to combine these two. The goal of this chapter is to show which business sector
approaches are transferable to disaster logistics. In order to do this, chapter 6 follows the
layout of chapters 4 and 5. Section 6.2 covers performance measures in disaster logistics
while section 6.3 is about standards and benchmarks in disaster logistics. Section 6.4 covers
the balanced scorecard and section 6.5 discusses the benefits of performance management
for disaster logistics.
Section 6.2 Performance measures in disaster logistics
In section 3.3 disaster logistics activities were covered while section 4.3 and appendix D
discussed logistical performance measures. In this section, these two are combined and the
applicability of measurements to disaster logistics is discussed.
Some of the examples given in appendix D are more useful in disaster logistics then others.
For example, the productivity ratios of figures D.1, D.4, D.7, D.8, D.11 and D.12 can easily
be applied to disaster logistics, since the inputs (labour, equipment and overall costs) are
present in conventional logistics as well as disaster logistics.
However, sometimes the suggested measures also have to be adapted. Examples are the
productivity measures of figure D.2 and D.9 which include turnover. Since aid agencies do
not receive money from their ‘customers’, measures based on turnover are inappropriate and
should be adapted to fit disaster logistics. For example turnover could be replaced by total
funds donated when calculating productivity percentages (figure D.2).
Examples of measures, which are probably not applicable to disaster logistics, include the
performance effectiveness measures of figure D.3, D.6, D.10 & D.14, relating actual costs to
budgeted cost. These might be unusable because the uncertain and complex nature of
disasters makes it impossible to set reliable budgets in disasters.
In section 4.2, the supply chain comprehensive measures were covered (figure D.15 & D.16).
For disaster logistics some of these measures could be applicable. Examples are order
delivery lead-time, dwell time and supply chain response time. Others are inappropriate
given the specific nature of disaster logistics and the associated challenges (chapter 3). An
example is the cash-to-cash conversion measure of figure D.16. Given the fact that
beneficiaries in disaster logistics do not pay for the aid they receive, this measure is
inappropriate since it measures the time taken to convert $1 of inventory to $1 of revenue.

Kevin Koenen - 39 - 13/08/2007
In appendix D several examples of performance measures were given, however this list is
only meant to be illustrative. The examples in appendix D are not meant to be a complete list
of available performance measures. Therefore it is not appropriate to discuss the
transferability of every performance measure available. However, for the figures in appendix
D, each is shortly discussed and the transferability of the measures is briefly covered. This
should give the reader a good idea about the transferability of business sector performance
measures to disaster logistics.
A concrete example of transferring business sector performance measures to disaster
logistics is provided by the TNT-WFP partnership (TNT, 2007b). In appendix E, several key
performance indicators for transportation are identified and further explained by TNT. They
are concerned with utilisation, maintenance and fuel, accidents and overall performance.
Although, in the discussion section (section E.3) TNT argues for monthly data gathering,
feedback sessions and a change of thinking. They also find that there are several difficulties
for WFP to use the key performance indicators (Romero, 2007).
Section 6.3 Standards & benchmarks in disaster logistics
Section 4.4 discussed four ways to set performance measurement standards and it also
covered four types of benchmarking. Section 5.3 covered the Sphere project and its attempt
to specify minimum standards for disaster relief. In this section both are covered and their
applicability to disaster logistics is discussed.
The minimum standards and indicators identified by Sphere are mainly concerned with the
types of aid required as can be seen in section 5.3 and appendix F. Although these
standards are really valuable for aid agencies, Sphere does not identify standards and
indicators for disaster logistics. Therefore, the Sphere project is not very applicable to
disaster logistics at this point. But based on literature review and de findings of this thesis,
the author does see possibilities for the inclusion of Sphere standards and indicators related
to disaster logistics. For example, standards could be developed for the functional areas of
disaster logistics. The specific performance measures discussed could provide a good basis
for this.
The standards set by the Sphere project are developed in cooperation with aid agency
employees and therefore they are internal improvement standards. This implies that internal
improvement standards are applicable in disaster logistics. Another standard or benchmark,
which is applicable in disaster logistics, is comparing disaster logistics performance to the
performance of other aid agencies or other logistics companies. This practice of
(non)competitive benchmarking is applicable since aid agencies can learn a lot from each
other, but also from the performance of conventional logistics organizations.

Kevin Koenen - 40 - 13/08/2007
The historical standard identified in section 4.4 can also be applied in disaster logistics.
Based on information of past disasters, standards could be set. For example one can set
average standards or worst-case scenario standards for delivery times of relief items.
However, one has to note that this is only useful if standards are set within different disaster-
types (appendix B). For example: applying delivery standards based on past earthquakes on
a man-made- or technological disaster is probably not that useful since circumstances also
differ a lot. The standard setting performed by TNT in the TNT-WPF partnership can be
reviewed in Appendix E. One observation from this example is that a lot of targets are
context specific, depending on disaster area, vehicle types and or local rates.
Section 6.4 Balanced scorecard in disaster logistics
Section 4.5 covered the balanced scorecard, one of the most inclusive performance
management systems. The balanced scorecard ultimately is a strategic management tool,
but section 5.5 showed that the Davidson (2006) approach resembles this system. One of
the main differences between the two is that Davidson (2006) includes measures in several
areas, but the areas are not the same as the four perspectives of the balanced scorecard.
Another difference is that Davidson (2006) does not ‘balance’ the performance measures,
while the balanced scorecard system does propose this (see section 4.5). However,
according to the author the attempt of Davidson (2006) is an interesting one and also the
balance scorecard system has interesting features which should be developed to be
applicable to disaster logistics even more. Especially the focus on different perspectives and
the weighing of performance measures are interesting features for disaster logistics.
However, the differences between disasters and the different stakeholders within disaster
logistics will result in different scorecards for different disasters thereby making it impossible
to draw up one universal disaster logistics scorecard. But to give an example of its
applicability to disaster logistics, the scorecard of figure 6.1 was developed for the transport
function of toilets to a disaster area.
Figure 6.1, first shows the financial perspective including a measure of appeal coverage.
This measure was taken from the IFRC (2007), which has been using this measure from
2000 onwards. The second measure expresses how much of the total available funds is
spend on disaster logistics, while the third measure is obtained from figure D.3. Together
these measures consider overall financial performance of an aid agency and more practical
financial performance of the transport function of toilets.
Second is the learning and growth perspective. This perspective is developed in order to
address the disaster logistics learning challenges, which were covered in section 3.8.
Examples of measures are a measure for staff turnover or measures of logistics staff training.
Institutions such as the Fritz Institute and INSEAD offer disaster management courses and
disaster logistics conferences. Aid agencies could include the learning and growth

Kevin Koenen - 41 - 13/08/2007
measurements suggested in figure 6.1 in order to monitor and control the amounts of staff
turnover and logistical knowledge levels throughout the aid agency.
Figure 6.1, Disaster logistics balanced scorecard
Perspective Objective Measure Target
Financial
1. Appeal Coverage Meet or exceed funds needed for a disaster ($ of appeal received / $ of appeal requested) * 100% 100%
2. Disaster logistics spend Optimize spend on disaster logistics ($ spend on disaster logistics / $ funds available) * 100% To be set
3. Functional (financial) Efficiency Perform logistics functions as efficient as possible (Actual transport cost / budgeted transport cost) * 100% To be set - below 100%
(Actual transport cost / standard transport cost ) * 100% To be set - below 100%
Learning and growth
1. (Logistics) Staff turnover rate Reduce staff turnover & retain logistical knowledge % of (logistics) staff leaving the aid agency To be set - as low as possible
2. Logistics staff trained Increase disaster logistics knowledge # of people finishing INSEAD disaster management course yearly To be set
# of Fritz Institute humanitarian logistics conferences visited To be set
% of (logistics) staff with disaster logistics degree To be set
Internal business process
1. Delivery lead time Providing needed sanitation within acceptable time frame Donation-to-delivery time of toilets To be set - as low as possible
2. Utilization measure Optimizing capacity utilization transport capacity used / transport capacity at disposal To be set
3. Functional productivity measure Increasing/optimizing functional productivity % of Labour to load a truck with toilets To be set
% of Labour to Line-Haul a truck with toilets To be set
% of Labour to unload a truck with toilets To be set
Customer (Beneficiary)
1. Beneficiary satisfaction Meet or exceed beneficiary expectations% of beneficiaries reporting satisfactory access to toilets
within 24h, 48h, 1 week, 1 monthTo be set
2. Beneficiary access Beneficiary access to toilets 1. % of people having access to toilet To be set - as high as possible
2. # of people per toilet To be set
The third perspective is the internal business process perspective. Here the functional
performance measures discussed in section 4.3 are applicable. In this example the delivery
lead time measure (figure D.15) is included, next to utilization and productivity measures
obtained from figure D.3. The standards for this perspective still have to be set, however the
Sphere project already is a good starting point, especially when minimum standards and
indicators are formed for the functional areas of disaster logistics.
The fourth and final perspective of the example is the customer or beneficiary perspective.
Here the customer service measures of figure D.17-D.19 are applicable. And also the
customer satisfaction approach discussed in section 4.3 and the participatory performance
management approach of section 5.4 are relevant in measuring performance in this
perspective For example; the participatory approach could be used to gather data on
beneficiary satisfaction with the aid offered.
Section 6.5 Benefits for disaster logistics
The past chapters dealt with performance management, disaster logistics and whether the
former is applicable to the latter. However, questions remain unanswered up until now: Why
should aid agencies apply performance management? What are the advantages and
benefits for them?

Kevin Koenen - 42 - 13/08/2007
This final section is intended to provide an answer to these questions. Here, the benefits of
performance management will be discussed and they will be related to the disaster logistics
challenges covered in chapter 3.
Improve processes
One major benefit of performance management in disaster logistics is the improvement
potential it has for disaster logistics. For example aid agency management can use facts of
actual performance as input for future plans, it can identify and eliminate the causes of bad
performance and it can use the output of measurements for continuous improvement of
processes (Thomas & Kopczak, 2005; Fritz Institute, 2004). So, the use of performance
measurements can enhance the effectiveness of decisions made before, during and after a
relief operation (Douglas-Bate, 2003). Being able to improve operations in disaster logistics
based on facts is a huge benefit of performance management and can clearly help in
addressing the operational challenges identified in section 3.7. For example, although
disasters and disaster logistics will still be complex, managing this complexity will be easier
because aid agency management is better informed.
Logistical knowledge retention
Another benefit of performance management for disaster logistics is closely related to the
former, since it also deals with improving processes. According to the author performance
management can improve learning and knowledge retention in disaster logistic. For example,
according to Davidson (2006) and the Fritz Institute (2005b) performance management can
enable organizations to retain lessons learned and transfer knowledge from one disaster to
the next in a systematic way. Although performance management in disaster logistics does
not limit employee turnover, it does help in addressing the challenges related to a lack of
logistical knowledge and institutional memory (section 3.8).
Standardization
Again, another benefit which is concerned with improving disaster logistics processes is
standardization. Performance management includes setting performance standards, this also
holds in disaster logistics. Standardization is said to increase the effectiveness of people and
facilitate coordination, collaboration and resource sharing in the field (Fritz Institute, 2005b;
Thomas, 2005), which is a clear benefit for disaster logistics. On the one hand
standardization addresses the challenges associated with stakeholders and complexity
(section 3.7) on the other hand standardization also addresses the collaboration and
coordination challenges in disaster logistics (section 3.7).
Accountability
Another benefit of performance management in disaster logistics is that it provides a
quantitative and objective base of actual data showing how aid agencies are performing,
which can be used to indicate that donor contributions are well-spent. This is a benefit for aid
agencies, since they can react to the increasing demand of donors to know how donor-

Kevin Koenen - 43 - 13/08/2007
money is spent and if aid agencies are operating efficiently. This challenge was named the
accountability challenge in section 3.7.
As aid agencies can show their performance objectively, donors are given an incentive to
continuously support aid agencies (Thomas & Kopczak, 2005). Maybe, this can even result
in a change in the process of aid agency funding from ad-hoc, project-related donations, to
more structural and year-round donations which can be used to improve disaster logistics
and aid agencies structurally in the long-term.
Logistics as strategic function
A final benefit of performance management for disaster logistics is about the role of disaster
logistics within the aid agency. Many people still view disaster logistics as a support function
within aid agencies; others begin to recognise that disaster logistics is actually a strategic
function which adds value. For example Thomas (2004) found that as the professionalisation
and strategic significance of disaster logistics increases, so does the value added by the
humanitarian organisation. Moreover, the Fritz Institute (2005) states that performance
measurements are essential to establishing the strategic position disaster logistics requires.
This final benefit of performance management for disaster logistics is that it addresses the
organizational challenges within aid agencies (section 3.9).

Kevin Koenen - 44 - 13/08/2007
Chapter 7 Conclusions, recommendations & limitations
Section 7.1 Conclusions
In chapter 1, the problem statement was formed, the research questions were developed and
the structure of the thesis was formed (see figure 7.1). The three ‘building blocks’, chapters 3
– 5, together with chapter 6 led to answering the problem statement:
How can business sector performance management approaches be used to improve disaster
logistics?
Figure 7.1, Research questions and thesis structure
First, chapter 3 showed that the challenges of disaster logistics included operational
challenges, collaboration and coordination challenges, stakeholder challenges, complexity
challenges, logistical learning and knowledge challenges, information technology challenges
and organizational challenges. Second, chapter 4 identified functional logistics performance
measures and supply chain comprehensive performance measures. Moreover standards and
benchmarks were identified and the balanced scorecard system was covered.
Third, chapter 5 covered current performance management in disaster logistics and reviewed
Sphere’s minimum standards, participatory performance management and the Davidson
scorecard. Finally, concluding this thesis chapter 6 combined the three ‘building blocks’ and
showed which performance management approaches are applicable in disaster logistics and
how they can improve disaster logistics. Here, the conclusions of this thesis are outlined:
A first conclusion is that performance management can improve disaster logistics operations
because performance measures quantify logistical performance, compare this with
performance standards and then identifies gaps between actual- and standard performance.
When these are know, aid agency management can determine the cause of the problem and

Kevin Koenen - 45 - 13/08/2007
identify a solution, thereby tackling operational challenges. All based on objective,
quantifiable performance measures.
A second conclusion is that performance management can address the challenges related to
the lack of knowledge retention in disaster logistics. Quantifying performance and using
performance management can improve disaster logistics because it enables aid agencies to
transfer knowledge from one disaster to the next in a systematic manner.
A third conclusion is that performance management sets standards when measuring
performance. This increases people’s effectiveness and facilitates coordination, collaboration
and resource sharing, thereby addressing several collaboration challenges disaster logistics
faces. This can clearly improve disaster logistics.
The fourth conclusion is that performance management improves disaster logistics because
measuring performance means quantitative, objective data. This data can be used as proof
towards donors that donations are used efficiently, thereby possibly increasing donors or
amounts of funds donated.
The final conclusion is that performance management can improve disaster logistics as a
function in the overall aid agency. Being able to show and improve performance of disaster
logistics means its strategic relevance is also easier to show. When this is done, the
organization challenges in disaster logistics can be addressed, thereby decreasing the
distance between aid agency policy makers and the disaster logistics function.
Section 7.2 Recommendations
A first recommendation for aid agencies and the business sector is to increase cooperation.
There are great learning possibilities when aid agencies and the business sector cooperate.
Not only does cooperation benefit aid agencies, also the business sector can learn from the
complexities and uncertainties associated with disaster logistics. With respect to
performance management, cooperation should be increased in order to find ways to
incorporate a measurement culture in aid agencies.
Second, it is recommended that the Sphere project should include disaster logistics
standards. Up till now, the Sphere handbook has been revised and updated two times. It is
recommended that a next update is made including minimal standards and indicators. This
way aid agencies not only profit from standardization of aid provision, but also from a
standardization of logistics activities and logistics management in times of disaster.
Finally, it is recommended that performance measures and scorecards are used more to
measure and manage performance of disaster logistics. The functional measures discussed
in chapter 6 and the example of appendix E serve as a good basis. Moreover, the balanced

Kevin Koenen - 46 - 13/08/2007
scorecard could be of assistance, but also the Davidson (2006) attempt serves as a good
basis to improve scorecard use to improve disaster logistics. Section 6.4 and the example of
figure 6.1 showed one of the possibilities to do so.
Besides the practical recommendations, also academic recommendations exist. These are
the recommendations for further research. It is recommended that this thesis is extended in
further research. For example, research into performance measures and –standards could
increase and improve the measurements and standards used.
Also, research could focus more on the implementation of measurements in disaster logistics.
Examples include the practical limitations to measurement and the use of information
technology and software to overcome these practical limitations.
Since measures and standards are developed in performance management, there is an
objective base to compare aid agencies with each other. It is recommended that research is
performed into the possibilities of this comparison. For example, research could look into the
possibilities of certification for aid agencies, in order to show to donors which aid agencies
spend their money efficiently and which do not.
Section 7.3 Limitations
A first limitation is about the usefulness of the conclusions and recommendations across
disasters. Several times throughout this thesis the point was raised that a lot of things in
disaster logistics are really context specific. Although the researcher does not discuss one
specific disaster, the usefulness can be questioned because no concrete, practical examples
can be given that fit a specific disaster. For example there is no prescription of
measurements to use in an earthquake in Southeast Asia or a plane crash in the United
States.
The second limitation is about the fact that the researcher is an academic master’s student
with no background in disaster logistics. This could also be seen as an advantage, because
the researcher is not coloured by his experience in aid agencies, but it is felt that it also limits
this study, because the researcher has no practical knowledge of the context and challenges
of a disaster. The only way in which information about this could be obtained is via aid-
agency websites, publications and the interview with Mr. Romero from the TNT-WFP
partnership.
A final limitation is closely related to the former. As the main data source for this thesis is
secondary data by means of literature review, the claims made throughout this thesis could
be coloured by the researcher’s perceptions of the literature. This limitation is diminished by
means of the interview with Mr. Romero from the TNT-WFP partnership. This primary data
source did indeed verify several claims made throughout this thesis.

Kevin Koenen - 47 - 13/08/2007
References
Arminas, D. (2005). Supply lessons of tsunami aid. Supply management., vol. 10, no. 2, pp.
14.
A.T. Kearny Inc. (1984). Measuring and improving productivity in physical distribution.
National council of Physical Distribution Management, Oak Brook, Illinois, United States.
Balanced Scorecard Institute (2007). http://www.balancedscorecard.org. Washington DC,
United States.
Ballou, R.H. (1992). Business logistics. Prentice Hall Inc., Englewood Cliffs, New Jersey,
United States.
Bowersox, D.J., Closs, D.J. & Cooper, M.B. (2002). Supply chain logistics management. Mc
Graw Hill, New York, NY, USA.
Camp, R.C. (1994). Benchmarking; the search for industry best practices that lead to
superior performance. IN: Robeson, J.F., Copacino, W.C. & Howe, R.E. (1994). The logistics
handbook. The Free Press, New York, New York, United States.
Chelimsky, E. (1995). The political environment of evaluation and what it means for the
development of the field. Evaluation practice, vol. 16, no. 3, pp. 215 – 225.
Chopra, S. (2001). Role of media in covering humanitarian conflict. South Asian women’s
forum, 10-12-2001.
Christopher, M. (1998). Logistics and supply chain management: strategies for reducing cost
and improving service. 2nd edition, Financial Times Pitman, London.
CRED (2007). Centre for Research on the Epidemiology of Disasters (CRED). Université
Catholique de Louvain, Ecole de Santé Publique, Brussels, Belgium.
Davidson, A.L. (2006). Key performance indicators in Humanitarian logistics. Thesis for:
Master of Engineering in Logistics.
Department of Defence (2002). Dictionary of Military and Associated Terms. University Press
of the Pacific: USA.
Douglas-Bate, R. (2003). Humanitarian Mapping. Forced Migration Review, vol. 18,
september 2003, pp. 35.

Kevin Koenen - 48 - 13/08/2007
EIU (2005). Disaster response management: going the last mile, Thailand and Indonesia.
The Economist Intelligence Unit, 2005, London, United Kingdom.
EM-DAT (2007). EM-DAT; the ODFA/CRED international disaster database, 2006 disasters
in numbers, http://www.em-dat.net, Université Catholique de Louvain, Brussels, Belgium.
Ernst, R. (2003). The academic side of commercial logistics and the importance of this
special issue. Forced migration review, vol. 18, september 2003, pp. 5.
Erpstein, M.J. (2001). Measuring and managing performance in the 21st century. In: Adams,
C., Neely, A. & Kennerly, M. (2001), The Performance Prism, Prentice Hall.
Fritz Institute (2004a). Fritz Institute Annual report 2004. San Francisco, California, USA.
-- (2004b). Impact Conference proceedings. June 2004, Washington D.C.
http://www.fritzinstitute.org/prgHI-Conference.htm.
-- (2005a). Fritz Institute Annual report 2005. San Francisco, California, USA.
-- (2005b). Logistics and the effective delivery of humanitarian relief. San Francisco,
California, USA.
-- (2005c). Lessons from the tsunami: top line findings. San Francisco, California, USA
-- (2007). http://www.fritzinstitute.org. San Francisco, California, USA.
Garfield, R. (2001). Studies of young child malnutrition in Iraq: Problems and insights. 1990-9.
Nutrition reviews, vol. 58, no. 9, pp. 269-277.
Gattorna, J.L. & Walters, D.W. (1996). Managing the supply chain: a strategic perspective.
Macmillan Press Limited, Houndmills, Hampshire, United Kingdom.
Gijsbrechts, R. (2007). Bsc Thesis Organisation & Strategy. Tilburg University, Tilburg, The
Netherlands.
Gustavsson, L. (2003). Humanitarian logistics: context and challenges. Forced migration
review, vol. 18, september 2003, pp. 6.
Habisch, A., Wegner, M., Schmidpeter, R. & Jonker, J. (2005). Corporate social responsibility
across Europe. Springer Science & Business media, Heidelberg, Berlin, Germany.
Kevin Koenen - 49 - 13/08/2007
Hallam, A. (1998). Evaluating humanitarian assistance programmes in complex emergencies.
Good practise review, vol. 7, London: Overseas Development Institute.
Harrison, A. & van Hoek, R. (2002). Logistics management and strategy. Pearson education
limited, Harlow, England.
Hoffman, W. (2006). DHL, U.N. set disaster pact. Traffic world, 16th January 2006, pp. 17,
Newark, United States.
Hofmann, C.A. (2004). Measuring the impact of humanitarian aid; a review of current practice.
HPG research report, vol. 15, june 2004, London: Overseas Development Institute.
Hofmann, C.A., Roberts, L., Shoham, J. & Harvey, P. (2004). Measuring the impact of
humanitarian aid; a review of current practice. HPG Research report, vol. 17, June 2004,
London: Overseas Development Institute.
Houghton Mifflin Company (2006). The American Heritage Dictionary of the English
Language. 4th edition, Houghton Mifflin Company.
House of Commons (2006). International Development - Seventh Report. the Stationery
Office, International Development Committee, London, United Kingdom.
IFRC (2002). International Federation of Red Cross and Red Crescent Societies. World
disasters report 2002, Geneva, Switzerland.
-- (2003). International Federation of Red Cross and Red Crescent Societies. World disasters
report 2003, Geneva, Switzerland.
-- (2005). International Federation of Red Cross and Red Crescent Societies. World disasters
report 2005, Geneva, Switzerland.
-- (2007). International Federation of Red Cross and Red Crescent Societies.
http://www.ifrc.org/, Geneva, Switzerland.
IDC (2006a). International Development Committee. Fourth Report: Private sector
development. july 2006, International Development Committee, House of Commons, United
Kingdom.
IDC (2006b). International Development Committee. Seventh report. 25 october 2006,
International Development Committee, House of Commons, United Kingdom.

Kevin Koenen - 50 - 13/08/2007
Kaplan, R.S. & Norton, D.P. (1996). The balanced scorecard. Harvard business school press,
Boston, Massachusetts, United States.
Kleindorfer, P.R. & van Wassenhove, L.N. (2004). Managing risk in the global supply chain.
In: Gatignon, H. & Kimberley, J.R. (eds). The INSEAD-Wharton Alliance on Globalizing,
Cambridge University Press, United Kingdom.
Lambert, D.M. (1994). Logistics Cost, Productivity and performance analysis. In: Robeson,
J.F., Copacino, W.C. & Howe, R.E. (1994). The logistics handbook. The Free Press, New
York, New York, United States.
Macrae, J. et. al. (2002). Uncertain power: the changing role of official donors in
humanitarian action. HPG report, vol. 15, London: Overseas Development Institute.
Maylor, H. & Blackmon, K. (2005). Researching business and management. Palgrave
macmillan, New York, New York, USA.
Monczka, R.M., Trent, R.J. & Handfield, R.B. (2005). Purchasing & supply chain
management. Third edition. Thomson, South Western, Mason, Ohio, USA.
Neely, A.D. (1998). Measuring business performance. Economist Books, London.
Neely, A.D. & Adams, C. (2001). Perspectives on performance: the performance prism.
Journal of cost management, vol. 15, iss. 1, pp. 7 – 15.
Neely, A.D., Adams, C. & Crowe, P. (2001). The performance prism in practice. Measuring
business excellence, vol. 5, iss. 2, pp. 6 – 13.
Pictet, J. (1979). Fundamental principles of the IFRC, Henry Dunant Institute.
Pun, K.F. & WHite, A.S. (2005). A performance measurement paradigm for integrating
strategy formulation: A review of systems and frameworks. International journal of
management reviews, vol. 7, iss. 1, pp. 49 – 71.
Reuters (2005). Tsunami response was world’s best. Reuters Alertnet Tsunami Aidwatch,
http://www.alertnet.org/thefacts/aidtracker/fulldonors.htm, 19 december 2005.
Richardson B (1994). Crisis management and management strategy — time to loop the loop?
Disaster prevention management, vol. 3, no. 3, pp. 59–80.
Rickard, J. (2004). Quoted in: Thomas, A. (2004). Elevating humanitarian logistics.
International aid & trade review, special edition, pp. 102 – 106.

Kevin Koenen - 51 - 13/08/2007
Roberts, L. (2004). Measuring the impact of humanitarian health programmes. Background
paper. London: Overseas development institute.
Robeson, J.F., Copacino, W.C. & Howe, R.E. (1994). The logistics handbook. The Free
Press, New York, New York, United States.
Romero, N. (2007). Interview at TNT-WFP ‘Moving the world’ headquarters, 02-07-2007,
Hoofddorp, The Netherlands.
Samii, R. & van Wassenhove, L.N. (2002). IFRC: Choreographer of disaster management.
The Gujarat earthquake. INSEAD, Fontainebleau, France.
Scott-Bowden, P. (2003). The world food programme: augmenting logistics. Forced migration
review, vol. 18, september 2003, pp. 17 - 19.
Sekaran, U. (2003). Research methods for business: A skill building approach. John Wiley &
Sons Inc., New York.
Shoham, J. (2004). Review of the role of nutrition and food security information in assessing
the impact of humanitarian interventions. Background paper. London: Overseas development
institute.
Shoham, J. et. al. (2001). DFID-funded technical support facility to FAO’s FIVIMS. Theme 2:
The use of nutritional indicators in surveillance systems.
Simpson, G.R. (2005). Just in Time: In year of disasters, experts bring order to chaos of relief.
Wall street journal, 22/11/2005, The Ney York Times company, New York, New York.
Slack, N. & Lewis, M. (2002). Operations strategy. Prentice Hall, Harlow, Essex, Engeland.
SMART (2002). Improving the monitoring, reporting and evaluation of humanitarian
assistance.
Sowinski, L.L. (2003). The lean, mean supply chain and its human counterpart. World trade,
vol. 16, no. 6, pp. 18-20.
Sphere project (2002). Humanitarian charter and minimum standards in disaster response.
1st edition, http://www.sphereproject.org/.
-- (2004). Humanitarian charter and minimum standards in disaster response. 2nd edition,
http://www.sphereproject.org/.

Kevin Koenen - 52 - 13/08/2007
-- (2007). Humanitarian charter and minimum standards in disaster response.
http://www.sphereproject.org/content/blogsection/7/83/lang,English/.
Sterling, J.U. (1994). Measuring the performance of logistics operations. IN: Robeson, J.F.,
Copacino, W.C. & Howe, R.E. (1994). The logistics handbook. The Free Press, New York,
New York, United States.
Stock, J.R. & Lambert, D.M. (1987). Strategic logistics management. Richard D. Irwin inc.,
Homewood, Illinois, United States.
Thomas, A. (2003). Why logistics? Forced migration review, vol. 18, september 2003, pp. 4.
-- (2004). Elevating humanitarian logistics. International aid & trade review, special edition,
pp. 102 – 106.
-- (2005a). Humanitarian Logistics: Matching Recognition with Responsibility. Asia-pacific
development review, june 21, 2005, pp. 29-34.
-- (2005b). Improving aid effectiveness; Two studies suggest solutions. UN chronicle, vol. 4,
pp. 61-63.
-- (2006). The changing tide of aid provision. Georgetown journal of international affairs,
summer/fall, 2006, pp. 83 – 89.
Thomas, A. & Kopczak, L.R. (2005). From logistics to supply chain management: the path
forward in the humanitarian sector. Fritz institute, San Francisco, California, USA.
Thomas, A. & Mizushima, M. (2005). Logistics training: necessity or luxury? Forced Migration
Review, vol. 22, pp. 60–61.
Thomasini, R.M. & Van Wassenhove, L.N. (2004a). Pan-American health organization’s
humanitarian supply management system: de-politicization of the humanitarian supply chain
by creating accountability. Journal of public procurement, vol. 4, no. 3, pp. 437-449.
-- (2004b). A framework to unravel, prioritize and coordinate vulnerability and complexity
factors affecting a humanitarian response operation. Working Paper no.20 04/41/TM, IN
SEAD, Fontainebleau, France.
TNT (2007). http://group.tnt.com/wfp/.
TNT (2007b). Fleet Benchmark Study. Esther Bosgra, TNT, Moving the World, Hoofddorp,
The Netherlands. http://group.tnt.com/wfp/downloads/factsheets/Fleet_Benchmark_study.pdf.

Kevin Koenen - 53 - 13/08/2007
UN/ISDR (2007). United Nations / International Strategy for Disaster Reduction.
http://www.unisdr.org, Geneva, Switzerland.
URD (2007). Group Urgence Rehabilitation Developement. http://www.urd.org/.
Wassenhove, van, L.N. (2006). Blackett memorial lecture: Humanitarian aid logistics: supply
chain management in high gear. Journal of operational research society, vol. 57, pp. 475-489.
Wieloch, R. (2003). The humanitarian use of the military. Forced migration review, vol. 18,
september 2003, pp. 32 – 33.

Kevin Koenen - 54 - 13/08/2007
Appendix A Disaster figures
Figure A.1, Total number of natural disasters reported 1900-2006 (EM-DAT, 2007)
Figure A.2, Total number of people reported affected by natural disasters 1900-2006 (EM-DAT, 2007)

Kevin Koenen - 55 - 13/08/2007
Figure A.3, Total number of technological disasters reported 1900-2006 (EM-DAT, 2007)
Figure A.4, Total number of people reported killed by technological disasters 1900-2006 (Source: EM-DAT, 2007)

Kevin Koenen - 56 - 13/08/2007
Appendix B Disaster definitions
Section B.1 Natural disasters
Natural hazards: Natural processes or phenomena occurring in the biosphere that may
constitute a damaging event. Natural hazards can be classified by origin namely: geological,
hydro meteorological or biological. Hazardous events can vary in magnitude or intensity,
frequency, duration, area of extent, speed of onset, spatial dispersion and temporal spacing
(UN/ISDR, 2007).
Hydro meteorological hazards: Natural processes or phenomena of atmospheric,
hydrological or oceanographic nature, which may cause the loss of life or injury, property
damage, social and economic disruption or environmental degradation. Hydro meteorological
hazards include: floods, debris and mud floods; tropical cyclones, storm surges,
thunder/hailstorms, rain and wind storms, blizzards and other severe storms; drought,
desertification, wild land fires, temperature extremes, sand or dust storms; permafrost and
snow or ice avalanches. Hydro meteorological hazards can be single, sequential or
combined in their origin and effects (UN/ISDR, 2007).
Geological hazard: Natural earth processes or phenomena that may cause the loss of life or
injury, property damage, social and economic disruption or environmental degradation.
Geological hazard includes internal earth processes or tectonic origin, such as earthquakes,
geological fault activity, tsunamis, volcanic activity and emissions as well as external
processes such as mass movements: landslides, rockslides, rock falls or avalanches,
surfaces collapses, expansive soils and debris or mud flows. Geological hazards can be
single, sequential or combined in their origin and effects (UN/ISDR, 2007).
Biological hazards: Processes of organic origin or those conveyed by biological vectors,
including exposure to pathogenic micro-organisms, toxins and bioactive substances.
Examples include: Outbreaks of epidemic diseases, plant or animal contagion and extensive
infestations (UN/ISDR, 2007).
Drought: Period of deficiency of moisture in the soil such that there is inadequate water
required for plants, animals and human beings (EM-DAT, 2007). In general, drought is
defined as an extended period - a season, a year, several years - of deficient rainfall relative
to the statistical multi-year average for the region. Lack of rainfall leads to inadequate water
required for plants, animals and human beings. A drought leads to other disasters, namely
food insecurity, famine, malnutrition, epidemics and displacement of populations from one
area to another (IFRC, 2007).
Earthquake: Sudden break within the upper layers of the earth, sometimes breaking the
surface, resulting in the vibration of the ground, which where strong enough will cause the
collapse of buildings and destruction of life and property (EM-DAT, 2007; IFRC, 2007).

Kevin Koenen - 57 - 13/08/2007
Epidemic: Either an unusual increase in the number of cases of an infectious disease, which
already exists in the region or population concerned; or the appearance of an infection
previously absent from a region (in EM-DAT the epidemic disease in included as a disaster
subset) (EM-DAT, 2007). An epidemic is then unusual increase in the number of cases of an
infectious disease which already exists in a certain region or population. It can also refer to
the appearance of a significant number of cases of an infectious disease in a region or
population that is usually free from that disease (IFRC, 2007).
Extreme temperature: Disaster type term used in EM-DAT comprising the two disaster
subsets heat wave: a long lasting period with extremely high surface temperature, and cold
wave: a long lasting period with extremely low surface temperature (EM-DAT, 2007).
Flood: Significant rise of water level in a stream, lake, reservoir or coastal region (EM-DAT,
2007). Flash floods are sudden and extreme volume of water that flow rapidly and cause
inundation Because of its rapid nature flash floods are difficult to forecast and give people
little time to escape or to take food and other essentials with them (IFRC, 2007).
Insect infestation: Pervasive influx and development of insects or parasites affecting humans,
animals, crops and materials (EM-DAT, 2007).
Slide: Disaster type term used in EM-DAT comprising the two disaster subsets avalanche: a
rapid and sudden sliding and flowage of masses of usually unsorted mixtures of
snow/ice/rock material, and landslide: all varieties of slope movement, under the influence of
gravity. More strictly refers to down-slope movement of rock and/or earth masses along one
or several slide surfaces (EM-DAT, 2007).
Volcanic eruption: Discharge (aerially explosive) of fragmentary ejecta, lava and gases from
a volcanic vent (EM-DAT, 2007). Volcanic eruptions happen when lava and gas are
discharged from a volcanic vent (IFRC, 2007).
Wave/surge: Disaster type term used in EM-DAT comprising the two disaster subsets tidal
wave: abrupt rise of tidal water (caused by atmospheric activities) moving rapidly inland from
the mouth of an estuary or from the coast and, tsunami: a series of large waves generated by
sudden displacement of seawater (caused by earthquake, volcanic eruption or submarine
landslide); capable of propagation over large distances and causing a destructive surge on
reaching land (EM-DAT, 2007).
Wild fire: Disaster type term used in EM-DAT comprising the two disaster subsets forest fire:
fires in forest that covers extensive damage. They may start by natural causes such as
volcanic eruptions or lightning, or they may be caused by arsonists or careless smokers, by
those burning wood, or by clearing a forest area and, scrub fire: fires in scrub or bush that

Kevin Koenen - 58 - 13/08/2007
cover extensive damage. They may start by natural causes such as volcanic eruptions or
lightning, or they may be caused by arsonists or careless smokers, by those burning wood,
or by clearing a forest area (EM-DAT, 2007).
Wind storm: Disaster type term used in EM-DAT comprising the following disaster subsets
cyclone/hurricane/typhoon: large-scale closed circulation system in the atmosphere above
the Indian Ocean and South Pacific (cyclone), the Western Atlantic and East Pacific
(hurricane) or Western Pacific (typhoon), with low barometric pressure and strong winds that
rotate clockwise. Maximum wind speed of 64 knots or more, storm: wind with a speed
between 48 and 55 knots, tornado: violently rotating storm diameter; the most violent
weather phenomenon. It is produced in a very severe thunderstorm and appears as a funnel
cloud extending from the base of a cumulonimbus to the ground, tropical storm: generic term
for a non-frontal synoptic scale cyclone originating over tropical or sub-tropical waters with
organised convection and definite cyclonic surface wind circulation and winter storm: Snow
(blizzard), ice or sleet storm (EM-DAT, 2007). Essentially, cyclones, hurricanes and typhoons
refer to a large scale closed circulation system in the atmosphere which combines low
pressure and strong winds that rotate counter clockwise in the northern hemisphere and
clockwise in the southern hemisphere. The system is referred to as a cyclone in the Indian
Ocean and South Pacific, hurricane in the Western Atlantic and Eastern Pacific and typhoon
in the Western Pacific (IFRC, 2007).
Section B.2 Technological disasters
Technological hazards: Danger originating from technological or industrial accidents,
dangerous procedures, infrastructure failures or certain human activities, which may cause
the loss of life or injury, property damage, social and economic disruption or environmental
degradation. Some examples: industrial pollution, nuclear activities and radioactivity, toxic
wastes, dam failures; transport, industrial or technological accidents (explosions, fires, spills)
(UN/ISDR, 2007). The IFRC (2007) distinguishes technological disasters as either: accidents,
explosions, chemical explosions, (thermo) nuclear explosions, mine explosions, pollution,
acid rain, chemical pollution and atmospheric pollution.
Industrial accident: Disaster type term used in EM-DAT to describe technological accidents
of an industrial nature/involving industrial buildings (f.e. factories). It comprises of a number
of disaster subsets: chemical spill/leak: accident release occurring during the production,
transportation or handling of hazardous chemical substances, explosions: explosions
involving industrial buildings or structures, radiation leakages, collapses: accident involving
the collapse of industrial building or structure, gas leaks from industrial sites, poisoning:
poisoning of atmosphere or water courses due to industrial sources, fires, and other
technological accidents involving industrial sites (EM-DAT, 2007).

Kevin Koenen - 59 - 13/08/2007
Transport accident: Disaster type term used in EM-DAT to describe technological transport
accidents involving mechanised modes of transport. It comprises of four disaster subsets:
accidents involving aeroplanes, helicopters, airships and balloons, accidents involving sailing
boats, ferries, cruise ships, other boats, accidents involving trains, and accidents involving
motor vehicles on roads and tracks (EM-DAT, 2007).
Miscellaneous accident: Disaster type term used in EM-DAT to describe technological
accidents of a non-industrial or transport nature (f.e. houses). It comprises of a number of
disaster subsets: explosions: explosions involving domestic/non-industrial buildings or
structures, collapses: accident involving the collapse of domestic/non-industrial buildings or
structures, fires, and other miscellaneous accidents involving domestic/non-industrial sites
(EM-DAT, 2007).
Section B.3 Other disasters
Population movement and displaced people: When population movement occurs, it is
important to immediately distinguish whether those moving are asylum seekers, refugees,
migrants or internally displaced people. The distinction is important since support
mechanisms and the legal status of the people can affect the response operation. Refugees
are people moving outside their country of origin - often in mass exodus - for reasons of
conflict and now increasingly, natural disasters. Displaced people who cross a border but are
not accorded refugee status are asylum seekers. Internally displaced persons are persons or
groups of persons who have been forced or obliged to flee or to leave their homes or places
of habitual residence, in particular as a result of or in order to avoid the effects of armed
conflict, situations of generalized violence, violations of human rights or natural or human-
made disasters, and who have not crossed an internationally recognized State border. An
often neglected but substantial moving population is made up of people displaced by factors
other than armed conflict - people forced to move by a natural disaster, economic hardship
and the formation of a new country or changing national boundaries. These people are
migrants (IFRC, 2007).

Kevin Koenen - 60 - 13/08/2007
Appendix C IFRC principles
The seven IFRC principles (IFRC, 2007) include:
1. Humanity. Refers to protecting and respecting life and preventing and alleviating human
suffering wherever it may be found, while dignity of people should be respected and
protected.
2. Impartiality. Refers to non-discrimination in the provision of aid, which should be guided
solely by recipient needs. Priority is given to the most urgent cases of distress.
Impartiality can also be described in terms of non-subjective aid provision to recipients
(Pictet, 1979).
3. Neutrality. In order to receive confidence of all people, the IFRC shall not take sides in
any political-, racial-, religious-, ideological- or any other type of conflict. And relief should
be provided without bias or affiliation to any party in a conflict.
4. Independence. The IFRC operates autonomous and independent of any local authority,
thereby increasing their impartiality and neutrality.
5. Voluntary service. The IFRC is a voluntary aid agency, with no desire for profit or gain.
6. Unity. In order to foster their unity, the IFRC only allows one Red Cross movement per
country, which should be open to all, a principle closely corresponding to the impartiality
principle.
7. Universality. The worldwide IFRC is based on equality. All members have equal status
and equal responsibilities in providing aid worldwide.

Kevin Koenen - 61 - 13/08/2007
Appendix D Business sector performance measures
Figure D.1, Transportation productivity ratios (A.T. Kearney, 1984: p. 144)
Transportation
Activities Labour Facilities Equipment Energy
Financial
Investment
Overall
(Cost)
Private fleet over-the-road trucking
- Loading X X
- Line-haul X X X - Unloading X X
- Overall X X X X
Private fleet pickup/delivery trucking
- Pretrip X X - Stem driv ing X X X
- On-route driv ing X X X
- At-stop X X - End-of-trip X X
- Overall X X X X
Transportation management
- Private fleet X - Outside transport X
Discussion: Practically all ratios of figure D.1 can be applied to disaster logistics, because the
inputs labour, equipment, energy and cost are present in both conventional logistics and
disaster logistics. An example is the energy/line-haul ratio, which could be translated into
average fuel consumption per kilometre.
Figure D.2, Transportation productivity measures (Ballou, 1992: p. 786)
Transportation
productivity measure This quarter Last quarter
This quarter
last year
Company
standard
Industry
Average
- Freight costs as a percentage of distribution costs 31% 30% 32% 29% 31%
- Damage- and loss claims as percentage of freight costs 0,5% 0,5% 0,6% 0,5% 0,5%
- Freight costs as a percentage of turnover 0,1% 9,2% 10,2% 9,0% 8,8%
Discussion: the applicability of measures from figure D.2 differs per measure. The first is
applicable, although one needs to know the company standard or industry average to be
useful. The second is not that useful since the ‘customers’ in disaster logistics generally do
not file damage claims. Finally, the third measure has to be adapted in order to be applicable:
turnover should be replaced by total funds available for a given project.
Figure D.3, Transportation effectiveness measures (Gattorna & Walters, 1996: p. 146)
Productivity Utilization Performance
- Weight / distance transported / total
actual transportation costs
- Total transportation capacity used / total transportation capacity owned (or
paid for)
- Actual transportation cost / budgeted
transportation cost
- Stops served / total actual
transportation cost
- Standard transportation cost / actual
transportation cost
- Volume of goods transported to destinations / total actual transportation
cost
- Actual transit times / standard transit times
- Shipments transported to destinations / total actual transportation cost
- Standard weight distance / total actual transportation cost
Transport effectiveness measures
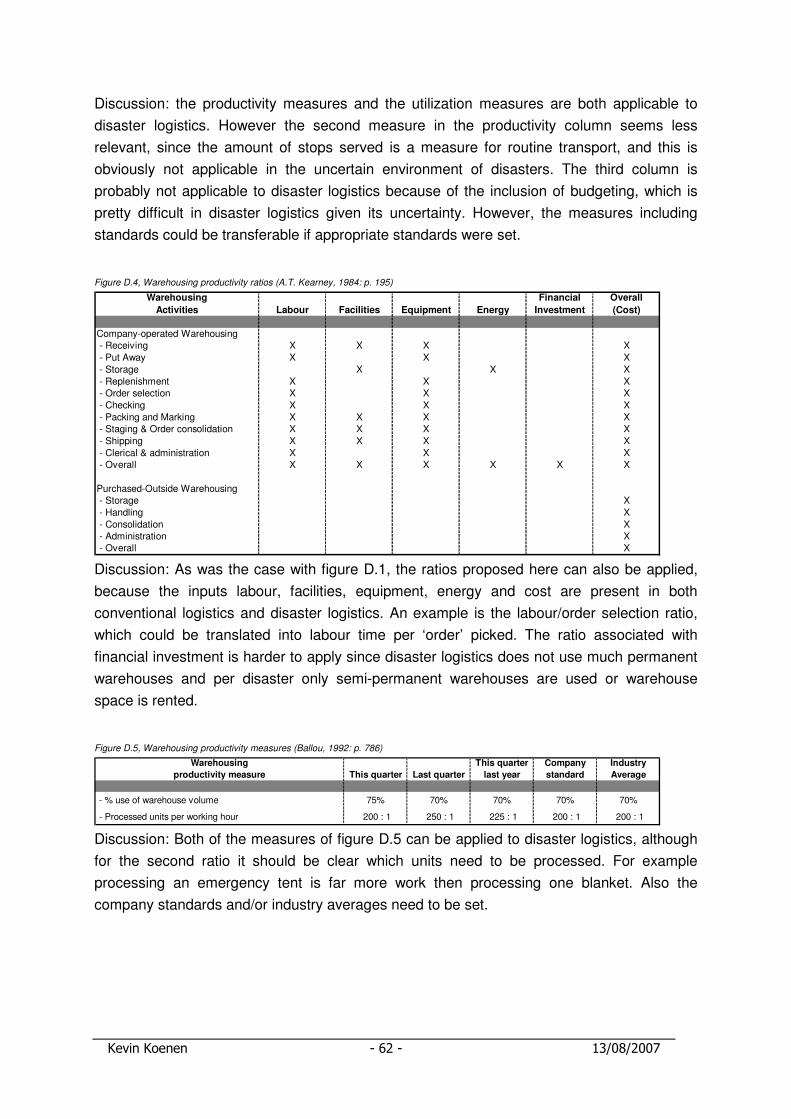
Kevin Koenen - 62 - 13/08/2007
Discussion: the productivity measures and the utilization measures are both applicable to
disaster logistics. However the second measure in the productivity column seems less
relevant, since the amount of stops served is a measure for routine transport, and this is
obviously not applicable in the uncertain environment of disasters. The third column is
probably not applicable to disaster logistics because of the inclusion of budgeting, which is
pretty difficult in disaster logistics given its uncertainty. However, the measures including
standards could be transferable if appropriate standards were set.
Figure D.4, Warehousing productivity ratios (A.T. Kearney, 1984: p. 195)
Warehousing
Activities Labour Facilities Equipment Energy
Financial
Investment
Overall
(Cost)
Company-operated Warehousing - Receiving X X X X
- Put Away X X X
- Storage X X X
- Replenishment X X X - Order selection X X X
- Checking X X X
- Packing and Marking X X X X - Staging & Order consolidation X X X X
- Shipping X X X X
- Clerical & administration X X X - Overall X X X X X X
Purchased-Outside Warehousing - Storage X
- Handling X
- Consolidation X - Administration X - Overall X
Discussion: As was the case with figure D.1, the ratios proposed here can also be applied,
because the inputs labour, facilities, equipment, energy and cost are present in both
conventional logistics and disaster logistics. An example is the labour/order selection ratio,
which could be translated into labour time per ‘order’ picked. The ratio associated with
financial investment is harder to apply since disaster logistics does not use much permanent
warehouses and per disaster only semi-permanent warehouses are used or warehouse
space is rented.
Figure D.5, Warehousing productivity measures (Ballou, 1992: p. 786)
Warehousing
productivity measure This quarter Last quarter
This quarter
last year
Company
standard
Industry
Average
- % use of warehouse volume 75% 70% 70% 70% 70%
- Processed units per working hour 200 : 1 250 : 1 225 : 1 200 : 1 200 : 1
Discussion: Both of the measures of figure D.5 can be applied to disaster logistics, although
for the second ratio it should be clear which units need to be processed. For example
processing an emergency tent is far more work then processing one blanket. Also the
company standards and/or industry averages need to be set.

Kevin Koenen - 63 - 13/08/2007
Figure D.6, Warehousing effectiveness measures (Gattorna & Walters, 1996: p. 120)
Productivity Utilization Performance
- Dollar value throughput / total warehouse cost
- Actual weight throughput /maximum weight throughput
- Actual total warehouse cost /budgeted warehouse cost
- Weight throughput /
total warehouse cost
- Actual orders throughput /
maximum orders throughput
- Actual weight throughput per total
warehouse cost
- Orders throughput /
total warehouse cost
- Actual lines throughput /
maximum lines throughput
- Actual weight throughput per square
foot / standard weight throughput per square foot
- Lines throughput / total warehouse cost
- Square feet used /square feet available
- Actual orders throughput per total warehouse cost / standard orders
throughput per total warehouse cost
- Units throughput /
total warehouse cost
- Cubic feet used /
cubic feet available
- Actual orders throughput per square
foot / standard orders throughput per
square foot
- Actual lines throughput per total
warehouse cost / standard lines throughput per total warehouse cost
- Actual lines throughput per square foot / standard lines throughput per
square foot
- Actual units throughput per total
warehouse cost / standard units throughput per total warehouse cost
- Actual units throughput per square foot / standard units throughput per
square foot
- Actual throughput cycle time /
standard throughput cycle time
Warehousing effectiveness measures
Discussion: the productivity measures and the utilization measures are both applicable to
disaster logistics. However the second measure in the utilization column seems less relevant,
since the concept of orders is different for disaster logistics. As was the case with figure D.3
the budgeting measure of the third column are not applicable, while the measures including
standards can be applied when appropriate standards are set per disaster context.
Figure D.7, Purchasing productivity ratios (A.T. Kearney, 1984: p. 242)
Purchasing
Activities Labour Equipment
Financial
Investment
Overall
(Cost)
- Sourcing X X
- Procurement X X X
- Cost control X X - Overall X
Discussion: Again, the ratios proposed here can be applied to disaster logistics, because the
inputs labour, equipment and cost are present in both conventional logistics and disaster
logistics. An example is the labour/sourcing ratio, which could be translated into labour time
spend per commodity, when trying to source goods locally in the disaster area.

Kevin Koenen - 64 - 13/08/2007
Figure D.8, Inventory productivity ratios (A.T. Kearney, 1984: p. 242)
Inventory
Activities Labour Equipment
Financial
Investment
Overall
(Cost)
- Forecasting X X X
- Planning & Budgeting X X X
- Execution & Control X X X - Overall X X
Discussion: the ratios proposed in figure D.8 can be applied to disaster logistics, because the
inputs labour, equipment, investments and cost are present in both conventional logistics and
disaster logistics. An example is the financial investment/overall ratio, which could be
translated into amount of money tied up in aid agency inventory.
Figure D.9, Inventory productivity measures (Ballou, 1992: p. 786)
Inventory
productivity measure This quarter Last quarter
This quarter
last year
Company
standard
Industry
Average
- Inventory circulation frequency 4,5 : 1 4,4 : 1 5,0 : 1 4,7 : 1 6,0 : 1
- Outdated or Obsolete inventory / turnover 0,1 : 1 0,1 : 1 0,3 : 1 0,1 : 1 0,2 : 1
Discussion: The measures suggested in figure D.9 are probably not that useful in disaster
logistics. The first measure is not applicable because of the uncertain environments of
disasters, while this measure is more useful in a more predictable and routine environment.
The second measure includes turnover, which is a concept that is not relevant in disaster
logistics. Replacing turnover with, for example, total funds available might make this measure
more applicable to disaster logistics.
Figure D.10, Inventory effectiveness measures (Gattorna & Walters, 1996: p. 136)
Productivity Utilization Performance
- Total dollar value inventory managed / inventory holding cost
- Stock value / working capital - Actual dollar value of inventory / planned dollar value of inventory
- Total SKUs managed / inventory holding cost
- Stock turns by relevant category - Actual inventory management cost / budgeted inventory management cost
- Total dollar value inventory managed / costs attributable to inventory management activity
Inventory effectiveness measures
Discussion: the productivity- and utilization measures of figure C.10 can be applied to
disaster logistics although inventory remains a rather uncertain activity. For example, for
disasters it is hard to predict when and where they are going to happen, thereby making
holding inventory also a difficult item to measure. Because of the same reasons, the
performance column is hard to apply because these include planning and budgeting.

Kevin Koenen - 65 - 13/08/2007
Figure D.11, Production productivity ratios (A.T. Kearney, 1984: p. 242)
Production
Activities Labour Equipment
Financial
Investment
Overall
(Cost)
- Production planning X X - Production control X X
- Scheduling & Dispatching X X X
- Shop floor data collection X X X - Overall X
Discussion: the ratios proposed in figure D.11 can be applied to disaster logistics, because
the inputs labour, equipment and cost are present in both conventional logistics and disaster
logistics. However, often aid agencies do not produce products themselves; therefore the
relevance for disaster logistics is questionable.
Figure D.12, Order processing productivity ratios (A.T. Kearney, 1984: p. 293)
O rder Processing
Activities Labour
Facilities/
Equipment
W orking
Capital
O verall
(Cost)
O rder processing
- O rder entry/editing X X X X
- Scheduling X X
- O rder/shipping set preparation X X X
- Inv oicing X X X
Custom er com m unication
- O rder m odification X X X
- O rder status inquiries X X X
- Tracing and Expediting X X X
- Error correction X X
- Product inform ation requests X X
Credit and Collection
- Credit checking X X X - Accounts receiv able processing X X X X
Discussion: the performance measures suggested in the order-processing category can be
applied to disaster logistics since the inputs labour, equipment and cost are present in both
conventional logistics and disaster logistics. However, in order to use these measures in
disaster logistics the concept of orders has to be accurately defined, because orders they are
different between conventional- and disaster logistics. For example, invoicing for ‘customer’
orders is not possible in disasters since aid is provided free of charge.
Figure D.13, Order processing productivity measures (Ballou, 1992: p. 786) Order processing
productivity measure This quarter Last quarter
This quarter
last year
Company
standard
Industry
Average
- Processed orders per working hour 50 : 1 45 : 1 55 : 1 50 : 1 50 : 1
- % of orders processed within 24 hours 96% 92% 85% 95% 93%
- Order procession costs per Order € 5,50 € 4,95 € 5,65 € 5,00 -
Discussion: The first and third measures are hard to apply since the concept of orders is
different in disaster logistics; therefore a measure of processed orders per working hour
seems irrelevant. The second measure could be useful, however one has to change orders
in disaster area served for example.

Kevin Koenen - 66 - 13/08/2007
Figure D.14, Order processing effectiveness measures (Gattorna & Walters, 1996: p. 163)
Productivity Utilization Performance
- Total orders entered / total order entry cost
- Total volume of orders entered / total order entry capacity
- Actual order entry costs / budgeted order entry costs
- Total SKUs entered / total order entry
cost
- Total orders received / total order
entry capacity
- Standard order entry cost allowances
earned / total order entry costs incurred
- Total monetary value of orders
entered / total order entry cost
- Total actual transaction throughput /
maximum transaction capacity
- Actual order set preparation costs /
budgeted order set preparation costs
- Total number order sets prepared / total order set preparation costs
- Total volume of Order sets prepared / Total Order set preparation capacity
- Actual 'other document' preparation costs / budgeted 'other document'
preparation costs
- Total number other transaction
documents prepared / Total cost of
preparing other documents
- Total volume of other transactions
prepared / Total capacity for preparing
other transitions
- Standard order set preparation
allowances earned / total order set
preparation costs incurred
- Total number invoices prepared / total invoice preparation costs
- Total volume of orders received for
preparation / total order set preparation capacity
- Standard 'other document'
preparation allowances earned / total 'other document' preparation costs
- Total monetary value invoiced / Total
invoice preparation costs
- Total volume of invoices processed /
Total invoice processing capacity
- Actual invoice processing costs /
budgeted invoice processing costs
- Total number customer inquiries
handled / total customer communication costs
- Total volume of enquiries handled /
total inquiry handling capacity
- Standard invoice processing cost
allowances earned / Total invoice processing costs incurred
- Actual customer communication cost / budgeted communication cost
- Standard customer communication
cost allowances earned / total actual
costs incurred
Order procession effectiveness measures
Discussion: given the difference in definition of orders for disaster logistics versus
conventional logistics the measures suggested in figure D.14 are hard to apply to disaster
logistics. Moreover the productivity measures including invoicing and or budgeting also seem
irrelevant since they are usually not present, or very hard to perform in disaster logistics.
Figure D.15, Supply chain comprehensive performance measures (Harisson & Van Hoek, 2002: p. 213 - 214)
M easu re E xp lan atio n
- O n tim e in fu ll, ou tboundA m easure of custom er orders fu lf i l led, com ple te and on tim e,
conform ing to spec if ication
- O n tim e in fu ll, inboundA m easure of supplie r deliv eries rece iv ed, com ple te and on tim e,
conf irm ing to spec if ication
- In terna l de fect ratesA m easure of process conform ance and contro l (ra ther then
inspection)
- N ew product in troduction rate A m easure of supply cha in product responsiv eness
- C ost reduction A m easure of usable product and process dev e lopm ent
- S tock turnsA m easure of supply cha in goods f low (th is m easure is usefu l on ly
when app lied to a spec if ic p roducts and the ir supply cha ins)
- O rder to de liv ery lead tim e A m easure of supply cha in process responsiv eness
- F iscal f lex ib il ityA m easure of how easy it is to structure the supp ly chain for
f inanc ia l adv antage
S u p p ly ch ain co m p reh en sive p erfo rm an ce m easu res

Kevin Koenen - 67 - 13/08/2007
Discussion: the first two measures are difficult to apply because ‘on time’ is very difficult to
define in disaster logistics. The fourth measure is also not applicable to disaster logistics
since it is focussed too much on innovation in products, which is not a main concern for
disaster logistics. Cost reduction and order delivery lead-time can be applied to disaster
logistics although one has to consider the difference in the concept of ‘orders’.
Figure D.16, Supply chain comprehensive performance measures (Bowersox et. al., 2002: p. 563 - 566)
Measure Explanation
- Cash-to-Cash conversion
Cash-to-cash cycle time is the time required to convert a dollar spent on inventory into a
dollar collected from sales revenue. = days of supply of inventory + days of accounts receivable outstanding - days of trade accounts payable outstanding.
- Supply chain inventory days of supply
Total finished goods inventory at all plants, duistribution centers, wholesalers, and retailers expressed as the calendar days of sales available.
- Dwell timeInventory dwell time is the ratio of the days inventroy sits idle in the supply chain to the days it is being productively used or positioned.
- On-shelf in-stock percent Simply the percentage of time that a product is available on the shelf in a store.
- Total supply chain costMeasuring the total cost of a supply chain in order to improve with the supply chain as a whole. As long as the total reductions in cost are larger than the cost increase for one supply chain member, the supply chain as a whole is improved.
- Supply chain response timeA theoretical approximation for the amount of time required for a supply chain to recognize a fundamental shoft in marketplace demand, internalize that finding, replan, and adjust output to meet that demand.
Supply chain comprehensive performance measures
Discussion: From figure D.16 dwell time, total supply chain cost and supply chain response
time are applicable measures, since they do not interfere with the disaster logistics process.
The other measurements are not applicable because they interfere with the specific context
of disaster logistics. For instance on-shelf-in-stock is not useable because aid is generally
not provided.
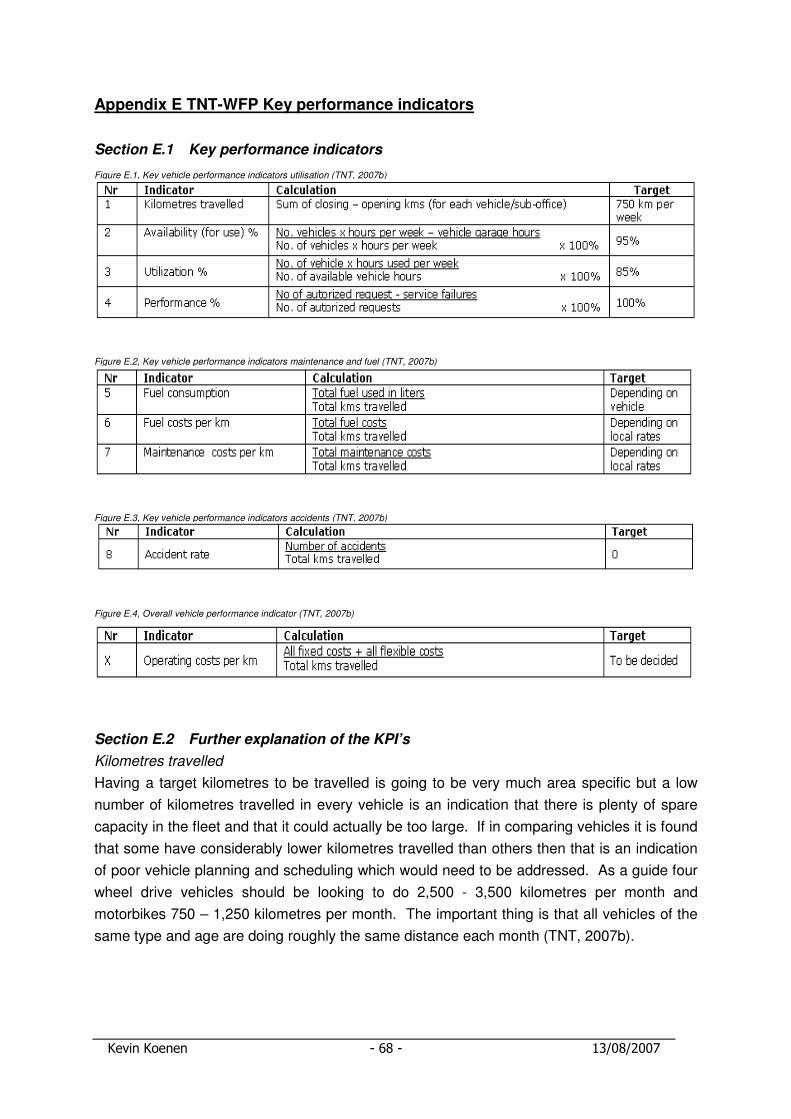
Kevin Koenen - 68 - 13/08/2007
Appendix E TNT-WFP Key performance indicators
Section E.1 Key performance indicators
Figure E.1, Key vehicle performance indicators utilisation (TNT, 2007b)
Figure E.2, Key vehicle performance indicators maintenance and fuel (TNT, 2007b)
Figure E.3, Key vehicle performance indicators accidents (TNT, 2007b)
Figure E.4, Overall vehicle performance indicator (TNT, 2007b)
Section E.2 Further explanation of the KPI’s
Kilometres travelled
Having a target kilometres to be travelled is going to be very much area specific but a low
number of kilometres travelled in every vehicle is an indication that there is plenty of spare
capacity in the fleet and that it could actually be too large. If in comparing vehicles it is found
that some have considerably lower kilometres travelled than others then that is an indication
of poor vehicle planning and scheduling which would need to be addressed. As a guide four
wheel drive vehicles should be looking to do 2,500 - 3,500 kilometres per month and
motorbikes 750 – 1,250 kilometres per month. The important thing is that all vehicles of the
same type and age are doing roughly the same distance each month (TNT, 2007b).

Kevin Koenen - 69 - 13/08/2007
Availability %
With a well maintained fleet that is renewed on a timely basis, it is realistic to expect to
achieve 95% vehicle availability. A figure of 100% is not good as it indicates that time is not
been given for planned preventative maintenance. Low availability indicates problems in
maintenance, and that the workshop is performing badly as a well maintained vehicle should
not have to spend a great deal of time in the workshop. It could also indicate that required
documents are not available, such as a road licence. Appropriate vehicles for the work and
terrain, planned preventative maintenance, rigorous quality control and good spare part
availability will significantly improve vehicle availability. High availability in itself does not
equal improved service delivery unless there is a good transport planning and scheduling of
vehicles but is a pre requisite for ensuring that there is sufficient transport at the disposal of
the programmes. A further benefit of high availability is that it usually leads to a lower cost
per kilometre as there are less repair costs (TNT, 2007b).
Utilization %
Utilisation is calculated as a percentage of total number of working hours in a week. The total
numbers of working hours are for each operation different. From 8-6 daily and half a day in
the weekend would mean the total number of working hours a week is 10 x 5 + 4 = 54 hours.
Low utilisation indicates that there is spare capacity in the fleet especially if combined with
low number of kilometres travelled. High Utilisation with low kilometres travelled is often seen
when vehicles are allocated to a person or project rather than being part of a general pool.
This reflects poor planning and scheduling and should be addressed. In circumstances
where one person does need to have a vehicle available to them at all times, the transport
department should consider rotating the vehicle made available to them so that kilometres
travelled and utilisation figures for all vehicles are as close together as possible (TNT, 2007b).
Performance %
This is the single most important indicator as it represents whether we are able to do the
work that we need and want to do. It is the closest indicator to demonstrating the impact of
transport on service delivery. This percentage indicates what percentage of authorised trips
was achieved. As transport is provided to support the work of the programmes the needs
satisfaction target should be 100% however problems will arise and cause the indicator to
drop below 100% without causing major concern. If the performance % is dropping
outsourcing transport, good arrangement for rental vehicles and planning should be looked at
(TNT, 2007b).
Fuel consumption/costs
Fuel consumption varies on engine size, vehicle weight and fuel type. It is also dependent
on the skills of the vehicle operator, the speeds driven, road conditions, the mechanical
condition of the vehicle, and the loads carried. For example the faster a vehicle is being
driven, low on tyre pressure or where gears are poorly used, the higher the fuel consumption
will be. Equally, poor roads, heavily loaded vehicle and use of the air-conditioning will cause

Kevin Koenen - 70 - 13/08/2007
the fuel consumption to be higher. However low figures do not necessarily relate to these
factors and investigations must be made to ensure that fuel is not stolen. Recording the daily
fuel consumption of each vehicle will greatly facilitate this. Same vehicle types of roughly the
same age and travelling on similar terrain can be expected to have similar fuel consumptions
(TNT, 2007b).
It is useful to compare:
• One vehicle to another in a certain month
• One particular vehicle in several months
Figure E.5, Target number of km per litre (TNT, 2007b)
Maintenance costs
Maintenance should be outsourced as much as possible, for preventive maintenance as well
as for repairs. WFP owned workshop should only be established when there is no local
maintenance available. There are three main reasons for this:
• Outsourcing builds local capacity
• Soil pollution
• In-house maintenance is often more expensive then outsourcing maintenance
It is important to keep track of the maintenance and repair costs for each vehicle (TNT,
2007b).
Accident rate
Safety cannot be compromised and therefore there has to be a target of zero accidents and
incidents. If it is ever above zero then a thorough investigation should be carried out.
Accidents can indicate the need for (re)establishing the fleet safety concept within your
organisation (TNT, 2007b).
Section E.3 Discussion
Once performance data exists, it should be measured each month against the KPI targets
set, trends examined and potential for improvements to the fleet identified. At the end of
each month the data for each vehicle can be examined to see if there are any areas that
need any further attention. Local knowledge will then assist in determining the cause of the
problem and in identifying the solution.

Kevin Koenen - 71 - 13/08/2007
Everybody involved in the transport management system needs to get feedback on
performance and how the information is used. Picking out exemplary performance can be
used just as much as picking out poor performance to stimulate team motivation.
Feedback however needs to go beyond senior management and the transport team. The
real key to improving transport performance is a change in thinking of all people who use
transport. Everyone needs to realise that it is an extremely expensive resource and that its
use is focused on improving the delivery of services that the organisation is responsible for
and that therefore everyone needs to play a role in that. Combining transport requirements
and therefore moving with full vehicles would be one example of how this can be done (TNT,
2007b).

Kevin Koenen - 72 - 13/08/2007
Appendix F SPHERE-project standards
Section F.1 Common standards
Common standard 1: participation
The disaster-affected population actively participates in the assessment, design,
implementation, monitoring and evaluation of the assistance programme (Sphere, 2004).
Common standard 2: initial assessment
Assessments provide an understanding of the disaster situation and a clear analysis of
threats to life, dignity, health and livelihoods to determine, in consultation with the relevant
authorities, whether an external response is required and, if so, the nature of the response
(Sphere, 2004).
Common standard 3: response
A humanitarian response is required in situations where the relevant authorities are unable
and/or unwilling to respond to the protection and assistance needs of the population on the
territory over which they have control, and when assessment and analysis indicate that these
needs are unmet (Sphere, 2004).
Common standard 4: targeting
Humanitarian assistance or services are provided equitably and impartially, based on the
vulnerability and needs of individuals or groups affected by disaster (Sphere, 2004).
Common standard 5: monitoring
The effectiveness of the programme in responding to problems is identified and changes in
the broader context are continually monitored, with a view to improving the programme, or to
phasing it out as required (Sphere, 2004).
Common standard 6: evaluation
There is a systematic and impartial examination of humanitarian action, intended to draw
lessons to improve practice and policy and to enhance accountability (Sphere, 2004).
Common standard 7: aid worker competencies and responsibilities
Aid workers possess appropriate qualifications, attitudes and experience to plan and
effectively implement appropriate programmes (Sphere, 2004).
Common standard 8: supervision, management and support of personnel
Aid workers receive supervision and support to ensure effective implementation of the
humanitarian assistance programme (Sphere, 2004).

Kevin Koenen - 73 - 13/08/2007
Section F.2 Minimum standards in water supply, sanitation and hygiene
Hygiene promotion standard 1: programme design and implementation
All facilities and resources provided reflect the vulnerabilities, needs and preferences of the
affected population. Users are involved in the management and maintenance of hygiene
facilities where appropriate (Sphere, 2004).
Water supply standard 1: access and water quantity
All people have safe and equitable access to a sufficient quantity of water for drinking,
cooking and personal and domestic hygiene. Public water points are sufficiently close to
households to enable use of the minimum water requirement (Sphere, 2004).
Water supply standard 2: water quality
Water is palatable, and of sufficient quality to be drunk and used for personal and domestic
hygiene without causing significant risk to health (Sphere, 2004).
Water supply standard 3: water use facilities and goods
People have adequate facilities and supplies to collect, store and use sufficient quantities of
water for drinking, cooking and personal hygiene, and to ensure that drinking water remains
safe until it is consumed (Sphere, 2004).
Excreta disposal standard 1: access to, and numbers of toilets
People have adequate numbers of toilets, sufficiently close to their dwellings, to allow them
rapid, safe and acceptable access at all times of the day and night (Sphere, 2004).
Excreta disposal standard 2: design, construction and use of toilets
Toilets are sited, designed, constructed and maintained in such a way as to be comfortable,
hygienic and safe to use (Sphere, 2004).
Vector control standard 1: individual and family protection
All disaster-affected people have the knowledge and the means to protect themselves from
disease and nuisance vectors that are likely to represent a significant risk to health or well-
being (Sphere, 2004).
Vector control standard 2: physical, environmental and chemical protection measures
The numbers of disease vectors that pose a risk to people's health and nuisance vectors that
pose a risk to people's well-being are kept to an acceptable level (Sphere, 2004).
Solid waste management standard 1: collection and disposal
People have an environment that is acceptably uncontaminated by solid waste, including
medical waste, and have the means to dispose of their domestic waste conveniently and
effectively (Sphere, 2004).

Kevin Koenen - 74 - 13/08/2007
Drainage standard 1: drainage works
People have an environment in which the health and other risks posed by water erosion and
standing water, including storm water, floodwater, domestic wastewater and wastewater from
medical facilities, are minimised (Sphere, 2004).
Section F.3 Minimum standards in food security, nutrition and food aid
Assessment and analysis standard 1: food security
Where people are at risk of food insecurity, programme decisions are based on a
demonstrated understanding of how they normally access food, the impact of the disaster on
current and future food security, and hence the most appropriate response (Sphere, 2004).
Assessment and analysis standard 2: nutrition
Where people are at risk of malnutrition, programme decisions are based on a demonstrated
understanding of the causes, type, degree and extent of malnutrition, and the most
appropriate response (Sphere, 2004).
Food security standard 1: general food security
People have access to adequate and appropriate food and non-food items in a manner that
ensures their survival, prevents erosion of assets and upholds their dignity (Sphere, 2004).
Food security standard 2: primary production
Primary production mechanisms are protected and supported (Sphere, 2004).
Food security standard 3: income and employment
Where income generation and employment are feasible livelihood strategies, people have
access to appropriate income-earning opportunities, which generate fair remuneration and
contribute towards food security without jeopardising the resources on which livelihoods are
based. (Sphere, 2004).
Food security standard 4: access to markets
People's safe access to market goods and services as producers, consumers and traders is
protected and promoted (Sphere, 2004).
General nutrition support standard 1: all groups
The nutritional needs of the population are met. (Sphere, 2004).
General nutrition support standard 2: at-risk groups
The nutritional and support needs of identified at-risk groups are met (Sphere, 2004).
Correction of malnutrition standard 1: moderate malnutrition
Moderate malnutrition is addressed (Sphere, 2004).

Kevin Koenen - 75 - 13/08/2007
Correction of malnutrition standard 2: severe malnutrition
Severe malnutrition is addressed (Sphere, 2004).
Correction of malnutrition standard 3: micronutrient malnutrition
Micronutrient deficiencies are addressed (Sphere, 2004).
Food aid planning standard 1: ration planning
Rations for general food distributions are designed to bridge the gap between the affected
population's requirements and their own food resources (Sphere, 2004).
Food aid planning standard 2: appropriateness and acceptability
The food items provided are appropriate and acceptable to recipients and can be used
efficiently at the household level (Sphere, 2004).
Food aid planning standard 3: food quality and safety
Food distributed is of appropriate quality and is fit for human consumption (Sphere, 2004).
Food aid management standard 1: food handling
Food is stored, prepared and consumed in a safe and appropriate manner at both household
and community levels (Sphere, 2004).
Food aid management standard 2: supply chain management
Food aid resources (commodities and support funds) are well managed, using transparent
and responsive systems (Sphere, 2004).
Food aid management standard 3: distribution
The method of food distribution is responsive, transparent, equitable and appropriate to local
conditions (Sphere, 2004).
Section F.4 Minimum standards in shelters, settlements & non-food-items
Shelter and settlement standard 1: strategic planning
Existing shelter and settlement solutions are prioritised through the return or hosting of
disaster-affected households, and the security, health, safety and well-being of the affected
population are ensured (Sphere, 2004).
Shelter and settlement standard 2: physical planning
Local physical planning practices are used where possible, enabling safe and secure access
to and use of shelters and essential services and facilities, as well as ensuring appropriate
privacy and separation between individual household shelters (Sphere, 2004).

Kevin Koenen - 76 - 13/08/2007
Shelter and settlement standard 3: covered living space
People have sufficient covered space to provide dignified accommodation. Essential
household activities can be satisfactorily undertaken, and livelihood support activities can be
pursued as required (Sphere, 2004).
Shelter and settlement standard 4: design
The design of the shelter is acceptable to the affected population and provides sufficient
thermal comfort, fresh air and protection from the climate to ensure their dignity, health,
safety and well-being (Sphere, 2004).
Shelter and settlement standard 5: construction
The construction approach is in accordance with safe local building practices and maximises
local livelihood opportunities (Sphere, 2004).
Shelter and settlement standard 6: environmental impact
The adverse impact on the environment is minimised by the settling of the disaster-affected
households, the material sourcing and construction techniques used (Sphere, 2004).
Non-food items standard 1: clothing and bedding
The people affected by the disaster have sufficient clothing, blankets and bedding to ensure
their dignity, safety and well-being (Sphere, 2004).
Non-food items standard 2: personal hygiene
Each disaster-affected household has access to sufficient soap and other items to ensure
personal hygiene, health, dignity and well-being (Sphere, 2004).
Non-food items standard 3: cooking and eating utensils
Each disaster-affected household has access to cooking and eating utensils (Sphere, 2004).
Non-food items standard 4: stoves, fuel and lighting
Each disaster-affected household has access to communal cooking facilities or a stove and
an accessible supply of fuel for cooking needs and to provide thermal comfort. Each
household also has access to appropriate means of providing sustainable artificial lighting to
ensure personal security (Sphere, 2004).
Non-food items standard 5: tools and equipment
Each disaster-affected household responsible for the construction or maintenance and safe
use of their shelter has access to the necessary tools and equipment (Sphere, 2004).

Kevin Koenen - 77 - 13/08/2007
Section F.5 Minimum standards in health services
Health systems and infrastructure standard 1: prioritising health services
All people have access to health services that are prioritised to address the main causes of
excess mortality and morbidity (Sphere, 2004).
Health systems and infrastructure standard 2: supporting national and local health systems
Health services are designed to support existing health systems, structures and providers
(Sphere, 2004).
Health systems and infrastructure standard 3: coordination
People have access to health services that are coordinated across agencies and sectors to
achieve maximum impact (Sphere, 2004).
Health systems and infrastructure standard 4: primary health care
Health services are based on relevant primary health care principles (Sphere, 2004).
Health systems and infrastructure standard 5: clinical services
People have access to clinical services that are standardised and follow accepted protocols
and guidelines (Sphere, 2004).
Health systems and infrastructure standard 6: health information systems
The design and development of health services are guided by the ongoing, coordinated
collection, analysis and utilisation of relevant public health data (Sphere, 2004).
Control of communicable diseases standard 1: prevention
People have access to information and services that are designed to prevent the
communicable diseases that contribute most significantly to excess morbidity and mortality
(Sphere, 2004).
Control of communicable diseases standard 2: measles prevention
All children aged 6 months to 15 years have immunity against measles (Sphere, 2004).
Control of communicable diseases standard 3: diagnosis and case management
People have access to effective diagnosis and treatment for those infectious diseases that
contribute most significantly to preventable excess morbidity and mortality (Sphere, 2004).
Control of communicable diseases standard 4: outbreak preparedness
Measures are taken to prepare for and respond to outbreaks of infectious diseases (Sphere,
2004).

Kevin Koenen - 78 - 13/08/2007
Control of communicable diseases standard 5: outbreak detection, investigation and
response
Outbreaks of communicable diseases are detected, investigated and controlled in a timely
and effective manner (Sphere, 2004).
Control of communicable diseases standard 6: HIV/AIDS
People have access to the minimum package of services to prevent transmission of
HIV/AIDS (Sphere, 2004).
Control of non-communicable diseases standard 1: injury
People have access to appropriate services for the management of injuries (Sphere, 2004).
Control of non-communicable diseases standard 2: reproductive health
People have access to the Minimum Initial Service Package (MISP) to respond to their
reproductive health needs (Sphere, 2004).
Control of non-communicable diseases standard 3: mental and social aspects of health
People have access to social and mental health services to reduce mental health morbidity,
disability and social problems (Sphere, 2004).
Control of non-communicable diseases standard 4: chronic diseases
For populations in which chronic diseases are responsible for a large proportion of mortality,
people have access to essential therapies to prevent death (Sphere, 2004).
Kevin Koenen - 79 - 13/08/2007
Appendix G Alphabetical index
Accountability (Benefit) 42 Impartiality 24
Aid agency 7, 19 Improve processes (Benefit) 42
Appeal coverage 35 Independence 24
Assessment accuracy 35 Information flow 22
Information technology challenge 27
Benchmarking 31 In-kind donations 18
Beneficiaries 8, 17 Internal benchmarking 31
Beneficiary country government 20 Internal validity 11
Biological disaster 13 Inventory 21
Business Process perspective 32
Business sector 8 Lack of institutional memory (challenge) 27
Lack of logistical knowledge (challenge) 26
Common standards 34 Lack of professionalisation (challenge) 27
Competitive benchmarking 31 Learning and Growth perspective 32
Complexity (challenge) 26 Literature review 10
Control 28 Logistical knowledge retention (Benefit) 42
Corporate social responsibility 18 Logistics as strategic function (Benefit) 43
Customer perspective 32
Man-made disasters 13
Descriptive study 10 Material flow 22
Directing 28 Media 19
Disaster logistics 7 Military 19
Disaster management 16 Mitigation phase 16
Donation-to-delivery-time 35 Monitoring 28
Donors 8
Donor accountability 18 Natural disasters 13
Donor countries 17 Needs assessments 19
Neutrality 24
Employee turnover (challenge) 26 Nutrition standards 34
Exploratory study 10
External validity 11 Operational challenges 25
Order processing 20
Financial efficiency 35 Organizational challenges 27
Financial flow 21 Other disasters 13
Financial perspective 32
Food aid standards 34 People flow 22
Food security standards 34 Performance 28
Functional benchmarking 31 Performance management 7, 28
Funding flow 21 Performance management systems 31
Performance measurement 28
General public 18 Performance standards 28
Generic process benchmarking 31 Preparedness phase 16
Geological disasters 13 Production 21
Project-to-project mentality 27
Health services standards 34 Purchasing 20
Humanitarian space 24
Humanity 24 Rehabilitation phase 16
Hydro-meteorological disaster 13 Reliability 10
Response phase 16
Kevin Koenen - 80 - 13/08/2007
Secondary data 10 Transportation 21
Shelter standards 34
Slow onset disasters 14 Unity 24
Stakeholder challenges 26 Universality 24
Standardization (Benefit) 42 Unsolicited donations 18
Sudden onset disasters 14 Voluntary service 24
Supply chain comprehensive -
performance measures 30 Warehousing 21
Water supply, sanitation and-
hygiene standards 34