Conductivity and microstructural evaluation of SGDC solid ... - Elsevier
11
Please cite this article in press as: P.C. Cajas Daza, et al., Conductivity and microstructural evaluation of SGDC solid electrolytes synthetized by Pechini and controlled precipitation, Bol. Soc. Esp. Cerám. Vidr. (2021), https://doi.org/10.1016/j.bsecv.2021.04.003 ARTICLE IN PRESS BSECV-281; No. of Pages 11 b o l e t í n d e l a s o c i e d a d e s p a ñ o l a d e c e r á m i c a y v i d r i o x x x (2 0 2 1) xxx–xxx www.elsevier.es/bsecv Conductivity and microstructural evaluation of SGDC solid electrolytes synthetized by Pechini and controlled precipitation Paola Cristina Cajas Daza, Jorge Luiz de Almeida Ferreira, José Alexander Araujo, José Antônio Euzébio Paiva, Rodrigo Arbey Mu ˜ noz Meneses, Cosme Roberto Moreira da Silva * Department of Mechanical Engineering, Materials Group, University of Brasilia, Brasília, DF 70940-910, Brazil a r t i c l e i n f o Article history: Received 21 July 2020 Accepted 22 April 2021 Available online xxx Keywords: Synthesis Pechini Ceramics Electrolyte a b s t r a c t In this work, controlled precipitation synthesis methods and polymeric precursors (Pechini) were used to obtain gadolinium-doped cerium oxide solid electrolytes (Ce 0.8 Gd 0.2 O 1.9 ) and double-doped cerium oxide with gadolinium and samarium (Ce 0.8 Gd 0.2-x Sm x O 1.9 x = 0.01; 0.03 and 0.05). The main results indicate that the synthesized powders by the Pechini method present better microstructural characteristics such as larger specific surface area and smaller particle size. Test specimens were compacted (187 MPa) and sintered (1500 ◦ C/6 h) and subsequently characterized. Through the impedance spectroscopy analysis, an increase in the percentage of the samaria caused an increase in the grain boundary and grain conduc- tivity in all the samples under study. In the grain interior, samples without samaria showed heterogeneous regions, where the cation-vacancy pairs are tightly bound, precluding these vacancies from participating in ion conduction. In the samples with samaria, these defect groups are smaller, indicating structural homogeneity, resulting in greater ionic conductiv- ity. Grain boundary specific conductivities show slight increase for samples codoped with samarium oxide. This effect suggests that Sm 3+ additions change the charge equilibrium in space-charge layer favoring better dopant distribution. © 2021 SECV. Published by Elsevier Espa ˜ na, S.L.U. This is an open access article under the CC BY-NC-ND license (http://creativecommons.org/licenses/by-nc-nd/4.0/). Conductividad y evaluación microestructural de Electrolitos sólidos SGDC sintetizados por Pechini y precipitación controlada Palabras clave: Sintesis Pechini Cerámica Electrolitos r e s u m e n En este trabajo se utilizaron los métodos de síntesis precipitación controlada y pre- cursores poliméricos (Pechini) para obtener electrolitos sólidos de ceria dopada con gadolinio (Ce 0.8 Gd 0.2 O 1.9 ) y óxido de ceria doblemente dopada con gadolinio y samario (Ce 0.8 Gd 0.2-x Sm x O 1.9 x = 0.01; 0.03 and 0.05). Los principales resultados indicaron que los ∗ Corresponding author. E-mail address: [email protected] (C.R. Moreira da Silva). https://doi.org/10.1016/j.bsecv.2021.04.003 0366-3175/© 2021 SECV. Published by Elsevier Espa ˜ na, S.L.U. This is an open access article under the CC BY-NC-ND license (http:// creativecommons.org/licenses/by-nc-nd/4.0/).
-
Upload
khangminh22 -
Category
Documents
-
view
1 -
download
0
Transcript of Conductivity and microstructural evaluation of SGDC solid ... - Elsevier
Please cite this article in press as: P.C. Cajas Daza, et al., Conductivity and microstructural evaluation of SGDC solid electrolytes synthetized byPechini and controlled precipitation, Bol. Soc. Esp. Cerám. Vidr. (2021), https://doi.org/10.1016/j.bsecv.2021.04.003
ARTICLE IN PRESSBSECV-281; No. of Pages 11
b o l e t í n d e l a s o c i e d a d e s p a ñ o l a d e c e r á m i c a y v i d r i o x x x (2 0 2 1) xxx–xxx
www.elsev ier .es /bsecv
Conductivity and microstructural evaluation of
SGDC solid electrolytes synthetized by Pechini and
controlled precipitation
Paola Cristina Cajas Daza, Jorge Luiz de Almeida Ferreira, José Alexander Araujo,José Antônio Euzébio Paiva, Rodrigo Arbey Munoz Meneses, Cosme Roberto Moreira daSilva ∗
Department of Mechanical Engineering, Materials Group, University of Brasilia, Brasília, DF 70940-910, Brazil
a r t i c l e i n f o
Article history:
Received 21 July 2020
Accepted 22 April 2021
Available online xxx
Keywords:
Synthesis
Pechini
Ceramics
Electrolyte
a b s t r a c t
In this work, controlled precipitation synthesis methods and polymeric precursors (Pechini)
were used to obtain gadolinium-doped cerium oxide solid electrolytes (Ce0.8Gd0.2O1.9) and
double-doped cerium oxide with gadolinium and samarium (Ce0.8Gd0.2−xSmxO1.9 x = 0.01;
0.03 and 0.05). The main results indicate that the synthesized powders by the Pechini method
present better microstructural characteristics such as larger specific surface area and
smaller particle size. Test specimens were compacted (187 MPa) and sintered (1500 ◦C/6 h)
and subsequently characterized. Through the impedance spectroscopy analysis, an increase
in the percentage of the samaria caused an increase in the grain boundary and grain conduc-
tivity in all the samples under study. In the grain interior, samples without samaria showed
heterogeneous regions, where the cation-vacancy pairs are tightly bound, precluding these
vacancies from participating in ion conduction. In the samples with samaria, these defect
groups are smaller, indicating structural homogeneity, resulting in greater ionic conductiv-
ity. Grain boundary specific conductivities show slight increase for samples codoped with
samarium oxide. This effect suggests that Sm3+ additions change the charge equilibrium in
space-charge layer favoring better dopant distribution.
© 2021 SECV. Published by Elsevier Espana, S.L.U. This is an open access article under the
CC BY-NC-ND license (http://creativecommons.org/licenses/by-nc-nd/4.0/).
Conductividad y evaluación microestructural de Electrolitos sólidos SGDCsintetizados por Pechini y precipitación controlada
Palabras clave:
Sintesis
Pechini
Cerámica
Electrolitos
r e s u m e n
En este trabajo se utilizaron los métodos de síntesis precipitación controlada y pre-
cursores poliméricos (Pechini) para obtener electrolitos sólidos de ceria dopada con
gadolinio (Ce0.8Gd0.2O1.9) y óxido de ceria doblemente dopada con gadolinio y samario
(Ce0.8Gd0.2−xSmxO1.9 x = 0.01; 0.03 and 0.05). Los principales resultados indicaron que los
∗ Corresponding author.E-mail address: [email protected] (C.R. Moreira da Silva).
https://doi.org/10.1016/j.bsecv.2021.04.0030366-3175/© 2021 SECV. Published by Elsevier Espana, S.L.U. This is an open access article under the CC BY-NC-ND license (http://creativecommons.org/licenses/by-nc-nd/4.0/).

Please cite this article in press as: P.C. Cajas Daza, et al., Conductivity and microstructural evaluation of SGDC solid electrolytes synthetized byPechini and controlled precipitation, Bol. Soc. Esp. Cerám. Vidr. (2021), https://doi.org/10.1016/j.bsecv.2021.04.003
ARTICLE IN PRESSBSECV-281; No. of Pages 11
2 b o l e t í n d e l a s o c i e d a d e s p a ñ o l a d e c e r á m i c a y v i d r i o x x x (2 0 2 1) xxx–xxx
polvos sintetizados por el método Pechini presentaron mejores características microestruc-
turales: mayor área de superficie específica y menor tamano de partícula. Los polvos fueron
compactados (187 MPa), sinterizados (1500 ◦C/6 h) y, por fin, caracterizados. Con análisis de
los espectros de impedancia se observó que el aumento del porcentaje de samario provocó
aumento de la conductividad del grano y del contorno de grano en todas las muestras
en estudio. En el interior del grano las muestras sin samaria mostraron regiones het-
erogéneas (grupos de defectos) donde pares catión-vacancia están estrechamente unidos,
lo que impide su participación en la conducción iónica. En las muestras con samaria, estos
grupos de defectos son más pequenos, indicando homogeneidad estructural, obteniendo
una conductividad iónica mas alta. La conductividad específica del límite de grano muestra
un ligero aumento para las muestras codopadas con óxido de samario. Este efecto sug-
iere que las adiciones de Sm3+ cambian el equilibrio de carga en la capa de carga espacial
favoreciendo una mejor distribución del dopante.
© 2021 SECV. Publicado por Elsevier Espana, S.L.U. Este es un artıculo Open Access bajo
la licencia CC BY-NC-ND (http://creativecommons.org/licenses/by-nc-nd/4.0/).
Introduction
Solid oxide fuel cells (SOFCs) are electrochemical devices thattransform chemical into electrical energy. Hydrogen is used asfuel and oxygen as oxidizing gas. SOFCs consist of two porouselectrodes (anode and cathode) and a solid electrolyte. Oneof the objectives of electrodes is to allow gas to go from theelectrode/electrolyte interface and vice versa [1,2]. The widerange of working temperatures is one of the main advan-tages of SOFCs. This performance depends basically on thematerials used in electrolytes and their ability to conductions [3]. The materials used in manufacturing these elec-trolytes are ceramics often with a fluorite structure. Cells arecurrently manufactured with solid electrolytes based on zir-conium oxide and additives, reaching operating temperaturesbetween 800 and 1000 ◦C. Cerium oxide containing additiveshas been widely studied for applications with intermediatetemperature solid oxide fuel cells (IT-SOFCs), given that thisceramic material reduces the operating temperature of thecell, guaranteeing high performance [4,5]. The choice of dop-ing oxides determines electrolytic conductivity. Previous work[1,6–8] indicated that, in addition to forming vacancies, addingdoping cations to the structure favors the formation of largedefect groups of vacancy-cation pairs. Electrolyte performancedepends on its microstructure and the morphology of the pre-cursor powder. Thus, it is essential to optimize the synthesismethods in order to obtain powders with specific charac-teristics [9]. The Pechini polymeric precursor process makesit possible to control the stoichiometry and composition ofthe system, in order to guarantee an atomic-level mixture[10], and is used to obtain a wide range of oxides. The con-trolled precipitation method for synthesizing is characterizedby the precipitation of a solid to a liquid phase. This methodmakes it possible to control the characteristics of powdersproduced during the formation of the solid part (nucle-ation, nucleus growth and saturation) [11], favoring adequateparticle size.
Pure cerium oxide (CeO2) is a mixed conductor becauseit exhibits both electric and ionic conductivity. However, theionic conductivity of pure cerium oxide is significantly lowerthan its electronic counterpart. In order to enhance ionic
conductivity in cerium at intermediate temperatures, theaddition of lower valent oxides may lead to an increase invacancy concentration in the structure, making ionic superiorto electronic conductivity. It is important that the cations ofdoping oxides not significantly alter the structure in order tomaintain as much stability as possible. The literature [12,13]suggests that the oxides that cause the least distortion, thatis, those that contain cations with an ionic radius similar tothat of Ce+4, are best suited to doping. Based on these results,gadolinium and samarium oxides were selected in the presentstudy as dopants of CeO2 to manufacture solid electrolytes.
Omar et al. [14] obtained increase of 30% in bulk con-ductivity in a codoped system (Sm0.75Nd0.075Ce0.85O2−�) whencompared to undoped Gd0.10Ce0.90O2−�. In this case, dopingwith two elements in the same proportions (Sm3+ and Nd3+)reached conductivity similar to the obtained previously withPm3+, at this point, the highest obtained ionic conductivity.Artini et al. [15] carried out double cerium oxide doping usingion with higher ionic radius (Dy3+) and another with smallerradius (Nd3+), aiming to obtain an intermediate radius, simi-lar to the Sm3+. In this case the double doping hinder clustergrowth and, as a result, increased the conductivity. In anotherwork [16] Artini et al., 2019 pointed out that for Ce1−xGdxO2−x/2
systems with doping in a range of 0.10 ≤ x < 0.20, the oxygenvacancies are randomly distributed and free in the crystal lat-tice, and can contribute to conductive process and are notbind to nano domains. Coles-Aldridge [17] synthetized sevencompositions of Ce0.8SmxGdyNdzO1.9 (where x, y and z = 0.2,0.1, 0.0667 or 0 and x + y + z = 0.2) using a low temperaturemethod in order to determine the effect of multiple dop-ing on microstructure and conductivity. It was observed anenhancement effect on conductivity for this combination ofco-dopants between 300 ◦C and 700 ◦C relative to the singlydoped compounds – Ce0.8Sm0.2O and Ce0.8Gd0.2O1.9.
The present study synthesized ceramic powders from the(Ce0.8Gd0.2−xSmxO1.9 x = 0.01; 0.03 and 0.05) using two differentsynthesis processes: the Pechini (polymeric precursors) andcontrolled precipitation methods. Next, the samples were sin-tered and a comparative analysis was conducted of the ionicconductivity of samples produced from different synthesismethods. Significant differences were found between the ionicconductivity behavior of samples produced with powders
Please cite this article in press as: P.C. Cajas Daza, et al., Conductivity and microstructural evaluation of SGDC solid electrolytes synthetized byPechini and controlled precipitation, Bol. Soc. Esp. Cerám. Vidr. (2021), https://doi.org/10.1016/j.bsecv.2021.04.003
ARTICLE IN PRESSBSECV-281; No. of Pages 11
b o l e t í n d e l a s o c i e d a d e s p a ñ o l a d e c e r á m i c a y v i d r i o x x x (2 0 2 1) xxx–xxx 3
sintered by Pechini and controlled precipitation. Conductivityalso increased with a rise in the amount of samaria added. Themain novelty of this work was the use of controlled precipi-tation synthesis methods and polymeric precursors (Pechini)to obtain gadolinium-doped cerium oxide solid electrolytesfollowed by conductivity determination and diffractometricand microstructural characterization in order to identifythe causes of differences in ionic conductivities in samplessintered with powders synthetized with these methods.
Experimental procedure
Powder synthesis
The types of reagents and purity as well as the synthesismethod have a significant effect on the desirable charac-teristics of the product to be obtained. The ceria-basedCe0.8Gd0.2−xSmxO1.9 systems (x = 0.01; 0.03 and 0.05) wereobtained using two different synthesis methods: Pechini poly-meric precursor and controlled precipitation.
The following reagents were used to obtain the powders inboth methods:
• Cerium (III) nitrate hexahydrate (99.5% pure)(Ce(NO3)3·6H2O)
• Gadolinium nitrate hydrate (99.9% pure) (Gd(NO3)3·xH2O)x ∼ 6
• Samarium nitrate hexahydrate (99.9% pure)(Sm(NO3)3·6H2O).
Synthesis using the Pechini polymeric precursor methodwas developed using two different solutions (A and B). In solu-tion A, citric acid was dissolved in ethylene glycol at 70 ◦Cwith a 1:4 ratio by weight. In solution B, the stoichiometricallycalculated precursors of cerium, gadolinium and samariumwere dissolved in distilled water, depending on the desiredcomposition. Solutions A and B were mixed to ensure homog-enization. Ammonium hydroxide was added to this mixtureuntil the solution reached pH 9. Next, the mixture was heatedto 160 ◦C to evaporate and polymerize the solvent, producingthe viscous resin. Finally, the resulting resin was maintainedat a temperature of 300 ◦C for three hours in order to obtainthe pre-calcined material.
A solution of water and ethanol at equal proportions (50 ml)was used as a solvent in controlled precipitation, addingceria nitrate until complete dissolution. Next, gadolinium andsamarium nitrates were added at the percentages calculatedfor each composition. Once the nitrates were dissolved in thesolution, the pH was adjusted to 9 by the slow and controlledaddition of ammonium hydroxide, thereby guaranteeing thecomplete formation of precipitates.
Powder characterization
The specific surface area of the powder samples was deter-mined by gas adsorption (BET), which describes the physicaladsorption of gases on solid surfaces. The amount of gasadsorbed as a function of pressure at a particular temperature
is used to construct the adsorption isotherm [18]. The testswere conducted on micromeritics equipment (ASAP2020).
Laser diffraction particle size analysis of ceria-based pow-ders, obtained by the two synthesis methods, makes it possibleto determine the quantitative distribution of particle sizeand/or sample clusters. For this analysis, the powders weredispersed in ethanol in wet mode. The Horiba LA-930 LaserScattering Particle Size Distribution Analyzer was used.
Qualitative analysis of the morphology of synthesized pow-ders and assessment of the influence of milling processes oncluster size was conducted by scanning electron analysis. Thesamples were previously metalized with a thin gold film inorder to ensure good surface electrical conductivity and avoidimage distortion. The Jeol JSM-7001F scanning electron micro-scope was used for this analysis.
The microstructure of powders from Ce0.8Gd0.2O1.9 andCe0.8Gd0.15Sm0.05O1.9, synthesized by both the Pechini andcontrolled precipitation methods, were analyzed by high-resolution transmission electron microscopy (HRTEM). Theimages made it possible to identify the planes in the pow-der structure. “ImageJ” software was used to measure thedistances between the crystallographic planes, resulting invalues similar to those found in the interplanar distances ofplanes (100) and (111) of the characteristic ceria structure.
Electrolyte compaction and sintering
After the synthesis processes, the powders obtained werethermally analyzed to determine the adequate calcinationtemperature, aimed at eliminating the organic part andvolatile elements of the synthesis methods. After this analy-sis, the thermal treatments of powders obtained by controlledprecipitation and those synthesized by the Pechini methodwere carried out at temperatures between 500 and 550 ◦C (2 h).Next, high-energy milling of the calcined powders in a ballmill was carried out for one hour at 1000 rpm, using a liquidmedium with an ethanol-powder ratio of 5:1. Zirconium balls(2 mm diameter) were used for milling (4:1 ballpowder ratio).After milling, the solution was dried on the heating plate ata temperature of 150 ◦C, with subsequent sieving (0.046 mmsieve), aimed at uniform particle redistribution. Next, the testspecimens were shaped by cold uniaxial pressing in a cylin-drical die with a diameter of approximately 10 mm. Aftercompaction, the test specimens of all the compositions weresintered using a two-stage sintering ramp. The initial heatingrate was 5 ◦C/min up to 900 ◦C with a 5-min plateau, followedby heating up to 1650 ◦C at a heating rate of 2 ◦C/min and 5-minplateau, then cooling to a sintering temperature of 1500 ◦C,maintaining this level for 6 h. The high sintering temperatureswere selected based on previous dilatometry, which indicatedthat these systems exhibit slow kinetics and need high sinter-ing temperature and long plateau times.
Characterization
Sample density was calculated according to ASTM-C744-74,which is based on Archimedes principle [19]. The valuesobtained make it possible to assess the degree of sample den-sification and the effects of the calcination and mechanical
Please cite this article in press as: P.C. Cajas Daza, et al., Conductivity and microstructural evaluation of SGDC solid electrolytes synthetized byPechini and controlled precipitation, Bol. Soc. Esp. Cerám. Vidr. (2021), https://doi.org/10.1016/j.bsecv.2021.04.003
ARTICLE IN PRESSBSECV-281; No. of Pages 11
4 b o l e t í n d e l a s o c i e d a d e s p a ñ o l a d e c e r á m i c a y v i d r i o x x x (2 0 2 1) xxx–xxx
milling processes. A SHIMADZU AUY 220 precision balancewas used to weigh the sintered test specimens.
Scanning electron microscopy was used for the sinteredsamples to analyze microstructural homogeneity resultingfrom the sintering of powders produced by Pechini and con-trolled precipitation synthesis. The samples analyzed werepreviously metalized with a thin gold film to ensure goodsurface electrical conductivity. SEM analyses were performedwith a Jeol JSM7001F.
The crystalline phases present in the sintered sampleswere identified by X-ray diffractometry, using a ShimadzuXRD 6000, with scans between 20◦ and 80◦, in steps of0.02 degrees/min.
Ionic conductivity was determined with a Solartron SI 1260Impedance/Gain-Phase Analyzer The measurements wereperformed in the 1 MHz–1 Hz frequency range with a voltageamplitude of 1000 mV and in the temperature range of 235 ◦Cto 385 ◦C. The specimen surfaces were ground, polished andsputter coated with conductive gold film using the QUORUM150R ES equipment, in order to determine ionic conductivity.The Smart v3.3.1 and ZView 2 software were used for dataacquisition and to fit the impedance data, respectively.
Samples sintered with powders obtained by the methodwith the highest ionic conductivity (Pechini) were selected forhigh-resolution transmission electron microscopy (HRTEM)using the FEI TECNAI G2 F20 HRTEM microscope. For propertesting, the samples should have specific dimensions com-patible with the sample holder. Disks from each of thesintered compositions (3 mm in diameter and 60 �m thick)were obtained. The disks underwent ion-beam thinning untilperforation and the formation of extremely thin edges aroundthe hole, transparent to the transmission microscope electronbeams. After this preparation, the samples were introducedinto HTRM for observation and analyses.
Results and discussion
Characterization of ceramic powders
The characterizations of synthetized powders were carried outwithout calcination and milling.
Specific surface area
The specific surface areas of the synthetized powders,obtained using the Brunauer–Emmett–Teller (BET) technique
Table 1 – Specific surface area of synthetized powders.
Powder composition Specific surface area (m2/g)
Controlled precipitation Pechini
Ce0.80Gd0.20O1.9 5.10 ± 0.13 40.15 ± 0.02Ce0.80Gd0.19Sm0.01O1.9 10.03 ± 0.14 41.99 ± 0.018Ce0.80Gd0.17Sm0.03O1.9 10.92 ± 0.09 36.38 ± 0.78Ce0.80Gd0.15Sm0.05O1.9 16.74 ± 0.37 44.32 ± 0.22
shown in Table 1, exhibit values of up to 44 m2/g in the pow-ders synthetized by the Pechini method. Powders produced bycontrolled precipitation showed much lower values (approx-imately 16 m2/g). The higher specific surface areas observedin Pechini synthesis is expected to result in better reactivitybetween particles during the sintering process, thereby, possi-ble decreasing the temperature needed for densification. Thiseffect minimized imperfections such as the presence of pores,impurity segregation to the boundary regions which promotesexpansion of the crystalline lattice and formation of microc-racks [20]. No large variations in the surface area of particleswere observed with changes in the codoped compositions.However, significant variations in these areas were found forthe different synthesis methods.
Particle size analysis
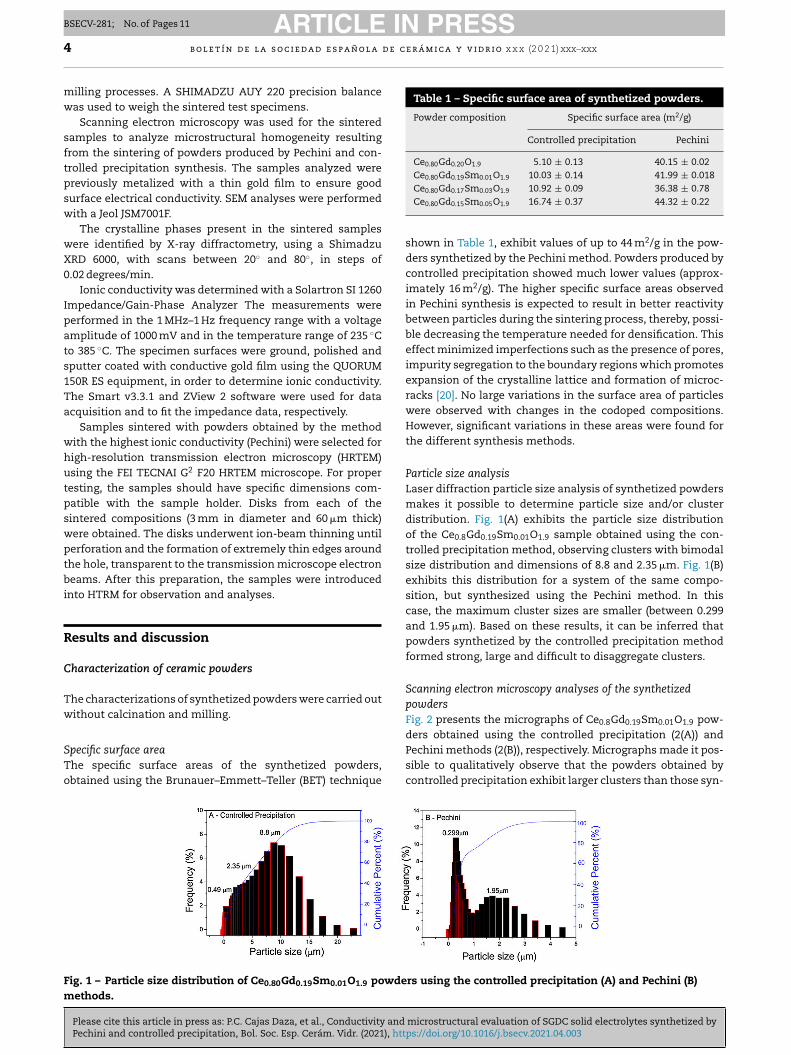
Laser diffraction particle size analysis of synthetized powdersmakes it possible to determine particle size and/or clusterdistribution. Fig. 1(A) exhibits the particle size distributionof the Ce0.8Gd0.19Sm0.01O1.9 sample obtained using the con-trolled precipitation method, observing clusters with bimodalsize distribution and dimensions of 8.8 and 2.35 �m. Fig. 1(B)exhibits this distribution for a system of the same compo-sition, but synthesized using the Pechini method. In thiscase, the maximum cluster sizes are smaller (between 0.299and 1.95 �m). Based on these results, it can be inferred thatpowders synthetized by the controlled precipitation methodformed strong, large and difficult to disaggregate clusters.
Scanning electron microscopy analyses of the synthetized
powders
Fig. 2 presents the micrographs of Ce0.8Gd0.19Sm0.01O1.9 pow-ders obtained using the controlled precipitation (2(A)) andPechini methods (2(B)), respectively. Micrographs made it pos-sible to qualitatively observe that the powders obtained bycontrolled precipitation exhibit larger clusters than those syn-
Fig. 1 – Particle size distribution of Ce0.80Gd0.19Sm0.01O1.9 powders using the controlled precipitation (A) and Pechini (B)
methods.

Please cite this article in press as: P.C. Cajas Daza, et al., Conductivity and microstructural evaluation of SGDC solid electrolytes synthetized byPechini and controlled precipitation, Bol. Soc. Esp. Cerám. Vidr. (2021), https://doi.org/10.1016/j.bsecv.2021.04.003
ARTICLE IN PRESSBSECV-281; No. of Pages 11
b o l e t í n d e l a s o c i e d a d e s p a ñ o l a d e c e r á m i c a y v i d r i o x x x (2 0 2 1) xxx–xxx 5
Fig. 2 – SEM micrograph of Ce0.80Gd0.19Sm0.01O1.9 powders synthetized by the controlled precipitation (A) and Pechini (B)
methods.
thesized by the Pechini method. These results are compatiblewith particle size analyses presented in Fig. 1(A) and (B). Thesame effect was observed in the other compositions preparedhere.
The morphological characterizations of the powdersdemonstrate that the Pechini method favors powders withsmaller particle sizes/clusters. The powders synthetized bythe Pechini method exhibited a larger specific surface area,that is expected to favor the compaction and sintering pro-cesses, maximizing density and minimizing the presence ofpores that act as an insulating phase, directly affecting ionicconductivity in the grain boundaries.
High-resolution transmission electronic microscopy of the
synthetized powders
The microstructures of powders from the Ce0.8Gd0.2O1.9
and Ce0.8Gd0.15Sm0.05O1.9 compositions synthesized by thePechini and controlled precipitation methods were exam-ined by high-resolution transmission electron microscopy(HRTEM). “ImageJ” software was used to measure the dis-tances between crystalline planes, resulting in values similarto those found in the interplanar distances of planes (100) and(111) of the characteristic ceria structure. Figs. 3 and 4 presentthe microstructural analyses of Ce0.8Gd0.2O1.9 powders(without codoping), obtained by the controlled and Pechinimethods, respectively. Fig. 3A shows the crystalline planesof the particles. In the enlargements of two different zonespresented in Fig. 3B, the spacings between these planes weremeasured, obtaining 0.301 nm and 0.256 nm, correspond-ing to the interplanar distances of planes (111) and (100),respectively, of the ceria structure [21].
Fig. 4A presents the crystalline lattice of ultrathin particles.Fig. 4B shows the enlargement of two zones of interest fromFig. 4A, demonstrating crystalline lattice spacings, with valuesof 0.297 and 0.303 nm, near the interplanar distances of plane(111) of the fluorite structure of cerium oxide.
Selected area electron diffraction (SAED) patterns makeit possible to study crystalline lattice symmetry and cal-culate interplanar distances, allowing phase identification.The images in Figs. 3C and 4C present the SAED pattern ofCe0.8Gd0.2O1.9 powders obtained by the controlled precipita-tion and Pechini methods, respectively, showing the presenceof concentric rings characteristic of polycrystalline systems.
The electron diffraction patterns identified diffraction ringscorresponding to reflection planes (100), (200), (220) and (311).The images are compatible with the cubic arrangement char-acteristic of cerium oxide (PDF-34-0394).
Figs. 5 and 6 exhibit HRTEM microstructural analyses ofsamaria-codoped and Ce0.8Gd0.15Sm0.05O1.9 powders obtainedby the controlled precipitation and Pechini methods, respec-tively.
In the enlargements of the images of Fig. 5B, the latticespacings presented values of 0.297 and 0.259, corresponding tothe interplanar distances of planes (111) and (100) of the cubicstructure of ceria. Likewise, the interplanar distances in Fig. 6Bwere 0.298 and 0.254 in relation to the interplanar distancesof planes (111) and (100) of the cubic structure of ceria [21].Figs. 5C and 6C present the SAED patterns for samaria-dopedpowders synthesized by the two methods used here.
Characterization of sintered samples
Density
Table 2 shows the relative densities of the sintered samples,produced from powders synthesized by different methods.The densities of the samples sintered from powders syn-thesized by controlled precipitation are lower, with valuesbetween 83 and 87% of theoretical density. These low densitiesare associated with the morphological properties generatedin this synthesis process, such as the low specific surfacearea and large cluster size, resulting in low sinterability. Thedensities of the solid electrolytes obtained from the pow-ders synthesized by the Pechini method are higher (94–96%of theoretical density), within the adequate electrolyte manu-facturing range [19].
Scanning electron microscopy of the sintered samples
The differences in density results for samples sintered fromceramic powders produced by different synthesis meth-ods were confirmed by scanning electron microscopyimages. Fig. 7 shows test specimen micrographs ofCe0.8Gd0.19Sm0.01O1.9 sintered with powders obtained bycontrolled precipitation (A) and the Pechini method (B). Thecontrolled precipitation sample exhibits a heterogeneousmicrostructure and high porosity, while that obtained by thePechini method displayed a homogeneous microstructure

Please cite this article in press as: P.C. Cajas Daza, et al., Conductivity and microstructural evaluation of SGDC solid electrolytes synthetized byPechini and controlled precipitation, Bol. Soc. Esp. Cerám. Vidr. (2021), https://doi.org/10.1016/j.bsecv.2021.04.003
ARTICLE IN PRESSBSECV-281; No. of Pages 11
6 b o l e t í n d e l a s o c i e d a d e s p a ñ o l a d e c e r á m i c a y v i d r i o x x x (2 0 2 1) xxx–xxx
Fig. 3 – HRTEM images of Ce0.80Gd0.20O1.9 powder (without codoping) synthesized by controlled precipitation, showing the
planes of the crystalline lattice (A), interplanar distances (B) and diffraction rings (C).
Fig. 4 – HRTEM images of the Ce0.80Gd0.20O1.9 powders (without codoping) synthesized by Pechini with crystallographic
planes (A), interplanar distances (B) and diffraction rings (C).
Fig. 5 – HRTEM of the Ce0.80Gd0.15Sm0.05O1.9 powder (codoped) synthesized by controlled precipitation with the
crystallographic planes (A), interplanar distances (B) and diffraction rings (C).
Fig. 6 – HRTEM of Ce0.80Gd0.15Sm0.05O1.9 powder (codoped) synthesized by the Pechini method with the crystallographic
planes (A), interplanar distances (B) and diffraction rings (C).
Table 2 – Relative densities (%) of samples sintered from powders synthesized by the controlled precipitation and Pechinimethods.
Sintered composition Controlled precipitation Pechini
Ce0.8Gd0.2O1.9 81.45 ± 0.35 94.22 ± 0.12Ce0.8Gd0.19Sm0.01O1.9 86.52 ± 0.43 96.00 ± 0.49Ce0.8Gd0.17Sm0.03O1.9 86.56 ± 0.25 96.61 ± 0.23Ce0.8Gd0.15Sm0.05O1.9 86.13 ± 0.39 96.17 ± 0.32

Please cite this article in press as: P.C. Cajas Daza, et al., Conductivity and microstructural evaluation of SGDC solid electrolytes synthetized byPechini and controlled precipitation, Bol. Soc. Esp. Cerám. Vidr. (2021), https://doi.org/10.1016/j.bsecv.2021.04.003
ARTICLE IN PRESSBSECV-281; No. of Pages 11
b o l e t í n d e l a s o c i e d a d e s p a ñ o l a d e c e r á m i c a y v i d r i o x x x (2 0 2 1) xxx–xxx 7
Fig. 7 – Scanning electron microscopy of the Ce0.80Gd0.19Sm0.01O1.9 sample sintered from the powders obtained by
controlled precipitation (A) and the Pechini method (B).
Fig. 8 – X-ray diffractograms of electrolytes sintered from
powders synthesized by the controlled precipitation (A) and
Pechini (B) methods.
with low porosity. The other compositions produced hereshowed similar behavior.
X-ray diffractometry
The diffractograms of Fig. 8, corresponding to all thecompositions analyzed in the present study, that is, the
Fig. 9 – Variation in lattice parameters with the synthesis
method and electrolyte composition.
Ce0.8Gd0.2−xSmxO1.9 systems (x = 0.00; 0.01; 0.03 and 0.05)sintered with powders synthesized by the controlled precipi-tation (A) and Pechini (B) methods, contain the cubic fluoritephase, exhibiting the main cerium oxide diffraction peaks(PDF 34-0394) [22]. The presence of a single phase in the diffrac-tograms suggests that the doping oxides entered the solidsolution in the structure of CeO2. The diffractograms displaythe cubic fluorite phase in all the samples, although smalldisplacements are observed in the diffraction peaks with avariation in composition, with no structural deformations.Changes in the angles corresponding to the diffractogrampeaks are caused by replacing cerium atoms with Sm3+ andGd3+ atoms, thereby varying the lattice parameters for eachcomposition.
The lattice parameter of the CeO2 is 0.5411 nm [23]. In orderto assess changes in CeO2 structure with the addition of thedopants used here, diffractogram data presented in Fig. 8 wereused. These data were used to calculate the lattice parametersof the sintered samples, where a peak value of 2� was used tocalculate the interplanar distance based on Bragg’s law [24].Fig. 9 presents the variation in the lattice parameter with anincrease in codoping content for the different powder synthe-sis methods. For Ce0.8Gd0.2O1.9, the lattice parameter foundis 0.5413 nm for the system obtained by the Pechini methodand 0.5422 for that obtained by controlled precipitation dopedwith higher lattice parameters, showing that this synthesis

Please cite this article in press as: P.C. Cajas Daza, et al., Conductivity and microstructural evaluation of SGDC solid electrolytes synthetized byPechini and controlled precipitation, Bol. Soc. Esp. Cerám. Vidr. (2021), https://doi.org/10.1016/j.bsecv.2021.04.003
ARTICLE IN PRESSBSECV-281; No. of Pages 11
8 b o l e t í n d e l a s o c i e d a d e s p a ñ o l a d e c e r á m i c a y v i d r i o x x x (2 0 2 1) xxx–xxx
Fig. 10 – HRTEM images of systems obtained by the Pechini
method of Ce0.8Gd0.2O1.9 (without codoping) with
light-colored regions characteristic of defect concentration
in the crystalline lattice (A) and Ce0.8Gd0.15Sm0.05O1.9 (with
codoping) with smaller concentrations of these defects (B).
process promotes greater distortion in the crystalline lattice,which has a harmful effect on the ionic conduction of thesesystems.
The powders synthesized by the Pechini method exhibitlattice parameters closer to those of cerium oxide, therebycausing fewer crystalline distortions.
High-resolution transmission electron microscopy of the
sintered samples
HRTEM of the grain interiors. Given the low total conductiv-ity of samples sintered with powders produced by controlledprecipitation synthesis, only HRTEM assessment of the graininteriors of samples with high total conductivity was con-ducted; that is, only those sintered from powders producedby the Pechini synthesis method. In this analysis, we soughtto identify the causes of increased grain conductivity asa function of the rise in codoping with samaria. Fig. 10presents HRTEM grain images of systems obtained by thePechini method, the composition doped only with gadolin-ium (Ce0.8Gd0.2O1.9) and that doped with gadolinium andcodoped with samaria (Ce0.8Gd0.15Sm0.05O1.9). These imagesshow regions containing brightly colored atoms, indicatingsmall distortions in the crystalline lattice that may be asso-ciated with small defects caused by the addition of dopants.The image in Fig. 10A, corresponding to the system withoutsamaria codoping (Ce0.8Gd0.2O1.9), exhibits different regions ofthe matrix, where the atoms show no definite order, therebyconfirming the presence of large ordered defect clusters (nan-odomains). In the images of Fig. 10B, corresponding to thesamaria-codoped system, the atoms displayed better struc-tural uniformity, which is repeated in long atomic distances.
The HRTEM images show the effectiveness of samariacodoping in obtaining systems with higher structural homo-geneity. These studies, conducted with high-resolutiontransmission electron microscopy, identified the presence ofnanodomains in both electrolytes (with and without samariacodoping), exhibiting a marked predominance of these defectsin the system without samaria. These nanodomains areresponsible for the high grain resistivity in these noncodopedsamples, since the charge carriers are blocked in these regions.The oxygen vacancies in the non-codoped samples are tightly
bound to the doping cations, remaining immobilized [25], hin-dering effective O−2 ion conduction through the structure anddirectly affecting the ionic conductivity of these systems notcodoped with samaria.
Ionic conductivity
Fig. 11 shows impedance spectra, known as Nyquist diagrams,for samples tested at 310 ◦C. Points A, B and C in this figureshow regions of low, medium and high frequencies, respec-tively. For all samples, two semicircles are clearly observed,related to ionic contribution of grain interior (high frequen-cies) and grain boundary (intermediate frequencies) [26]. Athird incomplete semicircle at low frequencies could be, pre-sumably, correlated to charge carriers (O−2) blocking at theinterface sample/electrode. This behavior is indicative thatsamples evaluated in this work reveal ionic conductivity.
The impedance values obtained in the impedance spectrafor each testing temperature were multiplied by the geomet-ric factor of each sample (A/l, where l is the thickness and A
the sample area) to obtain the Nyquist plots given in Fig. 11.Therefore, the intercept between each circle (high and lowfrequencies) and the real axis (Z′) of diagram of impedancerepresent, respectively, bulk and grain boundary contributionto the resistivity of the sample. Samples of the same com-position (Ce0.80Gd0.15Sm0.05O1.9) and originated from differentsynthesis methods showed different grain interior resistivity,reaching 250 k� cm for Pechini and 480 k� cm for controlledprecipitation. These results are indicative that Pechini methodfavors sintering samples with higher densities and, therefore,with lower bulk resistivity. In this case, the charge carriers insamples with high densities travel shorter effective lengthsthan in porous samples. In this later case (porous samples),charger carrier needs to travel longer path, and overcomeporosities to produce an effective ionic conductivity.
Fig. 12 shows logarithms of grain interior and grain bound-ary conductivity plotted against the inverse of temperature(Arrhenius graphic) [27]. to observe the temperature depen-dence of conductivity. Previous work [28] revealed that thespecific conductivity of grain boundary is related to the effec-tive grain boundaries area taking part in the conductionprocess.
To obtain the specific conductivity of grain boundary (�Esp
CG)
it was used the inverse of the contribution of grain bound-ary resistivity
(
1PCG
)
times the average thickness of grain
boundary (D) divided by the grain size (TG)(
�Esp
CG=
1PCG
∗D
TG
)
,as related in previous work [2], for each test temperature.According to literature [26] and considering the “brickwork”model. The ratio between grain capacitance (Cg) and grainboundary (Cgb) is correlated to dimensionless microstruc-tural parameter between grain boundary thickness (D) andgrain size (TG). Therefore it can be approximated the rela-tion Cg/Cgb = D/TG. The obtained capacitances values, usingthe software Zview for all samples reached the approximatedvalues of 3 × 10⁻¹¹ F and 3 × 10⁻⁸ F for electric contributionof grain and grains boundary respectively, reaching values ofratio Cg/Cgb of approximately 0.001 in this work.
As depicted in Fig. 12(A and C), the controlled increase ofco-dopant (Samarium oxide) causes the grain interior conduc-tivity increase for samples obtained from Pechini powders.

Please cite this article in press as: P.C. Cajas Daza, et al., Conductivity and microstructural evaluation of SGDC solid electrolytes synthetized byPechini and controlled precipitation, Bol. Soc. Esp. Cerám. Vidr. (2021), https://doi.org/10.1016/j.bsecv.2021.04.003
ARTICLE IN PRESSBSECV-281; No. of Pages 11
b o l e t í n d e l a s o c i e d a d e s p a ñ o l a d e c e r á m i c a y v i d r i o x x x (2 0 2 1) xxx–xxx 9
Fig. 11 – Nyquist plots of electrolytes with powders synthesized by (A) Pechini method and (B) controlled precipitation at
583 K.
Fig. 12 – Arrhenius plots of grain conductivity and of specific grain boundary conductivity for sintered samples obtained
with powder synthetized by the Pechini method (A and B) and controlled precipitation (C and D).
However, this behavior is not clearly observed for samplesobtained with controlled precipitation. In systems doped withcerium oxides, such as those in the present work, the possiblecreation of nanodomains in grain interiors could reduce theionic conductivity of this material [29]. In the present workit was experimentally observed that the ionic conductivity
increases with samarium oxide addition. Therefore, it issuggested that additions of small amount of a second dopant,without compound stoichiometry alteration, favors localcation ordering and oxygen holes in grain interior, favoringmobility of charge carriers and, as result, increasing ionicconductivity.
Please cite this article in press as: P.C. Cajas Daza, et al., Conductivity and microstructural evaluation of SGDC solid electrolytes synthetized byPechini and controlled precipitation, Bol. Soc. Esp. Cerám. Vidr. (2021), https://doi.org/10.1016/j.bsecv.2021.04.003
ARTICLE IN PRESSBSECV-281; No. of Pages 11
10 b o l e t í n d e l a s o c i e d a d e s p a ñ o l a d e c e r á m i c a y v i d r i o x x x (2 0 2 1) xxx–xxx
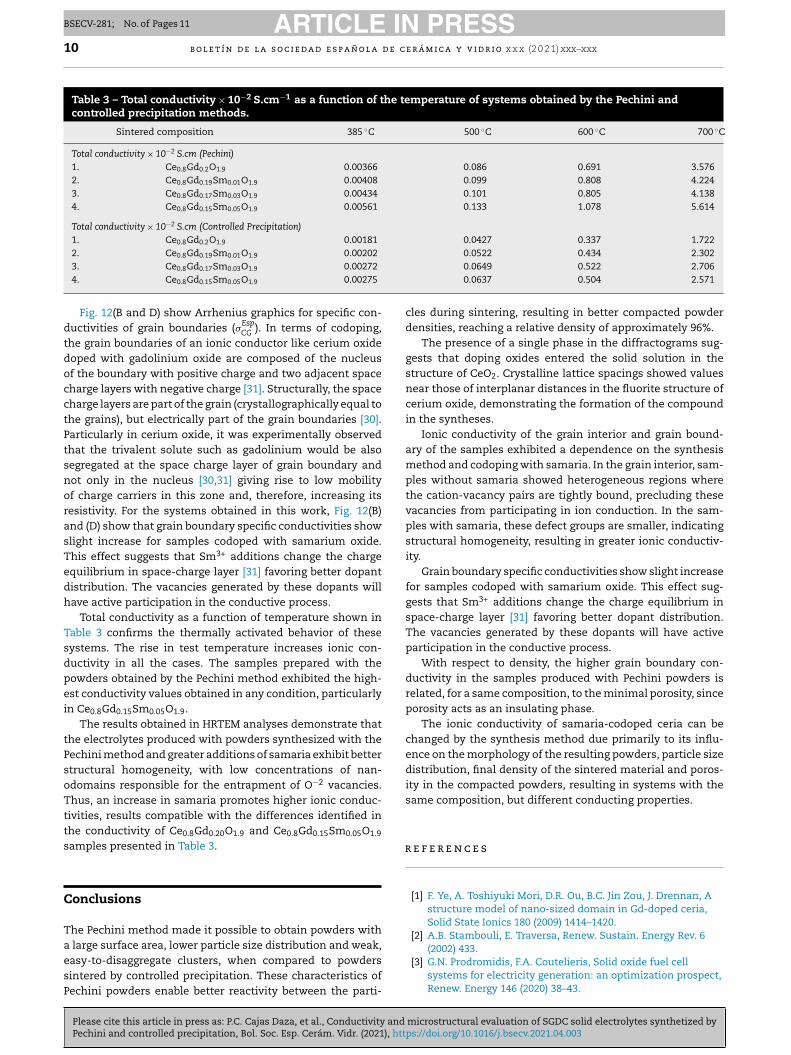
Table 3 – Total conductivity × 10−2 S.cm−1 as a function of the temperature of systems obtained by the Pechini andcontrolled precipitation methods.
Sintered composition 385 ◦C 500 ◦C 600 ◦C 700 ◦C
Total conductivity × 10−2 S.cm (Pechini)
1. Ce0.8Gd0.2O1.9 0.00366 0.086 0.691 3.5762. Ce0.8Gd0.19Sm0.01O1.9 0.00408 0.099 0.808 4.2243. Ce0.8Gd0.17Sm0.03O1.9 0.00434 0.101 0.805 4.1384. Ce0.8Gd0.15Sm0.05O1.9 0.00561 0.133 1.078 5.614
Total conductivity × 10−2 S.cm (Controlled Precipitation)
1. Ce0.8Gd0.2O1.9 0.00181 0.0427 0.337 1.7222. Ce0.8Gd0.19Sm0.01O1.9 0.00202 0.0522 0.434 2.3023. Ce0.8Gd0.17Sm0.03O1.9 0.00272 0.0649 0.522 2.7064. Ce0.8Gd0.15Sm0.05O1.9 0.00275 0.0637 0.504 2.571
Fig. 12(B and D) show Arrhenius graphics for specific con-ductivities of grain boundaries (�Esp
CG). In terms of codoping,
the grain boundaries of an ionic conductor like cerium oxidedoped with gadolinium oxide are composed of the nucleusof the boundary with positive charge and two adjacent spacecharge layers with negative charge [31]. Structurally, the spacecharge layers are part of the grain (crystallographically equal tothe grains), but electrically part of the grain boundaries [30].Particularly in cerium oxide, it was experimentally observedthat the trivalent solute such as gadolinium would be alsosegregated at the space charge layer of grain boundary andnot only in the nucleus [30,31] giving rise to low mobilityof charge carriers in this zone and, therefore, increasing itsresistivity. For the systems obtained in this work, Fig. 12(B)and (D) show that grain boundary specific conductivities showslight increase for samples codoped with samarium oxide.This effect suggests that Sm3+ additions change the chargeequilibrium in space-charge layer [31] favoring better dopantdistribution. The vacancies generated by these dopants willhave active participation in the conductive process.
Total conductivity as a function of temperature shown inTable 3 confirms the thermally activated behavior of thesesystems. The rise in test temperature increases ionic con-ductivity in all the cases. The samples prepared with thepowders obtained by the Pechini method exhibited the high-est conductivity values obtained in any condition, particularlyin Ce0.8Gd0.15Sm0.05O1.9.
The results obtained in HRTEM analyses demonstrate thatthe electrolytes produced with powders synthesized with thePechini method and greater additions of samaria exhibit betterstructural homogeneity, with low concentrations of nan-odomains responsible for the entrapment of O−2 vacancies.Thus, an increase in samaria promotes higher ionic conduc-tivities, results compatible with the differences identified inthe conductivity of Ce0.8Gd0.20O1.9 and Ce0.8Gd0.15Sm0.05O1.9
samples presented in Table 3.
Conclusions
The Pechini method made it possible to obtain powders witha large surface area, lower particle size distribution and weak,easy-to-disaggregate clusters, when compared to powderssintered by controlled precipitation. These characteristics ofPechini powders enable better reactivity between the parti-
cles during sintering, resulting in better compacted powderdensities, reaching a relative density of approximately 96%.
The presence of a single phase in the diffractograms sug-gests that doping oxides entered the solid solution in thestructure of CeO2. Crystalline lattice spacings showed valuesnear those of interplanar distances in the fluorite structure ofcerium oxide, demonstrating the formation of the compoundin the syntheses.
Ionic conductivity of the grain interior and grain bound-ary of the samples exhibited a dependence on the synthesismethod and codoping with samaria. In the grain interior, sam-ples without samaria showed heterogeneous regions wherethe cation-vacancy pairs are tightly bound, precluding thesevacancies from participating in ion conduction. In the sam-ples with samaria, these defect groups are smaller, indicatingstructural homogeneity, resulting in greater ionic conductiv-ity.
Grain boundary specific conductivities show slight increasefor samples codoped with samarium oxide. This effect sug-gests that Sm3+ additions change the charge equilibrium inspace-charge layer [31] favoring better dopant distribution.The vacancies generated by these dopants will have activeparticipation in the conductive process.
With respect to density, the higher grain boundary con-ductivity in the samples produced with Pechini powders isrelated, for a same composition, to the minimal porosity, sinceporosity acts as an insulating phase.
The ionic conductivity of samaria-codoped ceria can bechanged by the synthesis method due primarily to its influ-ence on the morphology of the resulting powders, particle sizedistribution, final density of the sintered material and poros-ity in the compacted powders, resulting in systems with thesame composition, but different conducting properties.
r e f e r e n c e s
[1] F. Ye, A. Toshiyuki Mori, D.R. Ou, B.C. Jin Zou, J. Drennan, Astructure model of nano-sized domain in Gd-doped ceria,Solid State Ionics 180 (2009) 1414–1420.
[2] A.B. Stambouli, E. Traversa, Renew. Sustain. Energy Rev. 6(2002) 433.
[3] G.N. Prodromidis, F.A. Coutelieris, Solid oxide fuel cellsystems for electricity generation: an optimization prospect,Renew. Energy 146 (2020) 38–43.

Please cite this article in press as: P.C. Cajas Daza, et al., Conductivity and microstructural evaluation of SGDC solid electrolytes synthetized byPechini and controlled precipitation, Bol. Soc. Esp. Cerám. Vidr. (2021), https://doi.org/10.1016/j.bsecv.2021.04.003
ARTICLE IN PRESSBSECV-281; No. of Pages 11
b o l e t í n d e l a s o c i e d a d e s p a ñ o l a d e c e r á m i c a y v i d r i o x x x (2 0 2 1) xxx–xxx 11
[4] K. Eguchi, Ceramic materials containing rare earth oxides forsolid oxide fuel cell, J. Alloys Compd. 250 (1–2.) (1997)486–491.
[5] A. Moure, J. Tartaj, C. Moure, Synthesis, sintering andelectrical properties of yttria-calcia-doped ceria, J. Eur.Ceram. Soc. 29 (12) (2009) 2559–2565.
[6] S. Singhal, K. Kendall, High temperature solid oxide fuelcells: fundamentals, Des. Appl. (2002).
[7] F. Ye, D.R. Ou, T. Mori, Microstructural evolution in aCeO2-Gd2O3 system, Microsc. Microanal. 18 (1) (2012)162–170.
[8] P.C.C. Daza, R.A.M. Meneses, A.C.M. Rodrigues, C.R.M. daSilva, Ionic conductivities and high resolution microscopicevaluation of grain and grain boundaries of cerium-basedcodoped solid electrolytes, Ceram. Int. 44 (12) (2018)13699–13705.
[9] N. Cioatera, V. Pârvulescu, A. Rolle, R.N. Vannier, Enhancedionic conductivity of Sm, Gd-doped ceria induced bymodification of powder synthesis procedure, Ceram. Int. 38(7) (2012) 5461–5468.
[10] E.C. Grzebielucka, A.S.A. Chinelatto, S.M. Tebcherani, A.L.Chinelatto, Synthesis and sintering of Y2O3-doped ZrO2powders using two Pechini-type gel routes, Ceram. Int. 36(July (5)) (2010) 1737–1742.
[11] C.V.R. Madronero, J.E.R. Paéz, Sodium aluminates obtainedfrom the Al(NO3)3 • 9H2O – NaOH system using thecontrolled precipitation method, Ing. Investig. 30 (2) (2010)16–24.
[12] H. Inaba, H. Tagawa, Ceria-based solid electrolytes, SolidState Ionics 83 (1–2) (1996) 1–16.
[13] J. Prado-Gonjal, R. Schmidt, J. Espíndola-Canuto, P.Ramos-Alvarez, E. Morán, Increased ionic conductivity inmicrowave hydrothermally synthesized rare-earth dopedceria Ce1−xRExO2−(x/2), J. Power Sources 209 (July) (2012)163–171.
[14] S. Omar, E.D. Wachsman, J.C. Nino, Higher conductivitySm3+ and Nd3+ co-doped ceria-based electrolyte materials,Solid State Ionics 178 (2008) 1890–1897.
[15] C. Artini, L. Gigli, M.M. Carnasciali, M. Pani, Effect of the (NdDy)-double doping on the structural properties of ceria,Inorganics 7 (2019) 94.
[16] C. Artini, et al., Transport properties and high temperatureRaman features of heavily Gd-doped ceria, Energies 12 (2019)4148.
[17] V.A. Coles-Aldridge, R.T. Baker, Ionic conductivity in multiplysubstituted ceria-based electrolytes, Solid State Ionics 316(2018) 9–19.
[18] M. Rezaei, S.M. Alavi, S. Sahebdelfar, Z.-F. Yan, Tetragonalnanocrystalline zirconia powder with high surface area and
mesoporous structure, Powder Technol. 168 (October (2))(2006) 59–63.
[19] A. Arabac, M.F. Öksüzömer, Preparation and characterizationof 10mol% Gd doped CeO 2 (GDC) electrolyte for SOFCapplications, Ceram. Int. 38 (8) (2012) 6509–6515.
[20] J.L. Narváez-semanate, J.J. Cabrera, R.A. Vargas-zapata, J.E.Rodríguez-páez, Obtención de nanopartículas de zro2dopado con y2o3 utilizando rutas químicas, Rev. Latinoam.Metarlugia Mater. 27 (2) (2007) 124–134.
[21] P.S. Murphin Kumar, et al., Pt nanoparticles supported onmesoporous CeO2 nanostructures obtained through greenapproach for efficient catalytic performance toward ethanolelectro-oxidation, ACS Sustain. Chem. Eng. 5 (12) (2017)11290–11299.
[22] E.N.S. Muccillo, et al., Propriedades físicas do óxido de cériopreparado por técnica de solucão e a condutividade elétricaem funcão da pressão parcial de oxigênio em cerâmicassinterizadas, Cerâmica 51 (2005) 157–162.
[23] Z. Tianshu, P. Hing, H. Huang, J. Kilner, Ionic conductivity inthe CeO2-Gd2O3 system (0.05≤Gd/Ce≤0.4) prepared byoxalate coprecipitation, Solid State Ionics 148 (3–4) (2002) 567.
[24] D. Sarkar, D. Mohapatra, S. Ray, S. Bhattacharyya, S. Adak, N.Mitra, Synthesis and characterization of sol–gel derived ZrO2doped Al2O3 nanopowder, Ceram. Int. 33 (September (7))(2007) 1275–1282.
[25] D.R. Ou, F. Ye, T. Mori, Defect clustering and local ordering inrare earth codoped ceria, Phys. Chem. Chem. Phys. 13 (20)(2011) 9554–9560.
[26] J.T.S. Irvine, D.C. Sinclair, A.R. West, Electroceramics:characterization by impedance spectroscopy, Adv. Mater. 2(March (3)) (1990) 132–138.
[27] C. Zhang, C.-J. Li, G. Zhang, X.-J. Ning, C.-X. Li, H. Liao e, C.Coddet, Ionic conductivity and its temperature dependenceof atmospheric plasma-sprayed yttria stabilized zirconiaelectrolyte, Mater. Sci. Eng. B (2007) 24–30.
[28] D.P.F. De Souza, M.F. De Souza, Liquid phase sintering ofRE2O3: YSZ ceramic Part II grain boundary electricalproperties, J. Mater. Sci. 34 (June) (1999) 6107–6114.
[29] R.M. Kasse, J.C. Nino, Ionic conductivity ofSmxNdyCe0.9O2−� codoped ceria electrolytes, J. AlloysCompd. 575 (2013) 399–402.
[30] X. Guo, R. Waser, Electrical properties of the grainboundaries of oxygen ion conductors: acceptor-dopedzirconia and ceria, Prog. Mater. Sci. 51 (2) (2006) 151–210.
[31] C. Kjølsetha, H. Fjeld, Ø. Prytz, P.I. Dahl, C. Estournès, R.Haugsrud, T. Norb, Space–charge theory applied to the grainboundary impedance of proton conducting BaZr0.9Y0.1O3,Solid State Ionics 181 (n 5–7) (2010) 268–275, 0167-2738.