On the effect of nitrogen on the dislocation structure of austenitic stainless steel
Upload
khangminh22Category
view
2download
0
doi: 10.1111/j.1460-2695.2009.01388.x
Predicting creep crack initiation in austenitic and ferritic steels usingthe creep toughness parameter and time-dependent failureassessment diagram
C. M. DAVIESDepartment of Mechanical Engineering, Imperial College London, South Kensington Campus, London SW7 2AZ, UK
Received in final form 11 August 2009
A B S T R A C T Methods for evaluating the creep toughness parameter, K matc , are reviewed and K mat
c dataare determined for a ferritic P22 steel from creep crack growth tests on compact ten-sion, C(T), specimens of homogenous parent material (PM) and heterogeneous specimenweldments at 565 ◦C and compared to similar tests on austenitic type 316H stainlesssteel at 550 ◦C. Appropriate relations describing the time dependency of K mat
c are deter-mined accounting for data scatter. Considerable differences are observed in the form ofthe K mat
c data and the time-dependent failure assessment diagrams (TDFADs) for boththe 316H and P22 steel. The TDFAD for P22 shows a strong time dependency, but isinsensitive to time for 316H. Creep crack initiation (CCI) time predictions are obtainedusing the TDFAD approach and compared to experimental results from C(T) specimensand feature components. The TDFAD based on parent material properties can be usedto obtain conservative predictions of CCI on weldments. Conservative predictions arealmost always obtained when lower bound K mat
c values are employed. Long-term test aregenerally more relevant to industrial component lifetimes. The different trends betweenlong- and short-term CCI time and growth data indicate that additional long-term testare required to further validate the procedure to predict the lifetimes of high temperaturecomponents.
Keywords creep crack initiation (CCI); creep toughness; P22 steel; TDFAD; weld-ments; 316H steel.
N O M E N C L A T U R E a, �a = crack length, crack extensiona = crack growth rateA = creep strain rate coefficient
Ap = primary creep strain coefficientBn = specimen net section thickness between side-groovesBr = coefficient in the stress rupture time lawC∗ = steady state creep characterising fracture mechanics parameter
CCG = creep crack growthCCI = creep crack initiation
D = constant coefficient in creep crack growth rate correlation with C∗
Di = constant coefficient in creep crack initiation time correlation with C∗
E = elastic (Young’s) modulusE′ = effective elastic modulusH = correlating coefficient in the K c
mat versus time relationHAZ = heat affected zone
Correspondence: Catrin M. Davies. E-mail: [email protected]
820 c© 2009 Blackwell Publishing Ltd. Fatigue Fract Engng Mater Struct 32, 820–836
Fatigue & Fracture of Engineering Materials & Structures

TDFAD’s CCI PREDICT IONS IN AUSTENIT IC AND FERRIT IC STEELS 821
J = elastic–plastic fracture mechanics parameterj = the power-law exponent in the K c
mat versus time relationJIC = material mode I plane strain elastic–plastic fracture toughnessK = linear-elastic stress intensity factor
KIC = material mode I plane strain fracture toughnessKr = TDFAD parameter measuring proximity to fracture
K cmat = creep toughness parameterLB = lower boundLr = TDFAD parameter measuring proximity to plastic collapse or creep rupture
Lmaxr = maximum value of Lr at the cut-off point in TDFAD
n = creep stress exponentnp = primary creep stress exponentP = loadp = primary creep parameter
PLC = plastic collapse load of cracked bodyPM = parent material
ROA = reduction of areat, �t = time, time increment
ti = creep crack initiation timetExpi = experimentally measured creep crack initiation time
tPredictedi = predicted value of the creep crack initiation time
UB = upper boundUp = area under the load displacement curve associated with plasticity
v = Poisson ratiovr = rupture stress exponent
W = specimen widthWM = weldment
�c = load line displacement associated with creepεc = strain component associated with creep deformationεe = strain component associated with elastic deformationεpl = strain component associated with plastic deformation
εtotal = total strainεf = plastic ductilityεc
f = creep failure strain (creep ductility)εref = total strain at reference stressεe
ref = strain at reference stress associated with elastic deformationε
pref = strain at reference stress associated with plastic deformation
εcref = strain at reference stress associated with creep deformation
�εcp , �εc
s = primary and secondary creep strain incrementsφi = exponent in correlation of initiation time with C∗
φ = exponent in correlation of creep crack growth rate with C∗
η = factor relating J/C∗ to the plastic/creep area under a load displacement curveσ 0.2 = 0.2% proof strength
σ UTS = ultimate tensile stressσ 0.2 = 0.2% proof stress of the materialσ c
0.2 = 0.2% creep strength (stress at 0.2% inelastic strain)σ flow = flow stress (σUTS + σ0.2)/2
I N T R O D U C T I O N
The lifetime of components operating in high temper-ature plant is limited by the mechanisms of creep crackinitiation (CCI) and growth (CCG). The CCI time is
the period of time prior to the onset of crack extensionfrom an existing defect due to CCG and can occupy a largefraction (>80%) of a components service lifetime.1 TheCCI time is generally defined as the time for a defined
c© 2009 Blackwell Publishing Ltd. Fatigue Fract Engng Mater Struct 32, 820–836
822 C. M. DAVIES
small measureable crack extension, typically 0.2 mm forlaboratory specimens or 0.5 mm.2 Reliable predictions ofCCI time are fundamental in high temperature compo-nent lifetime assessments due to the duration of the CCIperiod.
The time dependent failure assessment diagram (TD-FAD) approach has become increasingly recognised forthe prediction of CCI times.3 The development of theTDFAD has mainly been based on austenitic type 316Hstainless steel which differs from ferritic steels in theirtensile and creep material behaviour and further veri-fication is required before the procedure may be rec-ommended for ferritic steels.4,5 Two widely used alloysfor high-temperature plant components with contrast-ing properties are ferritic P22 (2 1/4 Cr1Mo) steel andaustenitic type 316H stainless steel. The favourable qual-ities of these steels include high creep ductility and rela-tively high weldability.6,7 These two steels are consideredhere in the evaluation of the TDFAD method.
The TDFAD approach for CCI time predictions relieson the availability of reliable creep toughness (K c
mat) data.The main advantage of the TDFAD approach is that de-tailed calculations of crack tip parameters such as C∗ arenot required and that the TDFAD can indicate whetherfailure is controlled by crack growth, creep rupture orplastic collapse, i.e. the fracture regime need not be speci-fied in advance. Methods for evaluation or estimating theK c
mat parameter have been developed and modified overrecent years.
A considerable amount of creep toughness data havebeen determined for austenitic type 316H stainlesssteel in the region of 500–700 ◦C, though mainly at550 ◦C.8,9 Limited K c
mat data have also been determinedfor a range of ferritic steels,4,5,8,10–12, and in some casesTDFADs have also been produced. Creep toughness dataoften show appreciable scatter8,9 which must be consid-ered when obtaining CCI time predictions. In the major-ity of cases, where TDFADs have been determined to-gether with creep toughness data, explicit CCI times havenot been obtained. Generally, the CCI data for a givencrack extension have been plotted on a TDFAD for arange of times and an assessment made to determine if theTDFAD approach leads to conservative predictions, orsometimes the limits between which the CCI times’ pre-diction lie are indicated. The degree of conservatism/non-conservatism however, is not indicated.
Considerably high loads are often applied to specimensin CCG tests, leading to relatively short test durationscompared to the lifetimes of high temperature compo-nents operating in plants. Therefore, the application ofmethods based on CCG test data to predict real com-ponent lifetimes require validation.4 Components are of-ten welded and the application of the TDFAD approachfor weldments has been considered.12–16 However, a
number of complications arise when considering weld-ments such as material mismatch effects that may requireconsideration.
In previous work,9 the TDFAD approach has been ap-plied to predict CCI times in austenitic type 316H stain-less steel at 550 ◦C, and the sensitivity of predictions tocreep toughness data bounds and reference stress solu-tions have been examined. In this work methods for K c
matevaluation and estimation are reviewed and K c
mat data aredetermined for a ferritic P22 steel from CCG tests oncompact tension, C(T), specimens of homogenous parentmaterial (PM) and heterogeneous specimen weldmentsat 565 ◦C. The weldments consist of PM, weld metaland a heat affected zone (HAZ). The crack tip is locatedon the HAZ/PM boundary where cracking is often ob-served in practice. Appropriate relations describing thetime dependency of K c
mat are determined accounting fordata scatter. The TDFAD diagram and its associated pa-rameters are then compared for the austenitic type 316Hand ferritic P22 steel. The influence of test duration, andmaterial condition are also considered and CCI time pre-dictions obtained and compared to experimental resultsfrom short and long-term laboratory tests specimens andfeature components.
T H E F A I L U R E A S S E S S M E N T D I A G R A M ( F A D )A P P R O A C H
The FAD procedure considers that failure will occur byplastic collapse or brittle/ductile fracture. The proximityto failure by fracture and plastic collapse are measured bythe parameters Kr and Lr, respectively, defined by
Kr = KKIC
=(
K 2
E ′ JIC
) 12
, (1)
Lr = σref
σ0.2= P
PLC, (2)
where KIC and JIC are fracture toughness values (criticalvalues of K and J for fracture under mode I, tensile load-ing), E′ the effective elastic modulus (equal to E for planestress or E/(1 – v2) for plane strain conditions where v isthe Poisson ratio). In Eq. (2) σ ref is the reference stress1
of a geometry, σ 0.2 is the 0.2% proof stress (measure ofthe materials yield stress), P the applied load and PLC thecollapse load of the cracked geometry.1
The R6 Option 1 curve17,18 is material independent anddefined by
Kr = (1 − 0.14L2
r) [
0.3 + 0.7 exp(−0.65L6
r)]
for Lr ≤ Lmaxr ,
(3)
Kr = 0 for Lr > Lmaxr . (4)
c© 2009 Blackwell Publishing Ltd. Fatigue Fract Engng Mater Struct 32, 820–836
TDFAD’s CCI PREDICT IONS IN AUSTENIT IC AND FERRIT IC STEELS 823
The cut-off, Lmaxr , which indicates failure by plastic col-
lapse is defined by the ratio
Lmaxr = σflow
σ0.2, (5)
where σ flow is the mean of the ultimate tensile stress, σ UTS,obtained from the engineering stress–strain curve and the0.2% proof stress, i.e. σflow = (σUTS + σ0.2)/2.
The R6 Option 2 FAD has a material specific failureassessment curve which has been derived based on theassumption that crack growth occurs when the J-integralattains a critical value.
The time-dependent failure assessment diagram(TDFAD)
The R6 Option 2 FAD has been extended to a TDFADwhich addresses limited high temperature crack growth.3
This is done by replacing KIC , in Eq. (1) by a creep tough-ness corresponding to a given crack extension at a giventime, denoted K c
mat(�a, t), and σ 0.2 in Eq. (2) by the 0.2%inelastic (creep and plastic) strain from an isochronousstress–strain curve at a particular time and temperature,σ c
0.2, also called the 0.2% creep strength. The value ofσ c
0.2 will decrease as time increases, i.e. creep strain in-creases. In the TDFAD, for the case of a single pri-mary load, the parameters Kr and Lr are therefore definedas
Kr = KK c
mat, (6)
Lr = σref
σ c0.2
, (7)
The cut off point Lmaxr is defined on the TDFAD as
Lmaxr = σr
σ c0.2
, (8)
where σ r is the stress to cause creep rupture at the sametime as σ c
0.2 is evaluated. If Lr exceeds Lmaxr , failure is
expected to occur by creep rupture rather than by fracture.In order to be consistent with the R6 procedure, Lmax
r inthe TDFAD should not exceed the value of Lmax
r definedin Eq. (5). The time to rupture in a uniaxial creep testover a range of stresses can often be approximated by thepower-law relation,
tr = Brσ−vr , (9)
where Br and vr are the rupture coefficient and exponent,respectively.
The time-dependent failure assessment curve is basedon the assumption that crack growth occurs when thedependent time parameter, J(t), attains a critical value. A
failure assessment diagram for a specific time is definedby the equations
Kr =[
Eεref
Lrσc0.2
+ L3r σ
c0.2
2Eεref
]−1/2
for Lr ≤ Lmaxr , (10)
Kr = 0 for Lr > Lmaxr . (11)
In Eq. (10) εref is the total strain at reference stress ata given time, given by the sum of the elastic and plasticstrain and the total creep strain accumulated in that time,i.e.
εref (t) = εeref + ε
pref + εc
ref (t) . (12)
Note that εref is the true strain at true stress σ ref
( = Lrσ 0.2) (and not the engineering strain). Note alsothat at short times εref (t) ≈ εe
ref + εpref and σ c
0.2 ≈ σ0.2, andEq. (10) reduces to the R6 Option 2 curve. At long timesεref (t) ≈ εc
ref and Eq. (10) tends to
Kr =[
Eεcref
σref
]−1/2
. (13)
Equation (13) can be derived for steady state creep con-ditions, where the creep strain rate is a constant, based onthe assumption that at long times J(t), evaluated, can beapproximated by the product of C∗ and time (i.e. J(t) ≈C∗t19) and C∗ is given by the reference stress estimate.1
The TDFAD can therefore measure the proximity to fail-ure by fast fracture, CCG, plastic collapse and creep rup-ture. Therefore, in the TDFAD approach, a failure modedoes not have to be pre-defined.
Application of TDFAD to predict CCI
The TDFAD can be used to predict if a crack will extenda distance �a in a given time or the time required for aspecified amount of crack extension. Because CCI can bedefined as the period of time required for a small incre-ment of crack growth, �a, the TDFAD may be used topredict CCI times. For some materials the curves may notvary greatly with time and curves for longer times can beused to provide a conservative TDFAD for an assessmentat shorter times.8
To predict CCI an initial time estimate is made and thevalues of Lr and Kr , and their associated parameters, aredetermined for the specified initiation distance, �a, atthat time. The point (Lr , Kr) is then plotted on the TD-FAD. If the point lies within the TDFAD then the crackextension is less than �a and creep rupture is avoided inthe assessment time. To determine an initiation time, ti,a time locus of points (Lr, Kr) is constructed at varioustimes. The time for a crack extension �a is given by theintersection of a point on this locus (for a given time) withthe failure assessment curve for the corresponding time.
c© 2009 Blackwell Publishing Ltd. Fatigue Fract Engng Mater Struct 32, 820–836

824 C. M. DAVIES
Table 1 Material properties for homogeneous PM 316H stainlesssteel at 550 ◦C and P22 steel at 565 ◦C
316H P22 (PM)
A (MPa1/n h−1) 1.47 × 10⁻³⁴ 3.21 × 10⁻²⁷
n 11.58 10.68np 7.45 2.47Ap (MPa−n p t−p ) 2.60 × 10⁻²³ 1.0 × 10⁻⁸
p 0.746 0.3E (MPa) 140 000 140 135σ 0.2 (MPa) 170 284σUTS (MPa) 442 365Br (MPavr h) 5.27 × 1031 1.43 × 10²²
vr 11.3 9.11σ flow (MPa) 306 327εf (%) (Eng) 37 27εc
f (%) (Axial) 8 31εc
f (%) (ROA) 21 65
An iterative process is required to match the times asso-ciated with the point of intersection of the locus and theTDFAD constructed. The procedure is further detailedin Refs [8,9].
Isochronous stress–strain data
Isochronous stress–strain curves for the specified tem-perature are required in order to determine σ c
0.2 and theoverall TDFAD. Isochronous stress–strain data are gen-erated here using the elastic–plastic and creep materialresponse. The method used follows the procedure in theRCC-MR design code20 for primary–secondary creep oftype 316 stainless steel material. Thus, the primary andsecondary creep strain increments, �εc
p and �εcs , are cal-
culated according to
�εcp = p A1/p
p σ np /pε(1−1/p)�t, (14)
�εcs = Aσ n�t. (15)
The creep strain increment, �εc , is equal to the largerof the two increments calculated from Eqs (14) and (15),i.e.
�εc
{�εc
p for �εcp ≥ �εc
s
�εcs for �εc
p < �εcs
. (16)
The primary and secondary creep constants in Eqs. (14)and (15) are given in Table 1 for 316H stainless steel at550 ◦C and P22 steel at 565 ◦C. For a particular time,the total strain at any stress level is given by the sumof the elastic and plastic strain and the total creep strainaccumulated in that time, i.e.
εtotal (σ, t) = εe (σ ) + ε pl (σ ) +∑
t
�εc (σ, � t). (17)
E V A L U A T I O N O F T H E C R E E P T O U G H N E S SP A R A M E T E R , K c
mat
The K cmat parameter is evaluated from the load displace-
ment curve generated during a CCG test using the rela-tion.3,8
K cmat =
(K 2 + E ′Up
Bn (W − a)η + n
n + 1E ′ P�c
Bn (W − a)η
)1/2
,
(18)
where Up is the area under the load displacement curveassociated with plasticity, W is the specimen width, Bn isthe net specimen thickness between any side-grooves, ais the crack length and n the secondary creep power-lawstress exponent (see Eq. 15) and η a geometry function(η = 2.2 for C(T) specimens21). Note that the K c
mat rela-tion has been modified since the work in Ref. [9].
In the absence of specimen load-displacement data amethod has been proposed to estimate K c
mat from CCIand CCG data. Under steady state conditions the CCGrate, a , may be described by the expression2
a = DC∗φ, (19)
where D and φ are temperature-dependent crack growthconstants. The CCI time may also be described by the C∗
parameter according to the power-law relationship
ti = Di C∗−φi , (20)
where Di and φi are temperature-dependent CCI con-stants. Assuming widespread creep conditions, a constantsecondary creep strain rate and using the reference stressestimate of C∗,1 it can be shown that K c
mat may be esti-mated from CCI data according to the relation22
K matc ≈
(E D1/φi
i t(1−1/φi ))1/2
. (21)
Alternatively, if crack growth is assumed a continuousprocess commencing at zero time, then K c
mat may be esti-mated from CCG data22 using
K matc ≈
(E
(�aD
)1/φ
t1−1/φ
)1/2
. (22)
It can therefore be seen from Eq. (22) that K cmat is ex-
pected to decrease with time according to
K matc α
(t1−1/φ
)1/2. (23)
CCI and growth models23–25 predict that φi = φ =n/(n + 1) thus, substituting for φ in Eq. (23) it may bewritten
K matc α t−1/2n. (24)
c© 2009 Blackwell Publishing Ltd. Fatigue Fract Engng Mater Struct 32, 820–836

TDFAD’s CCI PREDICT IONS IN AUSTENIT IC AND FERRIT IC STEELS 825
0.0
100.0
200.0
300.0
400.0
500.0
600.0
0.00 0.05 0.10 0.15 0.20 0.25 0.30
True Strain
Tru
e S
tre
ss (
MP
a)
P22 565 °C
316H 550 °C
Fig. 1 Comparison of the high temperature tensile behaviour of316H stainless steel at 550 ◦C and ferritic P22 steel at 565 ◦C.
It is therefore expected that K matc follows the power-law
relationship
K matc (�a, t) = Ht− j
i , (25)
where H is the correlating coefficient and, j is the power-law exponent.
C R E E P D E F O R M A T I O N A N D C C G B E H A V I O U RO F P 2 2 A N D 3 1 6 H S T E E L
Firstly, the high temperature tensile and creep deforma-tion and rupture behaviour of the two materials are com-pared to reveal their differences, which will be reflected inthe form of their TDFADs. The true-stress versus true-strain curves of both materials are shown in Fig. 1 up to thepoint in the tests where a failure mechanism intervened.The tensile properties are given in Table 1. The shape ofthe tensile behaviour of P22 and 316H are clearly differ-ent. The 0.2% proof stress of P22 is almost 70% higherthan that of 316H and exhibits relatively little hardening.On the contrary, 316H has a high degree of work hard-ening and has a 10% higher plastic ductility, εf , than P22steel, based on engineering strain (Eng) values.
The secondary creep strain rate and rupture-time versusstress relations for the two steels are compared in Fig. 2aand b, respectively. Note that the stress values for 316Hare true-stress values accounting for plastic strain on load-ing. However, in the absence of loading data, and becausethe applied stresses are significantly less than the σ 0.2 ofthe steel (thus little plastic strain is expected on specimenloading), the engineering stress has been used for the P22tests. In Fig. 2a the stress to cause a given strain rate orrupture time is around a factor of three higher for 316Hthan P22. The creep strain rates for a given stress aretherefore significantly higher, and rupture times lower,for P22 steel in comparison to 316H at these tempera-
1.E-06
1.E-05
1.E-04
1.E-03
1.E-02
10 100 1000
σ (MPa)
(h
-1)
P22 Data
316H Data
316H Trendline
P22 Trendline
sε
(a)
10
100
1000
10000
100000
10 100 1000σ (MPa)
(h)
P22 Data
316H Data
316H Trendline
P22 Trendline
(b)
rt
Fig. 2 Comparison of (a) secondary creep strain rates and (b) creeprupture time with stress for 316H at 550 ◦C and P22 at 565 ◦C.
tures. The uniaxial creep failure strain (creep ductility),εc
f , of P22 is over twice that of 316H based on both axialand reduction of area (ROA) measurements (see Table 1).
Isochronous stress–strain curves
The materials tensile data and creep laws have been com-bined to generate isochronous stress–strain curves as spec-ified in Section 2.3 using the material properties given inTable 1. The resultant curves are very different for the316H and P22 steel as shown in Fig. 3a and b, respec-tively, for times up to 100 000 h. The P22 steel’s curvesare strongly time dependent even at short times. In factthe P22 curve for a time of 1 h almost overlays the 316Hcurve at 100 000 h. The corresponding 0.2% inelastic(creep and plastic) strain, σ c
0.2, are illustrated and com-pared in Fig. 4. Little change in σ c
0.2 for 316H steel isobserved for the first 1000 h whilst creep strains domi-nate in the P22 steel. Even at very short times it can beseen that for P22 σ c
0.2 reduces by 50% due to creep strainaccumulation in the first hour alone.
c© 2009 Blackwell Publishing Ltd. Fatigue Fract Engng Mater Struct 32, 820–836

826 C. M. DAVIES
0.0
100.0
200.0
300.0
400.0
500.0
600.0
0.00 0.05 0.10 0.15 0.20 0.25 0.30Total Strain
Str
ess (
MP
a)
t = 0 ht = 1 h
t = 1000 h
t = 100 h
t = 10 h
t = 10,000 h
t = 100,000 h
(a)
316H 550 °C
0.0
100.0
200.0
300.0
400.0
500.0
600.0
0.00 0.05 0.10 0.15 0.20 0.25 0.30
Total Strain
Str
ess (
MP
a)
t = 0 h
t = 1 h
t = 1000 h
t = 100 h
t = 10 h
t = 10,000 h
t = 100,000 h
(b)P22 565 °C
Fig. 3 The isochronous stress–strain curvesat a range of times for (a) 316H stainlesssteel at 550 ◦C and (b) ferritic P22 steel at565 ◦C.
C R E E P F R A C T U R E B E H A V I O U R
CCG behaviour
CCG test data on the compact tension specimen, C(T),from Ref. [28] for P22 and Refs [26,27] for 316H steelhave been re-analysed in accord with recent changes indata analysis procedures.2,3 A sizable data set is available
for 316H with test durations ranging between 100 and18 000 h. The CCG tests on P22 steel were relativelyshort, ranging between 300 and 4,400 hrs. The signifi-cance of plasticity on loading of the 316H steel specimensand its influence on CCG behaviour has been described inRefs [9,29,30] The P22 test load-up data were not avail-able for analysis. However, it is expected that there is little
c© 2009 Blackwell Publishing Ltd. Fatigue Fract Engng Mater Struct 32, 820–836

TDFAD’s CCI PREDICT IONS IN AUSTENIT IC AND FERRIT IC STEELS 827
0.0
50.0
100.0
150.0
200.0
250.0
300.0
1.E+00 1.E+01 1.E+02 1.E+03 1.E+04 1.E+05
Time (h)
σc 0.2 (
MP
a)
P22
316H
316H
P22
σ 0.2
Fig. 4 Evolution of the 0.2% creep strength, σ c0.2, with time for the
316H stainless steel at 550 ◦C and P22 steel at 565 ◦C.
plasticity on loading of P22 specimens because the ratioσ ref /σ 0.2 on load up is less than 0.5 for all specimens and ison average 0.31 and 0.45, assuming plane strain and planestress conditions, respectively. For the 316H specimensthis ratio was close to or exceeded unity assuming planestrain conditions, except for the long-term tests where theratio was approximately 0.78.
Mean line power-law regression fits have been made tothe CCG data as shown in Fig. 5. Upper bound (UB)and lower bound (LB) fits are obtained by offsetting themean line by ±2 standard deviations of the regression fit,assuming a constant slope. Separate fits have been madeto the long- and short-term tests of 316H in Fig. 5a dueto the distinct CCG behaviour observed in the long-termtests, where plasticity is limited and thus high specimenconstraint effects maintained.30 The CCG rate constantsfor these fits (see Eq. 5) are given in Table 2. Similar CCGbehaviour is exhibited by both steels for C∗ > 1 × 10⁻⁵
MPamh−1; however, significant tails are observed for P22though the validity criterion2 are met.
CCI behaviour
The CCI times for 0.2 mm and 0.5 mm of crack exten-sion are plotted against the experimentally determinedC∗ parameter at the corresponding time in Figs 6 and 7for 316H and P22 steel, respectively. Regression fits havebeen made to the data and the constants in Eq. (20) de-termined, accounting for the degree of data scatter (seeTable 3). The CCI time data for 316H (Fig. 6) appearto form reasonable correlations with the C∗ parameter,though the power-law correlation exponent, φi , is signif-icantly less than n/(n + 1) as predicted from CCI mod-els.25,29 The value of φi obtained from the regression fitfor P22 data for �a = 0.2 mm is greater than unity indi-cating that the experimentally determined C∗ parameter
is not an appropriate correlating parameter in this case be-cause, as indicated by the tails shown in Fig. 5, steady stateCCG conditions have not been achieved.2 Also, becausethe data set for P22 is relatively small it can be difficult toestablish the data trend. More reasonable correlations areobtained for the P22 data at �a = 0.5 mm, though againφi is significantly less than n/(n + 1). A significant degreeof data scatter is observed for both materials, quantifiedby the UB/LB values of Di, which are generally a factorof 5 greater or less than the mean value, respectively.
Creep toughness data, Kmatc
The K matc values at �a = 0.2 and 0.5 mm of crack exten-
sion have been calculated using Eq. (18) for both materialsin homogenous PM and weldment (WM) conditions. Aregression fit has been made to the data to obtain the val-ues of H and j in Eq. (25) and again UB/LB fits madeby offsetting the mean by ± 2 standard deviations of thedata set (see Tables 4 and 5). In addition, the best line fithas been made to the data assuming a slope of 1/(2n) aspredicted in Eq. (24). Note that sensible trendlines havenot been obtained using Eqs (21) and (22) in conjunctionwith the CCG and CCI regression data detailed in Ta-bles 2 and 3, respectively, and thus are not shown in thefollowing figures.
Homogenous PM K matc data
The creep toughness data of 316H PM at 565 ◦C havepreviously been presented in Refs [9,31–33]. However,this data have been re-analysed here for consistency, andto be in accord with recent modifications in the K mat
cevaluation procedure. The slope j of the regression fitsto the 316H data in Fig. 8, is a factor of 5 steeper thanpredicted using Eq. (24). The best fit line to the data usingEq. (24) provides a reasonable fit to the data for less than500 h and 800 h for �a = 0.2 and 0.5 mm, respectively.For times greater than these, a change in the data trendcan be observed.
The corresponding K matc data for PM P22 steel are pre-
sented in Fig. 9. Creep toughness data for P22 steel at550 ◦C has been presented in Ref. [12]. K mat
c is expectedto be insensitive to such small variations in temperature,8
thus the data in12 at 550 ◦C have been combined with thedata analysed here at 565 ◦C. The influence of tempera-ture on K mat
c is further discussed for materials of similarcompositions to those analysed here in Ref. [10].
The regression fit values for �a = 0.2 mm were notsensible as the negative j value in Table 4 indicates anincrease in K mat
c with time. For �a = 0.5 mm, however,j ≈ 1/(2n) as predicted in Eq. (24). For the P22 datatherefore the mean lines shown in Fig. 9 are the best fitsof Eq. (24) to the data set, and the UB/LB factors are
c© 2009 Blackwell Publishing Ltd. Fatigue Fract Engng Mater Struct 32, 820–836

828 C. M. DAVIES
1.0E-05
1.0E-04
1.0E-03
1.0E-02
1.0E-01
1.0E+00
1.0E+01
1.0E-07 1.0E-06 1.0E-05 1.0E-04 1.0E-03 1.0E-02 1.0E-01
C* (MPam/h)
da/d
t (m
m/h
)Long Term Test Data
Short Term Test Data
UB
Mean
LB
316H 550 °C
(a)
1.0E-05
1.0E-04
1.0E-03
1.0E-02
1.0E-01
1.0E+00
1.0E+01
1.0E-07 1.0E-06 1.0E-05 1.0E-04 1.0E-03 1.0E-02 1.0E-01
C* (MPam/h)
da/d
t (m
m/h
)
Test Data
UB
Mean
LB
(b)
P22 565 °C
Fig. 5 CCG rate correlations with the C∗
parameter for (a) 316H stainless steel at550 ◦C and (b) P22 steel at 565 ◦C includingdata bounds.
assumed to be equal to that obtained from a regression fitto the data.
Comparison of parent and weldment data
The creep toughness data of 316 steel compact tensionspecimen weldments have been determined and compared
to PM data in16 where full details of the weldment geom-etry can be found. This weldment data are compared toadditional and re-analysed PM data in Fig. 10. Due tothe limited amount of weldment data available the slopeof the weldment trend line fitted to the data has beenassumed to be equal to that of the regression fit to thePM. A relatively good fit is observed, the coefficients for
c© 2009 Blackwell Publishing Ltd. Fatigue Fract Engng Mater Struct 32, 820–836

TDFAD’s CCI PREDICT IONS IN AUSTENIT IC AND FERRIT IC STEELS 829
Table 2 Regression fit constants to CCG rate versus C∗ data(Eq. 19) from long-term (LT) and short-term (ST) tests on 316Hand tests on P22 steel
316H (LT) 316H (ST) P22
D Mean 9.25 3.45 4.52D UB 16.91 8.26 16.87D LB 5.06 1.44 1.21φ 0.73 0.75 0.75
1.E+00
1.E+01
1.E+02
1.E+03
1.E+04
1.E+05
1.0E-07 1.0E-06 1.0E-05 1.0E-04 1.0E-03 1.0E-02
C* (MPam/h)
t i(h
)
Test DataUBMeanLB
(a)
Δa = 0.2 mm
1.E+00
1.E+01
1.E+02
1.E+03
1.E+04
1.E+05
1.0E-07 1.0E-06 1.0E-05 1.0E-04 1.0E-03 1.0E-02
C* (MPam/h)
t i(h
)
Test Data
UBMean
LB
Δa = 0.5 mm
(b)
Fig. 6 CCI time correlations with the C∗ parameter at (a) �a =0.2 mm and (b) �a = 0.5 mm for 316H stainless steel at 550 ◦C,including data bounds.
which are given in Table 4. For a given time, the meanK mat
c value of the 316 weldment specimens is a factor ofapproximately 2 less than that for PM.
Creep toughness data from C(T) weldment specimensof P22 steel are compared to PM specimens at 565 ◦Cand 550 ◦C for both �a = 0.2 and 0.5 mm in Fig. 11aand b, respectively. The PM and weldment data at bothtemperatures fall within the same scatter bands. A best fit
1.E+00
1.E+01
1.E+02
1.E+03
1.E+04
1.E+05
1.0E-07 1.0E-06 1.0E-05 1.0E-04 1.0E-03 1.0E-02
C* (MPam/h)
t i(h
)
Test Data
UB
Mean
LB
(a)
Δa = 0.2 mm
1.E+00
1.E+01
1.E+02
1.E+03
1.E+04
1.E+05
1.0E-07 1.0E-06 1.0E-05 1.0E-04 1.0E-03 1.0E-02
C* (MPam/h)
t i(h
)
Test Data
UB
Mean
LB
Δa = 0.5 mm
(b)
Fig. 7 CCI time correlation with the C∗ parameter at (a) �a =0.2 mm and (b) �a = 0.5 mm for P22 steel at 565 ◦C, includingdata bounds.
Table 3 Regression fit constants to CCI time versus C∗ data(Eq. 20) from tests on homogenous PM 316H and P22 steel forcrack extensions, �a, of 0.2 and 0.5 mm
316H P22
�a (mm) 0.2 0.5 0.2 0.5Di Mean 0.7 3.9 9.3 × 10⁻⁴ 22.1Di UB 5.0 17.9 4.0 × 10⁻³ 4.5Di LB 0.1 0.8 2.2 × 10⁻⁴ 0.93φi 0.55 0.47 1.1 0.44
line assuming a slope j = 1/(2n), as in Eq. (24), has beenmade to the PM and weldment data sets, where n hasbeen taken to be equal to the PM value. This assumptionis justified by the fact that the value of n determined fromtests performed on cross-weld uniaxial specimens of P22at 550 ◦C, which are considered to most represent thebehaviour of C(T) weldments, were found equal to the
c© 2009 Blackwell Publishing Ltd. Fatigue Fract Engng Mater Struct 32, 820–836

830 C. M. DAVIES
Table 4 Mean, UB and LB regression fit constants to K matc versus
time data (Eq. 25) of homogeneous PM and weldment 316H andP22 PM specimens
316H 316H P22
PM Weldment PM
�a (mm) 0.2 0.5 0.2 0.5 0.2 0.5H Mean 242.4 224.5 117.8 173.0 29.8 73.3H UB 449.7 611.5 211.8 289.0 51.5 136.8H LB 130.6 224.5 65.5 103.5 17.3 39.3j 0.20 0.23 0.20 0.23 –0.06 0.04
Table 5 Mean, UB and LB constants for the K matc versus time
relationship of Eq. (25) for homogenous PM specimens of 316Hand of P22 steel, and weldment specimens of P22 steel assumingj = 1/(2n)
316H P22
PM PM Weldment
�a (mm) 0.2 0.5 0.2 0.5 0.2 0.5H Mean 119.8 135.1 51.35 71.96 47.2 62.1H UB 222.2 223.0 88.68 134.3 69.5 88.3H LB 64.5 81.9 29.73 38.56 32.0 43.7j = 1/(2n) 0.043 0.047 0.047
PM test values.28 Note that sensible regression fits werenot obtained for this data set. On average there is a 10%difference between the PM and weldment value of K mat
cfor a given time and bound, whereas there is around a 40%and 80% difference between the UB or LB and mean valueof K mat
c for a given time, for the PM and weldment data,respectively, as can be deduced from Table 5. Therefore,within the extent of data scatter, little difference in creeptoughness behaviour is observed between the two materialconditions for the P22 steel.
T D F A D F O R M A T I O N
The TDFADs for a range of times (t = 0, 1, 10, 100,1000, 10 000 and 100 000 h) have been determined fromEqs (10), (11), (14)–(17), using the PM data given inTable 1, and are shown in Fig. 12. Also shown inFig. 12 for comparison purposes is the R6 Option 1 curve(see Eq. (3)). Note that the R6 cut off point, Lmax
r (seeEq. (5)) is the appropriate value to use (see Section 2.1)for times less than 10 000 h for the 316H material and forall times in the case of P22.
As can be seen in Fig. 12a and described in9 the 316HTDFAD is insensitive to time and deviates little fromthe R6 option 1 curve. The P22 TDFAD however, is inrelatively good agreement with the R6 Option 1 curve at
10
100
1000
1 10 100 1000 10000
t (h)
Kc m
at(M
Pa
√m)
Test Data
UB
Mean
LB
Regression Fit
(a)
Δa = 0.2 mm
Best Fit using Eqn (24)
10
100
1000
1 10 100 1000 10000
t (h)
Kc m
at(M
Pa
√m)
Data
UB
Mean
LB
Regression Fit
(b)
Δa = 0.5 mm316H 550 °C
Best Fit using Eqn (24)
Fig. 8 Creep toughness versus time data for 316H stainless steel at550 ◦C at (a) �a = 0.2 mm and (b) �a = 0.5 mm, including meanand UB/LB regression fits and the best fit using Eq. (24).
time 0 h, but almost instantly deviates significantly from it.These trends are due to the relatively low and high creepstrain rates experienced in 316H and P22, respectively,(see Figs 2a & 3) at these temperatures.
C C I T I M E P R E D I C T I O N S
The TDFAD procedure for predicting CCI times is eval-uated for both steels. A program has been developed thatdetermines the intersection of a point (Kr , Lr) for a giventime and crack extension with the TDFAD of correspond-ing time. Predictions for both PM and weldment data havebeen determined, though note the TDFADs have strictlybeen derived from PM data. The CCI times have beenpredicted for the tests on homogenous PM and weld-ment C(T) specimens.16,21,26 These tests have been usedto derive the relationship of creep toughness on time,thus appropriate predictions are expected. In addition,CCI data are available for feature tests on P22 PM and
c© 2009 Blackwell Publishing Ltd. Fatigue Fract Engng Mater Struct 32, 820–836

TDFAD’s CCI PREDICT IONS IN AUSTENIT IC AND FERRIT IC STEELS 831
10
100
1000
1 10 100 1000 10000
t i (h)
Kc m
at(M
Pa
√m)
565 °C
550 °C
UB
Mean
LB
Δa = 0.2 mm
(a)P22
10
100
1000
1 10 100 1000 10000
t i (h)
Kc m
at(M
Pa
√m)
565 °C
550 °C
UB
Mean
LB
Δa = 0.5 mm
(b)
P22
Fig. 9 Creep toughness versus time data for ferritic P22 steel PMat (a) 0.2 mm (b) 0.5 mm, including mean, UB/LB fitted lines.
weldment pipe components, as detailed in Ref. [34]. Theseresults are also predicted here using the TDFAD proce-dure. Predictions on C(T) specimens have been based onthe plane strain reference stress solution. Details of thestress intensity factor and reference stress solution for thepipe component are given in Ref. [34].
The TDFADs predicted CCI time, tPredictedi , is compared
to the experimentally determined value, tExpi , in Figs 13
and 15. Included in these figures is the line for tPredictedi =
tExpi . Points situated below this line indicate a conservative
prediction, and vice-versa. Predictions have been obtainedusing the mean and LB values of K mat
c calculated usingEq. (25) with the regression fit values shown in Table 4for 316H and the best fit values with an assumed slopeof j = 1/(2n) (see Eq. 24) as shown in Table 5 for theP22 material. The predictions based on mean or LB K mat
cvalues are shown as open and grey symbols, respectively.
The weldment and PM specimen predictions are showntogether in Fig. 13 for the 316 steel. Similar trends are
10
100
1000
1 10 100 1000 10000
t (h)
Kc m
at(M
Pa
√m)
PM Data
WM Data
Mean PM
Mean WM
(a)
Δa = 0.2 mm
316 550 °C
10
100
1000
1 10 100 1000 10000
t (h)
Kc m
at(M
Pa
√ m)
PM Data
WM Data
Mean PM
Mean WM
(b)
Δa = 0.5 mm
316 550 °C
Fig. 10 Comparison of the creep toughness versus time data for316H stainless steel at (a) 0.2 mm (b) 0.5 mm, for homogenous PMand weldment C(T) specimens.
observed for the two material conditions at both �a =0.2 and 0.5 mm. Predictions based on mean K mat
c val-ues are often, but not always, conservative whereas theuse of LB K mat
c values consistently gives conservative pre-dictions. The same is true for C(T) specimen PM andweldment data for P22 material shown in Figs 14 and15, respectively, except for one point in Figs 14b and 15awhich is just above the line using a LB K mat
c value. How-ever, because the data set available for P22 is limited, lessconfidence can be assigned to the appropriateness of theTDFAD for predicting CCI for P22, especially for long-term conditions because long-term data are unavailablefor this material.
An initiation distance �a = 0.5 mm has been deemedsuitable for the feature components,34 thus pipe data arenot included in Figs 14a and 15a. Predictions for the pipe
c© 2009 Blackwell Publishing Ltd. Fatigue Fract Engng Mater Struct 32, 820–836

832 C. M. DAVIES
10
100
1000
1 10 100 1000 10000
t i (h)
Kc m
at(M
Pa
√m)
PM 565 °C
PM 550 °C
WM 565 °C
WM 550 °C
Mean PM
Mean WM
(a)
Δa = 0.2 mm
P22
10
100
1000
1 10 100 1000 10000t i (h)
Kc m
at(M
Pa
√m)
PM 550 °C
PM 550 °C
WM 565 °C
WM 550 °C
Mean PM
Mean WM
(b)
Δa = 0.5 mm
P22
Fig. 11 Comparison of the creep toughness versus time data forP22 steel at 565 ◦C at (a) 0.2 mm (b) 0.5 mm, for homogenous PMand weldment C(T) specimens.
components are found to be very conservative in all caseswith tPredicted
i being less than 5% of tExpi . The degree of
uncertainty associated with tExpi measurements, and the
approximations made in evaluating the parameters K andσ ref for these components, leads to higher uncertaintiesin their CCI time predictions compared to that for labo-ratory test specimens. These additional uncertainties maycontribute to the excessive conservatism in the CCI timespredicted for these components. This uncertainty is how-ever not easily quantified. The influence of the referencestress solution on the CCI predictions has previously beenexamined and discussed in Ref. [9].
D I S C U S S I O N
The appropriate isochronous stress–strain response of alocation being either within the parent, weld or HAZ of aweldment will be affected by the isochronous stress–strain
response of the surrounding material region. An equiva-lent isochronous stress–strain response may be defined,with intermediate isochronous properties, which will bea function of weldment geometry, loading, crack geome-try, size and location. Note that for the weldment testsconsidered in this work the crack was located in theHAZ adjacent to the HAZ/PM interface. The equivalentisochronous stress–strain curve is based on the mismatchlimit load and equivalent material stress–strain curve de-scribed in R6.17 A conservative assessment is however ob-tained using the tensile properties of the weaker material,which would be the 316H PM in the case of the 316 spec-imen weldments which consist of 316H PM and 316Lweld metal.16 The mismatch reference stress for an over-matched weld is expected to be greater than that for ahomogeneous specimen (see e.g. Ref. [35]). Thus, shoulda conservative prediction be obtained for an overmatchedweldment using the materials PM properties and a ho-mogeneous reference stress solution then the use of themismatch reference stress would further increase the de-gree of conservatism. Tensile test data are not availablefor the P22 weld material at 565 ◦C; however, results in36
from a similar weld tested at 550 ◦C indicates that thewelds yield strength is slightly (7%) less than the PM,however their general stress–strain behaviour of the weldis very similar to that of the PM. Therefore, it is consid-ered that mismatch effects may not be significant for theP22 weldments analysis. The influence of mismatch onthe isochronous stress–strain curves of Cr–Mo steel, fol-lowing the R6 approach, have been examined in15 wherethe influence of geometry, crack size and time on theTDFAD was found negligible. A simplified procedure forevaluating isochronous stress–strain curves has been pro-posed in13 (neglecting plasticity and assuming the elasticresponse of the entire weldment is equal to the PM’s re-sponse) and applied to a 1Cr0.5Mo steel weldment. Thedependency of the TDFAD on time was shown in13, how-ever, the deviation of the weldments TDFAC from thePM is curve was not demonstrated.
Because the TDFAD is being used to predict CCI itis expected that creep fracture would be the failure modepredicted. This is true for all cases examined for the 316HPM and weldments and the majority of cases for the P22PM and weldment analyses using the LB K mat
c , whichleads to higher Kr values. However, for the vast majorityof cases failure by plastic collapse is predicted for the P22PM and weldment analyses when the mean K mat
c values areemployed, which is considered unrealistic. This is due tothe strong time dependence of σ c
0.2 causing a rapid increaseof Lr to values greater than Lmax
r . The time dependencyof the rupture stress σr is small in relation to σ c
0.2, thusLmax
r calculated from Eq. (8) which indicates creep rupture,does not fall below that of Eq. (5) which indicates plasticcollapse.
c© 2009 Blackwell Publishing Ltd. Fatigue Fract Engng Mater Struct 32, 820–836
TDFAD’s CCI PREDICT IONS IN AUSTENIT IC AND FERRIT IC STEELS 833
0.00
0.10
0.20
0.30
0.40
0.50
0.60
0.70
0.80
0.90
1.00
0.00 0.20 0.40 0.60 0.80 1.00 1.20 1.40 1.60 1.80 2.00
L r
Kr
R6 Option 1
TDFAD t = 0 hrs
Cutoff R6
Cutoff t = 10000 hrs
Cutoff t = 100000 hrs
316H 550 °C
(a)
TDFAD t = 1 → 100,000 h
0.00
0.10
0.20
0.30
0.40
0.50
0.60
0.70
0.80
0.90
1.00
0.00 0.20 0.40 0.60 0.80 1.00 1.20
L r
Kr
R6 Option 1
TDFAD t = 0 hrs
Cutoff R6
TDFAD t = 1 → 100,000 h
P22 565 °C
(b)
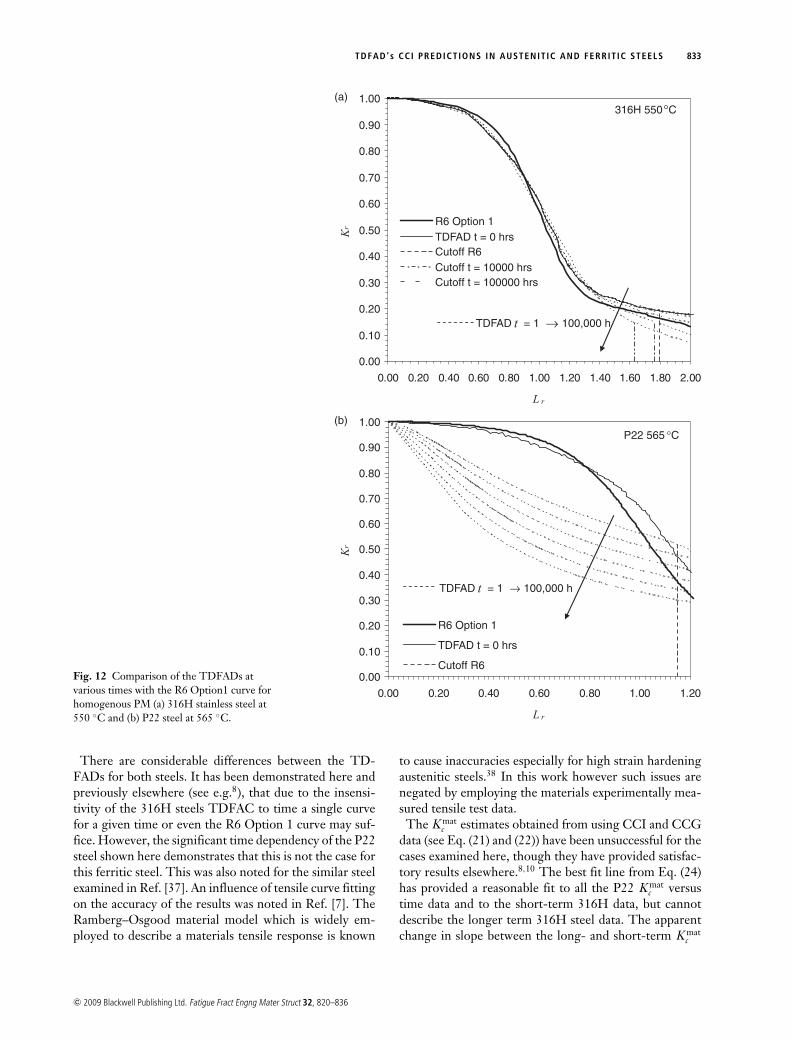
Fig. 12 Comparison of the TDFADs atvarious times with the R6 Option1 curve forhomogenous PM (a) 316H stainless steel at550 ◦C and (b) P22 steel at 565 ◦C.
There are considerable differences between the TD-FADs for both steels. It has been demonstrated here andpreviously elsewhere (see e.g.8), that due to the insensi-tivity of the 316H steels TDFAC to time a single curvefor a given time or even the R6 Option 1 curve may suf-fice. However, the significant time dependency of the P22steel shown here demonstrates that this is not the case forthis ferritic steel. This was also noted for the similar steelexamined in Ref. [37]. An influence of tensile curve fittingon the accuracy of the results was noted in Ref. [7]. TheRamberg–Osgood material model which is widely em-ployed to describe a materials tensile response is known
to cause inaccuracies especially for high strain hardeningaustenitic steels.38 In this work however such issues arenegated by employing the materials experimentally mea-sured tensile test data.
The K matc estimates obtained from using CCI and CCG
data (see Eq. (21) and (22)) have been unsuccessful for thecases examined here, though they have provided satisfac-tory results elsewhere.8,10 The best fit line from Eq. (24)has provided a reasonable fit to all the P22 K mat
c versustime data and to the short-term 316H data, but cannotdescribe the longer term 316H steel data. The apparentchange in slope between the long- and short-term K mat
c
c© 2009 Blackwell Publishing Ltd. Fatigue Fract Engng Mater Struct 32, 820–836

834 C. M. DAVIES
1.E-02
1.E-01
1.E+00
1.E+01
1.E+02
1.E+03
1.E+04
1.E-02 1.E-01 1.E+00 1.E+01 1.E+02 1.E+03 1.E+04
t iExp
(h)
tiP
redi
cted
(h
)C(T) Data PM Mean
C(T) Data PM LB
C(T) Data WM Mean
C(T) Data WM LB
(a)
Δa = 0.2 mm
316 550 °C
1.E-02
1.E-01
1.E+00
1.E+01
1.E+02
1.E+03
1.E+04
1.E-02 1.E-01 1.E+00 1.E+01 1.E+02 1.E+03 1.E+04
t iExp
(h)
tiP
redi
cted
(h
)
C(T) Data PM Mean
C(T) Data PM LB
C(T) Data WM Mean
C(T) Data WM LB
(b)
Δa = 0.5 mm
316 550 °C
Fig. 13 Comparison of the predicted and experimentallydetermined CCI times from tests on homogenous PM andweldment C(T) specimens of 316 steel at 550 ◦C for (a) 0.2 mm and(b) 0.5 mm, using mean and LB K mat
c values.
versus time data may indicate a change in material fracturebehaviour, as suggested in Ref. [31]. However, within theextent of data scatter no firm conclusions can be made.
The influence of using the LB bound or mean K matc
value has been examined here, and significant differencesare obtained in both cases, including a change of pre-dicted failure mode for the P22 steel. The influence ofthe reference stress solution on the CCI predictions haspreviously been examined in Ref. [9]. The plane stressreference stress is greater than the plane strain referencestress and therefore leads to higher degrees of conser-vatism. Using the plane stress reference stress solutionwith a LB K mat
c value will therefore lead to conservativepredictions for all cases considered here.
Long-term CCI and CCG tests are more representa-tive of component operating conditions. The difference
1.E-02
1.E-01
1.E+00
1.E+01
1.E+02
1.E+03
1.E+04
1.E-02 1.E-01 1.E+00 1.E+01 1.E+02 1.E+03 1.E+04
t iExp
(h)
tiP
redi
cted
(h)
C(T) Data Mean
C(T) Data LB
(a)
P22 PM 565 °C
Δa = 0.2 mm
1.E-02
1.E-01
1.E+00
1.E+01
1.E+02
1.E+03
1.E+04
1.E-02 1.E-01 1.E+00 1.E+01 1.E+02 1.E+03 1.E+04
t iExp
(h)
ti Pre
dict
ed (h
)
C(T) Data Mean
C(T) Data LB
Pipe Data Mean
Pipe Data LB
(b)
Δa = 0.5 mm
P22 PM 565 °C
Fig. 14 Comparison of the predicted and experimentallydetermined CCI times from tests on homogenous PM C(T)specimens and pipe components of P22 steel at 565 ◦C for(a) 0.2 mm and (b) 0.5 mm, using mean and LB K mat
c values.
between the CCG rate and K matc trends for long- and
short-term data signify that more long-term tests are re-quired to verify the TDFAD prediction method for usein high temperature components.
C O N C L U S I O N S
The creep toughness parameter, K matc , for a crack exten-
sion of 0.2 mm and 0.5 mm has been determined for anaustenitic 316H steel at 550 ◦C and ferritic P22 steel at565 ◦C from CCG tests on the compact tension, C(T),specimen geometry. Both homogenous PM and weldmentspecimen tests have been considered. K mat
c shows a rela-tively weak dependency on time for the P22 steel, howevera clear decrease in K mat
c with time is observed for the 316Hmaterial, especially at long times. Significant data scatter
c© 2009 Blackwell Publishing Ltd. Fatigue Fract Engng Mater Struct 32, 820–836

TDFAD’s CCI PREDICT IONS IN AUSTENIT IC AND FERRIT IC STEELS 835
1.E-02
1.E-01
1.E+00
1.E+01
1.E+02
1.E+03
1.E+04
1.E-02 1.E-01 1.E+00 1.E+01 1.E+02 1.E+03 1.E+04
t iExp
(h)
tiP
redi
cted
(h)
C(T) Data Mean
C(T) Data LB
(a)
Δa = 0.2 mm
P22 WM 565 °C
1.E-02
1.E-01
1.E+00
1.E+01
1.E+02
1.E+03
1.E+04
1.E-02 1.E-01 1.E+00 1.E+01 1.E+02 1.E+03 1.E+04
t iExp
(h)
tiP
redi
cted
(h)
C(T) Data Mean
C(T) Data LB
Pipe Data Mean
Pipe Data LB
(b)
Δa = 0.5 mm
P22 WM 565 °C
Fig. 15 Comparison of the predicted and experimentallydetermined CCI times from tests on C(T) weldment specimens andwelded pipe components of P22 steel at 565 ◦C for (a) 0.2 mm and(b) 0.5 mm, using mean and LB K mat
c values.
has been observed in the K matc data for both materials,
which has been quantified. For the P22 steel the influ-ence of K mat
c on time had to be predicted using modelsbecause, due to the extent of data scatter within the rela-tively small data set, a sensible regression line fit could notbe achieved. For a given time, the mean K mat
c values of the316 weldment specimens are found to be a factor of 2 lessthan that of the PM specimens. Within the extent of datascatter, little difference in creep toughness behaviour isobserved between the two material conditions for the P22steel. Isochronous stress–strain curves and TDFAD havebeen shown for a range of times for both the 316H andP22 PM steels. Due to the relatively low creep strain ratesin the 316H steel at 550 ◦C, these curves are relatively in-sensitive to time and little change is observed in the 316H
materials’ 0.2% creep strength, σ c0.2, for times less than
10 000 h. On the contrary the P22 curves rapidly deviatefrom their tensile curves (at t = 0 h) and σ c
0.2 halves withinthe first hour of creep. A program has been developedto obtain explicit CCI time predictions using the TD-FAD method. CCI time predictions have been obtainedfor the CGG tests on the PM and weldment C(T) spec-imens and in addition for CCG data on PM and weldedP22 pipe feature tests using the TDFAD derived fromPM data. Reasonable predictions are generally obtainedusing the mean bound value of K mat
c , though not alwaysconservative assuming plane strain conditions. Conserva-tive predictions are almost always obtained when LB K mat
cvalues are employed and may be ascertained by assumingplane stress conditions. Although considerable differencesare observed in the form of the K mat
c data and TDFADsof both austenitic 316H steel at 550 ◦C and ferritic P22steel at 565 ◦C reasonable and conservative CCI time pre-dictions can be achieved for both materials following theTDFAD approach. It is however essential that the influ-ence of time on the TDFAD is considered for the P22steel.
R E F E R E N C E S
1 Webster, G. A. and Ainsworth, R. A. (1994) HighTemperature Component Life Assessment, 1st edn. Chapmanand Hall, London.
2 ASTM. (2007) E1457-07: Measurement of Creep CrackGrowth Times in Metals. Annual Book of ASTM Standards.ASTM International, Philadelphia, PA, USA, pp. 1012–1035.
3 BEGL. (2003) An Assessment Procedure for the HighTemperature Response of Structures. British EnergyGeneration Ltd., Gloucester, UK.
4 Lamb, M. (2001) A Review of Creep Toughness of FerriticSteels. BNFL, Warrington, UK. Report No. M/TE/GEN/REP/0171/99, Issue 2.
5 Dogan, B., Petrovski, B. and Ceyhan, U. (2005) Hightemperature crack initiation and defect assessment of powerplant steel weldments. Creep & Fracture in High TemperatureComponents – Design and Life Assessment Issues, ECCC CreepConference. (Edited by I. A. Shibli, S.R. Holdsworth andG. Merckling). DEStech Publications, IMechE, London.
6 Fedeli, G., Gampe, U., Prunier, V., Nikbin, K. M.,Andersson, H., Patiraj, B. and Shibli, I. A. (1998) HIDAActivity on 2 1/4 Cr1Mo steel. Mater. High Temp. 15,27–35.
7 Kutz, M. (2002) Handbook of Materials Selection. John Wileyand Sons, New York.
8 Ainsworth, R. A., Hooton, D. G. and Green, D. (1999)Failure assessment diagrams for high temperature defectassessment. Eng. Fract. Mech. 62, 95–109.
9 Davies, C. M., O’Dowd, N. P., Dean, D. W., Nikbin, K. M.and Ainsworth, R. A. (2003) Failure assessment diagramanalysis of creep crack initiation in 316H stainless steel. Int.J. Press. Vessels Pip. 80, 541–551.
c© 2009 Blackwell Publishing Ltd. Fatigue Fract Engng Mater Struct 32, 820–836
836 C. M. DAVIES
10 Xuan, F. Z., Tu, S. T., Wang, Z. D. and Gong, J. M. (2005)On the creep fracture toughness of 2 1/4 Cr1Mo steel. KeyEng. Mater. 297–300, 1464–1469.
11 Mueller, F., Scholz, A. and Berger, C. (2007) Comparison ofdifferent approaches for the estimation of creep crackinitiation. Eng. Fail. Anal. 14, 1574–1585.
12 Dogan, B., Ceyhan, U. and Petrovski, B. (2007) Hightemperature crack initiation and defect assessment of P22steel weldments using time dependent failure assessmentmethod. Eng. Fract. Mech. 74, 839–852.
13 Ma, C. W., Xuan, F., Wang, Z. D. and Tu, S. T. (2004)Isochronous stress strain curves of low alloy steel cross weldspecimen in high temperature. Acta Metall. Sin. 17, 612–617.
14 Dogan, B., Ceyhan, U., Nikbin, K. M., Petrovski, B. andDean, D. W. (2006) European code of practice for creepcrack initiation and growth testing of industrial specimens.J. ASTM Int. 3, DOI: 10.1520/JAI13223.
15 Xuan, F.-Z., Tu, S.-T. and Wang, Z. (2006) A modifiedtime-dependent failure assessment diagram for cracks inmismatched welds at high temperatures. Fatigue Fract. EngngMater. Struct. 29, 157–166.
16 Davies, C. M., Dean, D. W., Nikbin, K. M. and O’Dowd,N. P. (2007) Interpretation of creep crack initiation andgrowth data for weldments. Eng. Fract. Mech. 74, 882–897.
17 BEGL. (2001) Assessment of the integrity of structurescontaining defects. R6 Revision 4, British Energy GenerationLtd., Gloucester, UK.
18 British Standard. (1999) BS 7910: Guide on Methods forAssessing the Acceptability of Flaws in Metallic Structures. BSI,London.
19 Ainsworth, R. A. and Budden, P. J. (1990) Crack tip fieldsunder non-steady creep conditions–I. Estimates of theamplitude of the fields. Fatigue Fract. Eng. Mater. Struct. 13,263–276.
20 RCC-MR. (1985) Design and Construction Rules forMechanical Components of FBR Nuclear Island. AFCEN, Paris.
21 Davies, C. M., Kourmpetis, M., O’Dowd, N.P. and Nikbin,K. M. (2006) Experimental evaluation of the J or C∗
parameter for a range of cracked geometries. J ASTM Int. 3,DOI: 10.1520/JAI13221.
22 Ainsworth, R. A. (1993) The use of a failure assessmentdiagram for initiation and propagation of defects at hightemperature. Fatigue Fract. Eng. Mater. Struct. 16,1091–1108.
23 Nikbin, K. M., Smith, D. J. and Webster, G. A. (1983)Influence of creep ductility and state of stress on creep crackgrowth. ASME International Conference on Advances inLife Prediction Methods. ASME, New York, NY, USA,Albany, NY, USA, pp. 249–258.
24 Nikbin, K. M., Smith, D. J. and Webster, G. A. (1984)Prediction of creep crack growth from uniaxial creep data.Proc. R. Soc. Lond. A 396, 183–197. DOI: 10.1098/rspa.1984.0116.
25 Austin, T. S. P. and Webster, G. A. (1992) Prediction ofcreep crack growth incubation periods. Fatigue Fract. Eng.Mater. Struct. 15, 1081–1090.
26 Dean, D. W. and Gladwin, D. N. (2007) Creep crackgrowth behaviour of type 316H steels and proposedmodifications to standard testing and analysis methods. Int.J. Press. Vessels Pip. 84, 378–395.
27 Bettinson, A. D. (2002) The Influence of Constraint on theCreep Crack Growth of 316H Stainless Steel. Department ofMechanical Engineering. Imperial College London,London.
28 Celard, N. (2000) Determination of a Unified Defect AssessmentProcedure for High Temperature Applications. Department ofMechanical Engineering. Imperial College London,London.
29 Davies, C. M., Mueller, F., Nikbin, K. M., O’Dowd, N. P.and Webster, G. A. (2006) Analysis of creep crack initiationand growth in different geometries for 316H and carbonmanganese steels. J. ASTM Int. 3, DOI : 10.1520/JAI13220.
30 Davies, C. M., Dean, D. W., Yatomi, M. and Nikbin, K. M.(2009) The influence of test duration and geometry on thecreep crack initiation and growth behaviour of 316H steel.Mater. Sci. Eng. A, 510–511, 202–206. DOI: 10.1016/j.msea.2008.04.109.
31 Dean, D. W. and Gladwin, D. N. (2001) Characterisation ofcreep crack growth behaviour in type 316H steel using bothC∗ and creep toughness parameters. Proceedings of the 9th
International Conference on Creep and Fracture of EngineeringMaterials and Structures, Swansea. (Edited by D. J. Parker).Institute of Materials, London, UK, pp. 751–761.
32 Dean, D. W. and O’Donnell, M. P. (2001) Alternativeapproaches in the R5 procedures for predicting initiationand the early stages of creep crack growth. Creep and Fatigueat Elevated Temperatures, Tsukuba, Japan, pp. 315–319.
33 Dean, D. W. and Hooton, D. G. (2003) A Review of CreepToughness Data for Austenitic Type 316 Steels. British EnergyGeneration Ltd. Gloucester, UK, Report No. E/REP/GEN/0024/.
34 Wasmer, K., Davies, C. M., Nikbin, K. M., O’Dowd, N. P.and Webster, G. A. (2003) A study of creep crack initiationand growth in welded P22 steel pipes. 2nd InternationalConference Integrity of High Temperature Welds. IOMCommunications Ltd, London, pp. 413–423.
35 Song, T.-K., Kim, Y.-J., Kim, J.-S. and Jin, T.-E. (2007)Mismatch limit loads and approximate J estimates for tensileplates with constant-depth surface cracks in the center ofwelds. Int. J. Fract. 148, 343–360.
36 Dogan, B. and Petrovski, B. (2001) Creep crack growth ofhigh temperature weldments. Int. J. Press. Vessels Pip. 78,795–805.
37 Xuan, F., Shandong, T. and Zhengsong, W. (2004) TDFADapproach to high temperature defect assessment and itsengineering application. Chin. J. Mech. Eng. 17, 537–542.
38 Gardner, L. and Ashraf, M. (2006) Structural design fornon-linear metallic materials. Eng. Struct. 28, 926–934.
c© 2009 Blackwell Publishing Ltd. Fatigue Fract Engng Mater Struct 32, 820–836
Copyright © 2022 FDOKUMEN