Creep can strengthen clay – a matter of long-term slope stability
Upload
khangminh22Category
view
4download
0
THE CREEP RESPONSE OF PAPER
Douglas W. Coffin
Department of Paper and Chemical Engineering, Miami University,Oxford OH 45056
With unchanging loadAll action appears to cease
Yet still there is creep
ABSTRACT
This article examines the literature pertaining to the creepbehavior of paper. The basic concept of creep, the terminologyused to describe creep, and the various ways to present creep areintroduced. This is followed by a historical overview of creep inpaper. Using this framework, discussions centered on tensile,compressive, and accelerated creep are presented. For years,research efforts have focused on accelerated creep. Because of thisdiversion, an acknowledged fundamental understanding of papercreep is lacking. Using previous data for tensile creep in constanthumidity conditions, a rudimentary model of creep in paper isdeveloped. The model clearly demonstrates that the role of bond-ing is accounted for simply with an efficiency factor that acts tomagnify the stress. In addition to the impact of inter-fiberchanges, intra-fiber effects resulting from hardening and wet-straining are demonstrated. It is suggested that compressive creepdiffers from tensile creep due to material instability. Acceleratedcreep is taken to be the result of moisture-induced load cycling.The result of this discourse is that to increase understanding,fundamental studies of creep behavior in constant conditions areand will be more fruitful than studies in cyclic humidity.
13th Fundamental Research Symposium, Cambridge, September 2005 651
Preferred citation: D.W. Coffi n. Review: The creep response of paper. In Advances in Paper Science and Technology, Trans. of the XIIIth Fund. Res. Symp. Cambridge, 2005, (S.J. I’Anson, ed.), pp 651–747, FRC, Manchester, 2018.DOI: 10.15376/frc.2005.2.651.
INTRODUCTION
To the layman, the word creep conjures up many images; those that makeone’s skin crawl and others of people best forgotten. Yet, the word can possesa certain charm such as in this context; creeping along at a slow and steadypace. Similarly, creep in paper can be a horror such as when it cuts the lifetimeof a box short, and yet the study of creep has a charm unparalleled in papertesting. Compare the slow steady progression towards failure created in acreep test, to the violent and rapid destruction that occurs in a tear test. Atear test is fast and exciting, but it is over before one really appreciates theseverity by which the paper was destroyed. Creeping deformation providesample time for observation and one fully appreciates the complex yet system-atic behavior of paper deformation. In the current age of instant everything,we can still rely on the creep test to be slow. (Rumor has it that even creep isnow apt to accelerate.)
In materials science, creep is defined as the accrual of deformation overtime due to the presence of a constant load. One may associate creep withflow of the material, whether it is viscous or plastic; molecular or structural;recoverable or unrecoverable. In addition, creep may involve redistribution ofthe load within the material. Creep responds well to its environment, espe-cially changes in that environment. Creep is not selective. Both natural andmanmade materials exhibit creep. Under the right conditions, say elevatedtemperature or moisture, a long lapse in time, or the right load, the creepdeformation can be appreciable. Too much creep can lead to poor perform-ance in manufacturing, converting, and end-use. This is the reason whyunderstanding the creep behavior of paper is important.
In the following, the creep behavior of paper is explored. First, the basicsof creep behavior including terminology and methods of characterization arepresented. A historical overview of the literature is given, to introduceimportant results and give the reader a flavor of how this area of researchdeveloped. A thorough discussion of the tensile creep of paper is presentedwith emphasis on the role of inter- and intra-fiber influences and how onewould account for such affects in modeling. The discussion of compressivecreep deals with the specialized methods required for this type of testing andthe differences relative to tensile creep. Then a discussion of that infamousaccelerated creep phenomenon is provided. The summary brings all of thistogether and suggests future directions for creep studies.
652 Session 4: Network Deformation and Failure
D.W. Coffin

BASICS OF CREEP
The creep test
In the realm of testing of mechanical properties, tensile creep tests are per-haps the simplest of all tests to set-up. Simple instructions are as follows
• Obtain a strip of paper of length, L0, a deadweight, W, and a tool tomeasure the deformation, ΔL.
• Fasten the strip at the top so that it hangs vertically (be sure paper can notslip.)
• At the bottom of the strip, apply the deadweight.• Reference time from the instant the load is applied.• Periodically, t1, t2 . . . tn, measure the change in length, ΔL1, ΔL2 . . . ΔLn.• Evaluate the change in length as a function of time due to the applied load.
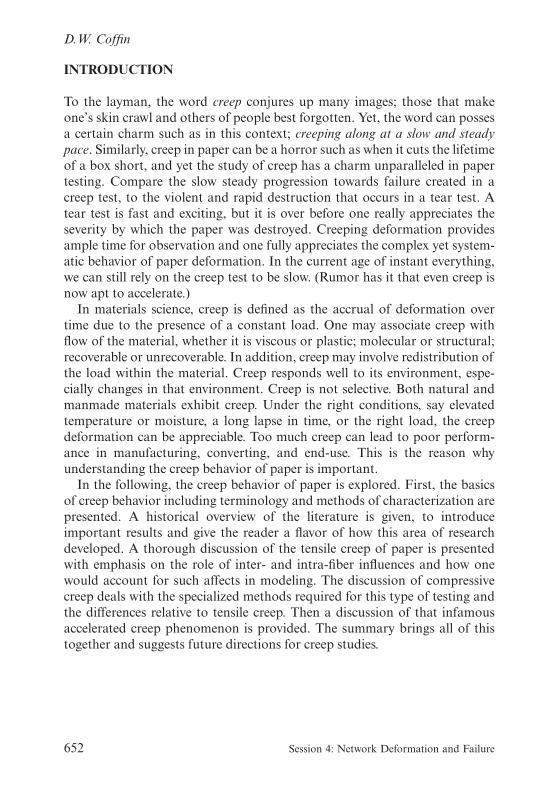
Figure 1 illustrates this procedure for the creep test. With the gathered data,calculate the strain as, ε = ΔLi/L, and graph the total strain versus time, asillustrated in Figure 2 for a generic creep response.
Typically, this creep behavior is idealized as having an instantaneousresponse, ε(0), and a time dependent response εc (t). The total creep strain isthe sum of the two components. Typically, the creep strain is a function ofload level, temperature (T), and moisture (H), as indicated in Equation (1).
ε(t, σ0, T, H ) = ε(0, σ0, T, H ) + εc (t, σ0, T, H ), t ≥ 0 (1)
Figure 1 A simple tensile creep test.
13th Fundamental Research Symposium, Cambridge, September 2005 653
The Creep Response of Paper
where εc(0,σ0, T,H) = 0. Although the creep test is simple, the interpretation,analysis, and presentation of creep data have many facets that merit discus-sion. The following section describes the basics of the theory of creep, so thatthe reader is equipped with the knowledge and terminology to better appreci-ate the sections dealing specifically with creep in paper. For more completeinformation on creep and viscoelastic behavior of polymers references [1–4]should be consulted.
Creep compliance
Creep compliance, J(t), defined as the total strain divided by the load is oftenused to characterize materials. The load is taken as a stress or load per unitinitial cross-sectional area of the sample (σ0 = W/A). With the notation intro-duced in Equation (1), creep compliance is then written as
J(t, σ0, T, H ) =ε(0, σ0, T, H ) + εc(t, σ0, T, H )
σ0
, t ≥ 0 (2)
Figure 2 A generic creep response.
654 Session 4: Network Deformation and Failure
D.W. Coffin

The instantaneous response is obtained from the compliance evaluated attime equals zero. The creep compliance curve can be put in dimensionlessform as
J(t)
J(0)=
ε(t)
σ0
=Eε(t)
σ0
(3)
where E is a measure of the elastic modulus of the paper and is equal to theinverse of the initial compliance for sufficiently small loads.
The dependence of creep compliance on load merits discussion. For sim-plification, assume the total creep strain is a function of only load and time,ε(σ,t). Consider a material where the change in creep deformation scales inproportion to changes in load. In this case, a change in load from σ0 to kσ0,where k is a constant has a corresponding increase in total creep strain equalto
ε(kσ0, t) = kε(σ0, t). (4)
Equation (4) can hold true only when the creep compliance is independent ofload. Thus, the creep response of a material that is linearly dependent on loadcan be written as
ε(σ, t) = J(t)σ. (5)
By developing creep compliance curves from creep tests conducted at differ-ent load levels, one can assess the validity of Equation (5) or in words, theload independence of creep compliance and the load-linearity of creepdeformation. Say we conduct a series of creep tests at different load levels andobtain the family of creep curves shown in Figure 3(a). If the response islinear with load, the family of creep strain curves will scale with load such toproduce the one creep compliance curve shown in Figure 3(b). If the responseis not scalable, in other words a nonlinear function of load, the creep compli-ance curves will not superimpose as shown in Figure 3c. As discussed in thenext subsection, even if the material is nonlinear (Figure 3c), it may be pos-sible to shift the curves with respect to time or load so that they superimposeto form one master creep compliance curve.
13th Fundamental Research Symposium, Cambridge, September 2005 655
The Creep Response of Paper

Master creep curves
A useful representation of creep behavior for some nonlinear materials is themaster creep compliance curve. For a linear material as was shown in Figure3(b), there is only one compliance curve for all load levels, but when theresponse is nonlinear a family of curves exists as was shown in Figure 3(c).For these nonlinear materials, it may be possible to scale or shift the compli-ance curves in either time or load to produce a master curve. Figure 4 showsthe same curves that were shown in Figure 3 (c) but with an appropriatescaling of time so that that all the curves superimpose. The symbols on thecurve in Figure 4 represent the beginnings and ends of the individual creepcurves. The curve that results from the compilation of the individual curvesfor various load levels is called the master creep curve.
If the shifts in time and load are systematic such that they can be expressedas a function, a general relationship to predict the creep response at differentload levels and time-scales is possible from the expression of a single mastercreep compliance curve and the appropriate shift functions. Assume that thecompliance of the master creep curve can be written as Jo(t,T,H) andthe creep curve for any load can be obtained through a shift in time, then thecreep compliance can be written as
J(t, σ, T, H ) = J(t + ts(σ),T, H ) t ≥ 0 (6)
Likewise if the creep responses at different temperatures and moistures canbe formed in to a master creep curve, the creep compliance can be expressedsimilarly.
Figure 3 Creep strain and creep compliance. (a) creep curves for different loadlevels, (b) creep compliance for a linear material, (c) creep compliance for a nonlinear
material.
656 Session 4: Network Deformation and Failure
D.W. Coffin

Isochronous and isometric creep curves
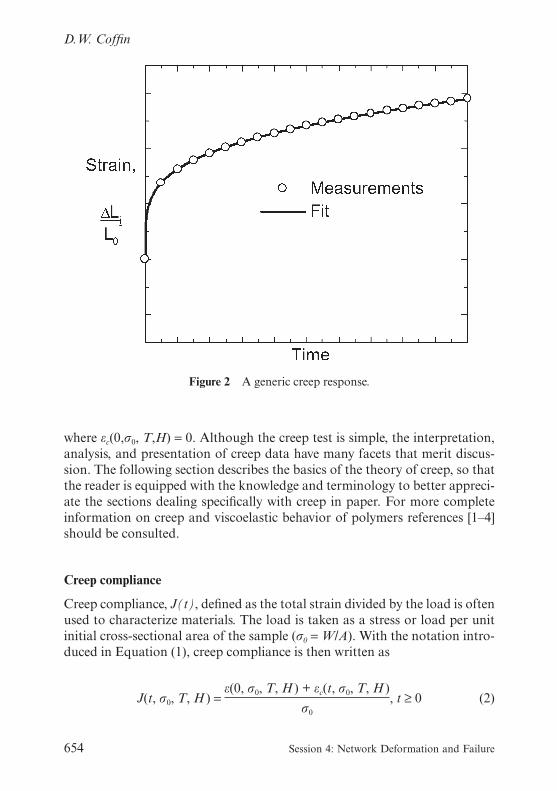
Isochronous and isometric curves are utilized to represent creep data. Isoch-ronous creep curves are plots of stress versus total creep deformation at agiven time. For example, taking a family of creep curves such as presented inFigure 3(a), the creep strain at any given time can be determined for each levelof stress. This collection of stress-strain points at a given time, form a curve,and Figure 5 displays these isochronous curves for several values of time. Ifthe creep compliance is a linear function of load, the isochronous curves willbe straight lines as shown in Figure 5(a). The slope of any line is equal to thecreep stiffness or the inverse of the creep compliance at that time. If the creepcompliance is a nonlinear function of load, the isochronous curves will not bestraight lines as shown in Figure 5(b). Typical isochronous curves for poly-mers show linear behavior at small strains and nonlinear response at largestrains. Isochronous curves are useful when comparing the creep behavior ofdifferent materials.
Another useful representation is the isometric creep curve. The isometriccurve plots load versus time for a constant strain. It provides the timerequired for a given load level to reach a certain strain.
Figure 4 Master creep curve for compliance curves shown in Figure 3c. The symbolsshow the start and end of the individual creep curves.
13th Fundamental Research Symposium, Cambridge, September 2005 657
The Creep Response of Paper
Superposition and linearity
A creep compliance that is independent of load is not sufficient for completematerial linearity. In addition to load linearity, superposition must hold.Superposition implies that the total deformation at any time for an arbitraryload history can be obtained by summing the creep behavior of each incre-ment of load over the time elapsed from when load increment was added. Forexample, say that a sample is subjected to a load σ1 starting from t = 0. Then ata given time, t*, the load is changed to σ2. Superposition states that the totalcreep can be determined by adding the creep due to the change in load to thecreep caused by the original load. As an equation this criteria is
ε(t) = ε(σ1, t) + ε(σ2 − σ1, t − t*) t > t* (7)
The strain can also be written simply as
ε(t) = ε(σ1, t*) + Δε(σ1, σ2, t, t*) t > t* (8)
where Δε is the additional strain after t = t* due to the change in load.Setting Equation (7) equal to Equation (8) gives
Δε(σ1, σ2, t, t*) = ε(σ1, t) − ε(σ1, t*) + ε(σ2 − σ1, t − t*) t > t*, (9)
which is the criterion that must be satisfied if superposition holds.Equations (7–9) are shown graphically in Figure 6. The step increase in
Figure 5 Example of isochronous curves for a linear material (a) and a nonlinearmaterial (b).
658 Session 4: Network Deformation and Failure
D.W. Coffin

load at t = t* causes the strain to follow the solid line. If superposition is valid,the increment in strain can be obtained by a superposition of the strain due tothe first load plus the additional strain due to the incremental increase in loadstarting from t = t* (adding the strain given at the lower right section of Figure7 to the dashed line.)
Equation (9) provides a requirement for increments of strain that musthold true for superposition to be valid, but it does not require that the creepcompliance be independent of load. For example, if upon the removal ofload the creep deformation is fully recoverable at the same rate at which itaccrued then superposition is valid, even if linear scaling does not apply. Onecan also have a linear creep response with respect to load level that does notobey superposition. An example of this would be materials that experienceaging, for example from a curing process. With curing, even if the loaddependence is linear, the creep compliance changes with time independent ofthe time lapse associated with the application of load rendering superpositioninvalid.
If the creep compliance is independent of load level and superposition
Figure 6 Graphic representation of superposition principle, Equation (7).
13th Fundamental Research Symposium, Cambridge, September 2005 659
The Creep Response of Paper

holds, the material is said to be linear. The Boltzmann superposition principleis
(1) The creep is a function of the entire past loading history of the material.(2) Each loading step makes an independent contribution to the final
deformation.
If linear superposition holds, then the strain can be written as the heredityintegral given in Equation (10).
ε(t) = �t
−∞
f (t − τ)dσ
dτdτ (10)
Equation (10) is a convolution integral and expresses both conditions ofsuperposition and load scaling. Thus, linear viscoelastic material responsecan be expressed in terms of Equation (10), where the function f(t) is thecreep compliance J(t).
If the material behavior is nonlinear, Equation (10) is invalid. There stillmay be a functional that will describe superposition. For most materials,Equation (10) is valid for low load levels and/or short time intervals, but athigher load levels or longer time lapses, the response cannot be described withEquation (10).
Deformations of creep: Instantaneous, delayed-elastic, and permanent
Assessing the linearity of the creep response is important, but of equalimportance is assessing the type of behavior that occurs during creep. Formost materials, the deformation response in a creep test can be classified asone of three types: instantaneous, delayed elastic, and permanent creep. Theinstantaneous response is an idealization that upon the instant of load appli-cation, some deformation develops instantaneously. Of course there is sometime lapse involved with the deformation and this initial deformation willdepend on how much time is involved in the application of the load andmeasurement of the deformation. But the concept of an instantaneousdeformation is suited well for mathematics and interpretation, so we use it.This “instantaneous” creep could have an elastic (recoverable) and inelastic(unrecoverable) component and is the creep compliance at time equals zero.For small load levels, this “instantaneous” response is usually recoverable andreferred to as the instantaneous elastic response, and we relate it to a measure
660 Session 4: Network Deformation and Failure
D.W. Coffin

of elastic modulus, E, (J(0)=1/E). At large load levels, the initial deformationmay include inelastic behavior such as rate independent plastic deformation.
The second type of creep strain is the delayed-elastic response. At theinstant of loading, this component of the deformation is zero, but as timepasses, deformation begins to accrue and approaches a finite limit. Uponunloading, this deformation is fully recoverable. The third type of creepdeformation is non-recoverable creep. This is deformation that accrues overtime and upon unloading is permanent. During a creep test, one can not fullydifferentiate the recoverable and unrecoverable portions of the creep. Toassess creep in terms of the recoverable and unrecoverable deformation, onemust remove the load and measure the recoverable response.
The three types of creep deformation, instantaneous, delayed-elastic, andpermanent are illustrated in Figure 7. An instantaneous elastic deformationdevelops directly upon loading and is recoverable immediately upon unload-ing. A delayed-elastic response accrues deformation over time, reaches alimit, and is recoverable over a given time period. A permanent deformationdevelops over time and fully remains upon unloading.
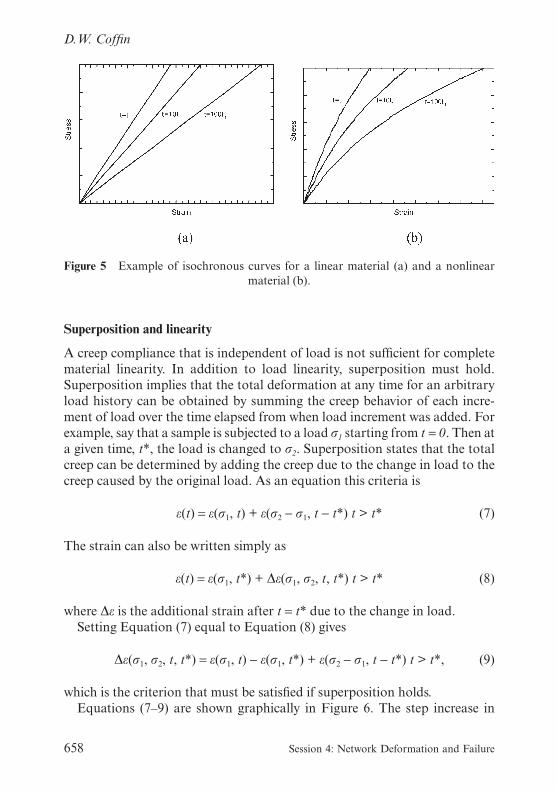
Mechanical analogies of the three types of deformation are shown inFigure 8. Instantaneous elastic deformation is represented by a spring;
Figure 7 Examples of three types of deformation experienced during creep testshown during loading and unloading.
13th Fundamental Research Symposium, Cambridge, September 2005 661
The Creep Response of Paper
non-recoverable deformation is represented by a dashpot; and delayed elasticdeformation is represented by an elastic spring in parallel with a viscousdashpot. Combinations of these elements are often used to produce modelsof viscoelastic behavior including creep. Such a model can be made to fitcreep data, but it is rare that the same model will also provide an accuratemodel for other loading histories such as stress-relaxation or a tensile-test.
Deformations of creep: Primary, secondary, and tertiary regimes
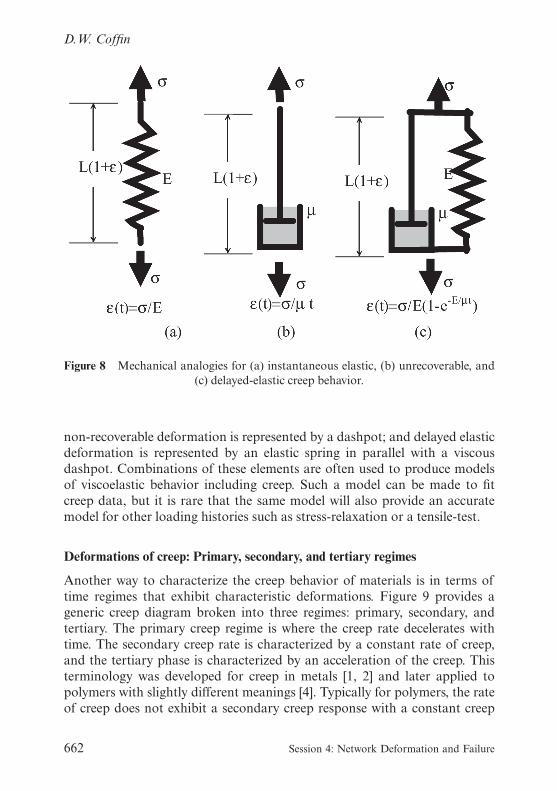
Another way to characterize the creep behavior of materials is in terms oftime regimes that exhibit characteristic deformations. Figure 9 provides ageneric creep diagram broken into three regimes: primary, secondary, andtertiary. The primary creep regime is where the creep rate decelerates withtime. The secondary creep rate is characterized by a constant rate of creep,and the tertiary phase is characterized by an acceleration of the creep. Thisterminology was developed for creep in metals [1, 2] and later applied topolymers with slightly different meanings [4]. Typically for polymers, the rateof creep does not exhibit a secondary creep response with a constant creep
Figure 8 Mechanical analogies for (a) instantaneous elastic, (b) unrecoverable, and(c) delayed-elastic creep behavior.
662 Session 4: Network Deformation and Failure
D.W. Coffin

rate, but rather the creep rate continues to decrease until the tertiary regime.The connection to the metals definition of primary and secondary creep ratesto polymers is not the rate of creep, but the type of deformation. In metals,the primary creep is related to recoverable deformation, and secondary creepis typically unrecoverable. Thus, when we speak of polymers including paper,the primary creep is considered recoverable creep and secondary creep istaken as unrecoverable creep regardless of the functional dependence ontime.
As previously stated, the amount of recoverable creep is assessed by con-ducting a creep recovery test. After the sample has been subjected to a con-stant load for a given period of time, the load is removed and the change inlength of the sample under no load is measured for a period of time greaterthan the initial creep. At the moment of unloading, the instantaneous elasticdeformation will be recovered. Then the delayed elastic creep will recover.The amount of strain recovered over time can be used to determine thedelayed elastic response.
Figure 9 Three regimes of creep response.
13th Fundamental Research Symposium, Cambridge, September 2005 663
The Creep Response of Paper

Delayed elastic response versus creep recovery strain
An important clarification about creep recovery needs to be made. From ahistoric point of view following directly from Boltzmann superposition, thecreep recovery strain at a given time is defined differently than the amount ofcreep strain that has recovered. Take a given creep test, where the load isapplied at t = 0 and removed at t = t1. Then at a time t = t2, the amount ofelastic recovery is measured. The elastic recovery is defined as the difference,ε(t1)−ε(t2), but the creep recovery strain is defined as ε*(t2)−ε(t2), where ε*(t2) is the creep strain that would have been in the sample had the loadremained on the sample until t=t2. This difference is illustrated in Figure 10.
For materials that obey Boltzmann superposition, Equation (10), the creeprecovery plotted as a function of recovery time is exactly the same as theinitial creep as a function of time. This is regardless of whether the creep is adelayed-elastic deformation or an unrecoverable deformation. It stems fromthe fact that if superposition holds, then the response after unloading can be
Figure 10 Difference between elastic recovery and traditional definition of creeprecovery strain.
664 Session 4: Network Deformation and Failure
D.W. Coffin

obtained by the application of a load of the same magnitude as the creep loadbut of opposite sign. The superposition of the continued positive creep minusthe additional negative creep gives the response for recovery with no load.Therefore, when checking the validity of Boltzmann superposition one needsto plot creep recovery as defined in Figure (8) against the initial creep ratherthan the actual elastic recovery.
On the other hand, to determine the amount of delayed-elastic creepdeformation one simply needs to know the absolute value of the total strainrecovered during the recovery period. This distinction is important because inthe literature for creep of paper, it appears that delayed-elastic recovery,ε(t1)−ε(t2), is reported as the creep recovery not the traditional definition ofcreep recovery strain.
Time-temperature superposition
There is another important principle of creep in polymers that warrants dis-cussion; time-temperature equivalence. In simple terms, time-temperatureequivalence implies that the creep behavior at one temperature can be relatedto the creep response at another temperature by a change in time-scale only.Typically, when creep compliance as a function of time is plotted on adouble-logarithmic scale the curves can be shifted horizontally along log-(time) until they superimpose. By keeping track of the shift factor as a func-tion of temperature, a master creep curve can be formed to provide creepresponse for various loads, temperatures and times. If time-temperatureequivalence is valid for the material, one can conduct creep tests at elevatedtemperatures to predict the response at long times for low load levels.
Lifetime
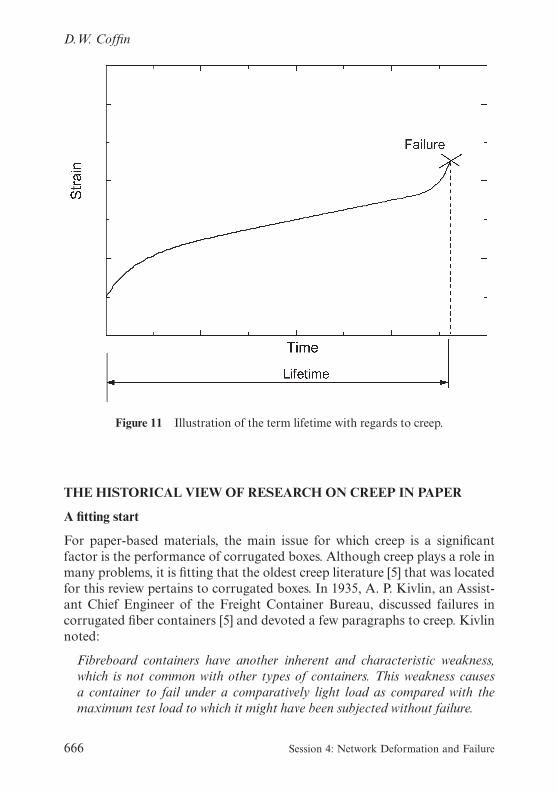
When a material creeps, a limiting strain may be reached, such as a puredelayed-elastic response, but more often the creep will continue until failureoccurs. The time lapse from the time when the load is applied until the timethe sample fails is called lifetime, as demonstrated in Figure 11. Lifetime is akey factor used to evaluate the performance of materials and productsexpected to sustain loads for long periods of time. Lifetime is often correlatedto load level and creep rates. The most obvious criteria for lifetime would be amaximum creep strain. If tertiary creep is included in the model, the pointwhere the rate of creep approaches infinity may be taken to signal failure.
13th Fundamental Research Symposium, Cambridge, September 2005 665
The Creep Response of Paper
THE HISTORICAL VIEW OF RESEARCH ON CREEP IN PAPER
A fitting start
For paper-based materials, the main issue for which creep is a significantfactor is the performance of corrugated boxes. Although creep plays a role inmany problems, it is fitting that the oldest creep literature [5] that was locatedfor this review pertains to corrugated boxes. In 1935, A. P. Kivlin, an Assist-ant Chief Engineer of the Freight Container Bureau, discussed failures incorrugated fiber containers [5] and devoted a few paragraphs to creep. Kivlinnoted:
Fibreboard containers have another inherent and characteristic weakness,which is not common with other types of containers. This weakness causesa container to fail under a comparatively light load as compared with themaximum test load to which it might have been subjected without failure.
Figure 11 Illustration of the term lifetime with regards to creep.
666 Session 4: Network Deformation and Failure
D.W. Coffin

He goes on to say that this weakness may explain why the lower containers ina stack collapse for no apparent reason. Kivlin further states:
. . . after a time under the steady application of this dead load, they (thecontainers) collapsed.
This is creep! It should be noted that the early work on creep in boxes refers tocreep as fatigue, which has nothing to do with the traditional material sciencemeaning of fatigue. By 1949, investigations of the creep testing of corrugatedboxes had begun [6]. Figure 12 shows a photograph of an early creep test on astack of boxes with quite an amusing collection of items for deadweight,which maintained symmetry. From this humble beginning over 50 years ago,there has arisen quite an interest in the creep of paper, board, and boxes.Some of the highlights are covered in the following overview.
Figure 12 Early creep test of stacked corrugated containers. [6]
13th Fundamental Research Symposium, Cambridge, September 2005 667
The Creep Response of Paper

Creep testing of boxes continued steadily for the next several decades [7–11]. Much of this work dealt with studying box lifetime; defined as the time atwhich the box fails due to creeping. All these early tests studied lifetime underconstant humidity conditions. The earliest work attempted to develop predic-tions of lifetime based on load level [7–9], the latter work [10, 11] focused onthe rate of creep in the secondary creep regime, which for boxes, is approxi-mately constant for a significant period of time. The latter approach wasfound to be a much better predictor.
Early creep studies
Interestingly, many of the initial studies of creep were not aimed at under-standing box lifetime, but at unlocking the mysteries of the time-dependentbehavior of paper. At about the same time that creep studies in boxes wereinitiated, interest in understanding the viscoelastic properties of paper hadarisen [12–14]. This early work dealt mainly with the viscoelastic behavior ofpaper as observed from tensile tests, but creep was discussed. The first in-depth study of the creep behavior of paper was presented by Brezinski in1956 [15]. Brezinski’s work and several follow-up doctoral studies conductedat the Institute of Paper Chemistry [16–18] are likely the best collection ofwork on the basic tensile creep of paper that can be found in the literature. Itshould be re-emphasized that the purpose of this body of work had nothingto do with boxes, but was aimed at gaining a fundamental understanding ofthe viscoelastic behavior of paper. This body of work is heavily relied on forthe critical evaluation of tensile creep in the following section.
Brezinski [15] completed an extensive study the tensile creep response ofhandsheets produced from a commercial softwood alpha pulp. He used twolevels of beating and wet-pressed to various levels to produce a range ofdifferent density sheets. He also performed creep tests at a multiple of loadlevels and in a range of relative humidity environments. In addition, to basicfirst creep tests, he measured creep recovery and creep in conditioned (previ-ously crept) samples.
The basic creep behavior he observed was the same for all conditions.Brezinski [15] established that the creep deformation of paper exhibited allthree distinct behaviors: initial-elastic, delayed-elastic, and unrecoverabledeformation. He also found that the initial creep deformation could be fitwith a power-law equation, but for high load levels and long times, the creepdeformation was linear with the logarithm of time. The equations Brezinski[15] used to fit his creep data were
ε = Bt a + C (11)
668 Session 4: Network Deformation and Failure
D.W. Coffin
for short times and low loads, and
ε = K log(t) + D (12)
for long times and high loads. The terms B, a, K, C, and D were constantsused to fit the data. He referred to the portion of the curve between these tworegimes as a transition zone.
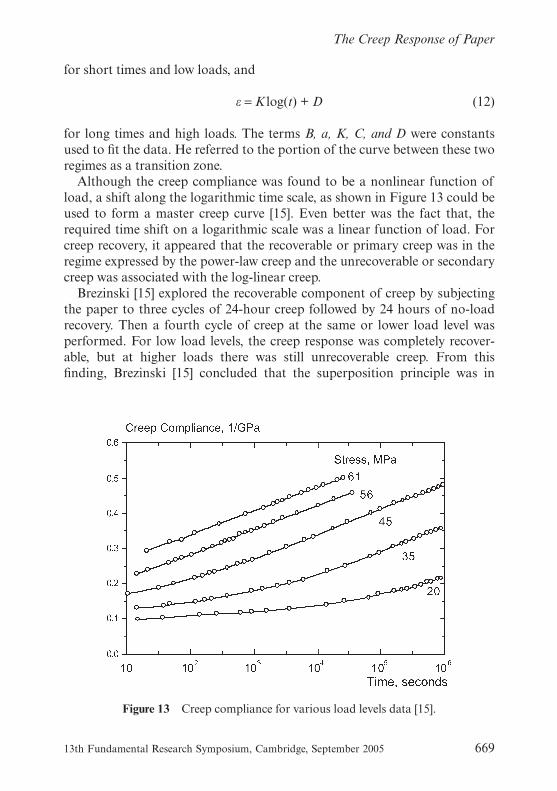
Although the creep compliance was found to be a nonlinear function ofload, a shift along the logarithmic time scale, as shown in Figure 13 could beused to form a master creep curve [15]. Even better was the fact that, therequired time shift on a logarithmic scale was a linear function of load. Forcreep recovery, it appeared that the recoverable or primary creep was in theregime expressed by the power-law creep and the unrecoverable or secondarycreep was associated with the log-linear creep.
Brezinski [15] explored the recoverable component of creep by subjectingthe paper to three cycles of 24-hour creep followed by 24 hours of no-loadrecovery. Then a fourth cycle of creep at the same or lower load level wasperformed. For low load levels, the creep response was completely recover-able, but at higher loads there was still unrecoverable creep. From thisfinding, Brezinski [15] concluded that the superposition principle was in
Figure 13 Creep compliance for various load levels data [15].
13th Fundamental Research Symposium, Cambridge, September 2005 669
The Creep Response of Paper
general not applicable to paper. Brezinski [15] did feel that superpositionmay be valid for low load levels where irrecoverable creep has not occurredbecause the creep curve and recovered creep curve superimposed with eachother.
Brezinski [15] also presented 24-hour isochronous creep curves for thevarious handsheets. The effect of increased beating and wet-pressing was ashift in the creep compliance such that higher load levels were required toobtain the same deformation. Wet-pressing alone did not appear to alter theamount of recoverable creep, but increased refining did appear to have aslight increase in the amount of recoverable creep. From these results, itappears that the effect of changes in bonding can be accounted for by a shiftin apparent load level, but fiber changes result in a new shape of the creepcompliance curve.
As one would expect, Brezinski found that by increasing the moisture con-tent, the creep compliance increased. His 24-hour isochronous curves showthat increasing the moisture causes a large shift to lower loads at any givenstrain. Brezinski uncovered much more interesting interactions with moisturechanges. First Brezinski found that the creep properties versus moistureexhibited a break somewhere between 50–60% RH (7.4–8.5% moisture). Aplot of creep deformation versus relative humidity, Figure 14, shows thebreak point.
Brezinzki tested unconditioned sheets that remained at low moisture afterdrying and conditioned sheets that had been exposed to 97.8% relativehumidity for 48 hours before conducting creep tests at various moisture con-tents. He found that for tests conducted in sheets at lower moisture contents(something less than 8%) specimens never exposed to high moisture crept lessthan those that had been pre-conditioned with exposure to high moisture.This observation suggests that exposing samples to high moisture removesprevious hardening in the paper. Of most interest is that prior to conditioninghe could not form a master creep curve, but after conditioning the curvescorresponding to different moisture contents could be shifted with a loga-rithmic time shift to form a master creep curve. For these pre-conditionedsheets, the slope of the logarithmic creep appeared to be independent ofmoisture content.
Figure 14 shows the total creep as a function of relative humidity and acreep strain that is termed the delayed creep. The delayed creep is the creepthat accrued between 10 seconds and 24 hours. The graph shows that theunconditioned samples were hardened as compared to the preconditionedsamples, but at relative humidity above the break point, the delayed-creepwas actually greater than the conditioned sample. This increase in the delayedcreep was credited to a release of dried-in strains. At higher moisture con-
670 Session 4: Network Deformation and Failure
D.W. Coffin

tents, more of the strain was released, adding to the total creep. The harden-ing effects were removed.
Finally, Brezinski [15] looked at recovery that occurred when a previouslycrept sample was exposed to high moisture content. Samples were first pre-conditioned to remove the dried-in strains and the breaks in the creep curves.Then a specimen was crept at 50% RH for 24 hours and allowed to recoverstrain for 7 days. Then the sheet was exposed to 97.8% RH for 24 hours withno load. The total strain after each step is shown below.
All but 0.05% of the strain was recovered. The process was repeated threemore times with almost compete recovery. Brezinski [15] states that most ofthe recoverable strain was strain that occurred before the onset of logarithmiccreep. A part of the logarithmic creep was recoverable, but the bulk of thiscreep was not recoverable.
Figure 14 The influence of relative humidity and pre-conditioning on creep ofpaper [15].
Initial Creep → After Recovery → After High MoistureTotal Strain: 1.13% 0.51% 0.05%
13th Fundamental Research Symposium, Cambridge, September 2005 671
The Creep Response of Paper

Shortly after the work of Brezinski [15], Shultz [16], Sanborn [17], andParker [18] published additional work on the creep of paper. Shultz [16]investigated the effect of the degree of wet straining on the creep response ofpaper. Typical of the stiffening effect of wet-straining on mechanical proper-ties, he found that increased degree of wet-straining decreased the creep com-pliance to as shown in Figure 15.
At some level of wet-straining, the creep compliance reached a minimum.For wet-straining beyond this level, the creep compliance again increased.For the data shown in Figure 15, the minimum creep compliance occurred atthe 5% wet-straining value.
Figure 16 shows the 24-hour total creep strain, the tensile strength, and thestretch as a function of degree of wet straining for another of the pulps testedby Schultz [16]. The degree of wet-straining where the creep was a minimumcorresponded to the degree of wet-straining where the tensile strengthreached a maximum. Tensile strength shown in Figure 16 is equal to the massspecific stress in units of length multiplied by the density of cellulose.
One of the more interesting findings of Shultz [16] was that for many of his
Figure 15 Influence of wet-straining on the tensile creep response of paper [16].
672 Session 4: Network Deformation and Failure
D.W. Coffin

pulps, there was a direct relationship between the amount of creep recoveryand the total first creep regardless of the amount of wet-straining or loadlevel. In addition, the effect of refining on this relationship was minimal.Shultz concluded that wet-straining the sheet and drying that imposed straininto the sheet, only changes how stress is distributed through the network.After drying the sheet under strain, the sheet carries load more efficiently, somuch so that even though the degree of bonding decreased with wet-strainingthe load carrying capacity of the sheet increased. In addition to altering theefficiency of the network it is likely that the fiber properties themselves arealtered by wet-straining. Shultz [16] did not investigate the effect of moistureor preconditioning, which given the observations from Figure 13 would havebeen interesting.
In order to differentiate inter-fiber versus intra-fiber mechanisms for creep,Sanborn [17] studied changes in the structure of paper due to creep. He foundgood correlations between the amount of irreversible creep and increases inlight scattering, and increases in air permeability. Therefore, he concludedthat creep induces loss of inter-fiber bonding. He also studied the energy loss
Figure 16 Effect of wet-staining on Total creep strain [16].
13th Fundamental Research Symposium, Cambridge, September 2005 673
The Creep Response of Paper

during creep and recovery and concluded that appreciable portions of thedissipated energy likely come from within the fiber.
Parker [18] also tried to determine if creep was dominated by inter- orintra-fiber mechanisms. He produced handsheets at different wet pressinglevels for pulps treated with different concentrations of aqueous ethylamine.The ethylamine changed the fibers as observed by decreases in the crystallin-ity index and the zero-span tensile strength, but also induced changes in thestructure and probably the degree of bonding. An interesting finding ofParker’s is that he could not form master creep curves for paper made frompulps that had undergone drops in crystallinity. These same pulps hadmore recoverable creep for a given amount of total creep. Thus, Parkerconcluded that at least some of the creep behavior is attributable to intra-fiber effects.
Hill [19] conducted creep tests on single fibers in tension. The basic creepresults for single fibers are similar to that of paper. Although he could notdetermine a mathematical model for the initial creep response, the high load/long time creep was linear with the logarithm of time. In addition, there wasrecoverable and unrecoverable creep.
From these initial creep studies [15–19] a good foundation of the creepresponse of paper emerged. Clearly both intrinsic material properties andstructure influence the creep response. It appears that the basic creepresponse is a result of the materials and structure of the fibers (intra-fibereffects) where as bonding and network structure (inter-fiber effects) tend toshift the basic creep curves to other time scales or load levels. The followingbullets summarize these early findings for tensile creep.
• A characteristic of primary and secondary tensile creep in paper is decreas-ing creep rates with time.– Primary creep rate decreases inversely to time raised to a power less than
one (∝ 1 / t1−a).– Secondary creep rate decreases with the inverse of time (∝ 1 / t).
• Creep compliance of paper is a nonlinear function of load.– Change in load effect is equivalent to a logarithmic shift in time.
• A master creep compliance curve can be formed.• Previous straining of paper produces mechanical hardening
– If wet-straining exceeds a critical value creep compliance increases.– Previous creeping induces hardening
• Increased moisture increases creep compliance.– The effect of moisture on secondary creep is a logarithmic time-shift.
• Hardening effects can be reduced or eliminated by exposure to highmoisture.
674 Session 4: Network Deformation and Failure
D.W. Coffin

• The inherent creep response of paper appears to be primarily that of intra-fiber creep.
• Inter-fiber bonding will influence the creep response in a manner equiva-lent to that of a shift in load or time.
A change of atmosphere for creep research
After these early researchers laid an excellent foundation for the creepbehavior of paper [15–19], a Ph.D. student at NC State carried out an investi-gation that literally created a completely new atmosphere for the study ofcreep in paper. In the early seventies, Byrd [20] studied the influence of cyclichumidity on creep. This work marks a turning point. Byrd’s results triggereda realization for the packaging industry that they had not been studying theworst case scenario to evaluate box lifetime. It brought about new interest incompressive creep testing, and it brought on much speculation on mechan-isms for the influence of moisture on creep.
Byrd discovered that paper experienced more creep deformation in anenvironment of cyclic moisture compared to creep at constant high moisture.This was counterintuitive and it captured the attention of many researchers.The same phenomenon had already been studied in other materials andreported as early as 1942 for concrete [21] and 1960 for wood [22], but a goodunderstanding of the cause of this phenomenon was lacking. The increasedcreep rates during cyclic humidity along with several other related and seem-ingly bizarre couplings between moisture and mechanical response werelabeled the mechanosorptive effects. Accelerated creep or mechanosorptivecreep were the names given to this cyclic moisture-induced increase in creeprates.
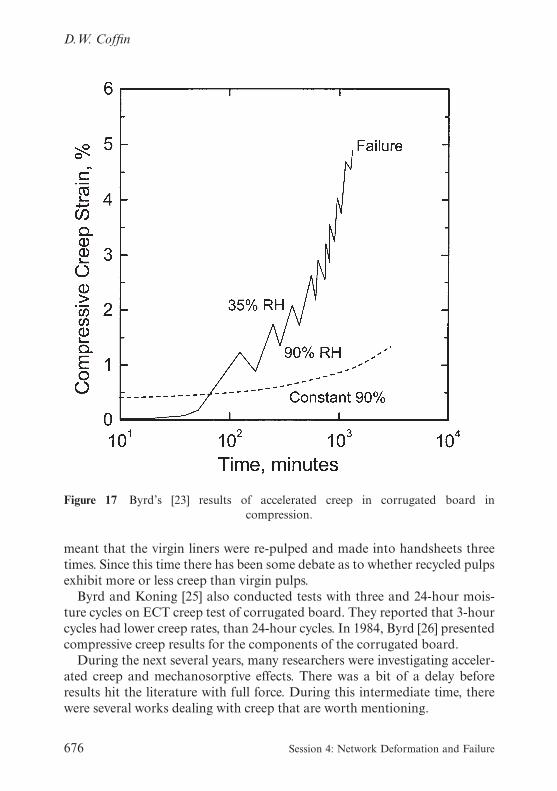
Byrd showed that accelerated creep occurred both in tension for hand-sheets [20] and edgewise compression for corrugated board [23] as shown inFigure 17. Shortly after Byrd’s publication, De Ruvo et al. [24] reportedstudies showing that the time of failure during creep, or lifetime was shorterfor cyclic humidity conditions than constant humidity conditions.
After Byrd’s discovery of accelerated creep in paper, which of courseshould have been determined much earlier given the reported observation ofother materials [21, 24], research emphasis on the mechanosorptive effectssteadily grew. Bryd continued to conduct studies of accelerated creep for bothcorrugated board, and paperboard. In 1978, he and Koning [25] presentedresults comparing constant and cyclic humidity creep rates for corrugatedboard made from liners produced from various pulp types. They reportedthat creep rates for board with liners made from virgin pulp were lower thanthe rates for board made from liners using a “recycled” pulp. By recycled they
13th Fundamental Research Symposium, Cambridge, September 2005 675
The Creep Response of Paper
meant that the virgin liners were re-pulped and made into handsheets threetimes. Since this time there has been some debate as to whether recycled pulpsexhibit more or less creep than virgin pulps.
Byrd and Koning [25] also conducted tests with three and 24-hour mois-ture cycles on ECT creep test of corrugated board. They reported that 3-hourcycles had lower creep rates, than 24-hour cycles. In 1984, Byrd [26] presentedcompressive creep results for the components of the corrugated board.
During the next several years, many researchers were investigating acceler-ated creep and mechanosorptive effects. There was a bit of a delay beforeresults hit the literature with full force. During this intermediate time, therewere several works dealing with creep that are worth mentioning.
Figure 17 Byrd’s [23] results of accelerated creep in corrugated board incompression.
676 Session 4: Network Deformation and Failure
D.W. Coffin
The lull after the discovery
In order to quantify the effect of cationic starch on filled papers, Lindströmet al. [27] measured creep lifetime as a function of load and then determined astress concentration factor that accounted for the loss of lifetime with fillercontent and improved lifetime with starch addition. It is noteworthy, thatLindström et al [27] attribute increased creep compliance to stress concentra-tions in conjunction with activation energy.
Byrd [28] conducted a study of accelerated creep in lap joined paperboardspecimens and found that creep rates when a water-sensitive adhesive (PVA)were three times those of just the paperboard or when a water-resistantadhesive (Cellulose Nitrate) was used. Thus, he felt that adhesive may play animportant role in the creep of corrugated board.
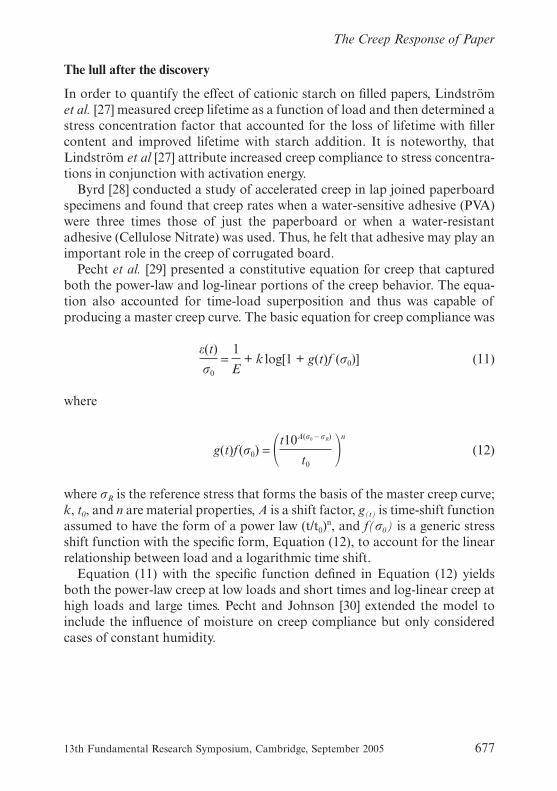
Pecht et al. [29] presented a constitutive equation for creep that capturedboth the power-law and log-linear portions of the creep behavior. The equa-tion also accounted for time-load superposition and thus was capable ofproducing a master creep curve. The basic equation for creep compliance was
ε(t)
σ0
=1
E+ k log[1 + g(t)f (σ0)] (11)
where
g(t)f(σ0) = �t10A(σ0 − σR)
t0�
n
(12)
where σR is the reference stress that forms the basis of the master creep curve;k, t0, and n are material properties, A is a shift factor, g(t) is time-shift functionassumed to have the form of a power law (t/t0)
n, and f(σ0) is a generic stressshift function with the specific form, Equation (12), to account for the linearrelationship between load and a logarithmic time shift.
Equation (11) with the specific function defined in Equation (12) yieldsboth the power-law creep at low loads and short times and log-linear creep athigh loads and large times. Pecht and Johnson [30] extended the model toinclude the influence of moisture on creep compliance but only consideredcases of constant humidity.
13th Fundamental Research Symposium, Cambridge, September 2005 677
The Creep Response of Paper

The hay-day of accelerated creep
In the 1990s research focusing on accelerated creep flourished. Starting in1992, five international symposia [31–35] were held with a focus on moistureeffects on paper and paperboard. The mechanosorptive behavior of paperwas a major theme of these meetings. The first meeting [31] held in 1992 at theForest Products Laboratory in Madison, WI, USA dealt entirely with pack-aging and accelerated creep. At this conference, Selway and Kirkpatrick [36]presented their views of mechanisms for accelerated creep in terms of amodel for plastic ratcheting. They provided a statement about creep ratchet-ing caused by transient stresses and nonlinear dependence of creep rate onload.
Söremark and Fellers [37, 38] introduced the idea of dislocations andstress-induced hygroexpansion. They also discuss stress-redistribution duringmoisture changes. Calvin [39] discussed a rapid method for predicting lifetimebased on results of constant load rate tests.
Figure 18 Differences in tensile and compressive creep isochronous curves forconstant and cyclic humidity [40].
678 Session 4: Network Deformation and Failure
D.W. Coffin

The year after this first “creep conference” the 10th Fundamental ResearchSymposium held at Oxford, UK contained three papers that dealt withaccelerated creep [40–42]. At that conference, Söremark et al. [40] presentedtheir work on creep in bending of corrugated board to discuss the effect ofdrying and fiber orientation. Besides testing single wall corrugated board,they made special board where they substituted one of the liners with steelribbons. By looking at the bending creep of this composite sample, they wereable to isolate the creep of the paperboard liner in either tension orcompression.
Söremark et al. [40] also advocated the use of isochronous creep curves forcharacterizing creep behavior for both constant and cyclic moisture condi-tions. In general, they found that for short times, the creep behavior was thesame in tension and compression and fairly linear in the response to load inconstant humidity. In cyclic humidity, the compressive creep had lower creepstiffness than tensile creep. Figure 18 displays isochronous curves demon-strating this. Figure 19 demonstrates that MD creep is lower than CD creep in
Figure 19 Effect of MD/CD orientation on isochronous curves for constant andcyclic moisture on creep [40].
13th Fundamental Research Symposium, Cambridge, September 2005 679
The Creep Response of Paper
both constant and cyclic moisture conditions. They also found that sheetsdried under restraint exhibit less creep than freely dried sheets for both con-stant and cyclic humidity conditions.
Another paper presented on creep at the 10th FRC, authored by Padanyi[41], dealt with a new observation on the creep behavior of paper. Padanyipretreated his sheets in either a high or low humidity environment until mois-ture equilibrium was achieved, and then placed the samples in a 50% RHenvironment. After moisture equilibrium was achieved, aging time wasallowed to pass before the creep test was begun. He found that the creepcompliance decreased as aging time increased. He likened this to physicalaging observed in polymers which have been brought from a temperatureabove glass transition to a temperature below glass transition. Even after thetemperature has equilibrated, the sample is not in thermodynamic equi-librium and the material exhibits increased creep rate. As the material ages,the creep rate decreases. He suggested that this may have ramifications toaccelerated creep. The explanation given by Padanyi [41] is not satisfyingbecause as shown in Figure 20 (b) even exposures to low relative humiditycaused some de-aging and aging effects. This effect is probably related to thatobserved by Brezinski [15] of change in creep compliance after exposure tohigh moisture and the recovery of strain upon moisture cycling.
The last paper with significance for creep in the same transactions was thatof Haraldsson et al. [42]. They presented a new device for conducting creeptests of paperboard in either tension or compression. One of the main focusesof research on creep had been to develop methods to conduct creep in edge-wise compression while suppressing any lateral buckling. Their results showthat at low load levels the tensile and compressive creep response is the same,but at high load levels there is more creep in compression. In addition, theyfound that in compression the strain at failure was the same for creep tests atdifferent load levels and equal to the strain of failure from a compressiveconstant strain rate test. This is important because it suggests that the strainat failure can be used as a criterion for lifetime. Haraldsson et al. [42] utilizedisometric curves to show lifetime as a function of load-level.
The second creep conference was held in 1994 at STFi in Stockholm, Swe-den. This is the meeting where Sedlachek and Ellis [43] reported that there isno accelerated creep in single fibers tested in axial tension. Haraldsson et al.[44] presented further results on their model for the lifetime of boxes inconstant humidity based on the observation that the strain at break is con-stant, and using isometric curves, curves of stress versus time for constantcreep strain, to predict the time of failure at low load levels from high loadlevel tests. They also advocated the use of isochronous creep curves to evalu-ate performance. Forsberg [45] continued the previous work of Calvin [39]
680 Session 4: Network Deformation and Failure
D.W. Coffin

and her results show that the large variability in results make it hard topredict lifetime based on short term results. Bronkhorst and Riedmann [46]introduced the simple equation given on Equation (13) that the lifetime of abox was inversely proportional to the secondary creep rate.
Figure 20 Physical aging of paper for both de-aging at high moisture (a) and de-aging at low moisture (b) [41].
13th Fundamental Research Symposium, Cambridge, September 2005 681
The Creep Response of Paper
Lifetime =A
secondary creep rate(13)
In 1997, the third meeting was held at PAPRO in Rotorua, New Zealand.Coffin and Boese [47] confirmed that single pulp fibers in tension do notexhibit accelerated creep and ascribed this to the fast sorption time of indi-vidual fibers. They also put forth a mechanistic explanation of acceleratedcreep based on stress concentrations and nonlinear creep behavior that sup-ported the single fiber observations. Jackson [48] also showed that rayonfibers did not exhibit accelerated creep. Haraldsson et al. [49] extended theuse of isochronous curves for cyclic humidity testing of boxes in compres-sion. It is interesting to note that at this conference only about half of thepapers dealt directly with creep, as compared to 100 percent for the firstconference.
The fourth creep conference was held in Grenoble, France in 1999. Chalm-ers [50] presented creep results using a vacuum compression tester and foundthat both load and creep rate could be used to predict lifetime. He found thatthe hygroexpansion could be separated from the creep in compressive creeptests, when the sample was exposed to cyclic humidity before the applicationof creep load. The hygroexpansion was lower under compression than underno load. Coffin and Habeger [51, 52] presented a detailed model of acceler-ated creep that could explain all observed phenomena. Jackson et al. [53]presented a ring crush creep test. Haraldsson and Fellers [54] presentedresults that showed that increased density and straighter fibers increasedcreep stiffness. Micro-compressions in virgin fibers reduced stiffness, but hadlittle effect with recycled fibers. Vullierme et al. [55] introduced a new devicefor measuring compressive creep in variable humidity environments by form-ing the paper into a rolled cylinder. As one can see this was an excitingconference for those interested in accelerated creep and the feeling at thisconference was that 30 years of research were starting to pay off.
In 1999, Patel [56] presented a nonlinear model for creep of paper andcorrugated board. He conducted creep and recovery tests on corrugatedboxes. He found that the Schapery model, a nonlinear viscoelastic super-position functional, was capable of fitting creep and recovery data, andapplied it with the finite-element method to model board in conditions ofconstant humidity.
Many of the papers written on accelerated creep put forth explanations forthe causes of accelerated creep [37, 41, 55–60]. One can refer to [61] for adiscussion of the proposed mechanisms. Everything from thermodynamicexplanations, to glass transitions, to fiber bond slipping was suggested.Elements of certain explanations were appealing, but for the most part these
682 Session 4: Network Deformation and Failure
D.W. Coffin
explanations could not fully explain all the observations that had been made.The approach that Habeger and Coffin [47, 51, 52] had been developing onthe mechanics of accelerated creep was published in 2000 [62]. They put fortha physical explanation for accelerated creep and showed through the use of asimple model that accelerated creep was a natural consequence of two inter-connected events that occur during creep in cyclic humidity. This mechanismcould also explain other mechanosorptive effects [63]. Some of the basic ideasput forth in their explanation can be gleaned from previous literature. Thefirst observation in that the total deformation under the action of a cyclicload is greater than the creep due to the application of the mean load. Thesecond is that changes in moisture content give rise to stress gradients (not auniform distribution of the dead load). During creep in cyclic humidity thestress at any given point will be cycling. The overloaded regions contributemore to creep than that which is suppressed by the under-loaded regions. Thenet effect is an acceleration of creep during and for some time after a changein moisture. A model based on this explanation yielded accelerated creep,Padanyi’s physical aging [62], and transients in the dynamic mechanicalproperties [63].
The last of the creep conferences was held in Marysville, Australia in 2001.Unfortunately, the proceedings have not been published, but several of thepapers from that meeting were forwarded to the author for this review.Chalmers et al. [64] presented a study of creep of corrugated board in bend-ing under conditions of cyclic humidity. They had success using the Pechtmodel [29] to fit the creep curves through the local minima of the creep data.The model worked well for predicting the creep at different load levels. VanWeert and Donkelaar [65] presented a finite-element model for both the mois-ture transport and creep in cyclic moisture. They utilized a nonlinear diffu-sion model for moisture transport and a nonlinear creep equation. The modelpredicted accelerated creep via the mechanism outlined in [62]. Both thesemodeling approaches have their advantages. The advantage of the approachtaken in [64] is that it is simple and can be used to rank different papers. Theadvantage of the work presented in [65] is that it is fundamental and theaccelerated creep is a natural consequence of the material properties, creepload, and cyclic moisture changes.
After this conference the mystery and intrigue that had been associatedwith accelerated creep was greatly diminished. A reasonable explanation foraccelerated creep had been demonstrated to explain all observations. Interestin the subject subsided. There has been no outcry for another conference, andthe lack of publication of the last proceedings seems to be indicative ofthe end of a chapter on creep in paper. The newest chapter is even moreinteresting and still challenging. The need to improve box lifetime still exists.
13th Fundamental Research Symposium, Cambridge, September 2005 683
The Creep Response of Paper

Understanding why accelerated creep occurs does not solve the practicalproblems. We still do not have sufficient knowledge to overcome acceleratedcreep. If we accept the simple explanation for accelerated creep, we haveessentially broken the mechanosorptive effects back into separate mechanicalmoisture effects that can be studied independently and then re-coupled forthe case of cyclic moisture.
Recently, Alfthan et al. [66] furthered the understanding of acceleratedcreep by developing a network model based on the earlier proposed mechan-ism [62]. They showed that the magnitude of the stresses created by aniso-tropic swelling of crossing fibers was sufficient to cause accelerated creep inpaper. This development creates the opportunity to obtain understanding ofhow the network structure influences accelerated creep.
Olsson and Salmén [67] investigated creep in paper by evaluating changesin the dynamic modulus and mid to near IR spectra during creep in bothconstant and cyclic humidity. They found that the dynamic modulusincreased with creep strain in both environmental conditions. This trendalong with the results of the IR measurements suggests that the cellulosestructure is re-aligned during creep. The IR results did not show any molecu-lar differences in samples creep in either constant or cyclic relative humidity.
Urbanik [68] presented a new approach to model the creep behavior ofpaper that combines results of previous work and accounts for primary, sec-ondary, and tertiary creep in compression. He first described the rates ofcreep for each component in terms of functions and then integrated to getcreep strain. Although the equations Urbanik used are complicated, theapproach is simple and work of this type may lead to equations that can beused to evaluate accelerated creep in boxes.
In 2002, Zhang et al. [69] confirmed many of the observations of Brezinskisuch as the ability to form master creep curves and the effects of wet pressingand beating. They advocate using the normalized creep compliance (creepcompliance multiplied by elastic modulus), which they call the creep numberto evaluate creep behavior. They evaluated the creep response of sheet madefrom three pulp types, one was high in hemicellulose, one was a sulphate(alpha) cellulose, and the third was a high yield kraft pulp. The creep responseof these three pulps differed. Specimens made from the pulp with high lignincontent crept the least, but it is not clear that this is due to the lignin ordifferent forms of the cellulose in the pulps. Since this sheet has a tensileindex that is almost twice that of the alpha pulp. Several methods of dryingwere used to make the sheets that included standard handsheet drying, cylin-der drying, a hot-air impingement drying, and combinations of cylinder andimpingement drying. Drying with high temperatures appeared to reduce thecreep response of the lignin containing pulp as well as the pulp containing
684 Session 4: Network Deformation and Failure
D.W. Coffin

high hemicellulose. The authors concluded that there were no systematicchanges to the creep responses based on drying conditions.
At the 2003 paper physics conference, Lehti et al. [70] presented results onthe effect of moisture on creep. They verified the results of Brezinski [15] thatthe effect of moisture could be treated with logarithmic time shift that was alinear function of moisture content. They also showed that the CD creep wasgreater than the MD creep, but that the time-shift was only slightly larger.Their creep curves were fit using a power-law.
At the same conference, Westerlind et al. [71] presented an extensive studyof the effect of strength additives on the mechanical properties of paper. Thisincluded CD compressive creep data for tests on cylinders carried out in acyclic humidity environment. The results showed that the compressive loga-rithmic creep rate in CD was inversely proportional to the product of the CDspecific longitudinal stiffness, Ccd, and the CD specific transverse shear stiff-ness, Czd-cd, as measured by ultrasonic methods. Using the data supplied intheir tables, the inverse proportional relationship as shown in Figure 21 wasobtained. (Note, Westerlind et al. [71] state that the relationship to related tothe square root of the geometric mean stiffness, but the re-analysis as
Figure 21 The logarithmic compressive creep rate versus inverse ultrasonic stiffnessparameter [71].
13th Fundamental Research Symposium, Cambridge, September 2005 685
The Creep Response of Paper
presented here shows that it should have been stated as the square of thegeometric mean stiffness.) This geometric stiffness term was chosen by West-erlind et al. [71] because the analysis and experimental results of Habeger andWhitsitt [72] showed that the short-span compressive strength of paper wasdirectly proportional to this term and related to the shear instability of thelayered structure. The creep rate should be related to this stiffness terminversely and the square relationship implies that that the creep rate is moresensitive to changes in this term than strength.
Since accelerated creep is just creep accentuated by a transient stressconcentration, a better understanding of the inherent creep behavior ofpaper would be useful. This is work that was put on hold for 30 years. Priorto the discovery of accelerated creep, there were great gains in understand-ing the creep of paper. After that time until just recently, the gains were allmade on developing experimental methods, clarifying observations, andstating general trends, but there was little progress in understanding thecreep behavior of paper. Since 2000, there again have been new gains made[66, 69–71, 74]. The research direction has once again changed backtowards an understanding of creep. For example, at the 2004 Progress inPaper Physics Meeting, DeMaio and Patterson [73] presented preliminaryresults of tensile creep testing under constant humidity on samples where hevaried the degree of bonding through wet-pressing in a regime where themodulus was constant. These results showed that the same master creepcurve was obtained for sheets with different amounts of bonding and theincreased bonding only tended to increase the strain at which tertiary creepinitiated. This is the type of work that is needed to further ourunderstanding.
Panek et al. [74] recently addressed the practical methods of evaluation forcreep in both constant and cyclic humidity. As they point out, there have beenmany different techniques used to evaluate creep. Some researchers used totaldeformation while others consider only the creep strain. Both master andisochronous curves are used. Lifetime, creep rates, ratios of creep rates, creepcompliance and creep stiffness have all been used to characterize creep.
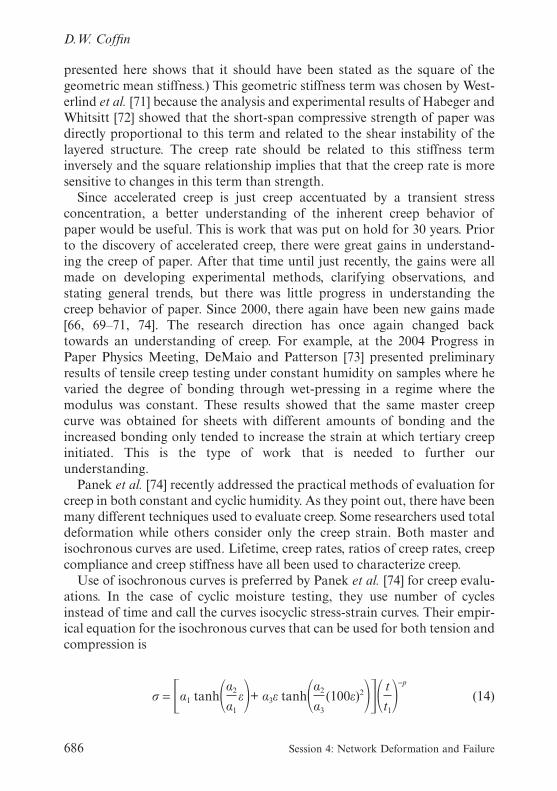
Use of isochronous curves is preferred by Panek et al. [74] for creep evalu-ations. In the case of cyclic moisture testing, they use number of cyclesinstead of time and call the curves isocyclic stress-strain curves. Their empir-ical equation for the isochronous curves that can be used for both tension andcompression is
σ = �α1 tanh�α2
α1
ε�+ α3ε tanh�α2
α3
(100ε)2��� t
t1�
−p
(14)
686 Session 4: Network Deformation and Failure
D.W. Coffin

where α1, α2, α3 are fitting parameters, and t1 is a reference time of 1 sec. Thefirst term in the equation represents the small strain response and the secondterm in the equation represents the large strain response. The form of Equa-tion (14) implies that the isochronous curves for different times are onlyscaled or that the parameters must be functions of time. Panek et al. [74]present six different parameters taken from the isochronous and isocycliccurves that can be used to characterize material parameters. This work pres-ents many good ideas for one trying to characterize and compare the creepresponse of different materials.
There is still much we do not know about creep. The current trend towardsinvestigating the fundamental creep response of paper will help in our effortsto improve product performance. The work being developed on methods ofcharacterization will help in sorting out the creep response of differentmaterials. Yet there remain insights into the creep behavior of paper found inthe existing literature that have not been thoroughly exploited.
In the following sections, we will explore some of this information. In thesection entitled “Tensile Creep,” we will take the view of an engineer anddetermine how to express the effect of various parameters on tensile creepalbeit with a very elementary equation. The results of this work were eye-opening for the author and hopefully the beauty the systematic nature of thetensile creep response of paper will be conveyed to the reader. After a thor-ough discussion of tensile creep, we focus on how compressive creep differsfrom tensile creep. Finally, we emphasize the mechanical explanation ofaccelerated creep, how the evidence in the literature supports this simple view,and stress that the whole mechanosorptive phenomena has received too muchattention at the expense of basic understanding of creep under constantconditions.
TENSILE CREEP
For our discussion of tensile creep, we will use a simple empirical equationthat captures the essence of the tensile creep. This equation comes with itsown warning, and is only introduced so that we can evaluate the effects ofvarious parameters such as load, degree of wet-pressing and wet-straining onthe creep behavior. In addition, it was the equation used to produce the linesshown in the graphs of this section. For the present discussion, this numericalcreep response is used to complement the experimental results so that we canextrapolate the experimental findings and explore the general behavior of thetensile creep of paper. The extrapolations taken here do not go far beyondwhat we can surmise from the literature, but it does provides a framework to
13th Fundamental Research Symposium, Cambridge, September 2005 687
The Creep Response of Paper

unify the trends and findings of individual results from the literature andmake general statements that can be confirmed or refuted with futureexperimental results.
As previously mentioned, Brezinski [15] conducted one of the earliest stud-ies of creep in paper, and it is probably the most complete study of tensilecreep under conditions of constant humidity. Therefore, we start with thisdata to provide the root input for our numerical model. Figure 22 shows thenumerical representation of Brezinski’s creep data [15], which is comparableto Figure 13, but shown as the creep compliance normalized with the elasticmodulus. In this section, the units of stress are taken as an apparent stressequal to the mass specific stress multiplied by the density of cellulose.
Figure 22 (b) shows the creep data plotted on a linear scale to accentuatethat the creep rate continues to decrease with time. When a dead load, isapplied suddenly, the deformation increases dramatically, then the creep ratecontinues to decrease towards zero, but before it reaches failure the creep rateonce again will begin to increase signaling tertiary creep. Brezinski [15] neverobserved a tertiary creep response in his testing, which suggests that for histests any creep-rate increase, signaling the onset of failure, occurred at veryshort time intervals and was not measured. Tertiary creep in tension is typic-ally very short in duration. Throughout the literature, there is very littleevidence of tertiary creep in tension. Creep curves obtained from A. DeMaioat IPST-GIT, are illustrated in Figure 23. Creep versus time curves are givenfor two samples. Both samples were subjected to a tensile load equivalent to75% of the tensile strength of the paper and conducted at constant 50%relative humidity. Both samples show tertiary creep. The tertiary creep begins
Figure 22 Representation of Brezinski’s creep data [12] as the product of initialmodulus and creep compliance (a) time is a logarithmic scale, (b) time is a linear scale.
688 Session 4: Network Deformation and Failure
D.W. Coffin

about ten minutes before failure a small time relative to a lifetime of aboutfive hours. The tertiary strain was only 0.0005 greater than the total strain ofabout 0.0355. Since the amount of tertiary strain is small and the relativelapse in the logarithm of time is short, we will exclude tertiary creep in thissection.
Empirical tensile creep equation
The equation used for creep is entirely empirical and was developed for use inthis review. The Pecht [29] equation, Equation (11) was not used because itdoes not separate primary from secondary creep. Panek’s [74] equation,Equation (14) was not utilized because the inversion to get a creep equationin not straightforward. Urbanik’s [68] equations are written for compressionand therefore also were not used. A nonlinear heredity integral possibly couldhave been utilized but the point of this entire exercise would have been lost inthe expression of the functional.
First, assume that the initial deformation is an instantaneous linear-elasticdeformation, εi−e, given as
Figure 23 Example of tertiary creep in paper. Data provided by A. DeMaio (2005).
13th Fundamental Research Symposium, Cambridge, September 2005 689
The Creep Response of Paper
εi−e =1
Eσ (15)
where E is the elastic modulus, and σ is the applied dead load written asstress. The modulus can be taken as that measured from a standard tensiletest. Therefore, this term captures all the viscoelastic response of the materialthat occurs at times shorter than the initial measurements.
The expression for the primary or delayed-elastic creep is based on theobservations of Brezinski [15] that the initial creep exhibits an allometric orpower-law response, but that there is a limit to the amount of primary creep.Therefore, the primary creep is written as a delayed elastic response, εd−e,expressed as
εd−e =σ
E2
(1 − e−atα
) (16)
where E2 is an elastic modulus of the delayed response, a is a time scalingfactor representing flow, and α is the exponent of the power-law behaviorobserved for small times. Equation (16) can be thought of as a generalizationof a diffusion controlled creep process, where α = 1/2 would hold [3]. Thecreep given in equation (16) is taken to be fully recoverable upon unloading.For short times, equation (16) reduced to
εd−e =σ
E2
(atα), atα << 1 (17)
The secondary creep is also based on the observations of Brezinski [16] thatlong-term creep is linear with the logarithm of time, and expressed as
εs = σ(Bln(bt + 1) (18)
where B is a creep flow parameter and b time-scaling factor. For long times,Equation (18) is approximately
εs = σB[ln(t) + ln(b)], bt >> 1. (19)
The total strain is taken as a summation of the three strain components,Equations (15), (16) and (18). In addition, a modulus term is factored out ofE2 and B, and the total creep strain is given as
690 Session 4: Network Deformation and Failure
D.W. Coffin

ε =σ
E[1 + A(1 − e−atα
) + Bln(bt + 1)] (20)
or in terms of creep compliance
J =ε
σ=
1
E[1 + A(1 − e−atα
) + Bln(bt + 1)]. (21)
In Equations (21) and (22), A = E
E2
, and B = EB. Given Brezinski’s [15]
observation that the log-rate of secondary creep appears to be independentof moisture content, it is probably not reasonable to pull the modulus out ofB’, but it is done anyway for convenience.
Brezinski [15] found that the dependence of creep compliance on load wasproportional to a shift in the logarithm of time. To satisfy this requirement,the parameters a and b must be functions of load. The relationship betweenthe time shift and load is written as
ln(ts = β(σ − σref) (22)
where β is the slope of the line and σref is a reference load to which all theother creep curves are shifted. In order for the curves to shift with the loga-rithm of time from some time t1 to some time t2,
t2 = t1ts = t1eβ(σ−σref) = t1e
−βσref eβσ (23)
must hold true. To form a master creep curve, the shift must hold for all times,and thus the functions of a and b are written as
a = a0eαβσ and b = b0e
βσ (24)
where the reference state is incorporated into the terms a0 and b0. Thus, ourcreep compliance equation that satisfies time-load equivalence can be writtenas
J(t,σ) =ε
σ=
1
E[1 + A(1 − e−a0e
αβσta
) + B ln(b0eβσ t + 1)] (25)
Warning: Equation (25) is for educational purposes only. It is neitherfundamental to paper behavior nor applicable to any other deformationprocesses other than creep.
13th Fundamental Research Symposium, Cambridge, September 2005 691
The Creep Response of Paper

Equation (25) represents the numerical representation for the creep behaviorof paper. It has seven parameters, E, A, B, a0, b0, α, and β. This seems like alot of parameters but they are needed to adequately describe (1) elasticresponse, (2) primary creep with (3) variable activation and (4) allometricbehavior, (5) secondary creep, with (6) variable activation, and (7) load non-linearity. Once we fit this model to creep data, we can easily explore thetensile creep behavior of paper. For example, we generate isochronouscurves, investigate the amount of total strain versus recoverable strain, andevaluate the influence of the papermaking process or sheet structure on thesix parameters of the creep Equation (25), and with one more assumptionexplore lifetime.
The parameters used for the fit of Equation (25) to Brezinski’s data asshown in Figure 22 are
E = 1000 kg/mm2, A = 1.05, B = 0.7/ln(10), a0 = 10−2/s0.23, b0 = 10−9/s,
α = .23, and β = 1.42ln(10)m2/kg.(26)
Four of the seven values, E, B, α, and β were reported directly by Brezinski[15], except the B and β are adjusted to go from base 10 to natural logarithms.The value of B was taken from the limiting recoverable creep compliancegiven in Figure 6 of reference [15]. The final two terms a0, and b0 were thenchosen to give the appropriate time of activation to fit the master creep curve.
Now, armed with our creep equation we can begin to explore the tensilecreep behavior of paper. Figure 24 shows the isochronous creep curves cor-responding to creep response previously shown in Figure 22. The initial creepstiffness for each curve is equal to J(t,0). The creep stiffness drops as loadincreases. At high loads the slope of the curves are approximately equal andcontinue to drop. If tertiary creep were included, then at some level of strainthe slope would decrease faster.
The shape of the curves shown in Figure 24 is analogous to stress-straincurves for strain-hardening materials, which have no well-defined yield point.These curves are similar to that expressed by Panek’s [74] isochronous Equa-tion (14), but there are several differences. The effect of time for the curvesgiven in Figure 24 is not just a scaling factor as suggested by Equation (14).The inability to scale the curves in Figure 24 is due to the fact Equation (25)can not have the time dependence factored out separately. The distinctionhere would have consequences for modeling and the validity of the implica-tions of Equation (14) should be evaluated. The expectation based on theresults of Seth and Page [75] that stress-strain curves evaluated for differentstrain-dates do not superimpose, would be that isochronous curves for differ-ent times would not superimpose. The second difference is minor, but the
692 Session 4: Network Deformation and Failure
D.W. Coffin

slopes of the curves in Figure 24 continue to decay, whereas Equation (14)yields a limiting constant slope.
Recoverable deformation versus total deformation
The primary creep regime is characterized by recoverable creep deformation.At small times and low load levels much of the creep is recoverable. Brezinski[15] found that after 24 hours of creep the recoverable creep plotted againsttotal creep produced a curve that reached a limit as shown in Figure 25. Inthis figure, the recoverable creep and total creep are shown in dimensionlessform. Brezinski [15] noted that the log-linear creep was observed to beginwhen the primary creep began to level off and provides some justification forthe simple separation taken for the empirical equation.
Isochronous curves can also be used to show the difference between recov-erable and total deformation. Figure 26 shows the isochronous curve fromFigure 24 corresponding to t = 106 seconds. The curve also shows an isochron-ous curve for just the recoverable deformation, which includes the initial
Figure 24 Isochronous creep curves based on results of Brezinski [15].
13th Fundamental Research Symposium, Cambridge, September 2005 693
The Creep Response of Paper
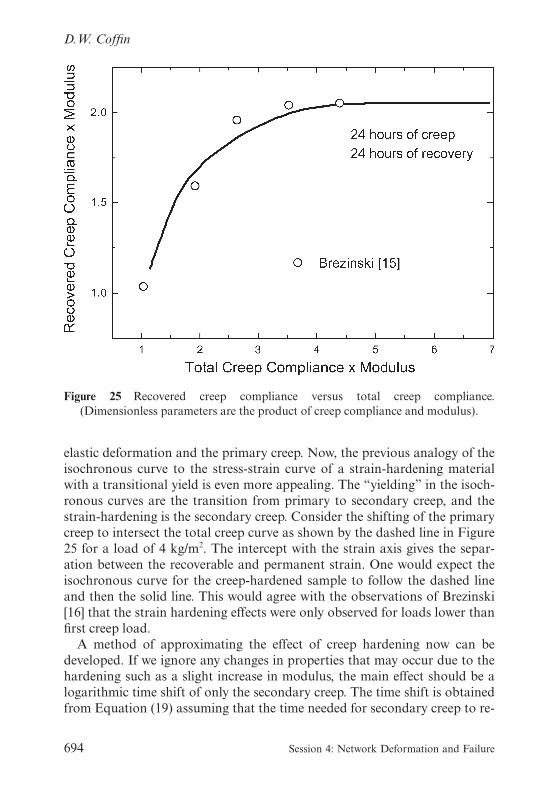
elastic deformation and the primary creep. Now, the previous analogy of theisochronous curve to the stress-strain curve of a strain-hardening materialwith a transitional yield is even more appealing. The “yielding” in the isoch-ronous curves are the transition from primary to secondary creep, and thestrain-hardening is the secondary creep. Consider the shifting of the primarycreep to intersect the total creep curve as shown by the dashed line in Figure25 for a load of 4 kg/m2. The intercept with the strain axis gives the separ-ation between the recoverable and permanent strain. One would expect theisochronous curve for the creep-hardened sample to follow the dashed lineand then the solid line. This would agree with the observations of Brezinski[16] that the strain hardening effects were only observed for loads lower thanfirst creep load.
A method of approximating the effect of creep hardening now can bedeveloped. If we ignore any changes in properties that may occur due to thehardening such as a slight increase in modulus, the main effect should be alogarithmic time shift of only the secondary creep. The time shift is obtainedfrom Equation (19) assuming that the time needed for secondary creep to re-
Figure 25 Recovered creep compliance versus total creep compliance.(Dimensionless parameters are the product of creep compliance and modulus).
694 Session 4: Network Deformation and Failure
D.W. Coffin
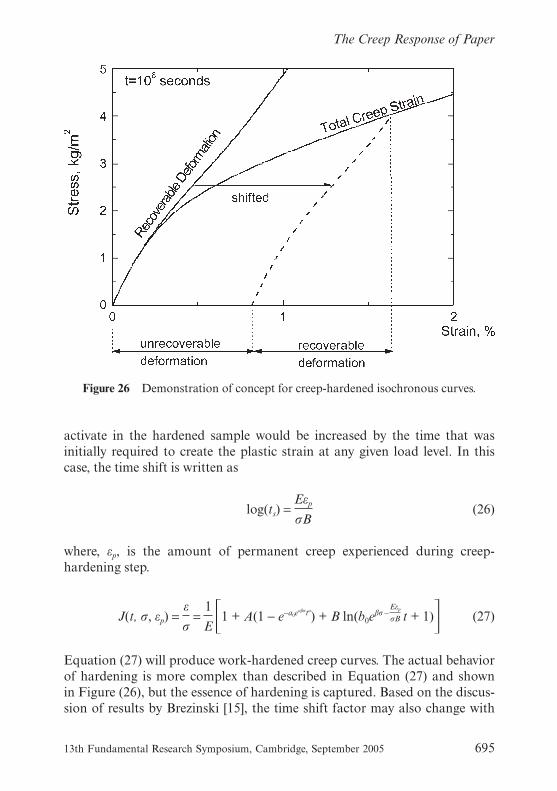
activate in the hardened sample would be increased by the time that wasinitially required to create the plastic strain at any given load level. In thiscase, the time shift is written as
log(ts) =Eεp
σB(26)
where, εp, is the amount of permanent creep experienced during creep-hardening step.
J(t, σ, εp) =ε
σ=
1
E �1 + A(1 − e−a0eαβσta
) + B ln(b0eβσ −
Eεp
σB t + 1)� (27)
Equation (27) will produce work-hardened creep curves. The actual behaviorof hardening is more complex than described in Equation (27) and shownin Figure (26), but the essence of hardening is captured. Based on the discus-sion of results by Brezinski [15], the time shift factor may also change with
Figure 26 Demonstration of concept for creep-hardened isochronous curves.
13th Fundamental Research Symposium, Cambridge, September 2005 695
The Creep Response of Paper

hardening. Further testing of creep-hardening is required to fully understandthe effects.
Wet-pressing
Brezinski’s isochronous curves for sheets wet-pressed to different levels areshown in Figure 27 (a) along with the empirical fits. Seth and Page [75]showed that the stress-strain curves of paper scaled with an efficiency factorif only bonding is changed. If we scale each of these curves by an efficiencyfactor of � = E/Eref, the isochronous curves collapse to form one curve asshown in Figure 27 (b). The term Eref, refers to the value of the modulus usedin the original fit as given in Equation (26). The parameter β could beadjusted to correspond with the case of maximum modulus, Eref = Emax, sothat the efficiency factor � = E/Emax has a maximum value of one �=E/Eref.This scaling of the isochronous curves implies that the effect of wet-pressingor degree of bonding on the creep curves can be accounted for with anefficiency factor that describes how well the network carries the load. It alsoimplies that the changes in bonding only change the amount of load carryingmaterial in the sheet and thus should be accounted for by only scaling theload by the ratio of elastic modulus, �. This factor � could be interpreted asa stress concentration factor, such that the real stress is the average stressdivided by the factor �.
The empirical creep compliance described by Equation (27) can easily bemodified to account for changes in sheet efficiency arising from bonding
Figure 27 Isochronous curves for different degrees of wet-pressing as observed bydifferent elastic modluii: (a) isochronous curves, (b) scaled isochronous curves. Open
circles are taken from [15]. Lines represent fit of Equation (29).
696 Session 4: Network Deformation and Failure
D.W. Coffin

simply by multiplying the stress by the factor �. Thus, Equation (27)becomes
J(t, σ, εp, �) =ε
σ=
1
E �1 + A(1 − e−a0eαβσ
� ta
) + B ln(b0eβσ
�
Eεp
σB t + 1)� (28)
or we can write the modulus in terms of the reference modulus and obtain
J(t, σ, εp, �) =ε
σ=
1
�E0�1 + A(1 − e−a0e
αβσ
� ta
) + B ln(b0eβσ
�
Eεp
σBt + 1)�. (29)
The lines shown in Figure 27(a) were evaluated using Equation (29) with themodulii reported by Brezinski [15] and given in the Figure 27(a). The otherparameters remained unchanged as given in Equation (22). The agreement isadequate, and we have captured the essential effect of changing bonding onthe pre-tertiary tensile creep response of paper. Although the last statementrequires many qualifiers it is quite a striking statement. In fact, it is worthrestating for emphasis. The effect of decreased bonding in the sheet isaccounted for simply by a magnification of the stress by the inverse of theefficiency factor.
The implication of this result is that sheets that are less efficient in carryingload will be more creep compliant because the creep curves will be shifted toshorter times. In addition, the increase in creep rates will be inversely pro-portional to the change in elastic modulus. If the product of creep compli-ance and modulus are plotted, the resulting curves for sheets with differentefficiency factors will only be shifted in time. The magnitude of the time shiftwill be inversely proportional to the efficiency factor. Figure 28 shows creepcurves for different efficiency factors using Equation (29) with the parametersgiven in Equation (22).
Wet-straining
Shultz [16] studied the effect of wet-straining, and some results were previ-ously shown in Figure 15 and 16. To understand the effect of wet-straining onthe creep response, the data was scaled to see if they could be shifted to amaster creep curve. By forming the product of creep compliance and elasticmodulus, the resulting curves could be shifted to form a master curve asshown in Figure 29. This implies that wet-straining can be described by boththe change in modulus and a logarithmic time shift. For the results of Shultz
13th Fundamental Research Symposium, Cambridge, September 2005 697
The Creep Response of Paper

[16] the time shift was linearly related to the degree of wet-straining. Thus,one can extrapolate back to zero wet-straining and obtain a shift factor that isproportional to the degree of wet-straining. This fit and extrapolation areshown in Figure 30. For Shultz’s results the change in elastic modulus withdegree of wet-straining could be approximated with a line and the resultingequation was
E = 36DWS + 625 kg/m2 (30)
where DWS is the degree of wet-straining in percent.Now the creep curve for zero wet-straining can be determined and is shown
in Figure 31.The effect of wet-straining is easily added to our empirical equation as
follows. Equation (29) was fit to the curve given in Figure 30 and the param-eters were obtained as
A = 1.4, B = 0.9/ln(10), a0 = 10−2/s0.26, b0 = 10−9/s, α = .26,
and β = 2.42ln(10)m2/kg, εp = 0.(31)
Figure 28 Creep curves for different network efficiency factors.
698 Session 4: Network Deformation and Failure
D.W. Coffin

The values of elastic modulus were given by Shultz [16] for the three levels ofwet-straining of 1.2, 3.1, and 5.0% as E = 663 kg/mm2, 750 kg/mm2, and 800kg/mm2 respectively, the extrapolated value at DWS = 0 was 625 kg/mm2.Because there is only data at one load level, the value of a0 and b0 could not bedetermined independently from β so the values of a0 and b0 were taken fromthe previous fit of Brezinski’s data.
Equation (29) can be expanded to account for wet-straining by allowingthe modulus to be a function of wet-straining and having a logarithmic timeshift for the DWS. This shift could easily be written in terms of a change instress, ΔσDWS, which is a function or the degree of wet-straining.
J (t, σ, εp, �, DWS) =
1
E(DWS) � 1 + A(1 − ea0eαβ (σ − ΔσDWS)
� ta
) + B ln(b0eβ(σ − ΔσDWS)
� e−
Eεp
σB t + 1)� (32)
Figure 29 Shifting of creep curves for different degrees of wet-straining for datafrom Shultz [17] and load level =2.6 kg/mm2.
13th Fundamental Research Symposium, Cambridge, September 2005 699
The Creep Response of Paper

For the data of Shultz [17], ΔσDWS 14.68DWS kg/m2. It is conjectured that theterm ΔσDWS may be related to the increase in drying stress accompanied withincreased degree of wet-straining.
Based on Equation (29) with the above fitting parameters, isochronouscreep curves for different degrees of wet-straining were determined and aregiven in Figure 32. The dashed line represents a scaling of the wet-strainedsheet by the ratio of initial elastic moduli. Wet-straining does not produceisochronous curves that are scalable. This is in contrast to the effect of wet-pressing. This implies that wet-straining changes the properties of the fibersand changes the general shape of the isochronous creep curves. This result isnot unexpected since the same thing holds for the stress-stain curve of paper[75].
The importance here is the reason that the isochronous curves do notsuperimpose. The effect of wet-straining on initial elastic modulus is differentthan the effect on the time shift and thus, the shape of the resulting isochron-
Figure 30 Logarithmic time shift as a function of degree of wet-straining withextrapolation back to restraint dried condition (DWS = 0%) and a reference state of
5% DWS.
700 Session 4: Network Deformation and Failure
D.W. Coffin
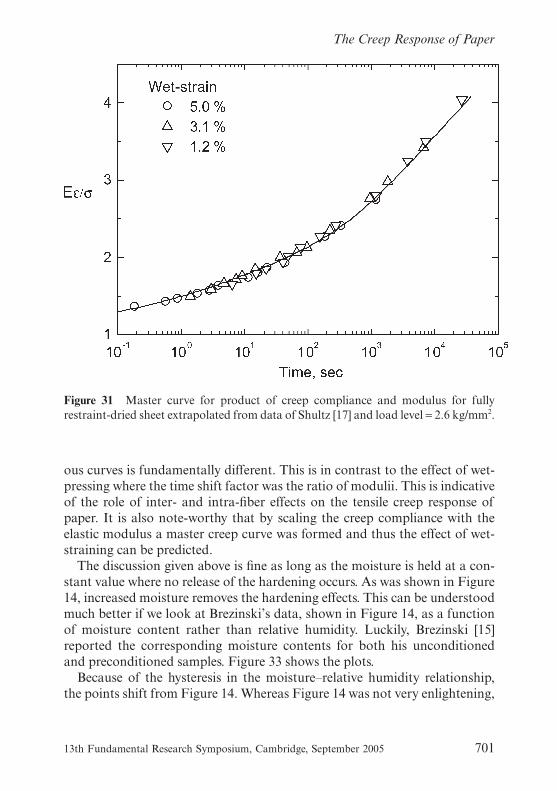
ous curves is fundamentally different. This is in contrast to the effect of wet-pressing where the time shift factor was the ratio of modulii. This is indicativeof the role of inter- and intra-fiber effects on the tensile creep response ofpaper. It is also note-worthy that by scaling the creep compliance with theelastic modulus a master creep curve was formed and thus the effect of wet-straining can be predicted.
The discussion given above is fine as long as the moisture is held at a con-stant value where no release of the hardening occurs. As was shown in Figure14, increased moisture removes the hardening effects. This can be understoodmuch better if we look at Brezinski’s data, shown in Figure 14, as a functionof moisture content rather than relative humidity. Luckily, Brezinski [15]reported the corresponding moisture contents for both his unconditionedand preconditioned samples. Figure 33 shows the plots.
Because of the hysteresis in the moisture–relative humidity relationship,the points shift from Figure 14. Whereas Figure 14 was not very enlightening,
Figure 31 Master curve for product of creep compliance and modulus for fullyrestraint-dried sheet extrapolated from data of Shultz [17] and load level = 2.6 kg/mm2.
13th Fundamental Research Symposium, Cambridge, September 2005 701
The Creep Response of Paper
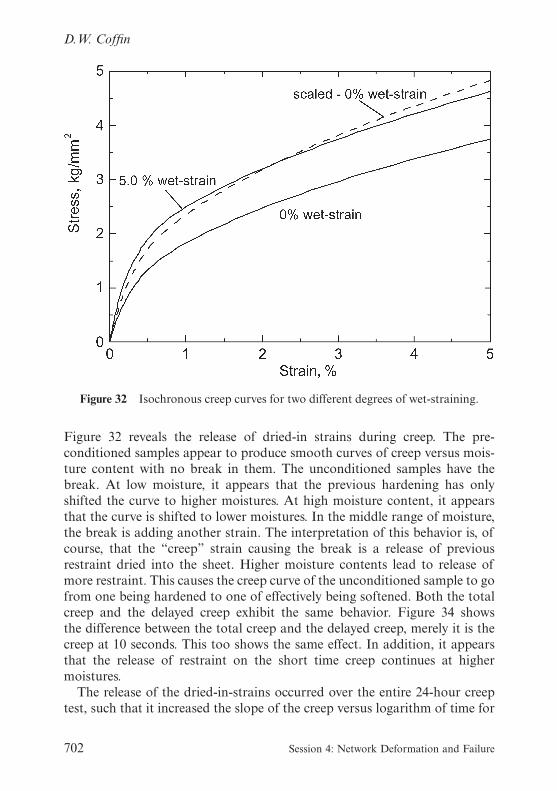
Figure 32 reveals the release of dried-in strains during creep. The pre-conditioned samples appear to produce smooth curves of creep versus mois-ture content with no break in them. The unconditioned samples have thebreak. At low moisture, it appears that the previous hardening has onlyshifted the curve to higher moistures. At high moisture content, it appearsthat the curve is shifted to lower moistures. In the middle range of moisture,the break is adding another strain. The interpretation of this behavior is, ofcourse, that the “creep” strain causing the break is a release of previousrestraint dried into the sheet. Higher moisture contents lead to release ofmore restraint. This causes the creep curve of the unconditioned sample to gofrom one being hardened to one of effectively being softened. Both the totalcreep and the delayed creep exhibit the same behavior. Figure 34 showsthe difference between the total creep and the delayed creep, merely it is thecreep at 10 seconds. This too shows the same effect. In addition, it appearsthat the release of restraint on the short time creep continues at highermoistures.
The release of the dried-in-strains occurred over the entire 24-hour creeptest, such that it increased the slope of the creep versus logarithm of time for
Figure 32 Isochronous creep curves for two different degrees of wet-straining.
702 Session 4: Network Deformation and Failure
D.W. Coffin

the secondary creep. This is illustrated in Figure 35. Brezinski [16] found thatfor the test at 23.5% relative moisture for the sheet preconditioned with highmoisture, log-linear creep was not observed over the 24-hour test period. Atsome time frame, it is presumed that log-linear creep would occur, so thegraph is extrapolated back just to accentuate the effect that of dried-in strainson hardening at lower moistures and softening at higher moistures.
Fiber orientation
The results in the literature, such as previously shown in Figure 18, show thatMD creep stiffness is greater than CD creep stiffness (CD creeps faster). Inmachinemade papers this difference is due to both drying restraint and fiberorientation. To assess the affect of fiber orientation separately from dryingrestraint we can look at results for two sets of sheets, one of which waspreviously reported [76]. The first set consisted of oriented handsheets(Figure 36(a)), and the second set of sheets [76] were made on a pilot machine
Figure 33 Total creep and delayed creep as a function of moisture content for bothunconditioned and preconditioned sheets (Data from [15]).
13th Fundamental Research Symposium, Cambridge, September 2005 703
The Creep Response of Paper

but the wet sheets were cut into sheets and dried under full restraint (Figure36(b)). Some of the properties of the sheet are given in Table 1.
Both sets of sheets were produced from unbleached kraft pulp. For eachpulp, there were two different orientations, and the geometric mean elasticmodulus was constant for a given pulp. For all the data CD, creep was greaterthan MD creep. For the highly oriented sheet, the creep is significantly higher.For the pilot machine sheets, which both have low orientation; the geometric
Figure 34 Creep at 10 seconds as a function of moisture for unconditioned andpreconditioned samples.
Table 1 Properties of two pulps used for fiber orientation study.
Pulp 1 Pulp 2
MD/CD ratio of Modulii 1.5 and 2.7 1.1 and 1.5Grammage, g/m2 96 105Density, g/m3 0.48 0.8Creep load, N/mm 0.59 0.96
704 Session 4: Network Deformation and Failure
D.W. Coffin

Figure 35 Effect of release of dried-in strains during the creep test on secondarycreep rate (strain/log(time)).
Figure 36 Effect of fiber orientation on creep for (a) pulp 1 and (b) pulp 2.
13th Fundamental Research Symposium, Cambridge, September 2005 705
The Creep Response of Paper

mean creep is fairly constant, Figure 37, with pulp two, the geometric meancreep for the highly oriented sheet is much larger than that of the sheet withlower orientation ratio. The effect of orientation can not be accounted forwith simply a time shift. It is possible to scale the creep results to get creepcurves that are of similar magnitude to each other, scaling the CD curves bythe inverse of the MD-CD ratio of elastic modulii squared brings it close tothe MD curve. To understand the role of fiber orientation on the creepresponse requires additional testing.
Example using normalized creep compliance
The use of the normalized creep compliance, the product of elastic modulusand creep compliance, would be useful for interpreting differences in creepbehavior. This is the point emphasized by Zhang et al. [69]. We have alreadyobserved that bonding changes only create logarithmic time shift of the nor-malized creep compliance. Insight into the creep differences in sheets madefrom either virgin or once-dried fibers can also be attained by comparing
Figure 37 Geometric mean creep response for pulps 1 and 2 at different orientationlevels.
706 Session 4: Network Deformation and Failure
D.W. Coffin

normalized creep compliance. The creep data from a previous study [77] wasutilized for this example. In that study, a source of virgin unbleached soft-wood fibers were made into handsheets and dried under restraint. Some ofthe handsheets were then re-pulped and re-made into new restraint driedhandsheets. Additional sheets were made of a 50–50 blend of the two fibersources.
Figure 38 provides the tensile creep curves for the samples all tested at thesame load level. Note the creep in the sheets with once-dried fibers is greaterthan the sheets made with the virgin fibers. The 50–50 blend is in betweenthese two sheets. These creep curves were then scaled to the ratio of elasticmodulus to that of the virgin sheet (� = 0.77 for once-dried and 0.966 for 50–50 blend). The result is given in Figure 39. These scaled sheets appear to differonly by a logarithmic shift in time. A shift of log(t) = 0.5 for the once-driedsheets, and log(t) = 0.3 for the 50–50 blend were required. The shifted curvesare shown in Figure 40. The time shifts do not correspond with just a scaling
Figure 38 Comparison of tensile creep in sheets made from virgin, once-dried, and a50–50 blend of fibers [77].
13th Fundamental Research Symposium, Cambridge, September 2005 707
The Creep Response of Paper

of the load factor by 1/�. Therefore, the differences in the effects of usingonce-dried fibers is likely to be caused by more than just changes in bondingefficiency. One could speculate that lack of bonding in the once-dried fiberscauses an increase in creep rate, but that some of this is offset by some type ofhardening so that the time shift is not as large as would be expected just basedon bonding differences. However, with the limited data, no firm conclusionscan be made. The point is that using the normalized creep compliance maygive better interpretation of data.
Lifetime
If we use the observation that failure occurs at the same total strain regardlessof load level [42], lifetime can be predicted using Equation (29). For tensionwe take the maximum strain to be the stretch. Putting the stretch in as thecreep strain in Equation (29) yields a relationship for lifetime as a function ofload level. This relationship is investigated in the following using the previousfits of data from references [15] and [16].
Figure 39 Creep curves scaled by ratio of elastic modulus.
708 Session 4: Network Deformation and Failure
D.W. Coffin
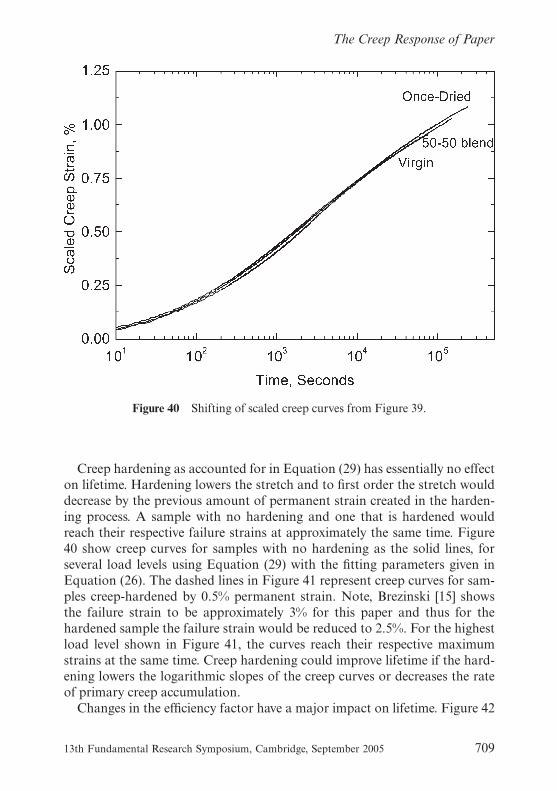
Creep hardening as accounted for in Equation (29) has essentially no effecton lifetime. Hardening lowers the stretch and to first order the stretch woulddecrease by the previous amount of permanent strain created in the harden-ing process. A sample with no hardening and one that is hardened wouldreach their respective failure strains at approximately the same time. Figure40 show creep curves for samples with no hardening as the solid lines, forseveral load levels using Equation (29) with the fitting parameters given inEquation (26). The dashed lines in Figure 41 represent creep curves for sam-ples creep-hardened by 0.5% permanent strain. Note, Brezinski [15] showsthe failure strain to be approximately 3% for this paper and thus for thehardened sample the failure strain would be reduced to 2.5%. For the highestload level shown in Figure 41, the curves reach their respective maximumstrains at the same time. Creep hardening could improve lifetime if the hard-ening lowers the logarithmic slopes of the creep curves or decreases the rateof primary creep accumulation.
Changes in the efficiency factor have a major impact on lifetime. Figure 42
Figure 40 Shifting of scaled creep curves from Figure 39.
13th Fundamental Research Symposium, Cambridge, September 2005 709
The Creep Response of Paper

provides isometric curves for lifetime versus load level for two efficiency fac-tors. For a given stretch, the isometric curves scale with load. For example, inFigure 42 the curve corresponding to � = 0.7 and εmax = 3% is obtained fromthe curve of � = 1 and εmax = 3% by simply scaling the load by 0.7. But if theefficiency factor decreases, so does the stretch, and this loss of stretch wouldfurther decrease lifetime, as illustrated in Figure 40 by the curve correspond-ing with say εmax = 2.25%. For a given load, the drop in lifetime can be severalorders of magnitudes! The loss in stretch could be determined from thestress-strain curve of the fully efficient sheet. For a sheet with efficiency lessthan one, the stretch equals the strain from the fully efficient curve deter-mined at a stress level equal to the tensile strength of the sheet with lowerefficiency divided by its efficiency factor. It is of interest to note that the loadrequired to reach a lifetime of 1 second was equal to the tensile index of thesheet for the case of � = 1 shown in Figure 41. This is the only strength valuethat can be gleaned from [15].
The influence of wet-straining on lifetime can be determined using the fitof Shultz’s [16] data. For the creep curves shown in Figure 29, Shultz
Figure 41 Creep curves showing effect of hardening on lifetime.
710 Session 4: Network Deformation and Failure
D.W. Coffin
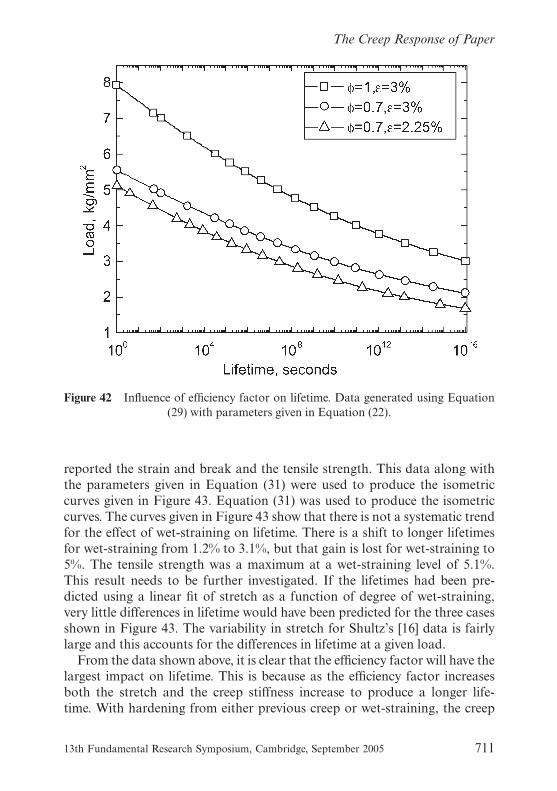
reported the strain and break and the tensile strength. This data along withthe parameters given in Equation (31) were used to produce the isometriccurves given in Figure 43. Equation (31) was used to produce the isometriccurves. The curves given in Figure 43 show that there is not a systematic trendfor the effect of wet-straining on lifetime. There is a shift to longer lifetimesfor wet-straining from 1.2% to 3.1%, but that gain is lost for wet-straining to5%. The tensile strength was a maximum at a wet-straining level of 5.1%.This result needs to be further investigated. If the lifetimes had been pre-dicted using a linear fit of stretch as a function of degree of wet-straining,very little differences in lifetime would have been predicted for the three casesshown in Figure 43. The variability in stretch for Shultz’s [16] data is fairlylarge and this accounts for the differences in lifetime at a given load.
From the data shown above, it is clear that the efficiency factor will have thelargest impact on lifetime. This is because as the efficiency factor increasesboth the stretch and the creep stiffness increase to produce a longer life-time. With hardening from either previous creep or wet-straining, the creep
Figure 42 Influence of efficiency factor on lifetime. Data generated using Equation(29) with parameters given in Equation (22).
13th Fundamental Research Symposium, Cambridge, September 2005 711
The Creep Response of Paper

stiffness increases, but the stretch decreases and lifetime are not affectedmuch. Therefore, changes in bonding should be a dominate factor in lifetime.
COMPRESSIVE CREEP
The simplicity associated with the tensile creep test is replaced with complex-ity when testing paperboard in compression. The challenge for creep testingin compression is to adequately deal with buckling. Many interesting andvaried apparatuses have been developed to carry out compressive creep stud-ies that inhibit, control or embrace the buckling of the paper. Compressivecreep is of interest for packaging, especially in corrugated boxes. Creep ofboxes, corrugated board, or the paperboard itself is studied in an attempt todetermine how to improve performance.
Box lifetime
The first compressive creep tests were on corrugated boxes [6,7]. As Figure 12demonstrated, box testing requires no special testing equipment. For boxtesting, buckling or bowing of the side panels is allowed because it mimicsfield performance. The structure of the box provides the resistance to buck-ling allowing the creep test to be carried out without special equipment. Thebox creep test is actually a simpler test than the tensile creep test. If a tensiletest is a stallion, than the box test is a Clydesdale as it has been the workhorsefor industry.
Kellicutt and Landt’s [7] results for compressive creep of boxes in constanthumidity show the three distinct regions of primary, secondary, and tertiarycreep. The secondary creep was approximately linear with time. Contrast thisconstant creep rate to the strong decay of rate found for tensile tests. Bulgingof the box side panels was observed during secondary creep. Tertiary creepwas in clear evidence in compression. Kellicutt and Landt [7] found that loadlevel had a profound effect on the lifetime of boxes. At load levels belowabout 75% of the box compressive strength, the logarithm of lifetime was alinear function of load. The relationship between load and lifetime wasassociated with high variability.
Koning and Stern [11] found that the secondary creep-rate was a muchbetter predictor of lifetime. Their empirical relationship was that lifetime wasproportional to the secondary creep rate to a power, −1.038. This relationshipwas valid for single containers, stacks of three boxes, empty or filled boxes,boxes constructed of A- or C- flute, two adhesives, various load levels, andtwo environmental conditions. That is an impressive array of conditions for
712 Session 4: Network Deformation and Failure
D.W. Coffin

which the relationship held, and Koning and Stern felt that the relationshipwas fairly general. Figure 43(a) shows data from their analysis along with thefit from [7] for lifetime as a function of load level. Figure 43(b) shows thesame data plotted as a function of secondary creep rate.
One of the reasons for the improved fit when using creep-rate is simplybecause both the creep-rate and lifetime are measured quantities from thetest. The load is prescribed, but the variability from sample to sample willaffect both creep rate and lifetime. The other reason is that the relationshipbetween creep rate and lifetime appears to be rather insensitive to moistureconditions and box type. This implies that there is a certain deformation atwhich the box will fail regardless of conditions.
Leake [78] found that lifetime was proportional to the secondary creep rateraised to a power, −0.957. For cyclic humidity, he found a similar relationship,but the power was −1.121. A follow-up study by Leake and Wojcik [79] foundsimilar results again with the power of −1.206. In addition, they conductededgewise-compressive creep tests on samples of combined board and foundlifetime proportional to the secondary creep rate raised to the power −1.175.Another interesting result of this study [79] was that the combined boardtests gave longer lifetimes at the same secondary creep rate, implying that thefailure strain is larger in the ECT creep test than the BCT creep test.
Figure 43 Box lifetime versus load level (a) and secondary creep rate (b) for datafrom Koning and Stern [11].
13th Fundamental Research Symposium, Cambridge, September 2005 713
The Creep Response of Paper
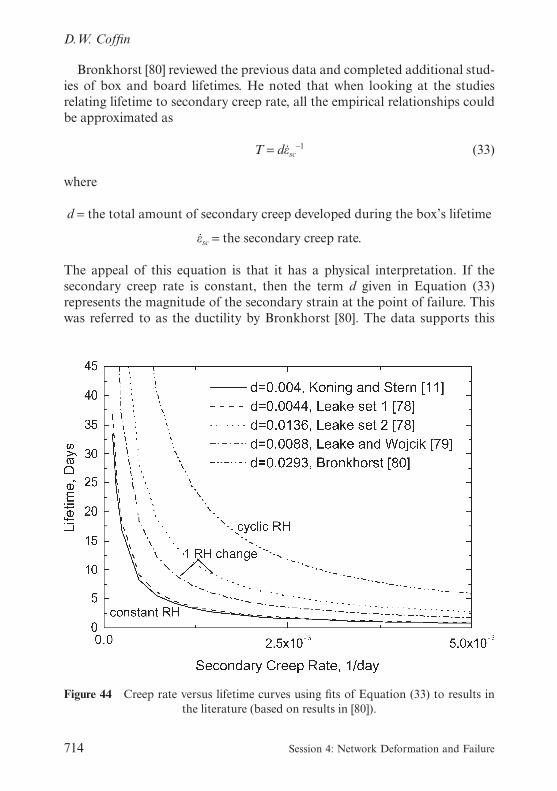
Bronkhorst [80] reviewed the previous data and completed additional stud-ies of box and board lifetimes. He noted that when looking at the studiesrelating lifetime to secondary creep rate, all the empirical relationships couldbe approximated as
T = dε.sc
−1 (33)
where
d = the total amount of secondary creep developed during the box’s lifetime
ε.sc = the secondary creep rate.
The appeal of this equation is that it has a physical interpretation. If thesecondary creep rate is constant, then the term d given in Equation (33)represents the magnitude of the secondary strain at the point of failure. Thiswas referred to as the ductility by Bronkhorst [80]. The data supports this
Figure 44 Creep rate versus lifetime curves using fits of Equation (33) to results inthe literature (based on results in [80]).
714 Session 4: Network Deformation and Failure
D.W. Coffin

equation since failure occurred at the same ductility, d, independent of loadlevel. From the results in the literature, it appears that boxes in cyclic humid-ity have higher secondary creep strains at failure than boxes in constanthumidity. This is demonstrated in Figure 44. It could also be that d is afunction of test methods employed since every investigator obtained differentductility factors.
In addition, Haraldsson et al. [42] found that associating failure with aconstant maximum deflection or strain could be used to predict lifetime inpaperboard. Chalmers [50] found that the compressive creep of paperboardsamples followed a power-law function, but that the exponent decreased withtime. His tests were conducted on a tester with vacuum to hold the specimenflat. He results show that for a sample with a relatively short lifetime, thesecondary creep response was fairly linear with time. He found good correl-ation for the lifetime being inversely proportional to the secondary creep rate.
Differences between tensile and compressive creep
For compressive creep, it appears that the predicting the secondary creep rateis the key factor to predicting lifetime. A secondary factor is the ductility. Inorder to make use of this knowledge a better understanding of compressivecreep is required.
The compressive and tensile creep responses of paper are different. Figure18 provided an example of differences between isochronous curves for ten-sion and compression. Another good example from reference [42] is shown inFigure 45. The creep stiffness is lower in compression at least for long timesand large load durations. At short times, and low load levels, the tensile andcompressive creep responses are essentially the same. This can be observed bythe fact that isochronous curves for tension and compression will coincide atthe lowest load levels.
This behavior was confirmed by Vorakunpinij [81] who observed that forlow load levels tensile and compressive creep behavior was the same, but asload level increased compressive creep rates decayed less than tensile creeprates and the two responses deviated from one another. The fact that thetensile and compressive creep behavior essentially coincide at low loads andshort times, suggests that the initial creep is a material property response nota structural response.
A reasonable explanation for the difference between tensile and compres-sive creep is that in compression the materials becomes unstable and at someload level or time limit elements within the sheet and fiber will buckle anddirectly increase the creep deformation relative to if no buckling occurred.This buckling could be on elements at all scale level including molecular or
13th Fundamental Research Symposium, Cambridge, September 2005 715
The Creep Response of Paper

the entire sheet. Once buckling occurs, deformation will accrue at a fasterrate.
If buckling of the fibrous elements causes increased compressive creeprates, then increased sheet density should postpone the buckling. As a result,tensile and compressive creep curves should coincide for a longer period oftime. This was observed by Vorakunpinij [81]. As discussed previously,increased density reduces creep because of improved load carrying efficiencyof the sheet, but in addition to the overall decreased creep rate, the differencein creep rate between compression and tension are reduced. Figure 46 showsmaster creep curves for two different handsheets both having a grammage of185 g/m2, but one sheet a has a density of 472 kg/m3 and one sheet has adensity of 882 g/m2. Clearly, the creep compliance for tension and compres-sion coincide for a longer period of time in the high density sheets. The curvesshown in the figures, are power-law fits to the master creep curves as deter-mined by Vorakunpinij [81].
Figure 45 Isochronous curves for tension and compression for both MD and CDcreep [42].
716 Session 4: Network Deformation and Failure
D.W. Coffin
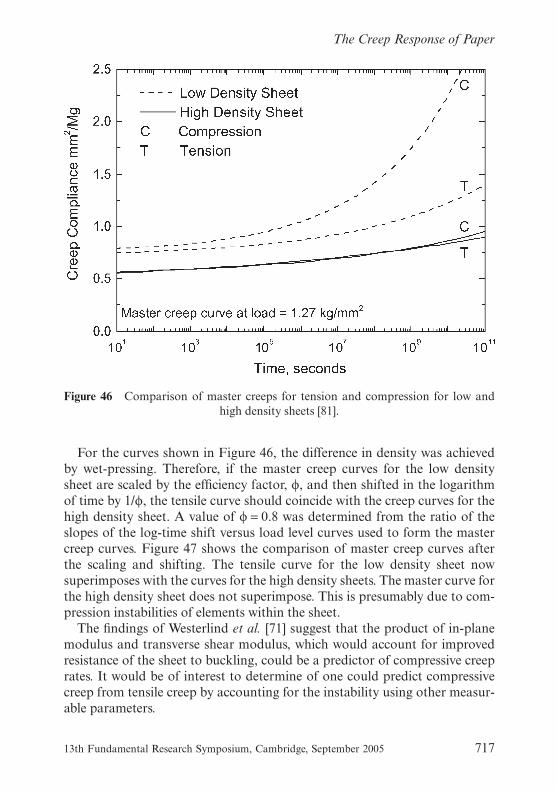
For the curves shown in Figure 46, the difference in density was achievedby wet-pressing. Therefore, if the master creep curves for the low densitysheet are scaled by the efficiency factor, �, and then shifted in the logarithmof time by 1/�, the tensile curve should coincide with the creep curves for thehigh density sheet. A value of � = 0.8 was determined from the ratio of theslopes of the log-time shift versus load level curves used to form the mastercreep curves. Figure 47 shows the comparison of master creep curves afterthe scaling and shifting. The tensile curve for the low density sheet nowsuperimposes with the curves for the high density sheets. The master curve forthe high density sheet does not superimpose. This is presumably due to com-pression instabilities of elements within the sheet.
The findings of Westerlind et al. [71] suggest that the product of in-planemodulus and transverse shear modulus, which would account for improvedresistance of the sheet to buckling, could be a predictor of compressive creeprates. It would be of interest to determine of one could predict compressivecreep from tensile creep by accounting for the instability using other measur-able parameters.
Figure 46 Comparison of master creeps for tension and compression for low andhigh density sheets [81].
13th Fundamental Research Symposium, Cambridge, September 2005 717
The Creep Response of Paper
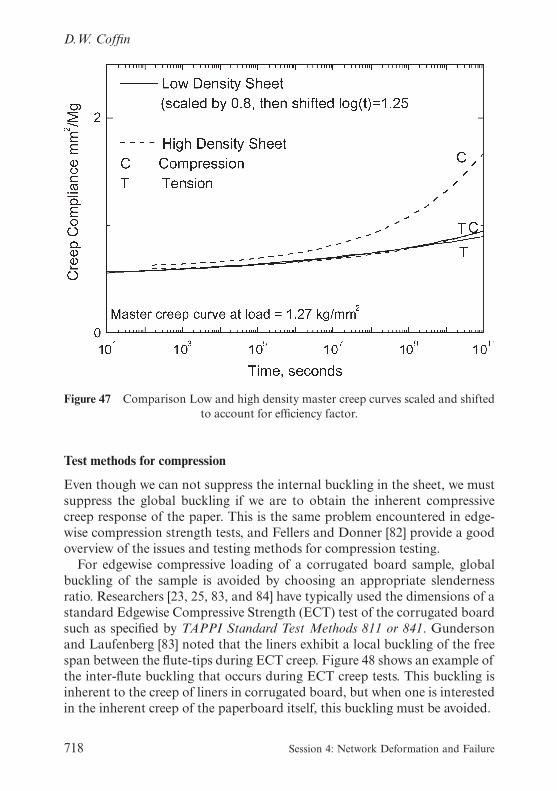
Test methods for compression
Even though we can not suppress the internal buckling in the sheet, we mustsuppress the global buckling if we are to obtain the inherent compressivecreep response of the paper. This is the same problem encountered in edge-wise compression strength tests, and Fellers and Donner [82] provide a goodoverview of the issues and testing methods for compression testing.
For edgewise compressive loading of a corrugated board sample, globalbuckling of the sample is avoided by choosing an appropriate slendernessratio. Researchers [23, 25, 83, and 84] have typically used the dimensions of astandard Edgewise Compressive Strength (ECT) test of the corrugated boardsuch as specified by TAPPI Standard Test Methods 811 or 841. Gundersonand Laufenberg [83] noted that the liners exhibit a local buckling of the freespan between the flute-tips during ECT creep. Figure 48 shows an example ofthe inter-flute buckling that occurs during ECT creep tests. This buckling isinherent to the creep of liners in corrugated board, but when one is interestedin the inherent creep of the paperboard itself, this buckling must be avoided.
Figure 47 Comparison Low and high density master creep curves scaled and shiftedto account for efficiency factor.
718 Session 4: Network Deformation and Failure
D.W. Coffin

One method of restricting the lateral buckling of the paper is to form thesheet into a cylinder and then load it in axial compression. The curvature ofthe cylinder increases buckling resistance of the paperboard. This approachhas been utilized by several researchers for creep testing [55 and 71]. The ideastems from methods utilized for compressive strength testing [85]. Compres-sion testing of cylinders has some drawbacks. For example, the cylindricalgeometry leads to a multi-component stress state that would affect the testresults and limits the minimum size of the cylinder or the maximum size ofcaliper. Moisture diffusion would likely be different from the inside and out-side of the cylinder. This could be beneficial since in a box moisture diffusiontypically occurs from one side. The apparatus developed by Vullierme et al.[55] and named the VARIPRESS, uses a cylinder formed by rolling the papermultiple times. The cylinder is placed in guiding cylinders, but is free on theinside surface. Gaps are used to allow compression of the cylinder. A sche-matic of this instrument is shown in Figure 49.
Gunderson [86] developed a method using a light vacuum to hold the
Figure 48 Inter-flute buckling resulting from creep of edgewise compressive loadingof corrugated board [84].
13th Fundamental Research Symposium, Cambridge, September 2005 719
The Creep Response of Paper

sample against lateral support blades, and thus increase the buckling resist-ance of a specimen. This design used support leaves with 0.25 mm thicknessand 25.4 mm width that was 114 mm length, spaced at intervals of 0.7 mm.Later the support leaves were replaced with a system of bronze rods, 3.2 mmsquare by 152.4 mm length [87]. A schematic of the modified system is shownin Figure 50. For this system, the vacuum pressure that hold the sheet to therods, also pulls air through the sheet and creates faster sorption times. Inaddition, the pressure differences from one side of the sheet to the othercreate a moisture gradient though the thickness of the sheet that would per-sist throughout the test.
Haraldsson et al. [42, 88] developed a creep tester with columns that sup-port the paper to prevent buckling. Spaces between the columns allow formoisture to move in and out of the sheet. Panek et al. [74] refined the appar-atus so that the columns were longer and had thin sections at the ends thatacted like hinges. The ends of the columns move with the paper and the
Figure 49 Simplified schematic of VARIPRESS creep tester for rolled papercylinders adapted from [55].
720 Session 4: Network Deformation and Failure
D.W. Coffin

hinges accommodate the creep movement with little interference. Deform-ation is measured by tracking the movement of two of the columns spaced 43mm apart. A simplified schematic of this apparatus is shown in Figure 51.
Vorakunpinij et al. [89] developed a flat support apparatus based loosely onprevious testers for compressive strength [90]. The sample is completely sup-ported by two plates that slide relative to each other. The specimen is fixed toone plate at each end. Lateral pressure is measured to account for any fric-tion. To eliminate the effect of shear near the ends, the deformation is meas-ured directly from the middle section of the paper. This apparatus, as shownin Figure 52, was used for tensile and compressive creep testing in constanthumidity environments.
Even the ring crush test has been adapted for creep testing [53 and 91] withresults having similar trends to those of other compressive creep testing. Thelong-term secondary creep rate in ring-crush was found to be linear with timeand may be attributed to buckling of the sample. Short term creep was fitwith a power-law equation. Good correlation was found between lifetime andminimum secondary creep rate similar to previous studies using a power-lawequation. The exponent was close to 1. The relationships were slightly differ-ent for different environmental conditions. Using the interpretation impliedby Equation (33), Jackson’s [53] results show that the ductility increases whentesting in constant 50% RH to constant 90% RH to cyclic RH.
Figure 50 Vacuum restraint tester showing support rods [87].
13th Fundamental Research Symposium, Cambridge, September 2005 721
The Creep Response of Paper
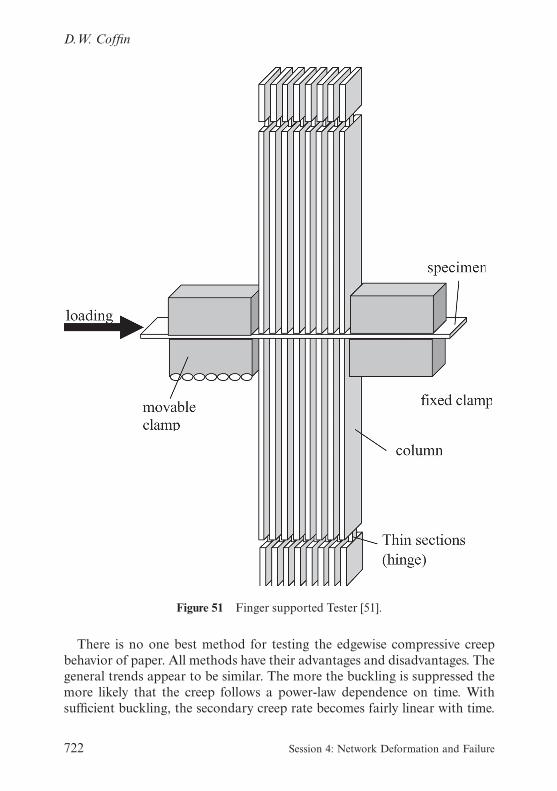
There is no one best method for testing the edgewise compressive creepbehavior of paper. All methods have their advantages and disadvantages. Thegeneral trends appear to be similar. The more the buckling is suppressed themore likely that the creep follows a power-law dependence on time. Withsufficient buckling, the secondary creep rate becomes fairly linear with time.
Figure 51 Finger supported Tester [51].
722 Session 4: Network Deformation and Failure
D.W. Coffin
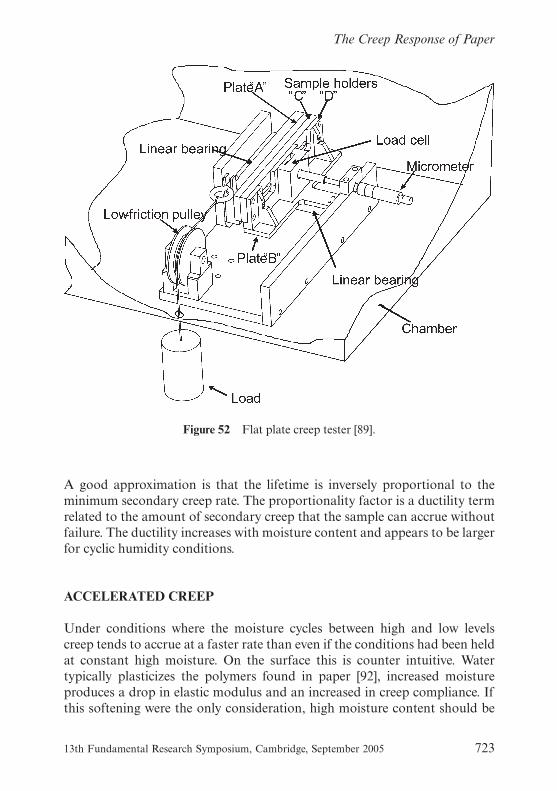
A good approximation is that the lifetime is inversely proportional to theminimum secondary creep rate. The proportionality factor is a ductility termrelated to the amount of secondary creep that the sample can accrue withoutfailure. The ductility increases with moisture content and appears to be largerfor cyclic humidity conditions.
ACCELERATED CREEP
Under conditions where the moisture cycles between high and low levelscreep tends to accrue at a faster rate than even if the conditions had been heldat constant high moisture. On the surface this is counter intuitive. Watertypically plasticizes the polymers found in paper [92], increased moistureproduces a drop in elastic modulus and an increased in creep compliance. Ifthis softening were the only consideration, high moisture content should be
Figure 52 Flat plate creep tester [89].
13th Fundamental Research Symposium, Cambridge, September 2005 723
The Creep Response of Paper

the worst case scenario for creep behavior. Alas, for many materials includingpaper this simple logic does not hold. Instead, cyclic moisture leads to whathas been termed accelerated or mechanosorptive creep. This puzzlingbehavior has captured the attention of many researchers, and as the literaturereview documents accelerated creep has dominated the field of creep in paperfor the past 30 years.
Figure 53 presents a graph of two creep curves for paper. The monotonic-ally increasing curve corresponds to creep at constant 80% relative humidity(RH). The curve that exhibits the cyclic strain response is the creep of asample that was first held at constant 80% for a period of time, and thencycled from 30% to 80% relative humidity. This demonstrates the dramaticincrease in the rate of creep that occurs when moisture cycling commences.This is accelerated creep. The saw tooth behavior shown in the graph is due tothe hygroexpansion and the change in elastic modulus of the specimen. Thepeaks and valleys correspond to periods of high and low moisture,respectively.
For the sample shown in Figure 53, the first time the sample experiences adecrease in moisture, the strain becomes flat. During last few excursions tolow moisture the strain continues to decrease during the entire period of low
Figure 53 Accelerated Creep in Paper [51].
724 Session 4: Network Deformation and Failure
D.W. Coffin

moisture. The strain in the low moisture regimes is the combined result of theshrinkage due to the decrease in moisture and the creep due to the appliedload. During the first excursion, these two components offset each other, butas the material hardens the rate of creep decreases and the shrinkage isobserved for the entire period of low moisture. In addition, the shrinkage andswelling strains are larger during the first cycles than during the latter cycles.
When the moisture is cycled, there are at least three components of strain:the creep strain, the change in elastic strain, and the hygroexpansion. Inaddition, there could be a release of previous hardening. A simple super-position of the strain components from separate hygroexpansion and creeptests will not give the combined results. The missing strain is not only fromthe extra creep, but there are also changes in hygroexpansion [93] and elasticmodulus that will occur [92]. None the less, it seems reasonable that thehygroexpansion and the change in elastic strain could be removed from thetotal strain. In addition, one could subtract the constant moisture creep cyc-lic moisture response. By removing these strains from the total response, theextra strain due to cycling moisture can be evaluated.
An approximation of this strain subtraction is done in Figure 54. The solidline is the difference in the total strains for the two creep curves shown inFigure 53. The reversible strains from cycle to cycle are not known. Thereforea pseudo reversible strain was constructed from the data of the last cyclegoing from 30–80–30 cycle of RH. The shape was taken directly from theresponse and the magnitude was taken from the shrinkage portion. The sameswelling-shrinkage was assumed for all cycles. The dashed line in Figure 54shows the result of subtracting this approximation of the reversible strainfrom the difference in total strains. The remaining strain is the extra accumu-lated strain. Additional swelling and shrinkage strains in the early cycles arealso present. The result shows that most of the extra creep occurs during thechange from low to high RH. For this sheet, the overall strain was greaterthan 1% when cycling commenced. It is likely that the creep rate for the paperat 30% RH and at this strain level is quite small even if high stress concentra-tions are present.
The fact that the cyclic RH creep curve exceeds the creep curve of constant80% RH in Figure 53 is actually noteworthy. Even if one appreciates thatmaterial nonlinearity in conjunction with stress concentrations can lead toexcess creep, the minimum expectation should be that the creep rate only beabove that of the average of the low and high creep. Since many observationsreported in the literature are that creep in cyclic humidity exceeds that in highhumidity, the responsible actions must be potent.
13th Fundamental Research Symposium, Cambridge, September 2005 725
The Creep Response of Paper

Mechanisms
Haslach [61] provided a thorough review of mechanosorptive creep coveringliterature up to circa 1997. He emphasized the experimental findings and theconjecture on the causes of accelerated creep. Because accelerated creep issuch an amazing phenomenon, there were many explanations for him tocover. The following presents just a few of the major factors that have beenproffered to cause accelerated creep. The view taken is biased towards themechanical explanation of accelerated creep, but it is held that this bias isjustified.
Early on for wood, it was thought that moisture diffusion drove acceleratedcreep, but the experimental results of Armstrong [94] showed this to bewrong. To get around this, Bazant [57] argued that it was moisture in themicropores disrupting bonds, but not affecting diffusion. Ranta Maunus [58]took the approach that accelerated creep was directly related to the change inmoisture and not linked directly to material compliance. These explanationsare not satisfying.
Figure 54 Difference in total creep strain for cyclic and constant humidity (dashed)and approximate extra creep strain (solid).
726 Session 4: Network Deformation and Failure
D.W. Coffin

Other researchers have assigned responsibility to the structure. Söremarkand Fellers [37–38] suggested a model of moisture induced stress-redistribution causing extra dislocations in the fiber network. Haslach [60]favors an explanation based on network structure and anisotropic swelling ofthe fibers. There are even results that upon cursory review support these fibernetwork explanations. Cyclic moisture tests on single fibers conducted bySedlachek [43] showed no accelerated creep rates. Only during the first excur-sion from 50 to 90% RH in tests started at 50% RH was there an increase increep. This was likely attributed to a release of dried-in strains. Coffin andBose [47] verified that single pulp fibers exhibit no accelerated creep. Byrdobserved increases in light scattering and therefore bond-breaking duringcreep and during the moisture changes [20]. Salmén and Fellers [95] observedaccelerated creep in paper, but no accelerated creep in bundles of Nylon 6,6fibers. This was attributed to fact that Nylon 6,6 does not have anisotropicswelling. As appealing as those three pieces of experimental evidence are eachhas a rational explanation.
Coffin and Boese [47] point out that the sorption of water in these singlepulp fibers is very fast. There is very little time when moisture gradients arepresent in the fibers and therefore, there is very little action to drive acceler-ated creep. This is the same reason that the tests of Salmén and Fellers [95]showed no accelerated creep. In fact, synthetic fibers have been shown toexhibit accelerated creep even Nylon 6,6 [96]. When the diameter of the fiberis sufficiently large and the moisture cycle is sufficiently fast acceleratedcreep will occur in homogenous and isotropic materials [62 and 96]. Thesethicker fibers undergo large swelling gradients for a significant portion ofthe cycle time and have ample time to give an accelerated creep response[96].
That leaves us with a bond breaking explanation. The problem with meas-urements of the changes in light scattering with creep is that the measure-ments by themselves can not show cause and effect. Which came first, bondbreaking or creep deformation? The only thing these measurements show isthat creep and loss of bonded area occurred together. The evidence wouldpoint to the fact that simply a loss of bonded area will not necessarily lead tomore creep. Decreased bonding occurs during wet-straining and previouscreep deformation. Both of these actions lead to less creep not more. This isbecause of intra-fiber changes and improved network efficiency. The rolebonding plays in creep is to act as a stress concentration factor, which inessence speeds up the creep process. This is very important especially onlifetime, but it does not control the basic creep response it only magnifies it.With a significant loss of bonding during creep, there probably is an increasein creep rate, which is tertiary creep.
13th Fundamental Research Symposium, Cambridge, September 2005 727
The Creep Response of Paper

For tensile creep in constant humidity, the creep compliance will notchange with increased bonding once the efficiency factor has reached a valueof one. The only change will be the increase in failure strain. There is noreason to expect the accelerated creep response to be different. Increasedbonding above a minimum level should not reduce accelerated creep, eventhough a loss of bonded area will occur during the creep.
An explanation of the mechanosorptive effects put forward by Padanyi [41]was that cycling to high moisture causes components of the material to riseabove the glass transition temperature. This event triggers the sample toundergo de-aging. When the sample returns to low moisture content there isexcess free volume and the sheet is not in thermodynamic equilibrium. Dur-ing this time the sheet is more compliant, and experiences more creep. Thepaper slowly ages and returns to its former state. This is a somewhat appeal-ing argument, but Padanyi showed that similar aging occurred after an excur-sion to low moisture and any appeal to glass transition is invalid. Proponentsof this argument state that the rapid change in dimensions creates the excessfree volume needed for increased compliance. This is more of an interpret-ation of the action in terms of free volume rather than a rational explanation.Perhaps it is better to state that this apparent increase in free volume is aresult of stress concentrations.
The mechanical explanation given by Habeger and Coffin [62] and utilizedin [65] and [66] is capable of explaining all observed mechanosorptive effectswithout any hand waving or appeals to special phenomena. It is well estab-lished that Boltzmann superposition does not apply to paper; in other words,the material is not linear. In addition, it is clear that the heterogeneity ofpaper and the creation of any moisture gradients within the paper producenonuniform swelling. This nonuniform swelling produces stress gradients.Because of material nonlinearity, the highly loaded regions will contributemore to creep than is conserved in the unloaded regions. The net result is theseemingly abnormal response of the paper known as accelerated creep. It alsoresults in Padanyi’s aging [41], and even the transients in dynamic mechanicalproperties [97, 63]. The fact is that these mechanosorptive effects should bethe expected behavior of the materials. They are a completely normalresponse of the material when subjected to multiple changes of load, mois-ture, time, and/or temperature.
Figure 55 shows a schematic of a sample subjected to a load F. Because ofmaterial heterogeneity or nonuniform swelling/shrinkage, the stress will notbe uniformly distributed as shown in Figure 55(b). We know only the appliedload, F, and not knowing any more assume that the average stress is acting onthe material as shown in Figure 55(c). If the material response is nonlinear,then different distributions of stress will give different responses even though
728 Session 4: Network Deformation and Failure
D.W. Coffin

the average stress remains constant. This is what happens when moisture iscycled during a creep test.
If the material can flow, the stresses will try to redistribute to a uniformstate. In cyclic moisture conditions, we continually disrupt the stress distribu-tion. Consider each point as being subjected to a cyclic stress. Because ofmaterial nonlinearity, the sample will experience more creep during thesetimes of stress gradients.
The mechanism for accelerated creep can be stated as follows:
Accelerated creep can occur in materials where (1) the creep behavior is anonlinear such that cycling the load gives more creep than the average loadand (2) stress distributions are created due to material heterogeneity and/ormoisture gradients.
There is precedence in the literature for this mechanism. For example Pickett[21] in addressing accelerated creep in concrete suggested
. . . an increase in creep accompanying non-uniform shrinkage or swelling isa natural consequence of the fact that sustained-stress-vs.-strain curve forconcrete is not linear.
Figure 55 Concept of nonuniform stress distribution in a specimen.
13th Fundamental Research Symposium, Cambridge, September 2005 729
The Creep Response of Paper

Selway and Kirkpatrick [36] suggested a similar mechanism
Changes in moisture can cause rapid transient increases in stress and thecreep rate is a highly nonlinear function of stress there can be significantincreases in the creep rate.
Neither of these statements point out the cyclic load criteria. Kevlar fibers arean example of a material that requires the distinction of cyclic load in thestatement. Kevlar fibers exhibit accelerated creep [98] but are rather loadinsensitive. Kevlar fibers do exhibit more creep upon cyclic loading than fromthe constant mean load [96].
Haslach [61] states
Another hypothesis is that the changing moisture content during cyclical rela-tive humidity sets up a stress gradient within individual fibers that acceleratesthe strain.
He dismisses this hypothesis because it is difficult to test. Also, the stressgradients can easily be between fibers not just within a fiber. Dillard [59] liststhe possibility of this mechanism as follows:
Stress and Hygroscopic swelling – a possibly important category which mightinclude altered residual stress states, nonlinear viscoelastic effects, and evendamage, all of which could result from the swelling and swelling gradientswhich result as the diffusion process occurs.
Dillard [59] chose to follow an explanation based on free volume instead.Söremark and Fellers [37] tied redistribution of stresses into their proposeddislocation explanation.
In the statement of the mechanism for accelerated creep, it is essential thatthe nonlinearity criteria be stated in terms of cyclic load causing more creepthan constant average load. It is possible for a material to have nonlinearscaling and still produce no accelerated creep.
Observations
There are some instructive examples of accelerated creep that support thismechanical view of accelerated creep over other explanations. Figure 56shows an example of accelerated creep in cellophane. This demonstrates thatin general accelerated creep is more than a special phenomenon relegated toanisotropic fibrous materials. It is not just material heterogeneity that willcause accelerated creep. In this case, the diffusion of water into the cello-phane causes moisture gradients that lead to stress concentrations andsubsequently accelerated creep.
730 Session 4: Network Deformation and Failure
D.W. Coffin

Figure 57 illustrates that accelerated creep also occurs when cycling to lowhumidity conditions. This dispels any notion that the sample must go aboveglass transition for accelerated creep to occur. In fact, the severity of thechange in creep from the constant 50% to the cyclic portion is severe. Com-pare to that shown in Figure 53. The acceleration of creep was so strong thatduring the first desorption the shrinkage was overcome by extra creep andeven this point ends up above the constant 50% creep curve. The reason forthis dramatic display of accelerated creep is that at low moistures the stressconcentrations can not relax. At the lower moisture, the stiffness of thematerial is high it creates such extreme stress concentrations that the materialcreeps rapidly. In subsequent excursions, the material has hardened and theexcess creep is small compared to the change in swelling/shrinkage, but stillthere is creep even in the low RH conditions. Note that the overall strain levelhere is low so the creep rates are relatively high. Whereas the creep from lowto high humidity had most of the extra creep only in the excursions to highmoisture, the curve shown in Figure 57 demonstrates that there is extra creepduring the drop in moisture. After studying Figure 54, one may have doubtsabout the mechanism because extra creep at the lower moisture would be
Figure 56 Accelerated creep in cellophane [51].
13th Fundamental Research Symposium, Cambridge, September 2005 731
The Creep Response of Paper

expected. In fact, there probably was since we subtracted the creep at 80%RH, where the creep rate would be higher than at 30% RH. For the curveshown in Figure 57, the acceleration of creep is accentuated leaving no doubtthat even the moisture changes induce excess creeping at low moistures.
The rate of accelerated creep should vary with the period of the moisturecycle. If cycle times are long, the stress gradients will dissipate and the creeprate will diminish. If the cycle time is too short, there will not enough time forcreep to occur and for very short cycle times the sheet will even obtain mois-ture equilibrium. There would be an optimum time where the stress gradientswould be re-created with each cycle and the change in moisture would occurat a frequency so that the stress concentrations would not be diminished. Thisoptimum cycle time would be a function of the characteristic times of mois-ture sorption and relaxation times. Figure 58 provides an example of how therate of creep changes as the cycle time changes.
As a last example, consider Padanyi’s physical aging tests. Figure 59 pro-vides verification of his result that exposure to low moisture “de-ages” the
Figure 57 Creep in cyclic humidity from mid to low moisture content for twosamples [51].
732 Session 4: Network Deformation and Failure
D.W. Coffin
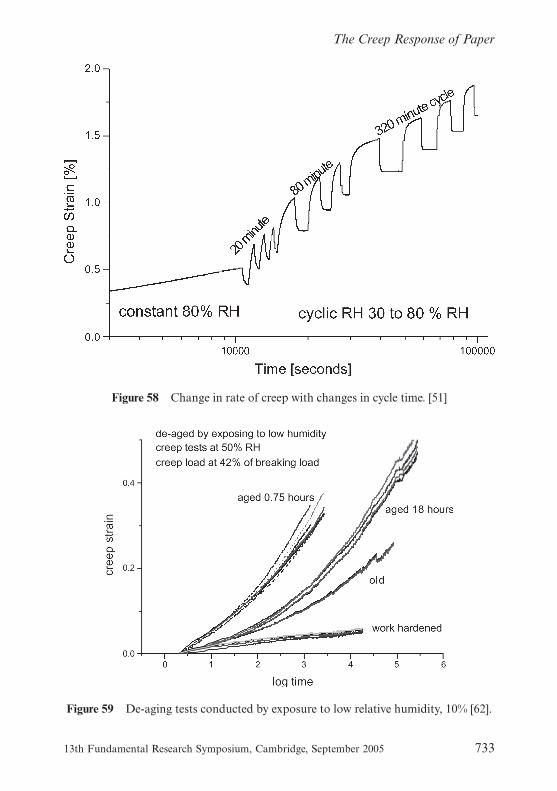
Figure 58 Change in rate of creep with changes in cycle time. [51]
Figure 59 De-aging tests conducted by exposure to low relative humidity, 10% [62].
13th Fundamental Research Symposium, Cambridge, September 2005 733
The Creep Response of Paper

material as observed by the increased creep compliance [62]. The paper washandsheets made from a TMP pulp. The curve labeled “old” is the creepcurve for a sample that was stored at 50% RH for a long time. Samples wereexposed to 10% humidity for 1 hour and then re-conditioned at 50% for 45minutes. Creep tests were conduced and the sample exhibited increased com-pliance. The samples were again de-aged and then after either 45 minutes or18 hours creep tests were once again started. Longer aging times result inlower creep compliance. The work hardened curves correspond to samplesthat have been de-aged twice and then subjected to 18 hours of creep.Another creep test with our de-aging results in work-hardening. A very rea-sonable explanation for this phenomenon is that during the moisture cycleunder no load, large stress-gradients are created and do not relax quickly. Theadded stress concentration has the effect of increasing the effective compli-ance. As time passes with no load application the stresses concentrations willdissipate and the material will age. Without de-aging, the samples will showvery little creep. In these tests, there may have been some permanent harden-ing of the samples de-aged twice at 45 minutes but it is small.
The examples of accelerated creep behavior discussed above demonstratethat the basics of the accelerated creep phenomenon can be understood on amechanistic level. The tests conducted at lower humidity offer strongevidence that accelerated creep is the natural consequence of cyclic stressgradients applied to nonlinear materials.
If one were to accept this explanation for accelerated creep, or in the leastaccept it as a natural way to account for accelerated creep, the entire issue ofmechanosorptive effects decouples into understanding the two phenomenaseparately. The first issue that needs to be addressed is how the materialgenerates more creep upon cyclic loading versus constant mean load. Thesecond and separate issue is how moisture changes create stress gradients.Gains in understanding each phenomenon can be made separately, and thenaccelerated creep will be one of the consequences of coupling the results backtogether again. In this paper, we did not discuss the second issue of moisturesorption and swelling but focused on the creep response of the paper.
Assessing material nonlinearity
By decoupling the accelerated creep problem into two problems, (1) moisturediffusion and swelling and (2) material nonlinearity, undertaking studies ofcreep at constant humidity are validated. For tension, we have been able toput together many of the pieces. Since compression creep testing for paperdid not begin until after the era of accelerated creep, we have very littleknowledge of the fundamental compressive creep response of paper. We
734 Session 4: Network Deformation and Failure
D.W. Coffin
know that is different from tension, but we can not systematically account forthe differences.
Focusing on tension, we have already discussed that the load dependenceof creep is basically accounted for as a logarithmic time shift of creep com-pliance curves. As the shift parameter β increases, the nonlinearity of loadcycling increases, and since a large part of this load dependent creep is per-manent, accelerated creep would be expected to increase. Therefore, to reduceaccelerated creep one must find ways to reduce this factor. Increasing theefficiency factor � will also achieve the same effect. This is accomplished byincreasing the bonding in the sheet. This is probably of major importance tolifetime. The other parameters that control creep play a secondary role incausing extra creep due to load cycling. Of course as far as lifetime is con-cerned, anything that reduces overall creep while not having a detrimentaleffect on stretch will improve performance on both cyclic and constantmoisture conditions.
The trouble with creep tests in cyclic humidity
It is very difficult to gain insights into accelerated creep beyond, just rankingwhich materials have more or less creep than others. The reason for this isthat there are two many things going on at one time. The mechanical responseof paper depends on load level, moisture content, temperature, and timescales. In a creep test under constant conditions, we keep everything constantexcept time. Of course, internally load is being redistributed but that isaccounted for in the creep compliance. By holding all but one variableconstant during the test, we can determine the effects of load, moisture,temperature, and history on the creep compliance. In this manner, a system-atic characterization of creep behavior is attained.
When conducting a cyclic humidity test, all the parameters are changing.One sample may show more accelerated creep because of increased intrinsicload nonlinearity. Another may exhibit increased differential swelling.Another may have differences in bonding, and yet another may have differ-ences in dried-in strains. When the moisture is cycled, each of these factorswill influence the creep response to an unknown amount. Rarely will strongcorrelations be found between sheet properties that will have broad applica-tion to all conditions. To pinpoint the cause behind one paper having moreaccelerated creep than another more information about the creep behaviorthan just that from cyclic tests is likely required.
To illustrate that more involved study is required to understand cyclichumidity creep consider these two case studies. Leake [77] showed thatseemingly equivalent boxes based on ECT strength and lifetime in constant
13th Fundamental Research Symposium, Cambridge, September 2005 735
The Creep Response of Paper
humidity creep did not exhibit the same lifetimes in a cyclic humidityenvironment. Thus, cyclic humidity triggered a material response that wasnot active in the other test conditions. The difference in these two boxes wasthe basis weight of the medium. Again, in reference [78] two boxes andboards tested were seemingly equivalent in terms of ECT and BCT, but thesecondary creep rates for the cyclic humidity creep tests were dramaticallydifferent. In this second case, the difference between the two boxes was theadhesive. Boxes made from the high-amylose adhesive had twice the lifetimeas boxes made with a cornstarch adhesive. Constant RH tests are not enough.By assessing the properties of the two boxes at multiple load levels and char-acterizing the diffusion and hygroexpansion of the box, one could probablyexplain why the two boxes behaved differently.
Furthermore, there is no one moisture-temperature history that will be theworst case scenario for all papers. The choice of testing conditions is arbi-trary and conclusions made from one set of tests probably not hold underanother set of conditions. In the field, the environment is truly transient withchanges in temperature and relative humidity that are not regular. Except forpractical applications, testing with a complex environmental history probablyreaps little insight.
SUMMARY
Ponder the following statement. Everything we know about the basicbehavior of creep in paper has come from tests completed in conditions ofconstant humidity. In fact most of the knowledge came from the early workin the field. We know that the creep process for paper is a self-retarding orhardening process at least until a critical state is reached where damage hasoccurred such that tertiary creep imitates and failure is eminent. We knowthat the creep deformation has a recoverable component. We know that acomponent of the deformation at least at the time scales of practical evalu-ation is unrecoverable. We know that hardening effects can be removed withexposure to high moisture in the unloaded state.
Results in the literature suggest that the creep behavior is predictable. Theeffect of load on creep compliance is a shift of the compliance curves alongthe logarithmic time scale (scalar magnification of time.) The effect of mois-ture on secondary creep also acts to scale time. Increased moisture can alsolead to a release of dried-ins-strains and produce an apparent increase increep compliance. Network efficiency as accounted for by degree of bondingsimply acts to magnify the stress and hence scales the creep compliance andshifts the curves in log-time. By using the creep compliance normalized by the
736 Session 4: Network Deformation and Failure
D.W. Coffin
elastic modulus, the effect of network efficiency becomes only a time-shift. Infact, many of the effects of many fiber and network changes can beaccounted for by scaling the creep compliance and magnifying the time in asystematic manner. Use of dimensionless quantities will likely reconcile manyof the differences observed for different paper materials.
The initial compressive creep response is inherently the same as that intension, but because the material becomes more stable in tension and lessstable in compression, the creep response deviates and paper creeps faster incompression.
The major contribution from cyclic humidity testing is the observation thatit produces more creep than high moisture. In addition, we know that com-parative creep tests conducted at constant humidity will often not yield thesame ranking as a comparison in cyclic humidity. The general conclusionfrom this observation is that creep tests in constant humidity are not useful.This is not a good conclusion.
Since a cyclic moisture creep test is the coupling of moisture changes withcreep, with at least two factors influencing the response, it would be too muchto expect one creep test conducted at constant humidity to capture thebehavior. Knowing that the accelerated creep is a result of load cycling, one isgoing to have to assess this behavior. The assessment of how changes in loadaffect the creep response, even in constant humidity, will help expose thereason one paper performs worse than another. For example, take the case ofKevlar fibers that exhibit accelerated creep, but not nonlinear scaling of load(doubling load more than double creep response.) To understand this one,needs to determine why cyclic load causes more creep deformation as com-pared to constant mean load. This should be a much easier problem to tacklethan trying to adequately describe the cyclic moisture case. There is soundlogic in the argument that more focus be given to assessing the effects of loadand other parameters under conditions of constant moisture.
Of course, there is still the need to carry out cyclic humidity tests. Cyclictesting is essential for ranking materials in a search for those that will provideimproved lifetime. In addition, cyclic testing provides the critical test for ourhypotheses and models. Once we change the way we look at the problem, wemay also develop methods to predict the effective response of an acceleratedcreep test with load magnification factors, or strain scaling factors.
To illustrate the type of understanding that can be obtained from constanthumidity testing, a rudimentary model of tensile creep was developed as partof this review. For tensile creep in constant cyclic humidity, the role ofbonding and hardening were clarified and the analysis revealed that ourunderstanding the creep response should be a direct extension of our under-standing of the stress strain curve of paper as outlined in reference [75].
13th Fundamental Research Symposium, Cambridge, September 2005 737
The Creep Response of Paper

Clearly, the basic response to load is governed by the materials and bondingacts merely to magnify the stress. Because the creep rate and lifetime are sucha strong function of load level, degree of bonding is probably a major factorin determining which materials show more and less creep. Changing the fiberproperties through hardening reduces creep rates, but this is offset by adecrease in rupture strain.
Creep in compression appears to be the same as tension, but magnified bycompressive instabilities. If the susceptibility of the material to buckling isassessed, it may be possible to predict the compressive creep from the tensilecreep response. Very little is known about the compressive creep response ofpaper. Therefore, it is difficult for us to predict how a given paper will behavewhen subjected to compression.
Lifetime predictions are troublesome because and variability in parametersis magnified at long times. Therefore, predicting lifetime from say appliedload level without minimizing or accounting for material variability will yielddiscouraging results. Using another measured quantity like secondary creeprate eliminates much of that variability, but it does no help with the predic-tion. We still must predict the secondary creep rate for a given material.
There is much we still do not understand about creep. After carrying outthis review and contemplating what information was missing, the followingresearch suggestions are offered.
1. Pre-rupture Tensile Creep
• Characterize the effect of raw materials on master creep curves at differentmoisture contents.
• Determine the loss of hardening that takes place when samples are pre-conditioned with high moisture by characterizing the creep of sheets madeto different degrees of wet-straining or shrinkage.
• Determine a relationship between MD/CD fiber orientation changes andMD/CD creep behavior uncoupled from effects of restraint.
• Verify that bonding can be treated simply by accounting for the efficiencyfactor as ratio of elastic modulii.
• Verify that the effect of moisture on secondary creep rates is only a loga-rithmic time shift for a sample with no dried-in strains. Characterize effectof moisture on primary creep.
• Through study of creep and creep recovery better characterize the relation-ship between primary and secondary creep.
• Determine the connection between creep-hardening from restraint duringdrying to drying stresses.
• Determine how much of the “secondary creep” is recoverable over longer
738 Session 4: Network Deformation and Failure
D.W. Coffin
time spans or that can be recovered in an accelerated mode with moisturecycling.
2. Compressive Creep
• Complete studies on the characterization of compressive creep in terms ofnonlinearity as a function of load, primary versus secondary creep, androle of material and process parameters.
• Determine the role of structural instability on compressive creep.• Determine effect of process parameters on rupture strain in compression.
3. Creep Failure
• Determine criteria for creep failure. Is it controlled by total strain, second-ary strain, or even an energy criterion?
• Connect equation relating creep lifetime to secondary creep-rate directly tomaterials and structural properties.
• Determine effect of moisture history on failure criterion.
The critical review of tensile creep presented in this review article, actuallybrought forth refined and clarified understanding of creep. These insightsshould help in experimental work, modeling, and practical application. Thesefindings are summarized as follows.
For Tensile creep:
1. The role of bonding can be accounted for with a sheet efficiency factorbased on the ratio of actual elastic modulus to fully developed elasticmodulus. The effect is two-fold. The creep compliance is inversely pro-portional to the efficiency factor, and the logarithmic time shift for differ-ent load levels is inversely proportional to the efficiency factor.
2. The effect of wet-straining can be accounted for by scaling the creepcompliance with the ratio of elastic modulii and a logarithmic time-shiftfor the onset of secondary creep.
3. The release of the dried-in strains (internal stresses if you prefer) can beobserved from a plot of creep strain versus moisture. At low moistureswhere the strain is locked-in to the sheet the creep is hardened. At highmoisture contents above that where the dried-in strain is released thematerial shows no hardening effects.
4. The isochronous creep curves can be used to show the effect of creep-hardening analogous to strain-hardening in a tensile test. The primarycreep is analogous to elastic deformation and the secondary creep isanalogous to plastic deformation.
13th Fundamental Research Symposium, Cambridge, September 2005 739
The Creep Response of Paper

5. The geometric mean MD-CD creep does not remain constant butincreases as the MD/CD ratio increases.
For compressive creep, it was shown that using the efficiency factor as donefor tensile creep can account for some of the differences in creep of sheetswith different levels of bonding, but that compressive instabilities are alsoaffected by bonding.
Both master creep curves and isochronous creep curves are useful for char-acterization of creep. If all the time-shifting functions are known the mastercreep curve contains all the information necessary to characterize the creepof a paper. Only if the isochronous curves scale with time will one curveprovide all the information. It appears that scaling is not strictly valid andthus a set of isochronous curves give only a partial picture of the creepresponse. Still the analogy of an isochronous curve to a stress-strain curvefrom a tensile test destines it to be used for practical studies. Two points aboutthese curves should be emphasized.
1. The use of the normalized creep compliance, the product of creep com-pliance and elastic modulus, provides a fundamental quantity that mayallow for more general master creep curves to be formed. Such as wasdone here for wet-pressing, wet-straining, and virgin versus once-driedsheet.
2. Isochronous creep curves provide an excellent method for comparing thecreep response of different materials, and demonstrating the effect ofchanges in process parameters.
Author’s note
After completing this review, and pulling together many of the thought andideas of others, I realized we have much better fundamental understanding ofcreep than previously believed. I hope this work is enlightening to others andadequately demonstrates that the creep response of paper can be understoodon a fundamental level. Furthermore, this understanding is not so very dif-ferent than our understanding of any other mechanical response of paper.Finally, I hope this paper encourages others to carry out fundamental studieson the creep of paper.
740 Session 4: Network Deformation and Failure
D.W. Coffin
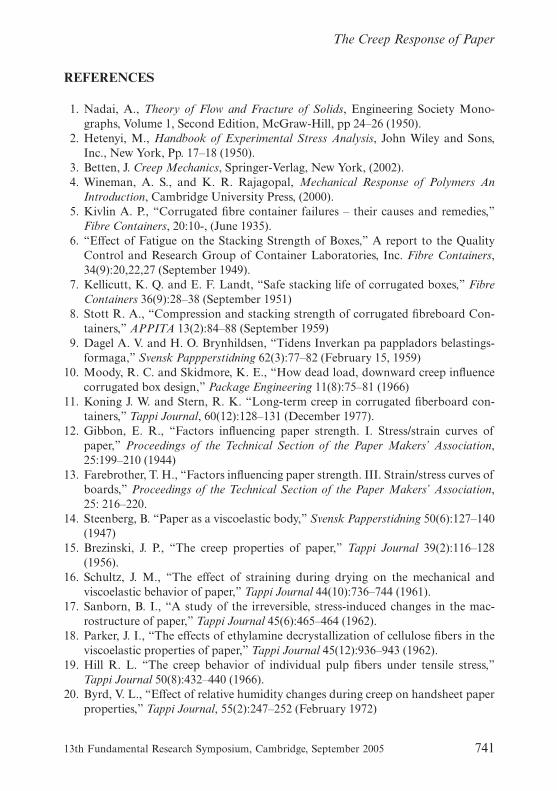
REFERENCES
1. Nadai, A., Theory of Flow and Fracture of Solids, Engineering Society Mono-graphs, Volume 1, Second Edition, McGraw-Hill, pp 24–26 (1950).
2. Hetenyi, M., Handbook of Experimental Stress Analysis, John Wiley and Sons,Inc., New York, Pp. 17–18 (1950).
3. Betten, J. Creep Mechanics, Springer-Verlag, New York, (2002).4. Wineman, A. S., and K. R. Rajagopal, Mechanical Response of Polymers An
Introduction, Cambridge University Press, (2000).5. Kivlin A. P., “Corrugated fibre container failures – their causes and remedies,”
Fibre Containers, 20:10-, (June 1935).6. “Effect of Fatigue on the Stacking Strength of Boxes,” A report to the Quality
Control and Research Group of Container Laboratories, Inc. Fibre Containers,34(9):20,22,27 (September 1949).
7. Kellicutt, K. Q. and E. F. Landt, “Safe stacking life of corrugated boxes,” FibreContainers 36(9):28–38 (September 1951)
8. Stott R. A., “Compression and stacking strength of corrugated fibreboard Con-tainers,” APPITA 13(2):84–88 (September 1959)
9. Dagel A. V. and H. O. Brynhildsen, “Tidens Inverkan pa pappladors belastings-formaga,” Svensk Pappperstidning 62(3):77–82 (February 15, 1959)
10. Moody, R. C. and Skidmore, K. E., “How dead load, downward creep influencecorrugated box design,” Package Engineering 11(8):75–81 (1966)
11. Koning J. W. and Stern, R. K. “Long-term creep in corrugated fiberboard con-tainers,” Tappi Journal, 60(12):128–131 (December 1977).
12. Gibbon, E. R., “Factors influencing paper strength. I. Stress/strain curves ofpaper,” Proceedings of the Technical Section of the Paper Makers’ Association,25:199–210 (1944)
13. Farebrother, T. H., “Factors influencing paper strength. III. Strain/stress curves ofboards,” Proceedings of the Technical Section of the Paper Makers’ Association,25: 216–220.
14. Steenberg, B. “Paper as a viscoelastic body,” Svensk Papperstidning 50(6):127–140(1947)
15. Brezinski, J. P., “The creep properties of paper,” Tappi Journal 39(2):116–128(1956).
16. Schultz, J. M., “The effect of straining during drying on the mechanical andviscoelastic behavior of paper,” Tappi Journal 44(10):736–744 (1961).
17. Sanborn, B. I., “A study of the irreversible, stress-induced changes in the mac-rostructure of paper,” Tappi Journal 45(6):465–464 (1962).
18. Parker, J. I., “The effects of ethylamine decrystallization of cellulose fibers in theviscoelastic properties of paper,” Tappi Journal 45(12):936–943 (1962).
19. Hill R. L. “The creep behavior of individual pulp fibers under tensile stress,”Tappi Journal 50(8):432–440 (1966).
20. Byrd, V. L., “Effect of relative humidity changes during creep on handsheet paperproperties,” Tappi Journal, 55(2):247–252 (February 1972)
13th Fundamental Research Symposium, Cambridge, September 2005 741
The Creep Response of Paper

21. Pickett, G. J., “The effect of change in moisture-content on the creep of concreteunder a sustained Load,” J. Amer. Concrete Inst. 13(4): 257(1942)
22. Armstrong, L. D. and Kingston, R. S. T., “Effects of moisture changes on creep inwood,” Nature 185 (4716): 862–863 (1960).
23. Byrd, V. L., “Effect of relative humidity changes on the compressive creepresponse of paper,” Tappi Journal, 55(11):1612–1613 (November 1972)
24. De Ruvo, A., R. Lundberg, S. Martin-Lof, and C. Söremark, “Influence of tem-perature and humidity on the elastic and expansional properties of paper and theconstituent fibre,” Transactions of the 6th Fundamental Research Symposium,Fibre-Water Interactions in Paper-Making, Oxford: September 1977, pp. 785–806.
25. Byrd, V. L. and Koning J. W., “Corrugated fiberboards, edgewise compressioncreep in cyclic relative humidity environments,” Tappi Journal 61(6):35–37 (1978).
26. Byrd V. L. “Edgewise compression creep of fiberboard components in a cyclic-relative-humidity environment,” Tappi Journal 67(7):86–90 (1984).
27. Lindström, T. Kolseth, P. and Naslund, P. “The dry strengthening effect of cat-ionic starch wet-end addition on filled paper,” in Papermaking Raw Materials,Trans. VIIIth Fundamental Research Symposium, Oxford, 1985, (V. Punton ed.) pp589–611.
28. Byrd V. L. “Adhesive’s influence on edgewise compression creep in a cyclic relativehumidity environment,” Tappi Journal 69(10):98–100 (1986).
29. Pecht M., Johnson M. W., and Rowlands, R. E., “Constitutive equations for thecreep of paper,” Tappi Journal 67(5):106–108 (1984)
30. Pecht M. and Johnson, M. W., “The strain response of paper under variousconstant regain states,” Tappi Journal 68(1):90–93 (1985)
31. Proceedings Cyclic Humidity Effects on Paperboard Packaging, editors T. L.Laufenberg, C. H. Leake, Madison WI, (September 14–15, 1992)
32. Proceedings Moisture-Induced Creep Behavior of Paper and Board, Editors C.Fellers and T. L. Laufenberg, Stockholm, (December 5–7, 1994)
33. Proceedings 3rd International Symposium, Moisture and Creep Effects on Paper,Board, and Containers, Editor I. R. Chalmers, Rotorua New Zealand (February20–21, 1997)
34. Proceedings 4th International Symposium, Moisture and Creep Effects on Paper,Board, and Containers, Editors J. Serra-Tosio and I. Vullierme, Grenoble, France(March 18–19, 1999)
35. Proceedings 5th International Symposium, Moisture and Creep Effects on Paper,Board, and Containers, Editor I. Parker, Marysville, Victoria, Australia (2001) Inpublication.
36. Selway J. W. and Kirkpatrick, J. “The assessment of high humidity corrugated boxperformance; A discussion of theoretical and experimental factors.” ProceedingsCyclic Humidity Effects on Paperboard Packaging, editors T. L. Laufenberg, C. H.Leake, Madison WI, (September 14–15, 1992) pp. 31–47.
37. Söremark, C. and Fellers, C. “Creep of corrugated board in cyclic humidity inter-pretation and a model,” Proceedings Cyclic Humidity Effects on Paperboard Pack-aging, editors T. L. Laufenberg, C. H. Leake, Madison WI, (September 14–15,1992) pp. 49–77.
742 Session 4: Network Deformation and Failure
D.W. Coffin

38. Söremark L. and Fellers C. N., “Mechano-sorptive creep and hygroexpansion ofcorrugated board in bending,” Journal of Pulp and Paper Science, 19(1):J19–J26(1993)
39. Calvin S., “Rapid method for predicting the short and long time stacking strengthof corrugated board,” Proceedings Cyclic Humidity Effects on PaperboardPackaging, editors T. L. Laufenberg, C. H. Leake, Madison WI, (September 14–15, 1992) pp. 95–104.
40. Söremark L., Fellers C. N., and Henriksson, L. “Mechano-sorptive creep ofpaper: influence of drying restraint and fibre orientation,”, Products of Papermak-ing, Transactions of the Tenth Fundamental Research Symposium, Oxford 1993,(C. F. Baker, ed.), pp. 547–574. FRC.
41. Padanyi, Z.V. “Physical aging and glass transition: effects on the mechanicalproperties of paper and board,” Products of Papermaking, Transactions of theTenth Fundamental Research Symposium, Oxford, 1993, (C.F. Baker, ed.), pp 521–545, FRC.
42. Haraldsson, T., Fellers C., and Kolseth P, “The edgewise compression creep ofpaperboard: new principles of evaluation,” Products of Papermaking, Trans-actions of the Tenth Fundamental Research Symposium, Oxford, 1993, (C.F. Baker,ed.), pp 601–637, FRC.
43. Sedlachek K. M. and R. L. Ellis, “The effect of cyclic humidity on the creep ofsingle fibers of southern pine,” Proceedings Moisture-Induced Creep Behavior ofPaper and Board, Editors C. Fellers and T. L. Laufenberg, Stockholm, (December5–7, 1994) pp. 29–49.
44. Haraldsson, T., Fellers, C., and Kolseth, P., “Modeling of creep behavior at con-stant relative humidity,” Proceedings Moisture-Induced Creep Behavior of Paperand Board, Editors C. Fellers and T. L. Laufenberg, Stockholm, (December 5–7,1994) pp. 139–147.
45. Frosberg, K., “Predicting the long term stacking strength of corrugated boxes,”Proceedings Moisture-Induced Creep Behavior of Paper and Board, Editors C.Fellers and T. L. Laufenberg, Stockholm, (December 5–7, 1994), pp. 194–203.
46. Bronkhorst, C. A. and Riedemann, J. R., “The creep deformation behavior ofcorrugated containers in a cyclic moisture environment,” Proceedings Moisture-Induced Creep Behavior of Paper and Board, Editors C. Fellers and T. L. Laufen-berg, Stockholm, (December 5–7, 1994), pp. 249–273.
47. Coffin D. W. and Boese, S. B., “Tensile creep behavior of single fibers and paperin a cyclic humidity environment, Proceedings 3rd International Symposium,Moisture and Creep Effects on Paper, Board, and Containers, Editor I. R. Chalm-ers, Rotorua New Zealand (February 20–21, 1997) pp. 39–52.
48. Jackson, T., “Accelerated creep in rayon fibers,” Proceedings 3rd InternationalSymposium, Moisture and Creep Effects on Paper, Board, and Containers, Editor I.R. Chalmers, Rotorua New Zealand (February 20–21, 1997) pp. 53–68.
49. Haraldsson, T., Fellers, C., Söremark C., “Creep properties of paper-principles ofevaluation,” Proceedings 3rd International Symposium, Moisture and Creep Effectson Paper, Board, and Containers, Editor I. R. Chalmers, Rotorua New Zealand(February 20–21, 1997) pp. 237–246.
13th Fundamental Research Symposium, Cambridge, September 2005 743
The Creep Response of Paper

50. Chalmers, I. R., “A comparison between static and cyclic humidity compressioncreep performance of linerboard,” Proceedings 4th International Symposium,Moisture and Creep Effects on Paper, Board, and Containers, Editors J. Serra-Tosioand I. Vullierme, Grenoble, France (March 18–19, 1999) pp. 44–53.
51. Coffin D. W. and Habeger C. C., “Accelerated creep mechanics: Part I,” Proceed-ings 4th International Symposium, Moisture and Creep Effects on Paper, Board, andContainers, Editors J. Serra-Tosio and I. Vullierme, Grenoble, France (March 18–19, 1999) pp. 122–133.
52. Habeger C. C. and Coffin D. W, “Accelerated creep mechanics: Part II,” Proceed-ings 4th International Symposium, Moisture and Creep Effects on Paper, Board, andContainers, Editors J. Serra-Tosio and I. Vullierme, Grenoble, France (March18–19, 1999) pp. 107–120.
53. Jackson T., Parker, I., Wingkong C., “The effect of moisture on the Ring Crushand tensile properties of handsheets and fibers,” Proceedings 4th InternationalSymposium, Moisture and Creep Effects on Paper, Board, and Containers, EditorsJ. Serra-Tosio and I. Vullierme, Grenoble, France (March 18–19, 1999) pp. 137–150.
54. Fellers, C., Haraldsson, T., and Mohlin U. B., “Mechanosorptive creep in com-pression, influence of fiber shape and sheet structure,” Proceedings 4th Inter-national Symposium, Moisture and Creep Effects on Paper, Board, and Containers,Editors J. Serra-Tosio and I. Vullierme, Grenoble, France (March 18–19, 1999) pp.165–172.
55. Vullierme, Serra-Tosio J. M., Thebault, “Moisture effect on the rheological andcreep properties of paper and linerboard in edge compression,” Proceedings 4thInternational Symposium, Moisture and Creep Effects on Paper, Board, andContainers, Editors J. Serra-Tosio and I. Vullierme, Grenoble, France (March 18–19, 1999) pp. 152–164.
56. Patel, P., Nonlinear Creep Model of Paper and Corrugated Board Materials, Ph.D.dissertation Lund University, Sweden 1999.
57. Bazant Z. P. “Constitutive equations of wood at variable humidity and tempera-ture,” Wood Science and Technology 19:159–177 (1985).
58. Ranta Maunus, A. “The viscoelasticity of wood at varying moisture content,”Wood Science and Technology, 9:189–205 (1975).
59. Dillard D. “Mechano-sorptive effects in synthetic fiber and thoughts on mech-anistic models,” Proceedings of Conference on Moisture-Induced Creep Behavior ofPaper and Board, Editors C. Fellers and T. L. Laufenberg, Stockholm Sweden Dec5–7, 1994.
60. Haslach, H. W., Jr., “The mechanics of moisture accelerate tensile creep in paper,”Tappi Journal, 77(10):179–182 (1994).
61. Haslach, H. W. Jr., “Moisture-accelerated creep,” Chapter 4 of Handbook ofPhysical Testing of Paper, Vol 1. Second Edition, Edited by R. E. Mark, C. C.Habeger, J. Borch, and M. B. Lyne. Marcel Dekker Inc. 2002.
62. Habeger C. C. and Coffin D. W. “The role of stress concentrations in acceleratedcreep and sorption-induced physical aging,” Journal of Pulp and Paper Science,26(4):145–157 (2000).
744 Session 4: Network Deformation and Failure
D.W. Coffin

63. Coffin D. W. and C. C. Habeger, “The mechanics of sorption-induced transientsin the loss tangent,” Journal of Pulp and Paper Science, 27(11):385–390 (2001)
64. I.R. Chalmers, A.D. McKenzie and B.I. Johnson, “The bending response ofcorrugated fibreboard to a cycling relative humidity environment”, Proceedings5th International Symposium, Moisture and Creep Effects on Paper, Board, andContainers, Editor I. Parker, Marysville, Victoria, Australia (2001) In publication.
65. C.L.M. van Weert, J.R. ten Donkelaar “A finite element model of acceleratedcreep and moisture transport in tensile loaded paper and corrugated board,”Proceedings 5th International Symposium, Moisture and Creep Effects on Paper,Board, and Containers, Editor I. Parker, Marysville, Victoria, Australia (2001) Inpublication
66. Alfthan, J., Gudmundson, P., and Ostlund, S., “A micro-mechanical model formechanosorptive creep in paper,” Journal of Pulp and Paper Science, 28(3):98–104(2002)
67. Olsson, A. M. and Salmén, L., “Molecular mechanisms involved in creepPhenomena of Paper,” Journal of Applied Polymer Science, 79:1590–1595 (2001).
68. Urbanik, T. J., “A more mechanistic model of the compression strain-loadresponse of paper,” Journal of Pulp and Paper Science, 28(6):211–216 (2002).
69. Zhang G., Tanaka, A., Keranen, J., Timofeev O., and Niskanen, K., “Effect ofdrying method on the creep behavior of paper,” 88th Annual Meeting or the Pulpand Paper Technical Association of Canada, pp A219–227, (2002).
70. Lehti, T., Ketoja, J. A., and Niskanen K. J., “Measurement of paper rheology atvaried moisture contents,” Proceeding of the 2003 International Paper PhysicsConference, Victoria, BC 2003, pp 57–60.
71. Westerlind, B. S., Rundlöf, M., Wågberg, L., and Bronkhorst, C. A. “Influence ofa strength additive and a softener on drying stresses and mechanical propertiesfor laboratory made paper,” Proceeding of the 2003 International Paper PhysicsConference, Victoria, BC 2003, pp 175–186.
72. Habeger, C.C. and Whitsitt W., J., “A Mathematical model of compressivestrength in paperboard” Fiber Science and Technology, 19(3): 215–239(1983).
73. DeMaio, A. and Patterson T., “The role of fiber-fiber bonding on the tensile creepcompliance of paper 2004 Progress in Paper Physics Seminar, Trondheim, Nor-way, June 21–24 (2004)
74. Panek, J., Fellers, C., and Haraldsson, T., “Principles of evaluation for the creepof paperboard in constant and cyclic humidity,” Nordic Pulp and Paper ResearchJournal, 19(2):155–163 (2004)
75. R.S. Seth, R. S. and D.H. Page, D. H., “The stress-strain curve of paper”, TheRole of Fundamental Research in Paper Making, Transactions of the Seventh Fun-damental Research Symposium, Cambridge, 1981, (J. Brander, ed.), pp 421–452,FRC.
76. Hojjatie, B. Coffin, D. W., and Aidun, C. K., “Properties of paper produced withVortigen technique: Effect of formation hydrodynamics,” 2004 Progress in PaperPhysics Seminar, Trondheim, Norway, June 21–24, (2004)
77. Coffin, D. W., Habeger, C. C. and Waterhouse, J., “Effect of recycling fibers onaccelerated creep,” Progress in Recycling, 9(3):14–21 (2000)
13th Fundamental Research Symposium, Cambridge, September 2005 745
The Creep Response of Paper

78. Leake C. H., “Measuring corrugated box performance,” Tappi Journal, 71(10):71–75 (1988)
79. Leake C. H. and R. Wojcik, “Influence of combining adhesive on box perform-ance,” Tappi Journal, 72(8)61–65 (1989)
80. Bronkhorst C. A., “Towards a more mechanistic understanding of corrugatedcontainer creep deformation behavior,” Journal of Pulp and Paper Science, 23(4):J174–181 (April 1997)
81. Vorakunpinij A., The effect of paper structure on the deviation between tensile andcompressive creep responses,” Ph.D. Dissertation Institute of Paper Science andTechnology, Atlanta, GA (2003).
82. Fellers, C. and Donner, B., “Edgewise compression strength of paper,” Chapter 9of Handbook of Physical Testing of Paper, Vol 1. Second Edition, Edited by R. E.Mark, C. C. Habeger, J. Borch, and M. B. Lyne. Marcel Dekker Inc. 2002.
83. Gunderson, D. E. and Laufenberg, T. L., “Apparatus for evaluating stability ofcorrugated board under load in cyclic humidity environment,” ExperimentalTechniques, 18(1):27–31 (1994)
84. Popil R. E., Kaewmanee P., and Coffin, D. W. “The role of liner buckling on theedgewise compressive strength of corrugated board,” 2004 Progress in PaperPhysics Seminar, Trondheim, Norway, June 21–24, 2004.
85. Setterholm, V. C. and Gertjejanses, R. O., “Method for measuring the edgewisecompressive properties of paper,” Tappi Journal 48(5):308–312 (1965).
86. 1. Gunderson, D. E., “A method for compressive creep testing of paperboard,”Tappi Journal 64(11): 67 (1981).
87. Considine, J. M. and Gunderson, D. E., “A method for mechanical propertytesting of paperboard during compressive creep in a cyclic humidity environ-ment,” Experimental Techniques 11(9): 18 (1987).
88. Haraldsson, T., Fellers, C., and Kolseth, P., “A mMethod for measuring the creepand stress-strain properties of paperboard in compression,” Journal of Pulp andPaper Science 20(1):J14 (1994).
89. Vorakunpinij A., Coffin D. W., Habeger C. C., “A new device for measuringtensile and compressive creep in paper,” Experimental Techniques 28(3):43–48(2004).
90. Seth, R. S. and Soszynski, R. M., “An evaluation of methods for measuring theintrinsic compressive strength of paper,” Tappi Journal 62(12):97–99 (1979).
91. Jackson, T., Parker, I., and Chiu, W., “Ring crush creep,” Appita Journal 53(5):444 (2000).
92. Salmén, L. and Hagen, R., “Viscoelastic properties,” Chapter 2 of Handbook ofPhysical Testing of Paper Vol 1. Second Edition, Edited by R. E. Mark, C. C.Habeger, J. Borch, and M. B. Lyne. Marcel Dekker Inc. 2002.
93. Uesaka, T., “Dimensional stability and environmental effects on paper proper-ties,” Chapter 3 of Handbook of Physical Testing of Paper Vol 1. Second Edition,Edited by R. E. Mark, C. C. Habeger, J. Borch, and M. B. Lyne. Marcel DekkerInc. 2002.
94. Armstrong, L. D., “Deformation of wood in compression during moisturemovement,” Wood Science 5(2):81–86 (1972).
746 Session 4: Network Deformation and Failure
D.W. Coffin

95. Salmén, L. and Fellers, C., “Moisture-induced transients and creep of paper andNylon 6,6; a comparison,” Nordic Pulp and Paper Research Journal 11(3)186:191(1996)
96. Habeger, C. C., Coffin D. W., B. Hojjatie, B., “Influence of humidity cyclingparameters on the moisture-accelerated creep of polymeric fibers,” Journal ofPolymer Science: Part B: Polymer Physics, 39(17): 2048–2062 (2001)
97. Kubát J. and Linbergson, B., “Damping transients in polymers during sorptionand desorption” Journal of Applied Polymer Science, 9(8): 2651–2654, (1965)
98. Wang, J. Z., Dillard, D. A., Wolcott, M. P., Kamke, F. A., and Wilkes, G. L.,“Transient moisture effects in fibers and composite materials,” Journal of Compos-ite Materials, 24:994–1009 (1990)
13th Fundamental Research Symposium, Cambridge, September 2005 747
The Creep Response of Paper

THE CREEP RESPONSE OF PAPER
Douglas W. Coffin
Department of Paper and Chemical Engineering, Miami University,Oxford OH 45056
Errata received from the author to be included in the proceedings
The reference to Figure 43 on page 711 should be the figure as shown below,say Figure 43a:
Figure 43a Effect of Wet-straining on Lifetime
13th Fundamental Research Symposium, Cambridge, September 2005
Transcription of Discussion
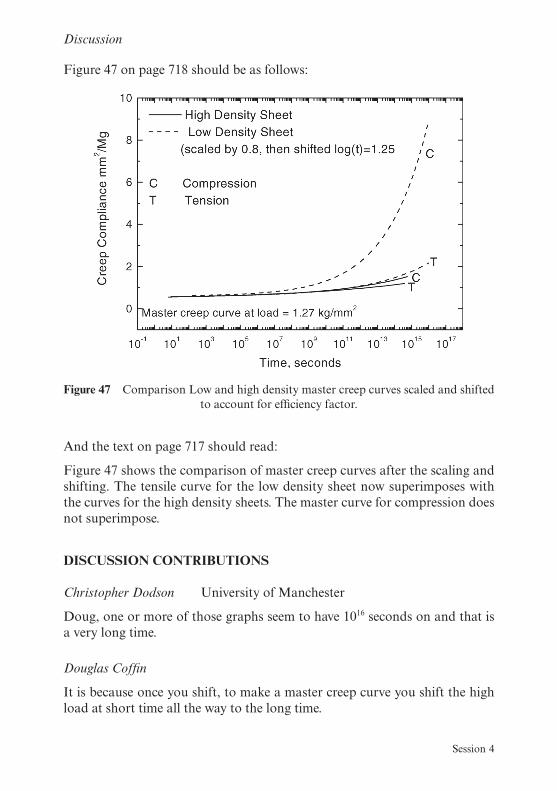
Figure 47 on page 718 should be as follows:
And the text on page 717 should read:
Figure 47 shows the comparison of master creep curves after the scaling andshifting. The tensile curve for the low density sheet now superimposes withthe curves for the high density sheets. The master curve for compression doesnot superimpose.
DISCUSSION CONTRIBUTIONS
Christopher Dodson University of Manchester
Doug, one or more of those graphs seem to have 1016 seconds on and that isa very long time.
Douglas Coffin
It is because once you shift, to make a master creep curve you shift the highload at short time all the way to the long time.
Figure 47 Comparison Low and high density master creep curves scaled and shiftedto account for efficiency factor.
Session 4
Discussion
Christopher Dodson
But it did have data points on.
Douglas Coffin
Because you shift the data points in time. Because it is a time shift, it is justtranslating it out to a larger scale.
Christopher Dodson
It is a little bit worrying for a mathematician to have things creeping for aboutthe age of the universe.
Douglas Coffin
It just means we can predict it.
Jukka Ketoja KCL Science and Consulting
Thank you for a very nice talk. It certainly clarified things, at least in mymind. I would just like to make a comment about the effect of moisturecontent. We have found1 that actually the same sort of master curve formal-ism applies to the moisture content. What is interesting is that you can, forinstance, analyse Brezinski’s data, and it turns out that 1% change in mois-ture content corresponds to about one order of magnitude in time, whichcauses extremely fast creep at a high moisture content. It means that creepdoes not apply only to box failure but other things as well.
1 S. Lehti et al., International Paper Physics Conference, Victoria 2003
Douglas Coffin
That’s right. I did not show Brezinski’s moisture data, but he formed mastercurves with that. But one of the things I advocate is normalised creep compli-ance. With respect to moisture, he found that for secondary creep, the slopeof that curve was the same for the compliance and not normalised compli-ance, even though we know the modulus changes. So there is somethinginteresting there with the moisture and secondary creep that needs moreinvestigation.
13th Fundamental Research Symposium, Cambridge, September 2005
Network Deformation and Failure

Tom Lindström STFI-Packforsk AB
We have this accelerated creep problem, so what should we look for in orderto alleviate the problem? I mean you can improve bonding, you can crosslink,you can also look for stress concentrations on different structural levels like,drying stress in the z-direction. You have microcompressions, you may haveshives – all creating stress concentrations. Add free volume considerationsand you have an action list. So, what should we look for?
Douglas Coffin
I think what you should do is take your chemicals and not just improve thebonding between fibres, but actually change the shear transfer between thefibres. I think that would be beneficial.
Tom Lindström
What do you mean by that? Explain to a chemist.
Douglas Coffin
When we think about bonds, we assume a very thin layer or no layer, it is justhow the fibres are attached, there is nothing there, but we know that all thedeformation has to be transferred by shear between fibres. We have to get theload from fibre to fibre. The deformation is through the whole fibre wall andnot just the bond and if you can change that behaviour, you get a change offundamental behaviour of the paper. You might be able to improve saystretch, while also improving stiffness, which is going to reduce creep compli-ance giving you much longer lifetimes. Whereas, you see, if we harden thefibre itself we are not getting anything because we are reducing the strain atfailure.
We can improve bonding all we want, but we also want to go one stepfurther and improve the material response at the same time.
Session 4
Discussion
Copyright © 2022 FDOKUMEN