Spot Weld Growth on 304L Austenitic Stainless Steel for Equal and Unequal Thicknesses
10
-
Upload
nottingham-my -
Category
Documents
-
view
0 -
download
0
Transcript of Spot Weld Growth on 304L Austenitic Stainless Steel for Equal and Unequal Thicknesses
Caspian Journal of Applied Sciences Research, 1(11), pp. 83-91, 2012
Available online at http://www.cjasr.com
ISSN: 2251-9114, ©2012 CJASR
83
Spot Weld Growth on 304L Austenitic Stainless Steel for Equal and Unequal
Thicknesses
Nachimani Charde
Department of Mechanical, Material and Manufacturing Engineering, The University of Nottingham Malaysia Campus,
Jalan Broga, 43500 Semenyih, Selangor Darul Ehsan , Malaysia
The austenitic stainless steel (304L) is common material that used in spot welding research. It has been welded
and analyzed for many types of conditions and also for many situations, previously. In this research, unequal
and equal thicknesses were welded and also analyzed for tensile shear strength, hardness changes and
macrograph views. Generally the weld nugget is determined by the process parameters such as welding current,
weld time, electrode force and electrode tips. Noticeably the welding current is the main parameter which creates
the heating effects between metal sheets and unites them together. The current flow is, however, allowed by
sufficient weld time in the welding process. In this experiment, the welding current and weld time were varied
for equal and unequal thicknesses. The results are showing different macro structures and also slightly different
characteristics in terms of hardness and strength.
Key words: Austenitic stainless steel, Stainless steel welding, Spot welding of stainless steel
1. INTRODUCTION
Joining the similar materials with different
thicknesses become common in spot welding. By
joining the unequal thicknesses of base metals, the
characteristic of welded region varies and also
differs in certain characteristic (Dursun, 2011). In
this experiment, the austenitic stainless steel of 1
and 2 mm thicknesses was used to analyze the
changes that affect the weld growth after the
welding process takes place. So the weld region is
separately analyzed for 1mm, 2mm and, of course
for both; the mixed thicknesses. Basically the
growth of weld nuggets is determined by the
welding current, welding time, electrode force and
electrode tips’ areas. The welding current and weld
time were increased while the force and electrode
tip remained constant throughout the experiments
(Shamsul and Hisyam, 2007).
2. MATERIALS AND METHODS
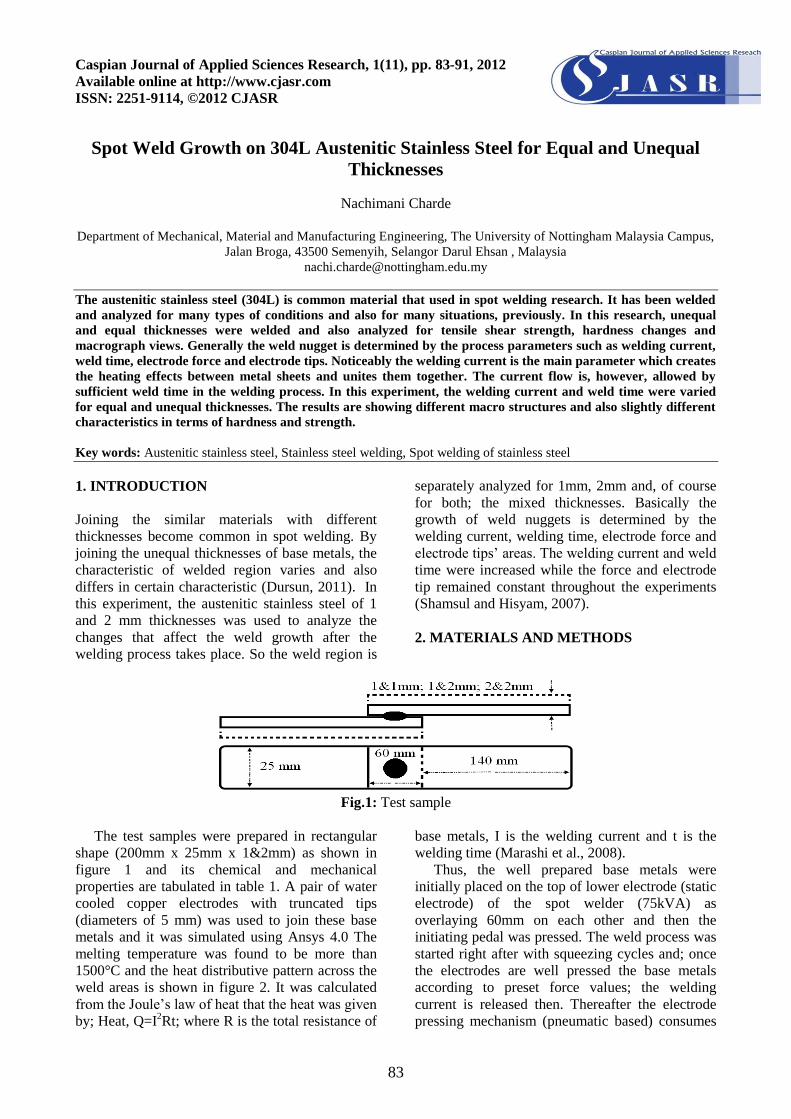
Fig.1: Test sample
The test samples were prepared in rectangular
shape (200mm x 25mm x 1&2mm) as shown in
figure 1 and its chemical and mechanical
properties are tabulated in table 1. A pair of water
cooled copper electrodes with truncated tips
(diameters of 5 mm) was used to join these base
metals and it was simulated using Ansys 4.0 The
melting temperature was found to be more than
1500°C and the heat distributive pattern across the
weld areas is shown in figure 2. It was calculated
from the Joule’s law of heat that the heat was given
by; Heat, Q=I2Rt; where R is the total resistance of
base metals, I is the welding current and t is the
welding time (Marashi et al., 2008). Thus, the well prepared base metals were
initially placed on the top of lower electrode (static
electrode) of the spot welder (75kVA) as
overlaying 60mm on each other and then the
initiating pedal was pressed. The weld process was
started right after with squeezing cycles and; once
the electrodes are well pressed the base metals
according to preset force values; the welding
current is released then. Thereafter the electrode
pressing mechanism (pneumatic based) consumes

Charde
Spot Weld Growth on 304L Austenitic Stainless Steel for Equal and Unequal Thicknesses
84
some time for cold work and returns to the home
position of upper electrode. The basic process
controlling parameters (the current and weld time)
were set before the welding process starts with
constant electrode pressing force (3kN) and round
electrode tips (19.63μm2). By varying the welding
current and weld time from lower to higher values
or from poor welds to good welds and also beyond
good welds; three sets of weld lobe curves were
obtained for equal and unequal base metals
(Pouranvari, 2008).
Table 1: Chemical and mechanical properties 304L (2B) Austenitic Stainless Steel
1mm 2mm
Element Weight % Weight %
C 0.048 0.046
Cr 18.12 18.14
Ni 8.11 8.13
Mn 1.166 1.205
Si 0.501 0.506
S 0.006 0.004
N 0.053 0.051
P 0.030 0.030
Hardness 81.7 (HRB) 86.2 (HRB)
Fig. 2: Simulation of welding process
Fig. 3(a): Weld lobe of 1&1mm base metals
Caspian Journal of Applied Sciences Research, 1(11), pp. 83-91, 2012
85
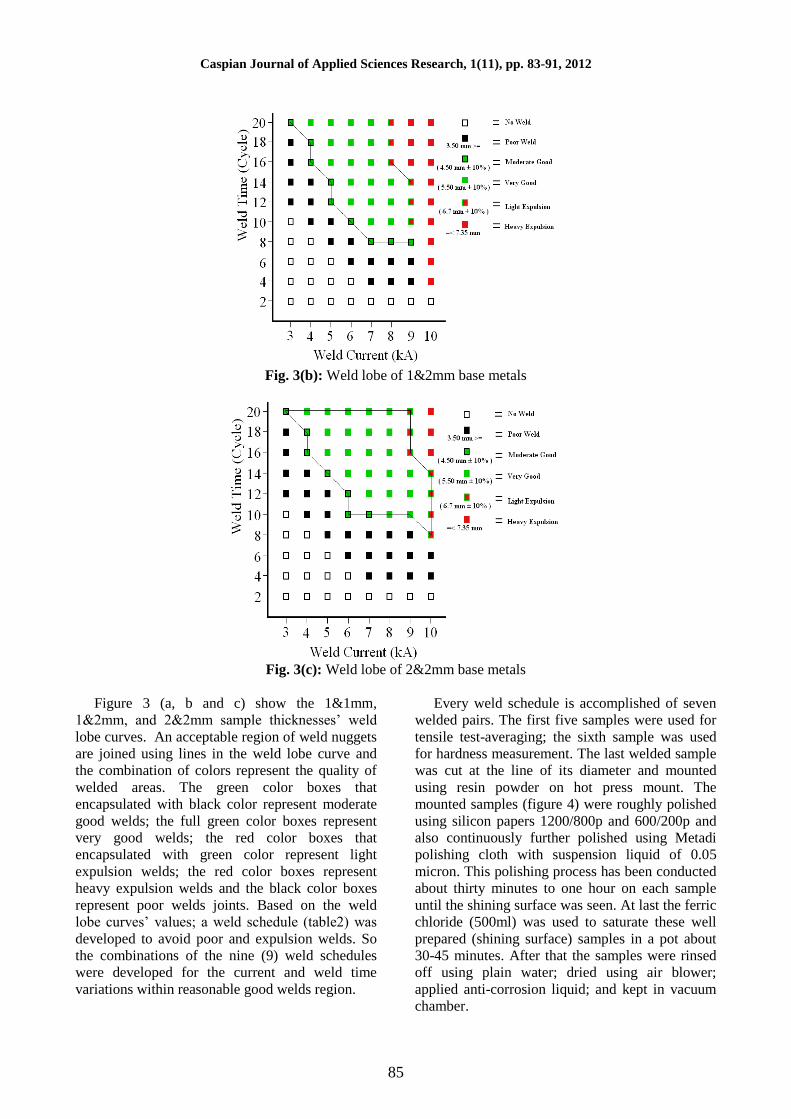
Fig. 3(b): Weld lobe of 1&2mm base metals
Fig. 3(c): Weld lobe of 2&2mm base metals
Figure 3 (a, b and c) show the 1&1mm,
1&2mm, and 2&2mm sample thicknesses’ weld
lobe curves. An acceptable region of weld nuggets
are joined using lines in the weld lobe curve and
the combination of colors represent the quality of
welded areas. The green color boxes that
encapsulated with black color represent moderate
good welds; the full green color boxes represent
very good welds; the red color boxes that
encapsulated with green color represent light
expulsion welds; the red color boxes represent
heavy expulsion welds and the black color boxes
represent poor welds joints. Based on the weld
lobe curves’ values; a weld schedule (table2) was
developed to avoid poor and expulsion welds. So
the combinations of the nine (9) weld schedules
were developed for the current and weld time
variations within reasonable good welds region.
Every weld schedule is accomplished of seven
welded pairs. The first five samples were used for
tensile test-averaging; the sixth sample was used
for hardness measurement. The last welded sample
was cut at the line of its diameter and mounted
using resin powder on hot press mount. The
mounted samples (figure 4) were roughly polished
using silicon papers 1200/800p and 600/200p and
also continuously further polished using Metadi
polishing cloth with suspension liquid of 0.05
micron. This polishing process has been conducted
about thirty minutes to one hour on each sample
until the shining surface was seen. At last the ferric
chloride (500ml) was used to saturate these well
prepared (shining surface) samples in a pot about
30-45 minutes. After that the samples were rinsed
off using plain water; dried using air blower;
applied anti-corrosion liquid; and kept in vacuum
chamber.

Charde
Spot Weld Growth on 304L Austenitic Stainless Steel for Equal and Unequal Thicknesses
86
Table 2: Weld schedule
Sample
No
Weld
Schedule
Thickness
(mm)
Electrode
Tip
Diameter
(mm)
Force
(kN)
Time
(cycle)
Current
(kA)
1-7 1 1&1, 1&2, 2&2 5 3 10 6
8-14 2 1&1, 1&2, 2&2 5 3 10 7
15-21 3 1&1, 1&2, 2&2 5 3 10 8
22-28 4 1&1, 1&2, 2&2 5 3 15 6
29-35 5 1&1, 1&2, 2&2 5 3 15 7
36-42 6 1&1, 1&2, 2&2 5 3 15 8
43-49 7 1&1, 1&2, 2&2 5 3 20 6
50-56 8 1&1, 1&2, 2&2 5 3 20 7
57-63 9 1&1, 1&2, 2&2 5 3 20 8
a) 1&1 mm b) 1&2 mm c) 2&2 mm
Fig. 4: Hot pressed-cross sectional area of welded samples
3. RESULTS AND DISCUSSION
3.1. Tensile shear results
The tensile test was conducted using 100kN tensile
machine. The ultimate tensile strength was taken at
the final value of pulling force at which the
fracture begins. Five samples were used to average
weld strength of a weld schedule. When the
welding current was increased from 6 to 7 and 7 to
8 kA; more heat was developed across the weld
areas and resulting diameter increments regardless
of thicknesses (Jamasri et al., 2008). So the nugget
diameters’ increment has caused strong bounding
between base metals and also requires high tensile
force to break the joints. Similar increment is
noticed when the weld time was increased from 10
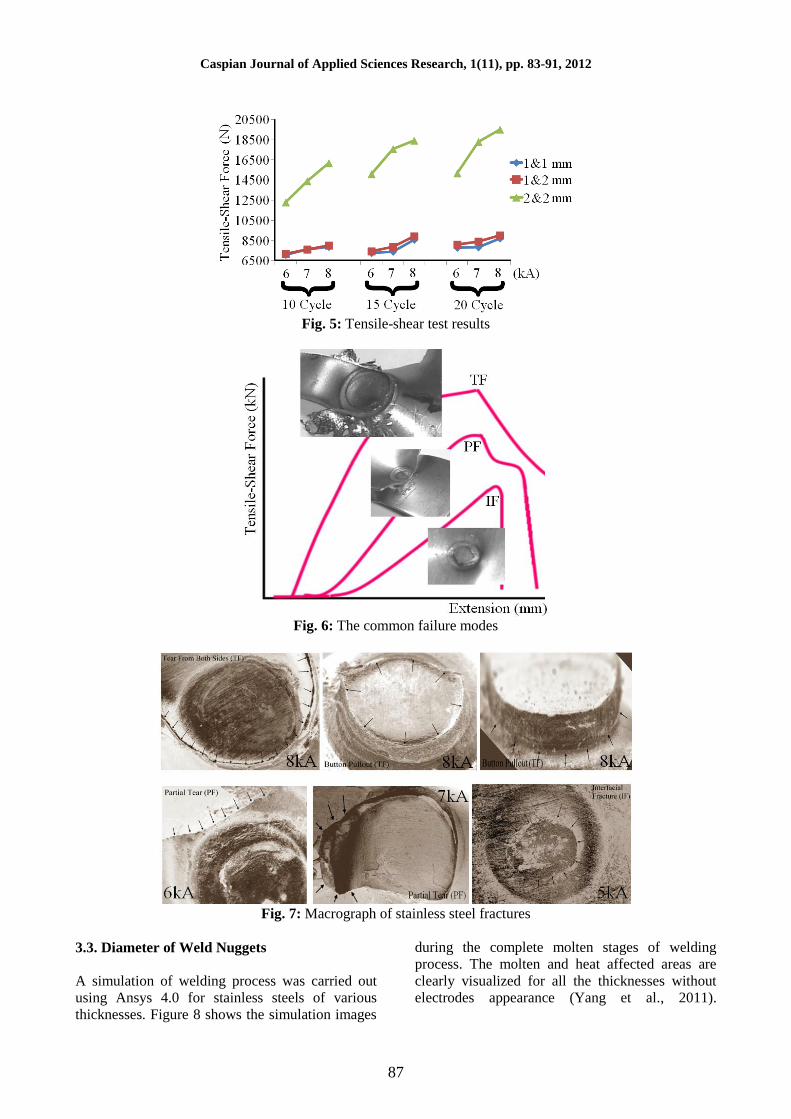
to 15 and 15 to 20 cycles. Figure 5 shows the
tensile strength of all; 1&1mm, 1&2mm and
2&2mm. Although the strength incremental pattern
seemed to be almost same for all the samples, the
required breaking strength varies. The 2&2mm
thickness sheets require the pull-to-break force
from 12.5 to 19.5kN. The 1&2mm mixed-
thickness sheets require 7 to 9.5kN while 1&1mm
thickness sheets require 6.7 to 9kN.
3.2. Failure modes
The failed tensile-shear test pieces showed three
main fracture modes. Poor welds (low fracture
force and small nugget diameter) were
characterised by interfacial fracture (IF) – fracture
through the nugget in the junction plane between
the faying sheets. Moderate to good welds showed
tearing on either side of the nugget in the base
metal (partial-tearing-failure - PF). Very good
welds were strongly bonded to both sheets and
therefore it tears on both sides (TF) or a perfect
button pull out will results (Martín, 2009). Figure 6
indicates the common failure modes and the
corresponding tensile strength curve. These types
of curves were seen for base metals fracture during
tensile test regardless of thicknesses. Moreover the
equal thicknesses (1&1 mm or 2&2 mm) weld
fractures seemed to be well balanced on the joint
areas. However the unequal thickness weld
samples were always broken at 1mm sheet sides
rather than 2mm sheet sides.
Caspian Journal of Applied Sciences Research, 1(11), pp. 83-91, 2012
87
Fig. 5: Tensile-shear test results
Fig. 6: The common failure modes
Fig. 7: Macrograph of stainless steel fractures
3.3. Diameter of Weld Nuggets
A simulation of welding process was carried out
using Ansys 4.0 for stainless steels of various
thicknesses. Figure 8 shows the simulation images
during the complete molten stages of welding
process. The molten and heat affected areas are
clearly visualized for all the thicknesses without
electrodes appearance (Yang et al., 2011).

Charde
Spot Weld Growth on 304L Austenitic Stainless Steel for Equal and Unequal Thicknesses
88
a) 1&1 mm b) 1&2 mm c) 2&2 mm
Fig. 8: Simulation results of austenitic stainless steel (Electrodes deleted)
Having considered the real macro graph of
welds for current increment (figure 9, 10 and 11);
three noticeable regions are existed after the
completion solidification process[7]
. Firstly the
fusion zone (FZ) undergoes complete melting
during welding process and solidify once the
welding process is over. It was appeared with
coarse grains and the distance expanded
horizontally in all direction is the exact width
(diameter) of the weld joint. The upper electrode
that pressing the welding region has created the
micro indentation during the molten metal’s
expansion. The heat affected zone (HAZ) is existed
due to the heat expansion in all direction from the
fusion zones while heating process is going on.
This leads to the slight alteration of grain sizes
when solidification happens. It is seen with finer
coarse grain as compare to fusion zone. It starts
from the outer border of exact fusion zone and
spreads outwards in all direction to certain extends.
The base metal (BM) is not affected during the
welding process as the microstructures remain
unchanged (Fukumoto, 2008). Figure 12 shows the
width (diameter) and height (indentation) that
obtained for current increments.
a) 6kA b) 7kA c) 8kA
Fig. 9: Macrograph of 1&1 mm austenitic stainless steel
a) 6kA b) 7kA c) 8kA
Fig. 10: Macrograph of 1&2 mm austenitic stainless steel
a) 6kA b) 7kA c) 8kA
Fig. 11: Macrograph of 2&2 mm austenitic stainless steel

Caspian Journal of Applied Sciences Research, 1(11), pp. 83-91, 2012
89
Fig. 12: Nugget size of all the thickness
When the current was increased from 6 to 7 and
7 to 8 kA, the width (diameter) was increased and
the height was decreased accordingly. This
phenomenon was noticed for all the thicknesses of
base metals. However the 2&2mm sheets have
higher thicknesses and therefore the indentations
were seen to be slightly higher than the 1&1mm
and 1&2mm sheets. Moreover higher the welding
current then easier the porous existed within the
fusion zones.
3.4. Hardness test results
The hardness test was carried out for all the
thicknesses’ weld joints (Aravinthan et al., 2011).
The hardness was measured from left hand sides
through the heat affected zones; then fusion zones;
again the other side heat affected zones and ended
with the right hand side of base metals. The
hardness of welded areas seemed to be noticeably
increased but slightly varied from one thickness to
another. Thus: when the 1mm base metals are
concerned then the unwelded areas (BM) seemed
to be an average hardness of 81.5 (HRB) but the
welded areas seemed to be about 92 (HRB).
Furthermore the hardness of heat affected zones
(HAZ) was lower than the fusion zones but higher
than the base metals about 87 (HRB). Figure 13
shows the hardness distribution of 1mm weld
joints.
Fig. 13: Hardness of 1&1mm thickness sheets
Similar pattern of hardness distribution was
seen for the other two thicknesses of weld joints.
Figure 14 and 15 show the hardness distribution of
1&2mm and 2&2mm sheets, respectively.

Charde
Spot Weld Growth on 304L Austenitic Stainless Steel for Equal and Unequal Thicknesses
90
Fig. 14: Hardness of 1&2mm thickness sheets
Fig. 15: Hardness of 2&2mm thickness sheets
The unwelded areas (BM) of 2mm thickness
was measured to be an average hardness of 86
(HRB) but the welded areas seemed to be about 96
(HRB). Meanwhile the hardness of heat affected
zones (HAZ) was lower than the fusion zones but
higher than the base metals about 88 (HRB) as
how the 1mm thickness welds joint resulted.
Moreover the average hardness of dissimilar
thickness welded zone was about 96 (HRB)
approximately. The heat affected zones was
resulted an average of 89 (HRB) in the dissimilar
weld joints. In overall the hardness of welded
zones are slightly increased regardless of
thicknesses due to the solidification process
(Aravinthan et al., 2011).
4. CONCLUSION
This paper looks into the spot weld growth on
304L (2B) austenitic stainless steel with various
thicknesses and; it concludes that
1. Increase in welding current and welding time
within the welding lobe have resulted increment of
weld nuggets width but simultaneously reduced the
height of weld nuggets regardless of thicknesses.
2. The increments of tensile strength were
observed due to the enlargement of welded areas
within the welding lobe regions.
3. The failure modes of tensile tested samples were
seen to be as normal as other materials’ failures
except dissimilar thicknesses weld joints. The
dissimilar thicknesses were fractured at the lower
thicknesses sheets sides, always.
4. The common three failure modes were seen as
poor weld produces interfacial fracture (IF);
medium weld produces tear form one side (PF);
and a good weld produces button pullout or tear
from both sides (TF).
5. The simulation and experimental weld bead
shapes were almost same to one another except the
intersecting lines in the weld nuggets.

Caspian Journal of Applied Sciences Research, 1(11), pp. 83-91, 2012
91
6. The hardness values of welded areas were
slightly increased due to the cold work of stainless
steel. However the hardness distributions along the
welded areas were seen to be fluctuating regardless
of thicknesses. Furthermore the increase in
welding current or welding time does not influence
the changes in hardness distribution along the
welded areas.
7. Macro structure exhibits the coarsened grains at
fusion zone, refined grains at heat affected zone
and unchanged grains at base metal; obviously
regardless of thicknesses.
REFERENCES
Aravinthan A, Nachimani C (2011). Analysis of
Spot Weld Growth on Mild and Stainless
Steel. Welding Journal, 143-147.
Aravinthan A, Nachimani C (2011). Metallurgical
Study of Spot Weld Growth on Mild Steel
with 1mm and 2mm Thicknesses. Journal -
The Institution of Engineers, Malaysia, 72
(4): 46-54.
Dursun O (2008). An Effect of Weld Current and
Weld Atmosphere on the Resistance Spot
Weld Ability of 304L Austenitic Stainless
Steel. Materials and Design 29: 597-603.
Fukumoto S, Fujiwara K, Toji S, Yamamoto A
(2008). Small Scale Resistance Spot
Welding of Austenitic Stainless Steels.
Materials Science and Engineering A, 492:
243-249.
Jamasri MN, Ilman R, Soekrisno , Triyono (2011).
Corrosion Fatique Behaviour of RSW
Dissimilar Metal Welds Between Carbon
Steel and Austenitic Stainless Steel with
Different Thickness. Procedia Engineering,
10: 649-654.
Marashi P, Pouranvari M, Amirabdollahian S,
Abedi A, Goodarzi M (2008).
Microstructure and Failure Behavior of
Dissimilar Resistance Spot Welds between
Low Carbon Galvanized and Austenitic
Stainless Steels. Materials Science and
Engineering, A: 175-180.
Martín O, Tiedra PD, Lopez M, Juan MS, García
C, Martín F, Blanco Y (2009). Quality
Prediction of Resistance Spot Welding
Joints of 304 Austenitic Stainless Steel.
Materials and Design, 30: 68-77.
Pouranvari M (2011). Effect of Welding Current
on the Mechanical Response of Resistance
Spot Welds of Unequal Thickness Steel
Sheets in Tensile-Shear Loading Condition.
International Journal of Multidisciplinary
Sciences and Engineering, 2(6): 178-189.
Shamsul JB, Hisyam M M (2007). Study of Spot
Welding of Austenitic Stainless Steel Type
304. Journal of Applied Sciences Research,
3(11): 1494-1499.
Yang Y, Qu X, Luo Y, Yang A (2011). Effect of
Resistance Spot Welding Parameters on the
Austenitic Stainless Steel 304 Grade by
Using 23 Factorial Designs. Advanced
Materials Research, 216: 666-670.