Unequal Land Relations in North East India - Universiteit Leiden
Upload
khangminh22Category
view
1download
0
127
Ankush Asri,Deepti Bhatia,Urs Fischbacher
Caste and Unequal Access to Education: An Experimental Study

Caste and Unequal Access to Education:
An Experimental Study ∗
Ankush Asri1, Deepti Bhatia †1, and Urs Fischbacher1
aUniversity of Konstanz, Germany & Thurgau Institute of Economics, Switzerland
March 21, 2022
Abstract
We study caste-based discrimination in hiring practices of employers in a lab
experiment in India. Students belonging to different castes are assigned the role
of employees and employers. We test whether employers tend to discriminate in
assessing the abilities of potential employees by varying employees access to educa-
tion. Depending on the treatment, employers are presented information on actual
performance, education and caste belonging of the employees. We find evidence for
initial discrimination in favor of in-group by non-upper caste employers. However,
this preference for in-group changes with time. Over time, as employers learn based
on the experience gained in the experiment, they statistically discriminate in favor
of upper caste employees.
Keywords: Caste, discrimination, labour market outcomes, experiments
JEL Codes: C91, D63, D91, J71
∗We are particularly grateful to Jaison Manjaly for his support in conducting the experiment. Wethank the participants at UEA Discrimination and Diversity Workshop (2021), International Conferenceof the French Association of Experimental Economics (2021), Centre for Development Studies Seminar(2021) and the research group at the Thurgau Institute of Economics (TWI) for helpful comments andfeedback.
†Corresponding authorE-mail addresses: [email protected] (A. Asri), [email protected] (D. Bhatia),[email protected] (U. Fischbacher)
2

1 Introduction
Discrimination has been shown in different domains such as the labour or the housing
market (Bartos et al., 2016; Bertrand and Mullainathan, 2004; Lang and Manove, 2011;
Neumark, 2018), and across different criteria such as gender, race, sexual orientation, or
social class (Carlsson and Rooth, 2012; Lahey, 2008; Oreopoulos, 2011) - even though
it violates norms of fairness and efficiency and, therefore, many societies fight discrimi-
nation using rules, affirmative action and awareness campaigns. These measures help in
reducing blatant discrimination but people could shift discrimination to characteristics
according to which discrimination is not considered as unfair. A particularly important
characteristics in this respect is education. People of disadvantaged groups often get
inferior education, and then, it is not considered inappropriate to discriminate based on
this information or on the resulting skill level. In this study, we use an experiment to
investigate discrimination in such a situation, in which people have different access to
education. We use caste as the criterion people could discriminate on. Even though the
different education levels would provide an excuse for discrimination, we find low levels of
discrimination, and qualitatively correct response to education information and feedback.
The economic literature on labour market discrimination focuses on two main expla-
nations of discriminatory behaviour, taste-based discrimination and statistical discrimi-
nation. Taste-based discrimination occurs when employers have an exogenous preference
for a particular group, which is unjustified and results in differential hiring based on iden-
tity (Becker, 1957). In contrast, statistical discrimination assumes that discrimination
arises due to imperfect information about individuals (Phelps, 1972; Arrow, 1973). Our
research is related to three main aspects of discrimination discussed in the literature. The
first aspect of discrimination focuses on status-based discrimination with respect to the
perceived status-based on race (Bertrand and Mullainathan, 2004), gender (Riach and
Rich, 1987, 2002) or other attributes (Eriksson and Rooth, 2014; Kroft et al., 2013). The
second aspect is related to in-group favoritism such that employers give a higher prefer-
ence to the employees belonging to their own group (Brewer, 1979; Turner et al., 1979;
Messick and Mackie, 1989). The third aspect focuses on endogenous employer learning
which points towards the belief updating of the employers over time as they learn the true
productivity of the employees and the statistical discrimination based on their updated
beliefs (Altonji and Pierret, 2001; Lange, 2007; Lepage, 2021).
In this paper, we investigate how the pre-existing inequality in the form of unequal
access to education interacts with these three aspects of discrimination. We study how
the presence of information about inequality of opportunity affects discrimination based
on favoritism towards a high status group, towards own group and how the employers
3

update beliefs. We conduct a lab experiment in India, where we use the caste identity
of the participants as a form of group identity. The Indian caste system divides the
society into a hierarchical structure with persistent economic and social inequality be-
tween upper castes (high status) and non-upper castes (low status). This division leads
to status-based discrimination, in-group favoritism as well as statistical discrimination
in the labour market (Hanna and Linden, 2012; Siddique, 2011; Banerjee et al., 2009;
Thorat and Attewell, 2007). This persistent inequality of opportunity between the two
caste groups makes the division on caste identity apt for our study. In our experiment,
participants are randomly assigned the role of employers and employees. First, the em-
ployees belonging to upper and non-upper castes learn and answer a set of questions on
general knowledge (GK). Next, the participants assigned the role of employers repeat-
edly choose an employee from a randomly selected pair of employees. The employees are
selected from a group, which comprises of half upper caste and half non-upper caste em-
ployees. The employers are shown the performance and caste belonging and depending
on the treatment, education information of the employees. We introduce unequal access
to education within the experiment by varying the questions selected from learned and
not-learned questions.
We conduct two treatments to understand how information on inequality of educa-
tion affects three aspects of discrimination. In the Caste treatment(C), employers receive
information about the caste belonging and the performance of the two employees in
randomly selected GK quiz questions. In the Caste and Education treatment(CE), the
employers are also shown the education information, in addition to caste and perfor-
mance information. With this experimental design we are able to test if the strength
of discrimination towards the high status, in-group favoritism as well as belief updating
differs between the two treatments. We find that employers do not discriminate in favor
of the high status (upper caste) group in either the CE treatment or C treatment. In
the initial rounds, we find evidence for in-group bias by non-upper caste employers in
both of the treatments. Over time, the employers learn about the true productivity of
different caste groups within the experiment, where on average the upper caste employees
performed better than the non-upper caste employees. In both our treatments, we find
statistical discrimination in favour of upper caste employees in the later rounds due to
learning based on the experience gained in the previous rounds.
The remainder of the paper is organized as follows: Section 2 gives an overview of
the related literature, Section 3 describes our experiment design, Section 4 presents our
results and Section 5 concludes.
4

2 Related literature
A large number of studies have been conducted on the existence of caste-based discrimina-
tion in the labour market.1 Previous correspondence studies point towards the existence
of taste-based discrimination in hiring in the labour market based on caste belonging,
particularly in the private sector. The upper caste applicants are favored and receive
higher call-backs as compared to the non-upper caste applicants (Siddique, 2011). Also,
significant differences in call-back exist in case of call centre jobs, where having good soft
skills is the key criteria (Banerjee et al., 2009). Thorat and Attewell (2007) further ex-
plored the existence of caste-based and religious discrimination in the labour market and
found that upper caste hindus received more invitations for job interviews as compared
to lower caste hindus and muslims. The evidence supporting the existence of taste-based
discrimination in the labour market necessitates measures which can eliminate or at least
reduce the biased perceptions of the employers. Effective interventions to reduce biased
evaluation about future performance of employees include joint assessment of employ-
ees rather than separately. When employees are presented at the same time, employers
are more likely to focus on individual performance signals compared to separate eval-
uations. In separate evaluations, employers are more likely to decide based on group
stereotypes (Bohnet et al., 2016). We focus on the former in this paper.
Our study is closest to Albrecht et al. (2013) and Reuben et al. (2014) who also study
how updating interacts with discrimination. Reuben et al. (2014) find evidence for dis-
crimination towards women in hiring decisions even when performance is known and is
same across genders. Their results further suggest that this is due to employers having
biased beliefs about women’s abilities. Albrecht et al. (2013) show that individuals incor-
porate irrelevant information while evaluating others. Individuals from low-performance
groups receive low evaluations on average, even when it is known that the individual per-
forms well. This implies that even in the presence of new information, the evaluators do
not fully update their prior beliefs about certain groups. Their results indicate that the
bias exists in both gendered and non-gendered setup.2 Their study focuses on discrimina-
tion arising due to conservatism in updating, while we study caste-based discrimination
due to lack of updating. In addition, we also study if (and how) the employers discount
the unequal access to education of potential employees. In our design, if the employers
will completely update their beliefs in the presence of caste and education information,
their evaluations will not be biased in favor of a particular caste group based on taste.
1See Banerjee and Knight (1985). For an overview of literature on hiring discrimination, see (Baert,2018); (Quillian et al., 2017)
2The finding that gender differences exist in updating behaviour is consistent with the previousliterature on updating (Charness and Levin, 2005); (Dohmen et al., 2009); (Mobius et al., 2011)
5

3 Experiment Design
The study consists of two parts. In the first part, participants are assigned the role of
employees where they learn and answer a GK Quiz. In the second part, a different group
of participants acts as employers and assesses the performance of the employees (from
the first part) in order to select the better performer among a pair of employees. We use
the evaluation of a better performer as a proxy for hiring, promotion and task allocation
decisions, which are regularly undertaken in the labour market.
The nature of the task is crucial for our design. We choose the task to solve a GK quiz
as it is caste-neutral and large differences in abilities due to caste cannot be assumed in
such a task. Additionally, the learning phase provides an equal opportunity to learn to all
the participants. Our task for the employees is similar to the task proposed by (Eisenkopf
et al., 2013).
3.1 Caste information
The caste system of the Indian society divides the society into mutually exclusive groups
based on occupational segregation.3 The upper caste, comprising of the “General cate-
gory” have a higher status as compared to the non-upper castes which generally comprise
of Scheduled Caste (SC), Scheduled Tribe (ST) and Other Backward Classes (OBCs). We
use these four categories in our experiment and for our analyses, we use the upper caste
and non-upper caste classification.
3.2 Employees
In part one, participants are assigned the role of employees. The task consists of two
phases. In the learning phase, each employee gets an opportunity to learn answers to 60
randomly selected multiple choice questions from a GK Quiz consisting 120 questions.4
This phase lasts for 15 minutes.
In the second phase, employees answer a GK Quiz consisting 120 questions which
includes 60 questions from the learning phase and 60 other questions. The questions
are presented in random order. Each correct answer earned them one point. There was
no penalty for incorrect answers. The duration for the second phase was 30 minutes.
After the completion of both phases, participants filled an anonymous socio-economic
3The origin of the caste system dates back to the 2nd Century BCE, where the four Varnas – Brah-min, Kshatriya, Vaishya and Shudra were mentioned along with their duties (dharma), in the ancientmanuscript “Manusmriti”. The caste system also has a presence in Bangladesh, Nepal, Pakistan and SriLanka. For a brief introduction to the caste system in India, please refer to section A.1 of the Appendix.
4The questions were from a variety of subject areas such as science and technology, economics, politics,sports, history, geography, current and world affairs.
6

questionnaire which comprised of questions about their caste, age, discipline of study,
math grade in high school etc.
3.3 Employers
In the second part, we recruit different participants, who act as employers and have
to evaluate the better performer among a pair of employees based on the information
presented to them. Each employer is randomly assigned a group of 12 employees from
the first part. The assigned group remains the same throughout the experiment. Out
of the assigned 12 employees, 6 employees are from the General category, 3 from OBC
category, 2 from SC category and 1 from ST category. That is, 6 employees belong to
the upper caste and 6 employees belong to the non-upper caste.5 The proportion of
employees assigned to each employer is in line with the reservation shares for different
categories in higher educational institutions.6
We vary an employee’s access to education such that out of the 6 employees from
the General category, 3 employees were randomly chosen to be educated. Out of the 2
employees from OBC category, 1 employee is randomly chosen to be educated. Further,
out of 1 OBC & 1 SC employee and 1 SC and 1 ST employee, 1 employee is educated
from each pair. This procedure ensures that the upper caste employees and non-upper
caste employees are educated with equal probability. Therefore, out of the 12 employees,
3 upper caste employees and 3 non-upper caste employees were educated. Being educated
here means that to determine the performance of the chosen employee, out of 8 questions,
5 questions will be picked up randomly from the learnt questions and 3 questions will be
picked up from the not-learned questions. For the employees who are not educated, 1
question is picked up randomly from the learnt questions and 7 questions are randomly
chosen from the not-learned questions.7 An employee’s access to education remains the
same throughout the session.
The task of the employers is to bet on the better performing employee among a pair
of randomly selected employees from their assigned group. The employers are shown
the performance of the two employees on 8 randomly selected questions from the 120
5Due to a programming error, one of these 12 employees was never selected. This employee was alwaysfrom the general category and his access to education was randomly determined. As we were not awareof the error, the instructions mention 12 employees. In our design section, we explain the situation as itwas presented to the employers.
6In central government funded higher educational institutes, 27% of the available seats are reservedfor OBC category, 15% are reserved for SC category and 7.5% for ST category. This sums the reservationshare to 49.5% of the available seats. 50.5% of the available seats are open to all categories and selectionis based solely on merit.
7It is important to note here that we replace the not-learnt questions for which the performance hasbeen shown once. In simple terms, the questions are picked randomly but with replacement.
7

questions answered in Part 1. The performance on the 8 selected questions is a mix
of learnt questions (i.e. these questions were learnt during the learning phase) and the
not-learned questions.
The employers get information about the performance of employees as well as - based
on the assigned treatment - information about caste and education (number of learned
questions) or only caste information. With respect to the caste information of the em-
ployees, the information displayed to the employers are from the four categories – Gen-
eral/SC/ST/OBC. The education information consists of information about the number
of learnt questions, out of the total 8 questions for which performance is shown. In case
of educated employee, the education information is equal to 5 and in case of not-educated
employee it is equal to 1.
The experiment lasts for 30 rounds. In each round, the employer has to choose
the employee who is more likely to perform better in the not-learned questions. The
better performing employee is decided on the basis of performance in common not-learned
questions where only one of the two employees had answered the question correctly. That
is, the better performer is determined based on a randomly chosen not-learned question.
The employer gains 1 point in each round for correctly predicting the better performing
employee. In case the prediction is wrong, the employer does not receive any points.
After each round, the employers receive feedback about whether their evaluation was
correct or incorrect and if they received any points for the corresponding round.
Treatments - As mentioned above, we vary the availability of information provided to
the employers. In CE treatment, information about the performance, caste and education
(number of learnt questions) of an employee is presented to the employers. In C treatment,
information about an employee’s performance and caste is provided.
3.3.1 Procedure
The participants were students from a premier government engineering college in India.
The participants belonged to several disciplines including engineering, social science, nat-
ural science and humanities. The participants were recruited via email and the experiment
was programmed and conducted using z-Tree (Fischbacher, 2007). All the sessions were
conducted in the computer lab of the institute in November 2019. Participants were
randomly assigned a seat number upon arrival in the lab. They received written instruc-
tions following which they had to answer some control questions in order to assess their
understanding of the task. The participants were informed that the anonymous data
will be used for the next part.8 They were allowed to begin the experiment once they
8The participants signed a consent form explaining them the nature of the study and anonymityof their data before the experiment began. They could withdraw from the study anytime without any
8

answered all the control questions correctly. After the experiment, participants answered
a questionnaire about their demographic information including their caste information.
In part one, we had 103 participants who were assigned the role of employees. On
average, the employee sessions lasted for 75 minutes. The mean age of participants was
19 years. On average, participants earned Rs. 333 (approx. 5 dollars at the time of the
experiment).9 All the participants received their payments privately. The caste belonging
of the employees was – Upper caste: 49 (General - 49), Non-upper caste: 54 (SC: 21, ST:
5 & OBC: 28).
It was ensured that none of the participants in the second part had participated in the
previous part. In total, 145 participants acted as employers. Similar to the first part, the
participants were randomly assigned a seat number upon arrival in the lab. In the written
instructions, all the participants were informed about the first part of the study and were
told how they can earn money. A quiz question from the first part is shown to the second
part participants so that they can judge the difficulty of the task. On average, employer
sessions lasted for 45 minutes and participants earned Rs. 140 (approx. 2 dollars) in CE
treatment and Rs. 130 (approx. 1.9 dollars) in C treatment. The caste membership of
the participants in the CE treatment was – Upper castes: 59 (General - 59), Non-upper
caste: 45 (SC: 8, ST: 10 and OBC: 27) and in the C treatment was – Upper caste: 22
(General - 22), Non-upper caste: 19 (SC: 4, ST: 2 and OBC: 13).
3.4 Hypotheses
Our two treatments allow us to investigate the different sources of discrimination - namely,
in-group bias, discrimination based on status, and discrimination due to conservatism in
updating beliefs. In addition, we test whether employers discriminate in the presence (ab-
sence) of information about access to education and explore the sources of discrimination
in this environment. We expect a higher in-group bias in C treatment as compared to
CE due to absence of education information. Further, we explore the temporal dimension
of discrimination by examining the decisions of the employers in the initial rounds. As
employers receive feedback after every round, they learn about the performance distribu-
tion of employees over time. Learning can mitigate or exacerbate discrimination, based
on an employer’s prior beliefs and actual performance of the employees. We discuss
these possibilities in detail below, starting with the hypothesis on overall discrimination
(status-based, in-group) followed by discrimination in the initial round and employer
repercussions. As public revelation of caste can affect an individual’s behaviour (Hoff and Pandey, 2006),it was a major concern for us. Anonymous caste and performance data was used for part two of thestudy, which ensured that this revelation does not impact the behaviour or performance of employees.
9The payments were equivalent to a day’s minimum wage received by a skilled worker in India.
9
learning.
H1 (Status-based discrimination): Upper caste employees have a higher probability to
be selected. This advantage is higher in the C treatment than in the CE treatment.
The perception that upper caste have higher academic ability as compared to non-
upper caste has existed in the Indian society since a long time. A recent survey by Pandey
and Pandey (2018) shows that majority of students from upper caste believe that upper
caste students have higher academic ability than non-upper caste students. Similar view
is shared by approximately half of the non-upper caste respondents of the survey. Due
to these biased perceptions based on an individual’s caste identity, we expect that, in
general, upper caste employees will be preferred in both of the treatments. This would
further lead to statistical discrimination in the favor of upper caste employees. As in the
CE treatment employers are equipped with additional information (education) about an
employee’s productivity, this should lead to less statistical discrimination as compared to
C treatment. Therefore, we expect that upper caste employees will be chosen more in C
treatment as compared to CE treatment.
H2 (In-group bias): Employers are more likely to select employees belonging to their
own caste than the other caste. In-group bias is higher in C treatment as compared to CE
treatment.
In general, we expect employers to prefer their own caste employees and show a bias
towards in-group. In both CE treatment and C treatment, we expect employers to choose
the employees belonging to their own caste, in particular when the performance (and ed-
ucation) of two employees is the same and one of them belongs to the other caste. In
addition, the presence or absence of education information provides employers an oppor-
tunity to choose their own caste employees. For instance, if an employer prefers own
caste employees and own caste employee performs better than the other caste employee
but is also more educated, then estimating the true ability is difficult as the better per-
formance could be due to higher education. Nonetheless, the employer can discriminate
and choose based on his preference. Thus, we expect that ambiguity in education in-
formation will lead to discrimination. On the other hand, in C treatment, the lack of
education information can exacerbate discrimination. For example, if an employer has
a preference for own caste employees and the own caste employee performs worse than
the other caste employee, the employer can still display in-group bias and choose an own
caste employee by assuming that the own caste employee might not be educated. Due
to lack of education information, we expect in-group bias to be higher in C treatment as
compared to CE treatment.
H3 (Initial discrimination): In the initial rounds, employers discriminate in favor of
10

own-caste employees or upper caste employees.
The employer decisions in the initial rounds convey their prior beliefs about the abil-
ities of individuals belonging to different castes. We expect employers to choose their
own-caste employees or upper caste employees (high status group). Since in C treatment
employers are not equipped with education information, it provides them an additional
opportunity to discriminate among different caste employees based on their prior beliefs.
Thus, we expect employers to discriminate more in C treatment as compared to CE
treatment.
H4 (Employer Learning): Employers learn the performance distribution of employees
over time and evaluate employees accordingly.
Since Altonji and Pierret (2001) point towards an updating of employer beliefs over
time in the presence of additional information, we expect employers to initially discrimi-
nate and choose either the upper caste employees (H1) or their own caste employees (H2).
Over time, we expect employers to learn the performance distribution of upper caste and
non-upper caste groups and take their decisions based on the experience in the previous
rounds. The empirical literature on employer learning also points out that employers
learn about employees’ productivity type quickly, as on average their initial expectation
errors reduce by half within a short span of time (Lange, 2007). Hence, we expect that,
over time, discrimination against non-upper caste employees will reduce when employers
repeatedly encounter high performing non-upper caste employees, while controlling for
education.
4 Results
In this section we discuss how information about unequal access to education affects
in-group bias, status-based discrimination, and employer learning across our treatments.
Our results are based on the classification of upper caste (General category) and non-
upper caste (SC, ST, and OBC).10 We find evidence for in-group bias among non-upper
caste employers in the initial rounds in both CE treatment and C treatment. However,
the bias disappears as the employers learn the performance distribution of employees over
time. In contrast to our expectation, we find no status-based discrimination in either of
the treatments. Lastly, we find evidence for statistical discrimination in favor of upper
caste employees in both treatments due to employer learning. In the following section,
we get into the details of these results starting with the performance differences between
the upper caste and non-upper caste employees.
10The category based summary tables are mentioned in the Appendix - Table A2 and A4.
11

4.1 Employees
Figure 1 shows that the upper caste employees perform slightly but significantly better
than non-upper caste employees in both learned and not-learned questions as well as
in total (learned and not-learnt questions together) (Mann-Whitney U test, p-value <
0.001). This performance difference could lead to statistical discrimination in favor of
the upper caste, since on average they perform better.11
0.62 0.65
0.94 0.98
0.30 0.33
0.2
.4.6
.81
Non-Upper CasteEmployees
Upper CasteEmployees
Performance Total Performance Learned QPerformance Not-Learned Q
Figure 1: Average Performance of the Employees belonging to Different Caste
4.2 Employers
With respect to the employers, first we discuss all the possible situations for which they
made a choice. The employers were either shown a pair of employees belonging to the
same caste or different caste. In order to analyse the employer decisions, we conduct a
linear probability regression in which the dependent variable is a dummy for choosing
employee 1. The dependent variable Employee 1 Selected equals 1 if employee 1 is selected
and 0 otherwise. In both the treatments, the decisions of the employers are significantly
11The corresponding figure for the performance of the employees who were randomly assigned to theemployers in the second part of the experiment is shown in the Appendix in Figure A1. The figure showsthat the randomization did not lead to any changes in these performances.
12

affected by the performance (and education) information as shown in the Table 1. How-
ever, this is not the case for caste information. Overall, employers do not discriminate
based on caste in both the treatments.12
Table 1: Probability of Employee 1 being selected
CE Treatment C Treatment
Performance Difference 0.153∗∗∗ 0.065∗∗∗
(0.007) (0.008)
Education Difference -0.449∗∗∗
(0.027)
Employee 1 Upper Caste 0.011 0.033(0.019) (0.032)
Employee 2 Upper Caste -0.018 0.018(0.016) (0.030)
Constant 0.515∗∗∗ 0.464∗∗∗
(0.013) (0.021)
Observations 3120 1230R-squared 0.278 0.104
Note: OLS linear probability model regression where the depen-dent variable is Employee 1 Selected. The variable PerformanceDifference is calculated as Performance Employee 1 - Perfor-mance Employee 2 and ranges from -8 to +8. Similarly, Edu-cation Difference is computed as Education Emp 1 - EducationEmp 2 and ranges between -1 to 1. Robust standard errors inparentheses clustered at employer level. ∗ p < 0.1, ∗∗ p < 0.05,∗∗∗ p < 0.01
The above result included all the possible scenarios for which employers made a choice.
We now focus on the decisions in which the employers encountered a pair of employees
belonging to different castes. First, we investigate whether status-based discrimination
towards the upper caste employees exists. According to our hypotheses (H1), upper caste
employees should be preferred in both treatments, however the extent of discrimination
should be less in the CE treatment due to the presence of education information. Fig-
ure 2 shows the intercept from a linear probability model where the dependent variable
is Upper Caste Selected, which is a dichotomous variable which equals 1 if upper caste
employee is selected by the employer and equals 0 if the non-upper caste employee is
12We conducted the t-tests for the regressions to check if the intercept is significantly different from0.50 and we find that the intercept is not significantly different from 0.50 (p-value = 0.09 in C treatmentand p-value = 0.23 in CE treatment).
13

selected. The corresponding regressions are shown in the Appendix in Table A7. The
regression controls for the difference in performance and education of a pair of employ-
ees. The main coefficient of interest is the intercept, which shows the probability of an
upper caste employee being selected by an employer, given the performance and educa-
tion level of the two employees is the same. Figure 2 shows that the probability of an
upper caste employee getting selected is not significantly different from 0.50 (leftmost
column) in both CE treatment and C treatment. In CE treatment, the probability is
0.52 and in the C treatment this probability is 0.50. Therefore, we reject our first hy-
pothesis that upper caste employees have a higher probability to be selected and that the
extent of status-based discrimination towards the upper caste is lower in CE treatment.13
Result 1: Overall, there is no status-based discrimination towards the upper caste
employees in either of the treatments.
C Treatment
CE Treatment
Ambiguous Info(CE Treatment)
.4 .45 .5 .55 .6 .4 .45 .5 .55 .6 .4 .45 .5 .55 .6
95% c.i.90% c.i.
AllEmployers
Upper CasteEmployers
Non-Upper CasteEmployers
Figure 2: Probability of Upper Caste Employee being Selected
Result 1 shows that, on average, we do not find status-based discrimination in favor or
against an employee based on her caste. However, this result could be driven by in-group
bias of the employers towards own caste employees. The second and third panel of the
13We conducted the t-tests for the regressions in order to check if the intercept is significantly differentfrom 0.50 and we find that the intercept is not significantly different from 0.50 as shown in Table A7 inthe Appendix.
14

Figure 2 show the intercept from a similar linear probability model but also controlling
for the caste of the employer. The corresponding regression table is shown in the Ap-
pendix in Table A8. Overall, we do not find an in-group bias based on the identity of
the employer in either of the treatments. When the employer belongs to the upper caste,
the probability of selecting an upper caste employee with the same performance and ed-
ucation level is 0.51 in CE treatment and 0.48 in C treatment. In both the treatments,
the probability is not significantly different from 0.50 (p-value = 0.07 in CE treatment
and p-value = 0.7 in C treatment). When the employer belongs to non-upper caste, the
probability of selecting an upper caste employee with the same performance and educa-
tion level is 0.49 in CE treatment and 0.51 in C treatment. In both the treatments the
probability is not significantly different from 0.50 (p-value = 0.96 in CE treatment and
p-value = 0.75 in C treatment).
Result 2: Overall, employers do not show in-group bias towards the employees be-
longing to their own caste.
Result 1 and Result 2 focused on the probability of selecting an upper caste employee
when the performance and education levels of the two employees are the same. However,
there can be situations where the information about the performance and education is
ambiguous, that is, it is less informative about the true ability of the employees resulting
in a higher likelihood of discrimination. For example, if an employee is a better performer,
the information about the better performer being more educated makes it less informative
to disentangle if the employee is of higher ability or if the better performance is merely
due to more education. Therefore, our next result focuses on the selection probability
when the performance of the two employees is different and the education information
is ambiguous. The results are focused on a subset of cases where either the upper caste
employee is a better performer but is also more educated, or the non-upper caste employee
is a better performer but is also more educated. This result focuses only on CE treatment
as the education information was not available to the employers in the C treatment.
The last row in Figure 2 shows if the coefficients described above are significantly
different from 0.50.14 The probability of selecting an upper caste employee is 0.51 which
is not significantly different from 0.50 (p-value = 0.51). This indicates that ambiguous
information does not lead to a higher probability of an upper caste employee being se-
lected. This effect does not change when we control for the caste of the employer. When
the employer belongs to the upper caste, the probability of an upper caste employee being
selected is 0.52 which is not significantly different from 0.50 (p-value = 0.16) and when
14The corresponding regression table is shown in the Appendix in Table A9.
15

the employer is non-upper caste the probability is 0.49 which is also not significantly
different from 0.50 (p-value = 0.68).
Result 3: Ambiguity in information about education does not lead to discrimination
or in-group bias based on the caste of the employees.
Table 2: Initial Discrimination
CE Treatment C Treatment
All Emp UC Emp N-UC Emp All Emp UC Emp N-UC Emp
Performance Difference 0.147∗∗∗ 0.160∗∗∗ 0.127∗∗∗ 0.058∗∗∗ 0.057∗∗∗ 0.059∗∗∗
(0.009) (0.011) (0.013) (0.010) (0.012) (0.018)
Education Difference -0.434∗∗∗ -0.465∗∗∗ -0.383∗∗∗
(0.032) (0.044) (0.048)
Upper Caste Employer 0.030 -0.024
(0.026) (0.051)
Period 0.001 -0.001 0.004∗∗∗ 0.004∗ 0.001 0.008∗∗
(0.001) (0.002) (0.002) (0.002) (0.003) (0.003)
Constant 0.479∗∗∗ 0.537∗∗∗ 0.440∗∗∗ 0.456∗∗∗ 0.481∗∗∗ 0.402∗∗∗
(0.028) (0.029) (0.031) (0.046) (0.052) (0.055)
Observations 1749 1009 740 673 345 328
R-squared 0.248 0.301 0.186 0.086 0.075 0.101
P-value for t-test if probability = 12
0.442 0.208 0.064 0.344 0.712 0.089
Note: OLS linear probability model regression where the dependent variable is Upper Caste Selected. Thetitles All Emp, UC Emp and N-UC Emp refer to all employers, upper caste employers and non-upper casteemployers respectively. The variable Period ranges from 1- 30. Robust standard errors in parentheses clusteredat employer level. ∗ p < 0.1, ∗∗ p < 0.05, ∗∗∗ p < 0.01
The above three results focused on determining whether overall, discrimination exists
based on status, in-group, and ambiguity of information. In order to understand the
temporal dimension of discrimination, we discuss the decisions made by employers in the
initial rounds, in which they encountered a pair of employees belonging to different castes.
For this, we conduct a regression analysis based on a linear probability model, where the
dependent variable is Upper Caste Selected. The regression estimates in Table 2 show
that in the initial rounds, the non-upper caste employers tend to favor their own caste
employees in both CE treatment and C treatment. The intercept shows that in the first
round in CE treatment, the probability of upper caste employee being selected by an up-
per caste employer and non-upper caste employer is 0.54 and 0.44 respectively. Also, in
the C treatment, we find evidence pointing towards an in-group bias in the initial round.
In this case, the probability of choosing an upper caste employee in the first round by
16
an upper caste and non-upper caste employer is 0.48 and 0.41 respectively. Thus, we
find that in both CE treatment and C treatment, non-upper caste employers prefer their
own-caste employees in the initial rounds.
Result 4: Non-upper caste employers favor their own caste employees in the initial
rounds in both CE treatment and C treatment.
4.3 Employer Learning
As the employers receive feedback about their selection after every round, we investigate
how they learn and adjust their choices in the subsequent rounds. To understand whether
the employer decisions are motivated by the experience gained in the previous rounds, we
use two approaches. First, we study how the aggregate history, that is, the share of wins
by a caste in the previous rounds affects the decision in the current round. Second, we
explore how the caste of the winner in the immediate previous round affects the decision
in the current round, which can be seen as a recency effect.
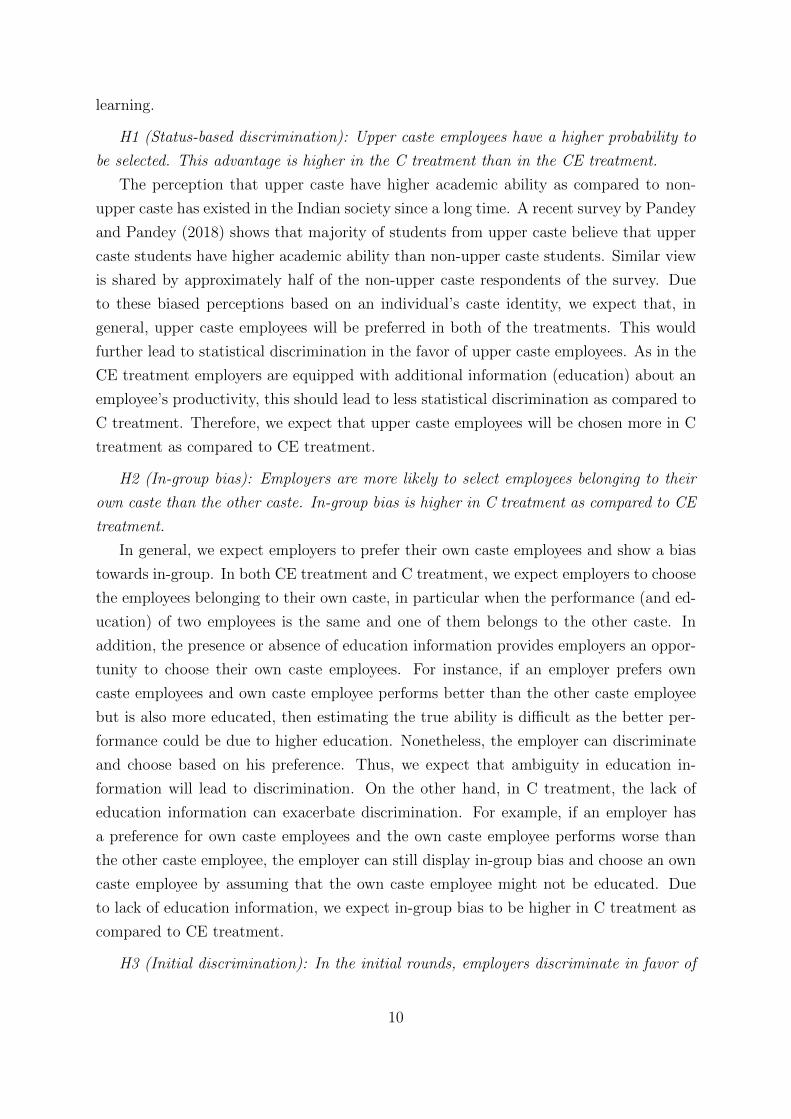
To determine whether the employers learn about the performance distribution of em-
ployees over time, we analyse how the cumulative share of wins by upper castes and
non-upper castes in the previous rounds impacts the decision in the current round. As
shown in Table 3, the variable Share of UC Winners in All Past Rounds shows the
experience of employers from all the previous rounds, while controlling for the perfor-
mance and education differences for a pair of employees. This means that, over multiple
rounds, if employers receive feedback that the upper caste employees performed better
than non-upper caste employees, then the probability that upper caste employee is chosen
will increase. The coefficient of the variable Share of UC Winners in All Past Rounds
in Table 3 shows that, as the cumulative share of wins by upper castes increase, the
probability that an upper caste will be chosen increases by 0.11 percentage points in CE
treatment and by 0.35 percentage points in C treatment. In both the treatments, the
cumulative share of wins by a caste significantly impacts the decision of the employers.
Thus, the decision of the employer to choose an upper caste or non-upper caste employee
(in addition to education and performance variables) can be significantly explained by
the experience gained by the employers in the previous rounds.
For our second approach, we test if the probability of an upper caste employee getting
selected is affected by the experience from immediate preceding round (depicted by the
variable Share of UC Winner in Previous Round in Table 3). The variable equals 1 if
an upper caste employee was a better performer in the previous round when the two
employees were of different caste, 0 otherwise. In simple terms, we investigate that if
an upper caste employee won in the previous round, are there higher chances that an
17

upper caste employee will be chosen in the current round? In the regression, we control
for the performance difference and education difference. We do not find support for the
recency effect in either of the treatments. The mean estimates of the variable Share of
UC Winner in Previous Round in Table 3 show that in CE treatment, the probability
to choose an upper caste employee increases when an upper caste employee was a better
performer in the previous round although the effect is insignificant.15
From our two approaches, we can infer that employers select employees based on their
aggregate experience in the previous rounds. In both the treatments, the employers learn
the performance distribution of upper caste and non-upper caste employees over time.
However, it is interesting to note that the effect is driven by the non-upper caste em-
ployers in the CE treatment and the upper caste employers in the C treatment (shown
in column 3 and 5 of Table 3). As the upper caste employees performed better than the
non-upper caste employees in the GK quiz, the employers tend to statistically discrimi-
nate in favor of the upper caste employees.
Result 5 – In both CE treatment and C treatment employers learn the performance
distribution of upper caste and non-upper caste employees over time. Employers tend to
statistically discriminate in favor of upper caste employees.
15For a robustness check, we also estimate the learning model including the education difference variablefor C treatment, as shown in Table A10 of the Appendix.
18

Table 3: Learning Model
CE Treatment C Treatment
All Emp UC Emp N-UC Emp All Emp UC Emp N-UC Emp
Performance Difference 0.145∗∗∗ 0.159∗∗∗ 0.125∗∗∗ 0.053∗∗∗ 0.050∗∗∗ 0.055∗∗∗
(0.009) (0.012) (0.013) (0.011) (0.012) (0.019)
Education Difference -0.429∗∗∗ -0.467∗∗∗ -0.369∗∗∗
(0.033) (0.045) (0.048)
Upper Caste Employer 0.033 -0.028
(0.027) (0.048)
Share of Upper Caste Winners:
All Past Rounds 0.113∗ 0.022 0.225∗∗ 0.349∗∗∗ 0.462∗∗ 0.229
(0.057) (0.065) (0.087) (0.129) (0.172) (0.194)
Previous Round 0.007 0.009 0.004 -0.013 -0.012 -0.013
(0.026) (0.034) (0.041) (0.044) (0.058) (0.068)
Constant 0.422∗∗∗ 0.505∗∗∗ 0.360∗∗∗ 0.309∗∗∗ 0.214∗ 0.390∗∗∗
(0.041) (0.035) (0.059) (0.080) (0.108) (0.120)
Observations 1645 949 696 632 323 309
R-squared 0.245 0.296 0.188 0.097 0.111 0.081
Note: OLS linear probability model regression where the dependent variable is Upper Caste Selected. Thetitles All Emp, UC Emp and N-UC Emp refer to all employers, upper caste employers and non-uppercaste employers respectively. The variable Share of Upper Caste Winners: All Past Rounds refers to thecumulative share of times when upper caste employee was a better performer compared to non-upper casteemployee. Share of Upper Caste Winners: Previous Round is a dummy variable which represents the casteof employee who was the better performer in the last round. The variable takes the value 1 when theupper caste employee was a better performer and equals 0 when the non upper caste employee was a betterperformer. Robust standard errors in parentheses clustered at employer level. ∗ p < 0.1, ∗∗ p < 0.05, ∗∗∗
p < 0.01
19

5 Conclusion
This paper examines caste-based discrimination in the presence of unequal access to
education. We focus on how the inequality of opportunity interacts with status-based
discrimination, in-group bias and employer learning. We employ an experimental setting
where employees are given an opportunity to learn answers to questions from a GK quiz.
We vary their access to education in a manner in which the number of learned questions
relevant for calculating their performance vary. The employers evaluate an assigned pair
of employees and choose an employee who is a better performer in a not-learned ques-
tion. Based on the treatment assigned to the employers, in addition to the performance
information, they either receive information about caste belonging and education (CE
treatment) or only caste information (C treatment). The two treatments allow us to test
if the employers discount for the education information (when available) during evalu-
ation, such that they fully update their beliefs and do not discriminate based on their
taste or preference for a particular caste group. We find that, on average, upper caste
employees perform better than non-upper caste employees in the GK Quiz. Overall, we
do not find significant evidence for caste-based discrimination across both the treatments.
Also, employers do not discriminate based on caste in decision situations where the em-
ployees belonging to different castes had the same performance and education. Although
non-upper employers exhibit in-group bias in the initial rounds in both the treatments,
this bias disappears with time due to the feedback. Our findings point towards statistical
discrimination in favour of upper caste employees. The employers choose upper caste
employees more often in later rounds as they learn that the upper caste employees are
better performers. This leads us to an important result, that is, employers learn about
the performance distribution of employees over time and update their beliefs based on the
available information. The employer evaluations can partly be explained by the cumula-
tive experience gained in the previous rounds as it significantly impacts their evaluation
decision in both the treatments. Our result is in line with the previous literature on
employer learning (Altonji and Pierret, 2001; Lange, 2007).
Although many previous correspondence studies point towards the existence of caste-
based discrimination in the labour market, we do not find significant evidence of caste-
based discrimination in our setting. There can be several possible reasons behind this
result as different features of our design could affect discrimination. A probable reason
can be that the employers found the task too difficult such that they could not assess the
better performer correctly. However, we intentionally made the task difficult such that
the employers have an environment where it is easy to discriminate implicitly. Also, the
employers answer a set of control questions before the experiment which ensures their
20

understanding of the task. The absence of in-group bias can also be due to the nature of
our subject pool. The employers were students from a premier engineering institute who
studied and resided with students from different caste groups. These interactions can play
a role in mitigating the caste bias an individual might have in early stages of life. It would
be interesting to check the existence of caste-based discrimination by hiring a different
subject pool at a different location in India. The absence of caste-based discrimination
can also be due to our experiment design, which mitigates the confirmation bias that the
employers in our experiment might have with respect to caste and ability, as we provide
them with feedback on their employee evaluation after every round. Due to the feedback
the employers learn how both the employees fared. For instance, if their prior belief was
that upper caste have higher ability than non-upper caste then after every round of their
employee assessment, they received feedback on whether their assessment was correct
or not and this information might not confirm with their prior belief about abilities of
upper caste and non-upper caste employees. The feedback provided an opportunity to
the employers to update their beliefs and learn the true performance distribution of the
caste groups. In contrast, in the real world, usually employers do not learn about the
performance of employees whom they do not hire.
As caste continues to play a crucial role in determining an individual’s occupation,
it is crucial to address discrimination based on caste through additional measures. In
order to mitigate caste-based discrimination by the employers, it would be beneficial if
the information about inequality of opportunity is made salient to the employers. This
will help them to discount for the inequality and hire accordingly. Also, in line with the
results of the CE treatment, the presence of education information is expected to abate
an employer’s initial discriminatory beliefs about different caste groups.
21

A Appendix
A.1 Caste System in India
The caste system essentially divided the Hindus in a hierarchical manner based on their
occupational structure and their purity. The four categories were – “Brahmins” (priests
and educators), “Kshatriyas” (rulers and warriors), “Vaishyas” (farmers, merchants and
artisans) and “Shudras”(manual labourers). The Brahmins were at the top in the hier-
archal structure followed by Kshatriyas, Vaishyas, and Shudras were at the bottom. The
caste at the top of the hierarchy had the highest social status in the society and were
entitled to a lot of privileges. Both the social status and the privileges reduced gradu-
ally as we move down the caste hierarchy (Simon and Thorat, 2020). People working as
street cleaners, manual scavengers or doing menial tasks were classified as untouchables.
These people, commonly referred as Dalits now, were considered out of the caste system
and were regarded as impure and polluting. Traditionally, dalits were denied the basic
civil rights including right to education, property and right to use public facilities. For
instance, they were denied entry into schools and temples where upper castes used to
participate. Social interaction was also limited among them as they were not allowed to
communicate with upper castes. The occupational based division of the society conse-
quently led to social, political and economic disparities among castes.
After independence, the caste system was formally abolished and the government
introduced affirmative action policies in the form of reservations for the historically dis-
advantaged castes.16 Reservations in higher educational institutes, national and state
legislatures and government jobs were introduced for the Dalits or the untouchables, who
are now known as Scheduled Castes (SCs) and for the tribal communities belonging to ge-
ographically isolated areas, who are referred as Scheduled Tribes (STs). The reservations
were later extended to the Other Backward Classes (OBCs) comprising of people who
were identified as socially and educationally backward on the basis of caste.17 The Gen-
eral category comprises of the upper castes who were historically privileged and continue
to be in a strong socioeconomic position. They are not a beneficiary of the reservation
policy and enjoy the highest social status in the society. Although over the years, caste
inequalities have narrowed with certain improvement in the condition of SCs, inequalities
still persist with respect to income, education and asset ownership (Desai and Dubey,
2012).
The historical practice of division of the society based on the occupational structure
16Article 15 of the Indian Constitution prohibits discrimination against any citizen on the basis ofcaste, religion, race, sex or place of birth.
17Based on the Mandal Commission report, reservations for OBC’s in central government jobs wereintroduced in 1992.
22

has had long lasting consequences. Over the years, considerable segmentation based
on caste, gender, religion and tribe has continued to exist in the Indian labour market.
According to 2011 census data, caste continues to be one of the biggest factor in determin-
ing one’s occupation. The labour market participation of the non-upper caste has largely
been limited to unskilled, low-paying jobs, whereas the upper caste have a higher share
in the high paid occupations. 38.4% of the Indian workers derive a major part of their
income by engaging as casual labourers as compared to 54.7% of the SC workers (De-
partment of Rural Development, 2011) 18. A large section of OBCs are concentrated
in low productivity employment sectors such as agriculture and construction. Also, the
non-upper castes are least likely to run an enterprise (Labour Employement Report,
2014). On the other hand, as a result of affirmative policies, the proportion of SCs and
STs having a central government job increased to 17.41% and 7.42% respectively (GoI,
2020). In professions such as health care, teaching and police, which have a substantial
government presence, the non-upper castes are now being represented in proportion to
their population. However, in the private sector they continue to have miniscule presence.
In contrast, the upper castes have significant presence in the private sector. Over 90% of
the top jobs in the private sector such as business professionals and corporate managers
are held by individuals who do not belong to the SC/ST category (ToI, 2018). A major
limitation of the affirmative action policy is its applicability to only the government jobs,
which constitutes a very small share of the total jobs in the economy.
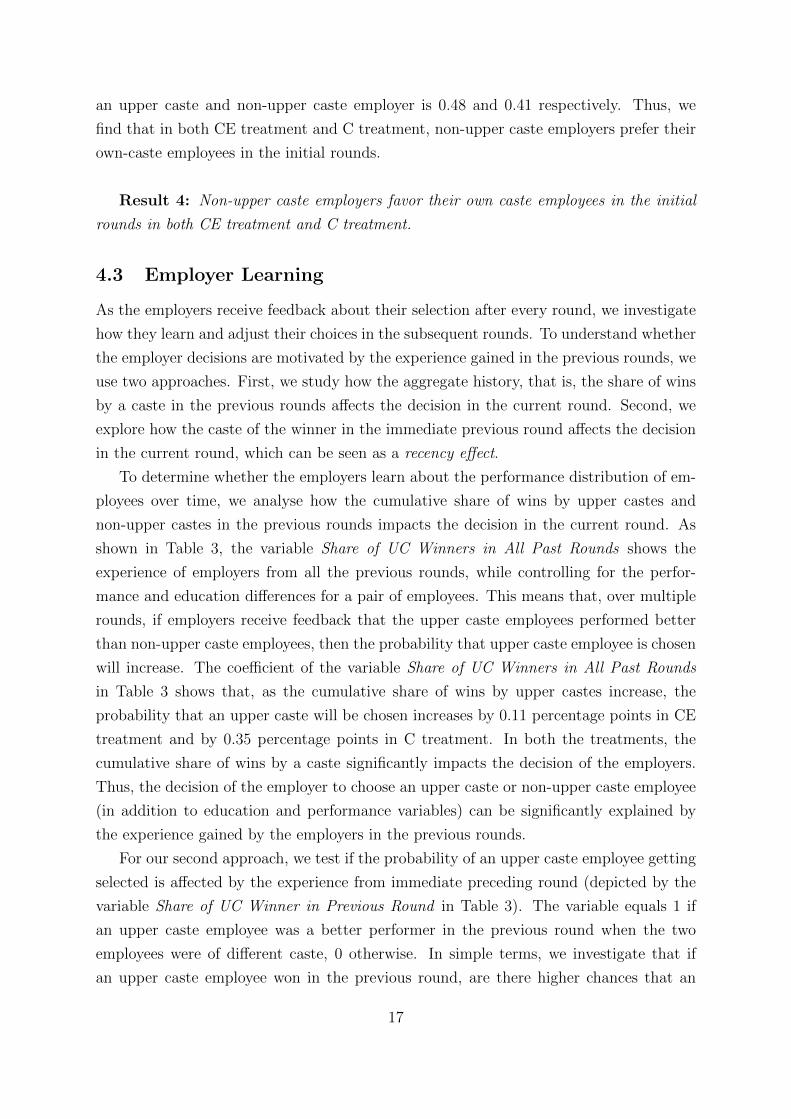
A.2 Summary Statistics - Employees
Table A1 shows the summary statistics of the employees based on the caste categories
in the reservation system (General, SC, ST and OBC) and Table A2 combines all the
non-upper castes into one category (General category is the upper caste and the rest of
the categories are non-upper caste).
18Socio Economic and Caste Census 2011, Rural households
23
Table A1: Summary Statistics for Employees belonging to Different Castes
Non-Upper Castes Upper Castes Totalmean mean mean
Male 0.98 0.88 0.93Age 18.79 20.04 19.39High school grade 88.18 88.75 88.45Political orientation 4.38 4.27 4.33Interested in politics 2.57 2.56 2.56Performance 0.62 0.65 0.64Performance learned questions 0.94 0.98 0.96Performance not-learned questions 0.30 0.33 0.31Proportions 0.52 0.48 0.50
Table A2: Summary Statistics for Employees belonging to Different Categories
General SC ST OBC Totalmean mean mean mean mean
Male 0.88 0.95 1.00 1.00 0.93Age 20.04 18.70 17.60 19.07 19.39High school grade 88.75 86.70 85.08 89.79 88.45Political orientation 4.27 4.45 4.40 4.32 4.33Interested in politics 2.56 2.55 2.20 2.64 2.56Performance 0.65 0.63 0.58 0.62 0.64Performance learned questions 0.98 0.94 0.90 0.94 0.96Performance not-learned questions 0.33 0.32 0.26 0.29 0.31Proportions 0.48 0.20 0.05 0.27 0.34
Majority of the subjects in our sample were males, apart from some females belonging
to the General category (upper caste). The average age of the subjects was 20 years old
for the General category (upper caste) and 18 years for rest of the categories (non-upper
caste). The high school grade was similar across different categories, so was the political
orientation and the degree of interest in politics. The last three rows of Table A1 and
Table A2 show the performance of the employees in the quiz. The General category
employees performed better than all the other categories for both learned and not-learned
questions (significant at 5 %).
A.3 Summary Statistics - Employers
Table A3 and Table A4 show the summary statistics for the employers. The employer
proportions seem to be similar in both the treatments (approximately 54% are upper
caste and 46% are non-upper caste). This proportion is also quite similar to the em-
24

ployees (52% are upper caste and 48% are non-upper caste). There were relatively more
non-upper caste males in CE treatment (82%) as compared to 68% in the C treatment.
Average age of the participants is similar across treatments and groups at 20 years old.
The upper caste employers have relatively higher high school grades in both treatments
as compared to non-upper caste employers. The political orientation is similar averaging
around 4 (on a scale from 0 to 10) in both treatments, as well interest in politics.
Table A3: Summary Statistics for Employers belonging to Different Castes
CE Treatment C TreatmentNon-Upper Upper Total Non-upper Upper Total
mean mean mean mean mean mean
Male 0.82 0.70 0.75 0.68 0.86 0.78Age 19.93 20.45 20.23 20.16 20.68 20.44High school grade 81.61 88.80 85.75 84.22 87.30 85.87Political orientation 4.32 4.28 4.30 4.00 3.73 3.85Interested in politics 2.48 2.50 2.49 2.47 2.77 2.63Proportions 0.42 0.58 0.51 0.46 0.54 0.50
Table A4: Summary Statistics for Employers belongong to Different Categories
CE Treatment C TreatmentGeneral SC ST OBC Total General SC ST OBC Totalmean mean mean mean mean mean mean mean mean mean
Male 0.70 0.88 0.90 0.77 0.75 0.86 0.50 0.50 0.77 0.78Age 20.45 18.75 19.50 20.46 20.23 20.68 22.00 21.50 19.38 20.44High school grade 88.80 81.80 74.67 84.22 85.75 87.30 86.38 44.20 89.71 85.87Political orientation 4.28 5.00 4.40 4.08 4.30 3.73 3.25 3.00 4.38 3.85Interested in politics 2.50 2.13 2.60 2.54 2.49 2.77 2.25 2.50 2.54 2.63Proportions 0.58 0.08 0.10 0.25 0.41 0.54 0.10 0.05 0.32 0.40
Table A5: Summary Performance for Different Caste Employees
CE-Educated CE-Uneducated C-Educated C-Uneducatedmean mean mean mean
Non-upper 5.57 2.97 5.52 3.07Upper 5.90 3.35 5.81 3.35Total 5.70 3.16 5.63 3.21
Table A5 and Table A6 show the average performance of educated and uneducated
employees in different treatments for different castes and categories. On an average,
25

Table A6: Summary Performance for Different Category Employees
CE-Educated CE-Uneducated C-Educated C-Uneducatedmean mean mean mean
General 5.90 3.35 5.81 3.35SC 5.66 3.14 5.56 3.07ST 5.22 2.67 5.29 2.70OBC 5.63 2.96 5.59 3.15Total 5.70 3.16 5.63 3.21
the General category or the upper caste employees perform better than the employees
belonging to non-upper caste or OBC, SC and ST categories, both in the case when they
are educated or uneducated. This result is in line with the our main result on employee
performance as shown in Figure 1.
A.4 Additional Results
Figure A1 shows the average performance of the upper and non-upper caste employees
who were assigned to the employers in CE treatment and C treatment. The average
performance of upper caste employees with or without education is slightly higher than
the non-upper caste employees. This is in line with our previous result as shown in
Figure 1.
26

0.37 0.42
0.70 0.74
0.2
.4.6
.81
Non-upper casteemployees
Upper casteemployees
CE treatment
0.38 0.42
0.69 0.73
0.2
.4.6
.81
Non-upper casteemployees
Upper casteemployees
C treatmentAv
erag
e pe
rform
ance
Not educated Educated
Figure A1: Average performance of the employees assigned to employers
Table A7: Status-based Discrimination
CE treatment C treatment
Performance Difference 0.147∗∗∗ 0.073∗∗∗
(0.008) (0.013)
Education Difference -0.434∗∗∗ -0.070∗
(0.032) (0.040)
Constant 0.517∗∗∗ 0.499∗∗∗
(0.013) (0.027)
Observations 1749 673R-squared 0.247 0.084P-value for t-test if probability = 1
20.212 0.973
Note: OLS linear probability model regression where the dependent vari-able is Upper Caste Selected. The variable is a dichotomous variable whichequals 1 if the upper caste employee is selected and equals 0 if the non-upper caste employee is selected. Robust standard errors in parenthesesclustered at the employer level. ∗ p < 0.1, ∗∗ p < 0.05, ∗∗∗ p < 0.01
27

Table A8: In-group favouritism
CE treatment C treatment
Performance Difference 0.147∗∗∗ 0.073∗∗∗
(0.008) (0.014)
Education Difference -0.434∗∗∗ -0.070∗
(0.032) (0.040)
Upper Caste Employer 0.031 -0.024(0.026) (0.051)
Constant 0.499∗∗∗ 0.512∗∗∗
(0.021) (0.036)
Observations 1749 673R-squared 0.248 0.085P-value for t-test if probability = 1
2When employer is upper caste 0.077 0.739When employer is non-upper caste 0.968 0.751
Note: OLS linear probability model regression where the dependentvariable is Upper Caste Selected. Robust standard errors in paren-theses clustered at the employer level. ∗ p < 0.1, ∗∗ p < 0.05, ∗∗∗
p < 0.01
Table A9: Ambiguous Information - CE Treatment
(1) (2)
Performance Difference 0.149∗∗∗ 0.149∗∗∗
(0.008) (0.008)
Education Difference -0.440∗∗∗ -0.440∗∗∗
(0.032) (0.031)
Ambiguous Information 0.010 0.012(0.021) (0.021)
Upper Caste Employer 0.037(0.026)
Constant 0.501∗∗∗ 0.478∗∗∗
(0.016) (0.024)
Observations 1523 1523R-squared 0.286 0.288P-value for t-test if probability = 1
2All employers 0.517When employer is upper caste 0.163When employer is non-upper caste 0.685
Note: OLS linear probability model regression where thedependent variable is Upper Caste Selected. Robust standarderrors in parentheses clustered at the employer level. ∗ p <0.1, ∗∗ p < 0.05, ∗∗∗ p < 0.01
28

Table A10: Learning Model with Education Variable in C treatment
CE Treatment C Treatment
All Emp UC Emp N-UC Emp All Emp UC Emp N-UC Emp
Performance Difference 0.145∗∗∗ 0.159∗∗∗ 0.125∗∗∗ 0.066∗∗∗ 0.074∗∗∗ 0.057∗∗
(0.009) (0.012) (0.013) (0.014) (0.020) (0.021)
Education Difference -0.429∗∗∗ -0.467∗∗∗ -0.369∗∗∗ -0.062 -0.110∗ -0.012
(0.033) (0.045) (0.048) (0.042) (0.059) (0.062)
Upper Caste Employer 0.033 -0.029
(0.027) (0.048)
Share of Upper Caste Winners:
All Past Rounds 0.113∗ 0.022 0.225∗∗ 0.339∗∗ 0.428∗∗ 0.229
(0.057) (0.065) (0.087) (0.129) (0.175) (0.195)
Previous Round 0.007 0.009 0.004 -0.008 0.005 -0.013
(0.026) (0.034) (0.041) (0.044) (0.059) (0.069)
Constant 0.422∗∗∗ 0.505∗∗∗ 0.360∗∗∗ 0.305∗∗∗ 0.210∗ 0.388∗∗∗
(0.041) (0.035) (0.059) (0.080) (0.104) (0.120)
Observations 1645 949 696 632 323 309
R-squared 0.245 0.296 0.188 0.101 0.122 0.082
Note: OLS Linear Probability Model regression where the dependent variable is Upper Caste Selected.The titles All Emp, UC Emp and N-UC Emp refer to all employers, upper caste employers and non-uppercaste employers respectively. The variable Share of Upper Caste Winners: All Past Rounds refers to thecumulative share of times when upper caste employee was a better performer compared to non-upper casteemployee. Share of Upper Caste Winners: Previous Round is a dummy variable which represents the casteof employee who was the better performer in the last round. The variable takes the value 1 when theupper caste employee was a better performer and equals 0 when the non upper caste employee was a betterperformer. Robust standard errors in parentheses clustered at employer level.∗ p < 0.1, ∗∗ p < 0.05, ∗∗∗ p < 0.01
29

B Instructions
Instructions - Employees
Welcome! You are now taking part in an experiment.
If you read the explanations below carefully, you will be able to earn money in addition
to 100 rupees which you receive as entry fee for your participation, depending on your
answers.
In this experiment, you have to answer a general knowledge (GK) quiz consisting of 120
multiple-choice questions. For each question, you receive four options out of which only
one is correct. For every correct answer you receive one point. There is no penalty for
incorrect answers. Your pay-out depends on how many points you receive at the end.
You will be paid in cash at the end of the experiment, where the points are exchanged
with the following exchange rate:
1 Point = 3 rupees
All the participants are paid out privately so that other participants cannot see how much
you have earned. Neither your name nor the names of others will be disclosed. We also
only use anonymous data for the analyses. During the experiment, you are not allowed
to speak with the other participants. If you have any questions, please raise your hand
and a member from the experimenter team will come to you.
General Procedure
About the GK Quiz
All the questions are multiple-choice questions with four options. The questions are ran-
domly selected from different subject areas. The more questions you answer correctly,
the higher your payout in this experiment. The experiment consists of two phases.
First Phase - Learning Phase
The first phase is a learning phase in which you have an opportunity to prepare for the
second phase. During the learning phase, you will get an opportunity to learn the correct
answer of 60 randomly selected questions from the 120 questions of the GK quiz. You are
not allowed to take notes. The experimenter present in the room will check compliance
with this rule. An infringement will be punished with exclusion from the experiment.
This phase will last for 15 minutes. You will not be allowed to leave this phase before
30

this duration. The remaining time for this phase will be shown at the top of your screen
(in seconds). After 15 minutes you will automatically switch to the second phase.
The figure below shows the display of the screen. The question along with four answer
options will be displayed. The correct answer is displayed below the answer options.
Figure A2: Screenshot of the Learning Phase
To move to the next question, click on the Save and Next button. In case you want to
revisit a question, click on Mark for Review and Next button. You can skip a question
by pressing the Skip button. You can navigate to a question of your choice by clicking
the question numbers on the right. The color of the box shows whether you have learnt
the question, marked for review or have not learnt it. The box is marked green when you
learn a question and click “Save and Next” button. In case you want to revisit a question
and learn the answer again, you may click on the “Mark for Review and next” button.
The box is marked yellow when you click this button. The box is marked red when you
skip a question and do not learn it.
Second Phase – Answering Phase
In the second phase, you have to answer a GK quiz consisting of 120 questions. The quiz
31

consists of 60 questions from the learning phase and 60 other questions. All the questions
will be presented in a random order. For each correct answer you get one point. No points
will be deducted for an incorrect answer. The second phase will last for 30 minutes. The
figure below shows the display of the screen.
Figure A3: Screenshot of the Answering Phase
The question along with four answer options will be displayed. You can choose the correct
answer by clicking the buttons displayed below the answer options. To move to the next
question, click on the Save and Next button. In case you want to revisit a question later,
click on Review and Next button. You can also skip a question by pressing the Skip but-
ton. You can navigate to a question of your choice by clicking the question numbers on
the right. The colour of the box shows whether you have answered the question, marked
for review or have not answered. The box is marked green when you answer a question
and click “Save and Next” button. If you are not sure about the answer and want to
revisit a question, you may click on the “Mark for Review and next” button. The box
is marked yellow when you click this button. The box is marked red when you skip a
question and leave it unanswered.
At the end of this phase, the questions saved as well as the questions marked for review
32

will be counted as answered. For each correct answer you will receive 1 point. The
questions which are skipped will receive 0 points.
33

Instructions - Employers (CE Treatment)
Welcome! You are now taking part in an experiment.
If you read the explanations below carefully, you will be able to earn money in addition
to 50 rupees which you receive as entry fee for your participation, depending on your
decisions.
This experiment lasts 30 rounds. In each round you have to take one decision. For each
decision you will receive points. Your pay-out depends on how many points you receive
at the end. You will be paid in cash at the end of the experiment, where the points are
exchange with the following exchange rate:
1 Point = 5 rupees
All participants are paid out privately so that other participants cannot see how much
you have earned. Neither your name nor the names of others will be disclosed. We also
only use anonymous data for the analyses. During the experiment, you are not allowed
to speak with the other participants. If you have any questions, please raise your hand
and a member from the experimenter team will come to you.
The experiment consists of two parts. You participate in the second part. It is important
for you to understand the first part as your decisions relate to this first part.
First Part
In the first part, there were 103 participants each of whom answered 120 general knowl-
edge questions. At the beginning of the experiment, the participants had a learning phase,
where they had an opportunity to learn answers to 60 of the 120 questions. After the
learning phase, they answered the quiz consisting of the 60 questions from the learning
phase and 60 unlearnt questions. All the participants answered the same questions. The
questions were multiple choice questions with four options. The questions were randomly
chosen and came from all subject areas. For example, a question from the quiz was:
Question: Which one of the following is the biggest island of Japan archipelago?
A. Honshu
B. Hokkaido
C. Shikoku
D. Kyushu
34

The correct answer is Honshu. If this question could be learned, this answer was provided
in the learning phase. The first part has already been conducted.
Second Part
You are a second part participant. In this part, you will be assigned a group of 12 ran-
domly selected participants from the first part. The group assigned to you stays the same
through- out the session. Neither your identity nor the identity of the 12 participants
assigned to you will be revealed to anyone.
In each round, you will be shown the performance of two randomly selected participants
from your group. The performance shown will be based on eight randomly selected ques-
tions from the 60 questions that these participants answered. Out of these 8 questions,
some of the questions were from the learning phase and some of the questions were not
from the learning phase and hence the participants did not learn answers to these ques-
tions.
Half of the 12 participants that are assigned to you get one question from learned ques-
tions and 7 from the unlearned questions. The other half gets 5 questions from learned
questions and 3 from the unlearned questions. In addition, you will be shown how many of
the 8 randomly selected questions were from the learned questions, for the two randomly
selected participants.
For example, consider a participant who had 5 questions from the learning phase and 3
questions which were not a part of the learning phase and hence the participant could
not learn the answers to these questions. You will be informed that this participant had
5 questions from the learning phase. Similarly, another participant can have 1 question
selected from the learning phase and 7 questions which were not a part of the learning
phase. You will be informed that this participant had one question from the learning
phase.
In addition to the information about performance and the number of learned questions,
you will also be shown the category of the two randomly selected participants, whether
they belong to a General/SC/ST/OBC category.
Your Task
Your task is to choose the participant who is more likely to perform better in the unlearnt
questions. That is, the questions for which the participants did not learn the answers.
35

You gain 1 point in each round in which you correctly predict the participant who is a
better performer in an unlearned question. If your prediction is wrong, you receive 0
points. After each round, you will receive feedback about whether your prediction was
correct or wrong.
The probability to win depends on the number of unknown questions that one partici-
pant answered correctly and the other participant did not. You can think that one of
these questions is randomly drawn in order to determine whether you win. If both the
participants answer exactly the same questions correctly, both have the same probability
to win. In this case, the winner will be randomly chosen by the computer.
For example, assume participant 1 and participant 2 had 10 common unlearnt questions.
Since the learned and the unlearned questions were randomly selected for each partic-
ipant, the number of questions which were unlearnt for both the participants could be
lower than 60. Participant 1 correctly answered question 1 to 4 and participant 2 correctly
answered question 3 to 7. Thus, the questions that participant 1 knew but participant 2
did not know are questions 1 and 2. The questions that participant 2 knew but partici-
pant 1 did not know are questions 5, 6, and 7. So, if your prediction is participant 1, you
win with probability 2/5 and if your prediction is participant 2, you win with probability
3/5. Note that we do not take into consideration the questions that both know (in the
example questions 3 and 4), or both do not know (in the example questions 8, 9, and 10).
Decision Screen
All 30 rounds in the experiment will look like the following on your screen. You see in the
first row the category of the participant, whether they belong to General/SC/ST/OBC
category. In the second row you will be shown how many out of the eight selected ques-
tions were from the learned questions. In the third row you will be shown how many of
the eight selected question were correctly answered.
In the example below, the participant on the left side belongs to General category and
the participant on the right belongs to Scheduled Caste category. The participant on the
left side could learn 5 questions in the learning phase and the participant on the right
side could learn 1 question in the learning phase. This means that participant on the left
side had 3 unlearnt questions and participant on the right side had 7 unlearnt questions.
Out of 8 questions, the participant on the left side answered 7 questions correctly and
the participant on the right side answered 5 questions correctly.
36

Figure A4: Screenshot of the Employer Task in CE Treatment
On this screen you have to choose the participant who according to you is a better
performer in the unlearned questions. To enter your choice, highlight the rectangle that
belongs to the participant by clicking anywhere in the rectangle. If you click, the rectangle
will be highlighted. You can change your choice before clicking the ”Confirm” button.
If you are satisfied with your choice, please click on ”Confirm”. You gain 1 point in
each round in which you make a correct prediction. After each round, you will receive
feedback about whether your prediction was correct or wrong as shown on the results
screen below.
37
Figure A5: Screenshot of the Feedback Screen
If you have any questions after reading the instructions carefully, please raise your hand
and remain seated. The experimenter will come to you. When you have understood
everything, you can start the experiment by answering some questions on your screen.
These questions are asked to make sure you have understood the instructions.
38
References
Albrecht, K., Von Essen, E., Parys, J., and Szech, N. (2013). Updating, self-confidence,
and discrimination. European Economic Review, 60:144–169.
Altonji, J. G. and Pierret, C. R. (2001). Employer learning and statistical discrimination.
The Quarterly Journal of Economics, 116(1):313–350.
Arrow, K. (1973). The theory of discrimination, discrimination in labor markets. Achen-
felter, A. Ress (eds.), Princeton–New Jersey.
Baert, S. (2018). Hiring discrimination: an overview of (almost) all correspondence
experiments since 2005. In Audit studies: Behind the scenes with theory, method, and
nuance, pages 63–77. Springer.
Banerjee, A., Bertrand, M., Datta, S., and Mullainathan, S. (2009). Labor market dis-
crimination in delhi: Evidence from a field experiment. Journal of Comparative Eco-
nomics, 37(1):14–27.
Banerjee, B. and Knight, J. (1985). Caste discrimination in the indian urban labour
market. Journal of Development Economics, 17(3):277 – 307.
Bartos, V., Bauer, M., Chytilova, J., and Matejka, F. (2016). Attention discrimina-
tion: Theory and field experiments with monitoring information acquisition. American
Economic Review, 106(6):1437–75.
Becker, G. (1957). The economics of discrimination. University of Chicago press.
Bertrand, M. and Mullainathan, S. (2004). Are emily and greg more employable than
lakisha and jamal? a field experiment on labor market discrimination. American
Economic Review, 94(4):991–1013.
Bohnet, I., Van Geen, A., and Bazerman, M. (2016). When performance trumps gender
bias: Joint vs. separate evaluation. Management Science, 62(5):1225–1234.
Brewer, M. B. (1979). In-group bias in the minimal intergroup situation: A cognitive-
motivational analysis. Psychological Bulletin, 86(2):307.
Carlsson, M. and Rooth, D.-O. (2012). Revealing taste-based discrimination in hiring:
a correspondence testing experiment with geographic variation. Applied Economics
Letters, 19(18):1861–1864.
39

Charness, G. and Levin, D. (2005). When optimal choices feel wrong: A laboratory study
of bayesian updating, complexity, and affect. American Economic Review, 95(4):1300–
1309.
Department of Rural Development, Ministry of Rural Development, G. o. I. (2011). Socio
economic and caste census.
Desai, S. and Dubey, A. (2012). Caste in 21st century india: Competing narratives.
Economic and Political Weekly, 46(11):40.
Dohmen, T., Falk, A., Huffman, D., Marklein, F., and Sunde, U. (2009). Biased proba-
bility judgment: Evidence of incidence and relationship to economic outcomes from a
representative sample. Journal of Economic Behavior & Organization, 72(3):903–915.
Eisenkopf, G., Fischbacher, U., and Follmi-Heusi, F. (2013). Unequal opportunities and
distributive justice. Journal of Economic Behavior & Organization, 93:51–61.
Eriksson, S. and Rooth, D.-O. (2014). Do employers use unemployment as a sorting
criterion when hiring? evidence from a field experiment. American Economic Review,
104(3):1014–1039.
Fischbacher, U. (2007). z-tree: Zurich toolbox for ready-made economic experiments.
Experimental Economics, 10(2):171–178.
GoI (2020). Annual report 2019–20 of ministry of personnel, public greivances and pen-
sions. new delhi.
Hanna, R. N. and Linden, L. L. (2012). Discrimination in grading. American Economic
Journal: Economic Policy, 4(4):146–68.
Hoff, K. and Pandey, P. (2006). Discrimination, social identity, and durable inequalities.
American Economic Review, 96(2):206–211.
Kroft, K., Lange, F., and Notowidigdo, M. J. (2013). Duration dependence and labor
market conditions: Evidence from a field experiment. The Quarterly Journal of Eco-
nomics, 128(3):1023–1167.
Labour Employement Report, I. (2014). Workers in the era of globalisation. New Delhi:
Academic Foundation.
Lahey, J. N. (2008). Age, women, and hiring an experimental study. Journal of Human
resources, 43(1):30–56.
40

Lang, K. and Manove, M. (2011). Education and labor market discrimination. American
Economic Review, 101(4):1467–96.
Lange, F. (2007). The speed of employer learning. Journal of Labor Economics, 25(1):1–
35.
Lepage, L. P. (2021). Endogenous learning, persistent employer biases, and discrimina-
tion. Persistent Employer Biases, and Discrimination (March 2, 2021).
Messick, D. M. and Mackie, D. M. (1989). Intergroup relations. Annual Review of
Psychology, 40(1):45–81.
Mobius, M. M., Niederle, M., Niehaus, P., and Rosenblat, T. S. (2011). Managing self-
confidence: Theory and experimental evidence. Technical report, National Bureau of
Economic Research.
Neumark, D. (2018). Experimental research on labor market discrimination. Journal of
Economic Literature, 56(3):799–866.
Oreopoulos, P. (2011). Why do skilled immigrants struggle in the labor market? a field
experiment with thirteen thousand resumes. American Economic Journal: Economic
Policy, 3(4):148–71.
Pandey, P. and Pandey, S. (2018). Survey at an iit campus shows how caste affects
students’ perceptions. Economic and Political Weekly, 53(9).
Phelps, E. S. (1972). The statistical theory of racism and sexism. The American Economic
Review, 62(4):659–661.
Quillian, L., Pager, D., Hexel, O., and Midtbøen, A. H. (2017). Meta-analysis of field
experiments shows no change in racial discrimination in hiring over time. Proceedings
of the National Academy of Sciences, 114(41):10870–10875.
Reuben, E., Sapienza, P., and Zingales, L. (2014). How stereotypes impair women’s
careers in science. Proceedings of the National Academy of Sciences, 111(12):4403–
4408.
Riach, P. A. and Rich, J. (1987). Testing for sexual discrimination in the labour market.
Australian Economic Papers, 26(49):165–178.
Riach, P. A. and Rich, J. (2002). Field experiments of discrimination in the market place.
The Economic Journal, 112(483):F480–F518.
41

Siddique, Z. (2011). Evidence on caste based discrimination. Labour Economics, 18:S146–
S159.
Simon, L. and Thorat, S. (2020). Why a journal on caste? CASTE/A Global Journal on
Social Exclusion, 1(1).
Thorat, S. and Attewell, P. (2007). The legacy of social exclusion: A correspondence
study of job discrimination in india. Economic and Political Weekly, pages 4141–4145.
ToI (2018). In 21st century india, caste still decides what you do. The Times of India.
Turner, J. C., Brown, R. J., and Tajfel, H. (1979). Social comparison and group interest
in ingroup favouritism. European Journal of Social Psychology, 9(2):187–204.
42

�>vi�ÃÌÀ>ÃÃi�È��nÓnä��ÀiÕâ���}i�
T +41 (0)71 677 05 10F +41 (0)71 677 05 11
[email protected]�www.twi-kreuzlingen.ch
Copyright © 2022 FDOKUMEN