Unequal-mass mergers of dark matter haloes with rare ... - arXiv
21
MNRAS 000, 1–17 (2021) Preprint 19 January 2022 Compiled using MNRAS L A T E X style file v3.0 Unequal-mass mergers of dark matter haloes with rare and frequent self-interactions Moritz S. Fischer, 1 ★ Marcus Brüggen, 1 Kai Schmidt-Hoberg, 2 Klaus Dolag, 3,4 Antonio Ragagnin, 5,6 Andrew Robertson 7 1 Hamburger Sternwarte, Universität Hamburg, Gojenbergsweg 112, D-21029 Hamburg, Germany 2 Deutsches Elektronen-Synchrotron DESY, Notkestraße 85, D-22607 Hamburg, Germany 3 Faculty of Physics, Universitäts-Sternwarte München, Ludwig-Maximilians-Universität, Scheinerstr. 1, D-81679 München, Germany 4 Max-Planck-Institut für Astrophysik, Karl-Schwarzschild-Str. 1, D-85748 Garching, Germany 5 INAF- Osservatorio Astronomico di Trieste, via G. B. Tiepolo 11, I-34143 Trieste, Italy 6 IFPU - Institute for Fundamental Physics of the Universe, Via Beirut 2, I-34014 Trieste, Italy 7 Institute for Computational Cosmology, Department of Physics, Durham University, South Road, Durham DH1 3LE, UK Accepted XXX. Received YYY; in original form ZZZ ABSTRACT Dark matter (DM) self-interactions have been proposed to solve problems on small length scales within the standard cold DM cosmology. Here, we investigate the effects of DM self-interactions in merging systems of galaxies and galaxy clusters with equal and unequal mass ratios. We perform -body DM-only simulations of idealized setups to study the effects of DM self-interactions that are elastic and velocity-independent. We go beyond the commonly adopted assumption of large-angle (rare) DM scatterings, paying attention to the impact of small-angle (frequent) scatterings on astrophysical observables and related quantities. Specifically, we focus on DM-galaxy offsets, galaxy–galaxy distances, halo shapes, morphology, and the phase–space distribution. Moreover, we compare two methods to identify peaks: one based on the gravitational potential and one based on isodensity contours. We find that the results are sensitive to the peak finding method, which poses a challenge for the analysis of merging systems in simulations and observations, especially for minor mergers. Large DM-galaxy offsets can occur in minor mergers, especially with frequent self-interactions. The subhalo tends to dissolve quickly for these cases. While clusters in late merger phases lead to potentially large differences between rare and frequent scatterings, we believe that these differences are non-trivial to extract from observations. We therefore study the galaxy/star populations which remain distinct even after the DM haloes have coalesced. We find that these collisionless tracers behave differently for rare and frequent scatterings, potentially giving a handle to learn about the micro-physics of DM. Key words: astroparticle physics – methods: numerical – galaxies: haloes – dark matter 1 INTRODUCTION In the standard cosmological model, structures in the Universe such as galaxies and galaxy clusters are thought to form hierarchically, mean- ing that small objects merge to form larger ones (e.g. Lacey & Cole 1993). In particular, cosmological -body simulations have been used to investigate structure formation within the standard ΛCDM model (e.g. Springel et al. 2005; Boylan-Kolchin et al. 2009; Klypin et al. 2011; Pillepich et al. 2017; Hopkins et al. 2018). These sim- ulations agree remarkably well with observations of the large-scale structure (e.g. Springel et al. 2006) and allow us to explain the forma- tion of a wide range of cosmic objects. In the cosmological standard model, today’s Universe mainly consists of dark energy and dark matter (DM), which is thought to be collisionless and cold (cold dark matter – CDM). The underlying nature of those two components is largely unknown. Although the large-scale structure of our Universe is reproduced ★ E-mail: moritz.fi[email protected] (UHH) well by -body simulations assuming only CDM, there seem to be discrepancies between predictions and observations on scales of galaxies. This is often referred to as the small-scale crisis of ΛCDM, which manifests itself in the core-cusp problem, the diversity prob- lem, the too-big-to-fail-problem and the plane of satellites problem (for a review see Bullock & Boylan-Kolchin 2017). Many solutions have been proposed to solve these problems, in- cluding alternative models for DM (e.g. Dodelson & Widrow 1994; Hu et al. 2000). One class of these models assumes that DM is not fully collisionless but that DM particles scatter off each other with a non-zero cross-section (Spergel & Steinhardt 2000). Such models with self-interacting dark matter (SIDM) provide a promising solu- tion to the small-scale crisis (for a review see Tulin & Yu 2018). The dark sector might be strongly coupled to itself, while interac- tions with standard model particles are weak enough to fulfil current constraints from laboratory experiments. In several particle physics models, this would be natural, (e.g. Carlson et al. 1992; Kusenko & Steinhardt 2001; Mohapatra et al. 2002; Frandsen et al. 2011). A variety of SIDM models exist for which the self-interactions can © 2021 The Authors arXiv:2109.10035v2 [astro-ph.CO] 18 Jan 2022
-
Upload
khangminh22 -
Category
Documents
-
view
1 -
download
0
Transcript of Unequal-mass mergers of dark matter haloes with rare ... - arXiv

MNRAS 000, 1–17 (2021) Preprint 19 January 2022 Compiled using MNRAS LATEX style file v3.0
Unequal-mass mergers of dark matter haloes with rare and frequentself-interactions
Moritz S. Fischer,1★ Marcus Brüggen,1 Kai Schmidt-Hoberg,2 Klaus Dolag,3,4Antonio Ragagnin,5,6 Andrew Robertson71Hamburger Sternwarte, Universität Hamburg, Gojenbergsweg 112, D-21029 Hamburg, Germany2Deutsches Elektronen-Synchrotron DESY, Notkestraße 85, D-22607 Hamburg, Germany3Faculty of Physics, Universitäts-Sternwarte München, Ludwig-Maximilians-Universität, Scheinerstr. 1, D-81679 München, Germany4Max-Planck-Institut für Astrophysik, Karl-Schwarzschild-Str. 1, D-85748 Garching, Germany5INAF- Osservatorio Astronomico di Trieste, via G. B. Tiepolo 11, I-34143 Trieste, Italy6IFPU - Institute for Fundamental Physics of the Universe, Via Beirut 2, I-34014 Trieste, Italy7Institute for Computational Cosmology, Department of Physics, Durham University, South Road, Durham DH1 3LE, UK
Accepted XXX. Received YYY; in original form ZZZ
ABSTRACTDark matter (DM) self-interactions have been proposed to solve problems on small length scales within the standard coldDM cosmology. Here, we investigate the effects of DM self-interactions in merging systems of galaxies and galaxy clusterswith equal and unequal mass ratios. We perform 𝑁-body DM-only simulations of idealized setups to study the effects of DMself-interactions that are elastic and velocity-independent. We go beyond the commonly adopted assumption of large-angle (rare)DM scatterings, paying attention to the impact of small-angle (frequent) scatterings on astrophysical observables and relatedquantities. Specifically, we focus on DM-galaxy offsets, galaxy–galaxy distances, halo shapes, morphology, and the phase–spacedistribution. Moreover, we compare two methods to identify peaks: one based on the gravitational potential and one based onisodensity contours. We find that the results are sensitive to the peak finding method, which poses a challenge for the analysisof merging systems in simulations and observations, especially for minor mergers. Large DM-galaxy offsets can occur in minormergers, especially with frequent self-interactions. The subhalo tends to dissolve quickly for these cases. While clusters in latemerger phases lead to potentially large differences between rare and frequent scatterings, we believe that these differences arenon-trivial to extract from observations. We therefore study the galaxy/star populations which remain distinct even after the DMhaloes have coalesced. We find that these collisionless tracers behave differently for rare and frequent scatterings, potentiallygiving a handle to learn about the micro-physics of DM.
Key words: astroparticle physics – methods: numerical – galaxies: haloes – dark matter
1 INTRODUCTION
In the standard cosmologicalmodel, structures in theUniverse such asgalaxies and galaxy clusters are thought to form hierarchically, mean-ing that small objects merge to form larger ones (e.g. Lacey & Cole1993). In particular, cosmological 𝑁-body simulations have beenused to investigate structure formation within the standard ΛCDMmodel (e.g. Springel et al. 2005; Boylan-Kolchin et al. 2009; Klypinet al. 2011; Pillepich et al. 2017; Hopkins et al. 2018). These sim-ulations agree remarkably well with observations of the large-scalestructure (e.g. Springel et al. 2006) and allow us to explain the forma-tion of a wide range of cosmic objects. In the cosmological standardmodel, today’s Universe mainly consists of dark energy and darkmatter (DM), which is thought to be collisionless and cold (cold darkmatter – CDM). The underlying nature of those two components islargely unknown.Although the large-scale structure of our Universe is reproduced
★ E-mail: [email protected] (UHH)
well by 𝑁-body simulations assuming only CDM, there seem tobe discrepancies between predictions and observations on scales ofgalaxies. This is often referred to as the small-scale crisis of ΛCDM,which manifests itself in the core-cusp problem, the diversity prob-lem, the too-big-to-fail-problem and the plane of satellites problem(for a review see Bullock & Boylan-Kolchin 2017).
Many solutions have been proposed to solve these problems, in-cluding alternative models for DM (e.g. Dodelson & Widrow 1994;Hu et al. 2000). One class of these models assumes that DM is notfully collisionless but that DM particles scatter off each other witha non-zero cross-section (Spergel & Steinhardt 2000). Such modelswith self-interacting dark matter (SIDM) provide a promising solu-tion to the small-scale crisis (for a review see Tulin & Yu 2018).The dark sector might be strongly coupled to itself, while interac-tions with standard model particles are weak enough to fulfil currentconstraints from laboratory experiments. In several particle physicsmodels, this would be natural, (e.g. Carlson et al. 1992; Kusenko &Steinhardt 2001; Mohapatra et al. 2002; Frandsen et al. 2011).
A variety of SIDMmodels exist for which the self-interactions can
© 2021 The Authors
arX
iv:2
109.
1003
5v2
[as
tro-
ph.C
O]
18
Jan
2022

2 M. S. Fischer et al.
be velocity-independent or velocity-dependent (e.g. Ackerman et al.2009; Buckley & Fox 2010; Loeb & Weiner 2011; van den Aarssenet al. 2012; Tulin et al. 2013) as several studies have assumed (e.g.Colin et al. 2002; Vogelsberger et al. 2012; Vogelsberger & Zavala2013;Vogelsberger et al. 2014; Robertson et al. 2017b; Banerjee et al.2020; Nadler et al. 2020; Turner et al. 2021). The self-interactionscould be elastic or inelastic (e.g. Essig et al. 2019; Huo et al. 2020)and the differential cross-section may have different shapes. Thelatter implies that the typical scattering angles can be of differentsizes. In the regime of rare self-interacting dark matter (rSIDM),the typical scattering angle is large, the scattering can be isotropicas most studies assumed, but there have also been a few studieswith anisotropic scattering (e.g. Robertson et al. 2017b; Banerjeeet al. 2020; Nadler et al. 2020). In contrast, the regime of frequentself-interacting dark matter (fSIDM) has typical scattering anglesthat are tiny and thus transfer less momentum per scattering eventcompared to rSIDM (Kahlhoefer et al. 2014). There exists a varietyof particle physicsmodels with long-range interactions arising from amass-less mediator. These models have a strongly anisotropic cross-section, which typically is velocity-dependent. This is the case formirror DM (Blinnikov&Khlopov 1983; Kolb et al. 1985; Berezhianiet al. 1996; Foot 2004), atomic DM (Kaplan et al. 2010; Cline et al.2012; Cyr-Racine & Sigurdson 2013) and some other hidden sectorDM models (Feng et al. 2009; Foot & Vagnozzi 2015; Boddy et al.2016).In addition to cosmological simulations, a number of studies have
focused on individual mergers to constrain the nature of DM. Severalstudies simulate galaxy clusters in aΛCDM cosmology including theintraclustermedium (ICM;Poole et al. 2006; ZuHone 2011;Machado& Lima Neto 2015; Zhang et al. 2016; Doubrawa et al. 2020; Mouraet al. 2020). Mergers between galaxy clusters provide important testcases for theories of DM. Dissociative mergers, where the intra-cluster gas becomes separated from the DM haloes, are especiallyinteresting, with known examples including the Bullet Cluster (e.g.Springel & Farrar 2007;Mastropietro&Burkert 2008; Lage& Farrar2014), the ‘El Gordo’ cluster (Donnert 2014; Molnar & Broadhurst2015; Zhang et al. 2015, e.g.), the ‘Sausage’ cluster (Donnert et al.2017; Molnar & Broadhurst 2017, e.g.), A1758N (Machado et al.2015; Monteiro-Oliveira et al. 2016), and ZwCl008.8+52 (Molnar &Broadhurst 2018).In the context of SIDM, merging galaxy clusters have attracted
attention since offsets between the DM component and the galaxiesmay provide evidence for DM self-interactions. There have beenseveral observational studies on galaxy cluster offsets that sparked adebate on the reliability of the largest offsets measured (e.g. Bradačet al. 2008; Dawson et al. 2012; Dawson 2013; Jee et al. 2014, 2015;Harvey et al. 2017; Peel et al. 2017; Taylor et al. 2017; Wittman et al.2018). Here, we focus on offsets that could discriminate betweenrSIDM and fSIDM.From the theoretical side, several numerical studies of galaxy clus-
ter mergers with SIDM have been carried out. Although SIDM en-compasses a wide range of models, most studies assumed elasticvelocity-independent isotropic scattering (Randall et al. 2008; Kimet al. 2017; Robertson et al. 2017a). Robertson et al. (2017b) per-formed the first study of anisotropic scattering. Nevertheless, thesestudies have been limited to large-angle scattering. Meanwhile, fre-quent self-interactions have only very recently been implemented in𝑁-body simulations based on an effective drag force (Fischer et al.2021), which is more generally applicable than the description interms of a heat conduction approach (Kummer et al. 2019).Kim et al. (2017) have performed a parameter study of equal-mass
mergers that demonstrated that offsets between DM and galaxies can
arise from rare self-interactions. Building on this, Fischer et al. (2021)showed that even larger offsets arise when fSIDM is considered, asexpected by Kahlhoefer et al. (2014). Unequal-mass mergers areinteresting since they occur much more frequently than equal-massmergers. In rSIDM, they have been studied in simulations whichreproduce the Bullet Cluster (1E 0657–56) (Randall et al. 2008;Robertson et al. 2017a,b). In addition, there are many studies onstructure formation in rSIDM using cosmological simulations (e.g.Vogelsberger et al. 2012; Vogelsberger et al. 2014; Vogelsberger &Zavala 2013; Peter et al. 2013; Rocha et al. 2013; Despali et al.2019; Banerjee et al. 2020; Nadler et al. 2020; Robertson et al. 2020;Vega-Ferrero et al. 2020; Sameie et al. 2021; Shen et al. 2021).In this paper, we focus on idealized equal and unequal-mass merg-
ers of galaxies and galaxy clusters using 𝑁-body simulations. Al-though the ICM contributes significantly to the total mass of galaxyclusters, we neglect the contribution from gas and consider ideal-ized systems that only consist of DM and galaxies. Likewise, forthe galaxy simulations, we also consider only DM and stars. In ourmodel, the DM is subject to self-interactions that are elastic andvelocity-independent, and we investigate, both, rare and frequentself-interactions.In Section 2,we briefly describe the simulation codewith its imple-
mentation for DM self-interactions and explain our initial conditions.In Section 3, we present the methods of our analysis, especially forthe peak finding. Subsequently, we present the results of our simu-lations in Section 4. In particular, we measure offsets and shapes ofthe merging systems, investigate the morphology and phase–spacedistribution of the mergers and compare peak finding methods. InSection 5, we discuss our results and their physical implications inthe light of the assumptions we have made. Finally, we summarizeand conclude in Section 6. Additional details and plots are providedin the appendices.
2 NUMERICAL SETUP
In this section, we describe our numerical setup including the simu-lation code and the description of the initial conditions.
2.1 Simulation code and implementation of self-interactions
For our simulations, we use the cosmological 𝑁-body code gadget-3, which is a successor of gadget-2 (Springel 2005). For rare andfrequent self-interactions, we are using the implementation describedin Fischer et al. (2021). This means that for the rare self-interactions,a similar scheme to the one introduced by Rocha et al. (2013) isused and the scheme for frequent self-interactions is based on aneffective description employing a drag force (Kahlhoefer et al. 2014)and was introduced in Fischer et al. (2021). In addition to the existingimplementation, we added a time-step criterion and slightly modifiedthe implementation of rSIDM as described below.
2.1.1 Time-step criterion for self-interactions
For both rare and frequent self-interactions, we implemented a time-step criterion that limits the maximum allowed time-step for eachparticle. In this context, our explanation about the time-step scalingfor fSIDM in section 2.4 Fischer et al. (2021) might be of interest.In gadget-3, particles are assigned an individual time-step and
our new criterion does not allow it to be larger than Δ𝑡si, which is
MNRAS 000, 1–17 (2021)

Unequal-mass mergers with SIDM 3
defined as
Δ𝑡si = 𝜏ℎ3
𝜔max 𝑚. (1)
Here, ℎ denotes the kernel size (which is used in the implementationof the self-interactions) and 𝑚 denotes the numerical particle mass.𝜔max is computed as follows
𝜔max = max(𝜔) with 𝜔 =𝜎T̃𝑚𝜒
Δ𝑣 , (2)
where Δ𝑣 denotes the relative velocity of two particles. We compute𝜔 for each particle interaction, and then determine 𝜔max for a givenparticle as themaximumvalue of𝜔 over all interactions involving thatparticle. The size of the time-step can be adjusted by the numericalfactor 𝜏. For frequent self-interactions, this enables the control of therelative velocity change per particle interaction. The simulations inthis paper were conducted with a value of 𝜏 = 0.1.
2.1.2 rSIDM – relabelling of particles
In this paper, we study mergers where we know which halo eachparticle initially belongs to. This information is used in the peakfinding as described in Section 3.1.1. However, when consideringrSIDM, the question of which DM halo a particle belongs to is notas clear as it might seem. Consider two indistinguishable particlesthat belong to different haloes. If they scatter by an angle \ < 𝜋/2,this cannot be distinguished from an event with a scattering angle𝜋−\ > 𝜋/2where the two particles are exchanged. Hence, wemodifyour rSIDM implementation such that particles are not allowed toscatter by angles larger than 90°, but use the smaller angle instead.This has the same effect as relabelling (exchange of host halo labels)the particles for scattering angles larger than 90°. In appendix A, westudy the effects of this modification.
2.2 Initial conditions and simulation parameters
In this paper, we perform a parameter study of head-on collisions ofDM haloes. Initially, the individual haloes are assumed to follow aNavarro–Frenk–White (NFW) profile (Navarro et al. 1996). As thetotal mass of an NFW halo is infinite, it needs to be truncated atsome radius, which we set as 20 times the scale radius, 𝑟𝑠 . We ransimulations for galaxy and cluster-scale mergers, i.e. the main haloeshave virial masses of 𝑀vir,main = 1012 or 1015M� , respectively. Forall haloes, the concentration parameter in the NFW profile, 𝑐, waschosen according to Dutton & Macciò (2014). In Tab. 1, we givethe corresponding scale radius and scale density for our haloes. Allhaloes have an equal number of DM and collisionless galaxy/starparticles. Each of these components follow an NFW profile withthe same value for 𝑟𝑠 . The cluster-scale simulations have a massresolution of 𝑚DM = 2 · 108M� for the DM particles and 𝑚Gal =4 · 106M� for the galaxy particles. For the galaxy-scale simulations,the mass resolution is:𝑚DM = 2 ·105M� and𝑚Star = 4 ·103M� . Inaddition, the haloes contain one more massive collisionless particleat their centre. For the cluster-scale simulations, it may be interpretedas the brightest cluster galaxy (BCG) although it has only a mass of𝑚BCG = 7 · 1010M� .All our mergers are head-on mergers, i.e. their impact parameters,
𝑏, equal zero. Initially, they are separated by a distance 𝑑ini and theyhave a relative velocity of 𝑣ini. We simulate collisionless DM as wellas rare and frequent interacting DM with several cross-sections. Theinitial velocity is chosen such that the sub halo is still gravitationallybound to the main halo. An overview of all runs is given in Tab. 2.
𝑀vir 𝑟𝑠 𝜌0(M�) (kpc) (M� kpc−3)
1015 389.31 1.33 · 1062 × 1014 194.76 1.91 · 1061014 144.53 2.24 · 1061012 19.92 6.56 · 1062 × 1011 9.97 9.64 · 1061011 7.40 1.14 · 107
Table 1. The scale radius 𝑟𝑠 and the density 𝜌0 ≡ 4 𝜌(𝑟𝑠) are given for ourinitial NFW haloes, which have the virial mass 𝑀vir.
𝑀vir,main MMR 𝑑ini Δ𝑣ini 𝜎T̃/𝑚(M�) (kpc) (km s−1) (cm2 g−1)
1015 1:1 4000 1000 0.0, 0.1, 0.3, 0.51015 1:5 4000 1000 0.0, 0.1, 0.3, 0.51015 1:10 4000 1000 0.0, 0.1, 0.3, 0.51012 1:1 500 140 0.0, 1.0, 2.01012 1:5 500 140 0.0, 1.0, 2.01012 1:10 500 140 0.0, 1.0, 2.0
Table 2. Initial condition and simulation parameters for the runs presentedin this paper. 𝑀vir,main denotes the virial mass of the main halo, MMR givesthe merger mass ratio in terms of the virial mass. The initial separation of thetwo haloes centres is given by 𝑑ini, their initial relative velocity is Δ𝑣ini andthey are all head-on collisions. The self-interaction cross-section is 𝜎T̃ (seeequation 3) and the given values have been simulated with rare and frequentself-interactions, except of 𝜎T̃ = 0.0 which corresponds to CDM.
In addition, we simulated the cluster-scale setup of the 1:10 mergeremploying a cross-section of 𝜎T̃/𝑚 = 0.5cm2 g−1 with half theresolution to check that our results are converged.For the self-interactions, we use the momentum transfer cross-
section defined as1
𝜎T̃ = 4𝜋∫ 1
0
d𝜎dΩcms
(1 − cos \cms)d cos \cms . (3)
In addition, we employ a fixed gravitational softening length of𝜖 = 1.2 kpc for the cluster-scale simulations and 𝜖 = 0.06 kpc forthe galaxy-scale simulations. We use an adaptive kernel size for theDM self-interactions, which varies to keep the number of neighbourswithin each particles’ kernel, 𝑁ngb, equal to 64. For fSIDM, a largernumber would lead to more interactions, enabling the use of a largertime-step and reducing numerical noise, but at the same time it wouldreduce spatial resolution and would require the computation of moreparticle interactions. As a compromise, we choose to use the samevalue as in Fischer et al. (2021).
3 METHODS
In this section, we describe how we determine the peaks of our parti-cle distributions and then how we define offsets. As we will describebelow, the peak finding is a complex issue and crucial for the studyof self-interactions in halo mergers. Finally, we will explain how wemeasure halo shapes and compare time-scales across simulations.
1 Note that for the case of identical particles, as implicitly assumed here, thisdefinition is equivalent to the one advocated by Robertson et al. (2017b) andKahlhoefer et al. (2017).
MNRAS 000, 1–17 (2021)

4 M. S. Fischer et al.
3.1 Peak finding
In the literature, one can find various methods to find peaks of parti-cle distributions. For instance, the shrinking spheres/circles method(Power et al. 2003) or parametric fits (Robertson et al. 2017a) or thesearch for density maxima based on kernel density estimates (Kimet al. 2017). Finding peaks for an unequal-mass merger is more dif-ficult than for an equal-mass merger as the peak for the less massivehalo vanishes faster and is harder to detect. In this paper, we use twomethods to find peaks, as we explain in the following subsections.
3.1.1 Gravitational potential based peaks
We employed a peak search strategy that is based on the gravitationalpotential energy of the particles. We use the information of whichhalo a particle initially belongs to, and perform the search for themostgravitationally bound particles of each halo and each particle typeseparately. For instance, the DM potential based peak of the mainhalo is the location of the DM particle that experience the lowestpotential originally from the main halo, where the potential at eachparticle is calculated with respect to only the other DM particles thatwere originally part of the main halo. While this approach does notdirectly map to observationally available information, it does give aninsight into the underlying merger dynamics.In order to speed up the peak search, we employ an octree-like
structure to cluster the particles, where every node is required tocontain no more particles than a given maximum. In the first step,we compute the potential using the nodes of the tree and search forlocal minima. Thus, we estimate the potential at the centre of massof each node and compare it to the neighbouring nodes.In a second step, we investigate particles close to the minima, i.e.
particles that belong to the corresponding node and its neighbours.For the computation of the binding energy of individual particles, wealso use the tree nodes, such that distant particles are not evaluatedindividually, but are clustered in nodes. For the main halo, we searchonly for the global minimum, which is usually the only minimum,although there can be more. The main peak is then given by thecoordinates of the particle where the potential is minimal.For the subhalo we investigate the deepest minimum, but also the
second deepest local minimum provided it exists. Typically, a secondpotential minimum forms at the centre of the main halo and after awhile it becomes the dominant peak as the subhalo merges with themain one. It is worth mentioning that the formation of the secondpeak is strongly affected by the relabelling procedure for rSIDM,which is implemented via a limited scattering angle as described inSection 2.1.2. In Appendix A, we demonstrate the effects from thisprocedure.If the subhalo contains a second peak, we check whether the first
one coincides with the peak of the main halo. If this is the case, wetake the second one as the peak of the subhalo. From some point intime on, this second peak is no longer present as a minimum in thepotential and, consequently, we are no longer able to determine thepeak position of the dissolving subhalo.For our computation of the gravitational potential, we also employ
a gravitational softening length to avoid artefacts from very closeparticles. In contrast to the actual simulations and for the sake ofsimplicity, we use Plummer softening (e.g. Dyer & Ip 1993). A largesoftening length would impact the peak positions. Consequently, wechoose a value that is small enough to obtain reliable peaks butlarge enough to avoid misdetections due to close particles. For theanalysis of the cluster-scale simulations, we use 𝜖 = 1.2 kpc and forthe galaxy-scale simulations, we employ 𝜖 = 0.06 kpc.
Finally, we estimate the error for the peaks by bootstrapping theparticle distribution 24 times and determine the peaks again. Weobtain the error on the peak position by simply using the standarddeviation of the peaks obtained from the bootstrapped haloes. Finally,we set the error to a value that has at least the value of the softeninglength.The peak finding algorithm is illustrated in Fig. 1 and can be
broken down into five steps as follows:
(i) Generation of the mesh.(ii) Estimation of the potential at the positions of the cells.(iii) Search for local minima by comparison with neighbour cells.(iv) Determination of the particle with the lowest potential.(v) Bootstrap distribution to obtain errors on peaks, redo (ii)–(iv).
The peak finding method we are using is not affected by projec-tion effects because we work in all three dimensions. For peaks ofcollisionless particle components, this typically leads to a peak thatcoincides with the position of the single tracer particle placed ini-tially at the halo centre. Note that this is in contrast to methods thatwork in projection as in Kim et al. (2017) or Fischer et al. (2021).However, the three-dimensional approach may not be ideal whencomparing DM-galaxy offsets of simulations to observations, wherethe three-dimensional information is not available. Moreover, ourapproach relies on knowledge to which halo each particle originallybelongs, which can only be traced in simulations.For a comparison with observations, fits of parametric models
seem to be more interesting. They are often used to analyse observa-tional data. Among other things, Robertson et al. (2017b) employedthis method to determine the positions of different components insimulations of a system that was designed to mimic the Bullet Clus-ter. For isotropic scattering, their measured offsets arise solely fromfitting the wake of scattered particles, whereas unscattered particlesbehave in the sameway as the collisionless galaxy particles. In conse-quence, measured offsets depend strongly on the chosen method andour potential based approach may lead to smaller offsets than para-metric fits. Moreover, spherically symmetric parametric models maynot always provide a good description of the DM distribution andan asymmetric model is favourable (Taylor et al. 2017). This prob-lem does not arise in other methods, such as the shrinking spheresmethod.But the shrinking spheres or its two-dimensional analogue, the
shrinking circles method suffers from more severe problems. It ishighly sensitive to the starting position and radius (Robertson et al.2017a). Moreover, for a multiple peak search, extra guidance wouldbe needed to detect the different peaks which is not necessary in themethod based on the gravitational potential that can detect multiplepeaks more easily. Finally, the position of the subhalo can be stronglyaffected by the density gradient of the main halo (Robertson et al.2017a).
3.1.2 Isodensity contour based peaks
In addition to the peak finder based on the gravitational potential,we use a second method which may be more easily transferable toobservations. In this second method, we determine the peaks of theparticle distributions based on isodensity contours in projected two-dimensional density maps (similar to Kahlhoefer et al. 2014). To thisend, we project the density for each component onto a plane in whichthe merger axis lies and determine how many regions exceed a giventhreshold in surface density. Initially, we choose a threshold close tothe maximum surface density and lower it until we find two separateregions that exceed the threshold. For each region, we compute the
MNRAS 000, 1–17 (2021)

Unequal-mass mergers with SIDM 5
Figure 1. Illustration of the peak finding method. Particles (black dots) areclustered in cells (squares) of different sizes adapted to the particle numberdensity. On the basis of the cells, a search for local potential minima (squareswith red lines) is performed. The particles which have locally the lowestpotential (red dots) are searched for in a neighbouring area around the minima(red shaded regions).
centroid of the particles that belong to this region, which gives us thepeak position. We perform this procedure for the DM and galacticcomponent, separately. In contrast to the peak finder described above,this method does not require any information about the origin of theparticles. In order to still be able to assign peaks to haloes, we linearlyextrapolate the peak position of a halo from the past and compare it tothe identified peaks. The one which is closer to the linear predictionis associated with the halo.If the centres of the haloes are too close, we are no longer able to
identify them as separate peaks as we find only one region exceedingthe density threshold. In this case, we use the only peak found for thetwo haloes. As a result, we are not able to give accurate peak positionsfor very small separations and do not show quantities derived fromthe peaks if they are close.Errors on the peak positions are computed via bootstrapping the
particle distribution 24 times. In general, the obtained errors are tinyand thus usually not visible in our plots.
3.2 Offsets
Here, we describe howwemeasure offsets between DM and galaxies,i.e. the distance between their respective peaks. There are multipleways that they could be defined, i.e. how their sign is chosen, buthere we define the offsets between DM and the component 𝑖 by
offset ≡ 𝑥DM − 𝑥𝑖 , (4)
where the coordinate along the merger axis is given by 𝑥. Note thatthis definition is different from the one we used previously in Fischeret al. (2021).
3.3 Halo shapes
In order to compute halo shapes we use the inertia tensor I, with itsmoments of inertia, i.e. its eigenvalues 𝐼1, 𝐼2, and 𝐼3. For 𝑁 pointmasses 𝑚𝑛 at position r𝑛, the inertia tensor is
I ≡𝑁∑︁𝑛
𝑚𝑛 [(r𝑛 · r𝑛) 1 − r𝑛 ⊗ r𝑛] . (5)
Here, 𝐼1 corresponds to the principal axis (or eigenvector) which ismost closely aligned to the merger axis. The ratio of the moments ofinertia gives us a shape variable
𝑠 ≡ 2 𝐼1𝐼2 + 𝐼3
. (6)
For our head-on mergers, we expect 𝐼2 = 𝐼3 due to the symmetry ofthe system and initially our haloes are spherical, which implies 𝑠 = 1.Values larger than one correspond to oblate haloes and values smallerthan one to prolate haloes. In Section 4, we compute the halo shapeseparately for the components of the haloes and with respect to thepeaks determined according to the method based on the gravitationalpotential described in Section 3.1. We consider only particles thatare closer than twice the scale radius of the initial NFW profiles.In contrast to our shape definition often a reduced inertia tensor is
used (e.g. Allgood et al. 2006; Bett 2012; Peter et al. 2013; Vargyaet al. 2021). This is in the context ofmeasuring the shape as a functionof distance. According to Zemp et al. (2011), the 1/𝑟2 weighting ofthe reduced inertia tensor does not improve the shape measurementand they recommend using elliptical shells. However, for our work,we are only interested in an estimate of the shape that allows us tounderstand qualitative differences between DMmodels as a functionof time. That is why we pursue a simplified approach.
3.4 Merger times
Self-interactions can change the merger time of a system, which canbe problematic for a comparison between simulations using differentcross-sections. A system evolved with SIDM may have reached thesecond pericentre but when simulated with CDM after the sametime, it could be in a phase before the second pericentre. To allowcomparison between the same stages in the evolution of a merger, wedefine an internal time 𝜏 of the system
𝜏 ≡𝑡 − 𝑡first pericentre
𝑡𝑚, (7)
where 𝑡𝑚 = 𝑡second pericentre − 𝑡first pericentre gives us the merger time.By definition, 𝜏 = 0 corresponds to the first pericentre passage and𝜏 = 1 to the second pericentre passage. For the analysis of thesimulation, we use the BCGs/BHs to compute the time 𝜏. This has theadvantage that the time is independent of the peak finding algorithmand thus always known.
4 RESULTS
In this section, we present our results on equal and unequal-masshead-on mergers, both, for frequent and rare self-interactions. Inparticular, we focus on the morphology (Section 4.1), DM-galaxyoffsets (Section 4.2), shapes of the haloes (Section 4.3), comparefSIDM and rSIDM (Section 4.4) as well as the peak finding methods(Section 4.5) and examine the phase–space distribution (Section 4.6).The numerical setup used to produce the results is described in
MNRAS 000, 1–17 (2021)

6 M. S. Fischer et al.x
τ = 0 τ = 1
infallphase
firstpericentre
firstapocentre
secondpericentre
secondapocentre
centre of mass
subhalo
main halo
Figure 2. Illustration of the evolution of an unequal-massmerger without self-interactions. The halo position along the merger axis is shown as a functionof the internal merger time 𝜏 (see Eq. 7).
Section 2 and themethods employed to analyse the data are explainedin Section 3.In the following, we call the more massive halo the ‘main halo’ and
the less massive one the ‘subhalo’. We will use this terminology evenin the case of an equal-mass merger in which case the assignment ofthe ‘main halo’ and ‘subhalo’ is arbitrary.In Fig. 2, we illustrate the evolution of an unequal-mass merger
and indicate the different evolution stages of the system. During theinfall phase, the self-interactions do not affect the merger, apart fromcore formation in the two haloes. At the first pericentre passage, self-interactions can be strong and decelerate the DM component. Thiscan lead to a smaller separation of the haloes at the first apocentrepassage and a shorter merger time-scale as well as other phenomenasuch as offsets between the DM and galactic/stellar components.Depending on the DM physics, the haloes coalesce at different rates,such that there can be further apocentre passages or not. In the mostextreme case, self-interactions are so strong that the haloes coalesceon contact. Since stars or galaxies are not subject to self-interactions,they behave differently from SIDM but are affected by the overallgravitational potential. This can lead to differences in the distributionof stars and galaxies between different DMmodels. These differencestend to grow with time as we will see in the following analysis of ourmerger simulations.To simplify the discussion, we will largely concentrate on a 1:10
cluster-scale merger for CDM, rSIDM, and fSIDM in the following.We will fix the cross-section to 𝜎T̃/𝑚 = 0.5 cm2 g−1 for the self-interacting cases, before we come to a comparison of the differentmass ratios and cross-sections. Further details on additional runswith other parameters can be found in the Appendices.
4.1 Morphology
Let us start with examining the physical DM and galactic densitiesin the plane of the merger, where we consider particles within aslice of 100 kpc height. An illustration of the time evolution of themerger is provided as supplementary material. For convenience weshow both, the density of the two haloes combined as well as onlythe density of particles which originally belonged to the subhaloto facilitate the physical intuition of the merger process. We alsopresent DM and galactic components separately for clarity. At the
first pericentre passage, differences between the different DMmodelsare still very small but they grow over time and become significantat later merger stages, so we will mainly concentrate on these in thefollowing. In Fig. 3, we show the subhalo density at 𝜏 = 1.16, i.e.some time after the second pericentre passage. At these later stagesin the evolution we do observe some differences between frequentand rare scatterings.For example, the DM densities of the left-hand column show that
matter is most concentrated for CDM, less for rSIDM, and least forfSIDM. The fSIDM subhalo dissolves faster than its rSIDM counter-part thus distinct DM peaks are only detectable for a shorter periodof time. This is related to differences in the gravitational potential,which affect the galaxy particles and creates distributions that differsignificantly from each other (see right-hand column of Fig. 3).The density at the peak position as a function of time is shown
in Fig. 4. Here, one can see the quantitative differences between theDMmodels. The central density of the subhalo is more affected thanthe main halo and galaxies are less affected than the DM. Usually,the density stays constant or is decreasing, except for short periods ofdensity increase that occur subsequent to pericentre passages. Notethat we measured the mean density within a sphere that has a radiusof 40 kpc. As the density gradient in the vicinity of the peak positionis non-zero, the measured density depends on the chosen radius.However, the results do not qualitatively depend on the selectioncriterion.In Fig. 3, the shapes of the densest regions for rSIDM and fSIDM
look rather different. The matter distribution for rSIDM appears to bevery oblate in the vicinity of the peak for both DM and galaxies. Incontrast, for fSIDM the distribution looksmore prolate. In section 4.3and 4.4.2, we study the evolution of the halo shape. However, for thefSIDMand rSIDM, runs we do not consider the potential based peaksto be accurate enough to compute the shape at the merger stage wediscuss here.With time, the subhalo particles get caught by the main halo. For
fSIDM, a fraction of stripped particles appear as a dense tail inbetween the halo peaks (at the left side of the black circle, lowerright-hand panel of Fig.3). This is less the case for rSIDM.Besides, there are shell-like features in the galactic distribution.
For rSIDM, there seem to be two shells, the peak belongs to one ofthem and another one is in front of it. The fSIDM morphology looksdifferent, there appears to be only one shell which is located in frontof the peak.Based on the morphology, minor mergers seem to be well suited to
distinguish rare and frequent self-interactions. However, in practice,observational limitations could alter the picture. It remains to beseen whether this persists in the presence of baryonic matter andthis will be the subject of forthcoming work. Moreover, we shouldnote that we have only looked at a slice in the merger plane and not aprojected two-dimensional density map, which is more relevant froman observational point of view and may look somewhat different dueto projection effects. For clarity, we only considered the particlesof the subhalo and ignored the main halo which is the dominantcomponent. But even if the main halo is taken into account, onecan recognize differences between DMmodels as we demonstrate inAppendix B.
4.2 Centre of mass distance and offsets
Let us now come to a discussion of the peak positions of the differentsub-components as well as the inferred offsets for our merger simu-lations. In Fig. 5, we show the positions of the peaks of the variouscomponents (DM, galaxies, BCGs) along the merger axis for runs of
MNRAS 000, 1–17 (2021)

Unequal-mass mergers with SIDM 7
2000 1000 0 1000 2000x [kpc]
2000
1000
0
1000
2000y
[kpc
]
10 5
10 4
10 3
10 2
DM d
ensit
y
CDM
MMR=1:10 T/m=0.0 cm2g 1
= 1.16
2000 1000 0 1000 2000x [kpc]
2000
1000
0
1000
2000
y [k
pc]
10 5
10 4
10 3
10 2
Gal.
dens
ity
CDM
MMR=1:10 T/m=0.0 cm2g 1
= 1.16
2000 1000 0 1000 2000x [kpc]
2000
1000
0
1000
2000
y [k
pc]
10 5
10 4
10 3
10 2
DM d
ensit
y
rSIDM
MMR=1:10 T/m=0.5 cm2g 1
= 1.16
2000 1000 0 1000 2000x [kpc]
2000
1000
0
1000
2000
y [k
pc]
10 5
10 4
10 3
10 2
Gal.
dens
ity
rSIDM
MMR=1:10 T/m=0.5 cm2g 1
= 1.16
2000 1000 0 1000 2000x [kpc]
2000
1000
0
1000
2000
y [k
pc]
10 5
10 4
10 3
10 2
DM d
ensit
y
fSIDM
MMR=1:10 T/m=0.5 cm2g 1
= 1.16
2000 1000 0 1000 2000x [kpc]
2000
1000
0
1000
2000
y [k
pc]
10 5
10 4
10 3
10 2
Gal.
dens
ity
fSIDM
MMR=1:10 T/m=0.5 cm2g 1
= 1.16
Figure 3. The subhalo’s physical density of the DM (left-hand side) and the galactic component (right-hand side) in the merger plane is shown for cluster-scalemergers with an MMR of 1:10. The upper panel gives the density for the CDM run, the middle panel for rSIDM, and the bottom panel for fSIDM. All panelsdisplay the density for 𝜏 = 1.16, i.e. sometime after the second pericentre passage. At this stage, the subhalo is moving in the positive 𝑥-direction. Theself-interaction cross-section is 𝜎T̃/𝑚 = 0.5 cm2 g−1. The black circles are drawn around the potential based peak position of the subhalo and have a radius oftwice the initial scale radius. Hence, they indicate the area from which the particles for the shape computation are selected. However, they are shown even in thecase where we considered the peaks as too uncertain for the following analysis (this concerns rSIDM and fSIDM). In the supplementary material, we providethe time evolution as a video.
MNRAS 000, 1–17 (2021)

8 M. S. Fischer et al.
1.0 0.5 0.0 0.5 1.0 1.5 2.0 2.5 3.0103
104
105
106
107
<40
kpc [
Mkp
c1 ]
DMGal
Mvir, main = 1015 M MMR=1:10 T/m=0.5 cm2g 1
CDMfSIDMrSIDM
main halosubhalo
DMGal
Figure 4. The density at the location of the halo peak is shown as a functionof time. The density is computed from the particles within a sphere of 40 kpcaround the peak. Only the particles which initially belonged to the halo inquestion were considered for the density computation. The shaded regionsdisplay the error. Here, we show the central densities for the same simulationsas studied in Fig. 3.
the 1:10 cluster-scale merger. For the same simulations, we displaythe offset in Fig. 6.The peaks were determined by using the potential-based peak
finder described in Section 3.1. This peak finder has the effect thatthe peaks of a collisionless component behave very similarly to theBCG positions. This can be seen when comparing the galaxy peakswith theBCGpositions. For theCDMrun, theDM is collisionless andthus all peaks coincide; the vanishing offsets shown in the upper panelof Fig. 6 demonstrate this. Furthermore, the vanishing DM–galaxyoffset demonstrates how small the peak finding error is. Besides, itseems that the haloes are a little offset from the centre of mass, e.g.the pericentre passage does not coincide with the centre of mass. Thisis only the case for the unequal-mass mergers and might be causedby the asymmetry of the system. During the infall phase, the haloesare deformed due to tidal forces, which may lead to a shift betweenthe centre of mass and the weighted centre of the two peaks.For the CDM and fSIDM run, the first pericentre passage occurs
after roughly 2.1 Gyr. Self-interactions have the effect of reducingthe merger time for the fSIDM run. Also, the second pericentrepassage occurs earlier than for CDM. Another difference betweenSIDM and CDM shows up in the oscillation of the BCGs in the DMpotential. For CDM, the amplitude decays much faster than for SIDMwhere the orbital decay is minimal. This effect exists in unequal-mass mergers as well as in equal-mass mergers as demonstratedin Kim et al. (2017). At a basic level, this reduction in dynamicalfriction with SIDM results from the lowered DM densities in themerger remnant compared with in the CDM case (e.g. see Fig. 4),and the fact that the dynamical friction force is proportional to thebackground density (Chandrasekhar 1943).We note however (as alsodiscussed in Kim et al. 2017) that dynamical friction acting on bodiesorbiting in a cored DM distribution is more complicated than themotion through an infinite constant-density background consideredby Chandrasekhar (1943), and that dynamical friction can vanishalmost entirely in such a case (Read et al. 2006).Before the merging system reaches equilibrium, the common po-
tential becomes deeper and thus the amplitude of the BCGs oscilla-
1 2 3 4 5 6 7t [Gyr]
1000500
0500
10001500200025003000
x [k
pc]
main halosubhalo
CDM Mvir, main = 1015 M
MMR=1:10 T/m=0.0 cm2g 1
main halosubhalo
DMGalBCG
1 2 3 4 5 6 7t [Gyr]
1000500
0500
10001500200025003000
x [k
pc]
main halosubhalo
fSIDM Mvir, main = 1015 M
MMR=1:10 T/m=0.5 cm2g 1
main halosubhalo
DMGalBCG
Figure 5. For a 1:10 merger, the peak positions for various components (DM,galaxies, BCGs) are shown. The red line indicates the centre of mass ofthe system. The upper panel gives the positions for a simulation with CDMand the lower panel for a simulation with fSIDM and a cross-section of𝜎T̃/𝑚 = 0.5 cm2 g−1. Peak positions are shown as long as the peak finderprovides reasonable results.
tion decreases until the DM core of the coalesced halo has formed.However, the orbits of the BCG could change once the effects of theICM are considered and the BCG is modelled more realistically.The offsets for the fSIDM run are large enough such that they can
already be identified in the lower panel of Fig. 5. These large offsetsdo not arise close to the first pericentre passage, but between thefirst apocentre and the second pericentre. However, we should pointout that we have no reliable peak positions for the subhalo at timeslater than 4 Gyr. While in principle a merging system could have itslargest offset after the second pericentre passage, the observationalidentification of separate DM peaks becomes prohibitively difficultat late merger stages as the subhalo dissolves. In contrast, separatestellar or galactic components could be identified more easily andoffsets after coalescence of the DM component associated with coresloshing could provide a signature of SIDM (Kim et al. 2017). Inparticular, the minimally decaying orbit of the BCGs could be ofinterest. We provide further results on core sloshing using multiplepeak finding methods in Section 4.5. We also compare offsets ofdifferent runs including various merger mass ratios (MMR) and self-interaction cross-sections in Section 4.4.1.
MNRAS 000, 1–17 (2021)

Unequal-mass mergers with SIDM 9
1 2 3 4 5 6 7t [Gyr]
10
5
0
5
10
x DM
x i [k
pc]
main halo, i = Galsubhalo, i = Galmain halo, i = BCGsubhalo, i = BCG
CDM Mvir, main = 1015 MMMR=1:10
T/m=0.0 cm2g 1
1 2 3 4 5 6 7t [Gyr]
300
200
100
0
100
x DM
x i [k
pc]
main halo, i = Galsubhalo, i = Galmain halo, i = BCGsubhalo, i = BCG
fSIDM Mvir, main = 1015 MMMR=1:10
T/m=0.5 cm2g 1
Figure 6. Offsets for the runs shown in Fig. 5. The upper panel displaysoffsets for the CDM merger and the lower panel for the fSIDM merger. Theshaded areas indicate the 1𝜎 error. The first and second pericentre passageare indicated by the vertical grey lines.
4.3 Shapes
DM self-interactions affect the peak positions of the haloes as wellas the higher order moments of the DM distribution. Here, we focuson the shape variable of the haloes as defined by Eq. (6). In contrastto other studies, we pursue a simplified approach by considering allparticles within twice the scale radius of the initial NFW profileinstead of measuring the shape as a function of radial distance asdone in other studies (e.g. Zemp et al. 2011; Peter et al. 2013; Chuaet al. 2020; Vargya et al. 2021).In Fig. 7, we show the shape parameter for a 1:10 merger evolved
with CDM and fSIDM, the same simulations as shown in Fig. 5 andFig. 6.Initially, the haloes are spherically symmetric (𝑠 = 1) and subse-
quently evolve to become more elliptical owing to gravitational in-teractions with the other halo. The shape of the main halo indicatedby the solid line is only slightly affected by the merger and becomesa little more elliptical, in particular about the pericentre passages.In contrast, the shape of the subhalo is more strongly affected, forboth CDM and fSIDM. For the CDM merger, we are able to trackthe peaks for much longer times and thus can compute shapes forlater times compared to fSIDM. As we can see in the upper panel of
1 2 3 4 5 6 7t [Gyr]
0.5
0.6
0.7
0.8
0.9
1.0
1.1
1.2
s
DM, main haloDM, subhaloGal, main haloGal, subhalo
CDM Mvir, main = 1015 MMMR=1:10
T/m=0.0 cm2g 1
1 2 3 4 5 6 7t [Gyr]
0.5
0.6
0.7
0.8
0.9
1.0
1.1
1.2
s
DM, main haloDM, subhaloGal, main haloGal, subhalo
fSIDM Mvir, main = 1015 MMMR=1:10
T/m=0.5 cm2g 1
Figure 7. Shapes for the runs shown in Fig. 5. The upper panel displaysshapes for the CDM merger and the lower panel for the fSIDM merger. Thefirst and second pericentre passage are indicated by the vertical grey lines.
Fig. 7, the evolution of the CDM subhalo can be described as follows:During the infall phase directly before the first pericentre passage,the shape becomes much more prolate due to tidal forces and thesize of this distortion depends on the mass ratio. Close to the corepassage, gravity has a different effect, which leads to a more oblateshape. The halo becomes even more oblate than it has been initially.But when it climbs out of the potential of the main halo afterwards,then it becomes more prolate due to tidal forces again. When theseparation between the two haloes has grown large enough (aboutthe first apocentre passage, ∼ 3.4 Gyr) the tidal force can becomesmall compared to the self-gravity of the subhalo. Hence, the self-gravity makes the subhalo more spherical. A rough estimate of thetidal radius at the first apocentre passage leads to 536 kpc or 3.7 𝑟s.Thus, the particles we selected for the shape computation should bewithin the tidal radius. Later on, when the merger is getting close tothe second pericentre passage, tidal forces make the halo more pro-late again. The described picture depends strongly on the consideredparticles. If one would take particles beyond twice the scale radiusof the initial NFW profile into account, the evolution of the shapewould look very different.In comparison to CDM, the fSIDM subhalo is less prolate about
the first pericentre passage and also the maximum in shape shortly
MNRAS 000, 1–17 (2021)
10 M. S. Fischer et al.
after the core passage is more extreme for fSIDM. Frequent self-interactions transfer energy from the direction of motion to the per-pendicular component which contributes to a more oblate halo. Be-sides, one can observe that a difference between the galaxies and theDM component arises. This is simply due to the collisionless natureof our galaxies that do not undergo frequent self-interactions.About the first apocentre passage (∼ 3.1Gyr), when the tidal force
becomes less important, the self-gravity can lead to a more sphericalhalo as we found for CDM. But for fSIDM the subhalo’s gravitationalpotential is less deep and the apocentre distance is shorter comparedto CDM, resulting in a halo that becomes even more prolate.Going beyond the parameter values assumed here, we compare
shapes of different simulations for a variety of MMRs and cross-sections in Section 4.4.2.
4.4 Frequent versus rare interactions
In the following, we compare the effects from rare and frequentself-interactions in mergers for various MMRs. In Fig. 8, we showDM-galaxy offsets for subhaloes employing several cross-sectionsand in Fig. 9, we compare the subhalo shapes of SIDM runs to theCDM shapes. In this section, we concentrate on the cluster-scalesimulations. Plots for the galaxy-scale simulations can be found inAppendix C.
4.4.1 Offsets
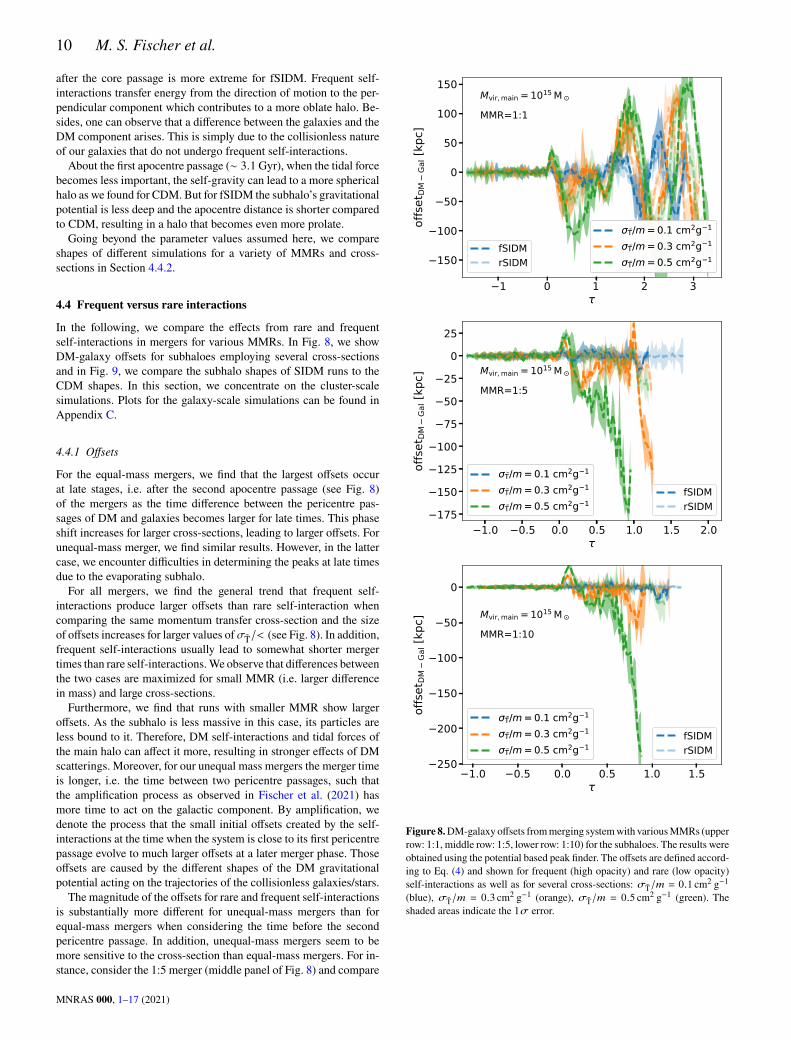
For the equal-mass mergers, we find that the largest offsets occurat late stages, i.e. after the second apocentre passage (see Fig. 8)of the mergers as the time difference between the pericentre pas-sages of DM and galaxies becomes larger for late times. This phaseshift increases for larger cross-sections, leading to larger offsets. Forunequal-mass merger, we find similar results. However, in the lattercase, we encounter difficulties in determining the peaks at late timesdue to the evaporating subhalo.For all mergers, we find the general trend that frequent self-
interactions produce larger offsets than rare self-interaction whencomparing the same momentum transfer cross-section and the sizeof offsets increases for larger values of𝜎T̃/𝑚 (see Fig. 8). In addition,frequent self-interactions usually lead to somewhat shorter mergertimes than rare self-interactions.We observe that differences betweenthe two cases are maximized for small MMR (i.e. larger differencein mass) and large cross-sections.Furthermore, we find that runs with smaller MMR show larger
offsets. As the subhalo is less massive in this case, its particles areless bound to it. Therefore, DM self-interactions and tidal forces ofthe main halo can affect it more, resulting in stronger effects of DMscatterings. Moreover, for our unequal mass mergers the merger timeis longer, i.e. the time between two pericentre passages, such thatthe amplification process as observed in Fischer et al. (2021) hasmore time to act on the galactic component. By amplification, wedenote the process that the small initial offsets created by the self-interactions at the time when the system is close to its first pericentrepassage evolve to much larger offsets at a later merger phase. Thoseoffsets are caused by the different shapes of the DM gravitationalpotential acting on the trajectories of the collisionless galaxies/stars.The magnitude of the offsets for rare and frequent self-interactions
is substantially more different for unequal-mass mergers than forequal-mass mergers when considering the time before the secondpericentre passage. In addition, unequal-mass mergers seem to bemore sensitive to the cross-section than equal-mass mergers. For in-stance, consider the 1:5 merger (middle panel of Fig. 8) and compare
1 0 1 2 3
150
100
50
0
50
100
150
offs
etDM
Gal [
kpc]
T/m = 0.1 cm2g 1
T/m = 0.3 cm2g 1
T/m = 0.5 cm2g 1
Mvir, main = 1015 MMMR=1:1
fSIDMrSIDM
T/m = 0.1 cm2g 1
T/m = 0.3 cm2g 1
T/m = 0.5 cm2g 1
1.0 0.5 0.0 0.5 1.0 1.5 2.0175
150
125
100
75
50
25
0
25
offs
etDM
Gal [
kpc]
T/m = 0.1 cm2g 1
T/m = 0.3 cm2g 1
T/m = 0.5 cm2g 1
Mvir, main = 1015 MMMR=1:5
fSIDMrSIDM
T/m = 0.1 cm2g 1
T/m = 0.3 cm2g 1
T/m = 0.5 cm2g 1
1.0 0.5 0.0 0.5 1.0 1.5250
200
150
100
50
0
offs
etDM
Gal [
kpc]
T/m = 0.1 cm2g 1
T/m = 0.3 cm2g 1
T/m = 0.5 cm2g 1
Mvir, main = 1015 MMMR=1:10
fSIDMrSIDM
T/m = 0.1 cm2g 1
T/m = 0.3 cm2g 1
T/m = 0.5 cm2g 1
Figure 8.DM-galaxy offsets frommerging systemwith variousMMRs (upperrow: 1:1, middle row: 1:5, lower row: 1:10) for the subhaloes. The results wereobtained using the potential based peak finder. The offsets are defined accord-ing to Eq. (4) and shown for frequent (high opacity) and rare (low opacity)self-interactions as well as for several cross-sections: 𝜎T̃/𝑚 = 0.1 cm2 g−1(blue), 𝜎T̃/𝑚 = 0.3 cm2 g−1 (orange), 𝜎T̃/𝑚 = 0.5 cm2 g−1 (green). Theshaded areas indicate the 1𝜎 error.
MNRAS 000, 1–17 (2021)

Unequal-mass mergers with SIDM 11
0.0 0.5 1.0 1.5
0.3
0.2
0.1
0.0
0.1
0.2
0.3
s - s C
DM
DMGal
Mvir, main = 1015 MMMR=1:1
fSIDMrSIDM
T/m = 0.1 cm2g 1
T/m = 0.3 cm2g 1
T/m = 0.5 cm2g 1
DMGal
0.0 0.5 1.0 1.5
0.3
0.2
0.1
0.0
0.1
0.2
0.3
s - s C
DM
DMGal
Mvir, main = 1015 MMMR=1:5
fSIDMrSIDM
T/m = 0.1 cm2g 1
T/m = 0.3 cm2g 1
T/m = 0.5 cm2g 1
DMGal
0.0 0.5 1.0 1.5
0.3
0.2
0.1
0.0
0.1
0.2
0.3
s - s C
DM
DMGal
Mvir, main = 1015 MMMR=1:10
fSIDMrSIDM
T/m = 0.1 cm2g 1
T/m = 0.3 cm2g 1
T/m = 0.5 cm2g 1
DMGal
Figure 9. Differences in the shape between SIDM and CDM subhaloes frommerging system with various MMRs (upper panel: 1:1, middle panel: 1:5,lower panel: 1:10). The shapes are defined according to Eq. (6) and shown forfrequent (high opacity) and rare (low opacity) self-interactions as well as forseveral cross-sections: 𝜎T̃/𝑚 = 0.1 cm2 g−1 (blue), 𝜎T̃/𝑚 = 0.3 cm2 g−1(orange), 𝜎T̃/𝑚 = 0.5 cm2 g−1 (green).
the fSIDM offset of the runs with 𝜎T̃/𝑚 = 0.3 cm2 g−1 (orange)and 𝜎T̃/𝑚 = 0.5 cm2 g−1 (green). For 𝜏 & 0.4, the evolution of theoffsets is quite different, the smaller cross-section shows decreasingoffsets whereas for the larger one the offset continues to grow, im-plying that the relationship between cross-section and offset size ishighly non-linear in general.To obtain a better understanding of the underlying dynamics, let
us now discuss the various effects which enter into the developmentof the offsets: when the drag force decelerates the DM, an offsetbetween galaxies and DM arises. The gravitational pull of the DMhalo acts against the offset. Thus, the smaller the subhalo, the weakerthe gravitational attraction and, as a result, larger offsets occur. But itis not as simple as this. The picture is more complicated as the grav-itational attraction depends on the gradient of the potential, whichis flattened by the self-interactions and on the offset itself. Conse-quently, the first pericentre passage offsets could also be larger forequal-mass mergers depending on the actual mass profile. The massprofile of galaxy clusters also depends on the ICM, which we didnot include in our simulations. However, the description above isonly appropriate for the time about the first pericentre passage. At alater time, the DM peak overtakes the galaxies (i.e. becomes moredistant to the centre of mass) as the galactic component has experi-enced a larger deceleration due to the offset, i.e. its correspondingDM halo has led to further deceleration. At the point in time whenthe DM is overtaking, i.e. the galactic peak is passing the DM peak,the DM gravitational potential is shallower. As a consequence, thegalaxies can escape further and much larger offsets ensue. The sizeof these offsets depends on how much shallower the gravitationalpotential becomes compared to the first pericentre passage. Lowermass haloes are less gravitationally bound, they dissolve faster due toself-interactions, and thus their gravitational potential becomes shal-lower and the offsets larger (and at the same time, harder to observegiven the dissolving subhalo). The size of the effective gravitationalattraction acting against the offset should depend on the offset anddecrease for large enough offsets. Hence, the growth of large offsetscan be accelerated further as observed for the unequal-mass mergersevolved with 𝜎T̃/𝑚 = 0.5 cm2 g−1 (middle and lower panel of theleft-hand column of Fig. 8).For equal-massmergers, we find that rSIDM can show large offsets
(& 100 kpc) only at late times via an accumulated phase shift. How-ever, due to shallower density gradients at later times peak finding be-comes more difficult, directly impacting the observational prospectsof finding large offsets. However, also the large offsets of fSIDMwill,in general, be difficult to observe as we discuss in Sec. 5.1. Neverthe-less, the conditions under which an offset of observable size arisesare more easily and more often met for fSIDM than for rSIDM.
4.4.2 Shape
In Fig. 9, we compare the shapes of SIDM subhaloes to the shapes ofthe corresponding CDM haloes using the time 𝜏 as given by Eq. (7).The shapes of the individual mergers are displayed in Appendix C.Before the first pericentre passage (𝜏 < 0) differences occur onlybecause of the different merger times as we use 𝜏 to match the timesof the simulations. If one used the physical time for the infall phase,any significant difference would vanish and we do not display themin Fig. 9.At the first pericentre passage (𝜏 = 0), the shapes are almost
the same for all cross-sections. However, for the second pericentrepassage (𝜏 = 1), this is no longer the case. How much the shapes ofSIDM haloes deviate from their CDM counterpart depends strongly
MNRAS 000, 1–17 (2021)

12 M. S. Fischer et al.
on the MMR. For equal-mass mergers, the differences in the shapeparameter between CDM and fSIDM are small before the secondpericentre passage and become larger for more unequal halo masses.As expected, the difference increases with increasing self-interactioncross-section.Self-interactions can lead to more oblate as well as more prolate
shapes compared to CDM. The difference depends on the mergerstage and the self-interaction type. For the phase before the firstapocentre passage, frequent self-interactions tend to produce haloesthat are always more oblate. In contrast, rare self-interaction showalso a phase (𝜏 ∼ 0.1–0.2) with a significantly more prolate shape.While both fSIDM and rSIDM lead to a shallower potential, thephase–space distributions are different. Unlike frequent interactions,the isotropic, rare self-interactions do not preferentially transfer theenergy from the forward motion to a perpendicular component butcan create a tail of back-scattered particles. Hence, the shape ofhaloes in rSIDM can be more prolate than for fSIDM.For the unequal-mass mergers, there is a phase at 𝜏 ∼ 0.7 where
the self-interactions – given the cross-section is large enough – leadto more elliptical haloes than CDM. This can be understood in termsof a smaller pericentre distance implying a stronger tidal force anda shallower potential due to the DM scattering as explained in Sec-tion 4.3. The galactic component can be even more elliptical than theDM as it is not subject to self-interactions. Thus, the naive picturethat self-interactions render haloes always more spherical fails in thecase of an unequal-mass merger.In most cases, fSIDM leads to a more oblate DM halo compared to
rSIDMassuming that the samemomentum transfer cross-sections arecompared. In addition to the fact that fSIDM is transferring momen-tum from the direction ofmotion to a perpendicular component, therecould also be differences between frequent and rare self-interactionsregarding the efficiency of making haloes more spherical.Furthermore, we also observe shape differences between the DM
component and the galaxies/stars. The most striking difference canbe seen for frequent self-interactions and unequal-mass mergers ataround the first apocentre passage. The galactic component is moreprolate than the DM and for the 1:10 merger, this phase lasts remark-ably long. For rSIDM, there is only a very small difference betweengalaxies and DM shape. Interestingly, we find that the shape for thegalactic component is more prolate for fSIDM than rSIDM. Thisoccurs due to differences in the gravitational potential, for fSIDM,the particles are less strongly bound and thus more prone to tidaldisruption.Finally, we want to emphasize that our results depend on the parti-
cles selected for the shape computation. Particles of the inner or outerhalo are affected differently during the merger. Hence, any compari-son with simulation data or observations needs to be cautious aboutthe scales on which quantities are measured.
4.5 Peak finding
In Section 3.1, we described two peak finding methods. So far, wehave only discussed results relying on the peak finding method basedon the gravitational potential. In this section, we will compare theseresults to the ones we obtain using the method of isodensity contoursand discuss the origin of the resulting differences.In Fig. 10, we show the peak positions as a function of time
for an equal-mass merger evolved with frequent self-interactions and𝜎T̃/𝑚 = 0.5 cm2 g−1. The upper panel shows the peak position usingthe peak finder based on the gravitational potential; and the lowerpanel displays the positions of the peaks based on isodensity contours.One can recognize two main differences between the peak finding
1 2 3 4 5 6 7t [Gyr]
1000
1500
2000
2500
3000
x [k
pc]
DMGalBCG
fSIDM Mvir, main = 1015 M
MMR=1:1 T/m=0.5 cm2g 1
1 2 3 4 5 6 7t [Gyr]
1000
1500
2000
2500
3000
x [k
pc]
DMGalBCG
fSIDM Mvir, main = 1015 M
MMR=1:1 T/m=0.5 cm2g 1
Figure 10. The peak positions for an equal-mass merger are shown as afunction of time. For the upper panel, the gravitational potential-based peakfinder was employed and for the lower one, the one based on isodensitycontours. DM peaks are indicated in black, galaxy peaks in blue, and theposition of BCG particles in orange. The red lines indicate the centre of massof the system.
methods: First, in the lower panel, the peak position around thepericentre passages is biased towards the centre ofmass as no separatepeaks can be identified for small separations and thus the haloes seemto coalesce earlier. Secondly, we observe the offsets to be smaller forthe isodensity contour peaks at the first apocentre passage. They areabout half the size of the potential-based offsets. This is caused bythe projection since self-interactions mainly alter the evolution of thecentral part of the haloes and the peaks identified in the potential-based method heavily depend on this region, whereas the isodensitycontour peaks are due to projection more sensitive to matter in theouter regions of the haloes.For comparison, the offsets for the two peak finding methods
are shown for a 1:5 cluster-scale merger in Fig.11. The isodensitycontour-based offsets are noisier than the potential-based ones, butoverall they follow the same trend. Interestingly, also the measuredoffsets direct after the first pericentre passage appear to be larger inthis case. For the isodensity contour peaks, all particles are consid-ered, thus the main halo can influence the position of the subhalo. Ifthe density gradient in the DM component of the subhalo is lowerthan the one of the galactic component, the DM peak could be more
MNRAS 000, 1–17 (2021)

Unequal-mass mergers with SIDM 13
1.0 0.5 0.0 0.5 1.0 1.5 2.0
150
100
50
0
offs
etDM
Gal [
kpc]
pot. peaksiso. peaks
Mvir, main = 1015 MMMR=1:5
T/m = 0.5 cm2g 1
fSIDMrSIDM
pot. peaksiso. peaks
Figure 11. The DM-galaxy offset is shown as a function of time for anunequal mass merger with an MMR of 1:5 of our cluster-scale mergers. Thesimulation was evolved with a cross-section of 𝜎T̃/𝑚 = 0.5 cm2 g−1. Wedisplay the offset based on the potential-based peak finder as well as theisodensity contour-based peak finder. The shaded areas indicate the error.
5.0 5.5 6.0 6.5 7.0 7.5t [Gyr]
0
50
100
150
200
250
gala
xy p
eak
sepa
ratio
n [k
pc] pot. peaks
iso. peaksMvir, main = 1015 MMMR=1:1
T/m = 0.1 cm2g 1
CDMfSIDMrSIDM
pot. peaksiso. peaks
Figure 12. The separation between the peaks of the galactic component isshown as a function of time for an equal-mass cluster-scale merger at latemerger stages. The DM component coalesced, but separate peaks for thegalaxies can be identified using the potential-based or isodensity contour-based peak finding. The displayed merger was evolved with the lowest cross-section we present in this paper, 𝜎T̃/𝑚 = 0.1 cm2 g−1. The shaded areasindicate the error.
affected by the main halo. Potentially, this could lead to a larger offsetmeasurement. In contrast to the potential-based offset measurements,the isodensity contour-based ones are not much larger about the firstapocentre passage (negative sign) compared to the ones subsequent tothe first pericentre passage (positive sign), but they last for a longertime and, as such, could be easier to observe. But the isodensitymethod does not provide reasonable offsets at times as late as forthe potential-based peaks. However, for comparison with observa-tions, an observationally motivated peak finding strategy should beemployed (Robertson et al. 2017a).Let us point out that very late merger stages at which the DM
haloes already coalesced could nevertheless be of interest from anobservational point of view. This is because the presence of self-interactions may lead to distinguishable galactic/stellar components.In Fig. 12, we show this late stage for an equal-mass merger be-cause for that MMR the peak finding works best. The separationbetween the galaxy peaks for the cluster-scale merger evolved with𝜎T̃/𝑚 = 0.1 cm2 g−1 is shown. For comparison, we also display theseparation for the corresponding CDM merger. Here, the separationvanishes quickly. But if self-interactions are present, even if theyare rather small, large separations are found with both methods. ForfSIDM, the distance between the galaxy peaks tends to be largerthan for rSIDM if the same momentum transfer cross-sections arecompared. In Section 4.2, we mentioned that a lower density dueto self-interactions reduces dynamical friction and thus can lead tocore sloshing as previously studied by Kim et al. (2017). However, itremains to be seen whether this persists in more realistic simulationsincluding the ICM.
4.6 Phase–space
Finally, we study the phase–space distribution of our 1:10 cluster-scale merger using the same simulation as for the morphology. Forthe phase–space distribution, we do not only consider particles of thesubhalo but also from the main halo. In Fig. 13, we show the distanceto the centre of mass as a function of the radial velocity (with respectto the centre of mass) for 𝜏 = 0.56. These quantities are all computedin 3 d. We display results for CDM and for rare and frequent self-interactions with a cross-section of 𝜎T̃/𝑚 = 0.5 cm2 g−1. On theleft-hand side, we display the DM and on the right-hand side, thesmoothed galactic component is shown.A clear difference between the distributions for the DM mod-
els is visible, especially when focusing on the clump of particlesat 𝑟 ∼ 1500 kpc. These particles primarily belong to the subhaloand disperse over time depending on the DM physics. If DM self-interactions are present, the gravitational potential is shallower,whichalso leads to a faster dispersal of the galactic component. As we cansee in Fig. 13, the subhalo clump is strongest for CDM, less strongfor rSIDM and the weakest for fSIDM for both DM and galaxies.
5 DISCUSSION
In this section, we first discuss aspects relating to the peak finding andthe analysis of our simulation. Then, we elaborate on the limitationsof our model and the physical implications of our results.
5.1 Technical aspects
We compared two peak finding methods, whose results differ signif-icantly. The one based on the gravitational potential is more robustbut less useful when it comes to a potential comparison with obser-vational data, whereas the one based on isodensity contours may bemore readily applied to observations.The isodensity contour method suffers from projection effects and
difficulties in the peak identification for small peak separations. As aresult, we found smaller offsets (about half the size for an equal-massmerger) with the isodensity contour method at the first apocentrepassage. However, it is possible that the isodensity contour methodprovides larger offsets close to the pericentre passages as the mea-sured subhalo peak position is affected by the main halo. Moreover,we failed to identify distinct peaks at an earlier stage of the merging
MNRAS 000, 1–17 (2021)

14 M. S. Fischer et al.
0 1000 2000 3000 4000r [kpc]
2000
0
2000v r
[km
s1 ]
0.00
0.05
0.10
0.15
0.20
0.25
0.30
f DM /
103
CDM
Mvir, main = 1015 M MMR=1:10T/m=0.0 cm2g 1
t = 3.56 Gyr= 0.56
0 1000 2000 3000 4000r [kpc]
2000
0
2000
v r [k
m s
1 ]
0.00
0.05
0.10
0.15
0.20
0.25
0.30
f Gal
/ 10
3
CDM
Mvir, main = 1015 M MMR=1:10T/m=0.0 cm2g 1
t = 3.56 Gyr= 0.56
0 1000 2000 3000 4000r [kpc]
2000
0
2000
v r [k
m s
1 ]
0.00
0.05
0.10
0.15
0.20
0.25
0.30
f DM /
103
rSIDM
Mvir, main = 1015 M MMR=1:10T/m=0.5 cm2g 1
t = 3.37 Gyr= 0.56
0 1000 2000 3000 4000r [kpc]
2000
0
2000
v r [k
m s
1 ]
0.00
0.05
0.10
0.15
0.20
0.25
0.30
f Gal
/ 10
3
rSIDM
Mvir, main = 1015 M MMR=1:10T/m=0.5 cm2g 1
t = 3.37 Gyr= 0.56
0 1000 2000 3000 4000r [kpc]
2000
0
2000
v r [k
m s
1 ]
0.00
0.05
0.10
0.15
0.20
0.25
0.30
f DM /
103
fSIDM
Mvir, main = 1015 M MMR=1:10T/m=0.5 cm2g 1
t = 3.21 Gyr= 0.56
0 1000 2000 3000 4000r [kpc]
2000
0
2000
v r [k
m s
1 ]
0.00
0.05
0.10
0.15
0.20
0.25
0.30
f Gal
/ 10
3
fSIDM
Mvir, main = 1015 M MMR=1:10T/m=0.5 cm2g 1
t = 3.21 Gyr= 0.56
Figure 13. The phase–space distribution of a 1:10 merger evolved with different DM models is shown at 𝜏 = 0.56, i.e. close to the first apocentre passage. Theleft-hand side column displays the DM distribution and on the right-hand side, the smoothed galactic component is shown. The top row gives the phase–spacedistribution for CDM and below SIDM is shown with a cross-section of 𝜎T̃/𝑚 = 0.5 cm2 g−1 for the case of isotropic scattering (middle row) and small-anglescattering (bottom row).
process than with the gravitational potential based method. Further-more, we only investigated projections of the particle distributionperpendicular to the merger axis, whereas in observations, the lineof sight and merger axis need not be perpendicular to one another.
However, in real observations, further difficulties arise. Especially
for galaxy clusters, the number of observed galaxies (∼ 100–1000) ismuch less than the number of particles (∼ 9 × 10⁵–107) we used forour smoothed galactic cluster component. Nevertheless, this problemcould be allayed by using the BCGs to measure offsets.
We find that observations at a later stage of the merger, rather
MNRAS 000, 1–17 (2021)

Unequal-mass mergers with SIDM 15
than around the time of the first pericentre passage, might be moreinteresting because offsets typically become larger with time. How-ever, the largest offsets might be difficult to observe as the subhalodissolves rather quickly. Nevertheless, a late merger phase when theDM haloes coalesce and form a single DM peak may still provideevidence for DM self-interactions as in general two separate galac-tic or stellar components will be present. For equal-mass mergers,Kim et al. (2017) found at these later merger stages that BCGs andgalaxies oscillated around the centre of mass. We make a similarobservation in our simulations and find that this also persists forunequal mass mergers. Interestingly, the galactic peak separationsare found to be generally large even for rather small cross-sectionsand can also be seen employing the more observationally motivatedpeak finding method. Hence, these types of observations could be apromising way to provide evidence for DM self-interactions.Distinguishing between different DM models through the mor-
phologies of the galaxies within merging galaxy clusters may provedifficult owing to the small number of collisionless tracers (galaxies)on these scales. However, on galaxy scales, stars may provide enoughtracers to better estimate the locations and shapes of the collisonlesscomponents. In addition, galaxies might also offer a chance to dis-tinguish stellar components according to their origin using stellarpopulation properties such as metallicity. Nevertheless, resolutionlimits of astronomical observations might pose a challenge for suchan approach.
5.2 Physical considerations
The focus of this paper lies on understanding the different phe-nomenologies of rare and frequent self-interactions and not a com-parison to observational data. Hence, the dependence of our resultson the initial conditions is less of a concern. For example, we findlarger offsets than in Fischer et al. (2021), despite the haloes start-ing with the same virial masses. This is because they start withhigher concentration parameters, which for the present study lead tohigher central densities and thus larger offsets. Aside from quanti-tative differences, some results may change qualitatively as physicalprocesses shaping the evolution of merging systems act on differ-ent time-scales. For instance, the merger time-scale differs from thetime-scale on which self-interactions isotropize the DM velocity dis-tribution. In particular, this could complicate the evolution of thehalo shapes. Consequently, it would be informative to extract merg-ing systems from cosmological simulations to obtain more realisticresults that can be directly comparedwith observations. In addition tothe study of individual systems, this would also allow us to estimatehow frequently offsets of observable size would occur for variousSIDM models. In the literature, observations of fairly large offsetshave been claimed but there is also reasonable doubt about them (forreferences see sec. 1). However, in the light of large offsets, fSIDMmodels are particularly interesting as they can explain larger offsetsthan rSIDM.We found minor mergers to be interesting in terms of distinguish-
ing rare and frequent self-interactions. In contrast to equal-massmergers, they have the advantage of being more abundant in theUniverse and thus allow for better statistics than studies based onindividual systems. For fSIDM, the subhalo dissolves faster than forrSIDM, but this statement depends on the matching of the cross-section. In terms of 𝜎T̃, the constraints for rare and frequent self-interactions would differ from each other. Together with alternativeconstraints, there could be a chance to distinguish between rSIDMand fSIDM. However, to derive constraints on the self-interactionswith observations would require a stringent observational motivated
analysis of the simulations and a more realistic setup as we explainnext. Thus, we do not try to derive any constraints on the differentialcross-section.Here, we studied an idealized setup that neglects various physical
aspects. Perhaps, most importantly, we did not include the baryonicmatter, i.e. the ICM, which contains a significant fraction (∼ 10%)of the cluster mass. The ICM is likely to change the evolution of amerger as it behaves collisionally (Zhang et al. 2016) and is affectedby processes such as star formation and feedback. Moreover, ourhaloes are totally smooth and do not contain any substructure. Themodelling of theBCGs is also very idealized as they are approximatedas collisionless point masses with unrealistically lowmasses. Finally,we treated the galaxies in our cluster simulations as collisionlessparticles, which neglects the fact that they also have a large DMcomponent (Kummer et al. 2018). More realistic modelling of theBCGs and the ICM could lead to different results, in particular, thepattern of oscillations of the BCGs and the core sloshing of thegalaxies could change. It is largely unknown how the evolution ofa merger subject to self-interactions would change if one improveson the aspects mentioned above. Hence, we do not want to speculateabout this but leave it for future studies.In the present work, we only modelled a constant cross-section
and did not consider SIDM with a velocity-dependent cross-section.A velocity-dependence is natural from a particle physics perspective,especially for light mediator models, which interact frequently (e.g.Buckley & Fox 2010; Loeb &Weiner 2011; Bringmann et al. 2017).In future work, it would be interesting to also investigate modelswith a velocity dependence, particularly as such models appear tobe in better agreement with astrophysical observations than constantcross-sections (e.g. Kaplinghat et al. 2016; Correa 2021; Gilmanet al. 2021; Sagunski et al. 2021).
6 SUMMARY AND CONCLUSIONS
In this paper, we have studied idealized equal and unequal-massmergers undergoing head-on collisions, focusing on the effects aris-ing from DM self-interactions. In particular, we have investigatedgalaxy cluster and galaxy mergers and compared simulations withcollisionless, rare and frequent self-interacting DM. In each simu-lation, we determined the peaks of the different components (DM,galaxies, and a central massive object) for each of our two merginghaloes, and measured the offsets between different components aswell as the shapes of the different components. Moreover, we stud-ied the morphology and phase–space distribution of the mergers andcompared two peak finding methods. Our main results from this suiteof simulations are as follows:
• The morphology of the collisionless particles, i.e. galaxies/starsshows significant differences between rSIDM and fSIDM, especiallyat a later merger phase and in unequal-mass mergers. It is stronglyaffected by the faster dissolving fSIDM subhalo.
• Minor mergers with SIDM can produce large offsets betweengalactic/stellar and DM peaks. Before the second pericentre passage,we found large offsets only for frequent self-interactions.
• In general, frequent self-interactions tend to produce larger off-sets than rare self-interactions if the same momentum transfer cross-sections are compared. This is even more extreme in unequal-massmergers.
• Separate galactic/stellar components with a coalesced DM com-ponent could provide evidence for DM self-interactions. Core slosh-ing seems to be most interesting in the case of equal-mass mergers,which has been studied by Kim et al. (2017).
MNRAS 000, 1–17 (2021)

16 M. S. Fischer et al.
• For SIDM, the shapes of DM and the galactic/stellar compo-nent can differ significantly from collisionless DM. In unequal-massmergers, self-interactions can lead to more elliptical distributionsbetween the first apocentre and second pericentre passage.
• We find the merger phase between 𝜏 ≈ 0.25 (halfway to the firstapocentre) and 𝜏 ≈ 1.0 (second pericentre) to be more interestingin terms of studying effects from self-interactions than the phasenear and shortly after the first pericentre passage (𝜏 ≈ 0.0). Thisseems to be true for observations as well, as suggested by our resultsconcerning isodensity peaks. In general, a late phase of a mergingsystem should be more interesting as the non-linear evolution of thesystem can amplify differences between DM models.
• Peak finding is a major challenge in studying effects of SIDMand distinguishing rare and frequent self-interactions. In observa-tions, it might prohibit detecting the very large offsets at late mergerstages. The positions obtained by various methods can differ a lotwith respect to one another, which makes it important to analyseobservations and simulations in a similar manner.
In this paper, we performed a parameter study on idealizedmergersin order to understand the dominant physical effects and to developan intuition about the best indicators of DM interaction properties.A detailed comparison with observations will require more realisticsimulations that include baryonic matter as well as more realisticsubstructure in the haloes. This is the subject of forthcoming work.
ACKNOWLEDGEMENTS
We thank Felix Kahlhoefer for useful comments and suggestions.This work is funded by the Deutsche Forschungsgemeinschaft (DFG,German Research Foundation) under Germany’s Excellence Strat-egy – EXC 2121 “Quantum Universe” – 390833306, Germany’sExcellence Strategy – EXC-2094 “Origins” – 390783311, and theEmmy Noether Grant No. KA 4662/1-1. AR is supported by theEuropean Research Council’s Horizon 2020 project ‘EWC’ (awardAMD-776247- 6). Preprint number: DESY-21-116Software: numpy (Harris et al. 2020), matplotlib (Hunter 2007),
scipy (Virtanen et al. 2020)
DATA AVAILABILITY
The data underlying this article will be shared on reasonable requestto the corresponding author.
REFERENCES
Ackerman L., Buckley M. R., Carroll S. M., Kamionkowski M., 2009, Phys.Rev. D, 79, 023519
Allgood B., Flores R. A., Primack J. R., Kravtsov A. V., Wechsler R. H.,Faltenbacher A., Bullock J. S., 2006, Monthly Notices of the Royal As-tronomical Society, 367, 1781
Banerjee A., Adhikari S., Dalal N., More S., Kravtsov A., 2020, Journal ofCosmology and Astroparticle Physics, 2020, 024
Berezhiani Z., Dolgov A., Mohapatra R., 1996, Physics Letters B, 375, 26Bett P., 2012, Monthly Notices of the Royal Astronomical Society, 420, 3303Blinnikov S. I., Khlopov M. Y., 1983, Soviet Ast., 27, 371Boddy K. K., Kaplinghat M., Kwa A., Peter A. H. G., 2016, Phys. Rev. D,94, 123017
Boylan-Kolchin M., Springel V., White S. D. M., Jenkins A., Lemson G.,2009, Monthly Notices of the Royal Astronomical Society, 398, 1150
Bradač M., Allen S. W., Treu T., Ebeling H., Massey R., Morris R. G., vonder Linden A., Applegate D., 2008, ApJ, 687, 959
Bringmann T., Kahlhoefer F., Schmidt-Hoberg K., Walia P., 2017, Phys. Rev.Lett., 118, 141802
Buckley M. R., Fox P. J., 2010, Phys. Rev. D, 81, 083522Bullock J. S., Boylan-Kolchin M., 2017, ARA&A, 55, 343Carlson E. D., Machacek M. E., Hall L. J., 1992, ApJ, 398, 43Chandrasekhar S., 1943, ApJ, 97, 255Chua K. T. E., Dibert K., Vogelsberger M., Zavala J., 2020, Monthly Noticesof the Royal Astronomical Society, 500, 1531
Cline J. M., Liu Z., Xue W., 2012, Phys. Rev. D, 85, 101302Colin P., Avila-Reese V., Valenzuela O., Firmani C., 2002, The AstrophysicalJournal, 581, 777
Correa C. A., 2021, Monthly Notices of the Royal Astronomical Society, 503,920
Cyr-Racine F.-Y., Sigurdson K., 2013, Phys. Rev. D, 87, 103515Dawson W. A., 2013, PhD thesis, Univ. CaliforniaDawson W. A., et al., 2012, ApJ, 747, L42Despali G., Sparre M., Vegetti S., Vogelsberger M., Zavala J., MarinacciF., 2019, Monthly Notices of the Royal Astronomical Society, 484,4563–4573
Dodelson S., Widrow L. M., 1994, Phys. Rev. Lett., 72, 17Donnert J. M. F., 2014, Monthly Notices of the Royal Astronomical Society,438, 1971
Donnert J. M. F., Beck A. M., Dolag K., Röttgering H. J. A., 2017, MonthlyNotices of the Royal Astronomical Society, 471, 4587
Doubrawa L., Machado R. E. G., Laganá T. F., Lima Neto G. B., Monteiro-Oliveira R., Cypriano E. S., 2020, Monthly Notices of the Royal Astro-nomical Society, 495, 2022
Dutton A. A., Macciò A. V., 2014, MNRAS, 441, 3359Dyer C. C., Ip P. S. S., 1993, ApJ, 409, 60Essig R., McDermott S. D., Yu H.-B., Zhong Y.-M., 2019, Phys. Rev. Lett.,123, 121102
Feng J. L., Kaplinghat M., Tu H., Yu H.-B., 2009, Journal of Cosmology andAstroparticle Physics, 2009, 004
Fischer M. S., Brüggen M., Schmidt-Hoberg K., Dolag K., Kahlhoefer F.,Ragagnin A., Robertson A., 2021, Monthly Notices of the Royal Astro-nomical Society, 505, 851
Foot R., 2004, Int. J. Mod. Phys. D, 13, 2161Foot R., Vagnozzi S., 2015, Phys. Rev. D, 91, 023512Frandsen M. T., Sarkar S., Schmidt-Hoberg K., 2011, Phys. Rev. D, 84,051703
Gilman D., Bovy J., Treu T., Nierenberg A., Birrer S., Benson A., Sameie O.,2021, Monthly Notices of the Royal Astronomical Society, 507, 2432
Harris C. R., et al., 2020, Nature, 585, 357Harvey D., Robertson A., Massey R., Kneib J.-P., 2017, MNRAS, 464, 3991Hopkins P. F., et al., 2018, Monthly Notices of the Royal Astronomical Soci-ety, 480, 800
Hu W., Barkana R., Gruzinov A., 2000, Phys. Rev. Lett., 85, 1158Hunter J. D., 2007, Comput. Sci. Engg., 9, 90Huo R., Yu H.-B., Zhong Y.-M., 2020, Journal of Cosmology and Astropar-ticle Physics, 2020, 051
Jee M. J., Hughes J. P., Menanteau F., Sifón C., Mandelbaum R., BarrientosL. F., Infante L., Ng K. Y., 2014, ApJ, 785, 20
Jee M. J., et al., 2015, ApJ, 802, 46Kahlhoefer F., Schmidt-HobergK., FrandsenM. T., Sarkar S., 2014,MNRAS,437, 2865
Kahlhoefer F., Schmidt-Hoberg K., Wild S., 2017, JCAP, 08, 003Kaplan D. E., Krnjaic G. Z., Rehermann K. R., Wells C. M., 2010, Journalof Cosmology and Astroparticle Physics, 2010, 021
Kaplinghat M., Tulin S., Yu H.-B., 2016, Phys. Rev. Lett., 116, 041302Kim S. Y., Peter A. H. G., Wittman D., 2017, MNRAS, 469, 1414KlypinA.A., Trujillo-GomezS., Primack J., 2011, TheAstrophysical Journal,740, 102
Kolb E. W., Seckel D., Turner M. S., 1985, Nature, 314, 415Kummer J., Kahlhoefer F., Schmidt-Hoberg K., 2018, MNRAS, 474, 388Kummer J., BrüggenM., Dolag K., Kahlhoefer F., Schmidt-Hoberg K., 2019,MNRAS, 487, 354
Kusenko A., Steinhardt P. J., 2001, Phys. Rev. Lett., 87, 141301
MNRAS 000, 1–17 (2021)

Unequal-mass mergers with SIDM 17
Lacey C., Cole S., 1993, Monthly Notices of the Royal Astronomical Society,262, 627
Lage C., Farrar G., 2014, The Astrophysical Journal, 787, 144Loeb A., Weiner N., 2011, Phys. Rev. Lett., 106, 171302Machado R. E. G., Lima Neto G. B., 2015, Monthly Notices of the RoyalAstronomical Society, 447, 2915–2924
Machado R. E. G., Monteiro-Oliveira R., Lima Neto G. B., Cypriano E. S.,2015, Monthly Notices of the Royal Astronomical Society, 451, 3309
Mastropietro C., Burkert A., 2008, Monthly Notices of the Royal Astronom-ical Society, 389, 967
Mohapatra R. N., Nussinov S., Teplitz V. L., 2002, Phys. Rev. D, 66, 063002Molnar S. M., Broadhurst T., 2015, The Astrophysical Journal, 800, 37Molnar S. M., Broadhurst T., 2017, The Astrophysical Journal, 841, 46Molnar S. M., Broadhurst T., 2018, The Astrophysical Journal, 862, 112Monteiro-Oliveira R., Cypriano E. S., Machado R. E. G., Lima Neto G. B.,Ribeiro A. L. B., Sodré L. J., Dupke R., 2016, Monthly Notices of theRoyal Astronomical Society, 466, 2614
MouraM. T.,MachadoR. E.G.,Monteiro-Oliveira R., 2020,MonthlyNoticesof the Royal Astronomical Society, 500, 1858
Nadler E. O., Banerjee A., Adhikari S., Mao Y.-Y., Wechsler R. H., 2020, TheAstrophysical Journal, 896, 112
Navarro J. F., Frenk C. S., White S. D. M., 1996, ApJ, 462, 563Peel A., Lanusse F., Starck J.-L., 2017, ApJ, 847, 23Peter A. H. G., Rocha M., Bullock J. S., Kaplinghat M., 2013, MNRAS, 430,105
Pillepich A., et al., 2017,Monthly Notices of the Royal Astronomical Society,473, 4077
Poole G. B., Fardal M. A., Babul A., McCarthy I. G., Quinn T., Wadsley J.,2006, Monthly Notices of the Royal Astronomical Society, 373, 881
Power C., Navarro J. F., Jenkins A., Frenk C. S., White S. D. M., Springel V.,Stadel J., Quinn T., 2003, MNRAS, 338, 14
Randall S. W., Markevitch M., Clowe D., Gonzalez A. H., Bradač M., 2008,ApJ, 679, 1173
Read J. I., Goerdt T., Moore B., Pontzen A. P., Stadel J., Lake G., 2006,Monthly Notices of the Royal Astronomical Society, 373, 1451
Robertson A., Massey R., Eke V., 2017a, MNRAS, 465, 569Robertson A., Massey R., Eke V., 2017b, MNRAS, 467, 4719RobertsonA.,MasseyR., EkeV., Schaye J., Theuns T., 2020,MonthlyNoticesof the Royal Astronomical Society, 501, 4610–4634
Rocha M., Peter A. H. G., Bullock J. S., Kaplinghat M., Garrison-KimmelS., Oñorbe J., Moustakas L. A., 2013, Monthly Notices of the RoyalAstronomical Society, 430, 81
Sagunski L., Gad-Nasr S., Colquhoun B., Robertson A., Tulin S., 2021,Journal of Cosmology and Astroparticle Physics, 2021, 024
Sameie O., et al., 2021, Monthly Notices of the Royal Astronomical Society,507, 720
Shen X., Hopkins P. F., Necib L., Jiang F., Boylan-Kolchin M., Wetzel A.,2021, Monthly Notices of the Royal Astronomical Society, 506, 4421
Spergel D. N., Steinhardt P. J., 2000, Physical Review Letters, 84, 3760Springel V., 2005, MNRAS, 364, 1105Springel V., Farrar G. R., 2007, Monthly Notices of the Royal AstronomicalSociety, 380, 911
Springel V., et al., 2005, Nature, 435, 629–636Springel V., Frenk C. S., White S. D. M., 2006, Nature, 440, 1137–1144Taylor P., Massey R., JauzacM., Courbin F., Harvey D., Joseph R., RobertsonA., 2017, MNRAS, 468, 5004
Tulin S., Yu H.-B., 2018, Phys. Rep., 730, 1Tulin S., Yu H.-B., Zurek K. M., 2013, Phys. Rev. D, 87, 115007TurnerH. C., LovellM. R., Zavala J., VogelsbergerM., 2021,MonthlyNoticesof the Royal Astronomical Society, 505, 5327
Vargya D., Sanderson R., Sameie O., Boylan-Kolchin M., Hopkins P. F.,Wetzel A., Graus A., 2021, Shapes of Milky-Way-Mass Galaxies withSelf-Interacting Dark Matter (arXiv:2104.14069)
Vega-Ferrero J., Dana J. M., Diego J. M., Yepes G., Cui W., Meneghetti M.,2020, Monthly Notices of the Royal Astronomical Society, 500, 247
Virtanen P., et al., 2020, Nature Meth., 17, 261Vogelsberger M., Zavala J., 2013, MNRAS, 430, 1722
Vogelsberger M., Zavala J., Loeb A., 2012, Monthly Notices of the RoyalAstronomical Society, 423, 3740
Vogelsberger M., Zavala J., Simpson C., Jenkins A., 2014, MNRAS, 444,3684
Wittman D., Golovich N., Dawson W. A., 2018, ApJ, 869, 104Zemp M., Gnedin O. Y., Gnedin N. Y., Kravtsov A. V., 2011, ApJSS, 197, 30Zhang C., Yu Q., Lu Y., 2015, The Astrophysical Journal, 813, 129Zhang C., Yu Q., Lu Y., 2016, The Astrophysical Journal, 820, 85ZuHone J. A., 2011, The Astrophysical Journal, 728, 54van den Aarssen L. G., Bringmann T., Pfrommer C., 2012, Phys. Rev. Lett.,109, 231301
APPENDIX A: RELABELLING PARTICLES FOR RSIDM
For rare self-interactions, large scattering angles are common. Whentwo particles (one from each merging halo) scatter, a scattering anglelarger than 90° could be interpreted as an exchange of particles. Ifso, it would make sense to switch the labels of the correspondingparticles. We implemented this by limiting the maximum scatteringangle to 90°. In Fig. A1, we show the density of the subhalo of a 1:10merger for both rSIDM versions at about the first apocentre passage.In the upper panel with and in the lower one without relabelling. Onecan see that this affects the formation of a second peak at the positionof the main halo.The relabelling procedure suppresses the second peak which in
consequence leads to less elliptical haloes. However, how much theshape is affected depends on the particles which are considered in theinertia tensor calculation. If only the matter within twice the scaleradius of the initial NFW profile is taken into account, the effectsfrom the relabelling procedure are negligible, but if all particles areconsidered, it can make a significant difference.
APPENDIX B: MORPHOLOGY
In Fig. B1, we show the same plots as in Fig. 3 but this time includingthe main halo. Due to the density contribution of the main halo whichhas 10 times the mass of the subhalo, it becomes more difficult toidentify morphological features. Nevertheless, differences betweenthe DM models are clearly visible.
APPENDIX C: PEAK POSITION, OFFSET, AND SHAPE
In this appendix, we provide further plots of the merger simulationswith the highest cross-section we modelled. In Fig. C1 - C6, we showthe potential based peak position together with the offset (Eq. (4))and the halo shape (Eq. (6)).
This paper has been typeset from a TEX/LATEX file prepared by the author.
MNRAS 000, 1–17 (2021)

18 M. S. Fischer et al.
2000 1000 0 1000 2000x [kpc]
2000
1000
0
1000
2000y
[kpc
]
10 5
10 4
10 3
10 2
DM d
ensit
y
rSIDM
MMR=1:10 T/m=0.5 cm2g 1
t = 3.13 Gyr
2000 1000 0 1000 2000x [kpc]
2000
1000
0
1000
2000
y [k
pc]
10 5
10 4
10 3
10 2
DM d
ensit
y
rSIDM
MMR=1:10 T/m=0.5 cm2g 1
t = 3.13 Gyr
Figure A1. The physical density of the subhalo of a merging system in theplane of the merger is shown at about the first apocentre passage. The systemis a 1:10 merger simulated with rare self-interactions (𝜎T̃/𝑚 = 0.5 cm2 g−1).The simulation of the upper panel allowed for scattering angles larger than90°, whereas the lower panel does not.
MNRAS 000, 1–17 (2021)

Unequal-mass mergers with SIDM 19
2000 1000 0 1000 2000x [kpc]
2000
1000
0
1000
2000y
[kpc
]
10 5
10 4
10 3
10 2
DM d
ensit
y
CDM
MMR=1:10 T/m=0.0 cm2g 1
= 1.16
2000 1000 0 1000 2000x [kpc]
2000
1000
0
1000
2000
y [k
pc]
10 5
10 4
10 3
10 2
Gal.
dens
ity
CDM
MMR=1:10 T/m=0.0 cm2g 1
= 1.16
2000 1000 0 1000 2000x [kpc]
2000
1000
0
1000
2000
y [k
pc]
10 5
10 4
10 3
10 2
DM d
ensit
y
rSIDM
MMR=1:10 T/m=0.5 cm2g 1
= 1.16
2000 1000 0 1000 2000x [kpc]
2000
1000
0
1000
2000
y [k
pc]
10 5
10 4
10 3
10 2
Gal.
dens
ity
rSIDM
MMR=1:10 T/m=0.5 cm2g 1
= 1.16
2000 1000 0 1000 2000x [kpc]
2000
1000
0
1000
2000
y [k
pc]
10 5
10 4
10 3
10 2
DM d
ensit
y
fSIDM
MMR=1:10 T/m=0.5 cm2g 1
= 1.16
2000 1000 0 1000 2000x [kpc]
2000
1000
0
1000
2000
y [k
pc]
10 5
10 4
10 3
10 2
Gal.
dens
ity
fSIDM
MMR=1:10 T/m=0.5 cm2g 1
= 1.16
Figure B1. The same as in Fig. 3, but considering both haloes. In the supplementary material, we provide the time evolution as a video.
MNRAS 000, 1–17 (2021)

20 M. S. Fischer et al.
0
2000
4000x
[kpc
]Mvir, main = 1015 MMMR=1:1
T/m=0.5 cm2g 1
400
200
0
offs
etDM
Gal [
kpc]
CDM, tm = 1.33 GyrfSIDM, tm = 1.07 GyrrSIDM, tm = 1.1 Gyr
1 0 1 2 30.6
0.8
1.0
s
DMGal
CDM, tm = 1.33 GyrfSIDM, tm = 1.07 GyrrSIDM, tm = 1.1 Gyr
DMGal
Figure C1. Peak position along the merger axis (top panel), the DM-galaxyoffset (middle panel), and the shape (bottom panel) for an equal mass mergeras a function of time. Results for CDM are shown in black, for rSIDM in red,and for fSIDM in green. The SIDM runs were conducted with a cross-sectionof 𝜎T̃/𝑚 = 0.5 cm2 g−1. Offsets and shapes are shown only for the subhalo.The DM component is indicated by a solid line and the galaxies by a dashedline.
2000
0
2000
4000
x [k
pc]
Mvir, main = 1015 MMMR=1:5
T/m=0.5 cm2g 1
400
200
0
offs
etDM
Gal [
kpc]
CDM, tm = 2.03 GyrfSIDM, tm = 1.64 GyrrSIDM, tm = 1.73 Gyr
1.0 0.5 0.0 0.5 1.0 1.5 2.00.50
0.75
1.00
1.25
s
DMGal
CDM, tm = 2.03 GyrfSIDM, tm = 1.64 GyrrSIDM, tm = 1.73 Gyr
DMGal
Figure C2. The same as in Fig. C1, but for an MMR of 1:5.
2000
0
2000
4000
x [k
pc]
Mvir, main = 1015 MMMR=1:10
T/m=0.5 cm2g 1
400
200
0
offs
etDM
Gal [
kpc]
CDM, tm = 2.61 GyrfSIDM, tm = 1.97 GyrrSIDM, tm = 2.26 Gyr
1.0 0.5 0.0 0.5 1.0 1.50.50
0.75
1.00
1.25
s
DMGal
CDM, tm = 2.61 GyrfSIDM, tm = 1.97 GyrrSIDM, tm = 2.26 Gyr
DMGal
Figure C3. The same as in Fig. C1, but for an MMR of 1:10.
MNRAS 000, 1–17 (2021)

Unequal-mass mergers with SIDM 21
0
200
400
x [k
pc]
Mvir, main = 1012 MMMR=1:1
T/m=2.0 cm2g 1
20
10
0
10
offs
etDM
Gal [
kpc]
CDM, tm = 1.42 GyrfSIDM, tm = 1.09 GyrrSIDM, tm = 1.13 Gyr
1.5 1.0 0.5 0.0 0.5 1.0 1.50.6
0.8
1.0
s
DMGal
CDM, tm = 1.42 GyrfSIDM, tm = 1.09 GyrrSIDM, tm = 1.13 Gyr
DMGal
Figure C4. The same as in Fig. C1, but for the galaxy-scale runs and with amomentum transfer cross-section of 𝜎T̃/𝑚 = 2.0 cm2 g−1.
0
200
400
x [k
pc]
Mvir, main = 1012 MMMR=1:5
T/m=2.0 cm2g 1
20
10
0
10
offs
etDM
Gal [
kpc]
CDM, tm = 2.28 GyrfSIDM, tm = 1.73 GyrrSIDM, tm = 1.82 Gyr
1.0 0.5 0.0 0.5 1.0 1.5 2.00.50
0.75
1.00
1.25
s
DMGal
CDM, tm = 2.28 GyrfSIDM, tm = 1.73 GyrrSIDM, tm = 1.82 Gyr
DMGal
Figure C5. The same as in Fig. C4, but for an MMR of 1:5.
200
0
200
400
x [k
pc]
Mvir, main = 1012 MMMR=1:10
T/m=2.0 cm2g 1
20
10
0
10
offs
etDM
Gal [
kpc]
CDM, tm = 3.08 GyrfSIDM, tm = 2.12 GyrrSIDM, tm = 2.51 Gyr
1.0 0.5 0.0 0.5 1.0 1.50.5
1.0
1.5
s
DMGal
CDM, tm = 3.08 GyrfSIDM, tm = 2.12 GyrrSIDM, tm = 2.51 Gyr
DMGal
Figure C6. The same as in Fig. C4, but for an MMR of 1:10.
MNRAS 000, 1–17 (2021)