A VALUE ASSESSMENT OF MERGERS AND ACQUISITIONS ...
193
i A VALUE ASSESSMENT OF MERGERS AND ACQUISITIONS IN THE SOUTH AFRICAN MINING INDUSTRY WILLIAM KWABENA OSAE Presented in partial fulfilment of the requirements for the degree MEng (Mining Engineering) IN THE FACULTY OF ENGINEERING, BUILT ENVIRONMENT AND INFORMATION TECHNOLOGY DEPARTMENT OF MINING ENGINEERING UNIVERSITY OF PRETORIA DECEMBER 2010 © University of Pretoria
-
Upload
khangminh22 -
Category
Documents
-
view
8 -
download
0
Transcript of A VALUE ASSESSMENT OF MERGERS AND ACQUISITIONS ...
i
A VALUE ASSESSMENT OF MERGERS AND ACQUISITIONS IN THE SOUTH AFRICAN MINING
INDUSTRY
WILLIAM KWABENA OSAE
Presented in partial fulfilment of the requirements for the degree
MEng (Mining Engineering)
IN THE FACULTY OF ENGINEERING, BUILT ENVIRONMENT AND
INFORMATION TECHNOLOGY
DEPARTMENT OF MINING ENGINEERING
UNIVERSITY OF PRETORIA
DECEMBER 2010
©© UUnniivveerrssiittyy ooff PPrreettoorriiaa

ii
I hereby declare that this dissertation is my own unaided work. It is being submitted for the degree MEng (Mining Engineering) at the University of Pretoria, Pretoria. It has not been submitted before for any degree or examination at any other university. This document represents my own opinion and interpretation of information received from research and interviews. It should be noted that one of the case studies analysed in this dissertation was the merger of the non-iron ore assets of Kumba Iron Ore and Eyesizwe Coal to form Exxaro Resources Limited. It is recorded here that my supervisor, Prof. Con Fauconnier, was the CEO of Kumba Resources prior to the merger and subsequently became the first CEO of Exxaro Resources until his retirement from office in 2006. Since then, I understand that he has had no formal relationship with Exxaro. It is declared that no specific views were solicited from Prof. Fauconnier regarding the success, or otherwise, of the Kumba/Eyesizwe deal and that all information used was obtained from press releases and annual reports. Mr Sipho Nkosi was CEO of Eyesizwe prior to the deal and is currently CEO of Exxaro Resources Limited. He participated in an interview on the broad subject matter of mergers and acquisitions. Likewise, it is recorded that all industry leaders who participated in the interviews, who have been acknowledged, were consulted mainly to solicit their views on value determination. The questionnaire used is attached as an appendix to this thesis and the discussions were confined to the questionnaire. By the nature of this study, it was important to gain insight from their intimate involvement and experience in mergers and acquisitions.
__________________________________(signature on copy of final document)
WILLIAM KWABENA OSAE
Dated this ________day of _____________

iii
UNIVERSITY OF PRETORIA
FACULTY OF ENGINEERING, BUILT ENVIRONMENT AND INFORMATION TECHNOLOGY
DEPARTMENT OF MINING ENGINEERING
The Department of Mining Engineering places great emphasis upon integrity and ethical conduct in
the preparation of all written work submitted for academic evaluation. While academic staff teach you
about systems of referring and how to avoid plagiarism, you too have a responsibility in this regard. If
you are at any stage uncertain as to what is required, you should speak to your lecturer before any
written work is submitted.
You are guilty of plagiarism if you copy something from a book, article or website without
acknowledging the source and pass it off as your own. In effect you are stealing something that
belongs to someone else. This is not only the case when you copy work word-by-word (verbatim), but
also when you submit someone else’s work in a slightly altered form (paraphrase) or use a line of
argument without acknowledging it. You are not allowed to use another student’s past written work.
You are also not allowed to let anybody copy your work with the intention of passing it off as his/her
work.
Students who commit plagiarism will lose all credits obtained in the plagiarised work. The matter may
also be referred to the Disciplinary Committee (Students) for a ruling. Plagiarism is regarded as a
serious contravention of the University’s rules and can lead to expulsion from the University. The
declaration which follows must be appended to all written work submitted while you are a student of
the Department of Mining Engineering. No written work will be accepted unless the declaration has
been completed and attached.
I (full names) ______William Kwabena Osae ____________________________
Student number ______9931137________________________________________
Topic of work _A value assessment of mergers and acquisitions in the South African mining
industry_
Declaration
1. I understand what plagiarism is and am aware of the University’s policy in this regard.
2. I declare that this dissertation is my own original work. Where other people’s work has been
used (either from a printed source, internet or any other source), this has been properly
acknowledged and referenced in accordance with departmental requirements.
3. I have not used another student’s past written work to hand in as my own.
4. I have not allowed, and will not allow, anyone to copy my work with the intention of passing it
off as his or her own work.
Signature __________________________________

iv
LANGUAGE EDIT
I, _____________________________________ hereby declare that I have
performed an English language edit on the final version of this project report.
Beverlie M Davies _10 January 2011
Signature Date

v
ABSTRACT
A VALUE ASSESSMENT OF MERGERS AND ACQUISITIONS IN THE SOUTH AFRICAN MINING
INDUSTRY
WILLIAM KWABENA OSAE
Supervisor: Professor Con Fauconnier
Co-Supervisor: Professor RCW Webber-Youngman
Department: Mining Engineering
University: University of Pretoria
Degree: MEng (Mining Engineering)
����
The global mining industry has been experiencing an unprecedented period of
change, driven by merger and acquisition activities which ran at record highs at all
levels of the sector (Goldsmith, 2008). Metals became the new green on Wall Street,
as mining displaced financial services to become the biggest source of mergers and
acquisitions (Bloomberg, 12 June 2008).
This was driven mainly by growing commodity demand from Asia which led to record
commodity prices. Mining companies therefore positioned themselves to gain bigger
economies of scale and diversification. The enactment of the Mineral and Petroleum
Resources Development (MPRDA) Act, No. 28 of 2002, in South Africa also
contributed to this trend. Mining mergers and acquisitions in South Africa have
increased considerably, with all-time-high annual total deal values of about US$5.3
billion and US$5.7 billion in 2003 and 2006 respectively, according to deal
information obtained from Dealogic.
Despite this growing trend, various studies conducted indicate mixed outcomes as to
whether mergers and acquisitions do create value. The bases for assessing value
creation in mergers and acquisitions, however, often tend to differ and therefore

vi
require a comprehensive and holistic approach. This dissertation examines some of
the key indicators that can be used to assess value creation in mergers and
acquisitions holistically and comprehensively. Subsequently, a suitable and
comprehensive value assessment model is developed and applied to some of the
key mergers and acquisitions that occurred in the South African mining industry
between 2003 and 2008.

vii
ACKNOWLEDGEMENTS
I wish to express my appreciation to the following organisations and persons who
made a contribution to this dissertation:
1 The database of information used on the mergers and acquisitions that
occurred in the South African mining industry between 2003 and 2008 was
obtained from Dealogic.
2 McGregor BFA provided all the information on financial parameters, historical
share price performance and market capitalisation for the companies
discussed in this dissertation and on industry benchmarks.
3 The following persons are gratefully acknowledged for their assistance during
the course of the study by participating in interviews:
a. Mr Sipho Nkosi (CEO, Exxaro Resources)
b. Mr Bernard Swanepoel (Founder, To The Point Consulting)
c. Mr Philip Kotze (CEO, Anooraq Resources)
d. Mr Peter Hayward-Butt (Co-Head, Investment Banking, RMB)
e. Mr Fani Titi (formerly of the TISO group and experienced in BEE deals)
4 Professor Con Fauconnier, my supervisor, and Professor R.C.W. Webber-
Youngman, my co-supervisor, for their guidance and support.
5 My wife Vivian and my children for their support and encouragement.

viii
CONTENTS
ACKNOWLEDGEMENTS ........................................................................................ VII
LIST OF FIGURES ..................................................................................................... X
LIST OF TABLES .................................................................................................... XII
LIST OF APPENDICES .......................................................................................... XIV
LIST OF ABBREVIATIONS ..................................................................................... XV
CHAPTER 1 INTRODUCTION ............................................................................... 1
1.1 Introduction to mergers and acquisitions ................................................................ 2
1.2 Project Background ................................................................................................ 2
1.3 Problem Statement ................................................................................................. 3
1.4 Objectives .............................................................................................................. 5
1.5 Scope of the Study ................................................................................................. 6
1.6 Methodology ........................................................................................................... 6
References – Chapter 1 ..................................................................................................... 7
CHAPTER 2 LITERATURE SURVEY .................................................................... 8
2.1 Introduction ............................................................................................................ 9
2.2 Mergers and Acquisitions Defined .......................................................................... 9
2.3 Types of Acquisition ............................................................................................. 10
2.4 The Role of Holding Companies in Mergers and Acquisitions ............................... 11
2.5 Motivations for Mergers and Acquisitions ............................................................. 12
2.6 The Merger and Acquisition Process .................................................................... 18
2.7 Discussion on Merger Objectives and Process ..................................................... 31
2.8 Participants in the Merger and Acquisition Process .............................................. 33
2.9 Merger and Acquisition Trends ............................................................................. 34
2.10 Discussion on Global Mining Mergers and Acquisitions ........................................ 42
2.11 The South African Economic Environment ........................................................... 44
2.12 The South African Mining Industry ........................................................................ 45
2.13 The Role of Mining in the South African National Economy .................................. 49
2.14 Legislative and Policy Framework of the South African Mining Industry ............... 52
2.15 Discussion on the South African Mining Industry .................................................. 59
ix
2.16 Mergers and Acquisitions in the South African Mining Industry ............................. 60
2.17 Mergers and Acquisition Trends in South African Mining Industry ........................ 64
2.18 Discussion on Mining Mergers and Acquisitions in South Africa ........................... 69
2.19 Value Creation Assessment Criteria for Mergers and Acquisitions ....................... 73
2.20 Discussion on Key Value Determination Indicators ............................................... 85
References – Chapter 2 ................................................................................................... 88
CHAPTER 3 RESULTS........................................................................................ 91
3.1 Introduction .......................................................................................................... 92
3.2 Selection of Appropriate and Representative Deals .............................................. 95
3.3 Application of Value Assessment Model ............................................................... 97
References – Chapter 3 ................................................................................................. 153
CHAPTER 4 ANALYSIS AND EVALUATION OF RESULTS ............................ 154
CHAPTER 5 CONCLUSIONS ............................................................................ 162
CHAPTER 6 RECOMMENDATIONS ................................................................. 167
CHAPTER 7 SUGGESTIONS FOR FURTHER WORK ..................................... 169

x
LIST OF FIGURES
Figure 2.9.3: Deal Value Classification by Commodity Type ............................................... 41
Figure 2.13: Mining Contribution to GDP and TFCF in South Africa .................................... 50
Figure 2.14.1a: BEE Rating of Various Sectors Listed on the JSE in 2006 (Source:
Empowerdex, 2006) ..................................................................................................... 56
Figure 2.14.1b: Proposed BEE Distribution Score (Source: Empowerdex, 2006) ................ 57
Figure 2.14.1c: Actual BEE Score Distribution (Source: Empowerdex, 2006) ..................... 57
Figure 2.16a: Total Merger and Acquisition Value in South Africa (Source: DTI, 2008) ....... 61
Figure 2.16b: BEE Contribution to Mergers and Acquisitions in SA (Source: DTI, 2008) ..... 61
Figure 2.16c: Distribution of Ownership Types in Mining BEE Deals (Source: Empowerdex,
2006) ............................................................................................................................ 63
Figure 2.16d: Types of BEE Ownership Deal in Mining in South Africa (Source:
Empowerdex, 2006) ..................................................................................................... 64
Figure 2.17a: Total Annual Deal Value (US$ billion) (Source: Dealogic) ............................. 66
Figure 2.17b: Average Annual Deal value (US$ million) (Source: Dealogic) ....................... 66
Figure 2.17c: Commodities Contribution to Total Number of Deals (Source: Dealogic) ....... 67
Figure 2.17d: Number of Deals per Commodity (Source: Dealogic) .................................... 68
Figure 2.19a: Deal Value Add (DVA) from 1997 to 2006 (Source: Dobbs, Goedhart &
Suonio, 2006) ............................................................................................................... 79
Figure 2.19b: Proportion Overpaid (POP) from 1997 to 2007 (Source: Dobbs, Goedhart &
Suonio, 2006) ............................................................................................................... 79
Figure 3.3.1a: Changes in Market Capital due to Announcement Effects (Source: McGregor
BFA)........................................................................................................................... 103
Figure 3.3.1b: Harmony Share Price Reaction Relative to Gold Index (Source: McGregor
BFA)........................................................................................................................... 103
Figure 3.3.1c: Location of Harmony’s Assets (Source: Harmony Annual Report 2003) ..... 106
Figure 3.3.1d: Gold Production at Harmony (000 ounces) (Source: Harmony Annual
Reports, 2000–2008) ................................................................................................. 107
Figure 3.3.1e: Producer Price Index for Mining and Quarrying (Source: McGregor BFA) .. 108
Figure 3.3.1f: Unit Cost of Production for Mining and Quarrying in R/kg (Source: Harmony
Annual Reports, 2000–2008) ..................................................................................... 109
Figure 3.3.1g: Comparative Return on Equity (%) (Source: McGregor BFA) ..................... 111
Figure 3.3.1h: Comparative Earnings per Share (SA cents per share) (Source: McGregor
BFA)........................................................................................................................... 112
Figure 3.3.1i: Comparative Dividends per Share (SA cents per share) (Source: McGregor
BFA)........................................................................................................................... 112
xi
Figure 3.3.1j: Comparative Price/Earnings Ratio (Source: McGregor BFA) ....................... 113
Figure 3.3.1k: Comparative Debt/Equity Ratio (Source: McGregor BFA) .......................... 113
Figure 3.3.1l: Harmony’s Production Forecast (Source: Harmony Annual Report 2006) ... 115
Figure 3.3.2a: ARM Manganese and Iron Ore Sales (000 tons) (Source: ARM Annual
Reports, 2006-2008) .................................................................................................. 118
Figure 3.3.2b: ARM Total Cost per Sales Ton (R/t) (Source: ARM Annual Reports, 2006–
2008) .......................................................................................................................... 119
Figure 3.3.2c: ARM Platinum Group Metals Production (ounces) (Source: ARM Annual
Reports, 2006–2008) ................................................................................................. 120
Figure 3.3.2d: ARM Cash Operating Cost (R/ton) (Source: ARM Annual Reports, 2006–
2008) .......................................................................................................................... 120
Figure 3.3.2e: ARM Return on Equity (%) (Source: McGregor BFA) ................................. 121
Figure 3.3.2f: ARM Earnings per Share and Dividends per Share (cents) (Source: McGregor
BFA)........................................................................................................................... 121
Figure 3.3.2g: ARM Debt/Equity Ratio (Source: McGregor BFA) ...................................... 122
Figure 3.3.3a: Pay Limits at Obuasi in grams/ton (Source: Ashanti GoldFields Annual
Reports 2004–2008) .................................................................................................. 129
Figure 3.3.3b: Cash Cost of AngloGold Ashanti, Obuasi and Geita in US$/oz (dollars per
ounce) ........................................................................................................................ 130
Figure 3.3.3c: Gold Production from the Various Operations Involved in the Merger in (000
ounces) ...................................................................................................................... 132
Figure 3.3.3d: Comparison of Return on Equity (%) (Source: McGregor BFA) .................. 135
Figure 3.3.3e: Earnings per Share (South African cents per share) (Source: McGregor BFA)
................................................................................................................................... 136
Figure 3.3.3f: Dividends per Share (South African cents per share) (Source: McGregor BFA)
................................................................................................................................... 137
Figure 3.3.3g: Price/Earnings Ratio (Source: McGregor BFA) .......................................... 137
Figure 3.3.3h: Debt/Equity Ratio (Source: McGregor BFA) ............................................... 138
Figure 3.3.4a: Cash operating Cost at Sishen (R/ton) (Source: Kumba Iron Ore Annual
Reviews, 2006–2008) ................................................................................................ 148
Figure 3.3.4b: Metallurgical Plant Efficiency at Sishen (%) (Source: Kumba Iron Ore Annual
Reviews, 2007–2008) ................................................................................................ 148
Figure 3.3.4c: Sishen Iron Ore Production (Run of Mine) in million tons (Source: Kumba Iron
Ore Annual Report 2007 and Annual Review 2008) ................................................... 149
Figure 3.3.4d: Exxaro’s Coal Production in million tons (Source: Exxaro Interim Report
2009) .......................................................................................................................... 149
Figure 3.3.4e: Kumba Iron Ore Share Price Performance (Source: McGregor BFA) ......... 152
xii
LIST OF TABLES
Table 2.9.1: Global Mergers and Acquisitions between 1995 and 2005 ............................... 37
Table 2.9.3a: Total Mining Deals (yoy % in parenthesis) ..................................................... 39
Table 2.9.3b: Number of Deals Per Category...................................................................... 40
Table 2.9.3c: Mining Deals per Geographical Region (with change from 2007 to 2008 in %)
..................................................................................................................................... 40
Table 2.9.3d: Top 10 Deals in US$ million in 2008 .............................................................. 42
Table 2.11: South Africa’s Real GDP and Economic Growth .............................................. 45
Table 2.12.1: South Africa’s Mineral Reserves Ranking Globally ........................................ 46
Table 2.12.2: South Africa’s Mineral Production Ranking Globally ...................................... 47
Table 2.13.1: Mining Contribution to GDP and TFCF in South Africa .................................. 49
Table 2.13.2: Mining Contribution to Employment in South Africa ....................................... 51
Table 2.14.2: BEE Qualification, Status and Recognition Levels ......................................... 55
Table 2.17: Summary of South African Mining Deals .......................................................... 65
Table 2.18a: Top Five Deals in 2008 (Source: Dealogic) .................................................... 70
Table 2.18b: Top Five Deals in 2007 (Source: Dealogic) .................................................... 71
Table 2.18c: Top Five Deals in 2006 (Source: Dealogic) .................................................... 71
Table 2.18d: Top Five Deals in 2005 (Source: Dealogic) .................................................... 71
Table 2.18e: Top Five Deals in 2004 (Source: Dealogic) .................................................... 72
Table 2.18f: Top Five Deals in 2003 (Source: Dealogic) ..................................................... 72
Table 2.19a: Shareholder Returns around Announcement Dates ....................................... 74
Table 2.19b: Post-merger Performance Assessment within 3–5 Years ............................... 74
Table 2.19c: Class of Tests of Merger and Acquisition Profitability ..................................... 76
Table 3.3.1a: Deal Value Add (R billion) ........................................................................... 102
Table 3.3.1b: Harmony’s Assets Classification (Source: Harmony Annual Report 2003) .. 105
Table 3.3.1c: BEE Production Ounces Conversion (Source: Harmony Annual Reports,
2003–2004) ................................................................................................................ 110
Table 3.3.3a: Ashanti Gold Field’s Post-Merger Contribution to Group Production
(000 ounces) .............................................................................................................. 131
Table 3.3.3b: Quality Assets of the Merged AngloGold Ashanti Company ........................ 133
Table 3.3.3c: Hedge Position of Ashanti and AngloGold as at June 2003 ......................... 133
Table 3.3.3d: Ashanti GoldFields Hedge Book Sensitivities as at December 2000 ........... 134
Table 3.3.4: Financial Value Assessment of Exxaro and Kumba ...................................... 150
Table 4.1: Deal Value Assessment for Harmony ............................................................... 156
Table 4.2: Deal Value Assessment for ARM ..................................................................... 157

xiii
Table 4.3: Value Assessment for AngloGold Ashanti ........................................................ 158
Table 4.4: Value Assessment for Exxaro and Kumba Iron Ore ......................................... 159

xiv
LIST OF APPENDICES
Appendix A: Merger and Acquisition Discussion Document .............................................. 172
Appendix B: Merger and Acquisition Questionnaire .......................................................... 175
Appendix C: Representative Deals ................................................................................... 176
xv
LIST OF ABBREVIATIONS
AAC
BBBEE
BEE
CONOPs
D/E
DCF
DME
DPS
DTI
DVA
EBIT
EBITDA
EPS
ESOP
GDP
HDSA
IFRS
JSE
KIO
MPRDA
MVA
NPV
NSJME
P/E
POP
ROA
ROE
ROIC
STC
TFCF
Anglo American Corporation
Broad Based Black Economic Empowerment
Black Economic Empowerment
Continuous Operations
Debt/Equity Ratio
Discounted Cash Flow
Department of Minerals and Energy
Dividend Per Share
Department of Trade and Industry
Deal Value Add
Earnings Before Interest and Tax
Earnings Before Interest, Tax, Depreciation and Amortisation
Earnings Per Share
Employee Share Ownership Scheme
Gross Domestic Product
Historically Disadvantaged South Africans
International Financial Reporting Standards
JSE Securities Exchange Limited
Kumba Iron Ore
Minerals and Petroleum Resources Development Act
Market Value Add
Net Present Value
Nedcor Securities Junior Mining and Exploration (Index)
Price Earnings Ratio
Proportion Overpaid
Return on Assets
Return on Equity
Return on Invested Capital
Secondary Tax on Companies
Total Fixed Capital Formation

xvi
TRS
yoy
Total Return to Shareholders
year-on-year

1
CHAPTER 1 INTRODUCTION

2
1.1 INTRODUCTION TO MERGERS AND ACQUISITIONS
Mergers and acquisitions are one of the ways by which firms attempt to create
value. The reasons for such activity often include, among others, expansion into
new markets, acquisition of new technology, achieving economies of scale,
reduction of duplicate costs and reduction of competition (DePamphilis, 2008).
Most organisations will in one way or another experience merger and acquisition
activity, as either acquirers, targets or partners. Even if an organisation chooses to
stay out of mergers and acquisitions, the odds are that its competitors may use
them for strategic or financial advantage, which may have implied consequences
for that organisation in the long run (Bruner, 2004).
However, it is often very difficult to determine whether these mergers and
acquisitions did in fact create value. One of the underlying reasons for this
difficulty is the determination of what key indicators should be used to assess and
measure value creation holistically, though they will vary for different situations.
This dissertation examines some of the key indicators that can be used in
assessing value in mining mergers and acquisitions, and applies them to some of
the key mergers and acquisitions that occurred in the South African mining
industry between 2003 and 2008. This provides a basis for reviewing some of the
past performances and for formulating lessons for the future.
1.2 PROJECT BACKGROUND
Mergers and acquisitions are occurring at increasing rates in the mining industry.
The enactment of Mineral and Petroleum Resources Development Act, No. 28 of
2002, in South Africa has also given rise to many junior mining companies. Many
of these mining juniors have been able to acquire mineral resources, and others
have purchased a stake in existing companies. Consolidation, unbundling and
acquisitions are also evident among existing companies.
3
The challenges always lie in how to identify and implement acquisitions, mergers
or partnerships that will create value. This requires, among others, an
understanding of the key indicators that can be used in value assessment, and
their application in assessing value in mergers and acquisitions.
1.3 PROBLEM STATEMENT
Mining mergers and acquisitions are often associated with huge financial deals.
The global value of mergers and acquisitions in the mining sector was US$134
billion in 2006, US$ 159 billion in 2007 and US$ 153 billion in 2008, according to
the 2008 Annual Review of Mining Deals report by PricewaterhouseCoopers
(Goldsmith, 2008).
Mergers and acquisitions in South Africa amounted to R514 billion in 2007, and
R284 billion in 2006. Total Black Economic Empowerment (BEE) transactions
amounted to R96 billion in 2007 and R56 billion in 2006. In 2006, mining mergers
and acquisitions made the biggest contribution to empowerment deals in South
Africa (Business Day, 13 May 2008).
Mining mergers and acquisitions in South Africa have increased considerably, with
all-time-high annual total deal values of about US$5.3 billion and US$5.7 billion in
2003 and 2006 respectively, according to deal information obtained from Dealogic.
Despite the huge financial investments involved, various studies have revealed
mixed outcomes as to whether or not mergers and acquisitions do indeed create
value. For instance, Dobbs, Goedhart and Suonio (2006) reported on two waves
of mergers and acquisitions activities. Their study indicated that value was
destroyed in the first wave which occurred between 1995 and 2000, but that the
period between 2003 and 2006, which constituted the second wave, did create
value. Post-merger and acquisition studies conducted by several authors, as
reported by DePamphilis (2008), indicated that the majority of mergers and
acquisitions underperform the industry average. There are, however, various
interpretations as to what constitutes value and how and when it is measured.
4
The South African mining environment has not been an exception to this rising
trend in merger and acquisition activities. However, not much work has been done
or published on the outcome of these deals in terms of value creation. It also
became evident, from interviews held with various industry leaders as part of this
dissertation, that post-merger value assessment is not usually done by companies
that participate in some form of merger or acquisition activity. This poses a serious
threat to the sustainability of the South African mining industry as a whole. The
recent financial crisis experienced by some junior mining companies that did
participate in acquisitions in the South African mining industry in response to the
requirements of the Mining Charter has impacted on the sustainability of some of
the BEE deals.
The following factors illustrate the importance and contribution of South African
mining to the local economy and globally:
(a) South Africa has the world’s largest resources of platinum group metals
(87.7%), manganese (80%), chromium (72.4%) and gold (40%).
(b) It also accounts for over 40% of the global production of ferrochromium,
platinum group metals and vanadium.
(c) In 2007, mining contributed 7.7% of South Africa’s Gross Domestic
Product, amounting to R135.6 billion, and 8.9% of the Total Fixed Capital
Formation. Mining’s contribution to South Africa’s exports was R536
billion in 2007.
(d) The mining industry employed about half a million (0.5 million) people in
2007, which represented 2.9% of total employment in this country.
(e) Mining also plays a very active role in the socio-economic development of
the areas in which mining companies operate.
(f) Mining offers significant opportunities for the integration and active
participation of historically disadvantaged black South Africans (HDBSAs)
in terms of ownership to realise the dream of a non-racial South Africa.
(g) Several countries, such as China, Australia and India, and various
countries in Europe, rely on South Africa for the supply of raw products
such as iron ore, manganese and coal, and beneficiated products such
as gold, ferrochrome and ferromanganese.

5
The above statistics were obtained from the Department of Minerals and Energy’s
(currently the Department of Mineral Resources) 2007/2008 report on South
Africa’s mineral industry.
If mining companies in South Africa are to remain significant and competitive,
mergers and acquisitions are bound to occur in order to comply with legislation,
create benefits through financial and operational synergy, diversification, etc., to
mention just a few reasons. For the industry to achieve these business objectives,
it is very critical that the failure rates of mergers and acquisitions should be
minimised to prevent a ripple effect on the economic and social dimensions of
South Africa.
One of the key steps in achieving this objective will be to create a comprehensive
and holistic framework for value assessment which can act as a guide in mergers
and acquisitions. This will then assist in determining the success rate of the past
and offer useful lessons for the future.
It therefore becomes a business imperative to investigate some of the key
indicators for a holistic assessment of value creation in mergers and acquisitions
and to give guidelines for their correct application in each situation.
1.4 OBJECTIVES
The objectives of this dissertation are to:
(a) understand mergers and acquisitions in general and some of the key
motives that drive these corporate actions
(b) understand the role of mining in the socio-economic development of South
Africa and hence the impact of mergers and acquisitions
(c) understand mergers and acquisitions that have occurred in the global
mining industry at large, and more specifically in the South African mining
industry
(d) understand some of key indicators that can be used to make a holistic and
comprehensive assessment of value in mergers and acquisitions

6
(e) develop a framework or guideline for value assessment of mergers and
acquisitions for the South African mining industry that is relevant and
comprehensive
(f) apply this framework or guideline to the South African mining industry in
the form of a value assessment of some of the key mergers and
acquisitions that occurred in the South African mining industry from 2003
to 2008
(g) outline and elaborate on some of the key findings and find out how
assistance can be given in future decision making to improve the success
rate of mining mergers and acquisitions, and also provide guidance for
new entrants such as BEE companies
1.5 SCOPE OF THE STUDY
This study considers all global and mining industry mergers and acquisitions and
trends, including those in the South African mining industry. However, the value
assessment of mergers and acquisitions is limited to the South African mining
industry. The study focuses only on some of the key mining mergers and
acquisitions that occurred in South Africa between 2003 and 2008, due to the
availability of reliable data. There was also a dramatic increase in mining mergers
and acquisitions during the period from 2003 to 2007.
1.6 METHODOLOGY
First, a literature review of mergers and acquisitions was undertaken to gain an
understanding of the rationale and motives behind them. Furthermore, an
understanding of some of the key quantitative and qualitative indicators that are
used for a holistic assessment of the value created in mining mergers and
acquisitions had to be acquired.
Thereafter the South Africa mining industry and its contribution to the socio-
economic framework of South Africa is discussed, as well as the mergers and
acquisitions that occurred in the South African mining industry between 2003 and
2008.

7
A framework for value assessment of mergers and acquisitions, suitable for the
South African mining industry, was then developed, using the findings from the
literature review, personal input and contributions from industry key stakeholders
(obtained through personal interviews) who have in-depth experience of mining
mergers and acquisitions in South Africa.
This framework was then used to make value assessments of some of the key
mining mergers and acquisitions that occurred in South Africa between 2003 and
2008. The outcome of these assessments provided a platform for a constructive
discussion, based on relevant information, on whether value has been created or
not and why. Finally, the dissertation examines the effectiveness of the framework
used and indicates areas for improvement.
REFERENCES – CHAPTER 1
Bloomberg, 12 June 2008. Mining replaces financial services as biggest driver of
M&A. http://www.bloomberg.com/apps/news
Bruner, R.F. (2004). Applied Mergers and Acquisitions. Hoboken, New Jersey:
Wiley.
Business Day (13 May 2008). South Africa: Slowdown in country’s mergers and
acquisitions. Johannesburg.
DePamphilis, D.M. (2008). Mergers, Acquisitions and Other Restructuring
Activities, 4th edition. Burlington, MA, USA: Academic Press.
Dobbs, R., Goedhart, M. & Suonio, H. (2006). Are companies getting better at
M&A?, The McKinsey Quarterly, December 2006.
http://www.mckinseyquarterly.com
Goldsmith, T (2008). Mining Deals, 2007 Annual Review.
http://www.pwc.com/mining

8
CHAPTER 2 LITERATURE SURVEY

9
2.1 INTRODUCTION
In business, one of the perceived routes for value creation is through growth.
Hence it is believed that companies on a growth path will take away market share
from competitors, create economic profits and provide returns to shareholders.
Those that do not grow tend to stagnate, and lose customers and market share.
Most companies have exhausted cost-cutting and operational efficiencies as
means to increase profitability and are therefore looking for growth as a primary
enabler of shareholder return (Sherman & Hart, 2006).
Despite the fact that not all mergers and acquisitions have been successful,
according to Moeller and Brady (2007) most companies that have grown into
global giants have used mergers and acquisitions as part of their growth strategy.
The questions therefore remain: Can a company become a large global player
without making acquisitions and will organic growth alone be sufficient for an
organisation to become a leading global player?
Mergers and acquisitions therefore have, and will continue to play, a vital role in
global organisations, despite the fact that not all of them have been successful.
2.2 MERGERS AND ACQUISITIONS DEFINED
The term ‘mergers and acquisitions’ refers to the aspect of corporate strategy,
corporate finance and management dealing with the buying, selling and combining
of different companies that can aid, finance or help a growing company in a given
industry to grow rapidly without having to create another business entity (Anon,
2008).
A merger is the combination of two or more companies into one larger company.
Such actions are commonly voluntary and involve stock swapping and/or cash
payment to the target. Stock swapping is often used as it allows the shareholders
of the two companies to share the risk involved in the deal. A merger usually
results in a new company name, often the combination of both original companies
into a new brand.

10
Mergers can be classified as:
• Horizontal, where the two companies produce similar products in same
industry
• Vertical, where each company works at a different stage in the production
of the same goods
• Conglomerate, where the two companies operate in different industries
• Congeneric, where both companies are in the same general industry but
have no mutual buyer/customer or supplier relationships
An acquisition, also known as a takeover, is the buying of one company (the
target) by another. An acquisition may be friendly or hostile. In the former case,
the companies co-operate in negotiations and in the latter case the target may be
unwilling to be bought or the target company’s board has no prior knowledge of
the offer.
Acquisition usually refers to the purchase of a smaller company by a larger one.
Sometimes, however, a smaller company will acquire control of a larger company
through equity ownership. This is known as a ‘reverse takeover’.
2.3 TYPES OF ACQUISITION
There are two types of acquisition, as follows:
• The buyer buys the shares and therefore control of the target company.
Ownership control of the company in turn conveys effective control over the
assets of the company, but since the company is acquired intact as a going
business, it also carries the liabilities of the target company
or
• The buyer buys the assets of the target company. The cash received from
the sell-off is paid to the shareholders by dividends or through liquidation.
This type of transaction, in which the buyer buys out the entire assets,
11
leaves the target company as an empty shell. The buyer then selects the
assets it wants and leaves out the assets and liabilities it does not want.
2.4 THE ROLE OF HOLDING COMPANIES IN MERGERS AND
ACQUISITIONS
The holding company is the legal entity having a controlling interest in one or more
companies resulting from mergers and acquisition activity. Effective control is
generally achieved by acquiring less than 100% but usually more than 50%.
Effective control can sometimes be achieved by owning as little as 20% in cases
where target company ownership is highly fragmented, with fewer shareholders
owning larger blocks of stock.
The holding company’s structure can sometimes create significant management
challenges where it does not own 100% of a subsidiary company, or where a
significant number of minority shareholders do not agree to the strategic direction
of the company. Furthermore, in highly diversified holding companies, managers
may have difficulty in making optimal investment decisions because of their limited
understanding of the different competitive dynamics of each business entity.
The holding company’s structure can in certain jurisdictions also create significant
tax problems for its shareholders. Subsidiaries of holding companies pay taxes on
their operating profits. The holding company then pays taxes on the dividends it
receives from its subsidiaries. Finally, holding company shareholders pay taxes on
the dividends they receive from the holding company. This is equivalent to triple
taxation of the subsidiary’s operating earnings. The current tax legislation in South
Africa, however, allows application for exemption from secondary tax on
companies (STC) for the dividends flowing from the subsidiary to the holding
company, and STC is paid only when the dividend is declared and paid to
shareholders.

12
2.5 MOTIVATIONS FOR MERGERS AND ACQUISITIONS
There are numerous reasons why mergers and acquisitions take place. Some of
the common ones, according to DePamphilis (2008), Moeller and Brady (2007),
Bruner (2004) and Pautler (2001), are:
• Synergy (operational and financial)
• Diversification
• Strategic re-alignment
• Market power
• Hubris and managerialism
• Buying undervalued assets (Q-ratio)
• Tax considerations
• Legal and regulatory framework
• Misevaluation
• Mismanagement (agency problems)
• Stakeholder expropriation
2.5.1 Synergy
This occurs when the combination of two or more businesses can create more
shareholder value than if they were operated separately, through improvement in
operating efficiency. Operating synergy consists of economies of scale and
economies of scope. Economies of scale refer to the spreading of fixed costs over
increasing production levels. Economies of scope refer to the use of a specific set
of skills or an asset currently employed in producing a specific product or service
to produce related products or services. These synergies are most often found
when it is cheaper to combine two or more product lines in one firm than to
produce them in separate firms.
13
Financial synergy refers to the impact of mergers and acquisitions on the cost of
capital, which is the minimum return required by investors and lenders. Combining
a firm with excess cash flows with one whose internally generated cash flow is
insufficient to fund its investment of opportunities may result in a lower cost of
borrowing.
A firm in a mature industry whose growth is slowing may produce cash flows in
excess of available investment opportunities. Another firm in a high-growth
industry may have more investment opportunities than cash to fund them.
Combining these two firms might result in a lower cost of capital for the merged
firms, with the ability to pursue growth opportunities.
2.5.2 Diversification
This refers to a strategy of making mergers and acquisitions outside a company’s
core or primary business, as well as geographically. A mining company whose
core business is the production of gold may chose to diversify into other
commodities such as coal, iron ore, platinum, etc. in order to pursue better growth
opportunities but also to spread its risk over various commodity cycles.
Geographic diversification also presents the opportunity of becoming a significant
global player in terms of access to resources and exposure to more favourable
political and labour climates. The opposite is also true in countries that may have
huge mining and mineral resources with a very unstable political climate, where
very high risk is associated with security of tenure. Hence, even though
diversification may generally present a platform for spreading business risk, it may
also create significant management challenges, depending on the nature and
degree of diversification.
2.5.3 Strategic re-alignment
This refers to the use of mergers and acquisitions as ways of adjusting rapidly to
changes in the external environment. These changes can come from different
sources, including technological, political, legal/regulatory, social, economic, etc.

14
For instance, as the pace of technological change accelerates, mergers and
acquisitions are sometimes viewed as a way of rapidly exploiting new products
and industries made possible by the emergence of new technologies. Large, more
bureaucratic firms are often unable to exhibit the creativity and speed that smaller,
more nimble and niche players display. In an environment where engineering
talents are scarce with product life-cycles becoming shorter, firms often do not
have the time and resources to innovate. Mergers and acquisitions may therefore
become a fast and sometimes less expensive way to acquire new technology in
current product offerings or to enter new markets.
2.5.4 Market power
This refers to the increase in a firm’s size, which subsequently leads to an
increase in market share, to improve its ability to set prices above competitive
levels. It also refers to the reduction of competition to allow a company to increase
its chances of survival. Mergers and acquisitions with such objectives are,
however, subject to anti-competition and anti-collusion rules and legislation, and
as such should be pursued with sound legal judgement and understanding of the
existing legal framework.
With regard to cross-border mergers and acquisitions, they could become very
complicated when the legal framework in one country differs significantly from that
of the other. There are also instances where it will be required to adhere to
competition regulations in both the country where the deal takes place and an
outside country, if other affected parties, for example suppliers or buyers of the
companies involved, operate in a different country.
2.5.5 Hubris and managerialism
Managers sometimes believe that their own evaluation of a target firm is superior
to the market’s valuation. This can often lead to overpayment due to ego-driven
decision making. The desire not to lose in a hostile takeover can, for instance,
result in a bidding war that results in a purchase price far in excess of the actual
economic value due to the personal self-interests of managers. This is sometimes
referred to as ‘the winner’s curse’.
15
There are also instances where management believes that increasing the size of
the company is an achievement that should result in an increase in power/position
and remuneration.
2.5.6 Buying undervalued assets (the q-ratio)
The q-ratio is the ratio of the market value of a firm to the replacement cost of its
assets. Firms interested in expansion have the choice of investing in a new plant
and equipment or obtaining the assets by acquiring a company whose market
value is less than the replacement cost of its assets (i.e. q-ratio < 1).
This theory was useful in explaining mergers and acquisitions during the 1970s
when high inflation and interest rates depressed stock markets well below the
book value of most firms. High inflation also caused the replacement cost of
assets to be much higher than the book value. Similarly in 2006, the flurry of
mergers and acquisitions in steel and copper companies reflected the belief that
the stock price of the target firms did not fully reflect the market value of those
assets.
The current global recession and credit crunch has also created a similar
environment where the market value of most companies is well below their book
value because of negative and pessimistic expectations of the future.
2.5.7 Mismanagement (agency problems)
This situation arises when there is a difference between the interests of incumbent
managers and the firm’s shareholders. This happens when management owns a
small fraction of the outstanding shares of the firm. Management is more inclined
towards maintaining job security and a lavish lifestyle than towards maximising
shareholder value. In instances where the shares of a company are widely held,
the cost of mismanagement is spread across a large number of shareholders.
Since each shareholder then bears only a small portion of the cost, this
mismanagement may be tolerated over a long period.
Mergers and acquisitions therefore take place to correct situations where there is
a conflict of interest between managers and shareholders. Low stock prices may
16
put pressure on managers to take action to raise the share price or become the
target of acquirers who perceive the stock to be undervalued. Mehran and
Peristiani (2006), as reported by DePamphillis (2008), found out that agency
problems are also important in management-initiated buy-outs, particularly when
managers and shareholders disagree over how excess cash flow should be used.
2.5.8 Tax considerations
There are two important issues in discussing the role of taxes as a motive for
mergers and acquisitions. First, tax benefits, such as loss carried forward and
investment tax credits, can be used to offset the combined companies’ taxable
income. An additional tax shelter is created if the acquisition is recorded under the
purchase method of accounting. This requires the book value of the acquired
assets to be re-valued to the current market value. The resulting depreciation of
these generally higher asset values also reduces the amount of future taxable
income generated by the combined companies.
Secondly, the taxable nature of the transaction will often play a more important
role in determining whether the merger takes place than any tax benefits that
accrue to the acquiring company. The seller may require a price that will differ
depending on whether or not there are tax benefits to be gained. Where there are
no tax benefits in terms of capital gains from the transaction, the seller may
request a higher price to compensate for tax payable from the transaction.
2.5.9 Misevaluation
This concept has traditionally been overshadowed by the presumption that
markets are efficient. Efficiency implies that a target’s share price will reflect
accurately its true economic value. Despite the generally accepted norm that
markets are efficient, evidence exists that assets may temporarily not reflect their
underlying economic value. The Internet bubble in the 1990s is an example of
market inefficiencies. Shleifer and Vishny (2003), as reported by DePamphilis
(2008), suggest that irrational changes in investors’ sentiments will sometimes
affect takeover motives.
17
It is therefore possible that acquirers may periodically profit by buying undervalued
targets for cash at a price below their actual value or by using equity. Similarly,
there is also a tendency for overvalued firms to use their overvalued stock to make
acquisitions more cheaply than what the case would be if they were correctly
valued.
2.5.10 Legal and regulatory framework
For the purpose of this study and considering the South African mining
environment, discussion will focus on regulatory issues with regard to ownership.
Leon (2008) reports that state influence and participation in ownership will
continue to impact on mining deals in Africa in order to secure the right to operate.
The most notable such deals are in Botswana, South Africa, Zimbabwe and
Zambia.
McKenzie (2008) reports on the regulatory issues affecting mining investment in
China, which requires a lot of state control in mineral exploration and mining.
Russia, too, is no exception to state control and ownership of mineral resources
and mining activities.
Mining companies may therefore have to embark on some form of mergers and
acquisitions in order to meet state regulatory approval in the countries in which
they operate.
2.5.11 Stakeholder expropriation
Pautler (2001) suggests a number of other motives for mergers and acquisitions in
which some shareholders may gain at the expense of other stakeholders. For
example, some target firms may seek acquirers to escape financial problems or to
break unfavourable labour contracts. There are also instances where other firms
may seek leveraged purchases of their targets to increase the surviving firm’s
risk-return profile at the expense of existing debt holders.
It is, however, evident that not all mergers and acquisitions will fully benefit all
stakeholders and this is due mainly due to the nature of business survival as
opposed to deliberate intent. It is not uncommon for trade unions to oppose

18
mergers and acquisitions if they believe these could lead to the reduction of jobs
due to operating synergies for example. There are also regulatory and approval
frameworks that look into issues relating to tax structure and its implications for the
state’s tax proceeds to ensure that the state is not exploited. However, one cannot
rule out the fact that some merger and acquisition motives could have the
deliberate intention to expropriate other stakeholders.
2.6 THE MERGER AND ACQUISITION PROCESS
Mergers and acquisitions are never events, but a process that takes on a life-span
of its own depending on the degree and success of post-merger integration. The
success of the process therefore depends on focusing on all the key essential
steps and managing them appropriately.
The key steps in the merger and acquisition process, according to DePamphilis
(2008), include the following phases:
• Phase 1: Develop a strategic plan (Business Plan)
• Phase 2: Develop an acquisition plan that supports the business plan
(Acquisition Plan)
• Phase 3: Actively search for acquisition candidates (Search)
• Phase 4: Screen and prioritise potential candidates (Screen)
• Phase 5: Initiate contact with the target (First Contact)
• Phase 6: Refine the valuation, structure the deal, perform due diligence and
develop a financing plan (Negotiation)
• Phase 7: Develop an integration plan (Integration Plan)
• Phase 8: Obtain all necessary approvals, resolve post-closing issues and
implement closure (Closing)
• Phase 9: Implement post-closing integration (Integration)
19
• Phase 10: Conduct a post-closing evaluation of the acquisition (Evaluation)
2.6.1 Phase 1: Building the business plan
A well-designed business plan, according to DePamphilis (2008), is a result of the
following:
1. External analysis of the operating environment (competitors, markets, etc.)
2. Internal analysis – strengths, weaknesses, opportunities and threats
(SWOT analysis)
3. Definition of a mission statement (where and how the company is
positioned, values, etc.)
4. Setting objectives (developing quantitative measures of financial and
non-financial performance)
5. Setting strategic direction, implementation and controls (how the objectives
will be achieved)
2.6.2 Phase 2: Building the merger/acquisition implementation plan
Following an analysis of a range of options, if an acquisition or merger is
necessary to achieve a business strategy, an acquisition or merger plan will be
required.
This plan consists of management objectives, resources assessment, market
analysis, how the process should be managed, a timetable for completing the
acquisition or merger and the various stakeholders involved.
Management objectives may include financial and non-financial considerations.
Financial objectives could include a minimum rate of return or operating profit,
revenue and cash flow within a specified period. Non-financial objectives address
motivations that support the achievement of the business plan, and may include
rights to products, patents and brands, new distribution channels, production
capacity, technology access, etc.

20
The depth to which the market analysis will be conducted will depend on whether
the merger or acquisition is taking place in the same market or a new market. It
will look at issues of market entry, customers, products and distribution channels.
During the early stages of the acquisition process, it is important to determine the
maximum amount of resources available (especially people, including expert input
and financial capability). The financial resources that are potentially available to
the acquirer include those internally generated cash flows in excess of normal
operating requirements, plus funds available from equity and debt markets. The
target company may also provide opportunities for additional sources of funding.
The acquisition plan will also have an implementation schedule that recognises all
of the key events that must take place throughout the acquisition process. Every
event should be characterised by beginning and ending milestones, as well as
dates and individuals responsible for the achievement of milestones.
2.6.3 Phase 3: The search process
Initiating the search for potential acquisition candidates involves a two-stage
procedure. The first step is to establish the primary screening or selection criteria.
The primary criteria will include the industry and the size of the transaction. The
size of the transaction is best defined in terms of the maximum purchase price that
a firm is willing to pay.
The second step is to develop a search strategy. Such strategies normally entail
using computerised databases, as well as merger and acquisition expert firms.
Acquiring firms may also ask their legal, banking and accounting firms to identify
other candidates. Investment banks, brokers and leverage buy-out firms are also
very good sources of candidates, although they are likely to require an advisory or
finder’s fee. Industry analysts in the market being targeted also have very useful
sources of information.
Finding reliable information about privately owned firms can be a major challenge.
However, publicly available information can be used as a guide. Benchmarking
done on the type of industry can also be used as a guide. For example, a firm’s

21
sales can be roughly estimated by multiplying an estimate of its workforce by the
industry-average ratio of sales per employee.
2.6.4 Phase 4: The screening process
The screening process is a refinement of the search process. It begins with a
pruning of the initial list of candidates. The following are some of the criteria that
can be used to screen potential targets:
• Market segment
• Product line
• Profitability
• Degree of leverage
• Market share
Market segment
The search criteria involve the specification of the target industry. It is now
necessary to identify the target segment in the industry. For example, a steel
manufacturing company may decide to diversify by acquiring a manufacturer of
aluminium flat-rolled products. A primary search criterion would be to include only
firms manufacturing aluminium flat-rolled products. Subsequent search criteria
may focus on companies that manufacture aluminium tubular products.
Product line
The product line criterion would identify a specific product line within the target
market segment. The steel manufacturing in the previous example may decide to
focus its search on companies manufacturing tubular products used in the
manufacturing of lawn and patio furniture.
Profitability
The profitability criterion should be defined with parameters such as percentage
return on sales, assets or total investments. This will allow a more accurate
comparison among candidates of different sizes.
22
Degree of leverage
Debt-to-equity or debt-to-total capital ratios often are used to measure the level of
leverage or indebtedness. The acquiring company may not want to purchase a
company whose heavy debt burden may cause the acquiring company’s leverage
ratios to exceed targeted levels and jeopardise the acquirer’s credit rating. The
debt/equity ratio must be considered in conjunction with the firm’s ability to
generate sufficient cash flow to finance the debt.
Market share
The acquiring firm may be interested only in firms that have a large market share
in the targeted industry. Firms having a substantially greater market share than
their competitors are often able to achieve lower cost positions than their
competitors because of economies of scale.
2.6.5 Phase 5: First contact
The approach suggested for initiating contact with a target company depends on
the size of the company, whether the target is publicly or privately held, and on the
acquirer’s time-frame for completing the transaction. Relationship building
enhances the deal-negotiation process.
For small companies (<US$25 million in sales) in which the buyer has no direct
contacts, a letter of expression of interest, followed by a phone call and a meeting
may be sufficient.
For medium-sized companies (between US$25 million and US$100 million)
contact should be made at the highest level possible through an intermediary.
Intermediaries include members of the acquirer’s board, an investment banker,
legal counsel or broker.
For large, publicly traded companies, contact should also be made at the highest
level through an intermediary. Discretion is extremely important to prevent the
target company from becoming a potential target of other acquirers. Even rumours
of an acquisition can have substantial and adverse consequences for the target.
Employees, suppliers, customers and shareholders become increasingly
23
concerned when there are rumours. The Johannesburg Securities Exchange
(JSE) regulations require a company to make a public disclosure if there is a leak
in respect of an acquisition of or by a listed company.
Neither the buyer nor the seller has an incentive to be the first to provide an
estimate of value. Getting a range may be the best option at this initial stage. This
can be done by discussing completed acquisitions of a similar nature.
Preliminary legal documents include a confidentiality agreement, a letter of intent
and a term sheet.
The confidentiality agreement (also called a non-disclosure agreement) is
generally mutually binding and covers all parties to the transaction. This
agreement should cover only information that is not in the public domain and
should have a reasonable expiration date.
The letter of intent is used to identify process areas of agreement and
disagreement. It formally stipulates the reason for the agreement, as well as the
major terms and conditions. It also sets out the responsibilities of both parties
while the agreement is in force. It specifies the types of data that must be
exchanged and the duration and extent of the initial due diligence.
The term sheet is a discussion document outlining the primary terms with the
seller and is often used as a basis for a more detailed letter of intent. Many
transactions skip the term sheet and go straight to negotiating the letter of intent.
2.6.6 Phase 6: Negotiation
Negotiation is essentially a process in which two or more parties, representing
different interests, attempt to achieve consensus on a particular issue. A useful
starting point in any negotiation is to determine areas of agreement and
disagreement.
The negotiation process consists of four concurrent activities, namely:
• Refining the valuation
• Deal structuring

24
• Due diligence
• Developing a financing plan
Refining the valuation
The first activity within the negotiation phase of the acquisition process involves
updating the preliminary valuation of the target company. The buyer may also
request and review at least three to five years of historical financial data. This
information is usually an audited version in accordance with the International
Financial Reporting Standards (IFRS). The valuations are normalised for abnormal
transactions and then refined using standard financial modelling techniques.
The financial modelling process involves four discrete steps, namely:
• Value acquirer and target firm as stand-alone businesses.
• Value acquirer and target firm, including synergy.
• Determine initial offer price for target firm.
• Determine combined firms’ ability to finance transaction.
There are five basic methods of valuation, namely:
• Income or discounted cash flow (DCF)
• Market-based valuation
• Asset-oriented valuation
• Replacement cost
• Contingency claims or real options approach
Deal structuring
In purely financial terms, deal structuring involves the allocation of cash flow
streams (with respect to amount and timing), the allocation of risk, and therefore
the allocation of value between the different parties to the transaction.

25
In practice, it deals with potential sources of disagreement on issues such as
forms of payment, legal, accounting and tax structures. It also addresses issues
pertaining to, but not limited to, how ownership is determined, how assets are
transferred, how ownership is protected (governance) and how risk is apportioned
among the parties to the transaction.
The deal-structuring process consists of a number of interdependent components.
These include the acquisition vehicle, the post-closing organisation, the legal form
of the selling entity, the form of payment, the form of acquisition and tax
considerations.
The acquisition vehicle refers to the legal structure (e.g. corporation or
partnership) used to acquire the target company. The post-closing organisation is
the organisational and legal framework (e.g. corporation or partnership) used to
manage the combined business following completion of the transaction. The form
of payment may consist of cash, common stock, debt or some combination. The
form of acquisition reflects both what is being acquired (e.g. stock or assets) and
the form of payment.
Conducting due diligence
The parties to the transaction should conduct their own due diligence to assess
potential risks and rewards accurately. The types of due diligence conducted by
the different parties may include:
• Buyer due diligence
• Seller due diligence
• Lender due diligence
Buyer due diligence will focus on issues such as validation of the assumptions
underlying the valuation. It will draw on a strategic/operational/marketing review by
senior operations and marketing management, a financial review by financial and
accounting personnel, and a legal review by the buyer’s legal counsel. The
strategic and operational review must focus on the seller’s management team,
operations, and sales and marketing strategies. The financial review will focus on

26
the accuracy, timeliness and completeness of the seller’s financial statements.
Finally, the legal review will consider corporate records, financial matters,
management and employee issues, tangible and intangible assets, material
contracts and the obligations of the seller.
Seller due diligence will essentially consider whether the buyer has the financial
capability to effect the transaction. It will also look at the accuracy of the seller’s
internal investigation to ensure the accuracy of the representations and warranties
made in the agreement.
If the buyer is borrowing to buy a target firm, the lender(s) will also want to perform
their own due diligence to ensure the accuracy of the valuations, as well as the
buyer’s ability to repay the loan.
Developing the financial plan
This involves the development of a balance sheet, and income and cash flow
statements for the combined firms in accordance with IFRS and includes the cost
of financing the transaction. This is essential in determining the purchase price
because it places a limitation on the purchase price that the buyer can offer the
seller.
According to capital budgeting theory, an investment should be funded as long as
the net present value (NPV) is greater than or equal to zero. In applying the same
concept to the acquisition, the buyer should be able to finance a purchase price up
to the present value of the target company as an independent or stand-alone
entity, plus the synergy created by combining the acquiring and target companies,
discounted at the appropriate cost of capital.
No matter what the size of the transaction, lenders and investors will want to see a
coherent analysis explaining why the proposed transaction is a good investment
opportunity for them. The financial plan is therefore a marketing or sales document
to negotiate the best possible terms for financing the proposed transaction.
27
2.6.7 Phase 7: Developing the integration plan
The euphoria that surrounds the successful completion of a transaction could
erode quickly once the challenges of making the combined firms perform in line
with the predictions laid out in the business and acquisition plans become
apparent.
Successful integration requires getting employees in both firms to work towards
achieving common objectives and comes through building trust and credibility.
The appointment of an integration manager with excellent interpersonal and
project management skills could be very useful. It is important to determine what is
critical for the continuation of the acquired company’s success during the
immediate period (one to two years) after closing of the deal. Critical activities
include the identification of key managers, vendors and customers, as well as
what is needed to retain these valuable assets.
The pre-closing integration planning activity also should include the determination
of the operating norms and/or standards required for continued operation of the
businesses. These include executive compensation, labour contracts, billing
procedures, product delivery times and quality expectations. A communication
plan to keep all stakeholders informed is essential.
2.6.8 Phase 8: Closing
The closing phase of the acquisition process consists of obtaining all necessary
shareholder, regulatory and third-party consents (e.g. customer and vendor
contracts), as well as completing the definitive agreement of purchase and sale.
Assigning customer and vendor contracts
In the purchase of an asset, many customer and vendor contracts cannot be
assigned to the buyer without receiving written approval from the other parties.
Both vendors and customers may view this as an opportunity to attempt to
negotiate more favourable terms. Licences must also receive approval from the
licensor.

28
Gaining necessary approvals
The buyer’s legal counsel is responsible for ensuring that the transaction is in full
compliance with securities, antitrust and state corporation laws. The transaction
must also meet the approval of the acquirer and target shareholders.
Completing the definitive agreement
The definitive agreement is perhaps the most important of all the closing
documents, and indicates the rights and obligations of the parties both before and
after closing of the deal.
The major components of an asset purchase agreement include the following:
• Purpose of acquisition
• Price
• Allocation of price
• Payment mechanism
• Assumption of liabilities
• Representations and warranties
• Covenants
• Conditions for closing
• Indemnification
• Mergers agreements
• Other closing documents
2.6.9 Phase 9: Implementing post-closing integration
The post-closing integration is one of the most important phases of the acquisition
process. The post-closing integration activity consists of:

29
• Implementing an effective communication plan
• Retaining key managers
• Identifying immediate operating cash flow requirements
• Employing the best practices from both companies
• Addressing cultural issues
Communication plans
An effective communication plan is crucial for the purpose of retaining the
employees of the acquired firm and maintaining or boosting their morale and
productivity. The plan should address employee, customer and vendor
requirements. Employees need to understand how their compensation, including
benefits, might change under the new ownership. Customers would want
reassurance that there will not be any deterioration in product or service quality or
delivery time during the transition period. Vendors will also be interested in
understanding how the change in ownership will affect their sales to the new firm.
Employee retention
Middle-level managers should be a top priority during this phase of the acquisition
process. In most cases, senior managers that the buyer chose to retain are asked
to sign employment agreements as a condition to closing. However, although
senior managers provide overall direction for the firm, middle-level managers
execute the day-to-day operations of the firm. Retention schemes have to be put
in place to minimise turnover.
Satisfying cash flow requirements
Operating cash flow will be essential in dealing with short- to medium-term cash
needs. There will be a need to make clear in discussions with middle managers,
following closure of the deal, areas in which maintenance expenditures have been
deferred. Receivables, previously thought to be collectable, may have to be written
off. Production may be disrupted as employees of the newly acquired firm try to
adapt to new practices introduced by the acquiring company or if inventory levels

30
are inadequate to maintain desired customer delivery times. Finally, more
customers than had been previously anticipated may be lost to competitors during
the period of transition.
The net effect of these issues needs to be understood and managed to ensure
that there is sufficient operating cash flow.
Employing best practices
The benefits of operating synergies are normally realised when a vehicle or
platform exists for sharing best practices from both organisations. This includes
areas of operating efficiency, product quality, customer service and on-time
delivery.
The new organisation is therefore able to combine the best practices and let go of
those that will not fit in with or support the new organisation.
Cultural issues
Corporate cultures reflect the set of beliefs and behaviours of the management
and employees of that organisation. Some organisations are paternalistic and
others are very ‘bottom line’ oriented. Some empower employees, whereas others
believe in highly centralised control. Some promote problem solving within a team
environment and others encourage individual performance.
Inevitably, different corporate cultures will impede post-acquisition integration
efforts and there will be a need to manage them effectively.
2.6.10 Phase 10: Conducting a post-closing evaluation
The main objective of conducting a post-closure evaluation is to determine
whether the acquisition is meeting its expectations, to determine corrective
actions, if necessary, and to identify what was done well and what should be done
better in future acquisitions.
Some of the key issues to consider include the following:
• Do not change performance benchmarks.

31
• Ask the difficult questions.
• Learn from mistakes.
Performance benchmarks
Once the acquisition appears to be operating normally, the actual performance
needs to be evaluated against that projected in the acquisition plan. Success
should be defined in terms of the actual as opposed to the planned performance.
It is often quite tempting to ignore the performance targets set during the
acquisition and accept less than the planned performance to justify the acquisition.
This may be appropriate if circumstances beyond the firm’s control have caused a
change in the operating environment. Typical examples include a recession, which
slows growth in revenue, or changing regulations, which preclude the introduction
of a new product.
Ask the difficult questions
Some of the questions that need to be asked, depending on the time elapsed
since closing, may include:
• Were the original valuation assumptions reasonable?
• What did the buyer do well, and what needs to be done differently?
• Is the business performing to expectations, and if not, why?
• Are the right people in place to manage the business for the long term?
• Are there any new risks or threats that need to be managed?
2.7 DISCUSSION ON MERGER OBJECTIVES AND PROCESS
In the South African mining industry, most of the motives for mergers and
acquisitions are driven by legislation compliance, operational and financial
synergy benefits, strategic re-alignment to achieve scale in terms of production
and significant market capitalisation, diversification in terms of commodities from a
risk point of view and buying of undervalued assets. In a few instances,

32
managerial pride, misevaluation and tax considerations (ring fencing) may have
motivated merger and acquisition activities.
The motive behind a merger or an acquisition is very important, since it offers
clarity of purpose and focus throughout the process of target acquisition, deal
valuation and post-merger integration. It also assists in clarifying the non-financial
benefits and threats to the merger objective.
The process of post-merger integration is probably by far the most important step
in any deal process. When companies merge, they do not merge only income
statements, balance sheets and cash flows. They also merge people, cultures,
systems and procedures, which often take a long time to integrate. In the recent
hostile bid made by XStrata for Anglo American, the new Chairman of Anglo
American, Sir John Parker, objected to the merger as having the potential to
destroy value because the two companies, in his opinion, differ significantly in
cultures and operating philosophy. The post-merger integration impacts
significantly on how much of the value anticipated can be extracted and how long
it could take to extract such value.
During the acquisition trail of Harmony, in addition to assets from the old Harmony
and Evander, the company acquired assets from Randfontein, Elandskraal,
Freegold and ARMgold. Within about three years between 2000 and 2003, the
cultures of JCI, AngloGold and ARMgold had to be merged into the existing
culture. The psychological and emotional impact of such cultural clashes can be
very traumatic for employees and careful attention needs to be paid to address
these issues to ensure the realisation of the intended benefits. There were also
significant differences in organisational structures, remuneration/payroll systems
and material resource planning systems, to mention a few.
It is also very important to note that deal objectives may not always be financial,
hence any assessment framework must also incorporate non-financial issues to
achieve a balanced and comprehensive value assessment of mergers and
acquisitions.
33
2.8 PARTICIPANTS IN THE MERGER AND ACQUISITION PROCESS
Some of the key participants in the merger and acquisition process, other than the
board, management and employees of the company, may include the following
(DePamphilis, 2008):
• Investment bankers
• Lawyers
• Accountants
• Proxy solicitors
• Public relations firms
• Institutional investors
• Hedge and private equity funds
• Merger and acquisition arbitrageurs
Investment bankers provide strategic and tactical advice and acquisition
opportunities, screen potential buyers and sellers, make initial contact with a seller
or buyer, and provide negotiation support, valuation and deal-structuring
guidance. They also issue a fairness opinion letter as a third party to a deal,
certifying the appropriateness of the price of a proposed deal. Large investment
banks are also able to assist in funding through syndicates.
Lawyers assist with the legal framework, on issues of corporate tax, employee
benefits, antitrust, securities and intellectual property.
Accountants provide input and guidance on issues such as optimal tax structure,
financial structuring and financial due diligence. They also perform the role of
auditors by reviewing financial statements.
Proxy contests may arise due to attempts to change management control of a
company by gaining the right to cast votes on behalf of other shareholders. Proxy
solicitors are then useful contacts to dissident shareholders. They may also be
used by management to design strategies to educate shareholders and
communicate why shareholders must follow the board’s recommendation.

34
Communicating a consistent position during a takeover attempt is vital.
Inconsistent messages may reduce the credibility of the parties involved. Public
relations firms are used in assisting parties in this regard.
Institutional investors include public and private pension funds, insurance
companies, investment companies, bank trust departments and mutual funds.
They provide a source of financial funding for mergers and acquisitions and can
also be a useful sounding board for acceptance of the deal by the investing
community.
Private equity funds are usually private investment limited partnerships or offshore
investment corporations. An important difference between them and hedge funds
is the time investors are required to commit funds. Investors in hedge funds are
generally given more frequent access to their money than those who invest in
private equity. Hedge and private equity funds provide financial funding. They may
also be used for completing transactions, arranging financing, performing due
diligence and monitoring the business performance of companies in their portfolio.
When a bid is made for a target company, the target company’s stock price often
trades at a small discount to the actual bid. This reflects the risk that the offer may
not be accepted. Merger and acquisition arbitrage refers to an investment strategy
that attempts to profit from this situation.
Employee representatives or organised labour (unions), governments,
communities and non-governmental organisations are also very much key
stakeholders that play a vital role in the merger and acquisition process.
2.9 MERGER AND ACQUISITION TRENDS
Merger activity tends to take place in waves – a time of increased activity followed
by a period of relatively few acquisitions. There have been six merger and
acquisition ‘waves’ over the past century between the periods of 1897 to 2007.
Each wave has been stimulated by events outside the merger world, but which
have had a significant impact on the level of merger activity (Moeller & Brady,
2007).
35
The first wave took place from 1897 and continued to 1904. It started in the United
States after the depression of 1893 had ended, and continued until the 1904 stock
market crash, with a peak between 1898 and 1902. This merger wave featured
horizontal mergers (about three-quarters of them) and often resulted in a
near-monopolistic situation in the consolidating industries: metals, food, oil,
chemicals, machinery and coal. Some of the companies formed from this wave in
the United States have remained global powerhouses and include Du Pont,
Standard Oil, American Tobacco, General Electric, Eastman Kodak and US Steel.
The second wave took place from 1916 until the Great Depression started in
1929. The growth of this merger and acquisition wave was facilitated by
co-operation among businesses as part of the Great War (World War I) effort,
when governments did not enforce antitrust laws and in fact encouraged
businesses to co-operate. For the first time investment bankers were aggressive in
funding mergers, and much of the capital was controlled by a number of small
investment bankers (most notably J.P. Morgan). The role of investment bankers in
driving the deal market continues today. Over two-thirds of this wave was
horizontal, while most of that remaining was vertical. Many of these mergers
created huge economies of scale that made firms economically stronger. The
industries that were mostly involved were mining, oil, food products, chemicals,
banking and automobiles. Some of the companies created in the United States in
this period were General Motors, IBM, John Deere and Union Carbide.
The third wave occurred from 1965 to 1969. Many of the deals in this wave were
driven by what was later determined to be irrational financial engineering of
company stock market earnings ratios (similar in many ways to the exuberance of
the dot.com era 30 years later). This wave was mainly conglomerate mergers.
A classic example was the acquisition by ITT of companies as diverse as
Sheraton Hotels, Avis Rent-a-Car, Continental Banking, a consumer credit
company, various parking facilities and several restaurant chains. One reason for
such conglomerate mergers was the worldwide growth after World War II in
stronger antitrust rules, thus forcing companies that wanted to expand by
acquisition to look for unrelated businesses.

36
The fourth wave was from 1981 to 1989 and was characterised by hostile
takeovers. The number of hostile takeovers rose dramatically, the role of the
‘corporate raider’ developed, anti-takeover strategies and tactics became more
sophisticated and investment bankers and attorneys played a more significant
role. The development of the high-yield bond market enabled companies to launch
‘mega deals’ and even purchase companies bigger than themselves (reverse
takeover). This trend contributed to the high number of leverage buy-outs with
excessive use of debt and companies going private. The relaxation of antitrust
rules in the United States and the United Kingdom assisted this wave.
The fifth wave, which occurred between 1994 and 2000, was characterised by
consolidation of industries and globalisation. The dot.com boom and bust also
occurred during this wave. The industries involved were oil, financial services,
information technology, telecommunications, pharmaceuticals and automobiles.
Companies involved in consolidations included Daimler Benz and Chrysler, Glaxo
and Wellcome, Exxon and Mobil, Mannesmann and Vodafone, Chase Manhattan
and J.P. Morgan, and Hewlett Packard and Compaq.
The sixth wave began in 2003, less than three years after the previous cycle,
indicating shorter and more frequent waves of merger and acquisition activities.
This wave is mainly horizontal and cross-border. It has also been heavily
influenced by the corporate scandals and the resulting laws and regulations that
have been passed – most notably the Sarbanes-Oxley Act in the United States.
This wave has also shown a rise in activity by financial buyers (hedge funds,
private equity funds, venture capital funds). Mining, metal and resource companies
have been very active during this wave, as a result of an increase in demand for
commodities from China and other countries in Asia which have experienced
phenomenal growth. The acquisition of Arcelor by Mittal and the acquisition of
Alcan Inc by Rio Tinto are examples. With the current global economic recession
and credit bubble burst that began in 2008, there has been a decline in merger
and acquisition activity, which might perhaps signal the end of this wave.
Despite the extreme caution exercised by most organisations to preserve cash,
the value of most companies has fallen sharply due to stock market decline
offering opportunities to purchase assets cheaply. It is therefore foreseeable that a

37
new wave of merger and acquisition activity may begin once the current global
recession has stabilised.
2.9.1 Historical global mergers and acquisitions
The mergers and acquisitions that are documented mostly originated in the United
States, especially between the period 1895 to 1995. Global data on mergers and
acquisitions are more evident between 1995 and 2005, as shown in Table 2.9.1.
Table 2.9.1: Global Mergers and Acquisitions between 1995 and 2005
Year Number of
Deals (Global)
Deal Value
(US$ bn)
Number of
Deals (US)
Deal Value
(US$ bn)
By Value
US/Global %
1995 22,027 980 3,510 356 36.3
1996 23,166 1,146 5,848 495 43.1
1997 22,642 1,676 7,800 657 39.2
1998 27,256 2,581 7,809 1,192 46.1
1999 31,701 3,439 9,278 1,426 41.4
2000 37,204 3,497 9,566 1,706 48.7
2001 28,828 1,745 8,290 759 43.4
2002 26,270 1,207 7,303 441 36.5
2003 27,753 1,333 8,131 559 41.9
2004 31,467 1,949 9,783 812 41.6
2005 33,574 2,775 10,644 1,045 37.6
2006 37,032 3,794 10,977 1,563 41.1
Source: (DePamphilis, 2008)
By value, United States deals account for about 36 to 49% of total global deals.
This could be one of the reasons why most of merger and acquisition studies

38
conducted involve companies in the United States, because the impact needs to
be understood.
2.9.2 Historical global mining mergers and acquisitions
Mining mergers and acquisitions have increased considerably over the years,
fuelled mainly by growing commodity demand from China and India. The period
between 2006 and early 2008 saw a phenomenal increase in actual deals, as well
as potential mega deals that were cancelled or postponed due to the global
economic slowdown.
After two years of record mining merger and acquisition activity, 2008 turned out to
be a year of extremes, with the earlier part of the year following a pattern
established in the previous years before plunging in the closing months
(Goldsmith, 2009).
The most notable potential deal that would have created an all-time record was
the BHP Billiton potential bid of about US$150 billion for Rio Tinto. It was a
super-consolidation deal that never happened due partly to Competition
Commission considerations, but mostly to the deteriorating global financial and
economic climate.
Even though the global credit crisis had been constraining the financial and
economic outlook since mid-2007, there remained a sentiment that this was a
crisis whose effects could be contained by the growing commodity demand from
China and India. The quest for world-scale resource acquisition, resource
diversification and sector consolidation drove deals well into 2008 until the
collapse of Lehman Brothers in September 2008. This sounded an alarm to the
sector and triggered a rapid fall in most commodity prices, resulting in most deals
being called off. These included the rumoured US$90 billion bid by Vale for
XStrata and the US$5 billion bid for Lonmin by XStrata.
2.9.3 Analysis of mining deals
Mining merger and acquisition activities in South Africa form part of the global
mining deals. Understanding the scale and nature of global mining deals relative
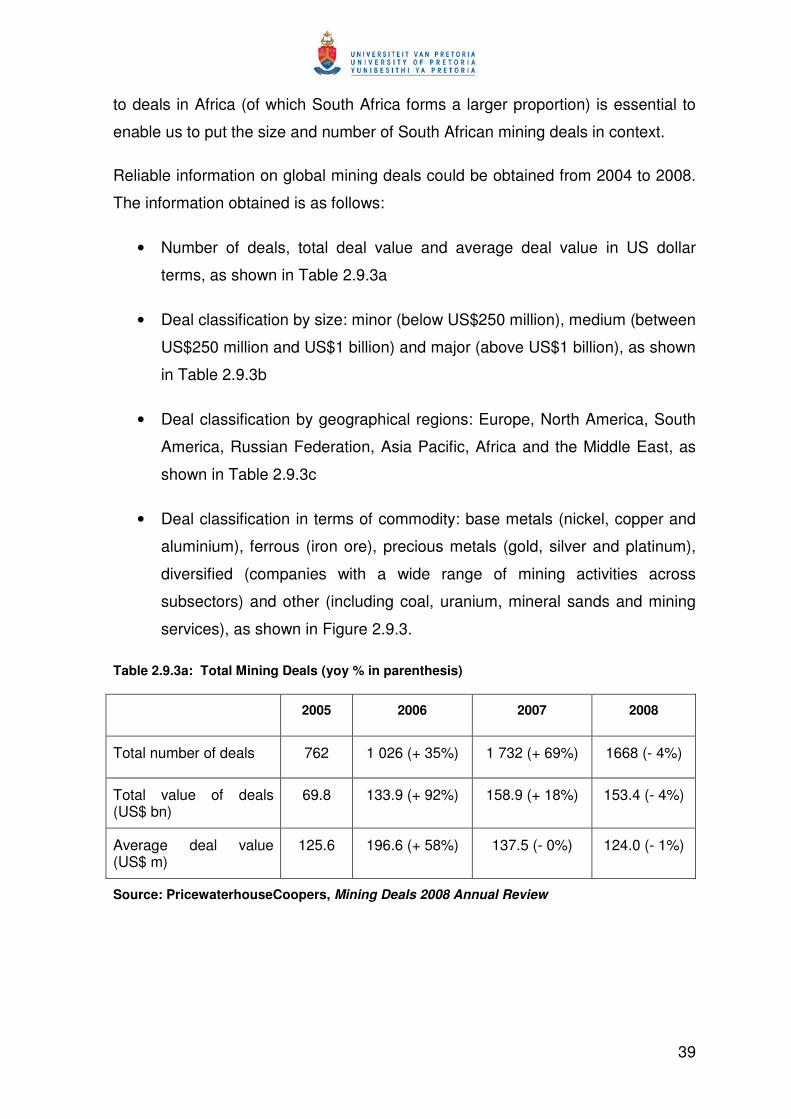
39
to deals in Africa (of which South Africa forms a larger proportion) is essential to
enable us to put the size and number of South African mining deals in context.
Reliable information on global mining deals could be obtained from 2004 to 2008.
The information obtained is as follows:
• Number of deals, total deal value and average deal value in US dollar
terms, as shown in Table 2.9.3a
• Deal classification by size: minor (below US$250 million), medium (between
US$250 million and US$1 billion) and major (above US$1 billion), as shown
in Table 2.9.3b
• Deal classification by geographical regions: Europe, North America, South
America, Russian Federation, Asia Pacific, Africa and the Middle East, as
shown in Table 2.9.3c
• Deal classification in terms of commodity: base metals (nickel, copper and
aluminium), ferrous (iron ore), precious metals (gold, silver and platinum),
diversified (companies with a wide range of mining activities across
subsectors) and other (including coal, uranium, mineral sands and mining
services), as shown in Figure 2.9.3.
Table 2.9.3a: Total Mining Deals (yoy % in parenthesis)
2005 2006 2007 2008
Total number of deals 762 1 026 (+ 35%) 1 732 (+ 69%) 1668 (- 4%)
Total value of deals (US$ bn)
69.8 133.9 (+ 92%) 158.9 (+ 18%) 153.4 (- 4%)
Average deal value (US$ m)
125.6 196.6 (+ 58%) 137.5 (- 0%) 124.0 (- 1%)
Source: PricewaterhouseCoopers, Mining Deals 2008 Annual Review

40
Table 2.9.3b: Number of Deals Per Category
2005 2006 2007 2008
Minor deals (< US$250 m) 732 970 1 644 1 572
Medium deals (US$ 0.25–US$ 1
bn)
22 38 63 66
Major deals (> US$ 1 bn) 8 18 25 30
Source: PricewaterhouseCoopers, Mining Deals 2008 Annual Review
Table 2.9.3c: Mining Deals per Geographical Region (with change from 2007 to 2008 in %)
Europe 2005 2006 2007 2008 % change
Deal value (US$ bn) 2.2 3.8 3.0 22.4 653%
Number of deals 66 73 70 49 -29%
North America 2005 2006 2007 2008 % change
Deal value (US$ bn) 33.8 83.5 77.1 32.8 -57%
Number of deals 225 312 695 596 -14%
South America 2005 2006 2007 2008 % change
Deal value (US$ bn) 1.4 8.6 8.7 22.8 163%
Number of deals 53 115 174 180 3%
Russian Federation &
CIS
2005 2006 2007 2008 % change
Deal value (US$ bn) 5.6 16.6 20.9 25.2 21%
Number of deals 50 100 57 77 35%
Asia Pacific 2005 2006 2007 2008 % change
Deal value (US$ bn) 2.2 3.6 16.4 22.8 39%
Number of deals 96 129 245 267 9%
Australasia 2005 2006 2007 2008 % change
Deal value (US$ bn) 11.1 7.3 19.2 17.1 -11%
Number of deals 207 237 391 360 -8%
Africa 2005 2006 2007 2008 % change

41
Deal value (US$ bn) 9.5 9.8 13.5 9.6 -28%
Number of deals 59 52 94 131 39%
Middle East 2005 2006 2007 2008 % change
Deal value (US$ bn) 0.1 0.6 0.2 0.6 221%
Number of deals 6 8 6 8 14%
Source: PricewaterhouseCoopers, Mining Deals 2008 Annual Review
Figure 2.9.3: Deal Value Classification by Commodity Type
Source: PricewaterhouseCoopers, Mining Deals 2008 Annual Review
It is evident that the number of deals, average deal value and total deals
increased very considerably (about threefold) between 2005 and 2008, due mainly
to the surge in commodity prices as a result of demand from China and the rest of
Asia (see Table 2.9.3d). The majority of the mining deals happen in North
America, with Europe, South America, the Russian Federation and the Asia
Pacific region showing higher trends in 2008. Africa and Australasia on average
experience about US$10 billion and US$15 billion of deals per annum. South
Africa accounts for most of the deals in Africa.
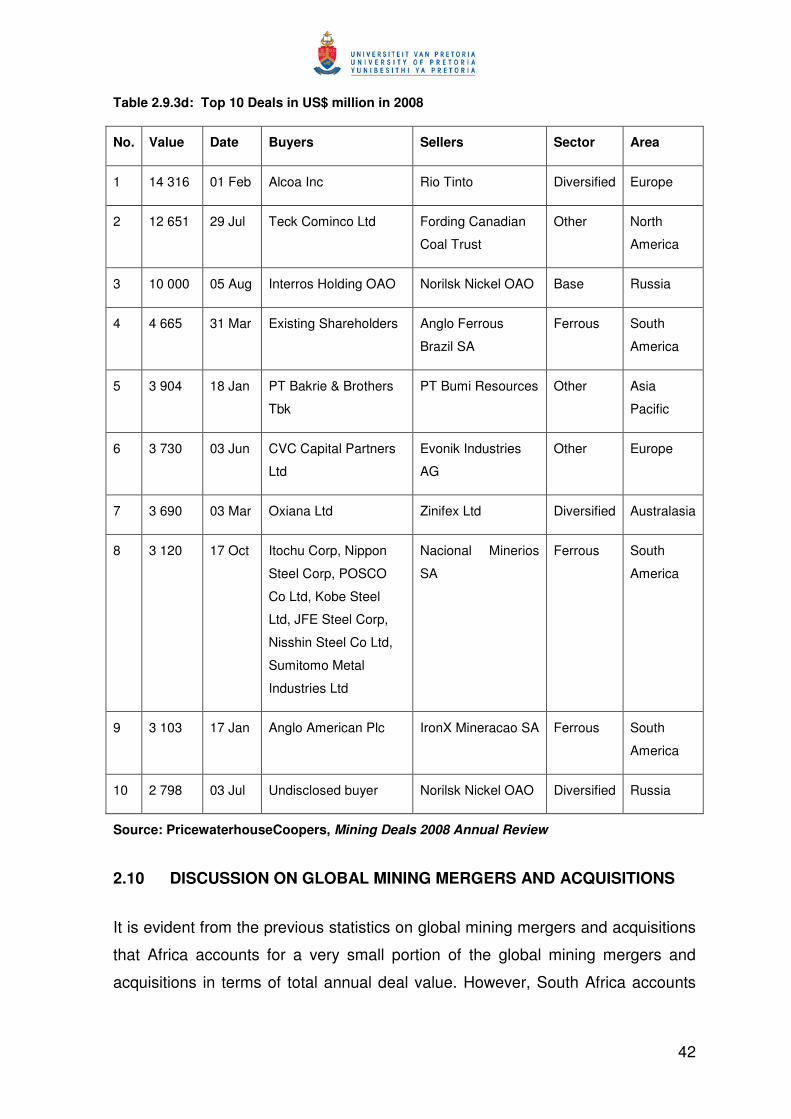
42
Table 2.9.3d: Top 10 Deals in US$ million in 2008
No. Value Date Buyers Sellers Sector Area
1 14 316 01 Feb Alcoa Inc Rio Tinto Diversified Europe
2 12 651 29 Jul Teck Cominco Ltd Fording Canadian
Coal Trust
Other North
America
3 10 000 05 Aug Interros Holding OAO Norilsk Nickel OAO Base Russia
4 4 665 31 Mar Existing Shareholders Anglo Ferrous
Brazil SA
Ferrous South
America
5 3 904 18 Jan PT Bakrie & Brothers
Tbk
PT Bumi Resources Other Asia
Pacific
6 3 730 03 Jun CVC Capital Partners
Ltd
Evonik Industries
AG
Other Europe
7 3 690 03 Mar Oxiana Ltd Zinifex Ltd Diversified Australasia
8 3 120 17 Oct Itochu Corp, Nippon
Steel Corp, POSCO
Co Ltd, Kobe Steel
Ltd, JFE Steel Corp,
Nisshin Steel Co Ltd,
Sumitomo Metal
Industries Ltd
Nacional Minerios
SA
Ferrous South
America
9 3 103 17 Jan Anglo American Plc IronX Mineracao SA Ferrous South
America
10 2 798 03 Jul Undisclosed buyer Norilsk Nickel OAO Diversified Russia
Source: PricewaterhouseCoopers, Mining Deals 2008 Annual Review
2.10 DISCUSSION ON GLOBAL MINING MERGERS AND ACQUISITIONS
It is evident from the previous statistics on global mining mergers and acquisitions
that Africa accounts for a very small portion of the global mining mergers and
acquisitions in terms of total annual deal value. However, South Africa accounts

43
for about 90% of the mining mergers and acquisitions in Africa, and therefore has
critical role to play in improving this situation.
This is unfortunate indeed, considering the fact that Africa hosts about 80% of
global reserves of major key commodities but is also the least developed of the
continents. The lack of mining merger and acquisition activity in Africa could be
attributed, among others, to:
(a) the fact that most of the operators of and investors in African mineral
production are foreign owned companies and often listed overseas, so that
most of these deals account to the country of origin of the investor
(b) the poor investment climate in Africa, which can be attributed to political
instability, unfavourable macro-economic policies, governance issues,
infrastructure and social issues such as crime and bribery
(c) the fact that most of the commodities produced in Africa are not fully
beneficiated, making their economic value significantly lower compared
with their value overseas when they are beneficiated
South Africa has an advantage in terms of its investment climate and the degree
of beneficiation compared with the rest of Africa. The enactment of the Mineral
and Petroleum Resources Development Act (No. 28 of 2002) (MPRDA) will also
cause some shift in ownership of some of the current foreign-owned companies as
they sell a stake to BEE entities to comply with legislation. However, the survival
and sustainability of the BEE deals that are likely to lead to an increase in future
merger and acquisition activities will depend on the creation of value for
stakeholders.
To address the poor state of mining mergers and acquisitions in Africa, an
examination of the success of past, current and future mining deals in South Africa
is very crucial. On this basis, this dissertation becomes very relevant in assisting
the pursuit of the worthy cause of BEE acquisitions in a manner that minimises
value destruction.

44
2.11 THE SOUTH AFRICAN ECONOMIC ENVIRONMENT
South Africa is home to about 6% of Africa’s population and accounts for
approximately 25% of the continent’s Gross Domestic Product (GDP). It also
accounts for about 45% of Africa’s mineral production and 50% of the continent’s
purchasing power.
Four of South African banking institutions are rated amongst the world’s top 500
financial institutions and South African banks are rated the 15th most secure out
of 134 countries according to the World Economic Forum’s Global
Competitiveness Report 2008/2009.
The Johannesburg Securities Exchange (JSE) rates amongst the top 20 stock
exchanges in the world by market capitalisation. The JSE regulations rank 5th
globally.
The country has an extensive infrastructure, namely:
(a) A road network of 754 000 km
(b) A rail network which is the 10th longest in the world, connecting with
networks in the sub-Saharan region
(c) Port facilities which are the largest in southern Africa
(d) More than 50 airlines carrying about 33 million passengers a year moving
through the country’s ten principal airports
(e) The largest telecommunications network in Africa in terms of both
customers and revenue
South Africa ranks 32nd of 181 countries in terms of ease of doing business. It
also ranks 9th in terms of protection of investors in the country.
The above information was sourced from the Department of Trade and Industry
report entitled South Africa: Geared for Growth 2008.

45
South Africa’s GDP and economic growth from 1960 to 2006 are summarised in
Table 2.11 (Roux, 2008).
Table 2.11: South Africa’s Real GDP and Economic Growth
Year Real GDP (R bn) Economic Growth (%)
1960 273,0 -
1964 348,9 6,3
1969 452,1 6,7
1974 559,6 5,5
1979 621,6 2,7
1984 717,6 3,7
1989 772,4 1,9
1994 779,4 0,2
1999 885,4 3,2
2004 1 061,2 4,6
2005 1 115,8 5,1
2006 1 171,4 5,0
Source: Roux (2008)
2.12 THE SOUTH AFRICAN MINING INDUSTRY
For more than a century, South Africa’s mineral industry, supported largely by the
production of gold, diamonds, coal and platinum group metals, has made an
important contribution to the national economy.
South Africa has the world’s largest resources of platinum group metals (87.7%),
manganese (80%), chromium (72.4%) and gold (40%). It also accounts for over
40% of the global production of ferrochromium, platinum group metals and
vanadium. Moreover, it is the world’s leading producer of chrome ore, vermiculite
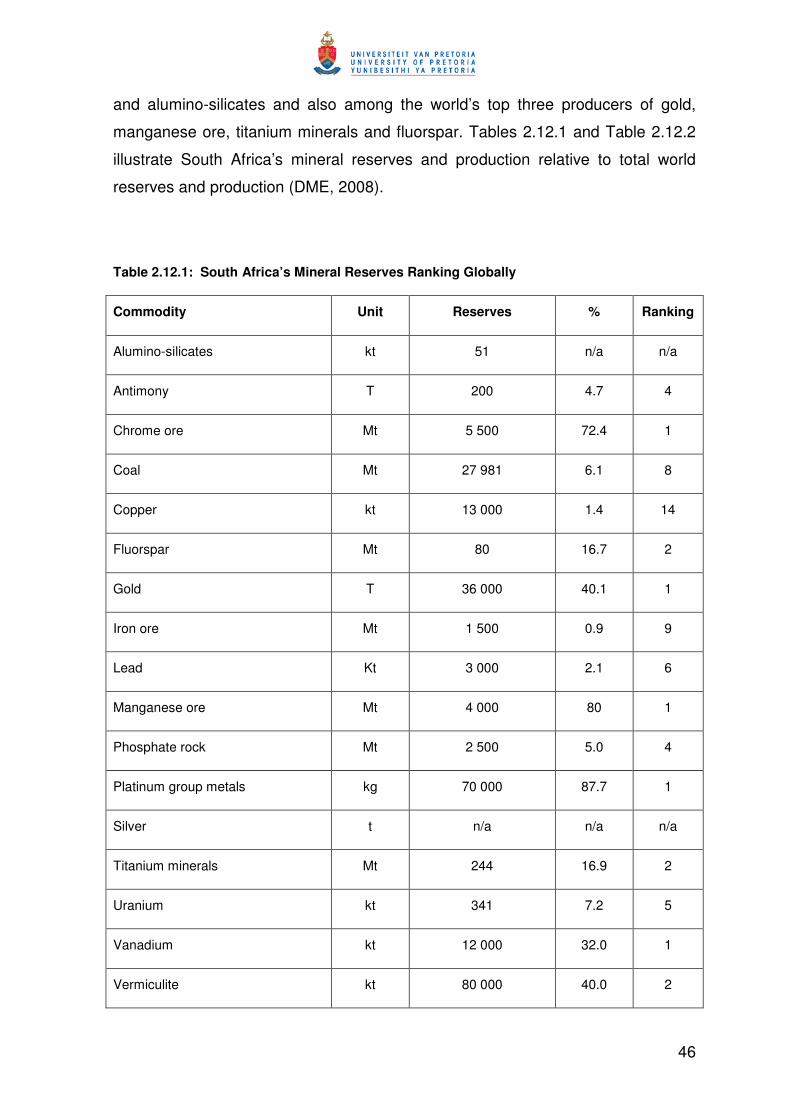
46
and alumino-silicates and also among the world’s top three producers of gold,
manganese ore, titanium minerals and fluorspar. Tables 2.12.1 and Table 2.12.2
illustrate South Africa’s mineral reserves and production relative to total world
reserves and production (DME, 2008).
Table 2.12.1: South Africa’s Mineral Reserves Ranking Globally
Commodity Unit Reserves % Ranking
Alumino-silicates kt 51 n/a n/a
Antimony T 200 4.7 4
Chrome ore Mt 5 500 72.4 1
Coal Mt 27 981 6.1 8
Copper kt 13 000 1.4 14
Fluorspar Mt 80 16.7 2
Gold T 36 000 40.1 1
Iron ore Mt 1 500 0.9 9
Lead Kt 3 000 2.1 6
Manganese ore Mt 4 000 80 1
Phosphate rock Mt 2 500 5.0 4
Platinum group metals kg 70 000 87.7 1
Silver t n/a n/a n/a
Titanium minerals Mt 244 16.9 2
Uranium kt 341 7.2 5
Vanadium kt 12 000 32.0 1
Vermiculite kt 80 000 40.0 2

47
Zinc metal kt 15 000 3.3 8
Zirconium minerals kt 14 000 1.4 2
Source: SA Yearbook 2008/09, Minerals, Energy and Geology
Table 2.12.2: South Africa’s Mineral Production Ranking Globally
Commodity Unit Production % Ranking
Aluminium kt 914 2.4 9
Alumino-silicates kt 265 59.0 1
Antimony t 3 354 2.5 7
Chrome ore kt 9 683 n/a n/a
Coal Mt 248 4.5 5
Copper kt 110 0.7 16
Fluorspar kt 285 6.0 4
Gold t 253 10.3 2
Iron ore Mt 41 2.5 7
Lead Mt 42 1.2 11
Manganese ore kt 5,589 14.2 2
Nickel kt 42 3.1 9
Phosphate rock kt 2 556 1.7 10
Platinum group metals kg 304 031 56.7 1
Silver t 70 0.3 21
Titanium minerals kt 1 181 19.5 2
Uranium t 639 1.6 11
Vanadium kt 24 40.0 1

48
Vermiculite kt 200 38.5 1
Zinc metal kt 31 0.3 25
Zirconium minerals kt 405 41.6 2
In 2007, about 53 different minerals were produced from 1 414 mines and
quarries, 50 of which were gold, 31 platinum group minerals, 96 coal and 344
diamonds, all as primary commodities (DME, 2008).
South Africa’s mineral wealth is typically found in the following geological
formations and settings:
• The Witwatersrand Basin yields about 94% of South Africa’s gold output
and contains considerable resources of uranium, silver, pyrite and
osmiridium.
• The Bushveld Complex is known for its platinum group metals (with
associated copper, nickel and cobalt mineralisation), chromium and
vanadium-bearing titanium iron ore formations, as well as large deposits of
the industrial minerals, including fluorspar and andalusite.
• The Transvaal Supergroup contains enormous resources of manganese
and iron ore.
• The Karoo Basin hosts considerable bituminous coal and anthracite
resources.
• The Phalaborwa Igneous Complex hosts extensive deposits of copper,
phosphate, titanium, vermiculite, feldspar and zirconium ores.
• Kimberlite pipes host diamonds that also occur in alluvial, fluvial and marine
settings.
• Heavy mineral sands contain ilmenite, rutile and zircon.

49
The key producing companies in gold are AngloGold Ashanti, GoldFields and
Harmony, and there are smaller producers such as Simmers and Jack, Great
Basin Gold and Aflease Gold.
The key platinum group metal producers are Anglo Platinum, Impala Platinum and
Lonmin Plc, and there are smaller producers such as Wesizwe Platinum, Anooraq
Resources and Eastern Platinum.
The major coal-producing companies are Anglo Coal, BHP Billiton Energy Coal
SA, Exxaro Coal and Xstrata Coal SA, and there are smaller producers such as
Keaton Energy, Sentula and South African Coal Mining Holdings.
The key major diamond producers are De Beers, Petra Diamonds and Trans Hex,
and the major iron ore and/or manganese producers are Kumba Iron Ore,
Assmang, BHP Billiton and Anglo American Plc.
The South African mining industry is also involved in the beneficiation of chromium
and manganese alloys and has key aluminium smelters.
2.13 THE ROLE OF MINING IN THE SOUTH AFRICAN NATIONAL
ECONOMY
In 2007, mining contributed R135.6 billion to the South African economy, which
equates to 7.7% of the country’s GDP. Mining also contributed 8.9% of the Total
Fixed Capital Formation (TFCF). The total contribution of mining to state revenue
was R18.5 billion in 2007. Table 2.13.1 and Table 2.13.2 illustrate these figures
from 1998 to 2007.
Table 2.13.1: Mining Contribution to GDP and TFCF in South Africa
Year GDP
(R bn)
Mining
(R bn)
% TFCF
(R bn)
Mining
(R bn)
% Exports
(R bn)
Mining
(R bn)
%
1998 674.88 45.88 6.8 126.91 11.32 8.9 160.76 55.30 34.4
1999 738.87 52.17 7.1 126.75 11.64 9.2 174.32 58.30 33.4
2000 838.22 63.39 7.6 139.65 13.85 9.9 222.06 76.30 34.4

50
2001 928.22 77.21 8.3 153.53 15.87 10.3 265.83 89.94 33.8
2002 1 063.80 92.11 8.7 175.59 19.80 11.3 333.25 109.36 32.8
2003 1 143.68 84.26 7.4 200.51 21.71 10.8 291.43 86.75 29.9
2004 1 250.95 89.29 7.1 178.12 14.22 8.0 310.53 89.67 28.9
2005 1 372.37 103.01 7.3 194.05 12.37 6.4 352.15 102.49 29.3
2006 1 543.94 119.37 7.7 324.20 26.30 8.1 434.50 138.88 31.9
2007 1 768.22 135.55 7.7 410.62 36.62 8.9 535.74 161.76 30.2
Source: Department of Minerals and Energy Report, South Africa’s Mineral Industry
2007/2008 (DME, 2008)
Figure 2.13: Mining Contribution to GDP and TFCF in South Africa
As can be seen from Figure 2.13, there was a sharp decline in TFCF percentage
from 2002 when the MPRDA was published which could, among others, be
attributed to fear and uncertainty among mining companies and investors.
However, this percentage has improved since 2005 as clarity and acceptance
have improved and also due to rising commodity prices. Mining also accounts for

51
a substantial portion of the country’s exports, resulting in R536 billion of exports in
2007, up from R160 billion in 1998.
In addition, the mining industry is a key source of employment and job creation
and employed about 0.5 million people in 2007. Table 2.13.2 shows the
employment statistics from 1998 to 2007. These are expressed as a percentage of
the total economically active population. The figures are therefore higher when
expressed as a percentage of the employed population, which will be a true
reflection of the mining industry’s contribution to current employment in the
economy.
Table 2.13.2: Mining Contribution to Employment in South Africa
Year Number Employed Percentage
1998 466 623 3.4
1999 437 028 3.0
2000 418 294 2.6
2001 407 154 2.7
2002 416 925 2.6
2003 434 859 2.7
2004 448 909 2.9
2005 444 132 2.6
2006 456 337 2.7
2007 495 474 2.9
Source: Department of Minerals and Energy Report, South Africa’s Mineral Industry
2007/2008 (DME, 2008)

52
2.14 LEGISLATIVE AND POLICY FRAMEWORK OF THE SOUTH AFRICAN
MINING INDUSTRY
Mining and minerals policy in South Africa is based on the principles of the
Freedom Charter of 1955, which aims at total inclusiveness in sharing the benefits
derived from the mineral wealth of the nation (''South Africa belongs to all who live
in it”).
This led to the enactment of the Minerals and Petroleum Resources Development
Act (MPRDA), No. 28 of 2002, as the guiding principle for mineral resource
ownership, exploration, exploitation and rehabilitation. This Act also led to the
establishment of what is known as the Mining Charter (officially the Broad-Based
Socio-economic Empowerment Charter for the Mining Industry, first formally
published in August 2004 and reissued in 2010), which sets out specific objectives
and criteria for achieving the transformation aims set out in the MPRDA. Holders
of prospecting and mining rights are also expected to utilise those rights by
engaging in prospecting and mining activities within a specified period in
accordance with the requirements of the MPRDA or lose those rights. This is often
referred to as the ‘use it or lose it’ principle.
The Minister of Minerals and Energy was then expected by the MPRDA to set out
the requirements of the Mining Charter within a specified period. The Mining
Charter was therefore a legal requirement imposed upon the Minister by the
MPRDA.
Due to some challenges posed by the original Act, the Minerals and Petroleum
Resources Amendment Bill of 2007 was passed to:
(a) facilitate the smooth implementation of the new minerals and mining
dispensation by aligning it with sound administrative practices and the
objectives of the Promotion of Administrative Justice Act, No. 3 of 2000
(b) remove ambiguity and further protect certain existing rights

53
The Department of Minerals and Energy is the custodian of policy formulation and
enforcement in consultation with employer representative organisations such as
the Chamber of Mines, labour unions and business in a tripartite alliance.
Other policies that are relevant to the administration of mineral laws include:
(a) Mines and Works Act, No. 27 of 1956, which deals with the safe design,
construction, equipping, operating and decommissioning of mines
(b) Mine Health and Safety Act, No. 29 of 1996, together with the Mine Health
and Safety Amendment Act, No. 74 of 2008, which focuses on broad
stakeholder participation in matters relating to safety and health and, more
recently, has put much emphasis on the accountability of mine owners
(c) Precious Metals Act, No. 37 of 2005, which provides for the acquisition of
smelting, refining, using and disposing of precious metals, with emphasis
on added value
(d) Diamond Amendment Act, No. 29 of 2005, which regulates precious
minerals and has also enabled access to rough diamonds by previously
excluded people
(e) Mineral Technology Act, No. 30 of 1989
(f) Geoscience Act, No. 100 of 1993
(g) Mining Titles Registration Amendment Act, No. 24 of 2003
Another key policy that is currently being discussed is the draft Mineral and
Petroleum Royalty Bill of 2006, which aims at the use of Earnings Before Interest
and Tax (EBIT) margins in the calculation of royalties, thus recognising capital
costs and also differentiating between refined and unrefined production. The
previous proposed royalty rate was based on Earnings Before Interest and Tax,
Depreciation and Amortisation (EBITDA). The original draft, compiled around
2002, was based on turnover.

54
2.14.1 Black Economic Empowerment
The constitutional mandate for Black Economic Empowerment (BEE) contained in
section 9(2) of the Constitution of the Republic of South Africa, 1996, led to the
promulgation in 2004 of the Broad-Based Black Economic Empowerment Act,
No. 53 of 2003, which provides the legislative framework for the promotion of BEE.
Section 12 of the BBEEE Act provides for the publication of ‘Transformation
Charters’ by the Minister of Trade and Industry.
2.14.2 BEE Scorecard
The typical generic BEE scorecard developed to facilitate, measure and monitor
the level of BEE compliance is illustrated by the various elements and their
respective weightings:
• Ownership 20 points
• Managerial control 10 points
• Employment equity 15 points
• Skills development 15 points
• Preferential procurement 20 points
• Enterprise development 15 points
• Socio-economic development 5 points
The ownership element measures the effective ownership of enterprises by
Historically Disadvantaged South Africans (HDSAs). An HDSA is any person,
category of persons or community disadvantaged by unfair discrimination before
the Constitution of the Republic of South Africa, Act No. 108 of 1996, came into
effect. The employment equity element measures the representation of HDSA in
management roles. The skills development element is focused on developing the
competencies of HDSAs in the workplace. The preferential procurement element
measures the extent to which enterprises buy goods and services from suppliers
with strong BEE recognition levels. The enterprise development element looks at
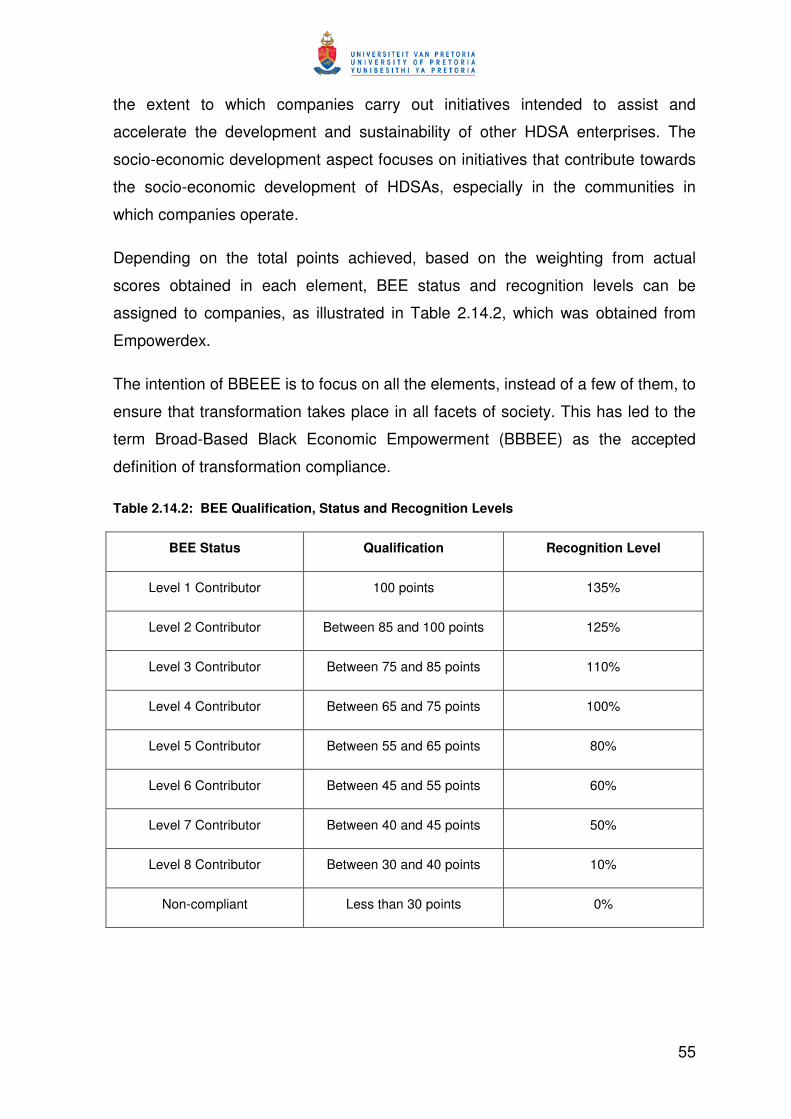
55
the extent to which companies carry out initiatives intended to assist and
accelerate the development and sustainability of other HDSA enterprises. The
socio-economic development aspect focuses on initiatives that contribute towards
the socio-economic development of HDSAs, especially in the communities in
which companies operate.
Depending on the total points achieved, based on the weighting from actual
scores obtained in each element, BEE status and recognition levels can be
assigned to companies, as illustrated in Table 2.14.2, which was obtained from
Empowerdex.
The intention of BBEEE is to focus on all the elements, instead of a few of them, to
ensure that transformation takes place in all facets of society. This has led to the
term Broad-Based Black Economic Empowerment (BBBEE) as the accepted
definition of transformation compliance.
Table 2.14.2: BEE Qualification, Status and Recognition Levels
BEE Status Qualification Recognition Level
Level 1 Contributor 100 points 135%
Level 2 Contributor Between 85 and 100 points 125%
Level 3 Contributor Between 75 and 85 points 110%
Level 4 Contributor Between 65 and 75 points 100%
Level 5 Contributor Between 55 and 65 points 80%
Level 6 Contributor Between 45 and 55 points 60%
Level 7 Contributor Between 40 and 45 points 50%
Level 8 Contributor Between 30 and 40 points 10%
Non-compliant Less than 30 points 0%

56
An Empowerdex interim progress report and sector comparison (Empowerdex,
2006) indicates the level of BEE compliance by sectors listed on the JSE. The
resource sector performed below the JSE average, as shown in Figure 2.14.2a,
indicating the degree of difficulty or lack of adequate progress with regard to
transformation within the mining sector compared with other sectors. It must be
borne in mind though, that the challenges facing each sector are unique and
progress will therefore depend on ease of implementation and commitment. The
report also shows the actual BEE score distribution ratio compared with what was
proposed. Employment equity and procurement seem to be areas where not much
progress has been made, as shown in Figures 2.14.2b and Figure 2.14.2c.
Figure 2.14.1a: BEE Rating of Various Sectors Listed on the JSE in 2006 (Source:
Empowerdex, 2006)
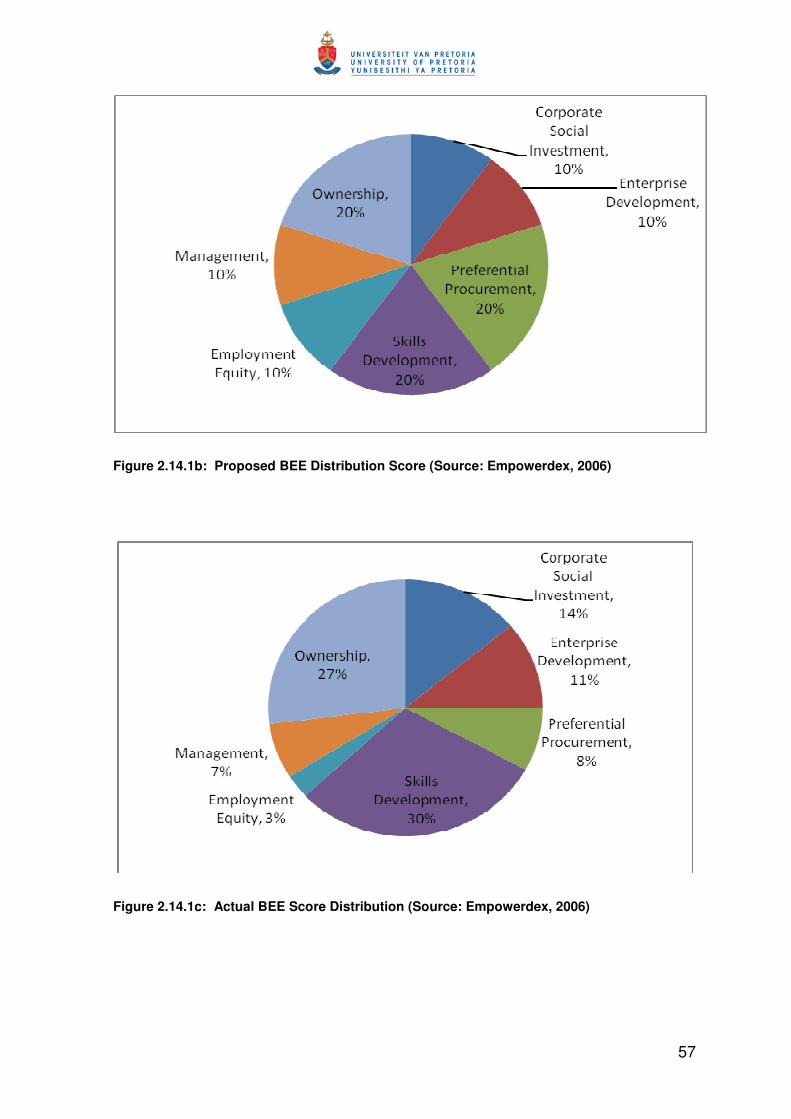
57
Figure 2.14.1b: Proposed BEE Distribution Score (Source: Empowerdex, 2006)
Figure 2.14.1c: Actual BEE Score Distribution (Source: Empowerdex, 2006)

58
It is evident that the lack of skilled HDSAs has contributed to the achievement of
only 3% in employment equity compared with the proposal of 10%. On the other
hand, skills development shows much greater improvement due mainly to the
availability of in-house capacity to offer such training and the incentives provided
in the form of refunding of skills development levies, once companies can show
proof of training. The mining industry is not an exception to this trend since it is
more of a national issue.
2.14.3 The Mining Charter
The Mining Charter was gazetted under the MPRDA with the vision of achieving a
globally competitive mining industry for the benefit of all South Africans and to
“create an industry that will proudly reflect the promise of a non-racial South
Africa”.
The objectives of the Charter are to:
• Promote equitable access to the mineral resources for all the people of
South Africa
• Substantially and meaningfully expand opportunities for HDSAs to enter the
mining and minerals industry and to benefit from the exploitation of the
nation’s mineral resources
• Utilise and expand on the existing skills base of HDSAs
• Promote employment and advance the social and economic welfare of
mining communities and the major labour-sending areas
• Promote beneficiation of South Africa’s mineral commodities
The key outcomes that are set out in a scorecard are the following:
• Achieving HDSA participation of 15% in ownership and joint ventures within
five years (by 2009) and 26% within ten years (by 2014)
• Achieving 40% HDSA participation in management within five years (by
2009)

59
• Achieving 10% of women in mining within five years (by 2009)
• Non-discrimination against migrant labour
• Improvement in the standard of housing conditions for lower level
employees
• Commitment to preferential procurement from BEE companies
• Human resources development, with the focus on improving the literacy
levels of mine workers
• Making a meaningful contribution to the communities in which the mines
operate
• Improvement in the level of beneficiation of mineral commodities
The scorecard is designed to facilitate the application of the Charter in terms of the
MPRDA requirements for the conversion of “old order mining rights” into new
rights within a five-year period (by 2009), but recognising the full ten-year period
(by 2014).
Compliance with the requirements of the MPDRA and Mining Charter is therefore
a prerequisite for securing and maintaining mining and mineral rights, as well as
conducting mining operations in South Africa.
The enactment of the MPRDA has therefore to some extent created an
environment that will contribute to significant merger and acquisition activity in the
South African mining industry.
2.15 DISCUSSION ON THE SOUTH AFRICAN MINING INDUSTRY
In summary, the South African mining industry is endowed with huge and vast
mineral resources, good infrastructure, sound economic policies and a stable
political regime. This has created the framework for world-class mineral production
in some key commodities such as platinum, gold, ferrochrome and alumino-
silicates.

60
There are, however, significant challenges in the areas of skills, clarity and
investor confidence in the administration of the MPRDA, especially regarding the
issue of new order licences and the renewal of old order licences. Access to
adequate electricity is a major concern, with major capital investments currently
under way to increase generation capacity by Eskom. Rail and port facilities are
also bottlenecks affecting coal and iron ore exports and they need urgent
attention. In addition, social challenges such as crime and unemployment
constitute significant challenges to capital investment.
The introduction of the MDPRA has created significant opportunities and removed
barriers to entry by HDSAs in terms of acquisition and funding in mining deals.
The challenge, however, lies in how to sustain these deals, especially in view of
the current global credit crunch. The issue of value assessment in mergers and
acquisitions in the South African mining industry is therefore highly relevant to
ensure that the vision of the Mining Charter is achieved.
2.16 MERGERS AND ACQUISITIONS IN THE SOUTH AFRICAN MINING
INDUSTRY
There has been a major improvement in mergers and acquisitions in South Africa
since 1995, due to the removal of economic sanctions and the inclusion of South
Africa in the global economic framework. Following the enactment of the BEE Act
in 2003, there was a marked increase in BEE deals. Figure 2.16a and
Figure 2.16b show the total merger and acquisition value and the BEE contribution
between 1995 and 2007. These figures were obtained from the Department of
Trade and Industry report entitled South Africa: Geared For Growth 2008 (DTI,
2008).

61
Figure 2.16a: Total Merger and Acquisition Value in South Africa (Source: DTI, 2008)
There appear to be two waves of merger and acquisition activity in South Africa,
one from 1995 to 2001, which might be due to the post-apartheid inclusion of
South Africa into the global economic framework, and another from 2002 to 2007,
which is most likely a result of BEE implementation and favourable commodity
prices in the mining industry.
Figure 2.16b: BEE Contribution to Mergers and Acquisitions in SA (Source: DTI, 2008)
62
The period after 2002 has shown a remarkable increase in BEE deals and the
mining sector has made a significant contribution to these deals.
An Empowerdex report entitled Interim Progress Report and Sector Comparison
published in 2006 indicates that the resources sector average, which comprised
34 JSE-listed mining companies, achieved a 38.8% BEE score, compared with the
JSE average of 49.34%, and the mining score of 38.8% was made up of the
following proportions:
(a) Ownership score of 13.2%
(b) Management score of 2.81%
(c) Employment equity score of 1.01%
(d) Skills development score of 11.4%
(e) Preferential procurement score of 2.75%
(f) Enterprise development score of 1.49%
(g) Residual element score of 5.89%
This reveals that ownership is one of the key elements that the mining companies
in South Africa are using to achieve their BEE score, and it would therefore impact
on the merger and acquisition activity structure of the industry. Technically, the
BEE score does not apply to the mining industry, but it allows for comparison with
other sectors.
Further analysis of the report, regarding the type of BEE ownership transaction,
reveals that the most of the transactions were made to secure ownership between
the 10–25% and 25–50% categories, reflecting the Mining Charter scorecard
requirements of 15% by 2009 and 26% by 2012. Most BEE deals in the mining
sector are therefore likely to fall within those ranges, as shown in Figure 2.16c.
Technically, the original intention of the Mining Charter was ownership.

63
Figure 2.16c: Distribution of Ownership Types in Mining BEE Deals (Source: Empowerdex,
2006)
Further analysis indicates that the BEE deals in the resources sector involved sale
of equity and sale of assets in similar proportions to those depicted in
Figure 2.16d. This means that some mining companies have opted to achieve
their ownership score through direct equity participation and others have sold out
mining assets, while yet others might also have used a combination of both.
Typical examples of asset sale would be BHP Billiton’s and Anglo American Plc’s
sale of coal assets to Eyesizwe Coal and Anglo Platinum’s sale of the Booysendal
platinum asset to Mvelaphanda Resources. Where mining assets are sold, it is
expected by the MPRDA that the seller should provide technical expertise,
guidance and, in some cases, product beneficiation and marketing capacity to
enable this BEE acquirer to become self-sustaining in future.

64
Figure 2.16d: Types of BEE Ownership Deal in Mining in South Africa (Source:
Empowerdex, 2006)
Corporate restructuring of the South African mining industry is an ongoing
exercise. Mining houses continue to transform into focused mining companies by
typically shedding their non-core industrial holdings. This transformation includes
the consolidation of ownership through minority buy-outs, the separation of a large
diversified company into two or more specialised companies, the transfer of
primary listings (and corporate head offices) offshore, as well as the purchase of
South African mining assets by foreign companies.
New BEE mining giants, such as Exxaro Resources, Mvelaphanda Resources and
African Rainbow Minerals (ARM), are playing an active role in mining. The Nedcor
Securities Junior Mining and Exploration (NSJME) Index is also an investment
vehicle aimed at providing greater visibility for South Africa’s junior mining and
exploration sector.
2.17 MERGERS AND ACQUISITION TRENDS IN SOUTH AFRICAN MINING
INDUSTRY
The period between 2003 and 2008 has been used for this study due to the
availability of reliable data. The period after 2003 also shows a lot of merger and

65
acquisition activity, partly due to the enactment of the MPRDA. The database used
for this merger and acquisition activity analysis was privately sourced from
Dealogic, and is therefore not available in the public domain.
During the period from 2003 to 2008, about 130 deals took place in various
commodities – mostly in platinum, gold and coal. In terms of deal volume, platinum
accounted for 27%, coal 22% and gold 22%. Deals averaged about 15–20 per
year between 2003 and 2005, and about 20–30 per year between 2006 and 2008.
The increase in deal activity from 2006 could be attributed to record commodity
prices in gold, coal and platinum, which enhanced the financial position of most
mining companies and also made entry easier for many junior mining companies.
A deal summary, in terms of total deals per year, number of deals per year and
average deal value is shown in Table 2.17, Figure 2.17a and Figure 2.17b.
Table 2.17: Summary of South African Mining Deals
Year Deal Volume Deal Value (US$ m) Average Deal Value
(US$ m)
2003 18 5,289.30 293.85
2004 15 2,070.88 138.06
2005 20 1,543.27 77.16
2006 21 5,660.51 269.55
2007 30 4,974.51 165.82
2008 25 2,346.44 93.86
Source: Dealogic
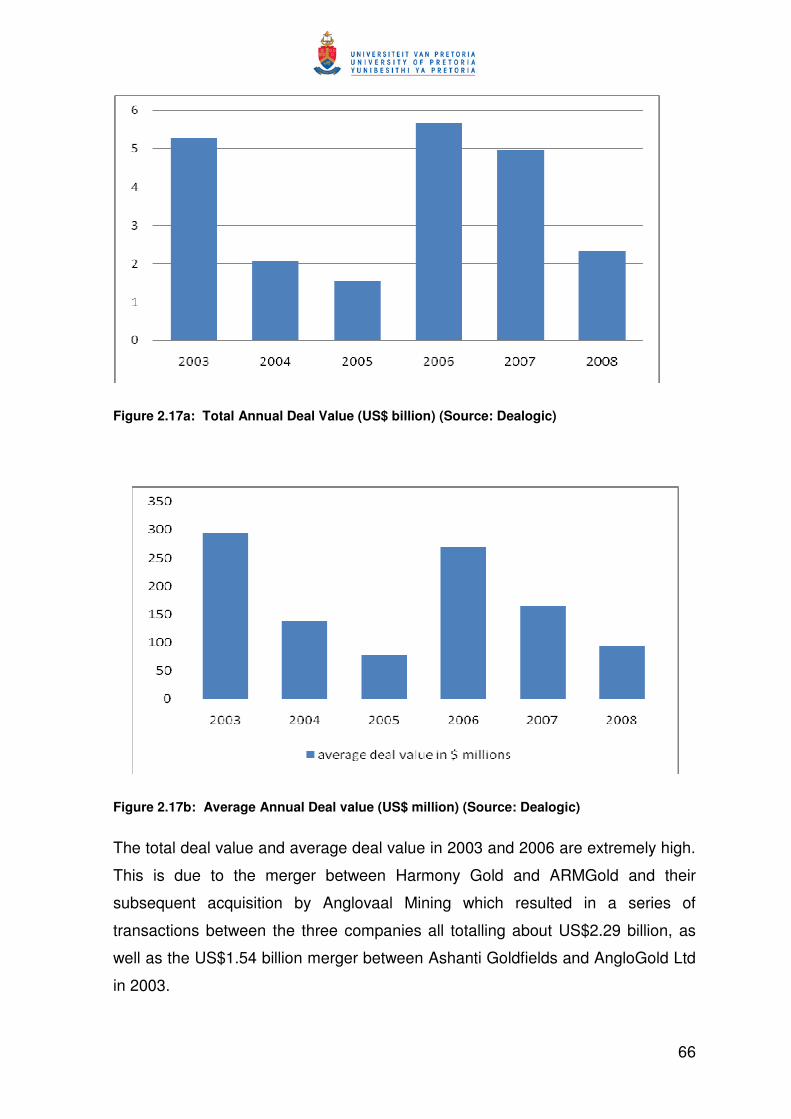
66
Figure 2.17a: Total Annual Deal Value (US$ billion) (Source: Dealogic)
Figure 2.17b: Average Annual Deal value (US$ million) (Source: Dealogic)
The total deal value and average deal value in 2003 and 2006 are extremely high.
This is due to the merger between Harmony Gold and ARMGold and their
subsequent acquisition by Anglovaal Mining which resulted in a series of
transactions between the three companies all totalling about US$2.29 billion, as
well as the US$1.54 billion merger between Ashanti Goldfields and AngloGold Ltd
in 2003.

67
The 2006 figure is also influenced by the US$1.53 billion acquisition of a stake in
Barrick Gold South Africa (South Deep mine) by GoldFields Ltd and a US$1.39
billion stake in Impala Platinum by Royal Bafokeng.
Gold, platinum and coal accounted for most of the deals, in both volume and
value. These are commodities with huge resource bases and they have historically
achieved favourable prices that have sustained and grown that sector of the
mining industry. Figure 2.17c shows the percentage contribution of various
commodities to the total number of mining deals from 2003 to 2008.
Figure 2.17c: Commodities Contribution to Total Number of Deals (Source: Dealogic)
Figure 2.17d illustrates the contribution of each commodity to the total number of
deals annually. The deal contribution per commodity in terms of deal value also
shows a similar trend. Gold, platinum and coal are therefore the key contributors
to increased merger and acquisition activity in the South African mining industry.

68
Figure 2.17d: Number of Deals per Commodity (Source: Dealogic)
Some of the major merger and acquisition activities that have taken place in the
South African mining industry are listed below, with announcement dates:
(a) The merger between Billiton and BHP in 2001, which led to the creation of
BHP Billiton, the largest mining company in the world by market capital.
This merger does not, however, form part of the study, due to difficulty in
obtaining information on all mining deals prior to 2003.
(b) The merger between AngloGold and Ashanti Goldfields in 2003 to form
AngloGold Ashanti.
(c) The merger between Harmony Gold and ARMGold, and the subsequent
acquisition of assets in Avmin to create the current Harmony Gold and
African Rainbow Minerals in 2003.
(d) The unbundling of Kumba Resources to form Kumba Iron Ore and the
subsequent mergers of its coal, base metal and mineral sands assets with
Eyesizwe to form Exxaro Resources in 2005.
(e) Acquisition activities involving African Rainbow Minerals, Mvelaphanda
Resources, Merafe Resources, Annoraq Resources, etc.
69
The significant mining deals in 2006 involved the unbundling of Kumba Resources
to form Kumba Iron Ore and the merger of its coal, base metal and mineral sands
assets with Eyesizwe Coal to form Exxaro Resources, and GoldFields’s
acquisition of 50% of South Deep Mine for R18 billion from Barrick Gold. The
largest mining BEE transaction involved Royal Bafokeng’s conversion of its lease
royalty stream into a 13.4% holding in Impala Platinum at R12.1 billion.
Some of the significant mining deals in 2007 involved the divestment by Anglo
American Plc of Mondi Plc worth R35.8 billion, and of AngloGold Ashanti worth
R20.2 billion, Sasol Ltd and BEE Consortium worth R17.9 billion and Uranium One
Inc and Energy Metals Corporation worth R11 billion.
According to the Mining Deals 2008 report by PricewaterhouseCoopers, top 2008
mining deals in South Africa included Northam Platinum Ltd and Impala Platinum
valued at US$2.5 billion, Northam Platinum and Existing Shareholders valued at
US$1.2 billion, Richards Bay Minerals and Imbewu Consortium valued at US$0.7
billion, Lebowa Platinum and Annoraq Resources valued at R0.5 billion,
Randfontein Estates Limited and Pamodzi Investment Holdings valued at US$0.25
billion, and Assore Ltd and Shanduka Resources valued at US$0.24 billion.
2.18 DISCUSSION ON MINING MERGERS AND ACQUISITIONS IN SOUTH
AFRICA
Historically, gold was the most viable commodity in the South African mining
environment and accounted for a very high proportion of global gold production
and job creation locally. In 2000, there was a surge in platinum prices, making
platinum one of the most viable commodities until 2008. In 2007, coal, iron ore
and manganese prices were also very high compared with historical numbers.
This explains why most of the mining deals occurred in these commodities as
investors (including some BEE partners) saw the opportunity for value
enhancement in these commodities, but they were often based on an optimistic
price outlook for the future.
Deal values were very high in 2003 and 2006, mainly because of the
Harmony/ARMgold/Avmin transactions and the AngloGold and Ashanti GoldFields

70
deal in 2003. The 2006 figure was due to the unbundling of Kumba Resources
and the merger of the coal, base metals and mineral sands assets with Eyesizwe
Coal to form Exxaro Resources. This also explains why the average deal values in
these years are about twice to thrice those of the other years.
These deals, therefore, had a very significant impact on the South African mining
industry and, considering the fact that two of them were BEE-related and the other
was cross-border, the outcomes of their value assessments are fairly indicative of
what one can expect in the South African mining industry and also offer significant
lessons for future deals. They have therefore been chosen as the key deals for
value assessment in this study.
Tables 2.18a to 2.18f list the top five merger and acquisition activities by value in
each year between 2003 and 2008. The dates used are announcement dates, and
may differ from the actual deal conclusion dates.
Table 2.18a: Top Five Deals in 2008 (Source: Dealogic)
Date Target Acquirer Value
(US$ m)
11 Dec Richards Bay Minerals Imbewu Consortium 490.89
25 Jun Oresteel Investments (Pty) Ltd Sumitomo Corp 278.20
25 Jun Assore Ltd (10.4%) Standard Bank Group Ltd 276.96
28 Mar Lebowa Platinum Mines Ltd (51%) Anooraq Resources Corp 323.74
10 Jan Randfontein Estates Ltd Pamodzi Investment Holdings
Ltd
252.00

71
Table 2.18b: Top Five Deals in 2007 (Source: Dealogic)
Date Target Acquirer Value
(US$ m)
7 Aug Eland Platinum Holdings Ltd Xstrata Plc 1,056.04
5 Sep Mining Asset (Booysendal Project) Northam Platinum 761.62
5 Sep Northam Platinum Ltd (22.4%) Mvelaphanda Resources Ltd 582.85
20 Nov Kalagadi Manganese (Pty) Ltd
(50%)
ArcelorMittal SA 432.50
5 Feb Mining Assets (Namakwa Sands) Exxaro Resources Ltd 281.48
Table 2.18c: Top Five Deals in 2006 (Source: Dealogic)
Date Target Acquirer Value
(US$ m)
11 Sep Barrick Gold South Africa (Pty) Ltd GoldFields Ltd 1,525.00
28 Sep Impala Platinum Holdings Ltd
(12.11%)
Royal Bafokeng Nation 1,388.12
11 Sep Western Areas Ltd (82%) GoldFields Ltd 753.78
15 Feb Barplats Investments Ltd (69%) Eastern Platinum Ltd 377.00
9 Mar Western Areas Ltd (29.2%) Harmony Gold Mining Co Ltd 294.25
Table 2.18d: Top Five Deals in 2005 (Source: Dealogic)
Date Target Acquirer Value
(US$ m)
9 Nov De Beers Consolidated Mines Ltd
(26%)
Ponahalo Holdings Ltd 239.63

72
14 Oct Eyesizwe Coal (Pty) Ltd BEE Holding Company 239.632
14 Oct Kumba Iron Ore Existing Shareholders
20 Apr African Rainbow Minerals Ltd ARM BBE Trust 134.00
21 Dec Mvelaphanda Resources Ltd (23%) Incwala Resources (Pty) Ltd 119.28
Table 2.18e: Top Five Deals in 2004 (Source: Dealogic)
Date Target Acquirer Value
(US$ m)
29 Mar GoldFields Ltd (20%) Norilsk Nickel OAO 1,244.91
9 Dec JCI Ltd (Mining Assets & Rights) Orlyfunt Holdings (Pty) Ltd 238.57
10 May Mvelaphanda Holdings (Pty) Ltd Rebserve Holdings Ltd 218.73
17 Jun AngloGold Ashanti Ltd (1.02%) Anglo American Plc 80.22
9 Jun Western Areas Ltd Inkwenkwezi Gold Mining
Consortium
78.00
Table 2.18f: Top Five Deals in 2003 (Source: Dealogic)
Date Target Acquirer Value
(US$ m)
4 Aug Ashanti Goldfields Co Ltd AngloGold Ltd 1,538.77
2 May African Rainbow Minerals Harmony Gold Mining Co Ltd 988.61
10 Jun GoldFields Ltd (Mining Assets) Mvelaphanda Resources Ltd 520.63
3 Nov Kumba Resources Ltd (31.6%) Anglo American Plc 505.10
13 Nov Harmony Gold Mining Co Ltd
(13.6%)
Anglovaal Mining Ltd 500.65

73
2.19 VALUE CREATION ASSESSMENT CRITERIA FOR MERGERS AND
ACQUISITIONS
Despite the huge financial investment involved in mergers and acquisitions, the
challenges always lie in post-merger/acquisition assessment to determine whether
these deals created value or not.
This will require an understanding of the methods, approaches and criteria that
have been used in the past for assessing value creation, examining their
applicability and limitations, and formulating a guideline to assist in future deal
assessments.
Do mergers and acquisitions create value?
Several authors have reported on the subject of whether mergers and acquisitions
do create value for the shareholders of the acquiring company. A brief summary of
these reports is given below.
According to DePamphilis (2008) the following is a summary of work covered by
other authors on mergers and acquisitions:
• Acquirers tend to overpay for growth firms (excessive premium).
• Shareholders profit by selling around announcement dates.
• Acquirers with experience in mergers and acquisitions tend to improve the
long-term performance of combined companies.
• The method of payment affects long-term returns (cash deals are mostly
cheaper than stock).
Table 2.19a shows the effects of the announcement of bids on shareholder
returns for target firms and acquiring firms.

74
Table 2.19a: Shareholder Returns around Announcement Dates
Mergers Events Impact on Target Impact on Acquirer
1960s 20% 0%
1970s 20% 0.5%
1980s 20% 1%
1990s 20% 0.7%
1980s and 1990s 20% 0.2%
Acquisition Events Impact on Target Impact on Acquirer
1960s 22% 4%
1970s 35% 2.4%
1980s 38% -1.3%
1990s 52% Not applicable
1962–2001 30% 0%
Merger & Acquisition Impact on Target Impact on Acquirer
1980s to 1990s 24% -0.7%
(Source: DePamphilis, 2008)
Although some post-merger performance studies indicate that most companies
that have merged or acquired tend to underperform relative to the industry
average, other such studies reveal the contrary. However, there is also diversity of
opinion on the matter, which may be the result of sample used, time period and
methodology employed. Table 2.19b is an example of the findings of some
post-merger performance studies. These findings are based on the use of
accounting studies or other performance measures such as cash flow and
operating profit during the period of three to five years following the closing of the
transaction.
Table 2.19b: Post-merger Performance Assessment within 3–5 Years
Underperform industry
average
Approximately industry
average
Overperform industry
average
McKinsey & Company (1990) Mueller (1985) Healy, Palepu & Ruback (1992)
Mangenheim & Mueller (1988) Ravenscraft & Sherer (1987 & 1988) Kaplan & Weisbach (1992)

75
Franks, Harris & Titman (1991) Bradely & Jarrel (1988) Rau & Vermaelen (1992)
Agrawal, Jaffe & Mandelker
(1992)
Ghosh (2001) Carline, Linn & Yadav (2001)
Sirower (1997)
Gregory (1997)
Loughran & Vijh (1997)
Rau & Vermaelen (1998)
Agrawal & Jaffe (1999)
Black, Carnes & Jandik (2000)
Deogun & Lipin (2000)
Sanford Bernstein & Company
(2000)
(Source: DePamphilis, 2008)
According to Bruner (2004), we can define three possible outcomes for mergers
and acquisitions:
• Value conserved: Investment returns equal required returns. The investor
got the returns that were expected prior to the deal.
• Value created: Investment returns exceed the required returns. The
investor got more than what was expected prior to the deal.
• Value destroyed: Investment returns were less than required returns. The
investor got less than what was expected prior to the deal.
The issue here, though, is: Can the value expected by the investors be considered
a fair expectation relative to what the market expects?
Bruner (2004) further explains that merger and acquisition profitability should be
measured against a benchmark, in which case three classes or tests of profitability
can be applied, as follows (Table 2.19c):
• Weak form, which compares share price movements before and after the
deal
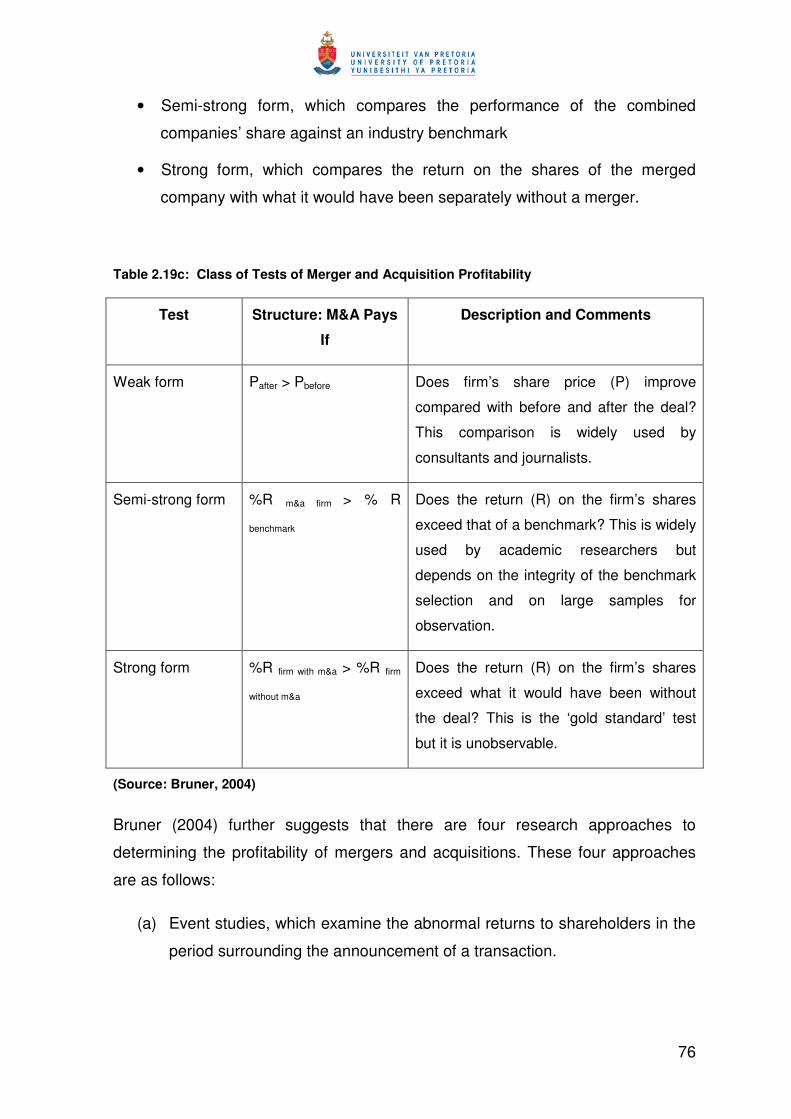
76
• Semi-strong form, which compares the performance of the combined
companies’ share against an industry benchmark
• Strong form, which compares the return on the shares of the merged
company with what it would have been separately without a merger.
Table 2.19c: Class of Tests of Merger and Acquisition Profitability
Test Structure: M&A Pays
If
Description and Comments
Weak form Pafter > Pbefore Does firm’s share price (P) improve
compared with before and after the deal?
This comparison is widely used by
consultants and journalists.
Semi-strong form %R m&a firm > % R
benchmark
Does the return (R) on the firm’s shares
exceed that of a benchmark? This is widely
used by academic researchers but
depends on the integrity of the benchmark
selection and on large samples for
observation.
Strong form %R firm with m&a > %R firm
without m&a
Does the return (R) on the firm’s shares
exceed what it would have been without
the deal? This is the ‘gold standard’ test
but it is unobservable.
(Source: Bruner, 2004)
Bruner (2004) further suggests that there are four research approaches to
determining the profitability of mergers and acquisitions. These four approaches
are as follows:
(a) Event studies, which examine the abnormal returns to shareholders in the
period surrounding the announcement of a transaction.

77
(b) Accounting studies, which examine reported financial statements before
and after the deal, and consider accounting measures such as net income,
return on equity or assets, earnings per share, leverage and liquidity of the
firm
(c) Survey of executives, which considers the views of managers on whether
an acquisition did create value or not
(d) Clinical studies, which focus on an in-depth analysis of a particular
transaction or a few transactions
Bruner (2004), after considering the work of other authors on the analysis of
previous deals, reports the following:
(a) Target firms enjoy returns that are significantly and materially positive
based on the evidence from event studies.
(b) Market-based returns analysis gives mixed conclusions on whether value
was created or not.
(c) The combined company returns are positive, which indicates that
acquirers also benefit.
Dobbs, Goedhart and Suonio (2006) report that the boom of 2003 to 2006 created
more value than the previous boom (1997 to 2000), and that acquirers were
getting more out of it. The two key measures that were used to arrive at this
conclusion are the deal value added (DVA) and the proportion of companies
overpaying (POP).
This research was based on 1 000 global mergers and acquisitions from 1997 to
2006, comparing the share price two days before and two days after a deal was
announced in order to assess the financial market’s initial reaction to the deals.
It also confirms the outcome of other research work indicating that there is a
positive correlation between the so-called ‘announcement effect’ and long-term
value creation.
78
First, the DVA tracks the financial market’s assessment of how much total value a
deal will create. It measures the aggregate value change at the time of
announcement across both companies as a percentage of a transaction’s value
(adjusted for market movements).
The second index, the POP, examines the success of acquirers in capturing value
from deals by measuring the proportion of all transactions in which the initial share
price reaction for the acquirer was negative, indicating that the acquirer overpaid
(adjusted for market movements). In other words, the POP represents the
proportion that the market perceives acquirers to have transferred to the sellers to
be more than 100% of the value created in the deal.
The study concludes that:
(a) The average DVA has been 6.1%, trending from 2.1% in 2003 to 10.6% in
2006.
(b) The POP decreased from 63% in 2003 to 56% in 2006, indicating that
average deal premiums are reducing considerably and acquirers are
keeping more of the value.
Figure 2.19a is the DVA from 1997 to 2006, and Figure 2.19.b is the POP from
1997 to 2006.

79
Figure 2.19a: Deal Value Add (DVA) from 1997 to 2006 (Source: Dobbs, Goedhart & Suonio,
2006)
Figure 2.19b: Proportion Overpaid (POP) from 1997 to 2007 (Source: Dobbs, Goedhart &
Suonio, 2006)

80
Based on the information discussed so far and considering the work of various
authors on the issue of whether mergers and acquisitions add value or not, the
following is a summary of key learnings:
• There is a pre-merger period and a post-merger period for measuring
performance.
• The pre-merger period performance metrics include announcement effect
indicators such as the DVA and POP.
• Acquirers tend to overpay (excessive premium), leading to significant
benefit to the target shareholders.
• Shareholders profit by selling around announcement dates.
• Performance can be measured by event studies around the period of the
announcement, or by accounting studies in which the financial statements
of the companies can be compared before and after the merger, through
clinical studies and interviews with top executives.
• The post-merger performance, based on accounting metrics, can compare
the returns achieved and what was initially expected against an appropriate
industry benchmark or judge them against what the individual companies’
performance would have been without a merger.
• One of the accounting metrics considered is return to shareholders or total
return to shareholders (TRS), which involves earnings per share and
dividends, net income, return on equity or assets, and liquidity of the firm.
• The method employed in analysis, the period used and the type of sample
used (whether global or industry) may affect the outcome of the study.
• The timing or acceptable period for post-merger and acquisition preliminary
value assessment should be at least three to five years after the deal.
• There can also be non-financial objectives in a merger and acquisition
process which need to be taken into consideration. A typical example is
mergers and acquisitions that have taken place in the South African mining
industry as a result of compliance with the MPDRA. In such a situation,
success can be related to achievement of the required ownership score,

81
which assists in securing mining licences to enable long-term sustainable
value creation.
How is value determined?
It is very clear that different measures have been used in different periods
(pre-merger and post-merger) to arrive at conclusions on whether mergers and
acquisitions do create value. This could indicate that value lies in the eyes of the
beholder and it is also possible that sometimes there could be a lack of focus on
what companies are really looking for.
This section of the report will attempt to consider most of the views of various
authors on what accounting metrics should be used in assessing the performance
of an organisation and conclude with the selection of a critical few for further
study. It is, however, important to understand that as much as each event is
unique and we cannot therefore apply a standard measure to all deals, a
comprehensive toolkit of measures, indicating the applicability and suitability of
each measure, will assist as a guide to ensure a holistic and comprehensive
approach to the value assessment of deals. The toolkit must include the minimum
set of complementary measures or indicators that must be used to do an
assessment of mergers and acquisitions. The metrics discussed previously for
measuring value creation in mergers and acquisitions essentially entail two
fundamental metrics: stock market metrics and operating performance metrics.
Goedhart, Koller and Wessels (2005) report that emotions can drive market
behaviour in short-lived situations, but fundamentals will still rule in the long term.
Hence stock market valuations over the short period of deal announcement may
not reveal the true underlying value assigned to the acquiring and target company
shares.
Dobbs and Koller (2005b) state that the most common approach in measuring a
company’s stock market performance is to calculate its total returns to
shareholders (TRS) over time. This approach, according to the study, has severe
limitations because over short periods (e.g. deal announcement periods or
commodity price fluctuations) TRS embodies change in a company’s future
performance more than in its underlying performance and health. Companies that

82
consistently meet high performance standards can thus find it hard to deliver high
TRS. In other words, the better a company performs, the more the market expects
of it.
The article further indicates that companies can compensate for the shortcomings
of TRS by employing complementary measures of stock performance. One of
them is the market value add (MVA), which is the difference between the market
value of a company’s debt and equity, and the amount of capital invested in it.
A related metric is the ratio of market value to capital, which is the debt and
market equity compared with the amount of capital invested. In this way the ratio
of market value to capital and MVA will complement TRS by measuring different
aspects of a company’s performance.
TRS measures against market expectations and changes in them, whereas MVA
and the ratio of market value to capital, by contrast, measure the financial market’s
view of a company’s future performance relative to the capital invested in it. In this
way we can assess expectations of its absolute performance.
Deelder, Goedhart and Agrawal (2008) are also of the opinion that TRS, like any
other performance metric, is only instructive when users understand its
components. Actual corporate performance, for example, is only part of the mix,
as TRS is also heavily influenced by changes in investor expectations of future
performance. The study refers to the traditional way of defining TRS as the sum of
the percentage change in earnings plus the change in market expectations as
being flawed because not all forms of earnings create value, but rather those that
are rooted in activities that generate high returns on capital. It also points out the
error in the traditional way of relating TRS to dividend payments because
dividends do not create value. For example, if a company pays a higher dividend
today to take on more debt, its future dividends are likely to be lower.
A better approach to understanding TRS is to break up the metric into four
fundamental parts, namely a company’s operating performance, its stock market
valuation at the beginning of the measuring period, changes in stock market
expectations about its performance and its financial leverage.

83
Dobbs, Nand and Rehm (2005) also discuss the potential flaw in using earnings
per share (EPS) as a tool in valuating mergers and acquisitions. They state that
assessing the impact of acquisitions on net income rather than on EPS corrects
for the dilutive effect of acquisitions that involve the issue of shares. When a
company uses cash to complete a transaction, its earnings are reduced by the
loss of interest income on the cash used in the transaction, or by the loss of
interest on the additional debt. When it uses additional shares to complete a
transaction, EPS declines mathematically since earnings are spread across a
greater number of shares. Dobbs et al. (2005) also discuss the impact of
accounting rules on the way acquisitions get treated in terms of goodwill and
amortisation, and the need for consistency to reflect the correct picture over time
and across borders.
The study concludes that there is no perfect metric to prove whether a deal
creates value or not, but that companies can explore the deal’s impact on
economic profit. Economic profit is defined as the invested capital multiplied by the
difference between return on invested capital and the weighted average cost of
capital.
In measuring long-term performance, Dobbs and Koller (2005a) believe that
earnings per share and share price may not give a good indication of the state of a
company because they do not necessarily indicate whether a company is
fundamentally healthy, in the sense of being able to sustain its current
performance and to build profitable businesses in the future. In other words, a
falling share price may not be a sign of poor performance.
There is therefore a need for a comprehensive performance assessment that
measures the value created and estimates its ability to create more. This will
assist in maintaining a balance between short-term and long-term value creation.
A company’s historical growth and returns on capital can be measured directly, but
the potential for future growth and returns must be inferred. To do so, it is
necessary to devise metrics that gauge the longer term health of the company and
also complement the metrics for short-term performance.

84
To give another illustration, a patient visiting a doctor may feel fine, but discovery
of his or her high cholesterol levels could make it necessary to act now to prevent
heart disease. Similarly, a company may show strong growth and returns on
capital, but the health metrics are needed to determine whether that performance
is sustainable.
A company’s cash flow and, ultimately, its market value stem from its long-term
growth in revenues and profits, and from returns on invested capital (ROIC)
relative to its cost of capital. A discounted cash flow (DCF) analysis, based on
projected performance and the use of the relevant health indicators, will therefore
assist in understanding the link between shareholder value, as measured by stock
markets, and the drivers of value.
According to Dobbs and Koller (2005a), organisational performance can be
measured in three different categories, namely:
(a) The economic value the company has created historically
(b) Metrics that can gauge the company’s ability to sustain that value created
and manage the risks that might prevent it from doing so
(c) Assessment of its capital market performance
Metrics such as ROIC, economic profit and growth that can be linked directly to
value creation are therefore more meaningful than traditional metrics such as
EPS.
Regarding the health metrics, it is important to know whether a company has the
products, the people and the processes to continue creating value. Assessing the
risk a company faces and the measures in place to mitigate them is also an
important tool in measuring health. Diagnostics of organisational health will
typically consider the skills and capability of the company, its ability to retain its
employees and keep them satisfied, its culture and values, and the depth of
management talent. These health metrics have to be quantifiable and should not
be generalised, but adapted to suit each situation. Health metrics are also an
important measure of post-merger integration.
85
2.20 DISCUSSION ON KEY VALUE DETERMINATION INDICATORS
There have been several discussions on various parameters that can be used to
assess value in an organisation in general, and also in mergers and acquisitions.
The key objectives in assessing value can be summarised as follows:
• Initial stock market reaction around announcement dates for mergers and
acquisitions must be assessed, using the DVA and POP.
• The operating performance of the company can fundamentally be assessed
by analysing financial activity using activity ratios (total asset turnover, fixed
asset turnover, etc.) that measure the speed at which various accounts are
converted into cash or sales, or by analysing the level of liquidity using
liquidity ratios (net working capital, current ratio, etc.) to establish the firm’s
ability to satisfy its short-term obligations as they become due, or by
analysing debt using debt ratios (debt equity ratio, interest cover, etc.) to
establish the degree of indebtedness, or by analysing profitability using
profitability ratios (profit margins, ROA, ROE, EPS, P/E ratio, etc.)
• Where capital is extensively employed, especially in major capital projects
for growth and expansion, the measure of efficient capital utilisation for
investment decisions can be determined using parameters such as MVA,
economic profit, DCF, market-value-to-capital ratio and ROIC.
The fundamental problem with the DVA and POP is the level of accuracy based
on the timing used. Market reaction to deal announcements can definitely add or
destroy value whether the deal is successful or not. A typical example would be
the reduction in the share price of Harmony and XStrata when their hostile bids for
GoldFields and AngloAmerican respectively were announced. Even though the
deals were called off at a later stage, the share price did not react by the same
proportion it did when the deal was announced. This means that the
announcement of a deal sends some signals to the market that could be
perceived in various ways, depending on the acquirer’s track record and the price
offered for the target. However, when one considers share price reactions around
86
announcement dates, they often tend to recover or change when more information
is made available to the public within a month or even more.
The market perception is also normally based on how much information is
available concerning the internal operating dynamics within the organisation
(which are often confidential) and on the organisation’s past performance (which
wrongfully assumes that past performance is a reliable indicator of future
performance). The POP was negative during Harmony’s hostile bid for
Randfontein Estates in 2000, with the share price reacting unfavourably,
especially in view of the huge premium the acquirer offered. Harmony, in its 2003
Annual Report, indicated that the acquisition had a payback of seven quarters.
The main flaws in the DVA and POP are the timing applied and the fact that
market predictions are not always right. Nonetheless, the market’s perception can
become a reality, which will reflect in the target’s share price and investor ratings if
the company does not perform to the contrary.
To comment on the three forms of profitability test, the weak form test is
dependent on market sentiment, which can sometimes be driven by emotions in
the short term, but normally depends on fundamentals in the long run. The semi-
strong form test is useful, depending on the availability and appropriateness of the
benchmark that is used. The strong form test, in practice, does not exist since it
will be based on assumptions.
The use of a survey of executives and senior managers to assess the effect of the
deal on value creation can be very helpful, as long as the feedback is constructive
and unbiased. There is a danger of being both a player and a referee in such
situations due to vested interest. Clinical studies are probably the most useful but
that will depend on the willingness of the organisation to make available extensive
information that sometimes may not be in the public domain. This can be a breach
of corporate governance, especially with market-sensitive information, and can
therefore only be done internally. The use of a consultant or expert can be a
threat, especially when management also does not know what the outcome will
be. Moreover, the expert knowledge required for such an exercise may not always
exist in an organisation, and may explain to some extent why a post-merger
assessment is not always done.
87
Considering the parameters that are used to measure the level of activity, liquidity,
profitability, indebtedness and efficient capital utilisation – all these are useful and
complementary and also have their applicability depending on the nature of the
organisation. However, activity must generate profits, which in turn can be used to
fund liquidity and debt, and in some case capital expansion. Capital projects must
also in the long run generate returns and paybacks. Hence over a long period, all
these parameters will manifest by impacting favourably or unfavourably on profits.
The key parameters that impact directly on shareholder value will therefore be
centred on earnings, dividends, share price performance and the level of debt.
This leads to various ratios, of which five are chosen for the purpose of this study,
namely:
(i) Earnings per share
(ii) Dividends per share
(iii) Return on equity
(iv) Price/earnings ratio
(v) Debt/equity ratio
This does not mean that other parameters are not important in value assessment.
The ratios chosen will be complemented by non-financial factors based on the
merger objectives, health indicators and BEE compliance in the South African
mining industry, which includes the following:
(a) Acquisition of skills
(b) Acquisition of better operating processes and systems
(c) Acquisition of quality resources
(d) Compliance with the Mining Charter and subsequently obtaining a new
order mining licence
(e) Growth in production and output from existing assets and project pipeline

88
(f) Operating efficiency in terms of cash unit cost
(g) Access to markets
From the discussions on how value is determined, the following can be used as a
guide:
Short-term metrics
Announcement effects (deal value add and proportion overpaid)
Medium to long-term metrics
Financial indicators (ROE, EPS, DPS, P/E, D/E ratios) and non-financial indicators
(growth in production, skills, quality resources, operational efficiency, compliance
with Mining Charter, markets, etc.)
Basis for comparison
The basis for comparison will be pre-merger and post-merger results, industry
average performance (since it strips out the effect of change in external factors
such as commodity price, exchange rates, etc.) and other appropriate
benchmarks.
Period of measurement
Announcement effects should be two days prior to the deal and two days after the
deal, and the medium-term assessment should be from three to five years and an
additional five years for the long term.
Deal valuation
This will be a combination of all these parameters, benchmarked appropriately
over a three-to-five-year period and with projections made for the next five years.
REFERENCES – CHAPTER 2
Anon (2008). Mergers and Acquisitions. Available:
http://en.wikipedia.org/wiki/mergers_and_acquisitions

89
Bruner, R.F. (2004). Applied Mergers and Acquisitions. Hoboken, NJ, US: Wiley,
pp 30–65.
Deelder, B., Goedhart, M.H., Agrawal, A. (2008). A better way to understand TRS.
McKinsey Quarterly, July.
DePamphilis, D.M. (2008). Mergers, Acquisitions and Other Restructuring
Activities, 4th edition. Burlington, MA, US: Academic Press, pp 18–34, 137–212.
Department of Minerals and Energy (DME). (2008). South Africa’s Mineral Industry
2007/2008. Pretoria: DME.
Department of Trade and Industry (DTI). (2008). South Africa: Geared for Growth
2008. Pretoria: DTI.
Dobbs, R., Goedhart, M. & Suonio, H. (2006). Are companies getting better at
M&A? McKinsey Quarterly, December.
Dobbs, R. & Koller, T. (2005a). Measuring long-term performance. McKinsey
Quarterly, March.
Dobbs, R. & Koller, T. (2005b). Measuring stock market performance. McKinsey
Quarterly, October.
Dobbs, R., Nand, B. & Rehm, W. (2005). Merger valuation: Time to jettison EPS.
McKinsey Quarterly, March.
Empowerdex (2006). Interim Progress Report and Sector Comparison. Available:
http:www.empowerdex.co.za
Goedhart, M., Koller, T. & Wessels, D. (2005). Do fundamentals – or emotions –
drive the stock market? McKinsey Quarterly, March.
Goldsmith, T. (2009). Mining Deals. 2008 Annual Review.
PricewaterhouseCoopers report.
Leon, P. (2008). Resource nationalism: an African perspective. Proc. International
Bar Association Conference, Buenos Aires.
90
McKenzie, P. (2008). Overview of regulatory factors affecting mining and
exploration activities in China. Proc. Beijing Conference, November.
Moeller, S. & Brady, C. (2007). Intelligent M&A. Navigating the mergers and
acquisitions minefield. Hoboken, NJ, US: Wiley, pp 9–16.
Pautler, P.A. (2001). Evidence on mergers and acquisitions. Internal Report,
Bureau of Economics, Federal Trade Commission, US.
Roux, A. (2008). Everyone’s Guide to the South African Economy. Cape Town:
Zebra Press.
Sherman, A.J. & Hart, M.A. (2006) Mergers and Acquisitions from A to Z.
AMACOM, US, pp 1–9.
91
CHAPTER 3 RESULTS
92
3.1 INTRODUCTION
In the previous chapter, which dealt with the literature review, the parameters that
can be used to assess value creation in deals were discussed in detail. In order to
select a few appropriate parameters that will be suitable to the South African
mining industry, interviews were conducted with some of the stakeholders who are
normally involved in such deals. These included chief executive officers of mining
companies, investment bankers, consultants and BEE partners.
The interviews were structured around a discussion document and a guideline
questionnaire, which are shown in Appendix A and Appendix B. The objective of
the interviews was to gain opinions on the parameters that were selected as a
result of the discussion of the literature review, and also to obtain some
suggestions for consideration. This was to ensure that the final deal value
assessment criteria that are used are relevant and comprehensive.
The outcome of the interviews may be summarised as follows:
(a) The Du Pont model, which is used ultimately to calculate the return on
equity, is perhaps the most important measure (Mr Mark Hayward-Butt,
Investment Banking). In Mr Hayward-Butt’s opinion, everything cascades
finally to net profits over the long run which, expressed as a ratio to
shareholders equity, gives a good measure of shareholder returns (return
on equity).
(b) In acquisitions, the percentage stake is very important. In deals where a
stake of 50% or more is acquired, the acquirer is able to influence the
performance of the asset acquired. In instances where the stake may be
relatively lower, especially at around 26% to comply with legislation, it may
be difficult to influence the decision-making processes, depending on how
fragmented the shareholder base is. This comment was made on the view
that Anooraq gaining management control of Lebowa could extract more
value for its shareholders (Mr Philip Kotze, CEO of Anooraq). It must also
93
be noted that 26% was enough to make Vulisango the largest shareholder
in Simmer and Jack, because the shareholder base was very fragmented.
(c) Deals that are made to achieve BEE compliance often bring in some form
of cash injection as the BEE partner has to purchase a stake. In some
instances, future earnings and dividends are used to repay loans. Hence
the financial side of the deal is very critical for sustainability because,
despite the intention of achieving equity in wealth ownership, there is often
debt to be paid by BEE partners
(d) The acquisition of a stake in a BEE deal should normally not have much
effect on the day-to-day running of operations and overall business
strategy. In fact, they should reinforce company performance because of
the additional sets of skills the BEE partners often bring.
(e) Hence value assessment should be the same for all deals, using financial
and non-financial metrics. This is because the intent of the BEE partners is
to enjoy sustainable value creation that allows them to see a return on the
financial investment they made in acquiring part of the company. This
should not be different from an ordinary shareholder perspective and
hence the metrics that reflect shareholder profitability would be suggested.
(f) There are often pre-deal expectations set out before any merger or
acquisition because good corporate governance requires that sound value
creation propositions be used to back these deals for shareholders to
make informed decisions.
(g) Post-deal value assessments using the same parameters, however, often
do not take place. In some cases, deal objectives change as situations
change in the post-deal environment.
(h) The parameters that have been used in the merger discussions with
industry players (which are a summary of relevant and applicable issues
from the literature survey) are regarded as fairly comprehensive and
adequate, though unique situations will require some modification.

94
(i) The study will be of enormous benefit to the mining industry at large in
assessing past deals and in selecting future deals.
The points discussed under (c), (d), (e), (f) and (g) were affirmed by Messrs
Bernard Swanepoel, Fani Titi and Sipho Nkosi. The comments noted under (h)
and (f) summarise their views on the purpose and outcome of the study.
Following the outcome of the interviews and the findings of the literature review,
the selection of an appropriate value adding criteria has to take the following into
consideration:
(a) The focus is on value creation for shareholders (it does not imply, though,
that the concerns of other stakeholders are not important. In fact, they are
vital for sustainable shareholder wealth creation. However, for the purpose
of this study, value creation was confined to shareholders.
(b) The sustainability of wealth creation depends on the health metrics, which
are often non-financial but very critical for the business.
(c) The financial metrics are often a consequence of how the non-financial
metrics are managed, and are lagging indicators. However, if the
non-financial metrics are well managed, then there should be sustainable
improved financial performance, compared with past and industry
performance on these metrics.
(d) The key issues that impact directly on shareholders include earnings,
dividends, debt and share price performance. This is the ultimate measure
of risk and return for shareholders, and hence the financial parameters
must focus on these issues.
The deal assessment criteria that were used therefore took all these factors into
consideration to arrive at suitable and relevant parameters.
These parameters can be summarised as follows:
95
(a) Parameters due to deal objectives, which are set by the parties involved in
the merger or by the acquirer in the case of an acquisition
(b) Initial market sentiments on deal announcement using the deal value add
(DVA) and the proportion overpaid (POP)
(c) Non-financial parameters such as growth in output, operating efficiency
(typically unit cost), access to quality resources (orebodies), access to
skills, access to good operating processes and systems, compliance with
legislation, access to markets, etc.
(d) Financial parameters such as return on equity (ROE), earnings per share
(EPS), dividend per share (DPS), price/earnings ratio (P/E), and
debt/equity ratio (D/E)
(e) These parameters are assessed on the following basis:
i. The initial assessment is based on the first three to five years, after
which an additional five years will enable a fair assessment of the
deal’s impact.
ii. Figures are compared with those of the past to see whether they
have improved or deteriorated. They are compared over the initial
post-deal period of three to five years for trends (whether positive,
negative or neutral) and also compared with appropriate industry
benchmarks or companies.
iii. The overall assessment is then based on the outcome of these sets
of parameters.
iv. Future projections are made based on past performance and other
industry-related indicators.
3.2 SELECTION OF APPROPRIATE AND REPRESENTATIVE DEALS
For the purpose of this study, out of the 138 mining deals that were available from
Dealogic, the following process was used in selecting appropriate and
representative deals:
(a) There were some deal duplications. These were typically the case where a
single deal results in multiple transactions, which all get recorded as deals.

96
A typical example would be the Harmony/ARMgold merger and
subsequent transactions, as well as the Kumba Resources/Eyesizwe
merger and the associated transactions.
(b) There were deals that involved acquirers that were not mining entities, for
example banks or BEE consortia making acquisitions, and these were
excluded for the purpose of this study.
(c) There were deals where the percentage stake acquired and the asset
involved was so insignificant as to make no major impact on the overall
performance, and that would therefore be difficult to assess. A typical
example is Harmony acquiring 37.8% in Village Main Reef for US$65,000.
(d) There were deals involving mining properties that were yet to be
developed. Value assessment will be useful once these projects have
been approved, executed, commissioned and allowed to operate for some
time.
The remaining deals were then screened using some guidelines to arrive at about
15–20 deals. These guidelines were the following:
(a) Deal value in terms of those that are significant (US$100 million or more)
(b) Rationale for the deal, whether BEE related or pure mergers and
acquisitions, to ensure that the study considers examples of both cases
(c) Types of commodity should involve at least gold, platinum, diamonds,
base metals and/or coal
(d) Deals involving major companies as well as junior mining companies
(e) The period chosen should involve all the years between 2003 and 2008.
This resulted in a list of 18 deals, as shown in Appendix C. Of these deals, those
that were acquired from 2007 onwards have not had adequate time for the deal
objectives to be entrenched, and an assessment can only be made based on
initial market reaction. Some of the remaining deals also involve companies that
were not publicly listed on the JSE, thereby making it therefore difficult to obtain
the information required.
97
Hence, applying the criteria of a period of three to five years for initial deal
assessment and of deals involving companies where at least the acquirer is listed
on the JSE resulted in about seven deals. The 31.6% stake of Anglo Plc in Kumba
Resources was going to be difficult to assess due to the wider range of portfolios
in Anglo Plc Mvelaphanda’s 10% acquisition of GoldFields being perceived as a
transaction on which Mvelaphanda will have little impact, in terms of management
control.
Three key mergers were therefore arrived at that were significant, provided
adequate information and could also impact significantly on post-merger
performance. These were Harmony/ARMgold/Avmin in 2003, AngloGold/Ashanti
GoldFields and Kumba Resources/Eyesizwe, with the latter having information for
only two years, enabling only a preliminary assessment. Even though only three
key mergers were used, they allowed for an in-depth analysis using all the
parameters discussed earlier.
3.3 APPLICATION OF VALUE ASSESSMENT MODEL
3.3.1 Value Assessment of Harmony/ARMgold Merger
Deal background
Harmony Gold Mining Company Limited was formed in 1994 following the
cancellation of the service contract between Harmony and Randgold, and was
listed on the JSE as a separate entity in 1997. The company grew from a single-
lease company in to a large global gold mining company, with operating assets in
South Africa and Australasia.
Following a spate of acquisitions between 1998 and 2001 mainly in South Africa,
involving Evander, Randfontein, Elandskraal and Freegold (which was a 50/50
joint venture with ARMgold), the company’s annual production grew from about
0.6 million ounces in 1997 to 3 million ounces in 2003. Within the same period,
mining reserves grew from about 12 million ounces to over 60 million ounces.
Its operating philosophy is to acquire less profitable assets and transform them
into profitable and sustainable assets. This is done mainly through:

98
(a) Focus on cost (especially on overheads)
(b) Flat management structures (which is believed to be more effective and
efficient)
(c) An ore reserve management philosophy that uses mining cut-offs as
opposed to mining pay limits
(d) Recapitalisation of the orebody to increase the life of mine
Most of these acquisitions achieved paybacks of between eight to ten quarters.
The company’s market capitalisation grew almost twenty-fold from R1.3 billion in
1998 to R24 billion in 2002. The average share price for the year-end rose from
R24.50/share in 1998 to R142.00/share in 2002.
The history and track record of ARMgold also share some similarity. In 1994,
Patrice Motsepe started Future Mining, a contract mining company which in 1997
led to the formation of African Rainbow Minerals Gold (ARMgold). The mining
assets of ARMgold were mainly closed or unprofitable operations in the Orkney
area of AngloGold Limited, which were mostly pillar mining operations.
ARMgold’s business model was also based on cost focus and a flat management
structure. ARMgold also introduced a system of continuous (seven days a week
underground) mining operations, also known as CONOPs, in order to ‘sweat’ its
assets to generate cash for future growth acquisitions. It was involved in a 50/50
joint venture cash acquisition of Freegold with Harmony in 2001. In 2002,
ARMgold was listed on the JSE with a market capitalisation of R5 billion. From a
small contracting company, ARM had grown to become a key gold producer in
South Africa and produced about 1 million ounces of gold in 2003. ARMgold was a
black-owned mining company.
The similarity in their business models in the areas of cost focus and flat
management structure, as well as their successful partnership in the 50/50 joint
venture, made their merger a business logic when the new Minerals and
Petroleum Resources Development Act (MPRDA), No. 28 of 2002, was enacted.
Although many mining companies in South Africa saw the merger as a threat and
were looking for exit opportunities, it created an opportunity for the companies to
99
grow not only by merging similar business philosophies, but also by positioning
themselves for further growth and proactively contributing to transformation in the
South African mining industry.
Merger description
In May 2003, Harmony Gold Mining Company Limited (Harmony) and African
Rainbow Minerals Gold Limited (ARMgold) announced details of a proposal to
create a world-class unhedged gold producer, with the bulk of its operations in
South Africa.
The merger was to create the fifth largest gold producer in the world, producing
approximately 4 million ounces per annum. The transaction was effected by the
issue of two Harmony shares for every three ARMgold shares held and the
payment of a special dividend of R5 per ordinary share by ARMgold prior to the
merger. At the time of the merger announcement, ARMgold had a market
capitalisation of about R5.5 billion and Harmony about R14 billion, with ARMgold
trading at about R56/share and Harmony at about R77/share (based on the
figures a day prior to the deal announcement). The merged company was to be
called Harmony with the “ARM words” conspicuous (Chief Executive’s Review,
Harmony 2003 Annual Report).
Prior to this deal announcement, both companies had acquired control of Freegold
assets from AngloGold Ashanti (then known as AngloGold) in a 50/50 joint venture
in December 2001 at a cash acquisition cost of R1.35 billion.
After the merger, the aggregate Harmony shares issued to ARMgold represented
26% of the enlarged issued share capital of the merged company, with African
Rainbow Minerals Investments (Pty) Ltd, represented by Patrice Motsepe,
becoming the largest shareholder, holding approximately 14% at that time. Patrice
Motsepe was also elected the non-executive Chairman of the ‘new Harmony’.
On the same day, the two companies subsequently announced details of a 50/50
joint acquisition of a 34.5% stake in Anglovaal Mining Limited (Avmin) for a cash
price of about R1.7 billion, which represented a premium of about 30% at the time
of negotiations based on market share price (Executive Chairman’s Review,
ARMgold Results for Quarter ended 31 March 2003).

100
Avmin at that time held shares in, and managed, the following assets:
• Gold: Avgold Limited (42%)
• Manganese and iron ore: Assmang Limited (50.3%) and Assore and 9.3%
• Nickel: Nkomati Mine (75%)
• Platinum: Two Rivers Project (55%)
On 15 July 2003, Harmony acquired a further 11.5% stake in Avgold through the
issue of about 6.9 million ordinary shares, which represented about 3.8% of the
issued share capital of Harmony at that time.
This resulted in Patrice Motsepe becoming the biggest shareholder in Avmin, and
also created the first black-empowered diversified mining company called ARM,
having assets in gold, platinum and ferrous metals, and exploration in copper in
Zambia.
The new Harmony effectively owned and operated Freegold, Target and the
Orkney operations in addition to the assets of the old Harmony, making it the
largest gold producer in South Africa at that time with the largest gold resource
base, and also operated major growth projects. It also owned about 20% of ARM
at that time, which it sold at a later stage.
Deal objectives
The key merger objectives, as recorded in the 2003 Annual Reports of Harmony
and ARMgold, as well as presentations made to investors at that time, can be
summarised as follows:
• A diversified black-empowered mining company was created.
• The new ARM would create more value for shareholders, using its
successful past business model, and would contribute to the communities
in which it operated.
• Harmony complied with the MPRDA in terms of black ownership
requirements and the subsequent appointment of a black non-executive
chairman.

101
• A new Harmony was created which would have the largest gold resource
basis (about 520 million ounces).
• The new Harmony would be the fifth largest producer of gold in the world,
producing about 4 million ounces of gold per annum, and having growth
projects.
• CONOPs (an operating process used successfully at ARMgold) would be
implemented at all Harmony’s operations to sweat its assets and increase
gold production to generate improved earnings and help fund future
growth projects.
• The Harmony business model of cost focus, better ore-reserve
management and flat management style would be used to further enhance
operational performance.
Value creation parameters applicable
This deal will be assessed on the basis of value creation for Harmony
shareholders and the following value creation indicators or parameters will be
used:
• Merger objectives in terms of what shareholders expected and what has
been achieved
• The initial market sentiments regarding the deal and its effect on the share
price of Harmony & ARMgold using the DVA as a short-term metric
• Non-financial parameters such as access to quality orebody, access to
quality skills, better operating processes, growth in production,
improvement in operational efficiency, compliance with legislation, etc.
• Financial parameters such as ROE, EPS, DPS, P/E and D/E
• Depending on the information available and where applicable, the
non-financial parameters will be measured on past performance compared
with current performance. The financial parameters will be measured on
past performance and also compared with industry performance.

102
• The first five years after the deal gives an indication of the medium-term
value created. Most of the discussion will therefore be based on value
created in the medium term from 2004 to 2008. However, an indication will
also be given in terms of what the prospects are in the next five years for
long-term value creation to be realised. It must be noted though that some
deals may take less or more than ten years to realise value, but ten years
has been chosen as a reasonable period for this study.
Short-term metric (deal value add – DVA)
The DVA is a short-term metric used by McKinsey to determine value creation,
and it is based on the assumption that positive DVA tends to correlate with long-
term value creation. It is essentially the difference between the combined market
capitalisation of two companies two trading days prior to the merger
announcement and two trading days after the merger announcement. Its objective
is to capture the markets’ perspective as to whether they believe it is a good deal
or not. It also considers the share price reaction for the acquirer. To establish this,
we need to observe the market reaction to Harmony and ARMgold relative to the
deal announcement date of 2 May 2003.
Table 3.3.1a indicates that the merger announcement had a positive DVA of about
R1.89 billion, which is an increase of about 10% in the combined market capital of
the merging companies, with Harmony showing a 12.52% change in market
capital. Figure 3.3.1a is a graphical illustration of changes in the market capital of
both companies.
Table 3.3.1a: Deal Value Add (R billion)
Market Capital Before After Variance % Variance
Harmony 13.5 15.19 1.69 12.52
ARMgold 5.49 5.69 0.2 3.64
Combined 18.99 20.88 1.89 9.95
Source: McGregor BFA
The changes in market capital could also be affected by the external market
effects of gold price and exchange rate. Figure 3.3.1b shows the share price
movement of Harmony relative to the JSE Gold Index. The two trading days prior
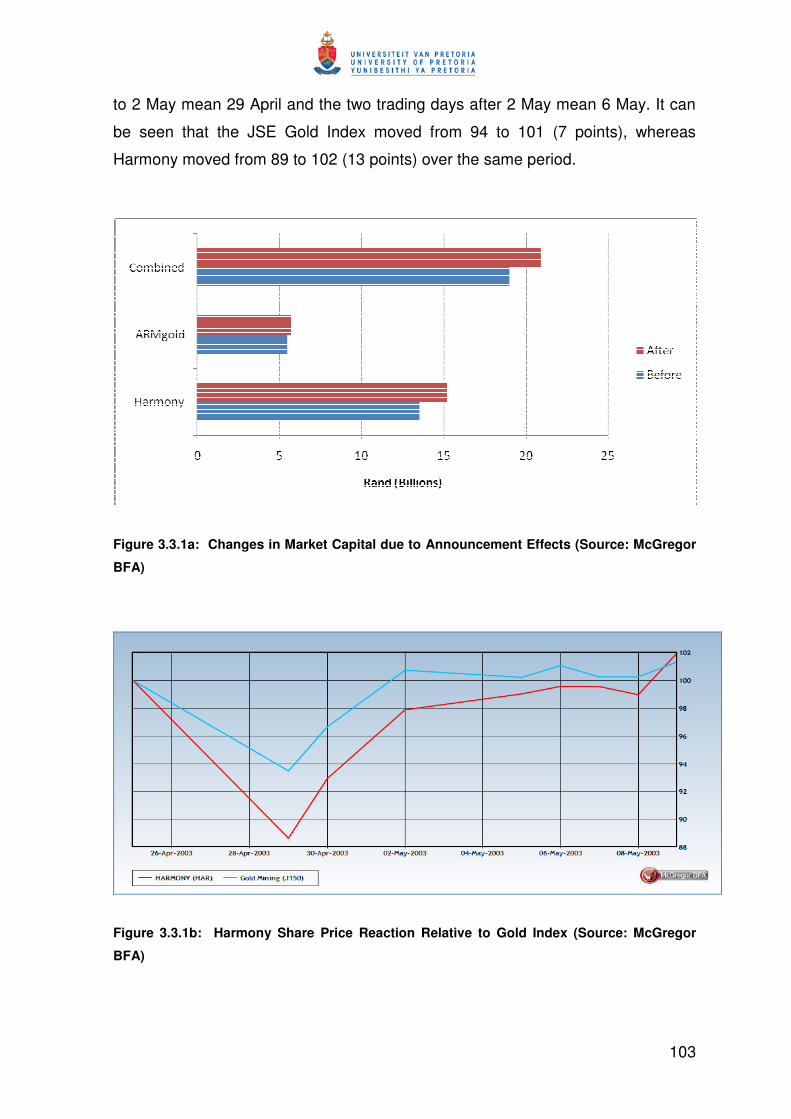
103
to 2 May mean 29 April and the two trading days after 2 May mean 6 May. It can
be seen that the JSE Gold Index moved from 94 to 101 (7 points), whereas
Harmony moved from 89 to 102 (13 points) over the same period.
Figure 3.3.1a: Changes in Market Capital due to Announcement Effects (Source: McGregor
BFA)
Figure 3.3.1b: Harmony Share Price Reaction Relative to Gold Index (Source: McGregor
BFA)
104
The market’s reaction to the deal was positive as depicted in the DVA, and this
added value to the market capital. According to McKinsey, there is normally a
positive correlation between DVA and long-term value creation. In other words, in
an efficient market, where fundamentals rule as opposed to short-term emotions,
the market’s prediction of value creation normally tends to be the case. This is true
if the market has adequate information on what is actually happening in
organisations, as well as the ability to predict the future dynamics within a
particular industry. It is also based on the flawed assumption that a company’s
internal capability will remains constant and therefore past performance predicts
future performance. This is, however, not always the case.
Medium-term metric (non-financial parameters)
The non-financial parameters that have the potential to add value include the
following:
• Access to quality orebody (Freegold & Target)
• Access to skills (skills transfer from ARM)
• Access to improved processes and systems (CONOPS)
• Production output profile (ounces of gold produced annually)
• Operational efficiency (unit cost in R/kg terms)
• Compliance with legislation (mining licence)
In terms of access to quality orebody, Harmony’s total resource, including project
ounces, increased by 39% from 296 million ounces to 410 million ounces. Total
reserves also increased by 26% from 49 million ounces to 62 million ounces. This
is reflected in the Chief Executive’s Overview in the 2003 Annual Report, and
includes 100% of ARMgold and Freegold.
In terms of synergy, the Freegold and Target mining areas were extensions of
most of the old Harmony operations, and this close proximity further enables the
exploitation of synergies between these assets and the old Harmony assets.

105
The position of the Freegold and Target assets relative to the old Harmony
operations is depicted in Figure 3.3.1c. The classification of these assets in terms
of marginal, quality, long-life quality and project growth are depicted in
Table 3.3.1b.
In general, Harmony had access to some quality orebodies as a result of the
merger, more specifically Tshepong, Masimong and Target. It also took over some
orebodies that were depleted, an example of which was Orkney.
Table 3.3.1b: Harmony’s Assets Classification (Source: Harmony Annual Report 2003)
Marginal
Ounces
Quality
Ounces
Long-life Quality
Ounces
Project Growth
Ounces
Potential
Projects
Harmony Evander Masimong Tshepong North Morobe/Wafi
Joel Kalgold Elandskraal Phakisa Poplar
Rest of
Freegold Randfontein Tshepong Doornkop Rolspruit
St Helena
Highland
Gold (31%) Bambanani Target (26%) Kalplats
Australian
ops
Bendigo
(32%)
Orkney
shafts Aurion (9.8%)
The fact that Masimong, Tshepong and Bambanani (long-life quality assets) and
Tshepong North, Phakisa and Target (project growth assets) formed part of the
merger transaction shows that Harmony secured long life and growth in production
from this merger of assets.
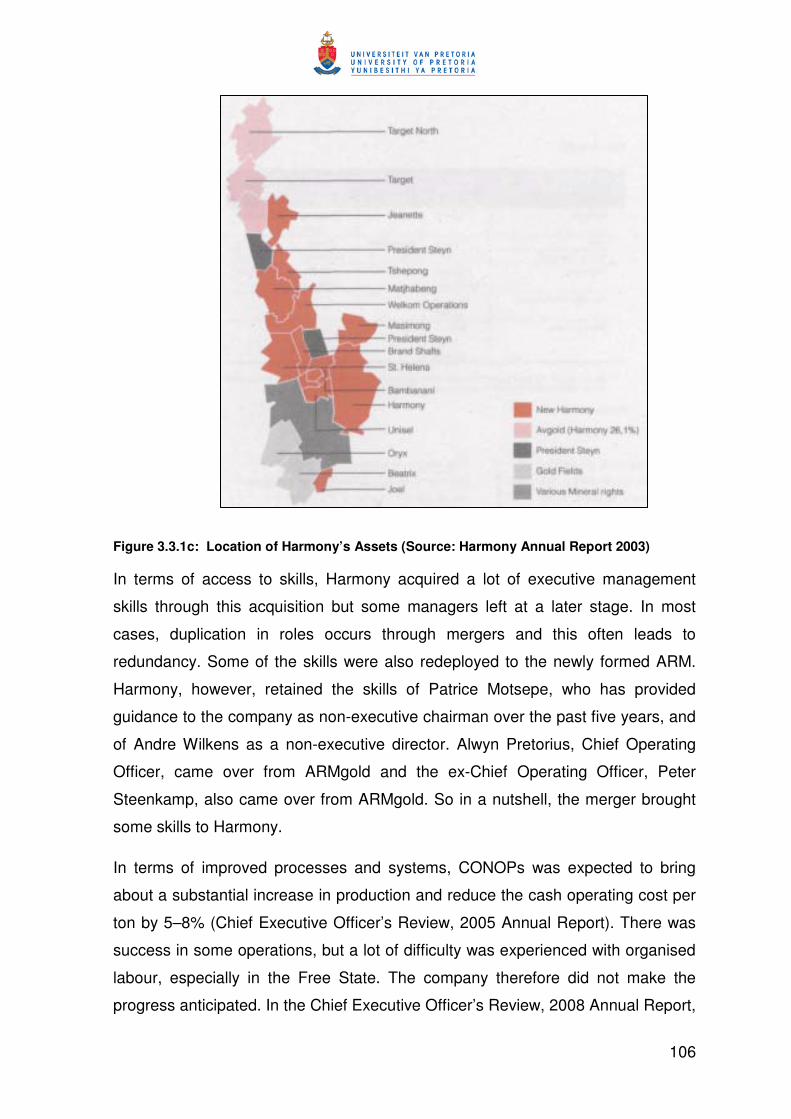
106
Figure 3.3.1c: Location of Harmony’s Assets (Source: Harmony Annual Report 2003)
In terms of access to skills, Harmony acquired a lot of executive management
skills through this acquisition but some managers left at a later stage. In most
cases, duplication in roles occurs through mergers and this often leads to
redundancy. Some of the skills were also redeployed to the newly formed ARM.
Harmony, however, retained the skills of Patrice Motsepe, who has provided
guidance to the company as non-executive chairman over the past five years, and
of Andre Wilkens as a non-executive director. Alwyn Pretorius, Chief Operating
Officer, came over from ARMgold and the ex-Chief Operating Officer, Peter
Steenkamp, also came over from ARMgold. So in a nutshell, the merger brought
some skills to Harmony.
In terms of improved processes and systems, CONOPs was expected to bring
about a substantial increase in production and reduce the cash operating cost per
ton by 5–8% (Chief Executive Officer’s Review, 2005 Annual Report). There was
success in some operations, but a lot of difficulty was experienced with organised
labour, especially in the Free State. The company therefore did not make the
progress anticipated. In the Chief Executive Officer’s Review, 2008 Annual Report,

107
he stated that CONOPs was not delivering the desired results and it has
subsequently ceased.
In terms of production output, Harmony experienced a continuous decline in gold
production from 2004 to 2008. Prior to the merger, Harmony produced about 2.6
million ounces of gold in 2002 and ARMgold produced about 1 million ounces of
gold. Gold production declined from about 3.3 million ounces in 2004 to 2.3 million
ounces in 2007. Within this period inflationary pressure in the South African mining
environment impacted on the unit cost of mining companies and hence the mining
cut-off grade, resulting in some assets becoming unprofitable. Some of the
Harmony assets had also depleted their reserves. In 2008, the sale of Harmony’s
Orkney assets to Pamodzi Gold and of the Randfontein Cooke operations to Rand
Uranium resulted in a further loss in gold production, with annual gold production
plummeting to about 1.6 million ounces.
The period 2004 to 2008 was therefore a reverse of the growth story depicted in
the period prior to 2004. Figure 3.3.1d illustrates the gold production profile from
2000 to 2008.
Figure 3.3.1d: Gold Production at Harmony (000 ounces) (Source: Harmony Annual
Reports, 2000–2008)
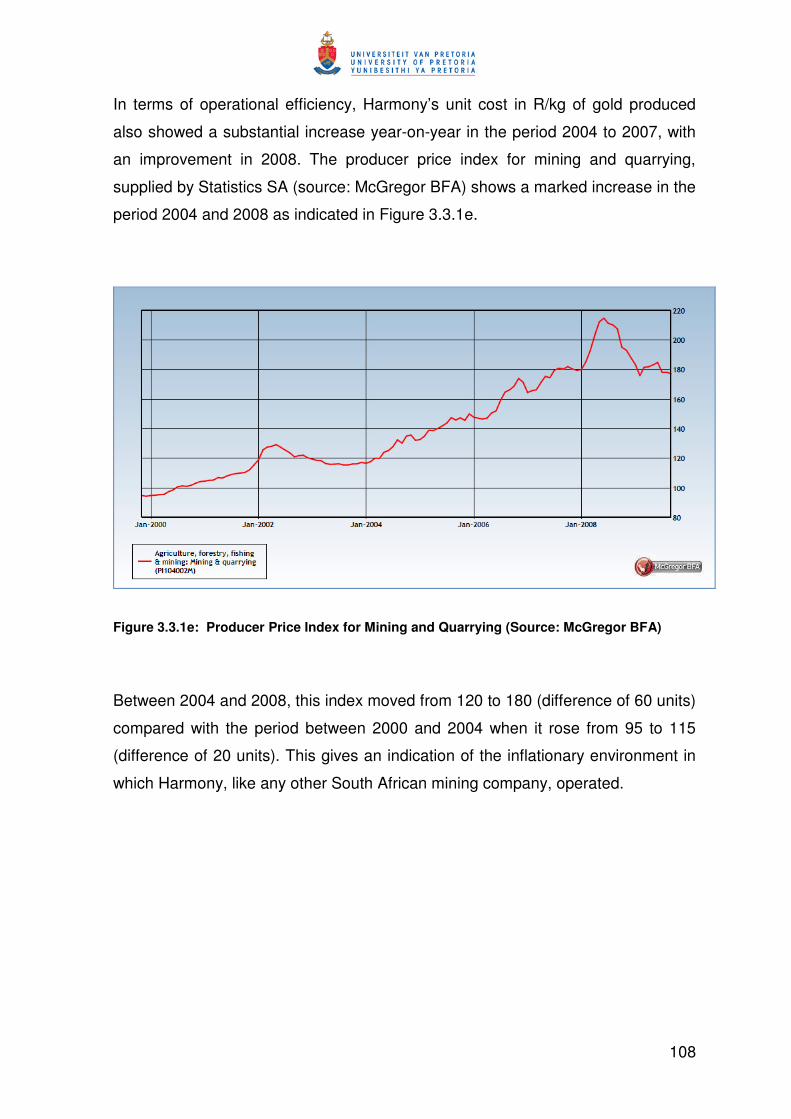
108
In terms of operational efficiency, Harmony’s unit cost in R/kg of gold produced
also showed a substantial increase year-on-year in the period 2004 to 2007, with
an improvement in 2008. The producer price index for mining and quarrying,
supplied by Statistics SA (source: McGregor BFA) shows a marked increase in the
period 2004 and 2008 as indicated in Figure 3.3.1e.
Figure 3.3.1e: Producer Price Index for Mining and Quarrying (Source: McGregor BFA)
Between 2004 and 2008, this index moved from 120 to 180 (difference of 60 units)
compared with the period between 2000 and 2004 when it rose from 95 to 115
(difference of 20 units). This gives an indication of the inflationary environment in
which Harmony, like any other South African mining company, operated.

109
Figure 3.3.1f: Unit Cost of Production for Mining and Quarrying in R/kg (Source: Harmony
Annual Reports, 2000–2008)
Harmony’s unit cost in R/kg of gold produced rose from about R82 000/kg to about
R138 000/kg in 2007 (about 60%) before improving to about R110 000/kg in 2008.
It can be seen that in the period 2004 to 2006, cost increases followed a historical
trend, but 2007 and 2008 showed excessive cost increases, with 2007 being
affected by restructuring and a decline in production. Even though there was a
general escalation in costs in the industry, Harmony also had the opportunity to
establish its key strategic differentiator (cost focus), which was not evident over
this period.
In terms of legislation, one of Harmony’s expectations in this deal was to enhance
its BEE ownership credentials in support of its mining licence application. This also
led to the formation of a newly established diversified black empowerment
company in the form of African Rainbow Minerals (ARM). The contribution made
by this deal to Harmony’s BEE ownership credentials is shown in Table 3.3.1c.
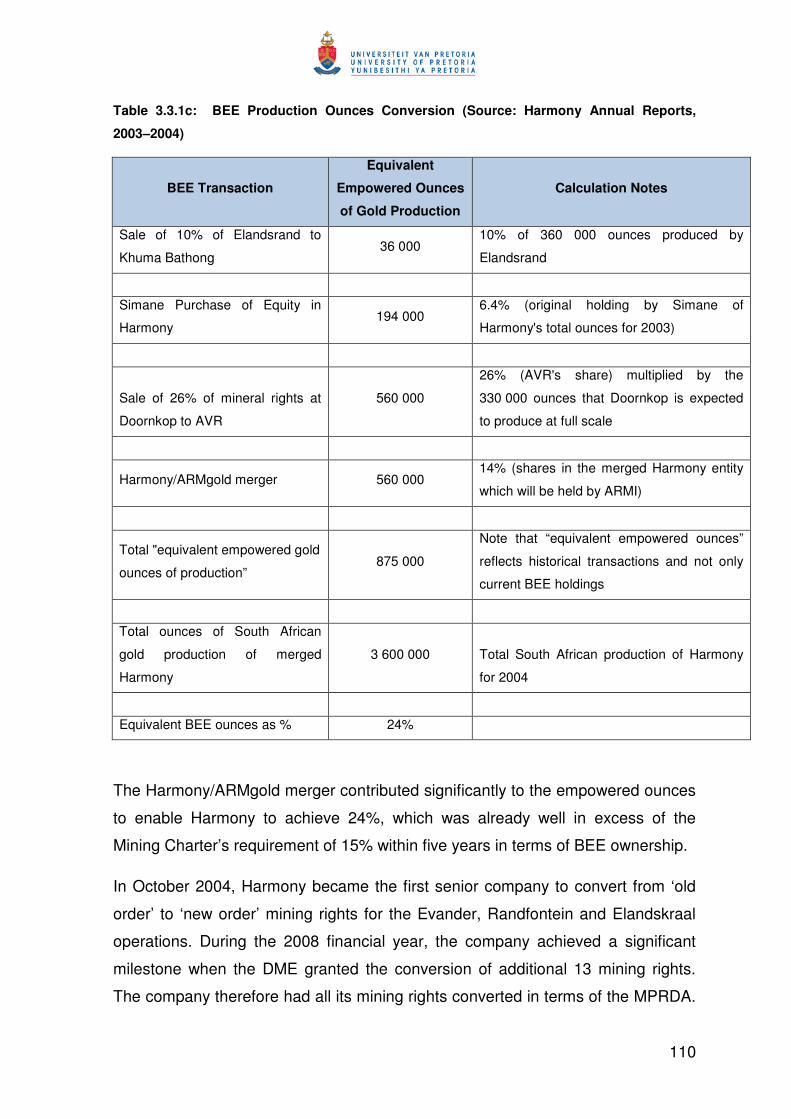
110
Table 3.3.1c: BEE Production Ounces Conversion (Source: Harmony Annual Reports,
2003–2004)
BEE Transaction
Equivalent
Empowered Ounces
of Gold Production
Calculation Notes
Sale of 10% of Elandsrand to
Khuma Bathong 36 000
10% of 360 000 ounces produced by
Elandsrand
Simane Purchase of Equity in
Harmony 194 000
6.4% (original holding by Simane of
Harmony's total ounces for 2003)
Sale of 26% of mineral rights at
Doornkop to AVR
560 000
26% (AVR's share) multiplied by the
330 000 ounces that Doornkop is expected
to produce at full scale
Harmony/ARMgold merger 560 000 14% (shares in the merged Harmony entity
which will be held by ARMI)
Total "equivalent empowered gold
ounces of production” 875 000
Note that “equivalent empowered ounces”
reflects historical transactions and not only
current BEE holdings
Total ounces of South African
gold production of merged
Harmony
3 600 000 Total South African production of Harmony
for 2004
Equivalent BEE ounces as % 24%
The Harmony/ARMgold merger contributed significantly to the empowered ounces
to enable Harmony to achieve 24%, which was already well in excess of the
Mining Charter’s requirement of 15% within five years in terms of BEE ownership.
In October 2004, Harmony became the first senior company to convert from ‘old
order’ to ‘new order’ mining rights for the Evander, Randfontein and Elandskraal
operations. During the 2008 financial year, the company achieved a significant
milestone when the DME granted the conversion of additional 13 mining rights.
The company therefore had all its mining rights converted in terms of the MPRDA.
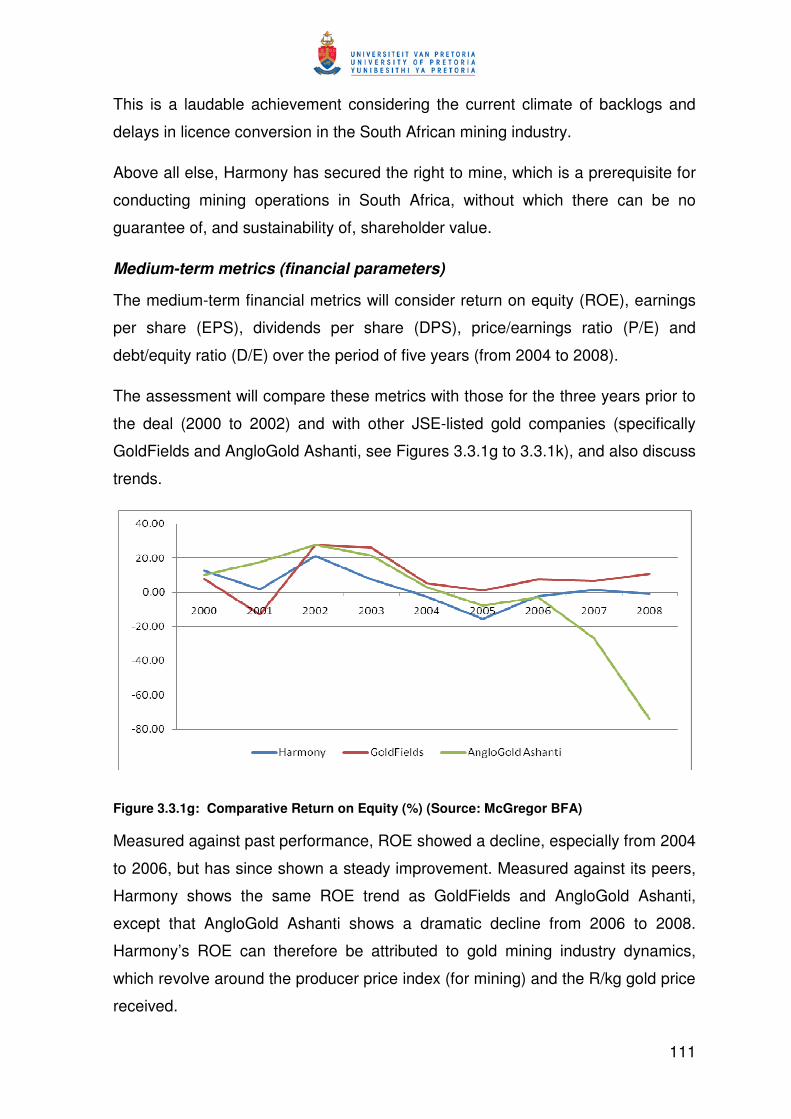
111
This is a laudable achievement considering the current climate of backlogs and
delays in licence conversion in the South African mining industry.
Above all else, Harmony has secured the right to mine, which is a prerequisite for
conducting mining operations in South Africa, without which there can be no
guarantee of, and sustainability of, shareholder value.
Medium-term metrics (financial parameters)
The medium-term financial metrics will consider return on equity (ROE), earnings
per share (EPS), dividends per share (DPS), price/earnings ratio (P/E) and
debt/equity ratio (D/E) over the period of five years (from 2004 to 2008).
The assessment will compare these metrics with those for the three years prior to
the deal (2000 to 2002) and with other JSE-listed gold companies (specifically
GoldFields and AngloGold Ashanti, see Figures 3.3.1g to 3.3.1k), and also discuss
trends.
Figure 3.3.1g: Comparative Return on Equity (%) (Source: McGregor BFA)
Measured against past performance, ROE showed a decline, especially from 2004
to 2006, but has since shown a steady improvement. Measured against its peers,
Harmony shows the same ROE trend as GoldFields and AngloGold Ashanti,
except that AngloGold Ashanti shows a dramatic decline from 2006 to 2008.
Harmony’s ROE can therefore be attributed to gold mining industry dynamics,
which revolve around the producer price index (for mining) and the R/kg gold price
received.
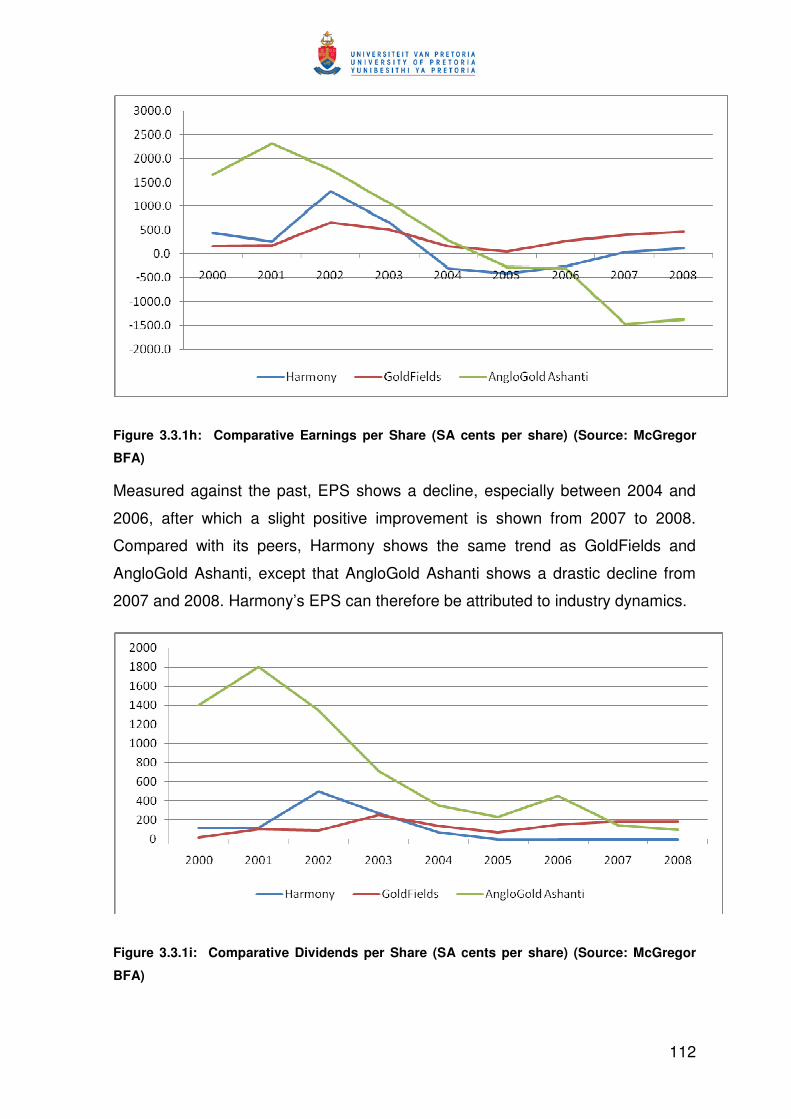
112
Figure 3.3.1h: Comparative Earnings per Share (SA cents per share) (Source: McGregor
BFA)
Measured against the past, EPS shows a decline, especially between 2004 and
2006, after which a slight positive improvement is shown from 2007 to 2008.
Compared with its peers, Harmony shows the same trend as GoldFields and
AngloGold Ashanti, except that AngloGold Ashanti shows a drastic decline from
2007 and 2008. Harmony’s EPS can therefore be attributed to industry dynamics.
Figure 3.3.1i: Comparative Dividends per Share (SA cents per share) (Source: McGregor
BFA)

113
Harmony’s dividend per share has shown a decline compared with the past, with
no dividends declared from 2005 to 2008, whereas its peers did pay dividends
over the same period. With huge capital projects currently in place and the
accompanying capital expenditure requirements, this may have been a prudent
thing to do.
Figure 3.3.1j: Comparative Price/Earnings Ratio (Source: McGregor BFA)
Harmony’s P/E ratio showed a decline from 2004 to 2006, and then increased
considerably in 2007 and 2008. Its performance relative to that of its peers is
indicative of industry dynamics, underperforming GoldFields from 2004 to 2006,
and overperforming its peers in 2007 and 2008.
Figure 3.3.1k: Comparative Debt/Equity Ratio (Source: McGregor BFA)

114
Despite its huge capital expansion programme, Harmony has managed to reduce
its debt to a reasonable level. However, it had to dispose of assets (GoldFields
shares, Orkney, Randfontein Cooke operations, etc.) to raise cash, which has
impacted severely on its gold production. Compared with those of its peers, its D/E
ratio is reasonable. The decision to raise cash through the disposal of “less
profitable assets” as opposed to share issue has prevented share dilution. This
should have a positive impact on its EPS and P/E ratio in the future.
It would also have been expensive to raise cash through a share issue,
considering Harmony’s share price performance. Moreover, the current global
financial market makes it difficult to secure debt.
Overall deal value assessment
In terms of deal objectives, the merger did create the required empowerment
credentials for the renewal of old order licences. Harmony’s further commitment to
dispose of its 20% stake in ARM to black empowerment interests additionally
underpins its proactive commitment to transformation in the South African mining
industry. Even though, in hindsight, the 20% could have yielded good returns
judging on the performance of ARM over the past five years, good business
decisions do not always entail monetary benefit. They are also about wealth
maximisation (which involves all stakeholders) as opposed to profit maximisation
(which focuses on shareholders only).
In terms of production growth through CONOPs, operational improvements and
projects to achieve 4 million ounces annual production, Harmony has never been
able to achieve this objective to date. Its production forecast over the next eight
years indicates a maximum annual production of about 3.5 million ounces per
annum. This is shown in Figure 3.3.1l.

115
Figure 3.3.1l: Harmony’s Production Forecast (Source: Harmony Annual Report 2006)
In terms of improvement in earnings, Harmony’s performance has been mixed.
The period between 2004 and 2006 was disappointing, while the period between
2007 and 2008 shows some improvements. This performance is more of a
reflection of industry trends between 2004 and 2006 when costs escalated with
the R/kg gold price actually declining from about R96 000/kg to about R85 000/kg
in 2004 and 2005, before rising again in the later stages of 2006. This
performance is also mirrored by its peers.
Harmony, however, lost the opportunity to establish its key strategic differentiator
(cost focus) which was critical for survival between 2004 and 2006. Its cost focus
was not strong enough, and therefore it lost the opportunity to keep its marginal
mines profitable and even acquire more marginal mines from its competitors. In
essence, Harmony’s business philosophy of acquiring marginal mines and turning
them into profitable mines was brought into question when it had to sell ‘marginal
mines’ itself.
In terms of creating a large resource base, Harmony achieved that objective, but
more value would have been created if more resources could have been moved
into the reserve category between 2004 and 2008 through improved cut-off
grades, more development and exploration.
116
In terms of short-term metrics (DVA), the market sentiment was very positive and
caused a substantial increase in the market capital of the two companies in the
short term.
In terms of non-financial indicators, Harmony had access to quality orebodies,
access to some skills and was able to comply well with the legislative
requirements of the MPRDA. There was no substantial improvement in its
operating processes (due to CONOPs), no growth in gold production and not
much operational improvement in terms of the unit cost in R/kg of gold produced.
The unit cost was, however, affected by rising inflation and lower gold production,
partly due to the lack of adequate electricity supply from Eskom and safety
interventions by the DME.
In terms of the financial indicators of ROE, EPS, DPS, P/E ratio and D/E ratio,
Harmony’s performance was largely due to industry dynamics and is reflected in
the performance of its peers over the same period.
Long-term outlook (next five years)
Harmony has secured mining licences for all its operations. It has restructured its
balance sheet and looks healthy from a debt point of view. It has access to quality
orebodies and has exciting growth projects that are moving towards
commissioning. There was some improvement in unit cost in 2008 and that focus,
if maintained, could see further improvement in the next five years relative to the
industry. Gold is heading for a bullish period at the current dollar price.
The next five years may be an exciting time for Harmony if costs are kept well
below the industry average and growth projects are commissioned on schedule.
This will improve earnings and shareholders can expect a substantial
improvement in ROE, EPS, DPS and P/E ratio.
Failure to capitalise on this moment will lead to value destruction for shareholders.
Summary
In summary, the merger has created mixed results in terms of shareholder value.
Most of the underperformance was due to industry dynamics as opposed to lack of
management control. This is echoed by the performance of GoldFields and

117
AngloGold Ashanti. For the merger to create value from the financial point of view,
Harmony should outperform the industry in most of the five financial indicators
used, or have a trend that is better than that of the past, or both. This has not
been the case to date.
However, the merger has still presented Harmony with a great opportunity to grow
back its production profile through existing projects, improve the bottom line
through cost focus and position itself for the bullish period that gold is expected to
experience in the next five years.
In conclusion, the merger definitely added some value from the black economic
empowerment point of view, and may still add enormous value to Harmony in the
next five years, despite the numerous challenges that it posed and the
environment in which Harmony has operated between 2004 and 2006.
3.3.2 Value Assessment of African Rainbow Minerals
The formation and history of African Rainbow Minerals (ARM) has been described
in detail already. Most of its operations are joint ventures, with joint management
of the assets. Prior to the Harmony merger, the company was already in a 50/50
joint venture at Modikwa Platinum with Anglo Platinum. The acquisition of a stake
in Avmin resulted in a joint venture with Assore, involving iron ore and manganese
assets. The company then went into a joint venture with Norlisk in nickel at
Nkomati. In 2007, ARM purchased a 20.6% stake in XStrata Coal South Africa in a
BEE deal. In 2009, ARM entered into a joint venture with Vale involving its copper
and exploration assets in Zambia and the Democratic Republic of Congo. It has
continued to retain its interest in Harmony Gold as the largest shareholder. The
company has since grown from a market capitalisation of R1.1 billion in 2004 to
R7.5 billion in 2008, approximately a sevenfold increase.
It has therefore become a diversified BEE company in various commodities. It is
fairly unique in terms of its asset composition and is a JSE-listed South African
company, with most of its assets being local, making it a bit similar for
benchmarking with Exxaro Resources.

118
Value assessment criteria
The non-financial value assessment for ARM will involve its growth in production
and project pipeline to sustain and increase current production levels for coal,
platinum, iron ore, chrome and manganese. It will also consider the cash operating
cost of some of the key assets, especially in platinum, iron ore and manganese
and it will involve skills acquisition through the joint ventures.
The financial criteria will be ROE, EPS, DPS, P/E ratio and D/E ratio (see
Figures 3.3.2a to 3.3.2g). Although a suitable benchmark would be Exxaro, it has
unfortunately operated for only about two years. Hence the trend over the past
four years and other relevant financial indicators will be used to assess value
creation. Platinum, manganese and iron ore are the major sources of earnings for
ARM, and hence the operational performance will focus only on those assets.
Non-financial assessment
Total iron ore sales increased from 5.9 million tons in 2006 to 6.6 million tons in
2008, and the approval of the Khumani expansion, adding an additional 6 million
tons per annum, will contribute significantly to the growth profile. Total unit cost in
sales per ton increased from R144.6/ton in 2006 to R257.7/ton in 2008. Iron ore
sales therefore increased by about 11%, while the unit cost increased by 78%.
This is the combined performance of the Beeshoek and Khumani iron ore
operations. Khumani, which is still in ramp-up phase, accounts for some of the unit
cost increase.
Figure 3.3.2a: ARM Manganese and Iron Ore Sales (000 tons) (Source: ARM Annual
Reports, 2006-2008)

119
Manganese ore sales increased from 1.7 million tons in 2006 to 3.7 million tons in
2008, with the unit cost increasing from R349/ton to R555/ton over the same
period. Manganese sales therefore increased by 121% and the unit cost by 59%
between 2006 and 2008. The increase in unit cost is quite substantial considering
that an increase in volume usually brings the benefit of unit cost reduction.
Figure 3.3.2b: ARM Total Cost per Sales Ton (R/t) (Source: ARM Annual Reports, 2006–
2008)
Total platinum group metals (PGM) production increased from about
343 000 ounces in 2006 to about 550 000 ounces in 2008, with an expected
further increase in production when the Two Rivers operation ramps up in 2010,
with Nkomati also delivering a substantial increase in nickel production when the
Nkomati Project ramps up in 2010.

120
Figure 3.3.2c: ARM Platinum Group Metals Production (ounces) (Source: ARM Annual
Reports, 2006–2008)
In terms of cash operating cost in R/ton, Modikwa Platinum experienced an
increase in unit cost of about 35% between 2005 and 2008, from R398/ton to
R538/ton. Two Rivers Platinum is ramping up production and the unit cost is
expected to stabilise once it achieves full-scale production.
Figure 3.3.2d: ARM Cash Operating Cost (R/ton) (Source: ARM Annual Reports, 2006–2008)

121
Financial assessment
Return on equity has shown a very good trend, increasing from about 6% in 2006
to 30% in 2008, which is quite high compared with that of most mining stocks
listed on the JSE.
Figure 3.3.2e: ARM Return on Equity (%) (Source: McGregor BFA)
Earnings per share and dividends per share increased substantially between 2006
and 2008. The trends are very encouraging.
Figure 3.3.2f: ARM Earnings per Share and Dividends per Share (cents) (Source: McGregor
BFA)

122
Due the number and size of growth projects, the need for cash injection has led to
an increase in debt level, with the D/E ratio increasing from 0.3 in 2006 to 0.45 in
2008 (an increase of about 50%).
Figure 3.3.2g: ARM Debt/Equity Ratio (Source: McGregor BFA)
Overall assessment
In terms of non-financial parameters, the joint partnership has offered ARM an
opportunity to source skills from world-class organisations such as Anglo
Platinum, Norlisk, Assore and XStrata through joint management. Production and
growth have been promising in all the commodities, with growth projects delivering
on schedule.
The only area of concern is unit cost performance. The increases are quite high,
even in an environment of high volume increases. In an environment of a steep
decline in the prices of platinum group metals, manganese, chrome and iron ore,
cost focus will be very critical for ARM to survive and to remain competitive.
In terms of financial metrics, all the parameters look good and trends are positive
in most cases. Overall, the non-financial and financial parameters look good, and
the acquisition of the assets of Avmin has definitely added value for the
shareholders of ARM. The company currently has cash assets of about
R2.6 billion as at financial year-end 2008, which places it in a good position to deal

123
with any future cash problems as the prices of iron ore, manganese and iron ore
decline.
Long-term outlook (next five years)
The current global credit crunch and the decline in the demand from China for
mineral commodities poses a huge challenge to mining companies. ARM must
consolidate on the foundation laid over the past five years through its adequate
diversification of commodities and strategic partnerships, and its delivery on
operational performance.
Its current cash and net debt position allows it to make further acquisitions, at a
time when most mining assets are cheaper and have a market value that is far
below their book value. If the focus on cost is maintained, and projects are
delivered on schedule (with logistical issues on coal, iron ore and manganese rail
transport expected to improve based on Transnet’s capital programme), the next
five years could be exciting.
3.3.3 Value Assessment of AngloGold / Ashanti GoldFields Merger
Background to the deal
AngloGold was formed in June 1998 through the consolidation of the gold
interests of Anglo American Corporation of South Africa (AAC) and its associated
companies into a single, focused, independent gold mining company. Its
operations were all in South Africa at that time, consisting of the Vaal Reef
operations in Klerksdorp, the Free State operations in the Free State, and the
Western Deep Levels and Elandsrand operations in Carletonville.
These operations produced about 5.4 million ounces in 2000. Production was,
however, on the decline mainly due to depletion of reserves and the technical
difficulties involved in accessing deeper portions of the resource. Gold production
in South Africa declined to 3.4 million ounces in 2002, and AngloGold needed to
look for production outside South Africa to replace its depleting reserves, with the
possibility of growing production even further.
Hence, subsequent to its formation in 1998, the company embarked on a series of
acquisitions. The acquisitions included the following assets from various countries:

124
• Minorco Gold in North and South America in March 1999
• Acacia Resources in Australia in December 1999
• A 40% interest in Morila Mine in Mali purchased from Randgold
Resources in July 2000
• A 50% interest in Geita Mine in Tanzania purchased from Ashanti
GoldFields in December 2000
AngloGold also disposed of some of its assets, including the following assets in
South Africa:
• The sale of Vaal River No. 2 Shaft to ARMgold for US$1 million in January
1998
• The sale of Deelkraal and Elandsrand mines to Harmony in April 2001 for
US$109 million
• The sale of its Free State assets (excluding Beatrix mine) to ARM and
Harmony in January 2002 for US$229 million
The company also disposed of some assets in Australia and the US. Between
2000 and 2002, its total production (with the combined effect of acquisitions and
asset disposals) fell by about 23% from 7.2 million ounces to 5.6 million ounces.
Ashanti GoldFields Corporation Limited was founded in 1897 to develop a mining
concession in the area of the operations of Obuasi. In 1969, Ashanti became a
wholly owned subsidiary of Lonrho Plc (later to become Lonmin Plc). The
government of Ghana acquired 20% of Ashanti in exchange for the extension of
Ashanti’s mining lease over its entire concession area. In 1972, the government of
Ghana formed a Ghanaian company to take over the assets, business and
functions of Ashanti by holding a 55% stake in the company.
In 1996, Ashanti acquired controlling interests in the Ayanfuri, Bibiani, Iduapriem
(in Ghana), Siguiri (in Guinea) and Freda-Rebecca (in Zimbabwe) concessions, as
well as an interest in what was then the Geita exploration concession in Tanzania.
In 2000, the Geita mine was developed and Anglo acquired 50% in a joint venture.
125
In 2000, Ashanti also acquired a 90% interest in the Tebirebie mine (in Ghana),
adjacent to the Iduapriem concession. Ashanti’s gold production was about
1.7 million ounces at that time and this remained fairly constant up to 2003.
However, Ashanti undertook a hedging exercise in 2002, which impacted severely
on its liquidity following the rise in the gold price. Ashanti’s hedge book was a
serious threat, and the company also lacked funds for sustaining capital
programmes and future growth prospects.
With AngloGold’s production on a continuous decline, the purpose of the merger
with Ashanti was to position the combined company on the global scale of top
producers and provide opportunities for growth. AngloGold’s business philosophy
also involved hedging, and a substantial amount of its production had been sold
forward. Hedging is the forward selling of gold at a predetermined price to
guarantee sales at a known price, and is used mainly in periods of high volatility in
the gold price. If the future spot price of gold improves, the hedge book becomes a
loss, and the opposite happens when the future spot price of gold declines.
Merger description
On 4 August 2003, the two companies announced the merger to create a
gold-focused leading global gold producer. The combined group would have the
largest reserve base of any gold company, a significant and well-diversified
production base, a highly attractive development and exploration portfolio, and the
financial and technical resources to maximise organic growth from the existing
asset base and to pursue further acquisition opportunities.
The terms of the merger were as follows:
• There would be 0.26 AngloGold shares for every Ashanti share.
• A 12% premium based on the closing share price on 15 May 2003 and a
34% premium based on the 30-day average price prior to 15 May 2003.
• The merged company would be called AngloGold Ashanti.
• AngloGold shareholders would own approximately 87% of the combined
group and existing Ashanti shareholders would own approximately 13%.
126
• The merged company would have a market capital of about US$8.3
billion.
• The merged company would have its headquarters based in
Johannesburg.
Merger objectives
The objectives and expected benefits from the merger were as follows:
• Growth/Upside Potential: An enhanced production profile was expected
from existing brownfields opportunities, with a strong exploration and
land-holding portfolio. AngloGold’s proven ability in the development of
deep-level projects would be utilised in the development of the Obuasi
Deeps project, where a scoping study had been undertaken to review the
mine’s potential to 100 level, as well as alternative production rates,
infrastructure options and operating and capital projections. The Obuasi
Deeps project would be allocated an exploration expenditure of US$44
million over five years to further delineate the target zones, and the total
capital expenditure for the project was expected to be about US$570
million (in 2003 terms).
• Synergies: The merger was expected to create financial synergy benefits
of approximately US$15 million per annum through the consolidation of
the Geita ownership.
• Scale: The merged company would become number one in reserves
(93.2 million ounces) – an increase of about 31% for AngloGold. In terms
of production, the merger would position it as one of the world’s largest
gold producers with about 7.3 million ounces – an increase of about 27%
in AngloGold’s production.
• Diversification: The company would have a well-diversified asset
portfolio comprising open-pit and underground operations from a total of
24 operations across 11 countries in the principal gold-producing regions
of the world.
127
• Investment appeal: In terms of size, the combined company would have
a market capitalisation of about US$8.3 billion, with an increase in
share-trading liquidity.
• Long-life assets: Six operations in five countries with combined reserves
of 45.1 million ounces had life-of-mine plans of at least 15 years.
• Hedging: The combined hedge book would have a net delta of
14.7 million ounces as at 30 June 2003, with the combined marked-to-
market valuation of negative US$327 million.
In summary, Ashanti shareholders benefited through a 34% premium, the inflow of
cash to address existing capital constraints for future development and high
dividend yield (since Ashanti previously did not pay dividends as opposed to
AngloGold Ashanti).
For AngloGold, the benefits were the result of a substantial increase in reserves
and gold production, market capitalisation, a reduction in cash cost due to
synergies, risk diversification geographically and enhanced earnings from
improved operational performance.
Value creation parameters applicable
This deal will be assessed on the basis of value creation for AngloGold Ashanti
shareholders and the following value creation indicators or parameters will be
used:
• Merger objectives in terms of what shareholders expected and what has
been achieved.
• The initial market sentiments to the deal will not be used because of lack
of information on Ashanti.
• Non-financial parameters, such as access to quality orebodies, access to
quality skills, better operating processes (e.g. deep mining technology),
growth in production, improvement in operational efficiency, etc. The
performance of the Obuasi operation in particular will be discussed,

128
because this affects the potential of Obuasi Deeps which forms part of the
key growth and expansion.
• Financial parameters, such as return on equity (ROE), earnings per share
(EPS), dividends per share (DPS), price/earnings ratio (P/E) and
debt/equity ratio (D/E). The management of the hedge book and its impact
will also be discussed.
• Depending on the information available and where applicable, the non-
financial parameters will be measured on past performance compared with
current performance. The financial parameters will be measured on past
performance and also compared with industry performance.
• The first five years after the deal gives an indication of the medium-term
value created. Most of the discussion will therefore be based on value
created in the medium term from 2004 to 2008. However, an indication will
also be given of the prospects for the next five years for long-term value
creation to be realised. It must be noted though that some deals may take
less or more than ten years to realise value, but ten years has been
chosen as a reasonable period for this study
Medium-term (non-financials)
In terms of growth potential from Obuasi Deeps, an annual exploration
expenditure of US$44 million was committed from 2004 to 2008. The exploration
work, which targeted gold potential below the 50 level of the then current mining
depth, was, however, not yet completed. The feasibility study on the viability of
Obuasi Deeps was therefore yet to be done.
Current exploration work did, however, increase resources at Obuasi by about
4 million ounces, from 38.3 million in 2003 to 42.2 million in 2008. By contrast,
reserves were reduced by about 4 million ounces over the same period (including
ore depletions). This was due to the substantial increase in the pay limit at Obuasi
from 6.06 g/t in 2004 to 9.35 g/t in 2008, an increase of 54%, mainly due to cost
pressures. This has the potential to affect the viability of Obuasi Deeps.
Figure 3.3.3a illustrates the pay limits from 2004 to 2008 at Obuasi.

129
�
�
Figure 3.3.3a: Pay Limits at Obuasi in grams/ton (Source: Ashanti GoldFields Annual
Reports 2004–2008)
The cash operating cost at Obuasi increased from US$305/oz (dollars per ounce)
in 2004 to US$633/oz in 2008 – an increase of 108%. This should be compared
with the group’s (AngloGold Ashanti) cash operating cost which increased by 66%
over the same period, from US$268/oz in 2004 to US$444/oz in 2008. Prior to the
deal, the cash operating cost had decreased from US$208/oz in 2000 to
US$198/oz in 2002. The effect of the depreciation of the local currency against the
dollar could have been a contributing factor.
The deal also expected cost savings from synergies at the Geita mine (Tanzania)
of about US$20/oz, based on the deal assumption of US$15 million annual
savings and Geita mine’s average annual production of about 0.6 million ounces.
The unit cost (cash operating cost) at Geita did, however, increase from
US$170/oz in 2003 to US$728/oz in 2008 – a more than fourfold increase. By
contrast, in the period prior to the deal, the cash operating cost reduced from
US$198/oz in 2000 to US$163/oz in 2002. The major cost increase is attributed to
a 46% decline in gold production at Geita and inflationary cost pressures. The
effect of depreciation of the local currency against the dollar could also be a
contributing factor. The mining industry as a whole experienced cost pressures
from 2004 to 2008. However, AngloGold Ashanti more than doubled its unit cost

130
from 2003 to 2006 compared with Harmony, which experienced an increase of
about 55% in unit cost over the same period.
Figure 3.3.3b shows the cash cost of Obuasi, Geita and AngloGold Ashanti from
2000 to 2008. The cash costs of Obuasi and Geita are well above group average
after the merger.
�
Figure 3.3.3b: Cash Cost of AngloGold Ashanti, Obuasi and Geita in US$/oz (dollars per
ounce)
Sources: Annual Reports, Ashanti GoldFields 2000–2003 and AngloGold Ashanti 2004–2008
It can be seen that cash costs were fairly flat from 2000 to 2003, followed by a
dramatic increase from 2004 to 2008, with Obuasi and Geita showing higher
trends, which could, among others, be influenced by the depreciation of the local
currency against the dollar. The merger has therefore not yielded any benefits in
operational efficiency in unit cost terms.
In terms of gold production, group production declined from 6 million ounces in
2004 to about 5 million ounces in 2008. Production at Obuasi and Geita both
showed a decline from 2004 to 2008. The major part of the group’s gold
production decline is due to the South African operations, which declined from
2.9 million ounces to 2.1 million ounces over the same period.

131
Even though the merger increased the combined group’s gold production to over
6 million ounces in 2004, this declined to 5 million ounces in 2008. The
expectation that the merger would grow sustainable production for AngloGold,
which had seen a decline in gold production of about 1.5 million ounces between
2000 and 2003 prior to the merger, has not been fulfilled. The total production
attributable from Ashanti GoldFields has also declined. The merger did, however,
account for about 1 million ounces (about 18%) of group production between 2004
and 2008. This is illustrated in Table 3.3.3a and Figure 3.3.1c. The Ashanti
GoldFields production is based on production that would have been attributed to
Ashanti GoldFields in the absence of the merger, and this involves production
from Obuasi, Siguiri and 50% of Geita.
Table 3.3.3a: Ashanti Gold Field’s Post-Merger Contribution to Group Production
(000 ounces)
������ ����� ����� ����� ���� ���� ����� ����� ��� � �����
������������������ ��� ����� ����� ������ ������ ������ ����� �� � �����
� ������ ��� ���� � � ��� ��� ��� � � ��� � �
��������� !��������� ��� ���� ���� �� � � ���� �� � �� � ����
"������� � � ��� ��� ���� ���� ���� � �� ��
������ � � ��� ���� ���� � �� ��� ��� � � ���
#������� �� ��� ���� ��� �� ��� ���� ���� �
������������$������ ������ ���� ����� ������ ������ ����� ������ � �� ������
�������%��&������������'( )� � � � � *�� ��*� ��*�� � *�� � * � ��*��
Source: Annual Reports, Ashanti GoldFields 2000–2003 and AngloGold Ashanti 2004–2008
�
�

132
�
Figure 3.3.3c: Gold Production from the Various Operations Involved in the Merger in (000
ounces)
Sources: Annual Reports, Ashanti GoldFields, 2000–2003 and AngloGold Ashanti, 2004–2008
In terms of diversification, AngloGold Ashanti produces about 20% of its gold from
Ghana, Tanzania and Guinea, which involves both open-pit and underground
operations. Compared with the South African investment climate, this
diversification has not given any major advantage to AngloGold Ashanti. Most of
the concerns posed by the MPRDA in 2003 have been addressed by the
government. Diversification also comes with risk in terms of regional spread as a
result of cultural differences, political uncertainties and the management time
required to supervise effectively across countries. The continent has also
witnessed unstable and unpredictable developments in investment climates in
countries such as Zimbabwe, the Democratic Republic of Congo and Zambia over
the past several years.
In terms of quality assets, the Obuasi and Geita operations were reported to be
quality assets having over 15 years’ life, with the highest production compared
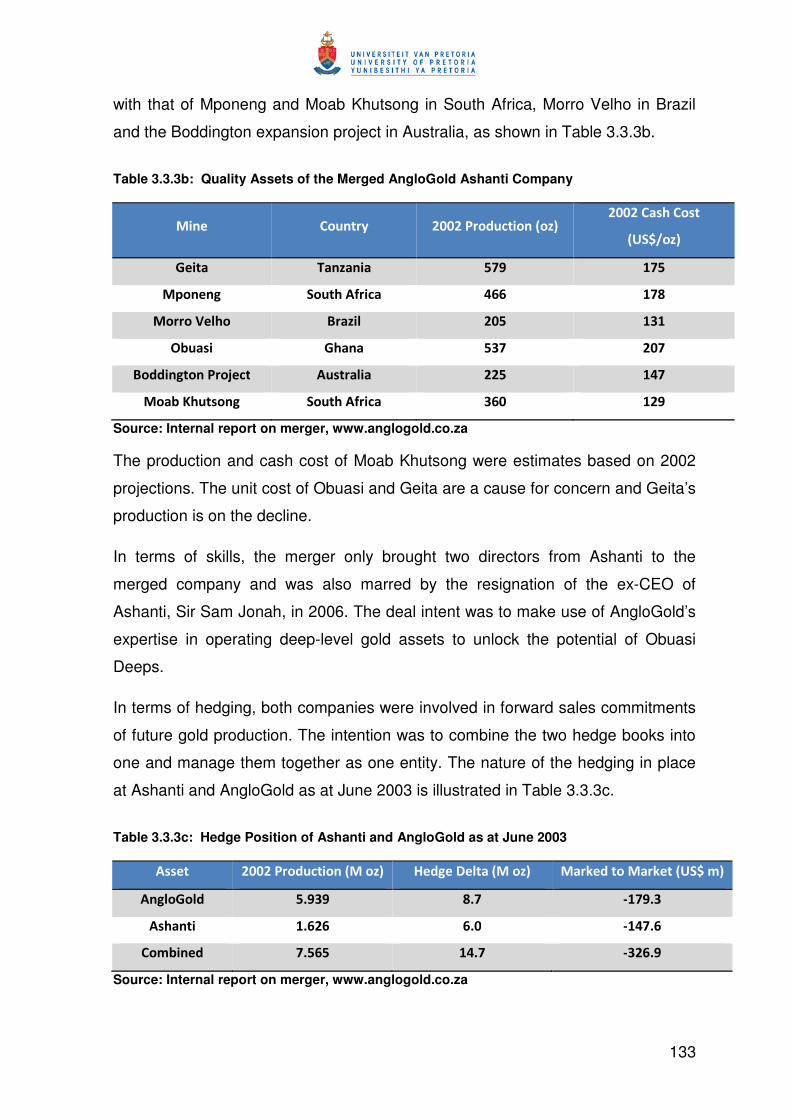
133
with that of Mponeng and Moab Khutsong in South Africa, Morro Velho in Brazil
and the Boddington expansion project in Australia, as shown in Table 3.3.3b.
Table 3.3.3b: Quality Assets of the Merged AngloGold Ashanti Company
+ ���� ,�����-� �����.����&�����'�/)������,����,����
'0 #1 �/)�
������ !��/����� � �� � ��
+ ������� #������2��&�� ��� � ��
+ �����3����� "��/��� ���� ���
� ������ ������ � � �� �
"����������.��4�&�� ���������� ���� � �
+ ����5�������� #������2��&�� ��� ����
Source: Internal report on merger, www.anglogold.co.za
The production and cash cost of Moab Khutsong were estimates based on 2002
projections. The unit cost of Obuasi and Geita are a cause for concern and Geita’s
production is on the decline.
In terms of skills, the merger only brought two directors from Ashanti to the
merged company and was also marred by the resignation of the ex-CEO of
Ashanti, Sir Sam Jonah, in 2006. The deal intent was to make use of AngloGold’s
expertise in operating deep-level gold assets to unlock the potential of Obuasi
Deeps.
In terms of hedging, both companies were involved in forward sales commitments
of future gold production. The intention was to combine the two hedge books into
one and manage them together as one entity. The nature of the hedging in place
at Ashanti and AngloGold as at June 2003 is illustrated in Table 3.3.3c.
Table 3.3.3c: Hedge Position of Ashanti and AngloGold as at June 2003�
������ �����.����&�����'+ ��/)� 6�����7�����'+ ��/)� + ��8������+ ��8���'0 #1�� )�
���������� �*��� �* � 9� �*�
�������� �*���� �*�� 9� *��
,�� ������ *���� �* � 9��*��
Source: Internal report on merger, www.anglogold.co.za�

134
The hedge delta shows the gold ounces that the company must buy to neutralise
the portfolio position based on the spot price at that time. The marked-to-market
adjustment is the value lost or gained as a result of the spot price relative to the
hedged price. When the spot price is lower than the hedged price, value is
accrued and the marked-to-market adjustment is positive and vice versa.
Hence at the time of the deal, the hedge book resulted in a net loss of US$326.9
million for the merged company. The effect on the spot price and the hedge book
of Ashanti as at December 2000 is illustrated in Table 3.3.3d.
Table 3.3.3d: Ashanti GoldFields Hedge Book Sensitivities as at December 2000
Spot Price (US$) Ounces Delivered
(M oz)
Average Price
(US$/oz)
Cash flow
(US$ million)
���� �*��� �� ���*� �
��� �*���� ��� ��*� �
��� *���� ��� �*��
��� �*���� �� 9��*���
Source: Ashanti GoldFields Annual Report 2000
The number of ounces delivered indicates how many ounces Ashanti would sell
through forward sales, as well as calls and puts, bought and sold, which would be
exercised under the various assumed spot prices. The effects of all lease rate–
swap rate sets have been included in the average price and cash flows. In
essence, a one dollar (US$1) movement in the spot price of gold results in a
US$6.75 million movement in cash flow (marked-to-market value).
The effect of the hedge book from 2005 to 2008 can be summarised as follows,
based on AngloGold Ashanti’s annual reports:
• As at year end December 2005, the net delta hedge was 10.84 million
ounces valued at a spot price of gold of US$517/oz and the marked-to-
market value as at that date was negative US$1.941 billion.
• As at year end December 2006, the net delta hedge was 10.16 million
ounces valued at a spot price of gold of US$636/oz and the marked-to-
market value was negative US$2.903 billion.

135
• As at year end December 2007, the net delta hedge was 10.39 million
ounces valued at a spot price of gold of US$836/oz and the marked-to-
market value was negative US$4.27 billion.
• Following the raising of US$1.7 billion in capital through a rights offer, the
net delta hedge was reduced from 11.28 million ounces to 5.22 million
ounces, using a gold price of US$872/oz and the marked-to-market value
was negative US$2.5 billion as at year end December 2008.
The hedge book had a major impact on the cash flow of the merged company, and
will continue to impact the net delta hedge over the next five years as the spot
price of gold continues to increase.
Medium-term metrics (financial parameters)
The medium-term financial metrics will consider return on equity (ROE), earnings
per share (EPS), dividends per share (DPS), price/earnings ratio (P/E) and
debt/equity ratio (D/E) over the period of five years (from 2004 to 2008).
The assessment will compare it with the three years prior to the deal (2000 to
2002), with other JSE-listed gold companies (specifically GoldFields and
Harmony) and also discuss trends (see Figures 3.3.3d to 3.3.3h).
�
Figure 3.3.3d: Comparison of Return on Equity (%) (Source: McGregor BFA)

136
Measured against past performance, ROE showed a steep decline, especially
from 2006 to 2008. Measured against its peers, AngloGold Ashanti showed the
same ROE trend as GoldFields and Harmony between 2003 and 2006, with a
steep decline from 2006 to 2008. AngloGold Ashanti’s ROE underperformed its
industry peers. Shareholders of AngloGold Ashanti would therefore have had
better returns had they invested in GoldFields or Harmony in 2007 and 2008.
�
Figure 3.3.3e: Earnings per Share (South African cents per share) (Source: McGregor BFA)
Measured against the past, EPS showed a decline from 2003 to 2007, after which
a slight positive improvement was shown in 2008. Compared with its peers,
AngloGold Ashanti shows a similar trend to GoldFields and Harmony between
2003 and 2004, but then shows a drastic decline from 2005 to 2008 while the EPS
of its peers improves over the same period. The company’s EPS is worse than
that of its industry peers. Its earnings per share were better than those of its peers
prior to the deal and worse from 2005 to 2008.

137
�
Figure 3.3.3f: Dividends per Share (South African cents per share) (Source: McGregor BFA)
AngloGold Ashanti’s dividends per share showed a decline compared with the
past, showing a similar trend to its peers between 2003 and 2005. However,
between 2006 and 2008, it slightly underperformed compared with GoldFields and
did better than Harmony which has not paid a dividend since 2008. Looking at the
losses incurred since 2006, paying a dividend may not be a prudent thing to do,
especially when assets have been disposed of and cash has been raised to
manage the hedge book.
�
�
Figure 3.3.3g: Price/Earnings Ratio (Source: McGregor BFA)

138
AngloGold Ashanti’s P/E ratio was significantly lower from 2005 to 2008 compared
with its past. Compared with its peers, its P/E ratio was about the same between
2000 and 2003, but was significantly lower than that of its peers between 2005
and 2008. Compared with its peers, it showed an improvement in trend from 2006
to 2008.
�
Figure 3.3.3h: Debt/Equity Ratio (Source: McGregor BFA)
Compared with the past, AngloGold Ashanti’s D/E ratio has increased almost
twofold, which implies that for every dollar of equity, the company has two dollars
of debt. Compared with its peers, AngloGold Ashanti’s D/E ratio is about fourfold
to sixfold higher. This implies that shareholders in AngloGold Ashanti are highly
exposed to debt, and this has the potential to lead the company into bankruptcy
(when its liabilities exceed its assets) and can also pose solvency problems when
it is not able to service its debt on time.
Debt or equity, or a combination of both, is usually the means through which a
company raises funds for its operations. Normally one would expect a company
with a high D/E ratio to show a higher return on equity, but in the case of
AngloGold Ashanti, it also has the lowest return on equity compared with its peers.
The company has also disposed of assets to raise cash, in addition to acquiring
debt to service its cash requirements. The impact of the hedge book on the
company’s financial ability has been enormous.
139
Overall deal value assessment
In terms of deal objectives, AngloGold Ashanti has not achieved most of the deal
objectives set for the merger. The assets from Ashanti have not provided
opportunities for production growth and have actually shown a decline in
production. The Obuasi Deeps exploration is ongoing and has added considerably
to Obuasi’s resources. However, the pay limit trend of Obuasi is likely to affect the
potential of the project, and less mining reserves could be accounted for below
100 level, unless the pay limit improves.
There was an expected cost benefit of about US$20/oz at Geita due to synergy,
which means one should expect the cost profile at Geita to show an improvement
over past performance. However, on the contrary, the cost profile of Geita is a
cause for concern as the unit cost has increased about fourfold since the merger.
In terms of diversification, the assets in Ghana and Tanzania have not offered any
significant or unique opportunity to AngloGold Ashanti by virtue of their location,
geographically and politically. Despite the fact that Obuasi and Geita were
acquired as long-life assets, Obuasi made a loss of US$126 million and Geita
made a loss of US$181 million in 2008, with disappointing performances in 2006
and 2007. These assets may no longer remain quality assets if these losses are
not curtailed.
Hedging has done severe damage to the financial position of the merged
company. The net delta hedge of gold continued to increase as the spot price of
gold increased substantially from 2003 to 2008. This meant the company had to
use more gold to settle the hedge book requirements as they became due.
Furthermore, actual gold production declined between 2003 and 2008. The net
effect has been a drastic marked-to-market adjustment and resulted in the
company committing most of its annual gold production to manage its hedge book.
Despite the US$1.7 billion cash injection to reduce the hedge book position in
2008, there is still a negative US$2.5 billion outstanding, based on an assumed
spot price of gold of about US$875/oz. Prior to the US$1.7 billion cash injection,
the hedge book was a negative US$4.2 billion, accounting for about 40% of the
market capitalisation of AngloGold Ashanti. At the time of the merger, the hedge

140
book was valued at negative US$326 million, and this grew about fourteen times
(14x) bigger from 2003 to 2008. Ashanti’s portion of the hedge book was about
half in terms of ounces, yet its production was about 25% of that of AngloGold.
This enormous burden has been transferred to the merged company.
Hence shareholders of Ashanti saw the merger as an opportunity to get out of the
financial crisis the hedge book was posing. At the same time AngloGold believed it
could extract more value even with the hedge book concerns, and paid a premium
of about 30% to Ashanti shareholders in the share swap deal.
Considering other non-financial indicators, the deal did not bring any substantial
skills to AngloGold. In terms of operating processes and systems, there is not
much evidence that improved processes and systems were put in place to
enhance the performance of Ashanti’s assets. AngloGold, however, will bring skills
into the Obuasi Deeps feasibility study and, if given the go-ahead, project
execution and operation of the deeper mine will be enhanced using its technical
experience and expertise.
Looking at the financial indicators, AngloGold Ashanti has performed poorly
compared with its past and its industry peers in terms of ROE, EPS, P/E ratio and
D/E ratio. Its payment of a dividend under such dire financial circumstances may
not be prudent, even though it appeases shareholders, considering the cost of
debt in the current global financial crisis. The gradual and eventual exit of its major
shareholder Anglo American over the past three to five years only confirms the
critical state in which the operation is, and the merger has to a large extent
destroyed value for shareholders.
Looking beyond (next five years)
In the next five years, the gold price is set to increase and is likely to stay above
US$1 000 per ounce. This implies that the hedge book delta and the marked-to-
market adjustments will continue to be less favourable.
The production profile in terms of gold ounces produced is likely to follow a
downward trend, as safety and power issues in South Africa continue to affect
underground operations which are getting deeper. Production from Obuasi and
Geita will also be on a decline due to depletion of reserves at Geita and the fact

141
that the Obuasi Deeps underground project will take not less than five years to
commission, if at all, should it get board approval following the feasibility study.
AngloGold Ashanti’s unit cash operating cost in terms of US$/oz increased more
than twofold between 2003 and 2008. The company’s debt position is very high,
and funding requirements will become a challenge, especially with the exit of its
major shareholder, which might send signals of caution to any potential investor.
The next five years will be very challenging years for AngloGold Ashanti and its
performance will be determined by, among others, its ability to manage cost, its
hedge book and the creation of investor confidence as it seeks to rebrand itself
following the exit of Anglo American.
3.3.4 Value Assessment of Kumba Resources/Eyesizwe (Exxaro) Merger
Background to the deal
Iscor Mining was unbundled from its parent company, Iscor Limited (which
became Mittal Steel South Africa in 2005 and is now known as ArcelorMittal) in
2001 and was renamed Kumba Resources; it listed on the JSE in the same year.
At the time of Iscor’s unbundling, its mining division (Iscor Mining, which later
became Kumba Resources) had provided a secure supply of iron ore, coal, zinc
and certain industrial minerals used in steel production, together with its two iron
ore mines and minerals sands which became part of Kumba. Within five years,
Kumba Resources had built a portfolio of assets in Africa, Asia and Australia. Its
key major operations were the iron ore operations at Sishen (Sishen Iron Ore) and
its coal operations (Grootegeluk Colliery) in the Waterberg in Limpopo province.
Eyesizwe Coal was formed in 2000, through a consortium of interested parties, to
bid successfully for certain coal assets of Anglo Coal and Ingwe (now BHP Billiton
Coal SA). These coal assets were operating mines located in Witbank, Kriel,
Middelburg and Belfast, and produced about 23 million tons of coal in 2002. Most
of the coal was thermal coal from its main collieries Matla and Arnot for local
Eskom consumption. Eyesizwe also acquired a significant coal resource in the
Waterberg area with a resource estimate of over 2 billion tons of coal.
142
In 2003, Kumba and Eyesizwe entered into a 50/50 joint venture, to develop the
Kalbasfontein Project. This was a result of a process initiated by the two
companies in 2001 to explore synergies and coal partner opportunities.
In October 2005, the two companies announced a merger deal, which led to the
creation of two separate and focused entities, namely Kumba Iron Ore (to manage
the iron ore assets of Kumba Resources) and Exxaro (which would combine the
coal assets of Eyesizwe with the coal, base metal and mineral sands assets). The
transaction was also aimed at fulfilling the requirements of the Mining Charter in
terms of black economic empowerment.
Details of the transaction
The transaction, as reported at the time of the deal announcement, was
summarised as follows:
(a) 80% of Kumba Resources’ interests in Sishen Iron Ore Company (SIOC)
would be transferred to a newly named company, Kumba Iron Ore.
(b) A new company would be formed (Newco, which later became Exxaro),
which would have significant coal, heavy minerals and zinc assets,
together with a 20% holding in SIOC.
(c) Kumba Resources’ existing shareholders would hold shares in both
companies in proportion to their existing shareholdings in Kumba
Resources prior to the unbundling.
(d) Newco would acquire the entire issue share capital of Eyesizwe Coal (Pty)
Ltd.
(e) All the Eyesizwe Coal shareholders would, through a special purpose
vehicle (SPV), utilise the cash received to subscribe for shares in the BEE
Hold co (holding company).
(f) The BEE Hold co would, through a series of transactions, acquire and
exercise control over 55% of the Newco issued share capital.
(g) A Consortium comprising Eyabantu Capital (Pty) Ltd, Tiso Group and the
South African Women in Mining Association, through SPVs and the IDC,

143
would subscribe for shares in the BEE Holdco through the injection of
either cash or Newco shares.
(h) Shares in Newco and SIOC would be issued to an employee share
ownership scheme (ESOP) and the Northern Cape community.
The transaction would result in a Newco and Kumba Iron Ore (KIO) that would
have different and focused business portfolios. The Newco would:
(a) Have an enterprise value of approximately R16 billion
(b) Become the second largest titanium slag producer and the third largest
titanium feedstock and zircon supplier globally
(c) Become the fourth largest coal producer in South Africa, producing 45
million tons of coal annually.
(d) Have a significant interest in iron ore through its 20% stake in SIOC.
(e) Have a significant greenfield and brownfield project pipeline to exploit its
significant reserve and resource base.
(f) Have significant financial ability to expand its business, with an initial debt
level of R0.8 billion which would increase later to R3.25 billion (20% of
enterprise value)
The unbundled Kumba Iron Ore would:
(a) Have an enterprise value of R14 billion
(b) Offer significant iron ore growth opportunities particularly in South Africa,
with production targeted to increase from 32 million to 42 million tons per
annum by 2008
(c) Be a subsidiary of Anglo American Plc
Merger objective
The proposed empowerment transaction would result in the following:
(a) Exceeding the requirements of the Mining Charter in terms of BEE
ownership through the creation of a Newco which would be 55% owned

144
and controlled by a BEE Holdco and would improve the lives of employees
and communities through employee share ownership schemes (ESOPs),
of which the majority would be black employees and vendor funding
(b) Creation of two separate and focused business entities that would grow
value for shareholders and their listing on the JSE
(c) Growth opportunities from greenfield and brownfield project pipelines,
mainly in coal and iron ore operations
(d) Gaining the financial ability to expand its business
(e) Establishment of Newco, as a diversified mining company with an
attractive investment case which would be well positioned strategically and
financially to take advantage of growth opportunities in the South African
mining sector
Value creation parameters applicable
Normally, three to five years is a fair period to make an initial assessment of a
mining deal, and thereafter, another five years for long-term value assessment
and future prospects. The Eyesizwe and Kumba Resources merger transaction
was concluded about two years ago, and this makes it difficult to see the benefits
and challenges of the full implementation. Nonetheless, an initial assessment of
the value created for shareholders and future potential will be made using the
following parameters:
(a) Merger objectives in terms of what was expected and what has been
achieved so far will be reviewed.
(b) The initial market sentiment cannot be assessed using the DVA parameter
because both companies would have to be listed and, in this case,
Eyesizwe was not listed.
(c) The non-financial parameters that will be used for Exxaro include access
to quality orebodies, access to skills, better operating processes, growth in
production, further pro-merger deals achieved due to empowerment
status, growth in production from existing operations and project pipelines,
and compliance with legislation. Since the majority of Exxaro’s earnings

145
come from the coal division, only the coal asset performance will be
assessed. For KIO, since it was the unbundling of an entity to create focus
and grow wealth, parameters such as growth in production, operational
efficiency (in terms of unit cash operating cost) will be considered.
(d) Financial parameters will consider ROE (return on equity), EPS (earnings
per share), DPS (dividend per share), P/E (price/earnings) ratio and the
D/E (debt/equity) ratio. Depending on the availability of information,
supplementary financial parameters may be used as well.
(b) The financial parameters would normally have to be benchmarked against
past performance and industry performance. In the case of KIO, it is the
only iron ore company listed on the JSE, and probably only the iron ore
operations of Khumani Iron Ore of Assmang would be a suitable
benchmark, but it is not operating as a separate entity. In terms of past
performance, the financial parameters were reported at group level
(involving other commodities) prior to the merger, and therefore a fair
comparison cannot be made. In the case of Newco, Eyesizwe was not a
publicly listed company, hence historical financial and operating figures
are not in the public domain. In terms of benchmarking, probably the only
diversified mining company listed on the JSE that could be used is African
Rainbow Minerals. However, their asset compositions vary to some extent,
and such a comparison must take note of key differences. In the light of
the above, the performance of the past two years will be used just for
information and discussion purposes. The impact of earnings from KIO on
Exxaro’s total earnings will also be considered.
(c) Only the period 2007 and 2008 will be used for post-merger assessment
and, where available, 2005 and 2006 figures will be used for pre-merger
performance.
Non-financial value assessment
In terms of legal compliance, the Newco (Exxaro) and KIO (Kumba Iron Ore)
fulfilled the requirements for BEE to comply with the Mining Charter. Exxaro has
55% BEE ownership and Kumba Iron Ore has 26% BEE ownership. Kumba Iron

146
Ore obtained their new order mining licence in 2008 according to their 2008
Annual Report, and Exxaro, with its current BEE ownership, complies with licence
conversion requirements.
In terms of access to skills, both companies contributed to the board and
executive management of the newly formed company. In terms of open-pit mining,
which will become the future of the Exxaro coal business, Kumba Resources
brings vast experience and expertise in building and operating huge open-pit
mines.
In terms of access to quality orebodies, the merger brings a substantial amount of
coal resources in the Waterberg area. This has created a regional dominance and
also offers an opportunity for synergy between these assets which are in the
exploration stage. The Grootegeluk West project has a total resource of about
6 billion tons of coal, and the Waterberg South and North projects together have a
total coal resource of about 3 billion tons. This has enabled Exxaro to expand its
operations to meet Eskom coal requirements for additional power stations in the
Waterberg area, and also enabled the inland coal-to-liquids joint venture
agreement with Sasol for Project Mafutha, although Exxaro has since announced
that it will not pursue this joint venture due to capital constraints.
Exxaro’s empowerment status has assisted it in obtaining mega deals, such as the
agreement with state utility Eskom in 2008 to supply 14.6 million tons of power
station coal annually for 40 years from the Grootegeluk mine to the adjacent
Medupi power station, currently under construction. Project Mafutha, which will
supply Sasol’s new inland coal-to-liquids project, requires 20–30 million tons of
coal per annum to produce 80 000 barrels of fuel per day. These deals are very
significant in exploiting the vast resource potential of Exxaro in the Waterberg, and
also in creating substantial shareholder value over and above what was
anticipated during the merger. Exxaro has also in the past considered feasibility
studies to increase the Richards Bay Coal Terminal (RBCT) rail capacity between
the Waterberg and the RBCT, with the possibility of producing export-quality coal
from the Waterberg area.
These opportunities could, however, significantly alter Exxaro’s debt position,
depending on the type of funding that is used. This could be cash from operations

147
(which could impact on dividends paid, which are critical for BEE entities to fund
their debts), use of share capital (which could lead to share dilution and could also
alter the BEE percentage) or use of debt (which is very difficult and expensive to
obtain in the current global economic crunch), or a combination of these funding
sources. These huge opportunities could therefore also pose a huge threat to
Exxaro’s financial stability in terms of how they are dealt with and the timing.
Regarding operating processes, the Grootegeluk operation is a world-class asset
in terms of its operating philosophy, processes and systems, and can be used as
a model for future expansion projects in the Waterberg area. The unit cash
operating costs of Exxaro coal assets are not available for determination of its
operational efficiency. The unit operating cost (cash cost per ton) for the Sishen
and Thabazimbi operations are available. Since about 92% of production comes
from Sishen, its operating performance in terms of unit cost and production profile
will be used an indication of how well the iron ore operations are performing.
Sishen Iron Ore’s cash operating cost increased by 1.6% from R68.8/ton in 2005
to R69.9/ton in 2006. From 2006 to 2007, its cash operating cost increased by
6.3% from R69.9/ton to R74.3/ton. However, from 2007 to 2008, the cash
operating cost at Sishen increased by 37.1% from R74.3/ton to R101.9/ton. The
unit cost performance in 2006 and 2007 was good, but that of 2008 is cause for
concern. Despite the normal expectation of unit cost reduction as volume
increases, the trend in plant yield, which reduced from 89.4% in 2005 to 82.5% in
2008, is a contributing factor.
The unit cost trend and plant yield are depicted in Figures 3.3.4a and 3.3.4b.

148
Figure 3.3.4a: Cash operating Cost at Sishen (R/ton) (Source: Kumba Iron Ore Annual
Reviews, 2006–2008)
The plant yield has been on a continuous decline; this is normally due to plant
feed, the type of product expected and the metallurgical process efficiency.
Figure 3.3.4b: Metallurgical Plant Efficiency at Sishen (%) (Source: Kumba Iron Ore Annual
Reviews, 2007–2008)
In terms of production and growth, Sishen’s run-of-mine ore production has
increased by about 40% – from 31.7 million tons in 2005 to 44.6 million tons in
2008, which is a remarkable achievement. The approval of the 9 million tons per
annum Sishen South project, despite the decline in iron ore prices, will further
consolidate growth in production. Sishen’s production profile is illustrated in
Figure 3.3.4c.

149
Figure 3.3.4c: Sishen Iron Ore Production (Run of Mine) in million tons (Source: Kumba
Iron Ore Annual Report 2007 and Annual Review 2008)
Production at Exxaro’s coal operations also showed an increase of about 12.8% –
from 20.3 million tons in 1H07 (first half of 2007) to 22.9 million tons in 2H08
(second half of 2008). This is shown in Figure 3.3.4d. Coal production increased
for all the various types of coal, except for coking coal which showed a slight
decline in 2H08 due to lower demand.
Figure 3.3.4d: Exxaro’s Coal Production in million tons (Source: Exxaro Interim Report
2009)
In terms of growth, additional annual production of about 14.6 million tons will be
delivered from the Grootegeluk operation at full production in 2014 to the Medupi
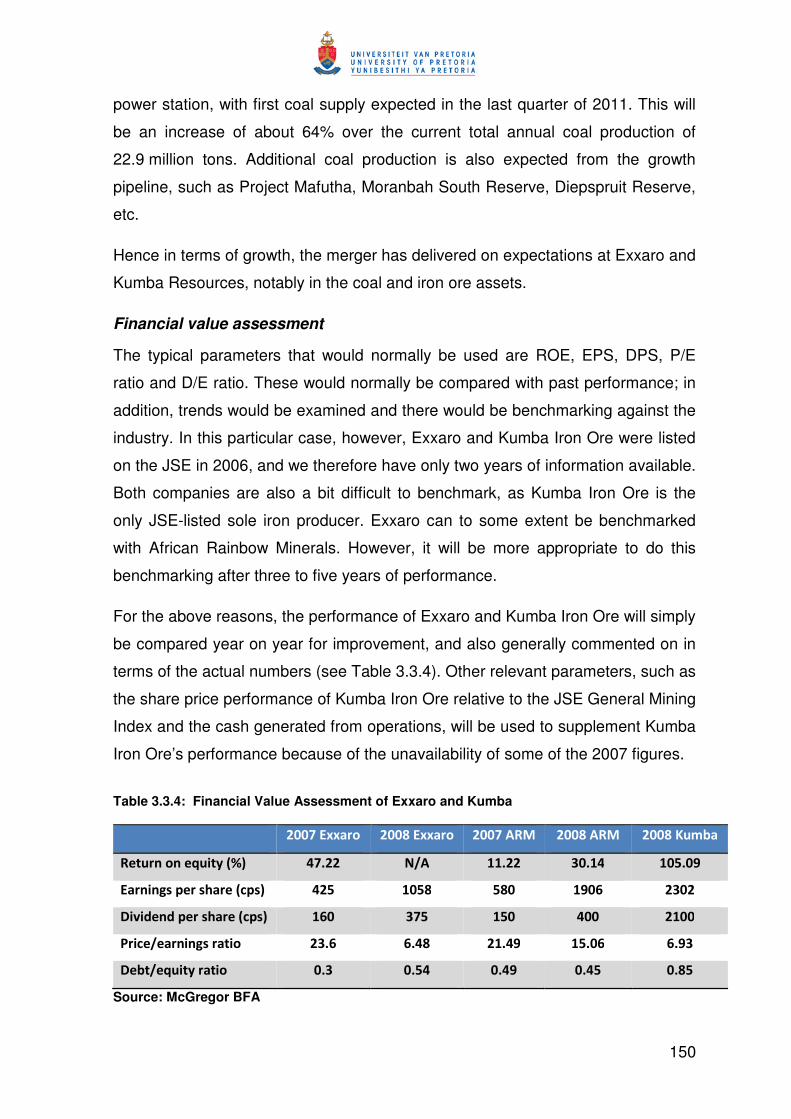
150
power station, with first coal supply expected in the last quarter of 2011. This will
be an increase of about 64% over the current total annual coal production of
22.9 million tons. Additional coal production is also expected from the growth
pipeline, such as Project Mafutha, Moranbah South Reserve, Diepspruit Reserve,
etc.
Hence in terms of growth, the merger has delivered on expectations at Exxaro and
Kumba Resources, notably in the coal and iron ore assets.
Financial value assessment
The typical parameters that would normally be used are ROE, EPS, DPS, P/E
ratio and D/E ratio. These would normally be compared with past performance; in
addition, trends would be examined and there would be benchmarking against the
industry. In this particular case, however, Exxaro and Kumba Iron Ore were listed
on the JSE in 2006, and we therefore have only two years of information available.
Both companies are also a bit difficult to benchmark, as Kumba Iron Ore is the
only JSE-listed sole iron producer. Exxaro can to some extent be benchmarked
with African Rainbow Minerals. However, it will be more appropriate to do this
benchmarking after three to five years of performance.
For the above reasons, the performance of Exxaro and Kumba Iron Ore will simply
be compared year on year for improvement, and also generally commented on in
terms of the actual numbers (see Table 3.3.4). Other relevant parameters, such as
the share price performance of Kumba Iron Ore relative to the JSE General Mining
Index and the cash generated from operations, will be used to supplement Kumba
Iron Ore’s performance because of the unavailability of some of the 2007 figures.
Table 3.3.4: Financial Value Assessment of Exxaro and Kumba
� ��� �:;;���� �����:;;���� ��� ��<+ � ������<+ � �����5�� ���
<����������=���-�'( )� *��� > �� ��*��� �*�� ���*���
:������������������'&��)� ��� ����� ���� ����� ����
7�?����������������'&��)� ���� �� ���� ��� �����
.��&� ��������������� �*�� �*�� ��*�� ��*��� �*��
7��� �=���-������� �*� �*�� �*�� �*�� �*���
Source: McGregor BFA

151
In terms of ROE, EPS, DPS, P/E ratio and D/E ratio, Exxaro compares quite well
with African Rainbow Minerals (ARM). Kumba’s performance looks even better
with earnings of 2,100 cents per share, ROE of 105% and handsome dividends of
2 100 cents per share paid. Earnings have grown substantially and the P/E ratios
are healthy.
The D/E ratio has, however, been the only indicator of concern, considering the
fact that one of the intentions of the deal was to keep debt to a maximum of 20%
of enterprise value of Exxaro. However, with the unanticipated growth
opportunities offered by the Grootegeluk expansion, as well as the pipeline of
projects, the need to raise cash to fund these opportunities is a business
imperative. One of the cheapest and perhaps less risky means of raising funds for
future expansion is normally cash from operations and equity (issuing more
shares, depending on the share performance of the company) considering the
global credit crunch and sometimes the difficulty of securing debt, but Exxaro also
has the challenge of BEE equity dilution. The challenge will therefore be the ability
of Exxaro to settle these debt facilities as they become due. It will also need to
improve efficiency and/or sweat existing assets to raise funds internally to finance
the growth of its projects.
Kumba Iron Ore also has a fairly high D/E ratio, but it would have been better to
compare this ratio with a historical figure to evaluate the extent of the impact of the
current growth projects, most notably the R8.5 billion investment in the Sishen
South project in the current environment of decline in iron ore prices and demand
from China. The project is also dependent on Transnet’s commitment to its
R4 billion expansion and upgrading programme.
It must be noted, though, that Kumba generated R5.8 billion and R14.5 billion of
cash in 2007 and 2008 respectively, and therefore has the ability to fund its debt.
However, of the R14.5 billion cash achieved in 2008, about R7 billion (almost
50%) was paid out as dividends. One would expect lower dividends in an
environment of growth as opposed to the risk of acquiring more debt, with the
expectation that the operations will continue to deliver substantial cash. The
current decline in platinum prices was a lesson for most companies that took on
substantial debt with future cash projections based on prevailing platinum prices.

152
However, with most of the BEE partners securing loans to fund their participation
in the deal, dividends are necessary to settle these loan facilities as they become
due. Exxaro is also highly dependent on Kumba Iron Ore’s earnings. The
attributable earnings from Kumba Iron Ore are normally about 70–90% of the net
operating profit achieved by Exxaro alone. For instance, in 1H08 the attributable
earnings from Kumba were R753 million, compared with Exxaro’s R806 million
(91%); in 2H08 the attributable earnings from Kumba were R1.12 billion compared
with Exxaro’s R1.66 billion (67%), and in 1H09 the attributable earnings from
Kumba were R868 million compared with Exxaro’s R953 million (91%).
Hence Exxaro’s 20% stake in Kumba Iron Ore has been, and will continue to be, a
huge source of earnings and dividends. It could also create the danger of
over-reliance on Kumba’s exceptional performance.
In terms of the P/E ratio, Kumba’s share price performance relative to the JSE
General Mining Index from 2007 to 2009 indicates a huge improvement from the
time of listing to date, and Kumba certainly continues to attract value from the
share price point of view, as depicted in Figure 3.3.4e.
Figure 3.3.4e: Kumba Iron Ore Share Price Performance (Source: McGregor BFA)

153
Deal value assessment summary
Most of the deal objectives have been met, with the exception of the extent of
indebtedness as reflected in the D/E ratio and the deal intent. However, there is a
reasonable justification for such debt levels, as long as they can be serviced
effectively.
The initial two years have met the expectation of BEE compliance, seen an
increase in production and growth, and brought complementary skills into the
merged company. Good business deals have been secured from Eskom and
Sasol (this was later terminated) which were assisted by the empowerment
credentials. Good earnings and dividends have also been achieved with excellent
returns on equity.
Challenges remain on the debt level, the cash operating cost at Sishen and the
future prices of coal and iron ore, especially in the next two to three years. The
foundation has, however, been laid for future value creation and the merger has
definitely added value to shareholders.
REFERENCES – CHAPTER 3
AngloGold Ashanti. Annual Reports 2000–2008.
Ashanti GoldFields. Annual Reports 2000–2003.
ARMgold. Annual Reports 2001–2003.
African Rainbow Minerals. Annual Reports 2005–2008.
Harmony Gold. Annual Reports 2000–2008.
Exxaro. Interim Report 2009.
Kumba Iron Ore, Annual Reviews 2006–2008, Annual Report 2007
McGregor BFA.

154
CHAPTER 4 ANALYSIS AND EVALUATION OF
RESULTS
155
In Chapter 3, the various indicators that can be used in assessing value creation
in mergers and acquisitions were discussed in detail. A framework or guideline
comprising a comprehensive set of indicators that will be applicable to the South
African mining industry was developed. This framework considered both the
financial and non-financial value-adding indicators that apply to mining deals in
South Africa. It also considered the objectives of the merger, and whether or not
they were met.
The framework was applied to some key deals that have occurred in the South
African mining industry, namely:
• The Harmony and ARMgold merger and the subsequent joint acquisition of
stakes in Avmin, which led to the creation of a larger Harmony focusing on
gold, and African Rainbow Minerals, a diversified empowered mining
company
• The AngloGold and Ashanti GoldFields merger to form AngloGold Ashanti
• The unbundling of the assets of Kumba Resources to form Kumba Iron Ore
and the subsequent merger of its coal, base metal and mineral sands
assets with Eyesizwe Coal to form Exxaro Resources
The outcome of the Harmony and ARMgold merger value assessment indicates
some amount of value destruction for shareholders of Harmony, but value was
created for shareholders of ARM, despite their large stake in Harmony.
Table 4.1 is a summary of the deal value assessment for Harmony shareholders.
In terms of deal objectives, the aspect of compliance with the Mining Charter was
well achieved, with further BEE promotion through the disposal of its 20% stake in
ARM. However, in terms of production growth, the implementation of CONOPs
and the application of the Harmony business model to extract value, these
objectives were not achieved. The merger gave Harmony access to a huge
resource base, but not much of the resources were converted to reserves. Most of
the deal objectives were therefore not achieved.
In the case of non-financial parameters, mining licences were secured for all the
assets and quality growth assets were acquired which are currently feeding the
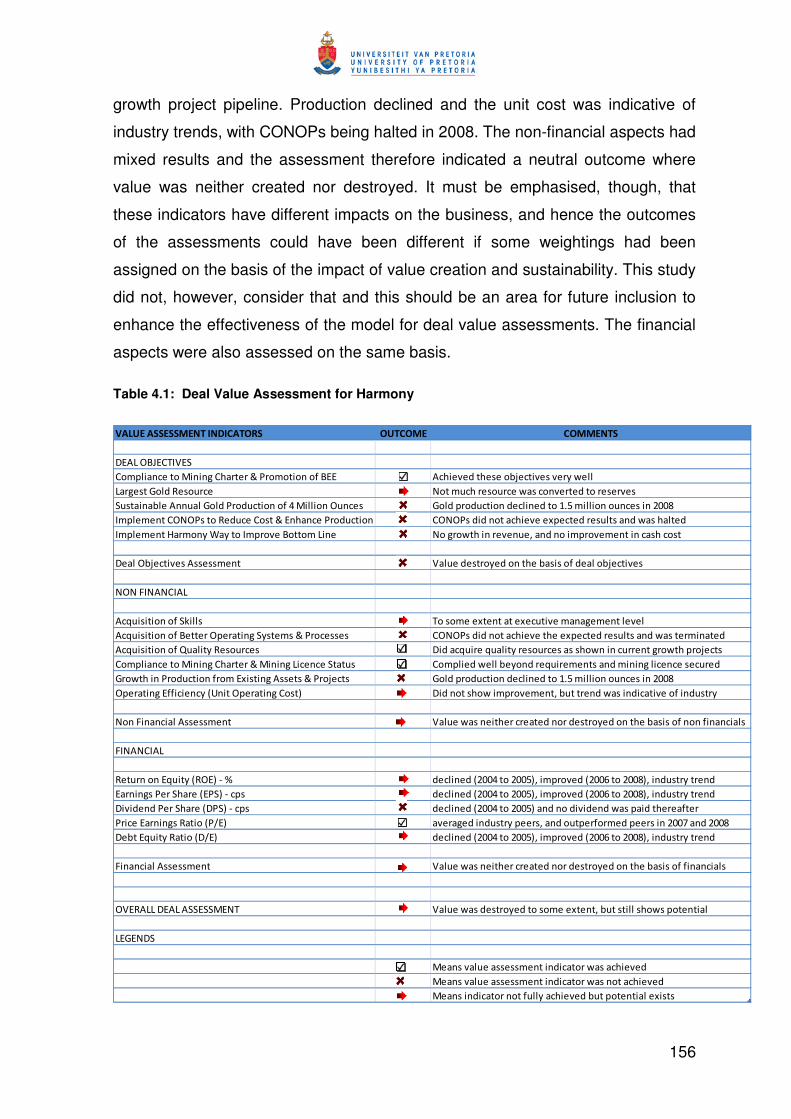
156
growth project pipeline. Production declined and the unit cost was indicative of
industry trends, with CONOPs being halted in 2008. The non-financial aspects had
mixed results and the assessment therefore indicated a neutral outcome where
value was neither created nor destroyed. It must be emphasised, though, that
these indicators have different impacts on the business, and hence the outcomes
of the assessments could have been different if some weightings had been
assigned on the basis of the impact of value creation and sustainability. This study
did not, however, consider that and this should be an area for future inclusion to
enhance the effectiveness of the model for deal value assessments. The financial
aspects were also assessed on the same basis.
Table 4.1: Deal Value Assessment for Harmony
3�@0 :��##:##+ :> !��> 7�,�!� <# � 0 !,� + : ,� + + :> !#
������������
�� ������������ �������������� ����� ������������ ������� ����!���"#������!����$�% ����
�����!��&�� �'�!�(��� ) ���� (�����!�(����% �!��������� ������!����!
(!�����"������(���&�� ���� (���������*�� ��������(���!� &�� ���� (������ ������ ����+,-�� ��������(���!����.//0
�� ���� �����)��!����'� (����!��� ������������ (����� �)��!� � ��������������1����� ���!(��!��� �% �!������
�� ���� ����2��� ��$�3 �$������ ������������ ����� ) �����% �����������(�4��� ������ ������ ���������!����!�
������"#������!��!!�!!� ��� ���(�� �!���$� ��������"�!�!���� �����"#������!
)�) �5�) �) ����
�
��6(�!��������� 7���! ��!�� ���1���������1��(������ ������ ���������
��6(�!�������������������������� $!��� !�� ������!!�! �)��!� � ������������������1����� ���!(��!��� �% �!����� �����
��6(�!���������8 (����$�'�!�(���! �� ���6(����6(����$���!�(���!��!�!��% ������(���������% ������#���!
�� ������������ �������������� �� �������������� ���(! �� ���� �% ����"�$�� ���6(���� ���!��� �� ��������������!��(��
&��% ��������� (���������� ��1�!������!!��!�� ����#���! &�� ���� (������ ������ ����+,-�� ��������(���!����.//0
�������������������$�9:���������������!�; �� �����!��% ��� ������ ���4�"(������ �% �!��� ������������� (!��$
) ���5����������!!�!!� ��� ���(��% �!��������������� ����� �!���$� ��������"�!�!�����������������!
5�) �) ���
'��(�������6(��$�9'��;�<�= ������ �9.//*����.//-;4��� ����� �9.//>����.//0;4��� (!��$�����
�������!����� �����9�� ;�<���! ������ �9.//*����.//-;4��� ����� �9.//>����.//0;4��� (!��$�����
���� �� ����� �����9�� ;�<���! ������ �9.//*����.//-;��� ���� ��� �� �% �!���� �����������
�������������!�'�����9�?�; ������� ��� (!��$�����!4��� ��(�������� � �����!����.//@��� �.//0
��"���6(��$�'�����9�?�; ������ �9.//*����.//-;4��� ����� �9.//>����.//0;4��� (!��$�����
5����������!!�!!� ��� ���(��% �!��������������� ����� �!���$� ��������"�!�!�������������!
���'���������� � � �) ���(��% �!� �!���$� ����!�� ���1����4�"(��!�����!��% !����������
��&�)�
� ���!����(���!!�!!� ������ �������% �!��������
� ���!����(���!!�!!� ������ �������% �!������������
� ���!��� ������������(��$�������� �"(�������������1�!�!

157
The deal did, however, create value for ARM shareholders as shown in Table 4.2,
from the perspectives of deal objectives, non-financial and financial indicators.
Table 4.2: Deal Value Assessment for ARM
3�@0 :��##:##+ :>!��> 7�,�!� <# � 0!,�+ : ,� + + :> !#
������������
�������� ����!���� �"���7��� ��% ��� �� ��������� ���$ ������� ����!���"#������!����$�% ����
���������(������!������� ��!�(!������!��"(!���!!�� � �� �!�����(!��!��������"(!���!!�� � ����������$���� ���
������"#������!��!!�!!� ��� ���(�������� ����"�!�!���� �����"#������!
)�) �5�) �) ����
�
��6(�!��������� 7���! 7���!��� ��1�����!����6(��� ����� �#���������(����������!
��6(�!�������������������������������!!�!�� � $!��� ! ����������(���% ����% ����% ��� ����!!���� �����!
��6(�!���������8 (����$�'�!�(���! �� ���6(����6(����$���!�(���!��!�!��% ������(���������% ������#���!
�� ������������ �������������� �� �������������� ���(! �� ���� �% ����"�$�� ���6(���� ���!��� �� ��������������!��(��
&��% ��������� (���������� ��1�!������!!��!�� ����#���! � �#������% ������#���!������������4�� �����!�4���������
�������������������$�9:���������������!�; 3 ���������1������������ ������!�4���!�������� (!��$�����
) ���5����������!!�!!� ��� ���(��% �!������� ����"�!�!�������������������!!�!!� ���
5�)�)���
'��(�������6(��$�9'��;�<�= ��!���������� ��������!��A�$���!
�������!����� �����9�� ;�<���! ��!���������� ��������!��A�$���!
���� �� ����� �����9�� ;�<���! ��!���������� ��������!��A�$���!
�������������!�'�����9�?�; �� (!��$����� ���� ���� �% �����11���
��"���6(��$�'�����9�?�; 5����$����!����4�% ����������$���!����!�����
5����������!!�!!� ��� ���(��% �!������� ��������"�!�!���������������!!�!!� ���
���'���������� � � �) ���(��% �!������� �����!������� ��!4��� ����� �!�����(�(��
��&�)�
� ���!����(���!!�!!� ������ �������% �!��������
� ���!����(���!!�!!� ������ �������% �!������������
� ���!��� ������������(��$�������� �"(�������������1�!�!
Overall, the merger of Harmony and ARMgold and the subsequent joint acquisition
of a stake in Avmin have made some positive contributions to the South African
mining industry, especially in the area of transformation as shown in the post-
merger and acquisition performances of Harmony and African Rainbow Minerals.
The AngloGold and Ashanti GoldFields merger, which led to the creation of
AngloGold Ashanti, failed to deliver value to shareholders. Most of the deal
objectives were not met and most of the non-financial indicators showed a

158
declining trend. The financial indicators underperformed industry trends in most
cases. The main contributors to value destruction were the combined hedge book
and escalating costs at Obuasi and Geita but, at group level, production also
declined substantially from South Africa. The value assessment summary is
shown in Table 4.3.
Table 4.3: Value Assessment for AngloGold Ashanti
3�@0:��##:##+ :> !��> 7�,�!� <# � 0 !,� + : ,� + + :> !#
������������
&��% ��������� (����� �������� ���� (��������!� ������ ��!�% �����!����� ��!�������!!��!
$����$��������!����� ���!��� ���������&���� $����$�"������!�� �$�"��������� �"(��&����B!���!�% ��!����!������
�����!����������9����<���4�(� �����(� �� ��������������$; �����!���������� � ��������������$�!�����������������(���$
�����������!!��!�9�"(�!��� �&����; ��$���� ����� ���!������������7��$��������������!���!!��!�� ���!��$
2� �����9�� "��� �� ������ ���; 2� �������!�!������$��� ����� ������� ���$�������� ����
������"#������!��!!�!!� ��� ���(�� �!���$� ��������"�!�!���� �����"#������!
)�) �5�) �) ����
�
��6(�!��������� 7���! '�!������������ ��� �� �������� ���������!������!7��������!�����
��6(�!�������������������������� $!��� !�� ������!!�! �����&�� � � �����"�������� (������� ��!�������������������
��6(�!���������8 (����$�'�!�(���! ��$���� ����� ���!�����!!(��!�% ������������"(�!��� �&����
�� ������������ �������������� �� �������������� ���(! ) ����������"���������!� ���
&��% ��������� (���������� ��1�!������!!��!�� ����#���! �!�����B!�������"(����� ������ ����� �+,-� �C����+,/.�� �C
�������������������$�9:���������������!�; �!������ �% �!��1��!!����$����������"(�!���� �&����
) ���5����������!!�!!� ��� ���(��% �!� �!���$� ��������"�!�!�������������������!!�!!� � ���
5�) �) ���
'��(�������6(��$�9'��;�<�= �������������� ���� ���� ������ (!��$��!�������$����� �.//>����.//0
�������!����� �����9�� ;�<���! �������������� ���� ���� ������ (!��$��!�������$����� �.//>����.//0
���� �� ����� �����9�� ;�<���! �������������� �"(��!�� ���������� (!��$
�������������!�'�����9�?�; �������������� ���� ���� ������ (!��$��!�������$����� �.//>����.//0
��"���6(��$�'�����9�?�; �������������� ���� ���� ������ (!��$��!�������$����� �.//>����.//0
5����������!!�!!� ��� ���(��% �!� �!���$� ��������"�!�!���������������!!�!!� ���
���'���������� � � �) ���(��% �!� �!���$� �����!������� ��!�% ���� �����(����(�(��
��&�)�
� ���!����(���!!�!!� ������ �������% �!��������
� ���!����(���!!�!!� ������ �������% �!������������
� ���!��� ������������(��$�������� �"(�������������1�!�!
The value assessment for Exxaro and Kumba Iron Ore is provisional, because
post-merger performance exists for two years only, and three to five years would

159
be ideal for the purpose of the study. Nonetheless, the first two years show some
value creation based on deal objectives, non-financial and financial indicators.
There was only one benchmark that was used for the financial assessment of
African Rainbow Minerals. Overall, the initial two-year post-merger performance is
very encouraging and the foundation has been laid for value creation in the next
five years, especially from growth projects. The value assessment summary is
shown in Table 4.4.
Table 4.4: Value Assessment for Exxaro and Kumba Iron Ore
3�@0 :��##:##+ :>!��> 7�,�!� <# � 0!,�+ : ,� + + :> !#
������������
�1��� �����'�6(���� ���!���������% ���!��� �� ���������--= ������% ���!��������11���
�����������% �� ���������� �5��(!!� ��(!���!!��������! �11������ �D(� "������������% ��!(���!!�(��"(!���!!��������!
&��% ����9���% ����� ��� �&�������� ����#���!; &��% ������� ������!�4������������ ���������������!
�"����$����5(� �5(������&��% ���9� ��������"�������!; ����!��� ����"�����������������7������� �"�������!�9�,�,��11���;
) �% ��������������5(����������!�� ����������(�����! � �#������������!�� ����������(�����!�% �����!7�� ��� � �!��
������"#������!��!!�!!� ��� ���(�������� ��������"�!�!���� �����"#��������!!�!!� ���
)�) �5�) �) ����
�
��6(�!��������� 7���! 7���!����� �"������� �����!�% ����������� ����"��� ������
��6(�!�������������������������� $!��� !�� ������!!�! &����7��(���!���� � ��������1��������������3 ����"(�����!�(���!
��6(�!���������8 (����$�'�!�(���! ���3 ����"(���) ������ � �(������#����� � �A�������������!�(���
�� ������������ �������������� �� �������������� ���(! �� ����!�% ������6(���� ���!��� �� �����������������������!!
&��% ��������� (���������� ��1�!������!!��!�� ����#���! ��� (��������!�������!� ����� �������!�4������������ �����
�������������������$�9:���������������!�; �!��������� ������� ����������������$���� �!������!� ������
) ���5����������!!�!!� ��� ���(�������� ��������"�!�!�������������������!!�!!� ���
5�)�)���
'��(�������6(��$�9'��;�<�= �1�����������(� "��!����� ��11������ �D���9*@,..= ��� �+/-= ;
�������!����� �����9�� ;�<���! ������!� ����� ������11���4���� ����!�����'� 4�D������$�����
���� �� ����� �����9�� ;�<���! ������!� ����� ������11���4���� ����!�����'� 4�D������$�����
�������������!�'�����9�?�; �� ���������� (!��$�������� �������� ���� �����'�
��"���6(��$�'�����9�?�; 3 ��!����� ���� �����'� 4�"�����11������ �D�������� �("��
5����������!!�!!� ��� ���(��% �!������� �"�!� ���������������!!�!!� ���
���'���������� � � �) ���(��% �!������� �����!������� ��!�% �����(�(������������
��&�)�
� ���!����(���!!�!!� ������ �������% �!��������
� ���!����(���!!�!!� ������ �������% �!������������
� ���!��� ������������(��$�������� �"(�������������1�!�!

160
The outcome of these key deals that occurred in the South African mining industry
can be summarised as follows:
(a) Most of the deals did create some value for shareholders.
(b) The period between 2006 and 2008 was very challenging for the industry
as a whole, with high cost pressures which resulted in operating margin
squeeze.
(c) The deals that were made for BEE purposes added significant value from
the point of view of empowerment and performance, as shown in the
cases of ARM and Exxaro.
(d) The only non-BEE deal, which was also cross-border, was not successful.
(e) The deals involving gold portfolios seem to have underperformed due to
the performance of the gold price relative to that of other commodities
between 2004 and 2008.
(f) The deals involving diversified commodities such as platinum, iron ore,
manganese and coal experienced some exceptional increases in
earnings.
(g) Gold portfolios are expected to experience a bullish environment in the
next five years, but this will have a negative impact on the hedged assets.
(h) The future of commodity prices for iron ore, manganese, platinum and coal
appears to be uncertain, bringing some element of risk in the next five
years.
(i) The use of weighting on the various indicators, based on the uniqueness
of each deal and the operating environment, would have enhanced the
outcome of the assessments, and will require more in-depth analysis and
engagement with the various companies.
The assessment framework that was developed and used in the assessment of
these mergers and acquisitions is comprehensive compared with the traditional
ones which tend to focus mainly on financial parameters. This tool considered deal

161
objectives, non-financial parameters and appropriate industry benchmarks, which
is an enhancement of the models currently in use. It was also developed with the
input of industry leaders with significant experience in mergers and acquisitions in
the South African mining industry, making the model suitable and relevant to the
South African mining industry.

162
CHAPTER 5 CONCLUSIONS

163
This dissertation discussed mergers and acquisitions and some of the key motives
behind them, as well as the industry trends in mergers and acquisitions, especially
in the global mining industry and, more specifically, in the South African mining
industry. Considering the important role that mining plays in the socio-economic
development of South Africa, a comprehensive and holistic framework for value
assessment has been developed and used to assess some of the key mergers
and acquisitions that have occurred in the South African mining industry. The
purpose is to assist in post-merger reviews of value creation, to offer opportunities
for improvement in value creation and also to serve as a useful guide in future
mergers and acquisitions.
The following conclusions can be drawn from the study:
(a) Mergers and acquisitions are one of the ways by which firms attempt to
create value. The merger and acquisition process involves target selection
following an extensive screening exercise, deal negotiation and conclusion
(subject to all the necessary approval frameworks), integration of the
various assets involved and post-merger evaluation. The motives that
drive these deals are quite numerous, but in the South African mining
industry compliance with legislation, operational and financial synergy,
strategic realignment to achieve economies of scale, and diversification in
terms of risk are some of the common ones.
(b) Mining contributes significantly to the socio-economic development of
South Africa. More specifically, in 2007 mining’s contribution to the Gross
Domestic Product was 7.7% or R135.6 billion, to exports it was
R536 billion and to Total Fixed Capital Formation it was 8.9%. The mining
industry also employed about half a million people in 2007, representing
about 2.9% of total employment in South Africa, with mining companies
also playing an active role in the socio-economic development of the areas
and communities in which they operate. Mining also promotes
transformation by creating opportunities for the integration of Historically
Disadvantaged South Africans in terms of ownership to assist in the
realisation of a non-racial South Africa.

164
(c) Mergers and acquisitions in the global mining industry increased
substantially between 2005 and 2008, with the total number of deals
increasing from 762 in 2005 to 1 668 in 2008, and the total annual deal
value increasing from US$69.8 billion in 2005 to US$153.4 billion in 2008.
North America, Europe and South America accounted for most of the
deals, and the main commodities involved were base metals, ferrous
metals and precious metals. In the South African mining industry, the total
number of deals per annum increased from 18 in 2003 to 30 in 2007 and
25 in 2008. Annual deal values were exceptionally high in 2003, 2006 and
2007, with annual total deal values ranging from US$5 billion to
US$5.7 billion. Platinum, gold and coal accounted for 27%, 22% and 22%
respectively in terms of the total number of deals from 2003 to 2008.
Some of the key mergers and acquisitions that occurred in this period
involved Harmony and ARMgold and their subsequent joint stake in
Avmin, AngloGold and Ashanti GoldFields, and the unbundling of Kumba
Resources to form Kumba Iron Ore and the merger of its coal, base metal
and mineral sands assets with Eyesizwe Coal to form Exxaro.
(d) The various key indicators that were used to assess value creation in
mergers and acquisitions mostly involved the use of financial metrics.
These metrics were based on the use of profitability ratios such as profit
margin, earnings per share (EPS), price/earnings (P/E) ratio, etc., debt
ratios such as debt/earnings (D/E) ratio, and efficient capital utilisation
ratios such as market value add (MVA), return on invested capital (ROIC),
economic profit, etc. Initial value assessment based on stock market
reaction to deal announcement was also done using deal value add (DVA)
and proportion overpaid (POP).
(e) A framework or guideline for assessment of mergers and acquisitions that
is relevant and suitable to the South African mining industry was
developed based on a literature review, personal input and contributions
by industry leaders who have in-depth experience in mergers and
acquisitions. The guideline involves the use of deal objectives (whether
they were achieved or not), non-financial parameters such as access to
skills, access to better operating processes and systems, access to quality

165
orebodies, compliance with legislation and operating efficiency in terms of
unit cost. The financial parameters used were mostly those that have an
ultimate impact on shareholders and these included ROE, EPS, dividends
per share (DPS), P/E ratio and D/E ratio. The overall assessment was
based on a combination of these parameters.
(f) This framework was used to assess some key deals that have occurred in
the South African mining industry, namely the Harmony/ARMgold merger
and the subsequent acquisition of stakes in Avmin to form the new
Harmony and African Rainbow Minerals (ARM); the AngloGold/Ashanti
GoldFields merger to form AngloGold Ashanti; and the unbundling of the
assets of Kumba Resources to form Kumba Iron Ore and the subsequent
merger of its coal, base metal and mineral sands assets with Eyesizwe
Coal to form Exxaro Resources. In the case of Harmony, the merger did
not affect shareholder value much, but value was destroyed for AngloGold
Ashanti shareholders. On the other hand, value was created for
shareholders of ARM, Exxaro and Kumba Iron Ore. The post-deal
performances were, however, affected by industry factors such as a higher
inflationary environment, rationing of electricity in South Africa, a shortage
of skills and commodity prices.
(g) The deals that were made for black economic empowerment (BEE)
purposes added significant value from the empowerment and performance
point of view as shown in the cases of ARM and Exxaro. The only
non-BEE deal, which was also cross-border, was not successful. The
deals involving gold portfolios seem to have underperformed due to the
performance of the gold price relative to that of other commodities
between 2004 and 2008. The deals involving diversified commodities such
as platinum, iron ore, manganese and coal experienced some exceptional
increases in earnings. Gold portfolios are expected to experience a bullish
environment in the next five years, but this will have a negative impact on
the hedged assets. The future of commodity prices for iron ore,
manganese, platinum and coal appears to be uncertain, bringing some
element of risk in the next five years. The use of weighting on the various
indicators, based on the uniqueness of each deal and the operating

166
environment, would enhance the outcome of the assessments, and will
require more in-depth analysis and engagement with the various
companies. New deals can use this model as a guide in decision making
In conclusion, mergers and acquisitions can offer significant opportunity for value
creation if the deal objectives are clear and appropriate, with a comprehensive
and holistic approach used in defining what value entails, the development of an
assessment framework to measure post-merger success for ongoing review and
the development of corrective measures, as well as the use of key learnings in
future deals. Failure to do this can have severe and negative consequences for
shareholder value.
167
CHAPTER 6 RECOMMENDATIONS

168
The study has contributed significantly to the value assessment of mergers and
acquisitions in the South African mining industry. The following are
recommendations that can enhance the contribution made by this study:
(a) The use of this model in evaluating other deals that have occurred in the
South African mining industry as more data becomes available in the next
three years will enhance the accuracy of deal assessment in the South
African mining industry and provide opportunities for improving the model.
(b) In-depth analysis of a particular deal will always provide very useful
insights and address the uniqueness of each deal, and industry leaders
are encouraged to provide the necessary guidance and assistance to
make information available and take ownership of such assessments.
(c) There should not be significant differences in the way value is measured in
BEE and non-BEE deals, because BEE, or the lack thereof, is not
necessarily the critical factor in creating sustainable shareholder value.
The use of a comprehensive and appropriate tool that defines value in
each situation, and its correct application, is the key value differentiator.
(d) As mergers and acquisitions have impacted, and will continue to impact,
significantly on the South African mining industry, the lack of an effective
tool to assess value could have severe consequences for the viability and
sustainability of the industry as a whole.
(e) This model also offers an opportunity for constructive debate, based on
facts rather than emotions, on the impact the Mining Charter has had on
the performance of the mining industry in the light of an imminent review of
the Charter in the near future.
169
CHAPTER 7 SUGGESTIONS FOR FURTHER WORK

170
The following are suggestions for further work:
(a) An assessment model should be developed that will assist in determining
which parameters to use based on the initial deal reaction from the stock
market, deal objectives and non-financial and financial indicators to suit a
particular situation, and also based on the prevailing industry issues that
have the potential to impact significantly on shareholder value.
(b) The model should be based on scoring criteria for the degree of value
created, supplemented by weightings of the indicators depending on the
key performance indicators applicable at that time and the extent to which
the indicators impact on value creation for that particular asset and the
industry at large.
(c) A guideline or framework should be developed that can be used to
improve the degree of success in mergers and acquisitions through the
setting of appropriate merger objectives, target selection, deal valuation,
integration, post-deal assessments and possible interventions that will
assist in sustainable value creation.

171
APPENDICES
172
APPENDIX A: MERGER AND ACQUISITION DISCUSSION
DOCUMENT
������ �?� �!�E E E E E �
� �����!��� ���6(�!�����!����������������% �$!�"$�% ��������� !������ ����������������(�,����� ������
�� (!��$���!�����"��������1�������,������������.//04�� ����!�"���� ��������% ����������3 ���� �����4�
�!�� ������ �!����� �����������!������!����"���� ������"����!��!�(�������� �����!��� ���6(�!�����!�
9����� "���� '�����4� �(��� +.4� .//0;,� ��� ������ ���� ��� ���� � ������!� �� � �������(� � '�!�(���!�
�������� �����������.//.�9� �'��;��� �����!("!�6(��������� (�������������� ���������������!�
��!��������"(�� ����!������������ �������� ���6(�!���������������!���� �(���������,�
� �!��!�( ��!���� (��� ����� �����!��� ���6(�!�����!�����4���% ����4�������� �������"�(��>/= ����
���� � �����!� �� � ��6(�!�����!� ����� ��� ������� ���(�� ���� !������� ��!,� 3 ���� ���� ���!��$� �1�� ���!�
���!�� !�( ��!4� ��� �!� ��� ���� ����� ��� � �!�� ��!�����!4� ���!�� �����(!���!� ���� "�!� � ��� ��� ��� � �� �
����!�������� ���������% �������(�����������������!4��!�% �����!������% ��� �% �������!������� ����!�
!��(� �"��� ��!(�� ������ ������ ����� ����% ����������(��% �!������� �������,�
����!������!�����!�"��7���(� ������������4��!���������� $�� �!���F!� �!!����������������:�����!��$����
��������4�(� ����7����� !�( $����� �����!��� ���6(�!�����!4�% ���������"#����������� �����$��������
�����(!� ����� ����!� ����� ���� "�� (!� � ��� �!!�!!� ���(�� ��������� ��� � �����!� �� � ��6(�!�����!4�
���� (���������!���������������������!�!(���"���������� �(������������ �������� (!��$4��� ������(!����
���!���������������!!�!!� ���!��������������(��� �������� �(������������ �������� (!��$�"��% ����
.//A� �� � .//0,� �� ����� ������� � � $� ��!������ ��� ���!� ����� � (�� ��� ���� ��� �������� ��� �"��������
�����"����� ����(����� ��������� �����!��� ���6(�!�����!��������������,�
�1���!���� �����% � ��� ���� % ��7� ��� !������� �(����!� �� � ���!����� ������"(����!� ��� ���� !("#���� ���
���(��������������� �����!��� ���6(�!�����!�����"��!(� � ���!� ��!������% !G�
• ������� ��!������6(��������� �����!���� ������!�� (����������1��!!�������� �(� �������
��� 4��� �����!("!�6(���� ����������������!����������� (������ ��7������������% ��������
�����!�����(��� ,��
• ������ !������� ��!� ������ ������� "$� !������� ���(� � ����(���� ���� ���!� �� ?��� ���� �
���� �(� �������� ,�
• � ���� � ��� ��$� ���� � �$� ������� ����<���� � ���(��!� 9���� �1�� ���4� ��!�� ���!� ���� ������
�������������!���7� ���!;,�
• �����������(��� �9���;4�% ��������7!����������� "��� �� ��7��������������"�������� !�
�% �� �$!���������� ��������(���� ������ ��% �� �$!������� ��������(���� ���4�����!���
������� ���������!����% ������������ ��7���"������!����� ����% ��������������(��������,����(��
�!� �!���$� �% ������������������� "��� ����� !��!���!!���������������(���� �����������
���,���!��!���!����<���� �� ��!(��,�

173
• ��� ����������� ������� � 9���;� � ��!(��!� ���� ����������� ��� ���!� ��� % ����� ���� !�����
���������������% �!��������������������6(����,���!��!���!����!����<���� �� ��!(��,�
• ���(�� �!� ���!���� � % ����� ���� ��6(����� ���!� % ���� ��� �1����� � ���� � ���� ���4� ���(�� �!�
������ �% �����������6(��������!�� ���������% �!��1����� 4��� ����(���!� �!���$� ��������
��!�� % ����� ��!!� % �!� �"����� � ��� ���� � % ���� % ���� % �!� �1����� ,� ��� �!!(�� ����4�
���(��4��!�% ������������1�������������������6(������!�������!!��������� ���������% ��������
� ��7����1����!���������������!�����!,�3 ���������"���� �!��������� ��!(��G������ ��7��4�����
��6(��������"���H�
• ���(�� ��������� ���� ��!�� "�� �!!�!!� � "$� � ��!(����� �������� ���������� �� � ���<����������
�� ������!� �� � ��� ������� ���� � "������ �� � ������ ���� ���4� ��� �����!�� ��� �� (!��$�
"����� ��7� ��� �����!�� ���� ���(�� ��� ���� !� ����� � � ���� ������������ ��� ��$� � ������ �� �
��6(�!������ �������$,���!� !��(� � "�� ��� ��!(��� ���� ����� ������ � � �(� � �� � ����<���� �
���(����������,�
• ��� ���������� ����� ����!� % ���� �$������$� ����( �� �������!� ���� !����4� ������ !������� ���
���(��!4� �"�?�6(��$������4����(����������!�� ���������9���% �������!����������!�� ����% ����
"��������6(�!�����;4����,�
• )��<����������� �����!�% ��������( ��� ��!(��!������ ����� ������������ F!��"����$�����������
�� � !(!����� ���(�� ����� ���� ����� ���� � �� � % ���� ����( �� ����� ����!� !(��� �!� ����!!� ���
6(����$���!�(���!4����% �������(��(��9��� (�����;4��� ����� �����������!$!��� !4�����!!����
6(����$�!7���!4�����!!����� ��7��!4����,�
• 3 ����� ���� ���� �!� � � �� ���� ����$� ��� ��� ��$� % ���� ���� ��6(���� ���!� ��� ���� � ������
������4� ���� ���� ���!� ��� �!!(�!� !(��� �!� ���� �(���� �� ��� ���� !� ��� ���� �$��� ���
�� ��% ��� ���� �������� �� � % ���� ���(�� ���$� "����� ��� ���� �������!���4� ���� �������
������� ������� ���4�������� ���F!�������������� �������������������� ���4������������ �
� ����������� ��� � ������ �������!4� �� � ���� !��(����� ��� ������� ���� ��� ��!� ��7�� ����
�1�� ���!������������$�!���� ��11����% ������ (���<"���������� ���� ��!�% ����!��(�� �% ����
�!7�� ��������!����������4��� ���!�������!4�������������� ������!,�
• ��� ����� � ��� � ��!(����� !��(� � "�� A<-� $���!� ���� !����� ���� � �� � -<+/� $���!� ���� �����
���� ,�
������ ������% ��������� ���������� ����(���������% ���������"��"�!� ��������� "�����������!�� �����
���� �"���� ����� ����!� ����� ���� �������"��� ��� �� ������(���� !��(�����,� ����� �� ��� (��� % ��������!�
� �$����$���������!��(�����,���!������� ����!��� ������1����� ��(���� �!�!��(� 4���% ����4�"��
���< ����� ��� � "������ ���� ���� �� � ����� � ��!(�� � �����!�� ���� ���� �(���� �4� ��� ��� �� (!��$�
"����� ��7������$���������� ���������� ��!(��,�)��������!!4�������!��(� ���!��"��!�� ��7�$�"�!���
����� ����!� ����� ����� ��7��� !��(� � �1����� ��� ����� ���� ��� ���"��� ����� ��� ����!��4� "(�� ��!�� ���
��!(��� � �6(���� (�� ��������� ���� � ���� ���������� ����������� ������ ��� ���% ,� 5��1�"����$� % ���4�
��% ����4�"������� � ����� ������������������������ ����!������������������(��6(���!!���������
���,�

174
��� �����(!���4� ���� !("#���� � ������ �!� �"�(�� � �����!� �� � ��6(�!�����!� ��������� ���(�� ����
!������� ��!,�2�������������(����������������������� ����<��������������� ����!�� �$����7�!�(� �
�� � �� ���!!���4� �� � � �$� "�� !(!�����"��� ��� ���� � � �(� � ��� ����� ���� 4� (���� ����$� !������� ��!�
% �������� ����$��������!��������������!������������!�����!���!�"�����������������C����� ���������������
���� � �� ���(��� ��� ������ ����!�� ���� ��� ���� ���� � ��� �� ����� � �������!� ����(��� ��� �� !� �� �
������!�!����!����������4�!��������!����������� ���!�����(���% ��������(�������(���$����% !����������
��� !����!������� ��!,�
3 ���� ���!� "��7���(� � ��� � �� 4� �� � $�(���1��������� % ����� �����!� �� � ��6(�!�����!� ��� ���� ��!�4�
��% �(� � ����������� ��� ��� % �� ��(� � �!�(!!� ���� ������� � 6(�!���������� ��� �� !����� ���<��<����
��������% ,����% �(� ����"�"�$���6(����*-�� ��(��!����+���(�����$�(����� �,�I�(�����(���� ��(� �����
% ����(� �("�� �$�������"(����� � ��!��$���������(���� ��������!� �!!���������% �������(� �"����������
�������� �������� (!��$���������,��
���7�$�(��� ������ !�
�
3 ������ �D3 ���)��� ���

175
APPENDIX B: MERGER AND ACQUISITION QUESTIONNAIRE
+ :<�:<#��> 7 ��,A 0�#�!�� > #�A 0 :#!�� >> ��<: 7�#,0##�� > �
+, 2�% �� ��$�� �����!��� ���6(�!�����!������$�(�"����������� ���������������!��$���!H�
., ���$�(�����!������1��������4� ��� �������� ���6(�!������ ���!����������������������(������
!������� ��!H������!% ���������!�6(�!����4���(� �$�(��� ���������������% ���G�
�, 3 �������������< ����� ��� ��(���� �!4��1���������!��������� ����!4������������� �
���<���������4�������������� ���!H�
", 3 �!�����������!�< �����!!�!!� ����"�!� ���� �����(���� ����� ���� �% ����% ����
% �!��1����� H�
�, 3 ������������$�!������������� ����!������ ������!������% ����(!� H�
A, ��!� �������� �!�(!!���� ��(� ����������� 4��� ����!� ���������<���� ���!G�
�, 3 ����% �(� �$�(����!� ������"��!�� �������������� ����!�������������$�������������
���� �(������������ �������� (!��$H�
", 3 ���� % ��������� % �(� � $�(� ����$� ��� ���� �����(!� ����� ����!� "�!� � ��� $�(��
�1����������� ��1������������������(�(��H�
*, 3 ����% �(� �"��$�(�����% �������������(!�� �����!��� ���6(�!�����!�������������7���������
����� ��������� ��$�% ����������6(���� ���!��������� �������������������� !������% ����(��
!��(� �"��� ��!(�� H�
-, 3 �����!�$�(����������������% !�������� �!�(!!���� ��(� ����������� H����!��������� ����
��� ������!�����������% ������% ����(��!��(� �"��� ��!(�� ����� �����!��� ���6(�!�����!4�
% ����������(��������������������� �(������������ �������� (!��$H�
>, ���$�(�"���������������!�!�( $��!������ ����������������� �������� (!��$4��� �% �$H�
@, ��$���������� � ���!������ �������"(������������!("#����� �����H�
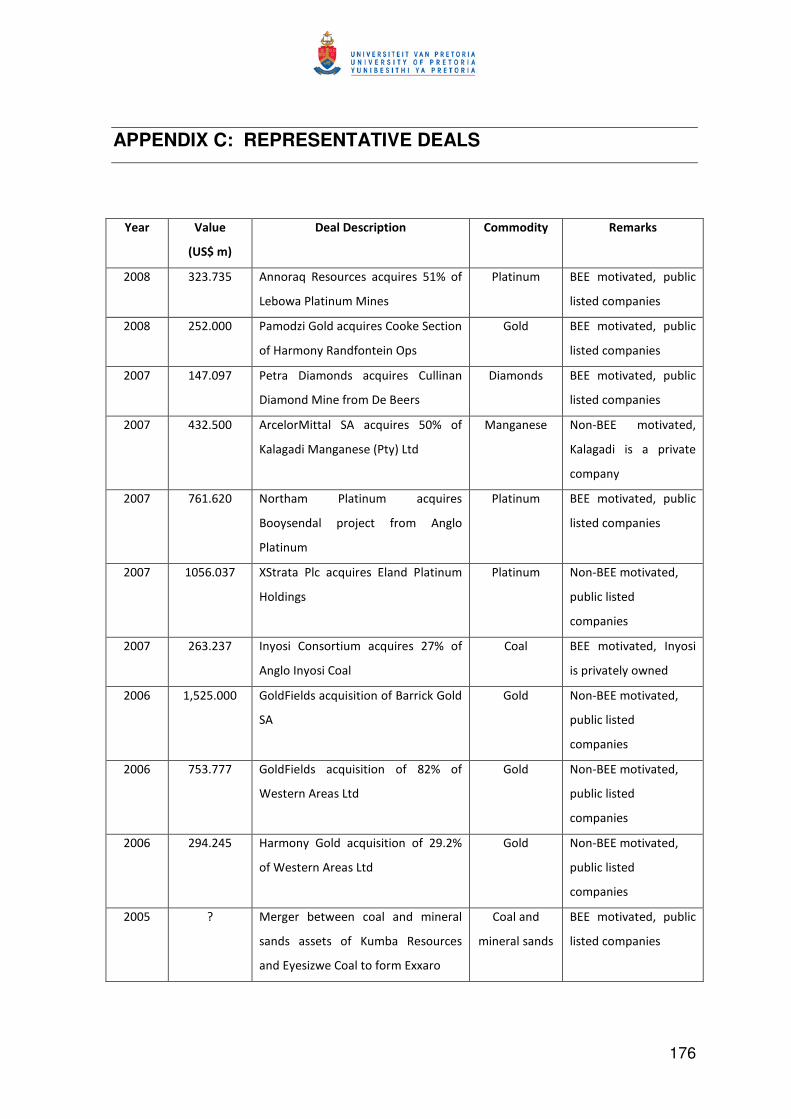
176
APPENDIX C: REPRESENTATIVE DEALS
B���� 3�����
'0#1�� )�
7����7��&�������� ,�� � ����-� <�� ��8��
.//0� A.A,@A-� ������6� '�!�(���!� ��6(���!� -+= � ���
��"�% ��������(� �� ���!�
������(� � ���� � ������� 4� �("����
��!�� ���� �����!�
.//0� .-.,///� ��� � C��&�� ���6(���!���7�� �������
���2��� ��$�'�� ����������!�
&�� � ���� � ������� 4� �("����
��!�� ���� �����!�
.//@� +*@,/J@� ������ ���� �� !� ��6(���!� (�������
���� �� �� �������� ��������!�
���� �� !� ���� � ������� 4� �("����
��!�� ���� �����!�
.//@� *A.,-//� �������� ������ �� ��6(���!� -/= � ���
D����� ��� ������!��9��$;��� �
� ������!�� ) ��<���� � ������� 4�
D����� �� �!� �� ��������
��� ���$�
.//@� @>+,>./� ) ������ � ������(� � ��6(���!�
���$!�� ��� ���#���� ���� � ������
������(� �
������(� � ���� � ������� 4� �("����
��!�� ���� �����!�
.//@� +/->,/A@� K ������ ���� ��6(���!� ���� � ������(� �
2�� ���!�
������(� � ) ��<����� ������� 4�
�("������!�� �
��� �����!�
.//@� .>A,.A@� ��$�!�� ��!����(� � ��6(���!� .@= � ���
��������$�!������
���� ���� � ������� 4� ��$�!��
�!���������$��% �� �
.//>� +4-.-,///� &�� 5��� !���6(�!���������������7�&�� �
���
&�� � ) ��<����� ������� 4�
�("������!�� �
��� �����!�
.//>� @-A,@@@� &�� 5��� !� ��6(�!������ ��� 0.= � ���
3 �!���������!��� �
&�� � ) ��<����� ������� 4�
�("������!�� �
��� �����!�
.//>� .J*,.*-� 2��� ��$� &�� � ��6(�!������ ��� .J,.= �
���3 �!���������!��� �
&�� � ) ��<����� ������� 4�
�("������!�� �
��� �����!�
.//-� H� � ������ "��% ���� ����� �� � � �������
!�� !� �!!��!� ��� D(� "�� '�!�(���!�
�� ��$�!�C% ������������� ��11����
������ �
� �������!�� !�
���� � ������� 4� �("����
��!�� ���� �����!�

177
.//-� ++J,.@@� ���% ���� '�!�(���!� ��6(���!� .A= � ���
� �������� ��'�!�(���!�
������(� ��� �
��� �
) ��<����� ������� 4�
�("������!�� H�
.//-� ->.,JA0� ��������� 2�� ���!� �� � ��6(���!� .>= �
����������!���!��� ��� �� ���!��� �
���� �� !� ����� ������� 4�
����������!�����������
��� ���$�
.//*� +4.**,J/0� ) ����!7� ) ��7��� ��6(���!� ./= � ��� &�� �
5��� !�
&�� � ) ��<����� ������� 4�
�("������!�� �
��� �����!�
.//A� H� � ������"��% ����2��� ��$4��'� ��� �
�� � ��6(�!������ ��� ��� ��� �!!��!� ���
���� �2��� ��$������!��(������!�����
&�� � ���� � ������� 4� �("����
��!�� ���� �����!�
.//A� -/-,/J+�� ������ ���� ��6(���!� A+,>= � ��� D(� "��
'�!�(���!��� �
��������4������
�� �� �������
!�� !�
) ��<����� ������� 4�
�("������!�� �
��� �����!�
.//A� +4-A0,@>@� � �����!�"��% �����!������&�� 5��� !�
�� � �����&�� � �� � ��� �������
�����&�� ��!������
&�� � ) ��<����� ������� 4�
�("�����!�� ���� �����!�
.//A� -./,>.J� � �������� �� '�!�(���!� ��6(���!�
+/= ����&�� 5��� !�
&�� � ���� � ������� 4� �("����
��!�� ���� �����!�