Do Wealth Creating Mergers and Acquisitions Really Hurt Bidder Shareholders?
63
1 Do Wealth Creating Mergers and Acquisitions Really Hurt Acquirer Shareholders? * Ron Masulis † , Peter L. Swan ‡ and Brett Tobiansky § , School of Banking and Finance, Australian School of Business, UNSW Draft: June 16, 2011 ABSTRACT We examine the expected economic benefits of mergers and acquisitions. We conclude that both signaling and revelation biases are responsible for the commonly reported finding that on average takeovers are harmful to acquirer shareholder wealth. After accounting for these two biases that lead to a price fall on announcement of 18.9% ($563.9 million), we demonstrate that acquirers generally benefit from takeovers with an average 81% share of the economic gains from the transaction. By studying bids that fail for exogenous reasons, which are largely free of signaling and revelation biases, we confirm the neoclassical view that takeovers are positive NPV projects for a typical acquirer, which produce a sizeable return on capital of 21% to the acquirer ($626.6 million) and 21.2% ($772.2 million) to the combined acquirer-target. This conclusion is based on two important findings. First, on a failed acquisition announcement, the combined acquirer and target value on average falls, where both target and acquirer suffer significant negative abnormal returns. Second, acquirers share in a significant portion of the economic benefits of a successful acquisition, reflected in a significantly positive relationship between acquirer and target stock returns utilizing a 60-day initial bid announcement window and a 100-day period following the termination announcement. Over the same window, exogenously failed cash bidders significantly underperform successful cash bidders by 10.7% and exogenously failed stock bidders significantly underperform successful stock bidders by a further 15.5% making a total differential of 26.2%. Moreover, in the long term, stock-funded targets typically only receive half the premium of cash targets. Key Words: M&A, takeover bids, acquisition benefits, acquirer gains, acquisition synergies, failed bids. JEL Codes: G34, G14 * We thank Ken Ahern and Emir Hrnjic for constructive comments. Also, participants at Financial Intermediation Research Society (FIRS) Conference, Sydney 2011. Eugene Chua, Nick Orlic, and Ewe Helmes provided assistance earlier on. † Email: [email protected]. ‡ Contact author. Department of Banking and Finance, ASB, UNSW Sydney NSW 2052 Australia. Tel: +61 (0) 2 9385 5871. Email: [email protected]. § Email: [email protected].
-
Upload
independent -
Category
Documents
-
view
2 -
download
0
Transcript of Do Wealth Creating Mergers and Acquisitions Really Hurt Bidder Shareholders?
1
Do Wealth Creating Mergers and Acquisitions Really Hurt Acquirer Shareholders?*
Ron Masulis†, Peter L. Swan
‡ and Brett Tobiansky
§,
School of Banking and Finance, Australian School of Business, UNSW
Draft: June 16, 2011
ABSTRACT
We examine the expected economic benefits of mergers and acquisitions. We conclude that
both signaling and revelation biases are responsible for the commonly reported finding that
on average takeovers are harmful to acquirer shareholder wealth. After accounting for these
two biases that lead to a price fall on announcement of 18.9% ($563.9 million), we
demonstrate that acquirers generally benefit from takeovers with an average 81% share of the
economic gains from the transaction. By studying bids that fail for exogenous reasons, which
are largely free of signaling and revelation biases, we confirm the neoclassical view that
takeovers are positive NPV projects for a typical acquirer, which produce a sizeable return on
capital of 21% to the acquirer ($626.6 million) and 21.2% ($772.2 million) to the combined
acquirer-target. This conclusion is based on two important findings. First, on a failed
acquisition announcement, the combined acquirer and target value on average falls, where
both target and acquirer suffer significant negative abnormal returns. Second, acquirers share
in a significant portion of the economic benefits of a successful acquisition, reflected in a
significantly positive relationship between acquirer and target stock returns utilizing a 60-day
initial bid announcement window and a 100-day period following the termination
announcement. Over the same window, exogenously failed cash bidders significantly
underperform successful cash bidders by 10.7% and exogenously failed stock bidders
significantly underperform successful stock bidders by a further 15.5% making a total
differential of 26.2%. Moreover, in the long term, stock-funded targets typically only receive
half the premium of cash targets.
Key Words: M&A, takeover bids, acquisition benefits, acquirer gains, acquisition synergies,
failed bids.
JEL Codes: G34, G14
*
We thank Ken Ahern and Emir Hrnjic for constructive comments. Also, participants at Financial
Intermediation Research Society (FIRS) Conference, Sydney 2011. Eugene Chua, Nick Orlic, and Ewe Helmes
provided assistance earlier on. † Email: [email protected].
‡ Contact author. Department of Banking and Finance, ASB, UNSW Sydney NSW 2052 Australia. Tel: +61 (0)
2 9385 5871. Email: [email protected]. § Email: [email protected].
2
Do Wealth Creating Mergers and Acquisitions Really Hurt Acquirer Shareholders?
Draft: June 16, 2011
ABSTRACT
We examine the expected economic benefits of mergers and acquisitions. We conclude that
both signaling and revelation biases are responsible for the commonly reported finding that
on average takeovers are harmful to acquirer shareholder wealth. After accounting for these
two biases that lead to a price fall on announcement of 18.9% ($563.9 million), we
demonstrate that acquirers generally benefit from takeovers with an average 81% share of the
economic gains from the transaction. By studying bids that fail for exogenous reasons, which
are largely free of signaling and revelation biases, we confirm the neoclassical view that
takeovers are positive NPV projects for a typical acquirer, which produce a sizeable return on
capital of 21% to the acquirer ($626.6 million) and 21.2% ($772.2 million) to the combined
acquirer-target. This conclusion is based on two important findings. First, on a failed
acquisition announcement, the combined acquirer and target value on average falls, where
both target and acquirer suffer significant negative abnormal returns. Second, acquirers share
in a significant portion of the economic benefits of a successful acquisition, reflected in a
significantly positive relationship between acquirer and target stock returns utilizing a 60-day
initial bid announcement window and a 100-day period following the termination
announcement. Over the same window, exogenously failed cash bidders significantly
underperform successful cash bidders by 10.7% and exogenously failed stock bidders
significantly underperform successful stock bidders by a further 15.5% making a total
differential of 26.2%. Moreover, in the long term, stock-funded targets typically only receive
half the premium of cash targets.
Key Words: M&A, takeover bids, acquisition benefits, acquirer gains, acquisition synergies,
failed bids.
JEL Codes: G34, G14

3
1. INTRODUCTION
Many studies document that acquirers systematically destroy shareholder wealth in
mergers and acquisitions (M&As), while targets benefit at their expense.5 Moeller,
Schlingemann, and Stulz (2005) find that shareholders of acquiring firms over the 1998-2001
period lose 12 cents per dollar on takeover announcement and an incredible $240 billion in
dollar terms. In their survey, Betton, Eckbo, and Thorburn (2008) find a significantly
negative abnormal return of -2.21 percent for large stock bidders of public targets, which
shrinks to -0.3 percent for large cash bidders of public targets. Small stock bidders
approximately break-even, while small cash bidders gain 3.06 percent. Thus, if one sets a
zero NPV as the floor return to the bidder in an auction market, only small bidders, not large
bidders where most of the investment is, satisfy this rationality criterion. Bayazitova, Kahl,
and Valkanov (2011) find that these large acquirers (mega-mergers) account for 43% of all
merger outlays. Apparent value-destroying deals representing large negative NPV projects do
not represent some minor backwater in which irrationality flourishes. Strangely, in view of its
wealth-destructive properties, M&A activity plays a significant role in the global economy,
constituting $2.1 trillion in the US in just one year alone, or 15% of GDP (see Bao and
Edmans (2011)).
The virtually universal finding that acquiring shareholders do not gain from M&A activity
features in practically every major textbook (see, for example, Ross, Westerfield, and Jordan
(2008, p. 835) or Copeland, Weston, and Shastri (2005, p. 778)). The overall synergistic
benefits made up of the net change in the value of the bidder and target on takeover
announcement are marginally positive, where acquirer shareholders are distinct losers, while
target shareholders are clear winners.
These virtually universal findings stand in stark contrast to what may be termed the neo-
classical theory of M&A (see Ahern and Weston (2007)) which asserts the profit motive of
the acquirer will naturally drive the ownership of assets to their highest value use. It follows
from this motivation that the initiator (acquirer and its shareholders) will benefit from such
wealth-enhancing transactions, rather than suffer losses. Thus, if there are changes in
technology due (say) to innovation, regulatory changes, or shifts in demand for goods and
5 For an early example of a study showing that acquirer value falls at the time of takeover announcement see
Dodd (1980). Betton, Eckbo, and Thorburn (2008, Table 6) summarize 16 relatively recent large-sample studies
of acquirer returns. Most report sizeable takeover samples in which the bidder‟s share price reaction is negative.

4
services such that the existing ownership of assets is no longer optimal, M&A activity should
occur to redistribute the ownership and control of assets from a target to a bidder so as to
enhance the overall value of the merged firms, resulting in improved utilization of the
combined firm‟s assets.
In this paper and consistent with neoclassical theory, we show that there is no foundation
for the belief that, even where target shareholders benefit, this typically comes at a
considerable cost to acquirer shareholders. To the contrary, we demonstrate that not only are
the net economic benefits of M&A large, but they are typically shared between acquirer and
target. In fact, an acquirer on average gains the lion‟s share from a typical acquisition,
capturing a 81% share or US$626.6 million of the associated total economic benefits, which
average US$772.2 million. These gains are not obvious to researchers since making a bid also
releases bad news about a bidder‟s value, which reduces its equity capitalization by $563.9
million or 18.9%. While this loss in value is offset by the prospective benefits of a typical
M&A bid, the net effect implies little change in a bidder‟s equity value.
Most recently, behavioral financial economists have focused on the use of the acquirer‟s
own stock, rather than cash as the means of payment for the target (e.g., Shleifer and Vishny
(2003) and Dong, Hirshleifer, Richardson, and Teoh (2006)). It is argued that managers of
acquirers may use their firms‟ relatively overvalued stock to benefit their own shareholders at
the expense of target shareholders, with no combined economic gain to bidders and targets,
but potentially huge losses to society as a whole.
We show the findings, that acquirer shareholders and, particularly, large acquirer
shareholders, do not gain from takeovers and may be worse off, is due to a fundamental
“revelation bias” in the standard event study methodology used to identify synergistic gains
and, to assess whether acquirer shareholders are victims of manager-shareholder agency
problems.
First, acquirer managers rewarded for short-term performance often instigate a “signaling
bias” by deliberately timing the “good news” of the bid announcement to coincide with the
release of bad news such as unmet earnings targets (see Bhagat, Dong, Hirshleifer, and Noah
(2005)). This common practice, documented in the Wall Street Journal, 1998, p. C1,
confounds the information about an acquisition‟s value to a bidder that is capitalized into the
bidder‟s stock price on the acquisition announcement, and results in a downward revaluation
of a bidder‟s stand-alone value.

5
Second, the bid itself typically releases bad news about an acquirer, even when there is no
motive to distort the market‟s perception of company value. For example, it may reveal
serious empire-building tendencies of incumbent management, or management perception
that the bidder has run out of profitable internal growth opportunities (see Fuller, Netter, and
Stegemoller (2002), and Hietala, Kaplan, and Robinson (2003)). Shleifer and Vishny‟s (2003)
market timing explanation for stock bids when the stock is relatively overvalued falls into the
same category.
Third, the acquirer may already have a long history of generally successful bids, such that
a new acquisition announcement is no surprise to the market, which leads to a close to zero
market reaction even to a beneficial acquisition. Serial acquirers such as General Electric,
Cisco, GlaxoSmithKline and Capital One for example are possible examples in this activity.6
Fourth, for reasons relating to conflicts between existing and new shareholders put
forward by Myers and Majluf (1984), stock financed acquisitions represent new equity issues
that by their very nature can represent bad news about the stock‟s true value since stock may
be preferred to retained earnings and debt when it is overvalued.
Finally, the initial bidder announcement return could be downward-biased because of the
likelihood of failure, perhaps because of the subsequent entry of competing bidders. Bhagat,
Dong, Hirshleifer, and Noah (2005) introduce the probability scaling method (PSM) that uses
post-bid data to factor in the probability of a successful bid and the intervention method (IM)
to take account of the likelihood of competing bids. They show that both of these methods
increase the perceived value of the takeover and reduce the likelihood of finding that the
bidder is overpaying for the target. Hence, release of information that is extraneous from the
critical question of whether an acquisition will create bidder shareholder value poses a severe
problem from the perspective of traditional M&A event study methodology. The PSM and
IM methods tackle only limited dimensions of this complex problem.
Our study builds on the well-known contribution by Shleifer and Vishny (2003) that put
forward a conditionality explanation for stock acquisition offers as opposed to cash bids.
Acquiring shareholders may gain and target shareholders correspondingly lose from the
resulting swap of the firm‟s own equity for the target‟s relatively underpriced equity. Hence,
the issuance of stock bids is endogenous in this arbitrage operation and is conditional on
management discovering that their stock is overpriced relative to the targets. This mechanism
6 The point made here about expectations and share price reaction is quite distinct from the considerable
empirical literature on whether serial acquirers are successful or not.

6
is a major contributor to the “revelation bias” that occurs on a bid announcement as it signals
that the offer‟s acquisition currency, bidder stock, is relatively overvalued. Stock price falls
on announcement of a stock financed bid, not because it is a bad bid, lacking synergies and
likely to destroy shareholder wealth, but because this is a strong signal that the stock is
currently relatively overvalued, much like the signal released by a seasoned equity offer
announcement.7 Here, decisions to issue equity by a stock offer are conditional on some
value-destruction occurring within the firm itself that reveals itself to the market along with
the offer to the target or, less plausibly, that target shares are undervalued.
The most recent contribution to this literature is a study by Savor and Lu (2009) who
restrict their analysis to acquirers only. They find that withdraw stock bids suffer a more
severe value reduction than those that are not withdrawn. They interpret this finding to be due
to the unsuccessful bidders inability to swap their overvalued equity for fairly valued target
equity and conclude that, indeed, stock acquirers realize sizable benefits from successful bids.
In our analysis, we include the market responses of matched targets following bid failures to
show that value reduction occurs because failed bidders are unable to realize the synergistic
benefits associated with their bids, with both bidders and targets losing value as a
consequence. Both Shleifer and Vishny (2003) and Savor and Lu (2009) assume a complete
absence of synergistic gain, but since neither investigates the price changes in the associated
targets, their argument remains only partially tested. Since firms with relatively overvalued
equity are likely to have insufficient internal growth prospects, it makes sense for such firms
to concentrate on external growth prospects achieved via synergistic gains.
Our contribution is related to the fact that failed bids are subject to a much weaker
“revelation bias” relative to new bids, and this is especially true for stock bids. The bidder
stock price following the initial bid already reflects the endogenous valuation error of
announcing a stock bid due to perceived relative overvaluation, managerial empire-building
incentives, evidence of weak internal growth prospects, and all other revelation problems. By
contrast, the induced change in a stock bidder‟s value following an offer withdrawal
represents a much cleaner experiment than the market reaction to the initial bid
7 Seasoned equity issues by overvalued but mature firms are rare but nonetheless have statistically significant
effects in terms of explaining the probability of an SEO (see DeAngelo, DeAngelo, and Stulz (2010)). This
rarity could be explained in part by the likelihood that investors see through the ploy and thus underprice the
offering. Conditionality problems also plague event study analysis of stock splits, as well as stock-based
takeover announcements and seasoned equity issues. Stock splits generally occur only following stock price run-
ups. Hence, an event study of stock splits will show considerable value-enhancement whereas in reality none
has occurred (see Brown, Goetzmann, and Ross (1995)).

7
announcement. This is especially the case where a bid has failed for exogenous reasons
unrelated to the existing value of the bidder or the target. Unlike Savor and Lu (2009), by
matching our bids with their targets, we show that both bidder and target are subject to large
losses in value on bid withdrawal due to exogenous failure, consistent with both being subject
to loss of synergistic benefits. The more the target falls, the more the bidder falls, and vice
versa, indicating that the bidder as well as the target suffers a loss of synergistic benefits.
Thus our fundamental insight is that when failed bidders are matched with their associated
failed targets and the reason for deal failure is exogenously triggered, then it is possible to
impute the share of gains received by the bidder when the deal succeeds.
We find that studying failed bids yields a great deal more insight than conventional
approaches concerned largely with successful bids. With failed bids, one can observe the
subsequent long-term history of both the bidder and target, whereas with successful bids one
cannot generally observe either individual firm post-acquisition, as they are combined
entities. Thus, failed bids are a huge and largely untapped mine of new information about the
fundamental causes and consequences of mergers and acquisitions.
In this study, we overcome the problems in the existing empirical literature by devising a
new approach to assessing the economic benefits of the M&A offers by using successful and
failed takeover deals in our sample of both bidders and targets. Moreover, as a means of
increasing our analysis of matched bidders and targets when the bid fails, we compile a much
larger database of mergers and acquisitions over four countries: Australia, Canada, the United
Kingdom and the United States, compared with conventional studies that focus on a single
country.8 Using our new database, we take a novel approach to analyzing the gains and
distribution of the synergistic benefits in mergers and acquisitions between bidder and target.
Following Savor and Lu‟s (2009) approach of studying bidders in M&A offers that are
cancelled for exogenous reasons, we extend this concept to analyze target firms and a
matched sample, where requisite financial information about both an acquirer and a target of
an offer is available for our offer sample. Utilizing this large sample, we incorporated new
variables into our cross-sectional regression models, which include indicators of failed offers
and exogenously failed offers and acquirer and target reactions to their counterparty‟s
abnormal announcement returns.
8 We are not the first to consider acquisitions outside of the United States. For example, Netter, Stegemoller, and
Wintoki (2011) examine a comprehensive set of mergers and acquisitions.
8
Our central line of reasoning is as follows. One would assume that a rational economic
motivation for a bidder to enter into a merger and acquisition transaction would be the ability
to invest in a positive net present value investment and thus, return excess abnormal returns
to their long-term shareholders. This view is in line with the findings of Schlingemann
(1994), Cooney and Kalay (1993), and Lang et al. (1991). Hence, we seek to investigate
whether mergers and acquisitions are positive NPV investments for acquirers using either
cash or stock financing and yield genuine economic gains and do not simply transfer wealth
(theft!) from target shareholders in the case of stock bids.
Our research question follows from the above reasoning, which examines whether the
pursuit of synergistic economic benefits serves as the primary motive for acquiring firms
participating in merger and acquisitions. We find support for our first hypothesis that (HI) on
the announcement of a failure of a merger, the combined value of the acquirer and target fall.
Having shown that synergistic benefits do exist for the combined firm, we then evaluate our
second hypothesis that (HII) acquirers gain a significant share of the synergistic benefits
created on announcement of a merger or acquisition.
We conduct our analysis in two stages. First, using our entire sample of 2,963 acquirers
and 4,606 targets, we conduct an investigation into the abnormal returns around: (i) the initial
announcement of a merger or acquisition, and (ii) the announcement date that the merger and
acquisition either succeeds or fails with certainty. Specifically we find a mean stock price
run-up and announcement return for acquirers of two percent and −1 percent respectively,
representing an approximate net gain to acquirers on announcement of one percent. This
result is consistent with evidence from Ahern and Sosyura (2011) suggesting that stock
acquirers release a string of positive announcements in the lead up to a merger or acquisition
announcement, thereby boosting their share price. In their sample, merger talks begin on
average 64.5 days prior to the public announcement. Consistent with the findings of Andrade,
Stafford and Mitchell (2001), we find that acquirer and target abnormal returns over a five-
day window are −1.05 percent and 19.22 percent, respectively. Hence, our sample replicates
the standard finding using conventional methodology that acquisitions are destructive of
acquirer value, thus earning (apparent) negative synergies. We find that the combined firm
announcement returns appreciate on the initial offer announcement (2.67 percent) and fall on
the announcement of an offer failure (−1.82 percent). Thus, this evidence yields strong
support for the existence of overall synergistic gains in our sample, consistent with
Hypothesis I and the findings of many prior empirical studies.
9
The second stage of our analysis utilizes a series of cross-sectional regression models to
investigate the creation, and subsequent loss of synergistic benefits. Using an innovative
method of examining synergistic benefits, we split our analysis into three subsections. The
first subsection analyses the creation of synergistic benefits using an event study of an initial
announcement of a merger or acquisition. We improve on existing methodology by extending
the event window to include a 60-day period preceding the initial announcement to capture
any price run-up, potentially due to proprietary information leaks, and define the dependent
variable to be equal to this run-up plus the five-day window around the offer announcement.
We find that for long-horizon models of target abnormal returns, the market predicts offer
failures and exogenously failed bids, where targets of these bids earn significantly lower
returns leading up to and on the initial offer announcement. Additionally, we find a
significant positive relationship between acquirer and target returns, hence finding leading
support for Hypotheses I and II.
How can we rule out reverse causation - that the deal failed because the target found a way
to trigger deal failure after it correctly anticipates poor future acquirer performance? This
might occur when the target obtains information about acquirer overvaluation from its due
diligence investigation. We rule out this otherwise plausible story by also incorporating the
target‟s reaction to the announcement of deal failure when examining bidder abnormal
returns and vice versa when examining target abnormal returns around the same
announcement. Were the reverse causality story true, both the bidder and target would
decline in value together due to release of bad news about the bidder until the endogenous
collapse of the bid. The bidder would then continue to fall in value as it could no longer
receive the benefit of the relatively underpriced target, but the target‟s stock would shoot up
in value as it is now free of the yoke of being tied to the overvalued bidder. We do not find
evidence consistent with this scenario. In fact, we find quite the opposite. The values of both
the target and bidder continue to fall pari passu together for the next 100 days, consistent
with a mutual loss of synergistic benefits.
As noted by Fuller, Netter and Stegemoller (2002) and Hietala, Kaplan and Robinson
(2003), information is released on the M&A offer announcement. The takeover
announcement reveals information about the stand-alone value of the bidder and target in
addition to any potential synergies arising from the combination of the two firms, and
distribution of these gains between target and acquirer. Due to this complication in measuring
synergistic gains on the initial announcement of an acquisition, we study the loss of
synergistic benefits on the announcement of a failure of an acquisition. We find evidence in
10
favor of negative abnormal returns to acquirers, targets, and the hypothetical combined firm
on the announcement of failed bids.
A third form of analysis involves investigating the relationship of the expected synergistic
benefits found in a long-horizon study of acquisition wealth creation, and the subsequent
losses of these synergistic benefits. Measuring abnormal returns commencing 60 days prior
the initial announcement until 100 days post the date participants know whether the bid is
successful or fails, we find strong evidence for the existence of synergistic benefits for
acquirers, supporting Hypothesis II. Specifically, we find that failed cash bidders
significantly underperform successful cash bidders by approximately 10.7 percent and failed
stock bidders underperform successful stock bidders by a further 15.5 percent in bids that fail
for exogenous reasons. Additionally, we find that failed target stock prices in stock bids fall
back to their pre-bid levels, which is the reverse of the predictions made by Savor and Lu
(2009). We also find that after 100 days following deal outcome successful stock bidders do
only about half as well (relative return of -13.3%) as successful cash bidders. This
substantially subtracts from the target‟s premium and synergistic share.
According to the market timing hypothesis, acquirers purchasing targets use relatively
overvalued equity as currency. One would expect that on the news of bid failure, long-term
target shareholders would react positively, which is the exact opposite of our findings. We
agree that bidders with overvalued stock use their shares as currency. Our point is that the
market is not entirely fooled. The terms on which targets accept bidder stock reflects to some
extent the bidder overvaluation and collective synergistic gains so that the target price can
only fall on deal failure, not rise as proponents of no synergistic gains predict. Additionally,
we find strong positive correlations between acquirer and target announcement return,
suggesting that there is a strong complementarity and sharing of synergistic gains between
acquirer and target shareholders. This complementarity is inconsistent with the Roll (1986)
hubris hypothesis, which predicts a more positive bidder stock return (with a larger target
price fall) following a bid failure announcement reflecting a reversal of a bidder‟s stock price
discount for its expected overpayment for the target. It is also inconsistent with the Shleifer
and Vishny (2003) and Savor and Lu (2009) “theft” explanation as the bidder price falls and
target must rise in response to deal failure and the unwinding of the “theft” of the target‟s
relatively undervalued equity, according to this explanation.
Our study makes at least two valuable contributions to the literature. First, we propose a
new approach to examining the synergistic benefits in merger and acquisitions. Our evidence
suggests that looking at failed bids provides an additional opportunity to more clearly identify
11
the gains in mergers and acquisition by studying the unexpected loss of these expected gains.
Second, we show the possibility of improvements to current methodology by including the
acquirer price run-up as a dependent variable when studying acquirer and target returns in
M&A. This price run-up is significantly negatively correlated with the unexpected losses
incurred if the bid subsequently fails typically many months hence. Remarkably, it is not only
correlated with the fall in the price of the bidder, but also with the target with the impact on
the target only slightly smaller in magnitude. This is to be expected if there is sharing of the
synergistic gains, with on-going private negotiations occurring between bidder and target
during the run-up period.
We structure the study as follows. Section 2 reviews existing literature and develop a
contextual basis for our key hypotheses. Hypotheses are further constructed in Section 3.
Section 4 describes our data sources, acquisition sample and empirical methods. Section 5
contains the empirical work and discusses the results, Section 6 presents our estimates as to
how synergistic gains are shared and Section 7 concludes.
2. LITERATURE REVIEW
Real synergy involves combining assets in the form of positive net present value (NPV)
projects, creating positive excess (abnormal) returns to an acquirer‟s long-term shareholders.
By contrast, Roll (1986) posits the hubris hypothesis that at least some managers over-bid for
targets due to errors in valuing synergies, leading to no overall value improvement. These
inefficient investments can also be due to agency problems such as empire-motivated
managers not acting in shareholder interests.
Jennings and Mazzeo (1991) conclude that bidders learn nothing from the share price
reaction to a bid. Thus, a negative share price reaction does not make deal completion less
likely. Luo (2005) disagrees with the earlier finding, utilizing a larger deal set and different
methodology and set of tests. We find that the pairwise correlation coefficient between the
cumulative abnormal returns (CARs) of the bidder over the five-day window is uncorrelated
with bid outcome in agreement with Jennings and Mazzeo (1991). When we add in a full set
of controls, the market is able to predict failure of the sample inclusive of endogenously
failed bids but not exogenously failed bids. Failure significance disappears even for
endogenous sample inclusive of the run-up period after maintaining the full set of controls.
Hence, the full market reaction to the bid does not appear to predict bid failure, suggesting
that the presumed inside information is not affected by the reaction of outside investors. This

12
evidence is consistent with our finding that the market reaction to the bid announcement does
not say a great deal about likely synergistic gains accruing to the bidder. We do find,
however, a significant negative correlation between the target announcement CAR and bid
failure that disappears when a full set of controls is included. Once we take account of the
target‟s price run-up and thus the information leakage, the market appears able to predict deal
failure for targets, but not for bidders. This is not so surprising when one considers that the
target event is much cleaner as it is not so contaminated by the revelation of bad news about
the bidder.
Schlingemann (1994) conducts a study of 623 cash takeovers during the period
1984−1998. He concludes that retained-earning sourced cash transactions positively relate to
bidder announcement abnormal returns. He attributes this finding to firms using internally
generated cash to invest in positive NPV investments (Cooney and Kalay (1993)).9 The
results of the study are also consistent with Lang et al. (1991) who hypotheses that managers
at times have incentives to waste excess free cash flows in wealth destroying investments.
Martynova and Renneboog (2009) conclude that transactions financed by internally generated
funds underperform those financed with debt. Lang et al. (1991) also identifies a relationship
between Tobin‟s q and investment policy such that that high q firms, compared to low q
firms, are more likely to have positive NPV projects. Hence, low q firms should on average
pay out their excess cash, rather than invest in poor acquisition prospects.
Grinblatt and Titman (2002) suggest, “the stock returns of the bidder at the time of the
announcement of the bid may tell us more about how the market is reassessing the bidder‟s
business than it does about the value of the acquisition”.10
Similarly, Hietala, Kaplan and
Robinson (2003) note that the announcement of takeovers reveals information about the
stand-alone value of the bidder and target, any potential synergies arising from the
combination, and the distribution of gains between the target and acquirer. Additionally, they
state that it is often not possible to infer the respective synergies, overpayment, and
distribution of gains simply from the change in the market price of the bidder and target. Our
model hopes to fill this gap by including a failed sample where the bid has failed for
exogenous reasons. Thus, an unexpected offer failure provides valuable additional evidence
about the value of an offer captured in the forgone economic gains of the offer.
9 Cooney and Kalay (1993) adopt the innovative methodology of including negative NPV projects into the
financing decision, shows that the new issue of equity to finance projects can signal an exceptional valuable
project, where the market may react positively to the news. This is contrary to the prediction by Myers and
Majluf (1984) where they believe that the market will never react positively to new issue of equity. 10
Grinblatt and Titman (2002, p. 708).
13
A negative share price reaction to offer withdrawal announcements for targets should
indicate the size of the loss of synergistic benefits (Bradley, Desai, and Kim (1983) and
Samuelson and Rosenthal (1986)). Bradley et al. (1983) find that after an offer withdrawal
the target‟s share fall back over an extended time-period toward its previous pre-offer levels,
as it becomes clear that no subsequent acquisition bid is likely. Comparatively, those targets
that receive subsequent offers experience additional increases in share price. Bradley‟s (1980)
study of 100 percent cash offers shows that bidders experience severe negative reactions to
offer failure, compared to positive reactions for successful offers.
Savor and Lu (2009) incorporate failed bid announcements into their sample. They
interpret the larger reduction in share price for failed stock offers, compared with successful,
as an inability to swap overvalued equity for more fairly-valued target equity. A more
plausible explanation is the inability of failed bidders to attain anticipated synergistic
benefits. Savor and Lu also point out that failed cash bids do not suffer such a loss in value
and continue to perform relatively well compared to failed stock bids. We agree but our
explanation is entirely different: stock bids by their nature, with high relative Tobin‟s q and
high-priced equity indicative of bidder relative managerial advantage, achieve far higher
synergistic gain. Hence, the loss on exogenous deal failure is also far higher. Their
supposition of no synergistic gain for stock bids predicts the exact opposite of their finding:
their failed stock bids should do much better than failed cash bids as the former suffer no loss
of embodied synergistic gain by assumption.
An important part of Savor and Lu„s approach is their solution to the endogeneity problem
that arises from the inclusion of failed bids. Bidders with overvalued stock have greater
incentives to propose stock as the mode of payment rather than cash. This complicates
matters as the bid may fail due to target shareholders discovering the acquirer‟s
overvaluation. Savor and Lu solve this endogeneity issue by attempting to create an
“exogenous failed subsample” where mergers fail for exogenous reasons outside of the
control of the bidder or target, and thus are unrelated to the acquirer‟s or target‟s valuation.
M&A researchers rarely use the technique of failed acquirers in their analysis.
A natural extension of the Savor and Lu approach is to focus on target reactions to bid
failure. If the market-timing theory is correct and no synergistic benefits exist, then rational
target shareholders should expect that a bidder‟s stock to be relatively overvalued. If this
happens systematically over time then in anticipation of future acquirer price falls, the price
of the target may fall below the notional cash value of the equivalent acquirer stock even
though the acquisition seems very likely to go ahead. Thus, upon the announcement of the

14
stock bid failure, the target share price could go up if the target‟s price has significantly fallen
for this reason. Alternatively, it may drop slightly representing only a fraction of the notional
value of the bid. In contrast, this study postulates that synergistic gains exist. Hence, upon the
offer failure announcement, we expect to see a fall in the combined value of the acquirer and
target equity capitalization due to a loss of jointly shared synergistic gains. More specifically,
we do not expect to see a target‟s share price rise because shareholders are no longer to
receive burdensome stock that may be rapidly falling in value. Instead, we expect the bidder
stock price to fall in a complementary fashion to the fall in target price, due to a shared loss in
synergistic benefit.
Ahern (2011) finds that in terms of dollar gains, targets do not do a geat deal better than
acquirers that tend to be much larger. Moreover, in vertical acquisitions a target‟s relative
scarcity and product market dependence help explain its share of total merger gains. Cai,
Song, and Walkling (2011) present evidence to show that some bids come as more of a
surprise to the market than others. In particular, the first bid in an industry has both greater
surprise and a higher return than subsequent bids. They conclude that, after accounting for
anticipation, bidding activity generates wealth. Malmendier, Opp, and Saidi (2011) find that
targets react much more favorably to cash bids than do stock bids on a deal failure
announcement utilizing a relatively short 25-day window. They suppose that cash targets are
initially undervalued so that by paying in cash rather that stock, the bidder captures the entire
gain. We find no difference in the way stock and cash bids react negatively to deal failure
with a much longer event window post the deal outcome news. It is true that we find stock
financed targets return to their pre-bid levels within the 100-day window following a deal
failure announcement and cash financed targets do not. Hence, we believe that failed targets
of cash bids remain in play for longer, even though Malmendier, Opp, and Saidi (2011) find
no evidence that they do subsequently become targets.
Dimopoulos and Sacchetto (2011) structurally estimate preemptive bidding and target
resistance based on an extension of Fishman‟s (1988) theoetical model. They show that only
rarely is there a second bidder, meaning that most initial bids are preemptive. Their
simulations imply that the initial bidder‟s valuation of the target is 97% of the pre-bid value
and potential rivals far lower at only 58%. This means that prospective synergistic gains are
likely to be the monopoly of just one bidder and the main barrier to the bidder extracting
most of the gains is target resistance. Our findings are the first to justify the high initial bidder
valuations that are otherwise unexplained by their modelling. Furthermore, in their
framework, deals fail endogenously because synergsitic gains are insufficient to overcome

15
target resistance. Thus, endogenously failed deals yield fewer synergistic benefits than
exogenously failed deals, which is precisely what we find with our sample of endogenously
and exogenously failed deals.
3. Hypothesis Development and Construction
3.a Hypothesis Development
As outlined above, despite a comprehensive body of research documenting the
performance of firms around acquisition announcements and the motives behind these
takeovers, there are serious limitations with these methodologies due to revelation and other
biases. We will analyze the short and long-term impacts of M&A offer failures. From this
analysis, we seek to fill some important gaps in our understanding of the motives for mergers
and acquisitions and in the process, to improve on the interpretation of M&A announcement
effects. We first assess whether the pursuit of synergistic benefits is a plausible motive for
bidders to make takeover offers.
Hypothesis I:
In our analysis, we include failed and exogenously failed takeover bids. In doing so, we
overcome the revelation bias issue posed by Hietala, Kaplan and Robinson (2003), where the
announcement of a takeover reveals information about the stand-alone value of the bidder
and target and their businesses, in addition to any potential synergies arising from the
combination of the two firms. Based on the existing literature and empirical evidence, we
propose the following hypothesis:
HI: On the announcement of the failure of a merger and acquisition offer, the combined
value of the acquirer and target will fall.
We foresee that this result will prove robust to a variety of samples, methodological
approaches, and estimation techniques, revealing that on an M&A offer failure there is a
decline in the combined acquirer and target equity capitalization, and hence a loss in
synergistic benefits.

16
Hypothesis II:
We hypothesis that:
HII: Acquirer shareholders gain a significant share of the synergistic benefits created on
the announcement of a merger and acquisition and, similarly, lose a significant
amount on failure of the bid.
To assess the validity of this proposition, we employ both event study analysis and cross
sectional regression models to analyze the returns around initial bid announcements and
failure announcements. We seek to assess whether bidders gain a significant share of the
expected synergistic benefits on announcement of an M&A offer. To test this proposition, we
examine whether on the announcement of a bid failure, bidder stocks lose their expected
portion of the synergistic benefits created at the bid announcement.
4. DATA AND METHODOLOGY
4.a Sample Construction
This study focuses on initial merger and acquisition offers and possible later withdrawals
announcements. We study merger and acquisition offers for public targets from four major
“Anglo” developed economies: Australia, Canada, the United Kingdom and the United
States, mainly to increase sample size particularly for the “failed offer” sample. Our study is
the first to combine data on matched acquirers and targets from a number of Anglo countries
with quite similar competitive tender offer rules. The core data used in this study represents
merger and acquisition characteristics, which comes from the Securities Data Corporation‟s
(SDC) Platinum Global and US Mergers and Acquisitions database. We examine initial bids
announced between January−1, 1985 and December 31, 2009 and obtain the following
information on from the SDC Platinum database: (i) the identities of the parties involved in
the transaction, (ii) whether the deal was consummated, (iii) the deal‟s mode of payment, (iv)
any toehold the acquirer or target held in each other prior to the offer, (v) the initial offer
announcement date, (vi) the announcement date of offer consummation or withdrawal, (vii)
offer characteristics, (viii) the industry and nation of the acquiring and target firms.

17
Where possible stock returns, firm size and accounting data, are obtained from the
CRSP/Compustat merged database. Due to the limited coverage in the CRSP/Compustat
merged database of international stocks, we used Datastream to collect stock returns, firm
size and accounting data. Since Datastream has limited financial statement coverage, we also
relied on Aspect Huntley, ORBIS and SDC Platinum to obtain the missing accounting
information.
The M&A sample criteria are as follows.
(i) The target is a public listed firm that is incorporated in Australia, Canada, the
United Kingdom or the United States.
(ii) The acquirer is a publicly listed firm.
(iii) The deal can be clearly classified as successfully completed or a failure.
(iv) The bidder seeks to acquire more than 50 percent of the target firm shares in order
to gain control and holds less than 50 percent of its shares beforehand.
(v) The deal value must be greater than one million dollars.11
(vi) The method of payment used in the bid must be solely cash or stock.
(vii) The firm‟s stock is actively traded and its stock price and market value must be
readily available from either CRSP or Datastream.
(viii) The firm‟s annual financial statement information must be available from
CRSP/Compustat Merged Database, Datastream, Aspect Huntley‟s FinAnalysis,
ORBIS or SDC Platinum.
(ix) Deal value must represent five percent or more of a bidder‟s equity capitalization
to insure that the deal has a material impact on a bidder‟s stock price.
The final sample includes 3,147 acquirers and 4,793 targets firms. Table 1 reports the
reduction in the sample as we impose additional sample criteria. We start with raw data
collected from SDC Platinum and in the end obtain our final sample shown in Table 1, Panel
A. We finally require the bidder and target firms to have stock price and accounting data
available, which yields our final dataset described in Table1, Panel B.
<<Insert Table1 about here>>
11
Deal value is defined in US$ as the consideration paid by the acquirer for the target, excluding fees and
expenses.
18
The four-country selection allows us to analyze the motives for cross-border acquisitions
and to analyze merger and acquisition activity outside the US, as well as to substantially
expand our sample size. Along with the usual sample criteria, we required that bidders seek
more than 50 percent of target shares since at this level of ownership an acquirer will
typically have full control over the target. We also find that setting an absolute cut-off on the
method of payment of either 100 percent cash or 100 percent stock, does not significantly
reduce the sample size.12
The final sample consists of 2,963 acquirers, 4,606 targets and 1,941 deals where data is
available for both acquirer and target. Figure 1 describes the time-series distribution of the
sample and the US dollar amount of stock bids relative to cash bids in each year. The figure
first shows that that we have more targets than acquirers with the required data and even
fewer deals where we have data for both bidder and target. Second, we identify the
frequencies of stock and cash financed deals in the sample. Stock based deals become more
popular than cash financed deals in the 1990s, which corresponds to the 1990s merger and
acquisition boom. The merger boom of the second half of the 1990s is noteworthy for the
largely stock financed transactions. Table 2 presents the sample distribution of completed and
failed bids, by country and by stock and cash financed deals.
<<Insert Figure 1 and Table 2 about here>>
According to Shleifer and Vishny‟s (2003) market-timing hypothesis, overvalued firms
have a relatively greater incentive to make stock acquisitions. Hence, an acquiring firm may
use mispricing of their stock to swap their overvalued equity for relatively less overvalued
target equity. This is very similar to the adverse selection in the Myers and Majluf (1986)
model of stock offers. Thus, the acquirer is using its overvalued stock to purchase a target‟s
assets at a discount. This hypothesis corresponds to the evidence presented in Figure 1, where
we see that the stock market and merger booms of the 1990s corresponds to an increasing use
of stock over cash as an acquisition currency. An announcement of an equity-finance merger
and acquisition may signal that the acquiring firm is mispriced and overvalued. Accordingly,
one expects on this negative signal of overvaluation that the acquirer‟s stock should fall in
value. Hence, if synergies exist from combining two firms, then on the offer announcement
they will co-mingle with the negative signal. This makes it difficult to isolate the synergy
12
A table of bids lost by imposing the 100 percent cash or stock requirement is available on request.

19
effect when studying the distribution of returns on the announcements of M&A deals. Thus,
we construct a sample of failed bids caused by exogenous factors, where the bids fail for
reasons extraneous to the valuation or decisions of the acquirer or target.
4.b Exogenous Failed Bids: Sample Construction
We follow a method similar to Savor and Lu (2009) to construct a sample of exogenously
induced merger and acquisition bid failures, shown in Table 3. As postulated in the market-
timing theory, there is a positive relationship between a firm‟s overvaluation and the
probability of a stock-based acquisition when bids fail due to target shareholder recognition
that a bidder‟s equity is overvalued. Empirically, on the initial announcements of stock-based
deals, bidder returns significantly underperform cash-based deals.
<<Insert Table 3 about here>>
To account properly for loss of expected synergies, we must first be sure that expected
synergies are associated with the acquisition announcement. We know that a variety of
important pieces of information are released with the initial bid announcement. The
announcement reveals information about the stand-alone values of the bidder and target, the
expected synergies arising from the combination, as well as the distribution of the expected
synergies between target and bidder shareholders. Thus, we must exclude bids where the
offer is doomed to fail from the beginning, or failed because of any revelations concerning
bidder or target valuation. Thus, we construct an exogenously caused offer failure sample,
which reduces our “failed bid sample” by more than 50 percent
Our methodology differs slightly from Savor and Lu (2009) because we include target
firms and a matched sample (where we have both acquirer and target firms in our sample).
Therefore, we determine what is exogenous in context of the three different sample
categories. The goal of the exogenous sample is to keep only deals that fail unexpectedly and
for reasons that are outside of the two firms control, which in a semi-strong form efficient
market means that new information was not previously priced by the market. Ideally, we
want to study bids that trigger market capitalization of a bid‟s expected synergies on its initial
announcement date, which is subsequently lost on the bid‟s announced failure. It is critical
that the withdrawal news does not co-mingle with signals concerning revision in the bidder‟s

20
valuation. For this reason, acquirer and target samples differ from each other. Additionally,
the matched sample must only contain acquirers and targets in exogenously failed deals.
The subsample of exogenously failed acquirers contains deals that failed due to regulatory
disapproval, competing offers, and unexpected target developments. Likewise, the
exogenous subsample for targets contains bids that failed due to regulatory disapproval,
unexpected acquirer developments and competing offers such that the initial offer to the
target firm remained unconsummated. Finally, for the matched-sample, the merger must have
failed due to reasons outside the control of the acquirer and target, such as regulatory
disapproval and competing offers. This extends Savor and Lu (2009) approach which finds
that mergers are beneficial to acquiring firm shareholders. They compare post-event returns
to find that successful acquirers on average outperform failed acquirers. Our methodology
differs from theirs because we allow for a more plausible alternative explanation for this
performance difference, namely the loss of synergistic benefits on the failure of the deal, and
not because of the loss of the opportunity to buy the target with overvalued bidder stock.
Furthermore, we extend their “exogenous failed” sample to include targets so as to improve
our power to distinguish between the conflicting hypotheses.
The information sources used to determine why a takeover failed differs slightly from
Savor and Lu (2009). Due to the difference in size of the number of failed bids in their study,
355 for their sample compared to 1,394 in our sample, we use a variety of information
sources to determine the reasons for bid failures. We investigate every failed deal using the
combined resources of Factiva, LexisNexis, news articles from Google, and the synopsis and
deal history provided by SDC Platinum. We find a similar success rate to Savor and Lu
(2009) in being able to explain the cause for bid failures.
The process of constructing the exogenously failed sample begins with the “All Failed
Bid” sample and then we divide the failed bid sample into acquiring and target firms and a
third category in which both the bidder and the bidder‟s actual target remain to form a
matched sample. We arrange the “endogenous” reasons why deals failed by whether they are
(i) common to both acquirer and target, (ii) common only to acquirers and (iii) common only
to targets so as to leave only acquirers, targets and matched pairs of acquirer-target
companies where both the acquirer‟s bid and the target failed for exogenous reasons and
where information is complete on both parties.
Thus, we first exclude bids where there is insufficient information due to an indeterminate
cause for the bid failure, resulting in a more decisive exogenous sample with known reasons
for failure. Second, we exclude deals where there is a flat rejection of an acquirer‟s offer, or
21
where the deal failed within a very short period, i.e., 14 days, in which case we believe no
synergies would have manifested themselves into the share prices of the acquirer or target
during that period. Similarly, we exclude deals where the deal failed after one year following
the bid‟s initial announcement, because of a low probability that the stock returns over this
long time period solely reflected the information about the changes in the bid and its likely
outcome.
In addition, we exclude bids where there are disagreements over the bid premium and
merger terms. We also exclude bids where the bid failed due to revelations about the target
valuation, changes in macro-economic conditions or an inability to secure financing, as these
cases have valuation implications beyond the loss of the synergistic benefits of the proposed
bid. The end-point of this exclusion process is the collection of remaining deals that failed for
exogenous reasons unrelated to valuation changes. Ideally, we want the firms remaining in
the sample not to have a permanent fall in value due to anything other than the loss of an
acquisition‟s synergistic benefits. Thus, there will be some cases where an acquirer will lose
synergistic benefits and a target will not or vice-versa. For example, the acquirer loses the
chance to consummate the deal due to a successful competing bid, so that the target is still
acquired. Consequently, the acquirer loses the deal‟s expected synergies, while the target
realizes its share of the synergies through the takeover premium of the successful competing
bidder. Table 4 displays the time-series distribution of successful and failed acquisition bids
in our final sample that we term the All Failed sample, inclusive of consummated bids.
<<Insert Table 4 about here>>
4.c Variable Construction
In this subsection, we discuss variable definitions.
Acquirer and Target Returns
We measure market reactions to bid announcement and failure dates using cumulative
abnormal returns (CARS) defined over a specified event window around the announcement
dates, where returns are adjusted for market-wide effects using a one-factor market model,
, ,i t i i m t tR R . (1)
22
The one-factor market model is estimated using daily stock returns, Ri,t, over the pre-
announcement period [−250, −30]. Daily market returns, Rm,t, are defined as value-weighted
stock indices construct from listed stocks on the major stock exchanges in each country. For
Australian firms, we use the All Ordinaries Index taken from SIRCA database; for the US,
we use the CRSP Value Weighted Index; and for other countries, we use local value-
weighted market index taken from Datastream.13
Stock i‟s abnormal return, ARi,t, is defined
as the stock‟s raw return minus the estimated one-factor market model:
, , ,i t i t i tAR R E R , (2)
where ,i tE R is estimated from the one factor market model shown in equation (1) and t is
from the first day of the event window until the last day, n. The cumulative abnormal return
(CAR) is defined as:
1
,n
t
t
CAR t n AR
. (3)
For comparison purposes, we use the CRSP Equal-Weighted Index as the equal-weighted
benchmark for all firms in our sample. There are many concerns when modeling and
interpreting abnormal returns around short- and long-term event studies. Studies of gains and
losses in mergers and acquisitions for short-term events have typically taken the three-day
CAR (Betton et al. (2008), Moeller, Schlingemann and Stulz (2005), and Savor and Lu
(2009)), and five-day CAR (Masulis, Wang and Xie (2007) and Fuller, Netter and
Stegemoller (2002)) windows around the initial acquisition announcement dates. Fuller et al.
(2002) find that for a random sample of 500 acquisitions from 1990 to 2000, the
announcement dates provided by SDC are correct for 92.6 percent of the sample.
Additionally, they find that for the remaining 7.4 percent SDC is incorrect by no more than
two trading days. For this reason, we employ a five-day event window around announcement
date, instead of a three-day event period.
Table 5 presents the summary statistics of the five-day CAR of both acquirers and targets
around the announcements of mergers and acquisitions. The results in the table are consistent
with existing empirical research on takeover announcement effects. We find that targets earn
significantly positive abnormal returns (20.9 percent) around M&A announcements, while
acquirers earn on average negative returns (−0.8 percent). The results are as expected and
appear to be contrary to Hypothesis II, which predicts that acquirers share a significant
portion of the synergistic benefits created by an M&A transaction. Interestingly, we find that 13
All Indices account for dividends.
23
targets of subsequently failed bids earn lower announcement returns. This observation holds
for targets of both the failed bid and exogenous failed bid samples. Bidders in the exogenous
failed bid sample suffer more severe negative returns (−1.2 percent) than the combination of
successful and failed bidders (−0.8 percent). In Panel−C, we show results for our hypothetical
combined bidder and target firm created from our matched sample. We see that all our
subsamples exhibit positive combined returns for takeover announcements. This finding
provides some initial evidence in favor of Hypothesis I and suggests that not only do
synergistic benefits exist, but they are observable in takeover announcements.
<<Insert Table 5 about here>>
Figures 2 and 3, respectively, plot average bidder and target cumulative abnormal returns
over 100 trading days before and after the bid announcement, measured in five-day
increments. Similarly, Figures 4 and 5 plot average acquirer and target cumulative returns
around the date when the market learns that the acquisition either is approved or fails. We
further separate the figures into subsamples of all firms (All), those acquisitions that were
successful (Successful), those that failed (Failed), and those that failed for exogenous reasons
(Exogenous). The effect of the announcements on targets is particularly evident in both the
initial announcement of the acquisition, creation of synergies and, secondly, on the
announcement of bid failure, loss of synergistic benefits. On the announcement, targets in our
sample earn on average abnormal returns of approximately 20 percent. Targets on bids that
subsequently fail earn significantly lower returns than targets that are successfully completed.
This is evidence that the market has some ability to predict which bids are likely to fail. Thus,
returns may only reflect an expected gain, conditional on the deal value and its likely
completion, and not the full value of the synergistic gains. This finding is consistent with
methodology employed by Bhagat et al. (2005), where they rescale returns using probability
scaling and intervention methods.
<< Insert Figures 2, 3, 4 and 5 about here>>
Plots of bidder returns in Figures 2 and 4 are consistent with the existing literature and
empirical findings, which report negligible returns and sometimes losses for acquirers around
acquisition announcements. In addition, Figure 4 is consistent with the findings of Savor and
24
Lu (2009) that acquirers in failed bids underperform acquirers in consummated bids over a
longer post-acquisition horizon. Thus, our results show that acquirers gain from takeovers
but, so far, we do not know why they realize gains.
There are two main methodological approaches in long-horizon event studies:
characteristic-based matching approach, also known as the BHAR (Buy-Hold Abnormal
Returns) and the Jensen‟s alpha approach, otherwise known as the calendar-time portfolio
approach (see Eckbo, Masulis and Norli (2000) and Fama (1998)). While the question of
which is the best model of returns for long-horizon event studies is yet to be resolved,14
in
this study we employ the BHARs to calculate the long-term abnormal returns and compare
the long-term performance of successful and failed acquirer and target firm pairs. With the
calendar-time approach, we face a similar obstacle to that of Savor and Lu (2009). They find
it difficult to implement due to the limited number of firms in their exogenously failed bid
sub-sample. The diversity of countries that our targets and acquirers come from exacerbates
this difficulty. Hence, this makes it extremely difficult to find an adequate number of firms
with similar size and book to market factors to implement the calendar time approach.
Researchers commonly utilize CARs in short-term event studies, but they find numerous
flaws to using them in longer-term studies: (i) CARs bear little resemblance to the returns
accrued by a long-term investor, and (ii) the process of aggregating short-term abnormal
returns over a longer time-period is likely to result in the emergence of spurious upward or
downward drift due to market microstructure issues, according to Conrad and Kaul (1993).
They also point out that accumulating single-period returns over longer time-periods assumes
portfolio rebalancing each period. Hence, the appropriate performance measure should be
buy-and-hold returns over longer intervals. However, in measuring CARs for the period
between announcement and failure dates, we hope to obtain a better understanding of the
stock returns around the two announcement dates and between these two announcements.
The second and most popular long-run event study technique is the buy-and-hold
benchmark approach, whereby we multiplicatively compound daily returns over the event-
window and then compare these returns to a given benchmark over the same period. We then
subtract the compounded returns for the benchmark from the compounded returns of the firm,
in order to obtain the stock‟s buy-and-hold abnormal returns (BHARs). Due to the diversity
of firms from multiple countries, we do not use an equal-weighted matching portfolio as a
benchmark for the firm. Instead, we use an equal-weighted index obtained from CRSP and
14
See Kothari and Warner (2007).
25
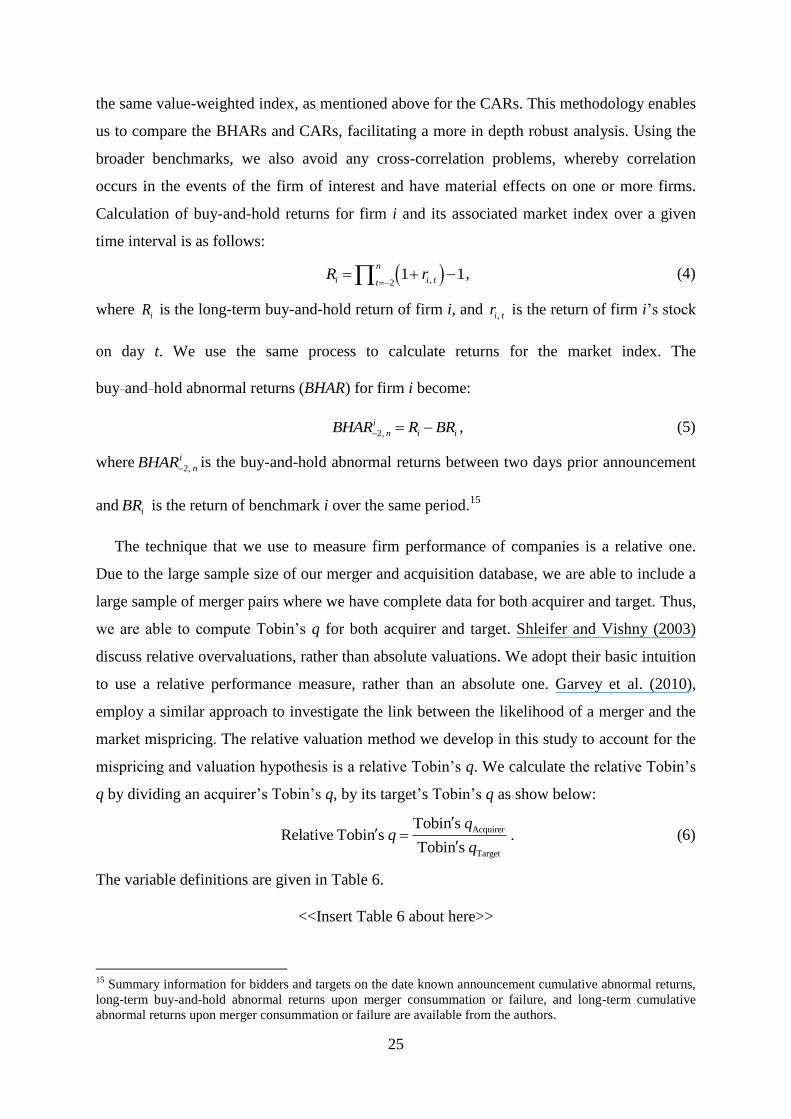
the same value-weighted index, as mentioned above for the CARs. This methodology enables
us to compare the BHARs and CARs, facilitating a more in depth robust analysis. Using the
broader benchmarks, we also avoid any cross-correlation problems, whereby correlation
occurs in the events of the firm of interest and have material effects on one or more firms.
Calculation of buy-and-hold returns for firm i and its associated market index over a given
time interval is as follows:
,21 1
n
i i ttR r
, (4)
where iR is the long-term buy-and-hold return of firm i, and ,i tr is the return of firm i‟s stock
on day t. We use the same process to calculate returns for the market index. The
buy−and−hold abnormal returns (BHAR) for firm i become:
2,
i
n i iBHAR R BR , (5)
where2,
i
nBHARis the buy-and-hold abnormal returns between two days prior announcement
andiBR is the return of benchmark i over the same period.
15
The technique that we use to measure firm performance of companies is a relative one.
Due to the large sample size of our merger and acquisition database, we are able to include a
large sample of merger pairs where we have complete data for both acquirer and target. Thus,
we are able to compute Tobin‟s q for both acquirer and target. Shleifer and Vishny (2003)
discuss relative overvaluations, rather than absolute valuations. We adopt their basic intuition
to use a relative performance measure, rather than an absolute one. Garvey et al. (2010),
employ a similar approach to investigate the link between the likelihood of a merger and the
market mispricing. The relative valuation method we develop in this study to account for the
mispricing and valuation hypothesis is a relative Tobin‟s q. We calculate the relative Tobin‟s
q by dividing an acquirer‟s Tobin‟s q, by its target‟s Tobin‟s q as show below:
Acquirer
Target
Tobin sRelative Tobin s
Tobin s
q
. (6)
The variable definitions are given in Table 6.
<<Insert Table 6 about here>>
15
Summary information for bidders and targets on the date known announcement cumulative abnormal returns,
long-term buy-and-hold abnormal returns upon merger consummation or failure, and long-term cumulative
abnormal returns upon merger consummation or failure are available from the authors.

26
5. CROSS-SECTIONAL ANALYSIS
This section examines the cross-sectional analysis of returns to acquirers and targets
around acquisition bids and bid failure announcements. We begin with summary statistics for
our sample, followed by a cross-sectional regression analysis of abnormal returns around
these events. The cross-sectional analysis allows us to estimate the magnitude and
distribution of expected synergistic benefits created in acquisition bids. This section is split
into three parts. The first sub-section analyzes expected synergistic benefits around
acquisition bid announcement dates. The second sub-section analyzes the predictions of
Hypothesis I concerning the loss of expected synergistic gains on bid failure announcements.
The third sub-section analyzes abnormal announcement returns over a longer event window,
starting with the bid announcement until the bid outcome announcement of a bid‟s success or
failure. From this analysis, we obtain a clearer picture of whether there are expected
synergistic benefits in typical acquisition bids. This analysis also allows us to assess whether
the pursuit of synergistic benefits is a fundamental motive for acquisition bids.
If the pursuit of synergistic benefits is an important motive for acquisition bidders, then
acquirers should share in any synergistic benefits associated with a bid. It follows that bidder
stock price reactions to acquisition bid announcements should be significantly positive. Table
7 shows that acquirers have a mean price run-up of two percent prior to the bid and a
cumulative abnormal return on the bid announcement of −1 percent. Ahern and Sosyura
(2011) suggest that acquirers release a string of positive announcements in the weeks and
months leading up to the public announcement of an acquisition, boosting their share price
and in the case of script offers, obtaining a better ratio on a stock merger swap. Therefore, if
we take account of the acquirer‟s pre-bid price run-up in measuring a bidder‟s acquisition
announcement return, then bidders realize a positive acquisition bid announcement return of
one percent. This preliminary evidence provides support for Hypothesis II: on average
acquirers realize positive returns on acquisition bid announcements, even though the gain in
percentage terms is small. While targets appear to capture the bulk of the acquisition induced
synergies since they exhibit larger announcement effects compared to bidders, this is
somewhat misleading because targets tend to be much smaller in size than bidders. Thus,
even if there is an equal division of the synergies between bidder and target, the target would
exhibit a much larger percentage gain.
<<Insert Table 7 about here>>

27
The market for corporate control literature documents strong evidence that targets receive
a substantial share of synergistic benefits associated with acquisitions, based on significant
positive market reactions to acquisition announcements. Similar to Betton et al. (2008), Panel
B presents a positive announcement CAR for target firms of 21 percent and a price run-up of
seven percent. Thus, in the 60 days prior to announcement until two days after the acquisition
announcement, the target firm enjoys an abnormal return of approximately 28 percent.
The descriptive statistics in Table 7 depict an interesting relationship between the relative
Tobin‟s q of acquirers and targets. The mean value for Tobin‟s q for acquirers and targets is
respectively 2.07 and 1.78. However, using our matched sample of acquirers and targets, we
are able to compute the relative Tobin‟s q present in a deal. Utilizing the latest accounting
figures prior to the bid and a firm‟s equity market value 61 days prior to the bid
announcement, the mean relative Tobin‟s q is 3.92, indicating that on average acquirers have
a Tobin‟s q that is approximately four times greater than that of their targets.
At one level, this may provide evidence to support Shleifer and Vishny‟s (2003) market-
timing theory and the explanation of Savor and Lu‟s (2009) of relative overvaluation of
acquirers compared to targets. This large disparity in acquirer and target Tobin‟s q figures
provides evidence to support the view that overvalued high-growth acquirers tend to purchase
relatively lower growth (and less overvalued or more undervalued) targets. Thus, Savor and
Lu‟s explanation rests on acquirers exploiting target shareholders by paying them in
(relatively) overvalued stock. We depart from the behaviorist point of view by using of
rational economic decision making to explain acquirer motives arising from slower than
expected growth prospects, which lead managers to seek external growth options, including
the pursuit of synergistic benefits through acquisitions. What Grossman and Hart (1981)
define as “allocational mergers” create synergistic benefits, where assets transfer from low-
productivity to high-productivity firms, thereby increasing the economic benefits that an asset
can produce.
Table 8 presents the announcement period and the sum of the 60-day run-up period plus
announcement abnormal returns, as well as the announcement period and the sum of the 60-
day run-up period plus announcement aggregate dollar returns for the sample used in the
cross-sectional regression. For this sample, we find similar results to the past literature (e.g.,
Andrade et al. (2001)). We find that on bid announcements bidders on average earn
negligible returns, which are sometimes losses (of –1.05 percent and –0.44 percent,
respectively). Furthermore, we see large gains to target firms on announcement date (19.22

28
percent and 27.01 percent). As hypothesized, we see large losses to both bidders (-9.34
percent) and targets (-17.6 percent) on the date the market learns of a bid‟s failure. In
addition, consistent with Eun et al. (1996), we observe a gain to the combined value of the
bidder and target of 2.67 percent or 3.28 percent inclusive of the price run-up immediately
before the bid announcement. We also see a loss of −1.82 percent on the bid failure
announcement or a total loss of −13.39 percent over 100 days following the bid failure
announcement, inclusive of the immediate bid failure announcement loss. This evidence
shows that on average positive synergistic benefits exists for the large sample of deals in our
sample. These results are also consistent with the findings for aggregated dollar returns and
are robust to measuring returns based on a value-weighted index. In summary, the results in
Table 8 provide support for Hypotheses I and II, with both the existence of large synergistic
benefits from acquisitions and with acquirers realizing a significant share of these expected
benefits.
<<Insert Table 8 about here>>
Table 9 presents the pairwise correlations of our explanatory and dependent variables
broken down by acquirers and targets separately. There is a strong correlation between
method of payment and the size of announcement returns for both bidders and targets. Both
Tobin‟s q and Relative Tobin‟s q are significantly negatively related to bid failure
announcement returns (Date Known - DK). Furthermore, the bidder and target price run-ups
are negatively relates to announcement date returns (Date Announced - DA).
<<Insert Table 9 about here>>
5.a The creation of synergistic benefits
In Table 10, we report the results from our regression analysis of acquirer returns around
acquisition bid announcements, including the target stock‟s price reaction to the bid
announcement, after controlling for firm and deal characteristics. We benchmark the models
presented in Table 10 against an equal-weighted index. We find for all regression models and
time periods that the target price reaction to a bid announcement is statistically highly
significant and positively related to the acquirer announcement returns. Inclusive of the run-

29
up period, the magnitude is also very strong. Where target firms have positive returns on
acquisition bid announcements, due to their large bid premiums and consequently large share
of the synergistic gains; acquirers also have positive returns on bid announcements. Hence,
we find evidence that acquirers share some of the expected synergistic gains capitalized into
stock prices on the announcement of the acquisition bid.
We find the coefficient on stock bids is significant at 1% level for all models.
Furthermore, it has a significant negative effect in the short-horizon models and significant
positive effect in the long-horizon models. In the five days around the bid announcement,
stock bidders earn approximately 4.5 percent less than cash bidders consistent with a strong
downward signaling bias for stock bids. This result is robust to using the All Failed Bids and
Exogenously Failed Bids samples. Moreover, in the 60 days leading up to an acquisition bid
announcement until two days after, stock bidders outperform cash bidders by approximately
5.7 percent, which is again consistent with the evidence from the exogenously failed bids
sample. These results are strong evidence in support of Ahern and Sosyura‟s (2011) findings
that stock bidders increase their value prior to bid announcements by releasing positive news.
<<Insert Table 10 about here>>
A significant finding in this model is the level of significance of the failed bid and
exogenous failed bid indicator variables. We find that the market is unable to predict
exogenous bid failures, but in the short-term model, the market appears to able discern low
levels of synergistic benefit to predict endogenous deal failure, as occurs in Dimopoulos and
Sacchetto (2011). This further supports our methodology, which extracts estimates of an
acquisition‟s expected synergistic benefits from exogenous deal failures. If these bid failures
could be anticipated because they are not truly exogenous, then the market reaction to bid
failure announcements would understate the actual expected synergies that a successful
acquisition would create, since only highly synergistic acquisitions overcome target
resistance.
The sign and significance of the coefficients of our control variables are largely consistent
with findings in Masulis et al. (2007). Specifically we find that: (i) firm size is significantly
negatively related to bidder returns. This suggests that larger firms have lower synergistic
benefits. This may be due to their size and the difficulty of merging their operations and
obtaining substantial large synergistic benefits relative to their size. (ii) Acquirer price run-up
has an insignificant and negligible effect on bidder returns. (iii) Relative Tobin‟s q has a
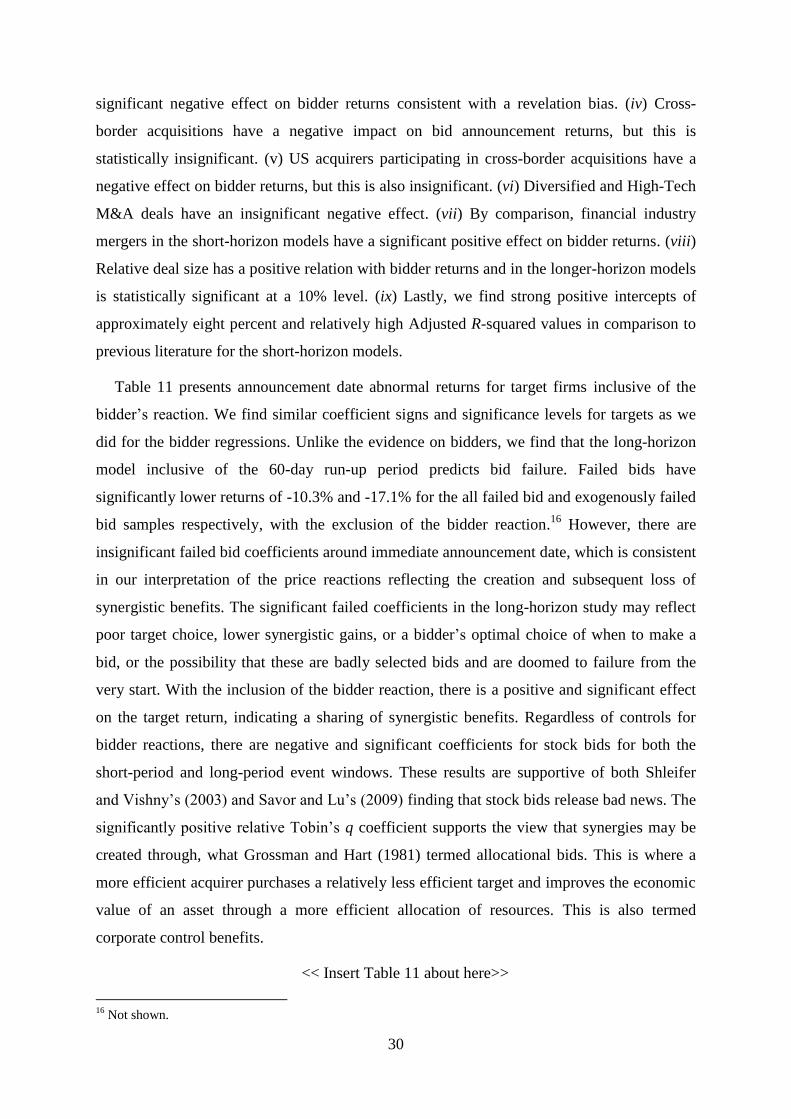
30
significant negative effect on bidder returns consistent with a revelation bias. (iv) Cross-
border acquisitions have a negative impact on bid announcement returns, but this is
statistically insignificant. (v) US acquirers participating in cross-border acquisitions have a
negative effect on bidder returns, but this is also insignificant. (vi) Diversified and High-Tech
M&A deals have an insignificant negative effect. (vii) By comparison, financial industry
mergers in the short-horizon models have a significant positive effect on bidder returns. (viii)
Relative deal size has a positive relation with bidder returns and in the longer-horizon models
is statistically significant at a 10% level. (ix) Lastly, we find strong positive intercepts of
approximately eight percent and relatively high Adjusted R-squared values in comparison to
previous literature for the short-horizon models.
Table 11 presents announcement date abnormal returns for target firms inclusive of the
bidder‟s reaction. We find similar coefficient signs and significance levels for targets as we
did for the bidder regressions. Unlike the evidence on bidders, we find that the long-horizon
model inclusive of the 60-day run-up period predicts bid failure. Failed bids have
significantly lower returns of -10.3% and -17.1% for the all failed bid and exogenously failed
bid samples respectively, with the exclusion of the bidder reaction.16
However, there are
insignificant failed bid coefficients around immediate announcement date, which is consistent
in our interpretation of the price reactions reflecting the creation and subsequent loss of
synergistic benefits. The significant failed coefficients in the long-horizon study may reflect
poor target choice, lower synergistic gains, or a bidder‟s optimal choice of when to make a
bid, or the possibility that these are badly selected bids and are doomed to failure from the
very start. With the inclusion of the bidder reaction, there is a positive and significant effect
on the target return, indicating a sharing of synergistic benefits. Regardless of controls for
bidder reactions, there are negative and significant coefficients for stock bids for both the
short-period and long-period event windows. These results are supportive of both Shleifer
and Vishny‟s (2003) and Savor and Lu‟s (2009) finding that stock bids release bad news. The
significantly positive relative Tobin‟s q coefficient supports the view that synergies may be
created through, what Grossman and Hart (1981) termed allocational bids. This is where a
more efficient acquirer purchases a relatively less efficient target and improves the economic
value of an asset through a more efficient allocation of resources. This is also termed
corporate control benefits.
<< Insert Table 11 about here>>
16
Not shown.

31
5.b The loss of synergistic benefits
In this section, we examine the returns of acquirers and targets around the date when the
market learns that a bid succeeds or fails. We hypothesize that on the bid failure
announcement there will be a loss of synergistic benefits and a fall in the combined value of
the two firms. While we show an association between bidder and target returns on takeover
announcement in Section 5.a, we cannot definitely conclude that bid announcements create
synergistic benefits. We now employ a methodology similar to that of Savor and Lu (2009).
They utilize a failed sample of acquirers and find that failed acquirers significantly
underperform successful ones. Likewise, we use failed bids to show that on bid failure
announcement, there is a subsequent loss of the bid‟s expected synergies for both bidders and
targets. Hence, we hypothesize that: (i) this subsequent loss is attributable to the loss of
expected synergistic benefits due to deal failure, (ii) acquirers share in these benefits, and (iii)
the loss on exogenously failed bids should be significantly higher than on endogenous failure
as it is an indicator of weak synergistic gain. Moreover, due to potential future competing
offers, targets keep their bid premium for a while after the failure of the initial bid. This last
result is similar to the finding in studies of bid cancellations by Dodd (1980) and Bradley et
al. (1983). Hence, expected synergies associated with the first bid and captured by the
target‟s stock price can remain with the target for an extended time period. We therefore
adjust the standard event study methodology for acquisitions by including an exogenous bid
failure sample and by measuring abnormal returns over a longer time period, specifically for
the 100 day period following the bid outcome announcement.
Table 12 shows that bid failure results that include bidder stock performance over the next
100 days from deal failure announcement [DK +100] are far better in terms of overall fit with
much higher Adjusted R-Squared. Moreover, the stock price fall for exogenously failed
acquirers making stock bids is 55% higher at 16.8% than it is in the All Failed Bids sample,
once again supporting our hypothesis that exogenously failed bids are likely to be far richer
in terms of benefits than endogenously failed bids. Here, the endogeneity problem seems
confined to stock bids only, since failed cash bids do not indicate a sizeable synergistic
benefit, reflected in an insignificant price decline on failure announcement. There is also
evidence of a further 6.7% price decline for the full sample of stock bids relative to cash bids
in the 100 days following news of a deal‟s outcome, irrespective of a bid‟s outcome. This
32
evidence is further support for our conclusion that stock bid announcement is conditional on
sizeable, but not previously revealed bad news about a bidder. Finally, Relative Tobin‟s q has
no effect on the long-term acquirer performance, implying that it is not a predictor of offers
by overvalued bidders.
<<Insert Table 12 about here>>
Table 13 introduces the target‟s reaction as an explanatory variable to better understand
bidder returns around bid outcome announcements. Similar to acquisition bid announcement
returns, we find that target price reactions are statistically significant and economically
positive around the bid outcome announcements. In fact, for the exogenously failed sample
over a long horizon, the returns for acquirers and targets are almost perfectly correlated with
a highly statistically significant coefficient of 0.8. One cannot observe this correlation for
successful acquisitions as it happens by definition due to merger. This is in line with
Hypothesis I which predicts that a fall in the value of a target will generally result in a
complementary fall in the value of the bidder. The key finding in the bidder return
regressions shown in Table 12 is the significant positive coefficients for a target‟s price
reaction to the bid outcome news. This provides further support for the Hypothesis I and II
predictions that expected synergistic benefits exist and that acquirers receive a significant
share of these expected benefits.
<<Insert Table 13 about here>>
Columns (1) and (2) of Table 14 presents target firm returns surrounding the
announcement that a bid has failed based on buy and hold abnormal returns (BHARs) two
days prior to the announcement until 100 days following the announcement. It incorporates
the reaction of the acquirer‟s stock price over the same long-term horizon (Column (2)). The
market-timing theory predicts that a stock acquirer will purchase a target‟s assets at a
discount using their relatively overvalued equity and that a cash acquirer will purchase the
target at a discount to its true long-term value (e.g., Malmendier, Opp, and Saidi (2011)).
Savor and Lu (2009) extend this argument by concluding that on acquisition failures, stock
bidders fail to acquire targets using relatively overvalued equity, thus losing the acquisition
gains of the bid. Therefore, one would assume that as news of a stock bid failure caused by
relative overvaluation of a bidder‟s stock, becomes known to the market, long-term target
33
shareholders would either react positively to news of a bid‟s failure or at least react less
negatively than they would on news of a failed cash bid. However, we find the coefficient on
the stock bid indicator in Columns (1) and (2) of Table 14 has an insignificant association to
target returns on a bid failure announcement. The insignificant coefficient is evidence against
the market-timing theory insofar as it pertains to both stock targets and cash targets. Cash
targets should relatively retain their value according to the undervaluation timing story, but
there is no evidence of this. These results further support our argument that expected
synergistic benefits are a substantial and tangible motive for acquisitions.
<<Insert Table 14 about here>>
Specifically, in examining Columns (1) and (2) of Table 14, we find that: (i) firm size is
significantly positive related to target returns for all models, indicating that larger targets
contain more synergies; (ii) bidder announcement returns in stock bids are statistically
insignificantly different from cash bids, hence rejecting the contention by Savor and Lu
(2009) that stock bids are motivated simply to exploit the acquirer‟s overvalued equity and
thus withdrawal should result either in little change or upward movement in the target‟s stock
return; (iii) Relative Tobin‟s q has an insignificant effect on target returns on the bid failure
announcement and no substantial effect on the size and significance of the remaining
explanatory variables when it is omitted from the models, indicating that this proxy for
overvalued acquirers has no effect on target stock performance; (iv) cross-border bids have
insignificant negative failure announcement effects for targets in both models; (v) US bidders
participating in cross-border deals have no additional significant withdrawal announcement
effect on target returns; (vi) diversified bid failures relative to failure generally have an
insignificant positive effect on targets in both models, which are consistent with the findings
in Morck et al. (1990); (vii) the High Tech indicator has a positive effect on target returns
around deal failure and is significantly positive in Model 3; (viii) financial industry bids have
an insignificant failure announcement effect on target returns relative to all failed bids; (ix)
and we find a significantly large negative intercept for target returns in all the models.
The significant negative intercept on target returns at a bid failure announcement indicates
that targets of failed bids earn significantly negative abnormal returns compared to the
market. Additionally, when we take into account the mean values of a target‟s equity
capitalization (size) and its relative Tobin‟s q provided in Table 7, we find that average target
abnormal returns on bid failure announcements is −25.15%. These losses are similar in
magnitude to the combined target gain from the run-up and bid announcement periods, which
34
yield a combined CAR of 28%, also shown in Table 7. Thus, unlike stock bidders, there is no
evidence of a revelation bias when it comes to target announcement effects and no difference
between cash and stock bids.
Furthermore, we find evidence in favor of Hypothesis I, with a significantly positive
coefficient for the bidder‟s stock reaction to target returns around the bid failure date. This
suggests that target‟s returns will generally move in the same direction as acquirer returns on
bid failure announcements. Therefore, combined with the significant negative intercept, we
have evidence in favor of a loss of synergistic benefits experienced by both bidders and
targets.
5.c The creation and subsequent loss of synergistic benefits
In this section, we examine the capitalization and subsequent loss of expected synergistic
benefits in M&A transactions. The method used in this section avoids the major limitations of
the evidence reported in the prior two sections. We undertake a long-horizon study starting
from the date of the bid announcement through to the date of the bid outcome announcement.
Thus, models in this section allow for the capitalization and subsequent loss of bid related
expected synergistic benefits. Hence, they overcome the issues of: (i) any leakage of bid
information prior to its public announcement; (ii) slow market reactions to the gain or loss of
expected synergistic benefits; and (iii) overcoming the revelation of information about bidder
or target valuation on the initial bid announcement. We expect to see a significant negative
effect of failed bids for acquirers, hence proving that: (i) acquirers lose expected synergies on
a bid failure and (ii) that on the initial bid announcement, acquirers share in a significant
portion of these benefits.
Columns (3) to (6) of Table 14 presents a comparison between successful and failed
targets over the long-period window from 60 days prior to the takeover announcement until
100 days post when the bid outcome is known. All models are benchmarked against an
equally weighted index. The methodology to analyze the gain and subsequent loss of
synergistic benefits attributed to targets differs from that previously. If one assumes that the
target will gain synergistic benefits on announcement of a takeover and subsequently lose
these benefits on the announcement of a failure, the target should eventually return to its
initial level over a period of time. Therefore, the expected abnormal return over this long
horizon event study would be negligible compared to a suitable benchmark. Hence, one
expects many of the coefficients and variables in the DA-DF models to be insignificant and

35
negligible. This assumption is accurate for the majority of the variables. However, we see a
significantly negative coefficient on stock, depicting that over this period targets of stock bids
severely underperform targets of cash bids. The 13.3 percent fall in the value of targets of
successful stock acquirers relative to successful cash acquirers shown in Column (3) seems to
form part of the overall bidder revelation loss that is passed on to targets of successful stock
acquirers during the period between the initial bid announcement but before the success or
failure of the bid is announced. The much larger fall in the price of failed stock targets
relative to failed cash targets in Column (5) of 36 percent most likely represents cash targets
remaining in play for a longer period than the 100 days post deal outcome news modeled
here. To the extent that failed cash targets retain some of their value gain following deal
failure, this reduces both bidder and target synergistic gain as any residual value gain to
targets due to revelation of true value simply represents a transfer to the new entity in the
case of deal success.

36
Additionally in Model (5), we find that target firm size has a positive effect on target
abnormal returns, which is statistically significant at a 10% significance level. When
substituting in the mean value for target firm size and relative Tobin‟s q, whilst turning off all
dummy variables except stock bids, we find an abnormal return over the period of study of
0.36% for Model (5) that is negligible. This result provides evidence that targets of stock bids
return to their prior-bid valuation basis. These results do not hold for cash bids, consistent
with the idea that they remain in play for much longer than do failed stock deals. The strong
positive coefficient for acquirer‟s reaction to target abnormal returns still exists and is
approximately the same in magnitude as those of successful bids. It suggests that there is a
relationship and sharing of synergistic gains between acquiring and target shareholders.
Table 15 reports bidder stock returns, commencing 60 days prior to the initial bid
announcement, until two days following the bid outcome announcement date. We find similar
results to those in Sections 5.a and 5.b. For our control variables, both the magnitude and
statistical significance is quite stable when compared to the estimates in Sections 5.a and 5.b,
indicating robustness across the three different methodologies. Specifically for our control
variables, we observe that both bidder size and stock bid indicator have an insignificant effect
on bidder returns. Hence, the presence of stock, as the method of payment does not play a
significant role in overall bidder returns, neglecting the interaction term between stock
financing and failed bids.
<<Insert Table 15 about here>>
The most important finding in the model is the significantly negative coefficient of the
failed bid indicator, and the failed stock bid interaction term. Both the All Failed Bids and
Exogenously Failed Bids samples show that failed cash bidders earn significantly lower
abnormal returns of −11.0 percent and −10.7 percent respectively compared to successful
cash bidders. Additionally, we find a significantly negative coefficient for the interaction
term between failed bid and stock bids. We find that failed stock bids underperform
successful stock bids by a further 9.4 percent and 11.6 percent for the All Failed Bids and
Exogenously Failed Bids samples respectively. Hence, this suggests stock bids contain more
synergistic bidder gain than do cash bids. These results are consistent with our expectations
and also the Savor and Lu (2009) findings, except that Savor and Lu treat the additional loss
on stock bids as evidence that the bidder can no longer sell overpriced equity to the target.
We treat our findings as significant evidence in favor of Hypotheses I and II, which imply

37
that expected synergistic benefits not only exist, but also acquirers expect to capture a
significant share of these benefits. Therefore, we conclude that bidders lose the expected
synergistic benefits on the bid‟s failure announcement.
The positive and highly statistically significant reaction of targets to either deal success or
bid failure over the entire period from 60 days prior to bid announcement to 100 days
following deal outcome shows that for every 100 basis point return obtained by the bidder,
there is a corresponding 62 basis point return for the target in the same direction. Thus,
synergies earned by the bidder and by the target move in the same direction, indicating a high
degree of commonality in synergies earned. By contrast, Savor and Lu (2009) explain the
sizeable fall in the price of the bidder on deal failure announcement as being entirely due to
the offsetting gain to the target when no longer burdened by the receipt of overpriced stock in
what they assume are synergy-free mergers involving only wealth transfers from target to
bidder. Hence, they predict a coefficient on the target BHAR of -1 rather than our finding of
+ 0.62. However, since they fail to include target returns in their empirical analysis, we can
safely reject their supposition of a negative relationship in favor of a strongly positive
relationship to conclude that both Hypotheses I and II are satisfied.
6. BIDDER AND TARGET RELATIVE SHARES OF SYNERGISTIC GAINS
Denote the mean equity values of the bidder and target just prior to the initial run-up
period as B and ,T respectively. Additionally, denote by BE , the excess bidder value lost
over the period from pre-run-up until 100 days following the offer outcome news date, when
the market is aware of a bid‟s success or failure, TE represents any permanent valuation
increase to the target following a cash bid, BG represents the synergistic gain accruing to a
bidder, and TG the synergistic gain accruing to a target. Hence, just prior to news of a bid‟s
outcome, a bidder‟s market valuation should equal:
1 ,S B T B S B B S T Bp B E E G p B E B E p E G (7)
where Sp represents the probability of deal success and 1F Sp p the probability of deal
failure. In our sample (and in the majority of empirical studies of M&A), there is negligible
change in bidder value on a bid announcement, given by B S T BB E p E G , relative to its
pre-run-up value given by B . Thus, prior to news of bid success or failure being released to
investors, there is approximate equality between the two, B S T BB E p E G B . Hence,

38
on a bid announcement, a bidder suffers a revelation loss in value, B S T BE p E G , which
is approximately equal to a bid‟s expected synergistic gains plus any revelation gain in value
to an initially underpriced target following a cash bid, factoring in the probability of success.
On news of deal failure, a failed bidder‟s value becomes:
1 ,B
B S T B B S T B DFB E B p E G B E p E G V
so that the synergistic gain is reduced by any permanent revaluation of the target
DF
B
B T
S
B VG E
p
, and ,
DF
B
BE B V where DF
BV is the relative reduction in bidder value
on a deal failure.
Similarly, target valuation on a bid announcement is:
1S T T S T T S Tp T E G p T E T E p G ,
where TE is the permanent valuation increase for the target, as before, and the target
valuation gain on the announcement is T T S T
DA
E p GV
T
. Thus, the estimated synergistic gain
on bid announcement, prior to knowing if a bid is a successful or not, is T
DA TT
S
T V EG
p
.
Note that on a bid announcement, a target‟s stock price rises by less than an offer‟s full value
to a target because the probability of bid success is less than one.
On a stock bid announcement, a target‟s expected value is 1T
Stock T Stock Stock
DA ST V T p G
and 100 days after bid failure, a stock target‟s value reverts (approximately) to its pre-bid
price. Hence, 1T
Stock Stock Stock T
S DFT T p G V . Thus, a stock target‟s estimated synergistic
gain, based on a bid announcement, but prior to the bid outcome being announced and a
target‟s estimated value, based on a price fall over the 100 days post-failure announcement
period must be the same, i.e., Stock Stock
Stock T T
T DF DA
S S
T TG V V
p p and T T
DF DAV V . Our empirical
results for stock funded targets are consistent with this prediction.
For a cash funded bid, our results are similar. The target‟s expected value becomes:
1T
Cash T Cash Cash
DA T ST V T E p G on bid announcement and a 100 days post deal failure
does not yet revert to its pre-bid price with a possibility that for some failed cash target
stocks, 0TE , with post-failure valuation, Cash
TT E , and fall in value, T
Cash
Sp G . Hence,

39
1
Cash CashT S T S T
DF Cash Cash Cash T
T S T DA
p G p GV
T E p G T V
on substituting from the initial deal
announcement effect. Thus, 1Cash T T
DA DFCash
T
S
T V VG
p
and 1Cash T T T
T DF DA DAE T V V V
on eliminating Cash
TG . Hence, if 0T
DFV there are no synergistic gains, and if 1
TT DF
DA T
DF
VV
V
the entire appreciation of the target on bid announcement is synergistic gain. In this latter
case, which we find to be the most likely one, 1
TT DA
DF T
DA
VV
V
, and consequently,
.T
DAT
S
T VG
p
The likelihood of an exogenously failed bid is 10%, hence the probability of bid success is
0.9Sp , and the proportion of exogenously failed stock bids is 52.9%, slightly less than the
overall proportion of stock bids. Based on an average equity value for bidders of $2,983.57
million and for targets of $657.55 million taken from Table 7, and the run-up prior to the
initial announcement (DA) to 100 days post-bid failure announcement (DK) bidder return in
Table 15, then over the [-60 DA, DK+100] period, we obtain a bidder return of -10.7% for
cash bids and -26.2% for stock bids, based on the exogenous failed bid sample. From two
days before failure announcement (DK) to 100 days post, Table 12 shows that no significant
fall occurred for cash bidders. Hence, there seems to have been earlier anticipation of cash
bid failure. The total expected bidder gain is B
S CG $626.6 million, made up of B
SG $459.6
million for stock bids and B
CG $167 million for cash bids. The overall revelation loss to the
bidder on the bid announcement, S CE , is $563.9 million (i.e., return of -18.9% on the initial
equity value) made up of SE $413.6 million for stock bids and CE $150.3 million for cash
bids.
Based on the same descriptive statistics and the average bidder announcement return of
27.1% for targets provided in Table 8 over the period [-60, DA +2], the target‟s overall gain
is $198 million. However, the evidence from Column (3) of Table 14 is that extending the
initial window until 100 days after deal outcome is known, successful stock targets receive
only about half the gain of cash targets. On this long-term basis, targets only receive overall
gains of $145.6 million. The bidder‟s share of the gains for stock bids at 89.8% is far higher

40
than for cash bids at 64.2%. The overall synergistic gain for the bidder-target combination is
$772.2 million, yielding an overall 21.2% return for the combined entity. Looked at from
another perspective, the bidder values the target at a premium of 117.4% of a target‟s pre-bid
negotiation value (prior to any bid induced stock price run-up). The bidder pays an expected
premium of only 22% due to the long-term impost on target shareholders of the bidder‟s
value reduction, leaving the bidder with a huge expected gain of 95.3% on top of the target‟s
pre-bid negotiation value. This calculation contrasts with structural estimation by
Dimopoulos and Sacchetto (2011), who find a slightly smaller takeover premium of 97%. In
their sample, the target receives a higher gain of 51%, which leaves a much smaller bidder
takeover premium of 46%.
7. CONCLUSIONS
In conclusion, we find strong evidence in favor of the existence of synergistic benefits to
takeover bids using evidence from an events study of the gains realized on initial bid
announcement and the subsequent loss of expected synergies on the announcement of a bid‟s
failure. These benefits are large, amounting to 22.7 percent of the combined equity values of
the bidder and target, starting just prior to the 60-day run-up period preceding a bid. On a bid
announcement, bidder stock price declines 18.9% or $563.9 million due to revelation of bad
news, mostly associated with the bid‟s use of stock as the takeover currency, but then is
pushed up to almost its pre-announcement value by the market capitalizing prospective
synergistic gains. We also find strong evidence of expected synergistic benefits realized by
stock and cash bidders, with the former receiving a much larger share of the benefits than the
latter, i.e., 81.44% versus 64.18 %. Contrary to the findings of Savor and Lu (2009), the
typical gain to a stock bidder is not offset by a loss to the target, as they would predict. In
fact, the gain to a typical target is very substantial, representing a 31% premium on the
target‟s price prior to the onset of offer negotiations. We find additional evidence that target
firms facing stock bids, lose these expected synergies in the first 100 days following a bid
withdrawal announcement and their stock prices on average returns to their pre-bid price
levels. In contrast, targets of cash bidders retain a portion of their bid premium for a longer
interval of time. We do not find evidence that failed cash target stocks permanently retain a
substantial proportion of the takeover premium, as suggested by Malmendier, Opp, and Saidi
(2011). They may simply be picking up the fact that these failed targets remain in play for
longer than do failed stock targets. Our proxy for bidder overvaluation and the timing theory

41
of target exploitation in stock bids, namely the relative Tobin‟s q, indicates no evidence to
support the target exploitation theory. Moreover, target shareholders benefit at least as much
in stock bids as they do in cash bids. Our results strongly reaffirm the neo-classical theory of
takeovers and M&A activity in which assets move systematically to their highest value use,
which is driven by the potentially huge synergistic gains accruing to successful bidders.

42
REFERENCES
Ahern, K. R. (2011). Bargaining power and industry dependence in mergers. Journal of
Financial Economics. Forthcoming.
Ahern, K. R., and Sosyura, D. (2010). Who Writes the News? Corporate Press Releases
During Merger Negotiations, Working Paper, University of Michigan.
Ahern, K. R., and Weston, F. (2007). M&As: The Good, the Bad, and the Ugly. Journal of
Applied Finance, 17, 5-20.
Akerlof, G. A. (1970). The Market for "Lemons": Quality Uncertainty and the Market
Mechanism. Quarterly Journal of Economics, 84, 488-500.
Andrade, G., and Stafford, E. (2004). Investigating the Economic Role of Mergers. Journal of
Corporate Finance, 10, 1-36.
Andrade, G., Mitchell, M., and Stafford, E. (2001). New Evidence and Perspectives on
Mergers. Journal of Economic Perspectives, 15, 103-120.
Bao, J., and Edmans, A. (2011). Do Investment Banks Matter for M&A Returns?. Review of
Financial Studies. Advance Access published May 6.
Bates, T. W., Becher, D. A., and Lemmon, M. L. (2008). Board Classification and
Managerial Entrenchment: Evidence from the Market for Corporate Control. Journal
of Financial Economics, 87, 656-677.
Bebchuk, L. A., and Cohen, A. (2005). The Costs of Entrenched Boards. Journal of Financial
Economics, 78, 409-433.
Bebchuk, L., Cohen, A., and Ferrell, A. (2009). What Matters in Corporate Governance?
Review of Financial Studies, 22, 783-827.
Betton, S., and Eckbo, B. E. (2000). Toeholds, Bid Jumps, and Expected Payoffs in
Takeovers. Review of Financial Studies, 13, 841-882.
Betton, S., Eckbo, B. E., and Thorburn, K. S. (2008). Corporate Takeovers. In B. Espen
Eckbo, Handboook of Corporate Finance: Empirical Corporate Finance, Volume 2.
(Elsevier/North-Holland Handbook of Finance Series), Ch. 15, 291-430.
Betton, S., Eckbo, B. E., and Thorburn, K. S. (2009). Merger Negotiations and the Toehold
Puzzle. Journal of Financial Economics, 91, 158-178.
Bhagat, S., Dong, M., Hirshleifer, D., and Noah, R. (2005). Do Tender Offers Create Value?
New Methods and Evidence. Journal of Financial Economics, 76, 3-60.
Bharadwaj, A., and Shivdasani, A. (2003). Valuation Effects of Bank Financing in
Acquisitions. Journal of Financial Economics, 67, 113-148.
Bhattacharyya, S., and Nain, A. (2010). Horizontal acquisitions and buying power: A product
market analysis. Journal of Financial Economics, In Press, Corrected Proof.
43
Bradley, M. (1980). Interfirm Tender Offers and the Market for Corporate Control. Journal
of Business, 53, 345-376.
Bradley, M., Desai, A., and Kim, E. H. (1983). The Rationale Behind Interfirm Tender
Offers: Information or Synergy. Journal of Financial Economics, 11, 183-206.
Brigham, E. F., and Daves, P. R. (2007). Intermediate Financial Management (9th ed.).
Mason: Thomson/South-Western.
Bris, A., Brisley, N., and Cabolis, C. (2008). Adopting Better Corporate Governance:
Evidence from Cross-Border Mergers. Journal of Corporate Finance, 14, 224-240.
Brown, S. J., and Warner, J. B. (1985). Using Daily Stock Returns: The Case of Event
Studies. Journal of Financial Economics, 14, 3-31.
Burkart, M. (1995). Initial Shareholdings and Overbidding in Takeover Contests. Journal of
Finance, 50, 1491-1515.
Cai, J., and Vijh, A. M. (2007). Incentive Effects of Stock and Option Holdings of Target and
Acquirer CEOs. Journal of Finance, 62, 1891-1933.
Chowdhry, B., and Jegadeesh, N. (1994). Pre-Tender Offer Share Acquisition Strategy in
Takeovers. Journal of Financial and Quantitative Analysis, 29, 117-129.
Conrad, J., and Kaul, G. (1993). Long-Term Market Overreaction or Biases in Computed
Returns? Journal of Finance, 48, 39-63.
Cooney Jr., J. W., and Kalay, A. (1993). Positive Information from Equity Issue
Announcements. Journal of Financial Economics, 33, 149-172.
Dasgupta, S., and Hansen, R. G. (2007). Auctions in Corporate Finance. In B. E. Eckbo,
Handbook of Corporate Finance: Empirical Corporate Finance, Volume 1.
Elsevier/North-Holland, Handbooks in Finance Series, Ch. 3, 87-143.
Dong, M., Hirshleifer, D., Richardson, S., and Teoh, S. H. (2006). Does Investor
Misvaluation Drive the Takeover Market? Journal of Finance, 61, 725-762.
Eckbo, B. E. (1983). Horizontal Mergers, Collusion, and Stockholder Wealth. Journal of
Financial Economics, 11, 241-273.
Eckbo, B. E. (2008). Corporate Restructuring: Breakups and LBOs. Handbook of Corporate
Finance: Empirical Corporate Finance, 2, 431-496.
Eckbo, B. E., Maksimovic, V., and Williams, J. (1990). Consistent Estimation of Cross-
Sectional Models in Event Studies. Review of Financial Studies, 3, 343-365.
Eckbo, B., Masulis, R., and Norli, O. (2000). Seasoned Public Offerings: Resolution of the
'New Issues Puzzle'. Journal of Financial Economics, 56, 251-291.

44
Eun, C. S., Kolodny, R., and Scheraga, C. (1996). Cross-Border Acquisitions and
Shareholder Wealth: Tests of the Synergy and Internalization Hypotheses. Journal of
Banking and Finance, 20, 1559-1582.
Exchanges, T. W. (2010). WFE - YTD Monthly. Retrieved September 30, 2010, from WFE:
World Federation of Exchanges: http://www.world-exchanges.org/statistics/ytd-
monthly
Fama, E. (1998). Market Efficiency, Long-Term Returns, and Behavioural Finance. Journal
of Financial Economics, 49, 283-306.
Fee, E. C., and Thomas, S. (2004). Sources of Gains in Horizontal Mergers: Evidence from
Customer, Supplier, and Rival Firms. Journal of Financial Economics, 74, 423-460.
Fuller, K., Netter, J., and Stegmoller, M. (2002). What Do Returns to Acquiring Firms Tell
Us? Evidence from Firms That Make Many Acquisitions. Journal of Finance, 57,
1763-1793.
Garvey, G. T., Milbourn, T. T., and Xie, K. (2010). But What Will it do for My EPS? An
Unflattering but Powerful Motive for Mergers, Working Paper, Olin Business School,
Washington University.
Gompers, P., Ishii, J., and Metrick, A. (2003). Corporate Governance and Equity Prices. The
Quarterly Journal of Economics, 118, 107-155.
Grinblatt, M., and Titman, S. (2002). Financial Markets and Corporate Strategy (2nd ed.).
New York: McGraw Hill Irwin.
Grossman, S. J., and Hart, O. D. (1981). The Allocational Role of Takeover Bids in
Situations of Asymmetric Information. Journal of Finance, 36, 253-270.
Harford, J., Klasa, S., and Walcott, N. (2009). Do Firms have Leverage Targets? Evidence
from Acquisitions. Journal of Financial Economics, 69, 1-14.
Hazelkorn, T., Zenner, M., and Shivdasani, A. (2004). Creating Value With Mergers and
Acquistions. Journal of Applied Corporate Finance, 16, 81-90.
Heinkel, R., and Kraus, A. (1988). Measuring Event Impacts in Thinly Traded Stocks.
Journal of Financial and Quantitative Analysis, 23, 71-88.
Hietala, P., Kaplan, S. N., and Robinson, D. T. (2003). What Is the Price of Hubris? Using
Takeover Battles to Infer Overpayments and Synergies. Financial Management, 32,
5-31.
Hirshleifer, D., and Titman, S. (1990). Share Tendering Strategies and the Success of Hostile
Takeover Bids. Journal of Political Economy, 98, 295-324.
45
Homstrom, B., and Kaplan, S. N. (2001). Corporate Governance and Merger Activity in the
United States: Making Sense of the 1980s and 1990s. Journal of Economic
Perspectives, 15, 121-144.
Jennings, R. H., and Mazzeo, M. A. (1993). Competing Bids, Target Management
Resistance, and the Structure of Takeover Bids. Review of Financial Studies, 6, 883-
909.
Jensen, M. C. (1986). Agency Costs of Free Cash Flows, Corporate Finance, and Takeovers.
American Economic Review Papers and Proceedings, 76, 323-329.
Jensen, M. C. (1993). The Modern Industrial Revolution, Exit, and the Failure of Internal
Control Systems. Journal of Finance, 48, 831-880.
Kothari, S. P., and Warner, J. B. (2007). Econometrics of Event Studies. In B. E. Eckbo,
Handbook of Corporate Finance: Empirical Corporate Fiannce, Volume 1.
Elseview/North-Holland handbook of Finance Series, Ch. 1, 3-36.
Krugman, P. R., and Obstfeld, M. (2009). International Economics: Theory and Policy (8th
ed.). Boston: Pearson Addison Wesley.
Lang, L. H., Stulz, R. M., and Walkling, R. A. (1991). A Test of The Free Cash Flow
Hypothesis: The Case of Bidder Returns. Journal of Finacial Economics, 29, 315-
335.
Li, K., and Prabhala, N. R. (2007). Self-Selection Models in Corporate Finance. In B. E.
Eckbo, Handbook of Corporate Finance: Empirical Corporate Finance, Volume 1.
Elsevier/North-Holland Handboook of Finance Series, Ch. 2, 37-86.
Martynova, M., and Renneboog, L. (2008). Spillover of Corporate Governance Standards in
Cross-Border Mergers and Acquisitions. Journal of Corporate Finance, 14, 200-223.
Martynova, M., and Renneboog, L. (2009). What Determines The Financing Decisions in
Corporate Takeovers: Cost of Capital, Agency Problems, or The Means of Payment?
Journal of Corporate Finance, 15, 290-315.
Masulis, R. W., Wang, C., and Xie, F. (2007). Corporate Governance and Acquirer Returns.
Journal of Finance, 62, 1851-1889.
Maynes, E., and Rumsey, J. (1993). Conducting Event Studies with Thinly Traded Stocks.
Journal of Banking and Finance, 17, 145-157.
Mitchell, M. L., and Mulherin, J. H. (1996). The Impact of Industry Shocks on Takeover and
Restructuring Activity. Journal of Financial Economics, 41, 193-229.
Moeller, S. B., and Schlingemann, F. P. (2005). Global Diversification and Bidder Gains: A
Comparison Between Cross-Border and Domestic Acquisitions. Journal of Banking
and Finance, 29, 533-564.
46
Moeller, S. B., Schingemann, F. P., and Stulz, R. M. (2004). Firm Size and The Gains From
Acquisitions. Journal of Financial Economics, 73, 201-228.
Moeller, S. B., Schlingemann, P. F., and Stulz, M. R. (2005). Wealth Destuction on a
Massive Scale? A Study of Acquiring-Firm Returns in the recent Merger Wave.
Journal of Finance, 60, 757-782.
Morck, R., Shleifer, A., and Vishny, R. W. (1990). Do Managerial Objectives Drive Bad
Acquisitions? Journal of Finance, 45, 31-48.
Myers, S. C., and Majluf, S. N. (1984). Corporate Financing and Investment Decisions When
Firms Have Information That Investors Do Not Have. Journal of Financial
Economics, 13, 187-221.
Rhodes-Kropf, M., and Viswanathan, S. (2004). Market Valuation and Merger Waves.
Journal of Finance, 59, 2685-2718.
Rhodes-Kropf, M., Robinson, D. T., and Viswanathan, S. (2005). Valuation Waves and
Merger Activity: The Empirical Evidence. Journal of Financial Economics, 77, 561-
603.
Roll, R. (1986). The Hubris Hypothesis of Corporate Takeovers. Journal of Business, 59,
197-216.
Rossi, S., and Volpin, P. F. (2004). Cross-Country Determinants of Mergers and
Acquiistions. Journal of Financial Economics, 74, 277-304.
Samuelson, W., and Rosenthal, L. (1986). Price Movements as Indicators of Tender Offer
Success. Journal of Finance, 41, 481-499.
Savor, P. G., and Lu, Q. (2009). Do Stock Mergers Create Value for Acquirers? Journal of
Finance, 64, 1061-1097.
Schlingemann, F. P. (2004). Financing Decisions and Bidder Gains. Journal of Corporate
Finance, 10, 683-701.
Shleifer, A., and Vishny, R. W. (2003). Stock Market Driven Acquisitions. Journal of
Financial Economics, 70, 295-311.
Stillman, R. (1983). Examining Antitrust Policy Towards Horizontal Mergers. Journal of
Financial Economics, 11, 225-240.
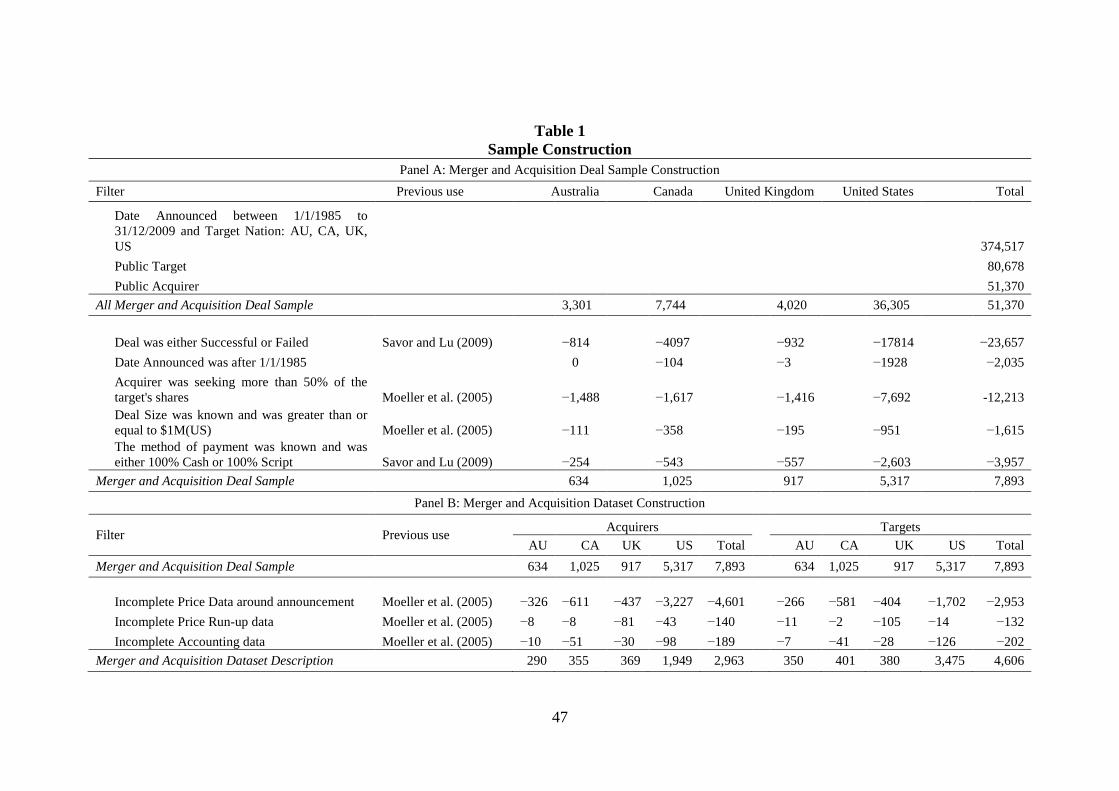
47
Table 1
Sample Construction
Panel A: Merger and Acquisition Deal Sample Construction
Filter Previous use Australia Canada United Kingdom United States Total
Date Announced between 1/1/1985 to
31/12/2009 and Target Nation: AU, CA, UK,
US
374,517
Public Target
80,678
Public Acquirer
51,370
All Merger and Acquisition Deal Sample 3,301 7,744 4,020 36,305 51,370
Deal was either Successful or Failed Savor and Lu (2009) −814
−4097
−932
−17814
−23,657
Date Announced was after 1/1/1985
0
−104
−3
−1928
−2,035
Acquirer was seeking more than 50% of the
target's shares Moeller et al. (2005)
−1,488
−1,617
−1,416
−7,692
-12,213
Deal Size was known and was greater than or
equal to $1M(US) Moeller et al. (2005)
−111
−358
−195
−951
−1,615
The method of payment was known and was
either 100% Cash or 100% Script Savor and Lu (2009) −254
−543
−557
−2,603
−3,957
Merger and Acquisition Deal Sample 634 1,025 917 5,317 7,893
Panel B: Merger and Acquisition Dataset Construction
Filter Previous use Acquirers Targets
AU CA UK US Total AU CA UK US Total
Merger and Acquisition Deal Sample 634 1,025 917 5,317 7,893 634 1,025 917 5,317 7,893
Incomplete Price Data around announcement Moeller et al. (2005) −326 −611 −437 −3,227 −4,601
−266 −581 −404 −1,702 −2,953
Incomplete Price Run-up data Moeller et al. (2005) −8 −8 −81 −43 −140
−11 −2 −105 −14 −132
Incomplete Accounting data Moeller et al. (2005) −10 −51 −30 −98 −189
−7 −41 −28 −126 −202
Merger and Acquisition Dataset Description 290 355 369 1,949 2,963 350 401 380 3,475 4,606

48
Table 2
Sample Distribution of Successful and Failed Bids The sample consists of 2,963 Acquirers, 4,606 Targets and 1,941 Matched Acquirers and Targets; where the
deal originated from Australia, Canada, the United Kingdom or the United States. SDC Platinum is the source of
merger and acquisition data.
Successful Bids Failed Bids
Stock Cash Total Stock Cash Total Total
Panel A: Acquirers
Australia 127 72 199
55 36 91
290
Canada 202 84 286
51 18 69
355
United Kingdom 134 162 296
31 42 73
369
United States 864 692 1,556
224 169 393
1,949
Total 1,327 1,010 2,337
361 265 626
2,963
Panel B: Targets
Australia 136 111 247
59 44 103
350
Canada 219 102 321
57 23 80
401
United Kingdom 122 184 306
35 39 74
380
United States 1,625 1,339 2,964
262 249 511
3,475
Total 2,102 1,736 3,838
413 355 768
4,606
Panel C: Matched Acquirers and Targets
Australia 85 43 128
38 20 58
186
Canada 109 32 141
28 10 38
179
United Kingdom 73 95 168
22 23 45
213
United States 590 514 1,104
127 132 259
1,363
Total 857 684 1,541 215 185 400 1,941
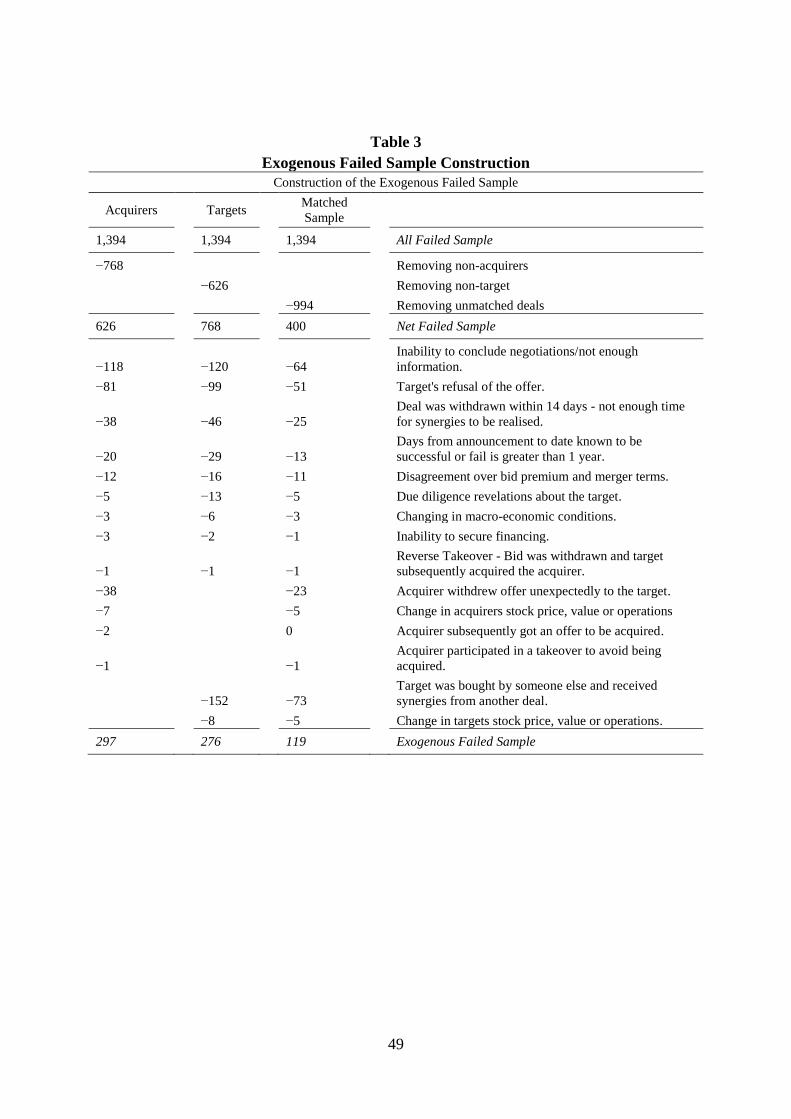
49
Table 3
Exogenous Failed Sample Construction
Construction of the Exogenous Failed Sample
Acquirers Targets Matched
Sample
1,394
1,394
1,394
All Failed Sample
−768
Removing non-acquirers
−626
Removing non-target
−994
Removing unmatched deals
626
768
400
Net Failed Sample
−118
−120
−64
Inability to conclude negotiations/not enough
information.
−81
−99
−51
Target's refusal of the offer.
−38
−46
−25
Deal was withdrawn within 14 days - not enough time
for synergies to be realised.
−20
−29
−13
Days from announcement to date known to be
successful or fail is greater than 1 year.
−12
−16
−11
Disagreement over bid premium and merger terms.
−5
−13
−5
Due diligence revelations about the target.
−3
−6
−3
Changing in macro-economic conditions.
−3
−2
−1
Inability to secure financing.
−1
−1
−1
Reverse Takeover - Bid was withdrawn and target
subsequently acquired the acquirer.
−38
−23
Acquirer withdrew offer unexpectedly to the target.
−7
−5
Change in acquirers stock price, value or operations
−2
0
Acquirer subsequently got an offer to be acquired.
−1
−1
Acquirer participated in a takeover to avoid being
acquired.
−152
−73
Target was bought by someone else and received
synergies from another deal.
−8
−5
Change in targets stock price, value or operations.
297 276 119 Exogenous Failed Sample
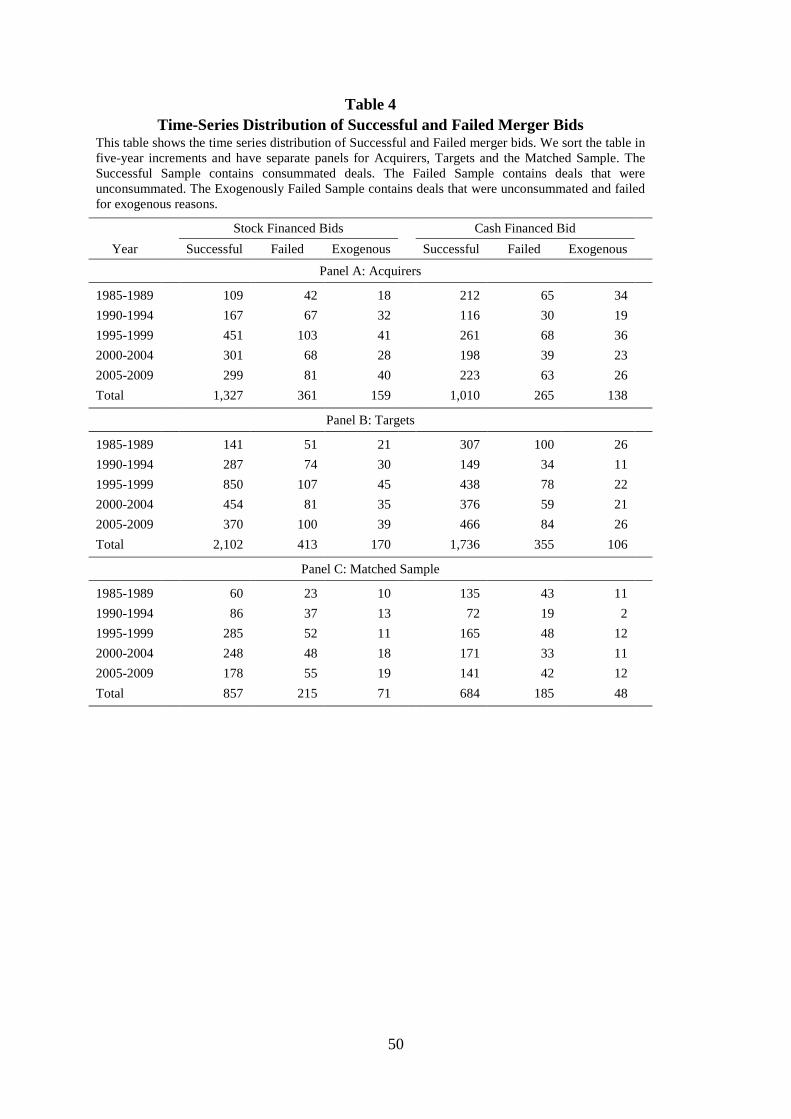
50
Table 4
Time-Series Distribution of Successful and Failed Merger Bids This table shows the time series distribution of Successful and Failed merger bids. We sort the table in
five-year increments and have separate panels for Acquirers, Targets and the Matched Sample. The
Successful Sample contains consummated deals. The Failed Sample contains deals that were
unconsummated. The Exogenously Failed Sample contains deals that were unconsummated and failed
for exogenous reasons.
Stock Financed Bids
Cash Financed Bid
Year Successful Failed Exogenous Successful Failed Exogenous
Panel A: Acquirers
1985-1989
109 42 18
212 65 34
1990-1994
167 67 32
116 30 19
1995-1999
451 103 41
261 68 36
2000-2004
301 68 28
198 39 23
2005-2009
299 81 40
223 63 26
Total 1,327 361 159 1,010 265 138
Panel B: Targets
1985-1989
141 51 21
307 100 26
1990-1994
287 74 30
149 34 11
1995-1999
850 107 45
438 78 22
2000-2004
454 81 35
376 59 21
2005-2009
370 100 39
466 84 26
Total 2,102 413 170 1,736 355 106
Panel C: Matched Sample
1985-1989
60 23 10
135 43 11
1990-1994
86 37 13
72 19 2
1995-1999
285 52 11
165 48 12
2000-2004
248 48 18
171 33 11
2005-2009
178 55 19
141 42 12
Total 857 215 71 684 185 48

51
Table 5
Date Announced (DA) Cumulative Abnormal Returns This table provides summary statistics for the cumulative abnormal returns over the M&A bid Date Announced
(DA) (−2, +2) event window. Panel A contains all the Acquirers in our sample, Panel B contains all the Targets
in our sample and Panel C contains the Combined Value of the acquirer and target created from the matched
sample. The All column depicts the entire sample deals. The Successful column contains all the successful bids.
The Failed column contains all the unconsummated or failed bids. The Exogenous column contains all the bids
that failed for exogenous reasons, as discussed in Section 2. We create CARs for Panel C by taking the
combined market value of the acquirer and target on the close of day +2, divided by the combined market value
of the acquirer and target, taken on the close of three days prior the announcement of the takeover. We base
significance levels on t-tests (means) and Wilcoxon-tests (medians). Respectively, ***, ** and * denote
statistical significance at the 1%, 5% and 10% level.
Variable All
Successful
Failed
Exogenous
Panel A: Acquirers
Mean −0.008*** −0.008*** −0.008* −0.012**
Median −0.009*** −0.008*** −0.010** −0.008
Standard Deviation −0.104 −0.100 −0.119 −0.100
5th percentile −0.158 −0.153 −0.172 −0.170
95th Percentile −0.148 −0.150 −0.142 −0.126
Observations −2,963 −2,337 −626 −297
Panel B: Targets
Mean −0.209*** −0.213*** −0.187*** −0.152***
Median −0.166*** −0.169*** −0.146*** −0.129***
Standard Deviation −0.273 −0.266 −0.306 −0.213
5th percentile −0.091 −0.083 −0.125 −0.139
95th Percentile −0.643 −0.652 −0.602 −0.467
Observations −4,606 −3,838 −768 −275
Panel C: Combined Firm
Mean −0.026*** −0.025*** −0.030*** −0.027***
Median −0.017*** −0.015*** −0.023*** −0.029***
Standard Deviation −0.104 −0.099 −0.121 −0.103
5th percentile −0.109 −0.109 −0.112 −0.145
95th Percentile −0.191 −0.188 −0.200 −0.199
Observations −1,941 −1,541 −400 −119
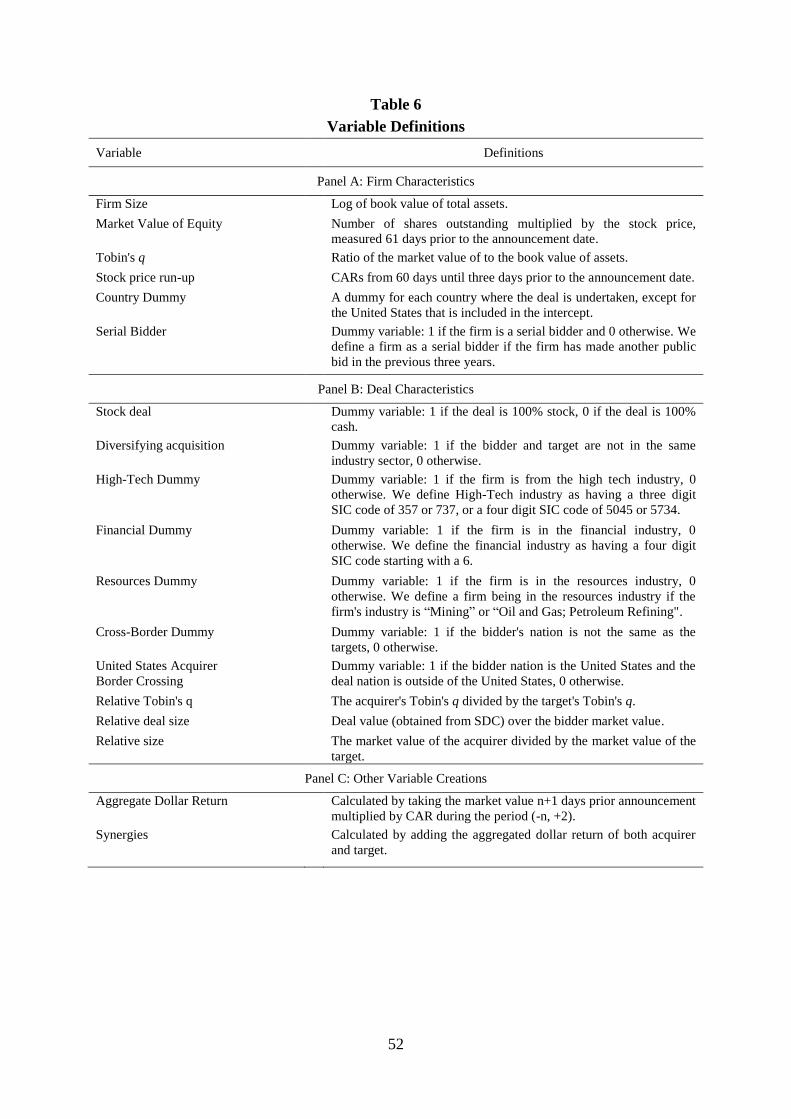
52
Table 6
Variable Definitions
Variable Definitions
Panel A: Firm Characteristics
Firm Size
Log of book value of total assets.
Market Value of Equity
Number of shares outstanding multiplied by the stock price,
measured 61 days prior to the announcement date.
Tobin's q
Ratio of the market value of to the book value of assets.
Stock price run-up
CARs from 60 days until three days prior to the announcement date.
Country Dummy
A dummy for each country where the deal is undertaken, except for
the United States that is included in the intercept.
Serial Bidder
Dummy variable: 1 if the firm is a serial bidder and 0 otherwise. We
define a firm as a serial bidder if the firm has made another public
bid in the previous three years.
Panel B: Deal Characteristics
Stock deal
Dummy variable: 1 if the deal is 100% stock, 0 if the deal is 100%
cash.
Diversifying acquisition Dummy variable: 1 if the bidder and target are not in the same
industry sector, 0 otherwise.
High-Tech Dummy
Dummy variable: 1 if the firm is from the high tech industry, 0
otherwise. We define High-Tech industry as having a three digit
SIC code of 357 or 737, or a four digit SIC code of 5045 or 5734.
Financial Dummy
Dummy variable: 1 if the firm is in the financial industry, 0
otherwise. We define the financial industry as having a four digit
SIC code starting with a 6.
Resources Dummy
Dummy variable: 1 if the firm is in the resources industry, 0
otherwise. We define a firm being in the resources industry if the
firm's industry is “Mining” or “Oil and Gas; Petroleum Refining".
Cross-Border Dummy
Dummy variable: 1 if the bidder's nation is not the same as the
targets, 0 otherwise.
United States Acquirer
Border Crossing
Dummy variable: 1 if the bidder nation is the United States and the
deal nation is outside of the United States, 0 otherwise.
Relative Tobin's q
The acquirer's Tobin's q divided by the target's Tobin's q.
Relative deal size
Deal value (obtained from SDC) over the bidder market value.
Relative size
The market value of the acquirer divided by the market value of the
target.
Panel C: Other Variable Creations
Aggregate Dollar Return Calculated by taking the market value n+1 days prior announcement
multiplied by CAR during the period (-n, +2).
Synergies
Calculated by adding the aggregated dollar return of both acquirer
and target.
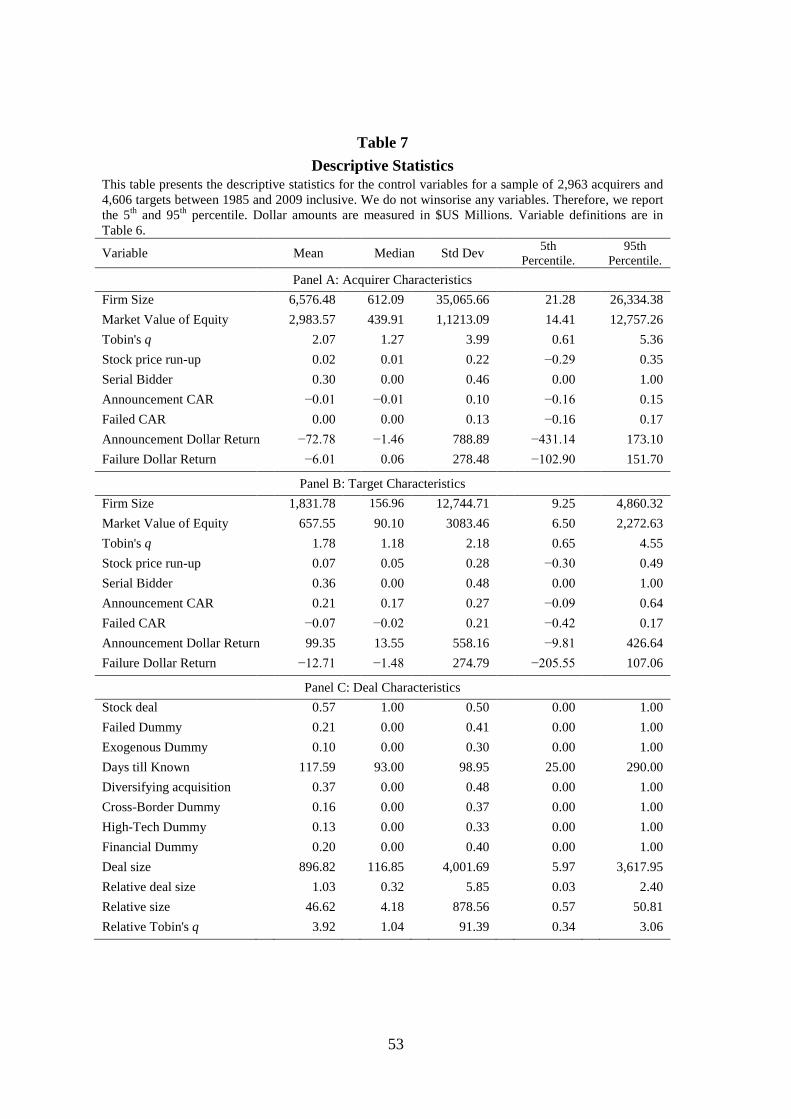
53
Table 7
Descriptive Statistics
This table presents the descriptive statistics for the control variables for a sample of 2,963 acquirers and
4,606 targets between 1985 and 2009 inclusive. We do not winsorise any variables. Therefore, we report
the 5th
and 95th
percentile. Dollar amounts are measured in $US Millions. Variable definitions are in
Table 6.
Variable Mean Median Std Dev 5th
Percentile.
95th
Percentile.
Panel A: Acquirer Characteristics
Firm Size 6,576.48 612.09 35,065.66 21.28 26,334.38
Market Value of Equity 2,983.57 439.91 1,1213.09 14.41 12,757.26
Tobin's q 2.07 1.27 3.99 0.61 5.36
Stock price run-up 0.02 0.01 0.22 −0.29 0.35
Serial Bidder 0.30 0.00 0.46 0.00 1.00
Announcement CAR −0.01 −0.01 0.10 −0.16 0.15
Failed CAR 0.00 0.00 0.13 −0.16 0.17
Announcement Dollar Return −72.78 −1.46 788.89 −431.14 173.10
Failure Dollar Return −6.01 0.06 278.48 −102.90 151.70
Panel B: Target Characteristics
Firm Size 1,831.78 156.96 12,744.71 9.25 4,860.32
Market Value of Equity 657.55 90.10 3083.46 6.50 2,272.63
Tobin's q 1.78 1.18 2.18 0.65 4.55
Stock price run-up 0.07 0.05 0.28 −0.30 0.49
Serial Bidder 0.36 0.00 0.48 0.00 1.00
Announcement CAR 0.21 0.17 0.27 −0.09 0.64
Failed CAR −0.07 −0.02 0.21 −0.42 0.17
Announcement Dollar Return 99.35 13.55 558.16 −9.81 426.64
Failure Dollar Return −12.71 −1.48 274.79 −205.55 107.06
Panel C: Deal Characteristics
Stock deal 0.57 1.00 0.50 0.00 1.00
Failed Dummy 0.21 0.00 0.41 0.00 1.00
Exogenous Dummy 0.10 0.00 0.30 0.00 1.00
Days till Known 117.59 93.00 98.95 25.00 290.00
Diversifying acquisition 0.37 0.00 0.48 0.00 1.00
Cross-Border Dummy 0.16 0.00 0.37 0.00 1.00
High-Tech Dummy 0.13 0.00 0.33 0.00 1.00
Financial Dummy 0.20 0.00 0.40 0.00 1.00
Deal size 896.82 116.85 4,001.69 5.97 3,617.95
Relative deal size 1.03 0.32 5.85 0.03 2.40
Relative size 46.62 4.18 878.56 0.57 50.81
Relative Tobin's q 3.92 1.04 91.39 0.34 3.06

54
Table 8
Announcement Period Returns
This table presents the announcement period abnormal returns and period aggregate dollars for Acquirers,
Targets and the Combined Value of the matched acquirer and target. The sample consists of 1,943
Acquirers and Targets. All values reported are mean values. Date Announced refers the initial
announcement date of the takeover. Date Failed is the date that the bid is known to fail and consists of
only failed acquirers and targets. We calculate the short-horizon abnormal returns using CARs
benchmarked to a value-weighted index. We calculate the long-horizon abnormal returns using BHARs
benchmarked against an equal-weighted index. The Dollar amounts are measured in $US Millions.
Variable definitions are in Table 6.
Variable Acquirer Target_ Combined Value
Panel A: Announcement Abnormal Returns
Date Announced
[−2, +2] −1.05% 19.22% 2.67%
[−60, +2] −0.44% 27.01% 3.28%
Date Failed
[−2, +2] 0.31% −5.45% −1.82%
[−2, +100] −9.34% −17.60% −13.39%
Panel B: Announcement Aggregate Dollar Returns
Date Announced
[−2, +2] −92.64 106.95 14.30
[−60, +2] −66.09 146.53 75.89
Date Failed
[−2, +2] −4.28 −4.98 −9.73
[−2, +100] −68.66 −313.09 −300.46
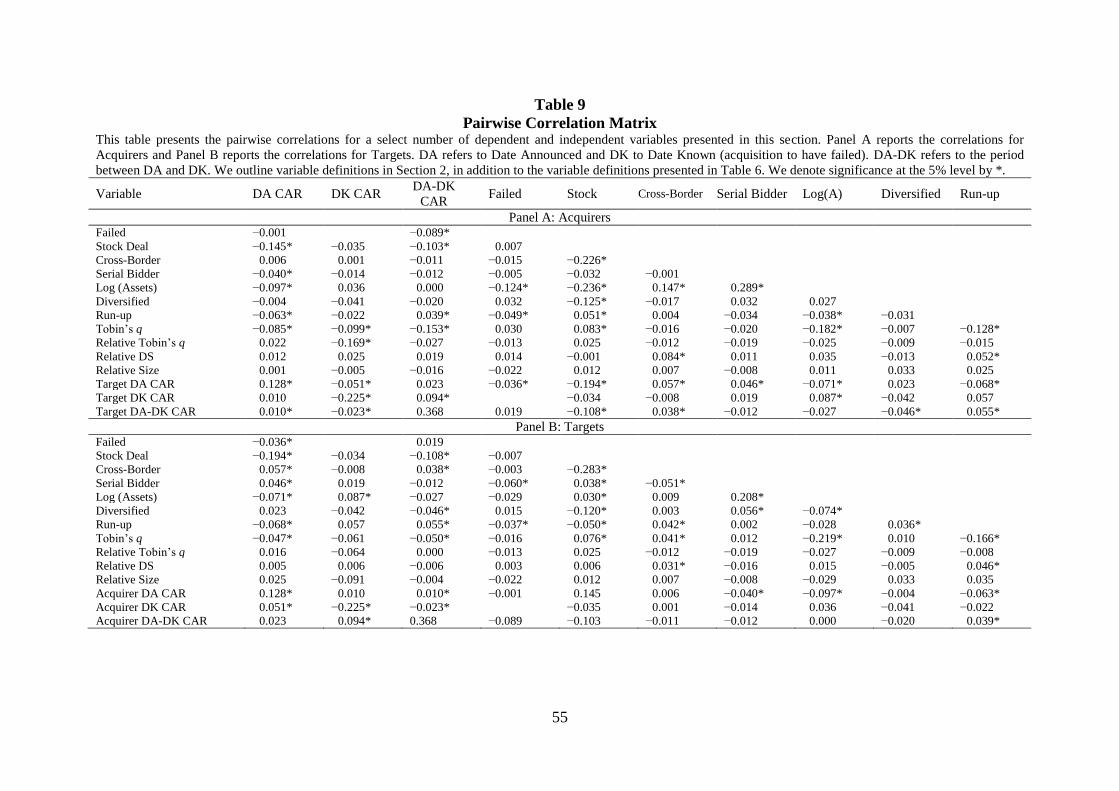
55
Table 9
Pairwise Correlation Matrix This table presents the pairwise correlations for a select number of dependent and independent variables presented in this section. Panel A reports the correlations for
Acquirers and Panel B reports the correlations for Targets. DA refers to Date Announced and DK to Date Known (acquisition to have failed). DA-DK refers to the period
between DA and DK. We outline variable definitions in Section 2, in addition to the variable definitions presented in Table 6. We denote significance at the 5% level by *.
Variable DA CAR DK CAR DA-DK
CAR Failed Stock Cross-Border Serial Bidder Log(A) Diversified Run-up
Panel A: Acquirers Failed −0.001 −0.089*
Stock Deal −0.145* −0.035 −0.103* −0.007
Cross-Border −0.006 −0.001 −0.011 −0.015 −0.226*
Serial Bidder −0.040* −0.014 −0.012 −0.005 −0.032 −0.001
Log (Assets) −0.097* −0.036 −0.000 −0.124* −0.236* −0.147* −0.289*
Diversified −0.004 −0.041 −0.020 −0.032 −0.125* −0.017 −0.032 −0.027
Run-up −0.063* −0.022 −0.039* −0.049* −0.051* −0.004 −0.034 −0.038* −0.031
Tobin‟s q −0.085* −0.099* −0.153* −0.030 −0.083* −0.016 −0.020 −0.182* −0.007 −0.128*
Relative Tobin‟s q −0.022 −0.169* −0.027 −0.013 −0.025 −0.012 −0.019 −0.025 −0.009 −0.015
Relative DS −0.012 −0.025 −0.019 −0.014 −0.001 −0.084* −0.011 −0.035 −0.013 −0.052*
Relative Size −0.001 −0.005 −0.016 −0.022 −0.012 −0.007 −0.008 −0.011 −0.033 −0.025
Target DA CAR −0.128* −0.051* −0.023 −0.036* −0.194* −0.057* −0.046* −0.071* −0.023 −0.068*
Target DK CAR −0.010 −0.225* −0.094* −0.034 −0.008 −0.019 −0.087* −0.042 −0.057
Target DA-DK CAR −0.010* −0.023* −0.368 −0.019 −0.108* −0.038* −0.012 −0.027 −0.046* −0.055*
Panel B: Targets Failed −0.036* −0.019
Stock Deal −0.194* −0.034 −0.108* −0.007
Cross-Border −0.057* −0.008 −0.038* −0.003 −0.283*
Serial Bidder −0.046* −0.019 −0.012 −0.060* −0.038* −0.051*
Log (Assets) −0.071* −0.087* −0.027 −0.029 −0.030* −0.009 −0.208*
Diversified −0.023 −0.042 −0.046* −0.015 −0.120* −0.003 −0.056* −0.074*
Run-up −0.068* −0.057 −0.055* −0.037* −0.050* −0.042* −0.002 −0.028 −0.036*
Tobin‟s q −0.047* −0.061 −0.050* −0.016 −0.076* −0.041* −0.012 −0.219* −0.010 −0.166*
Relative Tobin‟s q −0.016 −0.064 −0.000 −0.013 −0.025 −0.012 −0.019 −0.027 −0.009 −0.008
Relative DS −0.005 −0.006 −0.006 −0.003 −0.006 −0.031* −0.016 −0.015 −0.005 −0.046*
Relative Size −0.025 −0.091 −0.004 −0.022 −0.012 −0.007 −0.008 −0.029 −0.033 −0.035
Acquirer DA CAR −0.128* −0.010 −0.010* −0.001 −0.145 −0.006 −0.040* −0.097* −0.004 −0.063*
Acquirer DK CAR −0.051* −0.225* −0.023* −0.035 −0.001 −0.014 −0.036 −0.041 −0.022
Acquirer DA-DK CAR −0.023 −0.094* 0.368 −0.089 −0.103 −0.011 −0.012 −0.000 −0.020 −0.039*
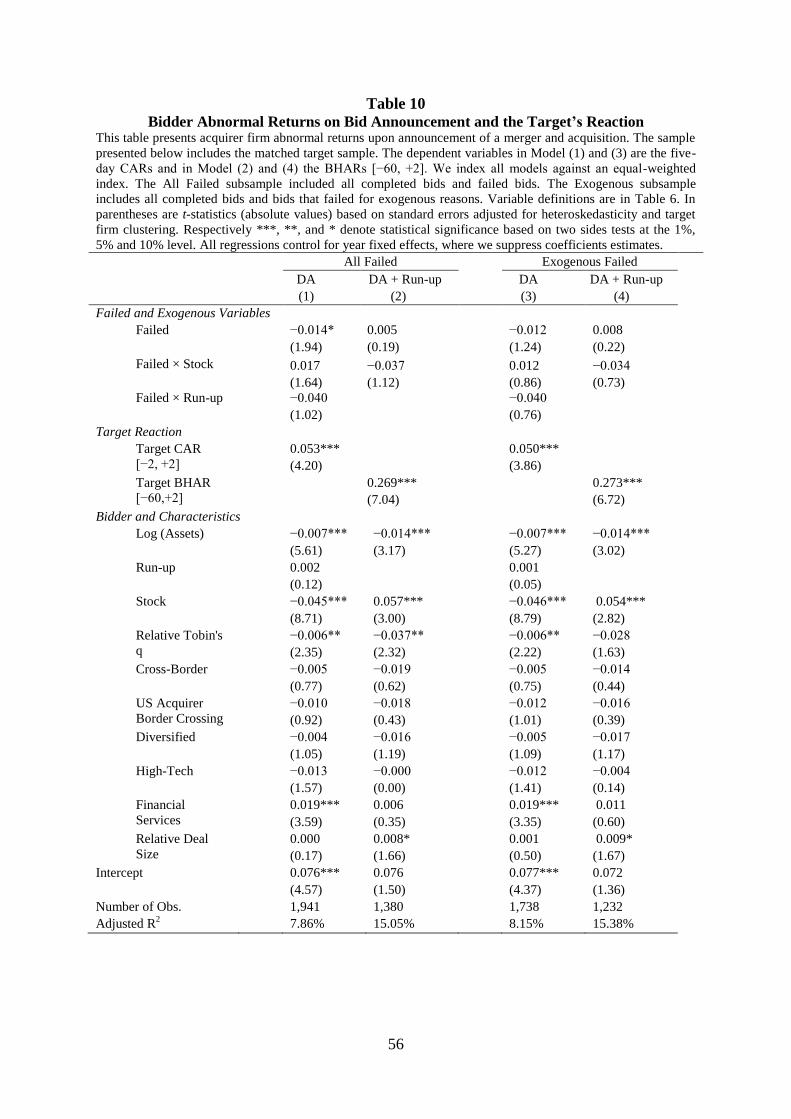
56
Table 10
Bidder Abnormal Returns on Bid Announcement and the Target’s Reaction This table presents acquirer firm abnormal returns upon announcement of a merger and acquisition. The sample
presented below includes the matched target sample. The dependent variables in Model (1) and (3) are the five-
day CARs and in Model (2) and (4) the BHARs [−60, +2]. We index all models against an equal-weighted
index. The All Failed subsample included all completed bids and failed bids. The Exogenous subsample
includes all completed bids and bids that failed for exogenous reasons. Variable definitions are in Table 6. In
parentheses are t-statistics (absolute values) based on standard errors adjusted for heteroskedasticity and target
firm clustering. Respectively ***, **, and * denote statistical significance based on two sides tests at the 1%,
5% and 10% level. All regressions control for year fixed effects, where we suppress coefficients estimates.
All Failed Exogenous Failed
DA DA + Run-up
DA DA + Run-up
(1) (2) (3) (4)
Failed and Exogenous Variables
Failed −0.014* 0.005 −0.012 0.008
(1.94) (0.19) (1.24) (0.22)
Failed × Stock
0.017 −0.037
0.012 −0.034
(1.64) (1.12)
(0.86) (0.73)
Failed × Run-up −0.040 −0.040
(1.02) (0.76)
Target Reaction
Target CAR
[−2, +2]
0.053*** 0.050***
(4.20) (3.86)
Target BHAR
[−60,+2]
0.269*** 0.273***
(7.04) (6.72)
Bidder and Characteristics
Log (Assets) −0.007*** −0.014*** −0.007*** −0.014***
(5.61) (3.17) (5.27) (3.02)
Run-up 0.002 0.001
(0.12) (0.05)
Stock −0.045*** 0.057*** −0.046*** 0.054***
(8.71) (3.00) (8.79) (2.82)
Relative Tobin's
q
−0.006** −0.037** −0.006** −0.028
(2.35) (2.32) (2.22) (1.63)
Cross-Border −0.005 −0.019 −0.005 −0.014
(0.77) (0.62) (0.75) (0.44)
US Acquirer
Border Crossing
−0.010 −0.018 −0.012 −0.016
(0.92) (0.43) (1.01) (0.39)
Diversified −0.004 −0.016 −0.005 −0.017
(1.05) (1.19) (1.09) (1.17)
High-Tech −0.013 −0.000 −0.012 −0.004
(1.57) (0.00) (1.41) (0.14)
Financial
Services
0.019*** 0.006 0.019*** 0.011
(3.59) (0.35) (3.35) (0.60)
Relative Deal
Size
0.000 0.008* 0.001 0.009*
(0.17) (1.66) (0.50) (1.67)
Intercept 0.076*** 0.076 0.077*** 0.072
(4.57) (1.50) (4.37) (1.36)
Number of Obs. 1,941 1,380 1,738 1,232
Adjusted R2 7.86% 15.05% 8.15% 15.38%

57
Table 11
Target Abnormal Returns on Bidder Takeover Announcement, Inclusive of Run-Up
and Bidder Reaction This table presents target firm abnormal returns upon announcement of a merger and acquisition and the bidder
reaction. The sample presented below includes the matched target sample. The dependent variable in Model (1)
and (3) are the five-day CARs and Model (2) and (4) are the BHARs [−60,+ 2]. We index all models against an
equal-weighted index. The All Failed subsample includes all completed bids and failed bids. The Exogenous
subsample includes all completed bids and bids that failed for exogenous reasons. Variable definitions are in
Table 6. In parentheses are t-statistics based on standard errors adjusted for heteroskedasticity and target firm
clustering. Respectively ***, **, and * denote statistical significance based on two sides tests at the 1%, 5% and
10% level. All regressions control for year fixed effects, where we suppress coefficient estimates.
All Failed Exogenous Failed
DA DA + Run-up
DA DA + Run-up
(1) (2) (3) (4)
Failed and Exogenous Variables
Failed −0.000 −0.091*** −0.030 −0.131*
(−0.02) (−2.66) (−1.09) (−1.85)
Failed × Stock
−0.022 −0.081*
−0.035 −0.062
(−1.08) (−1.80)
(−1.11) (−0.75)
Failed × Run-up −0.116** 0.100*
(−2.27) (1.70)
Acquirer Reaction
Acquirer CAR
[−2, +2]
0.198*** 0.206***
(4.20) (4.06)
Acquirer BHAR
[−60,+2]
0.533*** 0.552***
(8.39) (8.05)
Target and Deal Characteristics
Log (Assets) −0.003 0.007 −0.002 0.005
(−0.95) (1.05) (−0.78) (0.66)
Run-up −0.133*** −0.133***
(−5.26) (−5.55)
Stock −0.077*** −0.157*** −0.075*** −0.155***
(−7.61) (−6.42) (−7.24) (−6.23)
Relative Tobin's q 0.023*** 0.084*** 0.022*** 0.086***
(4.93) (4.61) (4.98) (4.45)
Cross-Border 0.013 0.098** 0.017 0.116**
(0.97) (2.22) (1.13) (2.45)
US Acquirer
Border Crossing
−0.036 −0.111* −0.036 −0.134*
(−1.44) (−1.67) (−1.32) (−1.95)
Diversified 0.008 0.014 0.011 0.019
(0.90) (0.66) (1.22) (0.84)
High Tech 0.035** −0.017 0.031** −0.022
(2.41) (−0.51) (2.12) (−0.65)
Financial Services −0.042*** −0.035 −0.044*** −0.032
(−3.65) (−1.44) (−3.58) (−1.23)
Intercept 0.224*** 0.315*** 0.218*** 0.297***
(7.56) (4.28) (7.25) (4.01)
Number of Obs. 1941 1380 1688 1194
Adjusted R2 12.04% 22.43% 11.62% 22.19%

58
Table 12
Bidder Abnormal Returns on Bid Outcome News This table presents the results for acquiring firm abnormal returns upon news either that a takeover was
successful or it failed (Date Known - DK). The sample presented below includes the matched acquirer sample.
The dependent variable in Model (1) and (3) are 5-day CARs and in Model (2) and (4), the BHARs [−2, +100].
We index all models against an equal weighted index. The All Failed subsample included all completed bids and
failed bids. The Exogenous subsample includes all completed bids and bids that failed for exogenous reasons.
Variable definitions are in Table 6. In parentheses are t-statistics (absolute values) based on standard errors
adjusted for heteroskedasticity and acquirer clustering. Respectively ***, **, and * denote statistical
significance based on two sides tests at the 1%, 5% and 10% level. All regressions control for year fixed effects,
where we suppress coefficients estimates.
All Failed Exogenous Failed
DK DK + 100
DK DK + 100
(1) (2) (3) (4)
Failed and Exogenous Variables
Failed 0.005 0.012 0.014* 0.057
(0.82) (0.29) (1.72) (1.00)
Failed × Stock
−0.006 −0.108**
−0.006 −0.168**
(0.59) (2.19)
(0.43) (2.31)
Bidder Characteristics
Log (Assets) −0.001 −0.006 −0.002* −0.010*
(0.85) (1.21) (1.74) (1.82)
Stock 0.003 −0.067*** 0.004 −0.065***
(0.86) (3.62) (0.96) (3.52)
Relative Tobin's q −0.006** −0.014 −0.006** −0.009
(2.55) (1.28) (2.31) (0.73)
Cross-Border −0.005 −0.023 −0.004 −0.007
(0.75) (0.62) (0.74) (0.18)
US Acquirer Border
Crossing
0.014 0.041 0.029*** 0.022
(1.33) (0.69) (2.90) (0.38)
Diversified −0.001 −0.005 0.000 0.007
(0.21) (0.27) (0.11) (0.40)
High Tech 0.007 0.040 0.002 0.029
(1.04) (1.33) (0.32) (0.96)
Financial Services 0.001 0.062*** 0.001 0.065***
(0.16) (3.44) (0.25) (3.41)
Relative Deal Size −0.001 0.003 0.001 0.006
(0.41) (0.67) (0.44) (1.23)
Intercept 0.007 0.130** 0.010 0.135**
(0.64) (2.33) (0.81) (2.31)
Number of Obs. 1,875 1,334 1,677 1,200
Adjusted R2 0.36% 5.83% 1.12% 4.77%

59
Table 13
Failed Bidder Abnormal Returns on Failure Announcement and the Target’s Reaction This table presents results of failed acquiring firm abnormal returns and the reaction of their matched target
upon announcement of the bid failure (DF). The sample presented below includes the matched acquirer sample.
The dependent variable in Model (1) and (3) are the five-day CARs and Model (2) and (4) are the BHARs [−2,
+100]. We index all models against an equal-weighted index. The All Failed subsample includes all failed bids.
The Exogenous subsample includes bids that failed for exogenous reasons. Variable definitions are in Table 6.
In parentheses are t-statistics (absolute values) based on standard errors adjusted for heteroskedasticity and
acquirer clustering. Respectively ***, **, and * denote statistical significance based on two-sided tests at the
1%, 5% and 10% level. All regressions control for year fixed effects, where we suppress coefficients estimates.
All Failed Exogenous Failed
DF DF + 100
DF DF + 100
(1) (2) (3) (4)
Target Reaction
Target CAR
[−2, +2]
0.155*** 0.190***
(3.94) (3.51)
Target BHAR
[−2,+100]
0.508*** 0.795***
(4.52) (5.43)
Bidder Characteristics
Log (Assets) −0.001 0.002 −0.003 −0.001
(0.66) (0.17) (1.13) (0.06)
Stock 0.016** −0.128** 0.020** −0.023
(1.97) (2.21) (2.15) (0.17)
Relative Tobin's q −0.007** −0.048 −0.006* −0.189**
(2.09) (0.91) (1.80) (2.37)
Cross-Border 0.010 −0.009 0.018 0.275**
(0.84) (0.05) (1.35) (2.12)
US Acquirer Border
Crossing
−0.007 0.123 0.023 −0.257
(0.37) (0.53) (1.14) (1.22)
Diversified 0.004 0.028 0.005 0.060
(0.59) (0.48) (0.59) (0.47)
High-Tech −0.013 0.039 −0.045** 0.056
(0.66) (0.39) (2.14) (0.37)
Financial Services 0.007 0.085 0.008 0.079
(0.92) (1.17) (0.81) (0.55)
Relative Deal Size −0.000 −0.005 0.005** 0.011
(0.07) (0.45) (2.13) (0.32)
Intercept 0.010 0.196 0.005 0.139
(0.38) (1.08) (0.19) (0.55)
Number of Obs. 620 199 436 97
Adjusted R2 5.28% 25.20% 11.04% 36.80%
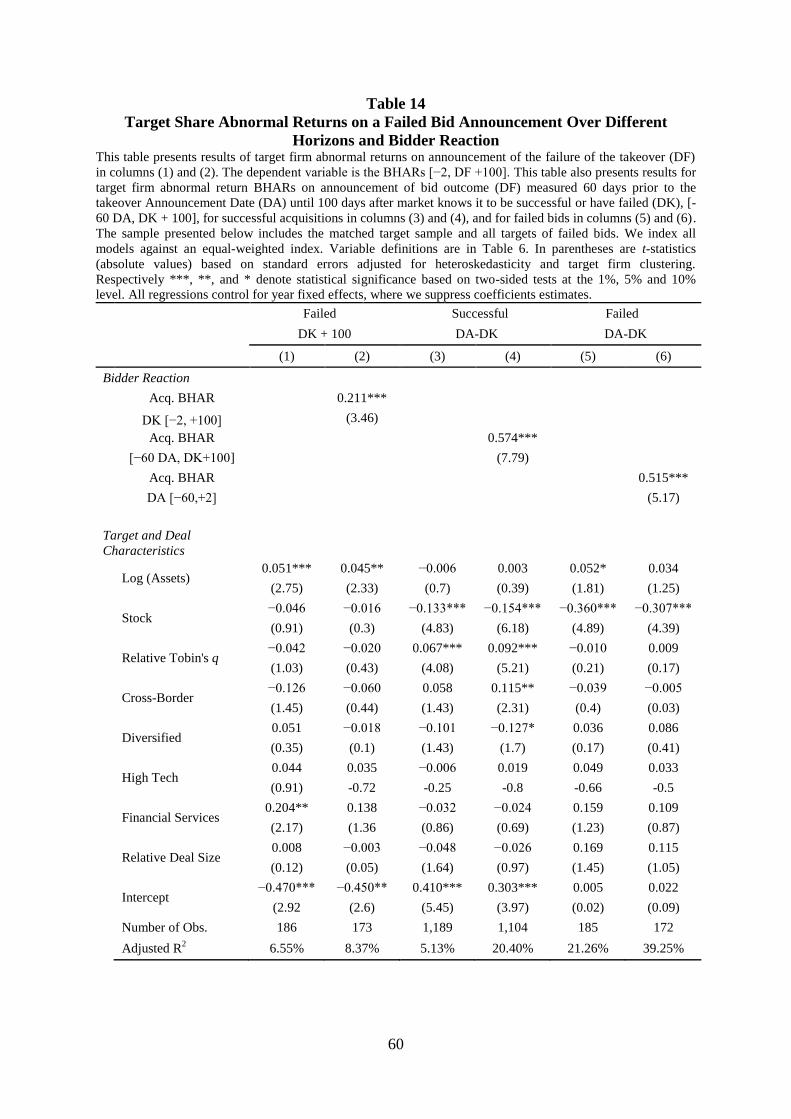
60
Table 14
Target Share Abnormal Returns on a Failed Bid Announcement Over Different
Horizons and Bidder Reaction This table presents results of target firm abnormal returns on announcement of the failure of the takeover (DF)
in columns (1) and (2). The dependent variable is the BHARs [−2, DF +100]. This table also presents results for
target firm abnormal return BHARs on announcement of bid outcome (DF) measured 60 days prior to the
takeover Announcement Date (DA) until 100 days after market knows it to be successful or have failed (DK), [-
60 DA, DK + 100], for successful acquisitions in columns (3) and (4), and for failed bids in columns (5) and (6).
The sample presented below includes the matched target sample and all targets of failed bids. We index all
models against an equal-weighted index. Variable definitions are in Table 6. In parentheses are t-statistics
(absolute values) based on standard errors adjusted for heteroskedasticity and target firm clustering.
Respectively ***, **, and * denote statistical significance based on two-sided tests at the 1%, 5% and 10%
level. All regressions control for year fixed effects, where we suppress coefficients estimates.
Failed Successful Failed
DK + 100 DA-DK DA-DK
(1) (2) (3) (4) (5) (6)
Bidder Reaction
Acq. BHAR
0.211***
DK [−2, +100]
(3.46)
Acq. BHAR
0.574***
[−60 DA, DK+100]
(7.79)
Acq. BHAR
0.515***
DA [−60,+2]
(5.17)
Target and Deal
Characteristics
Log (Assets)
0.051*** 0.045** −0.006 0.003 0.052* 0.034
(2.75) (2.33) (0.7) (0.39) (1.81) (1.25)
Stock
−0.046 −0.016 −0.133*** −0.154*** −0.360*** −0.307***
(0.91) (0.3) (4.83) (6.18) (4.89) (4.39)
Relative Tobin's q
−0.042 −0.020 0.067*** 0.092*** −0.010 0.009
(1.03) (0.43) (4.08) (5.21) (0.21) (0.17)
Cross-Border
−0.126 −0.060 0.058 0.115** −0.039 −0.005
(1.45) (0.44) (1.43) (2.31) (0.4) (0.03)
Diversified
0.051 −0.018 −0.101 −0.127* 0.036 0.086
(0.35) (0.1) (1.43) (1.7) (0.17) (0.41)
High Tech
0.044 0.035 −0.006 0.019 0.049 0.033
(0.91) -0.72 -0.25 -0.8 -0.66 -0.5
Financial Services
0.204** 0.138 −0.032 −0.024 0.159 0.109
(2.17) (1.36 (0.86) (0.69) (1.23) (0.87)
Relative Deal Size
0.008 −0.003 −0.048 −0.026 0.169 0.115
(0.12) (0.05) (1.64) (0.97) (1.45) (1.05)
Intercept
−0.470*** −0.450** 0.410*** 0.303*** 0.005 0.022
(2.92 (2.6) (5.45) (3.97) (0.02) (0.09)
Number of Obs. 186 173 1,189 1,104 185 172
Adjusted R2 6.55% 8.37% 5.13% 20.40% 21.26% 39.25%
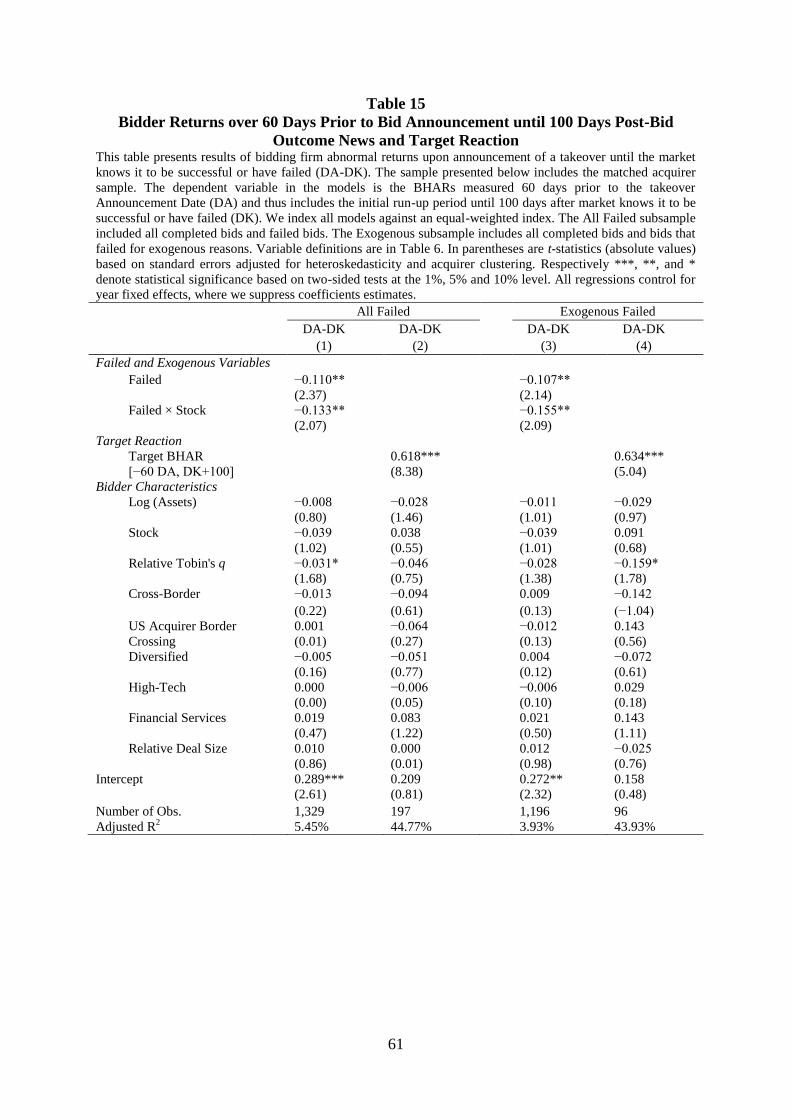
61
Table 15
Bidder Returns over 60 Days Prior to Bid Announcement until 100 Days Post-Bid
Outcome News and Target Reaction This table presents results of bidding firm abnormal returns upon announcement of a takeover until the market
knows it to be successful or have failed (DA-DK). The sample presented below includes the matched acquirer
sample. The dependent variable in the models is the BHARs measured 60 days prior to the takeover
Announcement Date (DA) and thus includes the initial run-up period until 100 days after market knows it to be
successful or have failed (DK). We index all models against an equal-weighted index. The All Failed subsample
included all completed bids and failed bids. The Exogenous subsample includes all completed bids and bids that
failed for exogenous reasons. Variable definitions are in Table 6. In parentheses are t-statistics (absolute values)
based on standard errors adjusted for heteroskedasticity and acquirer clustering. Respectively ***, **, and *
denote statistical significance based on two-sided tests at the 1%, 5% and 10% level. All regressions control for
year fixed effects, where we suppress coefficients estimates.
All Failed Exogenous Failed
DA-DK DA-DK
DA-DK DA-DK
(1) (2) (3) (4)
Failed and Exogenous Variables
Failed −0.110** −0.107**
(2.37) (2.14)
Failed × Stock
−0.133**
−0.155**
(2.07)
(2.09)
Target Reaction
Target BHAR
[−60 DA, DK+100]
0.618*** 0.634***
(8.38) (5.04)
Bidder Characteristics
Log (Assets) −0.008 −0.028 −0.011 −0.029
(0.80) (1.46) (1.01) (0.97)
Stock −0.039 0.038 −0.039 0.091
(1.02) (0.55) (1.01) (0.68)
Relative Tobin's q −0.031* −0.046 −0.028 −0.159*
(1.68) (0.75) (1.38) (1.78)
Cross-Border −0.013 −0.094 0.009 −0.142
(0.22) (0.61) (0.13) (−1.04)
US Acquirer Border
Crossing
0.001 −0.064 −0.012 0.143
(0.01) (0.27) (0.13) (0.56)
Diversified −0.005 −0.051 0.004 −0.072
(0.16) (0.77) (0.12) (0.61)
High-Tech 0.000 −0.006 −0.006 0.029
(0.00) (0.05) (0.10) (0.18)
Financial Services 0.019 0.083 0.021 0.143
(0.47) (1.22) (0.50) (1.11)
Relative Deal Size 0.010 0.000 0.012 −0.025
(0.86) (0.01) (0.98) (0.76)
Intercept 0.289*** 0.209 0.272** 0.158
(2.61) (0.81) (2.32) (0.48)
Number of Obs. 1,329 197 1,196 96
Adjusted R2 5.45% 44.77% 3.93% 43.93%

62
Figure 1
Mergers and Acquisition Sample by Method of Payment The graph shows the time-series distribution of the sample. There are three columns in each year; the first
column is the number of acquirers, the second column is the number of targets and the third column is the
number of matched deals (i.e., where an acquirer and target exists for the same deal). The upper bar plots the
number of stock-financed merger bids over time and the lower bar plots the number of cash−financed bids over
time.
0
50
100
150
200
250
300
350
400
19
85
19
86
19
87
19
88
19
89
19
90
19
91
19
92
19
93
19
94
19
95
19
96
19
97
19
98
19
99
20
00
20
01
20
02
20
03
20
04
20
05
20
06
20
07
20
08
20
09
Nu
mb
er
of
Ob
serv
atio
ns
Year
Stock Cash
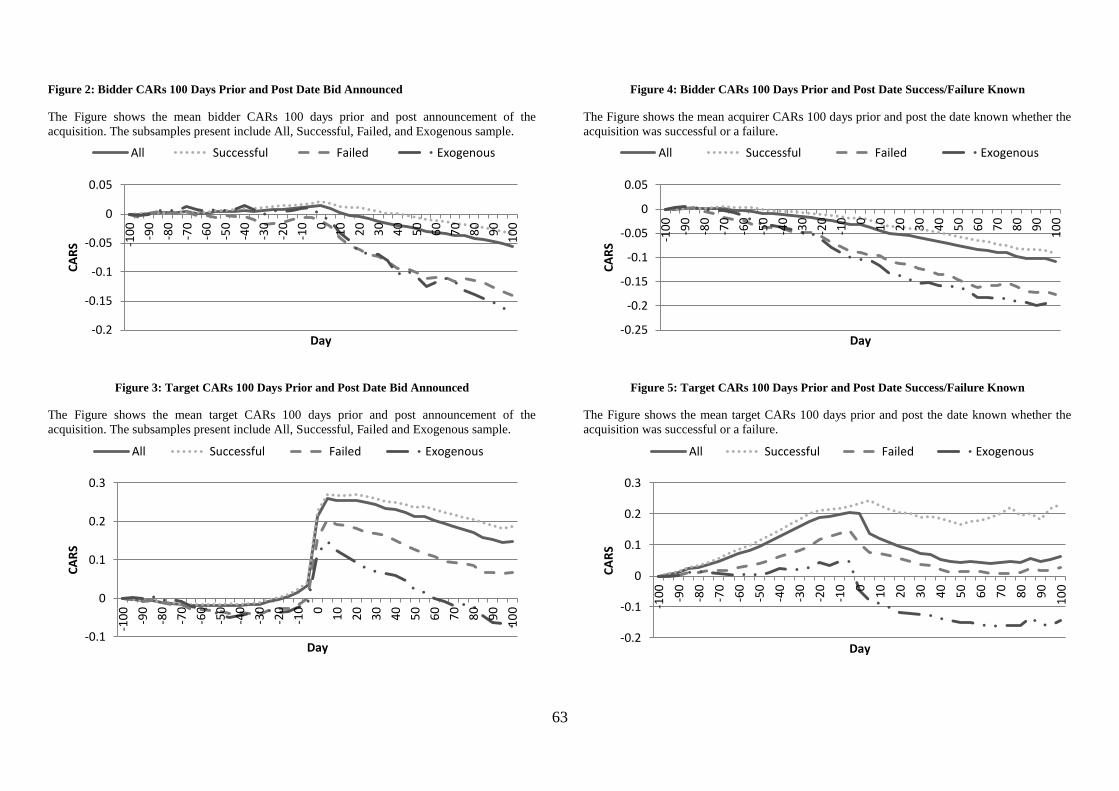
63
Figure 2: Bidder CARs 100 Days Prior and Post Date Bid Announced
The Figure shows the mean bidder CARs 100 days prior and post announcement of the
acquisition. The subsamples present include All, Successful, Failed, and Exogenous sample.
Figure 3: Target CARs 100 Days Prior and Post Date Bid Announced
The Figure shows the mean target CARs 100 days prior and post announcement of the
acquisition. The subsamples present include All, Successful, Failed and Exogenous sample.
Figure 4: Bidder CARs 100 Days Prior and Post Date Success/Failure Known
The Figure shows the mean acquirer CARs 100 days prior and post the date known whether the
acquisition was successful or a failure.
Figure 5: Target CARs 100 Days Prior and Post Date Success/Failure Known
The Figure shows the mean target CARs 100 days prior and post the date known whether the
acquisition was successful or a failure.
-0.2
-0.15
-0.1
-0.05
0
0.05
-10
0
-90
-80
-70
-60
-50
-40
-30
-20
-10 0
10
20
30
40
50
60
70
80
90
10
0
CA
RS
Day
All Successful Failed Exogenous
-0.1
0
0.1
0.2
0.3
-10
0
-90
-80
-70
-60
-50
-40
-30
-20
-10 0
10
20
30
40
50
60
70
80
90
10
0
CA
RS
Day
All Successful Failed Exogenous
-0.25
-0.2
-0.15
-0.1
-0.05
0
0.05
-10
0
-90
-80
-70
-60
-50
-40
-30
-20
-10 0
10
20
30
40
50
60
70
80
90
10
0
CA
RS
Day
All Successful Failed Exogenous
-0.2
-0.1
0
0.1
0.2
0.3
-10
0
-90
-80
-70
-60
-50
-40
-30
-20
-10 0
10
20
30
40
50
60
70
80
90
10
0
CA
RS
Day
All Successful Failed Exogenous