Investment Adviser's Letter to Shareholders - Tweedy, Browne
80
TWEEDY, BROWNE VALUE FUND (TWEBX) TWEEDY, BROWNE WORLDWIDE HIGH DIVIDEND YIELD VALUE FUND (TBHDX) Annual Report March 31, 2022 THIS BOOKLET CONSISTS OF TWO SEPARATE DOCUMENTS: Investment Adviser’s Letter to Shareholders TWEEDY, BROWNE INTERNATIONAL VALUE FUND (TBGVX) (FORMERLY, TWEEDY, BROWNE GLOBAL VALUE FUND) TWEEDY, BROWNE INTERNATIONAL VALUE FUND II - CURRENCY UNHEDGED (TBCUX) (FORMERLY, TWEEDY, BROWNE GLOBAL VALUE FUND II - CURRENCY UNHEDGED)
-
Upload
khangminh22 -
Category
Documents
-
view
4 -
download
0
Transcript of Investment Adviser's Letter to Shareholders - Tweedy, Browne

T W E E D Y , B R O W N E V A L U E F U N D ( T W E B X )
T W E E D Y , B R O W N E W O R L D W I D E H I G H D I V I D E N D Y I E L D V A L U E F U N D ( T B H D X )
Annual Report
March 31, 2022
T H I S B O O K L E T C O N S I S T S O F
T W O S E P A R A T E D O C U M E N T S :
Investment Adviser’sLetter to Shareholders
T W E E D Y , B R O W N E I N T E R N A T I O N A L V A L U E F U N D ( T B G V X )( F O R M E R L Y , T W E E D Y , B R O W N E G L O B A L V A L U E F U N D )
T W E E D Y , B R O W N E I N T E R N A T I O N A L V A L U E F U N D I I - C U R R E N C Y U N H E D G E D ( T B C U X )( F O R M E R L Y , T W E E D Y , B R O W N E G L O B A L V A L U E F U N D I I - C U R R E N C Y U N H E D G E D )

INVESTMENT TEAM
Olivier Berlage
Frank H. Hawrylak, CFA*
Amelia Koh Sean McDonald, CFA*
Jay Hill, CFA*†
Roger R. de Bree*
Andrew Ewert
William H. Browne
Thomas H. Shrager*† John D. Spears*† Robert Q. Wyckoff, Jr.*†
* Managing Director / Investment Committee member† Management Committee member
Dave Krasne, CFA

Investment Adviser’s Letter to Shareholders . . . . . . . . . . . . . . . . . . . . . . . . . . . . . . . . . . . . . . . . . . . . . I-1
Annual Report . . . . . . . . . . . . . . . . . . . . . . . . . . . . . . . . . . . . . . . . . . . . . . . . . . . . . . . . . . . . . . . . . . . . . II-1
Tweedy, Browne Fund Inc.Investment Adviser’s Note . . . . . . . . . . . . . . . . . . . . . . . . . . . . . . . . . . . . . . . . . . . . . . . . . . . . . . . . II-2Expense Information . . . . . . . . . . . . . . . . . . . . . . . . . . . . . . . . . . . . . . . . . . . . . . . . . . . . . . . . . . . . . II-10
Tweedy, Browne International Value Fund(formerly, Tweedy, Browne Global Value Fund)
Portfolio Highlights . . . . . . . . . . . . . . . . . . . . . . . . . . . . . . . . . . . . . . . . . . . . . . . . . . . . . . . . . . . . . II-11Perspective on Assessing Investment Results . . . . . . . . . . . . . . . . . . . . . . . . . . . . . . . . . . . . . . . . . . II-12Portfolio of Investments . . . . . . . . . . . . . . . . . . . . . . . . . . . . . . . . . . . . . . . . . . . . . . . . . . . . . . . . . . II-13Sector Diversification . . . . . . . . . . . . . . . . . . . . . . . . . . . . . . . . . . . . . . . . . . . . . . . . . . . . . . . . . . . . II-15Portfolio Composition . . . . . . . . . . . . . . . . . . . . . . . . . . . . . . . . . . . . . . . . . . . . . . . . . . . . . . . . . . . II-15Schedule of Forward Exchange Contracts . . . . . . . . . . . . . . . . . . . . . . . . . . . . . . . . . . . . . . . . . . . . II-15
Tweedy, Browne International Value Fund II – Currency Unhedged(formerly, Tweedy, Browne Global Value Fund II – Currency Unhedged)
Portfolio Highlights . . . . . . . . . . . . . . . . . . . . . . . . . . . . . . . . . . . . . . . . . . . . . . . . . . . . . . . . . . . . . II-17Perspective on Assessing Investment Results . . . . . . . . . . . . . . . . . . . . . . . . . . . . . . . . . . . . . . . . . . II-18Portfolio of Investments . . . . . . . . . . . . . . . . . . . . . . . . . . . . . . . . . . . . . . . . . . . . . . . . . . . . . . . . . . II-19Sector Diversification . . . . . . . . . . . . . . . . . . . . . . . . . . . . . . . . . . . . . . . . . . . . . . . . . . . . . . . . . . . II-21Portfolio Composition . . . . . . . . . . . . . . . . . . . . . . . . . . . . . . . . . . . . . . . . . . . . . . . . . . . . . . . . . . . II-21
Tweedy, Browne Value FundPortfolio Highlights . . . . . . . . . . . . . . . . . . . . . . . . . . . . . . . . . . . . . . . . . . . . . . . . . . . . . . . . . . . . . II-22Perspective on Assessing Investment Results . . . . . . . . . . . . . . . . . . . . . . . . . . . . . . . . . . . . . . . . . . II-23Portfolio of Investments . . . . . . . . . . . . . . . . . . . . . . . . . . . . . . . . . . . . . . . . . . . . . . . . . . . . . . . . . . II-24Sector Diversification . . . . . . . . . . . . . . . . . . . . . . . . . . . . . . . . . . . . . . . . . . . . . . . . . . . . . . . . . . . II-26Portfolio Composition . . . . . . . . . . . . . . . . . . . . . . . . . . . . . . . . . . . . . . . . . . . . . . . . . . . . . . . . . . . II-26Schedule of Forward Exchange Contracts . . . . . . . . . . . . . . . . . . . . . . . . . . . . . . . . . . . . . . . . . . . . II-26
Tweedy, Browne Worldwide High Dividend Yield Value FundPortfolio Highlights . . . . . . . . . . . . . . . . . . . . . . . . . . . . . . . . . . . . . . . . . . . . . . . . . . . . . . . . . . . . . II-28Perspective on Assessing Investment Results . . . . . . . . . . . . . . . . . . . . . . . . . . . . . . . . . . . . . . . . . . II-29Portfolio of Investments . . . . . . . . . . . . . . . . . . . . . . . . . . . . . . . . . . . . . . . . . . . . . . . . . . . . . . . . . . II-30Sector Diversification . . . . . . . . . . . . . . . . . . . . . . . . . . . . . . . . . . . . . . . . . . . . . . . . . . . . . . . . . . . II-31Portfolio Composition . . . . . . . . . . . . . . . . . . . . . . . . . . . . . . . . . . . . . . . . . . . . . . . . . . . . . . . . . . . II-31
Tweedy, Browne Fund Inc.Statements of Assets and Liabilities . . . . . . . . . . . . . . . . . . . . . . . . . . . . . . . . . . . . . . . . . . . . . . . . . II-32Statements of Operations . . . . . . . . . . . . . . . . . . . . . . . . . . . . . . . . . . . . . . . . . . . . . . . . . . . . . . . . . II-33Statements of Changes in Net Assets . . . . . . . . . . . . . . . . . . . . . . . . . . . . . . . . . . . . . . . . . . . . . . . . II-34Financial Highlights . . . . . . . . . . . . . . . . . . . . . . . . . . . . . . . . . . . . . . . . . . . . . . . . . . . . . . . . . . . . . II-36Notes to Financial Statements . . . . . . . . . . . . . . . . . . . . . . . . . . . . . . . . . . . . . . . . . . . . . . . . . . . . . II-38Report of PricewaterhouseCoopers LLP, Independent Registered Public Accounting Firm . . . . . II-48Other Information . . . . . . . . . . . . . . . . . . . . . . . . . . . . . . . . . . . . . . . . . . . . . . . . . . . . . . . . . . . . . . II-49Investment in the Funds by Managing Directors and Employees of the Investment Adviser . . . . II-49Statement Regarding Liquidity Risk Management Program . . . . . . . . . . . . . . . . . . . . . . . . . . . . . . II-50Directors and Principal Officers . . . . . . . . . . . . . . . . . . . . . . . . . . . . . . . . . . . . . . . . . . . . . . . . . . . . II-51

Letter to Shareholders
Periods Ending March 31, 2022
CUMULATIVE18 MOS THRU03/31/22
6 MOSENDING03/31/22 1 YR 5 YR 10 YR
SINCEINCEPTION(3)
INTERNATIONAL VALUE FUND (INCEPTION 06/15/93)* 27.99% 1.70% 4.36% 5.06% 6.51% 8.67%
MSCI EAFE INDEX (HEDGED TO USD)†(1)(2)(3) 28.92 0.56 7.08 8.32 9.56 6.41
MSCI EAFE INDEX (USD)†(1)(2)(3) 21.48 -3.38 1.16 6.72 6.27 5.37
INTERNATIONAL VALUE FUND II (INCEPTION 10/26/09)* 25.11% 0.08 1.13 4.37 4.84 5.35
MSCI EAFE INDEX (USD)†(1)(2) 21.48 -3.38 1.16 6.72 6.27 5.47
VALUE FUND (INCEPTION 12/08/93)* 28.66 2.54 5.35 6.10 7.13 7.94
MSCIWORLD INDEX (HEDGED TO USD)†(1)(3)(5) 33.65 3.31 11.87 12.94 12.27 8.36
S&P 500 INDEX/MSCIWORLD INDEX (HEDGED TO USD)¶ †(1)(4)(5) 33.65 3.31 11.87 12.94 12.27 9.07
WORLDWIDE HIGH DIVIDEND YIELD VALUE FUND (INCEPTION 09/05/07)* 22.18 2.06 1.97 5.66 5.40 4.22
MSCIWORLD INDEX (USD)†(1)(5) 31.67 2.21 10.12 12.42 10.88 6.82
MSCIWORLD HIGH DIVIDEND YIELD INDEX (USD)†(1)(5) 29.61 7.25 9.41 8.07 8.22 4.71
* The performance data shown represents past performance and is not a guarantee of future results. Total return and principalTT value of an invest-ment will fluctuate so that an investor’s shares, when redeemed, may be worth more or less than their original cost. The returns shown do notreflect the deduction of taxes that a shareholder would pay on Fund distributions or the redemption of Fund shares. Current performance may belower or higher than the performance data shown. Please visit www.tweedy.com to obtain performance data that is current to the most recentmonth end, or to obtain after-tax performance information. Please refer to footnotes 1 through 5 at the end of this letter for descriptions of theFunds’ indexes. Results are annualized for the one–year, firr ve-year, trr en-year and since inception periods only.
† Investors cannot invest directly in an index. Index returns are not adjusted to reflect the deduction of taxes that an investor would pay on distribu-tions or the sale of securities comprising the index.
‡ Tweedy, Browne has voluntarily agreed, effective May 22, 2020 through at least July 31, 2023, to waive the International Value Fund’s fees wheneverthe Fund’s average daily net assets (“ADNA”) exceed $6 billion. Under the arrangement, the advisory fee payable by the Fund is as follows: 1.25% onthe first $6 billion of the Fund’s ADNA; 0.80% on the next $1 billion of the Fund’s ADNA (ADNA over $6 billion up to $7 billion); 0.70% on the next $1billion of the Fund’s ADNA (ADNA over $7 billion up to $8 billion); and 0.60% on the remaining amount, if any, of the Fund’s ADNA (ADNA over $8billion). The performance data shown above would have been lower had fees not been waived from May 22, 2020 to March 31, 2022.
§ Tweedy, Browne has voluntarily agreed, effective December 1, 2017 through at least July 31, 2023, to waive a portion of the International ValueFund II’s, the Value Fund’s and the Worldwide High Dividend Yield Value Fund’s investment advisory fees and/or reimburse a portion of each Fund’sexpenses to the extent necessary to keep each Fund’s expense ratio in line with the expense ratio of the International Value Fund. (For purposes ofthis calculation, each Fund’s acquired fund fees and expenses, brokerage costs, interest, taxes and extraordinary expenses are disregarded, and eachFund’s expense ratio is rounded to two decimal points.) The net expense ratios set forth above reflect this limitation, while the gross expense ratiosdo not. Please refer to the Funds’ prospectus for additional information on the Funds’ expenses. The International Value Fund II’s, Value Fund’s andWorldwide High Dividend Yield Value Fund’s performance data shown above would have been lower had certain fees and expenses not been waivedand/or reimbursed during certain periods.
The Funds do not impose any front-end or deferred sales charges. The expense ratios shown above reflect the inclusion of acquired fund feesffand expenses (i.e., the fees and expenses attributable to investing cash balances in money market funds) and may differ from those shown in theFunds’ financial statements.
INTERNATIONAL VALUEVVFUND
INTERNATIONAL VALUEFUND II VALUE FUND
WORLDWIDE HIGHDIVIDEND YIELDVALUE FUND
TOTALTT ANNUAL FUNDOPERATING EXPENSE RATIOS AS OF 03/31/2022 1.38% (gross); 1.34% (net)‡ 1.37% (gross); 1.34% (net)§ 1.39% (gross); 1.34% (net)§ 1.48% (gross); 1.34% (net)§
TOTALTT ANNUAL FUNDOPERATING EXPENSE RATIOS AS OF 03/31/2021 1.38% (gross); 1.37% (net) 1.38% (gross); 1.38% (net) 1.41% (gross); 1.38% (net) 1.47% (gross); 1.39% (net)
30-DAY STANDARDIZED YIELDSAS OF 03/31/2022
0.94% (Subsidized);0.93% (Unsubsidized)
1.07% (Subsidized);1.07% (Unsubsidized)
0.66% (Subsidized);0.66% (Unsubsidized)
1.79% (Subsidized);1.79% (Unsubsidized)
PERFORMANCE
¶S&P 500 Index (12/08/93-12/31/06)/MSCI World Index (Hedged to USD) (01/01/07-present)
I-1

MARCH 31, 2022
GROWRR TH OF HYPOTHETICAL $10,000 INVESTMENT SINCE INCEPTION
VALUE FUND$86,936
S&P 500/MSCIWORLD(HEDGED TO USD)¶
$116,920
$10,000
03/31/2022
2020
2019
2018
2017
2016
2015
2014
2013
2012
2011
2010
2009
2008
2007
2006
2005
2004
2003
2002
2001
2000
1999
1998
1997
1996
1995
1994
1993
06/15/1993
$10,000
03/31/2022
2020
2019
2018
2017
2016
2015
2014
2013
2012
2011
2010
2009
10/31/2009
$10,000
03/31/2022
2020
2019
2018
2017
2016
2015
2014
2013
2012
2011
2010
2009
2008
2007
2006
2005
2004
2003
2002
2001
2000
1999
1998
1997
1996
1995
1994
12/08/1993
$10,000
03/31/2022
2020
2019
2018
2017
2016
2015
2014
2013
2012
2011
2010
2009
2008
2007
09/05/2007
INTERNATIONAL VALUE FUND since 06/15/1993
INTERNATIONAL VALUE FUND II - CURRENCY UNHEDGED since 10/26/2009
VALUE FUND since 12/08/1993
WORLDWIDE HIGH DIVIDENDYIELD VALUE FUND since 09/05/2007
MSCI EAFE(HEDGED TO USD)$59,998MSCI EAFE (USD)$45,222
INTERNATIONALVALUE FUND$109,479
MSCI EAFE (USD)$19,395INTERNATIONALVALUE FUND II$19,118
MSCIWORLDHIGH DIV YIELD (USD)$19,540
MSCIWORLD (USD)$26,158
WORLDWIDE HIGHDIVIDEND YIELDVALUE FUND$18,258
I-2
MSCIWORLD(HEDGED TO USD)$97,127
Prior to 2004, information with respect to both MSCI EAFE Indexes were available at month endonly; therefore, the closest month end to the inception date of the Fund, May 31, 1993, was used.
Prior to 2004, informationwith respect to theMSCIWorld Index (Hedged to USD) was available atmonthendonly; therefore, the closestmonth end to the inception date of the Fund, November 30, 1993, was used.
Please refer to performance disclosures provided on the previous page.
Letter to Shareholders
I-3
TO OUR SHAREHOLDERS:
While the Russian invann sion is deeply unsettling, like othercrises in the past,our immediate response has been to remaincalm and draw on oaa ur experience to assess the situationrationally. Ayy vital benefit of successfully operating for over100 years in the invenn stment industry is having a balancedperspective when markets are highly reactive.
You can rest assured that the Funds do not haveaa any dnn irectholdings in Ukraine or Russia; however, our Fund portfolioshaveaa some indirect exposure to the region.Nevertheless, the“knock on” effects on the broader global economffff y amm nd onequity markets haveaa been significant,and our Fund portfolioshaveaa not been completely immune to these effects.This hasffffbeen particularly felt in the Funds’European-based holdings,as invenn stors feared the impact on corporate proff fit marginsof supply chain disruptions, rising input costs and inflation,economic sanctions, and rising oil prices. With equityvaluations on the high side, and geopolitical and economicuncertainty escalating, it is no wonder that global equitymarkets had a comeuppance in the first quarter of thisyear.While we remain very concerned about the Russianinvann sion in Ukraine for humanitarian reasons and for whatit may maa ean for equity markets in the near term, we do
not believe that this threat is likely to impact our long-termapproach to markets, nor do we believe that it will likelypermanently impair the underlying estimated intrinsic valuesof the companies held in our Funds’ portfolios.Nevertheless,we will continue to closely monitor our Fund portfoliosas the situation unfolds, and seek to take advantage of theinevitable pricing opportunities we expect will be presentedby these challenging markets.
A HISTORICAL PERSPECTIVE
Looking back over the last several decades, our InternationalValue Fund and the global stock markets haveaa endured somepretty grim news,but have gone on to persevere and prosper.In 1997, there was a meltdown in both currencies andequities in the Far Eastern markets of Indonesia,South Korea,Malaysia, and Thailand, losing on average roughly 50% oftheir value. Following that was the Russian bond default andthe subsequent failure of Long-Term Capital Managementin 1998,which nearly brought the entire market to its knees.In 1999, there was extraordinary fear offf a potential massivesystems failure resulting from the digital concerns relatedto the Year 2000 (Y2K). In 2000, there was the burst of
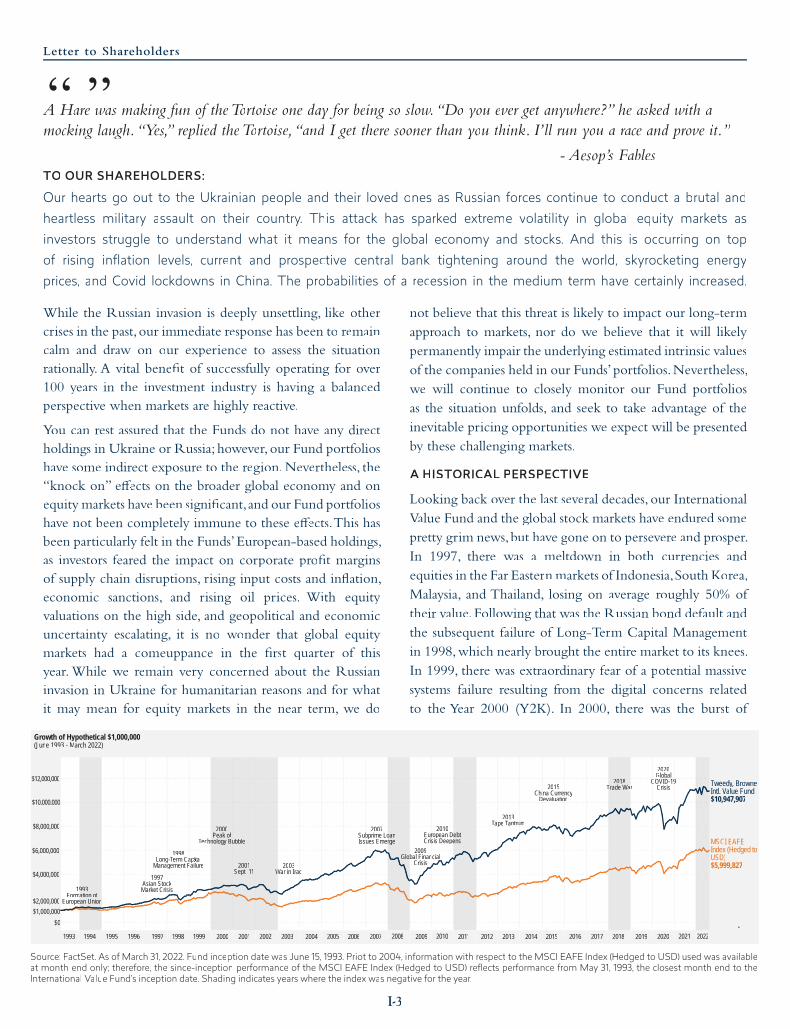
A HareHH was making fun of theTortoise one day for beff ing so slow.“ww Do“ you ever get anywhere?” he asked with amocking laugh.“Yes,”s replied theTortoise,“e and“ I get there sooner than you think. I’ll run you a race and prove it.”
- Aesop’s F’ ablesFF
“ ”
Our hearts go out to the Ukrainian people and their loved ones as Russian forces continue to conduct a brutal andheartless military assault on their country. This attack has sparked extreme volatility in global equity markets asinvestors struggle to understand what it means for the global economy and stocks. And this is occurring on topof rising inflation levels, current and prospective central bank tightening around the world, skyrocketing energyprices, and Covid lockdowns in China. The probabilities of a recession in the medium term have certainly increased.
ofn
e
s
3
Growth of Hypothetical $1,000,000(June 1993 - March 2022)
$2,000,00019999939
Formaation ofatioEuropean Unionee nnan Unionnean U
$1,000,000$00
$4,000,000
$8,000,000
$6,000,000
$10,000,0000
$12,000,000
1997Asian StockA cMarket CrisisM s
1998Long-Term Capitalg a e
Management Failureg Fg pg pg
2000Peak of
Technology Bunnology Bubblen u
2001ppSept.p 11
2003WaWW r in I qqraqq
2007Subprime Lob oanoIssues Emerrger
pp
20092009bal FinancialGlo
Crisis
20102010European Derr sebteee
ensCrisis Deepes eepp
2013Tapeppp Tantrumu
2015China Currencyn
DevaluationD o
2018TTTrT ade W ra
2020Global
COVID-199CCrisis Tweedy, Browne
Intl. Value Fund$10,947,907
MSCI EAFEIndex (Hedged toUSD)$5,999,827
1993 1994 1995 1996 19971994 1995 1996 1998 1999 2000 20022001 2003 2004 2005 2006 2007 2008 2009 2010 2011 2012 2013 2014 20152014 2016 2017 20182017 2019 2020 2021 2022
Source: FactSet. As of March 31, 2022. Fund inception date was June 15, 1993. Priot to 2004, information with respect to the MSCI EAFE Index (Hedged to USD) used was availableat month end only; therefore, the since-inception performance of the MSCI EAFE Index (Hedged to USD) reflects performance from May 31, 1993, the closest month end to theInternational Value Fund’s inception date. Shading indicates years where the index was negative for the year.

MARCH 31, 2022
I-4
the technology bubble and the presidential “hanging chad”election crisis, followed by the terrorist attack on theWorldTrade Center and the collapse of Enron in 2001. In 2008,we had the subprime credit crisis,which led to the failure ofsome of our iconic financial institutions and nearly drove thecountry into a full-scale depression.ff Finally, tyy he COVID-19pandemic was perhaps our most challenging test yet. Thatsaid, for the last nearly 29 years (06/15/1993 to 03/31/2022),our flagship fund, the Tweedy, Byy rowne International ValueFund, has persevered and prospered producing a cumulative,albeit lumpy, return of roughly 995%. This compares to acumulative return for the MSCI EAFE Index (Hedged toffUSD) of approximately 500%, and for the MSCI EAFEIndex (in USD) of approximately 352%.
HISTORY DOESN’T NECESSARILY RLL EPEAT IAA TSELFBUT IT OFTEN RHYMES
The current market environment, in our view, rhymessomewhat with the mid-seventies and early 2000s. Inboth of those periods, speculative excess was folloff wed by acomeuppance for overvalued equities that was quite severe.The highly regarded Nifty Fifty stocks of the ’70s collapsedas did the tech darlings of the late ’90s, and it took 15 to 20plus years in many inn nstances for those stocks to regain theirprevious highs. Several never made it back. In the ’70s thecollapse was catalyzed by inflation, triggered in part by fiscalstimulus associated with the funding of Lyndon Johnson’sGreat Society, ayy nd a supply shock (Arab oil embargo),whichled to a quadrupling of oil prices. In contrast, the 2000 techbubble stocks collapsed largely under the weight of theirown excess valuations, and associated financial excesses.Willunexpectedly persistent and escalating inflation coupledwith supply disruptions and an oil shock associated with theinvann sion of Ukraine be the catalyst for a similar comeuppancethis time around? It’s h’ ard to know, but we believe sucha calamity should again favoaa r value oriented invenn stmentstrategies such as ours. (Of course, past performance is noguarantee of future results.)
LESSONS FROM BEN GRAHAM
Thanks to Benjamin Graham,we never lose sight of the factthat when we buy a stock for the Funds, we are purchasingan ownership interest in a business enterprise that has avalue that is often independent of the price it trades at in thestock market.To Graham and us, the essence of invenn sting hasalwayll s been to seek to exploit discrepancies between thosetwo prices … to buy bargains in the market. Over time,the stock price can be volatile, depending on any nnn umberof factors that can trigger reactions and overreactions frominvenn stors. In contrast, in our view, a business’s underlyingrr
estimated intrinsic value tends to be more stable.We focusour attention on our estimates of the business’s i’ ntrinsicvalue, and when we believe the stock market mis-prices thatvalue,we pounce.When the stock market prices the businessat a level that meets or exceeds our estimate of its underlyingvalue,we will often trade our shares back into the market. Inthe interim,we seek to capture the spread between price andvalue and participate in the growth of the business’s i’ ntrinsicvalue.While we are not alwayll s correct in our assessment ofa company’s underlyinrr g intrinsic value, this “business-like”approach to invenn stment has served us well over time. Thealternative approach of trying to predict the outcome of acrisis or its impact on the economy amm nd equity markets, webelieve, is a low probability exercise.
STAYTT ING ON THE BUS
In times of economic and geopolitical turmoil like thepresent, challenging markets will invann riably offer upffffopportunities, and taking advantage when they appear, is,in our view, the essence of successful long-term investing.However, the ability to haveaa a successful invenn stmentexperience depends in large part on the willingness of ourinvenn stors to “stay on taa he bus.” The ride can be bumpy, but
In times of economic and geopolitical turmoillike the present, challenging markets will
invariably offer up opportunities ...
you have to stay on baa oard to have any chance of reachingyour destination. And you can rest assured that we are onboard with you.As of March 31,2022, the current ManagingDirectors and retired principals and their families, as well asemployeoo es of Tweedy, Byy rowne, had more than $1.5 billionin portfolios combined with or similar to client portfolios,including approximately $154.4 million in the InternationalValue Fund, $91.7 million in the Value Fund, $7.6 millionin the Worldwide High Dividend Yield Value Fund, and$7.7 million in the InternationalValue Fund II – CurrencyUnhedged.
PERFORMANCE
After nearly nine years of an incredibly difficult stretch forvalue invenn stors,we believe that the pendulum is now swingingback in favff or of what we do, and that is reflected in thereturns of our Funds over the last year and a half. Iff f one looksat performance results beginning 18 months ago (September30, 2020),when the prospects for emergency use approval ofvaccines and the prospect of a strong fundamental economic
“ ”

Letter to Shareholders
I-5
recovery sparked a strong rally in vll alue-oriented equities, theTweedy, Byy rowne Funds haveaa produced cumulative absolutereturns of between 22% and 29%. Our two internationalFunds performed roughly in line with or outperformed theirrespective benchmarks,while our twomore globally orientedfunds trailed their benchmarks during this period, largelydue to an underwerr ighting in US equities and the impact ofthe Ukraine war on the relative performance of Europeanequities.Three of our four Funds significantly outperformedthe growth component of the MSCI EAFE and WorldIndexes, which produced returns for the 18-month periodof 10.79% (MSCI EAFE Growth Index) and 23.23% (MSCIWorld Growth Index).TheWorldwide High DividendYieldValue Fund finished the 18-month period with a strongabsolute return of 22.18%, but marginally underperformedthe MSCIWorld Growth Index.
total return due to poor currency translations during thefiscal year.These gains also helped to propel the InternationalValue Fund’s returns well ahead of the MSCI EAFE Index(in USD) for the fiscal year. However, the InternationalValue Fund underperformed its benchmark, the MSCIEAFE Index (Hedged to USD) for the period.As you know,the InternationalValue Fund andValue Fund seek to reducetheir currency risk by hedging their perceived foreignffcurrency exposure back into the US dollar based on ourjudgment of such exposure, after taking into account variousfactors such as the sources of the Fund’s portfolio companies’earnings and the currencies in which the Fund’s securitiestrade.Therefore, the InternationalValue Fund and theValueFund will only partially hedge multi-national portfoliocompanies that earn revenues and profits in US dollars.Thosecompanies’ exposure to US dollar revenues and earningsacts, in our view, as an implicit hedge. The MSCI EAFEIndex (Hedged to USD) and MSCIWorld Index (Hedgedto USD), on the other hand, are fully hedged back into theUS dollar, irrespective of some of their constituents havingmaterial revenues and earnings in US dollars. In addition, theInternational Value Fund has had a significant underweightin Japanese equities (2.6% allocation as of March 31, 2022).When the US dollar is strong while the Japanese yen isweak, as has been the case over the last year, it becomes morechallenging to outpace the hedged benchmark’s strongerrelative performance. The benchmark’s outperformance, inpart, is due to its relatively large weighting in the Japaneseyen (23%) and its policy of hedging 100% of its nominalexposure back into the US dollar.With respect to theValueFund, hedging gains were not enough to propel the Fundahead of the hedged or unhedged MSCIWorld Index, as theFund was disadvantaged by its relatively lower weighting inUS equities.The unhedgedWorldwide High DividendYieldValue Fund also trailed its unhedged benchmark for the yearin part due to a significant relative underweighting in USequities. As would be expected, during this period of USdollar strength, the InternationalValue Fund II – CurrencyUnhedged was unable to perform on an absolute basis aswell as the hedged International Value Fund, but did comevery close to besting its unhedged benchmark producing areturn of 1.13% versus 1.16% for the MSCI EAFE Index inffUS dollars.
Over the last 28¾ years since its inception in June1993 through March 31, 2022, the International ValueFund produced a compound annualized return forff itsshareholders of 8.67%, net of feeff s, which translates into acumulative return of 994.78%. By comparison, from May31, 1993 through March 31, 2022, the MSCI EAFE Index(Hedged to USD) and the MSCI EAFE Index (in USD)
Returns over the 12 months ended March 31,2022 were notas robust. All four Funds underperformed their respectivebenchmark indices producing absolute returns of between1.13% and 5.35% compared to returns of between 1.16%and 11.87% for their benchmarks. For our Funds and valuestocks in general, returns had been quite strong from thefirst announcements of vaccines in the fouff rth quarter of2020, right up until mid-May of 2021, when the Deltaand subsequent Omicron variants appeared, driving peopleindoors again. From that point forward, as case rates andhospitalizations rose, the “stay at haa ome” technology andgrowth stocks once again surged, driving stock marketreturns for the rest of the calendar year. As the new yearopened, increasing concerns regarding rising inflation andinterest rates, and the invann sion of Ukraine, led to risingmarket volatility and value stocks once again assumedmarket leadership.
The US dollar has remained remarkably strong over thelast year against all major currencies, including the euro, theBritish pound, and the Japanese yen.This US dollar strengthfavoaa rs currency hedged funds, like our International ValueFund andValue Fund , which hedge their perceived forff eigncurrency exposure, to the extent practicable, back intothe US dollar. Significant gains in the value of the Funds’forward contracts helped to soften much of the dilution in
After nearly nine years of an incredibly difficultstretch for value investors, we believe that thependulum is now swinging back in favor of
what we do ...
“ ”

MARCH 31, 2022
I-6
compounded at 6.41% and 5.37%, respectively, translatinginto cumulative returns of 500.01% and 352.22%. Thus,an investor who had been invested in the Fund sinceits inception would have received a cumulative annualreturn of nearly twice that of the MSCI EAFE Index(Hedged to USD), and 2.4 times that of MSCI EAFEIndex (in USD). Investors should never forff get the powerof compound interest. An investment of $1 millioncompounded at 8.67% over 28¾ years grows to $10,947,907.
If you believe that the volatility of a return stream is a reliablemeasurement of risk, the InternationalValue Fund producedits benchmark-besting returns while assuming relatively lowlevels of risk when compared to the MSCI EAFE Index
(both Hedged to USD and in USD). For example, sinceJuly 1, 1993 (the first full month of the Internationalff ValueFund’s returns) through March 31, 2022, the InternationalValue Fund had an annualized standard deviation of 12.15%,compared to 16.02% for the MSCI EAFE Index (in USD)and 14.22% for the MSCI EAFE Index (Hedged to USD).Further, as illustrated in the following chart (and for the sameffperiod), the Fund’s 1’ 2.15% standard deviation compares wellto 16.37% for a peer group of foreign large cap funds inthe Morningstar database, which ranks it at the very top(#1) of these foreign large cap funds in terms of standarddeviation. In terms of Sharpe Ratio, which measures returnper unit of risk, the Fund’s since inception ratio of 0.56ranked it again at the very top (#1) of this same peer group.
SHARPE RATIOPEER GROUPTWEEDY, BROWNEINTERNATIONAL VALUE FUND
International Value FunddndndTop RRananked mong itsitamoong iitmo tongg itssonpeersrs in Re rnturnrn,n, VooVoooVoolatilitylattilitylattilityand Sharp Re RRaatatio
RISK (STANDARD DEVIATION)
%RETURN
position and size of thisbubble represents the
peer group average return,volatility, ayy nd sharpe ratio
11% 21%
0.32
0.15
0.390.56
HIGH RETURNLOW RISK
LOW RETURNLOW RISK
HIGH RETURNHIGH RISK
LOW RETURNHIGH RISK
0%12%
RISK RETURNMEASUREMENTSTWEEDY, BROWNE INTERNATIONAL VALUE FUND VS FOREIGN LARGE CAP FUNDS SINCE JULY 1, 1LL 993
This graph illustrates a risk-to-return profile of the Tweedy, Browne International Value Fund versus a group of its peers from July 1, 1993 (just(after the Fund’s inception on June 15, 1993) through March 31, 2022. The foreign large cap funds peer group is calculated by TweTT edy, Brownebased on data provided byMorningstar and includes all foreign large cap funds (Foreign Large Value, Foreign Large Growth, and Foreign LargeBlend) (52 funds in total) tracked by Morningstar that were in existence on July 1, 1993 and were still in existence on March 31, 2022. On thegraph’s horizontal x-axis we have plotted the funds’ levels of risk, as measured by the annualized standard deviation of return and reported byMorningstar, while the funds’ annualized investment returns (as reported by Morningstar) are plotted on the vertical y-axis. Funds that fall inthe upper left quadrant have demonstrated relatively lower risk and relatively higher returns. A fund’s bubble size is dependent on its SharpeRatio, with larger bubbles indicating a higher Sharpe Ratio relative to other funds (Sharpe Ratio is a measure of excess return per unit of riskassumed). As of March 31, 2022, the International Value Fund had the highest return, the lowest level of return volatility (risk), and the highestSharpe Ratio among these foreign large cap peers since the Fund’s 1993 inception.Source: Tweedy, Browne, based on data fund data provided by Morningstar.

Letter to Shareholders
I-7
Tweedy, Browne has ranked the International Value Fund basedon data provided by Morningstar in terms of standard deviation,Sharpe Ratio and total return among a foreign large cap peer group,composed of funds in Morningstar’s Foreign Large Value, ForeignLarge Growth, and Foreign Large Blend categories. As of March 31,2022, the International Value Fund was ranked in terms of standarddeviation 143 (out of 410 funds in the peer group) for the 1-yearperiod; 25 (out of 343 funds in the peer group) for the 5-year period;3 (out of 272 funds in the peer group) for the 10-year period; and 1(out of 52 funds in the peer group) for the period July 1, 1993 throughMarch 31, 2022. As of March 31, 2022, the International Value Fundwas ranked in terms of Sharpe Ratio 29 (out of 410 funds in thepeer group) for the 1-year period; 256 (out of 343 funds in the peergroup) for the 5-year period; 36 (out of 272 funds in the peer group)for the 10-year period; and 1 (out of 52 funds in the peer group) forthe period July 1, 1993 throughMarch 31, 2022. As of March 31, 2022,the International Value Fund was ranked in terms of total return 29(out of 410 funds in the peer group) for the 1-year period; 271 (out
of 343 funds in the peer group) for the 5-year period; 96 (out of272 funds in the peer group) for the 10-year period; and 1 (out of 52funds in the peer group) for the period July 1, 1993 through March31, 2022. The “out of” number represents the total number of fundsin the peer group for the listed time period. The rank in a categoryis based on the fund’s standard deviation, Sharpe Ratio and totalreturn provided by Morningstar. The total return rank in a categoryis based on total returns, which include reinvested dividends andcapital gains, if any, and exclude sales charges. Standard deviationmeasures the range of an investment’s performance. The greaterthe standard deviation, the greater the investment’s volatility.Sharpe Ratio is a way to measure a fund’s risk-adjusted returns.It is calculated by dividing a fund’s annualized excess returns overthe risk-free rate by the annualized standard deviation of the excessreturn. The higher the Sharpe Ratio, the better the fund’s historicalrisk-adjusted performance has been. The rankings may have beenlower had fees not been waived. Past performance is no guaranteeof future results.
As we have mentioned before,ff we believe that felff low value investor Howard Marks was absolutely right when he stated thatthe true measure of a money manager’s skill is the manager’s ability to produce returns that are more than commensuratewith the risks assumed. At Tweedy, Browne, we focff us on stock prices in relation to various valuation multiples and earningsyields and fundamental facff tors such as earnings and sales stability in gauging the inherent risk of a prospective investment.We are encouraged by the facff t that this funff damental work has also produced statistically attractive risk adjud sted returns.
While the International ValVV ue Fund’s positive returns over the last 28-plus years were earned while experiencing lowervolatility than its forff eign large cap fund peers, the path to achieving attractive risk-adjusted returns has not been withoutbumps along the way. Periods of underperformance are a normal part of a long-term index-besting performance record —the folloff wing table illustrates this. Since the International Value Fund’s inception, good index-besting periods have beenfollowed by difficult periods, then good periods, etc. YouYY ’ll notice the latest difficult stretch of underperformance has beenunprecedentedly long. If the past is indeed prologue, we would expect the recovery of returns this time around relative toour growth brethren and our global benchmark to be similarly robust, if not better. (Of course, past performance is noguarantee of futff ure results.)
CUMULATIVE RETURNS
INTERNATIONAL VALUE FUNDMSCI EAFE INDEX(HEDGED TO USD)
Good 06/15/1993 - 1997 97.09% 58.20%*
Difficult 1998 - 1999 39.05 55.16
Good 2000 - 2004 41.15 -22.01
Difficult 2005 - 2007 49.11 62.77
Good 2008 - 2012 9.86 -17.59
Difficult 2013 – 03/31/2022 72.77 133.66
In many rnn espects, Ben Graham’s “margin of safety” approach to invenn sting can help an invenn stor win over the longer term bylosing less during periods of great market stress.That has certainly been reflected in the results of our flagship Fund overits 28-plus year history. As you can see in the following chart, since its inception in 1993, the International Value Fund hasoutperformed its benchmark index (in terms of annual total returns) in every calendar year in which the index had a negativeannual total return. In fact, our Fund gained the most ground against its benchmark index during these challenging periods.

MARCH 31, 2022
I-8
PORTFOLIO ATTAA RIBUTION & POSITIONINGPlease note that the individual companies discussed herein wereheld in one ormore of the Funds during the year endingMarch 31,2022, butwere not necessarily held in all four of the Funds. Pleaserefertofootnote6attheendofthis letter foreachFund’srespectiveholdings in each of these companies as of March 31, 2022.
While macroeconomic issues, including the war in Ukraineand the surge in inflation and commodity prices, especiallyoil, are rarely determinative in our bottom up investmentdecision-making process, they are seriously weighed andcan have an impact at the margin on portfolio constructionand stock selection. Before addressing the drivers of returnsover the last year and specific portfolff io actions we havetaken, we thought we would share with you our viewsregarding the current macro and geopolitical environment:
» The risk of sustained higher inflation has increased. Inaddition to the cumulative impact of years and yearsof monetary and fiscal stimulus, elevated energy prices(Ukrainian war) and continued supply chain bottlenecks(China’s lockdowns froff m zero-Covid policy) are addingadditional inflationary pressure. Medium-term consumerinflation expectations are increasing, as are the risks fora wage-price spiral.
» There is an increased possibility that energy priceswill remain structurally higher in the medium term,particularly in Europe.
» Many central banks, including the Federal Reserve,appear to be behind the curve, and are playiaa ng catch-upin raising interest rates and removing quantitative easingto fight high inflation.
» While difficult to predict, the probability of a global
recession in the medium term has also increased.
» Factors above argue forff more cautious near-term margin
and earnings expectations.
» In discussions with the Funds’ portfolff io companies, we
have uncovered a good deal of optimism with respectto their ability to ultimately pass on increased costs viahigher prices. Almost invariably, however, this occurswith a lag, resulting in near term margin compression.Moreover, with every business now attempting tosimultaneously increase prices, some demand destructionshould be expected.
» On the geopolitical froff nt, the overwhelming globalcondemnation of the Russian invasion in Ukraine andthe imposition of crippling economic sanctions has likelybeen a shot across the bow for the Chinese.
With respect to portfolff io attribution, the strongest overallcontributions to our Funds’ performance over the last fiscalyear came from traditional value groups such as the Funds’financial, consumer staples, healthcare, and industrialholdings. This included strong returns froff m the Funds’banks, diversified financials, fooff d and beverage, pharmaand interactive tech media companies. It has been aparticularly beneficial environment forff banks such as WelWW lsFargo, DBS Group, United Overseas Bank, and Bank ofNew YorYY k Mellon, which have been clear beneficiariesof the increase in financial activity, advisory feeff s and netinterest margins. Food and beverage holdings, Nestlé,Diageo and Coca-Cola FEMSA benefitted from economic
PERFORMANCE IN DOWNMARKET YEARS
4.4
12.4
-4.7
-12.1
-38.3
-4.1-6.7
-1.7-4.4
-15.9
-27.4
-39.9
-12.1-9.0
-45
-40
-35
-30
-25
-20
-15
-10
-5
0
5
10
15
20
25
30
35
1994 2000 2001 2002 2008 2011 2018
Tweedydd , Browne International Value Fund MSCI EAFE (Hedged to USD)

Letter to Shareholders
I-9
reopenings around the world. Pharma companies such asGlaxoSmithKline and Roche continued to benefit fromffstrong drug pipelines. Interactive media holding, Alphabet(Google), whose growth trajectory in search and otheronline businesses has remained extraordinarily strong, andSwiss media company, TX Group, which through a recent
up 36% on the news in late October. While the offerffff , inour view, was not at the company’s fulff l intrinsic value, wedecided to sell our Funds’ shares. The Swedish industrialcompany, Trelleborg, which is held in all of our Funds,also jumped up on the rumor last fall that a Japanese rubbercompany had offereffff d $2 billion for Trelleborg’s wheelsystems business. The stock hit a record high 237 kronashortly after the initial media coverage. In late Marchrumor became reality, as Trelleborg signed an agreementto divest its wheel systems division to YokYY ohama RubberCompany forff $2.3 billion. Our weighted average cost inTrelleborg shares across our Funds is roughly 118 krona.Holdings of CNH Industrial also got a boost in the 4thquarter froff m the company’s plan to spin off its trucking andpowertrain business, Iveco, early in 2022.
In contrast, several of the Funds’ consumer discretionary,utility, materials, and industrial holdings produceddisappointing results for the fiscal year. This includedportfolio holdings such as Autoliv, the Swedish automobileairbag and seatbelt company, and Norma, the Germanmanufacturer of joining products for the automotivesector — both companies suffereffff d froff m automobile supplychain difficulties (lack of semiconductors and harnesses),and were negatively impacted by raw material inflation;Safran, the French jet engine manufacturer whose resultsare correlated in part to passenger airline volume has yetto fully recover from lockdowns and Covid restrictions;Rubis was affecffff ted by rising energy prices; BASF wasimpacted by macroeconomic concerns as well as Russiaexposure in its oil & gas subsidiary; Henkel was negativelyimpacted by the relatively slower growth in Europe dueto the pandemic and the Russian invasion of Ukraine;Intel announced a plan to regain product leadership thatwas more expensive than investors had expected; 3Mfaced rising litigation costs; Comcast was affecffff ted by aslowdown in broadband subscriber growth post “stay-aa at-home” and by increasing competition; and Fresenius SE &Co, the German healthcare company, which experienced adeclining patient population forff their dialysis services dueto Covid deaths. It remains our view that these companiesare strong and resilient and should be able to weather thenear-term geopolitical and economic uncertainty and themarket volatility associated therewith.
The Funds’ emerging market holdings also facedffchallenges during the fiscal year, particularly those inChina, as economic growth slowed and regulatory andgovernmental intervention continued to negatively impactcertain industries and companies. This led to declines
joint venture expanded its digital classified ad business,also produced strong returns forff the period. The stockprices of British defenff se-related industrial companies, BAESystems and Babcock International, also responded wellduring the period. BAE recently de-risked its pension planand, in our view, continues to have an attractive mix ofdefenseff businesses in demand by the UK military, whileBabcock International is in the midst of a turnaround bynew management, which is gaining credibility amongstinvestors. The German defenseff contractor and automotiveparts manufacff turer, Rheinmetall, also delivered a strongperformance during the year as thewar inUkraine increasedinterest in defense and security. The share price of Bollore,the French logistics and media company, benefitted fromthe strength in the freight forff warding market (driven byCovid-related supply chain disruptions) and the sale ofits African port and logistics business. TotTT alEnergies, theFrench oil & gas company, one of the Funds’ fewff remainingoil companies, benefitted from the recent spike in oil prices.A number of other holdings saw their stock prices advanceduring the year, including Berkshire Hathaway,aa theWarWW renBuffetffff t-led conglomerate, and AutoZone, the US-basedafteff rmarket auto parts retailer, which has benefitted fromdisruptions in the automotive supply chain. Carlisle, theUS-based commercial roofing company, also performedwell in the period as it continues to benefit froff m a strong re-roofing backlog due to jobs deferff red during Covid, and theincreasing age of the commercial building stock in the US.
Corporate actions later last year in a fewff of our Fundholdings also had a positive impact on results forff the fiscalyear end. For example, La Banque Postale announced atender last fall for the remaining shares of the French lifeinsurer, CNP Assurances, which it did not already own.CNP is a longtime Fund holding, and the stock jumped
... the strongest overall contributions to our Funds’performance over the last fiscal year came from
traditional value groups such as financial, consumerstaples, healthcare, and industrial holdings.
“ ”

MARCH 31, 2022
I-10
in Alibaba, Baidu, Tencent, and A-Living, among otherChinese holdings. Recent government imposed Covidlockdowns have only added to these concerns. That said,we were encouraged by recent messaging froff m ChineseVice Premier Liu He, where he encouraged the adoption ofstandard, transparent and predictable regulation to promotethe steady and healthy development of the Chinese platformeconomy amm nd improve its international competitiveness.While there are no guarantees, Liu He’s comments providesome hope that Chinese regulation might not be as heavy-handed going forff ward.
As of mid-May,aa many Chinese internet companies weretrading at extremely discounted valuations, despite theirstrong market positions and, in our view, attractivegrowth potential. Alibaba and Baidu were selling for ~2xand ~1.2x our estimates of their core business’s operatingincome, respectively. Although Tencent was tradingat a slightly higher 7x our estimate of its core businessoperating income, it has, in our view, the strongest“moat” of the three businesses, and we believe it shouldhave the highest earnings growth in a more normalizedmacro environment. Baidu has nearly 60% of its marketcap in cash and equity investments, while Alibaba hasover 43% and Tencent nearly 40%. Net of cash and equityinvestments, Baidu was selling forff 6.9x its forff ward earnings(or, estimated futff ure earnings), while Alibaba was sellingfor 6x its forward earnings. In contrast, Amazon wastrading forff nearly 55x forff ward earnings. Even folloff wingits recent share price decline, Facebook was still selling for17x its forward earnings, net of cash. Of course, thesefigures will be impacted by the recent Covid lockdowns inChina, and our estimates might prove to be too optimistic.Nonetheless, we believe the valuation discounts at thesebusinesses are extreme.Wh. ile we recognize that Chineseinternet companies are deserving of a higher corporategovernance and regulatory valuation discount relative totheir WesWW tern peers, in our view, the current valuationdifferenffff tials more than account for this. As of March 31,2022, the Funds generally had between 6.1% and 8.3% oftotal assets invested in Chinese and Hong Kong equities,and we are seeking to stay waa ithin the 5% to 10% range inthese two countries (at cost) ft orff the time being.
Looking forff ward, in researching prospective and existingholdings wherever they may be daa omiciled in the world, weare increasingly focff used on the folloff wing:
» Balance sheet strength;» Pricing power in the facff e of rising input costs (albeitofteff n with a lag);
» Risks to operating margins as a result of persistently highenergy prices; and
» Increased consideration of “insight information”; usinginsider buying as a clue to opportunity and resilience inthe businesses being researched.
As Scott Galloway,aa the highly noted media and tech guru,recently opined in one of his newsletters, “There are fewfundamental truisms in the markets. One of them is….fundamentals. Another is cyclicality. And in my view, theatmospherics, if not sheer probability, augur that we’veentered the less appealing part of the cycle.” If Scott iscorrect, companies with fortress balance sheets and pricingpower may continue to draw investor interest in thisincreasingly volatile market environment.
PORTFOLIO ACTIVITY
Despite rising valuations for much of the last year, wecontinued to be very active in adding to and pruning theFunds’ invenn stment gardens.We uncovered numerous equitiesthat we believe were undervalued, particularly in Europeand in some of the more developed emerging markets, butalso in the US.We eWW stablished a number of new positionsduring the fiscal year and added to many onn thers, includingVertex Pharmaceuticals, the US-based biotechnologycompany; Kemira, the Finnish chemical solutions business;Haitian International, the largest manufacturer of plasticinjection molding machines in China; Buzzi Unicem,the Italian cement company; Fagron, the Belgium basedpharmaceutical compounding company; SKF, tFF he Swedishball bearings company; FMC, the US-based agriculturalchemicals company; Sumitomo Heavy, tyy he multi-facetedJapanese manufacturer;Tencent, the dominant Chinese socialTTmedia and gaming company; US-basedThor Industries, thelargest maker of recreational vehicles in the world; Uni-President, the China-based instant noodles and beveragecompany;Winpak, the Canadian food packaging company;Tesco, the UK-based grocery business; and, near year end,Rheinmetall, the German-based defense systems andautomotive components company.nn All of these companies,at purchase, were trading at substantial discounts from ourconservative estimates of intrinsic value, were financiallystrong,and in our view had good prospects for future growth.To make room for the neff w acquisitions and additions, wesold and trimmed a number of the Funds’ holdings thathad approached or exceeded our estimates of intrinsicvalue, including Bangkok Bank, Hankook & Co.,Alten, theGerman engineering company,nn Jardine Strategic, KingboardHolding, Michelin, Novartis, Roche, Siemens, Carlisle Cos,Phillips 66, Bollore,Alphabet,AbbVie, and a host of others.

Letter to Shareholders
I-11
More on a Few Newly EstablishedPositions During the Year
» Buzzi UniUU cem (pa(( id approxrr imately €l 18.30 per share)rr ~geographically diversified global cement company. Nearnet cash balance sheet. Material insider buying (€27million at average price ~€19.50 per share). Negativelyimpacted by higher energy input prices, but cement isa small portion of the cost of construction projeo cts. Agreater risk is overall construction activity. Paid 4x 2021EBITDA and 6x our estimate of “normalized” EBITDA,assuming 10-year average margins. Observed M&Adeals at 6x to 8x EBITDA.
» Vertex (paid appa roximately $187 per share) ~ US-basedbiotechnology company specializing in drugs forff rarediseases. Dominant therapies in the treatment of CysticFibrosis. Enjoys pricing power and little competition.Material insider buying by the company’s CEO and leaddirector, in addition to a large buyback by the company.The ValVV ue Fund’s weighted average cost is $187, and atpurchase, it was trading at roughly 14x current earningsand 9.9x enterprise value to EBIT.
» SKF (KK pa(( id between 149.1 and 162.1 Swedish krona (SEK)per share) ~ Sweden-based pre-eminent manufacff turerof ball bearings with approximately 20% world marketshare. The WalWW lenberg family owns 14% of the companyand significantly added to its position ($25 million in2021 and $50 million in 2022), paying higher prices thanwe paid for our shares (as much as 229 krona per share).SKF has been a strong cash generator, has produced highreturns on invested capital, and has compounded ourestimate of its intrinsic value, on average, at 5 to 6% peryear. Its balance sheet is rock solid, in our view, with anet debt to EBITDA ratio of 0.55. At purchase, assuminga price of roughly 160 SEK, the shares were trading at8x our estimate of normalized EBIT, 6x our estimate ofnormalized EBITDA, 9.5x earnings, and had a currentdividend yield of 4.5%.
» Thor Industries (paid approxrr imately $l 94.30 per share)rr ~Largest maker of RVs in tVV he world. 45% market share inUS/Canada, 22% in Europe. 1.5x net debt to EBITDA.The company’s highly variable expense structure (asdemand falff ls, so do costs) has resulted in profit everyyear since 1980, despite cyclical end demand. Materialinsider buying ($31 million at $107 per share averageprice). Paid 7x trailing twelve months P/E, or 11x ourestimate of normalized P/E (based on pre-pandemicsales and 10-year average margin).
ENVIRONMENTAL, SOCIAL ANDGOVERNANCE (ESG) INITIATIVES
As we have mentioned in previous reports, environmental,social and governance factoff rs (ESG) can present bothrisks and opportunities when investing, and are becomingincreasingly important to many of our shareholdersand prospective shareholders. Over the last year, weincorporated into our research process an evaluation ofnumerous ESG considerations including the folloff wing:
» ESG issues factoff red into our decision to establish aposition in Kemira, one of our new Fund portfolioadditions. Kemira is a Finnish-based global leaderin sustainable chemical solutions for water intensiveindustries. Kemira’s products enable customers to improveproduct quality and deliver environmental benefits suchas cleaner drinking water, treating wastewater forff safereuse or release into nature, reducing CO2 emissions and/or improving recyclability (replacing plastics with paper).“Sustainability” is at the core of the business and at thecenter of product design. According to the company, 54%of total revenue is generated froff m products that improvecustomer resource efficiency. Kemira’s products helpensure safe and clean water and help paper mills use lesswater. The most meaningful of Kemira’s stated ESG goalsis to derive €500 million in annual revenue from bio-basedproducts by 2030 (bio-based inputs replacing carbon basedinputs). They have several other ESG-oriented goals relatedto employee safetff y, diversity & inclusion, water intensity,reduction in Scope 1 and Scope 2 emissions, etc. We valuedthe business at 9x to 10x EBITDA based largely on mergerand acquisition comparables. We think the high end of therange encompasses a 1.0x multiple point premium basedon ESG opportunities (like the universal goal of treatingwaste water for safe rff elease into nature).
» FMC Corp, the crop protection company, is an exampleof another purchase we made forff the Funds over thelast year where ESG considerations playeaa d a role in ourresearch process. FMC Corp. provides crop chemicals forffthe agriculture industry. Crop chemicals protect farff mers’fields from insects, funff gus, and weeds, which allows themto increase their crop yields. While FMC could facff e someESG risk associated with increasing regulations that bancertain crop chemical products due to their environmentalimpact, we do not think it is likely that this risk will bematerial. To date, FMC has actually benefited froff m thisdynamic. Many older crop chemicals, particularly certaininsecticides, are “broad-spectrum,” and can be quite toxicto the environment because they impact everything thatthey come into contact with. As a result, regulators are

MARCH 31, 2022
I-12
increasingly prohibiting the use of the older, more harmfulchemistries. In contrast, FMC produces a lot of “targeted”crop chemicals, which affecffff t only the “targeted” pests, andtherefore have a lower environmental impact. This hasallowed new products to take market share from the older,more toxic ones that are being banned, allowing FMCto grow at nearly twice the industry growth rate. In thisrespect, rather than negatively influencing our valuation,environmental impact concerns actually caused us toincrease the multiples we used to estimate the company’sintrinsic value. In addition, FMC was recently named byBarron’s as one of America’s most sustainable companies.They were the only agricultural-related business on the list.
» Another of our more recent Fund investments is Rubis,a French-listed business that distributes petroleum- basedproducts (gasoline and liquid petroleum gas “LPG”) in theCaribbean and East Afriff ca. We engaged with the companyin the 4th quarter to get a clearer understanding of howRubis was addressing its business’s environmental impact,and the possible negative implications that impact mayaahave on Rubis’s stock price and value compound. Wehad questions about what appeared to be, according to aprominent financial reporting firm, a weak track recordrelative to its peers, with respect to disclosing environmentalinformation. Rubis representatives disputed this, believingthat the reporting firm’s information was incomplete andsome of it incorrect. They emphasized the company’sAA rating at MSCI and asked us to complete a survey toinform them of the ESG issues that are important to us.We completed and submitted the survey, and appreciatedthe company’s willingness to engage with us on thisissue. We acknowledge that the company faces unusualenvironmental challenges from their operations in Afriff caand other emerging markets. For example, Rubis suppliesLPG to consumers in East Afriff ca for home heating andcooking. These consumers do not have access to renewablesources of power, natural gas pipelines, or reliable electricitynetworks. The main alternatives to LPG for home cookingand heating include burning wood, dung or cardboard,which arguably produce more toxic emissions than thatproduced by cleaner gas-based fossil fuels. It is estimatedthat these non-fosff sil fuel based alternatives kill about700,000 people per year in sub-Saharan Afriff ca from indoorair pollution. Economic development can help Afriff ca outof this unenviable position, but it also means Afriff cans mayaarequire low cost fossil fuel in the nearer term to help payaafor a more sustainable future. In addition, around quarter-end, Rubis announced a significant investment in a Frenchsolar power generation business whose efficacy we arecurrently studying. We will continue to monitor Rubis’s
behavior with respect to these complex environmentalimpact issues, but forff now feel they do not compromisethe company’s ability to compound its intrinsic value overtime. Furthermore, in our view the company’s discountedstock price more than compensates for these issues.
» More recently, we have engaged with the seniormanagement of Industrias Bachoco, the Mexican chickencompany, which we own across all four of our funds,regarding an important minority rights issue. In March,the Robinson Bours family, which owns a controllinginterest in the company, announced a voluntary tender offerffffto buy out the remaining shareholders at approximately81.66 pesos per share, which is a modest premium over theFunds’ original cost of approximately 71 pesos; however,we believe, as do a number of other shareholders, that theprice offerffff ed is well below any reasonable estimate of fairvalue, and unfairly benefits the family at the expense ofminority shareholders. Prior to the announcement of thevoluntary offerffff and in light of the significant discount atwhich the shares were trading in the public market, wehad encouraged the company to consider a share buyback,which, in our view, would have accreted significantadditional value to all of the remaining shareholders, notjust the Robinson Bours family. Instead they chose toattempt to buy out the remaining shareholders at a pricewhich represents only a modest premium to where thestock had been trading prior to the deal announcement. Ifthe intention of the family is to take the company privateand delist, we felt that they should at least make a realisticofferffff that reflects the inherent value of the business.
The tender offerffff has not yet been approved by Bachoco’sboard. Shortly afteff r the announcement, we contacted theCFO of the company to express our dissatisfaction with theofferffff . We also spoke with members of the press and severaladditional institutional shareholders. In late April, togetherwith 15 other minority shareholders whose ownershiptogether with our stake represented 16.23% of Bachoco’soutstanding shares, and over half the outstanding float, wesigned a letter to the board of directors of the company.The letter called for an increased tender offerffff price, or theadoption of a share repurchase plan that would increasethe value per share for all the remaining shareholders. Aswe write, we have yet to hear back from the company,and we continue to evaluate our options. From a biggerpicture perspective, Mexican companies in general areofteff n trading today at lower multiples than comparablecompanies in more business-friff endly countries.
» Nestlé, one of our core long-term holdings, recentlypurchased wind turbines in Germany afteff r soaring fossilfuel costs impacted expenses. The company has announced

Letter to Shareholders
I-13
plans to power all of its sites with 100% renewable energysources by 2025. We believe this is an aggressive goal, butsee it is a positive, incremental step. It may gaa ive them someprotection from energy price swings in the future, whichcould be a plus in helping to drive increases in intrinsic value.
THE DEFENSIVE POWER OF DIVIDENDS
Offense sells tickets but defense wins championships.
- Bear Bryant, former head coach of theAlabama CrimsonTide
There is no denying that dividend strategies have had arough go of it in the “risk on” investing environment ofthe last 10 plus years. However, if the pendulum is indeedswinging back towards funff damentals as equity marketsbecome more challenged, a dividend strategy mightprovide meaningful ballast in what could become a ratherstormy sea. With expected total returns on equities comingdown, the return from reinvested dividends could onceagain prove to be a significant contributor to total returnsproduced by equities in the nearer term, as it was fouff ndto be for the 101 years ending in 2000 (Dimson, Marshand Staunton, The Triumphp of the Optp imists: 101 Yearsof Global Investment Returns). In addition, companieswith long histories of growing their dividends might offerffffinvestors a partial hedge against declines in purchasingpower associated with increasing rates of inflation.
There are many ann dditional reasons why dhh ividends remainimportant to invenn stors. Stocks with high and sustainabledividend yields that are competitive with bond yields maybe more resistant to a decline in price than lower yieldingstocks because the stock is in effect “yield supported.”ffffThe reinvenn stment of dividends in additional shares of highyielding stocks during stock market declines can help lessenthe time necessary to recoup portfolio losses.The ability topay caa ash dividends is also a positive factor in assessing theunderlying health of a company ann nd the quality of its earnings.Dividends also, for the time being, maff y be taa ax advantaged(subject to certain requirements, such as minimum holdingperiods), particularly compared to the income from fixedincome securities, which are generally taxed at ordinaryincome rates. And most importantly, tyy here is an abundanceof empirical evidence which suggests that portfoliosconsisting of high dividend-yielding securities may paa roduceattractive total returns over long measurement periods.
As you may know, the Worldwide High DividendWW YieldValue Fund invenn sts primarily in equity securities that theAdviser believes to have above-aveaa rage dividend yields andreasonable valuations. A number of these companies fromtime to time also buy back their own shares, producing a
yield often referred to as “buyback yield.” This so-called“buyback yield” consists of the percentage increase inearnings per share associated with the contraction in sharecount. Companies with this kind of attractive “shareholderyield,” i.e., dividend yield + buyback yield, haveaa oftenbeen associated empirically with attractive total returns.Share buybacks are also value accretive to the remainingshareholders when the repurchased shares are trading at adiscount to their underlying intrinsic value.We hWW ave beenincorporating the concept of overall shareholder yield inour invenn stment process for quite some time now,particularlywhen researching high dividend yielding stocks.
Examples of current portfolio holdings that had strongshareholder yields (12-month yields through 03/31/2022):
DIVIDENDYIELD
BUYBACKYIELD
SHAREHOLDERYIELD
Cisco 1.45%3.10% 1.45% 4.55%
Bank of America 7.11%1.97% 7.11% 9.08%
US Bancorp 1.86%3.39% 1.86% 5.25%
BASF 3.33%6.90% 3.33% 10.23%
Numerous dividend paying companies in the WorldwideHigh Dividend Yield Value Fund haveaa consistently paidand grown their dividends over very long periods of time.For example, 22.1% of the Fund’s equity market value as ofMarch 31, 2022 was invested in eight dividend “champions,”each of which had 25 fiscal years or more of consecutivedividend increases.This included 3M (64 years), Johnson &Johnson (59 years),Roche (35 years),Fresenius SE (29 years),Nestlé (27 years), Rubis (27 years), Novartis (25 years), andFresenius Medical (25 years).
An additional 20% of the Worldwide High DividendYieldValue Fund’s equity market value was invested in eightcompanies which we refer to as “dividend contenders,” eachof which had 10-25 years of consecutive dividend increases.This included Enterprise Products Partners (23 years),Diageo (22 years), BAE Systems (18 years), Verizon (15years), Unilever (12 years), Cisco Systems (11 years),Truist(11 years), and US Bancorp (11 years).
Another 5.5% of WorWW ldwide High Dividend Yield ValueFund equity market value at March 31 was invested inthree “dividend challengers,” each of which grew theirannual dividends consecutively for 5-10 years. Thisincluded Astellas Pharma (nine years of consecutiveincreases, 22 years of flat or rising dividends), Bank ofAmerica (eight years of consecutive increases), and Intel(seven years of consecutive increases and 30 years of flat orrising dividends).
An additional 16.8% of Fund equity assets was invested innine companies with 10-30 years of stable or rising dividends

MARCH 31, 2022
I-14
including Takasago (27 years), Jardine Matheson (23 years),GlaxoSmithKline (21 years),LG Corp (19 years) Munich Re(19 years), Coca-Cola FEMSA (18 years), Zurich Insurance(13 years), BASF (12 years), and Kemira (12 years).
All combined, these four categories of companies that haveaapaid stable and/or increasing dividends for long periods oftime represented 64.4% of the Fund’s i’ nvested equity as ofMarch 31, 2022.The rest of theWorldwide High DividendYieldValue Fund’s h’ oldings include companies that (in ourview) haveaa paid attractive yields, often with a specific payoaa utratio target, and companies that cut back or omit theirdividend as a result of the pandemic.As of March 31, 2022,onlyTarkett has not resumed paying dividends.
When markets turned negative early in 2022, theWorldwideHigh DividendYieldValue Fund showed its defensive stripesby outpacing its benchmark index, the MSCIWorld Index,by 137 basis points year to date through March 31. As ofMarch 31, 2022, the Fund’s t’ op 20 holdings, which totalapproximately 63% of its equity assets, traded on average at15.6x 2022 estimated earnings, and had a weighted averagedividend yield of approximately 3.6%.Please note that the weighted average dividend yield shownabove is not representative of the Fund’s yield, nor does itrepresent the Fund’s performance. The figure solely representsthe average weighted dividend yield of the top twenty commonstocks held in the Fund’s portfolio. Please refer to the 30-daystandardized yield in the performance chart at the beginning ofthis letter for the Fund’s yield.
INVESTING WITH THE INNER CIRCLE:BUYING STOCKS WHERE THE INSIDERS (OFFICERS,DIRECTORS, THE COMPANY ITSELPP F OR OTHERLARGE SHAREHOLDERS) ARE ALSO BUYING
We continue to hone our investment process in an effortffffto enhance our prospects forff attractive returns. One facff torthat has played an increasingly important role as we researchcompanies for possible investment is “insider” buying. Theterm “insider buying” referff s to legal purchases of shares intheir own company by corporate officers, directors, andlarge shareholders, and it has alwaysaa been an importantbehavioral factor for us.
We have continued to improve our access to informationregarding the trading activity of insiders in their owncompanies. We have always feltff strongly that purchasesof shares by knowledgeable insiders at times when theircompany stock is trading at low prices in relation tometrics such as book value, earnings and/or cash flow canbe a powerful clue to possible futff ure outperformance oftheir companies’ shares. Empirical evidence supports thisview. Thanks to the increasing power of search enginesand computers, various data services can now deliver this
information to us on companies all over the globe on adaily basis and in a variety of formats that enhance the data’sefficacy. For example, these services can now track longer-term purchase patterns by insiders together with valuationmetrics forff the company’s shares at times of purchase,and the price performance of the shares after purchase.Companies can also be ranked based on the strength ofrecent insider trading patterns in their shares. Some of theseservices also track share buyback activity by companiesincluding number of shares bought back, prices paid,associated valuation metrics at the time of purchase, andthe history of the company’s buyback behavior. This kindof information, which we sometimes referff to as “insightinformation,” serves as an important complement to ourmore in-depth quantitative and qualitative fundamentalanalysis.
An Update on Seyhun’s 1998 insider buying study
Several studies over the years, largely from academia, haveconfirmed that corporate officers, directors, and largeshareholders who purchased their own companies’ sharesin the stock market tended to beat the market. However,several of those studies have indicated that much of themarket outperformance had come from companies withsmaller market capitalizations, and that insiders’ futureinvestment returns froff m buying the shares of their largermarket capitalization companies have been more modest.The studies that included some information aboutthe relatively small outperformance of larger marketcapitalization companies with purchases by insiders,however, did not study the investment results of the mostinformed insiders—the top executives—in combinationwith valuation ratios and other funff damental financialinformation.
One of the most interesting empirical studies of futff ureinvestment performance following insiders’ purchases oftheir own companies’ shares was described in the book,Investment Intelligence from Insider Trading, by H. NejatSeyhun, the University of Michigan Chair of Finance,which was published in 1998 by the MIT Press.
In the Seyhun study, the investment results folff lowing thepurchase by a top executive of at least 1,000 shares of his/her company’s own stock were computed, and these stockswere ranked on their price/earnings ratio and the price/book value ratio at the time of purchase, and then sortedinto five equal number groups of companies, or quintiles.Investment returns were measured over the 12 monthperiod subsequent to the end of the month in which theinsider purchase was made, and netted from the return of

Letter to Shareholders
I-15
an equal weighted index of NYSE, AMEX, and NASDAQstocks. The beginning stock prices used to calculate theone-year holding period excess-of-market returns were thestock prices at the end of the month in which the insiders’purchases had occurred, rather than the stock prices thatthe insiders had actually paid. One year stock returns weremeasured from each month of years 1975 through 1994.
The folff lowing two tables describe Professor Seyhun’sstudies of the 1-year forward investment results—net of astock market benchmark—okk f top executives’ purchases oftheir own companies’ shares in combination with the price/earnings ratio and the price/book value ratio valuation ofthe insider’s particular company on the first day of themonth immediately folff lowing the month in which theinsider made his/her purchase. As you can see froff m the data
in the folff lowing tables, which we put together based on theinformation in the book, this combination of insider buyingby knowledgeable insiders coupled with low valuation wasassociated with returns that were significantly in excess ofthe returns of an equal weighted index of NYSE, AMEX,and NASDAQ stocks.
Following in the footsteps of the Seyhun study, whichis admittedly somewhat dated, we decided to conductour own proprietary insider buying analysis to see ifSeyhun’s findings had stood the test of time. Our analysisutilized a data sample of 2,461 companies with stockmarket capitalizations of at least $500 million in whicha top executive – Chairman, Chief Executive Officer,President, Chief Operating Officer, Chief FinancialOfficer or Treasurer – had purchased at least $100,000
MARKET BEATING RETURNS IN LOW P/BV STOCKSWHERE TOP INSIDERSWERE ALSO BUYINGAVERAGE ANNUAL RETURNS IN EXCESS OF THEMARKET RETURNFOR PRICE/BOOK VALUE IN COMBINATIONWITH INSIDER BUYING, 1978 – 1993
12-MONTH INVESTMENT RETURN NET OF THE MARKET RETURN
PRICE/BOOK VALUEQUINTILE ALL STOCK STOCKSWITH ANY
INSIDER BUYER
STOCKSWHERE TOPEXECUTIVES BOUGHT
MORE THAN 1,000 SHARES
Lowest price/book value group 1.8% 5.1% 11.1%Price/book value group 2 -0.8% 1.4% 6.3%Price/book value group 3 -1.1% 1.9% 5.5%Price/book value group 4 0.8% -0.3% 0.6%Highest price/book value group -1.7% 0.0% -2.6%
A sample of 1700 companies from the COMPUSTATTT database was ranked each year on price/book value and sorted into five equal number groups, orquintiles. Invenn stment returns were measured over the subsequent 12-month period net of the return froff m an equal-weighted index of NYSE,AMEXand NASDAQDD stocks.
MARKET BEATING RETURNS IN LOW P/E STOCKSWHERE TOP INSIDERSWERE ALSO BUYINGAVERAGE ANNUAL RETURNS IN EXCESS OF THEMARKET RETURNFOR PRICE/EARNINGS RATIO IN COMBINATIONWITH INSIDER BUYING, 1978 – 1993
12-MONTH INVESTMENT RETURN NET OF THE MARKET RETURN
PRICE/EARNINGSQUINTILE ALL STOCK STOCKSWITH ANY
INSIDER BUYER
STOCKSWHERE TOPEXECUTIVES BOUGHT
MORE THAN 10,000 SHARES
Lowest price/earnings group 2.3% 3.8% 10.2%Price/earnings group 2 0.1% 1.8% 2.7%Price/earnings group 3 -0.9% 1.0% 7.0%Price/earnings group 4 -0.5% 1.6% 2.8%Highest price/earnings group -2.2% -0.4% 1.8%
A sample of 1700 companies from the COMPUSTATTT database was ranked each year on price/earnings ratio and sorted into five equal number groups,or quintiles. Invenn stment returns were measured over the subsequent 12-month period net of the return froff m an equal-weighted index of NYSE,AMEXand NASDAQDD stocks.
Source:Tweedy, Byy rowne, based on Invenn stment Intelligence from Insiderg Trading,g by H.Nejat Seyhun, Chair of Finance at the University of Michigan

MARCH 31, 2022
I-16
worth of his/her own company’s shares between September2, 2003 and March 31, 2020. We then ranked and sortedthese companies into deciles based on a variety of valuationmetrics including price/earnings ratio, enterprise valueto EBIT, EBITA and EBITDA, earnings yield, dividendyield, price to tangible book value, price to stated bookvalue, and enterprise value to free cash flow, among a hostof others. Consistent with Seyhun’s findings of over 20years ago, we fouff nd that companies in which there hadbeen significant insider buying by knowledgeable insidersand which were trading “cheap,” in our view, at the timeof purchase based on a variety of valuation metrics, oftenproduced what we consider significant excess returnsover and above the S&P 500 Index over the one-, two-and three-year periods subsequent to initial purchase.(Of course, not all companies in the analysis producedsignificant excess returns, and some produced significantlosses.) These results are even more impressive when oneconsiders that much of the excess return was produced inthe years between 2007 and 2020 (90% of the 2,461 insidertransactions occurred during this period), a span of timethat has been described as one of the worst periods ever forvalue stocks.
A word of caution about statistics and excess returncalculations in historical investment return studies: Thefairly robust excess returns in the Seyhun study and in ourown analysis are statistical averages, which are calculatedby adding up the separate positive or negative excess returnresults of individual stocks that constitute the average, andthen dividing that total amount by the total number ofindividual stocks. With our own analysis, the excess returnaverage included many individual stocks with extremelypositive excess returns and some individual stocks withextremely negative excess returns—including somestocks in which insiders’ purchases not only dramaticallyunderperformed the stock market, but also lost money.“Copy-catting” insiders is not a cinch.
Recent insider buying ideas
Over the last year, we screened out a number of companiesfor furff ther study and subsequent purchase due to insiderbuying in their shares. Two that come to mind and thatwere briefly mentioned previously herein are HaitianInternational, the Hong Kong-based manufacturer ofplastic injection molding machines, and Finland-basedKemira, the global provider of chemicals forff water intensiveindustries. In the case of Haitian, Jianfeng Zhang, anexecutive director at Haitian and the son of the Chairman,spent the equivalent of $1 million purchasing shares atapproximately HKD19 per share not long before the
Funds’ purchases, increasing his position in the companyby 40%. In addition, the employee trust, Premier Capital,which is also controlled and managed by the Zhang family,made multiple purchases froff m the end of Dec 2021 to lateApril 2022, totaling over $25 million, an at average costof approximately HKD20 per share. The Zhang familyis the controlling owner and manager of Haitian, withapproximately a 59% ownership stake in the company.
In our view, Mr. Zhang’s and Premier Capital’s purchaseslooked opportunistic: the price of Haitian stock haddeclined about 30% in a short period of time – and theywere both buying just after that large decline in price. Webelieve that somebody with Mr. Zhang’s long associationwith the company would generally be in a pretty goodposition to make a good guess about the company’s valueand futff ure prospects. That said, not all top executiveinsiders get the futff ure right. In our own recent analysisof insider purchases discussed above, we found that about25% of the insider trades lost money over the two yearsfollowing the date of the insider’s stock purchase.
On a funff damental basis, Haitian also appears to be a goodvalue. The company is the largest manufacturer of plasticinjen ction molding machines globally (approximately 13%of global market share), and it has a dominant position inChina, with approximately 40% market share by volume.From 2007 to 2020, Haitian compounded EBIT at a 12%compound average growth rate. The company also has hadattractive margins (gross margin over 30%, approximately20% EBITmargin over the last two years ending December2021), and strong return on equity and return on assets(18% and 11% on average over the last five years endingDecember 2021, respectively). The company also had asolid balance sheet with net cash position equivalent to 38%of its market capitalization. At purchase, we paid around sixtimes normalized EBIT, based on a conservative five-yearaverage EBIT. We estimate the company’s intrinsic valueto be at least 10 or 11x normalized EBIT. The companyalso paid a dividend yield close to 5%.
Significant insider buying in shares of Kemira, the Finnishchemical company, also caught our interest prior to theFunds’ initial purchases last fall. We had noticed that, sinceOctober of 2019, knowledgeable insiders had purchasedover €52 million worth of shares at an average price ofaround €13.89 per share. This included purchases by theChairman, Jari Paasikivi, the CEO, Jari Rosendal, andOras Invest, the family office for the Paasikivi famff ily. OrasInvest owns 20% of the outstanding shares of Kemira, andhas been Kemira’s largest shareholder since 2007. OrasInvest has a portfolff io worth €1.2 billion invested in four

Letter to Shareholders
I-17
industrial companies based in Finland, including Kemira.The famff ily office describes themselves as active owners who“work in close cooperation with other owners, Boards,management and all interest groups.” The Passikivi famff ilyoffice also has a clearly articulated desire to promote ESGrelated goals. Jari Paasikivi has been Chairman of Kemira’sBoard since 2014. He has bought Kemira shares bothpersonally and via the family office.
While we cannot know forff sure, perhaps these insiders feltffas did we that the shares of the company were attractivelyvalued. The Funds paid a weighted average cost of €11.91per share forff their initial purchases, representing in ourview a notable discount to prices paid by knowledgeableacquirers in observed, precedent merger & acquisitiontransactions. The company has a solid balance sheet, hascompounded its value at a mid-single digit rate, has paidan annual dividend of approximately 4.3%, has an ESGtailwind, and has an estimated intrinsic value, in our view,significantly greater than the Funds’ weighted average cost.
Material insider buying by knowledgeable insiders like Mr.Zhang, in the case of Haitian, and the Chairman, CEOand Paasikivi famff ily, in the case of Kemira, coupled withattractive fundamental characteristics and what we view asa very cheap stock price, gets us, as one of our managingdirectors likes to say, “trembling with greed.”
Ultimately, investing entails a belief system. The futff ure is,of course, unknown and uncertain. Business and businesscompetition is multi-dimensional and complex. Whatmakes sense to you? What are you comfortable with? Whatis your best shot in your search for long-term capital gains?Does it seem sensible that the top executives who live andbreathe a business and its competition every day might, onaverage — but not all of the time — have a knowledge andinsight edge over outside analysts? Does it seem sensible tobelieve that top executive insiders who open their walletsto buy their own company’s stock typically have reason tobelieve that the stock will go up over time? How many topexecutives buy their company’s stock — thereby puttingtheir reputations on the line, and placing a top executiveseal of approval on the company and its stock price — withthe intention of losing their own money?!!! We wouldsubmit that the utility of insider buying information in oursearch for value investments appeals to common sense.
FINAL THOUGHTS
Ben Graham’s intrinsic value approach emphasized soundinvestment, using business-like principles to seek topurchase undervalued equities at prices which (in theory)afforffff ded the investor a “margin of safety.” The eleganceof his theory was that, as prices become more discounted,there is (at least theoretically) lyy ess risk of loss, along withthe prospect forff greater return if price accretes over time
23
43
63
83
103
123
143
163
157,000
257,000
357,000
457,000
557,000
657,000
757,000
857,000
957,000
1,057,000
Dec2019
May2022
ARKINNOVATION
ETFPRICE/SHARE
BERK
SHIREH
ATHA
WAY
PRICE/SH
ARE
BRK/AARKK
$100
$100
$318
$107
$139
$84
(Feb 2021)
(Feb 2021)
This chart represents Berkshire Hathaway’s change inmarket price versus the ARK Innovation ETF’s change inmarket price from January 1, 2020throughMay 9, 2022. Berkshire Hathaway’s daily closing prices are displayed on the left hand side of the chart; the ARK Innovation ETF’s closingprices are displayed on the right. The orange and blue lines in the chart track what would have happened to $100 investment made in eithervehicle on January 1, 2020 and held through May 9, 2022. The chart illustrates the disparity between the return streams produced by the Value(as represented by Berkshire Hathaway) and Growth (as represented by the ARK Innovation ETF) styles of investing for the period indicated.Source: Bloomberg

MARCH 31, 2022
I-18
to estimated intrinsic value. (Of course, equity investingalwaysaa involves the risk of loss.)
A condition precedent to the long-term success of theapproach is the ability to weather challenging periods ofunderperformance that often offerffff pricing opportunityto disciplined value conscious investors. While this mostrecent period of underperformance for value managementhas been unprecedented in its length and psychologicallyunsettling, we believe shareholders can take some comfortffin the facff t that recovery periods in the past have tended tobe robust, and have typically lasted forff five plus years. Forexample, in the two five-year recovery periods prior to thispast decade, 2000-2004 and 2008-2012, the InternationalValue Fund produced cumulative returns that bested itsbenchmark index by 6,316 (63.16%) and 2,745 (27.45%)basis points, respectively. If the past is prologue, we hopethat our value style of investing will farff e as well this timearound relative to our growth brethren and our Funds’global and international benchmarks. (Past performance isno guarantee of futff ure results.)
Referencing the tortoise and the hare allegory mentionedat the beginning of this letter, we fouff nd an article publishedin the Financial Times (FT) in late January to be quite eye-opening. The article, written by Robin Wigglesworth,reported that Cathie WooWW d’s highly celebrated ARK ETFwas “on the cusp of being overtaken by Warren Buffett’sffffBerkshire Hathaway in the post-pandemic performancetable, reflecting a dramatic shift in fortunes between thetwo prominent investors … WooWW d’s ARK [Innovation]ETF and Berkshire Hathaway are ofteff n seen as primeexamples of two very differenffff t investment styles —growth and value, respectively. The reversal of their shareprices reflects a jarring rotation between the two tribesin recent years.” Since the article’s publication, BerkshireHathaway has pulled significantly ahead of ARK in theperformance race.
The pendulum indeed appears to be swinging as we write,and we believe that we are in the midst of a tectonic shiftin markets, catalyzed in part by the war in Ukraine andpandemic-related supply shocks, but driven primarily byescalating inflation and rising interest rates. We believethis shift sff hould continue to favff or sensible and disciplinedprice-driven strategies. The Tweedy, Browne Funds havetaken advantage of the volatility in equity markets over thelast couple of years, and in our view are well positioned forffwhat lies ahead. So for all you felff low tortoises out there,remain steady, and never forget that the race is not alwaysaato the swift.
Thank you forff your continued confidence and trust.
Sincerely,
Roger R. de Bree, Frank H.Hawrylak,Jay Haa ill, Sean McDonald,Thomas H. Shrager,John D. Spears, Robert Q.WyckoWW ff, Jffff r.
INVESTMENT COMMITTEE
May 2022

Letter to Shareholders
I-19
NOTES1. Indexes are unmanaged, and the figures for the indexes shown include reinvestment of dividends and capital gains distributions anddo not reflect any fees or expenses. Investors cannot invest directly in an index.
2. The MSCI EAFE Index is a free float-adjusted, market capitalization weighted index that is designed to measure the equity marketperformance of developed markets, excluding the US and Canada. The MSCI EAFE Index (in US$) reflects the return of the MSCIEAFE Index for a US dollar investor. The MSCI EAFE Index (Hedged to US$) consists of the results of the MSCI EAFE Index hedged100% back into US dollars and accounts for interest rate differentials in forward currency exchange rates. Results for each index areinclusive of dividends and net of foreign withholding taxes.
3. Inception dates for the International Value Fund, International Value Fund II, Value Fund and Worldwide High Dividend Yield ValueFund are June 15, 1993, October 26, 2009, December 8, 1993, and September 5, 2007, respectively. Pyy rior to 2004, information withrespect to theMSCI EAFE andMSCIWorld Indexes usedwas available atmonth end only; therefore, the since-inception performanceof the MSCI EAFE Indexes quoted for the International Value Fund reflects performance from May 31, 1993, the closest month endto the International Value Fund’s inception date, and the since inception performance of the MSCIWorld Index quoted for the ValueFund reflects performance from November 30, 1993, the closest month end to the Value Fund’s inception date.
4. The S&P 500/MSCIWorld Index (Hedged toUS$) is a combination of the S&P 500 Index and theMSCIWorld Index (Hedged toUS$),linked together by Tweedy, Browne, and represents the performance of the S&P 500 Index for the periods 12/8/93 – 12/31/06 and theperformance of the MSCI World Index (Hedged to US$) beginning 1/1/07 and thereafter (beginning December 2006, the Fund waspermitted to invest more significantly in non-US securities). The S&P 500 Index is a market capitalization weighted index composedof 500 widely held common stocks that assumes the reinvestment of dividends. The index is generally considered representative ofUS large capitalization stocks.
5. The MSCI World Index is a free float-adjusted market capitalization weighted index that is designed to measure the equity marketperformance of developed markets. The MSCI World Index (in US$) reflects the return of this index for a US dollar investor. TheMSCIWorld Index (Hedged to US$) consists of the results of theMSCIWorld Index with its foreign currency exposure hedged 100%back into US dollars. The index accounts for interest rate differentials in forward currency exchange rates. The MSCI World HighDividend Yield Index reflects the performance of equities in theMSCIWorld Index (excluding REITs) with higher dividend income andquality characteristics than average dividend yields that are both sustainable and persistent. The index also applies quality screensand reviews 12-month past performance to omit stocks with potentially deteriorating fundamentals that could force them to cut orreduce dividends. The MSCI World High Dividend Yield Index (in US$) reflects the return of the MSCI World High Dividend YieldIndex for a US dollar investor. TheMSCI ACWI ex USAValue Index captures large andmid cap securities exhibiting overall value stylecharacteristics across 22 Developed and 27 Emerging Markets countries. Results for each index are inclusive of dividends and net offoreign withholding taxes.
6. As of March 31, 2022, International Value Fund, International Value Fund II, Value Fund and Worldwide High Dividend Yield ValueFund had each invested the following percentages of its net assets, respectively, iyy n the following portfolio holdings:
International Value InternationalValue II Value Worldwide
3M Co. 0.0% 0.0% 1.6% 2.5%A-Living Smart City 0.0% 0.3% 0.2% 0.0%AbbVie 0.0% 0.0% 0.0% 0.0%Alibaba 1.5% 1.8% 1.4% 0.0%Alphabet (Google) 6.0% 0.0% 4.8% 0.0%Alten 0.0% 0.0% 0.0% 0.0%Amazon 0.0% 0.0% 0.0% 0.0%Astellas Pharma 0.7% 1.3% 0.7% 0.9%Autoliv 0.8% 0.6% 0.6% 1.0%AutoZone 0.0% 2.7% 2.9% 0.0%Babcock International 0.4% 0.7% 0.0% 0.0%BAE Systems 2.5% 2.1% 1.1% 2.5%Baidu 1.2% 1.2% 0.9% 0.0%Bank of America 0.0% 0.0% 0.7% 2.0%Bank of New York Mellon 0.0% 0.0% 0.9% 0.0%Bangkok Bank 0.0% 1.0% 0.0% 0.0%BASF 1.3% 2.2% 1.2% 3.0%Berkshire Hathaway 3.5% 2.8% 7.2% 0.0%Bollore 0.9% 0.8% 0.2% 0.0%Buzzi Unicem 0.2% 0.5% 0.4% 0.0%Carlisle 0.0% 0.0% 0.5% 0.0%Cisco Systems 0.5% 2.1% 1.0% 1.4%CNH Industrial 3.7% 4.0% 3.2% 0.0%CNP Assurances 0.0% 0.0% 0.0% 0.0%Coca-Cola FEMSA 1.3% 1.3% 1.0% 2.5%Comcast 0.0% 0.0% 1.5% 0.0%DBS Group 2.7% 2.4% 0.0% 2.1%Diageo 4.6% 3.4% 2.9% 4.1%

MARCH 31, 2022
I-20
International Value InternationalValue II Value Worldwide
Enterprise Products 0.0% 0.0% 0.6% 0.9%Facebook 0.0% 0.0% 0.0% 0.0%Fagron 0.2% 0.3% 0.3% 0.0%FMC 1.4% 1.4% 1.4% 0.0%Fresenius 1.3% 1.6% 1.6% 1.0%Fresenius Medical 0.0% 0.0% 0.0% 2.0%GlaxoSmithKline 2.9% 2.6% 1.7% 3.7%Haitian International 0.2% 0.5% 0.5% 0.0%Hankook 0.0% 0.3% 0.0% 0.0%Henkel 1.8% 0.7% 1.3% 0.0%Industrias Bachoco 0.3% 0.6% 0.6% 1.2%Intel 0.0% 0.0% 1.7% 2.3%Iveco Group 0.3% 0.4% 0.3% 0.0%Jardine Matheson 0.0% 0.0% 0.0% 1.0%Jardine Strategic 0.0% 0.0% 0.0% 0.0%Johnson & Johnson 2.2% 2.4% 2.7% 2.8%Kemira 0.3% 0.4% 0.5% 1.8%Kingboard 0.0% 0.0% 0.0% 0.0%La Banque Postale 0.0% 0.0% 0.0% 0.0%LG Corp 1.0% 1.1% 1.0% 1.0%Michelin 0.0% 0.8% 0.0% 0.0%Munich Re 1.1% 0.7% 0.0% 1.0%Nestlé 5.3% 3.4% 3.5% 4.9%Norma Group 0.3% 0.5% 0.5% 0.0%Novartis 1.1% 1.2% 1.0% 1.7%Oras Group 0.0% 0.0% 0.0% 0.0%Phillips 66 0.0% 0.0% 0.0% 0.0%Rheinmetall 0.2% 1.2% 1.1% 0.0%Roche 3.7% 3.5% 2.8% 3.4%Rubis 1.2% 1.9% 1.7% 2.5%Safran 2.7% 2.9% 1.8% 2.8%Siemens 0.0% 0.0% 0.0% 0.0%SKF 0.4% 1.0% 1.0% 0.9%Sumitomo Heavy Industries 0.5% 0.5% 0.5% 0.5%Takasago Thermal 0.0% 0.0% 0.0% 0.6%Tarkett 0.3% 1.4% 0.5% 0.7%Tencent Holdings 1.1% 0.8% 1.2% 0.0%Tesco 0.6% 0.6% 0.0% 0.0%Thor Industries 0.0% 0.0% 0.4% 0.0%Tikkurila 0.0% 0.0% 0.0% 0.0%TotalEnergies 3.1% 2.5% 2.7% 0.0%Trelleborg 1.5% 1.5% 1.4% 3.1%Truist 0.0% 0.0% 0.7% 2.1%TX Group 1.1% 0.8% 0.0% 0.0%Uni-President 0.1% 0.5% 0.5% 1.0%Unilever 2.5% 1.6% 1.9% 2.4%United Overseas Bank 3.1% 2.1% 2.1% 2.2%Uponor 0.0% 0.0% 0.0% 0.0%U.S. Bancorp 0.0% 0.0% 0.0% 1.9%Verizon 0.0% 0.0% 0.0% 3.7%Vertex Pharmaceuticals 0.0% 0.0% 1.4% 0.0%Wells Fargo 0.0% 0.0% 2.9% 0.0%Winpak 0.2% 0.3% 0.3% 0.0%Yokohama Rubber Company 0.0% 0.0% 0.0% 0.0%Zurich Insurance 2.1% 2.7% 0.8% 1.3%
Mention of a specific security should not be considered a recommendation to buy or a solicitation to sell that security. Pyy ortfolio holdingsare subject to change at any time without notice and may not be representative of a Fund’s current or future investments.
The MSCI style methodology adopts a two-dimensional framework for value/growth segmentation: each security is given an overallstyle characteristic derived from its value and growth scores and is then placed into either a value or a growth index (or is partiallyallocated to both). The value investment style characteristics for index construction are defined using three variables: book value to
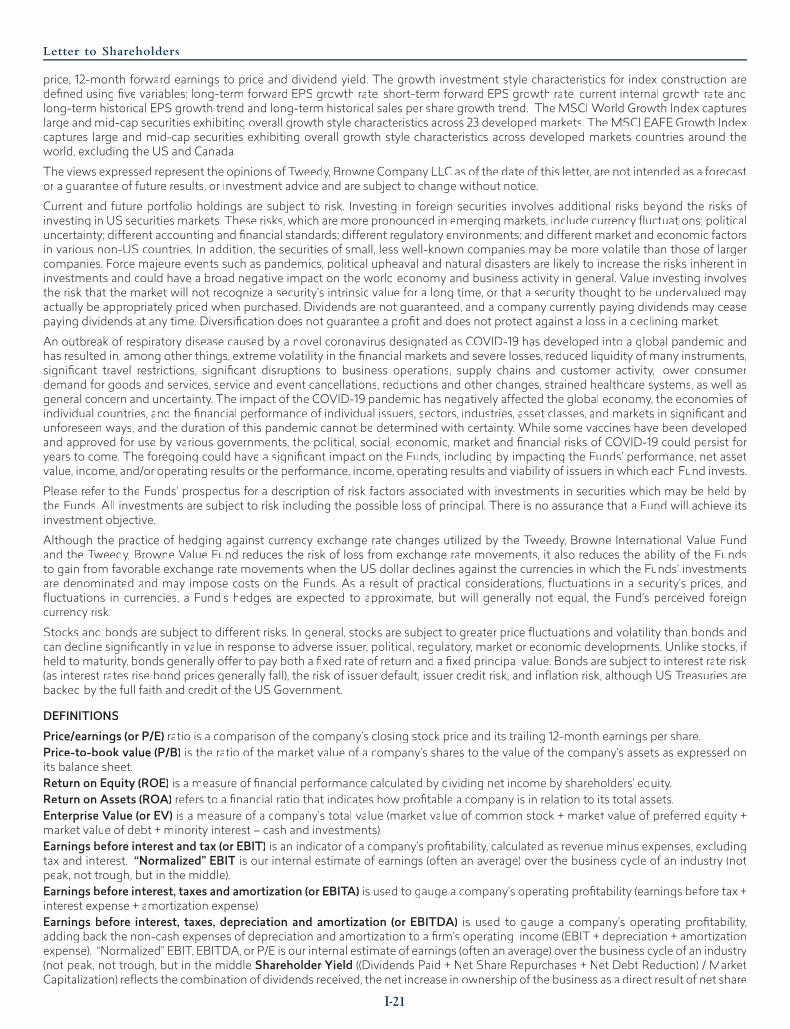
Letter to Shareholders
I-21
price, 12-month forward earnings to price and dividend yield. The growth investment style characteristics for index construction aredefined using five variables: long-term forward EPS growth rate, short-term forward EPS growth rate, current internal growth rate andlong-term historical EPS growth trend and long-term historical sales per share growth trend. The MSCI World Growth Index captureslarge and mid-cap securities exhibiting overall growth style characteristics across 23 developed markets. TheMSCI EAFE Growth Indexcaptures large and mid-cap securities exhibiting overall growth style characteristics across developed markets countries around theworld, excluding the US and Canada.
The views expressed represent the opinions of Tweedy, Browne Company LLC as of the date of this letter, are not intended as a forecastor a guarantee of future results, or investment advice and are subject to change without notice.
Current and future portfolio holdings are subject to risk. Investing in foreign securities involves additional risks beyond the risks ofinvesting in US securities markets. These risks, which are more pronounced in emergingmarkets, include currency fluctuations; politicaluncertainty; different accounting and financial standards; different regulatory environments; and different market and economic factorsin various non-US countries. In addition, the securities of small, less well-known companies may be more volatile than those of largercompanies. Force majeure events such as pandemics, political upheaval and natural disasters are likely to increase the risks inherent ininvestments and could have a broad negative impact on the world economy and business activity in general. Value investing involvesthe risk that the market will not recognize a security’s intrinsic value for a long time, or that a security thought to be undervalued mayactually be appropriately priced when purchased. Dividends are not guaranteed, and a company currently paying dividends may ceasepaying dividends at any time. Diversification does not guarantee a profit and does not protect against a loss in a declining market.
An outbreak of respiratory disease caused by a novel coronavirus designated as COVID-19 has developed into a global pandemic andhas resulted in, among other things, extreme volatility in the financial markets and severe losses, reduced liquidity of many instruments,significant travel restrictions, significant disruptions to business operations, supply chains and customer activity, lyy ower consumerdemand for goods and services, service and event cancellations, reductions and other changes, strained healthcare systems, as well asgeneral concern and uncertainty. Tyy he impact of the COVID-19 pandemic has negatively affected the global economy, tyy he economies ofindividual countries, and the financial performance of individual issuers, sectors, industries, asset classes, and markets in significant andunforeseen ways, and the duration of this pandemic cannot be determined with certainty. While some vaccines have been developedand approved for use by various governments, the political, social, economic, market and financial risks of COVID-19 could persist foryears to come. The foregoing could have a significant impact on the Funds, including by impacting the Funds’ performance, net assetvalue, income, and/or operating results or the performance, income, operating results and viability of issuers in which each Fund invests.
Please refer to the Funds’ prospectus for a description of risk factors associated with investments in securities which may be held bythe Funds. All investments are subject to risk including the possible loss of principal. There is no assurance that a Fund will achieve itsinvestment objective.
Although the practice of hedging against currency exchange rate changes utilized by the Tweedy, Browne International Value Fundand the Tweedy, Browne Value Fund reduces the risk of loss from exchange rate movements, it also reduces the ability of the Fundsto gain from favorable exchange rate movements when the US dollar declines against the currencies in which the Funds’ investmentsare denominated and may impose costs on the Funds. As a result of practical considerations, fluctuations in a security’s prices, andfluctuations in currencies, a Fund’s hedges are expected to approximate, but will generally not equal, the Fund’s perceived foreigncurrency risk.
Stocks and bonds are subject to different risks. In general, stocks are subject to greater price fluctuations and volatility than bonds andcan decline significantly in value in response to adverse issuer, political, regulatory, market or economic developments. Unlike stocks, ifheld to maturity, byy onds generally offer to pay both a fixed rate of return and a fixed principal value. Bonds are subject to interest rate risk(as interest rates rise bond prices generally fall), the risk of issuer default, issuer credit risk, and inflation risk, although US Treasuries arebacked by the full faith and credit of the US Government.
DEFINITIONSPrice/earnings (or P/E) ratio is a comparison of the company’s closing stock price and its trailing 12-month earnings per share.Price-to-book value (P/B) is the ratio of the market value of a company’s shares to the value of the company’s assets as expressed onits balance sheet.Return on Equity (ROE) is a measure of financial performance calculated by dividing net income by shareholders’ equity.Return on Assets (ROA) refers to a financial ratio that indicates how profitable a company is in relation to its total assets.Enterprise Value (or EV) is a measure of a company’s total value (market value of common stock + market value of preferred equity +market value of debt + minority interest – cash and investments).Earnings before interest and tax (or EBIT) is an indicator of a company’s profitability, cyy alculated as revenue minus expenses, excludingtax and interest. “Normalized” EBIT is our internal estimate of earnings (often an average) over the business cycle of an industry (notpeak, not trough, but in the middle).Earnings before interest, taxes and amortization (or EBITA) is used to gauge a company’s operating profitability (earnings before tax +interest expense + amortization expense).Earnings before interest, taxes, depreciation and amortization (or EBITDA) is used to gauge a company’s operating profitability,adding back the non-cash expenses of depreciation and amortization to a firm’s operating income (EBIT + depreciation + amortizationexpense). “Normalized” EBIT, ETT BITDA, or P/E is our internal estimate of earnings (often an average) over the business cycle of an industry(not peak, not trough, but in the middle Shareholder Yield ((Dividends Paid + Net Share Repurchases + Net Debt Reduction) / MarketCapitalization) reflects the combination of dividends received, the net increase in ownership of the business as a direct result of net share

MARCH 31, 2022
I-22
repurchases (the figure represents net share repurchases to incorporate dilution from employee share compensation), and the increasein ownership of the business as a result of changes to the capital structure. Bondholders are senior to equity holders in the capitalstructure and if net debt is paid down, then the value of the equity holders’ stake increases.Sharpe Ratio is a way to measure a fund’s risk-adjusted returns. It is calculated by dividing a fund’s annualized excess returns over therisk-free rate by its annualized standard deviation. The higher the Sharpe ratio, the better the fund’s historical risk-adjusted performancehas been.Standard Deviation is a statistical measurement of dispersion about an average that depicts how widely a mutual fund’s returns variedover a certain period of time. Investors use the standard deviation of historical performance to try to predict the range of returns that aremost likely for a given fund. When a fund has a high standard deviation, the predicted range of performance is wide, implying greatervolatility. Standard deviation is most appropriate for measuring the risk of a fund that is an investor’s only holding. The figure cannot becombined for more than one fund because the standard deviation for a portfolio of multiple funds is a function of not only the individualstandard deviations, but also of the degree of correlation among the funds’ returns. If a fund’s returns follow a normal distribution, thenapproximately 68% of the time they will fall within one standard deviation of the mean return for the fund, and 95% of the time withintwo standard deviations.Compustat is a comprehensive market and corporate financial database published by Standard and Poor’s, covering thousands ofcompaniesworldwide,with infodating as far back as 1950.Compustat is a leading sourceof intelligence for financialmarket professionals,investors, and academics.
This letter contains opinions and statements on investment techniques, economics, market conditions and other matters. There is noguarantee that these opinions and statements will prove to be correct, and some of them are inherently speculative. None of themshould be relied upon as statements of fact.
Content reproduced fromMorningstar is ©2022Morningstar, Inc. All Rights Reserved. The information contained herein: (1) is proprietaryto Morningstar and/or its content providers; (2) may not be copied or distributed; and (3) is not warranted to be accurate, complete ortimely.yy Neither Morningstar nor its content providers are responsible for any damages or losses arising from any use of this information.Past performance is no guarantee of future results.
Tweedy, Browne International Value Fund, Tweedy, Browne International Value Fund II – Currency Unhedged, Tweedy, Browne ValueFund, and Tweedy, BrowneWorldwide High Dividend Yield Value Fund are distributed by AMGDistributors, Inc., Member FINRA/SIPC.
This material must be preceded or accompanied by a prospectus for Tweedy, Browne Fund Inc. You should consider the Funds’investment objectives, risks, charges and expenses carefully before investing. The prospectus contains this and other information aboutthe Funds. The prospectus should be read carefully before investing.

This page left bff lank intentionally

Tweedy, Browne International Value FundTweedy, Browne International Value Fund II - Currency UnhedgedTweedy, Browne Value FundTweedy, Browne Worldwide High Dividend Yield Value Fund
ANNUAL REPORT
March 31, 2022
II-1

Investment Adviser’s Note (Unaudited)
Periods Ending March 31, 2022
CUMULATIVE18 MOS THRU03/31/22
6 MOSENDING03/31/22 1 YR 5 YR 10 YR
SINCEINCEPTION(3)
INTERNATIONAL VALUE FUND (INCEPTION 06/15/93)* 27.99% 1.70% 4.36% 5.06% 6.51% 8.67%
MSCI EAFE INDEX (HEDGED TO USD)†(1)(2)(3) 28.92 0.56 7.08 8.32 9.56 6.41
MSCI EAFE INDEX (USD)†(1)(2)(3) 21.48 -3.38 1.16 6.72 6.27 5.37
INTERNATIONAL VALUE FUND II (INCEPTION 10/26/09)* 25.11% 0.08 1.13 4.37 4.84 5.35
MSCI EAFE INDEX (USD)†(1)(2) 21.48 -3.38 1.16 6.72 6.27 5.47
VALUE FUND (INCEPTION 12/08/93)* 28.66 2.54 5.35 6.10 7.13 7.94
MSCIWORLD INDEX (HEDGED TO USD)†(1)(3)(5) 33.65 3.31 11.87 12.94 12.27 8.36
S&P 500 INDEX/MSCIWORLD INDEX (HEDGED TO USD)¶ †(1)(4)(5) 33.65 3.31 11.87 12.94 12.27 9.07
WORLDWIDE HIGH DIVIDEND YIELD VALUE FUND (INCEPTION 09/05/07)* 22.18 2.06 1.97 5.66 5.40 4.22
MSCIWORLD INDEX (USD)†(1)(5) 31.67 2.21 10.12 12.42 10.88 6.82
MSCIWORLD HIGH DIVIDEND YIELD INDEX (USD)†(1)(5) 29.61 7.25 9.41 8.07 8.22 4.71
* The performance data shown represents past performance and is not a guarantee of future results. Total return and principalTT value of an invest-ment will fluctuate so that an investor’s shares, when redeemed, may be worth more or less than their original cost. The returns shown do notreflect the deduction of taxes that a shareholder would pay on Fund distributions or the redemption of Fund shares. Current performance may belower or higher than the performance data shown. Please visit www.tweedy.com to obtain performance data that is current to the most recentmonth end, or to obtain after-tax performance information. Please refer to footnotes 1 through 5 at the end of this letter for descriptions of theFunds’ indexes. Results are annualized for the one–year, firr ve-year, trr en-year and since inception periods only.
† Investors cannot invest directly in an index. Index returns are not adjusted to reflect the deduction of taxes that an investor would pay on distribu-tions or the sale of securities comprising the index.
‡ Tweedy, Browne has voluntarily agreed, effective May 22, 2020 through at least July 31, 2023, to waive the International Value Fund’s fees wheneverthe Fund’s average daily net assets (“ADNA”) exceed $6 billion. Under the arrangement, the advisory fee payable by the Fund is as follows: 1.25% onthe first $6 billion of the Fund’s ADNA; 0.80% on the next $1 billion of the Fund’s ADNA (ADNA over $6 billion up to $7 billion); 0.70% on the next $1billion of the Fund’s ADNA (ADNA over $7 billion up to $8 billion); and 0.60% on the remaining amount, if any, of the Fund’s ADNA (ADNA over $8billion). The performance data shown above would have been lower had fees not been waived from May 22, 2020 to March 31, 2022.
§ Tweedy, Browne has voluntarily agreed, effective December 1, 2017 through at least July 31, 2023, to waive a portion of the International ValueFund II’s, the Value Fund’s and the Worldwide High Dividend Yield Value Fund’s investment advisory fees and/or reimburse a portion of each Fund’sexpenses to the extent necessary to keep each Fund’s expense ratio in line with the expense ratio of the International Value Fund. (For purposes ofthis calculation, each Fund’s acquired fund fees and expenses, brokerage costs, interest, taxes and extraordinary expenses are disregarded, and eachFund’s expense ratio is rounded to two decimal points.) The net expense ratios set forth above reflect this limitation, while the gross expense ratiosdo not. Please refer to the Funds’ prospectus for additional information on the Funds’ expenses. The International Value Fund II’s, Value Fund’s andWorldwide High Dividend Yield Value Fund’s performance data shown above would have been lower had certain fees and expenses not been waivedand/or reimbursed during certain periods.
The Funds do not impose any front-end or deferred sales charges. The expense ratios shown above reflect the inclusion of acquired fund feesffand expenses (i.e., the fees and expenses attributable to investing cash balances in money market funds) and may differ from those shown in theFunds’ financial statements.
INTERNATIONAL VALUEVVFUND
INTERNATIONAL VALUEFUND II VALUE FUND
WORLDWIDE HIGHDIVIDEND YIELDVALUE FUND
TOTALTT ANNUAL FUNDOPERATING EXPENSE RATIOS AS OF 03/31/2022 1.38% (gross); 1.34% (net)‡ 1.37% (gross); 1.34% (net)§ 1.39% (gross); 1.34% (net)§ 1.48% (gross); 1.34% (net)§
TOTALTT ANNUAL FUNDOPERATING EXPENSE RATIOS AS OF 03/31/2021 1.38% (gross); 1.37% (net) 1.38% (gross); 1.38% (net) 1.41% (gross); 1.38% (net) 1.47% (gross); 1.39% (net)
30-DAY STANDARDIZED YIELDSAS OF 03/31/2022
0.94% (Subsidized);0.93% (Unsubsidized)
1.07% (Subsidized);1.07% (Unsubsidized)
0.66% (Subsidized);0.66% (Unsubsidized)
1.79% (Subsidized);1.79% (Unsubsidized)
PERFORMANCE
¶S&P 500 Index (12/08/93-12/31/06)/MSCI World Index (Hedged to USD) (01/01/07-present)
II-2

GROWRR TH OF HYPOTHETICAL $10,000 INVESTMENT SINCE INCEPTION
VALUE FUND$86,936
S&P 500/MSCIWORLD(HEDGED TO USD)¶
$116,920
$10,000
03/31/2022
2020
2019
2018
2017
2016
2015
2014
2013
2012
2011
2010
2009
2008
2007
2006
2005
2004
2003
2002
2001
2000
1999
1998
1997
1996
1995
1994
1993
06/15/1993
$10,000
03/31/2022
2020
2019
2018
2017
2016
2015
2014
2013
2012
2011
2010
2009
10/31/2009
$10,000
03/31/2022
2020
2019
2018
2017
2016
2015
2014
2013
2012
2011
2010
2009
2008
2007
2006
2005
2004
2003
2002
2001
2000
1999
1998
1997
1996
1995
1994
12/08/1993
$10,000
03/31/2022
2020
2019
2018
2017
2016
2015
2014
2013
2012
2011
2010
2009
2008
2007
09/05/2007
INTERNATIONAL VALUE FUND since 06/15/1993
INTERNATIONAL VALUE FUND II - CURRENCY UNHEDGED since 10/26/2009
VALUE FUND since 12/08/1993
WORLDWIDE HIGH DIVIDENDYIELD VALUE FUND since 09/05/2007
MSCI EAFE(HEDGED TO USD)$59,998MSCI EAFE (USD)$45,222
INTERNATIONALVALUE FUND$109,479
MSCI EAFE (USD)$19,395INTERNATIONALVALUE FUND II$19,118
MSCIWORLDHIGH DIV YIELD (USD)$19,540
MSCIWORLD (USD)$26,158
WORLDWIDE HIGHDIVIDEND YIELDVALUE FUND$18,258
MSCIWORLD(HEDGED TO USD)$97,127
Prior to 2004, information with respect to both MSCI EAFE Indexes were available at month endonly; therefore, the closest month end to the inception date of the Fund, May 31, 1993, was used.
Prior to 2004, informationwith respect to theMSCIWorld Index (Hedged to USD) was available atmonthendonly; therefore, the closestmonth end to the inception date of the Fund, November 30, 1993, was used.
Please refer to performance disclosures provided on the previous page.
MARCH 31, 2022
II-3

TO OUR SHAREHOLDERS:
A HareHH was making fun of theTortoise one day for beff ing so slow.“ww Do“ you ever get anywhere?” he asked with amocking laugh.“Yes,”s replied theTortoise,“e and“ I get there sooner than you think. I’ll run you a race and prove it.”
- Aesop’s Fables
“ ”
Our hearts go out to the Ukrainian people and their loved ones as Russian forces continue to conduct a brutal andheartless military assault on their country. This attack has sparked extreme volatility in global equity markets asinvestors struggle to understand what it means for the global economy and stocks. And this is occurring on topof rising inflation levels, current and prospective central bank tightening around the world, skyrocketing energyprices, and Covid lockdowns in China. The probabilities of a recession in the medium term have certainly increased.
While the Russian invasion is deeply unsettling, likeother crises in the past, our immediate response has beento remain calm and draw on our experience to assess thesituation rationally. A vital benefit of successfully operatingfor over 100 years in the investment industry is having abalanced perspective when markets are highly reactive.
You can rest assured that the Funds do not have anydirect holdings in Ukraine or Russia; however, our Fundportfolios have some indirect exposure to the region.Nevertheless, the “knock on” effecffff ts on the broader globaleconomy amm nd on equity markets have been significant, andour Fund portfolff ios have not been completely immune tothese effecffff ts. This has been particularly feltff in the Funds’European-based holdings, as investors feared the impacton corporate profit margins of supply chain disruptions,rising input costs and inflation, economic sanctions, andrising oil prices. With equity valuations on the high side,and geopolitical and economic uncertainty escalating, it isno wonder that global equity markets had a comeuppancein the first quarter of this year. While we remain veryconcerned about the Russian invasion in Ukraine forhumanitarian reasons and for what it may mean for equitymarkets in the near term, we do not believe that this threatis likely to impact our long-term approach to markets, nordo we believe that it will likely permanently impair theunderlying estimated intrinsic values of the companies heldin our Funds’ portfolff ios. Nevertheless, we will continueto closely monitor our Fund portfolff ios as the situationunfolds, and seek to take advantage of the inevitablepricing opportunities we expect will be presented by thesechallenging markets.
PERFORMANCE
Afteff r nearly nine years of an incredibly difficult stretchfor value investors, we believe that the pendulum is nowswinging back in favor of what we do, and that is reflected
in the returns of our Funds over the last year and a half. Ifone looks at performance results beginning 18 months ago(September 30, 2020), when the prospects forff emergency useapproval of vaccines and the prospect of a strong funff damentaleconomic recovery sparked a strong rally in value-orientedequities, the Tweedy, Browne Funds have producedcumulative absolute returns of between 22% and 29%. Ourtwo international Funds performed roughly in line withor outperformed their respective benchmarks, while ourtwo more globally oriented funds trailed their benchmarksduring this period, largely due to an underweighting in USequities and the impact of the Ukraine war on the relativeperforff mance of European equities. Three of our fouff r Fundssignificantly outperformed the growth component of theMSCI EAFE and WorWW ld Indexes, which produced returnsfor the 18-month period of 10.79% (MSCI EAFE GrowthIndex) and 23.23% (MSCI World Growth Index). TheWorldwide High Dividend Yield Value Fund finished the18-month period with a strong absolute return of 22.18%,but marginally underperformeff d the MSCI World GrowthIndex.
Returns over the 12months endedMarch 31, 2022were notas robust. All four Funds underperformed their respectivebenchmark indices producing absolute returns of between1.13% and 5.35% compared to returns of between 1.16%and 11.87% forff their benchmarks. For our Funds and valuestocks in general, returns had been quite strong froff m thefirst announcements of vaccines in the fouff rth quarter of2020, right up until mid-May of 2021, when the Deltaand subsequent Omicron variants appeared, driving peopleindoors again. From that point forward, as case rates andhospitalizations rose, the “stay at home” technology andgrowth stocks once again surged, driving stock marketreturns forff the rest of the calendar year. As the new yearopened, increasing concerns regarding rising inflation andinterest rates, and the invasion of Ukraine, led to rising
Investment Adviser’s Note (Unaudited)
II-4
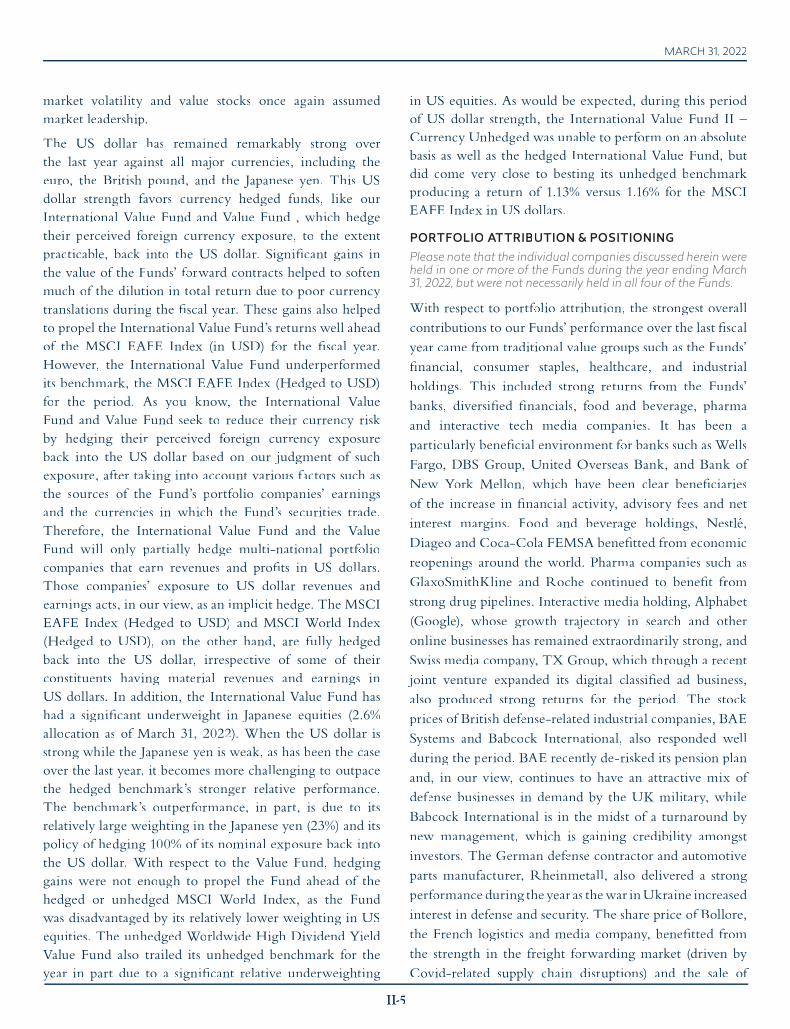
market volatility and value stocks once again assumedmarket leadership.
The US dollar has remained remarkably strong overthe last year against all major currencies, including theeuro, the British pound, and the Japanese yen. This USdollar strength favors currency hedged funds, like ourInternational ValVV ue Fund and ValVV ue Fund , which hedgetheir perceived foreign currency exposure, to the extentpracticable, back into the US dollar. Significant gains inthe value of the Funds’ forff ward contracts helped to softenffmuch of the dilution in total return due to poor currencytranslations during the fiscal year. These gains also helpedto propel the International Value Fund’s returns well aheadof the MSCI EAFE Index (in USD) forff the fiscal year.However, the International Value Fund underperformedits benchmark, the MSCI EAFE Index (Hedged to USD)for the period. As you know, the International ValueFund and ValVV ue Fund seek to reduce their currency riskby hedging their perceived forff eign currency exposureback into the US dollar based on our judgment of suchexposure, after taking into account various facff tors such asthe sources of the Fund’s portfolff io companies’ earningsand the currencies in which the Fund’s securities trade.Therefore, the International ValVV ue Fund and the ValueFund will only partially hedge multi-national portfolff iocompanies that earn revenues and profits in US dollars.Those companies’ exposure to US dollar revenues andearnings acts, in our view, as an implicit hedge. The MSCIEAFE Index (Hedged to USD) and MSCI WorWW ld Index(Hedged to USD), on the other hand, are fully hedgedback into the US dollar, irrespective of some of theirconstituents having material revenues and earnings inUS dollars. In addition, the International ValVV ue Fund hashad a significant underweight in Japanese equities (2.6%allocation as of March 31, 2022). When the US dollar isstrong while the Japanese yen is weak, as has been the caseover the last year, it becomes more challenging to outpacethe hedged benchmark’s stronger relative performance.The benchmark’s outperformance, in part, is due to itsrelatively large weighting in the Japanese yen (23%) and itspolicy of hedging 100% of its nominal exposure back intothe US dollar. With respect to the Value Fund, hedginggains were not enough to propel the Fund ahead of thehedged or unhedged MSCI World Index, as the Fundwas disadvantaged by its relatively lower weighting in USequities. The unhedged Worldwide High Dividend YieldValue Fund also trailed its unhedged benchmark for theyear in part due to a significant relative underweighting
in US equities. As would be expected, during this periodof US dollar strength, the International ValVV ue Fund II –Currency Unhedged was unable to perform on an absolutebasis as well as the hedged International ValVV ue Fund, butdid come very close to besting its unhedged benchmarkproducing a return of 1.13% versus 1.16% for the MSCIEAFE Index in US dollars.
PORTFOLIO ATTRIBUTION & POSITIONINGPlease note that the individual companies discussed herein wereheld in one or more of the Funds during the year ending March31, 2022, but were not necessarily held in all four of the Funds.
With respect to portfolff io attribution, the strongest overallcontributions to our Funds’ performance over the last fiscalyear came from traditional value groups such as the Funds’financial, consumer staples, healthcare, and industrialholdings. This included strong returns froff m the Funds’banks, diversified financials, fooff d and beverage, pharmaand interactive tech media companies. It has been aparticularly beneficial environment forff banks such as WelWW lsFargo, DBS Group, United Overseas Bank, and Bank ofNew YorYY k Mellon, which have been clear beneficiariesof the increase in financial activity, advisory feeff s and netinterest margins. Food and beverage holdings, Nestlé,Diageo and Coca-Cola FEMSA benefitted from economicreopenings around the world. Pharma companies such asGlaxoSmithKline and Roche continued to benefit fromffstrong drug pipelines. Interactive media holding, Alphabet(Google), whose growth trajectory in search and otheronline businesses has remained extraordinarily strong, andSwiss media company, TX Group, which through a recentjoint venture expanded its digital classified ad business,also produced strong returns forff the period. The stockprices of British defenseff -related industrial companies, BAESystems and Babcock International, also responded wellduring the period. BAE recently de-risked its pension planand, in our view, continues to have an attractive mix ofdefenff se businesses in demand by the UK military, whileBabcock International is in the midst of a turnaround bynew management, which is gaining credibility amongstinvestors. The German defenff se contractor and automotiveparts manufacturer, Rheinmetall, also delivered a strongperforff mance during the year as thewar inUkraine increasedinterest in defenseff and security. The share price of Bollore,the French logistics and media company, benefitted fromthe strength in the freight forff warding market (driven byCovid-related supply chain disruptions) and the sale of
MARCH 31, 2022
II-5

its African port and logistics business. TotTT alEnergies, theFrench oil & gas company, one of the Funds’ fewff remainingoil companies, benefitted from the recent spike in oil prices.A number of other holdings saw their stock prices advanceduring the year, including Berkshire Hathaway,aa theWarWW renBuffetffff t-led conglomerate, and AutoZone, the US-basedafteff rmarket auto parts retailer, which has benefitted fromdisruptions in the automotive supply chain. Carlisle, theUS-based commercial roofing company, also performedwell in the period as it continues to benefit froff m a strong re-roofing backlog due to jobs deferff red during Covid, and theincreasing age of the commercial building stock in the US.
Corporate actions later last year in a fewff of our Fundholdings also had a positive impact on results forff the fiscalyear end. For example, La Banque Postale announced atender last fall for the remaining shares of the French lifeinsurer, CNP Assurances, which it did not already own.CNP is a longtime Fund holding, and the stock jumpedup 36% on the news in late October. While the offerffff , inour view, was not at the company’s fulff l intrinsic value, wedecided to sell our Funds’ shares. The Swedish industrialcompany, Trelleborg, which is held in all of our Funds,also jumped up on the rumor last fall that a Japanese rubbercompany had offerffff ed $2 billion forff Trelleborg’s wheelsystems business. The stock hit a record high 237 kronashortly after the initial media coverage. In late Marchrumor became reality, as Trelleborg signed an agreementto divest its wheel systems division to YokohYY ama RubberCompany forff $2.3 billion. Our weighted average cost inTrelleborg shares across our Funds is roughly 118 krona.Holdings of CNH Industrial also got a boost in the 4thquarter froff m the company’s plan to spin off its trucking andpowertrain business, Iveco, early in 2022.
In contrast, several of the Funds’ consumer discretionary,utility, materials, and industrial holdings produceddisappointing results for the fiscal year. This includedportfolio holdings such as Autoliv, the Swedish automobileairbag and seatbelt company, and Norma, the Germanmanufacturer of joining products for the automotivesector — both companies sufferffff ed from automobile supplychain difficulties (lack of semiconductors and harnesses),and were negatively impacted by raw material inflation;Safran, the French jet engine manufacff turer whose resultsare correlated in part to passenger airline volume has yetto fully recover from lockdowns and Covid restrictions;
Rubis was affecffff ted by rising energy prices; BASF wasimpacted by macroeconomic concerns as well as Russiaexposure in its oil & gas subsidiary; Henkel was negativelyimpacted by the relatively slower growth in Europe dueto the pandemic and the Russian invasion of Ukraine;Intel announced a plan to regain product leadership thatwas more expensive than investors had expected; 3Mfaced rising litigation costs; Comcast was affecffff ted by aslowdown in broadband subscriber growth post “stay-aa at-home” and by increasing competition; and Fresenius SE &Co, the German healthcare company, which experienced adeclining patient population forff their dialysis services dueto Covid deaths. It remains our view that these companiesare strong and resilient and should be able to weather thenear-term geopolitical and economic uncertainty and themarket volatility associated therewith.
The Funds’ emerging market holdings also facedffchallenges during the fiscal year, particularly those inChina, as economic growth slowed and regulatory andgovernmental intervention continued to negatively impactcertain industries and companies. This led to declinesin Alibaba, Baidu, Tencent, and A-Living, among otherChinese holdings. Recent government imposed Covidlockdowns have only added to these concerns. That said,we were encouraged by recent messaging froff m ChineseVice Premier Liu He, where he encouraged the adoption ofstandard, transparent and predictable regulation to promotethe steady and healthy development of the Chinese platformffeconomy and improve its international competitiveness.While there are no guarantees, Liu He’s comments providesome hope that Chinese regulation might not be as heavy-handed going forff ward.
PORTFOLIO ACTIVITY
Despite rising valuations forff much of the last year, wecontinued to be very active in adding to and pruningthe Funds’ investment gardens. We uWW ncovered numerousequities that we believe were undervalued, particularlyin Europe and in some of the more developed emergingmarkets, but also in the US. We established a number ofnew positions during the fiscal year and added to manyothers, including Vertex Pharmaceuticals, the US-basedbiotechnology company; Kemira, the Finnish chemicalsolutions business; Haitian International, the largestmanufacturer of plastic injection molding machines inChina; Buzzi Unicem, the Italian cement company;
Investment Adviser’s Note (Unaudited)
II-6

Fagron, the Belgium based pharmaceutical compoundingcompany; SKF, the Swedish ball bearings company; FMC,the US-based agricultural chemicals company; SumitomoHeavy, the multi-facff eted Japanese manufacff turer; Tencent,the dominant Chinese social media and gaming company;US-based Thor Industries, the largest maker of recreationalvehicles in the world; Uni-President, the China-basedinstant noodles and beverage company; Winpak, theCanadian food packaging company; TesTT co, the UK-based grocery business; and, near year end, Rheinmetall,the German-based defenff se systems and automotivecomponents company. All of these companies, at purchase,were trading at substantial discounts froff m our conservativeestimates of intrinsic value, were financially strong, andin our view had good prospects forff future growth. Tomake room forff the new acquisitions and additions, wesold and trimmed a number of the Funds’ holdings thathad approached or exceeded our estimates of intrinsicvalue, including Bangkok Bank, Hankook & Co., Alten,the German engineering company, Jardine Strategic,Kingboard Holding, Michelin, Novartis, Roche, Siemens,Carlisle Cos, Phillips 66, Bollore, Alphabet, AbbVie, anda host of others.
FINAL THOUGHTS
Ben Graham’s intrinsic value approach emphasized soundinvestment, using business-like principles to seek topurchase undervalued equities at prices which (in theory)afforffff ded the investor a “margin of safety.” The eleganceof his theory was that, as prices become more discounted,there is (at least theoretically) less risk of loss, along withthe prospect forff greater return if price accretes over timeto estimated intrinsic value. (Of course, equity investingalwaysaa involves the risk of loss.)
A condition precedent to the long-term success of theapproach is the ability to weather challenging periods ofunderperformance that often offerffff pricing opportunityto disciplined value conscious investors. While this mostrecent period of underperformance for value managementhas been unprecedented in its length and psychologicallyunsettling, we believe shareholders can take some comfortffin the facff t that recovery periods in the past have tended tobe robust, and have typically lasted for five plus years. Forexample, in the two five-year recovery periods prior to thispast decade, 2000-2004 and 2008-2012, the InternationalValue Fund produced cumulative returns that bested its
benchmark index by 6,316 (63.16%) and 2,745 (27.45%)basis points, respectively. If the past is prologue, we hopethat our value style of investing will farff e as well this timearound relative to our growth brethren and our Funds’global and international benchmarks. (Past performance isno guarantee of futff ure results.)
The pendulum indeed appears to be swinging as we write,and we believe that we are in the midst of a tectonic shiftin markets, catalyzed in part by the war in Ukraine andpandemic-related supply shocks, but driven primarily byescalating inflation and rising interest rates. We believethis shift sff hould continue to favff or sensible and disciplinedprice-driven strategies. The Tweedy, Browne Funds havetaken advantage of the volatility in equity markets over thelast couple of years, and in our view are well positioned forffwhat lies ahead. So for all you felff low tortoises out there,remain steady, and never forget that the race is not alwaysaato the swift.
Thank you forff your continued confidence and trust.
Sincerely,
Roger R. de Bree, Frank H.Hawrylak,Jay Haa ill, Sean McDonald,Thomas H. Shrager,John D. Spears, Robert Q.WyckoWW ff, Jffff r.
INVESTMENT COMMITTEE
May 2022
MARCH 31, 2022
II-7

NOTES1. Indexes are unmanaged, and the figures for the indexes shown include reinvestment of dividends and capital gains distributions anddo not reflect any fees or expenses. Investors cannot invest directly in an index.
2. The MSCI EAFE Index is a free float-adjusted, market capitalization weighted index that is designed to measure the equity marketperformance of developed markets, excluding the US and Canada. The MSCI EAFE Index (in US$) reflects the return of the MSCIEAFE Index for a US dollar investor. The MSCI EAFE Index (Hedged to US$) consists of the results of the MSCI EAFE Index hedged100% back into US dollars and accounts for interest rate differentials in forward currency exchange rates. Results for each index areinclusive of dividends and net of foreign withholding taxes.
3. Inception dates for the International Value Fund, International Value Fund II, Value Fund and Worldwide High Dividend Yield ValueFund are June 15, 1993, October 26, 2009, December 8, 1993, and September 5, 2007, respectively. Pyy rior to 2004, information withrespect to theMSCI EAFE andMSCIWorld Indexes usedwas available atmonth end only; therefore, the since-inception performanceof the MSCI EAFE Indexes quoted for the International Value Fund reflects performance from May 31, 1993, the closest month endto the International Value Fund’s inception date, and the since inception performance of the MSCIWorld Index quoted for the ValueFund reflects performance from November 30, 1993, the closest month end to the Value Fund’s inception date.
4. The S&P 500/MSCIWorld Index (Hedged toUS$) is a combination of the S&P 500 Index and theMSCIWorld Index (Hedged toUS$),linked together by Tweedy, Browne, and represents the performance of the S&P 500 Index for the periods 12/8/93 – 12/31/06 and theperformance of the MSCI World Index (Hedged to US$) beginning 1/1/07 and thereafter (beginning December 2006, the Fund waspermitted to invest more significantly in non-US securities). The S&P 500 Index is a market capitalization weighted index composedof 500 widely held common stocks that assumes the reinvestment of dividends. The index is generally considered representative ofUS large capitalization stocks.
5. The MSCI World Index is a free float-adjusted market capitalization weighted index that is designed to measure the equity marketperformance of developed markets. The MSCI World Index (in US$) reflects the return of this index for a US dollar investor. TheMSCIWorld Index (Hedged to US$) consists of the results of theMSCIWorld Index with its foreign currency exposure hedged 100%back into US dollars. The index accounts for interest rate differentials in forward currency exchange rates. The MSCI World HighDividend Yield Index reflects the performance of equities in theMSCIWorld Index (excluding REITs) with higher dividend income andquality characteristics than average dividend yields that are both sustainable and persistent. The index also applies quality screensand reviews 12-month past performance to omit stocks with potentially deteriorating fundamentals that could force them to cut orreduce dividends. The MSCI World High Dividend Yield Index (in US$) reflects the return of the MSCI World High Dividend YieldIndex for a US dollar investor. TheMSCI ACWI ex USAValue Index captures large andmid cap securities exhibiting overall value stylecharacteristics across 22 Developed and 27 Emerging Markets countries. Results for each index are inclusive of dividends and net offoreign withholding taxes.
Mention of a specific security should not be considered a recommendation to buy or a solicitation to sell that security. Pyy ortfolio holdingsare subject to change at any time without notice and may not be representative of a Fund’s current or future investments.
The MSCI style methodology adopts a two-dimensional framework for value/growth segmentation: each security is given an overallstyle characteristic derived from its value and growth scores and is then placed into either a value or a growth index (or is partiallyallocated to both). The value investment style characteristics for index construction are defined using three variables: book value toprice, 12-month forward earnings to price and dividend yield. The growth investment style characteristics for index construction aredefined using five variables: long-term forward EPS growth rate, short-term forward EPS growth rate, current internal growth rate andlong-term historical EPS growth trend and long-term historical sales per share growth trend. The MSCI World Growth Index captureslarge and mid-cap securities exhibiting overall growth style characteristics across 23 developed markets. TheMSCI EAFE Growth Indexcaptures large and mid-cap securities exhibiting overall growth style characteristics across developed markets countries around theworld, excluding the US and Canada.
The views expressed represent the opinions of Tweedy, Browne Company LLC as of the date of this letter, are not intended as a forecastor a guarantee of future results, or investment advice and are subject to change without notice.
Current and future portfolio holdings are subject to risk. Investing in foreign securities involves additional risks beyond the risks ofinvesting in US securities markets. These risks, which are more pronounced in emergingmarkets, include currency fluctuations; politicaluncertainty; different accounting and financial standards; different regulatory environments; and different market and economic factorsin various non-US countries. In addition, the securities of small, less well-known companies may be more volatile than those of largercompanies. Force majeure events such as pandemics, political upheaval and natural disasters are likely to increase the risks inherent ininvestments and could have a broad negative impact on the world economy and business activity in general. Value investing involvesthe risk that the market will not recognize a security’s intrinsic value for a long time, or that a security thought to be undervalued mayactually be appropriately priced when purchased. Dividends are not guaranteed, and a company currently paying dividends may ceasepaying dividends at any time. Diversification does not guarantee a profit and does not protect against a loss in a declining market.
An outbreak of respiratory disease caused by a novel coronavirus designated as COVID-19 has developed into a global pandemic andhas resulted in, among other things, extreme volatility in the financial markets and severe losses, reduced liquidity of many instruments,significant travel restrictions, significant disruptions to business operations, supply chains and customer activity, lyy ower consumerdemand for goods and services, service and event cancellations, reductions and other changes, strained healthcare systems, as well asgeneral concern and uncertainty. Tyy he impact of the COVID-19 pandemic has negatively affected the global economy, tyy he economies ofindividual countries, and the financial performance of individual issuers, sectors, industries, asset classes, and markets in significant andunforeseen ways, and the duration of this pandemic cannot be determined with certainty. While some vaccines have been developed
Investment Adviser’s Note (Unaudited)
II-8

and approved for use by various governments, the political, social, economic, market and financial risks of COVID-19 could persist foryears to come. The foregoing could have a significant impact on the Funds, including by impacting the Funds’ performance, net assetvalue, income, and/or operating results or the performance, income, operating results and viability of issuers in which each Fund invests.
Please refer to the Funds’ prospectus for a description of risk factors associated with investments in securities which may be held bythe Funds. All investments are subject to risk including the possible loss of principal. There is no assurance that a Fund will achieve itsinvestment objective.
Although the practice of hedging against currency exchange rate changes utilized by the Tweedy, Browne International Value Fundand the Tweedy, Browne Value Fund reduces the risk of loss from exchange rate movements, it also reduces the ability of the Fundsto gain from favorable exchange rate movements when the US dollar declines against the currencies in which the Funds’ investmentsare denominated and may impose costs on the Funds. As a result of practical considerations, fluctuations in a security’s prices, andfluctuations in currencies, a Fund’s hedges are expected to approximate, but will generally not equal, the Fund’s perceived foreigncurrency risk.
Stocks and bonds are subject to different risks. In general, stocks are subject to greater price fluctuations and volatility than bonds andcan decline significantly in value in response to adverse issuer, political, regulatory, market or economic developments. Unlike stocks, ifheld to maturity, byy onds generally offer to pay both a fixed rate of return and a fixed principal value. Bonds are subject to interest rate risk(as interest rates rise bond prices generally fall), the risk of issuer default, issuer credit risk, and inflation risk, although US Treasuries arebacked by the full faith and credit of the US Government.
This letter contains opinions and statements on investment techniques, economics, market conditions and other matters. There is noguarantee that these opinions and statements will prove to be correct, and some of them are inherently speculative. None of themshould be relied upon as statements of fact.
Content reproduced fromMorningstar is ©2022Morningstar, Inc. All Rights Reserved. The information contained herein: (1) is proprietaryto Morningstar and/or its content providers; (2) may not be copied or distributed; and (3) is not warranted to be accurate, complete ortimely. Nyy either Morningstar nor its content providers are responsible for any damages or losses arising from any use of this information.Past performance is no guarantee of future results.
Tweedy, Browne International Value Fund, Tweedy, Browne International Value Fund II – Currency Unhedged, Tweedy, Browne ValueFund, and Tweedy, BrowneWorldwide High Dividend Yield Value Fund are distributed by AMGDistributors, Inc., Member FINRA/SIPC.
This material must be preceded or accompanied by a prospectus for Tweedy, Browne Fund Inc. You should consider the Funds’investment objectives, risks, charges and expenses carefully before investing. The prospectus contains this and other information aboutthe Funds. The prospectus should be read carefully before investing.
MARCH 31, 2022
II-9

Expense Information (Unaudited)
A shareholder of the International Value Fund (formerly,Tweedy, Browne Global Value Fund), International ValueFund II – Currency Unhedged (formerly, Tweedy, BrowneGlobal Value Fund II – Currency Unhedged), Value Fund orWorldwide High Dividend Yield Value Fund (collectively,the “Funds”) incurs two types of costs: (1) transaction costsand (2) ongoing costs, including management fees and otherFund expenses. The Example below is intended to help ashareholder understand the ongoing costs (in U.S. dollars) ofinvesting in the Funds and to compare these costs with theongoing costs of investing in other mutual funds.
The Example is based on an investment of $1,000invested at the beginning of the period and held for theentire period of October 1, 2021 to March 31, 2022.
Actual Expenses. The first part of the table presentedbelow, under the heading “Actual Expenses,” providesinformation about actual account values and actualexpenses. The information in this line may be used with theamount a shareholder invested to estimate the expenses thatwere paid by the shareholder over the period. Simply dividethe shareholder’s account value by $1,000 (for example, an$8,600 account value divided by $1,000 = 8.6), thenmultiply the result by the number in the first line under theheading entitled “Expenses Paid During Period” to estimatethe expenses paid during this period.
Hypothetical Example for Comparison Purposes. Thesecond part of the table presented below, under the heading“Hypothetical Expenses,” provides information abouthypothetical account values and hypothetical expensesbased on each Fund’s actual expense ratio and an assumedrate of return of 5% per year before expenses, which is noteach Fund’s actual return. The hypothetical account valuesand expenses may not be used to estimate the actual endingaccount balance or expenses paid by the shareholder of theFunds for the period. This information may be used tocompare the ongoing costs of investing in the Funds to otherfunds. To do so, compare this 5% hypothetical example withthe 5% hypothetical examples that appear in theshareholder reports of the other funds.
Please note that the expenses shown in the table beloware meant to highlight a shareholder’s ongoing costs only.There are no transactional expenses associated with thepurchase and sale of shares charged by any of the Funds, suchas commissions, sales loads and/or redemption fees. Othermutual funds may have such transactional charges.Therefore, the second part of the table is useful in comparingongoing costs only, and will not help a shareholderdetermine the relative total costs of owning different funds.
Actual ExpensesHypothetical Expenses
(5% Return before Expenses)
BeginningAccountValue
10/1/21
EndingAccountValue
3/31/22
ExpensesPaid During
Period*10/1/21–3/31/22
BeginningAccountValue
10/1/21
EndingAccountValue
3/31/22
ExpensesPaid During
Period*10/1/21 –3/31/22
AnnualizedExpense
Ratio
International Value Fund $1,000.00 $1,017.00 $6.79 $1,000.00 $1,018.20 $6.79 1.35%
International Value Fund II –Currency Unhedged $1,000.00 $1,000.80 $6.73 $1,000.00 $1,018.20 $6.79 1.35%
Value Fund $1,000.00 $1,025.40 $6.82 $1,000.00 $1,018.20 $6.79 1.35%
Worldwide High DividendYield Value Fund $1,000.00 $1,020.60 $6.75 $1,000.00 $1,018.25 $6.74 1.34%
* Expenses are equal to each Fund’s annualized expense ratio, multiplied by the average account value over the period,multiplied by the number of days in the period (182), divided by 365 (to reflect the one-half year period).
II-10

Tweedy, BrowneInternational Value FundPortfolio Highlights as of March 31, 2022 (Unaudited)
Hypothetical Illustration of $10,000 Invested inTweedy, Browne International Value Fund vs.
MSCI EAFE Index(Hedged to US$ and in US$)
6/15/93 through 3/31/22
$90,000
$10,000
$0
$20,000
$30,000
$40,000
$50,000
$70,000
$60,000
$80,000
$110,000
$100,000
$59,998
$45,222
$109,479Tweedy, Browne International Value Fund
Mar
199
4
Jun
1993
Mar
199
5
Mar
199
6
Mar
199
7
Mar
199
8
Mar
199
9
Mar
200
0
Mar
200
1
Mar
200
2
Mar
200
3
Mar
200
4
Mar
200
5
Mar
200
6
Mar
200
7
Mar
200
8
Mar
200
9
Mar
201
0
Mar
201
1
Mar
201
2
Mar
201
5
Mar
201
6
Mar
201
8
Mar
202
0
Mar
201
9
Mar
202
2
Mar
201
7
Mar
201
4
Mar
201
3
MSCI EAFE Index (in US$)MSCI EAFE Index (Hedged to US$)
$120,000
Mar
202
1
Average Annual Total Returns – For Periods Ended March 31, 2022
Tweedy, BrowneInternational Value Fund
MSCI EAFEIndex (Hedged to US$)
MSCI EAFEIndex (in US$)
1 Year 4.36% 7.08% 1.16%
5 Years 5.06 8.32 6.72
10 Years 6.51 9.56 6.27
Since Inception(6/15/93) 8.67 6.41 5.37
Total Annual Fund Operating Expense Ratio as of 3/31/21, as disclosed in the Fund’s most recent prospectus: 1.38%(gross), 1.37% (net).†
Total Annual Fund Operating Expense Ratio as of 3/31/22: 1.38% (gross), 1.34% (net).†
The preceding performance data represents past performance and is not a guarantee of future results. Total return and principal value of an investment will fluctuate so thatan investor’s shares, when redeemed, may be worth more or less than their original cost. The graph and table do not reflect the deduction of taxes that a shareholder wouldpay on Fund distributions or the redemption of Fund shares. Current performance may be lower or higher than the performance data shown. Results are annualized for allperiods greater than one year. Please visit www.tweedy.com to obtain performance data that is current to the most recent month end.The Fund does not impose any front-end or deferred sales charges. The expense ratios shown above reflect the inclusion of acquired fund fees and expenses (i.e., the fees andexpenses attributable to investing cash balances in money market funds) and may differ from those shown in the Fund’s financial statements.† Tweedy, Browne has voluntarily agreed, effective May 22, 2020 through at least July 31, 2023, to waive the International Value Fund’s fees whenever the Fund’s average daily net assets(“ADNA”) exceed $6 billion. Under the arrangement, the advisory fee payable by the Fund is as follows: 1.25% on the first $6 billion of the Fund’s ADNA; 0.80% on the next $1 billion of theFund’s ADNA (ADNA over $6 billion up to $7 billion); 0.70% on the next $1 billion of the Fund’s ADNA (ADNA over $7 billion up to $8 billion); and 0.60% on the remaining amount, ifany, of the Fund’s ADNA (ADNA over $8 billion). The Fund’s performance would have been lower had fees not been waived from May 22, 2020 to March 31, 2022.
The MSCI EAFE Index is a free float-adjusted market capitalization weighted index that is designed to measure the equity market performance of developed markets, excluding the U.S. andCanada. The MSCI EAFE Index (in US$) reflects the return of the MSCI EAFE Index for a U.S. dollar investor. The MSCI EAFE Index (Hedged to US$) consists of the results of theMSCI EAFE Index hedged 100% back into U.S. dollars and accounts for interest rate differentials in forward currency exchange rates. Results for each index are inclusive of dividends and net offoreign withholding taxes. The inception date for the Fund is June 15, 1993. Prior to 2004, information with respect to the MSCI EAFE indexes used was available at month end only; therefore,the closest month end to the Fund’s inception date, May 31, 1993, was used.
Indexes are unmanaged, and the figures for the indexes shown include reinvestment of dividends and capital gains distributions and do not reflect any fees or expenses. Investors cannot investdirectly in an index.
II-11

Tweedy, Browne International Value Fund
Perspective on Assessing Investment Results (Unaudited)
March 31, 2022
In accordance with rules and guidelines set out by theUnited States Securities and Exchange Commission, we haveprovided a comparison of the historical investment results ofTweedy, Browne International Value Fund to the results ofthe MSCI EAFE Index (hedged to US$) and the MSCI EAFEIndex (in US$) (non-U.S. currencies are unhedged).Although we believe this comparison may be useful, thehistorical results of the MSCI EAFE indexes in large measurerepresent the investment results of stocks that we do not own.Any portfolio that does not own exactly the same stocks inexactly the same proportions as the index to which theparticular portfolio is being compared is not likely to have thesame results as the index. The investment behavior of adiversified portfolio of undervalued stocks tends to becorrelated to the investment behavior of a broad index; i.e.,when the index is up, probably more than one-half of thestocks in the entire universe of public companies in all thecountries that are included in the same index will be up,albeit in greater or lesser percentages than the index.Similarly, when the index declines, probably more than one-half of the stocks in the entire universe of public companies inall the countries that are included in the index will be downin greater or lesser percentages than the index. But it is almosta mathematical truth that “different stocks equal differentresults.”
We believe that favorable or unfavorable historicalinvestment results in comparison to an index are notnecessarily predictive of future comparative investmentresults. In 1986, V. Eugene Shahan, a Columbia UniversityBusiness School alumnus and portfolio manager at U.S. Trust,wrote Are Short-Term Performance and Value InvestingMutually Exclusive? In this article, Mr. Shahan analyzed the
investment performance of seven money managers, aboutwhom Warren Buffett wrote in his article, The Superinvestorsof Graham and Doddsville. Over long periods of time, the sevenmanagers significantly outperformed the market as measuredby the Dow Jones Industrial Average (the DJIA) or theS&P 500 Index (the S&P 500) by between 7.7% and 16.5%annually. (The goal of most institutional money managers isto outperform the market by 2% to 3%.) However, for periodsranging from 13 years to 28 years, this group of managersunderperformed the market between 7.7% and 42% of theyears. Six of the seven investment managers underperformedthe market between 28% and 42% of the years. In today’senvironment, they would have lost many of their clientsduring their periods of underperformance. Longer term, itwould have been the wrong decision to fire any of thosemoney managers. In examining the seven long-terminvestment records, unfavorable investment results ascompared to either index did not predict the future favorablecomparative investment results that occurred, and favorableinvestment results in comparison to the DJIA or the S&P 500were not always followed by future favorable comparativeresults. Stretches of consecutive annual underperformanceranged from one to six years.
Mr. Shahan concluded:
Unfortunately, there is no way to distinguish between apoor three-year stretch for a manager who will do wellover 15 years, from a poor three-year stretch for amanager who will continue to do poorly. Nor is there anyreason to believe that a manager who does well from theoutset cannot continue to do well, and consistently.
II-12

Tweedy, Browne International Value Fund
Portfolio of InvestmentsMarch 31, 2022
Shares Value*
COMMON STOCKS—94.2%
Belgium—0.2%569,770 Fagron NV . . . . . . . . . . . . . . . . . . . . . . . . . . . . . . $10,441,088
Canada—2.0%1,124,700 National Bank of Canada . . . . . . . . . . . . . . . . . . . 86,289,581
251,390 Lassonde Industries, Inc., Class A(a) . . . . . . . . . . . 28,702,396386,105 Winpak, Ltd. . . . . . . . . . . . . . . . . . . . . . . . . . . . . 11,870,167
126,862,144
China—5.0%6,558,290 Alibaba Group Holding, Ltd.(b) . . . . . . . . . . . . . . 89,520,8134,349,576 Baidu, Inc., Class A(b) . . . . . . . . . . . . . . . . . . . . . . 76,782,886
41,516,695 Dali Foods Group Co., Ltd. . . . . . . . . . . . . . . . . . . 21,664,0613,734,350 Haitian International Holdings, Ltd. . . . . . . . . . . . 9,631,813
49,499 JD.com, Inc., Class A(b) . . . . . . . . . . . . . . . . . . . . 1,406,8507,801,470 Shanghai Mechanical and Electrical Industry Co.,
Ltd., Class A . . . . . . . . . . . . . . . . . . . . . . . . . . . 16,015,5716,463,000 Shanghai Mechanical and Electrical Industry Co.,
Ltd., Class B . . . . . . . . . . . . . . . . . . . . . . . . . . . 7,967,8771,485,150 Tencent Holdings, Ltd. . . . . . . . . . . . . . . . . . . . . . 68,473,6239,544,780 Uni-President China Holdings, Ltd. . . . . . . . . . . . 8,284,863
22,047,485 WH Group, Ltd. . . . . . . . . . . . . . . . . . . . . . . . . . . 13,848,193313,596,550
Czech Republic—0.0%(c)
2,800 Philip Morris CR a.s. . . . . . . . . . . . . . . . . . . . . . . 2,219,337
Finland—0.3%1,569,538 Kemira Oyj . . . . . . . . . . . . . . . . . . . . . . . . . . . . . . 20,652,580
France—11.0%10,734,192 Bollore SE . . . . . . . . . . . . . . . . . . . . . . . . . . . . . . 56,534,0902,510,680 Rubis SCA . . . . . . . . . . . . . . . . . . . . . . . . . . . . . . 74,223,0441,412,745 Safran SA . . . . . . . . . . . . . . . . . . . . . . . . . . . . . . . 167,292,5375,560,065 SCOR SE . . . . . . . . . . . . . . . . . . . . . . . . . . . . . . . 179,820,6991,527,083 Tarkett SA(b) . . . . . . . . . . . . . . . . . . . . . . . . . . . . 21,646,6473,831,330 TotalEnergies SE . . . . . . . . . . . . . . . . . . . . . . . . . 194,985,160
694,502,177
Germany—7.3%1,383,980 BASF SE . . . . . . . . . . . . . . . . . . . . . . . . . . . . . . . 79,427,5652,276,215 Fresenius SE & Co., KGaA . . . . . . . . . . . . . . . . . . 84,058,0911,682,955 Henkel AG & Co., KGaA . . . . . . . . . . . . . . . . . . 111,725,526
792,204 Krones AG . . . . . . . . . . . . . . . . . . . . . . . . . . . . . . 66,181,45742,354 KSB SE & Co., KGaA . . . . . . . . . . . . . . . . . . . . . 20,557,404
254,527 Muenchener Rueckversicherungs AG,Registered . . . . . . . . . . . . . . . . . . . . . . . . . . . . . 68,438,837
643,887 Norma Group SE . . . . . . . . . . . . . . . . . . . . . . . . . 18,595,60165,633 Rheinmetall AG . . . . . . . . . . . . . . . . . . . . . . . . . . 13,953,013
462,937,494
Hong Kong—1.8%7,421,500 CK Hutchison Holdings, Ltd. . . . . . . . . . . . . . . . . 54,282,219
26,265,000 Emperor Entertainment Hotel, Ltd. . . . . . . . . . . . 2,304,4885,542,142 Great Eagle Holdings, Ltd. . . . . . . . . . . . . . . . . . . 13,431,112
15,995,508 Hang Lung Group, Ltd. . . . . . . . . . . . . . . . . . . . . . 33,828,30859,000 Miramar Hotel & Investment . . . . . . . . . . . . . . . . 94,153
10,820,000 TAI Cheung Holdings, Ltd. . . . . . . . . . . . . . . . . . 6,700,845110,641,125
Shares Value*
Italy—1.8%817,650 Buzzi Unicem SpA . . . . . . . . . . . . . . . . . . . . . . . $15,218,283
2,943,779 Iveco Group NV(b) . . . . . . . . . . . . . . . . . . . . . . 19,342,6044,365,000 SOL SpA . . . . . . . . . . . . . . . . . . . . . . . . . . . . . . 79,892,921
114,453,808
Japan—2.6%93,500 ADEKA Corp. . . . . . . . . . . . . . . . . . . . . . . . . . . 2,059,822
2,798,041 Astellas Pharma, Inc. . . . . . . . . . . . . . . . . . . . . . 43,850,5711,001,300 Fuji Seal International, Inc. . . . . . . . . . . . . . . . . 13,731,451
57,600 Konishi Co., Ltd. . . . . . . . . . . . . . . . . . . . . . . . . 737,5003,363,180 Kuraray Co., Ltd. . . . . . . . . . . . . . . . . . . . . . . . . 29,037,283
820,800 NGK Spark Plug Co., Ltd. . . . . . . . . . . . . . . . . . 13,255,374164,400 Nippon Kanzai Co., Ltd. . . . . . . . . . . . . . . . . . . 3,808,191104,825 Okamoto Industries, Inc. . . . . . . . . . . . . . . . . . . 3,356,586193,700 Shizuoka Gas Co., Ltd. . . . . . . . . . . . . . . . . . . . . 1,352,610
1,284,760 Sumitomo Heavy Industries, Ltd. . . . . . . . . . . . . 29,529,980271,950 Taikisha, Ltd. . . . . . . . . . . . . . . . . . . . . . . . . . . . 6,782,535580,020 Transcosmos, Inc.(b) . . . . . . . . . . . . . . . . . . . . . 15,108,054
Miscellaneous Security(d) . . . . . . . . . . . . . . . . . . 2,012,301164,622,258
Mexico—2.1%1,533,895 Coca-Cola FEMSA SA de CV, Sponsored
ADR(e) . . . . . . . . . . . . . . . . . . . . . . . . . . . . . 84,287,5304,556,152 Industrias Bachoco SAB de CV, Class B . . . . . . 17,763,5559,067,593 Megacable Holdings SAB de CV . . . . . . . . . . . . 27,281,897
129,332,982
Netherlands—2.7%2,160,839 Heineken Holding NV . . . . . . . . . . . . . . . . . . . 170,179,586
Philippines—0.1%22,609,020 Alliance Global Group, Inc. . . . . . . . . . . . . . . . 5,461,412
Singapore—5.7%6,432,235 DBS Group Holdings, Ltd. . . . . . . . . . . . . . . . . . 168,787,9308,270,385 United Overseas Bank, Ltd. . . . . . . . . . . . . . . . . 193,796,445
362,584,375
South Korea—1.5%97,800 Hyundai Mobis Co., Ltd. . . . . . . . . . . . . . . . . . . 17,237,310
131,339 Kangnam Jevisco Co., Ltd. . . . . . . . . . . . . . . . . . 2,780,499998,776 LG Corp. . . . . . . . . . . . . . . . . . . . . . . . . . . . . . . 62,721,313360,632 LX Holdings Corp.(b) . . . . . . . . . . . . . . . . . . . . . 2,849,43942,936 Samchully Co., Ltd. . . . . . . . . . . . . . . . . . . . . . . 3,753,377
Miscellaneous Security(d) . . . . . . . . . . . . . . . . . . 7,138,00096,479,938
Sweden—2.7%661,300 Autoliv, Inc. . . . . . . . . . . . . . . . . . . . . . . . . . . . 50,549,772
1,704,935 SKF AB, Class B . . . . . . . . . . . . . . . . . . . . . . . . 28,048,2013,901,988 Trelleborg AB, Class B . . . . . . . . . . . . . . . . . . . 91,144,990
169,742,963
Switzerland—14.0%142,761 Coltene Holding AG, Registered . . . . . . . . . . . . 16,128,569
2,535,079 Nestlé SA, Registered . . . . . . . . . . . . . . . . . . . . 330,968,63680 Neue Zuercher Zeitung AG(b) . . . . . . . . . . . . . . 593,317
805,437 Novartis AG, Registered . . . . . . . . . . . . . . . . . . 71,002,553
SEE NOTES TO FINANCIAL STATEMENTSII-13

Tweedy, Browne International Value Fund
Portfolio of InvestmentsMarch 31, 2022
Shares Value*
Switzerland (continued)68,178 Phoenix Mecano AG(a) . . . . . . . . . . . . . . . . . . . $28,955,728
581,341 Roche Holding AG . . . . . . . . . . . . . . . . . . . . . . 230,964,264429,703 TX Group AG(b) . . . . . . . . . . . . . . . . . . . . . . . . 71,839,397262,041 Zurich Insurance Group AG . . . . . . . . . . . . . . . 129,956,458
880,408,922
United Kingdom—18.7%5,694,918 Babcock International Group plc(b) . . . . . . . . . . 24,235,434
16,699,941 BAE Systems plc . . . . . . . . . . . . . . . . . . . . . . . . 157,194,93014,718,898 CNH Industrial NV . . . . . . . . . . . . . . . . . . . . . . 233,175,4355,651,479 Diageo plc . . . . . . . . . . . . . . . . . . . . . . . . . . . . . 287,323,5598,418,226 GlaxoSmithKline plc . . . . . . . . . . . . . . . . . . . . . 182,560,7395,273,360 Inchcape plc . . . . . . . . . . . . . . . . . . . . . . . . . . . 46,248,229
11,937,289 Johnson Service Group plc(b) . . . . . . . . . . . . . . . 18,455,99117,304,144 Lookers plc(b) . . . . . . . . . . . . . . . . . . . . . . . . . . . 20,939,20010,457,845 Tesco plc . . . . . . . . . . . . . . . . . . . . . . . . . . . . . . 37,947,0661,178,920 Unilever plc . . . . . . . . . . . . . . . . . . . . . . . . . . . . 53,590,9892,283,205 Unilever plc (Ordinary Shares) . . . . . . . . . . . . . 103,900,622
16,292,379 Vertu Motors plc . . . . . . . . . . . . . . . . . . . . . . . . 13,900,482380,279 Vivo Energy plc . . . . . . . . . . . . . . . . . . . . . . . . . 680,664
1,180,153,340
United States—14.7%75,488 Alphabet, Inc., Class A(b) . . . . . . . . . . . . . . . . . 209,958,54860,045 Alphabet, Inc., Class C(b) . . . . . . . . . . . . . . . . . 167,705,085
418 Berkshire Hathaway, Inc., Class A(b) . . . . . . . . . 221,088,978546,465 Cisco Systems, Inc. . . . . . . . . . . . . . . . . . . . . . . 30,470,888687,282 FMC Corp. . . . . . . . . . . . . . . . . . . . . . . . . . . . . 90,425,693
1,819,506 Ionis Pharmaceuticals, Inc.(b) . . . . . . . . . . . . . . . 67,394,502787,517 Johnson & Johnson . . . . . . . . . . . . . . . . . . . . . . 139,571,638
926,615,332
TOTAL COMMON STOCKS(Cost $3,430,317,665) . . . . . . . . . . . . . . . . . . . . . . . . . . . . 5,941,887,411
PREFERRED STOCKS—0.5%
Chile—0.3%11,044,000 Embotelladora Andina SA, Class A . . . . . . . . . . 20,603,865
Croatia—0.2%166,388 Adris Grupa DD . . . . . . . . . . . . . . . . . . . . . . . . 10,269,053
TOTAL PREFERRED STOCKS(Cost $35,290,988) . . . . . . . . . . . . . . . . . . . . . . . . . . . . . . . 30,872,918
Shares Value*
REGISTERED INVESTMENT COMPANY—1.4%87,362,663 Dreyfus Treasury Securities Cash
Management—InstitutionalShares 0.11%(f)
(Cost $87,362,663) . . . . . . . . . . . . . . . . . $87,362,663
Face Value
U.S. TREASURY BILL—2.0%$125,000,000 0.050%(g) due 04/14/2022(e)
(Cost $124,997,743) . . . . . . . . . . . . . . . . 124,997,743
INVESTMENTS IN SECURITIES(Cost $3,677,969,059) . . . . . . . . . . . . . . . . . . 98.1% 6,185,120,735
UNREALIZED APPRECIATION ONFORWARD CONTRACTS (Net) . . . . . . . . 1.0 65,843,704
OTHER ASSETSAND LIABILITIES (Net) . . . . . . . . . . . . . . . 0.9 55,442,970
NET ASSETS . . . . . . . . . . . . . . . . . . . . . . . . . . . 100.0% $6,306,407,409
* See Note 2 in Notes to Financial Statements.(a) “Affiliated company” as defined by the Investment Company Act of 1940. See Note 4.(b) Non-income producing security.(c) Amount represents less than 0.1% of net assets.(d) Represents one or more issuers where disclosure may be disadvantageous to the Fund’s
accumulation or disposition program. The aggregate amount of $9,150,301 represents0.1% of the net assets of the Fund.
(e) This position has been segregated to cover certain open forward contracts. At March 31,2022, liquid assets totaling $209,285,273 have been segregated to cover such open forwardcontracts.
(f) Rate disclosed is the 7-day yield at March 31, 2022.(g) Rate represents annualized yield at date of purchase.
Abbreviations:ADR — American Depositary Receipt
SEE NOTES TO FINANCIAL STATEMENTSII-14

Tweedy, Browne International Value Fund
Sector DiversificationMarch 31, 2022 (Unaudited)
Sector DiversificationPercentage ofNet Assets
COMMON STOCKSCapital Goods . . . . . . . . . . . . . . . . . . . . . . . . . . . . . . . . . . . . . . . . . . 16.4%Pharmaceuticals, Biotechnology & Life Sciences . . . . . . . . . . . . . . . . 11.7Insurance . . . . . . . . . . . . . . . . . . . . . . . . . . . . . . . . . . . . . . . . . . . . . . 9.5Food . . . . . . . . . . . . . . . . . . . . . . . . . . . . . . . . . . . . . . . . . . . . . . . . . . 8.9Beverage . . . . . . . . . . . . . . . . . . . . . . . . . . . . . . . . . . . . . . . . . . . . . . 8.7Software & Services . . . . . . . . . . . . . . . . . . . . . . . . . . . . . . . . . . . . . . 8.5Banks . . . . . . . . . . . . . . . . . . . . . . . . . . . . . . . . . . . . . . . . . . . . . . . . . 7.1Materials . . . . . . . . . . . . . . . . . . . . . . . . . . . . . . . . . . . . . . . . . . . . . . 5.5Energy . . . . . . . . . . . . . . . . . . . . . . . . . . . . . . . . . . . . . . . . . . . . . . . . 3.1Retailing . . . . . . . . . . . . . . . . . . . . . . . . . . . . . . . . . . . . . . . . . . . . . . 2.7Household & Personal Products . . . . . . . . . . . . . . . . . . . . . . . . . . . . . 2.6Media . . . . . . . . . . . . . . . . . . . . . . . . . . . . . . . . . . . . . . . . . . . . . . . . . 2.4Health Care Equipment & Services . . . . . . . . . . . . . . . . . . . . . . . . . . 1.8Automobiles & Components . . . . . . . . . . . . . . . . . . . . . . . . . . . . . . . 1.3Utilities . . . . . . . . . . . . . . . . . . . . . . . . . . . . . . . . . . . . . . . . . . . . . . . 1.3Technology Hardware & Equipment . . . . . . . . . . . . . . . . . . . . . . . . . 1.0Real Estate . . . . . . . . . . . . . . . . . . . . . . . . . . . . . . . . . . . . . . . . . . . . . 0.8Commercial Services & Supplies . . . . . . . . . . . . . . . . . . . . . . . . . . . . 0.8Consumer Services . . . . . . . . . . . . . . . . . . . . . . . . . . . . . . . . . . . . . . . 0.1Tobacco . . . . . . . . . . . . . . . . . . . . . . . . . . . . . . . . . . . . . . . . . . . . . . . 0.0*
Total Common Stocks . . . . . . . . . . . . . . . . . . . . . . . . . . . . . . . . . . . 94.2Preferred Stocks . . . . . . . . . . . . . . . . . . . . . . . . . . . . . . . . . . . . . . . . 0.5Registered Investment Company . . . . . . . . . . . . . . . . . . . . . . . . . . . 1.4U.S. Treasury Bill . . . . . . . . . . . . . . . . . . . . . . . . . . . . . . . . . . . . . . . 2.0Unrealized Appreciation on Forward Contracts . . . . . . . . . . . . . . . . 1.0Other Assets and Liabilities (Net) . . . . . . . . . . . . . . . . . . . . . . . . . . 0.9
Net Assets . . . . . . . . . . . . . . . . . . . . . . . . . . . . . . . . . . . . . . . . . . . . . 100.0%
* Amount represents less than 0.1% of net assets.
Portfolio CompositionMarch 31, 2022 (Unaudited)
Switzerland 14%Switzerland 14%
United Kingdom 19%United Kingdom 19%
France 11%France 11%
United States 15%United States 15%
(b)(b) Includes Unrealized Appreciation on Forward Contracts (Net) Includes Unrealized Appreciation on Forward Contracts (Net)
(a)(a) “Other Countries” include Belgium, Canada, Chile, Croatia, Czech Republic,Other Countries” include Belgium, Canada, Chile, Croatia, Czech Republic, Finland, Finland, Hong Kong, Italy, Japan, Mexico, Philippines, South Korea andHong Kong, Italy, Japan, Mexico, Philippines, South Korea and Sweden
Netherlands 3%Netherlands 3%
China 5%China 5%
Germany 7%Germany 7%
Singapore 6%Singapore 6%
Other CountriesOther Countries(a)(a) 15%
Money Market Funds,Money Market Funds,Treasury Bill andTreasury Bill andOther Assets andLiabilities (Net)Liabilities (Net)(b)(b) 5%
Schedule of Forward Exchange ContractsMarch 31, 2022
ContractsCounter-
partySettlement
DateContract Value onOrigination Date
Value03/31/22*
UnrealizedAppreciation
(Depreciation)
FORWARD EXCHANGE CONTRACTS TO BUY(a)
140,000,000 Chinese Yuan . . . . . . . . . . . . . . . . . . . . . . . . . . . . . . . . . . . . . . . . . JPM 5/26/22 $21,883,548 $21,979,057 $95,509200,000,000 Chinese Yuan . . . . . . . . . . . . . . . . . . . . . . . . . . . . . . . . . . . . . . . . . SSB 5/27/22 31,264,900 31,396,928 132,028145,000,000 Chinese Yuan . . . . . . . . . . . . . . . . . . . . . . . . . . . . . . . . . . . . . . . . . SSB 7/12/22 22,613,320 22,714,650 101,330300,000,000 Chinese Yuan . . . . . . . . . . . . . . . . . . . . . . . . . . . . . . . . . . . . . . . . . BNY 1/13/23 46,483,521 46,790,628 307,107450,000,000 Thai Baht . . . . . . . . . . . . . . . . . . . . . . . . . . . . . . . . . . . . . . . . . . . . JPM 4/28/22 13,546,057 13,535,354 (10,703)400,000,000 Thai Baht . . . . . . . . . . . . . . . . . . . . . . . . . . . . . . . . . . . . . . . . . . . . JPM 6/30/22 11,982,355 12,049,100 66,745260,000,000 Thai Baht . . . . . . . . . . . . . . . . . . . . . . . . . . . . . . . . . . . . . . . . . . . . BNY 7/1/22 7,791,126 7,832,227 41,101
TOTAL . . . . . . . . . . . . . . . . . . . . . . . . . . . . . . . . . . . . . . . . . . . . . . . . . . . . . . . . . . . . $155,564,827 $156,297,944 $733,117
FORWARD EXCHANGE CONTRACTS TO SELL(a)
30,000,000 Canadian Dollar . . . . . . . . . . . . . . . . . . . . . . . . . . . . . . . . . . . . . . . NTC 8/25/22 $(23,696,776) $(24,007,835) $(311,059)24,000,000 Canadian Dollar . . . . . . . . . . . . . . . . . . . . . . . . . . . . . . . . . . . . . . . NTC 10/13/22 (18,975,512) (19,203,423) (227,911)57,000,000 Canadian Dollar . . . . . . . . . . . . . . . . . . . . . . . . . . . . . . . . . . . . . . . SSB 12/22/22 (44,468,196) (45,602,192) (1,133,996)23,000,000 Canadian Dollar . . . . . . . . . . . . . . . . . . . . . . . . . . . . . . . . . . . . . . . NTC 3/23/23 (18,046,930) (18,397,772) (350,842)
6,000,000,000 Chilean Peso . . . . . . . . . . . . . . . . . . . . . . . . . . . . . . . . . . . . . . . . . JPM 12/22/22 (6,727,966) (7,324,674) (596,708)9,200,000,000 Chilean Peso . . . . . . . . . . . . . . . . . . . . . . . . . . . . . . . . . . . . . . . . . SSB 3/23/23 (10,828,625) (11,101,536) (272,911)
140,000,000 Chinese Yuan . . . . . . . . . . . . . . . . . . . . . . . . . . . . . . . . . . . . . . . . . JPM 5/26/22 (21,233,033) (21,979,057) (746,024)200,000,000 Chinese Yuan . . . . . . . . . . . . . . . . . . . . . . . . . . . . . . . . . . . . . . . . . SSB 5/27/22 (30,318,189) (31,396,928) (1,078,739)145,000,000 Chinese Yuan . . . . . . . . . . . . . . . . . . . . . . . . . . . . . . . . . . . . . . . . . SSB 7/12/22 (21,868,637) (22,714,650) (846,013)300,000,000 Chinese Yuan . . . . . . . . . . . . . . . . . . . . . . . . . . . . . . . . . . . . . . . . . BNY 1/13/23 (46,104,904) (46,769,767) (664,863)400,000,000 Chinese Yuan . . . . . . . . . . . . . . . . . . . . . . . . . . . . . . . . . . . . . . . . . SSB 1/17/23 (61,285,024) (62,354,917) (1,069,893)410,000,000 Chinese Yuan . . . . . . . . . . . . . . . . . . . . . . . . . . . . . . . . . . . . . . . . . JPM 1/20/23 (63,174,114) (63,910,122) (736,008)840,000,000 Chinese Yuan . . . . . . . . . . . . . . . . . . . . . . . . . . . . . . . . . . . . . . . . . JPM 2/17/23 (129,874,146) (130,867,712) (993,566)100,000,000 European Union Euro . . . . . . . . . . . . . . . . . . . . . . . . . . . . . . . . . . . SSB 4/11/22 (118,364,200) (111,301,206) 7,062,99460,000,000 European Union Euro . . . . . . . . . . . . . . . . . . . . . . . . . . . . . . . . . . . BNY 5/10/22 (73,259,400) (66,847,460) 6,411,940
SEE NOTES TO FINANCIAL STATEMENTSII-15

Tweedy, Browne International Value Fund
Schedule of Forward Exchange ContractsMarch 31, 2022
ContractsCounter-
partySettlement
DateContract Value onOrigination Date
Value03/31/22*
UnrealizedAppreciation
(Depreciation)
FORWARD EXCHANGE CONTRACTS TO SELL(a) (continued)50,000,000 European Union Euro . . . . . . . . . . . . . . . . . . . . . . . . . . . . . . . . . . . NTC 5/20/22 $(60,842,750) $(55,730,554) $5,112,19675,000,000 European Union Euro . . . . . . . . . . . . . . . . . . . . . . . . . . . . . . . . . . . BNY 5/24/22 (91,246,500) (83,610,442) 7,636,05875,000,000 European Union Euro . . . . . . . . . . . . . . . . . . . . . . . . . . . . . . . . . . . BNY 6/21/22 (91,964,250) (83,721,300) 8,242,95050,000,000 European Union Euro . . . . . . . . . . . . . . . . . . . . . . . . . . . . . . . . . . . SSB 11/18/22 (58,458,750) (56,334,858) 2,123,892
220,000,000 European Union Euro . . . . . . . . . . . . . . . . . . . . . . . . . . . . . . . . . . . SSB 11/25/22 (252,258,600) (247,997,359) 4,261,241100,000,000 European Union Euro . . . . . . . . . . . . . . . . . . . . . . . . . . . . . . . . . . . NTC 12/2/22 (113,220,000) (112,782,484) 437,51665,000,000 European Union Euro . . . . . . . . . . . . . . . . . . . . . . . . . . . . . . . . . . . SSB 12/2/22 (73,600,150) (73,308,615) 291,53590,000,000 Great Britain Pound Sterling . . . . . . . . . . . . . . . . . . . . . . . . . . . . . JPM 7/11/22 (124,384,140) (118,472,389) 5,911,75175,000,000 Great Britain Pound Sterling . . . . . . . . . . . . . . . . . . . . . . . . . . . . . NTC 7/28/22 (102,143,250) (98,733,933) 3,409,31785,000,000 Great Britain Pound Sterling . . . . . . . . . . . . . . . . . . . . . . . . . . . . . NTC 8/8/22 (118,757,920) (111,903,548) 6,854,37280,000,000 Great Britain Pound Sterling . . . . . . . . . . . . . . . . . . . . . . . . . . . . . NTC 9/9/22 (110,466,400) (105,334,929) 5,131,47170,000,000 Great Britain Pound Sterling . . . . . . . . . . . . . . . . . . . . . . . . . . . . . JPM 9/26/22 (96,320,700) (92,174,545) 4,146,155
250,000,000 Hong Kong Dollar . . . . . . . . . . . . . . . . . . . . . . . . . . . . . . . . . . . . . SSB 4/22/22 (32,198,736) (31,929,021) 269,715300,000,000 Hong Kong Dollar . . . . . . . . . . . . . . . . . . . . . . . . . . . . . . . . . . . . . NTC 4/28/22 (38,648,090) (38,316,871) 331,21975,000,000 Hong Kong Dollar . . . . . . . . . . . . . . . . . . . . . . . . . . . . . . . . . . . . . NTC 6/10/22 (9,669,060) (9,586,630) 82,430
200,000,000 Hong Kong Dollar . . . . . . . . . . . . . . . . . . . . . . . . . . . . . . . . . . . . . BNY 8/29/22 (25,680,930) (25,610,045) 70,8851,100,000,000 Japanese Yen . . . . . . . . . . . . . . . . . . . . . . . . . . . . . . . . . . . . . . . . . JPM 5/19/23 (9,716,370) (9,298,158) 418,2125,800,000,000 Japanese Yen . . . . . . . . . . . . . . . . . . . . . . . . . . . . . . . . . . . . . . . . . JPM 8/10/23 (51,309,271) (49,393,700) 1,915,5714,500,000,000 Japanese Yen . . . . . . . . . . . . . . . . . . . . . . . . . . . . . . . . . . . . . . . . . JPM 9/1/23 (40,064,103) (38,398,898) 1,665,2053,000,000,000 Japanese Yen . . . . . . . . . . . . . . . . . . . . . . . . . . . . . . . . . . . . . . . . . BNY 9/22/23 (26,012,313) (25,647,945) 364,368
110,000,000 Mexican Peso . . . . . . . . . . . . . . . . . . . . . . . . . . . . . . . . . . . . . . . . . NTC 4/11/22 (5,143,432) (5,505,418) (361,986)210,000,000 Mexican Peso . . . . . . . . . . . . . . . . . . . . . . . . . . . . . . . . . . . . . . . . . BNY 5/10/22 (9,975,252) (10,455,799) (480,547)100,000,000 Mexican Peso . . . . . . . . . . . . . . . . . . . . . . . . . . . . . . . . . . . . . . . . . JPM 5/26/22 (4,815,448) (4,963,906) (148,458)260,000,000 Mexican Peso . . . . . . . . . . . . . . . . . . . . . . . . . . . . . . . . . . . . . . . . . NTC 8/25/22 (12,291,110) (12,690,159) (399,049)500,000,000 Mexican Peso . . . . . . . . . . . . . . . . . . . . . . . . . . . . . . . . . . . . . . . . . BNY 4/5/23 (23,084,879) (23,351,850) (266,971)176,000,000 Philippine Peso . . . . . . . . . . . . . . . . . . . . . . . . . . . . . . . . . . . . . . . JPM 11/9/22 (3,393,098) (3,360,174) 32,92480,000,000 Philippine Peso . . . . . . . . . . . . . . . . . . . . . . . . . . . . . . . . . . . . . . . SSB 3/23/23 (1,487,819) (1,516,851) (29,032)25,000,000 Singapore Dollar . . . . . . . . . . . . . . . . . . . . . . . . . . . . . . . . . . . . . . NTC 4/11/22 (18,561,209) (18,471,778) 89,43190,000,000 Singapore Dollar . . . . . . . . . . . . . . . . . . . . . . . . . . . . . . . . . . . . . . JPM 5/20/22 (67,410,681) (66,495,336) 915,34585,000,000 Singapore Dollar . . . . . . . . . . . . . . . . . . . . . . . . . . . . . . . . . . . . . . SSB 6/21/22 (64,099,180) (62,808,185) 1,290,99555,000,000 Singapore Dollar . . . . . . . . . . . . . . . . . . . . . . . . . . . . . . . . . . . . . . JPM 6/30/22 (40,820,871) (40,642,176) 178,69560,000,000 Singapore Dollar . . . . . . . . . . . . . . . . . . . . . . . . . . . . . . . . . . . . . . NTC 8/12/22 (44,368,525) (44,363,335) 5,19070,000,000 Singapore Dollar . . . . . . . . . . . . . . . . . . . . . . . . . . . . . . . . . . . . . . JPM 12/22/22 (51,289,566) (51,876,425) (586,859)53,000,000 Singapore Dollar . . . . . . . . . . . . . . . . . . . . . . . . . . . . . . . . . . . . . . SSB 1/12/23 (39,092,032) (39,293,996) (201,964)
36,000,000,000 South Korean Won . . . . . . . . . . . . . . . . . . . . . . . . . . . . . . . . . . . . JPM 5/10/22 (32,438,277) (29,682,233) 2,756,04460,000,000,000 South Korean Won . . . . . . . . . . . . . . . . . . . . . . . . . . . . . . . . . . . . SSB 3/20/23 (49,023,613) (49,736,968) (713,355)
120,000,000 Swedish Krona . . . . . . . . . . . . . . . . . . . . . . . . . . . . . . . . . . . . . . . . SSB 4/22/22 (14,254,617) (12,881,481) 1,373,136150,000,000 Swedish Krona . . . . . . . . . . . . . . . . . . . . . . . . . . . . . . . . . . . . . . . . SSB 8/25/22 (17,191,386) (16,169,299) 1,022,087115,000,000 Swedish Krona . . . . . . . . . . . . . . . . . . . . . . . . . . . . . . . . . . . . . . . . BNY 9/15/22 (13,392,181) (12,406,384) 985,797125,000,000 Swedish Krona . . . . . . . . . . . . . . . . . . . . . . . . . . . . . . . . . . . . . . . . NTC 2/17/23 (13,888,580) (13,577,463) 311,117200,000,000 Swedish Krona . . . . . . . . . . . . . . . . . . . . . . . . . . . . . . . . . . . . . . . . NTC 4/5/23 (21,301,523) (21,768,055) (466,532)50,000,000 Swiss Franc . . . . . . . . . . . . . . . . . . . . . . . . . . . . . . . . . . . . . . . . . . . NTC 4/11/22 (53,637,134) (54,353,311) (716,177)35,000,000 Swiss Franc . . . . . . . . . . . . . . . . . . . . . . . . . . . . . . . . . . . . . . . . . . . NTC 5/10/22 (38,875,714) (38,090,912) 784,802
140,000,000 Swiss Franc . . . . . . . . . . . . . . . . . . . . . . . . . . . . . . . . . . . . . . . . . . . BNY 12/2/22 (151,413,554) (154,427,129) (3,013,575)130,000,000 Swiss Franc . . . . . . . . . . . . . . . . . . . . . . . . . . . . . . . . . . . . . . . . . . . SSB 12/7/22 (142,270,862) (143,452,863) (1,182,001)100,000,000 Swiss Franc . . . . . . . . . . . . . . . . . . . . . . . . . . . . . . . . . . . . . . . . . . . JPM 12/22/22 (109,844,844) (110,478,352) (633,508)20,000,000 Swiss Franc . . . . . . . . . . . . . . . . . . . . . . . . . . . . . . . . . . . . . . . . . . . JPM 1/20/23 (22,109,953) (22,146,110) (36,157)
450,000,000 Thai Baht . . . . . . . . . . . . . . . . . . . . . . . . . . . . . . . . . . . . . . . . . . . . JPM 4/28/22 (14,265,335) (13,535,354) 729,981400,000,000 Thai Baht . . . . . . . . . . . . . . . . . . . . . . . . . . . . . . . . . . . . . . . . . . . . JPM 6/30/22 (12,500,000) (12,049,100) 450,900260,000,000 Thai Baht . . . . . . . . . . . . . . . . . . . . . . . . . . . . . . . . . . . . . . . . . . . . BNY 7/1/22 (8,130,081) (7,832,227) 297,854
TOTAL . . . . . . . . . . . . . . . . . . . . . . . . . . . . . . . . . . . . . . . . . . . . . . . . . . . . . . . . . . . . $(3,315,558,691) $(3,250,448,104) $65,110,587
Unrealized Appreciation on Forward Contracts (Net) . . . . . . . . . . . . . . . . . . . . . . . . $65,843,704
* See Note 2 in Notes to Financial Statements.(a) Primary risk exposure being hedged against is currency risk.
Counterparty Abbreviations:BNY — The Bank of New York MellonJPM — JPMorgan Chase Bank NA
NTC — Northern Trust CompanySSB — State Street Bank and Trust Company
SEE NOTES TO FINANCIAL STATEMENTSII-16

Tweedy, BrowneInternational Value Fund II
– Currency UnhedgedPortfolio Highlights as of March 31, 2022 (Unaudited)
Hypothetical Illustration of $10,000 Invested inTweedy, Browne International Value Fund II – Currency Unhedged vs.
MSCI EAFE Index (in US$)10/26/09 through 3/31/22
$10,000
$11,000
$12,000
Mar
201
8
$18,000
$16,000
$13,000
$9,000
$20,000
$19,000
$17,000
$15,000
$14,000
$19,118$19,395
Tweedy, Browne International Value Fund II - Currency UnhedgedMSCI EAFE Index (in US$)
Oct
200
9
Sep
2011
Sep
2016
Mar
201
6
Sep
2017
Mar
202
0
Mar
201
9
Sep
2018
Sep
2019
Mar
202
2
Sep
2021
Mar
202
1
Sep
2020
Mar
201
7
Sep
2015
Mar
201
5
Mar
201
4
Sep
2013
Sep
2014
Mar
201
3
Sep
2012
Sep
2010
Mar
201
0
Mar
201
2
Mar
201
1
$21,000
Average Annual Total Returns – For Periods Ended March 31, 2022
Tweedy, BrowneInternational Value Fund II –
Currency UnhedgedMSCI EAFE
Index (in US$)
1 Year 1.13% 1.16%
5 Years 4.37 6.72
10 Years 4.84 6.27
Since Inception(10/26/09) 5.35 5.47
Total Annual Fund Operating Expense Ratio as of 3/31/21, as disclosed in the Fund’s most recent prospectus: 1.38% (gross),1.38% (net).†
Total Annual Fund Operating Expense Ratio as of 3/31/22: 1.37% (gross), 1.34% (net).†
The preceding performance data represents past performance and is not a guarantee of future results. Total return and principal value of an investment will fluctuate so thatan investor’s shares, when redeemed, may be worth more or less than their original cost. The graph and table do not reflect the deduction of taxes that a shareholder wouldpay on Fund distributions or the redemption of Fund shares. Current performance may be lower or higher than the performance data shown. Results are annualized for allperiods greater than one year. Please visit www.tweedy.com to obtain performance data that is current to the most recent month end.
The Fund does not impose any front-end or deferred sales charges. The expense ratios shown above reflect the inclusion of acquired fund fees and expenses (i.e., the fees andexpenses attributable to investing cash balances in money market funds) and may differ from those shown in the Fund’s financial statements.
† Tweedy, Browne Company LLC has voluntarily agreed, effective December 1, 2017 through at least July 31, 2023, to waive a portion of the Fund’s investment advisory fees and/or reimbursea portion of the Fund’s expenses to the extent necessary to keep the Fund’s expense ratio in line with the expense ratio of the Tweedy, Browne International Value Fund. (For purposes of thiscalculation, the Fund’s acquired fund fees and expenses, brokerage costs, interest, taxes and extraordinary expenses are disregarded, and the Fund’s expense ratio is rounded to two decimal points.)The Fund’s performance data shown above would have been lower had certain fees and expenses not been waived and/or reimbursed during certain periods.
The MSCI EAFE Index is a free float-adjusted market capitalization weighted index that is designed to measure the equity market performance of developed markets, excluding the U.S. and Canada.The MSCI EAFE Index (in US$) reflects the return of the MSCI EAFE Index for a U.S. dollar investor. Results for each index are inclusive of dividends and net of foreign withholding taxes.
Indexes are unmanaged, and the figures for the index shown include reinvestment of dividends and capital gains distributions and do not reflect any fees or expenses. Investors cannot invest directlyin an index.
II-17

Tweedy, Browne International Value Fund II – Currency Unhedged
Perspective On Assessing Investment Results (Unaudited)
March 31, 2022
In accordance with rules and guidelines set out by theUnited States Securities and Exchange Commission, we haveprovided a comparison of the historical investment results ofTweedy, Browne International Value Fund II – CurrencyUnhedged to the results of the MSCI EAFE Index (in US$).Although we believe this comparison may be useful, thehistorical results of the MSCI EAFE Index (in US$) in largemeasure represent the investment results of stocks that we donot own. Any portfolio that does not own exactly the samestocks in exactly the same proportions as the index to whichthe particular portfolio is being compared is not likely to havethe same results as the index. The investment behavior of adiversified portfolio of undervalued stocks tends to becorrelated to the investment behavior of a broad index; i.e.,when the index is up, probably more than one-half of thestocks in the entire universe of public companies in all thecountries that are included in the same index will be up,albeit in greater or lesser percentages than the index.Similarly, when the index declines, probably more than one-half of the stocks in the entire universe of public companies inall the countries that are included in the index will be downin greater or lesser percentages than the index. But it is almosta mathematical truth that “different stocks equal differentresults.”
We believe that favorable or unfavorable historicalinvestment results in comparison to an index are notnecessarily predictive of future comparative investmentresults. In 1986, V. Eugene Shahan, a Columbia UniversityBusiness School alumnus and portfolio manager at U.S. Trust,wrote Are Short-Term Performance and Value InvestingMutually Exclusive? In this article, Mr. Shahan analyzed the
investment performance of seven money managers, aboutwhom Warren Buffett wrote in his article, The Superinvestorsof Graham and Doddsville. Over long periods of time, the sevenmanagers significantly outperformed the market as measuredby the Dow Jones Industrial Average (the DJIA) or theS&P 500 Index (the S&P 500) by between 7.7% and 16.5%annually. (The goal of most institutional money managers isto outperform the market by 2% to 3%.) However, for periodsranging from 13 years to 28 years, this group of managersunderperformed the market between 7.7% and 42% of theyears. Six of the seven investment managers underperformedthe market between 28% and 42% of the years. In today’senvironment, they would have lost many of their clientsduring their periods of underperformance. Longer term, itwould have been the wrong decision to fire any of thosemoney managers. In examining the seven long-terminvestment records, unfavorable investment results ascompared to either index did not predict the future favorablecomparative investment results that occurred, and favorableinvestment results in comparison to the DJIA or the S&P 500were not always followed by future favorable comparativeresults. Stretches of consecutive annual underperformanceranged from one to six years.
Mr. Shahan concluded:Unfortunately, there is no way to distinguish between apoor three-year stretch for a manager who will do wellover 15 years, from a poor three-year stretch for amanager who will continue to do poorly. Nor is there anyreason to believe that a manager who does well from theoutset cannot continue to do well, and consistently.
II-18

Tweedy, Browne International Value Fund II – Currency Unhedged
Portfolio of InvestmentsMarch 31, 2022
Shares Value*
COMMON STOCKS—96.7%
Belgium—0.3%79,510 Fagron NV . . . . . . . . . . . . . . . . . . . . . . . . . . . . . . . $1,457,028
Canada—1.2%3,500 E-L Financial Corp., Ltd. . . . . . . . . . . . . . . . . . . . . 2,474,280
21,490 Lassonde Industries, Inc., Class A . . . . . . . . . . . . . . 2,453,61647,125 Winpak, Ltd. . . . . . . . . . . . . . . . . . . . . . . . . . . . . . 1,448,781
6,376,677
China—6.3%1,232,000 A-Living Smart City Services Co., Ltd. . . . . . . . . . 1,706,102
682,980 Alibaba Group Holding, Ltd.(a) . . . . . . . . . . . . . . . . 9,322,693340,680 Baidu, Inc., Class A(a) . . . . . . . . . . . . . . . . . . . . . . . 6,014,010
6,681,815 Dali Foods Group Co., Ltd. . . . . . . . . . . . . . . . . . . . 3,486,6761,004,050 Haitian International Holdings, Ltd. . . . . . . . . . . . . 2,589,693
4,150 JD.com, Inc., Class A(a) . . . . . . . . . . . . . . . . . . . . . . 117,950578,670 Shanghai Mechanical and Electrical Industry Co.,
Ltd., Class A . . . . . . . . . . . . . . . . . . . . . . . . . . . . 1,187,947357,122 Shanghai Mechanical and Electrical Industry Co.,
Ltd., Class B . . . . . . . . . . . . . . . . . . . . . . . . . . . . 440,27687,160 Tencent Holdings, Ltd. . . . . . . . . . . . . . . . . . . . . . . 4,018,558
1,173,000 Times Neighborhood Holdings, Ltd. . . . . . . . . . . . . 343,0552,729,475 Uni-President China Holdings, Ltd. . . . . . . . . . . . . 2,369,1821,908,970 WH Group, Ltd. . . . . . . . . . . . . . . . . . . . . . . . . . . . 1,199,039
32,795,181
Finland—0.4%157,170 Kemira Oyj . . . . . . . . . . . . . . . . . . . . . . . . . . . . . . . 2,068,103
France—12.7%758,553 Bollore SE . . . . . . . . . . . . . . . . . . . . . . . . . . . . . . . 3,995,09432,355 Cie Generale des Etablissements Michelin . . . . . . . 4,409,973
342,430 Rubis SCA . . . . . . . . . . . . . . . . . . . . . . . . . . . . . . . 10,123,232128,602 Safran SA . . . . . . . . . . . . . . . . . . . . . . . . . . . . . . . . 15,228,619382,960 SCOR SE . . . . . . . . . . . . . . . . . . . . . . . . . . . . . . . . 12,385,491517,117 Tarkett SA(a) . . . . . . . . . . . . . . . . . . . . . . . . . . . . . 7,330,217250,808 TotalEnergies SE . . . . . . . . . . . . . . . . . . . . . . . . . . 12,764,193
66,236,819
Germany—7.7%200,055 BASF SE . . . . . . . . . . . . . . . . . . . . . . . . . . . . . . . . 11,481,294226,525 Fresenius SE & Co., KGaA . . . . . . . . . . . . . . . . . . . 8,365,31752,550 Henkel AG & Co., KGaA . . . . . . . . . . . . . . . . . . . 3,488,61248,199 Krones AG . . . . . . . . . . . . . . . . . . . . . . . . . . . . . . . 4,026,58913,543 Muenchener Rueckversicherungs AG,
Registered . . . . . . . . . . . . . . . . . . . . . . . . . . . . . . 3,641,52895,262 Norma Group SE . . . . . . . . . . . . . . . . . . . . . . . . . . 2,751,18829,235 Rheinmetall AG . . . . . . . . . . . . . . . . . . . . . . . . . . . 6,215,110
39,969,638
Hong Kong—1.9%1,663,100 Chow Sang Sang Holdings International, Ltd. . . . . 1,919,388
621,500 CK Hutchison Holdings, Ltd. . . . . . . . . . . . . . . . . . 4,545,7664,870,000 Emperor Entertainment Hotel, Ltd. . . . . . . . . . . . . 427,293
734,000 Hang Lung Group, Ltd. . . . . . . . . . . . . . . . . . . . . . 1,552,30945,710 Luk Fook Holdings International, Ltd. . . . . . . . . . . 110,873
Shares Value*
Hong Kong (continued)109,796 Miramar Hotel & Investment . . . . . . . . . . . . . . . . $175,214
1,580,000 TAI Cheung Holdings, Ltd. . . . . . . . . . . . . . . . . . 978,4979,709,340
Italy—1.1%129,036 Buzzi Unicem SpA . . . . . . . . . . . . . . . . . . . . . . . . 2,401,647300,592 Iveco Group NV(a) . . . . . . . . . . . . . . . . . . . . . . . . 1,975,09166,455 SOL SpA . . . . . . . . . . . . . . . . . . . . . . . . . . . . . . . 1,216,331
5,593,069
Japan—5.1%166,700 ADEKA Corp. . . . . . . . . . . . . . . . . . . . . . . . . . . . 3,672,431445,200 Astellas Pharma, Inc. . . . . . . . . . . . . . . . . . . . . . . 6,977,122111,200 Fuji Seal International, Inc. . . . . . . . . . . . . . . . . . 1,524,955
6,000 Fukuda Denshi Co., Ltd. . . . . . . . . . . . . . . . . . . . . 384,479111,630 Inaba Denki Sangyo Co., Ltd. . . . . . . . . . . . . . . . . 2,270,68220,600 Kamigumi Co., Ltd. . . . . . . . . . . . . . . . . . . . . . . . 370,89488,700 Konishi Co., Ltd. . . . . . . . . . . . . . . . . . . . . . . . . . 1,135,698
288,625 Kuraray Co., Ltd. . . . . . . . . . . . . . . . . . . . . . . . . . 2,491,95333,045 Okamoto Industries, Inc. . . . . . . . . . . . . . . . . . . . 1,058,12967,300 Shizuoka Gas Co., Ltd. . . . . . . . . . . . . . . . . . . . . . 469,957
108,745 Sumitomo Heavy Industries, Ltd. . . . . . . . . . . . . . 2,499,48544,060 Taikisha, Ltd. . . . . . . . . . . . . . . . . . . . . . . . . . . . . 1,098,87347,965 Transcosmos, Inc.(a) . . . . . . . . . . . . . . . . . . . . . . . 1,249,367
Miscellaneous Security(b) . . . . . . . . . . . . . . . . . . . 1,427,24526,631,270
Mexico—3.4%120,800 Coca-Cola FEMSA SA de CV, Sponsored
ADR . . . . . . . . . . . . . . . . . . . . . . . . . . . . . . . . 6,637,960789,063 Industrias Bachoco SAB de CV, Class B . . . . . . . . 3,076,404
2,625,871 Megacable Holdings SAB de CV . . . . . . . . . . . . . 7,900,52417,614,888
Netherlands—1.8%37,400 Heineken NV . . . . . . . . . . . . . . . . . . . . . . . . . . . . 3,597,24971,375 Heineken Holding NV . . . . . . . . . . . . . . . . . . . . . 5,621,228
9,218,477
Philippines—0.3%6,997,100 Alliance Global Group, Inc. . . . . . . . . . . . . . . . . . 1,690,212
Singapore—4.4%467,100 DBS Group Holdings, Ltd. . . . . . . . . . . . . . . . . . . 12,257,146461,100 United Overseas Bank, Ltd. . . . . . . . . . . . . . . . . . 10,804,762
23,061,908
South Korea—2.4%132,823 Hankook & Co., Ltd. . . . . . . . . . . . . . . . . . . . . . . 1,596,38617,345 Hyundai Mobis Co., Ltd. . . . . . . . . . . . . . . . . . . . 3,057,06737,361 Kangnam Jevisco Co., Ltd. . . . . . . . . . . . . . . . . . . 790,94789,851 LG Corp. . . . . . . . . . . . . . . . . . . . . . . . . . . . . . . . 5,642,47926,877 LX Holdings Corp.(a) . . . . . . . . . . . . . . . . . . . . . . . 212,362
Miscellaneous Security(b) . . . . . . . . . . . . . . . . . . . 1,234,69312,533,934
Sweden—3.0%38,380 Autoliv, Inc. . . . . . . . . . . . . . . . . . . . . . . . . . . . . . 2,933,767
317,975 SKF AB, Class B . . . . . . . . . . . . . . . . . . . . . . . . . . 5,231,065323,568 Trelleborg AB, Class B . . . . . . . . . . . . . . . . . . . . . 7,558,097
15,722,929
SEE NOTES TO FINANCIAL STATEMENTSII-19

Tweedy, Browne International Value Fund II – Currency Unhedged
Portfolio of InvestmentsMarch 31, 2022
Shares Value*
Switzerland—12.0%135,665 Nestlé SA, Registered . . . . . . . . . . . . . . . . . . . . . . $17,711,81969,216 Novartis AG, Registered . . . . . . . . . . . . . . . . . . . . 6,101,6725,015 Phoenix Mecano AG . . . . . . . . . . . . . . . . . . . . . . 2,129,910
45,290 Roche Holding AG . . . . . . . . . . . . . . . . . . . . . . . 17,993,52125,789 TX Group AG(a) . . . . . . . . . . . . . . . . . . . . . . . . . . 4,311,50428,434 Zurich Insurance Group AG . . . . . . . . . . . . . . . . . 14,101,541
62,349,967
Thailand—0.9%1,220,100 Bangkok Bank Public Co., Ltd., NVDR . . . . . . . . 4,993,872
United Kingdom—19.1%830,013 Babcock International Group plc(a) . . . . . . . . . . . . 3,532,224
1,165,123 BAE Systems plc . . . . . . . . . . . . . . . . . . . . . . . . . . 10,967,1901,320,447 CNH Industrial NV . . . . . . . . . . . . . . . . . . . . . . . 20,918,400
352,603 Diageo plc . . . . . . . . . . . . . . . . . . . . . . . . . . . . . . . 17,926,484618,690 GlaxoSmithKline plc . . . . . . . . . . . . . . . . . . . . . . 13,417,138
1,075,730 Inchcape plc . . . . . . . . . . . . . . . . . . . . . . . . . . . . . 9,434,3281,504,280 Johnson Service Group plc(a) . . . . . . . . . . . . . . . . 2,325,736
744,541 Lookers plc(a) . . . . . . . . . . . . . . . . . . . . . . . . . . . . 900,946713,908 Standard Chartered plc . . . . . . . . . . . . . . . . . . . . . 4,749,751809,785 Tesco plc . . . . . . . . . . . . . . . . . . . . . . . . . . . . . . . 2,938,365179,337 Unilever plc . . . . . . . . . . . . . . . . . . . . . . . . . . . . . 8,152,247
2,741,248 Vertu Motors plc . . . . . . . . . . . . . . . . . . . . . . . . . 2,338,803924,116 Vivo Energy plc . . . . . . . . . . . . . . . . . . . . . . . . . . 1,654,083
99,255,695
United States—12.7%6,915 AutoZone, Inc.(a) . . . . . . . . . . . . . . . . . . . . . . . . . 14,138,271
41,700 Berkshire Hathaway, Inc., Class B(a) . . . . . . . . . . . 14,716,347199,870 Cisco Systems, Inc. . . . . . . . . . . . . . . . . . . . . . . . . 11,144,75156,475 FMC Corp. . . . . . . . . . . . . . . . . . . . . . . . . . . . . . . 7,430,416
155,987 Ionis Pharmaceuticals, Inc.(a) . . . . . . . . . . . . . . . . 5,777,75871,820 Johnson & Johnson . . . . . . . . . . . . . . . . . . . . . . . 12,728,659
65,936,202
TOTAL COMMON STOCKS(Cost $407,945,009) . . . . . . . . . . . . . . . . . . . . . . . . . . . . . . . 503,215,209
Shares Value*
PREFERRED STOCKS—0.5%
Chile—0.3%940,000 Embotelladora Andina SA, Class A . . . . . . . . . . . $1,753,679
Germany—0.2%29,000 Jungheinrich AG . . . . . . . . . . . . . . . . . . . . . . . . . 844,628
648 KSB AG . . . . . . . . . . . . . . . . . . . . . . . . . . . . . . . . 274,6291,119,257
TOTAL PREFERRED STOCKS(Cost $3,455,379) . . . . . . . . . . . . . . . . . . . . . . . . . . . . . . . . . 2,872,936
REGISTERED INVESTMENT COMPANY—2.4%12,333,052 Dreyfus Government Securities Cash
Management – Institutional Shares 0.05%(c)
(Cost $12,333,052) . . . . . . . . . . . . . . . . . . . . . . 12,333,052
INVESTMENTS IN SECURITIES(Cost $423,733,440) . . . . . . . . . . . . . . . . . . 99.6% 518,421,197
OTHER ASSETSAND LIABILITIES (Net) . . . . . . . . . . . . . . 0.4 2,102,424
NET ASSETS . . . . . . . . . . . . . . . . . . . . . . . . . . 100.0% $520,523,621
* See Note 2 in Notes to Financial Statements.(a) Non-income producing security.(b) Represents one or more issuers where disclosure may be disadvantageous to the Fund’s
accumulation or disposition program. The aggregate amount of $2,661,938 represents0.5% of the net assets of the Fund.
(c) Rate disclosed is the 7-day yield at March 31, 2022.
Abbreviations:ADR — American Depositary Receipt
NVDR — Non-Voting Depositary Receipt
SEE NOTES TO FINANCIAL STATEMENTSII-20

Tweedy, Browne International Value Fund II – Currency Unhedged
Sector DiversificationMarch 31, 2022 (Unaudited)
Sector DiversificationPercentage ofNet Assets
COMMON STOCKSCapital Goods . . . . . . . . . . . . . . . . . . . . . . . . . . . . . . . . . . . . . . . . . . 20.3%Pharmaceuticals, Biotechnology & Life Sciences . . . . . . . . . . . . . . . . 12.1Insurance . . . . . . . . . . . . . . . . . . . . . . . . . . . . . . . . . . . . . . . . . . . . . . 9.1Retailing . . . . . . . . . . . . . . . . . . . . . . . . . . . . . . . . . . . . . . . . . . . . . . 7.3Materials . . . . . . . . . . . . . . . . . . . . . . . . . . . . . . . . . . . . . . . . . . . . . . 7.1Food . . . . . . . . . . . . . . . . . . . . . . . . . . . . . . . . . . . . . . . . . . . . . . . . . . 6.6Beverage . . . . . . . . . . . . . . . . . . . . . . . . . . . . . . . . . . . . . . . . . . . . . . 6.5Banks . . . . . . . . . . . . . . . . . . . . . . . . . . . . . . . . . . . . . . . . . . . . . . . . . 6.2Media . . . . . . . . . . . . . . . . . . . . . . . . . . . . . . . . . . . . . . . . . . . . . . . . . 3.1Technology Hardware & Equipment . . . . . . . . . . . . . . . . . . . . . . . . . 2.6Energy . . . . . . . . . . . . . . . . . . . . . . . . . . . . . . . . . . . . . . . . . . . . . . . . 2.5Household & Personal Products . . . . . . . . . . . . . . . . . . . . . . . . . . . . . 2.2Software & Services . . . . . . . . . . . . . . . . . . . . . . . . . . . . . . . . . . . . . . 2.2Utilities . . . . . . . . . . . . . . . . . . . . . . . . . . . . . . . . . . . . . . . . . . . . . . . 2.0Automobiles & Components . . . . . . . . . . . . . . . . . . . . . . . . . . . . . . . 2.0Health Care Equipment & Services . . . . . . . . . . . . . . . . . . . . . . . . . . 2.0Commercial Services & Supplies . . . . . . . . . . . . . . . . . . . . . . . . . . . . 1.1Real Estate . . . . . . . . . . . . . . . . . . . . . . . . . . . . . . . . . . . . . . . . . . . . . 0.9Consumer Durables & Apparel . . . . . . . . . . . . . . . . . . . . . . . . . . . . . . 0.4Diversified Financials . . . . . . . . . . . . . . . . . . . . . . . . . . . . . . . . . . . . . 0.3Consumer Services . . . . . . . . . . . . . . . . . . . . . . . . . . . . . . . . . . . . . . . 0.1Transportation . . . . . . . . . . . . . . . . . . . . . . . . . . . . . . . . . . . . . . . . . . 0.1Total Common Stocks . . . . . . . . . . . . . . . . . . . . . . . . . . . . . . . . . . . 96.7Preferred Stocks . . . . . . . . . . . . . . . . . . . . . . . . . . . . . . . . . . . . . . . . 0.5Registered Investment Company . . . . . . . . . . . . . . . . . . . . . . . . . . . 2.4Other Assets and Liabilities (Net) . . . . . . . . . . . . . . . . . . . . . . . . . . 0.4Net Assets . . . . . . . . . . . . . . . . . . . . . . . . . . . . . . . . . . . . . . . . . . . . . 100.0%
Portfolio CompositionMarch 31, 2022 (Unaudited)
United States 13%United States 13%
France 13%France 13%
United Kingdom 19%United Kingdom 19%
Japan 5%Japan 5%
Singapore 4%Singapore 4%
Money Market FundsMoney Market Fundsand Other Assets andand Other Assets andLiabilities (Net) 3%Liabilities (Net) 3%
OtherOtherCountriesCountries(a)(a) 17%
Switzerland 12%Switzerland 12%
China 6%China 6%
Germany 8%Germany 8%
(a)(a) "Other Countries” include Belgium, Canada, Chile, Finland, "Other Countries” include Belgium, Canada, Chile, Finland, Germany, Hong Kong, Italy, Mexico, Netherlands, Philippines, Germany, Hong Kong, Italy, Mexico, Netherlands, Philippines, South Korea, Sweden and Thailand South Korea, Sweden and Thailand
SEE NOTES TO FINANCIAL STATEMENTSII-21

Tweedy, BrowneValue FundPortfolio Highlights as of March 31, 2022 (Unaudited)
Hypothetical Illustration of $10,000 Invested in Tweedy, BrowneValue Fund vs. the MSCI World Index (Hedged to US$)
and S&P 500/MSCI World Index (Hedged to US$)12/8/93 through 3/31/22
$10,000$0
$20,000
$30,000
$40,000
$90,000
$80,000
$70,000
$60,000
$50,000
$110,000
$100,000
$120,000 $116,920
$97,127
$86,943
Dec
199
3
Mar
199
4
Mar
199
5
Mar
199
6
Mar
199
7
Mar
199
8
Mar
199
9
Mar
200
0
Mar
200
1
Mar
200
2
Mar
200
3
Mar
200
4
Mar
200
5
Mar
200
6
Mar
200
7
Mar
200
8
Mar
200
9
Mar
201
0
Mar
201
1
Mar
201
2
Mar
201
3
Mar
201
4
Mar
201
6
Mar
201
8
Mar
202
0
Mar
201
9
Mar
202
2
Mar
202
1
Mar
201
7
Mar
201
5
Tweedy, Browne Value FundMSCI World Index (Hedged to US$)S&P 500/MSCI World Index (Hedged to US$)
Average Annual Total Returns – For Periods Ended March 31, 2022
Tweedy, BrowneValue Fund
MSCI World Index(Hedged to US$)
S&P 500/MSCI WorldIndex (Hedged to US$)
1 Year 5.35% 11.87% 11.87%5 Years 6.10 12.94 12.9410 Years 7.13 12.27 12.27Since Inception(12/8/93) 7.94 8.36 9.07Total Annual Fund Operating Expense Ratio as of 3/31/21, as disclosed in Fund’s most recent prospectus: 1.41% (gross),1.38% (net).†
Total Annual Fund Operating Expense Ratio as of 3/31/22: 1.39% (gross), 1.34% (net).†
The preceding performance data represents past performance and is not a guarantee of future results. Total return and principal value of an investment will fluctuate so that aninvestor’s shares, when redeemed, may be worth more or less than their original cost. The graph and table do not reflect the deduction of taxes that a shareholder would pay onFund distributions or the redemption of Fund shares. Current performance may be lower or higher than the performance data shown. Results are annualized for all periods greaterthan one year. Please visit www.tweedy.com to obtain performance data that is current to the most recent month end.
The Fund does not impose any front-end or deferred sales charges. The expense ratios shown above reflect the inclusion of acquired fund fees and expenses (i.e., the fees andexpenses attributable to investing cash balances in money market funds) and may differ from those shown in the Fund’s financial statements.
† Tweedy, Browne Company LLC has voluntarily agreed, effective December 1, 2017 through at least July 31, 2023, to waive a portion of the Fund’s investment advisory fees and/or reimburse aportion of the Fund’s expenses to the extent necessary to keep the Fund’s expense ratio in line with the expense ratio of the Tweedy, Browne International Value Fund. (For purposes of this calculation,the Fund’s acquired fund fees and expenses, brokerage costs, interest, taxes and extraordinary expenses are disregarded, and the Fund’s expense ratio is rounded to two decimal points.) The Fund’sperformance data shown above would have been lower had certain fees and expenses not been waived and/or reimbursed during certain periods.
The MSCI World Index is a free float-adjusted market capitalization weighted index that is designed to measure the equity market performance of developed markets. The MSCI World Index (Hedgedto US$) consists of the results of the MSCI World Index with its foreign currency exposure hedged 100% back into U.S. dollars. The MSCI World Index (Hedged to US$) accounts for interest ratedifferentials in forward currency exchange rates. Results for each index are inclusive of dividends and net of foreign withholding taxes. The inception date for the Fund is December 8, 1993. Prior to2004, information with respect to the MSCI World indexes used was available at month end only; therefore the closest month end to the Fund’s inception date, November 30, 1993, was used.
The S&P 500 Index is a market capitalization weighted index composed of 500 widely held common stocks. The index is generally considered representative of U.S. large capitalization stocks. The S&P500/MSCI World Index (Hedged to US$) is a combination of the S&P 500 Index and the MSCI World Index (Hedged to US$), linked together by Tweedy, Browne, and represents the performanceof the S&P 500 Index for the periods 12/8/93 – 12/31/06 and the performance of the MSCI World Index (Hedged to US$) beginning 1/1/07 and thereafter (beginning December 2006, the Fund waspermitted to invest more significantly in non-U.S. securities).
Indexes are unmanaged, and the figures for the indexes shown include reinvestment of dividends and capital gains distributions and do not reflect any fees or expenses. Investors cannot invest directly in an index.
II-22

Tweedy, Browne Value Fund
Perspective on Assessing Investment Results (Unaudited)
March 31, 2022
In accordance with rules and guidelines set out by theUnited States Securities and Exchange Commission, we haveprovided a comparison of the historical investment results ofTweedy, Browne Value Fund to the results of the MSCIWorld Index (Hedged to US$) and the S&P 500/MSCIWorld Index (Hedged to US$). The S&P 500/MSCI WorldIndex (Hedged to US$) is a combination of the S&P 500 andthe MSCI World Index (Hedged to US$), linked together bythe Investment Adviser, and represents the performance ofthe S&P 500 for the periods 12/8/93 – 12/31/06, and theperformance of the MSCI World Index (Hedged to US$)beginning 1/1/07 and thereafter (beginning December 2006,the Fund was permitted to invest more significantly in non-U.S. securities). Although we believe this comparison may beuseful, the historical results of the S&P 500 and the MSCIWorld Index (hedged to US$) in large measure represent theinvestment results of stocks that we do not own. Anyportfolio that does not own exactly the same stocks in exactlythe same proportions as the index to which the particularportfolio is being compared is not likely to have the sameresults as the index. The investment behavior of a diversifiedportfolio of undervalued stocks tends to be correlated to theinvestment behavior of a broad index; i.e., when the index isup, probably more than one-half of the stocks in the entireuniverse of public companies that are included in the sameindex will be up, albeit in greater or lesser percentages thanthe index. Similarly, when the index declines, probably morethan one-half of the stocks in the entire universe of publiccompanies that are included in the index will be down ingreater or lesser percentages than the index. But it is almost amathematical truth that “different stocks equal differentresults.”
We believe that favorable or unfavorable historicalinvestment results in comparison to an index are notnecessarily predictive of future comparative investmentresults. In 1986, V. Eugene Shahan, a Columbia University
Business School alumnus and portfolio manager at U.S. Trust,wrote Are Short-Term Performance and Value InvestingMutually Exclusive? In this article, Mr. Shahan analyzed theinvestment performance of seven money managers, aboutwhom Warren Buffett wrote in his article, The Superinvestorsof Graham and Doddsville. Over long periods of time, the sevenmanagers significantly outperformed the market as measuredby the Dow Jones Industrial Average (the DJIA) or theS&P 500 by between 7.7% and 16.5% annually. (The goal ofmost institutional money managers is to outperform themarket by 2% to 3%.) However, for periods ranging from 13years to 28 years, this group of managers underperformed themarket between 7.7% and 42% of the years. Six of the seveninvestment managers underperformed the market between28% and 42% of the years. In today’s environment, theywould have lost many of their clients during their periods ofunderperformance. Longer term, it would have been thewrong decision to fire any of those money managers. Inexamining the seven long-term investment records,unfavorable investment results as compared to either indexdid not predict the future favorable comparative investmentresults that occurred, and favorable investment results incomparison to the DJIA or the S&P 500 were not alwaysfollowed by future favorable comparative results. Stretches ofconsecutive annual underperformance ranged from one to sixyears.
Mr. Shahan concluded:Unfortunately, there is no way to distinguish between apoor three-year stretch for a manager who will do wellover 15 years, from a poor three-year stretch for amanager who will continue to do poorly. Nor is there anyreason to believe that a manager who does well from theoutset cannot continue to do well, and consistently.
II-23

Tweedy, Browne Value Fund
Portfolio of InvestmentsMarch 31, 2022
Shares Value*
COMMON STOCKS—95.3%
Belgium—0.3%64,487 Fagron NV . . . . . . . . . . . . . . . . . . . . . . . . . . . . . . . $1,181,730
Canada—0.7%18,010 Lassonde Industries, Inc., Class A . . . . . . . . . . . . . . 2,056,28838,475 Winpak, Ltd. . . . . . . . . . . . . . . . . . . . . . . . . . . . . . 1,182,851
3,239,139
China—5.5%652,456 A-Living Smart City Services Co., Ltd. . . . . . . . . . 903,536452,610 Alibaba Group Holding, Ltd.(a) . . . . . . . . . . . . . . . . 6,178,137231,680 Baidu, Inc., Class A(a) . . . . . . . . . . . . . . . . . . . . . . . 4,089,838
3,283,500 Dali Foods Group Co., Ltd. . . . . . . . . . . . . . . . . . . . 1,713,382797,375 Haitian International Holdings, Ltd. . . . . . . . . . . . . 2,056,628
3,433 JD.com, Inc., Class A(a) . . . . . . . . . . . . . . . . . . . . . . 97,572419,200 Shanghai Mechanical and Electrical Industry Co.,
Ltd., Class A . . . . . . . . . . . . . . . . . . . . . . . . . . . . 860,572345,561 Shanghai Mechanical and Electrical Industry Co.,
Ltd., Class B . . . . . . . . . . . . . . . . . . . . . . . . . . . . 426,023110,830 Tencent Holdings, Ltd. . . . . . . . . . . . . . . . . . . . . . . 5,109,875
2,349,905 Uni-President China Holdings, Ltd. . . . . . . . . . . . . 2,039,7161,531,400 WH Group, Ltd. . . . . . . . . . . . . . . . . . . . . . . . . . . . 961,884
24,437,163
Finland—0.5%170,196 Kemira Oyj . . . . . . . . . . . . . . . . . . . . . . . . . . . . . . . 2,239,504
France—8.7%206,517 Bollore SE . . . . . . . . . . . . . . . . . . . . . . . . . . . . . . . 1,087,669259,040 Rubis SCA . . . . . . . . . . . . . . . . . . . . . . . . . . . . . . . 7,657,98066,120 Safran SA . . . . . . . . . . . . . . . . . . . . . . . . . . . . . . . . 7,829,709
235,186 SCOR SE . . . . . . . . . . . . . . . . . . . . . . . . . . . . . . . . 7,606,262150,328 Tarkett SA(a) . . . . . . . . . . . . . . . . . . . . . . . . . . . . . 2,130,924236,380 TotalEnergies SE . . . . . . . . . . . . . . . . . . . . . . . . . . 12,029,920
38,342,464
Germany—6.5%92,687 BASF SE . . . . . . . . . . . . . . . . . . . . . . . . . . . . . . . . 5,319,371
195,680 Fresenius SE & Co., KGaA . . . . . . . . . . . . . . . . . . . 7,226,24584,400 Henkel AG & Co., KGaA . . . . . . . . . . . . . . . . . . . 5,603,02241,893 Krones AG . . . . . . . . . . . . . . . . . . . . . . . . . . . . . . . 3,499,78076,131 Norma Group SE . . . . . . . . . . . . . . . . . . . . . . . . . . 2,198,68023,478 Rheinmetall AG . . . . . . . . . . . . . . . . . . . . . . . . . . . 4,991,222
28,838,320
Hong Kong—1.2%1,046,000 Chow Sang Sang Holdings International, Ltd. . . . . 1,207,191
476,000 CK Hutchison Holdings, Ltd. . . . . . . . . . . . . . . . . . 3,481,552214,000 Luk Fook Holdings International, Ltd. . . . . . . . . . . 519,073
5,207,816
Italy—0.7%102,790 Buzzi Unicem SpA . . . . . . . . . . . . . . . . . . . . . . . . . 1,913,150178,334 Iveco Group NV(a) . . . . . . . . . . . . . . . . . . . . . . . . . 1,171,774
3,084,924
Shares Value*
Japan—2.8%197,135 Astellas Pharma, Inc. . . . . . . . . . . . . . . . . . . . . . . . $3,089,47741,700 Fuji Seal International, Inc. . . . . . . . . . . . . . . . . . . 571,85836,595 Inaba Denki Sangyo Co., Ltd. . . . . . . . . . . . . . . . . . 744,384
239,905 Kuraray Co., Ltd. . . . . . . . . . . . . . . . . . . . . . . . . . . 2,071,31028,005 Okamoto Industries, Inc. . . . . . . . . . . . . . . . . . . . . 896,74489,395 Sumitomo Heavy Industries, Ltd. . . . . . . . . . . . . . . 2,054,72834,620 Taikisha, Ltd. . . . . . . . . . . . . . . . . . . . . . . . . . . . . . 863,43638,880 Transcosmos, Inc.(a) . . . . . . . . . . . . . . . . . . . . . . . . 1,012,726
Miscellaneous Security(b) . . . . . . . . . . . . . . . . . . . . 1,213,95712,518,620
Mexico—2.4%81,335 Coca-Cola FEMSA SA de CV, Sponsored
ADR(c) . . . . . . . . . . . . . . . . . . . . . . . . . . . . . . . . 4,469,358639,907 Industrias Bachoco SAB de CV, Class B . . . . . . . . 2,494,874
1,222,747 Megacable Holdings SAB de CV . . . . . . . . . . . . . . 3,678,91010,643,142
Netherlands—2.3%128,033 Heineken Holding NV . . . . . . . . . . . . . . . . . . . . . . 10,083,400
Philippines—0.4%6,542,900 Alliance Global Group, Inc. . . . . . . . . . . . . . . . . . . 1,580,496
Singapore—2.1%386,517 United Overseas Bank, Ltd. . . . . . . . . . . . . . . . . . . 9,057,090
South Korea—1.2%70,858 LG Corp. . . . . . . . . . . . . . . . . . . . . . . . . . . . . . . . . 4,449,753
Miscellaneous Security(b) . . . . . . . . . . . . . . . . . . . . 994,1275,443,880
Sweden—3.0%33,021 Autoliv, Inc. . . . . . . . . . . . . . . . . . . . . . . . . . . . . . . 2,524,125
256,145 SKF AB, Class B . . . . . . . . . . . . . . . . . . . . . . . . . . . 4,213,889271,905 Trelleborg AB, Class B . . . . . . . . . . . . . . . . . . . . . . 6,351,321
13,089,335
Switzerland—8.1%118,780 Nestlé SA, ADR . . . . . . . . . . . . . . . . . . . . . . . . . . . 15,453,27850,749 Novartis AG, Registered . . . . . . . . . . . . . . . . . . . . . 4,473,73130,803 Roche Holding AG . . . . . . . . . . . . . . . . . . . . . . . . 12,237,8996,692 Zurich Insurance Group AG . . . . . . . . . . . . . . . . . . 3,318,826
35,483,734
United Kingdom—11.6%529,590 BAE Systems plc . . . . . . . . . . . . . . . . . . . . . . . . . . . 4,984,980891,670 CNH Industrial NV . . . . . . . . . . . . . . . . . . . . . . . . 14,125,75562,715 Diageo plc, Sponsored ADR . . . . . . . . . . . . . . . . . . 12,739,925
343,309 GlaxoSmithKline plc . . . . . . . . . . . . . . . . . . . . . . . 7,445,125282,425 Inchcape plc . . . . . . . . . . . . . . . . . . . . . . . . . . . . . . 2,476,913723,592 Johnson Service Group plc(a) . . . . . . . . . . . . . . . . . 1,118,730185,395 Unilever plc, Sponsored ADR . . . . . . . . . . . . . . . . 8,448,450
51,339,878
SEE NOTES TO FINANCIAL STATEMENTSII-24

Tweedy, Browne Value Fund
Portfolio of InvestmentsMarch 31, 2022
Shares Value*
United States—37.3%46,230 3M Co. . . . . . . . . . . . . . . . . . . . . . . . . . . . . . . . . . $6,882,7226,150 Alphabet, Inc., Class A(a) . . . . . . . . . . . . . . . . . . . 17,105,3031,465 Alphabet, Inc., Class C(a) . . . . . . . . . . . . . . . . . . . 4,091,7306,180 AutoZone, Inc.(a) . . . . . . . . . . . . . . . . . . . . . . . . . 12,635,504
76,760 Bank of America Corp. . . . . . . . . . . . . . . . . . . . . . 3,164,04776,570 Bank of New York Mellon Corp./The . . . . . . . . . . 3,800,169
60 Berkshire Hathaway, Inc., Class A(a) . . . . . . . . . . . 31,735,2608,810 Carlisle Cos., Inc. . . . . . . . . . . . . . . . . . . . . . . . . . 2,166,555
79,420 Cisco Systems, Inc. . . . . . . . . . . . . . . . . . . . . . . . . 4,428,459140,841 Comcast Corp., Class A . . . . . . . . . . . . . . . . . . . . 6,594,17612,989 Concentrix Corp. . . . . . . . . . . . . . . . . . . . . . . . . . 2,163,448
107,535 Enterprise Products Partners LP . . . . . . . . . . . . . . 2,775,47845,731 FMC Corp. . . . . . . . . . . . . . . . . . . . . . . . . . . . . . . 6,016,828
125,210 Fox Corp., Class B . . . . . . . . . . . . . . . . . . . . . . . . 4,542,619150,480 Intel Corp. . . . . . . . . . . . . . . . . . . . . . . . . . . . . . . 7,457,789163,740 Ionis Pharmaceuticals, Inc.(a) . . . . . . . . . . . . . . . . 6,064,93066,608 Johnson & Johnson . . . . . . . . . . . . . . . . . . . . . . . 11,804,93633,708 National Western Life Group, Inc., Class A . . . . . 7,092,16324,140 Thor Industries, Inc. . . . . . . . . . . . . . . . . . . . . . . . 1,899,81850,625 Truist Financial Corp. . . . . . . . . . . . . . . . . . . . . . . 2,870,43823,825 Vertex Pharmaceuticals, Inc.(a) . . . . . . . . . . . . . . . 6,217,610
263,163 Wells Fargo & Co. . . . . . . . . . . . . . . . . . . . . . . . . 12,752,879164,262,861
TOTAL COMMON STOCKS(Cost $249,614,246) . . . . . . . . . . . . . . . . . . . . . . . . . . . . . . . 420,073,496
PREFERRED STOCK—0.2%
Chile—0.2%492,000 Embotelladora Andina SA, Class A
(Cost $918,375) . . . . . . . . . . . . . . . . . . . . . . . . 917,883
Shares Value*
REGISTERED INVESTMENT COMPANY—1.2%5,359,977 Dreyfus Government Securities Cash Management
– Institutional Shares0.05%(d)
(Cost $5,359,977) . . . . . . . . . . . . . . . . . . . . . . . . $5,359,977
FaceValue Value*
U.S. TREASURY BILL—2.1%$9,000,000 0.092%(e) due 06/02/2022(c)
(Cost $8,998,586) . . . . . . . . . . . . . . . . . . . . . . . . 8,994,885
INVESTMENTS IN SECURITIES(Cost $264,891,184) . . . . . . . . . . . . . . . . . . . . . 98.8% 435,346,241
UNREALIZED APPRECIATION ONFORWARD CONTRACTS (Net) . . . . . . . . . . 0.9 4,025,468
OTHER ASSETS AND LIABILITIES (Net) . . . 0.3 1,451,717
NET ASSETS . . . . . . . . . . . . . . . . . . . . . . . . . . . . 100.0% $440,823,426
* See Note 2 in Notes to Financial Statements.(a) Non-income producing security.(b) Represents one or more issuers where disclosure may be disadvantageous to the Fund’s
accumulation or disposition program. The aggregate amount of $2,208,084 represents0.5% of the net assets of the Fund.
(c) This position has been segregated to cover certain open forward contracts. At March 31,2022, liquid assets totaling $13,464,243 have been segregated to cover such open forwardcontracts.
(d) Rate disclosed is the 7-day yield at March 31, 2022.(e) Rate represents annualized yield at date of purchase.
Abbreviations:ADR — American Depositary Receipt
SEE NOTES TO FINANCIAL STATEMENTSII-25

Tweedy, Browne Value Fund
Sector DiversificationMarch 31, 2022 (Unaudited)
Sector DiversificationPercentage ofNet Assets
COMMON STOCKSCapital Goods . . . . . . . . . . . . . . . . . . . . . . . . . . . . . . . . . . . . . . . . . . 17.8%Pharmaceuticals, Biotechnology & Life Sciences . . . . . . . . . . . . . . . . 11.6Insurance . . . . . . . . . . . . . . . . . . . . . . . . . . . . . . . . . . . . . . . . . . . . . . 11.3Food . . . . . . . . . . . . . . . . . . . . . . . . . . . . . . . . . . . . . . . . . . . . . . . . . . 7.7Software & Services . . . . . . . . . . . . . . . . . . . . . . . . . . . . . . . . . . . . . . 7.6Banks . . . . . . . . . . . . . . . . . . . . . . . . . . . . . . . . . . . . . . . . . . . . . . . . . 6.3Beverage . . . . . . . . . . . . . . . . . . . . . . . . . . . . . . . . . . . . . . . . . . . . . . 6.2Retailing . . . . . . . . . . . . . . . . . . . . . . . . . . . . . . . . . . . . . . . . . . . . . . 5.0Materials . . . . . . . . . . . . . . . . . . . . . . . . . . . . . . . . . . . . . . . . . . . . . . 4.6Media . . . . . . . . . . . . . . . . . . . . . . . . . . . . . . . . . . . . . . . . . . . . . . . . . 3.6Energy . . . . . . . . . . . . . . . . . . . . . . . . . . . . . . . . . . . . . . . . . . . . . . . . 3.4Health Care Equipment & Services . . . . . . . . . . . . . . . . . . . . . . . . . . 1.9Utilities . . . . . . . . . . . . . . . . . . . . . . . . . . . . . . . . . . . . . . . . . . . . . . . 1.7Semiconductors & Semiconductor Equipment . . . . . . . . . . . . . . . . . . 1.7Household & Personal Products . . . . . . . . . . . . . . . . . . . . . . . . . . . . . 1.3Technology Hardware & Equipment . . . . . . . . . . . . . . . . . . . . . . . . . 1.0Automobiles & Components . . . . . . . . . . . . . . . . . . . . . . . . . . . . . . . 1.0Diversified Financials . . . . . . . . . . . . . . . . . . . . . . . . . . . . . . . . . . . . . 0.9Consumer Durables & Apparel . . . . . . . . . . . . . . . . . . . . . . . . . . . . . . 0.3Commercial Services & Supplies . . . . . . . . . . . . . . . . . . . . . . . . . . . . 0.2Real Estate . . . . . . . . . . . . . . . . . . . . . . . . . . . . . . . . . . . . . . . . . . . . . 0.2
Total Common Stocks . . . . . . . . . . . . . . . . . . . . . . . . . . . . . . . . . . . 95.3Preferred Stock . . . . . . . . . . . . . . . . . . . . . . . . . . . . . . . . . . . . . . . . . 0.2Registered Investment Company . . . . . . . . . . . . . . . . . . . . . . . . . . . 1.2U.S. Treasury Bill . . . . . . . . . . . . . . . . . . . . . . . . . . . . . . . . . . . . . . . 2.1Unrealized Appreciation on Forward Contracts . . . . . . . . . . . . . . . . 0.9Other Assets and Liabilities (Net) . . . . . . . . . . . . . . . . . . . . . . . . . . 0.3
Net Assets . . . . . . . . . . . . . . . . . . . . . . . . . . . . . . . . . . . . . . . . . . . . . 100.0%
Portfolio CompositionMarch 31, 2022 (Unaudited)
Money Market Funds,Money Market Funds,Treasury bill andTreasury bill andOther Assets andOther Assets andLiabilities (Net)Liabilities (Net)(b)(b) 4%
(a)(a) "Other Countries” include Belgium, Canada, Chile, Finland, Hong Kong, Italy,"Other Countries” include Belgium, Canada, Chile, Finland, Hong Kong, Italy, Mexico, Netherlands, Philippines, Singapore and South Korea Mexico, Netherlands, Philippines, Singapore and South Korea(b)(b) Includes Unrealized Appreciation on Forward Contracts (Net)Includes Unrealized Appreciation on Forward Contracts (Net)
France 9%France 9%
OtherOtherCountriesCountries(a)(a) 11% 11%
Japan 3%Japan 3%
United Kingdom 12%United Kingdom 12%Switzerland 8%Switzerland 8%
China 6%China 6%
Germany 7%Germany 7%
Sweden 3%Sweden 3% United StatesUnited States 37%37%
Schedule of Forward Exchange ContractsMarch 31, 2022
ContractsCounter-
partySettlement
DateContract Value onOrigination Date
Value03/31/22*
UnrealizedAppreciation
(Depreciation)
FORWARD EXCHANGE CONTRACTS TO SELL(a)
2,500,000 Canadian Dollar . . . . . . . . . . . . . . . . . . . . . . . . . . . . . . . . . . . . . . . . . . . . SSB 1/6/23 $(1,949,782) $(2,000,040) $(50,258)700,000,000 Chilean Peso . . . . . . . . . . . . . . . . . . . . . . . . . . . . . . . . . . . . . . . . . . . . . . . SSB 7/28/22 (912,409) (872,129) 40,28018,900,000 Chinese Yuan . . . . . . . . . . . . . . . . . . . . . . . . . . . . . . . . . . . . . . . . . . . . . . SSB 5/27/22 (2,865,069) (2,967,010) (101,941)26,700,000 Chinese Yuan . . . . . . . . . . . . . . . . . . . . . . . . . . . . . . . . . . . . . . . . . . . . . . JPM 1/12/23 (4,098,612) (4,162,589) (63,977)45,000,000 Chinese Yuan . . . . . . . . . . . . . . . . . . . . . . . . . . . . . . . . . . . . . . . . . . . . . . BNY 1/13/23 (6,915,736) (7,015,465) (99,729)20,000,000 Chinese Yuan . . . . . . . . . . . . . . . . . . . . . . . . . . . . . . . . . . . . . . . . . . . . . . SSB 1/17/23 (3,064,251) (3,117,746) (53,495)28,500,000 Chinese Yuan . . . . . . . . . . . . . . . . . . . . . . . . . . . . . . . . . . . . . . . . . . . . . . JPM 2/17/23 (4,406,444) (4,440,155) (33,711)7,000,000 European Union Euro . . . . . . . . . . . . . . . . . . . . . . . . . . . . . . . . . . . . . . . . BNY 5/10/22 (8,546,930) (7,798,870) 748,060
16,000,000 European Union Euro . . . . . . . . . . . . . . . . . . . . . . . . . . . . . . . . . . . . . . . . BNY 5/16/22 (19,436,320) (17,830,661) 1,605,6597,000,000 European Union Euro . . . . . . . . . . . . . . . . . . . . . . . . . . . . . . . . . . . . . . . . BNY 6/21/22 (8,583,330) (7,813,988) 769,3423,700,000 European Union Euro . . . . . . . . . . . . . . . . . . . . . . . . . . . . . . . . . . . . . . . . NTC 10/20/22 (4,316,864) (4,160,163) 156,7015,000,000 European Union Euro . . . . . . . . . . . . . . . . . . . . . . . . . . . . . . . . . . . . . . . . NTC 4/5/23 (5,614,350) (5,689,167) (74,817)7,000,000 Great Britain Pound Sterling . . . . . . . . . . . . . . . . . . . . . . . . . . . . . . . . . . . JPM 7/11/22 (9,674,322) (9,214,519) 459,8034,000,000 Great Britain Pound Sterling . . . . . . . . . . . . . . . . . . . . . . . . . . . . . . . . . . . NTC 7/28/22 (5,447,640) (5,265,810) 181,8306,500,000 Great Britain Pound Sterling . . . . . . . . . . . . . . . . . . . . . . . . . . . . . . . . . . . SSB 1/12/23 (8,777,990) (8,570,209) 207,7815,000,000 Hong Kong Dollar . . . . . . . . . . . . . . . . . . . . . . . . . . . . . . . . . . . . . . . . . . . SSB 4/22/22 (643,975) (638,580) 5,3959,000,000 Hong Kong Dollar . . . . . . . . . . . . . . . . . . . . . . . . . . . . . . . . . . . . . . . . . . . NTC 6/10/22 (1,160,287) (1,150,396) 9,8919,700,000 Hong Kong Dollar . . . . . . . . . . . . . . . . . . . . . . . . . . . . . . . . . . . . . . . . . . . NTC 8/8/22 (1,248,568) (1,241,514) 7,054
15,000,000 Hong Kong Dollar . . . . . . . . . . . . . . . . . . . . . . . . . . . . . . . . . . . . . . . . . . . BNY 8/29/22 (1,926,070) (1,920,753) 5,3177,800,000 Hong Kong Dollar . . . . . . . . . . . . . . . . . . . . . . . . . . . . . . . . . . . . . . . . . . . SSB 3/23/23 (1,000,849) (1,001,452) (603)
165,000,000 Japanese Yen . . . . . . . . . . . . . . . . . . . . . . . . . . . . . . . . . . . . . . . . . . . . . . . SSB 2/2/23 (1,517,032) (1,382,580) 134,452260,000,000 Japanese Yen . . . . . . . . . . . . . . . . . . . . . . . . . . . . . . . . . . . . . . . . . . . . . . . JPM 5/19/23 (2,296,597) (2,197,746) 98,851160,000,000 Japanese Yen . . . . . . . . . . . . . . . . . . . . . . . . . . . . . . . . . . . . . . . . . . . . . . . SSB 6/16/23 (1,426,377) (1,355,858) 70,519400,000,000 Japanese Yen . . . . . . . . . . . . . . . . . . . . . . . . . . . . . . . . . . . . . . . . . . . . . . . JPM 8/10/23 (3,538,570) (3,406,462) 132,10850,000,000 Mexican Peso . . . . . . . . . . . . . . . . . . . . . . . . . . . . . . . . . . . . . . . . . . . . . . JPM 5/26/22 (2,407,724) (2,481,953) (74,229)
SEE NOTES TO FINANCIAL STATEMENTSII-26

Tweedy, Browne Value Fund
Schedule of Forward Exchange ContractsMarch 31, 2022
ContractsCounter-
partySettlement
DateContract Value onOrigination Date
Value03/31/22*
UnrealizedAppreciation
(Depreciation)
FORWARD EXCHANGE CONTRACTS TO SELL(a) (continued)20,000,000 Mexican Peso . . . . . . . . . . . . . . . . . . . . . . . . . . . . . . . . . . . . . . . . . . . BNY 7/1/22 $(929,692) $(986,418) $(56,726)18,500,000 Mexican Peso . . . . . . . . . . . . . . . . . . . . . . . . . . . . . . . . . . . . . . . . . . . SSB 1/6/23 (839,314) (879,273) (39,959)46,000,000 Philippine Peso . . . . . . . . . . . . . . . . . . . . . . . . . . . . . . . . . . . . . . . . . . JPM 11/9/22 (886,833) (878,227) 8,60626,000,000 Philippine Peso . . . . . . . . . . . . . . . . . . . . . . . . . . . . . . . . . . . . . . . . . . SSB 3/23/23 (483,541) (492,976) (9,435)1,800,000 Singapore Dollar . . . . . . . . . . . . . . . . . . . . . . . . . . . . . . . . . . . . . . . . . SSB 9/7/22 (1,337,049) (1,331,380) 5,669
10,500,000 Singapore Dollar . . . . . . . . . . . . . . . . . . . . . . . . . . . . . . . . . . . . . . . . . SSB 1/12/23 (7,744,648) (7,784,660) (40,012)1,100,000,000 South Korean Won . . . . . . . . . . . . . . . . . . . . . . . . . . . . . . . . . . . . . . . JPM 4/28/22 (981,267) (907,064) 74,2034,900,000,000 South Korean Won . . . . . . . . . . . . . . . . . . . . . . . . . . . . . . . . . . . . . . . JPM 3/13/23 (4,056,291) (4,061,218) (4,927)
23,000,000 Swedish Krona . . . . . . . . . . . . . . . . . . . . . . . . . . . . . . . . . . . . . . . . . . NTC 8/12/22 (2,678,623) (2,478,066) 200,55713,500,000 Swedish Krona . . . . . . . . . . . . . . . . . . . . . . . . . . . . . . . . . . . . . . . . . . NTC 2/17/23 (1,499,967) (1,466,366) 33,60137,000,000 Swedish Krona . . . . . . . . . . . . . . . . . . . . . . . . . . . . . . . . . . . . . . . . . . NTC 4/5/23 (3,940,782) (4,027,090) (86,308)8,000,000 Swiss Franc . . . . . . . . . . . . . . . . . . . . . . . . . . . . . . . . . . . . . . . . . . . . . JPM 12/7/22 (8,751,136) (8,827,869) (76,733)
10,000,000 Swiss Franc . . . . . . . . . . . . . . . . . . . . . . . . . . . . . . . . . . . . . . . . . . . . . JPM 12/22/22 (10,984,484) (11,047,835) (63,351)
TOTAL . . . . . . . . . . . . . . . . . . . . . . . . . . . . . . . . . . . . . . . . . . . . . . . . . . . . . . . . . . . . . $(156,889,725) $(152,864,257) $4,025,468
Unrealized Appreciation on Forward Contracts (Net) . . . . . . . . . . . . . . . . . . . . . . . . . . $4,025,468
* See Note 2 in Notes to Financial Statements.(a) Primary risk exposure being hedged against is currency risk.
Counterparty Abbreviations:BNY — The Bank of New York MellonJPM — JPMorgan Chase Bank NA
NTC — Northern Trust CompanySSB — State Street Bank and Trust Company
SEE NOTES TO FINANCIAL STATEMENTSII-27

Tweedy, BrowneWorldwide High Dividend Yield Value FundPortfolio Highlights as of March 31, 2022 (Unaudited)
Hypothetical Illustration of $10,000 Invested inTweedy, Browne Worldwide High Dividend Yield Value Fund vs.
MSCI World Index (in US$) and MSCI World High Dividend Yield Index (in US$)9/5/07 through 3/31/22
Tweedy, Browne Worldwide High Dividend Yield Value FundMSCI World Index (in US$)MSCI World High Dividend Yield Index (in US$)
$4,000
$8,000
$6,000
$10,000
$14,000
$18,000
$16,000
$12,000
$24,000
$22,000
$20,000
Sep
5, 2
007
Sep
30,
2007
Mar
200
8
Sep
2008
Mar
200
9
Sep
2009
Mar
201
0
Sep
2010
Mar
201
1
Sep
2011
Mar
201
2
Sep
2012
Sep
2013
Sep
2014
Mar
201
6
Sep
2016
Mar
201
7
Sep
2017
Mar
201
8
Sep
2018
Sep
2019
Mar
202
0
Sep
2020
Mar
202
1
Mar
202
2
Sep
2021
Mar
201
9
Sep
2015
Mar
201
5
Mar
201
4
Mar
201
3
$26,158
$19,540$18,258
$26,000
$28,000
Average Annual Total Returns – For Periods Ended March 31, 2022
Tweedy, Browne WorldwideHigh Dividend Yield Value Fund
MSCI WorldIndex (in US$)
MSCI World High DividendYield Index (in US$)
1 Year 1.97% 10.12% 9.41%5 Years 5.66 12.42 8.0710 Years 5.40 10.88 8.22Since Inception(9/5/07) 4.22 6.82 4.71Total Annual Fund Operating Expense Ratio as of 3/31/21, as disclosed in Fund’s most recent prospectus: 1.47% (gross),1.39% (net).†
Total Annual Fund Operating Expense Ratios as of 3/31/22: 1.48% (gross), 1.34% (net).†
The preceding performance data represents past performance and is not a guarantee of future results. Total return and principal value of an investment will fluctuate so thatan investor’s shares, when redeemed, may be worth more or less than their original cost. The graph and table do not reflect the deduction of taxes that a shareholder wouldpay on Fund distributions or the redemption of Fund shares. Current performance may be lower or higher than the performance data shown. Results are annualized for allperiods greater than one year. Please visit www.tweedy.com to obtain performance data that is current to the most recent month end.
The Fund does not impose any front-end or deferred sales charges. The expense ratios shown above reflect the inclusion of acquired fund fees and expenses (i.e., the fees andexpenses attributable to investing cash balances in money market funds) and may differ from those shown in the Fund’s financial statements.
† Tweedy, Browne Company LLC has voluntarily agreed, effective December 1, 2017 through at least July 31, 2023, to waive a portion of the Fund’s investment advisory fees and/or reimbursea portion of the Fund’s expenses to the extent necessary to keep the Fund’s expense ratio in line with the expense ratio of the Tweedy, Browne International Value Fund. (For purposes of thiscalculation, the Fund’s acquired fund fees and expenses, brokerage costs, interest, taxes and extraordinary expenses are disregarded, and the Fund’s expense ratio is rounded to two decimal points.)The Fund’s performance data shown above would have been lower had certain fees and expenses not been waived and/or reimbursed during certain periods.
The MSCI World Index is a free float-adjusted market capitalization weighted index that is designed to measure the equity market performance of developed markets. The MSCI World Index (inUS$) reflects the return of the MSCI World Index for a U.S. dollar investor. The MSCI World High Dividend Yield Index reflects the performance of equities in the MSCI World Index(excluding REITs) with higher dividend income and quality characteristics than average dividend yields that are both sustainable and persistent. The index also applies quality screens and reviews12-month past performance to omit stocks with potentially deteriorating fundamentals that could force them to cut or reduce dividends. The MSCI World High Dividend Yield Index (in US$)reflects the return of the MSCI World High Dividend Yield Index for a U.S. dollar investor. Results for each index are inclusive of dividends and net of foreign withholding taxes.
Indexes are unmanaged, and the figures for the index shown include reinvestment of dividends and capital gains distributions and do not reflect any fees or expenses. Investors cannot invest directly in an index.
II-28

Tweedy, Browne Worldwide High Dividend Yield Value Fund
Perspective on Assessing Investment Results (Unaudited)
March 31, 2022
In accordance with rules and guidelines set out by theUnited States Securities and Exchange Commission, we haveprovided a comparison of the historical investment results ofTweedy, Browne Worldwide High Dividend Yield ValueFund to the results of the MSCI World Index (in US$) andthe MSCI World High Dividend Yield Index (in US$).Although we believe this comparison may be useful, thehistorical results of the MSCI indexes in large measurerepresent the investment results of stocks that we do not own.Any portfolio that does not own exactly the same stocks inexactly the same proportions as the index to which theparticular portfolio is being compared is not likely to have thesame results as the index. The investment behavior of adiversified portfolio of undervalued stocks tends to becorrelated to the investment behavior of a broad index; i.e.,when the index is up, probably more than one-half of thestocks in the entire universe of public companies in all thecountries that are included in the same index will be up,albeit in greater or lesser percentages than the index.Similarly, when the index declines, probably more thanone-half of the stocks in the entire universe of publiccompanies in all the countries that are included in the indexwill be down in greater or lesser percentages than the index.But it is almost a mathematical truth that “different stocksequal different results.”
We believe that favorable or unfavorable historicalinvestment results in comparison to an index are notnecessarily predictive of future comparative investmentresults. In 1986, V. Eugene Shahan, a Columbia UniversityBusiness School alumnus and portfolio manager at U.S. Trust,wrote Are Short-Term Performance and Value InvestingMutually Exclusive? In this article, Mr. Shahan analyzed the
investment performance of seven money managers, aboutwhom Warren Buffett wrote in his article, The Superinvestorsof Graham and Doddsville. Over long periods of time, the sevenmanagers significantly outperformed the market as measuredby the Dow Jones Industrial Average (the DJIA) or theS&P 500 Index (the S&P 500) by between 7.7% and 16.5%annually. (The goal of most institutional money managers isto outperform the market by 2% to 3%.) However, for periodsranging from 13 years to 28 years, this group of managersunderperformed the market between 7.7% and 42% of theyears. Six of the seven investment managers underperformedthe market between 28% and 42% of the years. In today’senvironment, they would have lost many of their clientsduring their periods of underperformance. Longer term, itwould have been the wrong decision to fire any of thosemoney managers. In examining the seven long-terminvestment records, unfavorable investment results ascompared to either index did not predict the future favorablecomparative investment results that occurred, and favorableinvestment results in comparison to the DJIA or the S&P 500were not always followed by future favorable comparativeresults. Stretches of consecutive annual underperformanceranged from one to six years.
Mr. Shahan concluded:
Unfortunately, there is no way to distinguish between apoor three-year stretch for a manager who will do wellover 15 years, from a poor three-year stretch for amanager who will continue to do poorly. Nor is there anyreason to believe that a manager who does well from theoutset cannot continue to do well, and consistently.
II-29

Tweedy, Browne Worldwide High Dividend Yield Value Fund
Portfolio of InvestmentsMarch 31, 2022
Shares Value*
COMMON STOCKS—94.3%
China—2.3%2,033,530 Dali Foods Group Co., Ltd. . . . . . . . . . . . . . . . . . . . $1,061,128
976,845 Uni-President China Holdings, Ltd. . . . . . . . . . . . . 847,9011,909,029
Finland—1.8%112,945 Kemira Oyj . . . . . . . . . . . . . . . . . . . . . . . . . . . . . . . 1,486,174
France—11.9%141,765 Orange SA . . . . . . . . . . . . . . . . . . . . . . . . . . . . . . . 1,688,39471,355 Rubis SCA . . . . . . . . . . . . . . . . . . . . . . . . . . . . . . . 2,109,46219,670 Safran SA . . . . . . . . . . . . . . . . . . . . . . . . . . . . . . . . 2,329,256
101,170 SCOR SE . . . . . . . . . . . . . . . . . . . . . . . . . . . . . . . . 3,271,98744,294 Tarkett SA(a) . . . . . . . . . . . . . . . . . . . . . . . . . . . . . 627,874
10,026,973
Germany—7.0%43,500 BASF SE . . . . . . . . . . . . . . . . . . . . . . . . . . . . . . . . 2,496,49550,695 Fresenius Medical Care AG & Co., KGaA,
ADR . . . . . . . . . . . . . . . . . . . . . . . . . . . . . . . . . 1,707,40722,400 Fresenius SE & Co., KGaA . . . . . . . . . . . . . . . . . . . 827,2073,250 Muenchener Rueckversicherungs AG,
Registered . . . . . . . . . . . . . . . . . . . . . . . . . . . . . . 873,8815,904,990
Hong Kong—4.7%177,500 CK Hutchison Holdings, Ltd. . . . . . . . . . . . . . . . . . 1,298,268407,000 Hang Lung Group, Ltd. . . . . . . . . . . . . . . . . . . . . . 860,74915,465 Jardine Matheson Holdings, Ltd. . . . . . . . . . . . . . . 848,387
409,085 Johnson Electric Holdings, Ltd. . . . . . . . . . . . . . . . 563,156172,775 Luk Fook Holdings International, Ltd. . . . . . . . . . . 419,079
3,989,639
Japan—3.7%49,270 Astellas Pharma, Inc. . . . . . . . . . . . . . . . . . . . . . . . 772,15445,315 Inaba Denki Sangyo Co., Ltd. . . . . . . . . . . . . . . . . . 921,75956,600 Kuraray Co., Ltd. . . . . . . . . . . . . . . . . . . . . . . . . . . 488,67717,685 Sumitomo Heavy Industries, Ltd. . . . . . . . . . . . . . . 406,48735,785 Takasago Thermal Engineering Co., Ltd. . . . . . . . . 508,932
3,098,009
Mexico—5.6%37,735 Coca-Cola FEMSA SA de CV, Sponsored ADR . . 2,073,538
257,375 Industrias Bachoco SAB de CV, Class B . . . . . . . . . 1,003,456531,475 Megacable Holdings SAB de CV . . . . . . . . . . . . . . 1,599,062
4,676,056
Singapore—4.3%67,295 DBS Group Holdings, Ltd. . . . . . . . . . . . . . . . . . . . 1,765,88478,510 United Overseas Bank, Ltd. . . . . . . . . . . . . . . . . . . 1,839,692
3,605,576
South Korea—1.0%13,365 LG Corp. . . . . . . . . . . . . . . . . . . . . . . . . . . . . . . . . 839,298
Shares Value*
Sweden—5.0%10,925 Autoliv, Inc. . . . . . . . . . . . . . . . . . . . . . . . . . . . . . . $835,10748,290 SKF AB, Class B . . . . . . . . . . . . . . . . . . . . . . . . . . . 794,428
109,875 Trelleborg AB, Class B . . . . . . . . . . . . . . . . . . . . . . 2,566,5264,196,061
Switzerland—11.3%31,255 Nestlé SA, Registered . . . . . . . . . . . . . . . . . . . . . . . 4,080,51416,072 Novartis AG, Registered . . . . . . . . . . . . . . . . . . . . . 1,416,8127,230 Roche Holding AG . . . . . . . . . . . . . . . . . . . . . . . . 2,872,4482,187 Zurich Insurance Group AG . . . . . . . . . . . . . . . . . . 1,084,619
9,454,393
United Kingdom—14.5%220,690 BAE Systems plc . . . . . . . . . . . . . . . . . . . . . . . . . . . 2,077,33468,020 Diageo plc . . . . . . . . . . . . . . . . . . . . . . . . . . . . . . . 3,458,165
142,165 GlaxoSmithKline plc . . . . . . . . . . . . . . . . . . . . . . . 3,083,042172,435 Inchcape plc . . . . . . . . . . . . . . . . . . . . . . . . . . . . . . 1,512,28344,585 Unilever plc . . . . . . . . . . . . . . . . . . . . . . . . . . . . . . 2,026,732
12,157,556
United States—21.2%13,970 3M Co. . . . . . . . . . . . . . . . . . . . . . . . . . . . . . . . . . . 2,079,85441,145 Bank of America Corp. . . . . . . . . . . . . . . . . . . . . . . 1,695,99720,336 Cisco Systems, Inc. . . . . . . . . . . . . . . . . . . . . . . . . . 1,133,93528,760 Enterprise Products Partners LP . . . . . . . . . . . . . . . 742,29638,740 Intel Corp. . . . . . . . . . . . . . . . . . . . . . . . . . . . . . . . 1,919,95413,405 Johnson & Johnson . . . . . . . . . . . . . . . . . . . . . . . . 2,375,76812,795 Progressive Corp./The . . . . . . . . . . . . . . . . . . . . . . . 1,458,50230,645 Truist Financial Corp. . . . . . . . . . . . . . . . . . . . . . . . 1,737,57130,030 U.S. Bancorp . . . . . . . . . . . . . . . . . . . . . . . . . . . . . 1,596,09560,286 Verizon Communications, Inc. . . . . . . . . . . . . . . . . 3,070,969
17,810,941
TOTAL COMMON STOCKS(Cost $60,004,777) . . . . . . . . . . . . . . . . . . . . . . . . . . . . . . . . . 79,154,695
REGISTERED INVESTMENT COMPANY—4.8%4,031,593 Dreyfus Government Securities Cash
Management– Institutional Shares 0.05%(b)
(Cost $4,031,593) . . . . . . . . . . . . . . . . . . . . . . . . 4,031,593
INVESTMENTS IN SECURITIES(Cost $64,036,370) . . . . . . . . . . . . . . . . . . . . . . 99.1% 83,186,288
OTHER ASSETS AND LIABILITIES (Net) . . . 0.9 791,287
NET ASSETS . . . . . . . . . . . . . . . . . . . . . . . . . . . . . 100.0% $83,977,575
* See Note 2 in Notes to Financial Statements.(a) Non-income producing security.(b) Rate disclosed is the 7-day yield at March 31, 2022.
Abbreviations:ADR — American Depositary Receipt
SEE NOTES TO FINANCIAL STATEMENTSII-30

Tweedy, Browne Worldwide High Dividend Yield Value Fund
Sector DiversificationMarch 31, 2022 (Unaudited)
Sector DiversificationPercentage ofNet Assets
COMMON STOCKSCapital Goods . . . . . . . . . . . . . . . . . . . . . . . . . . . . . . . . . . . . . . . . . . 18.2%Pharmaceuticals, Biotechnology & Life Sciences . . . . . . . . . . . . . . . . 12.5Banks . . . . . . . . . . . . . . . . . . . . . . . . . . . . . . . . . . . . . . . . . . . . . . . . . 10.3Food . . . . . . . . . . . . . . . . . . . . . . . . . . . . . . . . . . . . . . . . . . . . . . . . . . 8.3Insurance . . . . . . . . . . . . . . . . . . . . . . . . . . . . . . . . . . . . . . . . . . . . . . 8.0Beverage . . . . . . . . . . . . . . . . . . . . . . . . . . . . . . . . . . . . . . . . . . . . . . 6.6Telecommunication Services . . . . . . . . . . . . . . . . . . . . . . . . . . . . . . . 5.7Materials . . . . . . . . . . . . . . . . . . . . . . . . . . . . . . . . . . . . . . . . . . . . . . 5.3Health Care Equipment & Services . . . . . . . . . . . . . . . . . . . . . . . . . . 3.0Utilities . . . . . . . . . . . . . . . . . . . . . . . . . . . . . . . . . . . . . . . . . . . . . . . 2.5Household & Personal Products . . . . . . . . . . . . . . . . . . . . . . . . . . . . . 2.4Retailing . . . . . . . . . . . . . . . . . . . . . . . . . . . . . . . . . . . . . . . . . . . . . . 2.3Semiconductors & Semiconductor Equipment . . . . . . . . . . . . . . . . . . 2.3Media . . . . . . . . . . . . . . . . . . . . . . . . . . . . . . . . . . . . . . . . . . . . . . . . . 1.9Automobiles & Components . . . . . . . . . . . . . . . . . . . . . . . . . . . . . . . 1.7Technology Hardware & Equipment . . . . . . . . . . . . . . . . . . . . . . . . . 1.4Real Estate . . . . . . . . . . . . . . . . . . . . . . . . . . . . . . . . . . . . . . . . . . . . . 1.0Energy . . . . . . . . . . . . . . . . . . . . . . . . . . . . . . . . . . . . . . . . . . . . . . . . 0.9
Total Common Stocks . . . . . . . . . . . . . . . . . . . . . . . . . . . . . . . . . . . 94.3Registered Investment Company . . . . . . . . . . . . . . . . . . . . . . . . . . . 4.8Other Assets and Liabilities (Net) . . . . . . . . . . . . . . . . . . . . . . . . . . 0.9
Net Assets . . . . . . . . . . . . . . . . . . . . . . . . . . . . . . . . . . . . . . . . . . . . . 100.0%
Portfolio CompositionMarch 31, 2022 (Unaudited)
Money Market FundsMoney Market Fundsand Other Assets andand Other Assets andLiabilities (Net) 5%Liabilities (Net) 5%
France 12%France 12%Switzerland 11%Switzerland 11%
United States 21%United States 21%
Germany 7%
United Kingdom 15%United Kingdom 15%Mexico 6%Mexico 6%
Sweden 5%Sweden 5%
Hong Kong 5%Hong Kong 5%
OtherOtherCountriesCountries(a)(a) 13%
(a) (a) “Other Countries” include China, Finland, Japan, Singapore and South KoreaOther Countries” include China, Finland, Japan, Singapore and South Korea
SEE NOTES TO FINANCIAL STATEMENTSII-31

Statements of Assets and LiabilitiesMarch 31, 2022
International ValueFund
International ValueFund II –CurrencyUnhedged
ValueFund
Worldwide HighDividend Yield
Value Fund
ASSETSInvestments in securities, at cost(a) . . . . . . . . . . . . . . . . . . $3,677,969,059 $423,733,440 $264,891,184 $64,036,370
Investments in securities of unaffiliated issuers, at value . . $6,127,462,611 $518,421,197 $435,346,241 $83,186,288Investments in securities of affiliated issuers, at value . . . . 57,658,124 — — —Cash . . . . . . . . . . . . . . . . . . . . . . . . . . . . . . . . . . . . . . . . 65,006 5,232 4,101 —Cash segregated as collateral . . . . . . . . . . . . . . . . . . . . . . . 1,140,000 — — —Dividends and interest receivable . . . . . . . . . . . . . . . . . . . 11,937,471 1,223,883 635,540 172,372Receivable for investment securities sold . . . . . . . . . . . . . 21,259,765 3,154,362 — —Recoverable foreign withholding taxes . . . . . . . . . . . . . . . 19,072,964 1,864,331 1,245,978 751,978Receivable for Fund shares sold . . . . . . . . . . . . . . . . . . . . 22,081,424 560,952 96,744 —Unrealized appreciation on forward exchange contracts
(Note 2) . . . . . . . . . . . . . . . . . . . . . . . . . . . . . . . . . . . . 84,119,111 — 4,955,679 —Prepaid expense . . . . . . . . . . . . . . . . . . . . . . . . . . . . . . . . 79,070 6,315 5,086 1,826
Total Assets . . . . . . . . . . . . . . . . . . . . . . . . . . . . . . . . . . . $6,344,875,546 $525,236,272 $442,289,369 $84,112,464
LIABILITIESUnrealized depreciation of forward exchange contracts
(Note 2) . . . . . . . . . . . . . . . . . . . . . . . . . . . . . . . . . . . . $ 18,275,407 $ — $ 930,211 $ —Payable for Fund shares redeemed . . . . . . . . . . . . . . . . . . . 4,853,281 3,312,418 101,657 11,876Investment advisory fee payable (Note 3) . . . . . . . . . . . . . 4,156,597 351,505 296,681 56,389Payable for investment securities purchased . . . . . . . . . . . 9,396,194 903,233 — —Shareholder servicing and administration fees payable
(Notes 3) . . . . . . . . . . . . . . . . . . . . . . . . . . . . . . . . . . . 110,401 2,246 1,554 3,810Directors’ fees payable . . . . . . . . . . . . . . . . . . . . . . . . . . . 5,647 — — 250Due to custodian . . . . . . . . . . . . . . . . . . . . . . . . . . . . . . . — — — 42Transfer agent fees payable . . . . . . . . . . . . . . . . . . . . . . . . 480,655 14,520 31,144 9,183Fund administration and accounting fees payable . . . . . . . 249,518 27,136 24,411 13,405Legal and audit fees payable . . . . . . . . . . . . . . . . . . . . . . . 370,968 32,191 29,023 11,493Accrued expenses and other payables . . . . . . . . . . . . . . . . 569,469 69,402 51,262 28,441
Total Liabilities . . . . . . . . . . . . . . . . . . . . . . . . . . . . . . . . . 38,468,137 4,712,651 1,465,943 134,889NET ASSETS . . . . . . . . . . . . . . . . . . . . . . . . . . . . . . . . . . $6,306,407,409 $520,523,621 $440,823,426 $83,977,575
NET ASSETS consists ofPaid-in capital . . . . . . . . . . . . . . . . . . . . . . . . . . . . . . . . . 3,568,615,069 435,913,420 249,186,555 59,271,111Total distributable earnings . . . . . . . . . . . . . . . . . . . . . . . 2,737,792,340 84,610,201 191,636,871 24,706,464
Total Net Assets . . . . . . . . . . . . . . . . . . . . . . . . . . . . . . . . $6,306,407,409 $520,523,621 $440,823,426 $83,977,575
CAPITAL STOCK (common stock outstanding) . . . . . 224,080,116 31,919,462 23,074,458 13,185,099
NET ASSET VALUE offering price per share . . . . . . . . $28.14 $16.31 $19.10 $6.37
(a) Includes investments in securities of affiliated issuers, at cost for International Value Fund, International Value Fund II – Currency Unhedged, Value Fund andWorldwide High Dividend Yield Value Fund of $51,311,994, $0, $0 and $0, respectively (Note 4).
SEE NOTES TO FINANCIAL STATEMENTSII-32

Statements of OperationsFor the Year Ended March 31, 2022
International ValueFund
International ValueFund II –CurrencyUnhedged
ValueFund
Worldwide HighDividend Yield
Value Fund
INVESTMENT INCOMEDividends(a) . . . . . . . . . . . . . . . . . . . . . . . . . . . . . $177,485,946 $14,210,023 $10,135,670 $3,575,628Less foreign withholding taxes . . . . . . . . . . . . . . . (18,032,081) (1,612,686) (977,063) (350,502)Interest . . . . . . . . . . . . . . . . . . . . . . . . . . . . . . . . . 507,746 20,886 17,747 16,370Other . . . . . . . . . . . . . . . . . . . . . . . . . . . . . . . . . . 5,956,922 278,165 162,391 213,278
Total Investment Income 165,918,533 12,896,388 9,338,745 3,454,774
EXPENSESInvestment advisory fee (Note 3) . . . . . . . . . . . . . 81,714,296 6,669,091 5,519,019 1,200,373Transfer agent fees (Note 3) . . . . . . . . . . . . . . . . . 2,565,352 86,277 177,995 54,975Fund administration and accounting fees
(Note 3) . . . . . . . . . . . . . . . . . . . . . . . . . . . . . . 1,581,430 139,316 118,028 37,738Custodian fees (Note 3) . . . . . . . . . . . . . . . . . . . . 1,324,368 113,163 69,776 19,721Legal and audit fees . . . . . . . . . . . . . . . . . . . . . . . . 1,034,389 88,315 76,879 25,026Directors’ fees and expenses (Note 3) . . . . . . . . . . 736,023 59,180 48,804 10,978Shareholder servicing and administration fees
(Note 3) . . . . . . . . . . . . . . . . . . . . . . . . . . . . . . 417,085 28,627 22,882 7,610Interest . . . . . . . . . . . . . . . . . . . . . . . . . . . . . . . . . — — — 1,876Other . . . . . . . . . . . . . . . . . . . . . . . . . . . . . . . . . . 850,150 118,107 97,669 60,836
Total expenses before waivers. . . . . . . . . . . . 90,223,093 7,302,076 6,131,052 1,419,133Investment advisory fees waived (Note 3) . . . . . . . (2,422,733) (134,590) (199,819) (132,319)
Net Expenses 87,800,360 7,167,486 5,931,233 1,286,814NET INVESTMENT INCOME . . . . . . . . . . . . . . 78,118,173 5,728,902 3,407,512 2,167,960
REALIZED AND UNREALIZED GAIN (LOSS)Net realized gain (loss) on:
Securities(a) . . . . . . . . . . . . . . . . . . . . . . . . . . . 373,966,682 6,108,017 43,181,089 17,787,991Forward exchange contracts . . . . . . . . . . . . . . . (50,062,159) — (4,711,616) —Foreign currencies and net other assets . . . . . . . (667,552) (77,619) 18,020 (12,024)
Net realized gain . . . . . . . . . . . . . . . . . . . . . . . . . . 323,236,971 6,030,398 38,487,493 17,775,967Net unrealized appreciation (depreciation) of:
Securities(b) . . . . . . . . . . . . . . . . . . . . . . . . . . . (242,985,008) (7,307,785) (27,338,910) (17,192,278)Forward exchange contracts . . . . . . . . . . . . . . . 125,062,959 — 8,047,488 —Foreign currencies and net other assets . . . . . . . (845,092) (57,021) (38,799) (35,147)
Net change in unrealized appreciation(depreciation) . . . . . . . . . . . . . . . . . . . . . . . . . . (118,767,141) (7,364,806) (19,330,221) (17,227,425)
NET REALIZED AND UNREALIZED GAIN(LOSS) . . . . . . . . . . . . . . . . . . . . . . . . . . . . . . . . 204,469,830 (1,334,408) 19,157,272 548,542
NET INCREASE IN NET ASSETSRESULTING FROM OPERATIONS . . . . . . . $282,588,003 $4,394,494 $22,564,784 $2,716,502
(a) Dividend income and net realized gain on securities from affiliated issuers for International Value Fund were $864,254 and $0, respectively (Note 4).(b) Net unrealized depreciation from affiliated issuers for International Value Fund was $7,510,067 (Note 4).
SEE NOTES TO FINANCIAL STATEMENTSII-33

Statements of Changes in Net Assets
International Value FundInternational Value Fund II –
Currency UnhedgedYear Ended3/31/2022
Year Ended3/31/2021
Year Ended3/31/2022
Year Ended3/31/2021
INVESTMENT ACTIVITIES:Net investment income . . . . . . . . . . . . . . . . . . . . . . . . . . . . . . . . $78,118,173 $50,872,239 $5,728,902 $2,740,731
Net realized gain (loss) . . . . . . . . . . . . . . . . . . . . . . . . . . . . . . . . . 323,236,971 458,693,937 6,030,398 (16,179,107)
Net change in unrealized appreciation (depreciation) . . . . . . . . . . (118,767,141) 1,314,707,886 (7,364,806) 153,472,927
Net increase in net assets resulting from operations . . . . . . . . . . . 282,588,003 1,824,274,062 4,394,494 140,034,551
DISTRIBUTIONS:Distributions to shareholders . . . . . . . . . . . . . . . . . . . . . . . . . . . . (543,518,030) (57,684,545) (5,666,910) (4,397,957)
CAPITAL STOCK TRANSACTIONS:Net increase (decrease) in net assets from Fund share
transactions (Note 5) . . . . . . . . . . . . . . . . . . . . . . . . . . . . . . . . 147,891,584 (1,338,105,300) 35,458,266 (24,131,172)
Net increase (decrease) in net assets . . . . . . . . . . . . . . . . . . . . . . . (113,038,443) 428,484,217 34,185,850 111,505,422
NET ASSETS:Beginning of year . . . . . . . . . . . . . . . . . . . . . . . . . . . . . . . . . . . . . 6,419,445,852 5,990,961,635 486,337,771 374,832,349
End of year . . . . . . . . . . . . . . . . . . . . . . . . . . . . . . . . . . . . . . . . . . $6,306,407,409 $6,419,445,852 $520,523,621 $486,337,771
SEE NOTES TO FINANCIAL STATEMENTSII-34

Statements of Changes in Net Assets
Value FundWorldwide High Dividend
Yield Value FundYear Ended3/31/2022
Year Ended3/31/2021
Year Ended3/31/2022
Year Ended3/31/2021
INVESTMENT ACTIVITIES:Net investment income . . . . . . . . . . . . . . . . . . . . . . . . . . . . . . . . . . . . $3,407,512 $2,269,067 $2,167,960 $2,015,268
Net realized gain . . . . . . . . . . . . . . . . . . . . . . . . . . . . . . . . . . . . . . . . . 38,487,493 28,702,795 17,775,967 9,311,489
Net change in unrealized appreciation (depreciation) . . . . . . . . . . . . . (19,330,221) 86,167,750 (17,227,425) 20,839,394
Net increase in net assets resulting from operations . . . . . . . . . . . . . . . 22,564,784 117,139,612 2,716,502 32,166,151
DISTRIBUTIONS:Distributions to shareholders . . . . . . . . . . . . . . . . . . . . . . . . . . . . . . . . (48,474,016) (8,120,489) (17,769,883) (8,854,431)
CAPITAL STOCK TRANSACTIONS:Net increase (decrease) in net assets from Fund share transactions
(Note 5) . . . . . . . . . . . . . . . . . . . . . . . . . . . . . . . . . . . . . . . . . . . . . 39,786,257 (20,343,025) (12,768,833) (21,185,529)
Net increase (decrease) in net assets . . . . . . . . . . . . . . . . . . . . . . . . . . 13,877,025 88,676,098 (27,822,214) 2,126,191
NET ASSETS:Beginning of year . . . . . . . . . . . . . . . . . . . . . . . . . . . . . . . . . . . . . . . . . 426,946,401 338,270,303 111,799,789 109,673,598
End of year . . . . . . . . . . . . . . . . . . . . . . . . . . . . . . . . . . . . . . . . . . . . . $440,823,426 $426,946,401 $83,977,575 $111,799,789
SEE NOTES TO FINANCIAL STATEMENTSII-35

Financial Highlights
Tweedy, Browne International Value FundFor a Fund share outstanding throughout each year.
YearEnded
3/31/2022
YearEnded
3/31/2021
YearEnded
3/31/2020
YearEnded
3/31/2019
YearEnded
3/31/2018Net asset value, beginning of year . . . . . . . . . . . . . . . . . . . . . $29.41 $21.99 $26.91 $27.89 $26.74Income from investment operations:Net investment income . . . . . . . . . . . . . . . . . . . . . . . . . . . . 0.37(a) 0.23 0.43 0.45 0.25Net realized and unrealized gain (loss) on investments . . . . . 0.95 7.45 (4.82) 0.25 1.31
Total from investment operations . . . . . . . . . . . . . . . 1.32 7.68 (4.39) 0.70 1.56Distributions:Dividends from net investment income . . . . . . . . . . . . . . . . (0.41) (0.26) (0.45) (0.39) (0.31)Distributions from net realized gains . . . . . . . . . . . . . . . . . . . (2.18) — (0.08) (1.29) (0.10)
Total distributions . . . . . . . . . . . . . . . . . . . . . . . . . . (2.59) (0.26) (0.53) (1.68) (0.41)Redemption fees . . . . . . . . . . . . . . . . . . . . . . . . . . . . . . . . . . — — 0.00(b) 0.00(b) 0.00(b)
Net asset value, end of year . . . . . . . . . . . . . . . . . . . . . . . . . . $28.14 $29.41 $21.99 $26.91 $27.89
Total return(c) . . . . . . . . . . . . . . . . . . . . . . . . . . . . . . . . . . . 4.36% 34.89%(d) (16.66)%(d) 3.11% 5.82%
Ratios/Supplemental Data:Net assets, end of year (in 000s) . . . . . . . . . . . . . . . . . . . . . . $6,306,407 $6,419,446 $5,990,962 $8,497,700 $9,672,272Ratio of operating expenses to average net assets . . . . . . . . . . 1.34% 1.37% 1.36% 1.36% 1.36%Ratio of operating expenses to average net assets excluding
waivers of expenses . . . . . . . . . . . . . . . . . . . . . . . . . . . . . . 1.38% 1.38% 1.36% 1.36% 1.36%Ratio of net investment income to average net assets . . . . . . 1.19%(a) 0.83% 1.50% 1.53% 0.91%Portfolio turnover rate. . . . . . . . . . . . . . . . . . . . . . . . . . . . . . 10% 11% 9% 6% 5%
(a) Includes the impact of refunded European tax reclaims. If these reclaims were not included the Net Investment Income per Share would have been $0.35 and theRatio of Net Investment Income to Average Net Assets would have been 1.10%.
(b) Amount represents less than $0.01 per share.(c) Total return represents aggregate total return for the periods indicated.(d) The net asset value (NAV) disclosed in the March 31, 2020 annual report reflects adjustments in accordance with accounting principles generally accepted in the
United States of America (U.S. GAAP) and as such, differs from the NAV reported on March 31, 2020. The total return reported is based on the unadjusted NAVwhich was the official NAV for executing transactions on March 31, 2020. The total return based on the NAV which reflects the adjustments in accordance withU.S. GAAP is (16.74)% for the year ended March 31, 2020 and 35.02% for the year ended March 31, 2021.
Tweedy, Browne International Value Fund II – Currency UnhedgedFor a Fund share outstanding throughout each year.
YearEnded
3/31/2022
YearEnded
3/31/2021
YearEnded
3/31/2020
YearEnded
3/31/2019
YearEnded
3/31/2018Net asset value, beginning of year . . . . . . . . . . . . . . . . . . . . . $16.30 $11.66 $15.10 $15.61 $14.10Income from investment operations:Net investment income . . . . . . . . . . . . . . . . . . . . . . . . . . . . 0.18(a) 0.09 0.21 0.22 0.14Net realized and unrealized gain (loss) on investments . . . . . 0.01 4.69 (3.31) (0.54) 1.56
Total from investment operations . . . . . . . . . . . . . . . 0.19 4.78 (3.10) (0.32) 1.70Distributions:Dividends from net investment income . . . . . . . . . . . . . . . . (0.18) (0.10) (0.23) (0.19) (0.19)Distributions from net realized gains . . . . . . . . . . . . . . . . . . . — (0.04) (0.11) — —
Total distributions . . . . . . . . . . . . . . . . . . . . . . . . . . (0.18) (0.14) (0.34) (0.19) (0.19)Redemption fees . . . . . . . . . . . . . . . . . . . . . . . . . . . . . . . . . . — — 0.00(b) 0.00(b) 0.00(b)
Net asset value, end of year . . . . . . . . . . . . . . . . . . . . . . . . . . $16.31 $16.30 $11.66 $15.10 $15.61
Total return(c) . . . . . . . . . . . . . . . . . . . . . . . . . . . . . . . . . . . 1.13% 40.87%(d) (20.94)%(d) (1.91)% 12.08%
Ratios/Supplemental Data:Net assets, end of year (in 000s) . . . . . . . . . . . . . . . . . . . . . . $520,524 $486,338 $374,832 $487,298 $378,197Ratio of operating expenses to average net assets . . . . . . . . . . 1.34% 1.37% 1.36% 1.35% 1.36%Ratio of operating expenses to average net assets excluding
recoupments and/or waivers/reimbursements ofexpenses . . . . . . . . . . . . . . . . . . . . . . . . . . . . . . . . . . . . . . 1.37% 1.37% 1.36% 1.35% 1.37%
Ratio of net investment income to average net assets . . . . . . 1.07%(a) 0.66% 1.40% 1.51% 0.93%Portfolio turnover rate . . . . . . . . . . . . . . . . . . . . . . . . . . . . . 8% 25% 11% 2% 6%
(a) Includes the impact of refunded European tax reclaims. If these reclaims were not included the Net Investment Income per Share would have been $0.17 and theRatio of Net Investment Income to Average Net Assets would have been 1.02%.
(b) Amount represents less than $0.01 per share.(c) Total return represents aggregate total return for the periods indicated.(d) The net asset value (NAV) disclosed in the March 31, 2020 annual report reflects adjustments in accordance with accounting principles generally accepted in the
United States of America (U.S. GAAP) and as such, differs from the NAV reported on March 31, 2020. The total return reported is based on the unadjusted NAVwhich was the official NAV for executing transactions on March 31, 2020. The total return based on the NAV which reflects the adjustments in accordance withU.S. GAAP is (21.08)% for the year ended March 31, 2020 and 41.12% for the year ended March 31, 2021.
SEE NOTES TO FINANCIAL STATEMENTSII-36

Financial Highlights
Tweedy, Browne Value FundFor a Fund share outstanding throughout each year.
YearEnded
3/31/2022
YearEnded
3/31/2021
YearEnded
3/31/2020
YearEnded
3/31/2019
YearEnded
3/31/2018Net asset value, beginning of year . . . . . . . . . . . . . . . . . . . . . $20.38 $15.34 $19.62 $23.20 $21.78
Income from investment operations:Net investment income . . . . . . . . . . . . . . . . . . . . . . . . . . . . 0.17(a) 0.11 0.19 0.24 0.16Net realized and unrealized gain (loss) on investments . . . . . 0.93 5.31 (3.38) 0.54 1.64
Total from investment operations . . . . . . . . . . . . . . . 1.10 5.42 (3.19) 0.78 1.80
Distributions:Dividends from net investment income . . . . . . . . . . . . . . . . (0.18) (0.12) (0.20) (0.24) (0.19)Distributions from net realized gains . . . . . . . . . . . . . . . . . . . (2.20) (0.26) (0.89) (4.12) (0.19)
Total distributions . . . . . . . . . . . . . . . . . . . . . . . . . . (2.38) (0.38) (1.09) (4.36) (0.38)Net asset value, end of year . . . . . . . . . . . . . . . . . . . . . . . . . . $19.10 $20.38 $15.34 $19.62 $23.20
Total return(b) . . . . . . . . . . . . . . . . . . . . . . . . . . . . . . . . . . . 5.35% 35.58% (17.47)% 5.41% 8.19%
Ratios/Supplemental Data:Net assets, end of year (in 000s) . . . . . . . . . . . . . . . . . . . . . . $440,823 $426,946 $338,270 $453,275 $534,019Ratio of operating expenses to average net assets . . . . . . . . . . 1.34% 1.37% 1.36% 1.36% 1.36%Ratio of operating expenses to average net assets excluding
waiver and/or reimbursements of expenses . . . . . . . . . . . . 1.39% 1.40% 1.38% 1.37% 1.37%Ratio of net investment income to average net assets . . . . . . 0.77%(a) 0.59% 0.93% 0.96% 0.61%Portfolio turnover rate . . . . . . . . . . . . . . . . . . . . . . . . . . . . . 20% 18% 12% 9% 6%
(a) Includes the impact of refunded European tax reclaims. If these reclaims were not included the Net Investment Income per Share would have been $0.16 and theRatio of Net Investment Income to Average Net Assets would have been 0.73%.
(b) Total return represents aggregate total return for the periods indicated.
Tweedy, Browne Worldwide High Dividend Yield Value FundFor a Fund share outstanding throughout each year.
YearEnded
3/31/2022
YearEnded
3/31/2021
YearEnded
3/31/2020
YearEnded
3/31/2019
YearEnded
3/31/2018Net asset value, beginning of year . . . . . . . . . . . . . . . . . . . . . $7.76 $6.30 $8.51 $10.23 $9.47
Income from investment operations:Net investment income . . . . . . . . . . . . . . . . . . . . . . . . . . . . 0.19(a) 0.14 0.20 0.24 0.17Net realized and unrealized gain (loss) on investments . . . . . (0.02) 1.94 (1.43) (0.15) 1.10
Total from investment operations . . . . . . . . . . . . . . . 0.17 2.08 (1.23) 0.09 1.27
Distributions:Dividends from net investment income . . . . . . . . . . . . . . . . (0.20) (0.14) (0.19) (0.26) (0.18)Distributions from net realized gains . . . . . . . . . . . . . . . . . . . (1.36) (0.48) (0.79) (1.55) (0.33)
Total distributions . . . . . . . . . . . . . . . . . . . . . . . . . . (1.56) (0.62) (0.98) (1.81) (0.51)Redemption fees . . . . . . . . . . . . . . . . . . . . . . . . . . . . . . . . . . — — — 0.00(b) 0.00(b)
Net asset value, end of year . . . . . . . . . . . . . . . . . . . . . . . . . . $6.37 $7.76 $6.30 $8.51 $10.23
Total return(c) . . . . . . . . . . . . . . . . . . . . . . . . . . . . . . . . . . . 1.97% 33.80% (17.06)% 2.44%(d) 13.58%(d)
Ratios/Supplemental Data:Net assets, end of year (in 000s) . . . . . . . . . . . . . . . . . . . . . . $83,978 $111,800 $109,674 $175,608 $266,642Ratio of operating expenses to average net assets . . . . . . . . . . 1.34% 1.37% 1.36% 1.36% 1.36%Ratio of operating expenses to average net assets excluding
waiver and/or reimbursements of expenses . . . . . . . . . . . . 1.48% 1.45% 1.42% 1.39% 1.37%Ratio of net investment income to average net assets . . . . . . 2.26%(a) 1.82% 2.20% 2.24% 1.54%Portfolio turnover rate . . . . . . . . . . . . . . . . . . . . . . . . . . . . . 16% 22% 7% 6% 5%
(a) Includes the impact of refunded European tax reclaims. If these reclaims were not included the Net Investment Income per Share would have been $0.17 and theRatio of Net Investment Income to Average Net Assets would have been 2.04%.
(b) Amount represents less than $0.01 per share.(c) Total return represents aggregate total return for the periods indicated.(d) The net asset value (NAV) disclosed in the March 31, 2018 annual report reflects adjustments in accordance with accounting principles generally accepted in the
United States of America (U.S. GAAP) and as such, differs from the NAV reported on March 31, 2018. The total return reported is based on the unadjusted NAVwhich was the official NAV for executing transactions on March 31, 2018.
SEE NOTES TO FINANCIAL STATEMENTSII-37

Notes to Financial Statements
1. OrganizationTweedy, Browne Fund Inc. (the “Company”) is an open-
end management investment company registered with theUnited States Securities and Exchange Commission (“SEC”)under the Investment Company Act of 1940, as amended(the “1940 Act”). The Company was organized as a Marylandcorporation on January 28, 1993. Tweedy, BrowneInternational Value Fund (“International Value Fund”),formerly, Tweedy, Browne Global Value Fund, Tweedy,Browne International Value Fund II – Currency Unhedged(“International Value Fund II – Currency Unhedged”),formerly, Tweedy, Browne Global Value Fund II – CurrencyUnhedged, Tweedy, Browne Value Fund (“Value Fund”), andTweedy, Browne Worldwide High Dividend Yield ValueFund (“Worldwide High Dividend Yield Value Fund”) (eacha “Fund” and together, the “Funds”) are each a diversifiedseries of the Company.
The Funds commenced operations as follows:
International Value Fund 06/15/93
International Value Fund II – Currency Unhedged 10/26/09
Value Fund 12/08/93
Worldwide High Dividend Yield Value Fund 09/05/07
International Value Fund and International Value Fund II– Currency Unhedged seek long-term capital growth byinvesting primarily in foreign equity securities that Tweedy,Browne Company LLC (the “Investment Adviser”) believesare undervalued. Value Fund seeks long-term capital growth byinvesting primarily in U.S. and foreign equity securities thatthe Investment Adviser believes are undervalued. WorldwideHigh Dividend Yield Value Fund seeks long-term capitalgrowth by investing primarily in U.S. and foreign equitysecurities that the Investment Adviser believes to have above-average dividend yields and valuations that are reasonable.
2. Significant Accounting PoliciesThe Funds are investment companies and, accordingly,
follow the investment company accounting and reportingguidance of the Financial Accounting Standards BoardAccounting Standards Codification Topic 946 – InvestmentCompanies, which is part of U.S. generally accepted accountingprinciples (“U.S. GAAP”). The preparation of financialstatements in accordance with U.S. GAAP requires managementto make estimates and assumptions that affect the reportedamounts and disclosures in the financial statements. Actualresults could differ from those estimates. The following is asummary of significant accounting policies consistently followedby the Funds in the preparation of their financial statements.
Portfolio Valuation. Portfolio securities and other assetslisted on a U.S. national securities exchange, comparableforeign securities exchange or through any system providing forcontemporaneous publication of actual prices (and not subjectto restrictions against sale by the Fund on such exchange or
system) are valued at the last quoted sale price at or prior to theclose of regular trading on the New York Stock Exchange or, ifapplicable, the NASDAQ Official Closing Price (“NOCP”).Portfolio securities and other assets that are readily marketablebut for which there are no reported sales on the valuation date,whether because they are not traded in a system providing forsame day publication of sales or because there were no salesreported on such date, are generally valued at the meanbetween the last asked price and the last bid price prior to theclose of regular trading. Forward exchange contracts are valuedat the forward rate. Securities and other assets for whichcurrent market quotations are not readily available, and thosesecurities which are generally not readily marketable due tosignificant legal or contractual restrictions, are valued at fairvalue as determined in good faith by the Investment Adviserunder the direction of the Company’s Board of Directors.Securities and other assets for which the most recent marketquotations may not be reliable (including because the last saleprice does not reflect current market value at the time ofvaluing the Fund’s assets due to developments since such lastprice) may be valued at fair value if the Investment Adviserconcludes that fair valuation will likely result in a moreaccurate net asset valuation. The Company has retained athird-party service provider that, under certain circumstancesselected by the Company, provides fair value pricing forinternational equity securities whose principal markets are nolonger open when the Funds calculate their net asset values.This means that a Fund’s net asset value may be based, at leastin part, on prices other than those determined as of the close ofthe principal market in which such assets trade. The Funds’ useof fair value pricing may cause the net asset value of a Fund’sshares to differ from the net asset value that would becalculated using market quotations. Fair value pricing involvessubjective judgments, and it is possible that the fair valuedetermined for a security may be materially different than thevalue that could be realized upon the sale of that security. Debtsecurities purchased with a remaining maturity of more than 60days are valued through pricing obtained by pricing servicesapproved by the Company’s Board of Directors. Debt securitiespurchased with a remaining maturity of 60 days or less arevalued at amortized cost, which approximates fair value, or byreference to other factors (i.e., pricing services or dealerquotations) by the Investment Adviser. Investments in open-end mutual funds are valued at net asset value (NAV).
Fair Value Measurements. The inputs and valuationtechniques used to determine fair value of the Funds’investments are summarized into three levels as described inthe hierarchy below:
• Level 1 – quoted prices in active markets for identicalsecurities
• Level 2 – other significant observable inputs (includingquoted prices for similar securities, interest rates, creditrisk, etc.)
• Level 3 – significant unobservable inputs (including aFund’s own assumptions in determining the fair valueof investments)
II-38

Notes to Financial Statements
The inputs or methodology used for valuing securities are not necessarily an indication of the risk associated with investing in thosesecurities. The following is a summary of the inputs used to value each Fund’s assets carried at fair value as of March 31, 2022. See eachFund’s respective Portfolio of Investments for details on portfolio holdings.
International Value Fund
TotalValue at
March 31, 2022
Level 1QuotedPrice
Level 2Other
SignificantObservable
Inputs
Level 3Significant
UnobservableInputs
Investments in Securities:Common Stocks
Belgium . . . . . . . . . . . . . . . . . . . . . . . . . . . . . . . . . . . . . . . . . $ 10,441,088 $ — $ 10,441,088 $ —China . . . . . . . . . . . . . . . . . . . . . . . . . . . . . . . . . . . . . . . . . . 313,596,550 16,015,571 297,580,979 —Finland . . . . . . . . . . . . . . . . . . . . . . . . . . . . . . . . . . . . . . . . . 20,652,580 — 20,652,580 —France . . . . . . . . . . . . . . . . . . . . . . . . . . . . . . . . . . . . . . . . . . 694,502,177 21,646,647 672,855,530 —Germany . . . . . . . . . . . . . . . . . . . . . . . . . . . . . . . . . . . . . . . . 462,937,494 — 462,937,494 —Hong Kong . . . . . . . . . . . . . . . . . . . . . . . . . . . . . . . . . . . . . . 110,641,125 6,700,845 103,940,280 —Italy . . . . . . . . . . . . . . . . . . . . . . . . . . . . . . . . . . . . . . . . . . . . 114,453,808 — 114,453,808 —Japan . . . . . . . . . . . . . . . . . . . . . . . . . . . . . . . . . . . . . . . . . . . 164,622,258 — 164,622,258 —Netherlands . . . . . . . . . . . . . . . . . . . . . . . . . . . . . . . . . . . . . . 170,179,586 — 170,179,586 —Philippines . . . . . . . . . . . . . . . . . . . . . . . . . . . . . . . . . . . . . . . 5,461,412 — 5,461,412 —Singapore . . . . . . . . . . . . . . . . . . . . . . . . . . . . . . . . . . . . . . . . 362,584,375 — 362,584,375 —South Korea . . . . . . . . . . . . . . . . . . . . . . . . . . . . . . . . . . . . . . 96,479,938 — 96,479,938 —Sweden . . . . . . . . . . . . . . . . . . . . . . . . . . . . . . . . . . . . . . . . . 169,742,963 50,549,772 119,193,191 —Switzerland . . . . . . . . . . . . . . . . . . . . . . . . . . . . . . . . . . . . . . 880,408,922 — 880,408,922 —United Kingdom . . . . . . . . . . . . . . . . . . . . . . . . . . . . . . . . . . 1,180,153,340 13,900,482 1,166,252,858 —All Other Countries . . . . . . . . . . . . . . . . . . . . . . . . . . . . . . . . 1,185,029,795 1,185,029,795 — —
Preferred Stocks . . . . . . . . . . . . . . . . . . . . . . . . . . . . . . . . . . . . . . . 30,872,918 30,872,918 — —Registered Investment Company . . . . . . . . . . . . . . . . . . . . . . . . . . 87,362,663 87,362,663 — —U.S. Treasury Bill . . . . . . . . . . . . . . . . . . . . . . . . . . . . . . . . . . . . . . 124,997,743 — 124,997,743 —Total Investments in Securities . . . . . . . . . . . . . . . . . . . . . . . . . . . 6,185,120,735 1,412,078,693 4,773,042,042 —
Other Financial Instruments:Asset
Unrealized appreciation of forward exchange contracts . . . . . 84,119,111 — 84,119,111 —Liability
Unrealized depreciation of forward exchange contracts . . . . . (18,275,407) — (18,275,407) —Total . . . . . . . . . . . . . . . . . . . . . . . . . . . . . . . . . . . . . . . . $6,250,964,439 $1,412,078,693 $4,838,885,746 $ —
International Value Fund II – Currency Unhedged
TotalValue at
March 31, 2022
Level 1QuotedPrice
Level 2Other
SignificantObservable
Inputs
Level 3Significant
UnobservableInputs
Investments in Securities:Common Stocks
Belgium . . . . . . . . . . . . . . . . . . . . . . . . . . . . . . . . . . . . . . . . . $ 1,457,028 $ — $ 1,457,028 $ —China . . . . . . . . . . . . . . . . . . . . . . . . . . . . . . . . . . . . . . . . . . 32,795,181 1,187,947 31,607,234 —Finland . . . . . . . . . . . . . . . . . . . . . . . . . . . . . . . . . . . . . . . . . 2,068,103 — 2,068,103 —France . . . . . . . . . . . . . . . . . . . . . . . . . . . . . . . . . . . . . . . . . . 66,236,819 7,330,217 58,906,602 —Germany . . . . . . . . . . . . . . . . . . . . . . . . . . . . . . . . . . . . . . . . 39,969,638 — 39,969,638 —Hong Kong . . . . . . . . . . . . . . . . . . . . . . . . . . . . . . . . . . . . . . 9,709,340 978,497 8,730,843 —Italy . . . . . . . . . . . . . . . . . . . . . . . . . . . . . . . . . . . . . . . . . . . . 5,593,069 — 5,593,069 —Japan . . . . . . . . . . . . . . . . . . . . . . . . . . . . . . . . . . . . . . . . . . . 26,631,270 — 26,631,270 —Netherlands . . . . . . . . . . . . . . . . . . . . . . . . . . . . . . . . . . . . . . 9,218,477 — 9,218,477 —Philippines . . . . . . . . . . . . . . . . . . . . . . . . . . . . . . . . . . . . . . . 1,690,212 — 1,690,212 —Singapore . . . . . . . . . . . . . . . . . . . . . . . . . . . . . . . . . . . . . . . . 23,061,908 — 23,061,908 —South Korea . . . . . . . . . . . . . . . . . . . . . . . . . . . . . . . . . . . . . . 12,533,934 — 12,533,934 —Sweden . . . . . . . . . . . . . . . . . . . . . . . . . . . . . . . . . . . . . . . . . 15,722,929 2,933,767 12,789,162 —Switzerland . . . . . . . . . . . . . . . . . . . . . . . . . . . . . . . . . . . . . . 62,349,967 — 62,349,967 —Thailand . . . . . . . . . . . . . . . . . . . . . . . . . . . . . . . . . . . . . . . . 4,993,872 — 4,993,872 —United Kingdom . . . . . . . . . . . . . . . . . . . . . . . . . . . . . . . . . . 99,255,695 2,338,803 96,916,892 —All Other Countries . . . . . . . . . . . . . . . . . . . . . . . . . . . . . . . . 89,927,767 89,927,767 — —
Preferred Stocks . . . . . . . . . . . . . . . . . . . . . . . . . . . . . . . . . . . . . . .Chile . . . . . . . . . . . . . . . . . . . . . . . . . . . . . . . . . . . . . . . . . . . 1,753,679 1,753,679 — —Germany . . . . . . . . . . . . . . . . . . . . . . . . . . . . . . . . . . . . . . . . 1,119,257 — 1,119,257 —
Registered Investment Company . . . . . . . . . . . . . . . . . . . . . . . . . . 12,333,052 12,333,052 — —Total . . . . . . . . . . . . . . . . . . . . . . . . . . . . . . . . . . . . . . . . $ 518,421,197 $ 118,783,729 $ 399,637,468 $ —
II-39

Notes to Financial Statements
Value Fund
TotalValue at
March 31, 2022
Level 1QuotedPrice
Level 2Other
SignificantObservable
Inputs
Level 3Significant
UnobservableInputs
Investments in Securities:Common Stocks
Belgium . . . . . . . . . . . . . . . . . . . . . . . . . . . . . . . . . . . . . . . . . $ 1,181,730 $ — $ 1,181,730 $ —China . . . . . . . . . . . . . . . . . . . . . . . . . . . . . . . . . . . . . . . . . . 24,437,163 860,572 23,576,591 —Finland . . . . . . . . . . . . . . . . . . . . . . . . . . . . . . . . . . . . . . . . . 2,239,504 — 2,239,504 —France . . . . . . . . . . . . . . . . . . . . . . . . . . . . . . . . . . . . . . . . . . 38,342,464 2,130,924 36,211,540 —Germany . . . . . . . . . . . . . . . . . . . . . . . . . . . . . . . . . . . . . . . . 28,838,320 — 28,838,320 —Hong Kong . . . . . . . . . . . . . . . . . . . . . . . . . . . . . . . . . . . . . . 5,207,816 — 5,207,816 —Italy . . . . . . . . . . . . . . . . . . . . . . . . . . . . . . . . . . . . . . . . . . . . 3,084,924 — 3,084,924 —Japan . . . . . . . . . . . . . . . . . . . . . . . . . . . . . . . . . . . . . . . . . . . 12,518,620 — 12,518,620 —Netherlands . . . . . . . . . . . . . . . . . . . . . . . . . . . . . . . . . . . . . . 10,083,400 — 10,083,400 —Philippines . . . . . . . . . . . . . . . . . . . . . . . . . . . . . . . . . . . . . . . 1,580,496 — 1,580,496 —Singapore . . . . . . . . . . . . . . . . . . . . . . . . . . . . . . . . . . . . . . . . 9,057,090 — 9,057,090 —South Korea . . . . . . . . . . . . . . . . . . . . . . . . . . . . . . . . . . . . . . 5,443,880 — 5,443,880 —Sweden . . . . . . . . . . . . . . . . . . . . . . . . . . . . . . . . . . . . . . . . . 13,089,335 2,524,125 10,565,210 —Switzerland . . . . . . . . . . . . . . . . . . . . . . . . . . . . . . . . . . . . . . 35,483,734 15,453,278 20,030,456 —United Kingdom . . . . . . . . . . . . . . . . . . . . . . . . . . . . . . . . . . 51,339,878 21,188,375 30,151,503 —All Other Countries . . . . . . . . . . . . . . . . . . . . . . . . . . . . . . . . 178,145,142 178,145,142 — —
Preferred Stock . . . . . . . . . . . . . . . . . . . . . . . . . . . . . . . . . . . . . . . . 917,883 917,883 — —Registered Investment Company . . . . . . . . . . . . . . . . . . . . . . . . . . 5,359,977 5,359,977 — —U.S. Treasury Bill . . . . . . . . . . . . . . . . . . . . . . . . . . . . . . . . . . . . . . 8,994,885 — 8,994,885 —Total Investments in Securities . . . . . . . . . . . . . . . . . . . . . . . . . . . 435,346,241 226,580,276 208,765,965 —
Other Financial Instruments:Asset
Unrealized appreciation of forward exchange contracts . . . . . 4,955,679 — 4,955,679 —Liability
Unrealized depreciation of forward exchange contracts . . . . . (930,211) — (930,211) —Total . . . . . . . . . . . . . . . . . . . . . . . . . . . . . . . . . . . . . . . . $439,371,709 $226,580,276 $212,791,433 $ —
Worldwide High Dividend Yield Value Fund
TotalValue at
March 31, 2022
Level 1QuotedPrice
Level 2Other
SignificantObservable
Inputs
Level 3Significant
UnobservableInputs
Investments in Securities:Common Stocks
China . . . . . . . . . . . . . . . . . . . . . . . . . . . . . . . . . . . . . . . . . . $ 1,909,029 $ — $ 1,909,029 $ —Finland . . . . . . . . . . . . . . . . . . . . . . . . . . . . . . . . . . . . . . . . . 1,486,174 — 1,486,174 —France . . . . . . . . . . . . . . . . . . . . . . . . . . . . . . . . . . . . . . . . . . 10,026,973 2,316,268 7,710,705 —Germany . . . . . . . . . . . . . . . . . . . . . . . . . . . . . . . . . . . . . . . . 5,904,990 1,707,407 4,197,583 —Hong Kong . . . . . . . . . . . . . . . . . . . . . . . . . . . . . . . . . . . . . . 3,989,639 — 3,989,639 —Japan . . . . . . . . . . . . . . . . . . . . . . . . . . . . . . . . . . . . . . . . . . . 3,098,009 — 3,098,009 —Singapore . . . . . . . . . . . . . . . . . . . . . . . . . . . . . . . . . . . . . . . . 3,605,576 — 3,605,576 —South Korea . . . . . . . . . . . . . . . . . . . . . . . . . . . . . . . . . . . . . . 839,298 — 839,298 —Sweden . . . . . . . . . . . . . . . . . . . . . . . . . . . . . . . . . . . . . . . . . 4,196,061 835,107 3,360,954 —Switzerland . . . . . . . . . . . . . . . . . . . . . . . . . . . . . . . . . . . . . . 9,454,393 — 9,454,393 —United Kingdom . . . . . . . . . . . . . . . . . . . . . . . . . . . . . . . . . . 12,157,556 — 12,157,556 —All Other Countries . . . . . . . . . . . . . . . . . . . . . . . . . . . . . . . . 22,486,997 22,486,997 — —
Registered Investment Company . . . . . . . . . . . . . . . . . . . . . . . . . . 4,031,593 4,031,593 — —Total . . . . . . . . . . . . . . . . . . . . . . . . . . . . . . . . . . . . . . . . $ 83,186,288 $ 31,377,372 $ 51,808,916 $ —
Foreign Currency. The books and records of the Fundsare maintained in U.S. dollars. Foreign currencies,investments and other assets and liabilities are translated intoU.S. dollars at the exchange rates prevailing at the end of theperiod, and purchases and sales of investment securities,income and expenses are translated on the respective dates ofsuch transactions. Unrealized gains and losses frominvestments in securities that result from changes in foreign
currency exchange rates, have been included in net unrealizedappreciation/depreciation of securities. All other unrealizedgains and losses that result from changes in foreign currencyexchange rates have been included in net unrealizedappreciation/depreciation of foreign currencies and net otherassets. Net realized foreign currency gains and losses resultingfrom changes in exchange rates include foreign currency gainsand losses between trade date and settlement date on
II-40

Notes to Financial Statements
investments, securities transactions, foreign currencytransactions and the difference between the amounts ofinterest and dividends recorded on the books of a Fund andthe amount actually received. The portion of foreign currencygains and losses related to fluctuation in the exchange ratesbetween the initial purchase trade date and subsequent saletrade date is included in realized gains and losses oninvestment securities sold.
Forward Exchange Contracts. International Value Fundand Value Fund enter into forward exchange contracts forhedging purposes in order to reduce their exposure tofluctuations in foreign currency exchange on their portfolioholdings. Forward exchange contracts are valued at the forwardrate and are marked-to-market daily. The change in marketvalue is recorded by each Fund as an unrealized gain or loss onthe Fund’s Statement of Operations. When the contract isclosed, each Fund records a realized gain or loss on theStatement of Operations equal to the difference between thevalue of the contract at the time that it was opened and thevalue of the contract at the time that it was closed. Thedifference between the value of a Fund’s open contracts atMarch 31, 2022 and the value of those contracts at the timethey were opened is included on the Statement of Assets andLiabilities as unrealized appreciation of forward exchangecontracts (for contracts with unrealized gains) or unrealizeddepreciation of forward exchange contracts (for contracts withunrealized losses). A Fund may be required to post collateralwith respect to certain “non-deliverable” forward exchangecontracts in an unrealized loss position, and may receivecollateral from the counterparty for certain non-deliverableforward exchange contracts in an unrealized gain position.Collateral is usually in the form of cash or U.S. Treasury Bills.Daily movement of collateral is subject to minimum thresholdamounts. Collateral posted by a Fund is held in a segregatedaccount at the Fund’s custodian bank, and is reported on theStatement of Assets and Liabilities as Cash segregated ascollateral. Collateral received by a Fund is held in escrow in theFund’s custodian bank, and is not reported on the Fund’sStatement of Assets and Liabilities, but would be disclosed inNote 8.
The use of forward exchange contracts does not eliminatefluctuations in the underlying prices of the International ValueFund’s and Value Fund’s investment securities, but it doesestablish a rate of exchange that can be achieved in the future.Although forward exchange contracts limit the risk of loss dueto a decline in the value of the hedged currency, they also limitany potential gain that might result should the value of thehedged currency increase. In addition, the International Valueand Value Funds could be exposed to risks if the counterpartiesto the contracts are unable to meet the terms of their contracts.
Securities Transactions and Investment Income.Securities transactions are recorded as of the trade date.Realized gains and losses from securities transactions arerecorded on the identified cost basis. Dividend income anddistributions to shareholders are recorded on the ex-dividend
date. In the case of certain foreign securities, dividend incomeis recorded as soon after the ex-date as the Funds becomeaware of such dividend. Interest income and expenses arerecorded on an accrual basis.
Foreign Taxes. The Funds may be subject to foreign taxeson dividend and interest income, gains on investments orcurrency purchase/repatriation, all or a portion of which maybe recoverable. Each Fund applies for refunds where available.The Funds will accrue such taxes and recoveries as applicable,based on their current interpretation of tax rules andregulations that exist in the markets in which they invest.
As a result of several court rulings in certain Europeancountries, the Funds may also file withholding tax reclaims incertain jurisdictions to recover all or a portion of amountswithheld in prior periods that may now be reclaimable. Anypayments received on such withholding tax reclaims areincluded in Other Income in the Statements of Operationsand are recorded when the amount is known and there are nosignificant uncertainties on collectability.
Dividends and Distributions to Shareholders. Dividendsfrom net investment income, if any, will be declared and paidannually for International Value Fund, International ValueFund II – Currency Unhedged, and Value Fund and semi-annually for Worldwide High Dividend Yield Value Fund.Distributions from realized capital gains after utilization ofcapital loss carryforwards, if any, will be declared and paidannually for each of the Funds. Additional distributions of netinvestment income and capital gains from the Funds may bemade at the discretion of the Board of Directors in order toavoid the application of a 4% non-deductible federal excise taxon certain undistributed amounts of ordinary income andcapital gains. Income dividends and capital gain distributionsare determined in accordance with income tax regulationswhich may differ from U.S. GAAP. These differences areprimarily due to differing treatments of income and gains onvarious investment securities held by the Funds, timingdifferences and differing characterization of distributions madeby the Funds.
Federal Income Taxes. Each Fund has qualified and intendsto continue to qualify as a regulated investment company bycomplying with the requirements of the U.S. Internal RevenueCode of 1986, as amended (the “Code”), applicable to regulatedinvestment companies and by distributing substantially all of itstaxable income to its shareholders. Therefore, no federal incometax provision is required.
The Funds are not aware of any events that are reasonablypossible to occur in the next twelve months that would resultin the amounts of any unrecognized tax benefits significantlyincreasing or decreasing for the Funds. However, the Funds’conclusions may be subject to future review based on changesin accounting standards or tax laws and regulations or theinterpretation thereof. In addition, utilization of any capital
II-41

Notes to Financial Statements
loss carryforwards could be subject to limitations imposed bythe Code related to share ownership changes. Each of theFunds’ tax positions for the tax years for which the applicablestatutes of limitations have not expired are subject toexamination by the Internal Revenue Service, statedepartments of revenue and by foreign tax authorities.
Expenses. Expenses directly attributable to each Fund as adiversified series of the Company are charged to such Fund.Other expenses of the Company are allocated to each seriesbased on the average net assets of each series or otherequitable allocation method.
3. Investment Advisory Fee, Other Related PartyTransactions and Administration Fee
The Company, on behalf of each Fund, has entered intoseparate investment advisory agreements with the InvestmentAdviser (each, an “Advisory Agreement”). Under theAdvisory Agreement with respect to International ValueFund, International Value Fund pays the Investment Advisera fee at the annual rate of 1.25% on the Fund’s average dailynet assets up to $10.3 billion, and 0.75% on the remainingamount, if any. Under the Advisory Agreements with respectto each of International Value Fund II – Currency Unhedged,Value Fund and Worldwide High Dividend Yield Value Fund,each Fund pays the Investment Adviser a fee at the annualrate of 1.25% of the Fund’s average daily net assets. The fee ispayable monthly, provided that each Fund makes interimpayments as may be requested by the Investment Adviser ofup to 75% of the amount of the fee then accrued on the booksof the Fund and unpaid. For the year ended March 31, 2022,the Investment Adviser earned $81,714,296, $6,669,091,$5,519,019 and $1,200,373 in fees, prior to any waivers and/orreimbursements, from International Value Fund,International Value Fund II – Currency Unhedged, ValueFund and Worldwide High Dividend Yield Value Fund,respectively.
With respect to International Value Fund, the InvestmentAdviser has entered into a voluntary fee waiver agreementwith the Fund pursuant to which the Investment Adviser isentitled to receive investment advisory fees from the Fund atan annual rate of 1.25% on the first $6 billion of the Fund’saverage daily net assets, 0.80% on the next $1 billion of theFund’s average daily net assets over $6 billion up to $7 billion,0.70% on the next $1 billion of the Fund’s average daily netassets over $7 billion up to $8 billion, and 0.60% on theremaining amount, if any, of average daily net assets over$8 billion. This arrangement with International Value Fundwill remain in place at least through July 31, 2023. For theyear ended March 31, 2022, the Investment Adviser waived$2,422,733 in fees from International Value Fund.
With respect to International Value Fund II – CurrencyUnhedged, Value Fund and Worldwide High Dividend YieldValue Fund, the Investment Adviser has voluntarily agreed towaive a portion of each Fund’s investment advisory feesand/or reimburse a portion of each Fund’s expenses to the
extent necessary to keep each Fund’s expense ratio in linewith the expense ratio of International Value Fund. (Forpurposes of this calculation, each Fund’s acquired fund feesand expenses, brokerage costs, interest, taxes andextraordinary expenses are disregarded, and each Fund’sexpense ratio is rounded to two decimal points.) Thisarrangement will remain in place at least through July 31,2023. For the year ended March 31, 2022, the InvestmentAdviser waived and/or reimbursed $134,590, $199,819 and$132,319 in fees from International Value Fund II – CurrencyUnhedged Fund, Value Fund and Worldwide High DividendYield Value Fund, respectively.
The Company pays the Investment Adviser for certainshareholder servicing and administration services provided tothe Funds at an annual amount of $475,000, which is allocatedpro-rata based on the relative average net assets of the Funds.
No officer, director or employee of the InvestmentAdviser, the Funds’ administrator, The Bank of New YorkMellon (“BNY Mellon”) or any parent or subsidiary of thosecorporations receives any compensation from the Companyfor serving as a director or officer of the Company. TheCompany pays each Independent Director $135,000 annually,in quarterly increments of $33,750, plus out-of-pocketexpenses for their services as directors. (Prior to January 1,2022, such amounts were $130,000 and $32,500, respectively).The Lead Independent Director receives an additional annualfee of $27,000. (Prior to January 1, 2022, such amount was$26,000). These fees are allocated pro-rata based on therelative average net assets of the Funds.
The Company, on behalf of the Funds, has entered into anadministration agreement (the “Administration Agreement”)with BNY Mellon, a subsidiary of The Bank of New YorkMellon Corporation. Under the Administration Agreement,the Company pays BNY Mellon an administration fee and afund accounting fee computed daily and payable monthly atthe following annual rates of the aggregate average daily netassets of the Funds, allocated according to each Fund’s netassets:
Up to$1 Billion
Between$1 Billion
and$5 Billion
Between$5 Billion
and$10 Billion
Exceeding$10 Billion
Administration Fees 0.0300% 0.0180% 0.0100% 0.0090%
Accounting Fees 0.0075% 0.0060% 0.0050% 0.0040%
BNY Mellon, serves as the Funds’ custodian pursuant to acustody agreement. BNY Mellon Investment Servicing (US)Inc., a subsidiary of The Bank of New York MellonCorporation, serves as the Funds’ transfer agent.
AMG Distributors, Inc., an affiliate of the InvestmentAdviser, serves as the distributor to the Funds. TheInvestment Adviser pays all distribution-related expenses. Nodistribution fees are paid by the Funds.
II-42

Notes to Financial Statements
At March 31, 2022, excluding unaffiliated platforms that hold shares of the Funds via omnibus accounts, the Funds areaware of one shareholder who owned 9.7% of International Value Fund II – Currency Unhedged’s outstanding shares; threeshareholders who collectively owned 34.3% of Value Fund’s outstanding shares; and two shareholders who collectively owned19.5% of Worldwide High Dividend Yield Value Fund’s outstanding shares. Significant transactions by these shareholders couldhave an impact on each respective Fund.
4. Securities TransactionsThe 1940 Act defines “affiliated companies” to include securities in which a fund owns 5% or more of the outstanding voting
shares of an issuer. The following chart lists the issuers owned by International Value Fund that may be deemed “affiliatedcompanies,” as well as transactions that occurred in the securities of such issuers during the year ended March 31, 2022:
Shares Heldat 3/31/21 Name of Issuer†
Value at3/31/21
PurchaseCost
SalesProceeds
Value at3/31/22
Shares Heldat 3/31/22
DividendIncome 4/1/21
to 3/31/22
Net Realized Gain(Loss) 4/1/21
to 3/31/22
Change inNet UnrealizedDepreciation
4/1/21 to3/31/22
24,740Lassonde Industries,
Inc., Class A $ 3,385,671 $28,604,468 $ — $28,702,396 251,390 $377,513 $ — $(3,287,743)
68,178 Phoenix Mecano AG 33,178,052 — — 28,955,728 68,178 486,741 — (4,222,324)
$36,563,723 $28,604,468 $ — $57,658,124 $864,254 $ — $(7,510,067)
† Issuer countries: Canada and Switzerland, respectively.
None of the other Funds owned 5% or more of the outstanding voting shares of any issuer.
The cost of purchases and proceeds from sales of investment securities, excluding short-term investments, for the year endedMarch 31, 2022, are as follows:
InternationalValue Fund
InternationalValue Fund II –
CurrencyUnhedged Value Fund
WorldwideHigh
DividendYield
Value Fund
Purchases $651,828,089 $84,927,246 $81,610,352 $14,534,686Sales $913,067,579 $40,819,450 $83,905,032 $42,071,049
5. Capital StockThe Company is authorized to issue 2.0 billion shares of $0.0001 par value capital stock, of which 600,000,000,
600,000,000, 400,000,000 and 400,000,000 shares have been designated as shares of International Value Fund, InternationalValue Fund II – Currency Unhedged, Value Fund and Worldwide High Dividend Yield Value Fund, respectively. Changes inshares outstanding were as follows:
Year EndedMarch 31, 2022
Year EndedMarch 31, 2021
International Value Fund Shares Amount Shares Amount
Sold 22,490,002 $ 670,012,086 26,120,514 $661,002,269Reinvested 17,304,813 493,187,163 1,905,087 51,475,438Redeemed (34,000,476) (1,015,307,665) (82,160,023) (2,050,583,007)Net Decrease 5,794,339 $147,891,584 (54,134,422) $(1,338,105,300)
International Value Fund II – Currency Unhedged Shares Amount Shares Amount
Sold 4,671,606 $78,851,422 9,923,658 $138,555,658Reinvested 279,644 4,616,915 230,542 3,481,184Redeemed (2,866,443) (48,010,071) (12,456,102) (166,168,014)Net Increase (Decrease) 2,084,807 $35,458,266 (2,301,902) $(24,131,172)
Value Fund Shares Amount Shares Amount
Sold 939,346 $18,730,742 1,228,145 $21,208,718Reinvested 2,438,808 46,776,331 416,787 7,760,578Redeemed (1,250,676) (25,720,816) (2,751,770) (49,312,321)Net Decrease 2,127,478 $39,786,257 (1,106,838) $(20,343,025)
II-43

Notes to Financial Statements
Year EndedMarch 31, 2022
Year EndedMarch 31, 2021
Worldwide High Dividend Yield Value Fund Shares Amount Shares Amount
Sold 725,038 $5,318,233 956,549 $6,795,622Reinvested 2,669,981 17,407,626 1,205,081 8,695,565Redeemed (4,624,089) (35,494,692) (5,159,712) (36,676,716)
Net Decrease (1,229,070) $(12,768,833) (2,998,082) $(21,185,529)
6. Income Tax InformationThe character of distributions paid on a tax basis during
the fiscal year ended March 31, 2022 is as follows:
Distributionspaid from:
InternationalValue Fund
InternationalValue
Fund II –CurrencyUnhedged Value Fund
WorldwideHigh
DividendYield
Value Fund
Ordinary income $ 90,369,663 $5,666,910 $ 3,766,356 $ 2,970,433
Long-term capitalgain 453,148,367 — 44,707,660 14,799,450
Total Distributions $543,518,030 $5,666,910 $48,474,016 $17,769,883
The character of distributions paid on a tax basis duringthe fiscal year ended March 31, 2021 is as follows:
Distributionspaid from:
InternationalValue Fund
InternationalValue
Fund II –CurrencyUnhedged Value Fund
WorldwideHigh
DividendYield
Value Fund
Ordinary income $57,684,545 $3,226,605 $4,145,465 $2,131,591
Long-term capitalgain — 1,171,352 3,975,024 6,722,840
Total Distributions $57,684,545 $4,397,957 $8,120,489 $8,854,431
As of March 31, 2022, the components of distributableearnings on a tax basis were as follows:
InternationalValue Fund
InternationalValue
Fund II –CurrencyUnhedged Value Fund
WorldwideHigh
DividendYield
Value Fund
Undistributedordinaryincome $ 33,978,224 $ 287,696 $ 1,639,542 $ 161,765
Undistributedlong-termcapital gain 195,229,757 — 19,973,296 5,417,923
Unrealizedappreciation/(depreciation) 2,508,584,359 94,654,389 170,024,033 19,128,560
Accumulatedcapital andother losses — (10,331,884) — (1,784)
Total $2,737,792,340 $84,610,201 $191,636,871 $24,706,464
The Funds may have temporary or permanent book/taxdifferences. Permanent differences are due to tax equalizationutilized. Temporary differences are due to capital losscarryforwards, mark-to-market on forward contracts, mark-to-
market on passive foreign investment companies, wash saleloss deferrals and partnership transactions. Temporarydifferences will reverse at some time in the future.Reclassifications are recorded to the Funds’ capital accountsfor any permanent tax differences to reflect income and gainsavailable for distribution (or available capital losscarryforwards) under income tax regulations. For the yearended March 31, 2022, permanent book and tax basisdifferences resulting primarily from the utilization ofequalization were identified and reclassified among thecomponents of each Fund’s net assets as follows:
InternationalValue Fund
InternationalValue
Fund II –CurrencyUnhedged Value Fund
WorldwideHigh
DividendYield
Value FundDistributable earnings $(19,011,280) $ — $(651,841) $(1,158,227)Paid-in capital 19,011,280 — 651,841 1,158,227
Results of operations and net assets were not affected bythese reclassifications.
As of March 31, 2022, International Value Fund II –Currency Unhedged had a short-term capital losscarryforward of $24 and a long-term capital loss carryforwardof $10,331,243, which under current federal income tax rulesmay be available to reduce future net realized gains oninvestments in any future period to the extent permitted bythe Code. Utilization of this capital loss carryforward could besubject to limitations imposed by the Code related to shareownership changes. During the year ended March 31, 2022,International Value Fund II – Currency Unhedged utilized$5,985,602 in capital loss carry forwards.
As of March 31, 2022, the aggregate cost of securities ineach Fund’s portfolio for federal tax purposes is as follows:
International Value Fund $3,679,972,594International Value Fund II – Currency Unhedged $423,736,142Value Fund $265,303,579Worldwide High Dividend Yield Value Fund $64,049,627
II-44

Notes to Financial Statements
The aggregate gross unrealized appreciation/depreciationand net unrealized appreciation as computed on a federalincome tax basis at March 31, 2022 for each Fund is asfollows:
GrossAppreciation
GrossDepreciation
NetAppreciation
(Depreciation)
International Value Fund $2,760,316,925 $(251,732,566) $2,508,584,359
International Value Fund II –Currency Unhedged 138,241,364 (43,586,975) 94,654,389
Value Fund 191,006,514 (20,982,481) 170,024,033
Worldwide High DividendYield Value Fund 22,619,603 (3,491,043) 19,128,560
7. Foreign Securities and Certain Other RisksInvesting in foreign securities involves additional risks
beyond those associated with investing in U.S. securities.These risks, which are more pronounced in emerging markets,include changes in exchange rates and exchange rate controls(which may include suspension of the ability to transfercurrency from a given country); costs incurred in conversionsbetween currencies; non-negotiable brokerage commissions;less publicly available information; not generally being subjectto uniform standards, practices and requirements with respectto accounting, auditing and financial reporting; lower tradingvolume and/or liquidity; delayed settlements; greater marketvolatility; the difficulty in enforcing obligations andcontractual and other rights; less securities regulation;different tax provisions (including withholding on interestand dividends paid to a Fund), less well established contractlaw; war, seizure, political and social instability anddiplomatic developments.
Each Fund may invest in securities of Chinese issuers.Investments in securities of companies domiciled in thePeople’s Republic of China (“China”) involve a high degreeof risk and special considerations not typically associated withinvesting in other foreign or emerging securities markets.Such heightened risks include, among others: (a) militaryconflicts; (b) an authoritarian government, which, despitereforms and privatizations of companies in certain sectors, stillexercises substantial influence over many aspects of theprivate sector, resulting in risks of losses due to expropriation,nationalization, confiscation of assets and property, and theimposition of restrictions on foreign investments and onrepatriation of capital invested; (c) less regulatory oversight ofissuers, brokers and other market participants; (d) currencyrisks associated with the Chinese Renminbi, includingpossible liquidity disruptions and the interference withconversion rights; (e) tax rules; (f) less rigorous accounting,auditing and financial reporting standards and practices thaninternational accounting standards, which may result insignificant differences in the preparation of financialstatements; and (g) to the extent investments are madethrough Stock Connect, a program that allows non-Chineseinvestors to invest in Chinese stocks and China A-Shares,
substantial limitations imposed by the program, including,among other things, market wide quota limitations, newtechnologies risks, bans on day-trading, different tradingholidays, and the sudden loss of a security’s eligibility to tradein the program.
The consequences of the conflict between Russia andUkraine, including international sanctions, the potentialimpact on inflation and increased disruption to supply chainsmay impact the Funds’ portfolio companies, result in aneconomic downturn or recession either globally or locally inthe U.S. or other economies, reduce business activity, spawnadditional conflicts (whether in the form of traditionalmilitary action, reignited “cold” wars or in the form of virtualwarfare such as cyberattacks) with similar and perhaps widerranging impacts and consequences and have an adverseimpact on the Funds’ returns and net asset value.
Each Fund invests a significant portion of its assets insecurities of issuers located in Europe. The European financialmarkets have experienced, and may continue to experience,severe economic and financial difficulties, including risksassociated with high levels of debt and negative interest rates.Among other things, these developments have adverselyaffected the value and exchange rate of the Euro and othercurrencies, and may continue to significantly affect theeconomies of European countries, which in turn may have amaterial adverse effect on the Funds’ investments in suchcountries, other countries that depend on European countriesfor significant amounts of trade or investment, or issuers withexposure to debt issued by certain European countries,particularly to the extent a Fund does not hedge its exposureto foreign currency.
Actions taken by European governments, central banksand others, including austerity measures and reforms, may notwork, may result in social unrest, and may limit future growthand economic recovery or have other unintendedconsequences. In addition, the United Kingdom haswithdrawn from the European Union, and one or more othercountries may withdraw from the European Union and/orabandon the Euro, the common currency of the EuropeanUnion, which could place its currency and banking system injeopardy, cause additional market disruption globally, andintroduce new legal and regulatory uncertainties. The impactof these actions, especially if they occur in a disorderlyfashion, could be significant and far reaching and could affectthe value and liquidity of the Funds’ investments.
The outbreak of the novel coronavirus (“COVID-19”) andsubsequent global pandemic has significantly impacted theglobal economy, individual companies, and financial marketsin general and throughout the world, and has createdsignificant uncertainty. The duration and extent of COVID-19over the long-term cannot be reasonably estimated at this time.The ultimate impact of COVID-19 and the extent to whichCOVID-19 will impact each Fund’s normal course of business,
II-45
Notes to Financial Statements
results of operations, investments, and cash flows will dependon future developments, which are highly uncertain anddifficult to predict.
8. Derivative InstrumentsDuring the year ended March 31, 2022, International
Value Fund and Value Fund had derivative exposure toforward foreign currency exchange contracts. The primaryunderlying risk exposure for these derivatives is foreigncurrency risk. International Value Fund II – CurrencyUnhedged and Worldwide High Dividend Yield Value Fundhad no exposure to derivatives. For open contracts atMarch 31, 2022, see the Portfolio of Investments.
The following summarizes the volume of the InternationalValue and Value Funds’ forward foreign currency exchangecontract activity during the year ended March 31, 2022:
International Value Fund Value Fund
Average Notional Amount $(3,332,461,390) $(158,961,857)
Notional Amount at March 31, 2022 $(3,159,993,864) $(156,889,725)
The following table presents the value of derivatives heldas of March 31, 2022, by their respective location on theStatements of Assets and Liabilities:
Statement of Assets and Liabilities
Derivative Assets Location International Value Fund Value Fund
Forwardexchangecontracts
Unrealizedappreciation offorward exchangecontracts $84,119,111 $4,955,679
Derivative Liabilities Location International Value Fund Value Fund
Forwardexchangecontracts
Unrealizeddepreciation offorward exchangecontracts $18,275,407 $930,211
The following table presents the effect of derivatives onthe Statements of Operations for the year ended March 31,2022:
Statement of Operations
Derivative Location International Value Fund Value Fund
Forwardexchangecontracts
Net realized gain (loss)on forward exchangecontracts $(50,062,159) $(4,711,616)
Derivative Location International Value Fund Value Fund
Forwardexchangecontracts
Net change inunrealized appreciation(depreciation) of forwardexchange contracts $125,062,959 $8,047,488
For financial reporting purposes, the Funds do not offsetassets and liabilities across derivative types that are subject tomaster netting arrangements on the Statements of Assets andLiabilities.
The following table presents derivative assets net ofamounts available for offset under a master netting agreementand any related collateral received by the Fund for forwardcurrency contracts as of March 31, 2022:
CounterpartyDerivative
Assets – Gross(a)
DerivativesAvailablefor Offset
CollateralReceived
DerivativeAssets – Net(b)
International Value FundBNY $24,358,060 $ 4,425,956 $ — $19,932,104
JPM 19,283,037 4,487,991 2,130,000 12,665,046
NTC 22,549,061 2,833,556 — 19,715,505
SSB 17,928,953 6,527,904 — 11,401,049
Total $84,119,111 $18,275,407 $2,130,000 $63,713,704
Value FundBNY $ 3,128,378 $ 156,455 $ — $ 2,971,923
JPM 773,571 316,928 270,000 186,643
NTC 589,634 161,125 — 428,509
SSB 464,096 295,703 — 168,393
Total $ 4,955,679 $ 930,211 $ 270,000 $ 3,755,468
The following table presents derivative liabilities net ofamounts available for offset under a master netting agreementand any related collateral posted by the Fund for forwardcurrency contracts as of March 31, 2022:
CounterpartyDerivative
Liabilities – Gross(a)
DerivativesAvailablefor Offset
CollateralPosted
DerivativeLiabilities – Net(c)
International Value FundBNY $ 4,425,956 $ 4,425,956 $— $—
JPM 4,487,991 4,487,991 — —
NTC 2,833,556 2,833,556 — —
SSB 6,527,904 6,527,904 — —
Total $18,275,407 $18,275,407 $— $—
Value FundBNY $ 156,455 $ 156,455 $— $—
JPM 316,928 316,928 — —
NTC 161,125 161,125 — —
SSB 295,703 295,703 — —
Total $ 930,211 $ 930,211 $— $—
(a) As presented in the Statement of Assets and Liabilities.(b) Net amount represents the net receivable due from counterparty in the
event of default.(c) Net amount represents the net payable due to counterparty in the event
of default.
Counterparty Abbreviations:BNY — The Bank of New York MellonJPM — JPMorgan Chase Bank NA
NTC — Northern Trust CompanySSB — State Street Bank and Trust Company
II-46

Notes to Financial Statements
9. Committed Line of CreditEffective May 27, 2021, the Company, acting on behalf of
and for the account of each Fund, has entered into a line ofcredit agreement with BNY Mellon (the “Credit Agreement”)that established a revolving credit facility of $50,000,000 (the“Facility”) that may be used by the Funds for certaintemporary or emergency purposes, including the meeting ofredemption requests. Effective March 23, 2022, the revolvingcredit facility amount was increased to $75,000,000. EachFund pays a commitment fee of 0.25% per annum on its prorata share of the unused portion of the committed line. Theinterest rate on borrowing under the Credit Agreement is thehigher of the Federal Funds Effective Rate or the securedovernight financing rate (SOFR) (previously, the daily One-Month LIBOR Rate) plus applicable margin of 1.25%. TheFacility has a 364-day term currently in effect throughMarch 22, 2023.
During the period May 27, 2021 through March 31, 2022,the Worldwide High Dividend Yield Value Fund had loans
outstanding for five calendar days at a weighted averageinterest rate and average dollar amount of borrowings on daysa loan was outstanding of 1.35% and $10,000,000respectively. No other Funds borrowed under the CreditAgreement during the period. As of March 31, 2022, therewere no loans outstanding with respect to the CreditAgreement.
10. IndemnificationsUnder the Company’s organizational documents, its
directors and officers are indemnified against certain liabilitiesthat may arise out of the performance of their duties to theFunds. Additionally, in the course of business, the Companyenters into contracts that contain a variety of indemnificationclauses. The Funds’ maximum exposure under thesearrangements is unknown, as this would involve future claimsthat may be made against the Funds that have not yetoccurred. However, the Investment Adviser believes the riskof loss under these arrangements to be remote.
II-47

Report of Independent Registered Public Accounting Firm
To the Board of Directors of Tweedy, Browne Fund Inc. and Shareholders of Tweedy, Browne International Value Fund,Tweedy, Browne International Value Fund II – Currency Unhedged, Tweedy, Browne Value Fund and Tweedy, BrowneWorldwide High Dividend Yield Value Fund
Opinions on the Financial StatementsWe have audited the accompanying statements of assets and liabilities, including the portfolios of investments, of Tweedy,
Browne International Value Fund, Tweedy, Browne International Value Fund II – Currency Unhedged, Tweedy, BrowneValue Fund and Tweedy, Browne Worldwide High Dividend Yield Value Fund (constituting Tweedy, Browne Fund Inc.,hereafter collectively referred to as the “Funds”) as of March 31, 2022, the related statements of operations for the year endedMarch 31, 2022, the statements of changes in net assets for each of the two years in the period ended March 31, 2022,including the related notes, and the financial highlights for each of the five years in the period ended March 31, 2022(collectively referred to as the “financial statements”). In our opinion, the financial statements present fairly, in all materialrespects, the financial position of each of the Funds as of March 31, 2022, the results of each of their operations for the yearthen ended, the changes in each of their net assets for each of the two years in the period ended March 31, 2022 and each ofthe financial highlights for each of the five years in the period ended March 31, 2022 in conformity with accounting principlesgenerally accepted in the United States of America.
Basis for OpinionsThese financial statements are the responsibility of the Funds’ management. Our responsibility is to express an opinion on
the Funds’ financial statements based on our audits. We are a public accounting firm registered with the Public CompanyAccounting Oversight Board (United States) (PCAOB) and are required to be independent with respect to the Funds inaccordance with the U.S. federal securities laws and the applicable rules and regulations of the Securities and ExchangeCommission and the PCAOB.
We conducted our audits of these financial statements in accordance with the standards of the PCAOB. Those standardsrequire that we plan and perform the audit to obtain reasonable assurance about whether the financial statements are free ofmaterial misstatement, whether due to error or fraud.
Our audits included performing procedures to assess the risks of material misstatement of the financial statements, whetherdue to error or fraud, and performing procedures that respond to those risks. Such procedures included examining, on a testbasis, evidence regarding the amounts and disclosures in the financial statements. Our audits also included evaluating theaccounting principles used and significant estimates made by management, as well as evaluating the overall presentation of thefinancial statements. Our procedures included confirmation of securities owned as of March 31, 2022 by correspondence withthe custodian, transfer agent and brokers; when replies were not received from brokers, we performed other auditing procedures.We believe that our audits provide a reasonable basis for our opinions.
/s/PricewaterhouseCoopers LLPNew York, New YorkMay 27, 2022
We have served as the auditor of one or more investment companies in Tweedy, Browne Fund Inc. since 2004.
II-48

Other Information (Unaudited)
1. Investment in the Funds by Managing Directors andEmployees of the Investment Adviser
As of March 31, 2022, the current and retired managingdirectors and their families, as well as employees of theInvestment Adviser, have approximately $154.4 million,$7.7 million, $91.7 million and $7.6 million of their ownmoney invested in International Value Fund, InternationalValue Fund II – Currency Unhedged, Value Fund andWorldwide High Dividend Yield Value Fund, respectively.
2. Tax Information – Year Ended March 31, 2022For shareholders who do not have a March 31, 2022 tax year
end, this footnote is for informational purposes only. Form1099-DIV will be sent to shareholders in February 2023 reportingthe amounts and tax characterization of distributions for the 2022calendar year.
For the fiscal year ended March 31, 2022, the amount oflong-term capital gain designated by the Funds and taxable atthe lower capital gain rate for federal income tax purposeswas:
Fund
International Value Fund $472,159,647
International Value Fund II – Currency Unhedged $—
Value Fund $45,359,763Worldwide High Dividend Yield Value Fund $17,106,979
Of the ordinary income (including short-term capitalgain) distributions made by the Funds during the fiscal yearended March 31, 2022, the percentage that qualifies for thedividend received deduction available to corporateshareholders was:
Fund
International Value Fund 8.30%
International Value Fund II – Currency Unhedged 14.34%
Value Fund 34.76%Worldwide High Dividend Yield Value Fund 22.70%
For the fiscal year ended March 31, 2022, the percentageof the distributions paid by the Funds that qualify for thelower tax rates (qualified dividend income) applicable toindividual shareholders was:
Fund
International Value Fund 100%
International Value Fund II – Currency Unhedged 100%
Value Fund 100%Worldwide High Dividend Yield Value Fund 100%
If the Funds meet the requirements of Section 853 of theInternal Revenue Code, the Funds may elect to pass throughto their shareholders credits for foreign taxes paid.
For the fiscal year ended March 31, 2022, the grossincome derived from foreign sources and foreign taxes paidwere:
International Value Fund
Dollar Amount Per Share
Foreign Source Income $168,776,678 0.7532
Foreign Taxes 9,616,658 0.0429
International Value Fund II – Currency Unhedged
Dollar Amount Per Share
Foreign Source Income $13,373,821 0.4190
Foreign Taxes 820,306 0.0257
Value Fund
Dollar Amount Per Share
Foreign Source Income $8,394,097 0.3638
Foreign Taxes 487,692 0.0211
Worldwide High Dividend Yield Value Fund
Dollar Amount Per Share
Foreign Source Income $2,933,595 0.2225
Foreign Taxes 174,119 0.0132
3. Portfolio InformationThe Company files each Fund’s complete schedule of
portfolio holdings with the SEC for the first and third quartersof each fiscal year on Part F of Form N-PORT. TheCompany’s Part F of Form N-PORT is available on the SEC’swebsite at www.sec.gov.
4. Proxy Voting InformationThe policies and procedures that the Company uses to
determine how to vote proxies relating to portfolio securitiesheld by the Funds are included in the Company’s Statementof Additional Information, which is available without chargeand upon request by calling the Funds at 800-432-4789, byvisiting the Funds’ website at www.tweedy.com, or on theSEC’s website at www.sec.gov. Information regarding how theFunds voted proxies relating to portfolio securities during themost recent twelve-month period ended June 30 is available,without charge, at www.sec.gov.
II-49

Statement Regarding Liquidity Risk Management Program (Unaudited)
In accordance with Rule 22e-4 (the “Liquidity Rule”)under the Investment Company Act of 1940 (the “1940Act”), the Company has adopted a liquidity risk managementprogram (the “Program”) effective as of December 1, 2018.The Board of Directors (the “Board”) of the Company mostrecently reviewed the Company’s Program at a meeting heldon December 7, 2021 (the “Meeting”). Tweedy, BrowneCompany LLC (the “Investment Adviser”), the investmentadviser to the Company, serves as the administrator for theCompany’s Program. At the Meeting, the Investment Adviserprovided the Board with a report that addressed the operationand effectiveness of implementation of the Program for theperiod November 1, 2020 through October 31, 2021 (the“Report”).
The Report discussed the overall operation andeffectiveness of the Program. The Report described themethodology under the Program for categorizing each Fund’sinvestments into one of the four liquidity buckets (highlyliquid, moderately liquid, less liquid, and illiquid). The Reportnoted that each Fund continues to be “primarily invested” in
highly liquid investments (a fund is “primarily invested” inhighly liquid investments if at least 50% of the fund’s totalnet assets are represented by highly liquid investments), andthat, accordingly, each Fund is not required to establish, andhas not established, a “highly liquid investment minimum” asdefined in the Liquidity Rule. The Report also discussed eachFund’s investment strategy and liquidity of investments;short-term and long-term cash flow projections; and holdingsof cash and cash equivalents.
No significant liquidity events impacting any Fund werenoted in the Report. The Report also stated that no Fundexceeded the 15% illiquid security limit imposed by theLiquidity Rule, which requires a fund to file Form N-RN withthe SEC. In addition, the Report noted that there had beenno material changes to the Program (other than toincorporate a reference to the revolving credit facility withBNY Mellon) and that the Investment Adviser, based on itsreview of the operation of the Program and the adequacy andeffectiveness of its implementation, believes the Programcontinues to be an effective tool in seeking to manageliquidity risk and ensure compliance by the Funds with theLiquidity Rule.
II-50

Directors and Principal Officers (Unaudited)
INDEPENDENT DIRECTORS
Name, Address,1 Age andPosition(s) with Company
Term ofOffice andLength of
Time Served2Principal Occupation(s)
During at Least the Past 5 Years
Number ofPortfolios in
FundComplex
Overseen byDirector
OtherDirectorships
Held byDirector
Paul F. BalserAge: 80Director
Since 2000 Partner, Ironwood Manufacturing Fund, LP (privateequity investments), since 2003; Partner, IronwoodManagement Fund (private equity investments),since 2007; Partner, Ironwood Partners LLC (privateequity investments), since 2001; Partner, GenerationPartners (private equity investments) from 1995 to2004; Senior Advisor, Millennium Bridge Capital(private equity investments) since 2015.
4 None
Jeannine G. CarusoAge: 59Director
Since 2020 Chief Investment Officer and Director ofInvestments, The Dyson Foundation from 2006 to2014; Former Partner, New Providence AssetManagement, L.P. from 2014 to 2021 (retired sinceJune 2021).
4 None
Robert C. ElliottAge: 76Director
Since 2016 Vice Chairman, 2014-2017 and Director, 2011 topresent, Market Street Trust Company; Board ofRegents – Winthrop University Hospital since 2005;Senior Adviser, Bessemer Trust from 2011-2014;Senior Managing Director, Bessemer Trust from1975-2011.
4 None
Jack E. FocklerAge: 63Director
Since 2016 Managing Director and Vice President, Head of Sales,Client Service and Marketing from 1989 to 2015;Senior Advisor from 2015 to 2017, Royce &Associates, LP (investment adviser) (retired sinceJanuary 2018).
4 None
John C. Hover IIAge: 76Director
Since 2003 Former Executive Vice President, United States TrustCompany of New York (retired since 2000).
4 None
Richard B. SalomonAge: 74Director
Since 1996 Former attorney, Cozen O’Connor (law firm) (retiredsince 2019).
4 None
INTERESTED DIRECTORS3
Name, Address,1 Age andPosition(s) with Company
Term ofOffice4 andLength of
Time ServedPrincipal Occupation(s)
During at Least the Past 5 Years
Number ofPortfolios in
FundComplex
Overseen byDirector
OtherDirectorships
Held byDirector
Thomas H. ShragerAge: 64President and Director
Since 2009 –President;
Since 2008 –Director
Managing Director, member of the ManagementCommittee and member of the InvestmentCommittee, Tweedy, Browne Company LLC.
4 Director, Tweedy,Browne Value Funds (aLuxembourg UCITS)
Robert Q. Wyckoff, Jr.Age: 69Chairman, Vice Presidentand Director
Since 2016 –Chairman andVice President;Since 2015 –
Director
Managing Director, member of the ManagementCommittee and member of the InvestmentCommittee, Tweedy, Browne Company LLC.
4 Director, Tweedy,Browne Value Funds (aLuxembourg UCITS)
1 Each Director may be reached c/o Tweedy, Browne Company LLC, One Station Place Stamford, CT 06902.2 Directors serve for a term until the next annual meeting of stockholders and the election and qualification of their successors, or until their earlier
removal, resignation or death.3 Messrs. Thomas H. Shrager and Robert Q. Wyckoff, Jr. are each an “interested person” of the Company as defined in the 1940 Act because of their
affiliation with Tweedy, Browne Company LLC, which acts as the Company’s Investment Adviser, and with AMG Distributors, Inc., the Funds’ distributor.4 Directors serve for a term until the next annual meeting of stockholders and the election and qualification of their successors, or until their earlier
removal, resignation or death. Officers serve for an indefinite term until the election and qualification of their successors, or until their earlier removal,resignation or death.
II-51

Directors and Principal Officers (Unaudited)
OFFICERS WHO ARE NOT DIRECTORS
Name, Address,1 Age andPosition(s) with Company
Term ofOffice2 andLength of
Time ServedPrincipal Occupation(s)
During at Least the Past 5 Years
Roger R. de BreeAge: 59Treasurer
Since 2016 Managing Director (since 2020) and member of the Investment Committee (since 2013), Tweedy, BrowneCompany LLC.
Elise M. DolanAge: 45Chief Compliance Officerand Assistant Secretary
Since 2013 General Counsel and Chief Compliance Officer (since 2016) and Associate General Counsel (2013 to2016), Tweedy, Browne Company LLC; Associate, Dechert LLP (2002 to 2013).
Patricia A. RogersAge: 55Vice President and Secretary
Since 2013 Associate General Counsel (since 2016 and 1998 to 2013) and General Counsel and Chief ComplianceOfficer (2014 to 2016), Tweedy, Browne Company LLC.
John D. SpearsAge: 73Vice President
Since 1993 Managing Director, Tweedy, Browne Company LLC.
1 Each officer may be reached c/o Tweedy, Browne Company LLC, One Station Place, Stamford, CT 06902.2 Officers serve for an indefinite term until the election and qualification of their successors, or until their earlier removal, resignation or death.
II-52


One Station PlaceStamford, CT 06902
p: 1-800-432-4789w: www.tweedy.com TB-ANN-0322