Business cycle and aggregate industry mergers
35
1 Business Cycle and Aggregate Industry Merger Srdan Komlenovic 1 , Abdullah Mamun 2 & Dev Mishra 2 University of Saskatchewan Abstract We find that industry level aggregate mergers are highly pro-cyclical. Pro-cyclicality of mergers is robust to both related and unrelated mergers. We also find that the determinants and financing preferences of industry-level mergers vary greatly across the business cycle stages, which suggests that the motivation for mergers changes in different economic conditions. However, this evidence is asymmetric between related and unrelated mergers. August, 2008 ______________________________ 1 Graduate student, Department of Finance and Management Science 2 Associate Professor of Finance, Department of Finance and Management Science, Edwards School of Business, University of Saskatchewan, Saskatoon, SK S7N 5A7, CANADA. Authors are grateful to Marie Racine, and seminar participants at the University of Saskatchewan.
-
Upload
independent -
Category
Documents
-
view
1 -
download
0
Transcript of Business cycle and aggregate industry mergers
1
Business Cycle and Aggregate Industry Merger
Srdan Komlenovic1, Abdullah Mamun2 & Dev Mishra2
University of Saskatchewan
Abstract
We find that industry level aggregate mergers are highly pro-cyclical.
Pro-cyclicality of mergers is robust to both related and unrelated mergers. We
also find that the determinants and financing preferences of industry-level
mergers vary greatly across the business cycle stages, which suggests that the
motivation for mergers changes in different economic conditions. However, this
evidence is asymmetric between related and unrelated mergers.
August, 2008
______________________________
1Graduate student, Department of Finance and Management Science 2Associate Professor of Finance, Department of Finance and Management Science, Edwards School of Business, University of Saskatchewan, Saskatoon, SK S7N 5A7, CANADA. Authors are grateful to Marie Racine, and seminar participants at the University of Saskatchewan.
2
Business Cycle and Aggregate Industry Merger
1. Introduction:
Pro-cyclicality of mergers is intuitively appealing. For example, general increase
in economic activity associated with the business cycle positively affects
aggregate demand in an economy providing individual firms with an incentive
to increase output. Unlike direct investment, mergers enable a firm to increase
its output much faster (Becketti, 1986). On the other hand, general slowdown
in an economy and resulting decrease in aggregate demand creates excess
capacity in an industry. Mergers can eliminate excess capacity within an
industry by consolidation of the existing firms (Jensen, 1993). In addition,
Schleifer and Vishny (1992) conjecture that the firms are credit constrained
during the recession, thus not able to pay fundamental value to the targets and
vice versa during the boom. This argument also implies that the effect of
business cycle on a firm’s financial flexibility may lead mergers to be pro-
cyclical. However, there is paucity of empirical studies on the pro-cyclicality of
aggregate merger activities - exceptions are early merger studies which provide
inconclusive evidence.
Recent merger studies (Mitchell and Mulherin, 1996, Andrade, Mitchell
and Stafford, 2001, Andrade and Stafford, 2004, and Harford, 2005) have added
to our understanding of the determinants of the industry level merger activity
and reasons behind uneven distribution of aggregate mergers over time.
Mitchell and Mulherin (1996) suggest that “a fruitful research design would
consider the joint effect of macroeconomic and industry-level factors in modeling
the behavior of takeovers over time”. However, these studies largely ignore the
role of economic activity (macroeconomic factors) on industry level merger
activity. Early studies (Nelson, 1959, 1966, Weston, 1961, Gort, 1969, Melicher,
Ledolter, D’Anotnio, 1983, and Becketti, 1986) that investigated the role of
underlying economic activity on aggregate mergers, on the other hand, largely

3
ignored the industry-level factors1. Among recent studies, Maksimovic and
Phillips (2001) provide weak evidence that aggregate mergers are pro-cyclical,
while Lambrecht (2004) develop a theoretical model that explains why price and
demand motivates horizontal mergers. However, none of the existing studies, to
the best of our knowledge, investigates whether pro-cyclicality of mergers at the
industry level can be explained by existing theories of industry specific factors.
In addition, none examines how well the existing theories explain mergers
across business cycle. This study fills this gap by empirically examining the
relationship between industry level aggregate mergers and business cycle while
controlling for industry-level determinants of merger activity.
Several reasons motivate out analysis. First, empirical evidence suggests that
different industries perform differently at different stages of business cycle.
Earlier studies examining pro-cyclicality of mergers are primarily concentrated
on economy wide mergers without controlling for industry specific factors
(Nelson, 1959, 1966, Weston, 1961, Gort, 1969, Melicher, Ledolter, D’Anotnio,
1983, and Becketti, 1986). This is the first study to recognize and control for
industry affect while examining the effect of business cycle. Second, mergers
within (i.e. related) and outside (i.e. unrelated) an industry may have different
motivations. For example, a related merger may be motivated to build
economies of scale and/or to instantly build capacity to meet increased
aggregate demand for their product. On the other hand, an unrelated merger
may be motivated to diversify firm’s business risk, take advantage of economies
of scope, and/or respond to decreased aggregate demand (saturation) in the
acquirer’s industry. In this study, we identify each merger to acquirer’s and
target’s industry using Fama-French 48 industry groups, to classify mergers
into related (e.g. horizontal) and unrelated industries. Our classification allows
us to investigate i) relationship between business cycle and aggregate mergers
at industry level while controlling for other factors and ii) separately the role of
business cycle in related and unrelated mergers.
1 Becketti (1986) concludes ‘Estimates of this model suggests that macroeconomic variables account for about one-third of the fluctuations in merger activity. Thus, two thirds of the fluctuations in merger activity can be regarded as due to factors not captured in this model.’
4
We capture the level of economic activity using the Chicago Fed National
Activity Index (CFNAI).. The CFNAI is made up of 85 different
business/economic series representing current level of economic activities as a
proxy of economy wide business activity. Accordingly, it provides current status
of economic activity that a firm’s management may use in adjusting their
strategies in repose to a change in economic activity (e.g. expand or contract
production). This is a departure from existing literature that primarily relies on
National Bureau of Economic Research (NBER) business cycle dates, or a single
series (e.g. industrial production by McQueen and Roley, 1993). The CFNAI’s
advantage over NBER business cycle date is that NBER dates provide the
status of the economy with substantial lag (e.g. it may take several years before
a stage of economy is made public) leaving little value of such information for
managerial decision making.
Our approach in constructing business cycle is similar to that of
McQueen and Roley (1993), who use continuous variable (Industrial Production)
to measure economic activity. Yet, CFNAI is based on the most comprehensive
information about current business activity, thus is an ideal proxy of business
cycle for our purpose. Moreover, we use twenty six years of industry-level
merger activity which covers more than three full business cycles and
approximately forty two thousand mergers in 43 of 48 Fama-French industries.
We examine the effect of business cycle separately in related and
unrelated mergers. In the univariate tests we find that industry level merger
activity is pro-cyclical. This result is practically similar for both related and
unrelated mergers. Further, in the panel Tobit tests we find robust evidence
that the industry level mergers are pro-cyclical. This evidence holds after
controlling for macro-economic and industry level factors that are likely to affect
merger activity, e.g. interest rates, stock market returns, industry level capacity
utilization, industry concentration, industry level cash holdings, industry level
market anomaly (market to book), and industry level leverage (debt to equity).
While all these control variables maintain theoretically (empirically) expected

5
relationship with aggregate mergers. We also control for the proxies of
neoclassical theory (e.g. industry shocks and deregulation) and behavioral
theory (e.g book to market and desperation of Tobin’s Q). We find that, proxies
of both neoclassical and behavioral theories explain merger activity in general;
however, pro-cyclicality of merger is not fully captured by any of these theories.
We offer several innovations over the existing literature on aggregate
mergers. First, we study industry level aggregate mergers. We show that
although merger intensity varies by industry, yet they are pro-cyclical. Second,
we show that proxies of behavioural and neo-classical theories of mergers
significantly explain industry level mergers; this is consistent with the past
literature on industry level aggregate mergers. However, these proxies do not
capture all the variation of industry level mergers over time. Our proxy of
business cycle captures large part of this unexplained variation. For example, a
1.5 standard deviation increase in the proxy of business cycle on average
increases related merger activity (measured as a percentage of industry assets)
between 0.049% and 0.110%. On the other hand, the same variation in the
proxy of business cycle increases unrelated merger activity between 0.124% and
0.232%. Third, we use the most comprehsive proxy of business cycle that relies
on current information on economic activities available at that particular time.
The contemporaneous nature of this business cycle proxy makes it more suited
for use by managers in making strategic decisions (e.g. expansion and
contraction of business units). Last but not least, by using this most
comprehensive proxy of business cycle and by breaking down mergers by
industry for the longest possible period, we provide more conclusive evidence
that mergers are pro-cyclical. This evidence, to a great extent, helps shed
positive light in the existing mixed evidence on the effect of business cycle on
aggregate merger activity.
2. Data and Research Design
To explore the impact of the business cycle on aggregate industry
mergers, we first compile mergers and acquisitions (M&A) data for the years
1981 to 2006 from Thompson Financial’s SDC Platinum Database. We include

6
all merger transactions i) which are not classified as spin-offs, self-tenders,
exchange offers, repurchases, minority stake purchases, and privatizations, and
ii) for which SDC reports valid target and acquirer CUSIPs, target and
acquirer SIC codes, and merger completion date. These filters return an initial
sample of 102,622 mergers and acquisitions. We divide all targets and
acquirers represented in initial sample into Fama and French (1997)-48-
industry-groups (FF-Industry) and remove firms in financial and undefined
industries (FF-Industry 44 to 48). We split the remaining 68,241 sample pairs
into two types i) related (horizontal)- where targets and acquirers are in the
same FF-Industry (42,323 pairs) and ii) unrelated (non-horizontal) - those
mergers that cannot be classified as related (25,918 pairs). Because SDC
Platinum reports mergers involving private acquirers, while, for such private
acquirer’s balance sheet information is unavailable in standard databases.
Hence, following existing literature (e.g. Moeller, Schlingeman and Stulz, 2002)
we exclude mergers involving private acquirers leaving 23,988 and 18,024 for
related and unrelated mergers, respectively. Finally, for each type of merger we
aggregate the total transaction values for each month and FF-industry, which
returns a final sample of 14276 industry-months (332 months, 43 industry
groups) of aggregate merger activity.
<Table 1 about here>
Business Cycle:
We use an index of economic activity developed by Stock and Watson
(1999) and maintained by Federal Reserve Bank of Chicago, popularly known as
Chicago Fed National Activity Index (CFNAI). This index holds several
advantages over the traditional proxies of business cycles used in the literature.
First, the index is derived from a wide range of monthly inflation adjusted
economic indicators that are broadly classified into five categories: i) twenty one
series from output and income category, ii) twenty four series from employment,
unemployment and hours, iii) thirteen series from personal consumption,
housing starts and sales, iv) eleven series from manufacturing and trade sales,

7
and v) sixteen series from inventories and orders. Second, the index is expected
to give the most objective measure of current economic activity. It uses only
economic data that is available at the time of estimation. This is an advantage
over using the traditional indicators of business cycle. For example, NBER
announced November 2001 trough in business cycle on July 17, 2003. Third, by
construction, it has a mean of zero and standard deviation of one. A value of
zero corresponds to an economic activity growing at trend, while negative and
positive values correspond to economic activities growing below and above
trend, respectively. Because the fluctuations of CFNAI measure the deviation
from the long run trend, this measure is a proxy of growth business cycles as
defined in Stock and Watson (1998).
Non-cyclical components are likely to affect a high frequency measure of
economic activity. Ideally, one may use a band-pass filter to separate irregular
components, business cycle components and trend. However, every band-pass
filter uses certain amount of lead and lag to identify irregular components and
business cycle component. As a result a use of filtered data would imply a use of
information that is not available at the estimation time, which defies the use of
a real time measure of economic activity. Therefore, in our main tests we use
twelve month moving average of CFNAI instead. This proxy offers two
advantages: i) since a merger decision is a long process with a lead time of
several months, the proxy covers twelve months of information ii) moving
average takes care of some irregular components by smoothing the series.
Nonetheless, using a band-pass filter do not qualitatively change our results3.
Business Cycle Effect:
An increase in current economic activity often signals future increase in
aggregate demand, signaling a need to increase capacity at present. There are
two primary ways firms may increase their capacity to cater expected future
demand: internal investment or mergers. The key advantage mergers offer over
internal investment is that they allow the acquirer increase output much faster
3 This result is available from the author upon request.
8
(Becketti, 1986), and often instantly. Given the uncertainty about timing of
expected shift in demand following a change in economic activity, building
capacity through internal investment may not always be a preferable solution.
This limitation of internal investment makes mergers an attractive form of
investment strategy, particularly when the firm is in imminent need to increase
capacity.
Now the question is how business cycle may affect aggregate industry
mergers across different business cycle stages. Institutively, near the peak of
the business cycle growth in most industries is generally declining, so does the
need for additional capacity. As a result near the peak of the business cycle the
aggregate merger activity may start to slow down. Likewise, during the
recession period, firms in most industries experience decreasing demand for
their products, which will result in excess capacity, providing firms an incentive
to reduce such excess capacity. Empirical evidence, however, suggests that
expansion stage in business cycle triggers greater asset allocation than the
recession (e.g. Maksimovic and Phillips, 2001). Accordingly, the trough stage is
also likely to see a rise in expansionary mergers as policy induced interest rates
and inflation fall and firms have a better outlook for future demand. Apart from
the pro-cyclicality of aggregate demand, financial constraints of the acquirer
play an important role in explaining the pro-cyclicality of mergers (Schleifer and
Vishny, 1992). Note that unrelated mergers by virtue of their nature neither
build capacity in existing lines of business (thus industry), nor help reduce
excess capacity in the industry. Apparently a less financially constrained firm is
more likely to explore more growth opportunities and economics of scope. Since
during boom and near peak of the business cycle (i.e. good times) for several
reasons (e.g. good performance, availability of cheaper external financing) firms
are financially less constrained, thus one may also observe an increase in
unrelated mergers. In addition, underlying economic conditions will affect
unrelated mergers quite similarly to related mergers. Naturally, during the good
times (boom and peak) there is greater optimism in the economy, more assets
are likely to exchange hands.

9
Two theoretical papers examining the role of business cycle in explaining
aggregate merger activity support our arguments presented above on pro-
cyclicality of mergers. Schleifer and Vishny(1992) argue that bidders are credit
constrained during the recession, as a result they cannot pay fundamental value
of targets. Targets then postpone mergers until the market becomes more
liquid. On the contrary, during expansion bidders are less financially
constrained and hence, are able to pay targets closer to their fundamental
value. Therefore, financing constraints, according to Schleifer and Vishny,
makes mergers pro-cyclical. Lambrecht (2004), on the other hand, proposes a
more direct relationship between merger and business cycle. In his basic model
that examines related mergers, firms are price takers and merger is motivated
by economies of scale. The economy of scale is an increasing function of demand
level which is pro-cyclical. Cyclical nature of product market demand, thus,
drives merger waves in his model. Lambrecht further extends the model to
accommodate market power as an additional motive behind mergers and argues
that market power tends to speedup merger activity and the basic conclusion of
pro-cyclicality of merger holds.
The previous discussion leads us to expect that both types of mergers will be
affected similarly by business cycle, while the magnitude of effect may vary by
types. More precisely, we expect aggregate industry mergers are pro-cyclical:
reaching the highest levels at the end of the boom period, and decreasing in
value during recession stages.
Control Variables:
Extant literature has identified several factors affecting merger activity. In our
tests of effect of business cycle in aggregate mergers we simultaneously control
for these factors. These factors represent capital market and economic
conditions, neoclassical theory, behavioral theory and Q-theory, and other
industry specific factors.

10
Capital Market and Economic Conditions: Studies that investigate
macroeconomic factors (e.g. current or expected economic conditions, current
capital market conditions) mainly attempt to explain merger waves. Majority of
early empirical studies (Nelson, 1959, 1966, Weston, 1961, Gort, 1969, Melicher,
Ledolter, D’Anotnio, 1983) use i) the stock market price level as a proxy of the
market’s optimism about future of the economy and ii) industrial production or
gross domestic product (GDP) or gross national product (GNP) as a proxy of
business cycle. Among these studies, Gort (1969) argues that in times of high
stock prices, economic disturbances that lead to valuation discrepancies
between the buyer and seller increase aggregate mergers. Nelson (1959) reports
a high positive correlation between merger activity and changes in stock price,
while a positive but small correlation between merger and industrial activity- a
proxy of business cycle. Weston (1961) supports Nelson (1959) by reporting a
positive association of merger activity with stock price movement but no
association with industrial activity.4 On the contrary, in a follow up study
Nelson (1966) reports a weaker correlation between merger activity and stock
price movement, stronger and positive correlation between merger activity and
industrial activity. All these studies in some sense are measuring the effect of
business cycle in merger activity using different proxies of business cycles.
Recently, Melicher, Ledolter, D’Antonio (1983) argue that firms merge to
increase operating capacity quickly in response to optimism about future
economic growth. This behavior of firms is expected to result in an increase in
industrial production. However, Melicher et al. find weak evidence that merger
activity depends on economic conditions, while they find strong evidence that
merger activity depends on market conditions measured by stock market price
and bond yield. In a similar study, Becketti (1986) report both capital market
condition (measured by stock index and short term treasury bill yield) and
economic activity (measured by change in GNP) affect merger activity. Becketti
further adds that about a third of the aggregate merger activity can be
attributed to changes in economic conditions. More recently Benzing (1991)
4 Sample period used by Nelson (1966) is 1919-1954 and Weston (1961) is 1919-1940.

11
examines effect of capital market condition and economic condition on merger
activity before and after the Celler-Kefauver act (1950) and find both conditions
significant factors affecting mergers, while , capital market condition has
become the dominant determinant after 1950.
We proxy capital market conditions by one year holding period return of S&P
500 and one year effective yield of the 10-year Treasury Bonds; and business
cycle by twelve month moving average of CFNAI index. We expect capital
market conditions to affect aggregate ex-post level of mergers. In particular
change in aggregate stock price level is expected to exert a positive and bond
yield level a negative effect in future aggregate industry merger.
The pioneering work of Gort (1969) finds that distribution of mergers varies
widely across industries and over time. A vast majority of subsequent research
examine aggregate mergers from an industry-level or firm-level perspective and
advances three general hypotheses; neoclassical, behavioral and Q theory.
Neoclassical Theory: The most widely accepted neoclassical theory argues that
merger waves are triggered by industry-specific shocks which cause firms in an
industry to reorganize. The mergers are the most efficient way to reorganize
within a particular industry. Harford (2005), Mitchell and Mulherin (1996), and
Andrade and Stafford (2004), among others, find a positive relationship between
the number of mergers in an industry and the magnitude of industry shocks
that immediately precede the mergers. As a result mergers are concentrated in
a few industries at a time. Empirical evidence supports the Neoclassical Theory.
Mitchell and Mulherin (1996) find that more than 50% of all mergers in the
1980’s occurred in 7 industries which contained only 14% of the market’s equity
value. Mulherin and Boone (2000) find similar results for mergers in the
1990’s. Andrade, Mitchell and Stafford (2001) find a similar characteristic for
all merger waves in the preceding 50 years. However, industry shocks by
themselves may not be enough to cause a merger wave. Harford (2005) argues
that even though industry shocks trigger aggregate mergers, sufficient
aggregate capital liquidity is required in order to see a merger wave. We expect

12
that industry specific shocks are positively associated with aggregate industry
mergers.
We use industry shock and deregulation as controls for neoclassical theory.
Mitchell and Mulherin (1996), and Andrade and Stafford (2004) use sales shock
to account for industry shock. Harford (2005) on the other hand argues cash
flow margin on sale, asset turnover, research and development (R&D), capital
expenditure, employee growth, return on asset (ROA) and sales growth captures
the industry shock to industries operating environment. Following Harford
(2005) we use first principal component of the seven variables to create an index
of industry shock. In addition, we also include regulatory changes. This is
motivated by the arguments of Mitchell and Mulherin (1996) that regulatory
changes (deregulation) are positively related to takeover and restructuring
activity.
Behavioral Theory: Neoclassical theories fail to explain long run (under)
performance of the acquirer. Behavioral theories attempt to explain why high
market valuation (e.g. high market to book, high price to earnings) coincides
with high merger activity. One of the more popular behavioral theories, the
overvaluation theory, asserts that managers of the overvalued firms take
advantage of such mispricing by acquiring undervalued firms. Market makes
mistakes in evaluating potential targets, acquirers and combined firms.
Managers often take advantage of the market imperfection partly through
merger; therefore, merger waves are driven by relative valuation of firms
(Schleifer and Vishny, 2003). Similarly, Ang and Cheng (2006), Dong et al.
(2006) and Rhodes-Kropf, Robinson and Viswanathan (2005) all find that stock
acquirers are more overvalued than cash acquirers, and stock-acquired targets
are more undervalued than cash-acquired targets. An implication of this theory
is that dispersion of market valuation should positively influence industry level
merger activity. Furthermore, Loughran and Vijh (1997) show that after the
announcement of mergers, acquirers using stock to finance merger experience
negative long run abnormal returns, while acquirers who use cash experience
positive long run abnormal returns. Rau and Vermaelen (1998), on the other
13
hand, find that in general overvalued acquirers perform worse regardless of the
way mergers are financed. Rhodes-Kropf and Viswanathan (2004) argue that
acquirers overestimate the targets’ value (and synergy) in times when market is
overvalued and underestimate it in times when market is undervalued. So we
predict that overvaluation measures will positively affect industry level merger
activity.
Q-Theory: The Q-theory also supports the overvaluation theory. It argues that
as the firm’s Q ratio rises, not only does its investment rate rise, but it also
becomes more profitable to acquire other firms. Empirical evidence suggests
that the change in a firm’s Q ratio has a greater effect on M&A investment than
on direct investment (Jovanovic and Rousseau, 2002) and that firms with
higher Q ratios will acquire firms with lower Q’s (Hasbrouck, 1985; Jovanovic
and Rousseau, 2002).
We use following two variables as proxies of behavioral and Q-Theory
respectively. First, we use weighted average of book to market (B/M) ratio,
which captures whether an industry is overvalued or not. We expect that
aggregate merger is positively related to overvaluation measures. Second, we
use standard deviation of Tobin’s Q, which captures potential effect of volatility
of overvaluation within the industry. We expect this proxy be positively
associated with only related mergers. However, its association with unrelated
mergers is not obvious.
Other Controls
We use several other controls that do not fall into any particular theory yet,
existing literature cites them as important determinants of industry merger
activity. These controls are: i) industry concentration ratio (Andrade and
Stafford, 2004), ii) industry capacity utilization (Andrade and Stafford, 2004),
iii) excess cash (Harford, 1999), and iv) two proxies of financing constraints -
weighted average of debt of equity (D/E) ratio and log of cash. Table 2 defines all
control variables in detail.

14
<Insert Table 2 >
Table 3 panel A presents descriptive statistics of the macroeconomic variables.
The business cycle ranges from -2.013 to 1.641, with a mean of -0.0616,
suggesting that the economic activity was growing below the long-term trend
during the sample period. Interest rates range from 0.0031 to 0.0114 which
translates to an annual yield ranging between 3.69% and 13.65%. Monthly
market return was 0.0088, which is very close to long term return on S&P 500
index. The aggregate capacity utilization ranges between 71.1% and 86.7%. It
also provides descriptive statistics of other controls. Table 4 presents pearsons
correlation between the explanatory variables. Correlations between any pair of
variables do not appear too large.
3. Empirical Results:
We start by identifying business cycle stages. There are four booms and the
equal number of troughs during our sample period. A trough stage takes all
values of twelve month moving average of CFNAI that fall in less than the15th
percentile range of the sample observations. This method is consistent with
McQueen and Roley (1993). Fifty one observations out of 332 sample
observations fall into this stage. The timing of these stages fits very well with
the NBER dates- each NBER trough date coincides exactly with the trough
stage we identify. We assign same number of observations (fifty one) to peak
stage (i.e. upper 15th percentile). Accordingly, we identify the values between
peak and trough periods as recession stage and between trough and peak as
boom stage.
Initially, at each business cycle stage we calculate the average number of
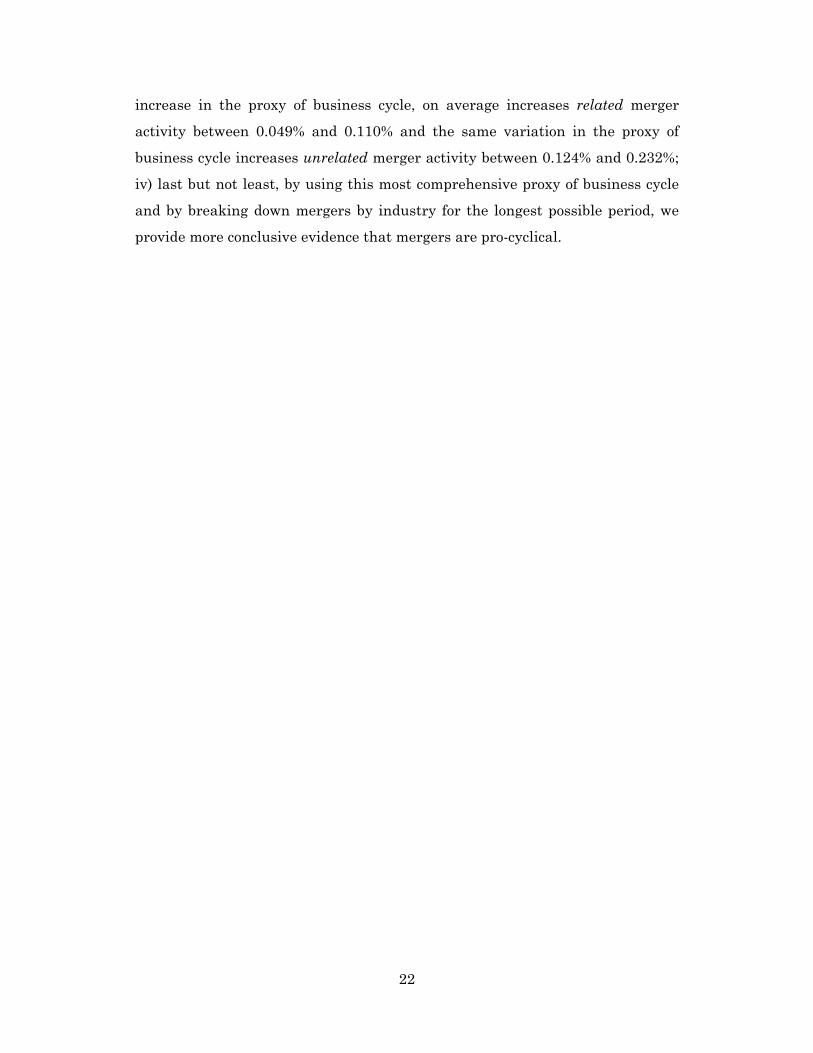
monthly mergers (see Figure 1).
<Figure 1 about here>
<Figure 2 about here>
<Figure 3 about here>

15
Figure 1 shows a pro-cyclical pattern in merger. Figure 2 demonstrates that
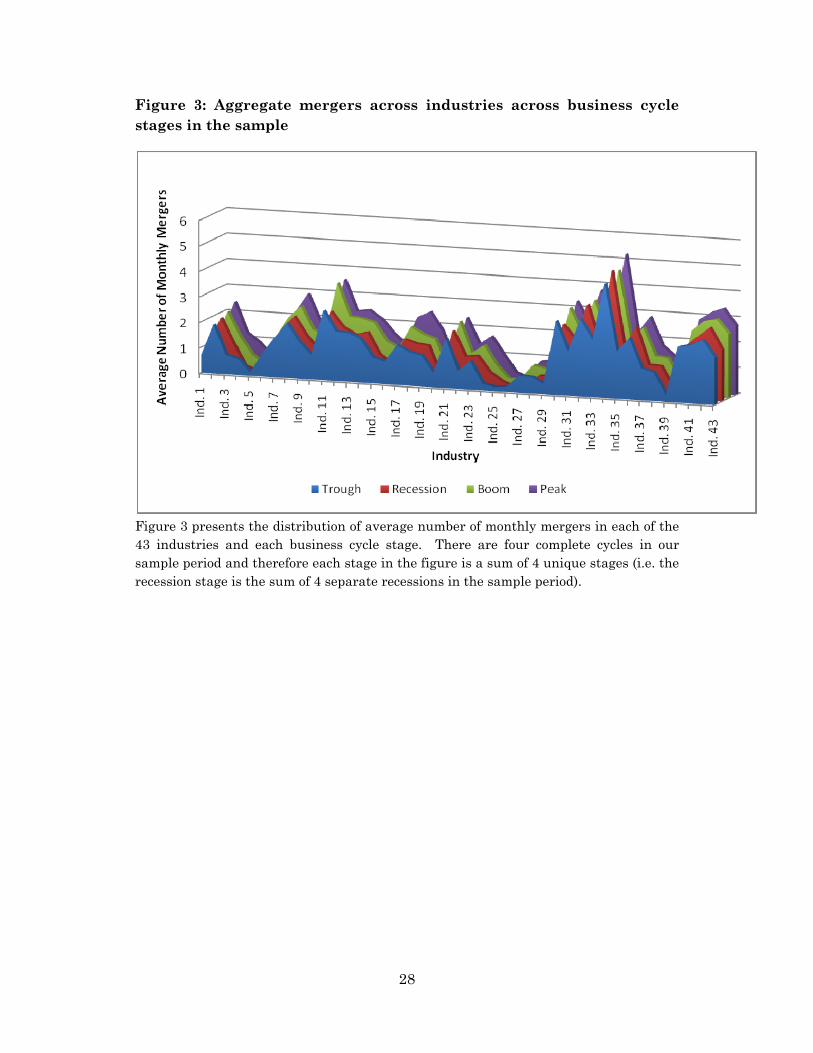
other economy wide effect is present in the data and Figure 3, on the other
hand, shows the presence of industry specific variations in merger
concentration. Taken together these figure suggests that mergers are pro-
cyclical, however, they are also affected by other macroeconomic and industry
specific factors. This is consistent with the observation in Mitchell and
Mulherin (1996, p. 195 ) “Our results suggest that a fruitful research designed
would consider the joint effect of macroeconomic and industry-level factors in
modeling the behavior of takeovers over time”. Accordingly, in the rest of this
section we examine business cycle effect in aggregate merger by simultaneously
controlling for other determinants of merger activity.
As demonstrated in figure 4 in each industry there are substantial numbers of
observations with zero merger activity ranging from 20% to 90% of sample
months.
<Figure 4 about here>
Some industries in general have a higher concentration of mergers, which
explains the uneven distribution in Figure 4. Such sparse data is a common
problem in this line of research (e.g. Mitchell and Mulherin (1996), Harford
(2005) and Andrade and Stafford (2004)). In order to deal with this problem,
similar to Andrade and Stafford (2004), we use Tobit specifications in our tests.
Accordingly, our dependent variable is total transaction value of mergers for
industry i in period t, censored at zero.
, 1
1 , 1
Transaction value of Merger (Business Cycle Indicator , Other Macroeconomic Variables , Industry Specific Variables )
i t t
t i t
f −
− −
=
[1]
16
We test the effect of business cycle in each type of mergers separately. Hausman
(1978) specification test rejects null hypothesis in favor of random effect (RE)
model. Davidson-Mackinnon (1993) test suggests that endogeneity is not a
problem in any of the models. Therefore, we use panel RE model to test our
predictions.
<Table 5 about here>
Table 5 presents the empirical results of our tests of the effect of business cycle
on related merger activities. We use four different sets of control variables
motivated by existing theories of merger. While majority of these control
variables load with an expected sign our main test variable shows that related
mergers are positively and significantly associated with the business cycle. This
evidence is consistent with the literature that i) mergers serve acquirer’s needs
by allowing to increase capacity and output instantly, consistent with Becketti
(1986), to cater the potential increase in demand associated with increased
economic activity; and ii) mergers are motivated by economies of scale -an
increasing function of demand level, which is pro-cyclical- as Lambrecht (2004)
conjectures.
<Table 6 about here>
Table 6 presents the empirical results of our tests of the effect of business cycle
on unrelated merger activities. This table uses the same specifications as does
the Table 5, except for the dependent variable which is transaction value of
unrelated mergers scaled by total assets of the acquirer’s industry. We find that
majority of control variables load with an expected sign. Likewise, consistent
with our prediction unrelated mergers are positively and significantly
associated with the business cycle. This evidence collaborates with the
arguments of Schleifer and Vishny (1992) that financially constrained bidders
cannot pay fundamental value of targets, prompting the later to postpone
mergers until the economy experience expansion. Collectively, Tables 5 and 6
support our hypothesis that industry aggregate mergers, irrespective of their
17
types, are pro-cyclical. While these findings are consistent with the existing
literature that examines economy wide aggregate mergers, using a new proxy of
business cycle and industry level mergers, we present a strong and robust result
supporting the pro-cyclicality of mergers over and above what is captured in
traditional explanations of aggregate merger activity.
Turning to the discussion to other controls, we also attempt to provide an
explanation for some traditional theories of mergers. Model 1 Tables 5 and 6
controls for interest rate and aggregate stock market returns. In both tables we
observe that the coefficient of interest rate is negative and significant at better
than 1% level. This suggests that cost of financing negatively affects merger
activity in general. Accordingly, this also suggests that mergers are better
opportunities to utilize internal funds when the interest rate – the opportunity
cost of firms’ internal funds - is lower. In the same model, we also observe that
the coefficient of market returns is positive and significant at 1% level,
suggesting that in times of better capital market conditions merger activity
increases. This supports argument in the literature that i) market price level
reflects market’s optimism about future economic activities, thus lead firms to
expand operations during good market conditions and ii) on the contrary the
results also support the argument that valuation discrepancies created by high
stock prices lead to increased merger activities (Gort, 1969).
Model 2 of Tables 5 and 6 controls for two proxies of neo-classical theory -
industry shocks and deregulation. The coefficient of industry shocks is positive
and significant at 1% level in both Tables. Our industry shocks variable is
constructed according to Harford (2005), accordingly the results are also
consistent with Harford (2005) and other existing literature. These results
suggest that industry shocks play important role in shaping overall merger
activities within the industry (related mergers), as well as the acquisitions
involving a target from outside the industry (unrelated mergers). This implies
that industry shocks require a large scale re-allocation of assets, such
reallocation may take place within or outside the industry. However, the

18
coefficient of deregulation dummy is insignificant in both Tables suggesting
that the regulatory environment does not affect aggregate mergers. One
interpretation of these findings is that the industry shocks represent changes in
industry specific factors, which are very likely to observe the influence of change
regulatory environment. This interpretation corroborate Mitchell and Mulherin
(1996) who find that in the presence of measures capturing industry shocks
regulatory environment does not predict industry mergers.
Model 3 of Tables 5 and 6 controls for one proxy of each of the behavioral and Q
theory i.e. overvaluation measures. As discussed earlier, behavioral theory
suggest that overvaluation in the industry is expected to trigger greater level of
merger activity. Accordingly, industry aggregate book to market (B/M) ratio is
expected to be negatively associated with industry aggregate mergers.
Consistent with this prediction, we find that the coefficient of B/M ratio
negative and significant at 1% level in both Tables, which also corroborates the
findings of Ang and Cheng (2006), Dong et al. (2006) and Rhodes-Kropf and
Viswanathan (2005). The related Q-theory suggests that dispersion in the
valuation in the industry is expected to make mergers between overvalued
acquirers and undervalued targets more beneficial. We use the standard
deviation of Tobin’s Q as a proxy of dispersion in valuation in the industry - our
proxy of Q-theory. This measure only captures dispersion of Tobin’s Q of the
firms in a particular industry; accordingly it is expected to exhibit a relationship
only with related mergers, while no prediction can be made for unrelated
mergers. As expected the coefficient of standard deviation of Tobin’s Q is
positive and significant at 1% level for related mergers while it is not significant
for unrelated mergers. These findings for related mergers are consistent with
Schleifer and Vishny (2003), who argue that “…firms with overvalued equity
might be able to make acquisitions, survive, and grow, while firms with
undervalued or relatively less overvalued, equity become takeover targets
themselves” (pp. 309). Further, the same is also consistent with Andrade,
Mitchell and Stafford (2001), also find that in two-thirds of all mergers since

19
1973, high Q firms bought low Q firms and Jovanovic and Rousseau (2002), who
find that “a firm’s merger and acquisition (M&A) investment responds to its Q
more (by a factor of 2.6) than its direct investment does” (pp. 198).
Model 4 of Tables 5 and 6 adds five other industry specific controls that the
existing literature finds as significant determinants of merger activity. First, we
use log of industry concentration based on firm’s sales - - as a proxy of industry
concentration. The coefficient of industry concentration is negative and
significant at 1% level irrespective of the type of mergers. Literature (e.g.
Porter, 1980; Day, 1997) suggests that more mature industries exhibit higher
concentration; hence, our findings may be interpreted as evidence that less
mature industries exhibit greater level of merger activity. Further, anecdotal
evidence suggests that less concentrated industries have greater number of
firms available, which is obviously expected to result in more mergers. The
negative relationship between related mergers and industry concentration may
also be an outcome of antitrust regulations. Antitrust legislation is more likely
to prohibit mergers within the highly concentrated industries to maintain
competition. The negative relationship between industry concentration and
unrelated merger implies that firm in less matured industry pursue unrelated
merger, which apparently seems counter intuitive. However, in industries
where there are no dominant oligopolies for one or other reasons (be it antitrust
legislation, state of technology or nature of product) firms may try to gain
market power by merging with firms from other industry. Andrade and Stafford
(2004) find similar result when their sample includes both related and unrelated
mergers5.
Second, we use industry capacity utilization which is an indicator of current
demand conditions in the industry. Literature provides mixed prediction on the
relationship between industry capacity utilization and merger activity. For
example, Andrade and Stafford (2004) argue that this variable can have a
5 Andrade and Stafford (2004) argues that this result may be due to convergence problem in their merger sample. However, it seems very unlikely that two studies done independently would find the same result.

20
positive (when industry is expanding) or a negative (when industry is
contracting) relationship with industry mergers. Accordingly, we observe that
the coefficient of industry capacity utilization is positive and significant for
related mergers (Table 5), while it is not significant for unrelated mergers.
Third, we control for industry aggregate debt to equity (D/E) ratio, which is also
a proxy for financing constraint. As discussed in the previous section, we expect
a negative association between D/E and merger activity. Surprisingly, we find
that related mergers are positively and significantly related with D/E. While,
this is contrary to the prediction of Shleifer and Vishny (1997) who argue that
financial constraints have negative implications for mergers. However,
possibility of a merger where shareholders of both firms proportionally share
stock ownership in the combined firm cannot be ruled out in the financially
constrained industry. Therefore, one may argue that financially constrained
industries involve greater proportion of mergers that are paid in stocks instead
of cash. In contrast, coefficient of D/E is negative as expected and significant at
5% level for unrelated mergers. The possibility of combination between two
firms from different industries to form a new firm with proportional ownership
may be less.
Fourth, we use excess cash measured as cash levels in the industry at time t
less historical average of industry cash level. Anecdotal evidence suggests that
firms with high cash reserve do not need external financing to finance mergers,
therefore, firm’s cash holding is expected to be positively associated with merger
activity. We find the coefficient of excess cash positive and significant at 1%
level for both related and unrelated mergers, supporting our prediction. This
relationship, which is robust to the use of natural log of cash in Model 5 of
Tables 5 and 6, is consistent with existing analytical and empirical literature.
For example, Jensen (1986) argued that cash positively affects a firm’s role as
an acquirer. As managers of firms with excess cash, seeking to increase scale
and scope of operating assets under their control are involved in value
decreasing investment on average. Accordingly, this evidence is also consistent

21
with Harford (1999) that the probability of being a bidder increases in cash rich
firms.
To summarize, the evidence in these tables suggests that business cycle is a
significant determinant of aggregate merger activity. This evidence is robust
after controlling for traditional proxies of merger activity and other significant
determinants of mergers. Further, the evidence is robust for both related and
unrelated mergers. Our results (unreported) are robust when we add all the
controls used in model 4 to models 1-3.
4. Conclusion:
We examine the effect of business cycle on industry-level merger activity in a
sample of industry aggregate mergers. Analytical literature in finance, e.g.
behavioral corporate finance (Shleifer and Vishny, 1992), suggests a
relationship between business cycle and merger activities. We use Chicago Fed
National Activity Index (CFNAI) as the proxy of business cycle and find that
industry aggregate mergers vary significantly with business cycle - increasing
during the boom and peak periods and decreasing during recession and trough
periods. In other words, business cycle positively affects merger activity. The
positive and significant association of merger activity and business cycle is
robust for both related and unrelated mergers. Further, our findings are robust
to controlling for the proxies of capital market conditions, neo-classical theory,
behavioral theory, Q-theory and other industry specific determinants of
mergers.
Our study contributes to the existing empirical literature in aggregate
mergers in several ways: i) while recent literature concentrates on the role of
industry specific factors in explaining industry aggregate merger. We depart by
showing the role of business cycle in explaining the later; ii) we show that
although merger intensity varies by industry, yet they are pro-cyclical; iii) the
proxies of behavioural and neo-classical theories of mergers do not capture all
the variation of industry level mergers over time. Our proxy of business cycle
captures large part of this unexplained variation. A 1.5 standard deviation
22
increase in the proxy of business cycle, on average increases related merger
activity between 0.049% and 0.110% and the same variation in the proxy of
business cycle increases unrelated merger activity between 0.124% and 0.232%;
iv) last but not least, by using this most comprehensive proxy of business cycle
and by breaking down mergers by industry for the longest possible period, we
provide more conclusive evidence that mergers are pro-cyclical.

23
References
Andrade, G., Mitchell, M., Stafford, E., 2001. New evidence and perspectives on mergers. Journal of Economic Perspectives 15, 103–120.
Andrade, G., Stafford, E., 2004. Investigating the economic role of mergers. Journal of Corporate Finance 10, 1–36.
Ang, J., Cheng, Y., 2006. Direct evidence on the market-driven acquisitions theory. Journal of Financial Research 29, 199-216.
Baxter, M., King, R., 1999. `Measuring Business Cycles Approximate Band-Pass Filters for Economic Time Series, Review of Economics and Statistics 81, 575-593.
Becketti, S., 1986. Corporate mergers and the business cycle. Economic Review 71, 13-26.
Benzing, C., 1991. The Determinants of Aggregate Merger Activity - Before and After Celter-Kefauver, Review of Industrial Organization 6, 61-72.
Davidson, R., J.G. MacKinnon., 1993. Estimation and Inference in Econometrics, Oxford University Press, New York, NY.
Dong, M., Hirshleifer, D., Richardson, S., Teoh, S.H., 2006. Does investor misvaluation drive the takeover market? Journal of Finance 61, 725-762
Fama, E., French, K., 1992. The cross-section of expected stock returns. Journal of Finance 47, 427-465.
Fama, E., French, K., 1997. Industry costs of equity. Journal of Financial Economics 43, 153–193.
Gort, M., 1969. An economic disturbance theory of mergers. Quarterly Journal of Economics 83, 624–642.
Harford, J., 1999. Corporate cash reserves and acquisitions. Journal of Finance 54, 1969-1997.
Harford, J., 2005. What drives merger waves? Journal of Financial Economics 77, 529–60.
Hasbrouck, J., 1985. The Characteristics of Takeover Targets, Q and Other Measures, Journal of Banking and Finance 9, 351-362.

24
Hausman, J.A., 1978. Specification Tests in Econometrics. Econometrica 46, 1251-1271.
Jensen, M., 1986. Agency Costs of Free Cash Flow, Corporate Finance, and Takovers,
American Economic Review 76, 323-329.
Jensen, M., 1993. The modern industrial revolution, exit, and the Failure of Internal control systems. Journal of Finance 48, 831– 880.
Jovanovic, B., Rousseau, P., 2002. The Q-theory of mergers. American Economic Review 92, 198–204.
Loughran, T., Vijh, A., 1997. Do long-term shareholders benefit from corporate acquisitions? Journal of Finance 52, 1765–1790.
Markham, J.W., 1955. Survey of the Evidence and Findings on Mergers. in Business Concentration and Price Policy, N.B.E.R., Princeton University Press, Princeton
McQueen, G. and V. Roley., 1993. Stock Prices, News, and Business Conditions. Review of Financial Studies 6, 683-707.
Melicher, Ledolter R., J., and D’Antonio L., 1983. A Time Series Analysis of Aggregate Merger Activity. Review of Economics and Statistics 6, 423-429.
Mitchell, M., Mulherin, J., 1996. The impact of industry shocks on takeover and restructuring activity. Journal of Financial Economics 41, 193– 229.
Mulherin, J., Boone, A., 2000. Comparing acquisitions and divestitures. Journal of Corporate Finance 6, 117–139.
Nelson, R. L., 1959. Merger Movements in American Industry, 1895-1956, Princeton, N.J.: Princeton University Press.
Nelson, R. L., 1966, Business Cycle Factors in the Choice between Internal and External Growth, The Corporate Merger. Chicago: University of Chicago Press.
Porter, M., 1980. Competitive Strategy: Techniques for Analyzing Industries and Competitors. Free Press, New York, NY.

25
Rau, P.R., Vermaelen, T., 1998. Glamour, value and the post-acquisition performance of acquiring firms. Journal of Financial Economics 49, 223–253.
Rhodes-Kropf, M., Robinson, D., Viswanathan, S., 2005. Valuation waves and merger activity: The empirical evidence. Journal of Financial Economics 77, 561-603.
Rhodes-Kropf, M., Viswanathan, S., 2004. Market valuation and merger waves. Journal of Finance 59, 2685-2718.
Shleifer, A., and R. Vishny., 1992. Liquidation values and debt capacity. Journal of Finance 47, 1343-1366.
Shleifer, A. and R. Vishny., 1997. A Survey of Corporate Governance. Journal of Finance, 52 (1997), 737–783.
Shleifer, A., Vishny, R., 2003. Stock market driven acquisitions. Journal of Financial Economics 70, 295–311.
Stock J.H. and M.W. Watson., 1998. Business Cycle Fluctuations in U.S. Macroeconomic Time Series. NBER Working Paper No. 6528.
Stock, J.H. and M.W. Watson., 1999. Forecasting Inflation. Journal of Monetary Economics 44, 293-335.
Weston, J. F., 1961. The Role of Mergers in the Growth of Large Firms. Berkeley: University of California Press.
26
Figure 1: Related and unrelated mergers at different business cycle stages.
For each business cycle stage, this figure plots average number of mergers per month in all industries. (i.e. total number of mergers in a stage divided by total number of months within that stage)

27
Figure 2: Aggregate mergers across industries in four boom periods in the sample
Figure 2 presents the distribution of average number of monthly mergers in each of 43 industries and each of the four boom stages.
28
Figure 3: Aggregate mergers across industries across business cycle stages in the sample
Figure 3 presents the distribution of average number of monthly mergers in each of the 43 industries and each business cycle stage. There are four complete cycles in our sample period and therefore each stage in the figure is a sum of 4 unique stages (i.e. the recession stage is the sum of 4 separate recessions in the sample period).

29
Figure 4: Distribution of Industries by “No Activity” months
Figure 4 displays the distribution of industries by the percentage of inactive months. All industries have at least 20-30% of inactive months, while 11 industries have more than 90% of the months in the sample period where no mergers occur.
30
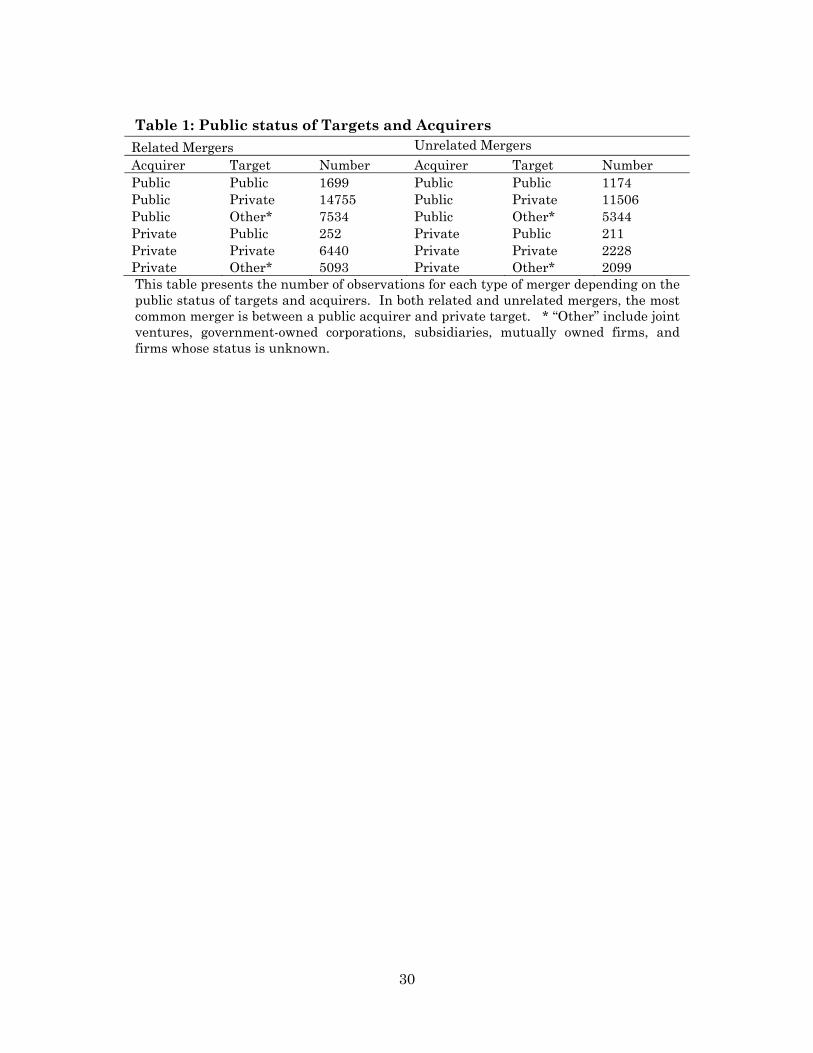
Table 1: Public status of Targets and Acquirers Related Mergers Unrelated Mergers Acquirer Target Number Acquirer Target Number Public Public 1699 Public Public 1174 Public Private 14755 Public Private 11506 Public Other* 7534 Public Other* 5344 Private Public 252 Private Public 211 Private Private 6440 Private Private 2228 Private Other* 5093 Private Other* 2099 This table presents the number of observations for each type of merger depending on the public status of targets and acquirers. In both related and unrelated mergers, the most common merger is between a public acquirer and private target. * “Other” include joint ventures, government-owned corporations, subsidiaries, mutually owned firms, and firms whose status is unknown.
31
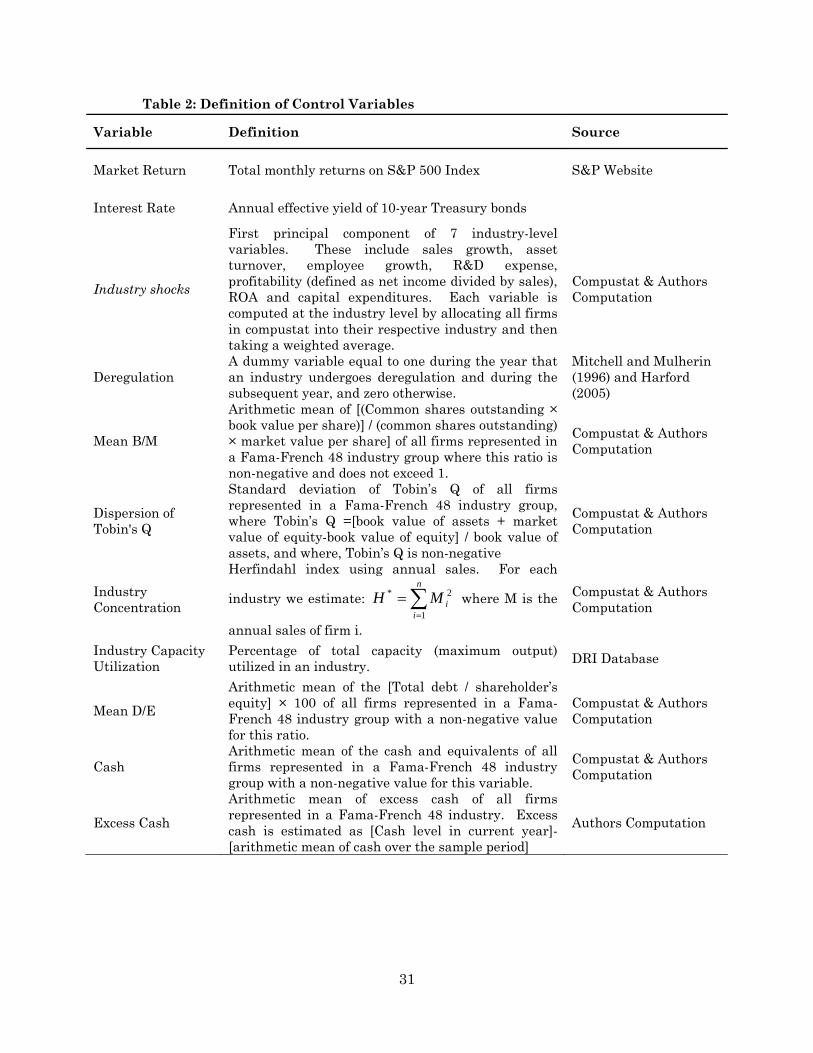
Table 2: Definition of Control Variables
Variable Definition Source
Market Return Total monthly returns on S&P 500 Index S&P Website
Interest Rate Annual effective yield of 10-year Treasury bonds
Industry shocks
First principal component of 7 industry-level variables. These include sales growth, asset turnover, employee growth, R&D expense, profitability (defined as net income divided by sales), ROA and capital expenditures. Each variable is computed at the industry level by allocating all firms in compustat into their respective industry and then taking a weighted average.
Compustat & Authors Computation
Deregulation A dummy variable equal to one during the year that an industry undergoes deregulation and during the subsequent year, and zero otherwise.
Mitchell and Mulherin (1996) and Harford (2005)
Mean B/M
Arithmetic mean of [(Common shares outstanding × book value per share)] / (common shares outstanding) × market value per share] of all firms represented in a Fama-French 48 industry group where this ratio is non-negative and does not exceed 1.
Compustat & Authors Computation
Dispersion of Tobin's Q
Standard deviation of Tobin’s Q of all firms represented in a Fama-French 48 industry group, where Tobin’s Q =[book value of assets + market value of equity-book value of equity] / book value of assets, and where, Tobin’s Q is non-negative
Compustat & Authors Computation
Industry Concentration
Herfindahl index using annual sales. For each
industry we estimate: ∑=
=n
iiMH
1
2* where M is the
annual sales of firm i.
Compustat & Authors Computation
Industry Capacity Utilization
Percentage of total capacity (maximum output) utilized in an industry. DRI Database
Mean D/E
Arithmetic mean of the [Total debt / shareholder’s equity] × 100 of all firms represented in a Fama-French 48 industry group with a non-negative value for this ratio.
Compustat & Authors Computation
Cash Arithmetic mean of the cash and equivalents of all firms represented in a Fama-French 48 industry group with a non-negative value for this variable.
Compustat & Authors Computation
Excess Cash
Arithmetic mean of excess cash of all firms represented in a Fama-French 48 industry. Excess cash is estimated as [Cash level in current year]-[arithmetic mean of cash over the sample period]
Authors Computation

32
Table 3: Descriptive Statistics
N Mean Stdev Min Max CFNAI 332 -0.06 0.66 -2.01 1.6410 year Treasury Bond Yield 332 0.01 0.00 0.00 0.01 Market return 332 0.01 0.01 -0.03 0.04 Asset Turnover 996 1.12 0.41 0.28 2.71 Assets 1039 1.90 0.20 1.14 2.58 B/M (mean) 1125 0.63 0.32 0.08 2.01 Capacity Util. 882 80.05 6.33 52.30 96.15 Cash 1039 2.72 0.93 0.07 5.12 D/E 1039 0.94 0.48 0.09 5.57 Deregulation 1161 0.03 0.16 0.00 1.00 Excess Cash 1029 -0.02 0.19 -1.20 1.50 Industry Conc. 1039 0.05 0.08 0.00 0.96 Industry Shock 977 0.00 1.63 -3.31 12.58 Interest Rates 1150 0.08 0.03 0.04 0.14 Market Return 1190 0.11 0.16 -0.28 0.53 Tobin's Q(stdev) 1039 0.82 0.86 0.01 4.78
Our sample period consists of 332 months and 43 industries. As a result we have 332 observations for all macroeconomic variables, and a maximum of 1161 industry months (27 years × 43 industries) for industry-specific variables. The number of observations for industry-specific variables varies based on data availability.

33
Table 4: Correlation between all variables:
Moving Avg. of CFNAI
Market Return
Interest Rate
Industry shocks Deregulation
Industry Concentration
Mean B/M
St. Dev of Tobin's Q
Log Cash
Mean D/E
Log of Excess Cash
Moving Avg. of CFNAI 1.00 Market Return 0.20 1.00 Interest Rate 0.26 0.18 1.00 Industry shocks -0.09 -0.07 -0.20 1.00 Deregulation 0.04 0.02 0.07 0.06 1.00 Industry Concentration 0.00 -0.02 0.06 -0.19 -0.06 1.00 Mean B/M 0.13 0.03 0.38 -0.33 0.08 0.05 1.00 St. Dev of Tobin's Q -0.09 -0.20 -0.45 0.37 -0.08 0.11 -0.33 1.00 Log Cash -0.27 -0.10 -0.61 0.26 0.00 -0.13 -0.35 0.39 1.00 Mean D/E -0.13 -0.07 0.01 -0.11 0.09 0.06 0.10 -0.24 -0.13 1.00 Log of Excess Cash -0.15 -0.13 -0.38 0.38 -0.04 -0.05 -0.21 0.27 0.41 -0.01 1.00 The Table provides Pearson’s correlation coefficients for explanatory variables. The coefficients significant at 1% level are underlined.

34
Table 5: Related Merger
Macro Factor Model
Neo-Classical Model
Behavioral and Q Theory Model
Other Factor Model I
Other Factor Model II
Business Cycle 0.000860*** 0.000837*** 0.00110*** 0.000683*** 0.000486** [5.35] [4.17] [6.00] [2.88] [2.55] Interest Rate -0.0551*** [-16.2] Market Return 0.00248*** [4.44] Industry shocks 0.000830*** [10.5] Deregulation 0.000307 [0.49] Mean B/M -0.00446*** [-9.31] St. Dev of Tobin's Q 0.000564*** [3.93] Industry Concentration -0.0209*** -0.0149*** [-6.23] [-5.48] Industry Capacity Utilization 0.0000755*** 0.0000603*** [3.24] [3.19] Mean D/E 0.00115*** 0.000779*** [3.60] [2.98] Log of Excess Cash 0.00512*** [6.70] Log Cash 0.00103*** [7.11] Constant -0.00295*** -0.00585*** -0.00546*** -0.0154*** -0.00943*** [-7.97] [-19.9] [-11.4] [-8.04] [-6.18] Observations 13440 11472 12180 8654 8654 No of Industry Included 42 42 42 30 30 Statistical significance at the 1%, 5% and 10% levels is denoted by ***, **, and *, respectively. The T-statistic under the null hypothesis that parameter estimates equals zero, is given in the brackets.

35
Table 6: Unrelated mergers
Macro Factor Model
Neo-Classical Model
Behavioral and Q Theory Model
Other Factor Model I
Other Factor Model II
Business Cycle 0.00131*** 0.00132*** 0.00125*** 0.00151*** 0.00124*** [5.43] [4.44] [5.04] [4.29] [3.47] Interest Rate -0.0678*** [-13.3] Market Return 0.00317*** [3.76] Industry shocks 0.000849*** [6.67] Deregulation -0.000118 [-0.12] Mean B/M -0.00521*** [-7.42] St. Dev of Tobin's Q 0.000322 [1.58] Industry Concentration -0.0342*** -0.0365*** [-5.08] [-5.24] Industry Capacity Utilization -0.0000372 -0.0000149 [-1.01] [-0.40] Mean D/E -0.00138** -0.00136** [-2.27] [-2.21] Log of Excess Cash 0.00383*** [3.84] Log Cash 0.00177*** [8.35] Constant -0.00269*** -0.00722*** -0.00428*** -0.00778** -0.00459 [-3.02] [-9.04] [-4.53] [-2.52] [-1.47] Observations 13440 11472 12180 8944 8824 No of Industry Included 42 42 42 31 31 Statistical significance at the 1%, 5% and 10% levels is denoted by ***, **, and *, respectively. The T-statistic under the null hypothesis that parameter estimates equals zero, is given in the brackets.