Curcumin-loaded biocompatible thermoresponsive polymeric nanoparticles for cancer drug delivery
Upload
independentCategory
view
2download
0
1
1
Bacterial adhesion reduction on a biocompatible Si+ ion implanted austenitic 2
stainless steel 3
4
A.M. Gallardo-Moreno1,2*, M. Multigner3,2*, A. Calzado4,2*, A. Méndez-Vilas2,1, L. 5
Saldaña4#, J.C. Galván3, M.A. Pacha-Olivenza2,1, J. Perera-Núñez1,2, JL. González-Carrasco3,2, I. 6
Braceras5,2, N. Vilaboa4,2, M.L. González-Martín1,2 7
1Departamento de Física Aplicada, Facultad de Ciencias, Universidad de Extremadura, Avda. de 8
Elvas s/n, 06071 Badajoz, Spain 9 2Centro de Investigación Biomédica en Red de Bioingeniería, Biomateriales y Nanomedicina CIBER-10
BBN, Spain 11 3Centro Nacional de Investigaciones Metalúrgicas, CENIM-CSIC, Avda. Gregorio del Amo 8, 28040 12
Madrid, Spain 13 4Unidad de Investigación, Hospital Universitario La Paz-IdiPAZ, Paseo de la Castellana 261, 28046 14
Madrid, Spain 15 5 Inasmet-Tecnalia, Mikeletegi Pasealekua 2, E-20009 San Sebastián, Spain 16 # Present address: Departamento de Especialidades Médicas, Facultad de Medicina, Universidad 17
de Alcalá, Ctra. Madrid-Barcelona Km 3360,28871 Alcalá de Henares, Madrid, Spain 18
19
20
* The first three authors contribute equally to this work 21
*ManuscriptClick here to view linked References
Materials Science and Engineering C 01/2011; 31(7):1567-1576

2
ABSTRACT 1
Implant infection due to bacterial surface colonization is emerging as an extremely important 2
medical problem, which often leads to the failure of medical devices. Modern surface modification 3
techniques, such as ion implantation, can confer to the surfaces very different properties from those of 4
the bulk underlying material. In this work, austenitic stainless steel 316 LVM has been superficially 5
modified by Si+ ion implantation. The effect of surface modification on the biocompatibility and 6
bacterial adhesion to 316 LVM stainless steel has been investigated. To this aim, human mesenchymal 7
stem cells (hMSCs), as precursor of osteoblastic lineage, and bacterial strains relevant in infections 8
related to orthopedic implants, i.e., Staphylococcus aureus and Staphylococcus epidermidis, have been 9
assayed. For a meaningful understanding of changes in the biological response associated to ion 10
implantation, variations in the chemical surface composition, topography, surface Gibbs energy, 11
isoelectric point and in vitro corrosion behavior have been evaluated. Si+ ion implantation did not alter 12
hMSCs attachment, spreading, viability and alkaline phosphatase activity while diminished the number 13
of attached bacteria in static conditions and led to smaller adhesion rates and retention strength. The 14
ability of implanted surfaces to reduce the bacterial adhesion was higher for Staphylococcus 15
epidermidis than for Staphylococcus aureus. This study proposes Si+ ion implantation as an effective 16
way of reducing bacterial adhesion on 316 LVM stainless steel surfaces without compromising its 17
good biocompatibility. 18
keywords: biocompatibility, 316 LVM stainless steel, Bacterial adhesion, ion implantation, corrosion. 19
1. Introduction 20
Austenitic stainless steel 316 LVM is a low-cost metallic biomaterial, with an easy 21
mechanization and reasonably good biocompatibility, thus it is widely used in implant surgery. After 22
implantation, metallic devices generally become spontaneously encapsulated by a fibrous tissue of up 23
to 200 microns of thickness, due to a local inflammatory reaction, that allows the diffusion of ions and 24
microparticles and impairs the mechanical stability of the implant. Also, an important problem 25
associated to the use of implants is the appearance of infections due to the frequent bacterial surface 26
colonization and later formation of biofilms, which often leads to the failure of medical devices [1-5]. 27
Materials Science and Engineering C 01/2011; 31(7):1567-1576

3
Therefore, the search of biomaterials that promotes osseointegration while inhibiting bacterial 1
adhesion is an important challenge in the field. Current research to improve the performance of 2
metallic biomaterials rendering them with antimicrobial properties has focused on using polymers 3
[6,7], silver-containing coatings [8,9], or surface modifications by ion implantation [10-13]. The 4
approach of this investigation is the surface modification by Si+ ion implantation on austenitic stainless 5
steel 316 LVM. Rationale for the use of Si came from its significant role in the enhancement of bone 6
growth [14]. Materials containing very high Si levels, such as bioactive glass (Na-Ca-P-Si), 7
pseudowollastonites (CaSiO3), silica gel or porous silica, exhibit a good bioactivity [15,16]. This trend 8
has been also confirmed even with trace levels of Si doping to hydroxyapatite [17]. Hence, an in-depth 9
assessment of the effect of Si+ ion implantation on the biocompatibility and bacterial adhesion of 10
austenitic stainless steel 316 LVM has been investigated. For the biocompatibility study, human 11
mesenchymal stem cells (hMSCs) from bone marrow were selected. Initial osseointegration of 12
implanted biomaterials is initiated by recruitment of mesenchymal stem cells, as precursors of 13
osteoblastic lineage, which then mature into fully functional, osteoid-producing osteoblasts [18]. 14
Whereas a number of studies have addressed osteoblastic cells and stainless steel surface interactions 15
[19-22], hMSCs responses to modifications of this material have not been investigated to date. 16
Regarding bacterial adhesion, strains of Staphylococcus epidermidis, which differ in their capacity to 17
form biofilms, and one strain of the most pathogenic Staphylococcus aureus were selected due to its 18
relevance in infections related to orthopaedic implants [23]. We consider the initial adhesion from its 19
very early events to the first stages of the bacteria accommodation to the surface, as well as the 20
strength of the bacterial retention to the specimens and further viability of the microorganisms. For a 21
meaningful understanding of changes in the biological response associated to implantation, variations 22
in the chemical and physical surface properties of the alloy as chemical surface composition, 23
topography, surface Gibbs energy, isoelectric point and in vitro corrosion behavior have been 24
investigated. 25
2. Materials and methods 26
2.1. Materials 27
Materials Science and Engineering C 01/2011; 31(7):1567-1576

4
The 316 LVM austenitic stainless steel, whose chemical composition is shown in Table 1, was 1
supplied by Surgival (Valencia, Spain). Disks of 20 mm diameter and 2 mm thickness were grinded 2
with SiC papers, polished with diamond paste and finished with alumina powder of 0.5 μm in size to 3
obtain a mirror-like surface. Prior to experiments, specimens were sonicated in 70% acetone, 4
subsequently in distilled and deionized water and then in ethanol. Microstructural characterization was 5
performed by using a scanning electron microscope (SEM) JSM-6500F (Jeol, Tokyo, Japan) equipped 6
with a field emission gun (FEG) emitter coupled with an energy dispersive X-ray (EDX) system for 7
chemical analysis. 8
2.2. Ion implantation 9
Si+ ion implantation was performed at the Centro de Asistencia a la Investigación (CAI, UCM, 10
Madrid, Spain) with F4Si as a precursor for Si+ ions. An acceleration voltage of 80 keV with a dose of 11
1×10¹⁷ ions/cm2 was used. Theoretical calculations of the ion implanted affected zone have been made 12
using the PROFILE CODE software (v3.20 from Implant Sciences Corp., Wakefield, MA, USA). For 13
these experimental conditions an ion implanted zone of about 90 nm wide, with a maximum in the Si 14
content (19 at%) at 39 nm from the surface, is expected. In these conditions, the sputtered material 15
comprised the first 27 nm, and the Si content at the surface would amount to 3.5 at%. 16
2.3. Surface chemistry 17
XPS analysis of the specimens was performed at the CACTI service (Vigo, Spain) using an 18
ESCALAB 250 iXL (Thermo, Waltham, MA, USA) equipment working with monochromatic Al-Kα 19
radiation (1486.92 eV) under a pressure of 5×10⁻¹⁰ mbar within the measurement chamber, and with an 20
Ar+ ion gun for deep profiling. The X-ray spot was of 500 μm in diameter. 21
2.4. Micro/nano topography 22
A PicoLE (now Agilent 5100) atomic force microscope (AFM) from Agilent Technologies 23
(Santa Clara, CA, USA) has been used with Au-coated triangular tips (Mikromash, Tallin, Estonia) 24
working in contact mode. Images were subjected to first-order flattening to remove eventual 25
background tilt. The average roughness (Ra) and the root-mean-squared roughness (Rq) were derived 26
from 10×10 µm2 images. Also, line profiles were given to analyze the lateral distances of the 27
Materials Science and Engineering C 01/2011; 31(7):1567-1576

5
topographical features of the surface. Deflection images are presented when very small irregularities 1
are not well visible in the original topographical images. AFM images were also used to evaluate the 2
Wenzel roughness factor, defined as the ratio of the surface area to the projected area, that allows to 3
correlate the observed contact angle on a rough and homogeneous surface to that corresponding to the 4
flat surface [24,25]. Gwyddion 2.9 and PicoScan 5 AFM software packages were used in the 5
representation and analysis of data. 6
2.5. Surface Gibbs energy 7
Accordingly to the van Oss approach [26], surface Gibbs energy can be evaluated as 8
LW ABγ = γ + γ , being γLW and γAB its Lifshitz-van der Waals and acid-base components, respectively; 9
and where γAB can be expressed as a function of the electron-donor, γ-, and the electron-acceptor, γ+, 10
parameters, as −+ γ⋅γ=γ 2AB . Evaluation of these components and parameters for a given solid can 11
be done by measuring the contact angle, θL, of three probe liquids (L) of well known surface properties 12
and applying the Young-Dupré equation: 13
LW LWL L L L L(cos 1) 2 2 2+ − − +γ θ + = γ ⋅ γ + γ ⋅ γ + γ ⋅ γ (1) 14
To this aim, contact angles of water (θW) (distilled and deionized from a Milli-Q Plus system, 15
Millipore, Billerica, MA, USA), formamide (θF) (purity > 99.0%, Fluka, Sigma-Aldrich, St. Louis, 16
MO, USA) and diiodomethane (θD) (purity > 98%, Fluka) whose surface properties are well known 17
[26,27], were determined using the sessile drop technique with the aid of a G211 (Krüss, Hamburg, 18
Germany) goniometer. 19
2.6. Isoelectric point 20
The isoelectric point (IEP) of the specimens was evaluated by measuring the zeta potential, ζ, 21
from the streaming potential [28] by using the campling cell of an electrokinetic analyzer (EKA, Anton 22
Paar, Graz, Austria). The measurements were made in 0.001 M KCl setting a ramp pressure of 600 mb. 23
The pressure gradient (ΔP) between both ends of the clamping cell provoked movement of the 24
electrolyte inside the electrokinetic channel, which in turn was reflected in a potential difference 25
between both ends (ΔV). Both magnitudes are related to ζ by the expression 26
Materials Science and Engineering C 01/2011; 31(7):1567-1576

6
)··(P
··V0εεΔκηΔ
=ζ (2) 1
where κ is the specific electrical conductivity of the electrolyte, η its dynamic viscosity and ε and ε0 2
the dielectric permittivity of the electrolyte and vacuum, respectively. The IEP, or pH at which ζ is 3
zero, of the specimens was determined by changing the pH of the electrolytic solution by adding HCl 4
or KOH. 5
2.7. In vitro corrosion 6
The in vitro corrosion tests were carried out by soaking the specimens in Ringer’s solution 7
(8.36 g of NaCl, 0.3 g of KCl, and 0.15 g of CaCl2 in each 1000 ml of distilled water). Electrochemical 8
impedance spectroscopy (EIS) tests were performed in a conventional electrochemical cell filled with 9
the Ringer’s solution and using the investigated specimen as working electrode, a counter electrode of 10
platinum, and a reference electrode of Ag/AgCl saturated in a potassium chloride solution. The EIS 11
measurements were performed using a potentiostat/galvanostat AutoLab EcoChemie PGSTAT30 (Eco 12
Chemie, Utrecht, The Netherlands) equipped with a FRA2 frequency response analyzer module. 13
Frequency scans were carried out by applying sinusoidal wave perturbations of ±10mV in amplitude, 14
close to the corrosion potential, in the range of 100 kHz to several mHz. Five impedance sampling 15
points were registered per frequency decade. The EIS measurements were made after soaking the 16
specimens in the Ringer’s solution for 5 min and 24 h. The impedance data were analysed by using the 17
‘EQUIVCRT’ program [29]. The electrical resistance values were obtained by applying the routines of 18
the ZView® software version 3.1c (Scribner Associates Inc, Southern Pines, NC, USA). 19
2.8. In vitro biocompatibility assays 20
Purified hMSCs (CD105+, CD29+, CD44+, CD14–, CD34–, CD45–) were purchased from 21
Cambrex Bio Science (Verviers, Belgium) and expanded in growth medium (Cambrex Bio Science) 22
that consisted of MSC basal medium and the SingleQuots® growth supplements that contained fetal 23
bovine serum (FBS), L-glutamine and penicillin/streptomycin. In order to promote osteoblastic 24
differentiation, hMSCs were incubated for up to 12 days in osteogenic induction medium (Cambrex 25
Bio Science) that consisted of MSC basal medium and the SingleQuots® osteogenic supplements that 26
Materials Science and Engineering C 01/2011; 31(7):1567-1576

7
contained FBS, L-glutamine, penicillin/streptomycin, dexamethasone, ascorbate and β-1
glycerophosphate. Cells were maintained at 37ºC in a humidified 5% CO2 atmosphere. 2
Before cell culture experiments, the specimens were sterilized under ultraviolet light for 24 h. 3
For cell attachment assays, hMSCs were seeded on the specimens in 12-well plates (4×10⁴ 4
cells/well) and cultured for 1, 2 and 3 h in growth medium. Cell attachment was assessed using the 5
alamarBlue assay (Biosource, Nivelles, Belgium), which incorporates a redox indicator that changes 6
color in response to the metabolic activity. After washing extensively with phosphate buffered saline 7
(PBS), attached cells were incubated in DMEM containing 10% alamarBlue dye for 4 h, followed by 8
quantification in a spectrofluorometer (Victor2 Wallac 1420 Multilabel Counter, Perkin Elmer, Turkin, 9
Finland) using 530 nm for excitation and 590 nm for emission. 10
For cell spreading and arrangement of actin cytoskeleton, hMSCs were seeded on the 11
specimens in 12-well plates (1.5×10⁵ cells/well) and then cultured for 24 h. Attached cells were fixed 12
with 4% paraformaldehyde in PBS and permeabilized with 0.1% Triton X-100 in PBS. To visualize 13
actin filaments, cells were stained with PBS containing 4×10⁻⁷ M phalloidine-TRITC (Sigma) and 14
observed using a fluorescence microscope (Leica AF6000, Wetzlar, Germany). To determine cell 15
spreading, a total of 50 cells randomly selected from five representative fields per sample were 16
manually outlined, and cell areas were measured using the ImageJ v1.34 image analysis software. 17
Cell viability was assessed after seeding hMSCs on the specimens in 12-well plates (1.5×10⁴ 18
cells/well) and cultured for 1, 4 and 7 days in growth medium. At the end of the incubation period, 19
viable cells were quantified using the alamarBlue assay described above. In order to determine 20
alkaline phosphatase (ALP) levels and degree of mineralization, hMSCs were seeded on the specimens 21
in 12-well plates (1.1×10⁴ cells/well) and cultured for 12 days in osteogenic induction medium. To 22
prevent nutrient exhaustion, medium was partially replaced every 3-4 days with an equal volume of 23
fresh medium. hMSCs cultured in growth medium were used as a control. Cell layers were washed 24
exhaustively with PBS and extracted with 5×10⁻² M Tris–HCl pH 8.0, 5×10⁻¹ M NaCl and 1% Triton 25
X-100. ALP activity was assessed in cell layers by determining the release of p-nitrophenol from p-26
nitrophenylphosphate at 37ºC and a pH of 10.5. Data were normalized to the total protein amount in 27
Materials Science and Engineering C 01/2011; 31(7):1567-1576

3
Therefore, the search of biomaterials that promotes osseointegration while inhibiting bacterial 1
adhesion is an important challenge in the field. Current research to improve the performance of 2
metallic biomaterials rendering them with antimicrobial properties has focused on using polymers 3
[6,7], silver-containing coatings [8,9], or surface modifications by ion implantation [10-13]. The 4
approach of this investigation is the surface modification by Si+ ion implantation on austenitic stainless 5
steel 316 LVM. Rationale for the use of Si came from its significant role in the enhancement of bone 6
growth [14]. Materials containing very high Si levels, such as bioactive glass (Na-Ca-P-Si), 7
pseudowollastonites (CaSiO3), silica gel or porous silica, exhibit a good bioactivity [15,16]. This trend 8
has been also confirmed even with trace levels of Si doping to hydroxyapatite [17]. Hence, an in-depth 9
assessment of the effect of Si+ ion implantation on the biocompatibility and bacterial adhesion of 10
austenitic stainless steel 316 LVM has been investigated. For the biocompatibility study, human 11
mesenchymal stem cells (hMSCs) from bone marrow were selected. Initial osseointegration of 12
implanted biomaterials is initiated by recruitment of mesenchymal stem cells, as precursors of 13
osteoblastic lineage, which then mature into fully functional, osteoid-producing osteoblasts [18]. 14
Whereas a number of studies have addressed osteoblastic cells and stainless steel surface interactions 15
[19-22], hMSCs responses to modifications of this material have not been investigated to date. 16
Regarding bacterial adhesion, strains of Staphylococcus epidermidis, which differ in their capacity to 17
form biofilms, and one strain of the most pathogenic Staphylococcus aureus were selected due to its 18
relevance in infections related to orthopaedic implants [23]. We consider the initial adhesion from its 19
very early events to the first stages of the bacteria accommodation to the surface, as well as the 20
strength of the bacterial retention to the specimens and further viability of the microorganisms. For a 21
meaningful understanding of changes in the biological response associated to implantation, variations 22
in the chemical and physical surface properties of the alloy as chemical surface composition, 23
topography, surface Gibbs energy, isoelectric point and in vitro corrosion behavior have been 24
investigated. 25
2. Materials and methods 26
2.1. Materials 27
Materials Science and Engineering C 01/2011; 31(7):1567-1576

4
The 316 LVM austenitic stainless steel, whose chemical composition is shown in Table 1, was 1
supplied by Surgival (Valencia, Spain). Disks of 20 mm diameter and 2 mm thickness were grinded 2
with SiC papers, polished with diamond paste and finished with alumina powder of 0.5 μm in size to 3
obtain a mirror-like surface. Prior to experiments, specimens were sonicated in 70% acetone, 4
subsequently in distilled and deionized water and then in ethanol. Microstructural characterization was 5
performed by using a scanning electron microscope (SEM) JSM-6500F (Jeol, Tokyo, Japan) equipped 6
with a field emission gun (FEG) emitter coupled with an energy dispersive X-ray (EDX) system for 7
chemical analysis. 8
2.2. Ion implantation 9
Si+ ion implantation was performed at the Centro de Asistencia a la Investigación (CAI, UCM, 10
Madrid, Spain) with F4Si as a precursor for Si+ ions. An acceleration voltage of 80 keV with a dose of 11
1×10¹⁷ ions/cm2 was used. Theoretical calculations of the ion implanted affected zone have been made 12
using the PROFILE CODE software (v3.20 from Implant Sciences Corp., Wakefield, MA, USA). For 13
these experimental conditions an ion implanted zone of about 90 nm wide, with a maximum in the Si 14
content (19 at%) at 39 nm from the surface, is expected. In these conditions, the sputtered material 15
comprised the first 27 nm, and the Si content at the surface would amount to 3.5 at%. 16
2.3. Surface chemistry 17
XPS analysis of the specimens was performed at the CACTI service (Vigo, Spain) using an 18
ESCALAB 250 iXL (Thermo, Waltham, MA, USA) equipment working with monochromatic Al-Kα 19
radiation (1486.92 eV) under a pressure of 5×10⁻¹⁰ mbar within the measurement chamber, and with an 20
Ar+ ion gun for deep profiling. The X-ray spot was of 500 μm in diameter. 21
2.4. Micro/nano topography 22
A PicoLE (now Agilent 5100) atomic force microscope (AFM) from Agilent Technologies 23
(Santa Clara, CA, USA) has been used with Au-coated triangular tips (Mikromash, Tallin, Estonia) 24
working in contact mode. Images were subjected to first-order flattening to remove eventual 25
background tilt. The average roughness (Ra) and the root-mean-squared roughness (Rq) were derived 26
from 10×10 µm2 images. Also, line profiles were given to analyze the lateral distances of the 27
Materials Science and Engineering C 01/2011; 31(7):1567-1576

5
topographical features of the surface. Deflection images are presented when very small irregularities 1
are not well visible in the original topographical images. AFM images were also used to evaluate the 2
Wenzel roughness factor, defined as the ratio of the surface area to the projected area, that allows to 3
correlate the observed contact angle on a rough and homogeneous surface to that corresponding to the 4
flat surface [24,25]. Gwyddion 2.9 and PicoScan 5 AFM software packages were used in the 5
representation and analysis of data. 6
2.5. Surface Gibbs energy 7
Accordingly to the van Oss approach [26], surface Gibbs energy can be evaluated as 8
LW ABγ = γ + γ , being γLW and γAB its Lifshitz-van der Waals and acid-base components, respectively; 9
and where γAB can be expressed as a function of the electron-donor, γ-, and the electron-acceptor, γ+, 10
parameters, as −+ γ⋅γ=γ 2AB . Evaluation of these components and parameters for a given solid can 11
be done by measuring the contact angle, θL, of three probe liquids (L) of well known surface properties 12
and applying the Young-Dupré equation: 13
LW LWL L L L L(cos 1) 2 2 2+ − − +γ θ + = γ ⋅ γ + γ ⋅ γ + γ ⋅ γ (1) 14
To this aim, contact angles of water (θW) (distilled and deionized from a Milli-Q Plus system, 15
Millipore, Billerica, MA, USA), formamide (θF) (purity > 99.0%, Fluka, Sigma-Aldrich, St. Louis, 16
MO, USA) and diiodomethane (θD) (purity > 98%, Fluka) whose surface properties are well known 17
[26,27], were determined using the sessile drop technique with the aid of a G211 (Krüss, Hamburg, 18
Germany) goniometer. 19
2.6. Isoelectric point 20
The isoelectric point (IEP) of the specimens was evaluated by measuring the zeta potential, ζ, 21
from the streaming potential [28] by using the campling cell of an electrokinetic analyzer (EKA, Anton 22
Paar, Graz, Austria). The measurements were made in 0.001 M KCl setting a ramp pressure of 600 mb. 23
The pressure gradient (ΔP) between both ends of the clamping cell provoked movement of the 24
electrolyte inside the electrokinetic channel, which in turn was reflected in a potential difference 25
between both ends (ΔV). Both magnitudes are related to ζ by the expression 26
Materials Science and Engineering C 01/2011; 31(7):1567-1576

6
)··(P
··V0εεΔκηΔ
=ζ (2) 1
where κ is the specific electrical conductivity of the electrolyte, η its dynamic viscosity and ε and ε0 2
the dielectric permittivity of the electrolyte and vacuum, respectively. The IEP, or pH at which ζ is 3
zero, of the specimens was determined by changing the pH of the electrolytic solution by adding HCl 4
or KOH. 5
2.7. In vitro corrosion 6
The in vitro corrosion tests were carried out by soaking the specimens in Ringer’s solution 7
(8.36 g of NaCl, 0.3 g of KCl, and 0.15 g of CaCl2 in each 1000 ml of distilled water). Electrochemical 8
impedance spectroscopy (EIS) tests were performed in a conventional electrochemical cell filled with 9
the Ringer’s solution and using the investigated specimen as working electrode, a counter electrode of 10
platinum, and a reference electrode of Ag/AgCl saturated in a potassium chloride solution. The EIS 11
measurements were performed using a potentiostat/galvanostat AutoLab EcoChemie PGSTAT30 (Eco 12
Chemie, Utrecht, The Netherlands) equipped with a FRA2 frequency response analyzer module. 13
Frequency scans were carried out by applying sinusoidal wave perturbations of ±10mV in amplitude, 14
close to the corrosion potential, in the range of 100 kHz to several mHz. Five impedance sampling 15
points were registered per frequency decade. The EIS measurements were made after soaking the 16
specimens in the Ringer’s solution for 5 min and 24 h. The impedance data were analysed by using the 17
‘EQUIVCRT’ program [29]. The electrical resistance values were obtained by applying the routines of 18
the ZView® software version 3.1c (Scribner Associates Inc, Southern Pines, NC, USA). 19
2.8. In vitro biocompatibility assays 20
Purified hMSCs (CD105+, CD29+, CD44+, CD14–, CD34–, CD45–) were purchased from 21
Cambrex Bio Science (Verviers, Belgium) and expanded in growth medium (Cambrex Bio Science) 22
that consisted of MSC basal medium and the SingleQuots® growth supplements that contained fetal 23
bovine serum (FBS), L-glutamine and penicillin/streptomycin. In order to promote osteoblastic 24
differentiation, hMSCs were incubated for up to 12 days in osteogenic induction medium (Cambrex 25
Bio Science) that consisted of MSC basal medium and the SingleQuots® osteogenic supplements that 26
Materials Science and Engineering C 01/2011; 31(7):1567-1576
7
contained FBS, L-glutamine, penicillin/streptomycin, dexamethasone, ascorbate and β-1
glycerophosphate. Cells were maintained at 37ºC in a humidified 5% CO2 atmosphere. 2
Before cell culture experiments, the specimens were sterilized under ultraviolet light for 24 h. 3
For cell attachment assays, hMSCs were seeded on the specimens in 12-well plates (4×10⁴ 4
cells/well) and cultured for 1, 2 and 3 h in growth medium. Cell attachment was assessed using the 5
alamarBlue assay (Biosource, Nivelles, Belgium), which incorporates a redox indicator that changes 6
color in response to the metabolic activity. After washing extensively with phosphate buffered saline 7
(PBS), attached cells were incubated in DMEM containing 10% alamarBlue dye for 4 h, followed by 8
quantification in a spectrofluorometer (Victor2 Wallac 1420 Multilabel Counter, Perkin Elmer, Turkin, 9
Finland) using 530 nm for excitation and 590 nm for emission. 10
For cell spreading and arrangement of actin cytoskeleton, hMSCs were seeded on the 11
specimens in 12-well plates (1.5×10⁵ cells/well) and then cultured for 24 h. Attached cells were fixed 12
with 4% paraformaldehyde in PBS and permeabilized with 0.1% Triton X-100 in PBS. To visualize 13
actin filaments, cells were stained with PBS containing 4×10⁻⁷ M phalloidine-TRITC (Sigma) and 14
observed using a fluorescence microscope (Leica AF6000, Wetzlar, Germany). To determine cell 15
spreading, a total of 50 cells randomly selected from five representative fields per sample were 16
manually outlined, and cell areas were measured using the ImageJ v1.34 image analysis software. 17
Cell viability was assessed after seeding hMSCs on the specimens in 12-well plates (1.5×10⁴ 18
cells/well) and cultured for 1, 4 and 7 days in growth medium. At the end of the incubation period, 19
viable cells were quantified using the alamarBlue assay described above. In order to determine 20
alkaline phosphatase (ALP) levels and degree of mineralization, hMSCs were seeded on the specimens 21
in 12-well plates (1.1×10⁴ cells/well) and cultured for 12 days in osteogenic induction medium. To 22
prevent nutrient exhaustion, medium was partially replaced every 3-4 days with an equal volume of 23
fresh medium. hMSCs cultured in growth medium were used as a control. Cell layers were washed 24
exhaustively with PBS and extracted with 5×10⁻² M Tris–HCl pH 8.0, 5×10⁻¹ M NaCl and 1% Triton 25
X-100. ALP activity was assessed in cell layers by determining the release of p-nitrophenol from p-26
nitrophenylphosphate at 37ºC and a pH of 10.5. Data were normalized to the total protein amount in 27
Materials Science and Engineering C 01/2011; 31(7):1567-1576

9
was stopped and the specimen was placed at the bottom side of the flow channel by carefully turning 1
upside down the parallel plate flow chamber. Then, bacteria were let to deposit on the sample surface 2
and analysed after 2, 3, 10, 15 and 20 min. Between each one of such adhesion periods, the chamber 3
was again carefully turned upside down to quantify the adhered bacteria. The flow was slowly opened 4
to discard non-adhered bacteria and to homogenize the bacterial concentration inside the flow channel 5
for the next static adhesion period. Previous experiments showed that adhered bacteria were not 6
detached during this process. Adhesion rate determined from this last experimental setting will be 7
referred as static adhesion rate (jS). The evaluation of the retention strength was carried out by 8
detachment experiments. Once a static adhesion experiment was finished, and with a final number of 9
bacteria nF on the specimen surface, two consecutives liquid–air interfaces were passed through the 10
parallel plate flow chamber channel, over the surface of the specimen, sweeping away some adhered 11
bacteria in its path. The number of remaining bacteria on the surface was denoted by nR. 12
2.10. Bacteria viability 13
Adhesion experiments were carried out with the help of a reusable silicone chamber 14
(Flexiperm, Greiner Bio-One GmbH, Frickenhausen, Germany) fixed to the specimen surface. Then 2 15
ml of the bacterial suspension was added to the chamber well and let in contact with the surface for 60 16
min. After that time, the silicone well was carefully removed, the samples were slightly washed in PBS 17
twice and adhered bacteria were stained using the commercial Live/Dead Baclight L-7012 kit 18
(Invitrogen, Barcelona, Spain). Live and dead bacteria were observed simultaneously using a 19
fluorescence microscope (Olympus, Tokyo, Japan) 20
2.11. Statistical analysis 21
The statistical analysis of the data was undertaken using a one-tail unpaired t-test and one-way 22
ANOVAs. All data reported are mean ± S.D. of at least three independent experiments. The 23
confidential range selected was 95%, which gives statistical differences when p-values<0.05. 24
3. Results 25
3.1. Microstructure 26
Materials Science and Engineering C 01/2011; 31(7):1567-1576

10
Microstructural examination of the non implanted specimens was performed by using 1
backscattering electron images obtained in fresh polished sections. By operating at low voltages it was 2
possible to obtain images where contrast results from differences in the average atomic number and in 3
the grain orientation. Fig. 1 shows a representative view, which reveals relative large equiaxial grains 4
with an average size of about 45 μm. Twins growing from the grain boundaries to the grain interior, 5
obviously developed during the thermomechanical processing of the alloy, were often observed. In 6
addition, inclusions of SMn forming rather continuous stringers were occasionally observed. They are 7
elongated parallel to the longitudinal bar direction (thus in the cross sectional views, which are the 8
investigated surfaces) and observed as isolated round particles with a diameter of up to about 2 μm. 9
3.2. Surface chemistry 10
XPS analysis was performed on the Si+ ion implanted and non implanted specimens. Due to the 11
elevated C content at the outermost surface (~50 at%), resulting from the environmental 12
contamination, a precise quantification of the chemical composition at the first level is meaningless. 13
Nevertheless, it is worth to highlight that the content of the major elements decreased in the order of 14
Fe, Si, and Cr. Ni content was found to be insignificant. Si content (oxidized and non oxidized) had a 15
maximum value of about 10 at%. Fig. 2 shows the chemical composition (at%) as a function of depth 16
for the implanted specimen. For the sake of clarity, only profiles for C, forming carbides, Si and O 17
were included. The silicon content followed a nearly Gaussian curve with the maximum (~ 20 at%) at 18
about 30 nm from the surface. It was also detected a carburization associated to the implantation. 19
Relevant for the present work is that thickness of the passive film, as deduced from the oxygen profile 20
(see inset of Fig. 2), was below 2 nm. This value was smaller than the thickness estimated for the non 21
implanted specimens (6 to 8 nm). 22
3.3. Micro/nano topography 23
Fig. 3a1 shows a representative deflection mode AFM image of the surface of non implanted 24
specimens, jointly with the topographical profiles along the marked lines (Fig.3a2). The main 25
topographical features corresponded to the presence of grooves, whose depths were in the range of 0-26
30 nm. Upon Si+ ion implantation, AFM revealed a nanostructured surface (Fig. 3b), with areas 27
Materials Science and Engineering C 01/2011; 31(7):1567-1576
11
showing completely disordered nano-topography (Figs. 3c1, 3c2), and others showing ordered-aligned 1
nano-stripes (Figs. 3d1, 3d2). Most of the furrows remnants from the polished stage were not longer 2
observed. This might indicate that sputtering associated with the implantation process was dependent 3
on the grain orientation, rendering a selective etching. As a matter of fact, optical examination of the 4
Si+ ion implanted surface (image not included) showed a microstructure similar to that obtained by 5
backscattered electron images (Fig. 1) based on crystallographic contrast. 6
The Ra and Rq values obtained from AFM images are summarized in Table 2. Ion implantation 7
slightly increased the amplitude surface roughness parameters, but the different surface domains 8
observed upon Si+ ion implantation displayed almost the same values of Ra and Rq, even though 9
images showed very different surface morphology. The Wenzel roughness factor (r) was practically 1 10
(Table 2), which ensured that surface roughness did not influence the contact angle measurements. 11
This agrees with previous r values published for stainless steel surfaces [31]. 12
3.4. Contact angle and surface Gibbs energy 13
Contact angles for the three liquids tested were slightly lower on the Si+ ion implanted than on 14
the non implanted specimens (Table 3), but both were moderately hydrophobic. From these contact 15
angles and using Eq. (1), surface Gibbs energy and its components and parameters were evaluated and 16
listed in Table 3. For both kinds of specimens surface interactions were mainly mediated by Lifshitz-17
van der Waals forces, but the surface Gibbs energy of the Si+ ion implanted specimen was slightly 18
higher than for the non implanted one. 19
3.5. Isoelectric point 20
Assignment of absolute values of zeta potential for extended conductive materials, determined 21
with the streaming potential technique is controversial. The commonly used clamping cell introduces 22
some uncertainties in the quantification of absolute ζ values [32], but isoelectric points are unique and 23
specific ζ values can be compared between samples measured in the same conditions. In our cases, the 24
ζ potential evaluated from Eq. (2) at the physiological pH (Table 3) indicates that there was not 25
significant variation in ζ after Si+ ion implantation, being both surfaces negatively charged in 26
physiological conditions, and with the IEP close to 4. 27
Materials Science and Engineering C 01/2011; 31(7):1567-1576

12
3.6. In vitro corrosion 1
Figs. 4a and 4 b show the impedance (Nyquist) plots for the non implanted and Si+ ion 2
implanted specimens, respectively, after immersion in the Ringer’s solution during 5 min and 1 day. 3
The real and imaginary parts of the impedance are plotted in the complex plane as a function of the 4
frequency used in the EIS tests. After 5 min of immersion, the impedance plots tended to describe a 5
semicircle for both specimens. With progressing immersion time, semicircles were also described but 6
with larger diameter. Intersections of the impedance curves with the real axes at low-frequency (LF) 7
provide information about an electrical resistance. Such a resistance could be associated to (i) the 8
intrinsic electrical properties of the passive film, Rpf [33,34], (ii) the charge transfer resistance at the 9
metal/electrolyte interface associated to the corrosion phenomena, Rct [35], or (iii) the sum of both 10
resistances, Rpf+Rct [36]. Table 4 shows the electrical resistance values obtained by applying the 11
routines of the ZView® software. In a first approximation a simple equivalent circuit, R(RQ), based 12
just in a time constant, was used to calculate these values [35]. Impedance values of the implanted 13
specimens for the shorter immersion times were rather low, approaching to the behavior of a non-14
passivated alloy. After 24 h, the impedance diagrams show that both types of specimens reached a 15
spontaneous passivation. 16
3.7. In vitro biocompatibility assays 17
The number of attached cells increased with time on both surfaces. Si+ ion implantation did not 18
significantly affect the number of attached cells at any tested time (Fig. 5). On the two considered 19
surfaces, actin filaments organized in stress fibers mostly oriented following the main cellular axis 20
(Figs. 6a and 6b). Microscopic examination of actin-stained cells indicated a similar level of spreading 21
on both tested surfaces. The mean areas of cells for non implanted and Si+ ion implanted specimens 22
were 4946 ± 2344 μm2 (Fig. 6c) and 4715 ± 2464 μm2 (Fig. 6d), respectively. The number of viable 23
cells (Fig. 7a) increased in a time-dependent manner on both substrates. There were not significant 24
differences in cell viability between non implanted and Si+ ion implanted specimens at any point time. 25
Compared to cell culture conditions that maintained hMSCs in an undifferentiated state, ALP activity 26
(Fig. 7b) and matrix mineralization (Fig. 7c) increased greatly when hMSCs were cultured in 27
Materials Science and Engineering C 01/2011; 31(7):1567-1576

13
osteogenic induction medium on both materials. Similar degrees of cell matrix maturation and 1
calcification were detected on cell layers cultured on Si+ ion implanted and non implanted specimens. 2
3.8. Bacterial adhesion and retention strength 3
Fig. 8 shows the adhesion rates on the implanted and non implanted specimens for the (a) 4
dynamic (jD) and the (b) static (jS) processes. The initial adhesion rates (jD) when the specimens were 5
located at the top of the flow channel, (Fig. 8a), were always lower (p < 0.05) than the adhesion rate 6
calculated when the specimen was placed at the bottom (jS) (Fig. 8b). Dynamic adhesion experiments, 7
in which the sample was on the top of the channel avoiding bacteria deposition, were expected to be 8
mainly dictated by the action of long range forces. No significant differences were found among the jD 9
values for any of the three strains tested on the non implanted surfaces. However when jD was 10
evaluated on the implanted specimens, it decreased for the S. aureus strain, slightly increased for S. 11
epidermidis4 and was no significantly modified for S. epidermidis2. Also, no differences were found 12
in the static adhesion rates among strains on the nonimplanted samples (Fig. 8b), but jS decreased on 13
the implanted specimens, irrespective the bacterial strain (Fig. 8b). Fig. 9 adds more information to the 14
static adhesion process. The lines plotted show the variation of the bacterial adhesion as a function of 15
the contact time between material surfaces and bacterial suspensions (2, 5, 10, 15, 20 min). The 16
number of adhered bacteria for S. aureus was always superior to that of S. epidermidis on both 17
surfaces. For the three tested bacterial strains, the numbers of attached microorganisms after 10 min of 18
static adhesion were always inferior on the implanted surfaces (p < 0.05). 19
Results of the retention experiments are summarized in Fig. 10, where the number of adhered 20
bacteria, nF, after the static adhesion experiments and the number of retained bacteria on the surface 21
after two consecutives liquid–air interfaces, nR, have been plotted together. On the non implanted 22
specimens, the passage of the air-liquid interfaces did not significantly decrease the number of bacteria 23
retained (only S. epidermidis2 suffered a small decrease), while on the Si+ ion implanted specimens 24
this process caused an important detachment of adhered microorganisms. In any case, the density of 25
remaining bacteria on the surface was superior for S. aureus, irrespective the surface condition, which 26
indicated a higher strength of the bacterial retention as compared to S. epidermidis [37,38]. Bacterial 27
Materials Science and Engineering C 01/2011; 31(7):1567-1576

3
Therefore, the search of biomaterials that promotes osseointegration while inhibiting bacterial 1
adhesion is an important challenge in the field. Current research to improve the performance of 2
metallic biomaterials rendering them with antimicrobial properties has focused on using polymers 3
[6,7], silver-containing coatings [8,9], or surface modifications by ion implantation [10-13]. The 4
approach of this investigation is the surface modification by Si+ ion implantation on austenitic stainless 5
steel 316 LVM. Rationale for the use of Si came from its significant role in the enhancement of bone 6
growth [14]. Materials containing very high Si levels, such as bioactive glass (Na-Ca-P-Si), 7
pseudowollastonites (CaSiO3), silica gel or porous silica, exhibit a good bioactivity [15,16]. This trend 8
has been also confirmed even with trace levels of Si doping to hydroxyapatite [17]. Hence, an in-depth 9
assessment of the effect of Si+ ion implantation on the biocompatibility and bacterial adhesion of 10
austenitic stainless steel 316 LVM has been investigated. For the biocompatibility study, human 11
mesenchymal stem cells (hMSCs) from bone marrow were selected. Initial osseointegration of 12
implanted biomaterials is initiated by recruitment of mesenchymal stem cells, as precursors of 13
osteoblastic lineage, which then mature into fully functional, osteoid-producing osteoblasts [18]. 14
Whereas a number of studies have addressed osteoblastic cells and stainless steel surface interactions 15
[19-22], hMSCs responses to modifications of this material have not been investigated to date. 16
Regarding bacterial adhesion, strains of Staphylococcus epidermidis, which differ in their capacity to 17
form biofilms, and one strain of the most pathogenic Staphylococcus aureus were selected due to its 18
relevance in infections related to orthopaedic implants [23]. We consider the initial adhesion from its 19
very early events to the first stages of the bacteria accommodation to the surface, as well as the 20
strength of the bacterial retention to the specimens and further viability of the microorganisms. For a 21
meaningful understanding of changes in the biological response associated to implantation, variations 22
in the chemical and physical surface properties of the alloy as chemical surface composition, 23
topography, surface Gibbs energy, isoelectric point and in vitro corrosion behavior have been 24
investigated. 25
2. Materials and methods 26
2.1. Materials 27
Materials Science and Engineering C 01/2011; 31(7):1567-1576
4
The 316 LVM austenitic stainless steel, whose chemical composition is shown in Table 1, was 1
supplied by Surgival (Valencia, Spain). Disks of 20 mm diameter and 2 mm thickness were grinded 2
with SiC papers, polished with diamond paste and finished with alumina powder of 0.5 μm in size to 3
obtain a mirror-like surface. Prior to experiments, specimens were sonicated in 70% acetone, 4
subsequently in distilled and deionized water and then in ethanol. Microstructural characterization was 5
performed by using a scanning electron microscope (SEM) JSM-6500F (Jeol, Tokyo, Japan) equipped 6
with a field emission gun (FEG) emitter coupled with an energy dispersive X-ray (EDX) system for 7
chemical analysis. 8
2.2. Ion implantation 9
Si+ ion implantation was performed at the Centro de Asistencia a la Investigación (CAI, UCM, 10
Madrid, Spain) with F4Si as a precursor for Si+ ions. An acceleration voltage of 80 keV with a dose of 11
1×10¹⁷ ions/cm2 was used. Theoretical calculations of the ion implanted affected zone have been made 12
using the PROFILE CODE software (v3.20 from Implant Sciences Corp., Wakefield, MA, USA). For 13
these experimental conditions an ion implanted zone of about 90 nm wide, with a maximum in the Si 14
content (19 at%) at 39 nm from the surface, is expected. In these conditions, the sputtered material 15
comprised the first 27 nm, and the Si content at the surface would amount to 3.5 at%. 16
2.3. Surface chemistry 17
XPS analysis of the specimens was performed at the CACTI service (Vigo, Spain) using an 18
ESCALAB 250 iXL (Thermo, Waltham, MA, USA) equipment working with monochromatic Al-Kα 19
radiation (1486.92 eV) under a pressure of 5×10⁻¹⁰ mbar within the measurement chamber, and with an 20
Ar+ ion gun for deep profiling. The X-ray spot was of 500 μm in diameter. 21
2.4. Micro/nano topography 22
A PicoLE (now Agilent 5100) atomic force microscope (AFM) from Agilent Technologies 23
(Santa Clara, CA, USA) has been used with Au-coated triangular tips (Mikromash, Tallin, Estonia) 24
working in contact mode. Images were subjected to first-order flattening to remove eventual 25
background tilt. The average roughness (Ra) and the root-mean-squared roughness (Rq) were derived 26
from 10×10 µm2 images. Also, line profiles were given to analyze the lateral distances of the 27
Materials Science and Engineering C 01/2011; 31(7):1567-1576

5
topographical features of the surface. Deflection images are presented when very small irregularities 1
are not well visible in the original topographical images. AFM images were also used to evaluate the 2
Wenzel roughness factor, defined as the ratio of the surface area to the projected area, that allows to 3
correlate the observed contact angle on a rough and homogeneous surface to that corresponding to the 4
flat surface [24,25]. Gwyddion 2.9 and PicoScan 5 AFM software packages were used in the 5
representation and analysis of data. 6
2.5. Surface Gibbs energy 7
Accordingly to the van Oss approach [26], surface Gibbs energy can be evaluated as 8
LW ABγ = γ + γ , being γLW and γAB its Lifshitz-van der Waals and acid-base components, respectively; 9
and where γAB can be expressed as a function of the electron-donor, γ-, and the electron-acceptor, γ+, 10
parameters, as −+ γ⋅γ=γ 2AB . Evaluation of these components and parameters for a given solid can 11
be done by measuring the contact angle, θL, of three probe liquids (L) of well known surface properties 12
and applying the Young-Dupré equation: 13
LW LWL L L L L(cos 1) 2 2 2+ − − +γ θ + = γ ⋅ γ + γ ⋅ γ + γ ⋅ γ (1) 14
To this aim, contact angles of water (θW) (distilled and deionized from a Milli-Q Plus system, 15
Millipore, Billerica, MA, USA), formamide (θF) (purity > 99.0%, Fluka, Sigma-Aldrich, St. Louis, 16
MO, USA) and diiodomethane (θD) (purity > 98%, Fluka) whose surface properties are well known 17
[26,27], were determined using the sessile drop technique with the aid of a G211 (Krüss, Hamburg, 18
Germany) goniometer. 19
2.6. Isoelectric point 20
The isoelectric point (IEP) of the specimens was evaluated by measuring the zeta potential, ζ, 21
from the streaming potential [28] by using the campling cell of an electrokinetic analyzer (EKA, Anton 22
Paar, Graz, Austria). The measurements were made in 0.001 M KCl setting a ramp pressure of 600 mb. 23
The pressure gradient (ΔP) between both ends of the clamping cell provoked movement of the 24
electrolyte inside the electrokinetic channel, which in turn was reflected in a potential difference 25
between both ends (ΔV). Both magnitudes are related to ζ by the expression 26
Materials Science and Engineering C 01/2011; 31(7):1567-1576

6
)··(P
··V0εεΔκηΔ
=ζ (2) 1
where κ is the specific electrical conductivity of the electrolyte, η its dynamic viscosity and ε and ε0 2
the dielectric permittivity of the electrolyte and vacuum, respectively. The IEP, or pH at which ζ is 3
zero, of the specimens was determined by changing the pH of the electrolytic solution by adding HCl 4
or KOH. 5
2.7. In vitro corrosion 6
The in vitro corrosion tests were carried out by soaking the specimens in Ringer’s solution 7
(8.36 g of NaCl, 0.3 g of KCl, and 0.15 g of CaCl2 in each 1000 ml of distilled water). Electrochemical 8
impedance spectroscopy (EIS) tests were performed in a conventional electrochemical cell filled with 9
the Ringer’s solution and using the investigated specimen as working electrode, a counter electrode of 10
platinum, and a reference electrode of Ag/AgCl saturated in a potassium chloride solution. The EIS 11
measurements were performed using a potentiostat/galvanostat AutoLab EcoChemie PGSTAT30 (Eco 12
Chemie, Utrecht, The Netherlands) equipped with a FRA2 frequency response analyzer module. 13
Frequency scans were carried out by applying sinusoidal wave perturbations of ±10mV in amplitude, 14
close to the corrosion potential, in the range of 100 kHz to several mHz. Five impedance sampling 15
points were registered per frequency decade. The EIS measurements were made after soaking the 16
specimens in the Ringer’s solution for 5 min and 24 h. The impedance data were analysed by using the 17
‘EQUIVCRT’ program [29]. The electrical resistance values were obtained by applying the routines of 18
the ZView® software version 3.1c (Scribner Associates Inc, Southern Pines, NC, USA). 19
2.8. In vitro biocompatibility assays 20
Purified hMSCs (CD105+, CD29+, CD44+, CD14–, CD34–, CD45–) were purchased from 21
Cambrex Bio Science (Verviers, Belgium) and expanded in growth medium (Cambrex Bio Science) 22
that consisted of MSC basal medium and the SingleQuots® growth supplements that contained fetal 23
bovine serum (FBS), L-glutamine and penicillin/streptomycin. In order to promote osteoblastic 24
differentiation, hMSCs were incubated for up to 12 days in osteogenic induction medium (Cambrex 25
Bio Science) that consisted of MSC basal medium and the SingleQuots® osteogenic supplements that 26
Materials Science and Engineering C 01/2011; 31(7):1567-1576

7
contained FBS, L-glutamine, penicillin/streptomycin, dexamethasone, ascorbate and β-1
glycerophosphate. Cells were maintained at 37ºC in a humidified 5% CO2 atmosphere. 2
Before cell culture experiments, the specimens were sterilized under ultraviolet light for 24 h. 3
For cell attachment assays, hMSCs were seeded on the specimens in 12-well plates (4×10⁴ 4
cells/well) and cultured for 1, 2 and 3 h in growth medium. Cell attachment was assessed using the 5
alamarBlue assay (Biosource, Nivelles, Belgium), which incorporates a redox indicator that changes 6
color in response to the metabolic activity. After washing extensively with phosphate buffered saline 7
(PBS), attached cells were incubated in DMEM containing 10% alamarBlue dye for 4 h, followed by 8
quantification in a spectrofluorometer (Victor2 Wallac 1420 Multilabel Counter, Perkin Elmer, Turkin, 9
Finland) using 530 nm for excitation and 590 nm for emission. 10
For cell spreading and arrangement of actin cytoskeleton, hMSCs were seeded on the 11
specimens in 12-well plates (1.5×10⁵ cells/well) and then cultured for 24 h. Attached cells were fixed 12
with 4% paraformaldehyde in PBS and permeabilized with 0.1% Triton X-100 in PBS. To visualize 13
actin filaments, cells were stained with PBS containing 4×10⁻⁷ M phalloidine-TRITC (Sigma) and 14
observed using a fluorescence microscope (Leica AF6000, Wetzlar, Germany). To determine cell 15
spreading, a total of 50 cells randomly selected from five representative fields per sample were 16
manually outlined, and cell areas were measured using the ImageJ v1.34 image analysis software. 17
Cell viability was assessed after seeding hMSCs on the specimens in 12-well plates (1.5×10⁴ 18
cells/well) and cultured for 1, 4 and 7 days in growth medium. At the end of the incubation period, 19
viable cells were quantified using the alamarBlue assay described above. In order to determine 20
alkaline phosphatase (ALP) levels and degree of mineralization, hMSCs were seeded on the specimens 21
in 12-well plates (1.1×10⁴ cells/well) and cultured for 12 days in osteogenic induction medium. To 22
prevent nutrient exhaustion, medium was partially replaced every 3-4 days with an equal volume of 23
fresh medium. hMSCs cultured in growth medium were used as a control. Cell layers were washed 24
exhaustively with PBS and extracted with 5×10⁻² M Tris–HCl pH 8.0, 5×10⁻¹ M NaCl and 1% Triton 25
X-100. ALP activity was assessed in cell layers by determining the release of p-nitrophenol from p-26
nitrophenylphosphate at 37ºC and a pH of 10.5. Data were normalized to the total protein amount in 27
Materials Science and Engineering C 01/2011; 31(7):1567-1576
8
cell lysates, as measured by the Bradford method (Protein Assay, Bio-Rad, Hercules, CA, USA), using 1
bovine serum albumin (BSA) as standard. The degree of mineralization was determined using Alizarin 2
Red staining. Cell layers were washed exhaustively with PBS, fixed with ethanol and stained with 3
4×10⁻² M Alizarin Red in deionized water (adjusted to pH = 4.2). Following rinsing with PBS, the 4
bound stain was eluted with 10% (w/v) cetylpyridinium chloride and the absorbance at 562 nm was 5
measured using a spectrofluorimeter. 6
2.9. Bacterial adhesion and retention 7
For bacterial culture, S. aureus ATCC29213 (S. aureus), S. epidermidis ATCC35984 (S. 8
epidermidis4) and S. epidermidis HAM892 (S. epidermidis2) were stored at -80 ºC in porous beads 9
(Microbank, Pro-Lab Diagnostics, Toronto, Canada). S. epidermidis2 is a negative extracellular 10
polysaccharide substance producer (EPS-negative) mutant derived by acriflavine mutagenesis from S. 11
epidermidis4 (EPS-positive) that was kindly provided by L. Baldassarri from the Laboratorio di 12
Ultrastrutture, Istituto Superiore di Sanita, Rome, Italy. From the frozen stock, blood agar plates were 13
inoculated and incubated at 37 ºC to obtain cultures. From these cultures, tubes of 4 ml of Trypticase 14
Soy Broth (TSB) (BBL, Becton Dickinson, Franklin Lakes, NJ, USA) were inoculated for 10 h at 37 15
ºC and then 25 μl of this pre-culture was used again to inoculate 50 ml of TSB at 37 ºC for 14 h. This 16
period of time was sufficient to guarantee that all strains were at the beginning of the stationary growth 17
phase. The bacteria were then harvested by centrifugation for 5 min at 1000 g (Sorvall TC6, Dulont, 18
Newtown, PA, USA) and washed three times with PBS. Finally, the bacteria were re-suspended in 19
PBS at a concentration of 3×10⁸ bacteria/ml. Bacterial adhesion and bacterial retention experiments 20
were carried out at 37 ºC in a parallel plate flow chamber previously described [30]. Bacterial adhesion 21
was assessed under two different conditions. In the dynamic adhesion configuration, the specimen was 22
located at the top side of the flow channel, above the bacterial suspension flow. Evaluation of the 23
bacterial initial dynamic adhesion rate (jD), given as the number of bacteria adhered per square 24
centimeter and second, was done by continuous video recording of the specimen surface. Static 25
adhesion experiments were designed to allow bacterial deposition, avoiding any shear stress associated 26
to the bacterial suspension flow. To this purpose and after finishing the dynamic experiments, the flow 27
Materials Science and Engineering C 01/2011; 31(7):1567-1576

9
was stopped and the specimen was placed at the bottom side of the flow channel by carefully turning 1
upside down the parallel plate flow chamber. Then, bacteria were let to deposit on the sample surface 2
and analysed after 2, 3, 10, 15 and 20 min. Between each one of such adhesion periods, the chamber 3
was again carefully turned upside down to quantify the adhered bacteria. The flow was slowly opened 4
to discard non-adhered bacteria and to homogenize the bacterial concentration inside the flow channel 5
for the next static adhesion period. Previous experiments showed that adhered bacteria were not 6
detached during this process. Adhesion rate determined from this last experimental setting will be 7
referred as static adhesion rate (jS). The evaluation of the retention strength was carried out by 8
detachment experiments. Once a static adhesion experiment was finished, and with a final number of 9
bacteria nF on the specimen surface, two consecutives liquid–air interfaces were passed through the 10
parallel plate flow chamber channel, over the surface of the specimen, sweeping away some adhered 11
bacteria in its path. The number of remaining bacteria on the surface was denoted by nR. 12
2.10. Bacteria viability 13
Adhesion experiments were carried out with the help of a reusable silicone chamber 14
(Flexiperm, Greiner Bio-One GmbH, Frickenhausen, Germany) fixed to the specimen surface. Then 2 15
ml of the bacterial suspension was added to the chamber well and let in contact with the surface for 60 16
min. After that time, the silicone well was carefully removed, the samples were slightly washed in PBS 17
twice and adhered bacteria were stained using the commercial Live/Dead Baclight L-7012 kit 18
(Invitrogen, Barcelona, Spain). Live and dead bacteria were observed simultaneously using a 19
fluorescence microscope (Olympus, Tokyo, Japan) 20
2.11. Statistical analysis 21
The statistical analysis of the data was undertaken using a one-tail unpaired t-test and one-way 22
ANOVAs. All data reported are mean ± S.D. of at least three independent experiments. The 23
confidential range selected was 95%, which gives statistical differences when p-values<0.05. 24
3. Results 25
3.1. Microstructure 26
Materials Science and Engineering C 01/2011; 31(7):1567-1576

10
Microstructural examination of the non implanted specimens was performed by using 1
backscattering electron images obtained in fresh polished sections. By operating at low voltages it was 2
possible to obtain images where contrast results from differences in the average atomic number and in 3
the grain orientation. Fig. 1 shows a representative view, which reveals relative large equiaxial grains 4
with an average size of about 45 μm. Twins growing from the grain boundaries to the grain interior, 5
obviously developed during the thermomechanical processing of the alloy, were often observed. In 6
addition, inclusions of SMn forming rather continuous stringers were occasionally observed. They are 7
elongated parallel to the longitudinal bar direction (thus in the cross sectional views, which are the 8
investigated surfaces) and observed as isolated round particles with a diameter of up to about 2 μm. 9
3.2. Surface chemistry 10
XPS analysis was performed on the Si+ ion implanted and non implanted specimens. Due to the 11
elevated C content at the outermost surface (~50 at%), resulting from the environmental 12
contamination, a precise quantification of the chemical composition at the first level is meaningless. 13
Nevertheless, it is worth to highlight that the content of the major elements decreased in the order of 14
Fe, Si, and Cr. Ni content was found to be insignificant. Si content (oxidized and non oxidized) had a 15
maximum value of about 10 at%. Fig. 2 shows the chemical composition (at%) as a function of depth 16
for the implanted specimen. For the sake of clarity, only profiles for C, forming carbides, Si and O 17
were included. The silicon content followed a nearly Gaussian curve with the maximum (~ 20 at%) at 18
about 30 nm from the surface. It was also detected a carburization associated to the implantation. 19
Relevant for the present work is that thickness of the passive film, as deduced from the oxygen profile 20
(see inset of Fig. 2), was below 2 nm. This value was smaller than the thickness estimated for the non 21
implanted specimens (6 to 8 nm). 22
3.3. Micro/nano topography 23
Fig. 3a1 shows a representative deflection mode AFM image of the surface of non implanted 24
specimens, jointly with the topographical profiles along the marked lines (Fig.3a2). The main 25
topographical features corresponded to the presence of grooves, whose depths were in the range of 0-26
30 nm. Upon Si+ ion implantation, AFM revealed a nanostructured surface (Fig. 3b), with areas 27
Materials Science and Engineering C 01/2011; 31(7):1567-1576

11
showing completely disordered nano-topography (Figs. 3c1, 3c2), and others showing ordered-aligned 1
nano-stripes (Figs. 3d1, 3d2). Most of the furrows remnants from the polished stage were not longer 2
observed. This might indicate that sputtering associated with the implantation process was dependent 3
on the grain orientation, rendering a selective etching. As a matter of fact, optical examination of the 4
Si+ ion implanted surface (image not included) showed a microstructure similar to that obtained by 5
backscattered electron images (Fig. 1) based on crystallographic contrast. 6
The Ra and Rq values obtained from AFM images are summarized in Table 2. Ion implantation 7
slightly increased the amplitude surface roughness parameters, but the different surface domains 8
observed upon Si+ ion implantation displayed almost the same values of Ra and Rq, even though 9
images showed very different surface morphology. The Wenzel roughness factor (r) was practically 1 10
(Table 2), which ensured that surface roughness did not influence the contact angle measurements. 11
This agrees with previous r values published for stainless steel surfaces [31]. 12
3.4. Contact angle and surface Gibbs energy 13
Contact angles for the three liquids tested were slightly lower on the Si+ ion implanted than on 14
the non implanted specimens (Table 3), but both were moderately hydrophobic. From these contact 15
angles and using Eq. (1), surface Gibbs energy and its components and parameters were evaluated and 16
listed in Table 3. For both kinds of specimens surface interactions were mainly mediated by Lifshitz-17
van der Waals forces, but the surface Gibbs energy of the Si+ ion implanted specimen was slightly 18
higher than for the non implanted one. 19
3.5. Isoelectric point 20
Assignment of absolute values of zeta potential for extended conductive materials, determined 21
with the streaming potential technique is controversial. The commonly used clamping cell introduces 22
some uncertainties in the quantification of absolute ζ values [32], but isoelectric points are unique and 23
specific ζ values can be compared between samples measured in the same conditions. In our cases, the 24
ζ potential evaluated from Eq. (2) at the physiological pH (Table 3) indicates that there was not 25
significant variation in ζ after Si+ ion implantation, being both surfaces negatively charged in 26
physiological conditions, and with the IEP close to 4. 27
Materials Science and Engineering C 01/2011; 31(7):1567-1576

12
3.6. In vitro corrosion 1
Figs. 4a and 4 b show the impedance (Nyquist) plots for the non implanted and Si+ ion 2
implanted specimens, respectively, after immersion in the Ringer’s solution during 5 min and 1 day. 3
The real and imaginary parts of the impedance are plotted in the complex plane as a function of the 4
frequency used in the EIS tests. After 5 min of immersion, the impedance plots tended to describe a 5
semicircle for both specimens. With progressing immersion time, semicircles were also described but 6
with larger diameter. Intersections of the impedance curves with the real axes at low-frequency (LF) 7
provide information about an electrical resistance. Such a resistance could be associated to (i) the 8
intrinsic electrical properties of the passive film, Rpf [33,34], (ii) the charge transfer resistance at the 9
metal/electrolyte interface associated to the corrosion phenomena, Rct [35], or (iii) the sum of both 10
resistances, Rpf+Rct [36]. Table 4 shows the electrical resistance values obtained by applying the 11
routines of the ZView® software. In a first approximation a simple equivalent circuit, R(RQ), based 12
just in a time constant, was used to calculate these values [35]. Impedance values of the implanted 13
specimens for the shorter immersion times were rather low, approaching to the behavior of a non-14
passivated alloy. After 24 h, the impedance diagrams show that both types of specimens reached a 15
spontaneous passivation. 16
3.7. In vitro biocompatibility assays 17
The number of attached cells increased with time on both surfaces. Si+ ion implantation did not 18
significantly affect the number of attached cells at any tested time (Fig. 5). On the two considered 19
surfaces, actin filaments organized in stress fibers mostly oriented following the main cellular axis 20
(Figs. 6a and 6b). Microscopic examination of actin-stained cells indicated a similar level of spreading 21
on both tested surfaces. The mean areas of cells for non implanted and Si+ ion implanted specimens 22
were 4946 ± 2344 μm2 (Fig. 6c) and 4715 ± 2464 μm2 (Fig. 6d), respectively. The number of viable 23
cells (Fig. 7a) increased in a time-dependent manner on both substrates. There were not significant 24
differences in cell viability between non implanted and Si+ ion implanted specimens at any point time. 25
Compared to cell culture conditions that maintained hMSCs in an undifferentiated state, ALP activity 26
(Fig. 7b) and matrix mineralization (Fig. 7c) increased greatly when hMSCs were cultured in 27
Materials Science and Engineering C 01/2011; 31(7):1567-1576

13
osteogenic induction medium on both materials. Similar degrees of cell matrix maturation and 1
calcification were detected on cell layers cultured on Si+ ion implanted and non implanted specimens. 2
3.8. Bacterial adhesion and retention strength 3
Fig. 8 shows the adhesion rates on the implanted and non implanted specimens for the (a) 4
dynamic (jD) and the (b) static (jS) processes. The initial adhesion rates (jD) when the specimens were 5
located at the top of the flow channel, (Fig. 8a), were always lower (p < 0.05) than the adhesion rate 6
calculated when the specimen was placed at the bottom (jS) (Fig. 8b). Dynamic adhesion experiments, 7
in which the sample was on the top of the channel avoiding bacteria deposition, were expected to be 8
mainly dictated by the action of long range forces. No significant differences were found among the jD 9
values for any of the three strains tested on the non implanted surfaces. However when jD was 10
evaluated on the implanted specimens, it decreased for the S. aureus strain, slightly increased for S. 11
epidermidis4 and was no significantly modified for S. epidermidis2. Also, no differences were found 12
in the static adhesion rates among strains on the nonimplanted samples (Fig. 8b), but jS decreased on 13
the implanted specimens, irrespective the bacterial strain (Fig. 8b). Fig. 9 adds more information to the 14
static adhesion process. The lines plotted show the variation of the bacterial adhesion as a function of 15
the contact time between material surfaces and bacterial suspensions (2, 5, 10, 15, 20 min). The 16
number of adhered bacteria for S. aureus was always superior to that of S. epidermidis on both 17
surfaces. For the three tested bacterial strains, the numbers of attached microorganisms after 10 min of 18
static adhesion were always inferior on the implanted surfaces (p < 0.05). 19
Results of the retention experiments are summarized in Fig. 10, where the number of adhered 20
bacteria, nF, after the static adhesion experiments and the number of retained bacteria on the surface 21
after two consecutives liquid–air interfaces, nR, have been plotted together. On the non implanted 22
specimens, the passage of the air-liquid interfaces did not significantly decrease the number of bacteria 23
retained (only S. epidermidis2 suffered a small decrease), while on the Si+ ion implanted specimens 24
this process caused an important detachment of adhered microorganisms. In any case, the density of 25
remaining bacteria on the surface was superior for S. aureus, irrespective the surface condition, which 26
indicated a higher strength of the bacterial retention as compared to S. epidermidis [37,38]. Bacterial 27
Materials Science and Engineering C 01/2011; 31(7):1567-1576

8
cell lysates, as measured by the Bradford method (Protein Assay, Bio-Rad, Hercules, CA, USA), using 1
bovine serum albumin (BSA) as standard. The degree of mineralization was determined using Alizarin 2
Red staining. Cell layers were washed exhaustively with PBS, fixed with ethanol and stained with 3
4×10⁻² M Alizarin Red in deionized water (adjusted to pH = 4.2). Following rinsing with PBS, the 4
bound stain was eluted with 10% (w/v) cetylpyridinium chloride and the absorbance at 562 nm was 5
measured using a spectrofluorimeter. 6
2.9. Bacterial adhesion and retention 7
For bacterial culture, S. aureus ATCC29213 (S. aureus), S. epidermidis ATCC35984 (S. 8
epidermidis4) and S. epidermidis HAM892 (S. epidermidis2) were stored at -80 ºC in porous beads 9
(Microbank, Pro-Lab Diagnostics, Toronto, Canada). S. epidermidis2 is a negative extracellular 10
polysaccharide substance producer (EPS-negative) mutant derived by acriflavine mutagenesis from S. 11
epidermidis4 (EPS-positive) that was kindly provided by L. Baldassarri from the Laboratorio di 12
Ultrastrutture, Istituto Superiore di Sanita, Rome, Italy. From the frozen stock, blood agar plates were 13
inoculated and incubated at 37 ºC to obtain cultures. From these cultures, tubes of 4 ml of Trypticase 14
Soy Broth (TSB) (BBL, Becton Dickinson, Franklin Lakes, NJ, USA) were inoculated for 10 h at 37 15
ºC and then 25 μl of this pre-culture was used again to inoculate 50 ml of TSB at 37 ºC for 14 h. This 16
period of time was sufficient to guarantee that all strains were at the beginning of the stationary growth 17
phase. The bacteria were then harvested by centrifugation for 5 min at 1000 g (Sorvall TC6, Dulont, 18
Newtown, PA, USA) and washed three times with PBS. Finally, the bacteria were re-suspended in 19
PBS at a concentration of 3×10⁸ bacteria/ml. Bacterial adhesion and bacterial retention experiments 20
were carried out at 37 ºC in a parallel plate flow chamber previously described [30]. Bacterial adhesion 21
was assessed under two different conditions. In the dynamic adhesion configuration, the specimen was 22
located at the top side of the flow channel, above the bacterial suspension flow. Evaluation of the 23
bacterial initial dynamic adhesion rate (jD), given as the number of bacteria adhered per square 24
centimeter and second, was done by continuous video recording of the specimen surface. Static 25
adhesion experiments were designed to allow bacterial deposition, avoiding any shear stress associated 26
to the bacterial suspension flow. To this purpose and after finishing the dynamic experiments, the flow 27
Materials Science and Engineering C 01/2011; 31(7):1567-1576

9
was stopped and the specimen was placed at the bottom side of the flow channel by carefully turning 1
upside down the parallel plate flow chamber. Then, bacteria were let to deposit on the sample surface 2
and analysed after 2, 3, 10, 15 and 20 min. Between each one of such adhesion periods, the chamber 3
was again carefully turned upside down to quantify the adhered bacteria. The flow was slowly opened 4
to discard non-adhered bacteria and to homogenize the bacterial concentration inside the flow channel 5
for the next static adhesion period. Previous experiments showed that adhered bacteria were not 6
detached during this process. Adhesion rate determined from this last experimental setting will be 7
referred as static adhesion rate (jS). The evaluation of the retention strength was carried out by 8
detachment experiments. Once a static adhesion experiment was finished, and with a final number of 9
bacteria nF on the specimen surface, two consecutives liquid–air interfaces were passed through the 10
parallel plate flow chamber channel, over the surface of the specimen, sweeping away some adhered 11
bacteria in its path. The number of remaining bacteria on the surface was denoted by nR. 12
2.10. Bacteria viability 13
Adhesion experiments were carried out with the help of a reusable silicone chamber 14
(Flexiperm, Greiner Bio-One GmbH, Frickenhausen, Germany) fixed to the specimen surface. Then 2 15
ml of the bacterial suspension was added to the chamber well and let in contact with the surface for 60 16
min. After that time, the silicone well was carefully removed, the samples were slightly washed in PBS 17
twice and adhered bacteria were stained using the commercial Live/Dead Baclight L-7012 kit 18
(Invitrogen, Barcelona, Spain). Live and dead bacteria were observed simultaneously using a 19
fluorescence microscope (Olympus, Tokyo, Japan) 20
2.11. Statistical analysis 21
The statistical analysis of the data was undertaken using a one-tail unpaired t-test and one-way 22
ANOVAs. All data reported are mean ± S.D. of at least three independent experiments. The 23
confidential range selected was 95%, which gives statistical differences when p-values<0.05. 24
3. Results 25
3.1. Microstructure 26
Materials Science and Engineering C 01/2011; 31(7):1567-1576
10
Microstructural examination of the non implanted specimens was performed by using 1
backscattering electron images obtained in fresh polished sections. By operating at low voltages it was 2
possible to obtain images where contrast results from differences in the average atomic number and in 3
the grain orientation. Fig. 1 shows a representative view, which reveals relative large equiaxial grains 4
with an average size of about 45 μm. Twins growing from the grain boundaries to the grain interior, 5
obviously developed during the thermomechanical processing of the alloy, were often observed. In 6
addition, inclusions of SMn forming rather continuous stringers were occasionally observed. They are 7
elongated parallel to the longitudinal bar direction (thus in the cross sectional views, which are the 8
investigated surfaces) and observed as isolated round particles with a diameter of up to about 2 μm. 9
3.2. Surface chemistry 10
XPS analysis was performed on the Si+ ion implanted and non implanted specimens. Due to the 11
elevated C content at the outermost surface (~50 at%), resulting from the environmental 12
contamination, a precise quantification of the chemical composition at the first level is meaningless. 13
Nevertheless, it is worth to highlight that the content of the major elements decreased in the order of 14
Fe, Si, and Cr. Ni content was found to be insignificant. Si content (oxidized and non oxidized) had a 15
maximum value of about 10 at%. Fig. 2 shows the chemical composition (at%) as a function of depth 16
for the implanted specimen. For the sake of clarity, only profiles for C, forming carbides, Si and O 17
were included. The silicon content followed a nearly Gaussian curve with the maximum (~ 20 at%) at 18
about 30 nm from the surface. It was also detected a carburization associated to the implantation. 19
Relevant for the present work is that thickness of the passive film, as deduced from the oxygen profile 20
(see inset of Fig. 2), was below 2 nm. This value was smaller than the thickness estimated for the non 21
implanted specimens (6 to 8 nm). 22
3.3. Micro/nano topography 23
Fig. 3a1 shows a representative deflection mode AFM image of the surface of non implanted 24
specimens, jointly with the topographical profiles along the marked lines (Fig.3a2). The main 25
topographical features corresponded to the presence of grooves, whose depths were in the range of 0-26
30 nm. Upon Si+ ion implantation, AFM revealed a nanostructured surface (Fig. 3b), with areas 27
Materials Science and Engineering C 01/2011; 31(7):1567-1576
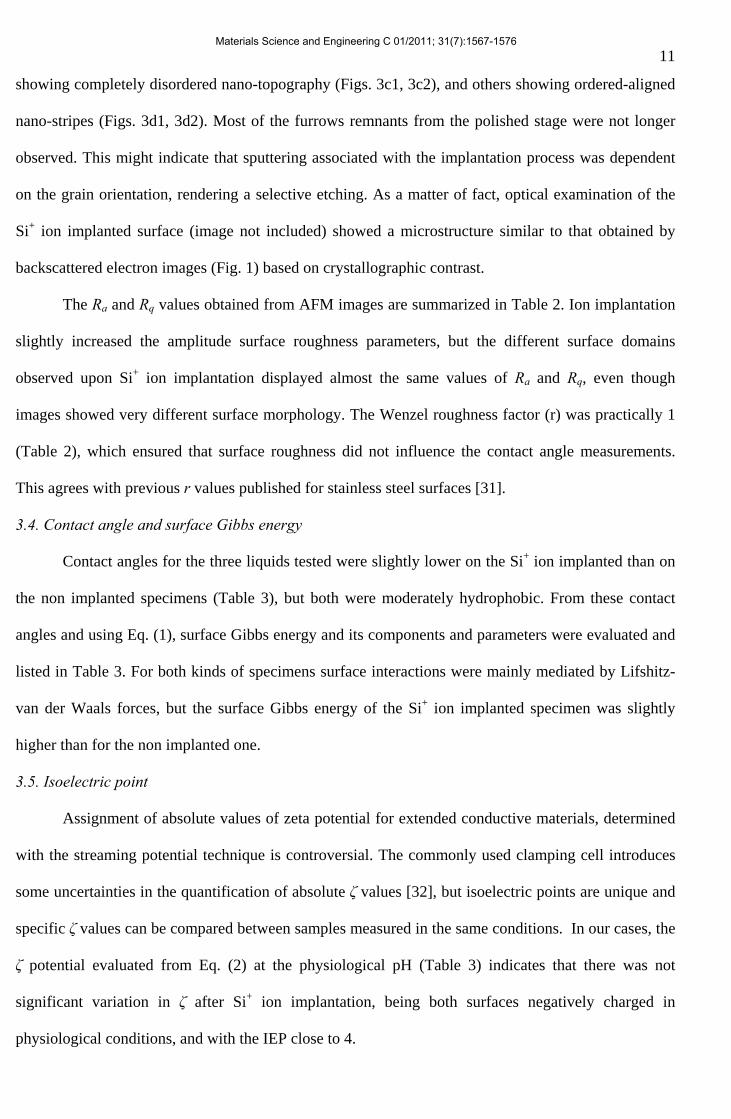
11
showing completely disordered nano-topography (Figs. 3c1, 3c2), and others showing ordered-aligned 1
nano-stripes (Figs. 3d1, 3d2). Most of the furrows remnants from the polished stage were not longer 2
observed. This might indicate that sputtering associated with the implantation process was dependent 3
on the grain orientation, rendering a selective etching. As a matter of fact, optical examination of the 4
Si+ ion implanted surface (image not included) showed a microstructure similar to that obtained by 5
backscattered electron images (Fig. 1) based on crystallographic contrast. 6
The Ra and Rq values obtained from AFM images are summarized in Table 2. Ion implantation 7
slightly increased the amplitude surface roughness parameters, but the different surface domains 8
observed upon Si+ ion implantation displayed almost the same values of Ra and Rq, even though 9
images showed very different surface morphology. The Wenzel roughness factor (r) was practically 1 10
(Table 2), which ensured that surface roughness did not influence the contact angle measurements. 11
This agrees with previous r values published for stainless steel surfaces [31]. 12
3.4. Contact angle and surface Gibbs energy 13
Contact angles for the three liquids tested were slightly lower on the Si+ ion implanted than on 14
the non implanted specimens (Table 3), but both were moderately hydrophobic. From these contact 15
angles and using Eq. (1), surface Gibbs energy and its components and parameters were evaluated and 16
listed in Table 3. For both kinds of specimens surface interactions were mainly mediated by Lifshitz-17
van der Waals forces, but the surface Gibbs energy of the Si+ ion implanted specimen was slightly 18
higher than for the non implanted one. 19
3.5. Isoelectric point 20
Assignment of absolute values of zeta potential for extended conductive materials, determined 21
with the streaming potential technique is controversial. The commonly used clamping cell introduces 22
some uncertainties in the quantification of absolute ζ values [32], but isoelectric points are unique and 23
specific ζ values can be compared between samples measured in the same conditions. In our cases, the 24
ζ potential evaluated from Eq. (2) at the physiological pH (Table 3) indicates that there was not 25
significant variation in ζ after Si+ ion implantation, being both surfaces negatively charged in 26
physiological conditions, and with the IEP close to 4. 27
Materials Science and Engineering C 01/2011; 31(7):1567-1576
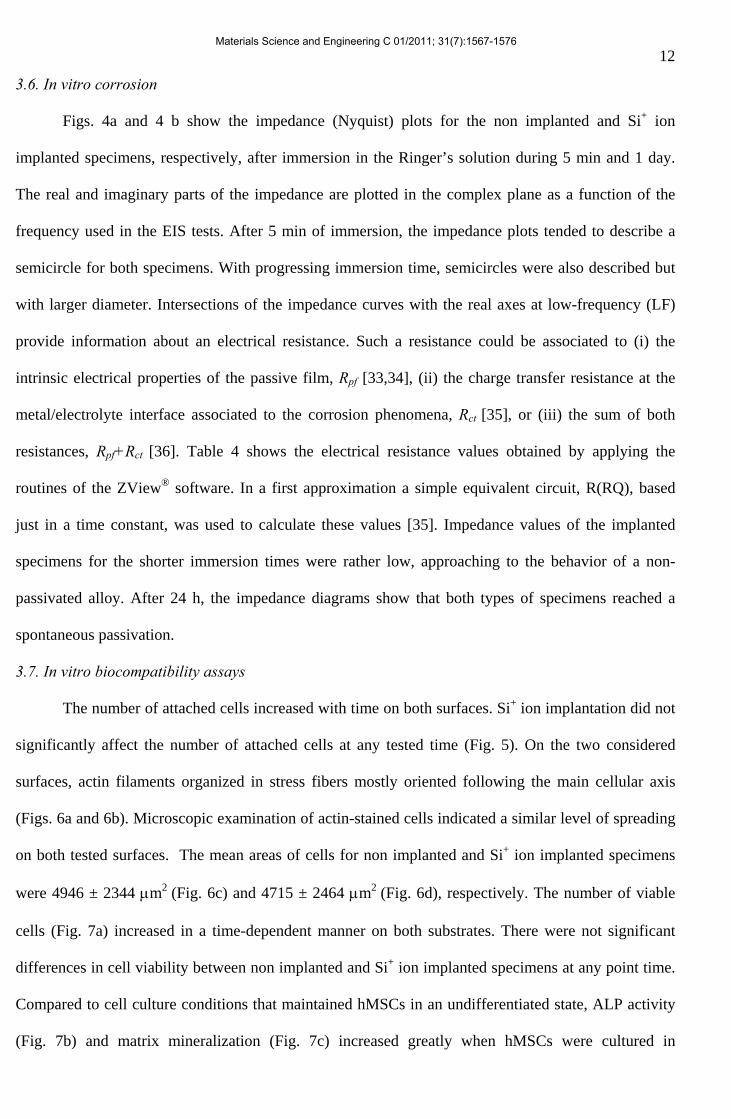
12
3.6. In vitro corrosion 1
Figs. 4a and 4 b show the impedance (Nyquist) plots for the non implanted and Si+ ion 2
implanted specimens, respectively, after immersion in the Ringer’s solution during 5 min and 1 day. 3
The real and imaginary parts of the impedance are plotted in the complex plane as a function of the 4
frequency used in the EIS tests. After 5 min of immersion, the impedance plots tended to describe a 5
semicircle for both specimens. With progressing immersion time, semicircles were also described but 6
with larger diameter. Intersections of the impedance curves with the real axes at low-frequency (LF) 7
provide information about an electrical resistance. Such a resistance could be associated to (i) the 8
intrinsic electrical properties of the passive film, Rpf [33,34], (ii) the charge transfer resistance at the 9
metal/electrolyte interface associated to the corrosion phenomena, Rct [35], or (iii) the sum of both 10
resistances, Rpf+Rct [36]. Table 4 shows the electrical resistance values obtained by applying the 11
routines of the ZView® software. In a first approximation a simple equivalent circuit, R(RQ), based 12
just in a time constant, was used to calculate these values [35]. Impedance values of the implanted 13
specimens for the shorter immersion times were rather low, approaching to the behavior of a non-14
passivated alloy. After 24 h, the impedance diagrams show that both types of specimens reached a 15
spontaneous passivation. 16
3.7. In vitro biocompatibility assays 17
The number of attached cells increased with time on both surfaces. Si+ ion implantation did not 18
significantly affect the number of attached cells at any tested time (Fig. 5). On the two considered 19
surfaces, actin filaments organized in stress fibers mostly oriented following the main cellular axis 20
(Figs. 6a and 6b). Microscopic examination of actin-stained cells indicated a similar level of spreading 21
on both tested surfaces. The mean areas of cells for non implanted and Si+ ion implanted specimens 22
were 4946 ± 2344 μm2 (Fig. 6c) and 4715 ± 2464 μm2 (Fig. 6d), respectively. The number of viable 23
cells (Fig. 7a) increased in a time-dependent manner on both substrates. There were not significant 24
differences in cell viability between non implanted and Si+ ion implanted specimens at any point time. 25
Compared to cell culture conditions that maintained hMSCs in an undifferentiated state, ALP activity 26
(Fig. 7b) and matrix mineralization (Fig. 7c) increased greatly when hMSCs were cultured in 27
Materials Science and Engineering C 01/2011; 31(7):1567-1576

13
osteogenic induction medium on both materials. Similar degrees of cell matrix maturation and 1
calcification were detected on cell layers cultured on Si+ ion implanted and non implanted specimens. 2
3.8. Bacterial adhesion and retention strength 3
Fig. 8 shows the adhesion rates on the implanted and non implanted specimens for the (a) 4
dynamic (jD) and the (b) static (jS) processes. The initial adhesion rates (jD) when the specimens were 5
located at the top of the flow channel, (Fig. 8a), were always lower (p < 0.05) than the adhesion rate 6
calculated when the specimen was placed at the bottom (jS) (Fig. 8b). Dynamic adhesion experiments, 7
in which the sample was on the top of the channel avoiding bacteria deposition, were expected to be 8
mainly dictated by the action of long range forces. No significant differences were found among the jD 9
values for any of the three strains tested on the non implanted surfaces. However when jD was 10
evaluated on the implanted specimens, it decreased for the S. aureus strain, slightly increased for S. 11
epidermidis4 and was no significantly modified for S. epidermidis2. Also, no differences were found 12
in the static adhesion rates among strains on the nonimplanted samples (Fig. 8b), but jS decreased on 13
the implanted specimens, irrespective the bacterial strain (Fig. 8b). Fig. 9 adds more information to the 14
static adhesion process. The lines plotted show the variation of the bacterial adhesion as a function of 15
the contact time between material surfaces and bacterial suspensions (2, 5, 10, 15, 20 min). The 16
number of adhered bacteria for S. aureus was always superior to that of S. epidermidis on both 17
surfaces. For the three tested bacterial strains, the numbers of attached microorganisms after 10 min of 18
static adhesion were always inferior on the implanted surfaces (p < 0.05). 19
Results of the retention experiments are summarized in Fig. 10, where the number of adhered 20
bacteria, nF, after the static adhesion experiments and the number of retained bacteria on the surface 21
after two consecutives liquid–air interfaces, nR, have been plotted together. On the non implanted 22
specimens, the passage of the air-liquid interfaces did not significantly decrease the number of bacteria 23
retained (only S. epidermidis2 suffered a small decrease), while on the Si+ ion implanted specimens 24
this process caused an important detachment of adhered microorganisms. In any case, the density of 25
remaining bacteria on the surface was superior for S. aureus, irrespective the surface condition, which 26
indicated a higher strength of the bacterial retention as compared to S. epidermidis [37,38]. Bacterial 27
Materials Science and Engineering C 01/2011; 31(7):1567-1576

3
Therefore, the search of biomaterials that promotes osseointegration while inhibiting bacterial 1
adhesion is an important challenge in the field. Current research to improve the performance of 2
metallic biomaterials rendering them with antimicrobial properties has focused on using polymers 3
[6,7], silver-containing coatings [8,9], or surface modifications by ion implantation [10-13]. The 4
approach of this investigation is the surface modification by Si+ ion implantation on austenitic stainless 5
steel 316 LVM. Rationale for the use of Si came from its significant role in the enhancement of bone 6
growth [14]. Materials containing very high Si levels, such as bioactive glass (Na-Ca-P-Si), 7
pseudowollastonites (CaSiO3), silica gel or porous silica, exhibit a good bioactivity [15,16]. This trend 8
has been also confirmed even with trace levels of Si doping to hydroxyapatite [17]. Hence, an in-depth 9
assessment of the effect of Si+ ion implantation on the biocompatibility and bacterial adhesion of 10
austenitic stainless steel 316 LVM has been investigated. For the biocompatibility study, human 11
mesenchymal stem cells (hMSCs) from bone marrow were selected. Initial osseointegration of 12
implanted biomaterials is initiated by recruitment of mesenchymal stem cells, as precursors of 13
osteoblastic lineage, which then mature into fully functional, osteoid-producing osteoblasts [18]. 14
Whereas a number of studies have addressed osteoblastic cells and stainless steel surface interactions 15
[19-22], hMSCs responses to modifications of this material have not been investigated to date. 16
Regarding bacterial adhesion, strains of Staphylococcus epidermidis, which differ in their capacity to 17
form biofilms, and one strain of the most pathogenic Staphylococcus aureus were selected due to its 18
relevance in infections related to orthopaedic implants [23]. We consider the initial adhesion from its 19
very early events to the first stages of the bacteria accommodation to the surface, as well as the 20
strength of the bacterial retention to the specimens and further viability of the microorganisms. For a 21
meaningful understanding of changes in the biological response associated to implantation, variations 22
in the chemical and physical surface properties of the alloy as chemical surface composition, 23
topography, surface Gibbs energy, isoelectric point and in vitro corrosion behavior have been 24
investigated. 25
2. Materials and methods 26
2.1. Materials 27
Materials Science and Engineering C 01/2011; 31(7):1567-1576

4
The 316 LVM austenitic stainless steel, whose chemical composition is shown in Table 1, was 1
supplied by Surgival (Valencia, Spain). Disks of 20 mm diameter and 2 mm thickness were grinded 2
with SiC papers, polished with diamond paste and finished with alumina powder of 0.5 μm in size to 3
obtain a mirror-like surface. Prior to experiments, specimens were sonicated in 70% acetone, 4
subsequently in distilled and deionized water and then in ethanol. Microstructural characterization was 5
performed by using a scanning electron microscope (SEM) JSM-6500F (Jeol, Tokyo, Japan) equipped 6
with a field emission gun (FEG) emitter coupled with an energy dispersive X-ray (EDX) system for 7
chemical analysis. 8
2.2. Ion implantation 9
Si+ ion implantation was performed at the Centro de Asistencia a la Investigación (CAI, UCM, 10
Madrid, Spain) with F4Si as a precursor for Si+ ions. An acceleration voltage of 80 keV with a dose of 11
1×10¹⁷ ions/cm2 was used. Theoretical calculations of the ion implanted affected zone have been made 12
using the PROFILE CODE software (v3.20 from Implant Sciences Corp., Wakefield, MA, USA). For 13
these experimental conditions an ion implanted zone of about 90 nm wide, with a maximum in the Si 14
content (19 at%) at 39 nm from the surface, is expected. In these conditions, the sputtered material 15
comprised the first 27 nm, and the Si content at the surface would amount to 3.5 at%. 16
2.3. Surface chemistry 17
XPS analysis of the specimens was performed at the CACTI service (Vigo, Spain) using an 18
ESCALAB 250 iXL (Thermo, Waltham, MA, USA) equipment working with monochromatic Al-Kα 19
radiation (1486.92 eV) under a pressure of 5×10⁻¹⁰ mbar within the measurement chamber, and with an 20
Ar+ ion gun for deep profiling. The X-ray spot was of 500 μm in diameter. 21
2.4. Micro/nano topography 22
A PicoLE (now Agilent 5100) atomic force microscope (AFM) from Agilent Technologies 23
(Santa Clara, CA, USA) has been used with Au-coated triangular tips (Mikromash, Tallin, Estonia) 24
working in contact mode. Images were subjected to first-order flattening to remove eventual 25
background tilt. The average roughness (Ra) and the root-mean-squared roughness (Rq) were derived 26
from 10×10 µm2 images. Also, line profiles were given to analyze the lateral distances of the 27
Materials Science and Engineering C 01/2011; 31(7):1567-1576

5
topographical features of the surface. Deflection images are presented when very small irregularities 1
are not well visible in the original topographical images. AFM images were also used to evaluate the 2
Wenzel roughness factor, defined as the ratio of the surface area to the projected area, that allows to 3
correlate the observed contact angle on a rough and homogeneous surface to that corresponding to the 4
flat surface [24,25]. Gwyddion 2.9 and PicoScan 5 AFM software packages were used in the 5
representation and analysis of data. 6
2.5. Surface Gibbs energy 7
Accordingly to the van Oss approach [26], surface Gibbs energy can be evaluated as 8
LW ABγ = γ + γ , being γLW and γAB its Lifshitz-van der Waals and acid-base components, respectively; 9
and where γAB can be expressed as a function of the electron-donor, γ-, and the electron-acceptor, γ+, 10
parameters, as −+ γ⋅γ=γ 2AB . Evaluation of these components and parameters for a given solid can 11
be done by measuring the contact angle, θL, of three probe liquids (L) of well known surface properties 12
and applying the Young-Dupré equation: 13
LW LWL L L L L(cos 1) 2 2 2+ − − +γ θ + = γ ⋅ γ + γ ⋅ γ + γ ⋅ γ (1) 14
To this aim, contact angles of water (θW) (distilled and deionized from a Milli-Q Plus system, 15
Millipore, Billerica, MA, USA), formamide (θF) (purity > 99.0%, Fluka, Sigma-Aldrich, St. Louis, 16
MO, USA) and diiodomethane (θD) (purity > 98%, Fluka) whose surface properties are well known 17
[26,27], were determined using the sessile drop technique with the aid of a G211 (Krüss, Hamburg, 18
Germany) goniometer. 19
2.6. Isoelectric point 20
The isoelectric point (IEP) of the specimens was evaluated by measuring the zeta potential, ζ, 21
from the streaming potential [28] by using the campling cell of an electrokinetic analyzer (EKA, Anton 22
Paar, Graz, Austria). The measurements were made in 0.001 M KCl setting a ramp pressure of 600 mb. 23
The pressure gradient (ΔP) between both ends of the clamping cell provoked movement of the 24
electrolyte inside the electrokinetic channel, which in turn was reflected in a potential difference 25
between both ends (ΔV). Both magnitudes are related to ζ by the expression 26
Materials Science and Engineering C 01/2011; 31(7):1567-1576

6
)··(P
··V0εεΔκηΔ
=ζ (2) 1
where κ is the specific electrical conductivity of the electrolyte, η its dynamic viscosity and ε and ε0 2
the dielectric permittivity of the electrolyte and vacuum, respectively. The IEP, or pH at which ζ is 3
zero, of the specimens was determined by changing the pH of the electrolytic solution by adding HCl 4
or KOH. 5
2.7. In vitro corrosion 6
The in vitro corrosion tests were carried out by soaking the specimens in Ringer’s solution 7
(8.36 g of NaCl, 0.3 g of KCl, and 0.15 g of CaCl2 in each 1000 ml of distilled water). Electrochemical 8
impedance spectroscopy (EIS) tests were performed in a conventional electrochemical cell filled with 9
the Ringer’s solution and using the investigated specimen as working electrode, a counter electrode of 10
platinum, and a reference electrode of Ag/AgCl saturated in a potassium chloride solution. The EIS 11
measurements were performed using a potentiostat/galvanostat AutoLab EcoChemie PGSTAT30 (Eco 12
Chemie, Utrecht, The Netherlands) equipped with a FRA2 frequency response analyzer module. 13
Frequency scans were carried out by applying sinusoidal wave perturbations of ±10mV in amplitude, 14
close to the corrosion potential, in the range of 100 kHz to several mHz. Five impedance sampling 15
points were registered per frequency decade. The EIS measurements were made after soaking the 16
specimens in the Ringer’s solution for 5 min and 24 h. The impedance data were analysed by using the 17
‘EQUIVCRT’ program [29]. The electrical resistance values were obtained by applying the routines of 18
the ZView® software version 3.1c (Scribner Associates Inc, Southern Pines, NC, USA). 19
2.8. In vitro biocompatibility assays 20
Purified hMSCs (CD105+, CD29+, CD44+, CD14–, CD34–, CD45–) were purchased from 21
Cambrex Bio Science (Verviers, Belgium) and expanded in growth medium (Cambrex Bio Science) 22
that consisted of MSC basal medium and the SingleQuots® growth supplements that contained fetal 23
bovine serum (FBS), L-glutamine and penicillin/streptomycin. In order to promote osteoblastic 24
differentiation, hMSCs were incubated for up to 12 days in osteogenic induction medium (Cambrex 25
Bio Science) that consisted of MSC basal medium and the SingleQuots® osteogenic supplements that 26
Materials Science and Engineering C 01/2011; 31(7):1567-1576
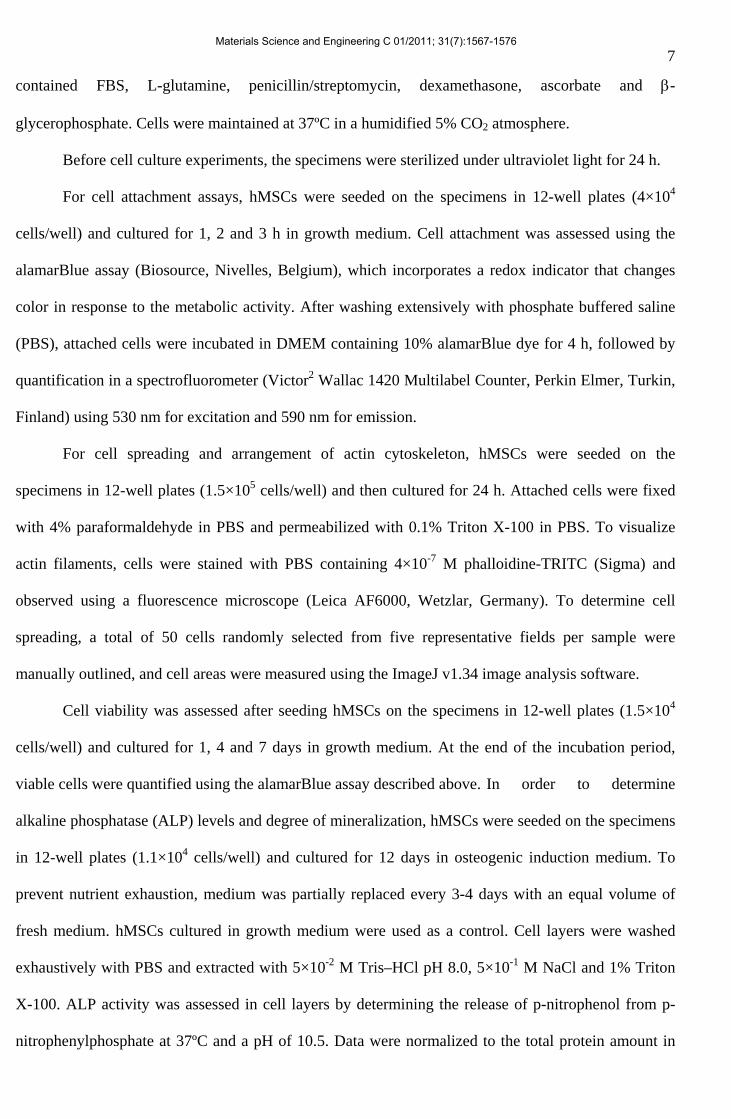
7
contained FBS, L-glutamine, penicillin/streptomycin, dexamethasone, ascorbate and β-1
glycerophosphate. Cells were maintained at 37ºC in a humidified 5% CO2 atmosphere. 2
Before cell culture experiments, the specimens were sterilized under ultraviolet light for 24 h. 3
For cell attachment assays, hMSCs were seeded on the specimens in 12-well plates (4×10⁴ 4
cells/well) and cultured for 1, 2 and 3 h in growth medium. Cell attachment was assessed using the 5
alamarBlue assay (Biosource, Nivelles, Belgium), which incorporates a redox indicator that changes 6
color in response to the metabolic activity. After washing extensively with phosphate buffered saline 7
(PBS), attached cells were incubated in DMEM containing 10% alamarBlue dye for 4 h, followed by 8
quantification in a spectrofluorometer (Victor2 Wallac 1420 Multilabel Counter, Perkin Elmer, Turkin, 9
Finland) using 530 nm for excitation and 590 nm for emission. 10
For cell spreading and arrangement of actin cytoskeleton, hMSCs were seeded on the 11
specimens in 12-well plates (1.5×10⁵ cells/well) and then cultured for 24 h. Attached cells were fixed 12
with 4% paraformaldehyde in PBS and permeabilized with 0.1% Triton X-100 in PBS. To visualize 13
actin filaments, cells were stained with PBS containing 4×10⁻⁷ M phalloidine-TRITC (Sigma) and 14
observed using a fluorescence microscope (Leica AF6000, Wetzlar, Germany). To determine cell 15
spreading, a total of 50 cells randomly selected from five representative fields per sample were 16
manually outlined, and cell areas were measured using the ImageJ v1.34 image analysis software. 17
Cell viability was assessed after seeding hMSCs on the specimens in 12-well plates (1.5×10⁴ 18
cells/well) and cultured for 1, 4 and 7 days in growth medium. At the end of the incubation period, 19
viable cells were quantified using the alamarBlue assay described above. In order to determine 20
alkaline phosphatase (ALP) levels and degree of mineralization, hMSCs were seeded on the specimens 21
in 12-well plates (1.1×10⁴ cells/well) and cultured for 12 days in osteogenic induction medium. To 22
prevent nutrient exhaustion, medium was partially replaced every 3-4 days with an equal volume of 23
fresh medium. hMSCs cultured in growth medium were used as a control. Cell layers were washed 24
exhaustively with PBS and extracted with 5×10⁻² M Tris–HCl pH 8.0, 5×10⁻¹ M NaCl and 1% Triton 25
X-100. ALP activity was assessed in cell layers by determining the release of p-nitrophenol from p-26
nitrophenylphosphate at 37ºC and a pH of 10.5. Data were normalized to the total protein amount in 27
Materials Science and Engineering C 01/2011; 31(7):1567-1576

8
cell lysates, as measured by the Bradford method (Protein Assay, Bio-Rad, Hercules, CA, USA), using 1
bovine serum albumin (BSA) as standard. The degree of mineralization was determined using Alizarin 2
Red staining. Cell layers were washed exhaustively with PBS, fixed with ethanol and stained with 3
4×10⁻² M Alizarin Red in deionized water (adjusted to pH = 4.2). Following rinsing with PBS, the 4
bound stain was eluted with 10% (w/v) cetylpyridinium chloride and the absorbance at 562 nm was 5
measured using a spectrofluorimeter. 6
2.9. Bacterial adhesion and retention 7
For bacterial culture, S. aureus ATCC29213 (S. aureus), S. epidermidis ATCC35984 (S. 8
epidermidis4) and S. epidermidis HAM892 (S. epidermidis2) were stored at -80 ºC in porous beads 9
(Microbank, Pro-Lab Diagnostics, Toronto, Canada). S. epidermidis2 is a negative extracellular 10
polysaccharide substance producer (EPS-negative) mutant derived by acriflavine mutagenesis from S. 11
epidermidis4 (EPS-positive) that was kindly provided by L. Baldassarri from the Laboratorio di 12
Ultrastrutture, Istituto Superiore di Sanita, Rome, Italy. From the frozen stock, blood agar plates were 13
inoculated and incubated at 37 ºC to obtain cultures. From these cultures, tubes of 4 ml of Trypticase 14
Soy Broth (TSB) (BBL, Becton Dickinson, Franklin Lakes, NJ, USA) were inoculated for 10 h at 37 15
ºC and then 25 μl of this pre-culture was used again to inoculate 50 ml of TSB at 37 ºC for 14 h. This 16
period of time was sufficient to guarantee that all strains were at the beginning of the stationary growth 17
phase. The bacteria were then harvested by centrifugation for 5 min at 1000 g (Sorvall TC6, Dulont, 18
Newtown, PA, USA) and washed three times with PBS. Finally, the bacteria were re-suspended in 19
PBS at a concentration of 3×10⁸ bacteria/ml. Bacterial adhesion and bacterial retention experiments 20
were carried out at 37 ºC in a parallel plate flow chamber previously described [30]. Bacterial adhesion 21
was assessed under two different conditions. In the dynamic adhesion configuration, the specimen was 22
located at the top side of the flow channel, above the bacterial suspension flow. Evaluation of the 23
bacterial initial dynamic adhesion rate (jD), given as the number of bacteria adhered per square 24
centimeter and second, was done by continuous video recording of the specimen surface. Static 25
adhesion experiments were designed to allow bacterial deposition, avoiding any shear stress associated 26
to the bacterial suspension flow. To this purpose and after finishing the dynamic experiments, the flow 27
Materials Science and Engineering C 01/2011; 31(7):1567-1576
9
was stopped and the specimen was placed at the bottom side of the flow channel by carefully turning 1
upside down the parallel plate flow chamber. Then, bacteria were let to deposit on the sample surface 2
and analysed after 2, 3, 10, 15 and 20 min. Between each one of such adhesion periods, the chamber 3
was again carefully turned upside down to quantify the adhered bacteria. The flow was slowly opened 4
to discard non-adhered bacteria and to homogenize the bacterial concentration inside the flow channel 5
for the next static adhesion period. Previous experiments showed that adhered bacteria were not 6
detached during this process. Adhesion rate determined from this last experimental setting will be 7
referred as static adhesion rate (jS). The evaluation of the retention strength was carried out by 8
detachment experiments. Once a static adhesion experiment was finished, and with a final number of 9
bacteria nF on the specimen surface, two consecutives liquid–air interfaces were passed through the 10
parallel plate flow chamber channel, over the surface of the specimen, sweeping away some adhered 11
bacteria in its path. The number of remaining bacteria on the surface was denoted by nR. 12
2.10. Bacteria viability 13
Adhesion experiments were carried out with the help of a reusable silicone chamber 14
(Flexiperm, Greiner Bio-One GmbH, Frickenhausen, Germany) fixed to the specimen surface. Then 2 15
ml of the bacterial suspension was added to the chamber well and let in contact with the surface for 60 16
min. After that time, the silicone well was carefully removed, the samples were slightly washed in PBS 17
twice and adhered bacteria were stained using the commercial Live/Dead Baclight L-7012 kit 18
(Invitrogen, Barcelona, Spain). Live and dead bacteria were observed simultaneously using a 19
fluorescence microscope (Olympus, Tokyo, Japan) 20
2.11. Statistical analysis 21
The statistical analysis of the data was undertaken using a one-tail unpaired t-test and one-way 22
ANOVAs. All data reported are mean ± S.D. of at least three independent experiments. The 23
confidential range selected was 95%, which gives statistical differences when p-values<0.05. 24
3. Results 25
3.1. Microstructure 26
Materials Science and Engineering C 01/2011; 31(7):1567-1576

10
Microstructural examination of the non implanted specimens was performed by using 1
backscattering electron images obtained in fresh polished sections. By operating at low voltages it was 2
possible to obtain images where contrast results from differences in the average atomic number and in 3
the grain orientation. Fig. 1 shows a representative view, which reveals relative large equiaxial grains 4
with an average size of about 45 μm. Twins growing from the grain boundaries to the grain interior, 5
obviously developed during the thermomechanical processing of the alloy, were often observed. In 6
addition, inclusions of SMn forming rather continuous stringers were occasionally observed. They are 7
elongated parallel to the longitudinal bar direction (thus in the cross sectional views, which are the 8
investigated surfaces) and observed as isolated round particles with a diameter of up to about 2 μm. 9
3.2. Surface chemistry 10
XPS analysis was performed on the Si+ ion implanted and non implanted specimens. Due to the 11
elevated C content at the outermost surface (~50 at%), resulting from the environmental 12
contamination, a precise quantification of the chemical composition at the first level is meaningless. 13
Nevertheless, it is worth to highlight that the content of the major elements decreased in the order of 14
Fe, Si, and Cr. Ni content was found to be insignificant. Si content (oxidized and non oxidized) had a 15
maximum value of about 10 at%. Fig. 2 shows the chemical composition (at%) as a function of depth 16
for the implanted specimen. For the sake of clarity, only profiles for C, forming carbides, Si and O 17
were included. The silicon content followed a nearly Gaussian curve with the maximum (~ 20 at%) at 18
about 30 nm from the surface. It was also detected a carburization associated to the implantation. 19
Relevant for the present work is that thickness of the passive film, as deduced from the oxygen profile 20
(see inset of Fig. 2), was below 2 nm. This value was smaller than the thickness estimated for the non 21
implanted specimens (6 to 8 nm). 22
3.3. Micro/nano topography 23
Fig. 3a1 shows a representative deflection mode AFM image of the surface of non implanted 24
specimens, jointly with the topographical profiles along the marked lines (Fig.3a2). The main 25
topographical features corresponded to the presence of grooves, whose depths were in the range of 0-26
30 nm. Upon Si+ ion implantation, AFM revealed a nanostructured surface (Fig. 3b), with areas 27
Materials Science and Engineering C 01/2011; 31(7):1567-1576

11
showing completely disordered nano-topography (Figs. 3c1, 3c2), and others showing ordered-aligned 1
nano-stripes (Figs. 3d1, 3d2). Most of the furrows remnants from the polished stage were not longer 2
observed. This might indicate that sputtering associated with the implantation process was dependent 3
on the grain orientation, rendering a selective etching. As a matter of fact, optical examination of the 4
Si+ ion implanted surface (image not included) showed a microstructure similar to that obtained by 5
backscattered electron images (Fig. 1) based on crystallographic contrast. 6
The Ra and Rq values obtained from AFM images are summarized in Table 2. Ion implantation 7
slightly increased the amplitude surface roughness parameters, but the different surface domains 8
observed upon Si+ ion implantation displayed almost the same values of Ra and Rq, even though 9
images showed very different surface morphology. The Wenzel roughness factor (r) was practically 1 10
(Table 2), which ensured that surface roughness did not influence the contact angle measurements. 11
This agrees with previous r values published for stainless steel surfaces [31]. 12
3.4. Contact angle and surface Gibbs energy 13
Contact angles for the three liquids tested were slightly lower on the Si+ ion implanted than on 14
the non implanted specimens (Table 3), but both were moderately hydrophobic. From these contact 15
angles and using Eq. (1), surface Gibbs energy and its components and parameters were evaluated and 16
listed in Table 3. For both kinds of specimens surface interactions were mainly mediated by Lifshitz-17
van der Waals forces, but the surface Gibbs energy of the Si+ ion implanted specimen was slightly 18
higher than for the non implanted one. 19
3.5. Isoelectric point 20
Assignment of absolute values of zeta potential for extended conductive materials, determined 21
with the streaming potential technique is controversial. The commonly used clamping cell introduces 22
some uncertainties in the quantification of absolute ζ values [32], but isoelectric points are unique and 23
specific ζ values can be compared between samples measured in the same conditions. In our cases, the 24
ζ potential evaluated from Eq. (2) at the physiological pH (Table 3) indicates that there was not 25
significant variation in ζ after Si+ ion implantation, being both surfaces negatively charged in 26
physiological conditions, and with the IEP close to 4. 27
Materials Science and Engineering C 01/2011; 31(7):1567-1576

12
3.6. In vitro corrosion 1
Figs. 4a and 4 b show the impedance (Nyquist) plots for the non implanted and Si+ ion 2
implanted specimens, respectively, after immersion in the Ringer’s solution during 5 min and 1 day. 3
The real and imaginary parts of the impedance are plotted in the complex plane as a function of the 4
frequency used in the EIS tests. After 5 min of immersion, the impedance plots tended to describe a 5
semicircle for both specimens. With progressing immersion time, semicircles were also described but 6
with larger diameter. Intersections of the impedance curves with the real axes at low-frequency (LF) 7
provide information about an electrical resistance. Such a resistance could be associated to (i) the 8
intrinsic electrical properties of the passive film, Rpf [33,34], (ii) the charge transfer resistance at the 9
metal/electrolyte interface associated to the corrosion phenomena, Rct [35], or (iii) the sum of both 10
resistances, Rpf+Rct [36]. Table 4 shows the electrical resistance values obtained by applying the 11
routines of the ZView® software. In a first approximation a simple equivalent circuit, R(RQ), based 12
just in a time constant, was used to calculate these values [35]. Impedance values of the implanted 13
specimens for the shorter immersion times were rather low, approaching to the behavior of a non-14
passivated alloy. After 24 h, the impedance diagrams show that both types of specimens reached a 15
spontaneous passivation. 16
3.7. In vitro biocompatibility assays 17
The number of attached cells increased with time on both surfaces. Si+ ion implantation did not 18
significantly affect the number of attached cells at any tested time (Fig. 5). On the two considered 19
surfaces, actin filaments organized in stress fibers mostly oriented following the main cellular axis 20
(Figs. 6a and 6b). Microscopic examination of actin-stained cells indicated a similar level of spreading 21
on both tested surfaces. The mean areas of cells for non implanted and Si+ ion implanted specimens 22
were 4946 ± 2344 μm2 (Fig. 6c) and 4715 ± 2464 μm2 (Fig. 6d), respectively. The number of viable 23
cells (Fig. 7a) increased in a time-dependent manner on both substrates. There were not significant 24
differences in cell viability between non implanted and Si+ ion implanted specimens at any point time. 25
Compared to cell culture conditions that maintained hMSCs in an undifferentiated state, ALP activity 26
(Fig. 7b) and matrix mineralization (Fig. 7c) increased greatly when hMSCs were cultured in 27
Materials Science and Engineering C 01/2011; 31(7):1567-1576
13
osteogenic induction medium on both materials. Similar degrees of cell matrix maturation and 1
calcification were detected on cell layers cultured on Si+ ion implanted and non implanted specimens. 2
3.8. Bacterial adhesion and retention strength 3
Fig. 8 shows the adhesion rates on the implanted and non implanted specimens for the (a) 4
dynamic (jD) and the (b) static (jS) processes. The initial adhesion rates (jD) when the specimens were 5
located at the top of the flow channel, (Fig. 8a), were always lower (p < 0.05) than the adhesion rate 6
calculated when the specimen was placed at the bottom (jS) (Fig. 8b). Dynamic adhesion experiments, 7
in which the sample was on the top of the channel avoiding bacteria deposition, were expected to be 8
mainly dictated by the action of long range forces. No significant differences were found among the jD 9
values for any of the three strains tested on the non implanted surfaces. However when jD was 10
evaluated on the implanted specimens, it decreased for the S. aureus strain, slightly increased for S. 11
epidermidis4 and was no significantly modified for S. epidermidis2. Also, no differences were found 12
in the static adhesion rates among strains on the nonimplanted samples (Fig. 8b), but jS decreased on 13
the implanted specimens, irrespective the bacterial strain (Fig. 8b). Fig. 9 adds more information to the 14
static adhesion process. The lines plotted show the variation of the bacterial adhesion as a function of 15
the contact time between material surfaces and bacterial suspensions (2, 5, 10, 15, 20 min). The 16
number of adhered bacteria for S. aureus was always superior to that of S. epidermidis on both 17
surfaces. For the three tested bacterial strains, the numbers of attached microorganisms after 10 min of 18
static adhesion were always inferior on the implanted surfaces (p < 0.05). 19
Results of the retention experiments are summarized in Fig. 10, where the number of adhered 20
bacteria, nF, after the static adhesion experiments and the number of retained bacteria on the surface 21
after two consecutives liquid–air interfaces, nR, have been plotted together. On the non implanted 22
specimens, the passage of the air-liquid interfaces did not significantly decrease the number of bacteria 23
retained (only S. epidermidis2 suffered a small decrease), while on the Si+ ion implanted specimens 24
this process caused an important detachment of adhered microorganisms. In any case, the density of 25
remaining bacteria on the surface was superior for S. aureus, irrespective the surface condition, which 26
indicated a higher strength of the bacterial retention as compared to S. epidermidis [37,38]. Bacterial 27
Materials Science and Engineering C 01/2011; 31(7):1567-1576

14
viability tests after adhesion provided similar images for both specimens (data not shown), with all 1
bacteria stained in green color, because the integrity of their membranes was not affected by the 2
contact with the implanted surfaces. 3
4. Discussion 4
Material surface characteristics as chemical composition, topography, physico-chemical 5
properties, stiffness, and in the case of metallic materials, its corrosion behavior, have been described 6
as of prime interest to elucidate its initial interactions with cells and microorganisms [2,39]. 7
Ion implantation modifies the chemical composition in a narrow zone beneath the surface, in an 8
extension which is mainly dependent of doses, incidence angle of the beam and energy used for 9
implantation. In our material, XPS analysis indicated that the maximum concentration of Si was 10
located at 30 nm depth, becoming the outer oxide passive film enriched with less than 10 at% Si 11
(Fig.2). Probably due to this relatively low Si+ concentration within the first nanometers, the physico-12
chemical and electrical properties of the surface alloy were scarcely modified after implantation. On 13
this base, it would be expected that the bacterial initial adhesion rates on the ion implanted specimen 14
would follow the same trend than on the non implanted sample. However, the significant differences 15
found in jD between both samples indicates that Si+ ion implantation introduces heterogeneities in the 16
surface at a microscopic level reflected in Lifshitz-van der Waals forces, that each strain can sense in a 17
different way, but that are obscured in the macroscopic values of contact angle and streaming 18
potential. Also, the adhesion rates in static conditions, jS, and the retention strength were much lower 19
on implanted specimens than on the non implanted, the extension of such changes being strain-20
dependent. Since these kinds of experiments reflect the action of short range interactions, these results 21
support the suggestion that microscopic chemical or physical heterogeneities have to play a decisive 22
role in the bacterial adhesion to the implanted surface [40]. Zhao et al. [41] also found a lower 23
adhesion of two strains of S. aureus F1557 and S. epidermidis F1661 harvested in the mid-exponential 24
phase on a SiF3+ ion implanted austenitic stainless steel. Despite those authors employed the same 25
precursor as us for ion implantation, SiF4, in our case the implanted ion was exclusively Si+, as 26
Materials Science and Engineering C 01/2011; 31(7):1567-1576
15
demonstrated by XPS analysis. Known the bactericide effect of F, results of Zhao et al. [41] preclude 1
any conclusion about the role of Si+ ion implantation on bacterial adhesion. 2
As hypothesized in the introduction, Si enrichment was expected to enhance the bioactivity of 3
the steel. However, no significant differences in matrix maturation and calcification of cell layers 4
cultured on Si+ ion implanted specimens were recorded. Beneficial role of Si has been found in 5
materials containing a high level of Si such as bioglass (Na-Ca-P-Si glasses of variable composition) 6
[16], pseudowollastonites [17], or calcium phosphate ceramics [42]. It is well known that the Si-OH 7
groups are critical for the bioactivity of silicon oxide-based ceramics and silica gels [43]. Si is thought 8
to react with water resulting in the formation of hydrated silicon oxide with Si-OH groups at the 9
surface. The catalytic effect of the hydrated silica for apatite nucleation was demonstrated by the 10
observation that thermal treatment above 900ºC eliminates the Si-OH groups, loosing its ability of 11
forming apatite [44]. The dissolution products of bioglass [45], which contains high levels of aqueous 12
Si, and pseudowollastonites [17] enhance osteoblast activities. Moreover, supplementation of cultures 13
of human osteoblasts with aqueous Si levels as low as 1 ppm stimulates the production of proteins 14
involved in the mineralized matrix formation [42]. Therefore, the lack of capability of the implanted 15
surface to enhance matrix mineralization by hMSCs is likely related to the chemical structure of the 16
passive film, which causes a low concentration of aqueous Si, rather than to the relative low content of 17
Si+ itself. 18
As a consequence of the implantation process on the 316 LVM stainless steel, we have 19
identified the formation of carbides in the ion implanted affected zone, but other microstructural 20
features like formation of an outer amorphous zone [46] and formation of martensite resulting from the 21
internal stresses developed during the implantation [47] or ferrite [48] cannot be discarded. The net 22
effect of these microstructural changes was a decrease in the corrosion behavior at the earliest stages of 23
immersion. Some concern may exist about the decrease in the corrosion behavior of Si+ ion implanted 24
samples that certainly may be accompanied by an increase in the ion release. In spite of the decrease in 25
the corrosion resistance detected for the Si+ ion implanted specimens, the ability of hMSCs to maturate 26
into the osteoblastic lineage was completely preserved on these samples. Murine osteoblastic cells 27
Materials Science and Engineering C 01/2011; 31(7):1567-1576

16
MC3T3-E1 were found to take up significant amounts of Ni2+ after culturing on 316 LVM for only 4 1
days [49]. Uptake of Ni2+ did not affect cell proliferation, but was associated to interference on ALP 2
secretion upon BMP-2 stimulation. Consequently, osteoblastic maturation might be compromised on 3
316 LVM due to Ni2+ ion release. In our work, hMSCs were switched to osteoblastic phenotype by 4
culturing in osteogenic media lacking exogenously added BMP-2. We have observed that ALP 5
secretion and matrix calcification abilities of hMSCs cultured on 316 LVM for 12 days proceeded in a 6
similar fashion than on Ti6Al4V surfaces (data not shown), indicating that osteogenic maturation of 7
hMSCs may indeed proceed in the presence of Ni2+ amounts released from 316 LVM samples. Despite 8
Ni2+ at nanomolar concentrations is a nutrient for bacteria [50], high local concentration of ions could 9
act as bactericidal. However, viability tests did not show any effect on the survival of bacteria adhered 10
to implanted or non implanted surfaces. The worse corrosive behavior of the Si+ ion implanted steel 11
could be related with the lower bacterial adhesion shown in the static experiments and with the much 12
lower retention of bacteria on the implanted surface. 13
Consequence of the ion implantation process is also the geometrical modification of the surface 14
by the sputtering during ion bombardment. Discrepancies between the theoretical depth of the 15
maximum in the Si content (39 nm) and the values found by XPS (around 30 nm) could also give some 16
support. Topographical changes of the specimens induced by the erosion during implantation slightly 17
increased the surface roughness parameters Ra and Rq. This “physical” etching varied from grain to 18
grain with almost the same values of Ra and Rq, even though AFM images showed very different 19
surface morphology. This feature is related to the insensitivity of the above parameters to the lateral 20
distances between the topographical features, providing only a statistical measure of the deviations of 21
the height of points comprising an image from the average plane. As shown in Fig. 3, the nanometer-22
scale topographical features, either in aligned or disordered regions, appeared in average very far one 23
from another as compared to their heights. Therefore, this surface can be described as a vertically 24
nano-structured but horizontally micro (or sub-micro)-structured one. 25
A wide range of different cell types including epithelial cells, fibroblasts, osteoblasts and 26
mesenchymal stem cells ‘‘sense’’ changes in topographical features at the nanometric scale [51-54]. 27
Materials Science and Engineering C 01/2011; 31(7):1567-1576

17
Regarding osteoblast-lineage cells and their precursors, the smallest features these cell types may sense 1
are about 10–15 nm, and topographic changes of Ra smaller than 10 nm did not have any significant 2
impact on hMSCs behavior [55]. In fact, surface roughness of bone is approximately 32 nm [56]. In 3
concordance with the topographical changes observed upon Si+ ion implantation, the rates of adhesion 4
and subsequent proliferation of hMSCs on 316 LVM stainless steel did not result affected. It is worth 5
to note that hMSCs responses to the investigated surfaces were essentially identical to those observed 6
on Ti6Al4V having a similar polished surface topography (data not shown), an alloy characterized by 7
an excellent biocompatibility. 8
There is very scarce information about the influence of changes in the topography on bacterial 9
adhesion at levels far below these microorganisms sizes (~ 1 µm). A generally recognized idea is that 10
bacteria attach preferentially to surfaces having topographical irregularities with dimensions 11
comparable to their sizes, where they can be sheltered by external unfavorable conditions [57], but 12
little is known about the influence of nanometer-sized features. Interestingly, it has been reported a 13
decrease of S. epidermidis adhesion on “nanophase” compared to “microphase” TiO2 and ZnO [58]. 14
Nanostructured stainless steel has recently shown to have a potential to diminish P. aeruginosa biofilm 15
formation compared to conventional micrometer-sized-grain stainless steel [59]. To the authors 16
opinion, the appearance of nanoroughness on the Si+ ion implanted specimens should be considered as 17
influencing the lower bacterial retention and adhesion observed in the static experiments in relation 18
with the non implanted stainless steel. 19
An additional factor that has been recognized to influence bacterial adhesion is the mechanical 20
stiffness of substrate. Lichter et al. [39] have demonstrated that in the stiffness range comprised 21
between 1 MPa and 100 MPa, S. epidermidis colony density increased with increasing substrate 22
stiffness independently of the other surface conditions. Despite Si+ ion implantation decreased the 23
reduced Young’s modulus close to the surface from 217 GPa to about 150 GPa [60], the range of 24
stiffness in our samples was still three orders of magnitude higher than those studied by Lichter et al., 25
which prevents us to consider any effect relative to this material property. 26
Materials Science and Engineering C 01/2011; 31(7):1567-1576

18
In summary, the results of the current study demonstrate that Si+ ion implantation of stainless 1
steal 316 LVM does not compromise the biocompatibility of the pristine alloy, but renders the material 2
with a lower bacterial adhesion characterized by a lower number of attached cells in static 3
experiments, smaller adhesion rates and retention strength. The effect seems to be more relevant for 4
both strains of S. epidermidis tested, and differences in the number of adhered bacteria begin to be 5
significant after about 10 minutes of testing. Some of the fundamental mechanisms underlying the 6
improved response in vitro remain unknown, thus further investigations using different doses of ions, 7
which would yield different changes of surface properties, are in progress. 8
6. Acknowledgements 9
The authors wish to express their thanks for the financial support of Grants Nos. MAT2006-10
12948-C04-(01-02-03), MAT2009-14695-C04-(01-02-03) and CIT-420000-2008-17 from Ministerio 11
de Ciencia e Innovación (Spain Government), Grant No. S-0505/MAT/000324 from the Comunidad de 12
Madrid (Madrid Regional Government), grant PRI08A124 and GRU09124 from the Junta de 13
Extremadura (Extremadura Regional Government), and grants from Fundación Mutua Madrileña. LS 14
is supported by program Juan de la Cierva from the Ministerio de Ciencia e Innovación. NV is 15
supported by program I3SNS from Fondo de Investigaciones Sanitarias (Spain). MLGM is granted by 16
program I3 from Ministerio de Ciencia e Innovación and Junta de Extremadura. The CACTI service 17
(Vigo, Spain) is acknowledged for XPS analysis and the CAI (UCM, Madrid, Spain) for ion 18
implantation. 19
20
References 21
[1] A.G. Gristina, J.W. Costerton, J. Bone. Joint. Surg. Am. 67 (1985) 264. 22
[2] Y.H. An, R.B. Dickinson, R.J. Doyle, in: Y.H. An, R.J. Friedman (Ed.), Handbook of Bacterial 23
Adhesion. Principles, Methods and Applications. Totowa, 2000, p.1. 24
[3] W.M. Dunne, Clin. Microbiol. Rev. 15 (2002) 155. 25
[4] J. Palmer, S. Fling, J. Brooks, J. Ind. Microbiol. Biot. 34 (2007) 577. 26
[5] J.W. Costerton, P.S. Stewart, E.P. Greeberg, Science 284 (1999) 1318. 27
Materials Science and Engineering C 01/2011; 31(7):1567-1576
19
[6] M. Ignatova, S. Voccia, B. Gilbert, N. Markova, D. Cossement, R. Gouttebaron, R. Jerome, C. 1
Jerome, Langmuir 22 (2006) 255. 2
[7] J.K. Baveja, M.D.P. Wilcox, E.B.H. Hume, N. Kumar, R. Odell, L.A. Poole-Warren, Biomaterials 3
25 (2004) 2003. 4
[8] W. Chen, Y. Liu, H.S. Courtney, M. Bettenga, C.M. Agrawal, J.D. Bumgardner, J.L. Ong, 5
Biomaterials 27 (2006) 5512. 6
[9] Q. Zhao, Y. Liu, C. Wang, Appl. Surf. Sci. 252 (2005) 1620. 7
[10] M. Yoshinari, Y. Oda, T. Kato, K. Okuda, Biomaterials 22 (2001) 2043. 8
[11] I. Braceras, J.I. Alava, J.I. Oñatea, M. Brizuelaa, A. Garcia-Luisa, N. Garagorria, J.L. Vivientea, 9
M.A. de Maeztu, Surf. Coat. Technol. 158 (2002) 28. 10
[12] Q. Zhao, Y. Liu, C. Wang, S. Wang, N. Peng, C. Jeynes, Med. Eng. Phys. 30 (2008) 341. 11
[13] J. Jagielski, A. Piatkowska, P. Aubert, L. Thomé, A. Turos, A. Abdul Kader, Surf. Coat. Tech. 12
200 (2006) 6355. 13
[14] K. Hing, P.A. Revell, N. Smith, T. Buckland, Biomaterials 29 (2006) 5014. 14
[15] L. Hench, in: Society for Biomaterials 24th annual meeting, San Diego, 1998. p. 511. 15
[16] P.N. de Aza, F. Guitian, S. de Aza, Scripta. Metall. Mater. 31 (1994) 1001. 16
[17] C.M. Botelho, M.A. Lopes, I.R. Gibson, S.M. Best, J.D. Santos, J. Mater. Sci-Mater M. 13 (2002) 17
1123. 18
[18] G. Ciapetti, L. Ambrosio, G. Marletta, N. Baldini, A. Giunti, Biomaterials 27 (2006) 6150. 19
[19] K. Anselme, B. Noël, P. Hardouin, J. Mater. Sci-Mater M. 10 (1999) 815. 20
[20] K.F. Bombonato-Prado, L.S. Bellesini, C.M. Junta, M.M. Marques, G.A. Passos, A.L. Rosa, J. 21
Biomed. Mater. Res. A 88 (2009) 401. 22
[21] K. Bordji, J.Y. Jouzeau, D. Mainard, E. Payan, J.P. Delagoutte, P. Netter, Biomaterials 17 (1996) 23
491. 24
[22] R.D.K. Misra, W.W. Thein-Han, T.C. Pesacreta, K.H. Hasenstein, M.C. Somani, L.P. 25
Karjalainen, Adv. Mater. 21 (2009) 1280. 26
[23] D. Campoccia, L. Montanaro, C.R. Arciola, Biomaterials 27 (2006) 2331. 27
Materials Science and Engineering C 01/2011; 31(7):1567-1576

20
[24] H. Kamusewitz, W. Possart, Appl. Phys. A. 76 (2003) 899. 1
[25] P.J. Ramón-Torregrosa, M.A. Rodríguez-Valverde, A. Amirfazli, M.A. Cabrerizo-Vílchez, 2
Colloid. Surface. A. 323 (2008) 83. 3
[26] C.J. Van Oss, Interfacial forces in aqueous media, New York, 1994. 4
[27] B. Janczuk, M.L. Kerkeb, T. Bialopiotrowicz, F. González-Caballero, J. Colloid Interface Sci. 5
151 (1992) 333. 6
[28] D.J. Shaw, Introduction to colloid and surface chemistry, London, 1989. 7
[29] B.A. Boukamp, ‘Equivalent Circuit’ AC-Immittance Data Analysis System, Version 4.51, The 8
Netherlands, 1993. 9
[30] J. Sjollema, H.J. Busscher, A.H. Weerkamp, J. Microbiol. Methods. 9 (1989) 73. 10
[31] M. Raulio, M. Järn, J. Ahola, J. Peltonen, J.B. Rosenholm, S. Tervakangas, J. Kolehmainen, T. 11
Ruokolainen, P. Narko, M. Salkinoja-Salonen, J. Ind. Microbiol. Biotechnol. 35 (2008) 751. 12
[32] S. Roessler, R. Zimmermann, D. Scharnweber, C. Werner, H. Worch, Colloid. Surface. B. 26 13
(2002) 387. 14
[33] Z. Bou-Saleh, A. Shahryari, S. Omanovic, Thin Solid Films 515 (2007) 4727. 15
[34] C.M. Abreu, M.J. Cristóbal, R. Losada, X.R. Novoa, G. Pena, M.C. Pérez, J. Electroanal. Chem. 16
572 (2004) 335. 17
[35] D. Wallinder, J. Pan, C. Leygraf, A. Delblanc-Bauer, Corros. Sci. 41 (1999) 275. 18
[36] J. Flis, A. Gajek, J. Electroanal. Chem. 515 (2001) 82. 19
[37] C. Gómez-Suárez, H.J. Busscher, H.C. Van der Mei, Appl. Environ. Microbiol. 67 (2001) 2531. 20
[38] A.M. Gallardo-Moreno, M.L. González-Martín, J.M. Bruque, C. Pérez-Giraldo, Colloid. Surface. 21
A. 249 (2004) 99. 22
[39] J.A. Lichter, M.T. Thompson, M. Delgadillo, T. Nishikawa, M.F. Rubner, K.J. van Vliet, 23
Biomacromolecules 9 (2008) 1571. 24
[40] H.J. Busscher, W. Norde, H.C. van der Mei, Appl. Environ. Microbiol. 74 (2008) 2559. 25
[41] Q. Zhao, Y. Liu, C. Wang, S. Wang, N. Peng, C. Jeynes, Appl. Surf. Sci. 253 (2007) 8674. 26
[42] A.M. Pietak, J.W. Reid, M.J. Stott, M. Sayer, Biomaterials 28 (2007) 4023. 27
Materials Science and Engineering C 01/2011; 31(7):1567-1576

21
[43] T. Kokubo, H.M. Kim, M. Kawashita, Biomaterials 24 (2003) 2161. 1
[44] P. Li, C. Ohtsuki, T. Kokubo, K. Nakanishi, N. Soga, T. Nakamura, T. Yamamuro, J. Am. 2
Ceram. Soc. 75 (1992) 2094. 3
[45] I. Xynos, A. Edgar, D. Buttery, L. Hench, J. Polak, J. Biomed. Mater. Res. 55 (2001) 151. 4
[46] J. Baszkiewicz, J.A. Kozubowski, D. Krupa, M. Kaminski, A. Barcz, G. Gawlik, J. Jagielski, J. 5
Mater. Sci. 33 (1988) 4561. 6
[47] R. Leutenecker, G. Wagner, T. Louis, U. Gonser, L. Luzman, A. Molinari, Mater. Sci. Eng. A. 7
115 (1989) 229. 8
[48] J. Dudognon, M. Vayer, A. Pineau, R. Erre, Surf. Interface. Anal. 40 (2008) 772. 9
[49] M. Mölders, J. Felix, D. Bingmann, A. Hirner, M. Wiemann, J. Biomed. Mater. Res. A. 83 (2007) 10
303. 11
[50] D.H. Nies, Plasmid 27 (1992) 17. 12
[51] S. Tajima, J.S. Chu, S. Li, K. Komvopoulos, J. Biomed. Mater. Res. A. 84 (2008) 828. 13
[52] M.J. Dalby, N. Gadegaard, C.D. Wilkinson, J. Biomed. Mater. Res. A. 84 (2008) 973. 14
[53] T.P. Kunzler, C. Huwiler, T. Drobek, J. Vörös, N.D. Spencer, Biomaterials 28 (2007) 5000. 15
[54] M.J. Dalby, D. McCloy, M. Robertson, H. Agheli, D. Sutherland, S. Affrossman, R.O. Oreffo, 16
Biomaterials 27 (2006) 2980. 17
[55] L. Saldañaa, A. Méndez-Vilas, L. Jiang, M. Multignerd, J.L. González-Carrasco, M.T. Pérez-18
Prado, M.L. González-Martín, L. Munuera, N. Vilaboa Saldaña, Biomaterials 28 (2007) 4343. 19
[56] E. Palin, H. Liu, T.J. Webster, Nanotechnology 16 (2005) 1828. 20
[57] R. Schmidt, Adv. Eng. Mater. 3 (2001) 236. 21
[58] G. Colon, B.C. Ward, T.J. Webster, J. Biomed. Mater. Res. A. 78 (2006) 595. 22
[59] B. Yu, E.M. Davis, R.S. Hodges, R.T. Irvin, D.Y. Li, Nanotechnology 19 (2008) 335101. 23
[60] M. Multigner, E. Frutos, C. Serra, C. Laura, G. Rivero, J.L. González-Carrasco, “submitted for 24
publication”, 2010. 25
Materials Science and Engineering C 01/2011; 31(7):1567-1576
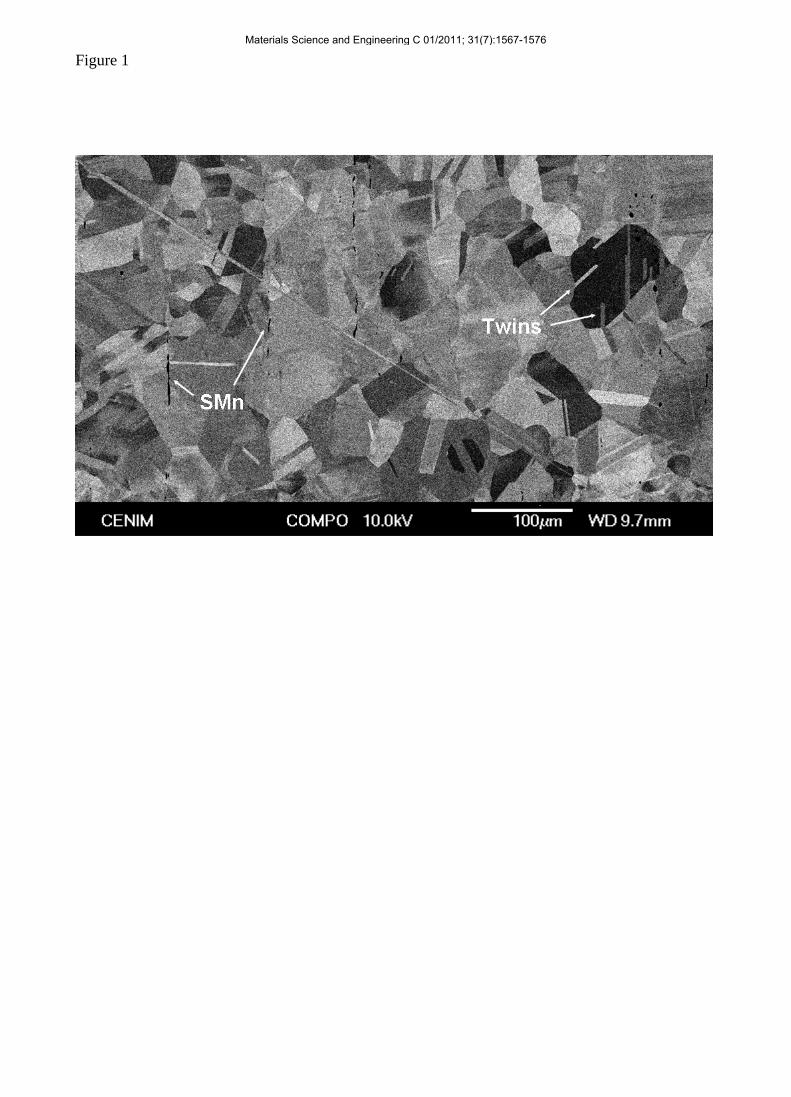
Figure 1
Figure(s)
Materials Science and Engineering C 01/2011; 31(7):1567-1576

Figure 2
0 20 40 60 80 1000
10
20
30
40
50
60
70
0 2 40
10
20
30
40
Si-Si C(Carbide)
% a
t.
Depth (nm)
Si+ implanted O Si oxSi-Si
Figure(s)
Materials Science and Engineering C 01/2011; 31(7):1567-1576

Figure(s)Click here to download high resolution image
Materials Science and Engineering C 01/2011; 31(7):1567-1576

0 1x10⁶ 2x10⁶ 3x1060
1x10⁶
2x10⁶
3x10⁶
(b)
Immersion time: 5 minutes
SI+ ION IMPLANTED SAMPLE
-j Z i
mag
/ Ω
·cm
2Zreal / Ω ·cm2
Immersion time: 1 day
0 1x10⁶ 2x10⁶ 3x1060
1x10⁶
2x10⁶
3x10⁶
(a)
Immersion time: 5 minutes
NON IMPLANTED SAMPLE
-j Z i
mag
/ Ω
·cm
2
Zreal / Ω ·cm2
Immersion time: 1 day
Figure(s)
Materials Science and Engineering C 01/2011; 31(7):1567-1576

Figure 5
Figure(s)
Materials Science and Engineering C 01/2011; 31(7):1567-1576
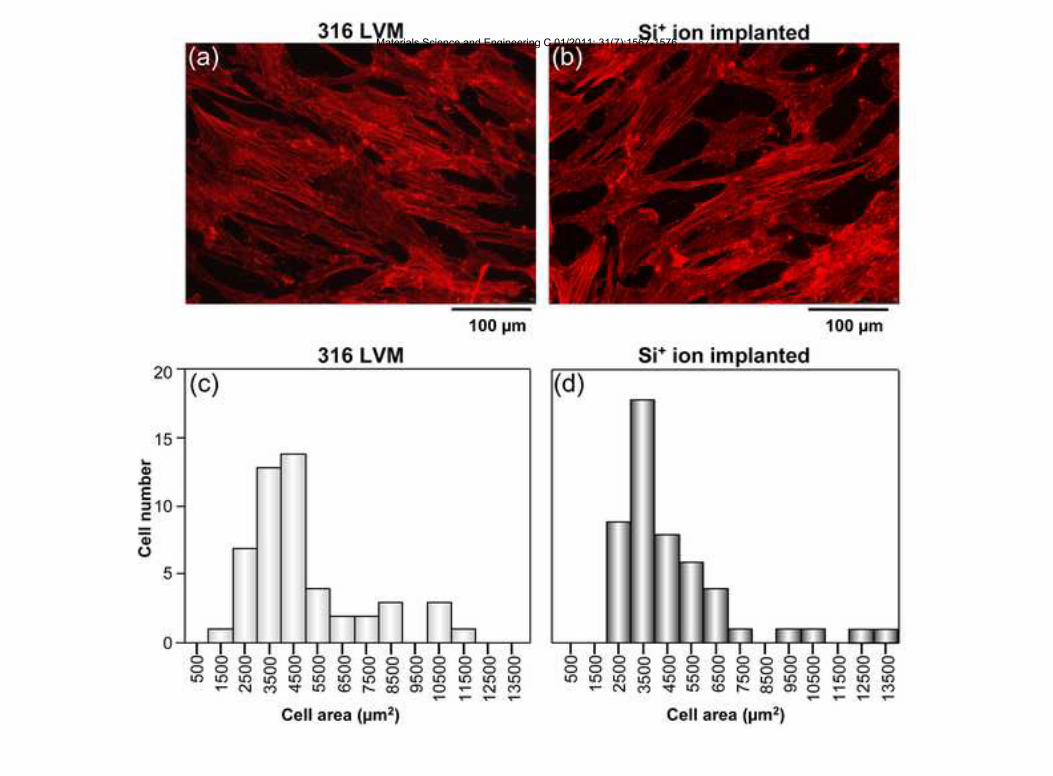
Figure(s)Click here to download high resolution image
Materials Science and Engineering C 01/2011; 31(7):1567-1576

Figure(s)Click here to download high resolution image
Materials Science and Engineering C 01/2011; 31(7):1567-1576

Figure 8
0
15
30
45
60
CONTROL(INOX) INOX+Si
J 0, N
º bac
teri
as(b
act/c
m2 s)
j D (
bact
eria
cm
-2 m
in-1
) x 1
0-3
316 LVM Si+ ion implanted
(a)
*****
0
15
30
45
60
j S (
bact
eria
cm
-2 m
in-1
) x 1
0-3
316 LVM Si+ ion implanted
(b) *****
***
Figure(s)
Materials Science and Engineering C 01/2011; 31(7):1567-1576

Figure 9
0
20
40
60
80
100
0 5 10 15 20 25Tiempo(min)
n (b
acte
ria
cm-2
) x 1
0-4
Time (min)
n ( b
acte
ria c
m-2
) x 1
0-4
Figure(s)
Materials Science and Engineering C 01/2011; 31(7):1567-1576

Figure 10
CONTROL(INOX) INOX+Si 316 LVM Si+ ion implanted
S. epidermidis4
***
******
316 LVM Si+ ion-implanted 0
20
40
60
80
100
120
CONTROL(INOX) INOX+Si
nº b
acte
rias
/cm
2 10-4
n F, n
R (
bact
eria
cm
-2 )
x 10
-4
***
***
S. aureus
316 LVM Si+ ion implanted CONTROL(INOX) INOX+Si
***
*****
S. epidermidis2
316 LVM Si+ ion implanted
**(c)(a) (b)
Figure(s)
Materials Science and Engineering C 01/2011; 31(7):1567-1576

Table 1
Chemical composition of the 316LVM stainless steel used in the investigation
Element Fe Cr Ni Mo Mn Si C Cu N S
%wt bal 17.48 14.13 2.87 1.62 0.53 0.024 0.067 0.061 0.001
Table(s)
Materials Science and Engineering C 01/2011; 31(7):1567-1576
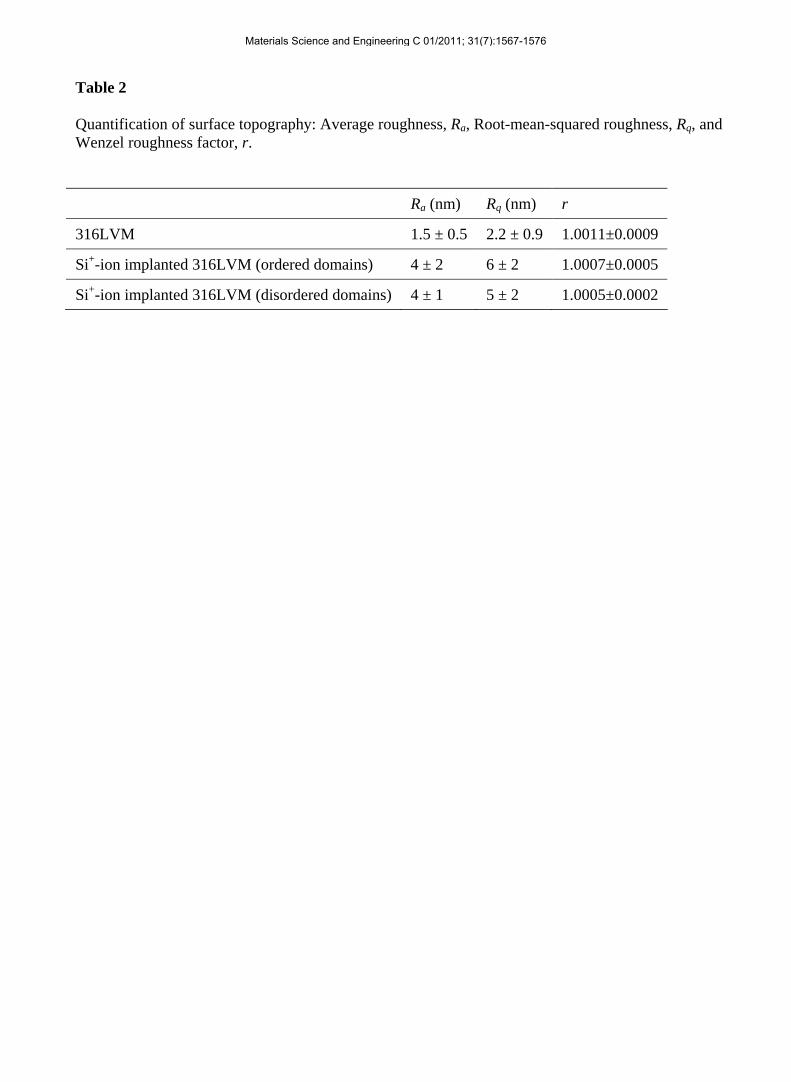
Table 2
Quantification of surface topography: Average roughness, Ra, Root-mean-squared roughness, Rq, and Wenzel roughness factor, r. Ra (nm) Rq (nm) r
316LVM 1.5 ± 0.5 2.2 ± 0.9 1.0011±0.0009
Si+-ion implanted 316LVM (ordered domains) 4 ± 2 6 ± 2 1.0007±0.0005
Si+-ion implanted 316LVM (disordered domains) 4 ± 1 5 ± 2 1.0005±0.0002
Table(s)
Materials Science and Engineering C 01/2011; 31(7):1567-1576

Table 3
Contact angles of water (θW), formamide (θF), and diiodomethane (θD), zeta potential (ζ) at physiological pH, isoelectric point (IEP) and Lifshitz–van der Waals (γLW), acid base (γAB) and total (γ) surface Gibbs energy and electron-donor (γ-) and electron-acceptor (γ+) parameters.
θW
(º)
θF
(º)
θD
(º)
ζ
(mV)
IEP
(pH units)
γLW
(mJ·m-2)
γ-
(mJ·m-2)
γ+
(mJ·m-2)
γAB
(mJ·m-2)
γ
(mJ·m-2)
316LVM 59±1 49±1 40±1 -26±5 4.0±0.2 32.7±0.5 23±2 0.6±0.1 8±1 40±2
Si+-ion implanted 316LVM
56±1 45±2 38±1 -29±5 4.2±0.2 33.4±0.5 25±2 0.9±0.3 9±2 43±2
Table(s)
Materials Science and Engineering C 01/2011; 31(7):1567-1576

Table 4 Electrical resistance values obtained by fitting the experimental impedance plots to a simple equivalent circuit, R(RQ), containing an unique time constant and, by applying routines of the ZView® software.
Resistance (ohms cm-2)
Immersion time in Ringer’s solution
316LVM Si+ ion implanted 316LVM
5 min 2.06 x 10⁶ 5.01 x 10⁵
1 day 1.07 x 10⁷ 1.55 x 10⁶
Table(s)
Materials Science and Engineering C 01/2011; 31(7):1567-1576
Copyright © 2022 FDOKUMEN


![Diffusion of 18 elements implanted into thermally grown SiO[sub 2]](https://static.fdokumen.com/doc/165x107/6335afedcd4bf2402c0b3112/diffusion-of-18-elements-implanted-into-thermally-grown-siosub-2.jpg)