E101-3161A - Bubbling Fluidized-Bed Boilers - Windsor Energy
Upload
universitimalayaCategory
view
0download
0
Ib
Aa
b
c
d
a
ARRAA
KMPFPZ
1
tgtmciosttpptblt&ga
0d
Computers and Chemical Engineering 36 (2012) 35– 47
Contents lists available at ScienceDirect
Computers and Chemical Engineering
jo u rn al hom epa ge : www.elsev ier .com/ locate /compchemeng
mproved single phase modeling of propylene polymerization in a fluidizeded reactor
hmad Shamiri a,b, Mohd Azlan Hussaina,∗, Farouq Sabri Mjalli c, Navid Mostoufid
Department of Chemical Engineering, University of Malaya, 50603 Kuala Lumpur, MalaysiaTraining Center, Razi Petrochemical Company, P.O. Box 161, Bandar Imam, IranPetroleum & Chemical Engineering Department, Sultan Qaboos University, Muscat 123, OmanProcess Design and Simulation Research Center, School of Chemical Engineering, College of Engineering, University of Tehran, P.O. Box 11155/4563, Tehran, Iran
r t i c l e i n f o
rticle history:eceived 27 July 2010eceived in revised form 13 July 2011ccepted 25 July 2011vailable online 9 August 2011
a b s t r a c t
An improved model for the production of polypropylene in a gas phase fluidized bed reactor was devel-oped. Comparative simulation studies were carried out using the well-mixed, constant bubble size andthe improved models. The improved model showed different prediction characteristics of polymer pro-duction rate as well as heat and mass transfer behavior as compared to other published models. All thethree models showed similar dynamic behavior at the startup conditions but the improved model pre-
eywords:athematical modeling
olymerizationluidized bed reactorolypropyleneiegler–Natta catalyst
dicted a narrower safe operation window. Furthermore, the safe ranges of variation of the main operatingparameters such as catalyst feed rate and superficial gas velocity calculated by the improved and wellmixed models are wider than that obtained by the constant bubble size model. The improved modelpredicts the monomer conversion per pass through the bed which varies from 0.28 to 5.57% within thepractical ranges of superficial gas velocity and catalyst feed rate.
© 2011 Elsevier Ltd. All rights reserved.
. Introduction
The various advantages of fluidized bed reactors (FBR) such asheir ability to carry out a variety of multiphase chemical reactions,ood mixing of particles, high rate of mass and heat transfer andheir ability to operate in continuous state have made it one of the
ost widely used reactors for polyolefin production. Consequently,onsiderable attention has been paid to model propylene polymer-zation in fluidized bed reactors. Fig. 1 illustrates the schematicf an industrial gas-phase fluidized bed polypropylene reactor. Ashown in this figure, small particles of Ziegler–Natta catalyst andriethyl aluminum co-catalyst are charged continuously to the reac-or and react with the reactants to produce a broad distribution ofolymer particles. The catalyst particles are porous and are com-osed of small sub-fragments containing titanium active metal. Ashe monomer diffuses through the porous catalyst, it polymerizesy reaction on the active sites of the catalyst surface. The cata-
yst fragments become dispersed during the polymerization andhe particles grow into the final polymer product (Zacca, Debling,
Ray, 1996). The feed gas, which consists of propylene, hydro-en and nitrogen, provides the fluidization through the distributor,cts as the heat transfer medium and supplies the reactants for
∗ Corresponding author. Fax: +60 379675319.E-mail address: mohd [email protected] (M.A. Hussain).
098-1354/$ – see front matter © 2011 Elsevier Ltd. All rights reserved.oi:10.1016/j.compchemeng.2011.07.015
the growing polymer particles. The fluidized particles disengagefrom the unreacted gases in the disengaging zone. The solid-freegas is combined with fresh feed after heat removal and recycledback to the gas distributor. The polypropylene product is continu-ously withdrawn from near the base of the reactor and above thegas distributor. The unreacted gas is recovered from the productwhich proceeds to the finishing section of the plant.
In heterogeneous systems, polymerization occurs in the pres-ence of different phases with inter-phase mass and heat transferand chemical reaction. Phenomena such as complex flow of gas andsolids, kinetics of heterogeneous polymerization and various heatand mass transfer mechanisms must be incorporated in a realisticmodeling approach. Several different methods for describing thehydrodynamics of the fluidized bed polyolefin reactor have beenproposed in the literature. McAuley, Talbot, and Harris (1994) andXie, McAuley, Hsu, and Bacon (1994)considered the fluidized bedpolyolefin reactor as a well mixed reactor. They compared the sim-ple two-phase and the well mixed models at steady state conditionsand showed that the well mixed model does not exhibit significanterror in the prediction of the temperature and monomer concentra-tion in the reactor as compared with the simple two-phase modelat steady state conditions. Choi and Ray (1985) presented a sim-
ple two-phase model in which the reactor consists of emulsionand bubble phases. They assumed that the polymerization reac-tion occurs only in the emulsion since the bubbles are solid-free.Fernandes and Lona (2001) proposed a heterogeneous three-phase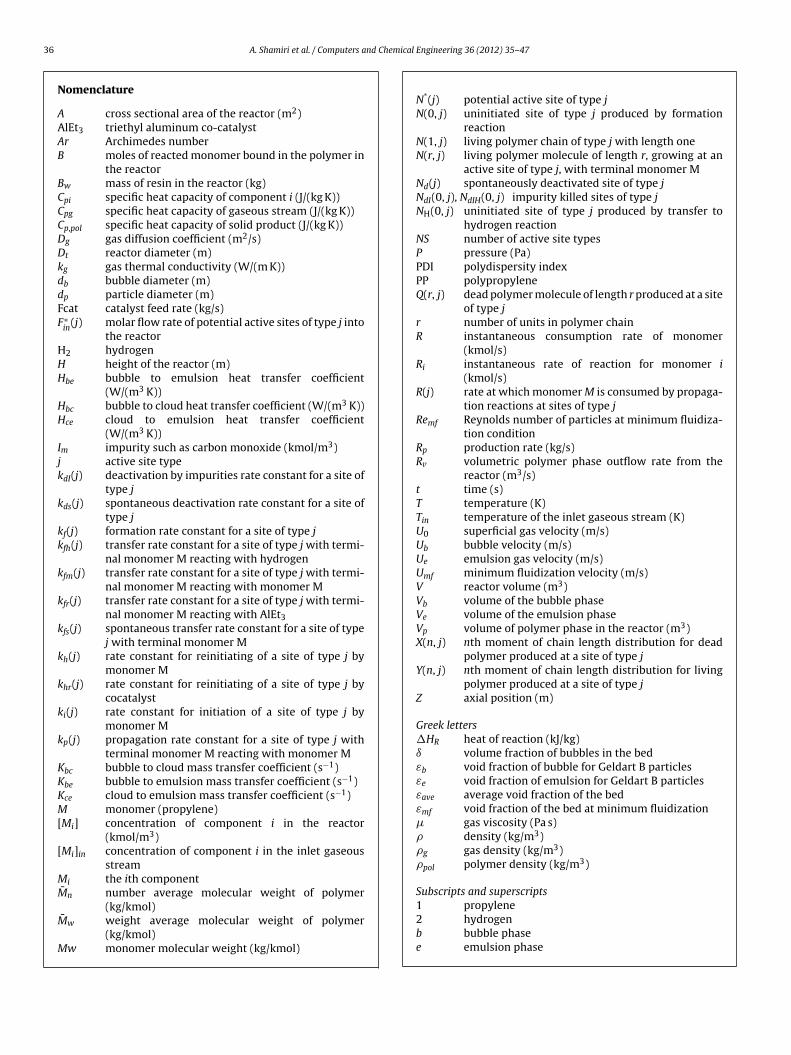
36 A. Shamiri et al. / Computers and Chemical Engineering 36 (2012) 35– 47
Nomenclature
A cross sectional area of the reactor (m2)AlEt3 triethyl aluminum co-catalystAr Archimedes numberB moles of reacted monomer bound in the polymer in
the reactorBw mass of resin in the reactor (kg)Cpi specific heat capacity of component i (J/(kg K))Cpg specific heat capacity of gaseous stream (J/(kg K))Cp,pol specific heat capacity of solid product (J/(kg K))Dg gas diffusion coefficient (m2/s)Dt reactor diameter (m)kg gas thermal conductivity (W/(m K))db bubble diameter (m)dp particle diameter (m)Fcat catalyst feed rate (kg/s)F∗
in(j) molar flow rate of potential active sites of type j into
the reactorH2 hydrogenH height of the reactor (m)Hbe bubble to emulsion heat transfer coefficient
(W/(m3 K))Hbc bubble to cloud heat transfer coefficient (W/(m3 K))Hce cloud to emulsion heat transfer coefficient
(W/(m3 K))Im impurity such as carbon monoxide (kmol/m3)j active site typekdI(j) deactivation by impurities rate constant for a site of
type jkds(j) spontaneous deactivation rate constant for a site of
type jkf(j) formation rate constant for a site of type jkfh(j) transfer rate constant for a site of type j with termi-
nal monomer M reacting with hydrogenkfm(j) transfer rate constant for a site of type j with termi-
nal monomer M reacting with monomer Mkfr(j) transfer rate constant for a site of type j with termi-
nal monomer M reacting with AlEt3kfs(j) spontaneous transfer rate constant for a site of type
j with terminal monomer Mkh(j) rate constant for reinitiating of a site of type j by
monomer Mkhr(j) rate constant for reinitiating of a site of type j by
cocatalystki(j) rate constant for initiation of a site of type j by
monomer Mkp(j) propagation rate constant for a site of type j with
terminal monomer M reacting with monomer MKbc bubble to cloud mass transfer coefficient (s−1)Kbe bubble to emulsion mass transfer coefficient (s−1)Kce cloud to emulsion mass transfer coefficient (s−1)M monomer (propylene)[Mi] concentration of component i in the reactor
(kmol/m3)[Mi]in concentration of component i in the inlet gaseous
streamMi the ith componentM̄n number average molecular weight of polymer
(kg/kmol)M̄w weight average molecular weight of polymer
(kg/kmol)Mw monomer molecular weight (kg/kmol)
N*(j) potential active site of type jN(0, j) uninitiated site of type j produced by formation
reactionN(1, j) living polymer chain of type j with length oneN(r, j) living polymer molecule of length r, growing at an
active site of type j, with terminal monomer MNd(j) spontaneously deactivated site of type jNdI(0, j), NdIH(0, j) impurity killed sites of type jNH(0, j) uninitiated site of type j produced by transfer to
hydrogen reactionNS number of active site typesP pressure (Pa)PDI polydispersity indexPP polypropyleneQ(r, j) dead polymer molecule of length r produced at a site
of type jr number of units in polymer chainR instantaneous consumption rate of monomer
(kmol/s)Ri instantaneous rate of reaction for monomer i
(kmol/s)R(j) rate at which monomer M is consumed by propaga-
tion reactions at sites of type jRemf Reynolds number of particles at minimum fluidiza-
tion conditionRp production rate (kg/s)Rv volumetric polymer phase outflow rate from the
reactor (m3/s)t time (s)T temperature (K)Tin temperature of the inlet gaseous stream (K)U0 superficial gas velocity (m/s)Ub bubble velocity (m/s)Ue emulsion gas velocity (m/s)Umf minimum fluidization velocity (m/s)V reactor volume (m3)Vb volume of the bubble phaseVe volume of the emulsion phaseVp volume of polymer phase in the reactor (m3)X(n, j) nth moment of chain length distribution for dead
polymer produced at a site of type jY(n, j) nth moment of chain length distribution for living
polymer produced at a site of type jZ axial position (m)
Greek letters�HR heat of reaction (kJ/kg)ı volume fraction of bubbles in the bedεb void fraction of bubble for Geldart B particlesεe void fraction of emulsion for Geldart B particlesεave average void fraction of the bedεmf void fraction of the bed at minimum fluidization� gas viscosity (Pa s)� density (kg/m3)�g gas density (kg/m3)�pol polymer density (kg/m3)
Subscripts and superscripts1 propylene2 hydrogenb bubble phasee emulsion phase

A. Shamiri et al. / Computers and Chemi
g gas mixture propertyi component type numberin inletj active site type numbermf minimum fluidizationpol polymer
mpKfsMarhtrppHbmTa
ewltZsdfitopi
monomers
ref reference condition
odel that considers bubble, emulsion and particulate phases withlug flow behavior. Hatzantonis, Yiannoulakis, Yiagopoulos, andiparissides (2000) considered the reactor being comprised of per-
ectly mixed emulsion phase and a bubble phase divided intoeveral solid-free well-mixed compartments in series. Alizadeh,ostoufi, Pourmahdian, and Sotudeh-Gharebagh (2004) proposed
tanks-in-series model to represent the hydrodynamics of theeactor. Harshe, Utikar, and Ranade (2004) developed a compre-ensive mathematical model based on the mixing cell frameworko simulate transient behavior in the fluidized bed polypropyleneeactors. This dynamic model was coupled with a steady stateopulation balance equation. Rigorous multi-monomer, multisiteolymerization kinetics was incorporated in the model. Ibrehem,ussain, and Ghasem (2008) proposed a fluidized bed comprising ofubble, cloud, emulsion and solid phases and considered the poly-erization reactions occurring in the emulsion and solid phases.
heir model also accounts for the effect of catalyst particles typend porosity on the rate of reaction.
In the present study, these previous works on the mod-ling of gas-phase olefin polymerization fluidized-bed reactorsere extended to account for the dynamic behavior of propy-
ene polymerization in fluidized bed reactors. To describehe homopolymerization of propylene over a heterogeneousiegler–Natta catalyst, a two-site homopolymerization kineticcheme was employed. Extensive simulations were carried out toetermine the influence of key process parameters (such as super-cial gas velocity, catalyst feed rate, feed composition and feedemperature) on the dynamic response of the reactor. In order to
btain a better understanding of the reactor performance, a com-arative study between the well-mixed, constant bubble size andmproved model was carried out.
Fig. 1. Schematic of an industrial fluid
cal Engineering 36 (2012) 35– 47 37
2. Polymerization mechanism
Similar methodology as of McAuley, MacGregor, and Hamilec(1990), Kissin (1985), and de Carvalho, Gloor, and Hamielec(1989) were employed and the following mechanism scheme wasdeveloped for the homopolymerization of propylene over theZiegler–Natta catalyst containing multiple active sites. Mass andheat transfer resistances and existence of multiple active sites aretwo factors responsible for exhibiting broad molecular weight dis-tribution using Ziegler–Natta catalyst. It has been shown that undermost polymerization conditions, the effect of multiple active sitetypes to produce polymers with broad molecular weight distribu-tion is more important than that of transport resistances (Khare,Luca, Seavey, & Liu, 2004; Soares & Hamielec, 1995). The single-site kinetic model is also not capable of describing the kineticbehavior, production rate and molecular weight distribution ofpropylene homopolymerization. Therefore, a two-type active siteis considered in the present study. Each site type is associatedwith different rate constants for formation, initiation, propagationand chain transfer. Elementary polymerization reactions on theZiegler–Natta multi-site catalyst used in the present study are sum-marized in Table 1 (Shamiri, Hussain, Farouq, & Mostoufi, 2010).
3. Kinetic model
A mathematical kinetic model based on the mechanismdescribed in the previous section was derived in the present study.This model consists of mass balances on the species presented inthe reactor which are represented by a series of algebraic and differ-ential equations as described in the next section. Characterizationof polymer properties was modeled using the population balanceand the method of moments. Application of population balance andthe method of moments allows for the prediction of the physio-chemical characteristics of the polymer such as molecular weight,polydispersity index (PDI), melt flow index (MFI), density, polymerproduction rate, monomer conversion and active site information.
3.1. Mass balance equations for active sites and reacted
ized bed polypropylene reactor.
The mass balance on the number of moles of potential activesites N*(j) in the reactor is given by:
38 A. Shamiri et al. / Computers and Chemi
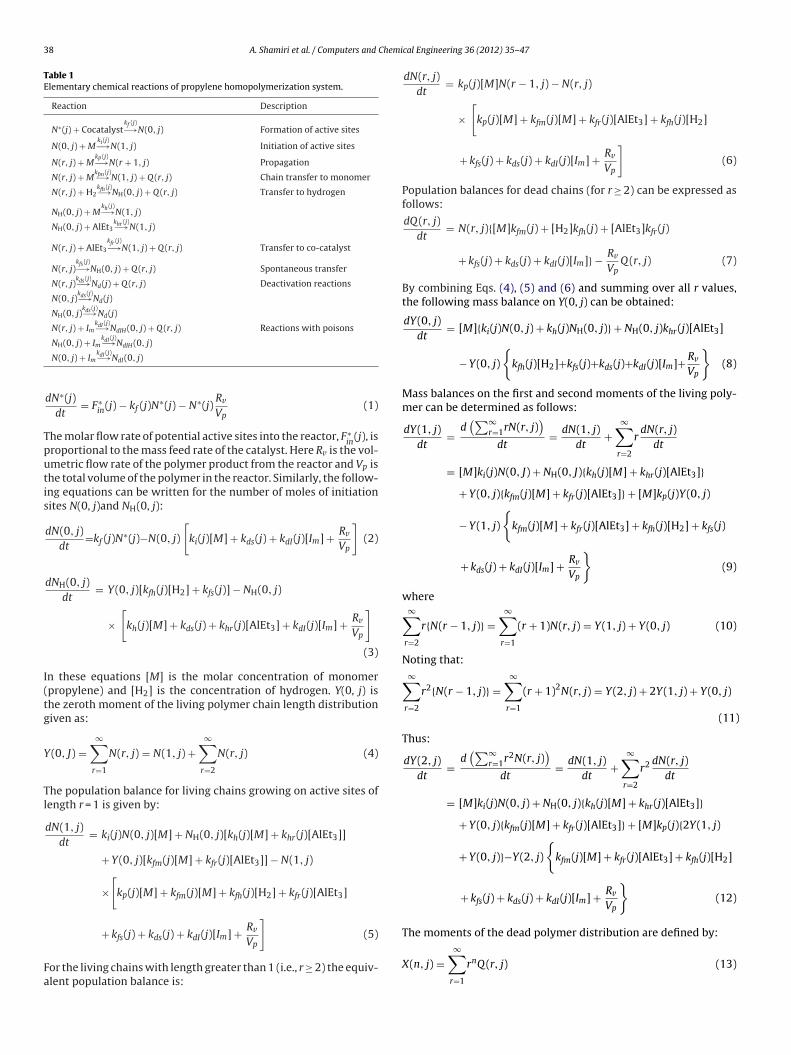
Table 1Elementary chemical reactions of propylene homopolymerization system.
Reaction Description
N∗(j) + Cocatalystkf (j)−→N(0, j) Formation of active sites
N(0, j) + Mki (j)−→N(1, j) Initiation of active sites
N(r, j) + Mkp(j)−→N(r + 1, j) Propagation
N(r, j) + Mkfm(j)−→ N(1, j) + Q (r, j) Chain transfer to monomer
N(r, j) + H2kfh(j)−→NH(0, j) + Q (r, j) Transfer to hydrogen
NH(0, j) + Mkh(j)−→N(1, j)
NH(0, j) + AlEt3khr (j)−→N(1, j)
N(r, j) + AlEt3
kfr (j)−→N(1, j) + Q (r, j) Transfer to co-catalyst
N(r, j)kfs(j)−→NH(0, j) + Q (r, j) Spontaneous transfer
N(r, j)kds(j)−→Nd(j) + Q (r, j) Deactivation reactions
N(0, j)kds(j)−→Nd(j)
NH(0, j)kds(j)−→Nd(j)
N(r, j) + ImkdI (j)−→NdIH(0, j) + Q (r, j) Reactions with poisons
kdI (j)
Tputis
I(tg
Y
Tl
Fa
NH(0, j) + Im−→NdIH(0, j)
N(0, j) + ImkdI (j)−→NdI(0, j)
dN∗(j)dt
= F∗in(j) − kf (j)N∗(j) − N∗(j)
Rv
Vp(1)
he molar flow rate of potential active sites into the reactor, F∗in
(j), isroportional to the mass feed rate of the catalyst. Here Rv is the vol-metric flow rate of the polymer product from the reactor and Vp ishe total volume of the polymer in the reactor. Similarly, the follow-ng equations can be written for the number of moles of initiationites N(0, j)and NH(0, j):
dN(0, j)dt
=kf (j)N∗(j)−N(0, j)
[ki(j)[M] + kds(j) + kdI(j)[Im] + Rv
Vp
](2)
dNH(0, j)dt
= Y(0, j)[kfh(j)[H2] + kfs(j)] − NH(0, j)
×[
kh(j)[M] + kds(j) + khr(j)[AlEt3] + kdI(j)[Im] + Rv
Vp
](3)
n these equations [M] is the molar concentration of monomerpropylene) and [H2] is the concentration of hydrogen. Y(0, j) ishe zeroth moment of the living polymer chain length distributioniven as:
(0, J) =∞∑
r=1
N(r, j) = N(1, j) +∞∑
r=2
N(r, j) (4)
he population balance for living chains growing on active sites ofength r = 1 is given by:
dN(1, j)dt
= ki(j)N(0, j)[M] + NH(0, j)[kh(j)[M] + khr(j)[AlEt3]]
+ Y(0, j)[kfm(j)[M] + kfr(j)[AlEt3]] − N(1, j)
×[
kp(j)[M] + kfm(j)[M] + kfh(j)[H2] + kfr(j)[AlEt3]
+ kfs(j) + kds(j) + kdI(j)[Im] + Rv
Vp
](5)
or the living chains with length greater than 1 (i.e., r ≥ 2) the equiv-lent population balance is:
cal Engineering 36 (2012) 35– 47
dN(r, j)dt
= kp(j)[M]N(r − 1, j) − N(r, j)
×[
kp(j)[M] + kfm(j)[M] + kfr(j)[AlEt3] + kfh(j)[H2]
+ kfs(j) + kds(j) + kdI(j)[Im] + Rv
Vp
](6)
Population balances for dead chains (for r ≥ 2) can be expressed asfollows:
dQ (r, j)dt
= N(r, j){[M]kfm(j) + [H2]kfh(j) + [AlEt3]kfr(j)
+ kfs(j) + kds(j) + kdI(j)[Im]} − Rv
VpQ (r, j) (7)
By combining Eqs. (4), (5) and (6) and summing over all r values,the following mass balance on Y(0, j) can be obtained:
dY(0, j)dt
= [M]{ki(j)N(0, j) + kh(j)NH(0, j)} + NH(0, j)khr(j)[AlEt3]
− Y(0, j)
{kfh(j)[H2]+kfs(j)+kds(j)+kdI(j)[Im]+ Rv
Vp
}(8)
Mass balances on the first and second moments of the living poly-mer can be determined as follows:
dY(1, j)dt
=d(∑∞
r=1rN(r, j))
dt= dN(1, j)
dt+
∞∑r=2
rdN(r, j)
dt
= [M]ki(j)N(0, J) + NH(0, J){kh(j)[M] + khr(j)[AlEt3]}+ Y(0, j){kfm(j)[M] + kfr(j)[AlEt3]} + [M]kp(j)Y(0, j)
− Y(1, j)
{kfm(j)[M] + kfr(j)[AlEt3] + kfh(j)[H2] + kfs(j)
+ kds(j) + kdI(j)[Im] + Rv
Vp
}(9)
where∞∑
r=2
r{N(r − 1, j)} =∞∑
r=1
(r + 1)N(r, j) = Y(1, j) + Y(0, j) (10)
Noting that:∞∑
r=2
r2{N(r − 1, j)} =∞∑
r=1
(r + 1)2N(r, j) = Y(2, j) + 2Y(1, j) + Y(0, j)
(11)
Thus:
dY(2, j)dt
=d(∑∞
r=1r2N(r, j))
dt= dN(1, j)
dt+
∞∑r=2
r2 dN(r, j)dt
= [M]ki(j)N(0, j) + NH(0, j){kh(j)[M] + khr(j)[AlEt3]}+ Y(0, j){kfm(j)[M] + kfr(j)[AlEt3]} + [M]kp(j){2Y(1, j)
+ Y(0, j)}−Y(2, j)
{kfm(j)[M] + kfr(j)[AlEt3] + kfh(j)[H2]
+ kfs(j) + kds(j) + kdI(j)[Im] + Rv
Vp
}(12)
The moments of the dead polymer distribution are defined by:
X(n, j) =∞∑
r=1
rnQ (r, j) (13)
Chemi
Sl
Faop
wpctt(
wh
3
b
M
TR
A. Shamiri et al. / Computers and
imilar equations can be derived for the nth moments of the chainength distributions for dead polymer:
dX(n, j)dt
= Y(n, j){kfm(j)[M] + kfr(j)[AlEt3] + kfh(j)[H2] + kfs(j)
+ kds(j) + kdI(j)[Im]} − X(n, j)Rv
Vp(14)
or determining the homo-polymer composition in the reactor atny time, mass balances for the reacted monomers were developedn the number of moles of each type of monomer bound in theolymer particles given by:
dB
dt= Ri − B
Rv
Vp(15)
here B is the number of moles of the monomer, which are incor-orated into the polymer in the reactor and Ri is the instantaneousonsumption rate of monomer to form polymer. Assuming thathe only significant consumption of monomers is by propagation,he following expression for the consumption rate of componentmonomer and hydrogen) can be obtained:
For monomer:
Ri =NS∑j=1
[Mi]Y(0, j)kp(j), i = 1 (16)
For hydrogen:
Ri =NS∑j=1
[Mi]Y(0, j)kfh(j), i = 2 (17)
The total polymer production rate can be calculated from:
Rp =2∑
i=1
MwiRi (18)
here Ri is the instantaneous rate of reaction for monomer andydrogen.
.2. Homopolymer properties
The number average and weight average molecular weights cane determined using the method of moments as follows:
¯ n = Mw
(∑NSj=1(X(1, j) + Y(1, j))∑NSj=1(X(0, j) + Y(0, j))
)(19)
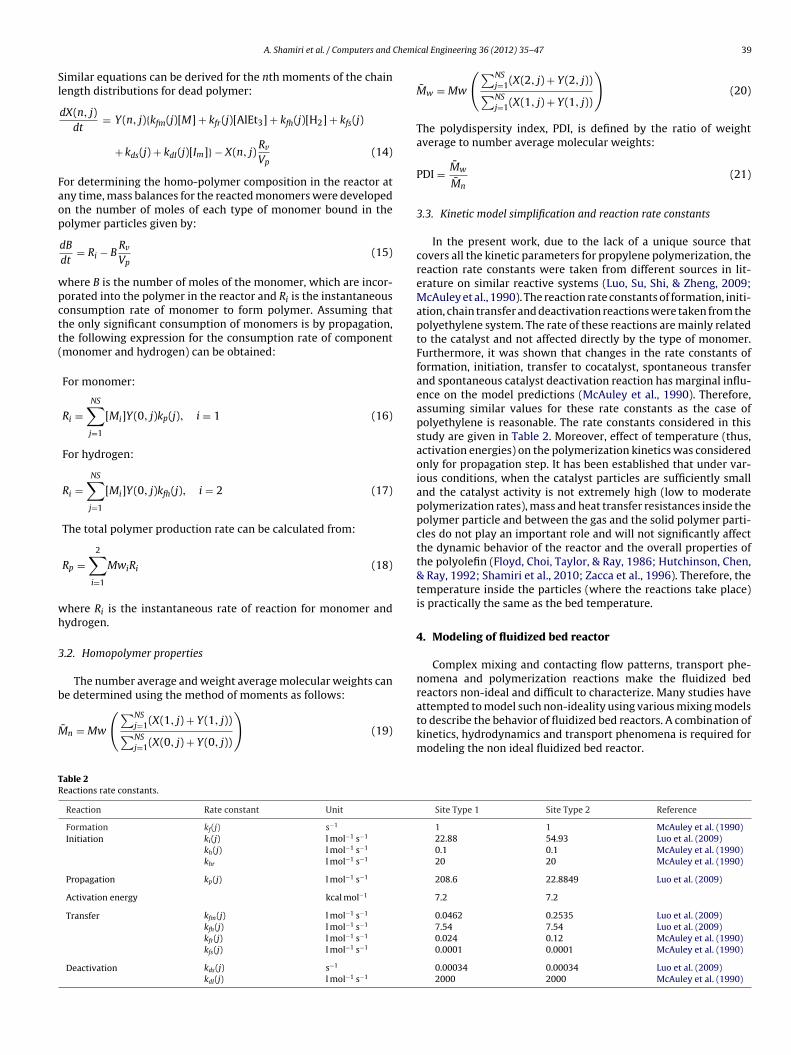
able 2eactions rate constants.
Reaction Rate constant Unit
Formation kf(j) s−1
Initiation ki(j) l mol−1 s−1
kh(j) l mol−1 s−1
khr l mol−1 s−1
Propagation kp(j) l mol−1 s−1
Activation energy kcal mol−1
Transfer kfm(j) l mol−1 s−1
kfh(j) l mol−1 s−1
kfr(j) l mol−1 s−1
kfs(j) l mol−1 s−1
Deactivation kds(j) s−1
kdI(j) l mol−1 s−1
cal Engineering 36 (2012) 35– 47 39
M̄w = Mw
(∑NSj=1(X(2, j) + Y(2, j))∑NSj=1(X(1, j) + Y(1, j))
)(20)
The polydispersity index, PDI, is defined by the ratio of weightaverage to number average molecular weights:
PDI = M̄w
M̄n(21)
3.3. Kinetic model simplification and reaction rate constants
In the present work, due to the lack of a unique source thatcovers all the kinetic parameters for propylene polymerization, thereaction rate constants were taken from different sources in lit-erature on similar reactive systems (Luo, Su, Shi, & Zheng, 2009;McAuley et al., 1990). The reaction rate constants of formation, initi-ation, chain transfer and deactivation reactions were taken from thepolyethylene system. The rate of these reactions are mainly relatedto the catalyst and not affected directly by the type of monomer.Furthermore, it was shown that changes in the rate constants offormation, initiation, transfer to cocatalyst, spontaneous transferand spontaneous catalyst deactivation reaction has marginal influ-ence on the model predictions (McAuley et al., 1990). Therefore,assuming similar values for these rate constants as the case ofpolyethylene is reasonable. The rate constants considered in thisstudy are given in Table 2. Moreover, effect of temperature (thus,activation energies) on the polymerization kinetics was consideredonly for propagation step. It has been established that under var-ious conditions, when the catalyst particles are sufficiently smalland the catalyst activity is not extremely high (low to moderatepolymerization rates), mass and heat transfer resistances inside thepolymer particle and between the gas and the solid polymer parti-cles do not play an important role and will not significantly affectthe dynamic behavior of the reactor and the overall properties ofthe polyolefin (Floyd, Choi, Taylor, & Ray, 1986; Hutchinson, Chen,& Ray, 1992; Shamiri et al., 2010; Zacca et al., 1996). Therefore, thetemperature inside the particles (where the reactions take place)is practically the same as the bed temperature.
4. Modeling of fluidized bed reactor
Complex mixing and contacting flow patterns, transport phe-nomena and polymerization reactions make the fluidized bedreactors non-ideal and difficult to characterize. Many studies have
attempted to model such non-ideality using various mixing modelsto describe the behavior of fluidized bed reactors. A combination ofkinetics, hydrodynamics and transport phenomena is required formodeling the non ideal fluidized bed reactor.Site Type 1 Site Type 2 Reference
1 1 McAuley et al. (1990)22.88 54.93 Luo et al. (2009)0.1 0.1 McAuley et al. (1990)20 20 McAuley et al. (1990)
208.6 22.8849 Luo et al. (2009)
7.2 7.2
0.0462 0.2535 Luo et al. (2009)7.54 7.54 Luo et al. (2009)0.024 0.12 McAuley et al. (1990)0.0001 0.0001 McAuley et al. (1990)
0.00034 0.00034 Luo et al. (2009)2000 2000 McAuley et al. (1990)

4 Chemi
p(efcmtflstM
etbct
4
bbap
m
•
•••
Dtai
(
T
Tto
[
0 A. Shamiri et al. / Computers and
The simple two-phase flow structure for the gas-phase olefinolymerization model has been previously used by Choi and Ray1985), McAuley et al. (1994), Hatzantonis et al. (2000) and Harshet al. (2004). In this model, it is assumed that the bubbles are solid-ree bubbles while the emulsion remains at minimum fluidizationonditions. McAuley et al. (1990, 1994) proposed a simplified well-ixed model by assuming the entire contents of the fluidized bed
reated as well mixed and the emulsion phase remains at minimumuidization condition. However, in reality, the voidage of the emul-ion phase may differ far from that at the minimum fluidization andhe bubbles may contain different portions of solid particles (Cui,
ostoufi, & Chaouki, 2000; Cui, Mostoufi, & Chaouki, 2001).In the modified model developed in this work, a unified mod-
ling approach is adopted for the gas-solid fluidization, in whichhe well mixed model (CSTR) is developed to describe the dynamicehavior of the polypropylene gas phase fluidized bed reactor. Foromparison purpose we described these conventional models inhe next section before describing our proposed model.
.1. Well-mixed model
A simplified well-mixed model is obtained by assuming thatubbles are very small or unrestricted mass and heat transferetween the bubble and emulsion phases and the temperaturend composition are uniform in the gas phase throughout the bedroposed by McAuley et al. (1990, 1994).
The following assumptions were made for the well mixedodel:
Mass and heat transfer rates between emulsion and bubble phaseare very high or bubbles are sufficiently small; therefore the poly-merization reactor is considered to be a single phase (emulsionphase) well mixed reactor (Alizadeh et al., 2004; McAuley et al.,1994).The emulsion phase remains at minimum fluidization.Uniform temperature and composition throughout the bed.Mass and heat transfer resistances between the gas and the solidpolymer particles in the emulsion phase are negligible (i.e., smallcatalyst particles, low to moderate catalyst activity or polymer-ization rates) (Floyd et al., 1986).
ynamic material and energy balance equations can be written forhe monomer and hydrogen based on the previously mentionedssumptions (Hatzantonis et al., 2000). The dynamic molar balances written as:
Vεmf )d[Mi]
dt= U0A([Mi]in − [Mi]) − Rvεmf [Mi] − (1 − εmf )Ri (22)
he dynamic energy balance is given by:[m∑
i=1
[Mi]CpiVεmf + V(1 − εmf )�polCp,pol
]dT
dt
= U0A
m∑i=1
[Mi]Cpi(Tin − Tref ) − U0A
m∑i=1
[Mi]Cpi(T − Tref ) − Rv
×[
m∑i=1
[Mi]Cpiεmf + (1 − εmf )�polCp,pol
](T − Tref )
+ (1 − εmf )�HRRp (23)
he internal energy of the monomer is considered to be negligible in
he energy balance equation. The initial conditions for the solutionf model equations are as follows:Mi]t=0 = [Mi]in (24)
cal Engineering 36 (2012) 35– 47
T(t = 0) = Tin (25)
The well mixed model is an oversimplification of what actually hap-pens in the fluidized bed since it considers the emulsion stays atminimum fluidization conditions at all operating conditions andit takes the voidage over the whole bed at minimum fluidizationconditions (εbed = εmf). Consequently, this model is incapable ofpredicting the transfer and reaction rates in the practical processproperly.
4.2. Constant bubble size model
The two phase constant bubble size model assumes that theemulsion (or dense phase) is at minimum fluidization conditions(Choi & Ray, 1985). This model has been adopted by many previousstudies for the gas-phase olefin polymerization (Choi & Ray, 1985;Harshe et al., 2004; Hatzantonis et al., 2000; McAuley et al., 1994;Shamiri, Hussain, Mjalli, Mostoufi, & Shafeeyan, 2011).
The assumptions made for the constant bubble size model areas follows:
• The fluidized bed comprises of two phases, bubble and emulsion.Reactions occur only in the emulsion phase.
• The emulsion phase is considered to be perfectly mixed, at min-imum fluidization, interchanging heat and mass with the bubblephase at uniform rates over the bed height.
• The bubbles are spherical with uniform size and in plug flow atconstant velocity.
• Mass and heat transfer resistances between the gas and the solidpolymer particles in the emulsion phase are negligible (i.e., smallcatalyst particles, low to moderate catalyst activity or polymer-ization rates) (Floyd et al., 1986).
Using these assumptions, steady-state mass and energy balancescan be derived to describe the variation of the monomer concen-tration and temperature in the bubble phase (Hatzantonis et al.,2000). The mole balance for monomer and hydrogen can be writtenas follows:
d[Mi]b
dz= Kbe([Mi]e − [Mi]b)
Ub(26)
By integrating the local monomer concentration [Mi]b with respectto the bed height, one can calculate the mean concentration of theith monomer in the bubble phase:
[M̄i]b = 1H
∫ H
0
[Mi]b dh = [Mi]e + ([Mi]e,(in)
− [Mi]e)Ub
KbeH
(1 − exp
(−KbeH
Ub
))(27)
The bubble phase energy balance is expressed by the followingequation:
m∑i=1
[Mi]bCpidTb
dz= Hbe
Ub(Tb − Te) (28)
The mean temperature in the bubble phase can be calculated byintegrating Eq. (48) over the total bed height:
T̄b= 1H
∫ H
0
Tb dh=Te+(Tin−Te)UbC̄p
HbeH
(1 − exp
(−HbeH
UbC̄p
))(29)
where
C̄p =Nm∑i=1
[M̄i]bCpMi (30)
is the average heat capacity of the reacting monomers.
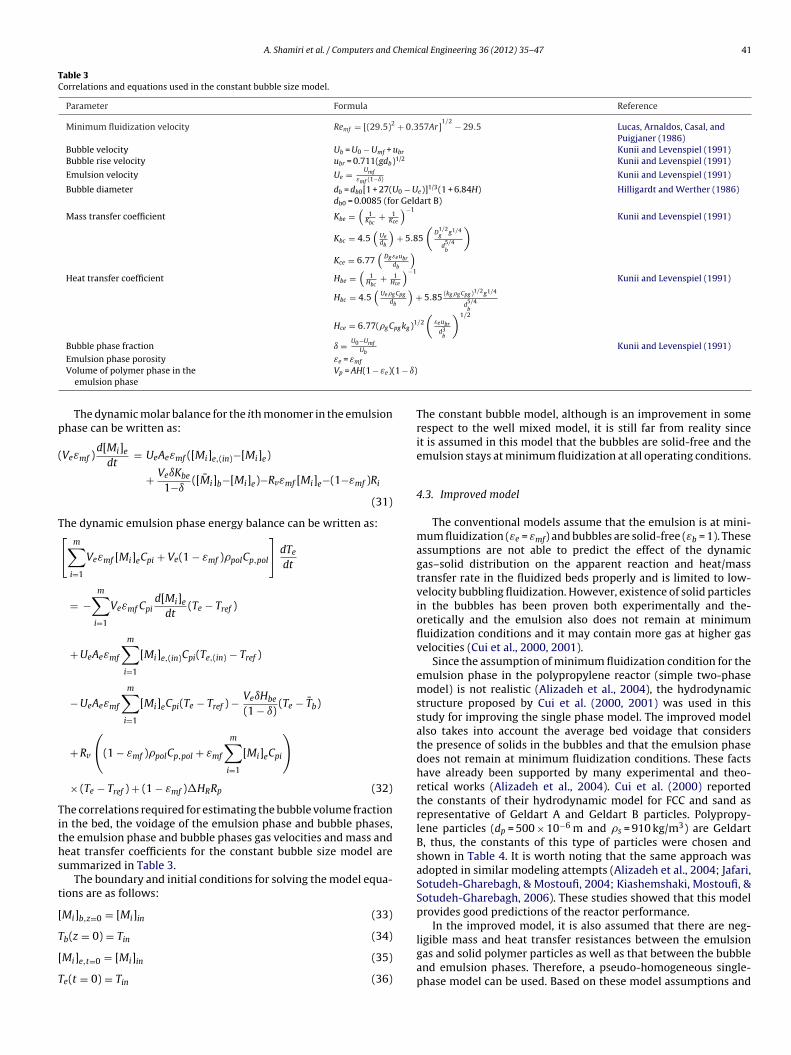
A. Shamiri et al. / Computers and Chemical Engineering 36 (2012) 35– 47 41
Table 3Correlations and equations used in the constant bubble size model.
Parameter Formula Reference
Minimum fluidization velocity Remf = [(29.5)2 + 0.357Ar]1/2 − 29.5 Lucas, Arnaldos, Casal, and
Puigjaner (1986)Bubble velocity Ub = U0 − Umf + ubr Kunii and Levenspiel (1991)Bubble rise velocity ubr = 0.711(gdb)1/2 Kunii and Levenspiel (1991)
Emulsion velocity Ue = Umf
εmf (1−ı) Kunii and Levenspiel (1991)
Bubble diameter db = db0[1 + 27(U0 − Ue)]1/3(1 + 6.84H)db0 = 0.0085 (for Geldart B)
Hilligardt and Werther (1986)
Mass transfer coefficient Kbe =(
1Kbc
+ 1Kce
)−1
Kbc = 4.5(
Uedb
)+ 5.85
(D
1/2g g1/4
d5/4b
)Kce = 6.77
(Dg εeubr
db
)Kunii and Levenspiel (1991)
Heat transfer coefficient Hbe =(
1Hbc
+ 1Hce
)−1
Hbc = 4.5(
Ue�g Cpgdb
)+ 5.85 (kg �g Cpg )1/2g1/4
d5/4b
Hce = 6.77(�gCpgkg )1/2(
εeubr
d3b
)1/2
Kunii and Levenspiel (1991)
Bubble phase fraction ı = U0−UmfUb
Kunii and Levenspiel (1991)
1 − ı)
p
(
T
Tiths
t
[
T
[
T
Emulsion phase porosity εe = εmf
Volume of polymer phase in theemulsion phase
Vp = AH(1 − εe)(
The dynamic molar balance for the ith monomer in the emulsionhase can be written as:
Veεmf )d[Mi]e
dt= UeAeεmf ([Mi]e,(in)−[Mi]e)
+ VeıKbe
1−ı([M̄i]b−[Mi]e)−Rvεmf [Mi]e−(1−εmf )Ri
(31)
he dynamic emulsion phase energy balance can be written as:[m∑
i=1
Veεmf [Mi]eCpi + Ve(1 − εmf )�polCp,pol
]dTe
dt
= −m∑
i=1
Veεmf Cpid[Mi]e
dt(Te − Tref )
+ UeAeεmf
m∑i=1
[Mi]e,(in)Cpi(Te,(in) − Tref )
− UeAeεmf
m∑i=1
[Mi]eCpi(Te − Tref ) − VeıHbe
(1 − ı)(Te − T̄b)
+ Rv
((1 − εmf )�polCp,pol + εmf
m∑i=1
[Mi]eCpi
)
× (Te − Tref ) + (1 − εmf )�HRRp (32)
he correlations required for estimating the bubble volume fractionn the bed, the voidage of the emulsion phase and bubble phases,he emulsion phase and bubble phases gas velocities and mass andeat transfer coefficients for the constant bubble size model areummarized in Table 3.
The boundary and initial conditions for solving the model equa-ions are as follows:
Mi]b,z=0 = [Mi]in (33)
b(z = 0) = Tin (34)
Mi]e,t=0 = [Mi]in (35)
e(t = 0) = Tin (36)
The constant bubble model, although is an improvement in somerespect to the well mixed model, it is still far from reality sinceit is assumed in this model that the bubbles are solid-free and theemulsion stays at minimum fluidization at all operating conditions.
4.3. Improved model
The conventional models assume that the emulsion is at mini-mum fluidization (εe = εmf) and bubbles are solid-free (εb = 1). Theseassumptions are not able to predict the effect of the dynamicgas–solid distribution on the apparent reaction and heat/masstransfer rate in the fluidized beds properly and is limited to low-velocity bubbling fluidization. However, existence of solid particlesin the bubbles has been proven both experimentally and the-oretically and the emulsion also does not remain at minimumfluidization conditions and it may contain more gas at higher gasvelocities (Cui et al., 2000, 2001).
Since the assumption of minimum fluidization condition for theemulsion phase in the polypropylene reactor (simple two-phasemodel) is not realistic (Alizadeh et al., 2004), the hydrodynamicstructure proposed by Cui et al. (2000, 2001) was used in thisstudy for improving the single phase model. The improved modelalso takes into account the average bed voidage that considersthe presence of solids in the bubbles and that the emulsion phasedoes not remain at minimum fluidization conditions. These factshave already been supported by many experimental and theo-retical works (Alizadeh et al., 2004). Cui et al. (2000) reportedthe constants of their hydrodynamic model for FCC and sand asrepresentative of Geldart A and Geldart B particles. Polypropy-lene particles (dp = 500 × 10−6 m and �s = 910 kg/m3) are GeldartB, thus, the constants of this type of particles were chosen andshown in Table 4. It is worth noting that the same approach wasadopted in similar modeling attempts (Alizadeh et al., 2004; Jafari,Sotudeh-Gharebagh, & Mostoufi, 2004; Kiashemshaki, Mostoufi, &Sotudeh-Gharebagh, 2006). These studies showed that this modelprovides good predictions of the reactor performance.
In the improved model, it is also assumed that there are neg-
ligible mass and heat transfer resistances between the emulsiongas and solid polymer particles as well as that between the bubbleand emulsion phases. Therefore, a pseudo-homogeneous single-phase model can be used. Based on these model assumptions and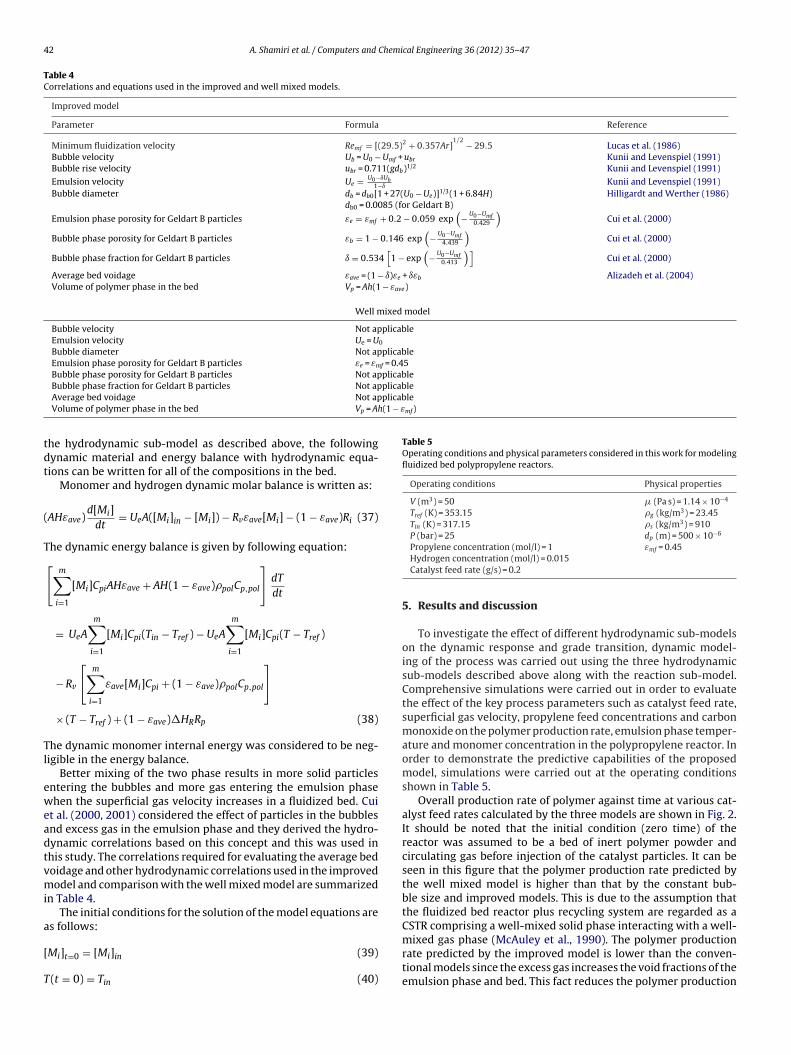
42 A. Shamiri et al. / Computers and Chemical Engineering 36 (2012) 35– 47
Table 4Correlations and equations used in the improved and well mixed models.
Improved model
Parameter Formula Reference
Minimum fluidization velocity Remf = [(29.5)2 + 0.357Ar]1/2 − 29.5 Lucas et al. (1986)
Bubble velocity Ub = U0 − Umf + ubr Kunii and Levenspiel (1991)Bubble rise velocity ubr = 0.711(gdb)1/2 Kunii and Levenspiel (1991)
Emulsion velocity Ue = U0−ıUb1−ı
Kunii and Levenspiel (1991)Bubble diameter db = db0[1 + 27(U0 − Ue)]1/3(1 + 6.84H)
db0 = 0.0085 (for Geldart B)Hilligardt and Werther (1986)
Emulsion phase porosity for Geldart B particles εe = εmf + 0.2 − 0.059 exp(
− U0−Umf0.429
)Cui et al. (2000)
Bubble phase porosity for Geldart B particles εb = 1 − 0.146 exp(
− U0−Umf4.439
)Cui et al. (2000)
Bubble phase fraction for Geldart B particles ı = 0.534[
1 − exp(
− U0−Umf0.413
)]Cui et al. (2000)
Average bed voidage εave = (1 − ı)εe + ıεb Alizadeh et al. (2004)Volume of polymer phase in the bed Vp = Ah(1 − εave)
Well mixed model
Bubble velocity Not applicableEmulsion velocity Ue = U0
Bubble diameter Not applicableEmulsion phase porosity for Geldart B particles εe = εmf = 0.45Bubble phase porosity for Geldart B particles Not applicable
plicableplicable(1 − εmf)
tdt
(
T
Tl
eweadtvmi
a
[
T
Table 5Operating conditions and physical parameters considered in this work for modelingfluidized bed polypropylene reactors.
Operating conditions Physical properties
V (m3) = 50 � (Pa s) = 1.14 × 10⁻⁴
Tref (K) = 353.15 �g (kg/m3) = 23.45Tin (K) = 317.15 �s (kg/m3) = 910P (bar) = 25 dp (m) = 500 × 10−6
Bubble phase fraction for Geldart B particles Not apAverage bed voidage Not apVolume of polymer phase in the bed Vp = Ah
he hydrodynamic sub-model as described above, the followingynamic material and energy balance with hydrodynamic equa-ions can be written for all of the compositions in the bed.
Monomer and hydrogen dynamic molar balance is written as:
AHεave)d[Mi]
dt= UeA([Mi]in − [Mi]) − Rvεave[Mi] − (1 − εave)Ri (37)
he dynamic energy balance is given by following equation:[m∑
i=1
[Mi]CpiAHεave + AH(1 − εave)�polCp,pol
]dT
dt
= UeA
m∑i=1
[Mi]Cpi(Tin − Tref ) − UeA
m∑i=1
[Mi]Cpi(T − Tref )
− Rv
[m∑
i=1
εave[Mi]Cpi + (1 − εave)�polCp,pol
]
× (T − Tref ) + (1 − εave)�HRRp (38)
he dynamic monomer internal energy was considered to be neg-igible in the energy balance.
Better mixing of the two phase results in more solid particlesntering the bubbles and more gas entering the emulsion phasehen the superficial gas velocity increases in a fluidized bed. Cui
t al. (2000, 2001) considered the effect of particles in the bubblesnd excess gas in the emulsion phase and they derived the hydro-ynamic correlations based on this concept and this was used inhis study. The correlations required for evaluating the average bedoidage and other hydrodynamic correlations used in the improvedodel and comparison with the well mixed model are summarized
n Table 4.The initial conditions for the solution of the model equations are
s follows:
Mi]t=0 = [Mi]in (39)
(t = 0) = Tin (40)
Propylene concentration (mol/l) = 1 εmf = 0.45Hydrogen concentration (mol/l) = 0.015Catalyst feed rate (g/s) = 0.2
5. Results and discussion
To investigate the effect of different hydrodynamic sub-modelson the dynamic response and grade transition, dynamic model-ing of the process was carried out using the three hydrodynamicsub-models described above along with the reaction sub-model.Comprehensive simulations were carried out in order to evaluatethe effect of the key process parameters such as catalyst feed rate,superficial gas velocity, propylene feed concentrations and carbonmonoxide on the polymer production rate, emulsion phase temper-ature and monomer concentration in the polypropylene reactor. Inorder to demonstrate the predictive capabilities of the proposedmodel, simulations were carried out at the operating conditionsshown in Table 5.
Overall production rate of polymer against time at various cat-alyst feed rates calculated by the three models are shown in Fig. 2.It should be noted that the initial condition (zero time) of thereactor was assumed to be a bed of inert polymer powder andcirculating gas before injection of the catalyst particles. It can beseen in this figure that the polymer production rate predicted bythe well mixed model is higher than that by the constant bub-ble size and improved models. This is due to the assumption thatthe fluidized bed reactor plus recycling system are regarded as aCSTR comprising a well-mixed solid phase interacting with a well-
mixed gas phase (McAuley et al., 1990). The polymer productionrate predicted by the improved model is lower than the conven-tional models since the excess gas increases the void fractions of theemulsion phase and bed. This fact reduces the polymer production
A. Shamiri et al. / Computers and Chemical Engineering 36 (2012) 35– 47 43
Time (s)
14000120001000080006000400020000
Pro
duction r
ate
(g/s
)
0
200
400
600
800
1000
1200
1400
1600
1800
2000
2200
Improved modelWell mixed modelConstant bubble size model
Fcat= 0.3 g/s
Fcat= 0.2 g/s
Fv
reawtis
ptt
F(
0.50.40.30.20.1
Pro
du
ctio
n r
ate
(g/s
)
500
750
1000
1250
1500
1750
2000
2250
2500
2750
3000
3250
Improv ed model
Well mixed mod el
Constant bubble size model
ig. 2. Evolution of the polymer production rate over the time in the reactor atarious catalyst feed rates (U0 = 0.35 m/s).
ate compared to the conventional models which assume that themulsion phase remains at minimum fluidization condition. Fig. 2lso indicates that the improved model, constant bubble size andell mixed models predict similar dynamic behavior at the reac-
or start-up. However, this behavior change as time evolves. Themproved model shows a closer behavior to the constant bubbleize model in terms of the production rate.
Fig. 3a and b illustrates the emulsion phase temperature and
ropylene concentration transients in the reactor predicted by thehree models. The improved model shows lower emulsion phaseemperature and higher monomer concentration compared to the(a)
Time (s)
1000080006000400020000
Em
uls
ion
ph
ase
pro
pyle
ne
co
nce
ntr
atio
n (
mo
l/lit
)
0.975
0.980
0.985
0.990
0.995
1.000
Improved model
Well mixed model
Constant bubble size model
(b)
Em
uls
ion
ph
ase
te
mp
era
ture
(k)
320
325
330
335
340
345
350
(a)
ig. 3. Evolution of reactor behavior against time predicted by the three modelsFcat = 0.3 g/s and U0 = 0.35 m/s): (a) temperature and (b) propylene concentration.
Catalyst fe ed rate (g/s)
Fig. 4. Effect of catalyst feed rate on polymer production rate at U0 = 0.35 m/s.
conventional well mixed model due to higher void fraction andlower reaction rate of the emulsion phase. The constant bubblesize model shows higher emulsion phase temperature and lowermonomer concentration compared to the other models. Constantbubble size model shows that the assumptions of steady-state massand energy balances and considering mean concentration and tem-perature over the bed height for the bubble phase may result in anover-prediction of the temperature and propylene conversion inthe emulsion phase. Fig. 3a and b also reveals that the improvedmodel shows the same dynamic trend behavior in the evolution oftemperature and concentration as the constant bubble size and wellmixed models at the beginning of polymerization and start-up con-ditions of the reactor. However, these transients settle at differentfinal steady-state values. Comparing the temperature profiles withmonomer concentration profiles reveals the reverse relationshipbetween these two variables in the reactor. The consumption ofmonomer increases with the reaction and consequently increasesthe temperature as well.
5.1. Effect of catalyst feed rate
The catalyst contains multiple active sites and each site type isassociated with different rate constants for formation, initiation,propagation, chain transfer and deactivation reactions. The molarflow rate of potential active sites into the reactor is proportional tothe mass feed rate of the catalyst. This makes the later an importantoperating parameter in polypropylene fluidized bed reactors. Fig. 4shows the effect of catalyst feed rate on the polypropylene produc-tion rate. It is clear that the polymer production rate is directlyproportional to the catalyst feed rate. As the catalyst feed rateincreases, so does the polymer production rate. This is due to theincrease in the available reaction sites. The improved model showslower production rate compared to the conventional well mixedand constant bubble size models since it predicts higher void frac-tion of the bed. In fact, the improved model considers the excessgas entering the emulsion phase which increases the average bedvoid fraction which leads to reduction in the polymerization ratecompared to the conventional models that assume the emulsionphase is at minimum fluidization condition.
Fig. 5 illustrates the effect of step changes in the catalyst feedrate on the dynamic behavior of the three models in terms of emul-sion phase temperature. The initial catalyst feed rate was assumed
to be 0.3 g/s and when the emulsion phase temperature reachedsteady state, the catalyst feed rate was changed by ±0.1 g/s. As canbe seen in Fig. 5, the catalyst feed rate strongly affects the emul-sion phase temperature and a small step change in the catalyst feed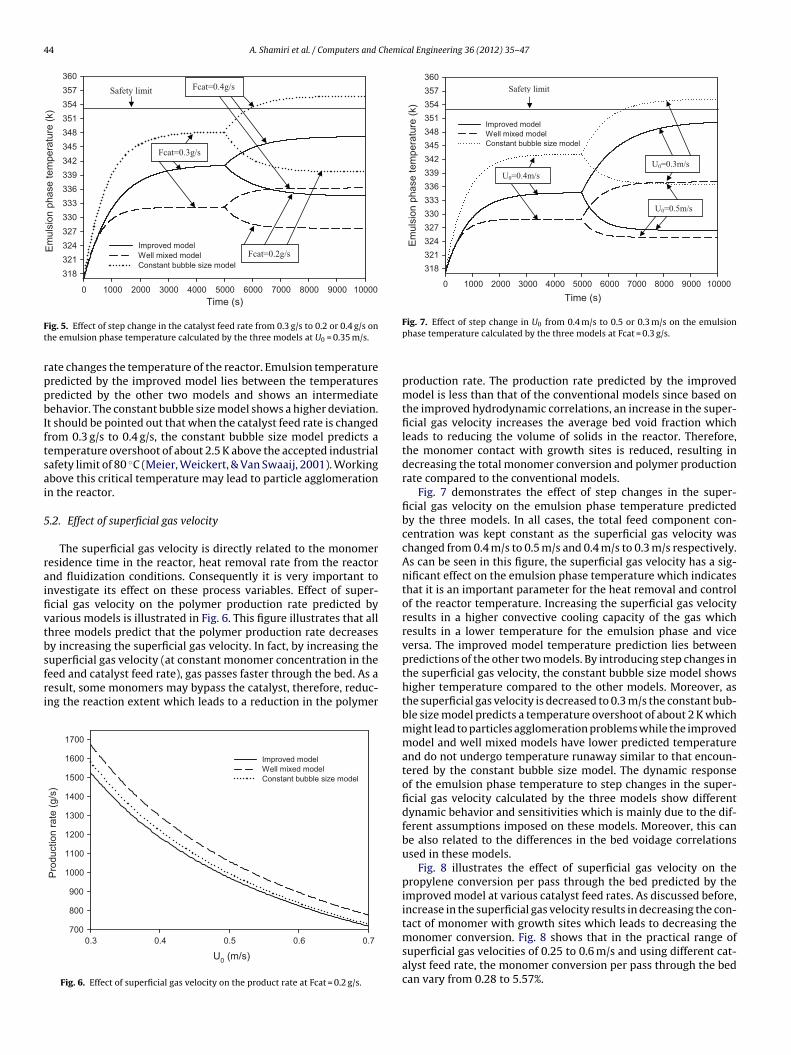
44 A. Shamiri et al. / Computers and Chemical Engineering 36 (2012) 35– 47
Time (s)
100009000800070006000500040003000200010000
Em
uls
ion
ph
ase
te
mp
era
ture
(k)
318
321
324
327
330
333
336
339
342
345
348
351
354
357
360
Improved model
Well mixed model
Constant bubble size model
Fcat=0.2g/s
Fcat=0.4g/s
Fcat=0.3g/s
Safety limit
Ft
rppbIftsai
5
raifivtbsfri
Time (s)
100009000800070006000500040003000200010000
Em
uls
ion
ph
ase
tem
pe
ratu
re (
k)
318
321
324
327
330
333
336
339
342
345
348
351
354
357
360
Improved model
Well mixed mod el
Constant bu bble size model
U0=0.5m/s
U0=0.4m/s U0=0.3m/s
Safety limit
Fig. 7. Effect of step change in U from 0.4 m/s to 0.5 or 0.3 m/s on the emulsion
ig. 5. Effect of step change in the catalyst feed rate from 0.3 g/s to 0.2 or 0.4 g/s onhe emulsion phase temperature calculated by the three models at U0 = 0.35 m/s.ate changes the temperature of the reactor. Emulsion temperatureredicted by the improved model lies between the temperaturesredicted by the other two models and shows an intermediateehavior. The constant bubble size model shows a higher deviation.
t should be pointed out that when the catalyst feed rate is changedrom 0.3 g/s to 0.4 g/s, the constant bubble size model predicts aemperature overshoot of about 2.5 K above the accepted industrialafety limit of 80 ◦C (Meier, Weickert, & Van Swaaij, 2001). Workingbove this critical temperature may lead to particle agglomerationn the reactor.
.2. Effect of superficial gas velocity
The superficial gas velocity is directly related to the monomeresidence time in the reactor, heat removal rate from the reactornd fluidization conditions. Consequently it is very important tonvestigate its effect on these process variables. Effect of super-cial gas velocity on the polymer production rate predicted byarious models is illustrated in Fig. 6. This figure illustrates that allhree models predict that the polymer production rate decreasesy increasing the superficial gas velocity. In fact, by increasing the
uperficial gas velocity (at constant monomer concentration in theeed and catalyst feed rate), gas passes faster through the bed. As aesult, some monomers may bypass the catalyst, therefore, reduc-ng the reaction extent which leads to a reduction in the polymerU0 (m/s)
0.70.60.50.40.3
Pro
duction r
ate
(g/s
)
700
800
900
1000
1100
1200
1300
1400
1500
1600
1700
Improved mode l
Well mixed mode l
Constant bubble si ze mode l
Fig. 6. Effect of superficial gas velocity on the product rate at Fcat = 0.2 g/s.
0
phase temperature calculated by the three models at Fcat = 0.3 g/s.
production rate. The production rate predicted by the improvedmodel is less than that of the conventional models since based onthe improved hydrodynamic correlations, an increase in the super-ficial gas velocity increases the average bed void fraction whichleads to reducing the volume of solids in the reactor. Therefore,the monomer contact with growth sites is reduced, resulting indecreasing the total monomer conversion and polymer productionrate compared to the conventional models.
Fig. 7 demonstrates the effect of step changes in the super-ficial gas velocity on the emulsion phase temperature predictedby the three models. In all cases, the total feed component con-centration was kept constant as the superficial gas velocity waschanged from 0.4 m/s to 0.5 m/s and 0.4 m/s to 0.3 m/s respectively.As can be seen in this figure, the superficial gas velocity has a sig-nificant effect on the emulsion phase temperature which indicatesthat it is an important parameter for the heat removal and controlof the reactor temperature. Increasing the superficial gas velocityresults in a higher convective cooling capacity of the gas whichresults in a lower temperature for the emulsion phase and viceversa. The improved model temperature prediction lies betweenpredictions of the other two models. By introducing step changes inthe superficial gas velocity, the constant bubble size model showshigher temperature compared to the other models. Moreover, asthe superficial gas velocity is decreased to 0.3 m/s the constant bub-ble size model predicts a temperature overshoot of about 2 K whichmight lead to particles agglomeration problems while the improvedmodel and well mixed models have lower predicted temperatureand do not undergo temperature runaway similar to that encoun-tered by the constant bubble size model. The dynamic responseof the emulsion phase temperature to step changes in the super-ficial gas velocity calculated by the three models show differentdynamic behavior and sensitivities which is mainly due to the dif-ferent assumptions imposed on these models. Moreover, this canbe also related to the differences in the bed voidage correlationsused in these models.
Fig. 8 illustrates the effect of superficial gas velocity on thepropylene conversion per pass through the bed predicted by theimproved model at various catalyst feed rates. As discussed before,increase in the superficial gas velocity results in decreasing the con-tact of monomer with growth sites which leads to decreasing themonomer conversion. Fig. 8 shows that in the practical range of
superficial gas velocities of 0.25 to 0.6 m/s and using different cat-alyst feed rate, the monomer conversion per pass through the bedcan vary from 0.28 to 5.57%.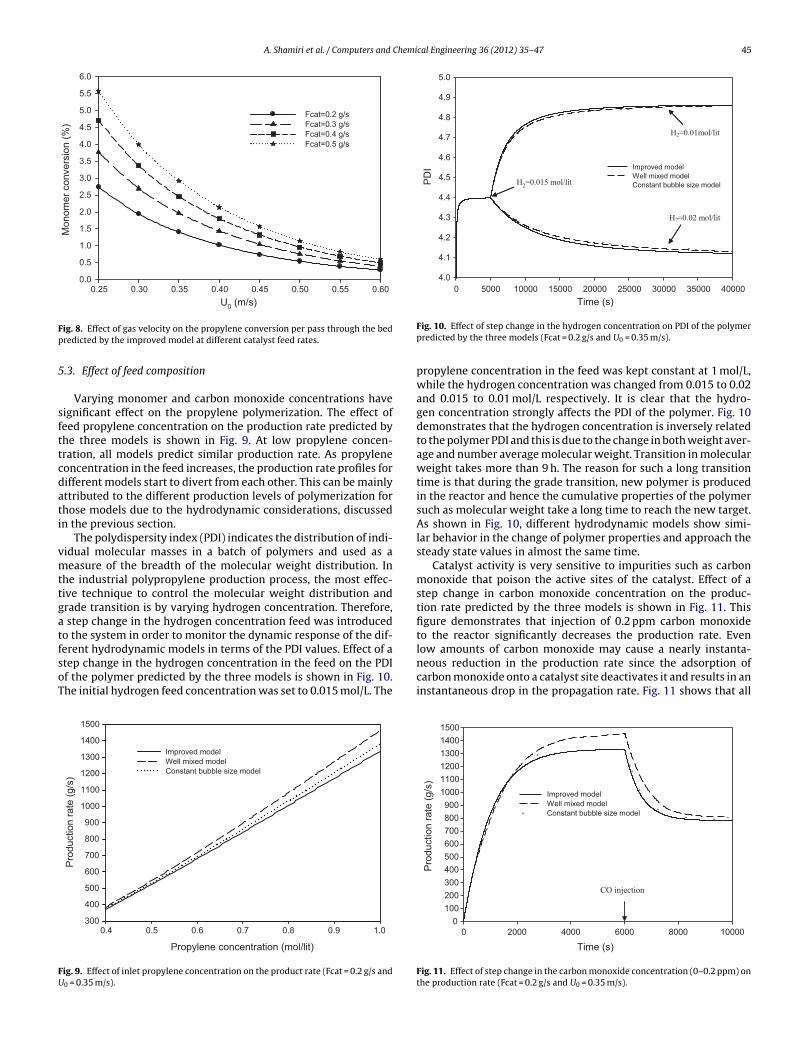
A. Shamiri et al. / Computers and Chemical Engineering 36 (2012) 35– 47 45
U0 (m/s)
0.600.550.500.450.400.350.300.25
Mo
no
me
r co
nve
rsio
n (
%)
0.0
0.5
1.0
1.5
2.0
2.5
3.0
3.5
4.0
4.5
5.0
5.5
6.0
Fcat=0.2 g/s
Fcat=0.3 g/s
Fcat=0.4 g/s
Fcat=0.5 g/s
Fp
5
sfttcdati
vmttgatfsoT
FU
Tim e (s)
0 500 0 1000 0 1500 0 2000 0 2500 0 3000 0 3500 0 4000 0
PD
I
4.0
4.1
4.2
4.3
4.4
4.5
4.6
4.7
4.8
4.9
5.0
Improved mode l
Well mixe d mode l
Const ant bubb le size mode l
H2=0.01mol/l it
H2=0.02 mol/l it
H2=0.015 mol/lit
ig. 8. Effect of gas velocity on the propylene conversion per pass through the bedredicted by the improved model at different catalyst feed rates.
.3. Effect of feed composition
Varying monomer and carbon monoxide concentrations haveignificant effect on the propylene polymerization. The effect ofeed propylene concentration on the production rate predicted byhe three models is shown in Fig. 9. At low propylene concen-ration, all models predict similar production rate. As propyleneoncentration in the feed increases, the production rate profiles forifferent models start to divert from each other. This can be mainlyttributed to the different production levels of polymerization forhose models due to the hydrodynamic considerations, discussedn the previous section.
The polydispersity index (PDI) indicates the distribution of indi-idual molecular masses in a batch of polymers and used as aeasure of the breadth of the molecular weight distribution. In
he industrial polypropylene production process, the most effec-ive technique to control the molecular weight distribution andrade transition is by varying hydrogen concentration. Therefore,
step change in the hydrogen concentration feed was introducedo the system in order to monitor the dynamic response of the dif-
erent hydrodynamic models in terms of the PDI values. Effect of atep change in the hydrogen concentration in the feed on the PDIf the polymer predicted by the three models is shown in Fig. 10.he initial hydrogen feed concentration was set to 0.015 mol/L. ThePropylene concentration (mol/lit)
1.00.90.80.70.60.50.4
Pro
duction r
ate
(g/s
)
300
400
500
600
700
800
900
1000
1100
1200
1300
1400
1500
Improved model
Well mixed model
Constant bubble size model
ig. 9. Effect of inlet propylene concentration on the product rate (Fcat = 0.2 g/s and0 = 0.35 m/s).
Fig. 10. Effect of step change in the hydrogen concentration on PDI of the polymerpredicted by the three models (Fcat = 0.2 g/s and U0 = 0.35 m/s).
propylene concentration in the feed was kept constant at 1 mol/L,while the hydrogen concentration was changed from 0.015 to 0.02and 0.015 to 0.01 mol/L respectively. It is clear that the hydro-gen concentration strongly affects the PDI of the polymer. Fig. 10demonstrates that the hydrogen concentration is inversely relatedto the polymer PDI and this is due to the change in both weight aver-age and number average molecular weight. Transition in molecularweight takes more than 9 h. The reason for such a long transitiontime is that during the grade transition, new polymer is producedin the reactor and hence the cumulative properties of the polymersuch as molecular weight take a long time to reach the new target.As shown in Fig. 10, different hydrodynamic models show simi-lar behavior in the change of polymer properties and approach thesteady state values in almost the same time.
Catalyst activity is very sensitive to impurities such as carbonmonoxide that poison the active sites of the catalyst. Effect of astep change in carbon monoxide concentration on the produc-tion rate predicted by the three models is shown in Fig. 11. Thisfigure demonstrates that injection of 0.2 ppm carbon monoxideto the reactor significantly decreases the production rate. Evenlow amounts of carbon monoxide may cause a nearly instanta-
neous reduction in the production rate since the adsorption ofcarbon monoxide onto a catalyst site deactivates it and results in aninstantaneous drop in the propagation rate. Fig. 11 shows that allTime (s)
0 200 0 400 0 600 0 800 0 100 00
Pro
du
ctio
n r
ate
(g/s
)
0
100
200
300
400
500
600
700
800
900
1000
1100
1200
1300
1400
1500
Improved model
Well mixed model
Constant bubbl e size model
CO injection
Fig. 11. Effect of step change in the carbon monoxide concentration (0–0.2 ppm) onthe production rate (Fcat = 0.2 g/s and U0 = 0.35 m/s).

46 A. Shamiri et al. / Computers and Chemi
Carbon monoxide concentration (p pm)
0.0 0.5 1.0 1.5 2.0 2.5
Em
uls
ion
ph
ase
te
mp
era
ture
(K
)
318
320
322
324
326
328
330
332
334
336
338
340
Improved mod el
Well mixed mod el
Const ant bu bble size mod el
Ft
mipdo
tsaa0ttttbtbinmctd
Foa
ig. 12. Effect of carbon monoxide concentration on the emulsion phase tempera-ure (Fcat = 0.2 g/s and U0 = 0.35 m/s).
odels behave similarly in predicting the effect of catalyst poison-ng. Fig. 12 illustrates the effect of carbon monoxide on the emulsionhase temperature. The emulsion phase temperature rate sharplyecreases by the presence of carbon monoxide due to deactivationf the catalyst sites.
Effect of a step change in carbon monoxide concentration onhe emulsion phase temperature calculated by the three models ishown in Fig. 13. As shown in this figure, the three models predict
temperature above the accepted industrial safety limit of 80 ◦Ct the catalyst feed rate of 0.5 g/s and superficial gas velocity of.3 m/s. Working above this critical temperature may lead to par-icle melting, agglomeration and subsequent reactor shutdown. Athis condition, the injection of 0.45 ppm of carbon monoxide tohe reactor presents a significant effect on the reactor tempera-ure. In such a condition, the temperature of the emulsion predictedy the three models is decreased by more than 20 K which bringshe final temperature below the maximum safe temperature fored operation which reduces the risks mentioned above. Fig. 13
llustrates that the constant bubble size model shows the most sig-ificant change compared to the other two models. The improved
odel shows closer behavior to the constant bubble size modelompared to the well mixed model. This difference can be relatedo the differences in the bed voidage predicted by these models, asiscussed before. It can be concluded that the presence of very low
Time (s)
0 200 0 400 0 600 0 800 0 100 00
Em
uls
ion
ph
ase
te
mp
era
ture
(k)
320
325
330
335
340
345
350
355
360
365
370
375
380
385
390
Improved model
Well mixed model
Constan t bubble size mod el
Safety limit
CO injecti on
ig. 13. Effect of step change in the carbon monoxide concentration (0–0.45 ppm)n the emulsion phase temperature calculated by the three models (Fcat = 0.7 g/snd U0 = 0.3 m/s).
cal Engineering 36 (2012) 35– 47
levels of carbon monoxide in the reactor, when the reactor worksat above the maximum safe bed operation temperature, can reducethe risks of particle melting, agglomeration and subsequent reactorshutdown.
Based on the advantages of the improved model, it can beexpected that the improved model provide a more realistic result.In fact, even though the model has not been validated experimen-tally, the recommendations of previous experimental findings havebeen taken into consideration in the improved model. Althoughthe authors were not able to find or generate experimental data ofpropylene polymerization for validation of the improved model, thesame modeling approach was adopted for polyethylene productionand was compared with steady state industrial data in terms of metflow index (Alizadeh et al., 2004), molecular weight distribution,polymer production rate, reactor temperature and polydispersityindex (Kiashemshaki et al., 2006) in which the results showed thatthe model is in good agreement with the industrial data.
6. Conclusions
An improved dynamic model for the production of polypropy-lene in a gas phase fluidized bed reactor was developed to describethe behavior of the fluidized bed reactor of polypropylene pro-duction. Comparative simulation studies were carried out usingthe well-mixed, constant bubble size and the improved models inorder to investigate the effects of the mixing, operating conditions,kinetic and hydrodynamic parameters on the reactor performance.The improved model showed different prediction characteristics ofpolymer production rate as well as heat and mass transfer behav-ior as compared to other published models. All the three modelsshowed similar dynamic behavior at the startup conditions. Butthe improved model predicted a narrower safe operation window.Furthermore, the safe ranges of variation of the main operatingparameters such as catalyst feed rate and superficial gas velocitycalculated by the improved and well mixed models are wider thanthat obtained by the constant bubble size model. The superficial gasvelocity and catalyst feed rate have a strong effect on the hydrody-namics and reaction rate which results in a greater variation in thetotal production rate. Based on the improved model, by consideringthe practical range of superficial gas velocity and different cata-lyst feed rate, the monomer conversion per pass through the bedvaries from 0.28 to 5.57%. The presence of carbon monoxide in thefeed resulted in the reduction of polypropylene production rate andreactor temperature due to catalyst deactivation which highlightsthe importance of including a purification facility in the process.On the other hand, injection of low amount of carbon monoxide tothe reactor may prevent particle melting, agglomeration and sub-sequent reactor shutdown when the reactor is about to work atabove the maximum safe bed operating temperature.
Acknowledgments
The authors would like to thank the support of the ResearchCouncil of the University of Malaya under research grant (No.RG054/09AET) and the Petroleum and Chemical EngineeringDepartment at Sultan Qaboos University and the School of Chem-ical Engineering, College of Engineering, University of Tehran fortheir support to this research.
References
Alizadeh, M., Mostoufi, N., Pourmahdian, S., & Sotudeh-Gharebagh, R. (2004). Mod-
eling of fluidized bed reactor of ethylene polymerization. Chemical EngineeringJournal, 97, 27–35.Choi, K. Y., & Ray, W. H. (1985). The dynamic behavior of fluidized bed reactors forsolid catalyzed gas phase olefin polymerization. Chemical Engineering Science,40, 2261–2278.

Chemi
C
C
d
F
F
H
H
H
H
I
J
K
K
Industrial & Engineering Chemistry Research, 33, 449–479.
A. Shamiri et al. / Computers and
ui, H. P., Mostoufi, N., & Chaouki, J. (2000). Characterization of dynamic gas–soliddistribution in the fluidized beds. Chemical Engineering Journal, 79, 135–143.
ui, H. P., Mostoufi, N., & Chaouki, J. (2001). Gas and solids between dynamic bubbleand emulsion in gas-fluidized beds. Powder Technology, 120, 12–20.
e Carvalho, A. B., Gloor, P. E., & Hamielec, A. E. (1989). A kinetic mathematical modelfor heterogeneous Ziegler–Natta copolymerization. Polymer, 30, 280–296.
ernandes, F. A. N., & Lona, L. M. F. (2001). Heterogeneous modeling for fluidized-bedpolymerization reactor. Chemical Engineering Science, 56, 963–969.
loyd, S., Choi, K. Y., Taylor, T. W., & Ray, W. H. (1986). Polymerization of olefinsthrough heterogeneous catalysts. III. Polymer particle modelling with an anal-ysis of intraparticle heat and mass transfer effects. Journal of Applied PolymerScience, 32, 2935–2960.
arshe, Y. M., Utikar, R. P., & Ranade, V. V. (2004). A computational model for predict-ing particle size distribution and performance of fluidized bed polypropylenereactor. Chemical Engineering Science, 59, 5145–5156.
atzantonis, H., Yiannoulakis, H., Yiagopoulos, A., & Kiparissides, C. (2000). Recentdevelopments in modeling gas-phase catalyzed olefin polymerization fluidized-bed reactors: The effect of bubble size variation on the reactor’s performance.Chemical Engineering Science, 55, 3237–3259.
illigardt, K., & Werther, J. (1986). Local bubble gas hold-up and expansion ofgas/solid fluidized beds. German Chemical Engineering, 92, 15–221.
utchinson, R. A., Chen, C. M., & Ray, W. H. (1992). Polymerization of olefins throughheterogeneous catalysis X: Modeling of particle growth and morphology. Journalof Applied Polymer Science, 44, 1389–1414.
brehem, A. S., Hussain, M. A., & Ghasem, N. M. (2008). Modified mathematical modelfor gas phase olefin polymerization in fluidized-bed catalytic reactor. ChemicalEngineering Journal, 149, 353–362.
afari, R., Sotudeh-Gharebagh, R., & Mostoufi, N. (2004). Modular simulation of flu-idized bed reactors. Chemical Engineering & Technology, 27, 123–129.
hare, N. P., Luca, B., Seavey, K. C., & Liu, Y. A. (2004). Steady-state and dynamic mod-
eling of gas-phase polypropylene processes using stirred-bed reactors. Industrial& Engineering Chemistry Research, 43, 884–900.iashemshaki, A., Mostoufi, N., & Sotudeh-Gharebagh, R. (2006). Two-phase mod-eling of the gas phase polyethylene fluidized bed reactor. Chemical EngineeringScience, 61, 3997–4006.
cal Engineering 36 (2012) 35– 47 47
Kissin, Y. V. (1985). Isospecific polymerization of olefins with heterogeneousZiegler–Natta catalysts. New York: Springer-Verlag.
Kunii, D. E., & Levenspiel, O. (1991). Fluidization engineering (2nd ed.). Boston, MA:Butterworth-Heinmann.
Lucas, A., Arnaldos, J., Casal, J., & Puigjaner, L. (1986). Improved equation for thecalculation of minimum fluidization velocity. Industrial & Engineering ChemistryProcess Design and Development, 25, 426–429.
Luo, Z. H., Su, P. L., Shi, D. P., & Zheng, Z. W. (2009). Steady-state and dynamic mod-eling of commercial bulk polypropylene process of Hypol technology. ChemicalEngineering Journal, 149, 370–382.
McAuley, K. B., MacGregor, J. F., & Hamilec, A. E. (1990). A kinetic model for industrialgas-phase ethylene copolymerization. AIChE Journal, 36, 837–850.
McAuley, K. B., Talbot, J. P., & Harris, T. J. (1994). A comparison of two phase andwell-mixed models for fluidized bed polyethylene reactors. Chemical EngineeringScience, 49, 2035–2045.
Meier, G. B., Weickert, G., & Van Swaaij, W. P. M. (2001). Gas-phase polymerizationof propylene: Reaction kinetics and molecular weight distribution. Journal ofPolymer Science Part A: Polymer Chemistry, 39, 500–513.
Shamiri, A., Hussain, M. A., Farouq, S. M., & Mostoufi, N. (2010). Kinetic modeling ofpropylene homopolymerization in a gas-phase fluidized-bed reactor. ChemicalEngineering Journal, 161, 240–249.
Shamiri, A., Hussain, M. A., Mjalli, F. S., Mostoufi, N., & Shafeeyan, M. S. (2011).Dynamic modeling of gas phase propylene homopolymerization in fluidized bedreactors. Chemical Engineering Science, 66, 1189–1199.
Soares, J. B. P., & Hamielec, A. E. (1995). Deconvolution of chain-length distri-bution of linear polymers made by multiple-site-type catalyst. Polymer, 36,2257–2264.
Xie, T., McAuley, K. B., Hsu, J. C. C., & Bacon, D. W. (1994). Gas phase ethylene poly-merization: Preparation processes, polymer properties and reactor modeling.
Zacca, J. J., Debling, J. A., & Ray, W. H. (1996). Reactor residence time distri-bution effects on the multistage polymerization of olefins-I. Basic principlesand illustrative examples, polypropylene. Chemical Engineering Science, 51,4859–4886.
Copyright © 2022 FDOKUMEN