Mechanics of mitotic spindle poles and polymerization ...
191
Mechanics of mitotic spindle poles and polymerization dynamics of microtubules by Blake D. Charlebois A dissertation submitted in partial fulfillment of the requirements for the degree of Doctor of Philosophy (Biomedical Engineering) in The University of Michigan 2011 Doctoral Committee: Professor Alan J. Hunt, Chair Professor Edgar Meyhöfer Associate Professor David S. Sept Associate Professor Kristen J. Verhey Assistant Professor Sivaraj Sivaramakrishnan
-
Upload
khangminh22 -
Category
Documents
-
view
3 -
download
0
Transcript of Mechanics of mitotic spindle poles and polymerization ...

Mechanics of mitotic spindle poles andpolymerization dynamics of microtubules
by
Blake D. Charlebois
A dissertation submitted in partial fulfillmentof the requirements for the degree of
Doctor of Philosophy(Biomedical Engineering)
in The University of Michigan2011
Doctoral Committee:Professor Alan J. Hunt, ChairProfessor Edgar MeyhöferAssociate Professor David S. SeptAssociate Professor Kristen J. VerheyAssistant Professor Sivaraj Sivaramakrishnan

© Blake D. Charlebois 2011
All Rights Reserved

To my parents and grandparents,
who were my first teachers
in matters academic and otherwise.
ii

ACKNOWLEDGEMENTS
It is difficult to adequately express my thanks to the many people involved, directly
or indirectly, in the completion of this work.
I first thank my advisor, Alan Hunt, for his support, patience, insightful intellec-
tual contributions, and persistent effort, none of which can be overstated.
I am tremendously fortunate to have a committee with extensive depth and
breadth of knowledge within and outside my field of study. Each committee member
is encouraging, engaged, and generous with his or her time and advice. I recall specific
enlightening interactions with Edgar Meyhöfer that stimulated my excitement about
science, and I note that I have indirectly benefited from his mentorship of Trey Schek
and Damon Hoff.
I have benefited a great deal from early mentorship by Henry (Trey) Schek and
ongoing mentorship from J. Damon Hoff. Damon is consistently generous with his
time, intellect, and friendship, assisting me and others in the department with a
wide range of problems from the intellectually or emotionally overwhelming to the
mundane. I suspect he is also the fastest aliquoter in the midwest. I thank members
of the Hunt lab, past and present, for their support and assistance including Kevin,
David, Jeff, Jun, Ran, Seth, Aghapi, John, Ophelia, and Hong. I also thank Meyhöfer
lab members Troy and Neha, as well as Ajit Joglekar, for their encouragement. I
acknowledge my M.A.Sc. advisor, C. Ross Ethier, who was highly influential in my
intellectual development, as was his student Khosro Shahbazi. Department staff,
including Chuck, Maria, and Dana, have been remarkably patient and helpful.
iii

I thank my collaborators for their extensive efforts. Chapter III is the product
of a collaboration that resulted in a shared first-authorship publication [Charlebois,
Kollu, Schek, Compton, and Hunt, 2011]. Swapna Kollu and I attempted to divide the
required effort equally between us, working side by side in many stages of the work and
allocating some tasks based on expertise. I therefore operated the optical tweezers,
performed data analysis, and drafted an initial typescript in which data interpretation
required expertise on mechanics and on the instrument used. Chapter VI is the
product of a collaboration that resulted in a paper on which I am second author
[Gardner, Charlebois, Jánosi, Howard, Hunt, and Odde, 2011]. The data I collected
using the optical tweezers assay of Chapter V confirmed our hypothesis, which had
been suggested by computational results Melissa Gardner obtained while working
in the Odde lab, and which Melissa further confirmed with TIRF microscopy after
joining the Howard lab. Figures shown in Chapter VI were prepared by Melissa,
but for those corresponding to the data I collected I performed independent parallel
analysis.
I am grateful my wonderfully supportive partner Areeta, who helps me see the
forest for the trees. My life would not be right without her.
I also have the good fortune of having a supportive family whose company I’ve
always very much enjoyed, including my Father, late Mother, grandparents (one of
whom taught me about polar and azimuthal angles in my youth, though I appreciated
this only much later), sister, aunts, uncles, cousins, and their significant others. Many
friends deserve my thanks for their support and for tolerating my disappearances into
the library or lab, and I will not try to name them here for fear of forgetting even
one.
The present work was written using TEXnicCenter, JabRef, and the the LATEX
template from the University of Michigan AOSS website, all of which have been
made available by their authors free of charge.
iv

TABLE OF CONTENTS
DEDICATION . . . . . . . . . . . . . . . . . . . . . . . . . . . . . . . . . . ii
ACKNOWLEDGEMENTS . . . . . . . . . . . . . . . . . . . . . . . . . . iii
LIST OF FIGURES . . . . . . . . . . . . . . . . . . . . . . . . . . . . . . . ix
LIST OF TABLES . . . . . . . . . . . . . . . . . . . . . . . . . . . . . . . . xi
LIST OF APPENDICES . . . . . . . . . . . . . . . . . . . . . . . . . . . . xii
ABSTRACT . . . . . . . . . . . . . . . . . . . . . . . . . . . . . . . . . . . xiii
CHAPTER
I. Introduction . . . . . . . . . . . . . . . . . . . . . . . . . . . . . . 1
1.1 The cytoskeleton . . . . . . . . . . . . . . . . . . . . . . . . . 11.2 Microtubules . . . . . . . . . . . . . . . . . . . . . . . . . . . 2
1.2.1 Microtubule structure and function . . . . . . . . . 21.2.2 GTP hydrolysis and dynamic instability . . . . . . . 71.2.3 Growth-phase polymerization . . . . . . . . . . . . . 8
1.3 Mitosis . . . . . . . . . . . . . . . . . . . . . . . . . . . . . . 91.4 Summary of dissertation contents . . . . . . . . . . . . . . . . 10
II. Background: Mitosis . . . . . . . . . . . . . . . . . . . . . . . . . 11
2.1 Introduction . . . . . . . . . . . . . . . . . . . . . . . . . . . 112.2 The spindle . . . . . . . . . . . . . . . . . . . . . . . . . . . . 12
2.2.1 Dynamic phenomena and spindle forces . . . . . . . 132.2.2 Centrosomal and acentrosomal spindle formation path-
ways . . . . . . . . . . . . . . . . . . . . . . . . . . 142.3 The mechanics of mitosis . . . . . . . . . . . . . . . . . . . . 16
2.3.1 Spindle deformation . . . . . . . . . . . . . . . . . . 182.3.2 Chromosome deformation . . . . . . . . . . . . . . . 182.3.3 Microtubule-chromosome interactions . . . . . . . . 19
v

2.4 Spindle pole analogs . . . . . . . . . . . . . . . . . . . . . . . 21
III. Mechanics of mitotic asters . . . . . . . . . . . . . . . . . . . . . 24
3.1 Materials and methods . . . . . . . . . . . . . . . . . . . . . 253.1.1 Cell culture . . . . . . . . . . . . . . . . . . . . . . 253.1.2 Mitotic aster preparation and assay execution . . . 253.1.3 Tracking movements of microtubules in the aster . . 263.1.4 Algorithm identifying excursions of roughly constant
velocity . . . . . . . . . . . . . . . . . . . . . . . . . 273.1.5 Computing κa from changes in stiffness experienced
by the bead . . . . . . . . . . . . . . . . . . . . . . 273.1.6 Computing κ and γ from exponential fits . . . . . . 29
3.2 Results and discussion . . . . . . . . . . . . . . . . . . . . . . 293.2.1 Motor-driven microtubule movement . . . . . . . . . 303.2.2 Compliance obtained from thermal motion of the bead 363.2.3 Compliance and drag obtained from exponential fits 383.2.4 Effect of perturbing kinesin-5 (Eg5) by depletion or
monastrol treatment . . . . . . . . . . . . . . . . . . 413.2.5 The spindle pole cross-linked by compliant elements 43
3.3 Conclusion . . . . . . . . . . . . . . . . . . . . . . . . . . . . 46
IV. Background: Microtubule structure and polymerization dy-namics . . . . . . . . . . . . . . . . . . . . . . . . . . . . . . . . . . 48
4.1 Introduction . . . . . . . . . . . . . . . . . . . . . . . . . . . 484.2 Microtubule structure . . . . . . . . . . . . . . . . . . . . . . 50
4.2.1 αβ-tubulin . . . . . . . . . . . . . . . . . . . . . . . 504.2.2 Microtubule lattices . . . . . . . . . . . . . . . . . . 534.2.3 Protofilament and subunit curvature . . . . . . . . . 574.2.4 Structures at the tips of growing microtubules . . . 58
4.3 Microtubule polymerization . . . . . . . . . . . . . . . . . . . 614.3.1 Growth-phase polymerization . . . . . . . . . . . . . 614.3.2 Polymerization with nucleotide hydrolysis . . . . . . 71
V. Nanometer-Resolution Microtubule Polymerization Assays Us-ing Optical Tweezers and Microfabricated Barriers . . . . . . 75
5.1 Introduction . . . . . . . . . . . . . . . . . . . . . . . . . . . 765.2 Rationale . . . . . . . . . . . . . . . . . . . . . . . . . . . . . 775.3 Methods . . . . . . . . . . . . . . . . . . . . . . . . . . . . . 775.4 Materials . . . . . . . . . . . . . . . . . . . . . . . . . . . . . 81
5.4.1 Buffer . . . . . . . . . . . . . . . . . . . . . . . . . . 815.4.2 Experimental Apparatus . . . . . . . . . . . . . . . 81
vi

5.4.3 MT Length Constraints: Applied Force and BarrierDesign . . . . . . . . . . . . . . . . . . . . . . . . . 82
5.4.4 Preparation of Biotinylated MT Seeds . . . . . . . . 835.4.5 Preparation of NeutrAvidin®-Coated Beads . . . . . 84
5.5 Discussion . . . . . . . . . . . . . . . . . . . . . . . . . . . . 845.5.1 Advantages of Force Clamping . . . . . . . . . . . . 855.5.2 Data Analysis: Bead Position Relative to Trap Center 855.5.3 Data Analysis: MT Length Changes . . . . . . . . . 865.5.4 Detection Limits: Forces, Bandwidth, and Resolution 875.5.5 Potential Sources of Artifacts . . . . . . . . . . . . . 88
5.6 Summary . . . . . . . . . . . . . . . . . . . . . . . . . . . . . 89
VI. Fluctuations in growth rate support a 2D model for micro-tubule self-assembly kinetics . . . . . . . . . . . . . . . . . . . . 90
6.1 Introduction . . . . . . . . . . . . . . . . . . . . . . . . . . . 906.2 Results . . . . . . . . . . . . . . . . . . . . . . . . . . . . . . 92
6.2.1 The 1DModel Predicts Fewer Large Shortening Eventsat Higher Tubulin Concentration . . . . . . . . . . . 92
6.2.2 The Frequency of Large Microtubule Shortening EventsIncreases at Higher Tubulin Concentration in TIRFExperiments . . . . . . . . . . . . . . . . . . . . . . 93
6.2.3 The Frequency of Large Shortening Events Increasesat Higher Tubulin Concentration in Laser TweezersExperiments . . . . . . . . . . . . . . . . . . . . . . 96
6.2.4 Concentration-Dependent Tubulin Subunit Dissoci-ation Rates are Explained by Accounting for BothLateral and Longitudinal Bonds . . . . . . . . . . . 97
6.2.5 The 1D and 2D Models Both Predict the Linear De-pendence of Growth Rate on Tubulin ConcentrationBut With Differing Rate Constants . . . . . . . . . 104
6.2.6 The Variability in Growth Rate is Significantly Un-derpredicted by the 1D Model, But is Correctly Pre-dicted By the Rapid On-Off Kinetics Required in the2D Model . . . . . . . . . . . . . . . . . . . . . . . 108
6.2.7 Experiments Confirm Rapid Tubulin On-Off KineticsPredicted by the 2D Model . . . . . . . . . . . . . . 109
6.2.8 Growth Variability in the Laser-Tweezer Assay is Con-sistent with Rapid Tubulin Subunit On-Off Kinetics 112
6.2.9 Experimentally, Microtubule Tips Are More TaperedAt Higher Tubulin Concentration, Consistent withConcentration-Dependent Subunit Dissociation Rates 113
6.2.10 GTP-Tubulin Growth Variability is Consistent withRapid Tubulin Subunit On-Off Kinetics . . . . . . . 114
vii

6.2.11 In Vivo Microtubule Growth Variability is Consistentwith Rapid Tubulin Subunit On-Off Kinetics . . . . 115
6.3 Discussion . . . . . . . . . . . . . . . . . . . . . . . . . . . . 1186.3.1 Relationship to previous studies . . . . . . . . . . . 1206.3.2 Possible alternative explanations for high variability
in microtubule assembly . . . . . . . . . . . . . . . 1216.3.3 The 2D model for microtubule assembly . . . . . . . 1226.3.4 Implications for the Regulation of Microtubule Dy-
namics by MAPs and Drugs . . . . . . . . . . . . . 1236.3.5 Implications for Other Multi-stranded Filaments . . 127
6.4 Methods . . . . . . . . . . . . . . . . . . . . . . . . . . . . . 1276.4.1 Tweezers experiments . . . . . . . . . . . . . . . . . 1276.4.2 TIRF microscopy experiments . . . . . . . . . . . . 1286.4.3 Simulations . . . . . . . . . . . . . . . . . . . . . . 128
VII. Summary and recommended future directions . . . . . . . . . 129
7.1 Summary . . . . . . . . . . . . . . . . . . . . . . . . . . . . . 1297.2 Recommended future directions . . . . . . . . . . . . . . . . . 130
7.2.1 Mechanics of the mitotic spindle . . . . . . . . . . . 1307.2.2 Microtubule polymerization dynamics . . . . . . . . 131
APPENDICES . . . . . . . . . . . . . . . . . . . . . . . . . . . . . . . . . . 136A.1 A simple model of pole compliance and force transfer . . . . . 137A.2 Supplemental data . . . . . . . . . . . . . . . . . . . . . . . . 142B.1 Surface free energy and roughness at equilibrium . . . . . . . 149B.2 Minimizing surface roughness . . . . . . . . . . . . . . . . . . 151B.3 Rate constants for a specific transition . . . . . . . . . . . . . 151B.4 Overall rate constants . . . . . . . . . . . . . . . . . . . . . . 154B.5 Aside: Rate perturbation factors . . . . . . . . . . . . . . . . 155
BIBLIOGRAPHY . . . . . . . . . . . . . . . . . . . . . . . . . . . . . . . . 157
viii

LIST OF FIGURES
Figure
1.1 Interconnection of cytoskeletal fibers . . . . . . . . . . . . . . . . . 31.2 F-actin and microtubules in growth cones. . . . . . . . . . . . . . . 41.3 Microtubules assemble from heterodimeric αβ-tubulin subunits. . . 51.4 Microtubules in an interphase cell. . . . . . . . . . . . . . . . . . . . 61.5 The GTP cap. . . . . . . . . . . . . . . . . . . . . . . . . . . . . . . 82.1 Fluorescence images of the phases of mitosis. . . . . . . . . . . . . . 122.2 Schematic of the phases of mitosis. . . . . . . . . . . . . . . . . . . 123.1 Experimental design and example of laser trap analysis of spindle poles. 313.2 Run-lengths and velocities of microtubules anchored to spindle poles. 323.3 Analysis of stiffness of microtubule linkage to spindle poles. . . . . . 373.4 Model explaining the effect of cross-link stiffness on force distribution
at spindle poles. . . . . . . . . . . . . . . . . . . . . . . . . . . . . . 454.1 Structure of β-tubulin. . . . . . . . . . . . . . . . . . . . . . . . . . 514.2 The E-hook and post-translational modification. . . . . . . . . . . . 524.3 The 13-protofilament microtubule lattice. . . . . . . . . . . . . . . . 544.4 Microtubule lattices with different numbers of protofilaments. . . . . 564.5 Effect of lattice changes on lateral interactions. . . . . . . . . . . . . 564.6 Terminology for microtubule tips. . . . . . . . . . . . . . . . . . . . 604.7 Rate constants as depicted by Hill. . . . . . . . . . . . . . . . . . . 644.8 k
(i)off,PF values used in VanBuren simulations. . . . . . . . . . . . . . 69
4.9 Examples of potential GTP cap distributions. . . . . . . . . . . . . 735.1 Assay overview and experimental geometry. . . . . . . . . . . . . . . 785.2 Orienting an MT in the barrier. . . . . . . . . . . . . . . . . . . . . 796.1 TIRF microscopy reveals koff,MTincreases with [Tub]. . . . . . . . . . 946.2 Nanoscale optical tweezers experiments confirm increasing growth
rate variability and frequency of large shortening events at higher[Tub] . . . . . . . . . . . . . . . . . . . . . . . . . . . . . . . . . . . 98
6.3 A 2D model predicts that tubulin subunit dissociation rates are de-pendent on [Tub] . . . . . . . . . . . . . . . . . . . . . . . . . . . . 101
6.4 Constraint of kon,MT in 2D Model Simulations. . . . . . . . . . . . . 1026.5 Lateral interactions require rapid on-off kinetics for subunits at the
microtubule tip. . . . . . . . . . . . . . . . . . . . . . . . . . . . . . 106
ix

6.6 TIRF microscopy measurements show that microtubule tip structuredepends on free GMPCPP-tubulin concentration. . . . . . . . . . . 110
6.7 Higher [Tub] result in increased growth variability in vitro. . . . . . 1166.8 [Tub] and growth variability in vivo. . . . . . . . . . . . . . . . . . . 1176.9 Revised view of microtubule assembly kinetics. . . . . . . . . . . . . 119A.1 Quantitative model of force transfer. . . . . . . . . . . . . . . . . . 141A.2 Position vs. time traces for ATP, AMPPNP, monastrol. . . . . . . . 143A.3 Position vs. time traces for Eg5 depletion and assessment of Eg5
depletion. . . . . . . . . . . . . . . . . . . . . . . . . . . . . . . . . 144A.4 Estimated ∆x and vx distributions. . . . . . . . . . . . . . . . . . . 145A.5 Additional exponential jump data. . . . . . . . . . . . . . . . . . . . 146A.6 Exponential fit to joined segments between jumps. . . . . . . . . . . 147B.1 Examples of subunit-addition transitions and definition of Lj. . . . 150
x

LIST OF TABLES
Table
3.1 Summary statistics for ∆x and vx . . . . . . . . . . . . . . . . . . . 343.2 Statistical comparison of ∆x and vx distributions. . . . . . . . . . . 353.3 p-values for comparison of κa . . . . . . . . . . . . . . . . . . . . . . 424.1 Examples of modulation of plus-end dynamic instability . . . . . . . 494.2 Nomenclature for microtubule polymerization dynamics with typical
units . . . . . . . . . . . . . . . . . . . . . . . . . . . . . . . . . . . 624.3 VanBuren model kon,PF, ∆G0
Lateral, and ∆G0∗Longitudinalvalues . . . . . 69
6.1 Published kon,MT and koff,MT estimates for growing microtubule plusends . . . . . . . . . . . . . . . . . . . . . . . . . . . . . . . . . . . 91
6.2 2D Model Simulation Parameter Values . . . . . . . . . . . . . . . . 1036.3 Experimental On and Off Rate Constant Estimates for Microtubule
Plus-ends . . . . . . . . . . . . . . . . . . . . . . . . . . . . . . . . 107B.1 Comparison of Hill’s nomenclature and that of the present work . . 148
xi

LIST OF APPENDICES
Appendix
A. Mechanics of Mitotic Asters: supplementary data and discussion . . . 137
B. The Hill 2D model . . . . . . . . . . . . . . . . . . . . . . . . . . . . . 148
xii

ABSTRACT
Mechanics of mitotic spindle poles and polymerization dynamics of microtubules
by
Blake D. Charlebois
Chair: Alan J. Hunt
During cell division, chromosomes must faithfully segregate to maintain genome in-
tegrity, and this dynamic mechanical process is driven by the macromolecular ma-
chinery of the mitotic spindle. However, little is known about spindle mechanics.
For example, spindle microtubules are organized by numerous cross-linking proteins
yet the mechanical properties of those cross-links remain unexplored. To examine
the mechanical properties of microtubule cross-links we applied optical trapping to
mitotic asters that form in mammalian mitotic extracts. These asters are foci of
microtubules, motors, and microtubule-associated proteins that reflect many of the
functional properties of spindle poles and represent centrosome-independent spindle-
pole analogs. We observed bidirectional motor-driven microtubule movements, show-
ing that microtubule linkages within asters are remarkably compliant (mean stiffness
0.025 pN/nm) and mediated by only a handful of cross-links. Depleting the motor
Eg5 reduced this stiffness, indicating that Eg5 contributes to the mechanical proper-
ties of microtubule asters in a manner consistent with its localization to spindle poles
in cells. We propose that compliant linkages among microtubules provide a mechan-
ical architecture capable of accommodating microtubule movements and distributing
xiii

force among microtubules without loss of pole integrity—a mechanical paradigm that
may be important throughout the spindle.
Microtubule assembly and disassembly are vital for many fundamental cellular
processes. Our current understanding of microtubule assembly kinetics is based on
a one-dimensional assembly model, which assumes identical energetics for subunits
exchanging at the tip. In this model, the subunit disassociation rate from a micro-
tubule tip is independent of free subunit concentration. Using total-internal-reflection
fluorescence (TIRF) microscopy and an optical tweezers assay to measure in vitro mi-
crotubule assembly with nanometer resolution, we find that the subunit dissociation
rate from a microtubule tip increases at higher free subunit concentrations. This
is because, as predicted by Hill, there is a shift in microtubule tip structure from
relatively blunt at low free subunit concentrations to relatively tapered at high con-
centrations, which we confirmed experimentally by TIRF microscopy. Because both
the association and the dissociation rates increase with free subunit concentrations,
we find that the kinetics of microtubule assembly are an order of magnitude faster
than currently estimated in the literature.
xiv

CHAPTER I
Introduction
The present work can be divided into chapters on mitosis (II and III) and chapters
on microtubule polymerization (IV to VI). The present chapter provides background
and motivation with a brief introduction to the cytoskeleton, microtubules, and mi-
tosis, but with most emphasis on microtubules due to their relevance to all chapters.
Additional background is left to later chapters (Chapter II for mitosis, Chapter IV
for microtubules). The present chapter concludes with a summary of the contents of
the present work.
1.1 The cytoskeleton
Animal cells may contain three types of cytoskeletal fibers: F-actin (microfila-
ments), intermediate filaments, and microtubules [Lodish et al., 2004]. These fibers
are long, thin, unbranched protein polymers, and they interact with proteins that
affect their polymerization dynamics, cross-link them into various structures (e.g.,
Fig. 1.1), and exert force upon them. Together, these fibers and associated proteins
are a major determinant of cell mechanics and morphology [Howard, 2001].
Cross-linking proteins commonly arrange cytoskeletal fibers into bundles or into
two- or three-dimensional networks with various cellular localizations. For instance,
in the mitotic spindle microtubles are cross-linked into a structure that orchestrates
1

chromosome movement (Chapter II).
Of the three types of cytoskeletal fibers, intermediate filaments are perhaps the
least well understood. They are encoded by numerous genes with complex expres-
sion patterns [reviewed by Herrmann et al., 2007], and they differ markedly in many
respects from F-actin and microtubules. F-actin and microtubules have several sim-
ilarities: they are composed of highly conserved globular subunits; they have a fast-
growing plus end and a slow-growing minus end (they are “polar”); they are nucleoside
triphosphatases; they are often highly dynamic; they generate force by polymeriza-
tion; and they are substrates against which molecular motors exert force [Howard,
2001; Lodish et al., 2004].
1.2 Microtubules
Microtubules are key structural elements in mitosis, and microtubule assembly is
crucial to mitosis and other cellular processes (e.g., see Fig. 1.2). The structures of
these tube-shaped polymers and also of the subunits from which they are composed
are intimately related to their mechanical and polymerization properties and, in turn,
their biological functions.
1.2.1 Microtubule structure and function
Microtubules [Amos, 2004; Amos and Schlieper, 2005; Desai and Mitchison, 1997;
Howard and Hyman, 2003, 2009] form by the assembly into a tube of 8-nm long
αβ-tubulin heterodimers (Fig. 1.3), referred to throughout this thesis as subunits. α
and β tubulins have roughly 50% identical sequences and are roughly 50 kDa each
[Desai and Mitchison, 1997]. Tubulin isoforms in addition to α and β have been
identified, including several relevant to centrioles [Pearson and Winey, 2009], as well
as γ-tubulin, which is implicated in microtubule nucleation by centrosomes.
Microtubule functions include providing structural support to the cell and or-
2

ECM
ER
IFsMTs
+
+
+
Cytoplasm
MFsRibosomeONM protein
INM proteinPlakin-type cross-bridgingmolecule
NesprinIntegrins
LaminsIF-anchoring plaquesActin-anchoring plaques
Nucleus
ONMINM
Chromatin
Interchromatinspace
NPC Adherensjunction
Desmosome
Focal adhesionHemidesmosome
MTOC
Figure 1.1: Interconnection of cytoskeletal fibers. In this hypothetical epithelial cell,F-actin (MFs), microtubules (MTs) and intermediate filaments (IFs) areinterconnected by plakins and are connected to other cells, the extracel-lular matrix (ECM), and outer nuclear membrane (ONM) and inner nu-clear membrane (INM) proteins. Also shown are nuclear pore complexes(NPCs) connected to lamins. Figure from Herrmann et al. [2007].
3

Figure 1.2: F-actin and microtubules in growth cones. At the tip of a growing axon,the growth cone, based on several spatial cues, guides growth. Retrogrademovement of F-actin is believed to be driven by actomyosin-generatedforce in the T (transition) zone (F-actin arcs) and polymerization of actinin the P (peripheral) domain. In the P domain, F-actin bundles and net-works are present in, respectively, filopodia and lamellipodia-like veils.Dynamic microtubules are present in the P domain, usually along F-actinbundles. In the C (central) domain, stable microtubules extend from theaxon shaft, and various other components are present. P-domain micro-tubules are thought to act as “guidance sensors” that affect signallingcomponents, and C-domain microtubules are important to advance thegrowth cone [reviewed by Lowery and Vactor, 2009]. Figure from Loweryand Vactor [2009]
4

A
B
Figure 1.3:Microtubules assemble from heterodimeric αβ-tubulin subunits. (A) Thetubulin heterodimer binds guanine nucleotides. (B) Subunits stacked endto end (α-β-α-β...) constitute a protofilament, and typically 13 protofil-aments constitute a microtubule. The ends of the microtubule with α-and β-tubulins exposed are respectively termed the minus and plus ends.Figure from Lodish et al. [2004].
5

Figure 1.4:Microtubules in an interphase cell. (a) Microtubules in an interphasecell labeled by antibody-based staining. (b) Prototypical microtubuleorganization and microtubule-based intracellular transport. The centro-some (yellow) is the microtubule organizing center (MTOC). It containscentrioles, which are formed from specialized microtubules. It also nucle-ates microtubules with their plus ends oriented toward the cell periphery.Molecular motors, either plus- or minus-directed, transport vescicles. Fig-ure from Howard and Hyman [2003].
ganelles and providing the tracks on which molecular motors walk for intracellular
transport (Fig. 1.4). Microtubules are enriched in neural tissue, and play important
roles in the function of growth cones (Fig. 1.2). Among the best known functions of
microtubles is orchestrating movement of chromosomes in mitotis and meiosis (Chap-
ter II), in which microtubules arranged in a fusiform array grow and shrink in order
to capture chromosomes, arrange them at the metaphase plate, and pull them to
opposite ends of the cell during anaphase. This process is fundamental to life and its
misregulation is implicated in cancer.
The microtubule can be viewed as a motor, as it stores the energy of GTP hydrol-
ysis in its lattice and can use this stored energy to perform work [Grishchuk et al.,
2005]. In addition, two types of molecular motor, dynein and kinesin, use the energy
of ATP hydrolysis to exert force on microtubules. Axonemal dynein brings about the
beating of cilia and flagella, while cytoplasmic dynein, usually if not always bound to
6

dynactin, has many functions. Dynactin is a megadalton multi- (>20) subunit protein
complex, and this composition determines the properties of dynein [Schroer, 2004].
The kinesin superfamily family includes motors that can walk along microtubules for
varying distances, generally toward the plus or minus end, against an opposing load
[Miki et al., 2005]. This superfamily also includes members that can depolymerize
microtubules at their ends after either diffusing or walking along the lattice. Other
microtubule-associated proteins act as polymerases [Howard and Hyman, 2007].
1.2.2 GTP hydrolysis and dynamic instability
α-tubulin contains GTP in its “N-site” where exchange and hydrolysis rates are
taken to be negligible. In contrast, β-tubulin contains GTP or GDP in an exchange-
able site (E-site) in which hydrolysis occurs. Microtubule polymerization occurs by
addition of tubulin subunits containing GTP in the E-site (GTP-tubulin), and upon
incorporation into the microtubule the rate of E-site GTP hydrolysis increases, so
that the lattice contains predominantly GDP-tubulin.
Microtubules exhibit an unusual behavior, termed dynamic instability, in which
they alternate between phases of steady growth and rapid shortening. Transition
from growth to rapid shortening is termed catastrophe, while transition from rapid
shortening to growth is termed rescue. In the textbook explanation for this phe-
nomenon, GTP-tubulin subunits add to the end of the microtubule (Fig. 1.5). Once
incorporated into the microtubule, the GTP contained in the β-tubulin can be hy-
drolyzed to GDP, so that subunits far from the tip are predominantly GDP-tubulin.
The GDP-tubulin lattice is unstable, but the GTP-tubulin at the tip stabilizes the
microtubule. Catastrophe occurs when the cap of GTP-tubulin at the tip is lost.
[Desai and Mitchison, 1997; Lodish et al., 2004; Mitchison and Kirschner, 1984] The
instability of the GDP-tubulin lattice is thought to result from GDP-tubulin prefer-
ing a curved conformation, so that it must be strained while in the lattice. Dynamic
7

Figure 1.5:The GTP cap. In the growth phase (left), the microtubule tip has a sta-bilizing cap of GTP-tubulin (black) while much of the bulk of the latticeis composed of GDP-tubulin (white). Addition of new GTP-tubulin fromsolution maintains this cap, while hydrolysis of GTP by tubulin in thelattice shortens the cap. Loss of the cap triggers a phase transition (catas-trophe) to rapid shortening (right). Figure from the original proposal ofthe GTP cap hypothesis by Mitchison and Kirschner [1984].
instability allows the cell to bring about rapid microtubule length changes as needed.
1.2.3 Growth-phase polymerization
Transitions between growth and shortening phases, as well as the effects of microtubule-
associated proteins, are determined in part by growth-phase microtubule assembly.
The established view is that this assembly is occurs by association of tubulin at a rate
proportional to the free tubulin concentration, with tubulin dissociation occurring at
a constant rate. Association has been estimated to be well below the diffusion lim-
ited rate, while dissociation has been estimated to be much slower than association
in the practical range of tubulin concentrations. As detailed in section 4.3 (p. 61),
there are several reasons to believe this established view should be revised: briefly,
net microtubule growth rate is far more variable than the established view would pre-
8

dict, and this may be explained by association and dissociation occurring far faster
than is currently believed [Howard and Hyman, 2009], but this would require disso-
ciation rate to increase with tubulin concentration; theory predicts that dissociation
rate may, depending on the magnitude of the lateral interaction energy, increase with
tubulin concentration due to increased incidence of tubulin subunits at the tip having
less than two stabilizing lateral neighbors [Hill, 1986]; and cryoelectron microscopy
data indicate that microtubule tips that are tapered, and therefore have more un-
stable subunits, are favored with increasing tubulin concentration [Chrétien et al.,
1995]. Chapter VI tests the hypotheses that subunit exchange at the tip is far faster
than has been appreciated and that the dissociation rate increases with free tubulin
concentration.
1.3 Mitosis
Mitosis is a precisely orchestrated process in which dynamic microtubules capture
chromosomes and the sister chromatids of each chromosome are pulled to opposite
ends of a dividing cell (further reviewed in Chapter II). The forces driving chromo-
some movement are transmitted via microtubules, which are arranged into a structure
termed the mitotic spindle in which microtubule minus ends converge at each of the
two spindle poles. The connection of these minus ends is dynamic; microtubules ex-
hibit poleward flux, which requires that they depolymerize at their minus ends while
maintaining load-bearing connections to the pole. Despite the mechanical nature of
mitosis, we have relatively little quantitative data on the mechanics of mitosis, par-
ticularly on the connection of microtubules to the pole. This motivates Chapter III,
which investigates the mechanical connection of microtubules in an analog of the
mitotic spindle pole.
9

1.4 Summary of dissertation contents
Chapter II briefly reviews mitosis literature, focusing on the mechanics of mitosis.
Chapter III is a study of the mechanics of mitotic spindle pole analogs termed mitotic
asters.
Chapter IV briefly reviews microtubule literature. Chapter V describes an optical-
tweezers based assay developed by Henry T. Schek III for measuring microtubule
length changes with high spatiotemporal resolution. Chapter VI combines the assay
of Chapter V with a light-microscopy assay and simulations to obtain evidence against
the classical model for microtubule growth.
Chapter VII summarizes the conclusions of this thesis and recommends future
work.
10

CHAPTER II
Background: Mitosis
This chapter∗ reviews mitosis with an emphasis on the mechanics of the mitotic
spindle.
2.1 Introduction
Mitosis requires that genetic material be segregated to the two daughter cells with
consistent fidelity. Incorrect segregation may result in cell death or in diseases such
as cancer. Correct segregation is achieved by a precisely orchestrated multi-phase
process.
Mitosis is normally divided into several phases (Figs. 2.1 and 2.2). In prophase,
centrosomes separate and chromosomes begin to condense. In prometaphase, the
nuclear envelope breaks down, the spindle microtubules are present in what was the
nucleus, and the chromosomes have fully condensed. At metaphase, chromosomes
move to the equatorial plane or metaphase plate. At anaphase, the sister chromatids
separate in synchrony to opposite poles (anaphase A) and the distance between the
poles increases (anaphase B). (Upon separation, the sister chromatids are considered
chromosomes.) Telophase is marked by the return of interphase features: spindle∗Portions of this chapter are taken verbatim my qualifying exam written proposal and from
Charlebois et al. [2011].
11

Interphase Prophase Prometaphase Metaphase Anaphase Telophase
Figure 2.1:Fluorescence images of the phases of mitosis. Microtubules (green) andDNA (purple) are stained in a dividing HeLa cell proceeding (left toright) from interphase to prophase, prometaphase, metaphase, anaphase,and telophase. Figure adapted from Yanagida [2009]
+
+
–
– –
Astralmicrotubules
Spindle microtubules
Spindle equator
k-�bre
Chromosome
Kinetochore
CentrosomeProphas Pe rometaphase
Metaphase
Anaphase A
Anaphase B
Telophase
Interphase
Figure 2.2: Schematic of the phases of mitosis. Figure from Walczak et al. [2010]
disassembly, decondensation of chromosomes, and reformation of the nuclear enve-
lope. Cytokinesis is the final division into two daughter cells with separate cytoplasm.
[Lodish et al., 2004] (Final separation of cytoplasm, termed midbody abscission, may
be considered separate from near division of the daughter cells, cytokinesis [Walczak
et al., 2010].)
2.2 The spindle
The central purpose of mitosis is segregation of chromosomes, and the mechanical
apparatus responsible for this segregation is the spindle, a macromolecular ensemble
12

of microtubules, motors, and nonmotor microtubule-associated proteins. Spindle mi-
crotubules extend from the two opposing spindle poles toward the metaphase plate,
forming a highly dynamic structure in which microtubule polymerization dynamics
and motor-generated forces orchestrate the movement of chromosomes. Spindle mi-
crotubules must cause chromosomes to congress at the metaphase plate with pairs
of sister kinetochores attached to opposite poles (amphitelic attachment) in order to
satisfy the spindle assembly checkpoint. In anaphase, spindle microtubules must pull
sister chromatids to opposing poles.
2.2.1 Dynamic phenomena and spindle forces
Spindle forces result in dynamic phenomena including chromosome directional
instability, in which chromosomes move at roughly constant speed in alternating di-
rections with abrupt transitions [Skibbens et al., 1993]; poleward microtubule flux, in
which spindle microtubules depolymerize at their minus ends and translate poleward,
which implies microtubules must be detached from their nucleation sites [Mitchison,
1989]; and kinetochore capture by microtubules.
The spindle can exert force on a chromosome via a kinetochore fiber (k-fiber; a
bundle of microtubules) that connects end-on to a kinetochore. Lateral kinetochore-
microtubule interactions are also implicated in chromosome movement. Further-
more, interaction between chromosome arms and non-kinetochore microtubules causes
polar-ejection forces, which push chromosome arms away from the poles [Walczak
et al., 2010]. Microtubule polymerization and depolymerization forces, as well as
motor-mediated forces (summarized by Loughlin et al. [2008]), are implicated in force
generation.
Spindle poles are mechanical hubs; they can be connected directly or indirectly to
each other, to chromosome arms and kinetochores, and to the cell cortex via micro-
tubules, cross-linkers, and molecular motors [reviews include Cheeseman and Desai,
13

2008; Gatlin and Bloom, 2010; Mogilner and Craig, 2010]. At the cell cortex, cyto-
plasmic dynein is implicated in exerting force on astral microtubules to control spindle
position, which is important for asymmetric division (additional microtubule-cortex
interactions have been demonstrated in yeast) [reviewed by Moore and Cooper, 2010;
Siller and Doe, 2009]. At the chromosome, spindle microtubules can interact with
chromosome arms, generating polar ejection forces, and also connect to a kinetochore,
which is composed of an array of proteins including MAPs and molecular motors
[Cheeseman and Desai, 2008]. Near the metaphase plate, interdigitating antiparallel
microtubules emanating from opposite poles experience forces due to molecular mo-
tors such as kinesin-5 (Eg5), which is implicated in separation of spindle poles and, in
some systems, polward flux [e.g., reviewed by Ferenz et al., 2010; Gatlin and Bloom,
2010]. Molecular motors, including kinesin-5, are also present at poles [Ferenz et al.,
2010]. Minus-directed motors dynein and kinesin-14 (HSET, Ncd) are implicated in
focusing microtubules into a pole [Gatlin and Bloom, 2010].
2.2.2 Centrosomal and acentrosomal spindle formation pathways
Chapter III investigates a model system representing the acentrosomal pathway.
A discussion of these pathways is therefore required.
“The chromosomal spindle fiber which is based on the kinetochore has
naturally been regarded as the spindle element most intimately involved
in chromosomal movement. Hence from the first, it has been the subject
of special attention, and many hypotheses concerning its nature and origin
have been broached, discarded, and advanced anew.
...hypotheses simmer down to three: the chromosomal fibers arise from
the pole, grow toward the chromosome and connect with it; or they arise
from the chromosome and grow toward the pole; or they are formed as the
result of an interaction between the pole and the chromosome.” Schrader
14

[1953]
Explaining formation of the canonical (centrosomal) spindle is the search and
capture model [Kirschner and Mitchison, 1986], in which microtubules nucleated by
the centrosome grow and shrink, exploring space randomly until they encounter and
attach stably to a kinetochore. Centrosomes were thus long believed to be “responsible
for mitotic-spindle assembly” [Wadsworth et al., 2004], while spindle assembly in
acentrosomal animal cells, which involves nucleation of microtubules at chromosomes
and organization of microtubules by molecular motors and cross-linkers [O’Connell
and Khodjakov, 2007], was viewed as an anomaly [Gadde and Heald, 2004].
Early calculations concluded that the search and capture model could predict
physiological chromosome alignment times [Hill, 1985; Holy and Leibler, 1994]. How-
ever, modeling using more realistic geometry and number of chromosomes [Wollman
et al., 2005] determined that the search and capture approach alone does not predict
chromosome congression on timescales as short as those observed experimentally,
particularly in large cells. Acceleration of spindle formation is required, possibly by
the acentrosomal pathway of spindle formation, in which microtubules nucleated at
chromosomes become focused into a spindle. Underscoring the importance of this
pathway, several microtubule cross-linkers and motors that organize and anchor mi-
crotubules during acentrosomal cell division are also important in centrosomal cell
division [Compton, 1998]. Furthermore, elements of acentrosomal spindle assembly
occur in PtK (potoroo) [Khodjakov et al., 2003] and Drosophila S2 [Maiato et al.,
2004] cells, both of which have centrosomes. The acentrosomal pathway presumably
compensated for the absence of centrosomes in a study in which Drosophila larvae
lacking centrosomes developed into morphologically normal adults, though they died
shortly after birth, apparently due not to mitotic errors but to lack of cilia [Basto
et al., 2006]. At minimum, this study casts doubt on the importance of centrosomes
to mitosis. Evidence consistent with the importance of the acentrosomal pathway has
15

been extensively reviewed [e.g., Compton, 1998; Gadde and Heald, 2004; O’Connell
and Khodjakov, 2007; Rieder, 2005; Wadsworth et al., 2004], and centrosomal and
acentrosomal pathways are believed to occur simultaneously in cells with centrosomes.
Of interest, therefore, are acentrosomal spindles and the motors and cross-linkers in-
volved in their formation. Some of these motors and cross-linkers have roles in mul-
tiple mitotic phenomena, such as chromosome movement, spindle bipolarity control,
and microtubule focusing. Experimental investigation of, for instance, spindle-pole-
specific functions of motors and cross-linkers requires a structure analogous to a single
pole.
An acentrosomal spindle pole analog is the focus of Chapter III. The remainder
of this chapter provides a brief review of spindle mechanics and of this spindle pole
analog.
2.3 The mechanics of mitosis
The mechanical nature of mitosis was evident to early cytologists who attempted
to mechanically probe the spindle. That post-metaphase chromosome attachment is
mechanically robust was established by using a fine glass needle to move insect-cell
contents:
“When once the chromosomes have separated in metaphase, no interfer-
ence short of total destruction of the cell will prevent the passage of the
daughter chromosomes to their respective poles.” [Chambers, 1914]
Consistent with this, later attempts to detach a half-bivalent during insect anaphase I,
often “designed to try every conceivable mode of punishment until detachment was
obtained or death intervened,” killed about 70% of cells [Nicklas and Staehly, 1967]
and no early- to mid-anaphase detachment was obtained except with the X chromo-
some. The nature of mechanical connections was explored by attempting to move
16

bivalents (tetrads), for instance, laterally (parallel to the metaphase plate). Me-
chanical attachment fibers could not be observed, and their existence of was inferred
based on the direction-dependent resistance to movement of bivalents. Later micro-
manipulation studies in which the fibers could be observed supported the view that
spindle poles and bivalents were mechanically connected by birefringent chromoso-
mal fibers, which were relatively flexible but relatively inextensible and which buckled
under compression [Begg and Ellis, 1979a,b]. In a more recent investigation of in-
terconnections among spindle microtubules, Gatlin et al. [2010] skewered Xenopus
extract meiotic spindles with glass microneedles, observing that the spindle moved
such that the needle approached and passed through the pole slightly slower than
speeds typically reported for poleward flux. Motion slowed as the needle approached
the pole, and the pole (based on NuMA staining) split to allow the needle to pass
through it, suggesting weak or dynamic cross-links at the pole, though the slowing
may have simply been due to slowing of flux at the pole. Inhibition of dynein, which
is implicated in transport toward poles, caused pole splaying, lengthened the spindle,
and eliminated the slowing of needle-spindle translocation as the needle approached
the pole. The authors also skewered spindles with a pair of needles positioned on
opposite sides of the metaphase plate and pulled the needles toward opposite poles,
finding that spindle lengthening by deformation began only when the needles were
separated by roughly 80% of the spindle length. These studies suggest that chro-
mosomes are attached to poles by microtubules that in much of the spindle are not
laterally connected by mechanically strong cross-links.
The remainder of this section focuses mainly on recent quantitative studies of the
response of mitotic entities to mechanical perturbations.
17

2.3.1 Spindle deformation
The overall distortion of the spindle when subjected to experimentally applied
forces has been investigated. For instance, Dumont and Mitchison [2009] compressed
mitotic Ptk2 cells using an agarose pad, causing widening and elongation of the spin-
dle, with elongation occurring on a longer timescale and resulting from lengthening of
kinetochore fibers. The authors concluded that this elongation was due to slowing of
microtubule depolymerization at the poles with no apparent effect at kinetochores, so
that kinetochore fibers were under tension near kinetochores and under compression
near poles. Itabashi et al. [2009] used a piezo-controlled dual cantilever system to
mechanically perturb Xenopus meiotic spindles. Spindles were compressed between
the cantilevers either parallel to or perpendicular to the pole-pole axis. For small
(less than 10%) perpendicular compression, spindles were viscoelastic, returning to
their original shape over multiple compression cycles. Stiffness was (1.2± 2.2) pN/nm
(mean±s.d.). Small pole-to-pole compression was also viscoelastic, with stiffness
(2.7± 3.3) pN/nm (mean±s.d.). Large (tens of %) perpendicular compression had
relatively complex effects, including spindle elongation and apparent disruption of
spindle architecture. The spindle partially recovered from this disruption over min-
utes. Overall, the spindle appears to be viscoelastic under small deformation, yet it
adapts its architecture in response to large mechanical perturbations.
2.3.2 Chromosome deformation
The bending rigidity of chromosomes due to thermal forces, as well as the Young’s
modulus of chromosomes as measured when stretched lengthwise by a pipette have
been estimated and found to be consistent with a model of the chromosome as a
homogeneous elastic rod [Poirier et al., 2002]. The mechanics of interactions between
microtubules and both chromosome arms and kinetochores have also be investigated.
18

2.3.3 Microtubule-chromosome interactions
The load-bearing mechanical coupling used by kinetochores to harness microtubule
depolymerization forces for poleward movement has been investigated in several stud-
ies. The stall force for anaphase chromosome movement during insect meiosis was
measured to be 4 orders of magnitude more than would be required to overcome
viscous drag [Nicklas, 1983]. In a later study of isolated Chinese hamster ovary
chromosomes [Hunt and McIntosh, 1998], the link between kinetochores and grow-
ing or rapidly-shortening microtubules was maintained without a need for ATP. The
microtubule-kinetochore coupling decreased the frequency of catastrophe and slowed
rapid shortening. Furthermore, when an optical trap held a microtubule connected to
a kinetochore moving away at roughly 2 µm/s, the microtubule-kinetochore connec-
tion supported a tension of 15 pN while allowing microtuble growth. (For reference,
the tension for microtubule-kinetochore attachment in vivo has been estimated to
be in the range 0.4 to 8 pN per microtubule [Powers et al., 2009, references therein].
The stall force measured by Nicklas [1983] has been computed to correspond to 8 to
210 pN per microtubule [Hunt and McIntosh, 1998].) Akiyoshi et al. [2010] examined
the interaction of microtubules and bead-linked purified yeast kinetochore particles
lacking motor proteins and the Aurora B protein kinase. They found that single par-
ticles formed remarkably robust attachments, consistent with in-vivo attachments.
This robustness increased with tension due to a combination of effects. The rate
of microtubule-kinetochore detachment was lower for growing than for shortening
microtubules, and increasing tension promoted growing microtubules by promoting
rescue and markedly suppressing catastrophe. Furthermore, although shortening mi-
crotubules detached at a relatively high rate, this rate decreased with tension. The
authors interpreted their data in terms of a two-state catch-bond model in which a
polymerizing microtubule corresponds to the more strongly-bound state. Rupture
force was consistent with other studies; when the force was increased at 0.25 pN/s,
19

the mean rupture force was 9.1 pN. The microtubule-kinetochore connection is thus
strong yet able to accommodate exchange of tubulin subunits. The molecular basis
of this connection is of interest.
Among molecular components implicated in kinetochore-microtubule connection
are KNL1 (Spc105 in budding yeast) and the Ndc80 complex [reviewed by Cheeseman
and Desai, 2008]. The latter is a rod-shaped heterotetramer with globular domains
at its ends [Wei et al., 2005]. Two components of this complex, Ndc80 and Nuf2,
are oriented in the kinetochore toward microtubules [Cheeseman and Desai, 2008].
The budding-yeast Ndc80 complex has been observed to be longer during metaphase,
when it is presumably under higher tension, than in anaphase [Joglekar et al., 2009].
Powers et al. [2009] found that beads coated with this complex can diffuse on the
microtubule lattice and track the tip of a rapidly shortening microtubule, with on the
order of 10 complexes being sufficient to maintain attachment against an optical-trap
load on the order of 1 pN. For particles of 1 or 2 GFP-labeled complexes not attached
to beads, interactions with microtubules were found to be sensitive to ionic strength,
suggesting the importance of electrostatic interactions. Results were consistent with
diffusion that can be biased by microtubule shortening. Akiyoshi et al. [2010] found
that the binding of kinetochore particles to microtubules was impaired upon mutation
of Ndc80 or Spc105, which is consistent with binding observed for purified Ndc80
and KNL1 [Cheeseman et al., 2006]. Also present at kinetochores are microtubule tip
trackers and depolymerizing kinesins, as well as molecular motors dynein and kinesin-
7 (CENP-E) [roles reviewed by Cheeseman and Desai, 2008; Cheeseman et al., 2006].
Polar-ejection forces, which are mechanical interactions between microtubules and
chromosome arms that push chromosomes away from the nearest pole, have been mea-
sured by optical trapping [Brouhard and Hunt, 2005]. These ATP-dependent unidi-
rectional forces frequently exceeded 1 pN while rarely exceeding 2 pN and produced
peak velocities in the tens of nm/s. Antibody inhibition implicated the chromokinesin
20

Kid (kinesin-10) in this movement and suggested the chromokinesin KIF4 (kinesin-4)
may be less important, which is consistent with other results [Bieling et al., 2010,
references therein].
Although our limited comprehension of spindle mechanics is aided by quantita-
tive and qualitative studies [reviewed by Mogilner and Craig, 2010], we have limited
mechanical data on spindles, particularly with high-resolution quantification of force
and movement, and we know relatively little about the mechanical connection of
microtubules to spindle poles. Spindle poles are sites of convergence of spindle mi-
crotubule minus-ends near centrosomes and are the regions of the spindle with the
highest density of microtubule-crosslinking [Gatlin et al., 2010; Mastronarde et al.,
1993; Nicklas et al., 1982]. It has been proposed that poles are key load-bearing
structures essential for chromosome movement and generation of euploid cell progeny
[Gordon et al., 2001]. Spindle poles are therefore the focus of Chapter III, and a
review of experimental spindle pole analog systems is required.
2.4 Spindle pole analogs
Formation of microtubule asters has been demonstrated with only microtubules
and a motor with a non-motor microtubule-binding domain [Hentrich and Surrey,
2010], yet mitotic aster constituents include microtubule cross-linkers and both plus-
and minus-end directed motors. Based on experiments and simulations with purified
systems of motors and microtubules, factors important to the pattern of microtubules
formed include motor concentration, processivity, and microtubule-end residence time
[Surrey et al., 2001]. Presumably, microtubule cross-linkers could reduce the need for
long microtubule-end residence times in asters with more physiological relevance, such
as those formed with mitotic and meiotic extracts.
Xenopus oocyte extracts [Itabashi et al., 2009; Karsenti and Vernos, 2001] pro-
vide a convenient system for the study of acentrosomal vertebrate spindles. Another
21

spindle-pole analog suitable for experimentation is an acentrosomal astral microtubule
array from cell-free extracts from mitotic HeLa (human) cells [Gaglio et al., 1995].
Such mitotic asters have been characterized biochemically, and perturbing compo-
nents yields various effects on microtubule organization [Chakravarty et al., 2004;
Gaglio et al., 1995, 1996; Mountain et al., 1999]. Furthermore, due to reduced debris,
HeLa extracts are likely better suited to optical trapping experiments than Xenopus
extracts.
Emphasizing the physiological relevance of mitotic HeLa-extract asters are several
experimental results in which perturbing extract components has a similar effect in
cultured cells or HeLa or Xenopus extracts [reviewed by Compton, 1998]. For in-
stance, NuMA (Nuclear protein that associates with the Mitotic Apparatus), which
in PtK1 mitotic spindles forms part of an insoluble matrix distinct from centroso-
mal material [Dionne et al., 1999], is important for the formation of spindle poles.
Immunogold electron microscopy images of HeLa spindle poles and HeLa extract
asters show similar NuMA-containing matrices that appear to anchor microtubule
minus ends and, in extract asters, make portions of microtubules nocodazole resis-
tant [Dionne et al., 1999]. Gaglio et al. [1995] found that perturbing NuMA in monkey
cells resulted in disorganized spindles, while perturbing NuMA in HeLa extracts pre-
vented formation of asters. However, this effect is reversed when kinesin-5 is also
depleted from the extract [Gaglio et al., 1996]. In mitotic (i.e., fertilized) Xeno-
pus egg extracts, NuMA is required for spindle formation but not aster formation
[Merdes et al., 1996]. The effects of perturbing molecular motors have been further
investigated. Perturbing kinesin-5 in extracts or monkey cells causes expansion of the
pole, with microtubules less tightly focused and NuMA occupying a larger volume
(in the case of cultured cells, the shape of the NuMA distribution was also differ-
ent, presumably because the spindle is monopolar) [Gaglio et al., 1996]. Perturbing
dynein disrupted NuMA localization and microtubule focusing in metaphase monkey
22

cells, which have centrosomes, and in mitotic asters [Gaglio et al., 1997]. Perturbing
kinesin-14 impaired formation of acentrosomal asters in cells and HeLa extracts, but
not in cells with centrosomes. Simultaneous inhibition of kinesin-14 and kinesin-5 re-
sulted in aster formation, leading to the conclusion that (plus-directed) kinesin-5 has
an antagonistic relationship with (minus-directed) dynein and kinesin-14 Mountain
et al. [1999]. Taken together, the roles of NuMA, dynein, kinesin-5, and kinesin-14
are generally similar in extract asters and in mitotic cells.
Based on simulations with components important to HeLa extract asters [Chakravarty
et al., 2004], major factors affecting aster formation include the orientation (paral-
lel or antiparallel) of microtubule cross-links by motors and cross-linkers, as well as
the net minus-end directed force (a measure of the balance of minus- and plus-end
directed motors). Factors that affect other aster properties, such as aster mechanics,
may differ from those affecting microtubule organization, and such properties may be
relevant to the ability of spindle poles to sustain forces while allowing tubulin subunit
exchange at microtubule minus ends (this requirement is discussed by Dionne et al.
[1999]).
These asters are therefore assumed to be acentrosomal analogs of mitotic spindle
poles. Chapter III investigates their mechanics.
23

CHAPTER III
Mechanics of mitotic asters
We examine∗ the mechanical properties of mitotic asters that recapitulate the
properties of spindle poles in a mammalian mitotic cell extract. These asters are
composed of microtubules and numerous motor and nonmotor microtubule-associated
proteins, and serve as surrogates for mitotic spindle poles. We have previously exten-
sively characterized the biochemical properties of these microtubule asters and have
shown that they faithfully recapitulate functional aspects of spindle poles. For me-
chanical analysis, we have applied optical trapping techniques to this experimental
system to study mechanical events at the nanometer scale. With these high-resolution
tools, we confirm that asters are steady-state assemblies and show that the linkage
of microtubules to the asters is highly compliant. Finally, we combine this approach
with molecular manipulation to explore the contribution of the homotetrameric motor
Eg5 to the mechanical properties of spindle poles.∗Most of this chapter is published as Charlebois et al. [2011], a shared-first-authorship collabo-
ration described in the acknowledgements (p. iv).
24

3.1 Materials and methods
3.1.1 Cell culture
HeLa cells were maintained in Dulbecco’s modified Eagle’s medium containing
10% bovine growth serum, 50 IU/mL penicillin, and 50 µg/mL streptomycin. Cells
were grown at 37 º C in a humidified incubator with a 5% CO2 atmosphere.
3.1.2 Mitotic aster preparation and assay execution
Mitotic extracts from HeLa cells were prepared according to Gaglio et al. [1995].
HeLa cells were arrested in mitosis by a double block with 2 mM thymidine followed
by nocodazole treatment (10 ng/mL) for 10–12 h. Mitotic cells were collected by
shake-off and incubated for 30 min at 37 ºC with 20 µg/mL cytochalasin B. The
cells were then collected by centrifugation at 1500 rpm and washed twice with cold
PBS containing 20 µg/mL cytochalasin B. Cells were washed one last time in cold
KHMM (78 mM KCl, 50 mM HEPES, 4 mM MgCl2, 1 mM MnCl2, 2 mM EGTA,
1 mM dithiothreitol, pH 7.0) buffer containing 20 µg/mL cytochalasin B, and finally
dounce-homogenized (tight pestle) at a concentration of ~3 × 10⁷ cells/mL in KHMM
buffer containing 20 µg/mL cytochalasin B, 20 µg/mL phenylmethylsulfonyl fluoride,
and 1 µg/mL each of chymostatin, leupeptin, antipain, and pepstatin.
The crude cell extract was then subjected to sedimentation at 20 psi for 20 min at
4º C in an Airfuge (Beckman Coulter, Brea, CA). The supernatant was recovered and
supplemented with 2.5 mM ATP (prepared as Mg2+ salts in KHMM buffer), 20 µM
taxol and 0.075–0.1 mg/mL biotin-tubulin (Cytoskeleton, Denver, CO). For immun-
odepletions, the supernatant recovered was incubated with antibody-coated agarose
beads as described in Gaglio et al. [1996] and depletion confirmed by immunoblot-
ting. Where indicated, monastrol was added at this stage at a final concentration of
100 µM. This supernatant was stored on ice up to a maximum of 4 h. To stimulate
25

assembly of mitotic asters, this supernatant mix was incubated at 30 ºC for 40 min.
After incubation, the extract containing asters was flowed into an experimental
chamber with aluminum foil spacers maintaining a chamber depth of ~70 µm, and then
sealed with VALAP (a 1:1:1 mixture by mass of Vasoline, lanolin, and paraffin, though
we increased the paraffin content by ~8%). Asters were nonspecifically adhered to the
coverglass by centrifuging the chamber at 270g for 3 min. The VALAP was removed
and a solution of KHMM containing 2.5 mM adenine nucleotide, NeutrAvidin-coated
beads (prepared as described in Charlebois et al. [2010], but with final rinse with and
resuspension in KHMM, and with dilution by ~3:100) was flowed in. For monastrol
experiments, 100 µM monastrol was also added to this solution. The chamber was
then resealed.
With the experimental chamber on the microscope stage (our optical tweezers
apparatus is described elsewhere [Brouhard et al., 2003; Schek et al., 2007]), a bead
was trapped and brought to microtubules at the aster periphery. Because of the
limits of light microscopy, it was not possible to determine unequivocally the exact
number of microtubules with which a bead interacted, but the contrast was consistent
with one or a few microtubules, and thicker, higher-contrast bundles were avoided.
After attachment, an antipoleward force (see Figs. A.2-A.3 on pp. 143-144; typically
2–4 pN, sufficient to maintain the microtubule under tension but generally not large
enough to detach the microtubule) was applied using the force-clamp. Experiments
were performed with the top of the bead 1–15 µm below the coverglass, typically
2.5–10µm, with the bead attached to a microtubule or bundle in the plane of focus.
3.1.3 Tracking movements of microtubules in the aster
Bead and aster-focus position were tracked using LabView Vision software (Na-
tional Instruments, Austin, TX). A rectangular region of interest surrounding the
bead or aster focus was chosen and the Vision VI “IMAQ Match Pattern 2” was used
26

to find this pattern in all images for the trace in question. For a given trace, this
was repeated with patterns taken from different time points, generally 20–80 s apart,
and these resulting image-based traces were averaged. Bead and aster-focus positions
were then subtracted, yielding changes in bead position relative to the aster focus at
~5 or ~28 Hz. The ~28-Hz traces of aster movement were filtered with a three-point
median filter. The uncertainty in bead position relative to the aster focus appears,
based on the limited movement in our AMP-PNP data (in which the motors are in
rigor, severely restricting microtubule movement; see Fig. 3.2), to have been small
relative to excursions observed in the presence of ATP.
3.1.4 Algorithm identifying excursions of roughly constant velocity
Position versus time traces were analyzed using an algorithm that performs least-
squares linear fits to successive time intervals of variable length. Initially a line is fit
over a time interval τmin =2 s at the beginning of a trace. The algorithm then extends
this line forward 1 s. If at least 90% of the residuals (data minus fit) are >10 nm, or
if at least 90% of them are <-10 nm, the algorithm rejects the extension and, from
the last point of the current (preextension) interval, begins a new fit. Otherwise, the
algorithm accepts the first 10% of the data points of the extension, and attempts a
new extension.
3.1.5 Computing κa from changes in stiffness experienced by the bead
Before attachment to the aster, the stiffness experienced by the bead is due to the
known trap stiffness, κtrap. Attachment to an aster increases stiffness to κtrap + κa,
where κa is the effective stiffness experienced by the bead due to its attachment to
the aster. Factors contributing to κa are the compliance of the bead-microtubule
connection (bead rocking) and microtubule-aster focus connection. The former was
estimated to be 0.021 pN/nm in a previous study [Schek et al., 2007]. In addition,
27

the sensitivity to conditions under which asters are formed (Fig. 3.3 A), and the
consistency with compliances estimated from cross-link breaking events (Fig. 3.3 B),
indicate that the compliance is dominated by the microtubule-aster focus connections.
By the equipartition theorem, we expect
κtrap = kBT/var(xpre) (3.1)
κa + κtrap = kBT/var(xpost) (3.2)
where kB is Boltzmann’s constant, T is the absolute temperature, xpre and xpost are
the bead position relative to the trap center (xbead in Fig. 3.1 C) before and after
attachment, respectively, and var(x) is the variance of x. From Eqs. (3.1) and (3.2),
we can obtain either of the following:
κa = κtrap
(var (xpre)var (xpost)
− 1)
(3.3)
κa = kBT
(1
var (xpost)− 1var (xpre)
).
(3.4)
Equation (3.3) has the advantage of being independent of the sensitivity constant
used to convert quadrant photodiode voltages to positions, whereas Eq. (3.4) is
independent of the trap stiffness. We used both Eqs. (3.3) and (3.4) to compute each
stiffness and averaged these values for each time interval analyzed, yielding Fig. 3.3
A (see later). Values obtained from Eqs. (3.3) and (3.4) were similar: the correlation
coefficient is r = 0.94, and the mean difference is -0.001 pN/nm, SD 0.01 pN/nm.
The expression var(x) was calculated by computing the variance of successive
0.05-s windows (overlapping, with each window beginning 0.01 s after the preceding
one) and averaging these variances. T was 307 K.
28

3.1.6 Computing κ and γ from exponential fits
For the decay toward mechanical equilibrium of a damped harmonic oscillator in
low Reynolds number conditions, and under constant force (see free body diagram in
Fig. 3.3 B, inset), the position, x, as a function of time, t, is
x (t) = F
κa− fe−κat/γ (3.5)
where κa is as in Fig. 3.3 A, γ is the drag coefficient, F is the applied (force clamp)
trap force, and f ∈ < is a constant determined by the initial conditions. The values κa,
γ, and f are fitting parameters. For curve fitting, the data were translated such that
the initial time and position were zero. Origin software (OriginLab, Northampton,
MA) fit the data to Eq. (3.5) with initial values f = 50 nm, κa = 0.03 pN/nm, and
γ = 0.006 pN/(nm/s). All parameters were restricted to be ≥ 0.
3.2 Results and discussion
To examine directly the mechanics of microtubule linkages at spindle poles we
used cell-free mitotic extracts and optical trapping. Microtubule asters that form
in the cell-free system have been extensively characterized, and have been shown to
recapitulate accurately spindle-pole organization in cells, including: that they require
the biochemical activities of the nonmotor microtubule cross-linking protein NuMA
and minus-end-directed motor activity (cytoplasmic dynein, HSET); that they be-
come less tightly focused after depletion of the plus end-directed motor Eg5; that
they are sensitive to antagonistic functional relationships between motors with oppo-
site directionality; and that they form in a centrosome-independent manner [Gaglio
et al., 1995, 1996, 1997; Mountain et al., 1999].
Microtubule asters assembled under these conditions lack microtubule polymeriza-
tion dynamics and poleward microtubule flux at spindle poles. Although the absence
29

of flux is less physiologic, this worked to our advantage in determining the mechanics
of microtubule linkages within asters without the confounding influence of micro-
tubule depolymerization at the poles.
For optical trapping, microtubules in the asters were assembled with extract tubu-
lin supplemented with biotinylated tubulin, and the asters were gently centrifuged into
contact with a flow-chamber coverglass (Fig. 3.1 A). An optical trap moved a 0.57-µm
NeutrAvidin-coated bead into contact with the microtubules at a point far from the
aster focus to minimize the number of microtubule attachments (Fig. 3.1, A and B).
A force-clamp maintained a constant antipoleward force by frequently (10 Hz) reposi-
tioning the trap (black trace in Fig. 3.1 C) to maintain the displacement of the bead,
xbead, relative the to the trap center (Fig. 3.1 D). The positions of the aster focus and
bead were tracked using video-enhanced differential interference contrast microscopy
(green and cyan traces, respectively, in Fig. 3.1 C). Changes in bead position relative
to the aster focus (red trace in Fig. 3.1 C) corresponded to microtubule movement
toward or away from the aster focus.
3.2.1 Motor-driven microtubule movement
In the presence of ATP, aster microtubules made excursions in both the poleward
and antipoleward directions relative to the aster focus (Fig. 3.1C, Fig. 3.2A, and
Figs. A.2-A.3 on pp. 143-144). Thus, motors at the pole were capable of generating
bidirectional movements but these could have been biased poleward in the presence
of dynamic microtubules, resulting in or accommodating poleward flux. Excursions
corresponded to intervals of roughly constant velocity, identified by an algorithm
(see Materials and Methods) that fit an initial window of the position versus time
data trace, and projected this fit forward in time until the position data became
inconsistent with the constant velocity assumption.
The velocities, vx, and run-distances, ∆x, of these excursions were roughly sym-
30

x
y
B
+–
coverglassA
trappinglaser
xtrap
xbead<0
Ftrap
x
z
C
Biotin-NeutrAvidin linkageBead
MicrotubuleCross-link
D
chan
ge in
x p
ositi
on (n
m)
x bead
(nm
)
-100
0
100
200
300
400
trapbeadasterbead relative to aster
-100
0
0 20 40 60 80 100time (s)
Ant
ipol
ewar
d
Figure 3.1: Experimental design and example of laser trap analysis of spindle poles.(A) Assay schematic: a bead is attached to an aster arm and pulled inthe x direction. (B) Differential interference contrast image of an asterand attached bead. (C) Plot showing position changes versus time. Thetrap trace is a record of trap movement as controlled by the force clamproutine (10 Hz), whereas the other traces are based on tracking beadand aster movement in images (5 or 30 Hz). The red trace shows beadmovement corrected for aster movement. The traces of Fig. 3.2, Fig. 3.3B,Figs. A.2-A.3 (pp. 143-144), and Fig. A.5A (p. 146) are corrected in thesame manner. Positive direction corresponds to antipoleward direction.(D) Plot showing bead position relative to trap center (5 kHz), unfiltered(yellow) and low-pass filtered with a cutoff of 100 Hz (black) or 10 Hz(red) as described in Materials and Methods.
31

chan
ge in
bea
d x
posi
tion
rela
tive
to a
ster
(nm
)
0 100 200 300 4000
0.25
0.5
0.75
1
fract
ion
belo
w |∆
x|0 25 50 75 100
0
0.25
0.5
0.75
1
B
0 45 90 135 1800
0.25
0.5
0.75
1
fract
ion
belo
w |v
x|
0 4 8 12 160
0.25
0.5
0.75
1
C
ATP (Control)AMP-PNP
Eg5-DepletedMonastrol
A
0
200
400
600
-200
0
0
200
400
600
800
-200
0
200
0
200
0 50 100 150-100
0100
time (s)
Monastrol
AMP-PNP
ATP (Control)
ATP (Control)
AMP-PNP
Monastrol
|∆x| (nm)excursion distance,
|vx| (nm/s)excursion speed,
Ant
ipol
ewar
d
Figure 3.2:Run-lengths and velocities of microtubules anchored to spindle poles. (A)Example traces of changes in bead x position relative to the aster versustime (these correspond to the red trace of Fig. 3.1 C). Each trace is froma different aster. (B and C) Analysis of corrected bead movements versustime using an algorithm that fits straight lines to successive time intervalsof variable length. Graphs are cumulative distribution function of (B)absolute run distance, |∆x|, and (C) time-weighted absolute speed, |vx|.(Insets) The same plots zoomed to lower values and with mean absolutevalues marked with a circle. See also Figs. A.2-A.4 on pp. 143-145.
32

metrically distributed between poleward and antipoleward directions (Fig. A.4 on
p. 145), although vx displayed a modest antipoleward bias (roughly 2 nm/s) under
the applied forces (typically 2–4 pN; see Table 3.1). Mean vx near zero is expected for
all conditions that produce asters, as consistent net movement of all microtubules in
one direction would result in aster disassembly. Therefore, the range of magnitudes
of ∆x and of vx between experimental conditions was compared by their variances
(Table 3.2) and the cumulative distributions of |∆x|and |vx|(Fig. 3.2, B and C).
Excursions were highly variable, with some movements persisting for hundreds of
nanometers in either direction (Fig. 3.2B and Fig. A.5), consistent with molecular
motors taking tens of steps [Toba et al., 2006; Valentine et al., 2006]. The absolute
velocity of an excursion, |vx|, was often tens of nm/s (Fig. 3.2C and Figs. A.2-A.4 on
pp. 143-145). Microtubules sometimes moved hundreds of nm antipoleward before
pausing, and could then resume antipoleward excursions or reverse to move poleward
(Figs. A.2-A.3). Because the optical trap applied tension in these experiments, an-
tipoleward movements may have been due to decreased poleward forces, due to disen-
gaging motors for example, rather than active pushing forces. The nonhydrolyzable
ATP analog AMP-PNP suppressed poleward and antipoleward microtubule excur-
sions (Fig. 3.2A and A.2), and this was reflected by significantly lower (p < 0.05)
variances for vx and ∆x (Table 3.2). Furthermore, the cumulative distributions of
|∆x|and |vx|were shifted toward lower values (Fig. 3.2B and C). These data indicate
that bidirectional motion of microtubules in the asters required active microtubule
motors.
However, it could be argued that the antipoleward movements observed in the
presence of ATP would not occur in the absence of the tension applied by the optical
trap. We provide two counterarguments. First, the applied tension (Figs. A.2-A.3)
was usually modest relative to that expected to be developed by a few motors. Second,
for motors to cause exclusively poleward movement, plus-directed motors would have
33

Table3.1:
Summarystatist
icsfor
∆xan
dv x
n∆t(s)〈vx〉(nm/s)
var(v x
)(nm
2 /s2)
p〈∆x〉(nm)
var(
∆x
)(nm
2 )p
ATP
405
2045
2.2±
0.8
234
0.0037
11±
33160
7.3×
10−
5
AMP-
PNP
27838
0.2±
0.4
5.26
0.61
7±
5597
0.14
Eg5-depletion
423
2590
1.9±
0.9
334
0.037
11±
45220
0.0013
Mon
astrol
161
976
0.8±
0.7
71.1
0.22
5±
31340
0.088
Summaryof
analysis
ofv x
and
∆x.nis
thenu
mbe
rof
segm
ents
identifi
ed,∆
tis
thetotaltim
ean
alyzed.v x
istim
e-we
ighted
while
∆xis
not.
pis
fora2-tailedt-t
estwith
thenu
llhy
pothesis
that
themeanis
zero.Seealso
Fig.
3.2.
34

Table3.2:
Statist
ical
compa
rison
of∆xan
dv x
distrib
utions.
Difference
inv x
distrib
ution
Difference
in∆xdistrib
ution
t-test
(mean)
Bartlett
test
(variance)
t-test
(mean)
Bartlett
test
(variance)
AMP-
PNP
vs.
control
0.024
00.46
3.7×
10−
6
AMP-
PNP
vs.
mon
astrol
0.46
1.2×
10−
100.7
0.015
AMP-
PNP
vs.
Eg5-depleted
0.1
00.47
1.3×
10−
8
control
vs.
mon
astrol
0.17
4.4×
10−
160.12
1.3×
10−
9
control
vs.
Eg5-depleted
0.76
0.00031
0.96
4.1×
10−
7
mon
astrol
vs.
Eg5-depleted
0.35
00.15
0p-values
fortan
dBa
rtlett
testscompa
ringmeans
andvaria
nces
(forv x,tests
were
perfo
rmed
usingtim
ewe
ighted
values
ofmeanan
dvaria
nce).Seealso
Fig.
3.2.
35

to be linked to a static matrix whereas minus-directed motors would have to have their
tails attached to moving microtubules while their heads walked on relatively static
microtubules. This second argument does not exclude the possibility that there would
be no motion in the absence of the optical-trap tension, but a perfectly static aster
seems unlikely.
We also note that plus- and minus-end directed motors have been shown to partic-
ipate in aster organization in this system [Gaglio et al., 1996, 1997; Mountain et al.,
1999], and bidirectional movements have been observed in vitro in microtubule gliding
assays where motors with opposite directionality act competitively [Tao et al., 2006],
although we detected movement with much higher spatiotemporal resolution and the
excursions we observed tended to be much shorter. The ATP-dependent microtubule
movements suggest that motors play an important role maintaining the mechanical
properties of the aster.
The effect of perturbing Eg5 is discussed on p. 41.
3.2.2 Compliance obtained from thermal motion of the bead
Microtubule movements will strain linkages that hold microtubules to the aster
focus. Our assay measures the overall stiffness of the microtubule plus its anchoring
by an unknown number of cross-links to the aster. Although the attached bead was
located microns from the aster focus, the longitudinal microtubule compliance was
negligible compared with the compliances we observed [Felgner et al., 1996; Gittes
et al., 1993; Mickey and Howard, 1995; Tuszynski et al., 2005; Venier et al., 1994], so
the observed compliance was dominated by compliance at the aster. We measured
the stiffness, κa, of the bead-microtubule-aster linkages (Fig. 3.3 A, inset) by com-
paring the thermal fluctuations of the bead before and after attachment to an aster
microtubule and applying the equipartition theorem.
Under control (ATP) conditions,we obtained κa =0.0255±0.005 pN/nm (mean
36

AM
P-P
NP
(n=5
)
ATP
(Con
trol)
(n=2
5)
Mon
astro
l(n
=7)
Eg5
-Dep
lete
d(n
=15)
A
aκ(p
N/n
m) trapκaκ
0.00
0.02
0.04
0.06
0.08
0 1 2 3 4
0
10
20
30
40
50
60
time (s)
chan
ge in
bea
d x
posi
tion
rela
tive
to a
ster
(nm
)
B
Ftrapvγ−
xaκ−
Ant
ipol
ewar
d
Figure 3.3:Analysis of stiffness of microtubule linkage to spindle poles. (A) Valuesobtained for κa under each experimental condition; for a linkage of stiff-ness κa, an applied load F will move the bead a distance F/κa. Error barsindicate standard error. The value n represents the number of traces un-der different experimental conditions including different forces or asters;between three and eight asters were examined for stiffness for each bio-chemical condition (see Figs. A.2-A.3 on pp. 143-144). (Inset) Physicalmodel from which Eqs. 3.3 and 3.4 are derived: the bead is subject toforces from the trap stiffness, κtrap, and the unknown stiffness, κa. (B) Fitof Eq. (3.5) to the first exponential jump. The spring force is −κax andthe drag force −γvx where κa is the stiffness and γ is the drag coefficient.Position data are the corrected bead x positions (see red trace of Fig. 3.1C, and note that aster moved little during this time, as evident in Fig.A.5B and C on p. 146). (Red circles) Data included in the fit. (Graydiamonds) Data points outside this range. (Magenta line) The fit. Theposition and time axes are shifted so the data involved in the fit begin atzero. (Inset) Physical model from which Eq. (3.5) is derived: the beadand aster arm are subject to the force applied by the optical trap in ad-dition to forces equivalent to a Hookean spring of stiffness κ and a forceproportional to velocity (dashpot) with drag coefficient γ.
37

±SE; Fig. 3.3 A). This is an order of magnitude less than the rabbit acto-myosin
cross-bridge [Veigel et al., 1998] or of several domains of the structural protein titin
[Rief et al., 1997]; and it is two orders of magnitude less than a frog extract spindle
under gentle compression perpendicular to the metaphase plate (in which there are
presumably far more entities acting in parallel against the applied force) [Itabashi
et al., 2009]. However, it is an order of magnitude more than chromosomes [Poirier
et al., 2002]. When ATP was replaced by AMP-PNP, the stiffness of the linkage
increased (Fig. 3.3 A), probably due to more sustained binding of motors to micro-
tubules.
3.2.3 Compliance and drag obtained from exponential fits
In the presence of AMP-PNP, we observed several abrupt jumps in the position
of the bead relative to the aster focus (Fig. 3.2A and Fig. A.5 on p. 146) indicating
failures in the mechanical structure. The force applied by our laser trap under these
conditions was extremely unlikely to break the NeutrAvidin-biotin linkage between
the bead and attached microtubule on the timescale of the experiment [Yuan et al.,
2000]. Thus, these abrupt jumps most likely represented rupture of a load-bearing
cross-link between the microtubule and the aster. These failure events provided a
complementary approach to determine the stiffness of the linkage of microtubules to
the aster. After each failure, the microtubule relaxed in the direction of the trap
force to a new position, which was stable because motor activity was suppressed
by AMPPNP. The exponential form of the jumps was consistent with decay toward
mechanical equilibrium of an overdamped harmonic oscillator (i.e., Hookean spring
with linear drag) under a constant force, F (Fig. 3.3 B, inset), where the low Reynolds
number allows mass to be neglected (Eq. (3.5)).
Exponential fits (Fig. 3.3B and Fig. A.5) yielded κa =0.0587±0.0005 pN/nm for
the first jump and 0.0339±0.0003 pN/nm for the second, consistent with estimates
38

from analysis of thermal motion (Fig. 3.3A) for the same aster. These exponential
jumps, and the decrease in stiffness by roughly half after the first jump, are most
directly explained by the loss of microtubule cross-links. As the trace shows no signs
of breaks occurring in rapid succession, and because it is unlikely that several cross-
links would break at the beginning of the jump simultaneously (within roughly 0.1 s
of each other), it is reasonable to expect that each event corresponded to failure of a
single microtubule cross-link. Assuming the cross-links had similar compliances, the
43% stiffness decrease after the second break suggests the breaking cross-link was 1
among 2–3, in which case there were 3–4 cross-links at the beginning of the trace.
Although these estimates are from fortuitous observations of crosslink breaking, the
consistency of the stiffness with other asters (Fig. 3.3 B) suggests they are not
atypical.
Exponential fits to each jump (Fig. 3.3B and Fig. A.5) yielded drag coefficients,
γ, of 10.4±0.9 pNs/µm for the first jump and 7.4±0.5 pNs/µm for the second. These
values are three orders-of-magnitude larger than expected from viscous drag on the
microtubule and bead (see Discussion A in the Supporting Material), presumably
because relaxation also involved shifting of microtubules attached to the microtubule
under consideration, with possible contributions from friction between moving com-
ponents of the aster. High drag is likely to be physiologically important, as it will slow
the movement of a microtubule that detaches under tension, and thereby allow more
time for motors and cross-linkers to make new attachments. However, the drag was
not so high as to overload mitotic motors; at typical ~10 nm/s speeds of microtubule
flux [Cameron et al., 2006], the drag is well below the pN forces that are commonly
developed by individual motor proteins.
An additional fit was performed on segments between the jumps (Fig. A.6 on
p. 147), obtaining a stiffness and drag coefficient for non-breaking elements in series
with those that broke. The stiffness was κa = 0.062 ± 0.002 pN/nm. The drag
39

coefficient was large at γ = 3.5 ± 0.3 pN s/nm. This suggests element(s) with a
stiffness similar to others in the system but with severe damping of their speed.
However, there is an important caveat. In short, it is difficult to assess whether the
change in position observed over the long timescale of these segments is due to poor
image-based tracking of the aster position resulting from changes in aster appearance
over time. Tracking aster position over time and distance scales of the large, fast
jumps (or excursions in the ATP traces) seems to be reliable considering that the
jumps are large relative to any long-term movement in the AMPPNP traces. In
contrast, we do not have such control data against which to compare the segments of
Fig. A.6. Further data with this aster at higher force has similar net movement, and
we do not know whether this is due to further change in bead position relative to the
aster or due to poor aster tracking.
3.2.3.1 Expected drag on microtubule and bead
The viscous drag coefficient, γv, depends on the viscosity, η, and also on the size
and shape of the bead and objects attached to it. Below, we give the relationship
between expected viscous drag, γv, and viscosity, η, and, from this and the observed
γ, we obtain the apparent ‘viscosity.’ We find it to be much larger than that of the
buffer, suggesting that viscous forces on the bead and the microtubule contributed
little to the observed drag, γ.
The viscous drag coefficient for a bead and microtubule is given by [Happel and
Brenner, 1983; Howard, 2001; Tirado and Garciadelatorre, 1979]
γv = 2πη[3a(
1 + 916a
h
)+ L
ln (L/2r)− 0.20
](3.6)
where a = 285 nm is the radius of the bead, h is the distance from the bead
center to the coverglass, and L and r are, respectively, the length and radius of the
40

microtubule. For the experiment in question, h =6 µm. From the image of the aster
and bead, we likely had 5.3 µm≤ L ≤7.5 µm. We assume the microtubule or bun-
dle radius was 14 nm≤ r ≤28 nm. Setting γv in equation (3.6) equal to the values
of γ obtained from the fit (section 3.2.3 above; not the additional fit to segments
between jumps), our data indicate that the apparent ‘viscosity’ experienced by the
bead and microtubule was 0.46 pNs/µm2 ≤ η ≤0.87 pNs/µm2, which is 3 orders of
magnitude greater than the viscosity of water (at 34°C, η = 7.34× 10⁴ pN s/µm2).
Because most of the surface of the bead-arm complex was in contact with buffer, the
high drag coefficient must have been caused by interactions with the portion of the
microtubule/bundle in the vicinity of the aster focus, where the effective drag must
have been much higher. These interactions may have been relatively stable connec-
tions to numerous entities near the focus that moved when the bead and microtubule
moved, in which case these would be equivalent to hundreds of beads and short (~5-
µm) microtubules. Alternatively, these interactions may have been transient, similar
to those observed for kinesin-8 [Bormuth et al., 2009].
3.2.4 Effect of perturbing kinesin-5 (Eg5) by depletion or monastrol treat-
ment
The kinesin-5 motor Eg5, in addition to sliding antiparallel microtubules to pro-
mote spindle bipolarity, localizes strongly to spindle poles [Sawin et al., 1992] where
it is presumed to cross-link microtubules. It is required for tight focusing of mi-
crotubules into asters in this cell-free system and in cells and other model systems
[Gaglio et al., 1996; Sawin et al., 1992]. To examine the mechanical role of Eg5 within
these microtubule asters, we inhibited its activity by immunodepletion or with the
small molecule inhibitor monastrol. With either perturbation, there was no detectable
change in mean microtubule excursion velocity or distance compared to controls (Fig.
3.2, B and C, and Table 3.2). However, the variance of excursion velocity and dis-
41

tance was higher in Eg5-depleted asters (Table 3.2), indicating that the microtubules
exhibited a greater range of speed and displacement, in both directions, compared
to control asters. This was likely a consequence of greater mechanical compliance,
as analysis of thermal motion suggests control asters were stiffer than those formed
under Eg5-depleted conditions (Fig. 3.3A, Table 3.3).
Table 3.3: p-values for comparison of κa
control monastrol Eg5-depletedAMP-PNP 0.059 0.029 0.020
control 0.12 0.0032monastrol 0.12
p-values are for a 2-tailed t-test without assumption of equal variance. κa from eachsubtrace was weighted by the length of the subtrace. See also Fig. 3.3A.
The stiffness of monastrol-treated asters was less than controls and more than Eg5-
depleted asters, though not reaching statistical significance from either (Fig. 3.3A,
Table 3.3). This is consistent with the observation that monastrol has little effect on
Eg5’s binding affinity to microtubules [Cochran et al., 2005; Kwok et al., 2006], and
suggests that cross-linking by Eg5 tetramers in the presence of monastrol contributes
to aster stiffness even though motor activity is inhibited. Although monastrol does
not affect Eg5’s binding affinity, it still inhibits Eg5’s catalytic activity, and thus may
still impact the compliance of the asters. This is in agreement with our observation
that the compliance of asters is slightly increased in the presence of monastrol, reflect-
ing the contribution of Eg5’s motor activity to the aster core’s compliance. Taken
together, our Eg5-perturbation results suggest that Eg5 imparts stiffness to poles
where it cross-links parallel microtubules, which is consistent with the report that
bipolar spindles formed in frog egg extracts lacking Eg5 are fragile [Mitchison et al.,
2005].
42

3.2.5 The spindle pole cross-linked by compliant elements
Microtubules in the mitotic spindle converge as they approach the centrosomes
at the spindle poles. Pole-focusing components such as motor (cytoplasmic dynein,
Eg5, and HSET) and nonmotor (NuMA) proteins crosslink and focus microtubule
minus-ends at the poles. Given their proximity, centrosomes may contribute to the
mechanical properties of the spindle pole. The studies described here examine the
mechanical properties of the acentrosomal asters assembled from cell-free extracts,
and are thus most relevant for understanding the role of these cross-linkers. We found
that connections between microtubules and the aster focus were very compliant. The
source of this compliance is at least partially motor-based as inhibition of motor
activity by AMP-PNP reduces the compliance. Nonmotor proteins such as NuMA
that can oligomerize via its large coiled-coil region [Saredi et al., 1996] to provide a
polymeric matrix may also be contributing to compliance.
We propose that this mechanical property is critical to preserve spindle architec-
ture as individual microtubules experience poleward and antipoleward displacements.
Highly compliant microtubule linkages increase the load any individual microtubule
can bear by distributing forces among microtubules and motors, similar to a truss
(Fig. 3.4 A). However, compliance must be low enough that significant force redis-
tribution occurs before a microtubule under tension is pulled out of the pole. This is
consistent with our compliance data showing that ~2 pN would be transmitted after
~80-nm movement, which is small compared to the micron-scale poles. On the other
hand, compliance must not be too low, because rigid cross-links will resist relative
sliding of adjacent microtubules, which is required for processes such as poleward flux
and for changes in the positions of chromosomes (Fig. 3.4, B and C). The compli-
ances we measured would allow a motor to take at least 10 steps before encountering a
load that would induce, for instance, Eg5 detachment [Korneev et al., 2007; Valentine
et al., 2006]. Thus, to support more extended movements as seen during poleward
43

flux, cross-links must periodically rearrange to relieve strain. If the compliance were
lower such rearrangements would have to occur more frequently, thus diminishing
their effectiveness transferring force between microtubules.
A simple model (section A.1 on p. 137) suggests an order-of-magnitude decrease
in compliance would diminish the effectiveness of force transfer to the point where
microtubules would be frequently lost from the pole if there was not a compensating
shift in cross-link dynamics (i.e., an increase in the number of cross-links or in the
rate that the new cross-links form). Conversely, an order-of-magnitude increase in
the compliance would result in severe distortions in the spindle structure that are not
observed in vitro. Furthermore, rigid microtubule crosslinking would fix the angles
between microtubules, so that one motor walking along a microtubule would force
another motor to disengage (Fig. 3.4 C, as opposed to Fig. 3.4 B).
Matos et al. [2009] have recently proposed that poleward flux-associated slipping
of microtubule attachments at kinetochores combined with a visco-elastic coupling
of microtubules to the poles comprises a system that can equilibrate tensions across
chromosome kinetochores, thus coordinating their movement at the onset of anaphase.
Our findings roughly support the model of Matos et al., but suggest that an effect
similar to the drag force mediated in their model by passive dashpot elements in series
with compliant elements may be mediated in part by ATP-hydrolyzing motors.
The implication of force transmission by compliant crosslinks is that a load on
any particular microtubule or microtubule bundle is not borne entirely by the motors
directly interacting with that microtubule (Fig. 3.4 A). A corollary is that loads
are distributed among motors such that the speeds that microtubules move is rela-
tively coordinated even if their pole-distal ends are attached to different structures
and subject to different loads (Fig. 3.4 A). For example, a tension opposing pole-
ward movement of a microtubule will slow not only that microtubule, but also the
poleward movement of its neighbors. Likewise, the maximum force that can be sus-
44
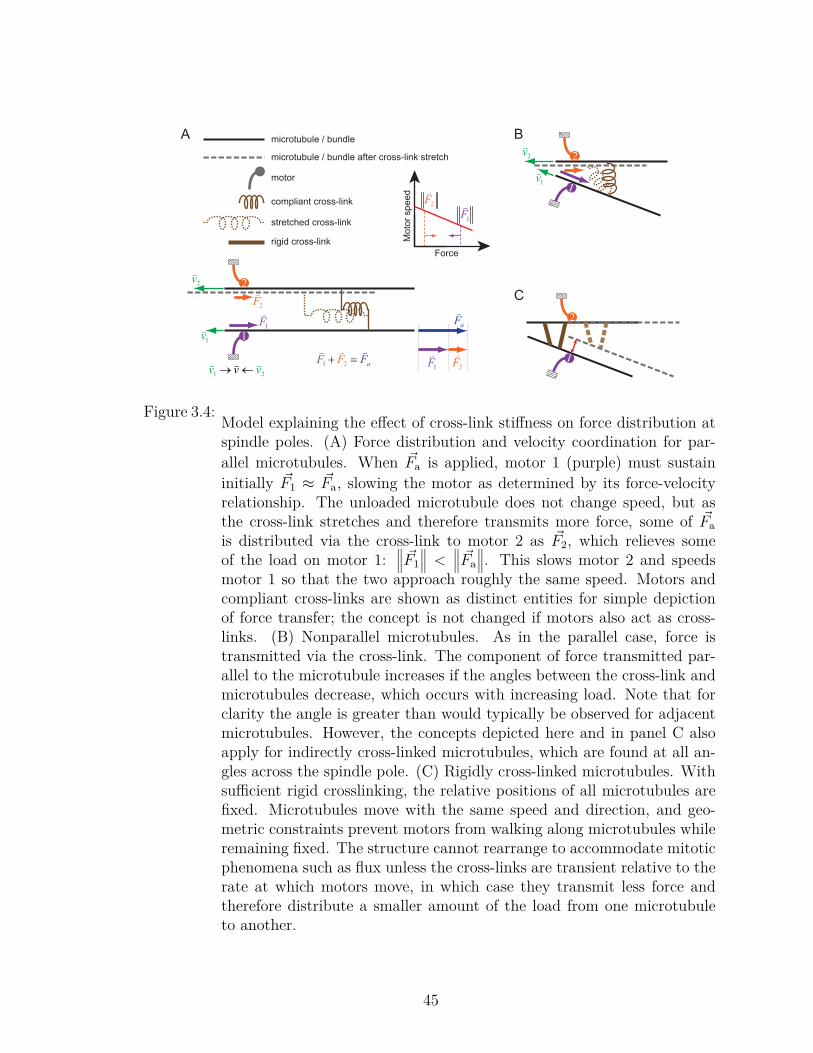
A
1v 1
2F2
F1
2v
Fa
F2
F1
aF
=+ F
2F
12vv
1v ←→
motor
compliant cross-link
stretched cross-link
microtubule / bundle
rigid cross-linkForce
Mot
or s
peed
F
1
F
2
microtubule / bundle after cross-link stretch
C2
1
B
1v22v
1
Figure 3.4: Model explaining the effect of cross-link stiffness on force distribution atspindle poles. (A) Force distribution and velocity coordination for par-allel microtubules. When ~Fa is applied, motor 1 (purple) must sustaininitially ~F1 ≈ ~Fa, slowing the motor as determined by its force-velocityrelationship. The unloaded microtubule does not change speed, but asthe cross-link stretches and therefore transmits more force, some of ~Fais distributed via the cross-link to motor 2 as ~F2, which relieves someof the load on motor 1:
∥∥∥ ~F1∥∥∥ < ∥∥∥ ~Fa
∥∥∥. This slows motor 2 and speedsmotor 1 so that the two approach roughly the same speed. Motors andcompliant cross-links are shown as distinct entities for simple depictionof force transfer; the concept is not changed if motors also act as cross-links. (B) Nonparallel microtubules. As in the parallel case, force istransmitted via the cross-link. The component of force transmitted par-allel to the microtubule increases if the angles between the cross-link andmicrotubules decrease, which occurs with increasing load. Note that forclarity the angle is greater than would typically be observed for adjacentmicrotubules. However, the concepts depicted here and in panel C alsoapply for indirectly cross-linked microtubules, which are found at all an-gles across the spindle pole. (C) Rigidly cross-linked microtubules. Withsufficient rigid crosslinking, the relative positions of all microtubules arefixed. Microtubules move with the same speed and direction, and geo-metric constraints prevent motors from walking along microtubules whileremaining fixed. The structure cannot rearrange to accommodate mitoticphenomena such as flux unless the cross-links are transient relative to therate at which motors move, in which case they transmit less force andtherefore distribute a smaller amount of the load from one microtubuleto another.
45

tained by one microtubule or bundle in a half-spindle is potentially augmented by
motors on neighboring microtubules, with the amount of force transfer diminishing
for microtubules more distantly separated in the spindle.
In this context, earlier estimates of spindle forces should be reconsidered. A max-
imum force of 750 pN (±50%) was estimated by Nicklas [1983] using a flexible glass
microneedle to stall the poleward movement of an individual chromosome in anaphase
in Melanoplus spermatocytes, which is 10,000 times that required to overcome viscous
drag. Microtubule flux is the dominant mechanism for poleward movement of chro-
mosomes during anaphase in Melanoplus spermatocytes [Chen and Zhang, 2004], so
the slowing of chromosomes by an opposing load is most simply explained by slowing
poleward flux. Because the forces on spindle microtubules will be distributed among
the force generators responsible for flux, the numbers obtained by Nicklas [1983] may
reflect an integrated force, perhaps reflecting the force that the half-spindle produces
to move multiple chromosomes.
3.3 Conclusion
These findings describe microtubule attachments to asters in a mammalian mi-
totic extract as compliant and dynamic, with individual microtubules anchored by a
small number of motors and nonmotors to maintain the overall structure while ac-
commodating and driving microtubule movements. Such a structural framework is
consistent with recent work from Gatlin et al. Gatlin et al. [2010] who found that
although poles are densely cross-linked structures, they are compliant enough to let
a spearing microneedle pass through them.
A similar theme is suggested at the spindle midzone in the proposal in Subra-
manian et al. [2010] that the protein PRC1 uses dynamic, compliant cross-linking of
microtubules at the spindle midzone to balance structural rigidity with the flexibility
needed to allow microtubule sliding by kinesin-5 motors. Thus, we envision that this
46

dynamic, compliant mechanical architecture may not be restricted to the polar region
of spindles but is used throughout spindles to distribute forces needed for steady-state
assembly and chromosome movement. We anticipate that future studies of the me-
chanics of spindle components, including poles containing centrosomes, may reveal
dynamic compliant linkages as a central theme within the mitotic spindle, which must
maintain mechanical integrity without impeding pervasive dynamic movements.
For further recommended future work, please see section 7.2.1.
47

CHAPTER IV
Background: Microtubule structure and
polymerization dynamics
This chapter∗ provides background relevant the chapter on variability of micro-
tubule growth rate (Chapter VI). Microtubules assemble from heterodimeric subunits;
the present work takes monomer to mean either α or β-tubulin, discussing polymer-
ization in terms of association and dissociation of subunits.
4.1 Introduction
As introduced in section 1.2, microtubules exhibit dynamic instability, in which
they alternate between phases of slow growth and rapid shortening. According to
the GTP-cap hypothesis, the transition from growth to rapid shortening, termed
catastrophe, is due to the loss of a stabilizing cap of GTP-tubulin subunits (Fig. 1.5,
p. 8). The phases and transitions of dynamic instability have profound biological
significance, as reflected by their extensive regulation in vivo by numerous micro-
tubule associated proteins (MAPs) that are implicated in various diseases [reviewed
by Amos and Schlieper, 2005; Howard and Hyman, 2007]. Rapid microtubule length∗Small portions of this chapter are taken nearly verbatim from Charlebois et al. [2010] and
from a typescript that was accepted for publication and corresponds to Gardner et al. [2011] andChapter VI.
48

changes allow tasks such as cytoskeletal reorganization and mitosis. Underscoring
their importance to mitosis, microtubule polymerization dynamics are the target of
important anticancer drugs [reviewed by Jordan and Wilson, 2004].
The four parameters typically used to specify dynamic instability are growth rate,
v̂g; rapid shortening rate, v̂s; catastrophe frequency, fcat; and rescue frequency, fres.
(However, the probability of catastrophe per unit time is a function of how long the
microtubule has been growing Odde et al. [1995].) Table 4.1 lists results from several
studies of the modulation of dynamic instability. Neither rigorous nor exhaustive, it is
intended only to summarize some of the effects that have been observed. Microtubule
associated proteins (MAPs) may, for example, cap, sever, polymerize, or depolymerize
microtubules, track the growing tip of a microtubule, nucleate microtubule growth,
sequester free tubulin, or some combination thereof, but simple ions can also have a
pronounced effect on microtubule polymerization.
Table 4.1: Examples of modulation of plus-end dynamic instabilitySubstance v̂g v̂s fcat fres reference
Mg2+ ↑ ↑ ⊗ ⊗ O’Brien et al. [1990]Ca2+ ⊗ ↑ ↑ O’Brien et al. [1997]Tau ↑ ↓ ↓ Drechsel et al. [1992]
Doublecortin ⊗ ↓ ↓ Moores et al. [2006]Op18/stathmin pH ↓ ↓ ↑ Howell et al. [1999]
XMAP215 ↑ ↓ Kinoshita et al. [2001]EB1 ↑ ↓ ↑ ↑ Vitre et al. [2008]
Cls1p (CLASP) ↑ ↓ ↓ ↑ Al-Bassam et al. [2010]↑ denotes an increase, ↓ denotes a decrease, and ⊗ indicates authors concludedthere was no effect. This table oversimplifies the effects of the substances itdescribes and is intended only to provide a rough overview. For instance the effectof Op18/stathmin on v̂g is pH-dependent, and the effects of some MAPs differ, forinstance, by organism. In some cases, effects were markedly different at the minusend. Differences in polymerization dynamics may also arise from, for instance,changes in β-tubulin isotype composition and post-translational modifications.
Elucidation of the mechanisms of action of MAPs and microtubules in vivo de-
pends on an understanding of the basic phenomenon of microtubule assembly from
49

purified tubulin in vitro which, in turn, is informed by the structure of αβ-tubulin
and its incorporation into the microtubule lattice.
4.2 Microtubule structure
4.2.1 αβ-tubulin
The structure of tubulin has been obtained from electron crystallography of zinc-
induced taxol-stabilized sheets of antiparallel protofilaments [e.g., Lowe et al., 2001;
Nogales et al., 1998] combined with cryoelectron microscopy images of microtubules
[e.g., Li et al., 2002], and also from crystal structures of αβ-tubulin in complex with
a stathmin-like domain and a drug [e.g., Ravelli et al., 2004].
The folds of α and β tubulins are similar and can be divided into several functional
domains. Nogales et al. [1998] describe the tubulin fold as “a core of two β-sheets
surrounded by α-helices” (a core helix, H7, is between these two sheets) and specify
three functional domains (see also Fig. 4.1): an N-terminal nucleotide-binding domain
containing loops believed to be oriented toward the lumen, an intermediate domain
containing loops believed to mediate some lateral contacts as well as taxol binding,
and a C-terminal domain believed to be involved in inter-monomer interactions and
MAP and motor binding. The nucleotide-binding site is oriented toward the micro-
tubule plus end and is believed to have its nucleotide exchange blocked by the next
plus-proximal α- or β-tubulin. In the case of β-tubulin, GTP hydrolysis is believed to
be enabled by residues of the α-tubulin of the next plus-proximal subunit along the
protofilament [Amos, 2004; Nogales and Wang, 2006]. The final C-terminal residues
(13 in α- and 9 in β-tubulin) are apparently disordered [though reported observable
by Wang and Nogales, 2005] acidic residues that are assumed to project into solution
[Amos, 2004]. This corresponds to part of the “E-hook” of tubulin.
The E-hook of tubulin is a negatively-charged C-terminal region (roughly 10-
50

Figure 4.1:Structure of β-tubulin. (a) Ribbon diagram and (b) domain organizationof β-tubulin. The N-terminal domain binds the guanine nucleotide. Acore helix, H7, is between the two β-sheets. The M-loop, which interactswith taxol when bound, is believed to be involved in lateral interactions.Further description is in the main text. Figure from Amos [2004].
51

Figure 4.2:The E-hook and post-translational modification. The E-hook (red lines),which is rich in glutamate (E) residues, is believed to be disordered and toproject into solution. It has been implicated in motor and microtubule-associated protein (MAP) function and is a site of post-translational mod-ification. For instance, post-translational polyglutamylation of glutamateresidues near the C-termini of α- and β-tubulins by reversible additionof up to to ∼20 glutamyl units (orange ovals marked “E”) is especiallycommon in the microtubules of neurons, centrioles, axonemes, the mitoticspindle and (in cytokinesis) the midbody [reviewed by Janke et al., 2008].Figure from Janke et al. [2008]
25 C-terminal residues rich in Glu and Asp) implicated in the function of motors
and MAPs, including the diffusion of some MAPs on the microtubule lattice [e.g.,
Brouhard et al., 2008; Helenius et al., 2006; Hertzer and Walczak, 2008; Lakämper
and Meyhöfer, 2005]. The C-terminal region of tubulin is a source of variability
among microtubules; its sequence varies across isotypes and it is the site of multiple
post-translational modifications [Westermann and Weber, 2003], a notable exception
being acetylation of several Lys residues [Choudhary et al., 2009]. In addition to
the E-hook, calculations indicate that large portions of the microtubule exterior and
lumen are at negative electrostatic potential, with some positive regions [Baker et al.,
2001].
Lateral (protofilament-protofilament) interactions are crucial to the present work
based on the predictions of a model introduced in section 4.3.1.2 (p. 64). Lateral
interactions are believed to be mediated by several loops. The M loop [Li et al., 2002;
Nogales et al., 1999; Sui and Downing, 2010] of one subunit may interact with the N
52

(H1-S2) loop [Li et al., 2002] in addition to the S2-H3 loop [Sui and Downing, 2010] of
a lateral neighbor. Li et al. [2002] noted that the N loop contains residues that vary
among β-tubulin isotypes, suggesting it might contribute to differences in dynamics
and drug sensitivity among isotypes. Lowe et al. [2001] also noted that residues
involved in longitudinal interactions are better conserved than those involved in lateral
interactions. In microtubules with 11 to 16 protofilaments, lateral interactions appear
to be mediated in part by M loops on the microtubule luminal wall, and there are
opportunities for salt-bridge formation [Sui and Downing, 2010], though one of these
appears to correspond to a salt-bridge that formed only in the presence of taxol in
molecular dynamics simulations [Mitra and Sept, 2008].
The nature of subunit-subunit interactions has been investigated in a computa-
tional study of energetic contributions due to electrostatics and burying of solvent-
accessible surface area [Sept et al., 2003]. Longitudinal translation of protofilaments
relative each other revealted two energy minima. These corresponded to A- and B-
type joins, with the latter more energetically favorable. The two minima could be
explained by solvent-accessible surface area contributions, but the preference for B-
type joins was found to be largely due to electrostatic contributions. Furthermore,
longitudinal interactions were found to be stronger than lateral interactions, which
is consistent with the VanBuren et al. [2002] simulations of subunit exchange kinet-
ics introduced in section 4.3.1.3. It is the lateral and longitudinal bonds that allow
assembly of subunits into the microtubule lattice.
4.2.2 Microtubule lattices
The 13-protofilament microtubule lattice (Figs. 1.3, 4.3) can be described as a
left-handed 3-start helix in which no distinction is made between α and β monomers
[Desai and Mitchison, 1997; Howard, 2001]. The helix pitch is 12 nm. Here, “n-start”
indicates that n starts are required to complete the lattice; following the helical path
53

Figure 4.3:The 13-protofilament microtubule lattice. (a) Tubulin dimers stackedend to end constitute a protofilament. (b) Hypothetical A-type latticein which lateral (protofilament-protofilament) interactions are betweenα- and β-tubulins. In both (b) and (c), the left-hand image shows thefull lattice, while the right-hand image shows one of the 3 helical pathsrequired to complete the lattice, emphasizing where lateral interactionsare α-α, α-β, and β-β. (c) Physiological B-type lattice. Along the seam,protofilaments are said to have “A-type” joins. Figure from Desai andMitchison [1997].
from one protofilament to the next for one rotation around the microtubule will result
in arrival n monomers down the starting protofilament. Along most of this helical
path, stepping from one protofilament to the next involves stepping from an α-tubulin
to another α or from β to β, and the subunits are said to have B-type lateral joins.
However, since following the helical path results in arrival 3 monomers down (1.5
subunits down) the starting protofilament, there must be a pair of protofilaments
between which the join is α-β or vice versa, termed an A-type join (more precisely,
the number of A-type joins must be odd) [Desai and Mitchison, 1997; Howard, 2001].
Microtubules with number of protofilaments, NPF, from 8 to 20 and with several
numbers of starts have been reported [references in Sui and Downing, 2010]. The dis-
tribution of NPF for microtubules formed by spontaneous nucleation in vitro depends
on conditions [e.g., Chrétien and Wade, 1991; Ray et al., 1993] and is typically 13 or
14, while microtubules in vivo usually have 13 [Desai and Mitchison, 1997]. (A no-
54

table exception is in Caenorhabditis elegans, in which 15-protofilament microtubules
are present in touch-receptor neurons and 11-protofilament microtubules are present
in other cells [Chalfie and Thomson, 1982].) Cells control NPF by, for instance, nu-
cleation from centrosomes. Also, the microtubule tip tracker EB1 has been reported
to promote 13-protofilament microtubules in vitro and to reduce transitions between
NPF values along the microtubule [Vitre et al., 2008].
The ability of microtubules to accommodate a range of NPF can be explained in
part by the lattice rotation model [Chrétien and Wade, 1991; Howard, 2001]; protofil-
aments, rather than aligning parallel to the microtubule axis, follow a helical path
around the microtubule, termed a supertwist, with a pitch typically of a few µm (the
motor kinesin will follow this path [Ray et al., 1993]). Because of this supertwist,
the local geometry experienced by a subunit is similar over a range of protofilament
numbers [Howard, 2001], though there appears to be an energetic preference for less
supertwist under standard assembly conditions (80mm PIPES and 1mm each of
EGTA, MgCl2, GTP) [Chrétien and Fuller, 2000].
Increased NPF also increases microtubule radius, requiring flexibility in the in-
teractions between protofilaments. Cryoelectron microscopy results for 11- to 16-
protofilament microtubules (Fig. 4.5) found lateral interactions were similar for this
range, but larger NPF may introduce new lateral contacts [Sui and Downing, 2010].
The multi-protofilament structure of microtubules allows them to grow to substan-
tial lengths; a single-protofilament “microtubule” would tend to sever in the middle
by dissociation of a single (longitudinal) bond, and the association of a free subunit
with another free subunit would be more favorable than with long polymer, resulting
in short microtubules even at subunit concentrations far above the critical concen-
tration [Howard, 2001]. In a multi-protofilament polymer such as a microtubule or
F-actin, each subunit not at an end binds to multiple neighbors; for the polymer to
be severed or to lose subunits other than at its ends would require multiple bonds
55

CBA
11-3 12-3 13-3FED
14-3 15-4 16-4
Figure 4.4: Microtubule lattices with different numbers of protofilaments. Thesemodels are based on cryoelectron microscopy data combined with 2Delectron crystallography data. Npf-n indicates number of protofilamentsand number of starts (e.g., 13-3 indicates a 13-protofilament 3-start he-lix). All lattices other than 13-3 have supertwist. Figure from Sui andDowning [2010].
Figure 4.5: Effect of lattice changes on lateral interactions. End-on cross-sectionsbased on reconstructions from electron microscopy images show that a4-start 16-protofilament microtubule may have additional lateral inter-actions relative to a 3-start 11-protofilament microtubule (both in thepresence of taxol, which is believed to affect lateral contacts). Figurefrom Sui and Downing [2010].
56

to be broken. The expected average length is much longer [Howard, 2001]. (In vivo,
enzymes sever F-actin [dos Remedios et al., 2003] and microtubules [Roll-Mecak and
McNally, 2010].)
Having discussed αβ-tubulin and its arrangement in the microtubule lattice, the
next natural topic leading to polymerization is the microtubule tip. However, the
next section focuses on protofilament and subunit curvature, which are relevant to
observed tip structures and also to the proposal that GDP tubulin in the microtubule
lattice is a strained torsional spring that would be unstable in the lattice were it not
for the GTP cap (section 1.2.2) [reviewed by Nogales and Wang, 2006; Nogales et al.,
2003].
4.2.3 Protofilament and subunit curvature
For rapidly shortening microtubules grown from purified tubulin, pronounced cur-
vature of protofilaments at the tip (ram’s horns) away from the microtubule axis has
been observed [e.g., Mandelkow et al., 1991; Müller-Reichert et al., 1998], though
this depends on conditions [e.g., see also Arnal et al., 2000; Höög et al., 2011]. This
suggests that rapid shortening is correlated with a change in intra-subunit or inter-
subunit angle (or both). For growing microtubules, protofilaments near the tip have
also been observed to curve away from the microtubule axis (section 4.2.4, p. 58).
That GTP-tublin is straighter that GDP-tubulin is suggested by several studies.
For instance, Müller-Reichert et al. [1998] prepared microtubules with GTP (i.e., hav-
ing a predominantly GDP lattice) or the slowly-hydrolyzable GTP analog GMPCPP,
which assumed to keep subunits in a GTP-like state. They depolymerized these mi-
crotubules by cold treatment or addition of Ca2+ and observed them by cryoelectron
microscopy, finding that the GDP microtubles had curved protofilaments at their
ends and that GMPCPP reduced this curvature. A similar atomic force microscopy
study yielded similar curvatures, estimating angle changes per α or β monomer along
57

the protofilament of 8° with GMPCPP and 12° with GDP [Elie-Caille et al., 2007].
In addition, the authors found that taxol initially results in very straight protofila-
ments, but that these become curved on a timescale of many hours. In a cryoelectron
microscopy study of unusual assemblies of tubulin, Wang and Nogales [2005] con-
cluded that GDP tubulin is more curved and much more flexible than GTP tubulin.
Higher flexibility would enable GDP-tubulin to adopt conformations farther from its
preferred conformation, but would presumably reduce the depolymerization force per
unit angular distortion. The view that emerges is that GTP- and GDP-tubulin have
intrinsic curvature and are strained in the microtubule lattice, but GDP-tubulin is
more strained, leading to its destabilization of the lattice.
4.2.4 Structures at the tips of growing microtubules
Three key features of the microtubule tip (Figs. 4.6, 4.9) have implications for
models of microtubule growth (section 4.3). First, the protofilaments may end at
roughly the same axial position (blunt tip) or a group of adjacent protofilaments may
form a sheet extension (tapered tip). Assumptions about tip bluntness are implicit
in models for microtubule growth that provide the basis for calculations of subunit
kinetics (on and off rates; section 4.3.1.2, p. 64). Second, protofilaments at the tip
may coincide with the cylinder defined by the bulk of the microtubule or they may
curve away from the protofilament axis. Curvature is important to models relating
hydrolysis and catastrophe. Third, GTP- and GDP-tubulins may be distributed in
various configurations near the tip. This section focuses on the first two properties,
leaving the third to section 4.3.2 (p. 71).
Studies of microtubules grown from purified tubulin [Chrétien et al., 1995; Man-
delkow et al., 1991; Vitre et al., 2008] or in cell-free Xenopus egg extracts [Arnal
et al., 2000] using cryoelectron microscopy or in Schizosaccharomyces pombe cells us-
ing electron tomography [Höög et al., 2011], usually combined with light microscopy
58

to establish dynamics under the conditions in question, have provided substantial
data on bluntness and curvature. Terminology describing tip structure below is as
described in Fig. 4.6.
Evidence of tapering and curving at the tip is moderately contradictory. Man-
delkow et al. [1991] found that microtubules under growth-phase conditions were
60% blunt, 36% clearly tapered (with 72% of these less than 50 nm), and 4% coiled
(presumably rapidly shortening). The authors did not focus on the curvature of the
tapered ends, but some curvature is apparent in their images, particularly for the
longer tapered ends. Other studies have observed curved tapered ends, some in the
hundreds of nm long [Arnal et al., 2000; Chrétien et al., 1995; Vitre et al., 2008] or, in
contrast, predominantly curved and relatively blunt (“flared”) tips as observed from
multiple angles by tomography [Höög et al., 2011].
Chrétien et al. [1995] found that tapering was more pronounced with increasing
tubulin concentration, with some sheet extensions exceeding 1 µm under some condi-
tions. Sheet extensions tended to curve away from the microtubule axis, and in some
cases two sheets extended from one tip. Development of tapering over time was quan-
tified, with some evidence that tips become more tapered during initial growth and
then begin to become less tapered. This was observed more recently in the control
for a study of the microtubule tip-tracking protein EB1 [Vitre et al., 2008].
Bluntness has been suggested to correlate with catastrophe. For instance, Op18
/ stathmin promoted both catastrophe and blunt ends when added to Xenopus egg
extracts [Arnal et al., 2000]. Results with EB1, though more complicated due to EB1’s
multiple effects, also suggest a correlation [Vitre et al., 2008]. In contrast, simulations
have predicted the opposite [VanBuren et al., 2005], and the above mentioned Höög
et al. [2011] tips were curved, relatively blunt, and growing. The mean length of the
outwardly curved portion was 18 nm, corresponding to roughly two layers of subunits.
Tapered tips (sheets) were rare, not exceeding 3% under any of the conditions, and
59

A B Cj =
1
j = 1
j = 1
3
j = 1
3
αβ αβ
j = 1
j = 1
j = 1
3
j = 1
3
αβ αβ
bluntsmooth
taperedrough
rough
j = 1
j = 1
j = 1
3
j = 1
3
αβ αβ
εon εoff
D
bluntcurved
taperedcurved
E
bluntstraight
taperedstraight
Figure 4.6: Terminology for microtubule tips. The seam is between protofilamentsj = 1 and j = 13. (A) A blunt tip has all protofilaments ending at nearlythe same position. The subunit marked εoff may be said to be in the“cozy corner,” in which case the vacancy marked εon would be the “cozycorner” for a new subunit addition. (B) A tapered tip has protofilamentsof varying length forming a sheet extension. Roughness, which will bediscussed in section 4.3.1.2 (p. 64), is a measure of the number of freelateral interactions exposed, so this tapered tip has higher roughness thanthe blunt, smooth tip. (C) A tip with roughness similar to (B) that mightappear in an experiment to resemble (A). (D) Curved protofilaments atthe tip. (E) Straight protofilaments at the tip.
60

they were, on average, an order of magnitude shorter than those observed by Arnal
et al. [2000] in Xenopus extracts. Blunt straight ends were also rare. The authors
interpreted the predominance of flared tips to indicate that in S. pombe protofilaments
have “little or loose lateral interaction,” though presumably they might also tend to
form, for instance, moderately stable pairs or triplets, ensuring mutual stabilization of
protofilaments, perhaps sometimes with a gap between them as in Fig. 4.6C. The effect
of MAPs at growing tips in cells is presumably complex, so it is difficult to predict
whether microtubules grown from purified tubulin would exhibit similar behavior.
4.3 Microtubule polymerization
For growth-phase microtubule polymerization, the tip is assumed, until catastro-
phe, to be approximately equivalent to polymerization without GTP hydrolysis. This
implies that the presence of GDP-tubulin at or near the tip of any protofilament can
be neglected. The subunit exchange at the tip of a growth-phase microtubule is im-
portant to models of the GTP cap, catastrophe, and rescue, as well as modulation by
MAPs and drugs. This section begins with a discussion of microtubule polymeriza-
tion neglecting hydrolysis, followed by a short discussion of the effects of hydrolysis.
Table 4.2 summarizes symbols used to represent key physical quantities.
4.3.1 Growth-phase polymerization
Polymer subunits such as G-actin or αβ-tubulin under suitable conditions and
in the absence of nucleotide hydrolysis are expected to polymerize in three phases:
spontaneous nucleation, growth, and polymer size redistribution [Oosawa, 1970]. This
section focuses on one end of the polymer in the growth phase, which is most rele-
vant to the present work, beginning with the model typically applied to microtubule
growth.
61

Table 4.2: Nomenclature for microtubule polymerization dynamics with typical units
Variable name Units Meaning
kB pN nm / K Boltzmann’s constantT K absolute temperature
[Tub] µm free tubulin concentrationNPF - number of protofilamentsvg s−1 net growth rate, subunits/timev̂g µmmin−1 net growth rate, distance/timevs s−1 rapid shortening rate, subunits/timev̂s µmmin−1 rapid shortening rate, distance/timefcat min−1 frequency of catastrophefres min−1 frequency of rescuekoff,PF s−1 off rate per protofilament
koff,MT ≡ NPFkoff,PF s−1 off rate per microtubulekon,PF or kon,MT µm−1 s−1 on rate constant per protofilament or
per microtubulek∗on,MT ≡ kon,MT[Tub] s−1 on rate per microtubulek∗on,PF ≡ kon,PF[Tub] s−1 on rate per protofilament
k(i)off,PF s−1 off rate for a subunit with i lateral
neighbors (2D models)∆GLateral < 0 pN nm free energy of lateral interaction per
subunit∆G∗Longitudinal < 0 pN nm free energy of longitudinal interaction
and immobilization per subunitΓ ≡ e−∆GLateral/kBT - for certain assumptions, off rate in-
crease upon loss of a lateral interaction(2D models)
Furthermore, koff,MT is used as the off rate in the 1D model (section 4.3.1.1 on p. 63)and as the mean off rate in 2D models (section 4.3.1.2 on p. 64; Appendix B onp. 148). Free energy under standard conditions is denoted with a superscript zero,and this use is clarified in Appendix B, p. 148.
62

4.3.1.1 Classic Oosawa 1D model
The net growth rate, v̂g, of a microtubule is proportional to the difference between
subunit association and subunit dissociation rates. Oosawa [1970], in a study based on
theory from macromolecular chemistry, assumed that dissociation occurs at a constant
rate koff,MT and that association occurs at a rate k∗on,MT ≡ kon,MT[Tub] where [Tub] is
the concentration of free subunits, yielding
v̂g = a(kon,MT[Tub]− koff,MT) (4.1)
where a = 8 nmNPF
is the mean length increase per subunit added † , giving v̂g dimensions
of length per time. The association of one subunit, Tub, onto the end of a microtubule,
MT, is the reaction
MT + Tubkon,MT−−−−⇀↽−−−−koff,MT
MT,
for which the reaction quotient is [Tub]−1, so that
∆Gsubunit = ∆G0subunit + kBT ln [Tub]−1, (4.2)
where ∆Gsubunit and ∆G0subunit are the free energy change for subunit addition under,
respectively, the conditions in question and standard conditions.
At equilibrium, the free subunit concentration is said to be at the critical concen-
tration, Cc, and there is no net growth: v̂g = 0 and [Tub] = Cc. Also, ∆Gsubunit = 0.
The equilibrium constant is Keq = C−1c = kon,MT/koff,MT = e−∆G0
subunit/kBT . The off
rate can be obtained by rearrangement:
koff,MT = kon,MTe∆G0
subunit/kBT (4.3)†Considering the geometry of the microtubule lattice, the length increase for a given subunit
association will depend on the definition of the microtubule “end” and on the protofilament towhich the subunit associates. Futhermore, different experimental techniques may effectively imposedifferent definitions of the microtubule end [Howard and Hyman, 2009].
63

Figure 4.7:Rate constants as depicted by Hill. Rate constants (Hill used α, β, α1,. . . )for a given subunit depend on the surroundings of that subunit. Consid-ering a zero-start 3-protofilament helix (implicitly wrapped into a tubeso that the leftmost and rightmost protofilaments are in contact), a sub-unit at the tip may have 0, 1, or 2 lateral neighbors with different rateconstants for each case. Figure from Hill [1986].
4.3.1.2 Hill 2D model
The above Oosawa model assumes that all subunit association events are kineti-
cally equivalent to each other and that, similarly, all subunit dissociation events are
kinetically equivalent to each other. However,
“. . . if a polymer has several strands [protofilaments], it will also have
several on and off sites at an end [see Fig. 4.7], with associated fluctuating
rate constants that depend on the instantaneous arrangement of subunits
at the end. . . Such polymers will have average overall on and off rate
constants but these rate constants will, in general, not be constant: they
will depend on free subunit concentration. . . ” Hill [1987]
One might expect that this kinetic equivalence assumption would be most rea-
sonable if lateral interactions were very weak; however, arguing against this is the
expected importance of lateral interactions to formation of long polymers (end of sec-
64

tion 4.2.2). Very weak lateral interactions would result in protofilaments that grow
independently of each other, producing extreme differences in protofilament length
(see discussion of equation B.2, p. 149). The large number of single-protofilament
extensions from the tip would eliminate the lateral interactions that prevent the
microtubule from severing. The assumption suggested by Hill [1987] for effectively-
1-protofilament models is that the tip structure is always configured such that the
practically significant association site is always the same and, similarly, the practically
significant dissociation site is always the same. There may be multiple such sites at
a time, but a hypothetical single-site growth phenomenon is what might be termed
“helical growth” or “cozy-corner growth” at the tip of a 3-start 13-protofilament mi-
crotubule that is always (neglecting the seam) as blunt and smooth as that depicted
in Fig. 4.6A (p. 60): Only the subunit with zero lateral neighbors would have a prac-
tically significant off rate, and only the vacancy next to this subunit would have a
practically significant on rate.
Arguing against effectively-1-protofilament microtubule models is the range of
experimentally observed tip structures (section 4.2.4). Hill [1986], considering differ-
ences in association/dissociation kinetics at different sites, provided a framework for
predicting how tip structure and overall off rate should, in general, depend on [Tub].
Appendix B (p. 148) follows Hill’s framework for one case, adapting the nomenclature
to the present work. Key points of Hill’s work follow:
1. Surface roughness is a key property of a given tip configuration. Hill defined
(equation B.3, p. 150) an index of the surface roughness (molecular roughness)
of the tip (Fig. 4.6, p. 60) as a measure of the number of subunits with exposed
lateral surface area. More exposed area corresponds to more surface free energy
and, therefore, a less energetically favorable tip configuration.
2. The equilibrium probability of one tip configuration relative to another is a
function of the difference in their surface free energies, which is proportional
65

to the difference in their surface roughnesses. Tip configurations with identical
roughness are equally probable. Exposed longitudinal surface also contributes
to free surface energy, but not to differences in free surface energy from one
tip configuration to another. The free energy of a lateral subunit-subunit inter-
action relative to kBT determines the distribution of tip structures of varying
roughness because it relates differences in exposed surface to differences in sur-
face free energy.
3. Increasing [Tub] (a departure above the critical concentration) will increase
surface roughness. This is supported by the Chrétien et al. [1995] observation
of increasing tip taper with increasing with [Tub]. One could think of this
as vaguely related to the law of mass action, in which increasing a reactant
(tubulin) drives the reaction toward energetically unfavorable products (rough
tips). Alternatively, one can consider an initially rough tip at [Tub] near zero:
preferential dissociation of subunits not having lateral neighbors will result in
a blunt, smooth tip.
4. Surface roughness is also related to dissociation rate. A tip with very low rough-
ness will have a relatively low dissociation rate, though the roughness-koff,MT
relationship is not simple. Increasing [Tub] should increase surface roughness
and, in turn, dissociation rate, in contradiction to the assumption of the Oosawa
1D model described in the preceding section.
5. Based on Hill’s analytic and simulation work, neither the overall on rate nor the
overall off rate can be assumed, in general, to be proportional to [Tub]. However,
if subunit association is assumed to be diffusion limited and not, for instance,
inhibited by neighboring protofilaments it may be appropriate to assume that
the on rate is proportional to [Tub] and is independent of the number of lateral
neighbors.
66

As noted in section 4.2.1, tubulin residues involved in longitudinal contacts are
highly conserved while those involved in lateral contacts are less well conserved [Lowe
et al., 2001]. If these sequence differences change the free energy of lateral interac-
tion, the surface roughness of microtubules growing from purified tubulin isoforms
might allow experimental estimation of isoform-specific free energy of lateral inter-
action. However, estimating surface roughness from, for instance, cryoelectron mi-
croscopy/tomography or fluorescence images has not been established. Chapter VI
(see especially equation 6.7 on p. 108 along with equations 6.10 and 6.11) provides a
method for experimental estimation of mean exchange rates, which could potentially
be used with simulations to obtain interaction energies.
A change in longitudinal bond energy would be predicted to affect the dissocia-
tion rate for all subunits at the tip by the same factor, regardless of the number of
neighbors each has.
4.3.1.3 Simulations based on the 2D model
The 2D simulations of VanBuren et al. [2002] are key to the interpretation of
experimental data in Chapter VI. This section briefly describes early simulations by
Chen and Hill before describing those of VanBuren and colleagues.
Hill [1986] computed mean surface roughness as a function of [Tub] and ∆GLateral
. He obtained values analytically or by Monte Carlo simulation for 4 types of lattice.
Surface roughness had little dependence on [Tub] for −∆GLateral/kBT > 4. Consid-
ering the value of ∆GLateral obtained by more recent computational work (Table 4.3
on p. 69, discussed below), one might assume surface roughness has weak dependence
on [Tub]. However, Hill [1986] did not use realistic geometry, focusing on 2- or 3-
protofilament models, as well as a staggered 5-protofilament model. For these, there
might be fewer possible rough configurations similar to Fig. 4.6B or C (p. 60) or to
the taper sometimes observed experimentally (section 4.2.4). Lattice geometry may
67

therefore have caused an underestimation of the importance of considering lateral
interactions.
Chen and Hill [1985] performed Monte Carlo simulations of 5-start 13-protofilament
microtubules in which GTP hydrolysis was incorporated but in which only helical
growth was allowed (no changes in surface roughness). These studies form the ba-
sis for subsequent work by VanBuren et al. using updated geometry and a clever
approach for obtaining longitudinal and lateral interaction energies.
VanBuren et al. [2002], performing 2D simulations of 13-protofilament micro-
tubules rooted in previous work by Hill (and used in section 6.2.4, p. 97), screened
for reasonable values of the free energies of lateral interaction‡ ∆G0Lateral and longitu-
dinal interaction ∆G0∗Longitudinal, where ∗ indicates the term incorporates the entropic
penalty of subunit immobilization. They assumed a constant on rate per protofila-
ment, kon,PF[Tub], and determined the off rate for every subunit in the lattice based
on the total free energy change for dissociation. For subunits not at the tip, they
included in this the free energy of lateral bonds experienced by subunits above it
(toward the tip), and dissociation of a non-tip subunit resulted in dissociation of
subunits above it.
For each variable-length time step of the simulation, the rate kE for each potential
association or dissociation event E was computed, and the actual time tE for the
potential event to occur was determined from tE = −k−1E ln (RE) where 0 < RE < 1
was a uniformly distributed random number. The event with the smallest tE was
selected for each timestep. The authors constrained ∆G0Lateral and ∆G0∗
Longitudinal to
pairings yielding v̂g in agreement with experiment. Varying [Tub] narrowed results
to a single pairing. Table 4.3 lists values obtained assuming two values of kon,PF
(A and B), along with the average of values used in Chapter VI (case C). Fig. 4.8
demonstrates the sensitivity to ∆G0∗Longitudinal and ∆G0
Lateral of k(i)off,PF, where i is the
‡The superscript zero denotes standard conditions, but [Tub]does not affect the free energy oflateral association. Implicitly, ∆G0
Lateral = ∆GLateral.
68

0.01
0.1
1
10
100
1000
Rat
e (s
-1)
A: VanBuren et al. [2002] case 1 B: VanBuren et al. [2002] case 2 C: Present work
koff,PF(0) koff,PF
(2)koff,PF(1)
Figure 4.8:k
(i)off,PF values used in VanBuren simulations. The off rate for a subunit
with i lateral neighbors, k(i)off,PF = kon,PFe
(∆G0∗Longitudinal+i∆G
0Lateral)/kBT , is cal-
culated from values in Table 4.3, in which the cases A, B, and C cor-respond to those of this figure. Kinetics are sensitive to energetics ofinteraction.
number of lateral neighbors. These simulations also took into account the possibility
of a subunit at the seam having a half neighbor. Additional results of this study and
a subsequent study [VanBuren et al., 2005] are relevant to the GTP cap.
Table 4.3: VanBuren model kon,PF, ∆G0Lateral, and ∆G0∗
Longitudinalvalues
Case kon,PF (µm−1 s−1) ∆G0LateralkBT
∆G0∗LongitudinalkBT
k(0)off,PF
k(1)off,PF
= k(1)off,PF
k(2)off,PF
A 2 -3.2 -9.4 2.5× 101
B 4 -5.7 -6.8 3.0× 10²
C 4.5 -4.75 -9.5 1.2× 10²
Cases A and B are those used by VanBuren et al. [2002], who obtained 1D-modelkon,MT estimates of a few µm−1 s−1 from the literature. Values indicated are basedon what appears to be the more likely of two possible interpretations of theirpublication. Case B was also used in Schek et al. [2007]. Case C is the average valueused in Chapter VI in which parameters were obtained by a different method. Seealso Fig. 4.8 and Table 6.2 (p. 103).
4.3.1.4 Experimental observation of growth-phase kinetics
The above Oosawa 1D model yields equation (4.1) (p. 63), which has provided
adequate fits to experimental v̂g vs. [Tub] data, Table 6.1 on p. 91); the model has
69

therefore been assumed to be realistic model of microtubule growth, and the fitting
parameters have yielded estimates of kon,MT and koff,MT.
Studies have generally estimated kon,MT well below the diffusion limit as estimated
by Northrup and Erickson [1992] and discussed, for instance, by Brouhard et al.
[2008]. This low kon,MT can be taken to imply an activation barrier that limits the
fraction of diffusion-based subunit-tip encounters that result in subunit association
[e.g., Northrup and Erickson, 1992]. For instance, from this, to explain v̂g increases
due to the MAP XMAP215, Brouhard et al. [2008] postulated a transition state that
can be stabilized by the MAP XMAP215 in order to reduce the activation barrier.
XMAP215 also catalyzes the reverse reaction.
Several experimental observations suggest the growth-phase koff,MT is appreciable.
Schek et al. [2007] observed large growth-phase shortening events, and such events
can also be found in the Kerssemakers et al. [2006] data. Needleman et al. [2010],
adding exogenous labeled tubulin to meiotic Xenopus extracts at low labeling ratio,
observed fast subunit exchange in the spindle. Because they were observing individual
subunits in a sample of dense microtubules they interpreted their data in terms of
a phenomenological model with multiple possible interpretations [described in Mirny
and Needleman, 2010]. The fit to their data, extrapolated to time intervals perhaps
10 to 50 times shorter than they measured, would predict that many subunits would
have shorter lifetimes than Oosawa-1D-model-based rates would allow.
A key feature of microtubule growth that the Oosawa 1D model fails to pre-
dict is variability in growth rate. To predict growth rate variability, the observation
koff,MT � (kon,MT[Tub]) for the practical range of [Tub] allows the simplifying as-
sumption§ that microtubule growth results mainly from subunit association events,
with little competition from dissociation. Over a given time interval ∆t, the number
of associations λ+ should be Poisson distributed, in which case the mean should equal§(The more general case in which association events and dissociation events are taken into account
is explained in the discussion of Fig. 6.1, p. 94.)
70

the variance:
〈λ+〉 =⟨λ2
+
⟩− 〈λ+〉2 .
From this, one can predict the variance in microtubule growth rate. Experiments
have consistently measured growth rates far more variable than the Oosawa model
would predict.
Several possible causes of the variability in microtubule growth rate have been
eliminated. For instance, experimental error was eliminated as a source, and individ-
ual microtubules exhibited as much variability as the entire population, eliminating
differences among microtubules as the source [Gildersleeve et al., 1992]. Based on a
GMPCPP study, GTP-hydrolysis did not account for v̂g variability [Dye andWilliams,
1996]. A more quantitative assessment relating variability to growth rate confirmed
previous results [Pedigo and Williams, 2002].
Howard and Hyman [2009] suggested that high variability in growth rate may
result from subunit exchange at the tip being more rapid than has been estimated,
with net growth resulting from relatively large association and dissociation rates.
This, combined with the above-described results suggesting a high dissociation rate
or fast exchange, along with the argument of Hill [1986] that dissociation rate should
depend on [Tub], motivates the experiments of Chapter VI. The remainder of this
chapter provides a brief description of the effects of GTP hydrolysis.
4.3.2 Polymerization with nucleotide hydrolysis
Upon incorporation of a GTP-subunit into the lattice, the rate of GTP hydrolysis
by that subunit increases. It is thought that this increase occurs when the next
vacancy of the same protofilament becomes occupied; the nucleotide-binding domain
of β-tubulin is oriented such that the α-tubulin of the next plus-proximal subunit,
when present, is thought to block nucleotide exchange and stimulate hydrolysis [Amos,
2004].
71

The number of GTP subunits the cap must have to stabilize the microtubule is
unclear. For instance, two studies concluded that 13 GMPCPP subunits are necessary
and sufficient to stabilize a GDP lattice [Caplow and Shanks, 1996; Drechsel and
Kirschner, 1994]. Simulations in which most protofilaments started with a 4-GTP-
subunit cap suggested uncapping 4 protofilaments can still yield growth [VanBuren
et al., 2005].
The value to which the hydrolysis rate increases would determine (along with sub-
unit exchange kinetics) cap size (Fig. 4.9). Cap size has been estimated experimentally
to be small [e.g., references in Schek et al., 2007], suggesting GTP hydrolysis occurs
quickly upon subunit incorporation. However, microtubules have been observed to
shorten during the growth phase, sometimes by amounts corresponding to more than
5 layers Schek et al. [2007] (also visible in the data of Kerssemakers et al. [2006])
without undergoing catastrophe, suggesting a finite hydrolysis rate and a distributed
GTP cap. Simulations suggest a hydrolysis rate of roughly 1 s−1 supports growth
consistent with experiment and a mean cap size of 55 subunits (s.d. 12), while very
fast hydrolysis prevents growth due to frequent catastrophe [VanBuren et al., 2002].
The use of a constant catastrophe frequency per unit time is at odds with experi-
mental evidence that the probability of catastrophe was not constant over time, with
catastrophe unlikely in the early stages of growth: Odde et al. [1995] found catastro-
phe tended to occur after 0.5 to 4 minutes (6 µm tubulin, plus end). The amount of
time that a microtubule plus end grew before catastrophe was gamma-distributed,
which can be interpreted to mean that catastrophe is the result of a sequence of first-
order transitions. Data were consistent with 3 such transitions (occurring at about
1.7 per minute) being required for catastrophe. This implies tip properties indicate
how long the microtubule has been growing, and this information travels with the tip
as the microtubule grows. Presumably, explaining this result will require an improved
understanding of the kinetics of subunit exchange and GTP hydrolysis, of the devel-
72
A B
C D
j = 1
j = 1
j = 1
3
j = 1
3
αβ αβ
j = 1
j = 1
j = 1
3
j = 1
3
αβ αβ
j = 1
j = 1
j = 1
3
j = 1
3
αβ αβ
j = 1
j = 1
j = 1
3
j = 1
3
αβ αβ
Figure 4.9:Examples of potential GTP cap distributions. GTP-tubulin (dark) capsthe primarily GDP-tubulin (light) lattice. The seam is between protofil-aments j = 1 and j = 13. The tip is blunt (A,B) or tapered (C,D). Uponsubunit incorporation, the hydrolysis rate increase is (A,C) modest, yield-ing a distributed cap or (B,D) large, yielding a single layer of GTP. Con-sidering (D), if the tapered portion of the tip were allowed to bend awayfrom the microtubule axis, and if this were to reduce the hydrolysis rate(i.e., if straightening stabilized the transition state of the hydrolysis reac-tion [Howard, 2001; Wang et al., 2007]), the subunits marked with dotsmight also contain GTP. This possibility, which is independent of whetherhydrolysis is tightly coupled, is supported by very limited evidence, butit is discussed briefly in Chapter VII
73

opment of tip structure over time, and of the effects of GTP hydrolysis on subunits
and the lattice. Underscoring our limited understanding are several studies that are
difficult to explain with available data.
Co-polymerization of GDP- and GTP-subunits into the microtubule lattice [Val-
iron et al., 2010] appears to slow the rates of growth, v̂g, and rapid shortening, v̂s,
relative to that in the absence of free GDP-subunits. The decrease in v̂s suggests
that GDP-subunits incorporated by co-polymerization differ from those that origi-
nally incorporated as GTP-subunits. Cryoelectron microscopy did not reveal obvious
effects on the lattice from co-polymerization, indicating differences in lattice config-
uration or subunit conformation are relatively subtle. Co-polymerization and transi-
tions between conformations could be speculated to be facilitated by higher flexibility
of GDP-tubulin relative to GTP-tubulin observed in unusual assemblies of tubulin
[Wang and Nogales, 2005], with conformational transitions faster in solution than in
the lattice.
Using antibody-recognition of GTP-subunits in the lattice in cells, Dimitrov et al.
[2008] observed apparent GTP remnants in the predominantly GDP bulk lattice, and
these correlated with rescue events. These remnants may have been the result of
MAPs. The antibody may have been recognizing subunits in which hydrolysis was
inhibited, or it may have been recognizing a conformation normally adopted by GTP
subunits but occasionally adopted by GDP-subunits [Kueh and Mitchison, 2009]. In
the latter case, such a conformation might be similar to that which slowed v̂s in the
Valiron et al. [2010] study.
The next chapter describes a method for observation of microtubule polymeriza-
tion dynamics at high spatiotemporal resolution. This is followed by a results chapter
that supports the above-mentioned 2D model.
74

CHAPTER V
Nanometer-Resolution Microtubule
Polymerization Assays Using Optical Tweezers and
Microfabricated Barriers
This chapter∗ describes one of the experimental techniques used in Chapter VI.
This technique was originally demonstrated by Schek et al. [2007].
Addition and loss of one or a few subunits cannot be observed at the spatiotem-
poral resolution of conventional microscopy, and requires development of approaches
with higher resolution. Here we describe an assay in which one end of a microtubule
(MT) abuts a barrier, and MT length changes are coupled to the movement of an
optically trapped bead, the motion of which is tracked with high resolution. We detail
assay execution, including preparation of the experimental chamber and orientation
of the MT against the barrier. We describe design requirements for the experimental
apparatus and barriers, and preparation of materials including stable, biotinylated
MT seeds from which growth is initiated and NeutrAvidin®-coated beads. Finally,
we discuss advantages of moving the optical trap such that it applies a constant force
(force clamping), detection limits, the importance of high temporal resolution, data
analysis, and potential sources of experimental artifacts.∗This chapter is largely identical to Charlebois et al. [2010].
75

5.1 Introduction
Most direct characterization of microtubule (MT) dynamics, focusing on rates of
growth, shortening, and transitions between growth and shortening, has been by light
microscopy (e.g., [Chrétien et al., 1995; Dye and Williams, 1996; Gildersleeve et al.,
1992; Horio and Hotani, 1986; Jordan et al., 1993; Odde et al., 1996; Walker et al.,
1988]), and this approach continues to yield valuable insights into MT dynamics and
their modulation (e.g., [Bieling et al., 2007; Brouhard et al., 2008; Helenius et al.,
2006; Moores et al., 2006; Pedigo and Williams, 2002]). However, conventional light
microscopy allows observation of MT length changes corresponding to the addition
or loss of hundreds of subunits. At standard video rate, the temporal resolution is, at
best, on the order of the time between subunit additions or losses, though recent data
suggest subunit exchange is much more rapid [Schek et al., 2007]. Rates of growth and
shortening thus represent an average over many addition or loss events. Observing
one or a few such events to unequivocally determine molecular-scale details requires
much higher spatiotemporal resolution.
Nanometer-resolution measurements of events resulting from MT dynamics has
recently been achieved with the development of assays using optical tweezers (e.g.,
[Asbury et al., 2006; Grishchuk et al., 2005; Kerssemakers et al., 2006; Schek et al.,
2007]; reviewed in [Gardner et al., 2008a]), including those in which the tweezers are
used to polymerize an MT into a barrier and track MT length changes [Kerssemakers
et al., 2006; Schek et al., 2007], yielding important new insights into MT polymer-
ization dynamics. For instance, on short (hundreds of ms) timescales, growth rates
were directly measured to be highly variable and, even during periods of net growth,
sometimes negative [Kerssemakers et al., 2006; Schek et al., 2007], with growth-phase
shortening events that correspond to the loss of several layers of subunits [Schek et al.,
2007].
76

5.2 Rationale
To observe MT polymerization with sufficient spatiotemporal resolution to detect
addition or loss of one or a few 8-nm subunits, MT length changes can be measured
by coupling them to the movement of an object whose position can be tracked at
high resolution: in this case, a bead held by optical tweezers. The MT-linked bead
is trapped, and the MT is oriented such that it abuts a suitably designed barrier
(Fig. 5.1A–C). Because MTs are relatively rigid, growth or shortening at the end of
the MT abutting the barrier will result in bead movement, which can be tracked
with high precision using interferometry or video processing. The trap position can
be held fixed [Kerssemakers et al., 2006], or it can be moved such that applied force
is constant [Schek et al., 2007], which is termed force clamping. Here we focus on
our force-clamp assay [Schek et al., 2007], but note advantages of other approaches
[Kerssemakers et al., 2006].
5.3 Methods
The assay entails constructing an experimental chamber, flowing in the experimen-
tal solution including NeutrAvidin®-coated beads coupled to biotinylated MT seeds
(short, stable MTs from which growth can be initiated), trapping an MT-linked bead,
orienting the MT against a barrier (Figs. 5.1, 5.2), and collecting position data. Mi-
crofabrication of barriers on glass coverslips is described elsewhere [Schek and Hunt,
2005], and here we focus on execution of the assay.
A coverglass patterned with barriers microfabricated from LOR and SU-8 (Mi-
croChem, Newton, MA) photoresist layers (Fig. 5.1C, section 5.4 on p. 81) is cleaned
with, in succession, methanol, ethanol, isopropanol, 0.1% sodium dodecyl sulfate
(SDS), and purified water. This is incorporated into an experimental chamber using
two aluminum foil spacers, each with a thin coating of vacuum grease, to position
77

φξ x
z
C: Side view schematic
a
coverglass
slide
D: Side view at low magnification
~70
μm
Laser trap
x
y
SU-8 ed
ge
LOR ed
ge
Bead
A: Top view schematic
B: Top view DIC image
Figure 5.1:Assay overview and experimental geometry. (A) Schematic top view. Themicrotubule (gray) tip is constrained in the y direction by the vertex ofthe LOR photoresist wall, which also blocks movement or growth in thenegative x direction. The microtubule is pushed toward the barrier by thelaser trap via the bead. A force-clamp feedback loop can move the lasertrap along the x-axis such that the force on the bead is constant, in whichcase microtubule length changes result in corresponding trap movement.This image is after Schek et al. [2007], Fig. 1. (B) Differential interferencecontrast image corresponding to (A). An image of the microtubule whenbuckled is superimposed on the image of the microtubule under low load,demonstrating that the microtubule tip remains constrained over a rangeof forces. Reprinted from Schek et al. [2007]. (C) Schematic side view.The laser propagates in the negative z direction. The undercut of theLOR layer (black) allows the SU-8 layer (gray) and coverglass (hatched)to constrain the microtubule tip in the z direction. The focus of thetrapping laser beam (gray triangles), which is slightly above the beadcenter (not shown), is a distance a above the bottom of the SU-8 layer inthe z direction and a distance ξ from the SU-8 edge in the x direction.If ξ approaches
√2a tan (ϕ) (assuming the barrier edge is 45°from the x
axis), the laser will be clipped by the barrier. This image is after Schekand Hunt [2005], Fig. 1. (D) Schematic side view at lower magnification.Beads sink to the bottom of the experimental chamber, which is ∼70 µmbelow the coverglass. Positioning the trap at increasing depth impairstrapping due to spherical aberration and interference of the laser withphotoresist structures.
78

A: Initial bead movement patterns B: Movement of MT to barrier vertex
Figure 5.2:Orienting an MT in the barrier. (A) Initial bead movement patterns. Thebead is moved, for instance, in a square pattern (solid arrows) or alongthe barrier edge and then toward the center in the y direction (dashedarrows) to keep the MT in the focal plane and orient it as shown in (B).(B) Movement of MT into barrier vertex. The MT is maneuvered into theundercut and along the barrier edge toward the vertex. Final orientationshould be similar to that of Fig. 5.1A.
the coverglass a small distance (~70 µm) above the slide. The foil spacers are spaced
about 6mm apart to create an experimental flow chamber with barriers on the upper
surface, and open ends such that fluids may be introduced by capillary action. Thin
spacing must be maintained between the coverglass and slide: because our micro-
scope is upright, we use silica beads (Section 5.4), which sink to the bottom of the
chamber where they must be initially trapped (Fig. 5.1D); however, with increasing
depth, the beam profile of the trapping laser is increasingly impaired by spherical
aberration and by passage through the photoresist structures that form the barriers
above (Fig. 5.1D). This can be partially remedied by patterning barriers at a reduced
surface density or by increasing power of the trapping laser when searching for a bead.
Before introducing the experimental mixture, buffer is flowed into the experimental
chamber, and if any areas exclude liquid this is remedied by gently pressing the
coverglass. Because beads spontaneously aggregate, they are separated by passage
through a 25-G needle several times immediately before the experiment. Following
this shearing, several chamber volumes of the experimental mixture (buffer, beads,
stable MT seeds, free tubulin, MAPs, and MT-binding drugs as applicable) are flowed
79

into the experimental chamber, which must then be sealed to prevent drying and
drying-induced fluid flow during experiments; we use VALAP (a 1:1:1 mixture of
Vasoline, lanolin, and paraffin), which is melted and brushed onto the ends of the
chamber. The chamber is then quickly moved to the microscope, and a single free
bead is trapped. To determine whether one or more MT seeds are attached to a given
trapped bead, the bead is moved laterally relative to the buffer by moving the trap
or microscope stage to bring an MT into the focal plane (the trap is positioned such
that the bead is held in the imaging focal plane).
A bead with an MT seed is moved to the vicinity of a barrier and oriented appro-
priately (Fig. 5.2). The bead can be moved in a pattern (Fig. 5.2A) that keeps the
MT in the focal plane and orients its plus end near an edge of the barrier (Fig. 5.2B),
at which point the bead can be moved such that the MT moves into the undercut
and down the barrier edge to the vertex. The MT tip must be located at the bar-
rier vertex and constrained by the undercut (Fig. 5.1A–C), at which point applying
the force clamp will push the MT against the barrier. From this point onward, trap
movements required to maintain constant force correspond to changes in MT length.
To establish whether the plus end or the minus end is in the barrier, the growth
of both ends is observed by light microscopy. If experimental conditions require a
relatively low growth rate, the investigator may more easily determine MT polarity
by inducing high growth at the end of an experiment by flowing in buffer with a
high tubulin concentration. An alternative approach for establishing MT polarity
is to substitute axonemes for seeds, as MTs preferentially grow from the plus ends
of isolated axonemes. These provide tighter control over protofilament number and
allow the MT to be oriented using a keyhole trap [Kerssemakers et al., 2006].
80

5.4 Materials
All chemicals are obtained from Sigma-Aldrich (St. Louis, MO) unless otherwise
specified.
5.4.1 Buffer
We perform experiments in BRB-80 [80 mm pipes, 1 mmMgCl2, 1 mm ethylene
glycol tetraacetic acid (EGTA), pH 6.8]. Because MT growth [Khan and Luduena,
1991] and flexural rigidity [Mickey and Howard, 1995] are influenced by the oxida-
tion state, we supplement the buffer with oxygen scavengers: 0.12 mg/mL catalase,
0.6 mg/mL glucose oxidase, 30 mm glucose, and 2 mm dithiothreitol. We also sup-
plement buffer with an additional mm MgCl2 per mm of guanine nucleotide.
5.4.2 Experimental Apparatus
The optical tweezers apparatus [Brouhard et al., 2003; Schek and Hunt, 2006;
Visscher and Block, 1998] should have several features. First, it should detect bead
position with high spatiotemporal resolution using, for instance, back-focal-plane in-
terferometry (BFPI) [Gittes and Schmidt, 1998b]. High temporal resolution allows
thermal noise to be suppressed by filtering, which improves spatial resolution (see
section 5.5). Second, the apparatus should be able to apply a time-averaged constant
force (force clamp) by moving the trap, which has several advantages (section 5.5),
including tracking MT length changes over a larger range and minimizing the effect
of force on results. Finally, it should allow simultaneous light microscopy appropriate
for visualizing MTs, such as video-enhanced differential-interference contrast (VE-
DIC) microscopy. For VE-DIC, contrast enhancement, background subtraction, and
frame averaging can be achieved with a Hamamatsu ARGUS (Hamamatsu Photonics,
Hamamatsu City, Japan) or with equivalent commercial or custom digital image ac-
quisition and processing. The setup should ideally simultaneously process and record
81

video at 30Hz, allowing the user to record MT movement while observing it in real
time.
5.4.3 MT Length Constraints: Applied Force and Barrier Design
The MT used for the experiment must be short enough that it will not buckle
under the trapping force [Schek and Hunt, 2005]. The force at which a segment of
MT buckles under compression is proportional to its flexural rigidity and inversely
proportional to the square of its length, and has been estimated at 2 pN for a 10-µm
MT [Gittes et al., 1993], though smaller values have been measured (e.g., [Kikumoto
et al., 2006; Kurachi et al., 1995]). The length of MT between the bead and barrier
in our experiments is generally ~5 µm.
The MT must also be long enough that the experiment can be conducted without
impairing measurements of the bead position [Schek and Hunt, 2005]. The geometry
of both the barrier and laser beam must be considered (Fig. 5.1C). The laser must not
pass through photoresist upstream of the trap, as this would change the beam profile,
thereby introducing an error in the applied force. In the case of BFPI detection,
the laser beam should not pass through photoresist downstream of the trap either,
since this affects the bead position measurement. Relatively thin layers of photoresist
allow the assay to be conducted with the trap closer to the barrier. The effect of the
barriers on the trap and bead detection at a given position can be determined exper-
imentally by performing a power spectrum calibration [Gittes and Schmidt, 1998a]:
if the power spectrum is Lorentzian and the parameters yielded by the calibration
are consistent with those obtained in the absence of barriers, then the effect of the
barrier on measured bead position is negligible.
82

5.4.4 Preparation of Biotinylated MT Seeds
For taxol-stabilized seeds, 50 µm tubulin and 1 mm GTP in buffer (see above)
are incubated at 37°C for 25 min, brought to 10mM taxol, and immediately vortexed.
These MTs are centrifuged (Beckman Airfuge; Beckman Coulter, Brea, CA), the
supernatant is discarded, and the pellet is rinsed and resuspended in BRB-80 with
10 µm taxol. Biotin succinimidyl ester (B1606; Invitrogen Corporation, Carlsbad,
CA) is added at 1.7 mm, and the sample is incubated at 37°C for 15 min. To quench
the reaction, three volumes of 400 mm glycine (in BRB-80) are added, followed by
an additional 10 min of incubation. The sample is centrifuged, the supernatant is
discarded, and the pellet is rinsed and resuspended in BRB-80 without taxol. It is
then sheared several times through a 30-G needle. Finally, in order to deplete taxol,
the seeds are centrifuged, rinsed, and resuspended two more times in buffer. The
resulting seeds should be ~2 µm long. The amount of free biotin in the experimental
solution must be minimal, as it may compete with seeds for NeutrAvidin®-binding
sites.
For guanylyl-(α,β)-methylene-diphosphonate (GMP-CPP; NU-405S; JenaBioscience,
Jena, Germany) stabilized seeds, the above protocol is altered as follows. The initial
tubulin concentration is 2 µm to reduce spontaneous MT nucleation [Hyman et al.,
1992]. The 1 mm GTP is replaced with 0.2 mm GMP-CPP (this five-fold reduction in
concentration reduces expense). Only one centrifugation is performed after shearing.
For experiments in which a relatively low polymerization rate is expected, seeds
can be made longer by adjusting the shearing protocol (e.g., see [Farrell et al., 1987;
Melki et al., 1993; Williams and Rone, 1989; Yamauchi et al., 1993]), or short seeds can
be elongated before the experiment by incubating with tubulin (pulsed if necessary).
Seeds will anneal to form longer MTs over longer time periods (hours). We generally
begin a day of experiments by making seeds and stop collecting data when the seed
concentration and length are no longer appropriate.
83

5.4.5 Preparation of NeutrAvidin®-Coated Beads
A solution of ~0.6-µm silica beads (SS03N; Bangs Laboratories, Fishers, IN) at
10 mg/mL in BRB-80 is sonicated and vortexed (a few minutes each), and 20 µgmL−1
biotin–BSA is added, followed by 5 min of vortexing. The beads are then centrifuged.
The supernatant is discarded and the pellet is rinsed three times with BRB-80 gently
and without resuspension. It is then resuspended in 10 times the original volume
(~1 mg/mL beads) and vortexed. This solution is brought to 20 µgmL−1 NeutrA-
vidin® (A2666, Invitrogen) and vortexed gently for 5 min. During this step, a low
bead concentration reduces the chances of NeutrAvidin® binding two biotinylated
beads to each other. The beads are centrifuged, the supernatant is discarded, and
the pellet is rinsed and resuspended in the original volume (~10 mg/mL beads). The
beads are centrifuged, rinsed, and resuspended three additional times. Silica beads
will slowly sediment, so when making aliquots, the beads should be mixed frequently
to ensure all aliquots have roughly the same concentration. Aliquots are flash-frozen
in liquid nitrogen and stored at –80°C.
Most beads should be attached to zero, one, or occasionally two seeds, and the
concentration of bead–seed complexes must be low enough to prevent the formation
of networks of beads and seeds. In the experimental solution, we generally use taxol-
stabilized biotinylated seeds at ~1/50 dilution and beads at ~1/80 dilution, but these
quantities vary significantly.
5.5 Discussion
Here we discuss advantages of force clamping, approaches to data analysis, assess-
ment of detection limits, and potential sources of artifacts.
84

5.5.1 Advantages of Force Clamping
In contrast to stationary-trap experiments, a force-clamp experiment [Finer et al.,
1994; Gittes and Schmidt, 1998a; Visscher and Block, 1998] uses a feedback loop in
which the trap is moved in response to changes in the bead position such that the
time-averaged force is constant. This offers several advantages. In a stationary-trap
experiment, the MT lengthens against the barrier, pushing the bead from the trap
center. Data collection terminates when the MT pushes the bead out of useable range
of the trap or force becomes high enough to buckle the MT or induce a catastrophe.
Also, because the force changes with bead movement, its effect on MT polymerization
dynamics is variable. With force clamping, data can be collected over a much larger
range of displacement because the trap moves to accommodate bead movement, and
the force can be tightly controlled as an experimental variable or kept low to minimize
its effect on polymerization dynamics. Also, stationary-trap data underestimates MT
growth because MT displacement is partially accommodated by stretching of the
bead–MT linkage. The stiffness of the bead–MT linkage must be obtained to correct
this underestimation [Kerssemakers et al., 2006], and this can be challenging due
to nonlinear compliance and variability of compliance between bead–MT complexes
[Svoboda et al., 1993; Visscher and Block, 1998]. Force clamping obviates the need
to correct for this compliance [Visscher and Block, 1998]; it maintains a constant
stretch of the bead–MT linkage so that changes in bead position directly correspond
to changes in MT length [Schek et al., 2007].
5.5.2 Data Analysis: Bead Position Relative to Trap Center
The raw bead position data allow assessment of force-clamp performance and can
allow detection of events that occur more quickly than the force clamp responds. Al-
though the position of the bead can be detected at kHz frequencies with subnanome-
ter precision using techniques such as BFPI [Gittes and Schmidt, 1998b], much of
85

the high-frequency movement is due to thermal motion, and must be filtered to ob-
tain a precise estimate of MT length changes. Applying a low-pass filter yields a
good signal-to-noise ratio and allows examination of events occurring on a timescale
longer than the reciprocal of the filter cutoff frequency (see “Detection limits” below).
To minimize phase distortion, forward–backward filtering may be appropriate (e.g.,
[Gustafsson, 1996]).
Bead position data also allow forces experienced by the bead and MT to be as-
sessed. For instance, if the bead is subjected to a combination of thermal, Hookean,
and drag (proportional to velocity) forces, the power spectrum of the bead position
versus time trace will be Lorentzian and will yield spring constants and damping
coefficients [Gittes and Schmidt, 1998a]. In addition to allowing the stiffness of the
optical trap to be verified, this type of analysis can identify artifacts resulting from,
for instance, the MT becoming stuck to the barrier, or the laser beam being clipped
by a barrier.
5.5.3 Data Analysis: MT Length Changes
A subunit addition will change MT length by 0–8 nm: given the 13 protofilament
lattice structure of an MT, addition of a single subunit increases the MT length by
at most 8 nm if the subunit adds to the leading protofilament, and various smaller
amounts including no length change if the subunit adds to a lagging protofilament.
Several approaches are available for analysis of length changes. Most simply,
length changes ∆x and growth rates r are computed for each fixed time interval of
length t. For analysis of the distribution of ∆x or r, variance may be of particular
interest because the variance of MT growth rate is higher than expected from conven-
tional linear polymer growth theory [Oosawa, 1970], and there has been substantial
interest in determining the mechanism behind this (e.g., [Dye and Williams, 1996;
Howard and Hyman, 2009; Odde et al., 1996; Pedigo and Williams, 2002]). In cases
86
where it is difficult to choose an appropriate timescale, t, of interest a priori, analysis
can be repeated for multiple values of t [Svoboda et al., 1994], an algorithm can be
applied that computes growth or shortening rate using time intervals of varying length
as it proceeds through the time series [Schek et al., 2007], or a timescale-independent
approach such as spectral analysis can be applied [Odde et al., 1996]. To detect re-
peated displacement events (e.g., steps), the distance between relatively stationary
periods can be examined, for example, by forming a pairwise-distance distribution
function [Svoboda et al., 1993]. Searches for steps must be approached cautiously
however: without fundamental expectations for speed and size of steps to form a null
hypothesis, it is difficult to design a statistical test to establish that a noisy data
stream contains “steps,” and related errors have repeatedly plagued biophysical stud-
ies of nanoscale movements. Limits to detection of steps in noisy signals are discussed
further in Moffit et al. [Moffitt et al., 2008].
5.5.4 Detection Limits: Forces, Bandwidth, and Resolution
For experiment design and data interpretation, it is crucial to understand the
forces to which the bead is subjected: trap, bead–MT linkage, viscous, and thermal.
These forces and their implications for detection limits are discussed in detail else-
where [Gittes and Schmidt, 1998a; Moffitt et al., 2008; Visscher and Block, 1998].
Briefly, in a force-clamp assay, theoretical spatial resolution can be computed, and is
predicted to improve with decreasing bead–MT linkage compliance, bead drag coeffi-
cient, and filter cutoff frequency used by the force clamp [Gittes and Schmidt, 1998a].
Therefore, resolution may improve with a smaller bead, which should decrease drag
and bead–MT compliance due to bead rocking, or with higher applied force, assum-
ing the bead–MT linkage compliance exhibits strain hardening [Svoboda et al., 1993].
Furthermore, high bandwidth facilitates stationary-trap or forceclamp data analysis,
in which case filtering may be required to suppress thermal noise and achieve desired
87

spatial resolution, though at the cost of lowered temporal resolution (e.g., see supple-
mental material accompanying [Schek et al., 2007]). Temporal resolution is therefore
determined by detector bandwidth or by the filter cutoff, and events that cannot be
resolved in time will be detected with a delay or, if they do not result in a persistent
displacement, will be missed or underestimated: for example, a spike caused by rapid
addition and loss of subunits may not be apparent in filtered data, but still be visible
in the raw high-bandwidth data.
In addition to theoretical considerations, data should be collected using a control
MT in which length changes are suppressed, such as a GMP-CPP-stabilized MT
without free tubulin, in order to experimentally assess detection limits and potential
artifacts [Schek et al., 2007].
5.5.5 Potential Sources of Artifacts
Several potential sources of artifacts should be considered.
1. An MT may become stuck to a barrier. To verify that this has not occurred, the
MT should be pulled slightly (~500 nm) away from the barrier wall at the end
of each experiment, and the trace should be inspected for evidence of sticking.
2. If substantial MT nucleation occurs during the experiment (this is easily ob-
served under VE-DIC), the concentration of free tubulin may fall rapidly toward
the critical concentration. Nucleation of pure GTP-tubulin is highly coopera-
tive; the rate of nucleation is extremely sensitive to free tubulin concentration
(e.g., [Carlier and Pantaloni, 1978; Fygenson et al., 1995; Voter and Erickson,
1984]). Furthermore, nucleation is stimulated in the presence of, for instance,
γ-tubulin or γ-tubulin complexes (reviewed in [Job et al., 2003]), taxol (e.g.,
[Schiff et al., 1979]), certain MAPs (e.g., [Gupta et al., 2009; Moores et al., 2006;
Slep and Vale, 2007]), or a slowly-hydrolysable GTP analog such as GMP-CPP
[Hyman et al., 1992; Sandoval and Weber, 1980].
88

3. MT ends other than the one in the barrier may impair measurements. For
instance, the end of the MT opposite that under investigation may strike a
different wall. Also, an MT that is out of plane, and therefore not visible, may
strike the barrier. Data should be inspected for signs that such events occurred
(e.g., a drop in thermal movements or movement of the bead in the y direction).
4. Drift may impair measurements. Barrier movement in the x direction due to
stage drift may result in underestimation or overestimation of MT growth rates.
Depending on the design of the tweezers apparatus, drift in the z direction may
affect trap stiffness and bead-position detection sensitivity. It may also change
the zero position of the bead detection system, thereby introducing error in the
applied force.
5. Small details in the shape of the barriers may cause artifactual length change
measurements. With sufficient forces and appropriate barrier design, this can
be addressed or avoided: this is discussed in the supplemental material accom-
panying Schek et al. [2007].
5.6 Summary
We have described an assay for studying MT polymerization dynamics with high
spatiotemporal resolution and discussed interpretation of the data. This technique
promises to yield a wealth of insights into MT polymerization dynamics and their
modulation by MAPs and MT drugs.
89

CHAPTER VI
Fluctuations in growth rate support a 2D model
for microtubule self-assembly kinetics
This chapter∗ provides evidence that the classic Oosawa 1D model (section 4.3.1.1,
p. 63) is an inadequate representation of microtubule assembly kinetics, and that a
2D model [Hill, 1986; VanBuren et al., 2002] (p. 64, p. 148) is a practically significant
improvement over the 1D model.
Symbols representing physical quantities match those of Table 4.2 (p. 62).
6.1 Introduction
The tubulin subunit association rate constant, kon,MT (µm−1 s−1) and dissociation
rate constant, koff,MT (s−1) have been previously estimated from in vitro measurements
of the net microtubule assembly rate, vg (subunits/s; with ∼1625 subunits/µm of MT
length) as a function of the free tubulin concentration [Tub] (µm) (Table 6.1). These
rate constants have been estimated by fitting the microtubule assembly data to the
1D model of Oosawa [1970]. A key, but untested, assumption of this model is that
the tubulin subunit dissociation rate is constant regardless of [Tub]. As described∗This chapter is largely identical to a typescript that was accepted for publication [Gardner et al.,
2011]. This publication, on which I am second author, is the result of a collaboration described inthe acknowledgements (p. iv).
90

by Hill [1986] (p. 64, p. 148), this assumption cannot be strictly correct since it
requires that the microtubule tip structure is on average constant over varying [Tub],
which is not thermodynamically tenable. In addition, Chrétien et al. [1995] found
experimentally that microtubule tips shift from relatively blunt tip structures at low
[Tub] to relatively tapered tip structures at high concentrations. However, the 1D
model might still serve as a reasonable approximation if the microtubule tip structure
is only weakly dependent on free tubulin subunit concentration. Thus, the canonical
view of microtubule polymerization implicitly rests on the assumption that all tubulin
subunits at the tip of a growing microtubule are on average energetically similar to
one another, so that koff,MT is independent of [Tub].
Table 6.1: Published kon,MT and koff,MT estimates for growing microtubule plus endskon,MT (µm−1 s−1) koff,MT (s−1) Reference
3.9± 1.8 25.7± 7.1 Engelborghs et al. [1977]7.2 17 Bergen and Borisy [1980]
1.00± 0.36 2.00± 0.18 Farrell and Jordan [1982]4.2 2.3 Carlier et al. [1984]3.82 0.37 Mitchison and Kirschner [1984]1.4 — Gard and Kirschner [1987]
8.9± 0.3 44± 14 Walker et al. [1988]6.8 25− 30 O’Brien et al. [1990]3 0.1 Drechsel et al. [1992]
6.9± 0.5 32± 6.0 Trinczek et al. [1993]∗5 0.1 Hyman et al. [1992]5.7 14.1 Chrétien et al. [1995]
∗4.9± 2.3 0.49± 0.12 Brouhard et al. [2008]* denotes use of GMPCPP either at the lowest [Tub][Brouhard et al., 2008] or forthe entire data set [Hyman et al., 1992]. Walker et al. [1988] excluded “pause” phasetime intervals from their growth-phase data analysis, complicating comparison oftheir results with those of others, but they report that pauses were rare.
To test whether thermodynamic differences between tubulin subunits at the mi-
crotubule tip are important for interpreting growth data, we studied microtubule as-
sembly at near-molecular resolution using total internal reflection fluorescence (TIRF)
microscopy, and with our high temporal and spatial resolution nanoscale laser tweezer
91

assay (Chapter V, [Schek et al., 2007]). To simplify our initial analysis, we inhibited
GTP hydrolysis by performing experiments in the presence of the slowly hydrolyzable
GTP analogue GMPCPP. Preventing GTP hydrolysis suppressed transitions to rapid
shortening that present potentially confounding variables for interpreting microtubule
growth dynamics.
By analyzing the variance of the microtubule growth rate vg at high spatiotem-
poral resolution, we show that the kinetics of microtubule assembly are much more
rapid than previously assumed, even when GTP hydrolysis is inhibited. This data is
explained by a 2D model of the tip structure, and interpreted in this context shows
that a non-homogeneous tip structure has a significant impact on tubulin subunit dis-
sociation rates from the tip of a growing microtubule. In summary, we show (1) that
tubulin subunit dissociation rates koff,MT from the tip of a growing microtubule depend
on the [Tub], and (2) that dissociation rates increase substantially at higher [Tub],
which requires that growth-phase subunit on-off events occur much more rapidly than
previously appreciated. This reassessment of microtubule assembly kinetics leads to
a new perspective on microtubule assembly regulation via MAPs and drugs, where
weak and infrequent interactions with tubulin subunits at the growing microtubule
tip can strongly affect net assembly.
6.2 Results
6.2.1 The 1D Model Predicts Fewer Large Shortening Events at Higher
Tubulin Concentration
In a linear (1D) model [Oosawa, 1970], a key assumption is that the departure
rate of tubulin subunits from the microtubule tip (koff,MT) is a [Tub]-independent
constant. As shown in Fig. 6.1A (left), this model specifies that, for a time interval
∆t, the number of subunit associations, λ+, is determined by the on rate constant
92

kon,MT and the free tubulin concentration [Tub]. The number of departure events from
the tip (λ−) in this time interval depends only on the off rate constant, koff,MT. Thus,
for the 1D model, the departure rate of tubulin subunits from the tip will remain
constant, regardless of subunit arrival rate or [Tub].
Given the number of arrivals, λ+, and the number of departures, λ−, (both Poisson
distributed) the resulting difference, (λ+ − λ−), gives the distribution of incremental
microtubule length changes (Fig. 6.1A, right). A strong but untested prediction of the
1D model is that the likelihood of large microtubule shortening events will decrease
as the subunit arrival rate (λ+) becomes larger (Fig. 6.1A, right). In the example
shown in Fig. 6.1A (right), the probability of a shortening event whose magnitude is
larger than some arbitrary value (e.g., larger than the vertical dashed line located at
|λ+ − λ−| = |−4| in Fig. 6.1A, right) decreases with increasing [Tub]. This is because
microtubule growth increments will be strongly favored over shortening increments
as the subunit arrival rate increases with increasing [Tub], while the departure rate
remains constant. Thus, the 1D model can be tested by quantifying the distribution
of microtubule length increments as a function of [Tub]. In particular, the 1D model
predicts that the frequency of large shortening events should decrease at higher [Tub].
6.2.2 The Frequency of Large Microtubule Shortening Events Increases
at Higher Tubulin Concentration in TIRF Experiments
To test the 1D model predictions, we performed in vitro GMPCPP-tubulin ex-
periments to measure microtubule assembly dynamics at nanometer scale resolution.
Using GMPCPP allowed us to focus on the intrinsic variability in the microtubule
growth rate without the potentially confounding effects of nucleotide hydrolysis. As
shown in Fig. 6.1B, assembly of GMPCPP-tubulin labeled with Alexa-488 (55%
labeled, Invitrogen Corp.) onto Rhodamine-labeled GMPCPP-tubulin seeds was im-
aged by TIRF microscopy (section 6.4 on p. 6.4 and [Gell et al., 2010]). We measured
93

Figure 6.1:TIRF microscopy reveals koff,MTincreases with [Tub]. (A) A 1D model(left). In a time interval ∆t, the number of subunits added to the tip isλ+ ∝ [Tub], while the number of subunits lost, λ−, is [Tub]-independent.The 1D model predicts (right) that large shortening events (e.g., leftof vertical dashed line) decrease in frequency as [Tub] increases (i.e., asλ+ increases). (B) Microtubule length measured at high spatial resolu-tion using TIRF microscopy. Microtubule extensions (green), grown fromGMPCPP microtubule seeds (red), are visualized during growth at vary-ing [Tub]. Tip position is measured by fitting the decay in fluorescenceintensity to the error function [Demtchouk et al., 2011]. (C) Typicalgrowth traces at different [Tub]. vg variability increases with [Tub]. Fur-thermore, the magnitude of large shortening events increases at higher[Tub] (e.g., blue arrows). (D) Quantification of vg variability. Length in-crements over 1.4 s intervals are summarized for each concentration. Thefixed-microtubule increment distribution is narrower than the live incre-ment distribution for both 0.8 and 1.5 µm (p = 0.018 and p = 0.002 byt-test, respectively). In contradiction to 1D model predictions (see A),large negative (shortening) increments are more common at higher [Tub].For example, shortening events < −32 nm account for 1.8% of all lengthincrements in the dilution experiments, but 9.1% of such increments at a[Tub] = 1.5 µm. As a control, we show the distribution of increments ob-tained from fixed microtubules (gray dashed line). The fraction of lengthchange increments for fixed microtubules remains relatively unchanged(1.4% for a pre-fix [Tub] of 0.6 µm, and 1.8% for 1.5 µm).
94

the length of microtubule extensions at 700ms intervals in the presence of two dif-
ferent non-zero concentrations of GMPCPP tubulin, and in a dilution experiment
in which the residual [Tub] was estimated to be ∼0.1 µm. Although the time-lapse
interval between subsequent images was 700ms, all of the images were collected using
100ms exposure times, regardless of concentration.
The positions of microtubule ends were estimated by fitting the error function to
the fluorescence intensity at microtubule end, where the microtubule end was defined
as the position at which the error function fell to 50% of the signal (µtip, Fig. 6.1B)
[Bicek et al., 2009; Demtchouk et al., 2011; Pearson et al., 2006; Wan et al., 2009].
Because GMPCPP tubulin spontaneously nucleates at ∼2 µm tubulin, we selected
[Tub] for analysis from ∼ 0.1 µm (dilution experiments) to 1.5 µm GMPCPP tubulin,
which represents a ∼15-fold range of concentration.
As expected, the rate of net assembly increased as the [Tub] increased from di-
lution experiments to 1.5 µm (Fig. 6.1C). Due to the low [Tub], the net microtubule
growth velocity is slow even at the highest concentration tested (maximum value of
∼0.15 µmmin−1 at 1.5 µm GMPCPP tubulin), which is consistent with the previously
reported value of 0.07 µmmin−1 at 0.5 µm GMPCPP tubulin [Brouhard et al., 2008].
We found that microtubule growth trajectories in dilution experiments and at
0.8 µm GMPCPP-tubulin (Fig. 6.1C, green and red) showed steady growth or short-
ening with small length fluctuations, while microtubule growth trajectories at 1.5 µm
GMPCPP-tubulin (Fig. 6.1C, blue) appeared to grow “noisily” with larger length
fluctuations. These fluctuations were quantified by calculating the net length change
increments for each 1.4 s interval during the first 30 s of growth for each microtubule
(Fig. 6.1D).
We note that the measurement error can be readily estimated from the increment
distribution for fixed microtubules (gray), where the standard deviation of increments
is ∼20 nm (corresponding to single time point position estimates of ±20 nm/√
2 =
95

±14 nm), and so the measurement accuracy is on the nanoscale. To account for
potential microtubule tip tracking accuracy changes as a function of microtubule tip
structure, we fixed microtubules after having grown them in the correct corresponding
[Tub] in each case.
Using the TIRF system, we found that the experimentally observed frequency of
large shortening events (e.g., < −32 nm, equivalent to 4 dimer lengths and signifi-
cantly above measurement error) increases at higher [Tub] ((1.8± 0.4)% in dilution
experiments to (9.1± 0.8)% at 1.5 µm tubulin, Fig. 6.1D). This result stands in direct
conflict with the 1D model, which predicts that the frequency of large microtubule
shortening events should decrease with increasing [Tub] (Fig. 6.1A, left). We note
that for fixed (non-dynamic) microtubules the frequency of “shortening” events aris-
ing from measurement noise alone is approximately independent of [Tub], ranging
from (1.4± 0.4)% at low concentration to (1.8± 0.4)% at high concentration. Thus,
the increase in the frequency and magnitude of shortening events at higher [Tub]
strongly suggests that the tubulin subunit dissociation rate from the microtubule tip
increases at higher [Tub], which violates a basic assumption of the 1D model.
6.2.3 The Frequency of Large Shortening Events Increases at Higher
Tubulin Concentration in Laser Tweezers Experiments
To examine microtubule growth rates with higher resolution, we measured the vari-
ability in growth rates using our high temporal and spatial resolution nanoscale laser
tweezers assay (Chapter V, [Schek et al., 2007]). Here, a spatial resolution of < 3.5 nm
at 10 Hz temporal resolution is achieved by measuring the position of microtubule-
attached beads as microtubules grow into a microfabricated barrier (Fig. 6.2A). We
observed variability in microtubule growth at three different [Tub], with variabil-
ity increasing substantially at higher [Tub] (Fig. 6.2B). By quantitatively comparing
the growth increment sizes at 0.1 s time intervals, we found that the frequency of
96

large shortening events (e.g., < −8 nm) increased from (1.4± 0.3)% of all events at
0.5 µm tubulin, to (6.3± 0.5)% of all events at 1.5 µm tubulin (Fig. 6.2C). As de-
scribed above, this stands in marked contrast to the expectation from the 1D model,
which predicts that the frequency of large shortening events should decrease at higher
[Tub]. Because of the higher spatial-temporal resolution in the tweezers experiment,
we were also able to test for the possible addition of oligomers [Kerssemakers et al.,
2006; Schek et al., 2007]. Here, we never observed increments equal to or larger than
16 nm (i.e., two subunits) at 0.5 µm and 1.0 µm (N = 4998 increments), and only very
rarely at 1.5 µm (0.93%, N = 2567 increments). In addition, these rare instances of
increments larger than 16 nm could be explained by rapid successive addition events
of single subunits [Schek et al., 2007], particularly considering our estimates (below)
of subunit exchange rates. Thus, similar to the TIRF data, the optical tweezers data
indicates that the tubulin subunit dissociation rate from the microtubule tip increases
at higher [Tub], which is inconsistent with the 1D model.
In addition, the laser-tweezers data was collected using unlabeled tubulin, which
provides an important control for the labeled tubulin in the TIRF experiments, as sim-
ilar results are obtained in both experiments. Because results are consistent between
the laser-tweezers data, which used unlabeled tubulin, and the TIRF experiments,
this argues that differently labeled tubulins are not a significant source of growth
variance.
6.2.4 Concentration-Dependent Tubulin Subunit Dissociation Rates are
Explained by Accounting for Both Lateral and Longitudinal Bonds
Because the tubulin dissociation rate from the microtubule tip increases at higher
[Tub], it seems necessary that the state of the microtubule tip is on average shifted
to a less stable configuration at higher [Tub]. To explicitly account for the energetic
states of individual tubulin subunits in the microtubule, we performed computational
97

Figure 6.2: Nanoscale optical tweezers experiments confirm increasing growth ratevariability and frequency of large shortening events at higher [Tub] (A)In high temporal and spatial resolution laser tweezer experiments, the po-sition of a microtubule-attached bead is monitored as the microtubule tipgrows against a microfabricated barrier. (B) Net assembly rate variabilityis measured with increasing [Tub]. In experimental traces shown at right,the microtubule growth rate variability becomes larger (i.e., “noisier”)with increasing [Tub]. (C) Histograms of microtubule length change in-crements at 0.1 s intervals show increased variability with increasing [Tub].Importantly, large microtubule shortening events increase in frequency athigher [Tub] (percentages of increments that are 6 −8 nm shown in red),consistent with the TIRF measurements, but in direct contradiction toboth intuitive expectation and the 1D model prediction.
98

simulations using our previously published “2D” model for microtubule assembly
[VanBuren et al., 2002]. In contrast to the 1D model, where protofilaments are
regarded as independent with a single koff,PF, the 2D model explicitly accounts for the
bonds in both the lateral and longitudinal directions. Together, these bonds stabilize
a subunit. As the number of these bonds varies, the koff,PF will also change. Since
the number of lateral bonds between subunits at the tip depends on the tip structure,
koff,PF averaged over time and all protofilaments yields koff,MT. This value for koff,MT
could increase at higher [Tub], consistent with our experimental observations (Figs.
1 and 2). Therefore, we asked whether the 2D model predicts an increase in koff,MT
at higher [Tub].
The 2D simulation accounts for (1) subunit arrivals at the tip of the microtubule,
and (2) subunit departures from the tip (Fig. 6.3A). For arrivals, the subunit arrival
rate at the tip of a protofilament (k∗on,PF) is given by
k∗on,PF = kon,PF[Tub] (6.1)
where kon,PF is the on rate constant per individual protofilament (µm−1 s−1, such
that kon,MT = 13kon,PF), k∗on,PF is the arrival rate per individual protofilament (s−1,
similarly k∗on,MT = 13k∗on,PF), and [Tub] is the free tubulin subunit concentration. This
expression for tubulin subunit arrival rate to each protofilament is identical to the
1D model. However, to account for energetic differences between tubulin subunits
at the microtubule tip, in the 2D model the subunit departure rate from a given
protofilament, koff,PF, depends on the equilibrium constant, where
Keq ≡kon,PF
koff,PF= e−∆G0
total/kBT . (6.2)
Therefore, by rearrangement:
99

koff,PF = kon,PF
e−∆G0total/kBT
(6.3)
where, koff,PF is the off rate per individual protofilament (s−1), kB is Boltzmann’s con-
stant, T is absolute temperature, and ∆G0total is the total free energy of the stabilizing
bonds on a specific subunit, given by
∆G0total =
∑∆G0∗
Longitudinal +∑
∆G0Lateral (6.4)
In this way, tip subunits will (by definition) have one longitudinal bond (Fig. 6.3A),
and therefore the total value for ∆G0∗Longitudinal will be identical for all subunits at
the tip. However, the lateral bond energy (∆G0Lateral) will vary, such that subunits
with two lateral neighbors will have a two-fold more negative value for ∆G0Lateral than
subunits with only one lateral neighbor.
As the stochastic 2D model computer simulation proceeds (see movies accompa-
nying Gardner et al. [2011]), the tip structure naturally evolves as subunits arrive
and depart from the tip of each protofilament, and the behavior averaged over time
can be calculated for a given [Tub] (simulation parameters in Table 6.2 and Fig. 6.4).
The steady-state subunit off rate from the microtubule tip (averaged over time and
summed over all protofilaments) can then be calculated as a function of the free sub-
unit concentration. Consistent with our experimental data, we found that interactions
between neighboring protofilaments can result in a strong concentration-dependent
subunit dissociation rate from the microtubule tip (Fig. 6.3B). As a result, the 2D
model predicts that net microtubule assembly (Fig. 6.3B, blue) results from the rela-
tively small difference between a large subunit arrival rate that increases with [Tub]
(Fig. 6.3B, green), and a large subunit departure rate that also increases with in-
creasing [Tub] (Fig. 6.3B, red). Thus, the 2D model assumes that subunits at the tip
of a growing microtubule are not energetically identical, and therefore predicts that
100

Figure 6.3: A 2D model predicts that tubulin subunit dissociation rates are depen-dent on [Tub] (A) Microtubules grow and shorten via the addition and lossof αβ-tubulin subunits. A 2D model includes the effect of both lateralbond interactions between neighboring protofilaments and longitudinalbonds along the protofilament. In the 2D model, subunit on rates andoff rates can be calculated, such that the on rate depends on the [Tub],while tubulin subunit off rates depend on their stability in the polymer,as calculated by summing all of the lateral and longitudinal bond ener-gies for a given tubulin subunit. (B) The 2D model predicts that tubulindissociation rates increase at higher [Tub] (red). Thus, the net assem-bly rate (blue) is given by the small difference between the large on rate(green) and the large off rate (red). (C) Left: Lattice thermodynam-ics dictate that dissociation rates at growing microtubule tips vary foreach protofilament based on the number of lateral neighbor interactionsat the protofilament tip. Here, dissociation rates are high for tubulin sub-units with fewer lateral neighbors, while increasing the number of lateralneighbors (and thus increasing the number of stabilizing lateral bonds)results in reduced dissociation rates. Right: The 2D model predicts that1-neighbor protofilament tip interactions increase in likelihood at higher[Tub], while 2-neighbor interactions decrease with increasing free subunitconcentration.
101

Figure 6.4: Constraint of kon,MT in 2D Model Simulations. By quantifying the mi-crotubule length change increment variance as a function of time step,kon,MT is constrained in the 2D model simulation. The range of testedvalues for kon,MT is 39-78 µm−1 s−1, and values of 52 and 65 µm−1 s−1 areconsistent with experimental results.
the average koff,MT increases at higher [Tub]. This result provides an explanation for
the discrepancy between the 1D model and our experimental observations.
Why do the subunit dissociation rates increase at higher [Tub]? The protofilament
dissociation rate constant is dependent on the number of neighboring protofilaments
available for forming stabilizing lateral bonds (Fig. 6.3C), which must on average be
shifted toward less stable configurations as the [Tub] increases. For example, tubulin
subunits with two lateral neighbors (Fig. 6.3C, left) have a low dissociation rate
constant, while subunits with one lateral neighbor have a moderate dissociation rate
constant, and tubulin subunits with no lateral neighbors have a high dissociation rate
constant due to the lack of any stabilizing lateral bonds (Fig. 6.3C, left). Thus, if the
probability of the configurations were known, the dissociation rate constant averaged
over the entire microtubule tip (koff,MT) would be given by
koff,MT ≈ f0k(0)off,PF + f1k
(1)off,PF + f2k
(2)off,PF (6.5)
102

Table6.2:
2DMod
elSimulationPa
rameter
Values
Parameter
Descriptio
nVa
lue
Reference
[Tub
]Free
subu
nitconcentration
0.5to
1.5µ
mEx
perim
ent
kon,M
TOn-rate
constant
52to
65µm−
1s−
1Con
strained
byexpe
rimental
GMPC
PPincrem
entvaria
nce
khy
drol
ysis
Hyd
rolysis
rate
0s−
1Assum
ednegligible
∆G
0∗ Long
itudi
nal
Free
energy
oflong
itudina
lin-
teraction
incorporating
entrop
icpe
nalty
ofim
mob
ilizatio
n
−9.
5kBT
Con
strained
for
GMPC
PPby
mod
el-fitting
toallnew
expe
ri-mentalresults
∆G
0 Late
ral
Free
energy
oflateralinteractio
n−
4.5to−
5.0k
BT
Con
strained
byGMPC
PPexpe
ri-mentalresults
with
valued
epend-
ingon
kon,M
T
kb
Sprin
gconstant
for
bead
-microtubu
lelin
kage
0.02
1pNnm−
1
Scheket
al.[2007]
ktr
apSp
ringconstant
fortrap
0.02
1pNnm−
1
Scheket
al.[2007]
TTe
mpe
rature
309K
Expe
riment
δOn-rate
pena
ltyfor
lagging
protofi
laments
15Con
strained
bymod
el-fitting
toexpe
rimentalt
ipstan
dard
devia-
tionmeasurements
103

where fi are the mean probabilities of tubulin subunits at the tip with i lateral
neighbors, and k(i)off,PF are the individual protofilament dissociation rate constants for
a tubulin subunit with i lateral neighbors [Hill, 1986].
We then examined in what way the relative fractions of tubulin subunits with 0, 1,
or 2 lateral neighbors change with increasing [Tub] in the 2D model. We found that
the fraction of tubulin subunits at microtubule tips with 0 lateral neighbors remains
relatively constant at all concentrations (Fig. 6.3C, right, yellow). However, there is
an increase in the probability of relatively unstable 1 lateral neighbor subunits at the
microtubule tip with increasing [Tub] (Fig. 6.3C, right, blue), and a corresponding
decrease in the probability of relatively stable tubulin subunits having 2 lateral neigh-
bors (Fig. 6.3C, right, magenta). This result explains why the subunit dissociation
rate accelerates with increasing [Tub] in the 2D model. It is important to appreciate
that the off rate is enslaved to, or dependent upon, the on rate. This means that as
the on rate goes up, the tip becomes more extended (i.e., protofilament lengths are
more variable with increasing tendency toward only one lateral neighbor), which in
turn increases the off rate. Thus, the off rate is in fact dependent on the on rate, and
they rise together.
6.2.5 The 1D and 2D Models Both Predict the Linear Dependence of
Growth Rate on Tubulin Concentration But With Differing Rate
Constants
To quantitatively test both the 1D and the 2D models, we first constrained their
association rate constants based on mean microtubule growth rate as a function of
[Tub]. For the 1D model, the average association rate constant for an entire micro-
tubule tip, kon,MT (µm−1 s−1) and the average tip dissociation rate constant, koff,MT
(s−1) have been previously estimated from experimental measurements of the net as-
sembly rate, vg (subunits/s; with ∼ 1625 subunits/µm of microtubule length) as a
104

function of the free subunit concentration, [Tub] (µm), using:
vg = kon,MT[Tub]− koff,MT (6.6)
Using equation 6.6, the 1D model average association rate constant (kon,MT) is the
slope of a linear fit to the net assembly rate vs. [Tub], while the 1D model average
dissociation rate constant (koff,MT) is the y-intercept (Fig. 6.5A). Numerous in vitro
studies have confirmed the predicted linear relationship for growing GTP-tubulin
microtubules, and for GMPCPP-tubulin microtubules, which do not undergo transi-
tions to rapid shortening due to very slow hydrolysis of this GTP analogue [Dye and
Williams, 1996]. These studies, summarized in Table 6.1, have consistently yielded
average association rate constants of kon,MT ≈ 5 µm−1 s−1 (range 1–9 µm−1 s−1) and
average dissociation rates of koff,MT ≈ 15 s−1 (range 0.1–44 s−1).
Similar to these studies, we experimentally measured the microtubule growth ve-
locity as a function of [Tub] using both the in vitro TIRF and the nanoscale laser
tweezers assays (Fig. 6.5A).
We then calculated the 1D model association and dissociation rate constants using
the combined results from both experiments (Fig. 6.5A). From the slope and inter-
cept, the 1D model microtubule association rate constant for GMPCPP-Tubulin was
kon,MT = 5.1 µm−1 s−1, and the dissociation rate constant was koff,MT = 3.9 s−1. Thus,
our observed growth velocity dependence on [Tub] was within the range previously
observed and yields similar 1D model rate constants to those previously reported
(Table 1).
The 2D model also predicts a linear dependence of microtubule growth rate on
tubulin concentration (Fig. 6.5B). However, the 2D model predicts that the aver-
age dissociation rate increases approximately linearly with [Tub] due to evolving tip
structures (Fig. 6.3B). This in turn requires that the association rate constant is
substantially larger than in a 1D model in order to produce the observed net micro-
105

A B C
D E F
Figure 6.5: Lateral interactions require rapid on-off kinetics for subunits at the mi-crotubule tip. (A) 1D-model estimates of koff,MT and kon,MT based onlaser-tweezers and TIRF-microscopy data. (B) Similar to the 1D model,a 2D model predicts vg increases linearly with [Tub]. However, to producethe correct vg it requires kon,MT an order of magnitude higher because ofincreasing koff,MT at higher [Tub] as tip structures become more extended.(C) A 2D model with rapid subunit exchange predicts experimental mi-crotubule growth variability in the TIRF assay, as quantified by Dp (dis-cussion of equation 6.7), while a first-order Poisson process (derived fromthe 1D model) with slow exchange fails to reproduce the experimentallyobserved variability in vg. Here, Dp is estimated by fitting equation 6.7to mean squared microtubule length increment (〈∆L2〉) vs. time interval(∆t). The experimental estimate and 2D model value of Dp are bothat least an order of magnitude larger than predicted for a 1D model.(D) Similar analysis to (C) at varying [Tub]yields k∗on,MT ≡ kon,MT[Tub],koff,MT, and vg estimates (main text, Table 6.3, and (E)). (E) Experimen-tal k∗on,MT and koff,MT as a function of [Tub]. Similar to the 2D modelprediction (Fig. 6.3B), koff,MT increases with [Tub] (red). vg (blue) isgiven by the small difference between the large on (green) and large off(red) rates. (F) A 2D model with fast subunit exchange predicts experi-mental microtubule growth variability in the laser-tweezer assay, while afirst-order Poisson process (derived from the 1D model of Oosawa) withslow exchange fails to reproduce the experimentally observed growth ratevariance at higher [Tub]. The 1D model predicts the variance is smallerthan the measurement variance, and so should appear constant across all[Tub].
106

Table6.3:
Expe
rimentalO
nan
dOffRateCon
stan
tEs
timates
forMicrotubu
lePlus-end
sNucleotide
GMPC
PPGTP
[Tub
](µm
)Dilu
tion
0.8
1.5
7.0
9.0
12.0
Dp(nm
2s−
1 )3.1±
0.24
20.1±2.0
28.8±2.4
111±
12155±
11272±
16v̂ g
(nm
s−1 )
-0.06±
0.12
1.9±
0.07
1.8±
0.11
5.7±
0.18
7.9±
0.13
10.7±0.36
koff,M
T(s−
1 )8.2±
0.65
51.6±5.3
74.5±6.3
287±
30402±
29708±
42k
on,M
T[T
ub](
s−1 )
8.1±
0.67
54.6±5.3
77.4±6.4
296±
30414±
29726±
43k
on,M
T(µ
m−
1s−
1 )81.3±0.44
68.3±6.6
51.6±4.3
42.3±4.3
46.0±3.2
60.5±3.5
s.e.inD
pan
dv g
obtained
byPo
isson
steppe
rmod
el.s.e
.in
rate
constantsob
tained
byprop
agationof
errors.Fo
rthe
dilutio
nexpe
riment,theresid
ualG
MPC
PP-Tub
ulin
concentrationwa
sestim
ated
tobe
0.1
µmby
usingtheratio
ofTIR
Fba
ckgrou
ndflu
orescencebe
fore
andafterdilutio
nof
1.5
µmtubu
lin,u
singtheform
ula:
(backg
roun
dmod
ein
1.5
µm-c
amera
offset)/(ba
ckgrou
ndmod
eafterdilutio
n–cameraoff
set)=(1.5/residua
ldilu
tionconcentration).There
wasno
significan
tba
ckgrou
ndph
otob
leaching
inthedilutio
nmov
ies,
suggestin
gthat
thecoverslip
-attachedtubu
linis
negligible
inthis
case.
107

tubule growth rate (Figs. 3B and 4B). As a result, the 2D model association rate
constant must be approximately an order of magnitude higher than the association
rate constant estimated for the 1D model (kon,MT ≈ 52 µm−1 s−1 with a 2D model,
see Fig. 6.4 and Table 6.2) (Fig. 6.5B). This 2D model association rate constant,
when considered on a per protofilament basis (kon,PF = kon,MT/13 = 4 µm−1 s−1),
is consistent with theoretical predictions for rotational-translational diffusion-limited
protein-protein association reactions [Northrup and Erickson, 1992] and is similar
to that estimated for F-actin (2 protofilament) self-assembly on a per protofilament
basis, kon,filament = 11.6 µm−1 s−1 or kon,PF = 5.8 µm−1 s−1 [Pollard, 1986].
6.2.6 The Variability in Growth Rate is Significantly Underpredicted by
the 1D Model, But is Correctly Predicted By the Rapid On-Off
Kinetics Required in the 2D Model
For a stochastic process the variance in the number of events per time interval
is equal to the mean number of events. Therefore the variability in the rate of mi-
crotubule growth should reflect the underlying rates of subunit addition and loss.
As described above, since the 2D model predicts rate constants that are an order
of magnitude higher than the 1D model, it also predicts a much larger variance in
microtubule assembly rate. To quantitatively compare the predictions of the 1D and
2D models to our experimental results, we calculated the mean squared displacement
of microtubule length increments for increasing time steps, and plotted the results
for each model with the 1.5 µm TIRF experimental data (Fig. 6.5C). By plotting the
results in this manner, the length fluctuations of filament growth can be described by
a diffusion with drift equation, as given by:
⟨∆L2
⟩= v2
g∆t2 + 2Dp∆t+ σ2 (6.7)
108

where ∆L is the microtubule length change increment (in nm) over a given time
step ∆t (in s), vg is the net growth rate (nm s−1), and Dp is the effective diffusion
coefficient for the microtubule polymerization, which provides a quantitative measure
of the variability in microtubule growth increments. Finally, σ2 is the experimental
measurement noise.
By fitting the experimental data and both models’ predicted data to a quadratic
equation, the diffusion coefficient (Dp) can be estimated, which provides a quanti-
tative measure of the microtubule growth variability. The 1D model diffusion co-
efficient Dp (constrained by mean growth rate data to kon,MT = 5.1 µm−1 s−1 and
koff,MT = 3.9 s−1, as in Fig. 6.6A) is an order of magnitude lower than the experi-
mental diffusion coefficient (Fig. 6.5C). In contrast, the 2D model, constrained by
the mean growth rate experiments to a 10-fold higher association rate constant than
in the 1D model (kon,MT = 52 µm−1 s−1), predicts a diffusion coefficient Dp, that is
similar to the experimental data (Fig. 6.5C, 2D model parameters as in Table 6.2).
Thus, microtubule assembly is too variable to be consistent with the 1D model, but
is consistent with the 2D model.
6.2.7 Experiments Confirm Rapid Tubulin On-Off Kinetics Predicted by
the 2D Model
The tubulin subunit on rate (k∗on,MT ≡ kon,MT[Tub]) and the off rate (koff,MT) from
the microtubule tip can be directly estimated from the mean-squared displacement
versus time data (Fig. 6.5D). The diffusion coefficient, Dp, relates the microtubule
length mean squared displacement due to diffusion alone, 〈∆l2D〉, to the time interval,
∆t, via ⟨∆l2D
⟩= 2Dp∆t (6.8)
109

A
B
C
D
Figure 6.6: TIRF microscopy measurements show that microtubule tip structure de-pends on free GMPCPP-tubulin concentration. (A) A 2D model predictsthat koff,MT increases at higher [Tub] because of increased incidence of1-neighbor subunits at the tip (greater disparity in protofilament length),which are promoted at high k∗on,MT ≡ kon,MT[Tub]. (B) The standard devi-ation of protofilament lengths for a given microtubule provides a measureof the variability in protofilament lengths. The 2D model predicts thatthe standard deviation of protofilament lengths will, on average, be largein 1.5 µm tubulin relative to 0.8 µm tubulin. (C) Fitting the error func-tion to the decay in fluorescence intensity at the microtubule end yieldsestimates of the mean (µtip) and the standard deviation (σtip) of the er-ror function. µtip represents the microtubule tip position (as describedabove), while σtip reflects the variability in protofilament lengths at themicrotubule tip. A low σtip (left) suggests that microtubule tips are blunt,with low variation in protofilament length. Conversely, a high σtip (right)suggests that tips are extended, with a higher variation in protofilamentlength. (D) In TIRF experiments, the tip standard deviation increaseswith increasing free GMPCPP-tubulin concentration. At [Tub] = 0.8 µm,the mean±sd of σtip is (99± 22) nm (n=700), while at [Tub] = 1.5 µm it is(140± 55) nm (n=1120; p < 10−15) (similar length microtubules at bothconcentrations). This experimental result shows that tips of microtubulesgrowing in the presence of GMPCPP at [Tub] = 0.8 µm are relativelyblunt with low protofilament length variation, while at [Tub] = 1.5 µmthey are more extended, with a larger variation in protofilament lengths.
110

and the growth rate variance due to diffusion is described by a Skellam distribution
[Oosawa, 1970; Skellam, 1946], so that
⟨∆l2D
⟩= a2 (kon,MT[Tub] + koff,MT) ∆t (6.9)
where a is the change in microtubule length contributed by a single dimer, which is
on average 0.615 nm. Combining equations 6.8 and 6.9 and solving for Dp we obtain,
Dp = a2
2 (kon,MT[Tub] + koff,MT) (6.10)
In addition, by definition,
v̂g = a (kon,MT[Tub]− koff,MT) (6.11)
Thus, through these two equations 6.10 and 6.11, the two unknowns, kon,MT and
koff,MT, can be calculated at a given [Tub] using the experimental estimates of Dp
and vg. (Stukalin and Kolomeisky [2004] recommended this type of analysis. It is
thoroughly explained by [Mirny and Needleman, 2010], but a factor of NPF ≈ 13 is
not accounted for.)
To calculate the values for kon,MT and koff,MT from the experimental data, and
to confirm concentration-dependent tubulin subunit dissociation rates, we completed
the mean-squared displacement analysis as described above for a range of [Tub] in the
TIRF analysis (Fig. 6.5D). Detailed results are summarized in Table 6.3 and shown in
Fig. 6.5E. The experimentally estimated tubulin dissociation rate increases substan-
tially as the [Tub] is increased, and the relatively slow net experimental microtubule
assembly rate (blue) represents the difference between a large experimental on rate
(green) and a large off rate (red), similar to the 2D model prediction (Fig. 6.3B).
For example, at 1.5 µm, the net microtubule assembly rate (blue) represents the dif-
111

ference between a large on rate, kon,MT[Tub] ≈ 77 s−1 (green), and a large off rate,
koff,MT ≈ 75 s−1 (red). In addition, the dilution experimental results demonstrate
that the off rate collapses to very near the 1D model estimate when microtubule
tips are blunt (1D model koff,MT ≈ 4 s−1, estimated experimental koff,MT in dilution
experiment, ≈ 8 s−1).
6.2.8 Growth Variability in the Laser-Tweezer Assay is Consistent with
Rapid Tubulin Subunit On-Off Kinetics
We then asked whether, consistent with the TIRF assays, the variance in the
growth rate measured using the optical tweezers assay is quantitatively larger than
expected for the 1D model. As shown in Fig. 6.5F, the 1D model, constrained by
mean growth rate data to kon,MT = 5.1 µm−1 s−1 and koff,MT = 3.9 s−1 (Fig. 6.5A),
predicts a microtubule growth rate variance in the laser tweezer assay of σ2Assembly =
1.0 nm2 at 0.5 µm tubulin (k∗on,MT = 2.5 s−1) and σ2Assembly = 1.7 nm2 at 1.5 µm tubu-
lin (k∗on,MT = 7.6 s−1). Our laser tweezers assay has a measurement variance due to
Brownian motion of the microtubule-bead complex of σ2Thermal = (3.5 nm)2 = 12 nm2
(at 10 Hz) [Schek et al., 2007]. Thus, the 1D model predicts that the experimentally
observed variance, σ2Observed = σ2
Assembly + σ2Thermal = 13 nm2, will be dominated by
the thermal measurement noise and so will not depend on free subunit concentra-
tion (Fig. 6.5F, orange line). Contrary to this expectation, the microtubule growth
increment distribution from the laser-tweezer assay increases with the [Tub], and is
inconsistent with the 1D model at 1.0 µm (p < 10−8, Two-tailed F-test) and 1.5 µm
(p < 10−8, Two-tailed F-test).
The 2D model, constrained by the mean growth rate experiments to a 10-fold
higher association rate constant than the 1D model, predicts a substantial increase in
growth rate variance with increasing [Tub]. For the 2D model at 0.1 s time intervals,
the growth rate variance is predicted to increase from 15 nm2 at 0.5 µm tubulin to
112

25 nm2 at 1.5 µm tubulin (Fig. 6.5F, blue, 2D model parameters as in Table 6.2) which
is consistent with experimental results (1.0 µm, p = 0.47; 1.5 µm, p = 0.31; Two-tailed
F-Test). Thus, the experimentally measured microtubule growth variance at higher
[Tub] is inconsistent with the relatively slow kinetics predicted by the 1D model, but
is well described using a 10-fold higher tubulin association rate constant.
6.2.9 Experimentally, Microtubule Tips Are More Tapered At Higher
Tubulin Concentration, Consistent with Concentration-Dependent
Subunit Dissociation Rates
In shifting from low [Tub] (i.e., favoring 2 lateral neighbors, Fig. 6.3C) to high con-
centration (i.e., favoring 1 lateral neighbor, Fig. 6.3C), the microtubule tip structure
shifts from being relatively blunt, where protofilaments are typically the same length,
to a more tapered tip in which protofilament lengths are more variable (Fig. 6.6A).
The 2D model simulations predict that at high [Tub] (i.e., when subunits arrive
rapidly to the tip), protofilaments will tend to grow independently of their neighbors,
which results in tip subunits that are more likely to have only 1 lateral neighbor.
Specifically, the tip structures at higher [Tub] will exhibit greater disparity in protofil-
ament length (i.e., higher protofilament length standard deviation), with more single-
neighbor protofilament extensions (Fig. 6.6B, blue). In contrast, at low [Tub], the
relatively higher off rate will favor blunt ends (i.e., lower protofilament length standard
deviation), where two lateral neighbors predominate (Fig. 6.6B, red). These predic-
tions are consistent with cryoelectron microscopy images of microtubules formed from
GTP-tubulin, where the mean microtubule tip taper lengths increase with increasing
[Tub] in the presence of GTP [Chrétien et al., 1995].
To test this prediction for GMPCPP microtubules, we estimated tip structures
using TIRF microscopy by fitting the error function to the green Alexa-488 fluo-
rescence intensity at microtubule ends, which yields both the mean protofilament
113

length (µtip) (Fig. 6.1B) and the standard deviation of protofilament lengths (σtip)
(Fig. 6.6C) [Demtchouk et al., 2011]. Specifically, we expect that tips with small
standard deviations have relatively “blunt” tips (Fig. 6.6C, left), while tips with
larger standard deviations have more tapered tips (Fig. 6.6C, right). Using this ap-
proach, we quantified the distribution of tip standard deviations (σPF) for similar
lengths of Alexa-488 microtubules grown at 0.8 µm and 1.5 µm GMPCPP-Tubulin
(Fig. 6.6D). We found that the distribution of microtubule tip standard deviations
at a concentration of 0.8 µm GMPCPP-Tubulin is (99± 22) nm (mean±sd; n=700),
while the mean microtubule tip standard deviation at 1.5 µm GMPCPP-Tubulin is
(140± 55) nm (mean±sd; n=1120) (Fig. 6.6D). This difference in tip standard de-
viations (p < 10−15) suggests that microtubule tips are relatively blunt (with low
protofilament length variation) in 0.8 µm GMPCPP-Tubulin, while at 1.5 µm they
are more extended, with a larger variation in protofilament lengths. These results
are consistent with the prediction that a decrease in the mean number of subunit
lateral neighbors at the microtubule tip causes the mean subunit dissociation rate to
accelerate with increasing [Tub].
6.2.10 GTP-Tubulin Growth Variability is Consistent with Rapid Tubu-
lin Subunit On-Off Kinetics
To test whether the conclusions from our GMPCPP tubulin experiments would be
consistent with GTP-tubulin experiments at nearer to physiological concentrations,
we performed TIRF experiments with GTP-tubulin at 7, 9, and 12 µm, and also as-
sessed the variability of dynamic GTP-tubulin microtubules with the laser-tweezer
assay (results of Schek et al. [2007]. As is the case with GMPCPP-tubulin, the 2D
model predicts that both k∗on,MT and koff,MT will increase at higher [Tub] (Fig. 6.7A).
According to the 2D simulations, the increment variance will then increase propor-
tionate to the tubulin concentration. Therefore, in our previous study with ∼ 5 µm
114

GTP-tubulin in an in vitro laser tweezers microtubule assembly assay [Schek et al.,
2007] we should have observed a variance of ≈3-fold larger than in our present 1.5 µm
GMPCPP-tubulin experiments ( 5 µm1.5 µm ≈ 3). As shown in Fig. 6.7B, the variance
is ≈3-fold higher at ≈3-fold higher [Tub] (5 µm GTP-tubulin vs. 1.5 µm GMPCPP
tubulin both sampled at 0.5 s intervals).
In TIRF experiments with GTP-tubulin at 7, 9, and 12 µm, we observed an in-
crease in microtubule growth variability and in negative growth excursions in going
from 7 µm tubulin to 12 µm tubulin (Fig. 6.7C), similar to the GMPCPP tubulin
data. As described above, we then fit the mean-squared-displacement data to the
diffusion-drift model for each concentration (Fig. 6.7D). Using this method, the tubu-
lin subunit on rate (k∗on,MT) and the off rate (koff,MT) from the microtubule tip can be
directly estimated from the data (Fig. 6.7E, Table 2). Consistent with the GMPCPP
tubulin experiments, the experimentally estimated tubulin dissociation rate increases
substantially as the GTP-tubulin concentration is increased, and the net experimen-
tal microtubule assembly rate (blue) represents the small difference between a large
experimental on rate (green) and a large off rate (red), similar to the 2D model pre-
diction (Compare Fig. 6.7A and Fig. 6.7E). In these experiments, the measured range
of [Tub] is consistent with in vivo tubulin concentration estimates (supplemental data
accompanying Gardner et al. [2011]).
6.2.11 In Vivo Microtubule Growth Variability is Consistent with Rapid
Tubulin Subunit On-Off Kinetics
To assess how our in vitro data compare with microtubule growth in vivo we
measured microtubule growth at 0.5 s intervals near to the periphery of live LLC-
PK1α cells, as previously described [Bicek et al., 2009] (Fig. 6.8A). To assess the
measurement error, we also measured the length of microtubules in fixed LLC-PK1α
cells at 0.5 s intervals (tubulin concentration estimate 5–15 µm, supplemental data
115

Figure 6.7:Higher [Tub] result in increased growth variability in vitro. (A) A 2Dmodel predicts that subunit association rates and subunit dissociationrates will continue to increase for GTP-tubulin at higher [Tub]. (B) Be-cause of rising association and dissociation rates at higher [Tub], themicrotubule growth rate variability continues to increase for higher [Tub](5 µm GTP-tubulin data from Schek et al. [2007], downsampled to 0.5 sintervals) (C) TIRF experiments with GTP-tubulin qualitatively show in-creasing growth variability at 12 µm tubulin as compared to 7 µm tubulin.(D) The polymerization diffusion coefficient (Dp) and the microtubulegrowth velocity (vg) for three different concentrations of GTP-tubulin areestimated by fitting a quadratic curve to a plot of mean squared displace-ment (in microtubule length increments) vs. time step (∆t) as given byEqn. 6.7. By analyzing the mean-squared displacement vs. time-step dataat different [Tub], the subunit on rates, off rates, and net rates can beestimated in each case, as described in the text and summarized in Table2 and (E). (E) Experimental subunit on rates and off rates are plotted asa function of GMPCPP-tubulin and GTP-tubulin concentration. Similarto the 2D model prediction (Fig. 6.7A), the subunit off rate rises withincreasing [Tub] (red). The net assembly rate (blue) is given by the smalldifference between the large on rate (green) and the large off rate (red).Please see Fig. 6.8 for confirmation in vivo.
116

A B C
Figure 6.8:[Tub] and growth variability in vivo. This figure is further to Fig. 6.7.(A) Microtubule growth rates are measured near the cell periphery inboth live and fixed LLC-PK1α cells to measure the variance in growthrate at 0.5 s intervals (green: GFP-tubulin). (B) Microtubule length asa function of time for live and fixed microtubules. Growing microtubulesfrequently shift the net rate dramatically on a time scale of seconds. Inthis example, the net rate shifts from 600 s−1 to 110 s−1 in a period of afew seconds. (C) In vivo microtubule growth rate variance is nearly 5-fold higher than GTP-tubulin in vitro data at 5 µm. In vivo growth ratevariances are calculated by subtracting the fixed-cell measurement errorvariance from the live-cell data. Thus, the kinetic constants in vivo areat least as large as those estimated in vitro for GTP-tubulin at similarconcentrations.
accompanying Gardner et al. [2011]). As shown in Fig. 6.8B, there is high variability
in live-cell microtubule growth rates, consistent with previous reports [Shelden and
Wadsworth, 1993]. With our high-resolution tracking accuracy (∼36 nm) [Demtchouk
et al., 2011], we can now readily detect nanoscale changes in microtubule length,
including periods where the growth rate abruptly shifts (Fig. 6.8B). That the net
rate is commonly ∼600 s−1, at least transiently, strongly suggests that the in vivo
on-off dynamics are on the scale of 1 kHz. The in vivo variance in growth rate
at 0.5 s intervals is ∼1600 nm2 (after subtracting the fixed microtubule variance),
which is nearly 5-fold larger than the in vitro growth rate variance for GTP-tubulin
microtubules at ∼5 µm tubulin (downsampled to 0.5 s intervals). Thus, the kinetic
rate constants in vivo are at least as large as we estimate for in vitro assembly.
117

6.3 Discussion
Using nanometer-resolution measurements, we confirm that microtubule assembly
is highly variable and find this is due to the coordinate increase of both the on and off
rates of tubulin with increasing [Tub]. By using GMPCPP-tubulin we demonstrated
that the observed nanoscale variability is not the consequence of GTP hydrolysis-
associated effects. The increasing off rate at higher concentrations is incompatible
with a fundamental assumption of the classic 1D self-assembly model of Oosawa
[1970], and requires a large revision of the rates of addition-loss during overall net
microtubule growth (Fig. 6.9). Our analysis implies that the rates of tubulin addition-
loss have been consistently underestimated in the literature by at least an order of
magnitude. The analysis leads us to conclude that the on and off rates are nearly equal
at experimental and physiologic [Tub], so that net microtubule assembly results from
a modest difference between two large rates. This in turn implies that, in principle, a
cell can significantly alter net microtubule assembly via relatively weak modification
of the off rate, which was previously viewed as too small (relative to the on rate) to
serve as a significant point of control over microtubule assembly.
To explain our results, we find that a 2D model that accounts for both longitudi-
nal and lateral bonds in the microtubule naturally gives rise to an increasing off rate
at higher [Tub]. The origin of this effect in the 2D model is the increasing tendency
toward more tapered tips at higher [Tub], which we confirmed experimentally via
TIRF microscopy (Fig. 6.6). We also found that the variability of microtubule as-
sembly with GTP tubulin in vitro and in vivo is largely accounted for by the revised
kinetic rates, which under typical conditions occur at kHz frequency. In summary,
we found, using integrated experiments and computational modeling, that the kinet-
ics of microtubule assembly are far more rapid than previously thought. In light of
our findings, it will now be of interest to re-examine how microtubule assembly is
regulated by MAPs and therapeutic drugs, such as the anticancer drug paclitaxel.
118

Figure 6.9: Revised view of microtubule assembly kinetics. By accounting for a non-homogeneous tip structure in a 2D model of microtubule assembly, wefind that (1) the association rate constant for tubulin subunits duringmicrotubule assembly is an order of magnitude higher than previouslythought, (2) the tubulin subunit dissociation rate is not constant, as pre-viously assumed, but rather increases at higher [Tub], and (3) micro-tubule assembly is driven by rapid on and off events of individual tubulinsubunits, the rates of which increases with the increasingly tapered tipstructures observed at higher [Tub]. Under typical assembly conditions,∼10 µm GTP-tubulin, the combined kinetic rates are estimated to occurat nearly 1000 per second. At all [Tub] the association and dissociationrates are nearly equal to each other.
119

6.3.1 Relationship to previous studies
Previous studies have noted surprisingly high variability of microtubule assembly
using relatively low resolution transmitted light microscopy imaging (≈100-150 nm
resolution at ≈0.2-1 Hz) [Dye and Williams, 1996; Gildersleeve et al., 1992; Odde
et al., 1996; Pedigo and Williams, 2002]. From the study of Dye and Williams [1996],
it appeared that GTP hydrolysis was not responsible for the high variability, since
their studies were conducted using GMPCPP-tubulin. However, the relatively low
spatial and temporal resolution imaging techniques in this study limited the strength
of the conclusions that could be drawn. In agreement with our findings, Dye and
Williams proposed that the variability was likely due to structural configurations at
the microtubule tip, but they did not identify the rapid kinetics and variable off rates
from these lower resolution results. Recent advances in optical tweezers and digital
fluorescence imaging have enabled measurement of microtubule assembly dynamics
with nanoscale resolution at 1-10 Hz temporal resolution [Demtchouk et al., 2011;
Kerssemakers et al., 2006; Schek et al., 2007]. Our previous study using laser tweezers
to measure microtubule assembly from GTP-tubulin with 3.5 nm spatial resolution
and 10 Hz temporal resolution revealed surprisingly large fluctuations in assembly
at the nanoscale. The fluctuations presented themselves as substantial shortening
episodes during periods of overall net growth, corresponding in many cases to multiple
layers of tubulin dimers. However, these nanoscale-resolution studies examined GTP-
tubulin assembly, leaving open the possibility for variability due to GTP hydrolysis
[Howard and Hyman, 2009]. The present study now removes potential ambiguities
due to either low resolution or GTP hydrolysis by reporting the first measurements of
microtubule assembly in a single nucleotide state (GMPCPP) with nanoscale spatial
resolution.
120

6.3.2 Possible alternative explanations for high variability in microtubule
assembly
While the use of GMPCPP-tubulin, rather than GTP-tubulin, argues against
hydrolysis-mediated fluctuations, the surprisingly large variability in assembly could
potentially be explained without invoking rapid assembly kinetics.
We considered whether the mixed isotypes of tubulin, which was purified from
bovine and porcine brain, might contribute to variability in growth owing to a dis-
tribution of thermodynamic parameters for different tubulin isoforms or tubulin with
different post-translational modifications. However, in this case we would expect the
variability to remain approximately constant with increasing tubulin concentration,
since the concentrations of all isotypes would increase in constant proportion to the
total tubulin concentration. However, we observed by both TIRF microscopy and
by the laser tweezers assay that the variance increased with [Tub], arguing against
a significant role of tubulin isotype heterogeneity. We note also that a recent study
of variability in assembly found no significant differences between brain-derived β-
tubulin isoforms [Rezania et al., 2008]. Similar arguments apply to trace contamina-
tions from GTP and/or GDP in the β-tubulin subunit, rather than GMPCPP in the
β-tubulin, as the relative proportions should remain constant with increasing [Tub].
In addition, our results with GTP-tubulin yield the same on-rate constant as obtained
for GMPCPP-tubulin, and together show an increase in on-rate and off-rate across a
100-fold range of [Tub]. Finally, it has been shown that the fraction of GDP-tubulin
necessary to appreciably alter microtubule assembly is ∼40% [Vandecandelaere et al.,
1995].
In addition, while it is formally possible that defects incorporated into the lattice
could contribute to the observed microtubule growth variability, it is not clear why
there should be an increased fraction of defects between 0.8 and 1.5 µm GMPCPP-
tubulin, as the growth rate is only marginally more rapid at 1.5 µm as compared
121

to 0.8 µm (3.4 nm s−1 and 2.4 nm s−1, respectively). We also note that defects are
relatively rare, with estimates ranging from ∼1 per µm [Davis et al., 2002] to 1 per
4 µm [Chrétien et al., 1992]. Therefore, defects are expected to be too rare (< 1 per
1600 subunits) to be the dominant source of variability.
It could be argued that thermal fluctuations of the leading protofilaments could
drive the observed length fluctuations, but the expected deformations based on the
mechanical stiffness of protofilaments would be too small to give rise to the observed
variance, as described previously [Elie-Caille et al., 2007; Kerssemakers et al., 2006;
Schek et al., 2007]. The consistency of the laser tweezers and TIRF experiments also
argues against this possibility.
6.3.3 The 2D model for microtubule assembly
While it is possible to construct complex alternative explanations for variability
in assembly, the 2D model [VanBuren et al., 2002] provides a physically direct and
simple explanation. It also predicts that tips will be more tapered at higher [Tub],
which we confirmed experimentally for GMPCPP-tubulin, and has previously been
observed for GTP-tubulin in cryo-electron microscopy studies [Chrétien et al., 1995].
The 2D model provides a link between the structural observation of increasing
taper at higher [Tub] and the increasing off rate. The off rate increases at high
[Tub] because the protofilaments grow more autonomously from each other due to
the greater frequency of addition events, which do not depend on the neighbor’s state.
The resulting variability in protofilament length increases the frequency of subunits
with 1-neighbor (i.e., tapered) relative to subunits with 2-neighbors (i.e., blunt) at
the tips of each protofilament. Thus, while the 1D model is appealing in its simplicity,
it is inadequate to explain the variability in microtubule assembly. By contrast, the
2D model explains both the mean and the variance in microtubule assembly, as well
as the longer microtubule tip taper at higher [Tub].
122

One might wonder whether the transient binding events that we detected are
perhaps not productive in the sense that they may not contribute to GTP hydrolysis.
However, because of the stochastic nature of thermal forces, it is not possible to
predict how long a given subunit will remain in a microtubule after it has added
at the tip. Given our current lack of understanding of the hydrolysis reaction, it
is possible that every addition event could potentially stimulate hydrolysis of GTP-
tubulin. Therefore, in order to understand the hydrolysis reaction it is important
to first establish a firm understanding of the subunit addition-loss kinetics. Our
findings strongly support the use of a 2D assembly model for further investigation of
microtubule dynamics, including the hydrolysis reaction.
6.3.4 Implications for the Regulation of Microtubule Dynamics by MAPs
and Drugs
The finding that tubulin association and dissociation rates are substantially higher
than has been previously recognized significantly changes the conceptualization of
microtubule growth. For example, under typical GTP-tubulin concentrations of 10 µm
in vitro, we estimate an on rate k∗on,MT = 520 s−1 and an off rate koff,MT = 480 s−1, for a
net rate of 40 s−1 (1.5 µmmin−1) (Fig. 6.7E). Thus, the total number of events is about
1000 s−1. These estimates stand in marked contrast to previous kinetic rate constant
estimates, which would yield an order of magnitude lower on rate of k∗on,MT = 50 s−1 at
10 µm GTP-tubulin and a fixed off rate of koff,MT = 10 s−1. In addition, our analysis
and experiments imply that the on rates and off rates are nearly equal at all [Tub],
and the net microtubule growth rate is a small difference between similarly large
association and dissociation rates.
The near equality of on and off rates implies that infrequent and/or weak sup-
pression of the off rate should lead to dramatic shifts in net assembly for single
microtubules in vivo. Using our nanoscale resolution image analysis, which has single
123

time-point accuracy of 36 nm in LLC-PK1α cells [Demtchouk et al., 2011], we can
now see that such shifts are in fact the norm in living epithelial cells. As shown in
Fig. 6.8A, a growing microtubule shifts from a net rate of 600 s−1 to 110 s−1 in a mat-
ter of a few seconds. This sequence clearly shows a “hypersensitivity” of assembly,
where the net growth state fluctuates wildly, perhaps due to weak and infrequent
interactions with MAPs.
The near equality of on and off rates also implies that a slight tipping of the
balance by a single MAP at the microtubule tip might significantly affect catastrophe
and rescue in vivo. For example, weak suppression of the off rate by a stabilizing MAP
would lead to a rapid and significant increase in the microtubule GTP-cap size, and
a corresponding substantial decrease in catastrophe frequency. Furthermore, a much
larger off rate allows a substantial range of growth regulation to be exerted purely
through suppression of tubulin loss from the microtubule tip. This has important
implications for explaining how a MAP such as XMAP215/chTOG, which is over-
expressed in colon and hepatic tumors, promotes assembly. Growth rates in vivo and
with this MAP in vitro are commonly 2-10 fold higher than with pure tubulin at
∼ 10 µm GTP-tubulin [Cassimeris et al., 1988; Charrasse et al., 1998; Pryer et al.,
1992; Rusan et al., 2001; Shelden and Wadsworth, 1993; Vasquez et al., 1994]. In the
context of the 1D model, a 10-fold increase in growth rate can only be achieved by
increasing the on rate because, for example, suppressing tubulin dissociation entirely
(i.e., decreasing the off rate from 10 s−1 to 0 s−1) would only achieve a 25% increase
in net assembly rate. However, in the 2D model, a ten-fold increase in net growth
rate by a MAP can be achieved simply by suppressing the off rate by a factor of two.
Such a mechanism of growth enhancement is similar to that proposed by VanBuren
et al. [2002] and Brouhard et al. [2008] to account for the 5-fold acceleration of growth
rate by XMAP215.
Other possible examples include the neuronal MAPs, tau and MAP2, which pro-
124

mote microtubule assembly in vitro at sub-stoichiometric concentrations [Drechsel
et al., 1992; Pryer et al., 1992]. This could then be important in maintaining the
neuronal phenotype without requiring high MAP expression levels.
Conversely, a weakly destabilizing MAP would be expected to tip the balance
strongly toward catastrophe. The best understood catastrophe-promoting MAP,
MCAK, seems to at least partly fulfill this description. The catalytic effect of MCAK
is to increase the tubulin off-rate by 100-fold [Hunter et al., 2003], which corresponds
to a modest free energy increase of ∆G0 = ln 100 = 4.6kBT . Interestingly, this energy
turns out to be nearly equal in magnitude to our estimate of the lateral bond energy
in the 2D model (−4.5kBT to −5.0kBT ; Table 6.2). In addition, MCAK’s catalytic
effect on the off-rate is only weakly cooperative, so that even a single molecule is able
to affect the off-rate (Hunter et al., 2003). The in vivo expression level of MCAK is
crucial to maintenance of proper ploidy, which is important to avoid progression into
a cancerous phenotype [Bakhoum et al., 2009a,b].
One example of high sensitivity to limited numbers of MAPs in vivo is the
length-dependent disassembly of budding yeast kinetochore microtubules mediated
by kinesin-5 motors, Cin8p and Kip1p, which establishes the congressed state char-
acteristic of metaphase mitotic spindles [Gardner et al., 2008b]. In the metaphase
budding yeast spindle, there are an estimated 40 microtubules and 50 kinesin-5 mo-
tors bound to the spindle [Gardner et al., 2008b; Winey et al., 1995]. This ∼1:1
microtubule:motor stoichiometry implies that even a single kinesin-5 motor at the
plus end has a significant impact on the microtubule assembly state. From modeling
studies, it was estimated that the presence of a single motor at the plus end was suffi-
cient to promote catastrophe ∼10-fold [Gardner et al., 2008b]. Given that metaphase
yeast kinetochore microtubules contain on average about 600 tubulin dimers, the ef-
fect of the motor can be regarded as even more potent, with about one motor per
∼600 tubulin dimers.
125

Slight tipping of the balance between addition and loss may play a role in rescue
as well. For a rapidly disassembling microtubule in vitro, the net shortening rate
is ∼−30 µmmin−1 (−500 nm s−1), or −800 s−1 [Walker et al., 1988]. In this case, we
estimate that at 10 µm GTP-tubulin the on rate is∼ 600 s−1, so the off rate is 1400 s−1,
or about a 2-fold difference. This stands in marked contrast to the 1D model, which
views the same −800 s−1 net disassembly rate as being due to an on rate of nearly
zero and an off rate of 800 s−1. The 1D model explanation is problematic, as it implies
that the on rate, which is presumably driven by translational and rotational diffusion
of subunits [Northrup and Erickson, 1992], suddenly goes to zero once catastrophe
has begun. With the 2D model, it now becomes relatively easy to understand how
rescue can occur in the absence of MAPs or drugs (because the on rate is not near
zero in the 2D model), and furthermore how these agents can in turn alter the rescue
rate under substoichiometric conditions.
Hypersensitivity of assembly can also potentially facilitate rapid cell-wide micro-
tubule array reorganization. A prime example of a dramatic microtubule reorgani-
zation process is Drosophila embryo mitosis, where a mitotic spindle forms, segre-
gates a genome, and subsequently disassembles in a matter of minutes [Stiffler et al.,
1999]. Such dramatic transitions in vivo occur under conditions of fixed total tubulin
concentration, which serves to buffer perturbations to net assembly [Mitchison and
Kirschner, 1987]. For example, if an assembly-promoting MAP is upregulated, then
the initial response will be potent. However, as net assembly is promoted, the free
concentration will drop, which will mitigate the assembly-promoting activity. Thus,
constant total tubulin concentration will act to buffer and mitigate perturbations
to microtubule dynamics, and confer a degree of robustness and homeostasis on the
microtubule cytoskeleton. To overcome the built-in cell-level buffering effect and per-
form highly dynamic operations such as mitosis, the microtubule array needs to be
hypersensitive.
126

To summarize, it will be important to revisit current models for microtubule reg-
ulation in vivo via MAPs and therapeutic drugs in light of our findings. In particular,
because both on and off rates are rapid and nearly equal, MAPs that promote net
microtubule assembly could work through a modest suppression of tubulin subunit
off-rates [Brouhard et al., 2008; Murphy et al., 1977; Pryer et al., 1992; VanBuren
et al., 2002, 2005].
6.3.5 Implications for Other Multi-stranded Filaments
More generally, our results identify a fundamental theoretical limitation to the
1D model of Oosawa, which has been used for nearly 40 years to interpret kinetic
self-assembly data of microtubules, F-actin, viruses, and amyloid aggregates [Cannon
et al., 2004; Collins et al., 2004]. It will be important to revisit earlier 1D model-based
studies to confirm that the assumption of constant subunit dissociation rate holds for
self-assembled polymers containing both longitudinal and lateral interactions, since
presently established kinetic estimates for these biological assemblies may need to be
revised as we have found with microtubules.
6.4 Methods
6.4.1 Tweezers experiments
A microtubule linked to a 0.57-µm diameter silica bead was trapped by optical
tweezers and oriented toward a microfabricated barrier. A weak force clamp was ap-
plied (∼0.2 pN) to abut the microtubule against the barrier. Schek et al. [2007] (their
Fig. 6B) showed that the applied force of 0.2 pN has only a modest effect on the net
growth rate. Experiments were conducted at 34 ◦C. In the laser-tweezer experiments,
we detect microtubule length changes without large variability at 0.5 µm GMPCPP
tubulin, and then observe increasing growth variability with increasing GMPCPP
127

tubulin concentration. Therefore, the laser-tweezer data is internally controlled by
using a range of GMPCPP-tubulin concentrations.
6.4.2 TIRF microscopy experiments
Assembly of GMPCPP-Tubulin labeled with Alexa-488 (55% labeled, Invitro-
gen Corp.) onto Rhodamine-labeled GMPCPP-Tubulin seeds was imaged by TIRF
microscopy as described [Gell et al., 2010]. Images were collected with an Andor
iXon camera on a Zeiss Axiovert 200 M microscope using a Zeiss100X/1.45 NA Plan
FLUAR objective. A 2.5X Optovar was used to provide additional magnification and
to limit pixel size to 64 nm. An objective heater was used to warm the flow channel
to 35 ◦C for GMPCPP experiments. Although the time-lapse interval for collecting
images was 700 ms, all of the images were collected at 100 ms exposure times, regard-
less of concentration. GTP experiments were performed at 1mm GTP at 30 ◦C. At
higher tubulin concentrations where the growth rate becomes rapid, we found that
the drift term is dominant even over short times, and the diffusive term is difficult to
accurately estimate within the experimental TIRF data temporal resolution.
Fixation experiments were performed by flowing in a mixture of BRB80 with
0.05% Glutaraldehyde once microtubule extensions achieved the appropriate length.
Similar tip structure distributions were used for each concentration to accurately
compare fixed and live microtubule growth increments.
6.4.3 Simulations
Simulations were performed as described Schek et al. [2007]; VanBuren et al. [2002]
with a hydrolysis rate of zero. For the rare cases where a lagging protofilament had
two longer neighboring protofilaments, we also included an on-rate penalty to account
for steric hindrance. Here, the on rate constant was described as kon,PF/δ, where δ is
the on-rate penalty.
128

CHAPTER VII
Summary and recommended future directions
7.1 Summary
The present work demonstrates a new assay for probing the mechanics of a mitotic
spindle pole and provides, to our knowledge, the first measurements of the mechanics
of isolated spindle poles. We find that microtubules undergo bidirectional motor-
driven movement and are attached to the pole by cross links (which may be motors)
that have a compliance suited to spindle-pole attachment. We also find that the
kinesin-5 Eg5 decreases pole compliance.
The present work also provides evidence that the exchange of αβ-tubulin subunits
at the tips of microtubules is an order of magnitude faster than has generally been
believed, with the net growth rate resulting from high on and off rates that are
roughly equal. Models of subunit exchange must, unlike the 1D Oosawa model, take
into account differences in lateral interactions between subunits at the tip in order to
provide an adequate description of microtubule polymerization.
129

7.2 Recommended future directions
7.2.1 Mechanics of the mitotic spindle
The data on the mechanics of asters suggest new avenues of investigation. Several
established biochemical depletions [Chakravarty et al., 2004] were not attempted in
this study. For comparison across species, a study of asters formed in Xenopus ex-
tracts [Ohba et al., 1999] may yield important new data, though such extracts may
not be appropriate for optical trapping due to excessive debris (Henry Schek, personal
communication). A study of the mechanics of centrosomes might yield new insight
into their mitotic functions. For instance, they might be found to be far stiffer than
HeLa mitotic asters, suggesting that they act as the firm anchors of the spindle while
compliant acentrosomal connections provide malleability. Effects of centrosome mu-
tations and changes in centrosome mechanics over the course of their maturation in
the cell cycle might also be of interest. Finally, a study of asters formed from simple
sets of purified components [Hentrich and Surrey, 2010; Surrey et al., 2001] would
allow a more quantitative reductionist approach in which mechanics could be related
to the concentrations of components present. (For mitotic extract studies, complete
depletion of a component and partial restoration of its concentration by exogenous
addition might also be of interest.)
7.2.1.1 Technical considerations
To obtain stiffness and drag coefficient for any aster (as opposed to only those
with fortuitous breakage events), it should be possible cause an exponential jump in
position by abruptly changing the applied force. This would complement or replace
the thermal noise approach.
An alternative protocol in which beads are attached to asters by mixing before
addition to the experimental chamber should be considered. The advantage of such an
130

approach would be ease of assay execution and, therefore, increased data collection.
The disadvantage would be inferior estimation of the equilibrium bead position in the
trap and, therefore, of applied force.
7.2.2 Microtubule polymerization dynamics
The effect of buffer conditions, an isoform change, or the presence of a MAP or
drug on kon,MT and koff,MT, obtained from Dp and v̂g, may yield information about its
mechanism of action. (Also of interest would be its effect on surface roughness, related
to its effect on ∆GLateral.) Considering that some differences between tubulin isoform
sequences tend to be located in regions of lateral contact, it would be interesting to
predict by analysis of sequence and structure, and also by computation [Mitra and
Sept, 2008; Sept et al., 2003], which isoforms would have the strongest and weakest
lateral interactions, and to assess experimentally whether these isoforms differ in their
polymerization dynamics and their tip structure. The MAP doublecortin appears to
have little effect on the mean or variance of v̂g, which suggests it may not affect
kon,MT and koff,MT [Moores et al., 2006]. In contrast, in one study, tau appears to
have increased both the mean and the variance of v̂g, which would seem to suggest
an increase in both kon,MT and koff,MT Drechsel et al. [1992], though increasing the
(presumably nearly diffusion limited) kon,MT seems unlikely. In neither of these studies
were the authors focusing on analysis of the variance of v̂g, and precise estimation
of kon,MT and koff,MT requires Dp and v̂g from root-mean-squared length increment
analysis. Studies on the effects of microtubule-targeted drugs Jordan and Wilson
[2004] may find that their mechanism of action includes, for instance, suppression of
kon,MT and koff,MT, which would suggest the importance to mitosis of rapid subunit
exchange.
A natural extension of Chapter VI is to observe the evolution of tip structure
over time by TIRF microscopy and attempt to correlate events in this evolution
131

with catastrophe. This has been done by cryoelectron microscopy [Chrétien et al.,
1995] in a population-based approach that does not allow observation of a change
in the structure of one tip that is followed by catastrophe. Catastrophe kinetics are
consistent with a multistep process [Odde et al., 1995], so it would be reasonable to
hypothesize that one of these steps involves evolution of tip structure. For instance,
that blunting may be correlated with catastrophe, as suggested by Arnal et al. [2000],
was contradicted by the simulations of VanBuren et al. [2005] and is inconsistent with
the experiments of Höög et al. [2011]. Considering Fig. 4.9A and C (p. 4.9), it may
be difficult to predict whether an initially blunt or tapered tip would be more stable
as the tip structure develops over time. For the tapered tip (C), a large fraction of
the GTP subunits have one lateral neighbor and, therefore, a high dissociation rate;
on the other hand a large fraction of vacancies have a neighbor so that new subunit
additions would be relatively stable, in contrast to the many futile additions to a blunt
tip. The VanBuren et al. [2005] simulations indicate the blunt tip should be more
stable (the authors suggested that the tips Arnal et al. identified as growing were
actually rapidly shortening). Supporting this lack of correlation, the tips observed
by Höög et al. [2011] were relatively blunt, but it is difficult to interpret these results
because they were obtained in cells in which MAPs may be assumed to have had a
pronounced effect. In the event that, in agreement with Arnal et al. [2000], blunting
is correlated with catastrophe, it may be interesting to consider that the tips observed
by Höög et al. [2011] were also curved. That curvature might reduce hydrolysis rate
has been given some consideration [Howard, 2001], with indirect evidence obtained
by Wang et al. [2007], and this might resolve the disagreement: blunting would be
correlated with catastrophe because the subunits in a blunt tip cannot fully close the
tip and simultaneously have outward curvature, whereas a tapered tip would contain
subunits partially protected from hydrolysis due to their curvature. However, this is
highly speculative.
132

Direct measurement of subunit exchange would be possible with an assay∗ similar
to that of Needleman et al. [2010] combined with more conventional TIRF microscopy
microtubule polymerization assays Gell et al. [2010], in which the fraction of subunits
labeled is low enough to resolve individual association and dissociation events. Asso-
ciation and immediate dissociation of zero-neighbor subunits would probably not be
observable, but a portion of the distribution of subunit lifetimes could be obtained,
particularly for low [Tub] in the presence of GMPCPP. It might be useful to repeat
observations at varying illumination intensity to assess the effects of photobleaching.
An advantage of this assay is that it would provide one of the most direct possi-
ble observations of fast subunit exchange, independently verifying the conclusions
of Chapter VI. The Oosawa 1D model would predict loss of signal due primarily to
photobleaching, whereas the 2D model would predict a broad distribution of subunit
lifetimes. This assay would also allow further validation of VanBuren-type simu-
lations. Mirny and Needleman [2010] provide a biased-random-walk framework for
subunit lifetime (here, the time for the random walker to return to the origin) that
predicts mean lifetime given by 4Dp/v̂2g. In a related assay with a much higher la-
beling ratio, it might be possible to assess fluctuations in exchange rate based on
fluorescence intensity.
A review of the literature will reveal studies in which conclusions are based on
tubulin subunit exchange rates obtained using the Oosawa model. These conclusions
may need to be revised. For instance, Caplow and Shanks [1996] base one of their
arguments on the assumption the number of subunits added to the tip in an incubation
should not be sufficiently variable to explain variability in cap lifetime, but a rough
calculation suggests this argument may, based on the present work, not be valid.∗The possibility of this assay was described to me by Edgar Meyhöfer.
133

7.2.2.1 Technical considerations
A large fraction of the computational expense in VanBuren-type simulations is
presumably due to futile zero-neighbor addition-loss events that shorten the variable-
length timestep. It may be useful to reduce computational expense by replacing zero-
neighbor additions with pair additions, the statistics of which would be determined
by theory or by simulation. However, implementation, if valid, would be complicated
and would make the model less elegant.
It may be advantageous to fabricate barriers entirely out of glass, making fine
features by femtosecond-laser machining. The arbitrary geometry made possible by
laser machining would allow a design in which a much shorter microtubule could be
used, allowing the application of higher forces and, for experiments at lower forces,
increasing success rate because a larger fraction of microtubule-linked beads found
would be useable. In the case experiments in the presence of microtubule stabilizers,
this would also increase the quantitity of data collected because one could start with
the shortest possible microtubule and allow it to grow as long as practically possible.
These all-glass barriers might also have longer shelf life and be reusable, whereas
LOR3B/SU8 barriers seem to become sticky after 1.5 to 2 weeks, possibly due to
delamination. A further advantage of glass is that adjustment of its surface chemistry
is well established, and the barrier would be made of 1 material instead of 3. However,
if gross features in the all-glass (or quartz) barriers are made by hydrofluoric acid
etching, it might make the glass unsuitable for microscopy and trapping.
The mask presently used for barrier fabrication is the original mask from the
earliest stages of development of the barrier assay. A redesign of the mask would be
a cost-effective way to increase throughput. This mask current is patterned far more
densely than is necessary, and this makes it more difficult to trap beads at depths of
tens of µm, which likely increases the failure rate of experiments. Furthermore, the
barriers are triangular, with a back wall that serves no purpose but tends complicate
134

positioning of a microtubule in the barrier; a diamond shape may be more appropriate.
Not entirely explicit in the present work are two recommended technical adjust-
ments: The piezoelectric mirror that steers the trapping laser focus in the focal plane
is provides analog strain gage sensor monitoring output. These have been recently
connected so that mirror position changes can be recorded in all experiments. There
are two advantages of doing so: it makes explicit to the user whether the mirror’s
dynamic response is adequate for the experiment being performed, and it may reveal
failure of the piezo-controlled mirror or amplifier before resources are wasted attempt-
ing assays. For instance, a large data set was recently discarded due to noise issues,
and it later became apparent that the piezo mirror was oscillating due to malfunction
of its power supply. A second adjustment is the collection of raw video data rather
than background-subtracted video data, allowing vastly superior automated drift-
tracking in barrier experiments. Background-subtracted video allows visualization
of the microtubule but because the barrier is part of the background image (this is
likely unavoidable), its drift becomes difficult to track automatically in background-
subtracted images.
This section has summarized a small sample of the possible avenues of future
investigation and made technical recommendations.
135

APPENDICES
136

APPENDIX A
Mechanics of Mitotic Asters: supplementary data
and discussion
A.1 A simple model of pole compliance and force transfer
Strictly speaking the data of Chapter III does not address flux, as the microtubules
in the asters are not dynamic. However, it is useful to consider how the compliances
we observe could influence flux, while recognizing that asters are a model system
that does not capture all aspects of spindle poles (e.g., centrosomes and dynamic
microtubules). We therefore restrict the following discussion to “order of magnitude”
arguments. As depicted in Fig. 3.4A (p. 45), compliant cross-links spanning between
microtubules fluxing poleward will distribute loads such that the speeds of micro-
tubule movements become similar. However, the ability of fluxing microtubules to
bear loads ultimately depends on transfer of these loads to the relatively stationary
overall structure of the pole: the microtubules must be anchored to the pole, even if
the anchors are dynamic, and the location of the pole within the cell is relatively im-
mobile. To mediate force transfer between continuously fluxing microtubules and the
relatively stationary pole, cross-links must periodically detach, rearrange to relieve
137

accumulated strain, and rebind. Moreover for the poles to maintain their structure
in quasi-steady-state, the rate of detaching must approximately equal the rate of
rebinding (see discussion of equation (A.1) below).
As discussed in section 3.2.5 (p. 43), for the compliance we observe the cross-links
between a fluxing microtubule and relatively immobile components must detach after,
on average, about one second (for flux at 10 nm/s) to avoid loads that would substan-
tially slow a typical motor protein. To illustrate the importance of compliance for
maintaining the structure of the pole, consider what happens if the compliance were
abruptly decreased 10-fold, similar to an actomyosin cross-bridge. Stress would build
more quickly, and the detachment rate would have to increase 10-fold to avoid slowing
microtubule movements. This would in turn decrease the time that the cross-links are
bound by a factor of 10, and similarly decrease the effectiveness of force distribution.
Furthermore the large fraction of time that the cross-links are unbound will increase
the likelihood that the microtubule can be pulled out of the pole altogether. Thus the
stiffness must be matched to the other physical characteristics to maintain the polar
architecture. Possibly a different compliance could be accommodated by changing
the structure of the pole (e.g., such that the steady-state number of cross-links is
restored), and this may in part explain pronounced changes in structure that accom-
pany disruption of spindle components that cross-link microtubules [Gaglio et al.,
1995, 1996, 1997; Mountain et al., 1999].
A more quantitative treatment of these arguments follows. To obtain an expression
for the number of cross-links at steady state, suppose there are N possible cross-links,
of which Na are attached, and suppose attachments form at rate (N −Na) kon and
detach at rateNakoff . At steady state, these rates are equal, so number of attachments,
Nss, is given by:
Nss = Nkon/(kon + koff) (A.1)
Initially we consider the behavior of a single cross-link to obtain expressions for how
138

transmitted force is affected by cross-link stiffness, κ; motor speed, v1; maximum
motor force, Fmax; and the maximum force cross-links can bear, Fsmax. Consider
Fig. 3.4A (p. 45) without motor 2 and with microtubule 2 fixed. Motor 1 moves
microtubule 1 at speed v1 > 0 (so the x axis is inverted). We assume the cross-link is a
Hookean spring with stiffness κ, stretched by a force Fs. Suppose that as microtubule
1 moves, the cross-link is stretched so Fs increases from 0 to Fsmax, at which point
the cross-link detaches from one of the two microtubules, relaxes, and reattaches at
a different position with Fs =0. The resulting Fs vs. time (or transmitted force vs.
time) curve would consist of cycles (Fig. A.1) in which Fs rises, abruptly drops to
zero, and rises again. The downward curvature reflects the motor(s) slowing as the
force builds. The average amount of time the cross-link is attached in one cycle is
given by τa = 1/koff , and τd = 1/kon is the average time it is detached. If 〈Fs〉a is
the average stress on the cross-link when it is attached to both microtubules then the
time-averaged force transmitted from one microtubule to the other is
FT = 〈Fs〉a τa
τa + τd= 〈Fs〉a
1 + τd/τa(A.2)
Following the approximately linear force versus speed relations that have been ob-
served for single motor proteins, we assume motor speed decreases with force accord-
ing to:
v1 = v1 max
(1− Fs
Fmax
)(A.3)
where v1max is the unloaded motor speed, Fmax is the force at which motor speed
reaches zero, and Fs ≥ 0 is the inhibitory load on the motor due to the cross-link
(= κξ where ξ is the strain of the cross-link). If a cross-link attaches at time t = 0
with strain ξ = 0, using dx = v1dt and dx = dξ, we have
dξ
dt+ v1 maxκ
Fmaxξ = v1 max (A.4)
139

Solving equation (A.4) and multiplying by κ to obtain the spring force yields
Fs (t) = Fmax(1− e−v1 maxκt/Fmax
)(A.5)
The average spring force during the attached time τa is
〈Fs〉a = Fmax
τa
∫ τa
0
(1− e−v1 maxκt/Fmax
)dt = Fmax + Fsmax
ln (1− Fsmax/Fmax) (A.6)
From equation (A.6), the mean force stretching the cross-link while it is attached
depends on the maximum force the motor can generate and on the force at which the
cross-link detaches. Noting that Fsmax = Fs (τa), we obtain from equation (A.5) that
τa = − Fmax
v1 maxκln(
1− Fsmax
Fmax
)(A.7)
From equation (A.7), since τa ∝ 1/κ, an order of magnitude change in stiffness would
cause an order of magnitude change in attachment time. This would result in either
failed aster formation or aster formation at a new steady state. Thus the specific
steady state structure of an aster depends on the values of κv1 max, Fsmax, and Fmax.
Consider a microtubule attached to the aster via one cross-link. From equation
(A.7), assuming Fmax = 7 pN, Fsmax = Fmax/2, κ= 0.025 pN/nm, and v1max = 30 nm/s,
we have τa ≈ 6 s−1 ∗. This is long enough to allow the motor to move the microtubule
a substantial distance, but short enough to allow rearrangements quickly relative to
the timescale of mitosis. More consistent with our estimate of a handful of cross-links
would be, say Nss = 5, and the stiffness would be divided between these. Taking
koff = 1/τa, the overall steady-state detachment rate is koffNss ∼= 1 s−1, and new at-
tachments must form at this same rate. To get a feeling for the sensitivity of the polar∗Here we assume Fmax consistent with one or two motor proteins, in keeping with our estimate
of a handful of cross-links total, including cross-links formed by motors. Fsmax is taken as half thisvalue since flux does not exhibit overt variations in speed, suggesting the load on the motors rarelyapproach the stall force. v1max was chosen to be similar to the speed of flux or unloaded Eg5.
140

time
offa k1=τ
κξ=
sF
maxsF
ond k1=τ0
0>ξ
Cro
ss-li
nk fo
rce,
Figure A.1: Quantitative model of force transfer. Cross-link force, Fs, vs. time overcycles of detachment and reattachment based on the supplemental dis-cussion of force transfer; see equations (A.5)-(A.7). As a motor movesone microtubule relative to the other, the inhibitory force, Fs, due tothe cross-link between them slows the motor. When Fs reaches Fsmax,the cross-link detaches and, after time τd, reattaches. Inset: graphicaldepiction of ξ.
141

structure to cross-link stiffness, consider the effect of an order of magnitude change.
An order of magnitude increase in stiffness would reduce τa and increase koff such that
the average number of cross-links Nss would drop below one, severely compromising
the transfer of loads between microtubules to the point where loaded microtubules
would frequently detach from the pole, if the structure of pole could be maintained
at all. Note however that the distribution of cross-links might shift so that the rate of
attachment increases, or the microtubules might rearrange so that more microtubule
lengths come in close proximity to accommodate more cross-links. Thus compliance
changes might be accommodated by changing the structure of the pole, though it is
not possible to predict the nature of such a structural change without more informa-
tion on the spindle structure and the kinetic behaviors of the cross-links. An order
of magnitude reduction in compliance would not compromise force transfer, but the
attached time would increase to τa ≈ 60 s, over which time the cross-link would be
strained about 2 µm. It is difficult to envision that any of the known nanometer-scale
cross-linking proteins could be strained this much, and such large distortions of the
polar structure are not observed in our assays or during mitosis. Thus we conclude
that the observed stiffness is well-matched to maintaining the structure of the pole
– substantially different stiffness would either result in failure to form or maintain a
microtubule focus, or produce substantial alterations of the overall structure and/or
cross-link dynamics at the pole.
A.2 Supplemental data
142

ATP (Control)AMP-PNP
Eg5-DepletedMonastrolA
0 60 120 180
0200
0200
0 60 120 180 240 3000
200
0 60 120 180
0200
time (s)
B
0 60 120 180
0200400
0200400600800
0200400600
0200400600800
0 60 120 180 240 300
0200400600800
10001200
0200400
0 60 120 180-100100
0200
0200400600800
1000120014001600180020002200240026002800
time (s)C
0 60 120 1800
200400600
0 60 120 180 240 300
0200
-2000
-2000
0 60 120 180
0200
0200400
time (s)
1.3 pN1.3 pN
2.7 pN6.7 pN
9.4 pN4.6 pN
1.3 pN2.6 pN
1.5 pN1.5 pN
1.4 pN
2.5 pN
1.8 pN9.6 pN
1.8 pN4.9 pN
4.9 pN
4.1 pN
0.4 pN 5.4 pN
0.7 pN4.9 pN
1.2 pN
1.3 pN
1.0 pN
1.0 pN
4.9 pN
1.6 pN
1.3 pN
5.2 pN5.2 pN
0.8 pN
0.7 pN4.1 pN
10.2 pN4.1 pN
0.7 pN4.1 pN
2.0 pN
1.4 pN
chan
ge in
bea
d x
posi
tion
rela
tive
to a
ster
(nm
)A
ntip
olew
ard
Figure A.2: Position vs. time traces for ATP, AMPPNP, monastrol. Color coding ofexperimental conditions as in Figs. 3.2 and 3.3A, p. 32 and 37. Positionvs. time, formatted as Fig. 2a with each set of axes corresponding toone aster for (A) AMP-PNP, (B) ATP (control), (C) monastrol. Eachset of axes contains a set of plots from one aster in sequence, beginningwith the earliest trace at the bottom. These asters correspond to thoseused for stiffness analysis (Fig. 3.3A) except that 3 were not used for Fig.3A because pre-attachment data were not available. The force appliedby the optical trap for each is also marked. In some cases we changedthe applied force between subtraces, but this did not have any obviouseffects over the range of forces applied.
143

BPA
beads S P PAbeads S P
Control Anti-Eg5 immune
Eg5
NuMA
Tubulin
chan
ge in
bea
d x
posi
tion
rela
tive
to a
ster
(nm
)A
ntip
olew
ard
A
0 60 120 1800
200400600800
10001200140016001800-200
0200400600800
100012001400160018002000220024002600
0 60 120 180 240 300
0200400
-2000
200400
0200
0 60 120 180
0200400
-600-400-200
0200400600800
10001200140016001800200022002400
time (s)
1.3 pN
1.4 pN
1.4 pN
1.4 pN
1.5 pN
0.6 pN4.6 pN
0.6 pN
0.8 pN
5.1 pN0.8 pN
5.0 pN0.7 pN
0.7 pN
0.5 pN4.2 pN
0.5 pN
Figure A.3: Position vs. time traces for Eg5 depletion and assessment of Eg5 deple-tion. (A) Eg5 depletion plots formatted as Fig. A.2. (B) Immunoblotanalysis of Eg5 in cell extracts. Following depletion of the extract, beadswere recovered and the extract was separated into 10,000 g soluble (S)and insoluble (P) fractions after the induction of microtubule polymer-ization. PA beads refers to Protein-A agarose beads. These fractionswere subjected to immunoblot analysis using antibodies against NuMA,Eg5 and tubulin as shown.
144

A
fract
ion
belo
w ∆
xes
timat
ed p
roba
bilit
y de
nsity
∆x (nm)-400 -200 0 200 4000
0.25
0.5
0.75
1
0
5
10
15
20x 10-3
Antipoleward
B
fract
ion
belo
w v
xes
timat
ed p
roba
bilit
y de
nsity
vx (nm/s)
-100 0 1000
0.25
0.5
0.75
1
0
0.05
0.1
0.15
Antipoleward
ATP (Control)AMP-PNP
Eg5-DepletedMonastrol
Figure A.4:Estimated ∆x and vx distributions. Estimated probability density (up-per) and cumulative distribution (lower) functions for (A) ∆x and (B)time-weighted vx. For estimated probability density, the MATLABksdensity function was used with the triangle kernel and with width2.5 nm/s for vx and 5 nm for ∆x.
145

B C
chan
ge in
bea
d x
posi
tion
rela
tive
to a
ster
(nm
)
0 1 2 3 4-20
0
20
40
60
80
100
time (s)
time (s) time (s)
chan
ge in
x p
ositi
on (n
m)
x bead
(nm
)y be
ad (n
m)
chan
ge in
x p
ositi
on (n
m)
x bead
(nm
)y be
ad (n
m)
A
0
50
100
-150
-100
-50
89 90 91 92-50
0
50
0
50
100
-150
-100
-50
142 143 144 145-50
0
50
Ant
ipol
ewar
d
Ant
ipol
ewar
d
Figure A.5:Additional exponential jump data. (A) Second exponential jump ob-served in the AMP-PNP recording. Fit formatted as Fig. 3B showingthe second jump of microtubule position in a pole in AMP-PNP. (B-C)Force clamp performance during exponential jumps. (B) Plots formattedas Fig. 1C-D but for the time interval used for the exponential fit of Fig.3B. In the upper panels, each trace is shifted vertically such that theypass through the same point at the beginning of the interval. The aster(green) moves little. The middle plot (xbead vs. time) shows that theforce clamp initially does not maintain constant force, with a 16.5-nmjump at 88.6 s. This had a small effect on the applied force and didnot affect the measurement of changes in bead position relative to theaster. To minimize phase distortion in the filtered traces, forwardback-ward filtering was used (MATLAB filtfilt function). (C) As (B), butcorresponding to Figure S2A and with a 24.5-nm jump at 142.3 s.
146

0 20 40 60 80 100 120 140
0
10
20
30
40
50
60
time (s)
chan
ge in
x p
ositi
on (n
m)
segment 1segment 2segment 3fit
Figure A.6: Exponential fit to joined segments between jumps. From the trace inwhich the jumps occurred, segments (1, 2, 3) between jumps were ex-tracted and aligned by forcing the x position at the end of one segmentto match the mean of the first two points in the next segment. Selectionof segment start and end points was arbitrary. The resulting curve wasfit to an exponential representing another viscoelastic element in serieswith those that broke. This fit yielded values κa = 0.062±0.002 pNnm−1
and γ = 3.5± 0.3 pN s nm−1.
147

APPENDIX B
The Hill 2D model
Further to section 4.3.1.2 (p. 64), this appendix summarizes, for a simple case,
the 2D model of Hill [1986] and describes some of its implications. For reference,
Table B.1 summarizes some of the key adaptations of Hill’s nomenclature. Several
symbols (e.g., vg, kon,MT) defined in Table 4.2 (p. 62) are used.
Table B.1: Comparison of Hill’s nomenclature and that of the present workHill Present work Relationshipc [Tub] equals NPF equalwh ∆GLateral equali j equalmi Lj equal (Hill set the minimum Lj to
0, which is not explicit below)α, β kon,PF, k(1)
off,PF similar depending on assumptionsx Γ x = Γ−1
aλν , bνλ γoff,q similar?
Hill used ∆GLongitudinal and ∆GLateral, neglecting the entropic penalty of subunit
immobilization, presumably implicitly recognizing that, as done by VanBuren, the
penalty can be incorporated into the longitudinal term when considering subunit
exchange at the tip. VanBuren used free energies under standard conditions (see
erratum accompanying VanBuren et al. [2002]), but implicitly ∆GLateral = ∆G0Lateral.
148

We follow very closely the treatment of Hill [1986]. Early material provides some
of the basis for the model of VanBuren et al. [2002] used in Chapter VI. Much of
the remainder is a quantitative discussion of the fact that mean dissociation rate
depends on tip structure, and tip structure depends on [Tub], so that dissociation
rate depends on [Tub]. Chapter VI addresses whether these dependencies are of
practical significance.
B.1 Surface free energy and roughness at equilibrium
Consider a hypothetical simplified NPF-protofilament microtubule lattice, such as
the that of Fig. B.1, in which the helix pitch is reduced to zero (a zero-start helix).
If the bulk of the lattice had a vacant site, addition of a subunit at this position from
infinity would involve a free energy change
∆Gsubunit = (2∆GLateral + 2∆GLongitudinal + ∆GImmobilization) (B.1)
where these terms are, respectively, due to the two lateral interactions, two longitu-
dinal interactions, and entropic penalty of immobilization. ∆Gsubunit < 0.
If the microtubule were broken in two, the free energy change per newly formed
end would be
∆Gbreak =(−NPF
2 ∆GLongitudinal −m∆GLateral
)(B.2)
where m, which Hill termed “an index of molecular roughness,” is half the number
of lateral interactions lost as a result of the breakage. m is only half of the lost
interactions because the interaction energy is divided between the two subunits that
lost the interaction. ∆Gbreak > 0 is the free surface energy. In equation B.2, the
term −NPF2 ∆GLongitudinal is the same for any break. Fluctuations (due to subunit
exchange) in the surface free energy of a microtubule tip are therefore independent
of ∆GLongitudinal. A subunit that associates with the tip may increase or decrease the
149

L j =
1 L j =
2
j = 1
j = 1
j = 1
3
j = 1
3
υ0 υ1
υ2
Figure B.1: Examples of subunit-addition transitions and definition of Lj. Lj, whichappears in the expression for Hill’s index of molecular roughness (equa-tion B.3), is the length of protofilament j measured, in this case, relativeto the shortest protofilaments (e.g., L1 = L6 = 1). Further to equa-tion B.6, the state λ, shown as light subunits, could, by addition of 1subunit (dark), undergo one of several λ → νq transitions, of which 3are shown. Circles and semi-circles indicate contributions to mλ. Semi-circles indicate lost contributions. Gained contributions are not marked.This figure is based on Hill [1986].
number of lateral bonds available at the tip, but it creates a new longitidinal bond
site that replaces the one it takes up.
m can be defined algebraically, letting the end of protofilament j be at a distance
Lj along the microtubule measured in units of subunit length (Fig. B.1):
2m = |LNPF − L1|+NPF∑j=2|Lj − Lj−1| (B.3)
At the critical concentration, there is equilibrium between the microtubule and the
free subunits. The microtubule tip “...will pass, stochastically, through (in principle)
an infinite number of discrete surface structures [tip structures], each with a definite
value of m...” [Hill, 1986] as determined by the Boltzmann distribution, so that the
probability of a tip structure with m is proportional to em∆GLateral/kBT , with larger m
having lower weight and corresponding to a rougher tip. The distribution of m at
[Tub] = Cc depends entirely on lattice geometry and ∆GLateral/kBT .
150

B.2 Minimizing surface roughness
It would useful determine a value of ∆GLateral that would result in predominantly
low-roughness tips (as would be the case with helical/cozy-corner growth in the 3-
start 13-protofilament lattice not considered here). Letting the degeneracy be R (m)
(the number of structures with m), the equilibrium probability, P (m̃), that m = m̃
is
P (m̃) = R (m̃) em̃∆GLateral/kBT∑mR (m) em∆GLateral/kBT
(B.4)
= R (m̃)∑mR (m) e(m−m̃)∆GLateral/kBT
(B.5)
One would expect that for the lowest value of m to dominate would require
∆GLateral/kBT � −1,
even ignoring the fact that the degeneracy of structures with the lowestm is relatively
low. Away from equilibrium, this would presumably become more extreme. Hill [1986]
computed mean m as a function of ∆GLateral/kBT for several simple lattices that
differ markedly from microtubules (small number of protofilaments, large stagger for
lattice with largest number of protofilaments), finding perhaps ∆GLateral/kBT < −3
resulted in small meanm, but presumably a more realistic lattice would require a more
extreme ∆GLateral to force mean m to approach minimum m. Presumably computer
enumeration of tip structures (following Hill) for a reasonable range of protofilament
lengths would allow approximate evaluation of equation B.5 for limited NPF and m.
B.3 Rate constants for a specific transition
Obtaining overall rate constants requires the consideration of transitions between
the above-mentioned surface structures. Consider the association of one subunit to
151

the tip (Fig. B.1). Let the states of the tip before and after association be, respectively,
λ and νq. As implicit in Fig. B.1, q is the number of lateral interactions made by the
newly added subunit. For most states λ, there are multiple states νq for each value
of q. The reaction is
MTλ + Tub kλ→νqon−−−−⇀↽−−−−kλ←νqoff
MTνq (B.6)
where the rate constants marked are per-protofilament.
If states λ and νq have surface roughness indicesmλ andmνq , the change in surface
free energy is, from equation B.2,
∆Gλ→νq = (mλ −mν) ∆GLateral (B.7)
∆Gλ→ν0 = −∆GLateral > 0 (B.8)
∆Gλ→ν1 = 0 (B.9)
∆Gλ→ν2 = +∆GLateral < 0. (B.10)
Letting the equilibrium probability of states λ and νq be peλ and pe
νq , the ratio of
probabilities for the two states is
peνq
peλ
= e−∆Gλ→νq/kBT (B.11)
The rates at which transitions occur is proportional to the probabilities of the states
from which they occur. Invoking detailed balance,
kλ→νqon Ccpeλ = k
λ←νqoff pe
νq . (B.12)
Combining equations B.11 and B.12,
kλ→νqon Cc = kλ←νqoff e−∆Gλ→νq/kBT . (B.13)
152

For q = 1, equation B.9 yields
kλ→ν1on Cc = kλ←ν1
off (B.14)
For reasons described in section B.5 (p. 155), we assume association rate is indepen-
dent of the number of neighbors,
kλ→νqon = kon,PF ∀q, (B.15)
and we make the change in notation kλ←νqoff ≡ k(q)off,PF. Equation B.13 gives
k(q)off,PF = k
(1)off,PF
(e∆Gλ→νq/kBT
)(B.16)
which, combined with equation B.7, gives
k(0)off,PF = k
(1)off,PFe
−∆GLateral/kBT (B.17)
k(2)off,PF = k
(1)off,PFe
∆GLateral/kBT . (B.18)
The change in off rate with addition of a lateral interaction, k(q)off,PF/k
(q+1)off,PF (q = 0
or q = 1) is extremely sensitive to
Γ ≡ e−∆GLateral/kBT =k
(q)off,PF
k(q+1)off,PF
, q ∈ {0, 1} . (B.19)
and may therefore be extremely sensitive to changes in temperature and ∆GLateral.
153

B.4 Overall rate constants
To obtain the overall rate constants at equilibrium or steady state ([Tub] 6= Cc),
consider the reaction of p. 152 but with νq replaced by a general state η:
MTλ + Tub −−⇀↽−− MTη
For a given λ, each of the NPF states η belongs to {ν0, ν1, ν2} and corresponds to
a subunit at the end of one of the NPF protofilaments. η can be thought of as an
index over the NPF tip vacancies of λ, but also the η are states from which λ can be
produced by subunit dissociation.
In a population of tips, the rate of λ ← η transitions per instance of η is kλ←ηoff .
Let η occur in this population with probability pη. Consider one state λ and its
corresponding η states, of which there are NPF. The rate at which transitions to λ
occur by dissociation is ∑η
kλ←ηoff pη,
where the sum is over the the NPF η states. This is a rate per microtubule tip in the
population. Taking into account all λ, the overall off rate per protofilament is
koff,PF = 1NPF
∑λ
∑η
kλ←ηoff pη. (B.20)
The sum can be expanded and grouped into factors of k(0)off,PF, k
(1)off,PF, and k
(2)off,PF,
corresponding to equation 6.5 (p. 102).
Hill [1986] went on to conclude that, in general, neither the rate of subunit asso-
ciation nor the rate of subunit dissociation is necessarily expected to be proportional
to [Tub]. Each rate (arguably only the dissociation rate) may be affected by changes
in tip structure with [Tub], which appear as changes in the probabilities in equa-
tion B.20.
154

B.5 Aside: Rate perturbation factors
The assumption used in equation B.15 (p. 153) is important in that it may have
a large effect on the rate constants, but it is not central to this appendix.
For q 6= 1, we define rate perturbation factors γ:
kλ→νqon ≡ γon,qkλ→ν1on (B.21)
kλ←νqoff ≡ γoff,qk
λ←ν1off (B.22)
Equation B.13 becomes
γon,qkλ→ν1on Cc = γoff,qk
λ←ν1off e−∆Gλ→νq (B.23)
and, applying equation B.14, we have
γon,q = γoff,qe−∆Gλ→νq . (B.24)
This implies that there are infinite ways that the q 6= 1 rate constants can be perturbed
relative to q = 1. For instance, for λ → ν2 transitions the association of subunits
might be slowed by a steric barrier presented by the two neighbors already present.
This same barrier would also reduce the off rate. Both these effects would be reflected
in the γon,2 and γoff,2. Hill noted that the “most realistic assumption is probably”
γoff,q = 1, corresponding to diffusion-limited association events such that “the full
effect of [the change in surface free energy] is felt by the off rate constants (neighbor
interactions must be broken for a subunit to escape).” [Hill, 1986].
For a vacancy with two lateral neighbors, one could argue that the association
rate should be lower due to steric limitations on accessibility of the vacancy by dif-
fusion. Considering the geometry of the microtubule and the putative localization of
binding surface area toward the lumen, it seems possible that subunits encountering
155

the tip might have a reduced probability, in terms of the description of Northrup and
Erickson [1992], to achieve a nearly-correct orientation corresponding to a partial
bond formation that stabilizes the subunit, making full bond formation likely. On
the other hand, with 3 binding surfaces, the subunit might be more likely to form
one of these partial bonds. Also, considering the possibility of A- and B-type joins,
one might postulate that the subunit has an additional binding site roughly 4 nm
away from the vacancy in which weak lateral interactions might stabilize the correct
orientation of the subunit, and upon dissociation from this site it might diffuse to
the correct location faster than its rotational diffusion would cause misorientation,
forming a longitudinal bond in addition to lateral bonds.
156

BIBLIOGRAPHY
157

BIBLIOGRAPHY
B. Akiyoshi, K. K. Sarangapani, A. F. Powers, C. R. Nelson, S. L. Reichow,H. Arellano-Santoyo, T. Gonen, J. A. Ranish, C. L. Asbury, and S. Biggins. Ten-sion directly stabilizes reconstituted kinetochore-microtubule attachments. Na-ture, 468(7323):576–579, Nov 2010. doi: 10.1038/nature09594. URL http://dx.doi.org/10.1038/nature09594. 19, 20
J. Al-Bassam, H. Kim, G. Brouhard, A. van Oijen, S. C. Harrison, and F. Chang.Clasp promotes microtubule rescue by recruiting tubulin dimers to the microtubule.Dev Cell, 19(2):245–258, Aug 2010. doi: 10.1016/j.devcel.2010.07.016. URL http://dx.doi.org/10.1016/j.devcel.2010.07.016. 49
L. A. Amos. Microtubule structure and its stabilisation. Org Biomol Chem, 2(15):2153–2160, Aug 2004. doi: 10.1039/b403634d. URL http://dx.doi.org/10.1039/b403634d. 2, 50, 51, 71
L. A. Amos and D. Schlieper. Microtubules and maps. Adv Protein Chem, 71:257–298, 2005. doi: 10.1016/S0065-3233(04)71007-4. URL http://dx.doi.org/10.1016/S0065-3233(04)71007-4. 2, 48
I. Arnal, E. Karsenti, and A. Hyman. Structural transitions at microtubule endscorrelate with their dynamic properties in xenopus egg extracts. Journal of CellBiology, 149(4):767–774, 2000. 57, 58, 59, 61, 132
C. Asbury, D. Gestaut, A. Powers, A. Franck, and T. Davis. The dam1 kinetochorecomplex harnesses microtubule dynamics to produce force and movement. Proceed-ings of the National Academy of Sciences of the United States of America, 103(26):9873–9878, 2006. 76
N. A. Baker, D. Sept, S. Joseph, M. J. Holst, and J. A. McCammon. Electrostaticsof nanosystems: application to microtubules and the ribosome. Proc Natl AcadSci U S A, 98(18):10037–10041, Aug 2001. doi: 10.1073/pnas.181342398. URLhttp://dx.doi.org/10.1073/pnas.181342398. 52
S. F. Bakhoum, G. Genovese, and D. A. Compton. Deviant kinetochore micro-tubule dynamics underlie chromosomal instability. Curr Biol, 19(22):1937–1942,Dec 2009a. doi: 10.1016/j.cub.2009.09.055. URL http://dx.doi.org/10.1016/j.cub.2009.09.055. 125
158

S. F. Bakhoum, S. L. Thompson, A. L. Manning, and D. A. Compton. Genomestability is ensured by temporal control of kinetochore-microtubule dynamics. NatCell Biol, 11(1):27–35, Jan 2009b. doi: 10.1038/ncb1809. URL http://dx.doi.org/10.1038/ncb1809. 125
R. Basto, J. Lau, T. Vinogradova, A. Gardiol, C. Woods, A. Khodjakov, and J. Raff.Flies without centrioles. Cell, 125(7):1375–1386, 2006. 15
D. Begg and G. Ellis. Micromanipulation studies of chromosome movement .2. bire-fringent chromosomal fibers and the mechanical attachment of chromosomes to thespindle. Journal of Cell Biology, 82(2):542–554, 1979a. 17
D. Begg and G. Ellis. Micromanipulation studies of chromosome movement .1.chromosome-spindle attachment and the mechanical-properties of chromosomalspindle fibers. Journal of Cell Biology, 82(2):528–541, 1979b. 17
L. Bergen and G. Borisy. Head-to-tail polymerization of microtubules invitro -electron-microscope analysis of seeded assembly. Journal of Cell Biology, 84(1):141–150, 1980. 91
A. D. Bicek, E. Tüzel, A. Demtchouk, M. Uppalapati, W. O. Hancock, D. M. Kroll,and D. J. Odde. Anterograde microtubule transport drives microtubule bending inllc-pk1 epithelial cells. Mol Biol Cell, 20(12):2943–2953, Jun 2009. doi: 10.1091/mbc.E08-09-0909. URL http://dx.doi.org/10.1091/mbc.E08-09-0909. 95, 115
P. Bieling, L. Laan, H. Schek, E. Munteanu, L. Sandblad, M. Dogterom, D. Brunner,and T. Surrey. Reconstitution of a microtubule plus-end tracking system in vitro.Nature, 450(7172):1100–1105, 2007. 76
P. Bieling, I. Kronja, and T. Surrey. Microtubule motility on reconstituted meioticchromatin. Curr Biol, 20(8):763–769, Apr 2010. doi: 10.1016/j.cub.2010.02.067.URL http://dx.doi.org/10.1016/j.cub.2010.02.067. 21
V. Bormuth, V. Varga, J. Howard, and E. Schaffer. Protein friction limits diffusiveand directed movements of kinesin motors on microtubules. Science, 325(5942):870–873, 2009. 41
G. Brouhard and A. Hunt. Microtubule movements on the arms of mitotic chro-mosomes: Polar ejection forces quantified in vitro. Proceedings of the NationalAcademy of Sciences of the United States of America, 102(39):13903–13908, 2005.20
G. Brouhard, H. Schek, and A. Hunt. Advanced optical tweezers for the study ofcellular and molecular biomechanics. Ieee Transactions on Biomedical Engineering,50(1):121–125, 2003. 26, 81
G. Brouhard, J. Stear, T. Noetzel, J. Al Bassam, K. Kinoshita, S. Harrison,J. Howard, and A. Hyman. XMAP215 is a processive microtubule polymerase.Cell, 132(1):79–88, 2008. 52, 70, 76, 91, 95, 124, 127
159

L. Cameron, G. Yang, D. Cimini, J. Canman, O. Evgenieva, A. Khodjakov,G. Danuser, and E. Salmon. Kinesin 5-independent poleward flux of kinetochoremicrotubules in ptk1 cells. Journal of Cell Biology, 173(2):173–179, 2006. 39
M. J. Cannon, A. D. Williams, R. Wetzel, and D. G. Myszka. Kinetic analysis of beta-amyloid fibril elongation. Anal Biochem, 328(1):67–75, May 2004. doi: 10.1016/j.ab.2004.01.014. URL http://dx.doi.org/10.1016/j.ab.2004.01.014. 127
M. Caplow and J. Shanks. Evidence that a single monolayer tubulin-gtp cap is bothnecessary and sufficient to stabilize microtubules. Mol Biol Cell, 7(4):663–675, Apr1996. 72, 133
M. Carlier and D. Pantaloni. Kinetic-analysis of cooperativity in tubulin polymeriza-tion in presence of guanosine diphosphate or triphosphate nucleotides. Biochem-istry, 17(10):1908–1915, 1978. 88
M. F. Carlier, T. L. Hill, and Y. Chen. Interference of gtp hydrolysis in the mechanismof microtubule assembly: an experimental study. Proc Natl Acad Sci U S A, 81(3):771–775, Feb 1984. 91
L. Cassimeris, N. K. Pryer, and E. D. Salmon. Real-time observations of microtubuledynamic instability in living cells. J Cell Biol, 107(6 Pt 1):2223–2231, Dec 1988.124
A. Chakravarty, L. Howard, and D. Compton. A mechanistic model for the orga-nization of microtubule asters by motor and non-motor proteins in a mammalianmitotic extract. Molecular Biology of the Cell, 15(5):2116–2132, 2004. 22, 23, 130
M. Chalfie and J. N. Thomson. Structural and functional diversity in the neuronalmicrotubules of caenorhabditis elegans. J Cell Biol, 93(1):15–23, Apr 1982. 55
R. Chambers. Some physical properties of the cell nucleus. Science, 40:824–827, 1914.16
B. Charlebois, H. Schek, and A. Hunt. Nanometer-resolution microtubule polymer-ization assays using optical tweezers and microfabricated barriers. In J. Correia,editor, Methods in Cell Biology, number 12, pages 203–215. 2010. 26, 48, 75
B. D. Charlebois, S. Kollu, H. T. Schek, III, D. A. Compton, and A. J. Hunt. Spindlepole mechanics studied in mitotic asters: Dynamic distribution of spindle forcesthrough compliant linkages. Biophysical Journal, 100(7):1756–1764, APR 6 2011.doi: 10.1016/j.bpj.2011.02.017. 11, 24
S. Charrasse, M. Schroeder, C. Gauthier-Rouviere, F. Ango, L. Cassimeris, D. L.Gard, and C. Larroque. The togp protein is a new human microtubule-associatedprotein homologous to the xenopus xmap215. J Cell Sci, 111 ( Pt 10):1371–1383,May 1998. 124
160

I. M. Cheeseman and A. Desai. Molecular architecture of the kinetochore-microtubuleinterface. Nat Rev Mol Cell Biol, 9(1):33–46, Jan 2008. doi: 10.1038/nrm2310. URLhttp://dx.doi.org/10.1038/nrm2310. 13, 14, 20
I. M. Cheeseman, J. S. Chappie, E. M. Wilson-Kubalek, and A. Desai. The conservedkmn network constitutes the core microtubule-binding site of the kinetochore. Cell,127(5):983–997, Dec 2006. doi: 10.1016/j.cell.2006.09.039. URL http://dx.doi.org/10.1016/j.cell.2006.09.039. 20
W. Chen and D. Zhang. Kinetochore fibre dynamics outside the context of the spindleduring anaphase. Nature Cell Biology, 6(3):227–231, 2004. 46
Y. D. Chen and T. L. Hill. Monte carlo study of the gtp cap in a five-start helixmodel of a microtubule. Proc Natl Acad Sci U S A, 82(4):1131–1135, Feb 1985. 68
C. Choudhary, C. Kumar, F. Gnad, M. L. Nielsen, M. Rehman, T. C. Walther,J. V. Olsen, and M. Mann. Lysine acetylation targets protein complexes and co-regulates major cellular functions. Science, 325(5942):834–840, Aug 2009. doi:10.1126/science.1175371. URL http://dx.doi.org/10.1126/science.1175371.52
D. Chrétien and S. D. Fuller. Microtubules switch occasionally into unfavorableconfigurations during elongation. J Mol Biol, 298(4):663–676, May 2000. doi:10.1006/jmbi.2000.3696. URL http://dx.doi.org/10.1006/jmbi.2000.3696. 55
D. Chrétien and R. Wade. New data on the microtubule surface lattice. Biology ofthe Cell, 71(1-2):161–174, 1991. 54, 55
D. Chrétien, F. Metoz, F. Verde, E. Karsenti, and R. H. Wade. Lattice defects inmicrotubules: protofilament numbers vary within individual microtubules. J CellBiol, 117(5):1031–1040, Jun 1992. 122
D. Chrétien, S. Fuller, and E. Karsenti. Structure of growing microtubule ends -2-dimensional sheets close into tubes at variable rates. Journal of Cell Biology, 129(5):1311–1328, 1995. 9, 58, 59, 66, 76, 91, 113, 122, 132
J. Cochran, J. Gatial, T. Kapoor, and S. Gilbert. Monastrol inhibition of the mitotickinesin Eg5. Journal of Biological Chemistry, 280(13):12658–12667, 2005. 42
S. R. Collins, A. Douglass, R. D. Vale, and J. S. Weissman. Mechanism of prionpropagation: amyloid growth occurs by monomer addition. PLoS Biol, 2(10):e321,Oct 2004. doi: 10.1371/journal.pbio.0020321. URL http://dx.doi.org/10.1371/journal.pbio.0020321. 127
D. Compton. Focusing on spindle poles. Journal of Cell Science, 111:1477–1481,1998. 15, 16, 22
161

L. J. Davis, D. J. Odde, S. M. Block, and S. P. Gross. The importance of latticedefects in katanin-mediated microtubule severing in vitro. Biophys J, 82(6):2916–2927, Jun 2002. doi: 10.1016/S0006-3495(02)75632-4. URL http://dx.doi.org/10.1016/S0006-3495(02)75632-4. 122
A. Demtchouk, M. Gardner, and D. Odde. Microtubule tip tracking and tip structuresat the nanometer scale using digital fluorescence microscopy. Cellular and MolecularBioengineering, 2011. 94, 95, 114, 117, 120, 124
A. Desai and T. Mitchison. Microtubule polymerization dynamics. Annual Review ofCell and Developmental Biology, 13:83–117, 1997. 2, 7, 53, 54
A. Dimitrov, M. Quesnoit, S. Moutel, I. Cantaloube, C. Poüs, and F. Perez. Detectionof gtp-tubulin conformation in vivo reveals a role for gtp remnants in microtubulerescues. Science, 322(5906):1353–1356, Nov 2008. doi: 10.1126/science.1165401.URL http://dx.doi.org/10.1126/science.1165401. 74
M. Dionne, L. Howard, and D. Compton. Numa is a component of an insoluble matrixat mitotic spindle poles. Cell Motility and the Cytoskeleton, 42(3):189–203, 1999.22, 23
C. G. dos Remedios, D. Chhabra, M. Kekic, I. V. Dedova, M. Tsubakihara, D. A.Berry, and N. J. Nosworthy. Actin binding proteins: regulation of cytoskeletalmicrofilaments. Physiol Rev, 83(2):433–473, Apr 2003. doi: 10.1152/physrev.00026.2002. URL http://dx.doi.org/10.1152/physrev.00026.2002. 57
D. N. Drechsel and M. W. Kirschner. The minimum gtp cap required to stabilizemicrotubules. Curr Biol, 4(12):1053–1061, Dec 1994. 72
D. N. Drechsel, A. A. Hyman, M. H. Cobb, and M. W. Kirschner. Modulation of thedynamic instability of tubulin assembly by the microtubule-associated protein tau.Mol Biol Cell, 3(10):1141–1154, Oct 1992. 49, 91, 125, 131
S. Dumont and T. Mitchison. Compression regulates mitotic spindle length by amechanochemical switch at the poles. Current Biology, 19(13):1086–1095, 2009. 18
R. Dye and R. Williams. Assembly of microtubules from tubulin bearing the nonhy-drolyzable guanosine triphosphate analogue GMPPCP [Guanylyl 5’-(beta,gamma-methylenediphosphonate)]: Variability of growth rates and the hydrolysis of GTP.Biochemistry, 35(45):14331–14339, 1996. 71, 76, 86, 105, 120
C. Elie-Caille, F. Severin, J. Helenius, J. Howard, D. J. Muller, and A. A. Hyman.Straight gdp-tubulin protofilaments form in the presence of taxol. Curr Biol, 17(20):1765–1770, Oct 2007. doi: 10.1016/j.cub.2007.08.063. URL http://dx.doi.org/10.1016/j.cub.2007.08.063. 58, 122
Y. Engelborghs, L. C. D. Maeyer, and N. Overbergh. A kinetic analysis of theassembly of microtubules in vitro. FEBS Lett, 80(1):81–85, Aug 1977. 91
162

K. Farrell and M. Jordan. A kinetic-analysis of assembly-disassembly at oppositemicrotubule ends. Journal of Biological Chemistry, 257(6):3131–3138, 1982. 91
K. Farrell, M. Jordan, H. Miller, and L. Wilson. Phase dynamics at microtubule ends- the coexistence of microtubule length changes and treadmilling. Journal of CellBiology, 104(4):1035–1046, 1987. 83
H. Felgner, R. Frank, and M. Schliwa. Flexural rigidity of microtubules measuredwith the use of optical tweezers. Journal of Cell Science, 109:509–516, 1996. 36
N. P. Ferenz, A. Gable, and P. Wadsworth. Mitotic functions of kinesin-5. SeminCell Dev Biol, 21(3):255–259, May 2010. doi: 10.1016/j.semcdb.2010.01.019. URLhttp://dx.doi.org/10.1016/j.semcdb.2010.01.019. 14
J. Finer, R. Simmons, and J. Spudich. Single myosin molecule mechanics - piconewtonforces and nanometer steps. Nature, 368(6467):113–119, 1994. 85
D. Fygenson, H. Flyvbjerg, K. Sneppen, A. Libchaber, and S. Leibler. Spontaneousnucleation of microtubules. Physical Review e, 51(5):5058–5063, 1995. 88
S. Gadde and R. Heald. Mechanisms and molecules of the mitotic spindle. CurrentBiology, 14(18):R797–R805, 2004. 15, 16
T. Gaglio, A. Saredi, and D. Compton. NuMA is required for the organization ofmicrotubules into aster-like mitotic arrays. Journal of Cell Biology, 131(3):693–708, 1995. 22, 25, 29, 138
T. Gaglio, A. Saredi, J. Bingham, M. Hasbani, S. Gill, T. Schroer, and D. Compton.Opposing motor activities are required for the organization of the mammalian mi-totic spindle pole. Journal of Cell Biology, 135(2):399–414, 1996. 22, 25, 29, 36,41, 138
T. Gaglio, M. Dionne, and D. Compton. Mitotic spindle poles are organized bystructural and motor proteins in addition to centrosomes. Journal of Cell Biology,138(5):1055–1066, 1997. 23, 29, 36, 138
D. L. Gard and M. W. Kirschner. A microtubule-associated protein from xenopus eggsthat specifically promotes assembly at the plus-end. J Cell Biol, 105(5):2203–2215,Nov 1987. 91
M. Gardner, A. Hunt, H. Goodson, and D. Odde. Microtubule assembly dynamics:new insights at the nanoscale. Current Opinion in Cell Biology, 20(1):64–70, 2008a.76
M. Gardner, B. Charlebois, I. Jánosi, J. Howard, A. Hunt, and D. Odde. Fluctuationsin growth rate support a 2D model for microtubule self-assembly kinetics. Cell,2011. 48, 90, 100, 115, 117
163

M. K. Gardner, D. C. Bouck, L. V. Paliulis, J. B. Meehl, E. T. O’Toole, J. Haase,A. Soubry, A. P. Joglekar, M. Winey, E. D. Salmon, K. Bloom, and D. J. Odde.Chromosome congression by kinesin-5 motor-mediated disassembly of longer kine-tochore microtubules. Cell, 135(5):894–906, Nov 2008b. doi: 10.1016/j.cell.2008.09.046. URL http://dx.doi.org/10.1016/j.cell.2008.09.046. 125
J. Gatlin, A. Matov, G. Danuser, T. Mitchison, and E. Salmon. Directly probing themechanical properties of the spindle and its matrix. Journal of Cell Biology, 188(4):481–489, 2010. 17, 21, 46
J. C. Gatlin and K. Bloom. Microtubule motors in eukaryotic spindle assemblyand maintenance. Semin Cell Dev Biol, 21(3):248–254, May 2010. doi: 10.1016/j.semcdb.2010.01.015. URL http://dx.doi.org/10.1016/j.semcdb.2010.01.015.14
C. Gell, V. Bormuth, G. J. Brouhard, D. N. Cohen, S. Diez, C. T. Friel, J. Helenius,B. Nitzsche, H. Petzold, J. Ribbe, E. Schäffer, J. H. Stear, A. Trushko, V. Varga,P. O. Widlund, M. Zanic, and J. Howard. Microtubule dynamics reconstituted invitro and imaged by single-molecule fluorescence microscopy. Methods Cell Biol,95:221–245, 2010. doi: 10.1016/S0091-679X(10)95013-9. URL http://dx.doi.org/10.1016/S0091-679X(10)95013-9. 93, 128, 133
R. Gildersleeve, A. Cross, K. Cullen, A. Fagen, and R. Williams. Microtubules growand shorten at intrinsically variable rates. Journal of Biological Chemistry, 267(12):7995–8006, 1992. 71, 76, 120
F. Gittes and C. Schmidt. Signals and noise in micromechanical measurements. InM. Sheetz, editor, Methods in cell biology, number 55, pages 129–156. 1998a. 82,85, 86, 87
F. Gittes and C. Schmidt. Interference model for back-focal-plane displacement de-tection in optical tweezers. Optics Letters, 23(1):7–9, 1998b. 81, 85
F. Gittes, B. Mickey, J. Nettleton, and J. Howard. Flexural rigidity of microtubulesand actin-filaments measured from thermal fluctuations in shape. Journal of CellBiology, 120(4):923–934, 1993. 36, 82
M. Gordon, L. Howard, and D. Compton. Chromosome movement in mitosis requiresmicrotubule anchorage at spindle poles. Journal of Cell Biology, 152(3):425–434,2001. 21
E. Grishchuk, M. Molodtsov, F. Ataullakhanov, and J. McIntosh. Force productionby disassembling microtubules. Nature, 438(7066):384–388, 2005. 6, 76
K. Gupta, B. Paulson, E. Folker, B. Charlebois, A. Hunt, and H. Goodson. Mini-mal plus-end tracking unit of the cytoplasmic linker protein clip-170. Journal ofBiological Chemistry, 284(11):6735–6742, 2009. 88
164

F. Gustafsson. Determining the initial states in forward-backward filtering. IeeeTransactions on Signal Processing, 44(4):988–992, 1996. 86
J. Happel and H. Brenner. Low Reynolds Number Hydrodynamics: With SpecialApplications to Particulate Media, volume 1. Kluwer, The Hague, Boston, HinghamMassachusetts, 1983. 40
J. Helenius, G. Brouhard, Y. Kalaidzidis, S. Diez, and J. Howard. The depolymerizingkinesin MCAK uses lattice diffusion to rapidly target microtubule ends. Nature,441(7089):115–119, 2006. 52, 76
C. Hentrich and T. Surrey. Microtubule organization by the antagonistic mitoticmotors kinesin-5 and kinesin-14. Journal of Cell Biology, 189(3):465–480, May2010. 21, 130
H. Herrmann, H. Bär, L. Kreplak, S. V. Strelkov, and U. Aebi. Intermediate filaments:from cell architecture to nanomechanics. Nat Rev Mol Cell Biol, 8(7):562–573, Jul2007. doi: 10.1038/nrm2197. URL http://dx.doi.org/10.1038/nrm2197. 2, 3
K. M. Hertzer and C. E. Walczak. The c-termini of tubulin and the specific geometryof tubulin substrates influence the depolymerization activity of mcak. Cell Cycle,7(17):2727–2737, Sep 2008. 52
J. Höög, S. Huisman, Z. Sebo-Lemke, L. Sandblad, J. McIntosh, C. Antony, andD. Brunner. Electron tomography reveals a flared morphology on growing micro-tubule ends. Journal of Cell Science, 124(5):693–698, 2011. 57, 58, 59, 132
T. Hill. Theoretical problems related to the attachment of microtubules to kineto-chores. Proceedings of the National Academy of Sciences of the United States ofAmerica, 82(13):4404–4408, 1985. 15
T. Hill. Linear Aggregation Theory in Cell Biology. Springer-Verlag, 1987. 64, 65
T. L. Hill. Effect of fluctuating surface structure and free energy on thegrowth of linear tubular aggregates. Biophysical Journal, 49(5):1017–1031, May1986. doi: 10.1016/S0006-3495(86)83730-4. URL http://dx.doi.org/10.1016/S0006-3495(86)83730-4. 9, 64, 65, 67, 71, 90, 91, 104, 148, 149, 150, 151, 154,155
T. Holy and S. Leibler. Dynamic instability of microtubules as an efficient way tosearch in-space. Proceedings of the National Academy of Sciences of the UnitedStates of America, 91(12):5682–5685, 1994. 15
T. Horio and H. Hotani. Visualization of the dynamic instability of individual micro-tubules by dark-field microscopy. Nature, 321(6070):605–607, 1986. 76
J. Howard. Mechanics of Motor Proteins and the Cytoskeleton. Sinauer Associates,Inc., Sunderland, Massachusetts, 2001. 1, 2, 40, 53, 54, 55, 57, 73, 132
165

J. Howard and A. Hyman. Dynamics and mechanics of the microtubule plus end.Nature, 422(6933):753–758, 2003. 2, 6
J. Howard and A. Hyman. Growth, fluctuation and switching at microtubule plusends. Nature Reviews Molecular Cell Biology, 10(8):569–574, 2009. 2, 9, 63, 71, 86,120
J. Howard and A. A. Hyman. Microtubule polymerases and depolymerases. CurrentOpinion in Cell Biology, 19(1):31–35, Feb. 2007. 7, 48
B. Howell, N. Larsson, M. Gullberg, and L. Cassimeris. Dissociation of thetubulin-sequestering and microtubule catastrophe-promoting activities of oncopro-tein 18/stathmin. Mol Biol Cell, 10(1):105–118, Jan 1999. 49
A. Hunt and J. McIntosh. The dynamic behavior of individual microtubules associatedwith chromosomes in vitro. Molecular Biology of the Cell, 9(10):2857–2871, 1998.19
A. W. Hunter, M. Caplow, D. L. Coy, W. O. Hancock, S. Diez, L. Wordeman, andJ. Howard. The kinesin-related protein MCAK is a microtubule depolymerase thatforms an atp-hydrolyzing complex at microtubule ends. Molecular Cell, 11(2):445–457, Feb. 2003. 125
A. Hyman, S. Salser, D. Drechsel, N. Unwin, and T. Mitchison. Role of GTP hy-drolysis in microtubule dynamics - information from a slowly hydrolyzable analog,gmpcpp. Molecular Biology of the Cell, 3(10):1155–1167, 1992. 83, 88, 91
T. Itabashi, J. Takagi, Y. Shimamoto, H. Onoe, K. Kuwana, I. Shimoyama, J. Gaetz,T. Kapoor, and S. Ishiwata. Probing the mechanical architecture of the vertebratemeiotic spindle. Nature Methods, 6(2):167–172, 2009. 18, 21, 38
C. Janke, K. Rogowski, and J. van Dijk. Polyglutamylation: a fine-regulator ofprotein function? ’protein modifications: beyond the usual suspects’ review series.EMBO Rep, 9(7):636–641, Jul 2008. doi: 10.1038/embor.2008.114. URL http://dx.doi.org/10.1038/embor.2008.114. 52
D. Job, O. Valiron, and B. Oakley. Microtubule nucleation. Current Opinion in CellBiology, 15(1):111–117, 2003. 88
A. P. Joglekar, K. Bloom, and E. D. Salmon. In vivo protein architecture of theeukaryotic kinetochore with nanometer scale accuracy. Curr Biol, 19(8):694–699,Apr 2009. doi: 10.1016/j.cub.2009.02.056. URL http://dx.doi.org/10.1016/j.cub.2009.02.056. 20
M. Jordan and L. Wilson. Microtubules as a target for anticancer drugs. NatureReviews Cancer, 4(4):253–265, 2004. 49, 131
166

M. Jordan, R. Toso, D. Thrower, and L. Wilson. Mechanism of mitotic block andinhibition of cell-proliferation by taxol at low concentrations. Proceedings of theNational Academy of Sciences of the United States of America, 90(20):9552–9556,1993. 76
E. Karsenti and I. Vernos. Cell cycle - the mitotic spindle: A self-made machine.Science, 294(5542):543–547, 2001. 21
J. Kerssemakers, E. Munteanu, L. Laan, T. Noetzel, M. Janson, and M. Dogterom.Assembly dynamics of microtubules at molecular resolution. Nature, 442(7103):709–712, 2006. 70, 72, 76, 77, 80, 85, 97, 120, 122
I. Khan and R. Luduena. Possible regulation of the invitro assembly of bovine braintubulin by the bovine thioredoxin system. Biochimica et Biophysica Acta, 1076(2):289–297, 1991. 81
A. Khodjakov, L. Copenagle, M. Gordon, D. Compton, and T. Kapoor. Minus-end capture of preformed kinetochore fibers contributes to spindle morphogenesis.Journal of Cell Biology, 160(5):671–683, 2003. 15
M. Kikumoto, M. Kurachi, V. Tosa, and H. Tashiro. Flexural rigidity of individualmicrotubules measured by a buckling force with optical traps. Biophysical Journal,90(5):1687–1696, 2006. 82
K. Kinoshita, I. Arnal, A. Desai, D. N. Drechsel, and A. A. Hyman. Reconstitution ofphysiological microtubule dynamics using purified components. Science, 294(5545):1340–1343, Nov 2001. doi: 10.1126/science.1064629. URL http://dx.doi.org/10.1126/science.1064629. 49
M. Kirschner and T. Mitchison. Beyond self-assembly - from microtubules to mor-phogenesis. Cell, 45(3):329–342, 1986. 15
M. Korneev, S. Lakamper, and C. Schmidt. Load-dependent release limits the pro-cessive stepping of the tetrameric Eg5. European biophysics journal, 36(6):675–681,2007. 43
H. Y. Kueh and T. J. Mitchison. Structural plasticity in actin and tubulin polymerdynamics. Science, 325(5943):960–963, Aug 2009. doi: 10.1126/science.1168823.URL http://dx.doi.org/10.1126/science.1168823. 74
M. Kurachi, M. Hoshi, and H. Tashiro. Buckling of a single microtubule by opticaltrapping forces - direct measurement of microtubule rigidity. Cell Motility and theCytoskeleton, 30(3):221–228, 1995. 82
B. Kwok, L. Kapitein, J. Kim, E. Peterman, C. Schmidt, and T. Kapoor. Allostericinhibition of kinesin-5 modulates its processive directional motility. Nature Chem-ical Biology, 2(9):480–485, 2006. 42
167

S. Lakämper and E. Meyhöfer. The e-hook of tubulin interacts with kinesin’s headto increase processivity and speed. Biophys J, 89(5):3223–3234, Nov 2005. doi:10.1529/biophysj.104.057505. URL http://dx.doi.org/10.1529/biophysj.104.057505. 52
H. Li, D. DeRosier, W. Nicholson, E. Nogales, and K. Downing. Microtubule structureat 8 angstrom resolution. Structure, 10(10):1317–1328, 2002. 50, 52, 53
H. Lodish, A. Berk, P. Matsudaira, C. Kaiser, M. Krieger, M. Scott, S. Zipursky, andJ. Darnell. Molecular Cell Biology, volume 5. W. H. Freeman and Company, NewYork, 2004. 1, 2, 5, 7, 12
R. Loughlin, B. Riggs, and R. Heald. Snapshot: motor proteins in spindle assembly.Cell, 134(3):548–548.e1, Aug 2008. doi: 10.1016/j.cell.2008.07.038. URL http://dx.doi.org/10.1016/j.cell.2008.07.038. 13
J. Lowe, H. Li, K. Downing, and E. Nogales. Refined structure of alpha beta-tubulinat 3.5 a resolution. Journal of Molecular Biology, 313(5):1045–1057, 2001. 50, 53,67
L. A. Lowery and D. V. Vactor. The trip of the tip: understanding the growthcone machinery. Nat Rev Mol Cell Biol, 10(5):332–343, May 2009. doi: 10.1038/nrm2679. URL http://dx.doi.org/10.1038/nrm2679. 4
H. Maiato, C. Rieder, and A. Khodjakov. Kinetochore-driven formation of kineto-chore fibers contributes to spindle assembly during animal mitosis. Journal of CellBiology, 167(5):831–840, 2004. 15
E. Mandelkow, E. Mandelkow, and R. Milligan. Microtubule dynamics and micro-tubule caps - a time-resolved cryoelectron microscopy study. Journal of Cell Biol-ogy, 114(5):977–991, 1991. 57, 58, 59
D. Mastronarde, K. Mcdonald, R. Ding, and J. McIntosh. Interpolar spindle micro-tubules in ptk cells. Journal of Cell Biology, 123(6):1475–1489, 1993. 21
I. Matos, A. Pereira, M. Lince-Faria, L. Cameron, E. Salmon, and H. Maiato. Syn-chronizing chromosome segregation by flux-dependent force equalization at kineto-chores. Journal of Cell Biology, 186(1):11–26, 2009. 44
R. Melki, I. Vainberg, R. Chow, and N. Cowan. Chaperonin-mediated folding ofvertebrate actin-related protein and gamma-tubulin. Journal of Cell Biology, 122(6):1301–1310, 1993. 83
A. Merdes, K. Ramyar, J. Vechio, and D. Cleveland. A complex of numa and cyto-plasmic dynein is essential for mitotic spindle assembly. Cell, 87(3):447–458, 1996.22
B. Mickey and J. Howard. Rigidity of microtubules is increased by stabilizing agents.Journal of Cell Biology, 130(4):909–917, 1995. 36, 81
168

H. Miki, Y. Okada, and N. Hirokawa. Analysis of the kinesin superfamily: insightsinto structure and function. Trends in Cell Biology, 15(9):467–476, 2005. 7
L. A. Mirny and D. J. Needleman. Quantitative characterization of filament dy-namics by single-molecule lifetime measurements. Methods Cell Biol, 95:583–600,2010. doi: 10.1016/S0091-679X(10)95029-2. URL http://dx.doi.org/10.1016/S0091-679X(10)95029-2. 70, 111, 133
T. Mitchison. Polewards microtubule flux in the mitotic spindle - evidence fromphotoactivation of fluorescence. Journal of Cell Biology, 109(2):637–652, 1989. 13
T. Mitchison and M. Kirschner. Dynamic instability of microtubule growth. Nature,312(5991):237–242, 1984. 7, 8, 91
T. Mitchison, P. Maddox, J. Gaetz, A. Groen, M. Shirasu, A. Desai, E. Salmon,and T. Kapoor. Roles of polymerization dynamics, opposed motors, and a tensileelement in governing the length of xenopus extract meiotic spindles. MolecularBiology of the Cell, 16(6):3064–3076, 2005. 42
T. J. Mitchison and M. W. Kirschner. Some thoughts on the partitioning of tubu-lin between monomer and polymer under conditions of dynamic instability. CellBiophys, 11:35–55, Dec 1987. 126
A. Mitra and D. Sept. Taxol allosterically alters the dynamics of the tubulin dimerand increases the flexibility of microtubules. Biophys J, 95(7):3252–3258, Oct 2008.doi: 10.1529/biophysj.108.133884. URL http://dx.doi.org/10.1529/biophysj.108.133884. 53, 131
T. Müller-Reichert, D. Chrétien, F. Severin, and A. A. Hyman. Structural changesat microtubule ends accompanying gtp hydrolysis: information from a slowly hy-drolyzable analogue of gtp, guanylyl (alpha,beta)methylenediphosphonate. ProcNatl Acad Sci U S A, 95(7):3661–3666, Mar 1998. 57
J. Moffitt, Y. Chemla, S. Smith, and C. Bustamante. Recent advances in opticaltweezers. Annual Review of Biochemistry, 77:205–228, 2008. 87
A. Mogilner and E. Craig. Towards a quantitative understanding of mitotic spindleassembly and mechanics. Journal of Cell Science, 123(20):3435–3445, 2010. 14, 21
J. K. Moore and J. A. Cooper. Coordinating mitosis with cell polarity: Molecularmotors at the cell cortex. Semin Cell Dev Biol, 21(3):283–289, May 2010. doi: 10.1016/j.semcdb.2010.01.020. URL http://dx.doi.org/10.1016/j.semcdb.2010.01.020. 14
C. Moores, M. Perderiset, C. Kappeler, S. Kain, D. Drummond, S. Perkins, J. Chelly,R. Cross, A. Houdusse, and F. Francis. Distinct roles of doublecortin modulatingthe microtubule cytoskeleton. Embo Journal, 25(19):4448–4457, 2006. 49, 76, 88,131
169

V. Mountain, C. Simerly, L. Howard, A. Ando, G. Schatten, and D. Compton. Thekinesin-related protein, HSET, opposes the activity of Eg5 and cross-links micro-tubules in the mammalian mitotic spindle. Journal of Cell Biology, 147(2):351–365,1999. 22, 23, 29, 36, 138
D. B. Murphy, K. A. Johnson, and G. G. Borisy. Role of tubulin-associated proteinsin microtubule nucleation and elongation. J Mol Biol, 117(1):33–52, Nov 1977. 127
D. J. Needleman, A. Groen, R. Ohi, T. Maresca, L. Mirny, and T. Mitchison. Fastmicrotubule dynamics in meiotic spindles measured by single molecule imaging:evidence that the spindle environment does not stabilize microtubules. Mol BiolCell, 21(2):323–333, Jan 2010. doi: 10.1091/mbc.E09-09-0816. URL http://dx.doi.org/10.1091/mbc.E09-09-0816. 70, 133
R. Nicklas. Measurements of the force produced by the mitotic spindle in anaphase.Journal of Cell Biology, 97(2):542–548, 1983. 19, 46
R. Nicklas and C. Staehly. Chromosome micromanipulation I: Mechanics of chromo-some attachment to spindle. Chromosoma, 21(1):1–16, 1967. 16
R. Nicklas, D. Kubai, and T. Hays. Spindle microtubules and their mechanical associ-ations after micromanipulation in anaphase. Journal of Cell Biology, 95(1):91–104,1982. 21
E. Nogales and H. Wang. Structural intermediates in microtubule assembly anddisassembly: how and why? Current Opinion in Cell Biology, 18(2):179–184,2006. 50, 57
E. Nogales, S. Wolf, and K. Downing. Structure of the alpha beta tubulin dimer byelectron crystallography (vol 391, pg 199, 1998). Nature, 393(6681):191–191, 1998.50
E. Nogales, M. Whittaker, R. Milligan, and K. Downing. High-resolution model ofthe microtubule. Cell, 96(1):79–88, 1999. 52
E. Nogales, H. Wang, and H. Niederstrasser. Tubulin rings: which way do they curve?Current Opinion in Structural Biology, 13(2):256–261, 2003. 57
S. H. Northrup and H. P. Erickson. Kinetics of protein-protein association explainedby brownian dynamics computer simulation. Proc Natl Acad Sci U S A, 89(8):3338–3342, Apr 1992. 70, 108, 126, 156
E. T. O’Brien, E. D. Salmon, R. A. Walker, and H. P. Erickson. Effects of magnesiumon the dynamic instability of individual microtubules. Biochemistry, 29(28):6648–6656, Jul 1990. 49, 91
E. T. O’Brien, E. D. Salmon, and H. P. Erickson. How calcium causes microtubuledepolymerization. Cell Motil Cytoskeleton, 36(2):125–135, 1997. doi: 3.0.CO;2-8.URL http://dx.doi.org/3.0.CO;2-8. 49
170
C. O’Connell and A. Khodjakov. Cooperative mechanisms of mitotic spindle forma-tion. Journal of Cell Science, 120(10):1717–1722, 2007. 15, 16
D. Odde, L. Cassimeris, and H. Buettner. Kinetics of microtubule catastrophe as-sessed by probabilistic analysis. Biophysical Journal, 69(3):796–802, 1995. 49, 72,132
D. Odde, H. Buettner, and L. Cassimeris. Spectral analysis of microtubule assemblydynamics. Aiche Journal, 42(5):1434–1442, 1996. 76, 86, 87, 120
T. Ohba, M. Nakamura, H. Nishitani, and T. Nishimoto. Self-organization of mi-crotubule asters induced in xenopus egg extracts by gtp-bound ran. Science, 284(5418):1356–1358, May 1999. 130
F. Oosawa. Size distribution of protein polymers. Journal of Theoretical Biology, 27(1):69–&, 1970. 61, 63, 86, 90, 92, 111, 118
C. G. Pearson and M. Winey. Basal body assembly in ciliates: the power of numbers.Traffic, 10(5):461–471, May 2009. doi: 10.1111/j.1600-0854.2009.00885.x. URLhttp://dx.doi.org/10.1111/j.1600-0854.2009.00885.x. 2
C. G. Pearson, M. K. Gardner, L. V. Paliulis, E. D. Salmon, D. J. Odde, andK. Bloom. Measuring nanometer scale gradients in spindle microtubule dynam-ics using model convolution microscopy. Mol Biol Cell, 17(9):4069–4079, Sep2006. doi: 10.1091/mbc.E06-04-0312. URL http://dx.doi.org/10.1091/mbc.E06-04-0312. 95
S. Pedigo and R. Williams. Concentration dependence of variability in growth ratesof microtubules. Biophysical Journal, 83(4):1809–1819, 2002. 71, 76, 86, 120
M. Poirier, S. Eroglu, and J. Marko. The bending rigidity of mitotic chromosomes.Molecular Biology of the Cell, 13(6):2170–2179, 2002. 18, 38
T. D. Pollard. Rate constants for the reactions of atp- and adp-actin with the endsof actin filaments. J Cell Biol, 103(6 Pt 2):2747–2754, Dec 1986. 108
A. Powers, A. Franck, D. Gestaut, J. Cooper, B. Gracyzk, R. Wei, L. Wordeman,T. Davis, and C. Asbury. The ndc80 kinetochore complex forms load-bearingattachments to dynamic microtubule tips via biased diffusion. Cell, 136(5):865–875,2009. 19, 20
N. K. Pryer, R. A. Walker, V. P. Skeen, B. D. Bourns, M. F. Soboeiro, and E. D.Salmon. Brain microtubule-associated proteins modulate microtubule dynamic in-stability in vitro. real-time observations using video microscopy. J Cell Sci, 103 (Pt 4):965–976, Dec 1992. 124, 125, 127
R. B. G. Ravelli, B. Gigant, P. A. Curmi, I. Jourdain, S. Lachkar, A. Sobel, andM. Knossow. Insight into tubulin regulation from a complex with colchicine anda stathmin-like domain. Nature, 428(6979):198–202, Mar 2004. doi: 10.1038/nature02393. URL http://dx.doi.org/10.1038/nature02393. 50
171

S. Ray, E. Meyhöfer, R. Milligan, and J. Howard. Kinesin follows the microtubulesprotofilament axis. Journal of Cell Biology, 121(5):1083–1093, 1993. 54, 55
V. Rezania, O. Azarenko, M. A. Jordan, H. Bolterauer, R. F. Ludueña, J. T. Huzil,and J. A. Tuszynski. Microtubule assembly of isotypically purified tubulin andits mixtures. Biophys J, 95(4):1993–2008, Aug 2008. doi: 10.1529/biophysj.108.132233. URL http://dx.doi.org/10.1529/biophysj.108.132233. 121
C. Rieder. Kinetochore fiber formation in animal somatic cells: dueling mechanismscome to a draw. Chromosoma, 114(5):310–318, 2005. 16
M. Rief, M. Gautel, F. Oesterhelt, J. Fernandez, and H. Gaub. Reversible unfolding ofindividual titin immunoglobulin domains by AFM. Science, 276(5315):1109–1112,1997. 38
A. Roll-Mecak and F. J. McNally. Microtubule-severing enzymes. Curr Opin CellBiol, 22(1):96–103, Feb 2010. doi: 10.1016/j.ceb.2009.11.001. URL http://dx.doi.org/10.1016/j.ceb.2009.11.001. 57
N. M. Rusan, C. J. Fagerstrom, A. M. Yvon, and P. Wadsworth. Cell cycle-dependentchanges in microtubule dynamics in living cells expressing green fluorescent protein-alpha tubulin. Mol Biol Cell, 12(4):971–980, Apr 2001. 124
I. Sandoval and K. Weber. Guanosine 5’-(alpha,beta-methylene)triphosphate en-hances specifically microtubule nucleation and stops the treadmill of tubulin pro-tomers. Journal of Biological Chemistry, 255(14):6966–6974, 1980. 88
A. Saredi, L. Howard, and D. Compton. NuMA assembles into an extensive filamen-tous structure when expressed in the cell cytoplasm. Journal of Cell Science, 109:619–630, 1996. 43
K. Sawin, K. Leguellec, M. Philippe, and T. Mitchison. Mitotic spindle organizationby a plus-end-directed microtubule motor. Nature, 359(6395):540–543, 1992. 41
H. Schek and A. Hunt. Micropatterned structures for studying the mechanics ofbiological polymers. Biomedical Microdevices, 7(1):41–46, 2005. 77, 78, 82
H. Schek and A. Hunt. Optical tweezers. In J. Webster, editor, Encyclopedia ofMedical Devices and Instrumentation, Volume 5, volume 2, pages 175–187. JohnWiley & Sons, Hoboken, New Jersey, 2006. 81
H. Schek, M. Gardner, J. Cheng, D. Odde, and A. Hunt. Microtubule assemblydynamics at the nanoscale. Current Biology, 17(17):1445–1455, 2007. 26, 27, 69,70, 72, 75, 76, 77, 78, 85, 87, 88, 89, 92, 96, 97, 103, 112, 114, 115, 116, 120, 122,127, 128
P. Schiff, J. Fant, and S. Horwitz. Promotion of microtubule assembly invitro bytaxol. Nature, 277(5698):665–667, 1979. 88
172

F. Schrader. Mitosis: the movements of chromosomes in cell division. ColumbiaUniversity Press, 1953. 14
T. Schroer. Dynactin. Annual Review of Cell and Developmental Biology, 20:759–779,2004. 7
D. Sept, N. A. Baker, and J. A. McCammon. The physical basis of microtubulestructure and stability. Protein Sci, 12(10):2257–2261, Oct 2003. doi: 10.1110/ps.03187503. URL http://dx.doi.org/10.1110/ps.03187503. 53, 131
E. Shelden and P. Wadsworth. Observation and quantification of individual micro-tubule behavior in vivo: microtubule dynamics are cell-type specific. J Cell Biol,120(4):935–945, Feb 1993. 117, 124
K. H. Siller and C. Q. Doe. Spindle orientation during asymmetric cell division.Nat Cell Biol, 11(4):365–374, Apr 2009. doi: 10.1038/ncb0409-365. URL http://dx.doi.org/10.1038/ncb0409-365. 14
J. G. Skellam. The frequency distribution of the difference between two poissonvariates belonging to different populations. J R Stat Soc Ser A, 109(Pt 3):296,1946. 111
R. Skibbens, V. Skeen, and E. Salmon. Directional instability of kinetochore motilityduring chromosome congression and segregation in mitotic newt lung-cells - a push-pull mechanism. Journal of Cell Biology, 122(4):859–875, 1993. 13
K. Slep and R. Vale. Structural basis of microtubule plus end tracking by xmap215,clip-170, and eb1. Molecular Cell, 27(6):976–991, 2007. 88
L. A. Stiffler, J. Y. Ji, S. Trautmann, C. Trusty, and G. Schubiger. Cyclin a andb functions in the early drosophila embryo. Development, 126(23):5505–5513, Dec1999. 126
E. Stukalin and A. Kolomeisky. Simple growth models of rigid multifilament biopoly-mers. Journal of Chemical Physics, 121(2):1097–1104, 2004. 111
R. Subramanian, E. Wilson-Kubalek, C. Arthur, M. Bick, E. Campbell, S. Darst,R. Milligan, and T. Kapoor. Insights into antiparallel microtubule crosslinking byprc1, a conserved nonmotor microtubule binding protein. Cell, 142(3):433–443,2010. 46
H. Sui and K. H. Downing. Structural basis of interprotofilament interaction andlateral deformation of microtubules. Structure, 18(8):1022–1031, Aug 2010. doi: 10.1016/j.str.2010.05.010. URL http://dx.doi.org/10.1016/j.str.2010.05.010.52, 53, 54, 55, 56
T. Surrey, F. Nedelec, S. Leibler, and E. Karsenti. Physical properties determiningself-organization of motors and microtubules. Science, 292(5519):1167–1171, 2001.21, 130
173

K. Svoboda, C. Schmidt, B. Schnapp, and S. Block. Direct observation of kinesinstepping by optical trapping interferometry. Nature, 365(6448):721–727, 1993. 85,87
K. Svoboda, P. Mitra, and S. Block. Fluctuation analysis of motor protein movementand single enzyme-kinetics. Proceedings of the National Academy of Sciences of theUnited States of America, 91(25):11782–11786, 1994. 87
L. Tao, A. Mogilner, G. Civelekogiu-Scholey, R. Wollman, J. Evans, H. Stahlberg,and J. Scholey. A homotetrameric kinesin-5, klp61f, bundles microtubles and an-tagonizes ncd in motility assays. Current Biology, 16(23):2293–2302, 2006. 36
M. Tirado and J. Garciadelatorre. Translational friction coefficients of rigid, sym-metric top macromolecules - application to circular-cylinders. Journal of ChemicalPhysics, 71(6):2581–2587, 1979. 40
S. Toba, T. Watanabe, L. Yamaguchi-Okimoto, Y. Toyoshima, and H. Higuchi. Over-lapping hand-over-hand mechanism of single molecular motility of cytoplasmicdynein. Proceedings of the National Academy of Sciences of the United Statesof America, 103(15):5741–5745, 2006. 33
B. Trinczek, A. Marx, E. M. Mandelkow, D. B. Murphy, and E. Mandelkow. Dynamicsof microtubules from erythrocyte marginal bands. Mol Biol Cell, 4(3):323–335, Mar1993. 91
J. Tuszynski, T. Luchko, S. Portet, and J. Dixon. Anisotropic elastic properties ofmicrotubules. European Physical Journal e, 17(1):29–35, 2005. 36
M. Valentine, P. Fordyce, T. Krzysiak, S. Gilbert, and S. Block. Individual dimers ofthe mitotic kinesin motor Eg5 step processively and support substantial loads invitro. Nature Cell Biology, 8(5):470–U89, 2006. 33, 43
O. Valiron, I. Arnal, N. Caudron, and D. Job. Gdp-tubulin incorporation into growingmicrotubules modulates polymer stability. J Biol Chem, 285(23):17507–17513, Jun2010. doi: 10.1074/jbc.M109.099515. URL http://dx.doi.org/10.1074/jbc.M109.099515. 74
V. VanBuren, D. J. Odde, and L. Cassimeris. Estimates of lateral and longitudinalbond energies within the microtubule lattice. Proc Natl Acad Sci U S A, 99(9):6035–6040, Apr 2002. doi: 10.1073/pnas.092504999. URL http://dx.doi.org/10.1073/pnas.092504999. 53, 67, 68, 69, 72, 90, 99, 122, 124, 127, 128, 148, 149
V. VanBuren, L. Cassimeris, and D. J. Odde. Mechanochemical model of micro-tubule structure and self-assembly kinetics. Biophysical Journal, 89(5):2911–2926,Nov 2005. doi: 10.1529/biophysj.105.060913. URL http://dx.doi.org/10.1529/biophysj.105.060913. 59, 69, 72, 127, 132
A. Vandecandelaere, S. R. Martin, and P. M. Bayley. Regulation of microtubuledynamic instability by tubulin-gdp. Biochemistry, 34(4):1332–1343, Jan 1995. 121
174

R. J. Vasquez, D. L. Gard, and L. Cassimeris. Xmap from xenopus eggs promotesrapid plus end assembly of microtubules and rapid microtubule polymer turnover.J Cell Biol, 127(4):985–993, Nov 1994. 124
C. Veigel, M. Bartoo, D. White, J. Sparrow, and J. Molloy. The stiffness of rabbitskeletal actomyosin cross-bridges determined with an optical tweezers transducer.Biophysical Journal, 75(3):1424–1438, 1998. 38
P. Venier, A. Maggs, M. Carlier, and D. Pantaloni. Analysis of microtubule rigidityusing hydrodynamic flow and thermal fluctuations. Journal of Biological Chemistry,269(18):13353–13360, 1994. 36
K. Visscher and S. Block. Versatile optical traps with feedback control. ACADEMICPRESS INC, SAN DIEGO, 1998. 81, 85, 87
B. Vitre, F. Coquelle, C. Heichette, C. Garnier, D. Chretien, and I. Arnal. Eb1regulates microtubule dynamics and tubulin sheet closure in vitro. Nature CellBiology, 10(4):415–U81, 2008. 49, 55, 58, 59
W. Voter and H. Erickson. The kinetics of microtubule assembly - evidence for a2-stage nucleation mechanism. Journal of Biological Chemistry, 259(16):430–438,1984. 88
P. Wadsworth, A. Khodjakov, and scipline: Cell Biology. E pluribus unum: towardsa universal mechanism for spindle assembly. Trends in Cell Biology, 14(8):413–419,2004. 15, 16
C. E. Walczak, S. Cai, and A. Khodjakov. Mechanisms of chromosome behaviourduring mitosis. Nat Rev Mol Cell Biol, 11(2):91–102, Feb 2010. doi: 10.1038/nrm2832. URL http://dx.doi.org/10.1038/nrm2832. 12, 13
R. Walker, E. Obrien, N. Pryer, M. Soboeiro, W. Voter, H. Erickson, and E. Salmon.Dynamic instability of individual microtubules analyzed by video light-microscopy- rate constants and transition frequencies. Journal of Cell Biology, 107(4):1437–1448, 1988. 76, 91, 126
X. Wan, R. P. O’Quinn, H. L. Pierce, A. P. Joglekar, W. E. Gall, J. G. DeLuca,C. W. Carroll, S.-T. Liu, T. J. Yen, B. F. McEwen, P. T. Stukenberg, A. Desai,and E. D. Salmon. Protein architecture of the human kinetochore microtubuleattachment site. Cell, 137(4):672–684, May 2009. doi: 10.1016/j.cell.2009.03.035.URL http://dx.doi.org/10.1016/j.cell.2009.03.035. 95
C. Wang, A. Cormier, B. Gigant, and M. Knossow. Insight into the gtpase activity oftubulin from complexes with stathmin-like domains. Biochemistry, 46(37):10595–10602, Sep 2007. doi: 10.1021/bi701147f. URL http://dx.doi.org/10.1021/bi701147f. 73, 132
H. Wang and E. Nogales. Nucleotide-dependent bending flexibility of tubulin regulatesmicrotubule assembly. Nature, 435(7044):911–915, 2005. 50, 58, 74
175

R. R. Wei, P. K. Sorger, and S. C. Harrison. Molecular organization of the ndc80complex, an essential kinetochore component. Proc Natl Acad Sci U S A, 102(15):5363–5367, Apr 2005. doi: 10.1073/pnas.0501168102. URL http://dx.doi.org/10.1073/pnas.0501168102. 20
S. Westermann and K. Weber. Post-translational modifications regulate microtubulefunction. Nature Reviews Molecular Cell Biology, 4(12):938–947, 2003. 52
R. Williams and L. Rone. End-to-end joining of taxol-stabilized gdp-containing mi-crotubules. Journal of Biological Chemistry, 264(3):1663–1670, 1989. 83
M. Winey, C. L. Mamay, E. T. O’Toole, D. N. Mastronarde, T. H. Giddings, K. L.McDonald, and J. R. McIntosh. Three-dimensional ultrastructural analysis of thesaccharomyces cerevisiae mitotic spindle. J Cell Biol, 129(6):1601–1615, Jun 1995.125
R. Wollman, E. Cytrynbaum, J. Jones, T. Meyer, J. Scholey, and A. Mogilner. Effi-cient chromosome capture requires a bias in the ’search-and-capture’ process duringmitotic-spindle assembly. Current Biology, 15(9):828–832, 2005. 15
P. Yamauchi, G. Flynn, R. Marsh, and D. Purich. Reduction in microtubule dynamicsinvitro by brain microtubule-associated proteins and by a microtubule-associatedprotein-2 2nd repeated sequence analog. Journal of Neurochemistry, 60(3):817–826,1993. 83
M. Yanagida. Clearing the way for mitosis: is cohesin a target? Nat Rev Mol CellBiol, 10(7):489–496, Jul 2009. doi: 10.1038/nrm2712. URL http://dx.doi.org/10.1038/nrm2712. 12
C. Yuan, A. Chen, P. Kolb, and V. Moy. Energy landscape of streptavidin-biotin com-plexes measured by atomic force microscopy. Biochemistry, 39(33):10219–10223,August 2000. 38
176