Axon and muscle spindle hyperplasia in the myostatin null mouse
12
Axon and muscle spindle hyperplasia in the myostatin null mouse Mohamed I. Elashry, 1,2 Anthony Otto, 1 Antonios Matsakas, 1 Salah E. El-Morsy, 2 Lisa Jones, 1 Bethan Anderson 1 and Ketan Patel 1 1 School of Biological Sciences, Hopkins Building, University of Reading, Reading, UK 2 Anatomy Department, Faculty of Veterinary Medicine, Mansoura University, Mansoura, Egypt Abstract Germline deletion of the myostatin gene results in hyperplasia and hypertrophy of the tension-generating (extrafusal) fibres in skeletal muscle. As this gene is expressed predominantly in myogenic tissues it offers an excellent model with which to investigate the quantitative relationship between muscle and axonal develop- ment. Here we show that skeletal muscle hyperplasia in myostatin null mouse is accompanied by an increase in nerve fibres in major nerves of both the fore- and hindlimbs. We show that axons within these nerves undergo hypertrophy. Furthermore, we provide evidence that the age-related neural atrophic process is delayed in the absence of myostatin. Finally, we show that skeletal muscle hyperplasia in the myostatin null mouse is accompa- nied by an increase in the number of muscle spindles (also called stretch receptors or proprioceptors). However, our work demonstrates that the mechanisms regulating intrafusal fibre hyperplasia and hypertrophy differ from those that control the aetiology of extrafusal fibres. Key words axon; muscle; myostatin; nerve fibre; proprioceptor; skeletal; spindle. Introduction The relationship between nerves and muscles has fascinated biologists for almost 500 years, ever since the first detailed description by Fallopius of the muscular innervation by the cranial nerves (reviewed by Steinberg, 2002). Key work car- ried out at the beginning of the last century by Shorey, amongst others, demonstrated that nerves and muscles are not only linked in terms of being part of a functional unit (to initiate contraction) but also influence each other’s development (Shorey, 1909). Studies performed by Ham- burger (1934) developed these ideas further by demonstrat- ing that the survival of motor neurons is regulated by target tissues in the embryonic limb. A key breakthrough in this field came from the study of Hollyday & Hamburger (1976) who transplanted an additional limb field to the flank of a developing chick and discovered that this opera- tion resulted in an increase of the motor neuron popula- tion. The most significant finding from this landmark study was that the increase in cell number was not due to an expansion of the progenitor pool but rather to a decrease in the degree of cell death, which would normally eliminate motor neurons that failed to form stable synaptic connec- tions. The identity of the tissues that promoted motor neu- ron survival was established through tissue ablation studies in which the somites, the source of skeletal muscle, were shown to have a major influence on motor neuron death (Phelan & Hollyday, 1991). Today it is generally believed that the vertebrate body generates considerably more motor neurons than are needed, and their survival is dependent on the limited pro- duction of trophic factors from muscle and Schwann cells (Sendtner et al., 2000; Strelau et al., 2009). The exact num- ber of cells that are eliminated is thought to be in the region of 50–60% compared to those that survive (Lance- Jones, 1982). It is believed that trophic factors, expressed at elevated levels at the neuromuscular junction, are delivered to the cell body through the deployment of retrograde transport mechanisms along the axon (Bartlett et al., 1998; Pu et al., 1999; Reynolds et al., 2000). These suggestions have been assimilated into the trophic factor access hypoth- esis (reviewed by Banks & Chamberlain, 2005; Oppenheim et al., 1999). Numerous trophic factors have been shown to promote motor neuron survival, including insulin-like growth factor (IGF)-1 and ciliary neurotrophic factor (CNTF), often most efficacious when used in combination. Further- more, there is evidence that certain motor neuron sub-types may depend on specific combinations of trophic factors to survive (Forger et al., 2003). Correspondence Ketan Patel, School of Biological Sciences, Hopkins Building, Whitek- nights, Reading, RG6 6UB, Berkshire, UK. T: + 44 (0)118 378 8079; E: [email protected] Accepted for publication 19 November 2010 ª 2011 The Authors Journal of Anatomy ª 2011 Anatomical Society of Great Britain and Ireland J. Anat. (2011) 218, pp173–184 doi: 10.1111/j.1469-7580.2010.01327.x Journal of Anatomy
-
Upload
independent -
Category
Documents
-
view
2 -
download
0
Transcript of Axon and muscle spindle hyperplasia in the myostatin null mouse

Axon and muscle spindle hyperplasia in the myostatinnull mouseMohamed I. Elashry,1,2 Anthony Otto,1 Antonios Matsakas,1 Salah E. El-Morsy,2 Lisa Jones,1
Bethan Anderson1 and Ketan Patel1
1School of Biological Sciences, Hopkins Building, University of Reading, Reading, UK2Anatomy Department, Faculty of Veterinary Medicine, Mansoura University, Mansoura, Egypt
Abstract
Germline deletion of the myostatin gene results in hyperplasia and hypertrophy of the tension-generating
(extrafusal) fibres in skeletal muscle. As this gene is expressed predominantly in myogenic tissues it offers an
excellent model with which to investigate the quantitative relationship between muscle and axonal develop-
ment. Here we show that skeletal muscle hyperplasia in myostatin null mouse is accompanied by an increase in
nerve fibres in major nerves of both the fore- and hindlimbs. We show that axons within these nerves undergo
hypertrophy. Furthermore, we provide evidence that the age-related neural atrophic process is delayed in the
absence of myostatin. Finally, we show that skeletal muscle hyperplasia in the myostatin null mouse is accompa-
nied by an increase in the number of muscle spindles (also called stretch receptors or proprioceptors). However,
our work demonstrates that the mechanisms regulating intrafusal fibre hyperplasia and hypertrophy differ from
those that control the aetiology of extrafusal fibres.
Key words axon; muscle; myostatin; nerve fibre; proprioceptor; skeletal; spindle.
Introduction
The relationship between nerves and muscles has fascinated
biologists for almost 500 years, ever since the first detailed
description by Fallopius of the muscular innervation by the
cranial nerves (reviewed by Steinberg, 2002). Key work car-
ried out at the beginning of the last century by Shorey,
amongst others, demonstrated that nerves and muscles are
not only linked in terms of being part of a functional unit
(to initiate contraction) but also influence each other’s
development (Shorey, 1909). Studies performed by Ham-
burger (1934) developed these ideas further by demonstrat-
ing that the survival of motor neurons is regulated by
target tissues in the embryonic limb. A key breakthrough in
this field came from the study of Hollyday & Hamburger
(1976) who transplanted an additional limb field to the
flank of a developing chick and discovered that this opera-
tion resulted in an increase of the motor neuron popula-
tion. The most significant finding from this landmark study
was that the increase in cell number was not due to an
expansion of the progenitor pool but rather to a decrease
in the degree of cell death, which would normally eliminate
motor neurons that failed to form stable synaptic connec-
tions. The identity of the tissues that promoted motor neu-
ron survival was established through tissue ablation studies
in which the somites, the source of skeletal muscle, were
shown to have a major influence on motor neuron death
(Phelan & Hollyday, 1991).
Today it is generally believed that the vertebrate body
generates considerably more motor neurons than are
needed, and their survival is dependent on the limited pro-
duction of trophic factors from muscle and Schwann cells
(Sendtner et al., 2000; Strelau et al., 2009). The exact num-
ber of cells that are eliminated is thought to be in the
region of 50–60% compared to those that survive (Lance-
Jones, 1982). It is believed that trophic factors, expressed at
elevated levels at the neuromuscular junction, are delivered
to the cell body through the deployment of retrograde
transport mechanisms along the axon (Bartlett et al., 1998;
Pu et al., 1999; Reynolds et al., 2000). These suggestions
have been assimilated into the trophic factor access hypoth-
esis (reviewed by Banks & Chamberlain, 2005; Oppenheim
et al., 1999). Numerous trophic factors have been shown to
promote motor neuron survival, including insulin-like
growth factor (IGF)-1 and ciliary neurotrophic factor (CNTF),
often most efficacious when used in combination. Further-
more, there is evidence that certain motor neuron sub-types
may depend on specific combinations of trophic factors to
survive (Forger et al., 2003).
Correspondence
Ketan Patel, School of Biological Sciences, Hopkins Building, Whitek-
nights, Reading, RG6 6UB, Berkshire, UK. T: + 44 (0)118 378 8079;
Accepted for publication 19 November 2010
ªª 2011 The AuthorsJournal of Anatomy ªª 2011 Anatomical Society of Great Britain and Ireland
J. Anat. (2011) 218, pp173–184 doi: 10.1111/j.1469-7580.2010.01327.x
Journal of Anatomy
Many experiments have been performed in which the
number of muscle fibres was reduced and the outcome on
motor neuron number assessed. It was shown that the num-
ber of surviving motor neurons decreased when the number
of muscle fibres was reduced (Habgood et al., 1984; Tanaka
& Landmesser, 1986; Grieshammer et al., 1998). In contrast,
very few experiments have determined axon numbers in
nerves following manipulations that increased the number
of muscle fibres. Such studies would be valuable as they
would not only validate the trophic factor access hypothesis
but, importantly, would determine whether the extra sur-
viving cells can be maintained over extended periods.
We here exploit the phenotype of the myostatin null
mouse specifically to determine the effect of a genetic
manipulation that results in increased muscle fibre number
on nerve fibre development in two major limb nerves. The
radial and ischiatic nerves were chosen as representative
elements in the anterior and posterior, respectively, of the
mouse. The radial is the largest nerve in the brachial plexus.
It conducts action potentials that mediate the contraction
of extensor muscles of the upper arm and forearm, as well
as relaying cutaneous sensation from the dorsal autopod.
The ischiatic nerve is the broadest nerve in the body and is
a continuation of the sacral plexus. It innervates thigh and
shank muscles as well as relaying cutaneous sensation (Gray
et al., 1995). Myostatin (GDF-8) is a member of the trans-
forming growth factor-beta (TGF-b) super-family of proteins
that negatively regulate skeletal muscle mass (McPherron
et al., 1997). Genetic deletion of myostatin in mice results in
muscle enlargement, which is brought about by enlarge-
ment (hypertrophy) and increase in the number (hyperpla-
sia) of tension-generating fibres (McPherron et al., 1997;
Elashry et al., 2009). The mutant is particularly valuable for
this study as the gene is expressed predominantly in muscle,
not in connective tissue or in tissues of the central nervous
system.
Muscle fibres of skeletal muscle perform two major func-
tions. The vast majority generate tension through contrac-
tion. The fibres responsible for generating tension are
called extrafusal fibres. They are categorised in terms of
their myosin heavy chain (MHC) content and, in mice, are
classed as oxidative (type I and type IIa), intermediate (type
IIx) or glycolytic (type IIb). However, another population of
contractile protein-rich fibres are also present in skeletal
muscle. These muscle spindles (also called stretch receptors
or proprioceptors) are essential for the optimal working of
the tissues as they prevent overstretching by acting as mec-
hano-sensors (Maier, 1997). Muscle spindles are composed
of a connective tissue capsule that surrounds a varying
number of discrete muscle fibres called intrafusal fibres. In
contrast, extrafusal fibres contain only one muscle fibre,
surrounded by a connective tissue layer. Two forms of mus-
cle spindles have been identified based on the organisation
of the nuclei; nuclear bag fibres, where the nuclei are
grouped at the equatorial region, and nuclear chain fibres,
where the nuclei are centrally located and arranged in a
chain-like fashion. Typically, a type Ia sensory fibre projects
from the non-contracting portion of the muscle spindle to
the CNS, relaying information about the degree of contrac-
tion in extrafusal fibres.
Here we report that the deletion of myostatin, which
causes muscle fibre hyperplasia, results in an increase in the
number of axons present in both the radial and ischiatic
nerves. Previous work has shown that the diameter of a
motor neuron is a reflection of the size of the motor unit.
Fast (glycolytic) muscle fibres are part of large motor units
in which the axon tends to have a large diameter. In con-
trast, slow (oxidative) fibres are part of small motor units
and are innervated by small-diameter neurons (Carmeli &
Reznick, 1994). We report that the large glycolytic muscle
fibre type profile of myostatin null animals is reflected in an
increase in the average axon diameter in both the radial
and ischiatic nerves. Lastly, we show that the increase in
extrafusal fibre number is accompanied by an increase in
the number of muscle spindles.
Material and methods
Animals
C57 ⁄ BL6 and transgenic mstn) ⁄ ) male mice (minimum of n = 3)
were bred in the Biological Resource Unit at the University of
Reading. Mice were housed with food and water ad libitum
until they reached the required age.
Muscle tissue collection
All the mice were killed through schedule one procedures. Two
muscles, the flexor digitorum superficialis (FDS) and the flexor
digitorum brevis (FDB), from the forelimbs and hindlimbs,
respectively, were carefully dissected, snap frozen with liquid
nitrogen pre-cooled with isopentane and kept at )80 �C until
processing. These muscles were chosen as they have a high sen-
sory function and are rich in muscle spindles.
Nerve tissue collection
The radial nerve and ischiatic nerve from the forelimb and hind-
limbs, respectively, were dissected before their branching points.
From the anatomical point of view, the radial nerve is the largest
of the brachial plexus nerves. It passes behind the axillary artery
to the caudal surface of the humerus to traverse from the medial
to the lateral surface of the upper forelimb. The ischiatic nerve
runs under the biceps femoris and semitendinosus muscles.
Before the knee joint, the nerve divides into two main branches,
the tibial and the peroneal nerves (Gray’s Anatomy, 1995). Both
the radial and ischiatic nerves were identified, isolated and fixed
in situ by the addition of a few drops of 2.5% glutaraldehyde in
0.1 M phosphate buffer (pH. 7.3) prior to resection. Sections 2 mm
in length were fixed in 2.5% glutaraldehyde in 0.1 M phosphate
buffer (pH. 7.3) for 3 days, ethanol-dehydrated, washed in resin
(LR medium resin kit; TAAB, UK) and then equilibrated in resin
overnight at 4 �C. The samples were placed in moulds before the
ªª 2011 The AuthorsJournal of Anatomy ªª 2011 Anatomical Society of Great Britain and Ireland
Myostatin null nerve fibre phenotype, M. I. Elashry et al.174

addition of hardener (acrylic resin accelerator; TAAB). The resin
blocks were sectioned at 1 lm thickness using an ultra-microtome
with a disposable glass knife.
Histological analysis
Resin sections were left to dry on a hot surface (60 �C) over-
night. Subsequently, sections were covered with 1% toluidine
blue with 1% sodium borate for 1 min, washed in distilled
water, dried and mounted using DPX, as previously performed
(Illanes et al., 1990).
Immunohistochemistry
Frozen muscle samples were rapidly embedded in tissue tech
freezing medium (Jung) using dry ice-cooled ethanol. Whole
muscles were cryosectioned and placed on polylysine-coated
slides from the tendon of origin to the tendon of insertion to
get a single 10-lm section for every 50 lm of muscle length.
The sections were air-dried for at least 2 h before staining. The
sections were blocked in wash buffer [5% foetal calf serum
(v ⁄ v) in phosphate-buffered saline containing 0.05% Triton
X-100]. Basal lamina and myosin heavy chain isoforms (MHC)
type I-, IIa- and IIb-expressing fibres were identified using rabbit
anti-laminin (1 : 200) polyclonal antibody (Sigma) and
A4.840 IgM (1 : 1), A4.74 IgG (1 : 4) and BFF3 IgM (1 : 1) super-
natant monoclonal primary antibodies, respectively (Develop-
mental Studies Hybridoma Bank). Primary antibodies were
visualised using Alexa Fluor 488 goat anti-mouse IgG (Molecular
Probes A11029, 1 : 200) and Alexa Fluor 633 goat anti-mouse
IgM (Molecular Probes A21046, 1 : 200) secondary antibodies.
All antibodies were diluted in wash buffer 30 min prior to use.
Transmission electron microscopy
The nerve sections were stained with lead acetate. Transmission
electron microscopy was carried out using a Philips CM 20 with
an accelerating voltage of 80 kV.
Digital image analysis
Images of toluidine blue-stained sections were captured using a
light microscope under an oil immersion lens (· 100) with an
Axiocam digital camera. Quantification of nerve fibres was per-
formed manually as previously described (Illanes et al., 1990).
Measurement of the nerve fibre cross-sectional area (CSA) was
carried out via manual drawing around each fibre using Zeiss
AXIOVISION software version 4.7. First, the total CSA of the nerve
fibre was determined by measuring the area inside the outer limit
of the myelin sheath. Secondly, the axonal CSA was measured.
Finally, the myelin sheath CSA was calculated by subtracting the
nerve fibre value from the axon area (Fig. 2K). Images of stained
FDS and FDB muscle transverse sections were captured using a
Zeiss Axioscop2 fluorescent microscope. Images of whole cross-
sections were reconstructed using ADOBE PHOTOSHOP CS. Quantifica-
tion of proprioceptors and the number of intrafusal fibres was
performed by following the same muscle spindle on serial sec-
tions through the entire length of the muscle. Intrafusal fibre
cross-sectional area measurements were performed manually
using Zeiss AXIOVISION software version 4.7. All FDS and FDB fibres
negative for MHC IIa and IIb on double-stained sections were
considered to be of a type IIX phenotype by subtraction of the
number of type I-stained fibres from serial muscle sections.
Statistical analysis
Quantification of the total axon number and cross-sectional
area of both genotype (wild type vs. myostatin null) and age
(6 vs. 12 months old) was analysed using two-way analysis of
variance (ANOVA). Assessment of the number of proprioceptors,
the number of intrafusal fibres and the CSA of intrafusal fibres
was carried out using a two-tailed Student t-test, where
P £ 0.05 was considered to be significant.
Results
Myostatin deletion increases the number of the
axons in fore- and hindlimb nerves
It is well established that myostatin (GDF-8) inhibition
increases the muscle mass through hyperplasia and ⁄ or
hypertrophy (McPherron et al., 1997; Elashry et al., 2009).
Development of muscle has been shown to influence motor
neurons but this paradigm has not been examined in
mstn) ⁄ ) animals. To this end we chose two major nerves
that innervate the muscles of the fore- (radial) and hindlimb
(ischiatic). Our analysis showed that myostatin deletion
resulted in 21.4 ± 2.8% increases in the number of axons in
the radial nerve and 14.4 ± 0.8% increases in the ischiatic
nerve at 6 months of age. A similar increase was observed
at 12 months of age (Fig. 1A–C).
Myostatin deletion delays the age-related reduction
of axon number
Previous analysis of axon number in the median nerve of
humans demonstrated a reduction with age (Brown, 1972).
Here we examined the effect of deleting myostatin on the
age-related influence on axon number. Our results revealed
that the radial nerve of 12-month-old wild-type mice
showed a significant 18.5 ± 3.1% reduction in axon number
compared to 6-month-old animals. In contrast, the mstn) ⁄ )
mice showed a non-significant decrease of 3.4 ± 2.3% dur-
ing this period (Fig. 1B). Similarly, the ischiatic nerve of
mstn+ ⁄ + 12-month-old mice showed a significant reduction
in axon number of 8.2 ± 2.7% compared to a non-signifi-
cant reduction of 3.7 ± 0.8% in mstn) ⁄ ) mice (Fig. 1C).
Interestingly, analysis of 24-month-old mstn) ⁄ ) showed a
highly significant reduction in the total number of axons
(22.2 ± 2.9% and 11.1 ± 1.4% for radial and ischiatic nerves,
respectively) compared to 6-month-old mstn) ⁄ ) mice
(Fig. 1D). Our results demonstrate that myostatin deletion
does not cause a significant reduction in the number of the
axons at 12 months of age compared to the wild type.
However, this was not permanent, as nerve fibre depletion
became evident by 24 months.
ªª 2011 The AuthorsJournal of Anatomy ªª 2011 Anatomical Society of Great Britain and Ireland
Myostatin null nerve fibre phenotype, M. I. Elashry et al. 175

Hypertrophy followed by age-related hypotrophy in
myostatin null axons
Previous studies have demonstrated that myostatin deletion
induces a shift from small to large fast myofibres (Girgen-
rath et al., 2005; Elashry et al., 2009). Therefore, we exam-
ined whether the muscle fibre size shift induced by
myostatin loss is accompanied by changes in the CSA of the
nerve fibres. Our results for the radial and ischiatic nerves
from 6-month-old mstn) ⁄ ) animals showed increases in the
CSA of the individual nerve fibres compared to tissue from
age-matched mstn+ ⁄ + controls (Fig. 2A,D, also Fig. 2G and I;
quantification in Table 1).
We then addressed the question of whether the CSA
increase resulted from expansion of the axon or its sur-
rounding myelin sheath. Our analysis of the 6-month-old
radial and ischiatic nerves of mstn) ⁄ ) animals revealed sig-
nificant increases in the CSA of both the axon and myelin
sheath (Fig. 2B,C,E,F, compare G and I). At 6 months of age,
the axonal expansion was greater in the ischiatic nerve than
in the radial nerve (Fig. 2B,E).
Radial and ischiatic nerves from both mstn) ⁄ ) and mstn+ ⁄ +
genotypes exhibited age-related hypotrophy in the CSA of
individual fibres by 12 months (Fig. 2A,D). The degree of
hypotrophy depended on the identity of the nerve. The
radial nerve from the mstn) ⁄ ) mice showed less hypertrophy
compared to age-matched mstn+ ⁄ + mice (Fig. 2A). The
opposite was found for the ischiatic nerve (Fig. 2D). Detailed
analysis of the axon and myelin sheath characteristics
revealed some interesting findings. The radial nerve of
mstn+ ⁄ + mice showed greater age-related hypotrophy in
both the axon and myelin sheath compared to mstn) ⁄ ) mice
(Fig 2B,C). In contrast, the ischiatic nerve of the mstn) ⁄ ) ani-
mals displayed a greater reduction in the diameter of both
axon and myelin sheath compared to mstn+ ⁄ +animals
(Fig. 2E,F, also compare G with H and I with J).
The CSA of motor neurons is directly related to the size of
the motor unit. During aging, loss of (large-diameter) fast
motor neurons leads to muscle fibres being re-innervated by
(small-diameter) slow motor neurons. We therefore assessed
whether the size of nerve fibres changed over time. We
A B
C D
Fig. 1 Myostatin deletion increases the
number of nerve fibres. (A) Representative
images showing transverse sections through
the ischiatic nerve of 6-month-old mstn+ ⁄ +
and mstn) ⁄ ) mice. Myostatin deletion-
induced hyperplasia results in an increased
cross-sectional area. Scale bar: 20 lm. (B,C)
Quantification of the average nerve fibre
number in the radial (B) and ischiatic (C)
nerves of 6- and 12-month-old mstn+ ⁄ + (red)
and mstn) ⁄ ) (green) mice (n = 3 mice per
group). Higher values were observed in
mstn) ⁄ ) nerves at both ages compared to
age-matched mstn+ ⁄ + counterparts. Two-way
ANOVA shows a significant genotype-
dependent increase in nerve fibre number
(P < 0.001). mstn+ ⁄ + animals 12 months old
showed decreases in the number of nerve
fibres for both radial (B) and ischiatic (C)
nerves when compared to 6-month-old
animals of equivalent genotype (n = 3 mice
per group), but not mstn) ⁄ ) animals. Two-
way ANOVA shows significant age-dependent
decreases in nerve fibre number (P = 0.001
for both nerves). (D) Average nerve fibre
number in the radial and ischiatic nerves of
6-, 12- and 24-month-old mstn) ⁄ ) mice.
One-way ANOVA was performed to measure
the effect of age on nerve fibre number of
the mstn) ⁄ ) mice (6- vs. 12- vs. 24-month-
old mice). Significant reductions in the
number of axons from 6 to 24 m were
observed (n = 3 animals at each time point;
*P < 0.001). Error bars are mean ± SEM.
ªª 2011 The AuthorsJournal of Anatomy ªª 2011 Anatomical Society of Great Britain and Ireland
Myostatin null nerve fibre phenotype, M. I. Elashry et al.176

grouped nerve fibres into three categories – small (0–
20 lm2), medium (20–60 lm2) and large (more than 60 lm2)
– to evaluate the percentage of each population present at a
given time. (All data are shown as percentage ± SEM in
Table 2). Our analysis for the radial nerve showed that the
mstn) ⁄ ) mice contained fewer small-sized nerve fibres but
more large-sized nerve fibres compared to the mstn+ ⁄ + ani-
mals (Fig. 3A). A similar situation was found at 12 months,
with the major difference being that the proportion of small
nerves had increased with age for both genotypes. Following
this trend, similar significant changes in the percentage of
large and small nerve fibres with both genotype and age
were revealed following examination of the ischiatic nerve
(Fig. 3B). These results suggest that myostatin deletion
induced a nerve fibre shift towards large-sized units as com-
pared to age-matched wild types. On the other hand, both
genotypes gained more small-sized units at the expense of
large-sized units during aging. To confirm and extend these
results, we examined the radial nerve from 24-month-old
mstn) ⁄ ) mice and compared it with younger mutant animals.
One-way ANOVA revealed that the radial nerve from 24-
month-old mstn) ⁄ ) mice showed a significant increase in the
percentage of small-sized axons compared to 6- and 12-
month-old mice and a significant decrease in the percentage
of large-sized axons, with no significant difference in the per-
centage of medium-sized axons (Fig. 3C, compare D–F, and
Tables 1 and 2). Our results suggest that myostatin deletion
reduces the rate of age-related nerve fibre hypotrophy but
does not in any way halt this process. The mstn) ⁄ ) nerve does
undergo significant hypotrophy by 24 months (Fig. 3F).
A B C
D E
G H I J K
F
Fig. 2 Myostatin deletion increases nerve fibre CSA. Average nerve fibre CSA (axons and myelin sheath) of the radial (A) and ischiatic (D) nerves
of 6- and 12-month-old mstn+ ⁄ + and mstn) ⁄ ) mice. (A) mstn) ⁄ ) mice show a significant increase in nerve fibre CSA compared to mstn+ ⁄ +
counterparts (P < 0.001). Significant age-related changes in CSA were observed in both genotypes analysed (P < 0.001). Average axon CSA of the
radial (B) and ischiatic (E) nerves of 6- and 12-month-old mstn+ ⁄ + and mstn) ⁄ ) mice. Two-way ANOVA for both nerves showed significant changes
by genotype, age and interaction of the two parameters. Average myelin sheath CSA of the radial (C) and ischiatic (F) nerves of 6- and 12-month-
old mstn+ ⁄ + and mstn) ⁄ ) mice. Two-way ANOVA for both nerves showed significant changes by genotype, age and interaction of the two
parameters. (G–J) TEM images showing sections of radial nerve from 6- and 12-month-old mstn+ ⁄ + and mstn) ⁄ ) mice. Images from 6-month-old
mstn) ⁄ ) mice show an increase in the CSA of axons compared to age-matched mstn+ ⁄ + animals. Fibres from 12-month-old mstn) ⁄ ) radial nerves
show a reduction in the CSA compared to those from 6-month-old animals. AX, axon; MS, myelin sheath. (K) Diagrammatic illustration showing
the technique used for nerve fibre (NF), axon (AX) and myelin sheath (MS) cross-sectional area measurements. Scale bar: 5 lm.
ªª 2011 The AuthorsJournal of Anatomy ªª 2011 Anatomical Society of Great Britain and Ireland
Myostatin null nerve fibre phenotype, M. I. Elashry et al. 177

Unfortunately, comparisons with wild types were not possi-
ble due to the premature death of age-matched litter mates.
Hyperplasia of muscle spindles in the myostatin
null mice
It is well established that myostatin deletion increases skele-
tal muscle mass through varying degrees of hyperplasia and
hypertrophy (McPherron et al., 1997; Elashry et al., 2009).
However, it is not clear whether the hyperplasia of extrafus-
al fibres is accompanied by an increase in the number of
muscle spindles. Previous studies have shown that postural
muscles contain a high proportion of muscle spindles.
Therefore, to analyse the effect of myostatin loss on muscle
spindle number, we carried out a study on the flexor digito-
rum superficialis and the flexor digitorum brevis as repre-
sentatives of postural muscles of the fore- and hindlimbs,
respectively. We counted every muscle spindle in these two
muscles using histological (Fig. 4A) and immunohistochemi-
cal techniques (Fig. 4A’–A’’), based either on the presence
of nuclear bag ⁄ chain structures (Fig 4A’) or the expression
of MHC within intrafusal fibres (contractile apparatus) at
both polar ends of each muscle spindle (Fig. 4A’’). Our
results show that most of the spindles were distributed in
the mid-belly region of the muscle, with only a few located
at the periphery. Mstn) ⁄ ) muscles contained significantly
increased numbers of the muscle spindles in both muscles
(increases of 26 and 41% for the FDS and FDB muscles,
respectively, P < 0.05) (Fig. 4B). Analysis of the number of
extrafusal fibres revealed that mstn) ⁄ ) mice had 16 ± 1%
and 69 ± 3% more muscle fibres in their FDS and FDB mus-
cles, respectively.
Next, we investigated whether myostatin deletion
increases the number of intrafusal fibres within each spin-
dle. The average number of intrafusal fibres varied from
4.1 ± 0 and 4.26 ± 0 for the FDB and 3.8 ± 0 and 4 ± 0 for
the FDS in the mstn+ ⁄ + and mstn) ⁄ ) mice, respectively. Sur-
prisingly, we failed to find any significant differences in the
Table 1 Average cross-sectional area (CSA) of whole nerve fibre, axon and myelin sheath from 6- and 12-month-old mstn+ ⁄ + and 6-, 12- and 24-
month-old mstn) ⁄ ) mice. All data are shown as mean ± SEM.
Motor unit CSA (lm)2
Radial Ischiatic
Mstn+ ⁄ + Mstn) ⁄ ) Mstn+ ⁄ + Mstn) ⁄ )
6 months 12 months 6 months 12 months 24 months 6 months 12 months 6 months 12 months
Nerve fibre 40.4 ± 1.4 27.1 ± 0.7 48.9 ± 1.2 40.6 ± 1.1* 22.3 ± 0.5§# 29.8 ± 0.7 26.8 ± 0.6 48.2 ± 0.9 31 ± 0.6*
Axon 18.8 ± 0.8 10.9 ± 0.3 20.1 ± 0.6 17.1 ± 0.5* 9.5 ± 0.3§# 10.2 ± 0.3 9.7 ± 0.3 18.5 ± 0.5 11.8 ± 0.3*
Myelin sheath 21.7 ± 0.7 16.2 ± 0.3 28.9 ± 0.7 23.5 ± 0.6* 12.8 ± 0.3§# 19.6 ± 0.4 17.1 ± 0.4 29.7 ± 0.5 19.2 ± 0.3*
Radial nerve – nerve fibre: significant difference (P < 0.001) from *6-month-old mstn) ⁄ ), §6-month-old mstn) ⁄ ) and # 12-month-old
mstn) ⁄ ) mice; axon: significant difference (P < 0.001) from *6-month-old mstn) ⁄ ), §6-month-old mstn) ⁄ ) and #12-month-old mstn) ⁄ )
mice; myelin sheath: significant difference (P < 0.001) from *6-month-old mstn) ⁄ ), §6-month-old mstn) ⁄ ) and # 12-month-old mstn) ⁄ )
mice.
Ischiatic nerve – nerve fibre: *significant difference (P < 0.001) from 6-month-old mstn) ⁄ )mice; axon: *significant difference
(P < 0.001) from 6-month-old mstn) ⁄ ); myelin sheath: *significant difference (P < 0.001) from 6-month-old mstn) ⁄ ).
Table 2 Average relative percentage of small, medium and large nerve fibres (lm2) from 6- and 12-month-old mstn+ ⁄ + and 6-, 12- and 24-
month-old mstn) ⁄ ) mice. All data are shown as mean ± SEM.
Motor unit percentage (%)
Radial Ischiatic
mstn+ ⁄ + mstn) ⁄ ) mstn+ ⁄ + mstn) ⁄ )
6 m 12 m 6 m 12 m 24 m 6 m 12 m 6 m 12 m
Small (0-20 lm2) 38.2 ± 8.9 46.5 ± 3.1 25.2 ± 2.1 37.1 ± 5.5 59.6 ± 5.9*§ 38.1 ± 2.3 49.8 ± 3.5 6.2 ± 1.1 34.9 ± 3.0*
Medium (20–60 lm2) 40.5 ± 2.6 44.4 ± 2.6 41.6 ± 1.1 36.3 ± 1.1 35.5 ± 4.5 53.0 ± 2.7 40.3 ± 1.1 67.8 ± 4.7 58.8 ± 2.4
Large (> 60 lm2) 21.3 ± 9 9.2 ± 3.5 33.2 ± 2.7 26.6 ± 6.3 4.9 ± 1.8*§ 8.8 ± 2.3 9.9 ± 3.7 26.0 ± 5.3 8.8 ± 1.6*
Radial nerve – small: *significant difference from 6-month-old mstn) ⁄ ) mice (P = 0.007); §significant difference (P = 0.04) from 12-
month-old mstn) ⁄ ) mice; medium: no significant changes; large: *significant difference from 6-month-old mstn) ⁄ ) mice (P = 0.008),§12-month-old mstn) ⁄ ) mice (P = 0.02).
Ischiatic nerve – small: *significant difference from 6-month-old mstn) ⁄ ) mice (P = 0.001); medium: no significant changes; large:
*significant difference from 6-month-old mstn) ⁄ ) mice (P = 0.02).
ªª 2011 The AuthorsJournal of Anatomy ªª 2011 Anatomical Society of Great Britain and Ireland
Myostatin null nerve fibre phenotype, M. I. Elashry et al.178
number of intrafusal fibres of both muscles in the absence
of myostatin when compared to the age-matched mstn+ ⁄ +
control (Fig. 4C). These studies show that myostatin dele-
tion results in an increase in the number of muscle spindles
but not in an increase in the number of intrafusal myofibres
present within each of the muscle spindles.
Myostatin deletion has no effect on the fibre-type
properties of intrafusal fibres
We determined the molecular properties of the intrafusal
fibres to establish whether the deletion of myostatin
induces a fibre-type conversion similar to that observed in
the extrafusal fibres (Elashry et al., 2009). Interestingly, mus-
cle spindles of mstn) ⁄ ) animals showed no significant differ-
ence in the fibre-type composition in either the FDS or the
FDB muscles, compared to age-matched mstn+ ⁄ + controls
(Fig. 4D, see also Fig. 5A–D).
Intrafusal fibre hypotrophy in myostatin null mice
Our results demonstrated that myostatin inhibition had no
effect on the total number and MHC profile of the intra-
fusal fibres. Lastly, we examined whether myostatin dele-
AD
E
F
B
C
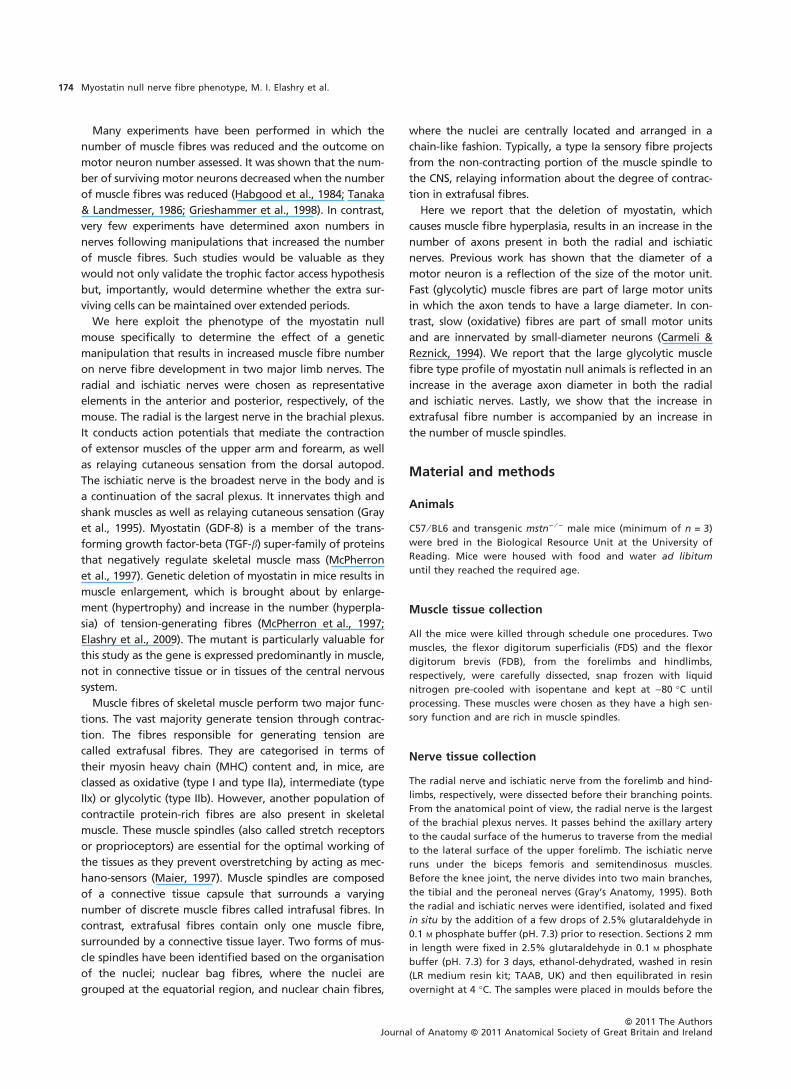
Fig. 3 Myostatin deletion causes a shift from small to large nerve fibres. Average radial and ischiatic nerve fibres were categorized into small
(0–20 lm2), medium (20–60 lm2) and large (>60 lm2). (A) Mstn) ⁄ ) (light and dark green) mice showed a tendency towards a reduction in the
percentage of small nerve fibres and a significant increase in the percentage of large nerve fibres in the radial nerve compared to mstn+ ⁄ + (pink
and red) (P = 0.07 and P < 0.03, respectively). A significant interaction between genotype and age was apparent for changes in medium-sized
nerve fibres (P = 0.05). (B) mstn) ⁄ ) ischiatic nerves (light and dark green) showed significant increases in the percentage of medium and large
nerve fibres, respectively, compared with mstn+ ⁄ + nerves (P < 0.001 and P = 0.05, respectively), with a tendency towards a reduction in small
nerve fibres (P = 0.06). In 12-month-old animals, significant genotype-independent changes were seen in the percentage of small nerve fibres
during aging (P < 0.02). A significant interaction between genotype and age was apparent for changes in small and large nerve fibres (P < 0.001
and P < 0.05, respectively). (C) Average percentage of small, medium and large radial nerve axons from 6-, 12- and 24-month-old mstn) ⁄ ) mice.
The 24-month-old radial nerves (black) harbour significant increases in small nerve fibres and decreases in large nerve fibres. Error bars displayed
as mean ± SEM. (D–F) Representative images of the radial nerve from mstn) ⁄ ) animals at 6- (D), 12- (E) and 24-months of age (F). Scale
bar: 20 lm.
ªª 2011 The AuthorsJournal of Anatomy ªª 2011 Anatomical Society of Great Britain and Ireland
Myostatin null nerve fibre phenotype, M. I. Elashry et al. 179
tion had any effect on the regulation of the CSA of the
intrafusal fibres. Surprisingly, the mstn) ⁄ ) FDS muscle intra-
fusal fibres showed a significant reduction in the CSA of
type IIb and type I intrafusal fibres (Fig. 5E) compared to
age-matched mstn+ ⁄ + mice. Similarly, there was a signifi-
cant reduction in the CSA of type IIb myofibres in the FDB
compared to age-matched mstn+ ⁄ + mice (Fig. 5F) but not in
type I fibres. These data suggest that the mechanisms regu-
lating intrafusal fibre-type development and hypertrophy
differ from those that control these processes in extrafusal
fibres.
Discussion
In this study we report the effect of a genetic manipulation
that causes an increase in skeletal muscle fibre number on
axonal numbers and sizes in two major limb nerves. We
show that following the deletion of myostatin, a potent
inhibitor of skeletal muscle development, the number and
size of axons in both the radial and ischiatic nerves of the
mouse increase compared to wild-type litter mates. Further-
more, we show that the age-related decrease in the num-
ber of axons is attenuated in the mstn) ⁄ ) compared to
A A’
B
C
D
A”
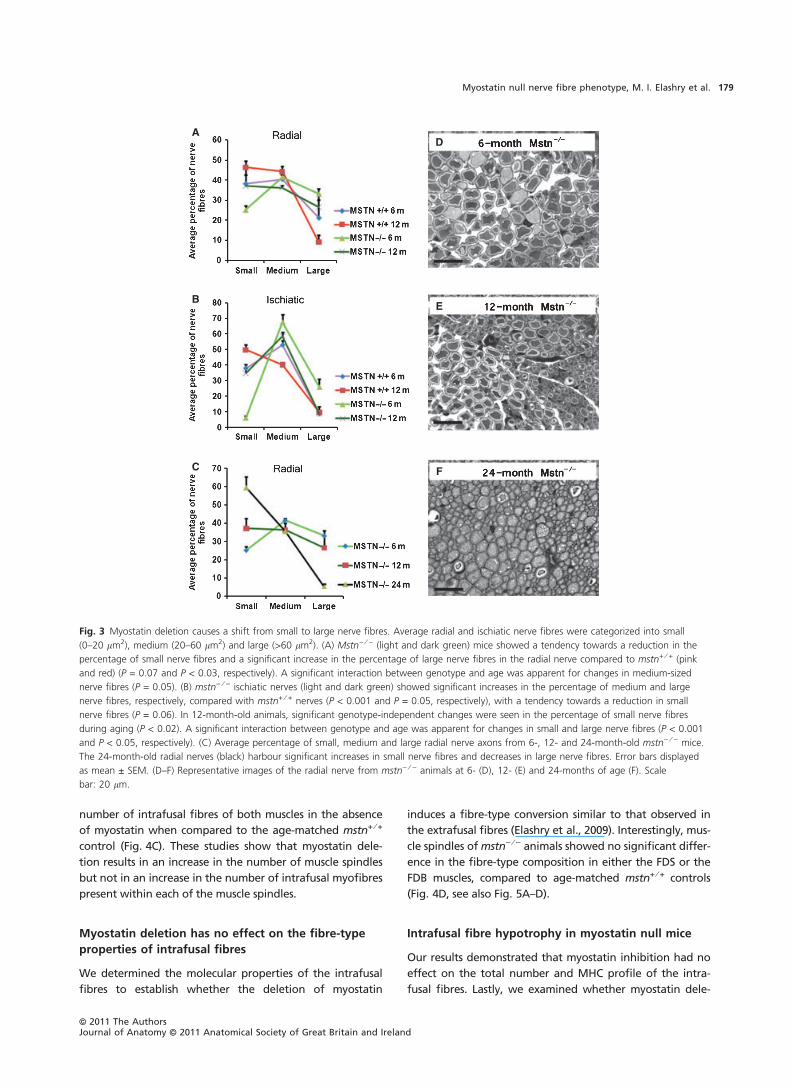
Fig. 4 Myostatin deletion causes an increase
in the number of muscle spindles but no
changes in number of the intrafusal fibres or
MHC-expressing fibres. (A) Haematoxylin and
eosin staining. (A’–A’’) Double
immunofluorescent labelling (right) against
MHC IIa (green) and MHC IIb (red) stained
with 4’,6-diamidino-2-phenylindole (DAPI,
blue) showing the equatorial nuclear region
(A’, white arrowhead) and the myosin heavy
chain region at the polar end showing type
IIa (A’’, green arrowhead) and type IIb (A’’,
red arrowhead). Scale bar: 50 lm. (B)
Average number of muscle spindles in the
FDS and FDB muscles. Significant increases in
muscle spindle number were observed in
muscles from both mstn) ⁄ ) (green bars) and
age-matched mstn+ ⁄ + mice (red bars)
(*P < 0.05). (C) Average total number of
intrafusal fibres in muscle spindles from the
FDS and FDB of mstn+ ⁄ + (red bars) and
mstn) ⁄ ) (green bars) mice. No significant
differences were present. (D) The average
number of MHC type I (blue), IIa (green) and
type IIb (red) intrafusal fibres revealed no
significant change in distribution in the
mstn) ⁄ ) compared to mstn+ ⁄ + mice.
ªª 2011 The AuthorsJournal of Anatomy ªª 2011 Anatomical Society of Great Britain and Ireland
Myostatin null nerve fibre phenotype, M. I. Elashry et al.180

A
B
C
D
E
F
A’
B’
C’
D’
A”
B”
C”
D”
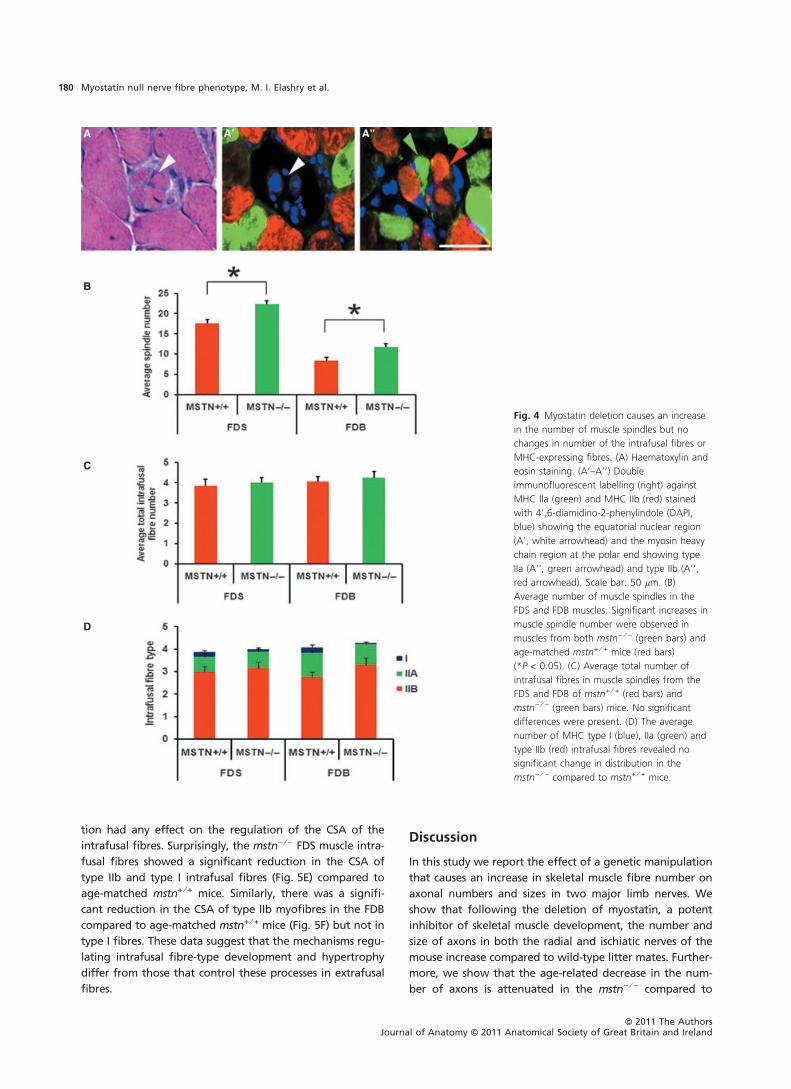
Fig. 5 Myostatin deletion caused a decrease in the CSA of the intrafusal fibres but no changes in the histochemical properties of the spindle.
(A-D) Double immunofluorescent staining for MHC IIa and IIb (A–A’’ and C–C’’) or IIa and I (B–B’’ and D–D’’) on transverse section of FDB muscle
from mstn+ ⁄ + (A–B’’) and mstn) ⁄ ) (C–D’’) highlighting intrafusal fibres (arrows). Scale bar: 50 lm. Quantification of the average CSA of MHC
type I, IIa and IIb positive intrafusal fibres from the FDS (E) and FDB (F). (E) The average CSA of type I and type IIb intrafusal fibres was significantly
smaller in the FDS muscle in the mstn) ⁄ ) than in age-matched mstn+ ⁄ + mice (*P = 0.001). (F) The FDB muscle only displays a significant reduction
in the average CSA of type IIb intrafusal fibres compared to mstn+ ⁄ + counterpart (*P = 0.005). All data are shown as mean ± SEM.
ªª 2011 The AuthorsJournal of Anatomy ªª 2011 Anatomical Society of Great Britain and Ireland
Myostatin null nerve fibre phenotype, M. I. Elashry et al. 181

mstn+ ⁄ + animals. Finally, we show that the increase in extra-
fusal fibres that results in the absence of myostatin is
matched by an increase in the number of muscle spindles.
Investigations going back over 100 years have docu-
mented the link between motor neuron number and the
number of muscle fibres. The general consensus is that the
developing vertebrate embryo generates many more motor
neuron cells than are required, a finding that has been
interpreted as a fail-safe mechanism that insures that all
muscle fibres are innervated.
Three mechanisms are used during prenatal and post-
natal life to control the number of motor neurons. During
early embryogenesis, the motor neuron population is
restricted to the ventral portion of the neural tube follow-
ing its induction by signals originating from the floor plate.
Recent work suggests that any motor neurons that have
been incorrectly induced along the dorsal ventral axis of
the neural tube are subsequently eliminated (Oppenheim
et al., 1999). The second phase of motor neuron number
control occurs later in life but still at the prenatal stages
when motor neurons compete for trophic factors on
recently differentiated myofibres. Motor neurons unable to
secure a source of trophic factors are thereafter eliminated.
Finally, motor neuron number is also regulated after birth.
It is worth noting that in invertebrates, neural activity is
required at an earlier stage of muscle development and is
responsible for promoting myoblast proliferation and sub-
sequent patterning (Fernandes & Keshishian, 2005).
Classical experiments carried out by Hollyday & Ham-
burger (1976) and Pittman & Oppenheim (1979) demon-
strated that increasing the number of potential motor
neuron targets or applying neuromuscular blockading
chemicals greatly increases the number of surviving motor
neurons by preventing normal cell death, a process termed
hypothanasia (Hollyday & Hamburger, 1976). These and
other studies led to the development of the trophic factor
access hypothesis that large numbers of motor neurons are
initially generated, and that these could at early stages of
development access trophic factors produced over extended
regions of the muscle fibres (reviewed by Banks & Chamber-
lain, 2005 and Landmesser, 1992). Trophic factors, possibly
including IGF-1, glial derived neurotrophic factor and CNTF,
are retrogradely transported from the muscle to the motor
neuron cell body (Bartlett et al., 1998; Reynolds et al.,
2000). However, muscle contraction activity thereafter leads
to the remodelling (constriction) of the neuromuscular junc-
tion(s) and concentrates the production of trophic factors in
this region.
Classical studies examined the increase in axon number
only up to later stages of prenatal development and there-
fore did not address whether sufficient trophic factors would
be present to maintain them into adult life. These stud-
ies also did not address whether mechanisms that control
the number of motor neurons in adult life would correct the
extra cells that survived the prenatal cull. Here we show that
deletion of myostatin results in a sustained increase in axon
numbers that extends into adult life. We suggest that the
additional fibres that are generated in the absence of myost-
atin are able to produce sufficient trophic factors to sustain
neurons not only at early stages but also into adulthood.
According to the trophic factor access hypothesis, muscle
fibres are initially poly-innervated and then the remodelling
of the neuro-muscular junction results in all but one axon
terminal maintaining contact with the muscle fibre. We
suggest that the large increase in muscle fibres during both
primary and secondary myogenesis (Matsakas et al., in press)
may lead to fewer poly-innervated myofibres, as there are
more target cells available to the developing motor neurons.
Work is ongoing to investigate this line of thinking.
An important finding from our analysis of the two nerves
examined was that the deletion of myostatin delays the
decrease in axon number and size seen in the wild-type mice
at 12 months of age. Aging has long been known to be
associated with the progressive loss of motor neurons. Fast
motor neurons are preferentially lost, resulting in the loss of
type II muscle fibres. These subsequently are re-innervated
by surviving slow motor neurons, which ultimately leads to a
change in the muscle profile towards an oxidative pheno-
type (Lexell et al., 1988; Lexell, 1997; Degens, 2007). Our
finding that the loss of axons is delayed in the myostatin null
could be explained by the fact that the muscle fibres in the
mutant are considerably larger than in the wild type and
therefore may produce more trophic factors. Indeed, addi-
tional productions of trophic factors have been demon-
strated to promote motor neuron survival (Dobrowolny
et al., 2005). These could counter the detrimental effects of
aging taking place in the fast motor neuron, thereby delaying
axon degeneration. However, it should be noted that the
number and size of axons do eventually decrease, and the
extra production of trophic factors are unable to prevent the
detrimental effects of aging in the long term. Interestingly,
even though the large-diameter axons were lost in the
mstn) ⁄ )animals, themuscle seemstoretainfastfibres (Elashry
et al., 2009). These results would suggest that the genetic
deletion of myostatin prevents the fibres from responding
tothechangeininnervationthattakesplaceduringaging.
It is of interest that although both the radial and ischiatic
nerves of the mstn) ⁄ ) mice were resistant to age-related
axonal loss, the ischiatic axons from the null mice displayed
a greater degree of hypotrophy compared with the radial
axons. At present we do not understand the mechanism
responsible for this difference. However, we propose a pos-
sible explanation based on the muscles that each nerve
innervates. The radial nerve mainly innervates the triceps
and extensor muscles in the forearm. In contrast, the ischiat-
ic nerve innervates large muscles in the back of the leg and
shank. We suggest that these large muscles contain a
greater proportion of fibres that have undergone extensive
hypertrophy following deletion of myostatin and that,
during ageing, they undergo a greater reduction in size
ªª 2011 The AuthorsJournal of Anatomy ªª 2011 Anatomical Society of Great Britain and Ireland
Myostatin null nerve fibre phenotype, M. I. Elashry et al.182

compared with those in the forelimb. A possible conse-
quence of this hypotrophy is the decreased production of
factors maintaining axon anabolic processes.
Our study also addresses the development of the muscle
spindles in a model that induces fibre hyperplasia and hyper-
trophy. We found that there was an increase in the number
of muscle spindles that develop in both the FDS and FDB
muscles examined. Our detailed analysis of muscle spindles
of the myostatin null mice led to three unexpected findings.
First, we show that the intrafusal fibres within the spindles
from mstn) ⁄ ) mice had not undergone hyperplasia, even
though the extrafusal fibres had increased in number.
Secondly, we found that the intrafusal fibres from mstn) ⁄ )
mice had undergone hypotrophy compared to the intrafusal
fibres of mstn+ ⁄ + mice. Thirdly, we show that the intrafusal
fibres from mstn) ⁄ ) animals did not show the fibre-type
switch towards type IIb that is seen in extrafusal fibres.
Much progress has been made regarding our understand-
ing of fibre-type development. Key molecules regulating
this process (MEF2C and MEF2D) were recently identified by
Olson’s group (Potthoff et al., 2007). Overexpression of
either molecule leads to the expression of slow MHC and
the deletion of these genes leads to loss of slow fibres and
development of fast fibres (Potthoff et al., 2007). Interest-
ingly, myostatin has been shown positively to regulate the
expression of these genes (Hennebry et al., 2009). Therefore
the loss of myostatin would lead to the lack of MEF2 expres-
sion, allowing a fast fibre default of the muscle fibres. How-
ever, this does not seem to be the case for muscle spindle
fibres and we suggest either that other mechanisms are
used in these cells or that the cells are able to over-ride the
loss of myostatin. Investigations are currently underway to
identify the mechanisms regulating fibre development in
muscle spindles.
In summary, our work shows that increasing the number
of muscle fibres leads to an increase in axon number. Fur-
thermore, we demonstrate that the axons also increase in
diameter and this possibly reflects the fast fibre composi-
tion of the muscle. Interestingly, we show that, in the
absence of myostatin, there is a delay in the loss of axons.
We suggest that this could be due to the enlarged muscle
producing elevated levels of neurotrophic factors. This
could be of clinical importance, as a number of diseases
involve motor neuron loss, e.g. amyotrophic lateral sclerosis
(ALS), a fatal disease in humans. Motor neuron loss in ani-
mal models of ALS can be delayed through the overexpres-
sion of IGF-1. Recent studies have shown that inhibition of
myostatin results in beneficial outcomes in rodent models
of ALS, promoting studies of this molecule for therapeutic
uses (Holzbaur et al., 2006; Morrison et al., 2009).
Acknowledgements
We would like to thank the Egyptian Ministry of Higher Educa-
tion, the Wellcome Trust (078649), and University of Reading
for generous funding, which allowed this work to be carried
out.
References
Banks GB, Chamberlain JS (2005) Relevance of motoneuron
specification and programmed cell death in embryos to
therapy of ALS. Birth Defects Res C Embryo Today 75, 294–
304.
Bartlett SE, Reynolds AJ, Hendry IA (1998) Retrograde axonal
transport of neurotrophins: differences between neuronal
populations and implications for motor neuron disease.
Immunol Cell Biol 76, 419–423.
Brown WF (1972) A method for estimating the number of motor
units in thenar muscles and the changes in motor unit count
with ageing. J Neurol Neurosurg Psychiatry 35, 845–852.
Carmeli E, Reznick AZ (1994) The physiology and biochemistry
of skeletal muscle atrophy as a function of age. Proc Soc Exp
Biol Med 206, 103–113.
Degens H (2007) Age related skeletal muscle dysfunction: causes
and mechanisms. J Musculoskelet Neuronal Interact 7, 246–
252.
Dobrowolny G, Giacinti C, Pelosi L, et al. (2005) Muscle
expression of a local Igf-1 isoform protects motor neurons in
an ALS mouse model. J Cell Biol 168, 193–199.
Elashry MI, Otto A, Matsakas A, et al. (2009) Morphology and
myofiber composition of skeletal musculature of the forelimb
in young and aged wild type and myostatin null mice.
Rejuvenation Res 12, 269–281.
Fernandes JJ, Keshishian H (2005) Motoneurons regulate
myoblast proliferation and patterning in Drosophila. Dev Biol
15, 493–505.
Forger NG, Prevette D, deLapeyriere O, et al. (2003)
Cardiotrophin-like cytokine ⁄ cytokine-like factor 1 is an
essential trophic factor for lumbar and facial motoneurons in
vivo. J Neurosci 23, 8854–8858.
Girgenrath S, Song K, Whittemore LA (2005) Loss of myostatin
expression alters fiber-type distribution and expression of
myosin heavy chain isoforms in slow- and fast-type skeletal
muscle. Muscle Nerve 31, 34–40.
Gray H, Williams PL, Bannister LH (1995) Gray’s Anatomy: The
Anatomical Basis of Medicine and Surgery, 38th edn. New
York: Churchill Livingstone.
Grieshammer U, Lewandoski M, Prevette D, et al. (1998) Muscle-
specific cell ablation conditional upon Cre-mediated DNA
recombination in transgenic mice leads to massive spinal and
cranial motoneuron loss. Dev Biol 197, 234–247.
Habgood MD, Hopkins WG, Slack JR (1984) Muscle size and
motor unit survival in mice. J Physiol 356, 303–314.
Hamburger V (1934) The effects of wing bud extirpation on the
development of the central nervous systerm in chick embryos.
J Exp Zool 68, 449–494.
Hennebry A, Berry C, Siriett V, et al. (2009) Myostatin regulates
fiber-type composition of skeletal muscle by regulating MEF2
and MyoD gene expression. Am J Physiol Cell Physiol 296,
C525–C534.
Hollyday M, Hamburger V (1976) Reduction of the naturally
occurring motor neuron loss by enlargement of the periphery.
J Comp Neurol 170, 311–320.
Holzbaur EL, Howland DS, Weber N, et al. (2006) Myostatin
inhibition slows muscle atrophy in rodent models of
amyotrophic lateral sclerosis. Neurobiol Dis 23, 697–707.
ªª 2011 The AuthorsJournal of Anatomy ªª 2011 Anatomical Society of Great Britain and Ireland
Myostatin null nerve fibre phenotype, M. I. Elashry et al. 183

Illanes O, Henry J, Skerritt G (1990) Light and electron
microscopy studies of the ulnar, saphenous, and caudal
cutaneous sural nerves of the dog. Am J Anat 187, 158–164.
Lance-Jones C (1982) Motoneuron cell death in the developing
lumbar spinal cord of the mouse. Brain Res 256, 473–479.
Landmesser L (1992) The relationship of intramuscular nerve
branching and synaptogenesis to motoneuron survival.
J Neurobiol 23, 1131–1139.
Lexell J (1997) Evidence for nervous system degeneration with
advancing age. J Nutr 127, 1011S–1013S.
Lexell J, Taylor CC, Sjostrom M (1988) What is the cause of the
ageing atrophy? Total number, size and proportion of
different fiber types studied in whole vastus lateralis muscle
from 15- to 83-year-old men. J Neurol Sci 84, 275–294.
Matsakas A, Otto A, Elashry MI, et al. (in press) Altered primary
and secondary myogenesis in the myostatin-null mouse.
Rejuvenation Res, in press.
Maier A (1997) Development and regeneration of muscle
spindles in mammals and birds. Int J Dev Biol 41, 1–17.
McPherron AC, Lawler AM, Lee SJ (1997) Regulation of skeletal
muscle mass in mice by a new TGF-beta superfamily member.
Nature 387, 83–90.
Morrison BM, Lachey JL, Warsing LC, et al. (2009) A soluble
activin type IIB receptor improves function in a mouse model
of amyotrophic lateral sclerosis. Exp Neurol 217, 258–268.
Oppenheim RW, Homma S, Marti E, et al. (1999) Modulation of
early but not later stages of programmed cell death in
embryonic avian spinal cord by sonic hedgehog. Mol Cell
Neurosci 13, 348–361.
Phelan KA, Hollyday M (1991) Embryonic development and
survival of brachial motoneurons projecting to muscleless
chick wings. J Comp Neurol 311, 313–320.
Pittman R, Oppenheim RW (1979) Cell death of motoneurons in
the chick embryo spinal cord. IV. Evidence that a functional
neuromuscular interaction is involved in the regulation of
naturally occurring cell death and the stabilization of
synapses. J Comp Neurol 187, 425–446.
Potthoff MJ, Wu H, Arnold MA, et al. (2007) Histone
deacetylase degradation and MEF2 activation promote the
formation of slow-twitch myofibers. J Clin Invest 117, 2459–
2467.
Pu SF, Zhuang HX, Marsh DJ, et al. (1999) Time-dependent
alteration of insulin-like growth factor gene expression during
nerve regeneration in regions of muscle enriched with
neuromuscular junctions. Brain Res Mol Brain Res 63, 207–216.
Reynolds AJ, Bartlett SE, Hendry IA (2000) Molecular
mechanisms regulating the retrograde axonal transport of
neurotrophins. Brain Res Brain Res Rev 33, 169–178.
Sendtner M, Pei G, Beck M, et al. (2000) Developmental
motoneuron cell death and neurotrophic factors. Cell Tissue
Res 301, 71–84.
Shorey M (1909) The effect of the destruction of peripheral
areas on the differentiation of the neuroblasts. J Exp Zool 7,
25–64.
Steinberg DA (2002) Scientific neurology and the history of the
clinical examination of selected motor cranial nerves. Semin
Neurol 22, 349–356.
Strelau J, Strzelczyk A, Rusu P, et al. (2009) Progressive
postnatal motoneuron loss in mice lacking GDF-15. J Neurosci
29, 13640–13648.
Tanaka H, Landmesser LT (1986) Cell death of lumbosacral
motoneurons in chick, quail, and chick-quail chimera embryos:
a test of the quantitative matching hypothesis of neuronal
cell death. J Neurosci 6, 2889–2899.
ªª 2011 The AuthorsJournal of Anatomy ªª 2011 Anatomical Society of Great Britain and Ireland
Myostatin null nerve fibre phenotype, M. I. Elashry et al.184