Axon Guidance by Molecular and Topographical Cues by ...
246
Axon Guidance by Molecular and Topographical Cues by Grace Nga Yin Li M.Eng.Sc., University of New South Wales, 2004 B.S., University of California, Berkeley, 2002 Submitted in partial fulfillment of the requirements for the degree of Doctor of Philosophy in the Division of Biology and Medicine at Brown University Providence, Rhode Island May 2008
-
Upload
khangminh22 -
Category
Documents
-
view
1 -
download
0
Transcript of Axon Guidance by Molecular and Topographical Cues by ...
Axon Guidance by Molecular and Topographical Cues
byGrace Nga Yin Li
M.Eng.Sc., University of New South Wales, 2004B.S., University of California, Berkeley, 2002
Submitted in partial fulfillment of therequirements for the degree of Doctor of Philosophy
in the Division of Biology and Medicine at Brown University
Providence, Rhode IslandMay 2008

This dissertation by Grace N. Li is accepted in its present form bythe Division of Biology and Medicine as satisfying the dissertation requirement
for the degree of Doctor of Philosophy.
DateDiane Ho!man-Kim, Ph.D., Director
Recommended to the Graduate Council
DateMichael Lysaght, Ph.D., Reader
DateJe!rey Morgan, Ph.D., Reader
DateAnubhav Tripathi, Ph.D., Reader
DateRavi Bellamkonda, Ph.D., External Reader
Approved by the Graduate Council
DateSheila Bonde, Dean of the Graduate School
iii

Vita
Name: Grace Nga Yin Li
Date of birth: December 30, 1980
Place of Birth: Hong Kong
EDUCATION
• Ph.D. candidate, Biomedical Engineering, Expected graduation date: May 2008 Thesis
title: Axon guidance by Multimolecular Cues, Brown University; Providence, Rhode
Island
• M.Eng. Biomedical Engineering, December 2003 Thesis title: Biological performance
of a novel synthetic furanone-based antimicrobial, University of New South Wales;
Sydney, Australia
• B.S. Bioengineering, December 2002 University of California, Berkeley; Berkeley, Cal-
ifornia
EMPLOYMENT HISTORY
• Formulations Research Chemist I, ALZA Corporation, Intravenous Technology Devel-
opment, Mountain View, California, 2001-2002
iii
FELLOWSHIPS/AWARDS
• Kaplan Graduate Fellowship, Brain Science Program, Brown University, 2007
• University Fellowship, Brown University, 2004-2005
• International Academy of Medical and Biological Engineering Young Investigator prize–
Highly commended, 8/2003
PUBLICATIONS
• Li GN and Hoffman-Kim D. Tissue engineered platforms of axon guidance. Tissue
Engineering Part B: Reviews 14(1): 33-51, 2008.
• Li GN, Liu J, and Hoffman-Kim D. Multi-molecular gradients of permissive and in-
hibitory cues direct neurite outgrowth. Annals of Biomedical Engineering, 2008 Apr
5; [Epub ahead of print].
• Li GN and Hoffman-Kim D. Quantification of neurite outgrowth using a novel appli-
cation of circular analysis. Submitted to J. Neurosci Meth, 2008.
• Li GN, Livi LL, Gourd CM, Deweerd ES, and Hoffman-Kim D. Genomic and mor-
phological changes of neuroblastoma cells in response to three-dimensional matrices.
Tissue Engineering 13: 1035-1047, 2007.
• Goldner JS, Bruder JM, Li GN, Gazzola D, and Hoffman-Kim D. Neurite bridging
across micropatterned grooves. Biomaterials 27(3): 460-472, 2006.
• Baveja JK, Li GN, Nordon RE, Hume EB, Kumar N, Willcox MD and Poole-Warren
LA. Biological performance of a novel synthetic furanone-based antimicrobial. Bioma-
terials 25(20):5013-21, 2004.
iv

Abstracts
• Li GN, Cheng E and Hoffman-Kim D. Effects of RhoGTPases on Neurite Outgrowth
on Multimolecular Gradients. Annual Meeting of the Biomedical Engineering Society,
September 2007.
• Li GN, Deweerd E and Hoffman-Kim D. Neurite growth on gradients of inhibitory
and permissive cues. Annual Meeting of the Biomedical Engineering Society, October
2006.
• Richardson J, Li GN and Hoffman-Kim D. Surface topography and adhesivity influ-
ence Schwann cell bridging. Annual Meeting of the Biomedical Engineering Society,
October 2006.
• Deweerd ES, Li GN and Hoffman-Kim D. Promotion of neurite outgrowth on multi-
molecular gradients by modulating downstream Rho pathways. Annual Meeting of
the Society for Biomaterials, April 2006.
• Gourd C, Deweerd E, Livi L, Li GN and Hoffman-Kim D. Genomic and morphological
analysis of human neuroblastoma cell growth in three-dimensional matrices. Annual
Meeting of the Society for Biomaterials, April 2006.
• Li GN, Liu J, Cheng E and Hoffman-Kim D. Neurite outgrowth on gradients of per-
missive and inhibitory cues. Annual Meeting of the Biomedical Engineering Society,
October 2005.
• Li GN, Liu J and Hoffman-Kim D. Neurite outgrowth on multi-molecular gradients.
Annual Meeting of the Society for Biomaterials, April 2005.
• Goldner J, Bruder J, Li GN, Gazzola D and Hoffman-Kim D. Neurite bridging across
micropatterned grooves. Nanotech2004 Montreux, November 2004.
• Goldner JS, Bruder JM, Li GN, Gazzola D and Hoffman-Kim D. Effects of groove
dimensions on neurite bridging across micropatterned grooves. Annual Meeting of the
Biomedical Engineering Society, October 2004.
v

• Li GN, Baveja JK, Hume EB, Doran M, Nordon RE and Poole-Warren LA. Biological
performance of a novel synthetic furanone-based antimicrobial. International Confer-
ence on Cellular Engineering, August 2003.
Manuscripts in progress
• Li GN, Deweerd E, Cheng E and Hoffman-Kim D. Promotion of neurite outgrowth on
multi-molecular gradients by modulating Rho kinase. In preparation, 2008.
INVITED LECTURE
• University of Massachusetts, Dartmouth; Dartmouth, MA. Bioengineering and Biotech-
nology Conference. February, 2006.
PROFESSIONAL AFFILIATIONS
• Biomedical Engineering Society
• Society for Biomaterials
TEACHING EXPERIENCE
Teaching Assistant, Brown University, Providence, RI
• Techniques in Molecular and Cell Science, BI 2130, Fall 2005
• Organ Replacement, BI 1080, Spring 2006 and Spring 2007
• Exercise Physiology, BI 1160, Fall 2007 Graduate Student Advisor, 2004 – present.
vi

VOLUNTEER EXPERIENCE
Rhode Island Department of Education, Math and Science Partnership at Harris Elementary
School and Citizens Elementary School, Woonsocket, RI. 8/2007-present. Planning and
implementation of after school science programs for elementary school students (Grades 3-5)
with focus on experimentation for understanding of Rhode Island Grade Level Expectations.
vii

Preface
The primary motivation for this work was to study the interactions between neurons and
their local microenvironments that contain specific guidance cues such as micropatterned
molecular cues or microgrooved topographies. The investigation of these cell-material inter-
actions quantitatively measures the effects of specific parameters of guidance cues such as
slope of concentration gradient and dimension of grooves on neurite outgrowth in a post-
injury model. These applications have tremendous importance in adding to the knowledge
base of the fields of neuroscience, pharmaceutical science and biotechnology.
The chapters in this thesis occur sequentially by their relevance to the research topic. The
chapters are formatted in the style of sequential journal articles and each chapter 2 through
6 has the following sections: Introduction, Materials and Methods, Results, Discussion and
References. Where applicable, an Appendix of supplemental data will be included. The first
chapter will provide background information on the field of axon guidance with particular
focus on the post injury environment and in vitro modeling of the nerve regenerative process
in the spinal cord. I will discuss the challenges of axon guidance and growth after spinal cord
injury and discuss the strategies that have been used to promote directed axonal growth
in this environment as well as to study different classes of guidance cues. This chapter
will focus on studies from the previous five years and concentrate on in vitro biomaterials
platforms to study axon guidance.
There are three additional chapters each addressing a specific aim in the research project.
The primary aim of Chapter 2 was to describe a novel application of circular statistical
methods to quantify results from neurite outgrowth assays. Using both experimental data
viii

from neurite outgrowth on micropatterned glass substrates and simulated data, I determined
the suitability of a number of developed circular statistical tests on different types of neurite
directional data. This study has been submitted to the Journal of Neuroscience Methods.
Chapter 3 describes the fabrication of adsorbed multimolecular gradients of laminin and
chondroitin sulfate proteoglycans, and the evaluation of dorsal root ganglia neurite out-
growth patterns on those substrates. To address specific aim 1 to determine the optimal
gradient parameters to maximize and direct neurite outgrowth, single cue, double cue oppos-
ing and double cue parallel gradients were assessed for their influence on cellular adhesion,
neurite outgrowth and neurite direction. In particular, the roles of absolute concentration
change versus relative concentration change as the mechanism of gradient sensing was in-
vestigated. This study has been published in the Annals of Biomedical Engineering in 2008.
Chapter 4 describes the optimization of specific gradient parameters, molecular concentra-
tion and slope, which were found to play a large role in promoting and directing neurite
outgrowth from studies described in Chapter 3. Interactions between multimolecular gradi-
ents were observed and cellular reponses and neurite length appeared to vary non-linearly
when gradient slope and direction were varied.
Chapter 5 investigates the role of the three-dimensional (3D) microenvironment of collagen
I and Matrigel hydrogels on the genomic expression and morphology of neuroblastoma cells.
To address specific aim 2, microarray analysis, quantitative reverse transcriptase polymerase
chain reaction and microscopy studies were performed to evaluate cellular responses to their
3D microenvironment. Material properties such as elastic modulus and porosity were also
evaluated. This study was published in Tissue Engineering in 2007.
Chapter 6 includes a summary of the results presented in Chapters 2 through 5, as well as
possible future directions and recommendations of this work.
Appendix A is a review article published in Tissue Engineering in 2008 entitled “Tissue
Engineered Platforms for Axon Guidance” which covers the microfabrication techniques
and platforms developed for studying and directing neurite outgrowth in vitro.
ix

Appendix B includes a smaller study on the influence of parallel gradients of different slope on
neurite outgrowth, and the neuron and neurite response after the application of Rho kinase
inhibitor Y27632. Dynamics of the neurite extension, retraction and turning processes are
also investigated using timelapse microscopy over 24 hours.
Appendix C addresses specific aim 3, to determine the role of protein micropatterning on
the phenomenon of cellular bridging over microgrooved substrates. Selective coating and
micropatterns of laminin were applied using microcontact printing, adsorption and covalent
attachment methods. Bridging by Schwann cells and dorsal root ganglia neurons were inves-
tigated, and cellular adhesion, motility and bridge formation dynamics were investigated.
x

Acknowledgements
I would first like to thank Diane Hoffman-Kim for allowing me to be part of her laboratory
and her research program and being a wonderful mentor throughout my graduate school
career both scientifically and in life. Over the course of the past four years, she taught
me how to ask critical questions to both myself and others, how to think more creatively
and from different perspectives at both scientific and managerial problems and how to trust
myself and my judgments. I am also thankful for all the support and encouragement that
she has given me in the everyday progress and setbacks that one meets along the way, and
I am very thankful that she has been an advisor in every sense of the word.
I would also like to thank my thesis committee – Jeffrey Morgan, Michael Lysaght, Anubhav
Tripathi and Ravi Bellamkonda– for their willingness to spend some of their time reading
over my work and for all the valuable input they have given me.
Of course, thanks also go to the members of the Hoffman-Kim lab who have been working
side by side with me over the course of the last four years: Elke Bremus-Koebberling,
Jan Bruder, Celinda Kofron, Liane Livi, Elizabeth Deweerd, Jennifer Mitchel and Julie
Richardson, who have served as sounding boards for my ideas both good and bad, and for
looking over drafts of my writing, in varying degrees of quality and giving great input. Of
particular mention are Celinda, who has allowed me to vent all the day-to-day frustrations
in the lab, and Jan, who has cheerfully helped when and technical issues with computers or
microscopes have arisen and taught me all the tricks to microscopy when I first arrived at
Brown. I would especially like to thank Liane Livi and Elke Bremus-Koebberling, who gave
xi

me sound advice when I needed it, and who encouraged and challenged me scientifically to
be as rigorous and meticulous as they.
The undergraduate students who have worked directly with me have been of tremendous
help: Jeffrey Liu, Elise Cheng, Julie Richardson, Matthew Finn, Jesse Thon, Jillian Harrison,
Beverly See. Thank you, in particular for their conscientiousness and responsiveness to all
aspects of experimental work and teamwork. I hope that they have gotten as much out of
this research experience as I have.
I would also like to thank my past mentors Andrew Cheung, YP Zhang, Frances Wong,
Laura Poole-Warren, Ross Odell and Robert Nordon. Without their guidance and advice
over the last ten years, I would not be where I am now, or who I am now scientifically.
I am thankful to all my friends and family, particularly my parents Daniel and Loretta Li,
my sister Joyce Li, and my roommate Heike Milhench. Without their support, I would not
be here today, and I would be a lot more embarrassed to still be a student at this point in
my life.
Lastly, I would like to thank my fiancé Michael Sherback for his continuous support and
encouragement through all the big obstacles and the little ones, even all the way from Ithaca,
New York. Without his help and perspective, I would not be able to accomplish all of these
things that have made my life as wonderful and as crazy as it has been.
xii

Contents
1 Introduction 1
1.1 Background and significance . . . . . . . . . . . . . . . . . . . . . . . . . . . 9
1.2 Challenges to spinal cord repair . . . . . . . . . . . . . . . . . . . . . . . . . 10
1.3 Cues from developmental neurobiology . . . . . . . . . . . . . . . . . . . . . 11
1.4 In vitro biomaterials platforms to study effects of guidance cues . . . . . . . . 14
1.5 Molecular cues . . . . . . . . . . . . . . . . . . . . . . . . . . . . . . . . . . . 16
1.5.1 Adhesion molecules and Extracellular matrix . . . . . . . . . . . . . . 16
1.5.2 Molecular concentration gradients . . . . . . . . . . . . . . . . . . . . 18
1.6 Topographical cues . . . . . . . . . . . . . . . . . . . . . . . . . . . . . . . . 21
1.6.1 Microgrooved topographies and cellular morphologies . . . . . . . . . 21
1.6.2 Dynamics of cell motility and process formation . . . . . . . . . . . . . 24
1.7 Key signaling molecules involved in cell motility and process formation . . . . 25
1.8 Combination of guidance cues on in vitro platforms to study interactions
between cues . . . . . . . . . . . . . . . . . . . . . . . . . . . . . . . . . . . . 26
xiii

1.9 Three-dimensional environment and axon guidance . . . . . . . . . . . . . . . 28
1.10 Closing remarks . . . . . . . . . . . . . . . . . . . . . . . . . . . . . . . . . . 30
1.11 References . . . . . . . . . . . . . . . . . . . . . . . . . . . . . . . . . . . . . 31
2 Evaluation of neurite outgrowth using a novel application of circular anal-
ysis 47
2.1 Introduction . . . . . . . . . . . . . . . . . . . . . . . . . . . . . . . . . . . . . 48
2.2 Methods . . . . . . . . . . . . . . . . . . . . . . . . . . . . . . . . . . . . . . . 50
2.2.1 Substrate preparation . . . . . . . . . . . . . . . . . . . . . . . . . . . 50
2.2.2 Cell culture . . . . . . . . . . . . . . . . . . . . . . . . . . . . . . . . . 51
2.2.3 Image analysis . . . . . . . . . . . . . . . . . . . . . . . . . . . . . . . 51
2.2.4 Linear statistical analysis . . . . . . . . . . . . . . . . . . . . . . . . . 52
2.2.5 Circular data presentation . . . . . . . . . . . . . . . . . . . . . . . . 53
2.2.6 Circular Statistics . . . . . . . . . . . . . . . . . . . . . . . . . . . . . 53
2.2.7 Simulations of circular distributions . . . . . . . . . . . . . . . . . . . 55
2.3 Results . . . . . . . . . . . . . . . . . . . . . . . . . . . . . . . . . . . . . . . . 56
2.3.1 Experimental Results . . . . . . . . . . . . . . . . . . . . . . . . . . . 57
2.3.2 Simulation Results . . . . . . . . . . . . . . . . . . . . . . . . . . . . . 63
2.4 Discussion . . . . . . . . . . . . . . . . . . . . . . . . . . . . . . . . . . . . . . 68
2.5 Conclusion . . . . . . . . . . . . . . . . . . . . . . . . . . . . . . . . . . . . . . 70
2.6 Acknowledgements . . . . . . . . . . . . . . . . . . . . . . . . . . . . . . . . . 71
2.7 References . . . . . . . . . . . . . . . . . . . . . . . . . . . . . . . . . . . . . 71
xiv

3 Multi-Molecular Gradients of Permissive and Inhibitory Cues Direct Neu-
rite Outgrowth 76
3.1 Introduction . . . . . . . . . . . . . . . . . . . . . . . . . . . . . . . . . . . . 77
3.2 Materials and Methods . . . . . . . . . . . . . . . . . . . . . . . . . . . . . . 79
3.2.1 Fabrication of gradient mixer . . . . . . . . . . . . . . . . . . . . . . . 79
3.2.2 Generation of protein gradients . . . . . . . . . . . . . . . . . . . . . . 80
3.2.3 DRG neuronal cell culture . . . . . . . . . . . . . . . . . . . . . . . . 82
3.2.4 Visualization of gradients and DRG neurons . . . . . . . . . . . . . . 82
3.2.5 Characterization of gradients . . . . . . . . . . . . . . . . . . . . . . . 83
3.2.6 Quantification of cell response and statistical analysis . . . . . . . . . 84
3.3 Results . . . . . . . . . . . . . . . . . . . . . . . . . . . . . . . . . . . . . . . 85
3.3.1 Multi-molecular gradients generated . . . . . . . . . . . . . . . . . . . 85
3.3.2 Molecular concentration and slope affect neurite growth . . . . . . . . 85
3.3.3 Neurite outgrowth on single-cue gradients of contrasting cues . . . . . 89
3.3.4 Neuronal adhesion and neurite elongation on single-cue gradients . . . 91
3.3.5 Multiple parameters affect neurite outgrowth on single-cue gradients . 92
3.3.6 Neurite outgrowth on double-cue opposing gradients . . . . . . . . . . 93
3.3.7 Neuron adhesion patterns on double-cue opposing gradients . . . . . . 95
3.3.8 Neuronal response to double-cue parallel gradient . . . . . . . . . . . 95
3.4 Discussion . . . . . . . . . . . . . . . . . . . . . . . . . . . . . . . . . . . . . 96
3.5 Acknowledgements . . . . . . . . . . . . . . . . . . . . . . . . . . . . . . . . . 102
3.6 References . . . . . . . . . . . . . . . . . . . . . . . . . . . . . . . . . . . . . . 102
xv

4 Optimization of combinatorial protein gradients for neurite outgrowth 107
4.1 Introduction . . . . . . . . . . . . . . . . . . . . . . . . . . . . . . . . . . . . . 108
4.2 Materials and methods . . . . . . . . . . . . . . . . . . . . . . . . . . . . . . 110
4.2.1 Substrate fabrication . . . . . . . . . . . . . . . . . . . . . . . . . . . 110
4.2.2 DRG cell culture . . . . . . . . . . . . . . . . . . . . . . . . . . . . . . 111
4.2.3 Microscopy and Image analysis . . . . . . . . . . . . . . . . . . . . . . 111
4.2.4 Data analysis . . . . . . . . . . . . . . . . . . . . . . . . . . . . . . . . 112
4.3 Results . . . . . . . . . . . . . . . . . . . . . . . . . . . . . . . . . . . . . . . . 114
4.3.1 Cellular adhesion is affected by LN concentration and slope in double
cue LN and CSPG gradients . . . . . . . . . . . . . . . . . . . . . . . . 114
4.3.2 Cellular adhesion is affected by CSPG inlet concentration and slope
in double cue LN and CSPG gradients presenting a shallow LN gradient116
4.3.3 Neurite length is affected by CSPG inlet concentration and slope in
double cue LN and CSPG gradients presenting a steep LN gradient . . 118
4.3.4 The relationship between cellular adhesion and neurite length . . . . . 119
4.3.5 LN and CSPG concentrations elicit differential effects on neurite out-
growth dependent on gradient direction . . . . . . . . . . . . . . . . . 122
4.3.6 Optimization of LN and CSPG slope to maximize cellular adhesion
and neurite outgrowth . . . . . . . . . . . . . . . . . . . . . . . . . . . 123
4.3.7 Effects of treatments against inhibitory CSPG on neurite outgrowth
on double cue LN and CSPG gradients . . . . . . . . . . . . . . . . . 123
4.4 Discussion . . . . . . . . . . . . . . . . . . . . . . . . . . . . . . . . . . . . . . 125
4.5 References . . . . . . . . . . . . . . . . . . . . . . . . . . . . . . . . . . . . . 129
xvi

5 Genomic and Morphological Changes of Neuroblastoma Cells in Response
to Three-Dimensional Matrices 132
5.1 Introduction . . . . . . . . . . . . . . . . . . . . . . . . . . . . . . . . . . . . 133
5.2 Materials and Methods . . . . . . . . . . . . . . . . . . . . . . . . . . . . . . 134
5.2.1 Cell culture . . . . . . . . . . . . . . . . . . . . . . . . . . . . . . . . . 134
5.2.2 RNA isolation . . . . . . . . . . . . . . . . . . . . . . . . . . . . . . . 136
5.2.3 Microarray analysis . . . . . . . . . . . . . . . . . . . . . . . . . . . . 136
5.2.4 Real-time RT-PCR . . . . . . . . . . . . . . . . . . . . . . . . . . . . 136
5.2.5 Real-time RT-PCR analysis . . . . . . . . . . . . . . . . . . . . . . . . 137
5.2.6 Quantification of neurite growth . . . . . . . . . . . . . . . . . . . . . 138
5.2.7 Confocal microscopy . . . . . . . . . . . . . . . . . . . . . . . . . . . . 138
5.2.8 Phalloidin staining . . . . . . . . . . . . . . . . . . . . . . . . . . . . . 139
5.2.9 Mechanical characterization of gels using dynamic mechanical analysis 139
5.2.10 Scanning electron microscopy . . . . . . . . . . . . . . . . . . . . . . . 140
5.2.11 Transmission electron microscopy . . . . . . . . . . . . . . . . . . . . 140
5.2.12 Statistical analysis . . . . . . . . . . . . . . . . . . . . . . . . . . . . . 140
5.3 Results . . . . . . . . . . . . . . . . . . . . . . . . . . . . . . . . . . . . . . . 141
5.3.1 SH-SY5Y cells exhibited differential gene expression in 3D versus 2D
cultures . . . . . . . . . . . . . . . . . . . . . . . . . . . . . . . . . . . 141
5.3.2 SH-SY5Y cells displayed different morphologies when grown in 3D
versus 2D cultures . . . . . . . . . . . . . . . . . . . . . . . . . . . . . 143
xvii

5.3.3 SH-SY5Y neurite outgrowth varied with type and dimension of mate-
rial . . . . . . . . . . . . . . . . . . . . . . . . . . . . . . . . . . . . . 144
5.3.4 Collagen I and Matrigel differ in structure and mechanical properties 148
5.4 Discussion . . . . . . . . . . . . . . . . . . . . . . . . . . . . . . . . . . . . . . 151
5.5 Acknowledgements . . . . . . . . . . . . . . . . . . . . . . . . . . . . . . . . . 154
5.6 References . . . . . . . . . . . . . . . . . . . . . . . . . . . . . . . . . . . . . . 154
6 Conclusions and Future Directions 161
A Tissue Engineered Platforms of Axon Guidance 169
B Effects of RhoGTPases on Neurite Outgrowth on Multimolecular Gradi-
ents 189
B.1 Materials and Methods . . . . . . . . . . . . . . . . . . . . . . . . . . . . . . . 190
B.2 Results . . . . . . . . . . . . . . . . . . . . . . . . . . . . . . . . . . . . . . . . 192
B.2.1 Varying the slope of LN and CSPG parallel gradients changes the
cellular adhesion patterns over the gradient channel . . . . . . . . . . . 192
B.2.2 CSPG slopes presented have a larger effect than LN slopes on cellular
adhesion and neurite length on parallel gradient substrates . . . . . . . 194
B.2.3 ROCK inhibition alters cell adhesion patterns on parallel LN/CSPG
gradients . . . . . . . . . . . . . . . . . . . . . . . . . . . . . . . . . . 194
B.2.4 ROCK inhibition increases neurite turning on parallel LN/CSPG gra-
dients over 24 hours . . . . . . . . . . . . . . . . . . . . . . . . . . . . 195
B.3 Discussion . . . . . . . . . . . . . . . . . . . . . . . . . . . . . . . . . . . . . . 195
B.4 References . . . . . . . . . . . . . . . . . . . . . . . . . . . . . . . . . . . . . . 197
xviii

C Bridging and motility on micropatterned grooves 199
C.1 Introduction . . . . . . . . . . . . . . . . . . . . . . . . . . . . . . . . . . . . . 199
C.2 Materials and Methods . . . . . . . . . . . . . . . . . . . . . . . . . . . . . . . 200
C.2.1 Substrate preparation . . . . . . . . . . . . . . . . . . . . . . . . . . . 200
C.2.2 Protein coating . . . . . . . . . . . . . . . . . . . . . . . . . . . . . . . 201
C.2.2.1 Adsorption . . . . . . . . . . . . . . . . . . . . . . . . . . . . 201
C.2.2.2 Covalent protein attachment . . . . . . . . . . . . . . . . . . 203
C.2.3 Cell culture . . . . . . . . . . . . . . . . . . . . . . . . . . . . . . . . . 203
C.2.4 Image analysis . . . . . . . . . . . . . . . . . . . . . . . . . . . . . . . 204
C.2.5 Scanning electron microscopy . . . . . . . . . . . . . . . . . . . . . . . 205
C.2.6 Timelapse analysis . . . . . . . . . . . . . . . . . . . . . . . . . . . . . 205
C.2.7 Modeling of force generation during bridging process . . . . . . . . . . 206
C.3 Results . . . . . . . . . . . . . . . . . . . . . . . . . . . . . . . . . . . . . . . . 206
C.3.1 Preferential adhesion on micropatterned grooves . . . . . . . . . . . . 206
C.3.2 Bridges across micropatterned grooves exhibit several stereotypic mor-
phologies . . . . . . . . . . . . . . . . . . . . . . . . . . . . . . . . . . 209
C.3.3 SC exhibit much higher incidence of bridging on selectively coated
grooved substrates . . . . . . . . . . . . . . . . . . . . . . . . . . . . . 209
C.3.4 Method of protein attachment on microgrooved substrates affects SC
bridging . . . . . . . . . . . . . . . . . . . . . . . . . . . . . . . . . . . 209
C.3.5 Bridge formation dynamics . . . . . . . . . . . . . . . . . . . . . . . . 212
xix

C.3.6 Forces generated during cellular bridging . . . . . . . . . . . . . . . . . 215
C.4 Discussion . . . . . . . . . . . . . . . . . . . . . . . . . . . . . . . . . . . . . . 218
C.5 References . . . . . . . . . . . . . . . . . . . . . . . . . . . . . . . . . . . . . . 219
xx

List of Tables
2.1 Equations of calculations of mean and standard deviation to determine pre-
ferred direction and spread of data. . . . . . . . . . . . . . . . . . . . . . . . 54
2.2 Equations of test statistical parameters used in circular and linear tests. . . . 55
2.3 Equations of probability density functions and parameters of statistical mod-
els used in simulation of neurite outgrowth. . . . . . . . . . . . . . . . . . . . 56
2.4 Comparison of circular and linear descriptive statistics for all experimental
conditions tested. . . . . . . . . . . . . . . . . . . . . . . . . . . . . . . . . . . 62
2.5 Comparison of circular and linear goodness-of-fit statistical tests for all ex-
perimental conditions tested. . . . . . . . . . . . . . . . . . . . . . . . . . . . 63
2.6 Comparison of circular and linear multisample tests for all experimental con-
ditions tested. . . . . . . . . . . . . . . . . . . . . . . . . . . . . . . . . . . . 64
2.7 Comparison of circular and linear goodness-of-fit statistical tests for simulated
data of known distribution. . . . . . . . . . . . . . . . . . . . . . . . . . . . . 67
3.1 Gradients tested . . . . . . . . . . . . . . . . . . . . . . . . . . . . . . . . . . 82
3.2 Concentration and slope of LN gradients affect neurite outgrowth. . . . . . . 89
3.3 Effects of slope, fractional concentration change, and regional adhesion on
neurite angles. . . . . . . . . . . . . . . . . . . . . . . . . . . . . . . . . . . . 92
xxi

3.4 Neurite length is not affected by type of cue or by gradient slope. Mean
and standard deviation of length of longest neurite measured on all gradient
substrates tested. . . . . . . . . . . . . . . . . . . . . . . . . . . . . . . . . . . 93
4.1 Contribution of each input parameter (LN or CSPG) to ANOVA model . . . 122
4.2 Optimized double cue gradients . . . . . . . . . . . . . . . . . . . . . . . . . . 123
5.1 Microarray results of 2D versus 3D . . . . . . . . . . . . . . . . . . . . . . . . 142
5.2 qPCR results . . . . . . . . . . . . . . . . . . . . . . . . . . . . . . . . . . . . 144
B.1 Effect of LN and CSPG slopes on cell adhesion and neurite length. . . . . . . 194
C.1 Criteria for bridge types used in timelapse analysis . . . . . . . . . . . . . . . 212
C.2 Gravitational, Buoyancy, Drag and Tension forces generated by SC and DRG
during bridging as calculated by static equilibrium model. . . . . . . . . . . . 215
xxii

List of Figures
1.1 Mechanisms of action of molecular guidance cues. (Baier and Bonhoeffer,
1994) . . . . . . . . . . . . . . . . . . . . . . . . . . . . . . . . . . . . . . . . 13
1.2 Tissue engineered platforms of axon guidance. . . . . . . . . . . . . . . . . . . 14
1.3 Schematic of cellular bridge where the cellular processes span across grooves
with no underlying support. . . . . . . . . . . . . . . . . . . . . . . . . . . . . 22
2.1 Measurement of neurite angles. . . . . . . . . . . . . . . . . . . . . . . . . . . 52
2.2 Visualization of linear and circular scales. . . . . . . . . . . . . . . . . . . . . 58
2.3 Distribution of neurites after 24 hours in culture on uniformly coated LN
substrates shows uniformity in neurite outgrowth angles. . . . . . . . . . . . 59
2.4 Distribution of neurites after 24 hours in culture on micropatterned LN or
CSPG stripes shows clustered and directed neurite outgrowth angles. . . . . 60
2.5 Distribution of neurites after 24 hours in culture on micropatterned LN or
CSPG gradients shows dispersed but directed neurite outgrowth angles. . . . 62
2.6 Representative circular histograms of simulated data generated by MATLAB
algorithm. . . . . . . . . . . . . . . . . . . . . . . . . . . . . . . . . . . . . . 65
3.1 Microfluidic gradient mixer generates linear substrate-bound protein gradients. 81
xxiii

3.2 (a) Neurofilament and S100 double immunostaining allows identification of
DRG neurons and non-neuronal cells in culture. . . . . . . . . . . . . . . . . 86
3.3 DRG neurite outgrowth on single-cue gradients is directed toward higher LN
or lower CSPG concentration. . . . . . . . . . . . . . . . . . . . . . . . . . . 88
3.4 Growth evaluated in context of fractional concentration change. . . . . . . . 90
3.5 Neuronal response to double-cue opposing gradients. . . . . . . . . . . . . . . 94
3.6 Change in direction of gradients influences neurite angle and neuronal adhe-
sion patterns. . . . . . . . . . . . . . . . . . . . . . . . . . . . . . . . . . . . 96
4.1 Effects of varyng LN concentration (LN10-50) and slope (-0.04 to 0.2μg/mL/μm)
presented simulataneously with -0.04μg/mL/μm CSPG gradients (CSPG10)
on cellular adhesion . . . . . . . . . . . . . . . . . . . . . . . . . . . . . . . . 115
4.2 Effects of varyng LN concentration (10-50μg/mL) and slope (-0.04 to 0.2μg/mL/μm)
presented simulataneously with -0.04μg/mL/μm CSPG gradients (CSPG10)
on neurite outgrowth direction. . . . . . . . . . . . . . . . . . . . . . . . . . . 116
4.3 Effects of varyng CSPG concentration (CSPG1-20) and slope (-0.004 to 0.08μg/mL/μm)
presented simulataneously with -0.04μg/mL/μm LN gradients (LN10) on cel-
lular adhesion . . . . . . . . . . . . . . . . . . . . . . . . . . . . . . . . . . . 117
4.4 Effects of varyng CSPG concentration (CSPG1-20) and slope (-0.004 to 0.08μg/mL/μm)
presented simulataneously with -0.04μg/mL LN gradients (LN10) on neurite
outgrowth direction. . . . . . . . . . . . . . . . . . . . . . . . . . . . . . . . . 117
4.5 Effects of varyng CSPG concentration (1-20μg/mL) and slope (-0.004 to
0.08μg/mL/μm) presented simulataneously with -0.2μg/mL LN gradients
(LN50) on cellular adhesion . . . . . . . . . . . . . . . . . . . . . . . . . . . . 118
xxiv

4.6 Effects of varyng CSPG concentration (1-20μg/mL) and slope (-0.004 to
0.08μg/mL/μm) presented simulataneously with -0.2μg/mL/μm LN gradients
(LN50) on neurite outgrowth direction. . . . . . . . . . . . . . . . . . . . . . 119
4.7 Comparison of cellular adhesion and neurite length as a normalized fraction
of maximum adhesion and outgrowth of each dataset . . . . . . . . . . . . . 120
4.8 Scatterplot of slope versus adhesion or length to show non-linear relationship
between these variables. Complex third order equations were found to best
fit these datasets in A, C, D. . . . . . . . . . . . . . . . . . . . . . . . . . . . 121
4.9 Contour plots of optimization within multiple regression model described in
Equations 1 and 2. . . . . . . . . . . . . . . . . . . . . . . . . . . . . . . . . 124
4.10 Addition of exogenous factors chABC and Y27632 affects neurite length on
multimolecular gradients. . . . . . . . . . . . . . . . . . . . . . . . . . . . . . 125
5.1 Different morphologies of SH-SY5Y neuroblastoma cells in 3-dimensional (3D)
and 2-dimensional (2D) cultures. . . . . . . . . . . . . . . . . . . . . . . . . . 145
5.2 SH-SY5Y neuroblastoma cell spreading and neurite outgrowth varied with
material type and geometry. . . . . . . . . . . . . . . . . . . . . . . . . . . . 146
5.3 Visualization of actin in SH-SY5Y neuroblastoma cells in 3-dimensional (3D)
and 2-dimensional (2D) cultures. . . . . . . . . . . . . . . . . . . . . . . . . . 147
5.4 Distinct structural properties of collagen I and Matrigel matrices. . . . . . . 149
5.5 Distinct mechanical properties of collagen I and Matrigel matrices. . . . . . . 150
B.1 Schematic of gradient fabrication methods. . . . . . . . . . . . . . . . . . . . . 191
B.2 Cellular adhesion (A) and neurite length (B) on parallel gradients with vary-
ing inlet concentrations and slopes of LN and CSPG. . . . . . . . . . . . . . . 193
xxv

B.3 ROCK inhibition alters cell adhesion patterns on parallel LN/CSPG gradients.195
B.4 ROCK inhibition increases neurite turning on parallel LN/CSPG gradients
over 24 hours. . . . . . . . . . . . . . . . . . . . . . . . . . . . . . . . . . . . 195
C.1 Selective micropatterns of microgrooved substrates. . . . . . . . . . . . . . . . 202
C.2 Free body diagram showing forces acting on a cell soma during bridge forma-
tion under static equilibrium and input parameters used in the model. . . . . 207
C.3 Preferential cellular adhesion on micropatterned substrates. . . . . . . . . . . 208
C.4 Scanning electron micrographs of SC bridges of various morphologies. . . . . . 210
C.5 Differences in bridge formation between SC and DRG on micropatterned
grooves. . . . . . . . . . . . . . . . . . . . . . . . . . . . . . . . . . . . . . . . 211
C.6 Differences in SC bridge types between substrates with different micropat-
terned coatings. . . . . . . . . . . . . . . . . . . . . . . . . . . . . . . . . . . 213
C.7 SC formed more bridges on (B) covalently coated substrates than (A) adsorp-
tion coated substrates. . . . . . . . . . . . . . . . . . . . . . . . . . . . . . . . 214
C.8 Timelapse trajectories of SC and DRG bridging and associated velocities. . . 216
C.9 Forces required during bridging process at soma moves up a groove. . . . . . . 217
xxvi

Chapter 1
Introduction
Summary
Neural tissue engineering for applications in nerve repair is expanding beyond the traditional
focus of cells seeded in biological matrices. In vitro platforms incorporating multiple cues
that are spatially and temporally distinct, allow a more specific and quantitative examination
of cellular response to their environments, (reviewed in Li and Hoffman-Kim, 2008b). In
this research project, in vitro platforms featuring different guidance cues have been used to
investigate how neurons integrate complex guidance information to make growth decisions.
These guidance cues included molecular chemotropic and topographical cues that can direct
and promote neurite outgrowth. No single guidance cue studied thus far has been able
to elicit directed and functional nerve regeneration, which underscores the complexity of
the underlying mechanisms of axon guidance. Further research progress therefore calls for
increasingly well-controlled fabrication of precise multicue environments to study how axon
guidance occurs, with the goal of informing strategies to overcome nerve injury.
The current research project dealt specifically with the integration of molecular gradients
and topographical cues to study how these cues work individually and in combinations to in-
fluence neurite growth. To this end, microfabrication techniques such as soft lithography and
1

2
micropatterning of proteins have been used to fabricate devices that allow us to have precise
control of substrates for the culture and analysis of neurons and glia. Using these newer
techniques that offer greater levels of precision, quantification and spatiotemporal control of
cells’ microenvironments, we apply these studies to determining key parameters for nerve re-
generation. These microfabrication techniques included microfluidics, microcontact printing
and three-dimensional (3D) cell culture, employed to investigate the effects of: (1) individ-
ual and combinatorial adsorbed molecular gradients to approximate the environment of the
post-injury central nervous system, (2) the global effects of 3D extracellular microstructure
on neuronal culture and (3) selective directional protein coatings on microgrooved topogra-
phies to direct neuronal adhesion and neurite extension along and across grooves. Such an
approach included analysis of different cellular mechanisms and allowed us to approach the
goals of neurite growth promotion and direction in a systematic and multifactorial manner.
Neurite outgrowth on multimolecular gradients
Biomolecular gradients have been shown to play roles in axon guidance both in the devel-
oping nervous system and after injury. Particularly, graded expression of substrate bound
guidance cues play a critical role in guiding nerve growth. Elucidation of this phenomenon by
which growth cones integrate multiple molecular gradients requires the ability to expose neu-
rons to biomolecular gradients over the relevant microscale dimension in a quantifiable and
controllable manner. By generating a microenvironment using soft lithography and microflu-
idic techniques, linear concentration gradients of inhibitory chondroitin sulfate proteoglycans
(CSPG) and/or permissive laminin-1 (LN) were generated as single-cue gradients, parallel
double-cue gradients, and opposing double-cue gradients with varying slopes. Gradient pa-
rameters of interest were molecular concentration, absolute versus relative concentration
change over the width of a growth cone and gradient direction. Overall, dorsal root ganglia
neurons extended neurites toward regions of lower CSPG and higher LN concentrations.
Molecular concentration and gradient direction had the largest effects on cellular adhesion
and directional neurite outgrowth. Both absolute and relative concentration affected neurite
3
outgrowth direction on single cue gradients (Li et al., 2008). Gradient parameters for double
cue gradients were optimized to maximize cellular adhesion and neurite outgrowth. These
results represent an important step towards understanding how neurite growth is guided by
complex microenvironments containing multiple molecular cues.
Addition of molecules to modulate the inhibition of CSPG or the response of the neurons to
CSPG removed the ability of the substrate to direct neurite growth. Addition of chondroiti-
nase ABC to enzymatically cleave chondroitin sulfate sugar chains appeared to be more
inhibitory for cellular adhesion, with no change in neurite length, when compared to the
untreated control. Addition of Y27632, a pharmacological inhibitor against Rho kinase, a
molecule hypothesized to be in the signaling pathway for CSPG, did not yield a significant
difference in cellular adhesion to the substrate but significantly increased neurite length.
Quantitative analysis of neurite outgrowth patterns using cir-
cular statistical methods
Neurite outgrowth direction was analyzed using circular statistical methods. Circular statis-
tics is a subdiscipline of statistics that deals with directional data, such as angles, axes or
rotations, as unit vectors. Angular data, such as neurite outgrowth angles are much better
described and visualized using circular methods such as vector components and circular his-
tograms which reflect the actual geometry of the experimental data. Many types of circular
statistical methods have been developed. Analysis of different types of experimental neurite
directional data and hypothesis testing using circular methods allowed us to determine the
suitability of a number of developed circular statistical tests and develop a better tool for
evaluating neurite outgrowth in vitro. One-sample uniformity tests were performed to de-
scribe the distribution of data, in this case the pattern of neurite outgrowth on substrates
presenting protein gradients. Multisample tests were performed to compare different distri-
butions of neurite outgrowth on different types of substrates. Appropriate statistical tests
are data dependent, as theoretical statistical models have underlying assumptions that the

4
data need to comply with. A summary of circular statistical tests and their corresponding
assumptions are used in different experimental and simulated examples and described in (Li
and Hoffman-Kim, 2008a).
Neurite outgrowth in three-dimensional matrices
Interactions of neurons with the three-dimensional (3D) architecture of biological hydrogel
matrices were studied in the context of genomic profiles, cellular morphology and material
properties of the matrices. The influence of 3D culture on cells has been well studied, but
matrices studied commonly incorporate multiple components that are known to affect cell
growth. In this project, the specific differences in gene expression and morphology of neurons
cultured in 2D versus 3D were investigated. Material properties are known to have direct
effects on cell culture, and matrices were characterized with the description of mechanical
properties and microstructural properties. SH-SY5Y neuroblastoma cells responded to ge-
ometry by differentially regulating cell spreading and genes associated with actin in similar
patterns for both collagen I and Matrigel. We observed that neurite outgrowth and the
expression of the gene encoding for neurofilament varied with the type of material, where
fibrillar structure and high stiffness increased neurite outgrowth (Li et al., 2007). These re-
sults suggest complex cell–material interactions in 3D, in which the dimension of the culture
material influences gene expression and cell spreading and the structural and mechanical
properties of the culture material influence gene expression and neurite outgrowth.
Schwann cell growth on selectively coated microgrooved to-
pographies
Topography has been shown to guide axon growth through contact guidance mechanisms.
Interactions of cells with a microenvironment that presents both protein tracks and mi-
crogrooves allow us to present two directional guidance cues that act via different mecha-
nisms, to investigate the synergy or hierarchy of these classes of guidance cues. Permissive
5
LN or inhibitory CSPG stripes were adsorbed onto grooved substrates via microcontact
printing. Selected surfaces were coated: plateaus, walls and grooves or the total substrate
surface. Patterns of adsorbed proteins were further presented either aligned or orthogo-
nal to the underlying groove direction. Schwann cell “bridging” morphology was studied,
where cellular processes supported a cell across a microgroove (groove-plateau-depth dimen-
sion: 50-70-50μm) with no underlying support (Goldner et al., 2006). Selective coatings of
substrates yielded Schwann cell bridges of different morphologies. Substrates with total or
plateau coatings supported predominantly bridges on the plateau level, while groove-coated
substrates supported bridges that anchored on groove walls. Schwann cell motility and dy-
namics during the bridging process were studied using timelapse microscopy and cell soma
were tracked through focal planes along the z-axis. Schwann cells showed a large variation in
motility and trajectory during the bridging process. These results suggest that both molec-
ular and topographical cues can direct Schwann cell adhesion and process formation, may
act in a synergistic manner to guide cellular responses, and that the interactions between
the Schwann cells and their microenvironment are complex and dynamic.
Conclusions and summary of major findings
The results in this thesis suggest that spatial patterning of molecular guidance cues and
physical cues such as topography and microstructure can play a large role in promoting
neuronal adhesion and neurite growth in a directed manner to overcome inhibition at the
glial scar. Circular statistical methods have also been applied in the neuroscience field to
better describe and quantify neurite behavior in vitro.
The major findings in this project are: concentration gradients of LN and CSPG, two
molecules found in the glial scar, are able to elicit directional neurite growth towards the
areas of higher LN and lower CSPG concentration, in single cue gradients as well as double
cue opposing gradients. This effect was not seen on uniformly coated LN substrates or
double cue parallel gradients. Gradient parameters of molecular concentration and gradient
direction have large effects on cellular adhesion and neurite outgrowth.

6
Topography and architecture affected neuronal gene expression and morphology, which dif-
fered in 2D versus 3D cultures, and in different biomatrices. Of the 1766 genes that were
differentially regulated due to differences in geometry, gene expression of ornithine decar-
boxylase, midkine, important for metabolism and signaling respectively were up-regulated
while gene expression for talin 1, filaminin A, actinin1 1, fibronectin 1, collagen type III
1, important for cytoskeleton and extracellular matrix were down-regulated. Collagen I
and Matrigel had different physical properties such as elasticity, microstructure and poros-
ity, which induced changes in neurite outgrowth potential. Microgrooved topography and
molecular cues were observed to affect Schwann cell cultures. Laminin is well known to be
highly permissive for Schwann cell alignment and growth, and appeared to be necessary for
anchorage of processes on plateau surfaces for the formation of bridges.
Taken together, these results suggest that specific presentation of guidance cues can elicit
specific neuronal and glial responses. Interactions between neurons and their microenviron-
ments are complex, but using in vitro platforms that can present controlled spatial cues and
quantitative analysis of the resulting biological response can provide detailed information
on how guidance cues act.
References
Goldner JS, Bruder JM, Li G, Gazzola D, Hoffman-Kim D. Neurite bridging across mi-
cropatterned grooves. Biomaterials, 2006; 27: 460-72.
Li G, Liu J, Hoffman-Kim D. Multi-Molecular Gradients of Permissive and Inhibitory Cues
Direct Neurite Outgrowth. Annals of Biomedical Engineering, 2008; in press.
Li GN, Hoffman-Kim D. Evaluation of neurite outgrowth using a novel application of circular
analysis. Journal of Neuroscience Methods, 2008a; submitted.
Li GN, Hoffman-Kim D. Tissue-Engineered Platforms of Axon Guidance. Tissue Engineer-
ing Part B: Reviews, 2008b; 14: 33-51.

7
Li GN, Livi LL, Gourd CM, Deweerd ES, Hoffman-Kim D. Genomic and morphological
changes of neuroblastoma cells in response to three-dimensional matrices. Tissue Eng, 2007;
13: 1035-47.
Specific Aims
Neurons in development and post injury are in a complex environment with a myriad of
cues which taken together, is usually portrayed as a global “permissive” or “inhibitory”
environment. Describing the net overall state of the cellular environment ignores much of
the detail and simplifies much of the complexity that is present at the local level. Our long
term goal is to elucidate the cellular and molecular mechanisms that underlie axon guidance
decisions, and to then use this knowledge to build systems that can direct and promote
appropriate axonal growth. Our working hypothesis is that neurons can sense multiple
cues in a complex environment and respond by integrating their competing, synergistic or
balancing effects. To test this hypothesis I propose the following specific aims:
Aim 1. Determine the optimal gradient parameters for maxi-
mal and directional neurite growth on multimolecular gradients
over 24 hours.
The presentation of molecular cues in vivo is highly complex. In development and in the
post injury environment of the central nervous system, combinations of both permissive and
inhibitory cues are presented to a growth cone in its immediate microenvironment, either
simultaneously, with distinct borders or in a gradient. Hence it is important to understand
how these cues are integrated by the growth cone. Important factors to investigate are:
absolute and relative concentration changes, relative gradient directions, and gradient shape.
By varying the slope (slope) and relative direction of permissive (laminin) and inhibitory
(chondroitin sulfate proteoglycans) protein gradients, we can a) determine the effects of

8
the protein gradients individually and in combination, b) precisely control the absolute
and relative concentration change and c) control the relative directions of the gradients,
to quantify the effects of these gradient parameters on differential neuron adhesion and
directional neurite outgrowth using circular statistical methods.
Aim 2. Determine the role of geometry and microstructure of
three-dimensional microenvironments on changes in genomic
profiles and morphologies of neuroblastoma cultures.
Three-dimensional (3D) cell culture has been shown to have differential effects on a wide
range of cell functions including proliferation, migration, metabolism and growth. It is im-
portant to characterize the changes that occur within the cell and understand how physical
cues such as topography and architecture may influence these changes. By investigating
changes in global gene expression profiles and morphologies of neurons using DNA microar-
ray technology and microscopy techniques, we aim to correlate neuronal growth patterns
with physical parameters of their 3D microenvironment.
Aim 3. Determine the role of protein micropattterns and cell
type on the formation of cellular bridges .
The phenomenon of cellular bridging, an event where a process extends from one plateau to
another on a grooved substrate with no underlying support (1), allows us to study a specific
influence of contact guidance and tension generation. Using microfabrication techniques,
we will fabricate platforms that will incorporate topographical cues with varied micropat-
terns of substrate bound molecular cues which will allow testing of the role of anchorage
in the formation of cellular bridges. We hypothesize that sharp laminin coated surfaces on
distal plateaus are necessary for tension generation required for bridging. Using timelapse
microscopy to study dorsal root ganglia and Schwann cell motility under different phases of
9
bridge formation, we can characterize stereotypic Schwann cell trajectories and model the
forces required for bridging with inputs taken from experimental data.
Relevance
Traumatic injury to the spinal cord often results in irreversible loss of function because nerves
of the central nervous system (CNS) do not regenerate spontaneously. Describing the net
overall state of the cellular environment ignores much of the detail and simplifies much of
the complexity that is present at the local level. Experimental research using traditional
biological techniques has provided valuable information regarding the neuronal response
to individual guidance cues. However, the local environment that growing nerves face is
inherently complex and contains a rich mixture of cues whose collective influence on growing
nerves is not completely understood. Tissue engineering techniques have been employed by
biomedical engineers and neuroscientists to model the complex in vivo environment of the
nervous system as a means to isolate and study the specific interactions of these cues with
the neurons on which they act. Our long term goal is to elucidate the cellular and molecular
mechanisms that underlie axon guidance decisions, and to then use this knowledge to build
systems that can direct and promote appropriate axonal growth. Our working hypothesis is
that neurons can sense multiple cues in a complex environment and respond by integrating
their competing, synergistic or balancing effects.
1.1 Background and significance
Historically, tissue engineering strategies have been used in efforts to develop therapies for
peripheral nerve and spinal cord injury, combining biomaterials, cell therapy, and drug de-
livery approaches (Chalfoun et al., 2006; Fry, 2001; Lavik and Langer, 2004; Schmidt and
Leach, 2003; Zhang et al., 2005a). Strategies for nervous system repair include preventing
cell death by delivering anti-inflammatory agents and neuroprotective agents, and also pro-
moting axonal growth to appropriate targets. Both the intrinsic growth capacity of cells

10
and the extracellular environment contribute to the ability for axon regeneration. Manipu-
lating the cells’ local microenvironment has been a particular focus of much research, from
nerve grafts to engineered constructs. Regenerative repair in the peripheral nervous system
(PNS) is thought to be possible due to the presence of growth-promoting cues provided
by supportive glia (i.e., Schwann cells; SCs), macrophages and monocytes. More serious
injuries to the PNS require surgical intervention, most commonly autologous nerve grafts
(reviewed in (Fawcett and Keynes, 1990; Meek and Coert, 2002). Regenerative capacity of
the central nervous system (CNS) is much reduced due to the inhibitory post-injury environ-
ment comprised of degenerating myelin and the glial scar, formed by hypertrophic reactive
astrocytes. Similar transplantation strategies for CNS injuries using embryonic spinal cord
(McDonald et al., 1999) or peripheral nerve tissue have met with limited success (reviewed
in (Lakatos and Franklin, 2002)). The conventional paradigm of tissue engineering in which
cells and scaffold materials are combined to replace or regenerate diseased or injured tissue,
initially seemed particularly applicable to the problems of nerve injury. However, successful
nerve regeneration with complex, precise connections has been found to require more than
the substitution of engineered tissue for injured tissue. A consensus has emerged that it
will ultimately require the coordinated presentation of multiple permissive signals, to be
incorporated into tissue engineered biomaterial platforms designed to promote regrowth.
1.2 Challenges to spinal cord repair
Nerves fail to regenerate after spinal cord injury and current medical technology is unable to
effectively manipulate the process of nerve regeneration. This research seeks to contribute to
this process by quantifying how guidance cues both individually and in combination promote
axon growth in an inhibitory environment. Spinal cord injury affects 250,000 Americans with
11,000 new injuries occurring each year. To date, there is still a critical gap in the knowledge
base that informs strategies to provide growth-promoting cues to injured neurons.
When a nerve is injured, a major cause of the failure of axon regeneration in the CNS is
the inhibitory nature of the glial environment. Damage to CNS axons will always produce

11
a glial scar, where reactive astrocytes hyperproliferate, oligodendrocytes are injured and
myelin degenerates to form a mechanical and chemical barrier to axon regrowth. The area
over which axon regeneration must occur to regain function, falls inevitably over a developing
or established glial scar.
Hence understanding the mechanisms underlying axon guidance by multiple cues is a critical
aspect of nerve regeneration, and one that can best be addressed using tissue engineering ap-
proaches. Evans (Gregory, 2001) has reviewed the strategies for traditional tissue-engineered
constructs for nerve repair by component: scaffolds, support cells, growth factors and extra-
cellular matrix. Scaffolds are biomaterials-based and can be biological or synthetic (Flaim
et al., 2005). Support cells include glial cells of both the central and peripheral nervous
system, neural progenitor cells (NPCs) and cells genetically modified to secrete growth pro-
moting molecules (Chen et al., 2005; Keilhoff et al., 2006; Thompson and Buettner, 2006).
Growth factors can improve neuronal viability and increase neurite initiation and outgrowth.
Extracellular matrix can increase cellular adhesion, migration and neurite initiation and ex-
tension. Incorporation of these permissive molecules is one way of promoting axogenesis and
neurite growth.
1.3 Cues from developmental neurobiology
Axon guidance has been a topic of study in neuroscience for many decades, both in devel-
opmental neurobiology and in nerve regeneration, and many cues have been identified that
influence axon pathfinding. A number of these guidance cues are soluble factors such as
ephrins, netrins and semaphorins (Chilton, 2006; David and Lacroix, 2003; Mueller, 1999;
Raivich and Makwana, 2007; Serini and Bussolino, 2004). Studies have identified different
mechanisms of action that include axon guidance such as permissive, inhibitory, outgrowth
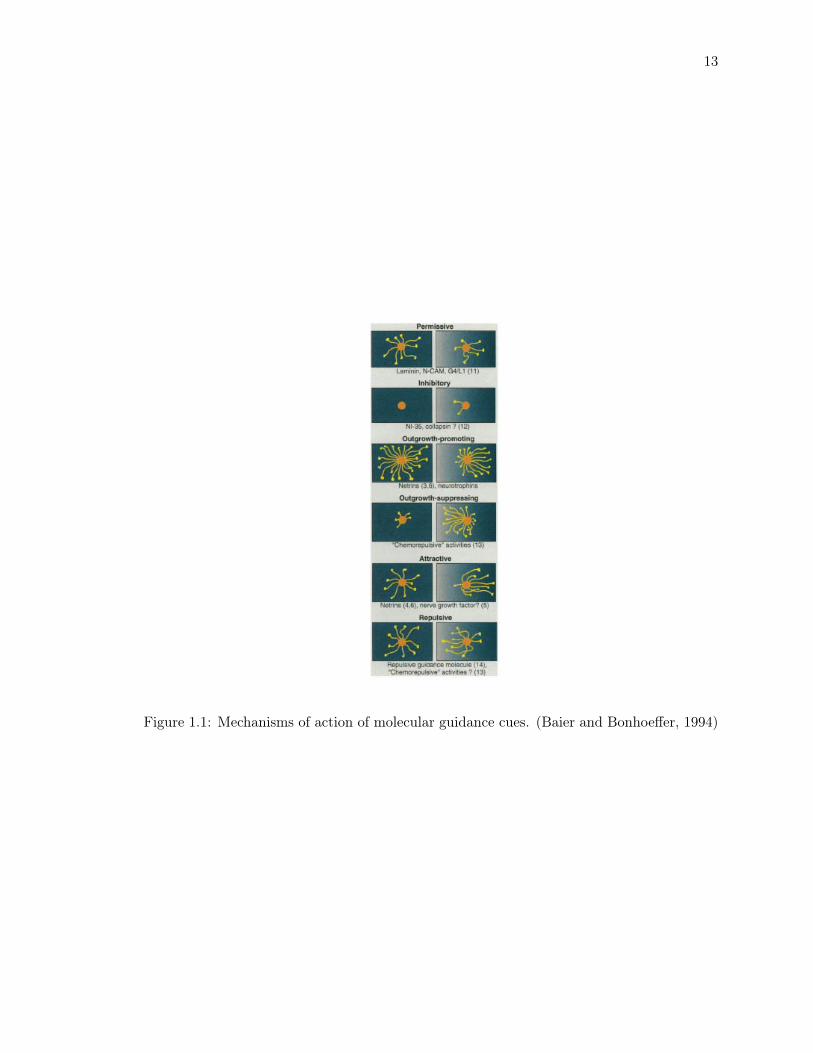
promoting, outgrowth suppressing, chemoattractive and chemorepulsive activities (Figure
1.1 (Baier and Bonhoeffer, 1994)). Further, some molecules such as netrin-1 and Sema3A
have bifunctional roles that can repel some growth cones while simultaneously attracting oth-
ers which adds to the flexibility of axon guidance produced in the developing nervous system

12
(Colamarino and Tessier-Lavigne, 1995; Polleux et al., 2000). Other categories of guidance
cues include bound factors that guide through neuron-matrix interactions (Daniel M. Suter,
2000; Derek N. Adams, 2005; Dertinger et al., 2002b; McFarlane, 2003), topographical cues
that influence nerve growth by contact guidance (Cai et al., 2005; Dowell-Mesfin et al., 2004;
Goldner et al., 2006; Mahoney et al., 2005; Manwaring et al., 2004; Walsh et al., 2005) and
electrical cues that affect the rate and direction of nerve growth (McCaig et al., 2002; Patel
and Poo, 1982; Schmidt et al., 1997).
From the developing nervous system, guidance mechanisms have been observed from the
process of the formation of topographic maps that provide a means for neurons to reach
their target region and distribute in an orderly, stereotypical arrangement within these
regions. By studying the factors that give rise to such precise and ordered connections that
require the recognition of particular subsets of target regions, one can gain insight on how
to reproduce such precision in a post-injury environment. To reach their targets, axons can
be influenced by far-reaching, diffusible chemotropic molecules (Goodhill, 1997), reviewed in
(Goodman, 1996). Further mechanisms exist to guide axons within the target may include
target-derived growth factors with much shorter range guidance that may induce axonal
branching (Bastmeyer and O’Leary, 1996). Several mechanisms have also been proposed
that allow for recognition of specific targets, including type specificity, positional specificity
or chemospecificity. Chemospecificity has been of particular interest and has been widely
studied, as surgical techniques to move target areas have shown that axons continue to
project to their preferred target regions. On example is the retinotectal system, where
retinal axons have been observed to recognize different parts of the tectum, independent of
the path to the tectum or if the location of the tectum has moved (Fujisawa, 1981; Hope et
al., 1976). These observations have suggested underlying molecular mechanisms that include
the use of molecular gradients to build this topographical mapping phenomenon.
13
Figure 1.1: Mechanisms of action of molecular guidance cues. (Baier and Bonhoeffer, 1994)

14
Micropatterned Molecular Cues:Diffusible
Substrate-bound
Topographical CuesMicron and Nanoscale
Cellular CuesCellular Topography3D structure
Electrical Cues
- +V
Micron and NanoscaleMaterial Properties
Figure 1.2: Tissue engineered platforms of axon guidance.
1.4 In vitro biomaterials platforms to study effects of guidance
cues
Tissue engineering approaches can be used to create more in vivo-like platforms for studies
of axon guidance, because they allow the generation of precisely controlled microenviron-
ments that mimic specific features of the local in vivo environment. These platforms can
incorporate three dimensions, cocultures of different cell types and defined presentation of
molecules, in order to study key neuronal functions. One particular advantage of tissue
engineered platforms of neural microenvironments is that they can present several types of
cues in a synergistic or a competitive manner to elucidate their relative importance (Figure
1.2).
For the past few decades, micropatterned substrates have been used as tools to study and
direct neurite outgrowth. Initially, molecular cues were patterned using simple techniques
that allowed the investigation of guidance effects, but lacked reproducibility and precision
on the cellular level, at the physiologically relevant micron scale. With the implementa-
tion of microlithography adapted from the microelectronics industry (Connolly, 1994; Folch
and Toner, 2000a), patterned features of proteins and topographies could produce polymer
15
substrates for cell culture using techniques such as soft lithography and rapid prototyping
(reviewed by (Li et al., 2003). More recently, laser ablation has been used to fabricate
polymer substrates with diverse geometries. High energy laser pulses can be used to re-
move material in specific geometries to create microstructures on a surface with the size
range <15um, which then serve as substrates for cell culture (reviewed by (Folch and Toner,
2000b).
Microfluidic channels are another method of producing substrates with requisite micropat-
terns to study axon guidance and neurite growth. These channels allow for fabrication of
concentration gradients by diffusive mixing under laminar flow conditions. Laminar flow is
generated in microchannels on the order of 50um at low flow rates controlled by a syringe
pump. This is due to the low Reynolds number achieved by the slow flow and the small
dimensions. The Reynolds number is the ratio of inertial forces to the viscous forces acting
on a small unit of fluid, calculated by: Re =ρU2V
μUS=
ρUL
μwhere μ =viscosity =0.01 g
cm∗s ,
ρ = density = 1 gcm3 , U = average flow rate = 1 cm
s , L = characteristic linear dimension =
VS , V =volume, S =surface area of walls.
For the devices in this study, flow rate is held at 1cm/s, such that Re<1. The surfaces
of constant flow speed are smooth and random fluctuations of flow in time are absent so
that when multiple streams of different proteins are present, adjacent streams remain chem-
ically distinct except for diffusive mixing at their interface (Whitesides, Jun2001, ). Due to
this feature, soluble gradients can be formed simply by serial dilution of adjacent streams
(Dertinger et al., 2002a; Dertinger et al., 2001; Jeon et al., 2002; Lin et al., 2004). Grooved
microchannels have been studied for inducing turbulent or chaotic flow, particularly her-
ringboned grooves that have rotated oblique angles (Stroock et al., 2002a; Stroock et al.,
2002b). However, simulations varying groove aspect ratio ( ), using computation fluid dy-
namics programs have shown that at low groove aspect ratios ( =0.05), there is no significant
irregularity in flow, showing no evidence for chaotic mixing, and at higher groove aspect ratio
( =0.3), there was a more jumbled flow pattern but did not indicate chaotic mixing (Wang
et al., 2003).

16
1.5 Molecular cues
The presentation of molecular cues in vivo is highly complex. In development and in the
post injury environment of the CNS, combinations of both permissive and inhibitory cues
are presented to a growth cone in its immediate microenvironment, either simultaneously,
with distinct borders or in a gradient. The complexity of the local post-injury CNS en-
vironment has motivated the development of in vitro models of the glial scar, which have
largely focused on patterning the chemical cues present, particularly permissive laminins
(LN) and inhibitory chondroitin sulfate proteoglycans (CSPGs (Le Beau et al., 1995; Tom
et al., 2004)). The use of anisotropy in presenting chemical cues either through gradients or
stripes to provide directional bias has been largely successful in vitro. Recent advances in
microfabrication techniques in microfluidics and microcontact printing have increased our
capacity to present directional information on a biologically relevant scale. Optimal dimen-
sions of features range from tens to hundreds of microns (Dertinger et al., 2002b; Song et
al., 2006; Yeung et al., 2001), and can be used in combination with other types of guidance
cues for synergy in a more complex microenvironment.
1.5.1 Adhesion molecules and Extracellular matrix
Micropatterns of molecular cues are used to direct neuronal growth and cell adhesion
(Cornish et al., 2002; Offenhausser et al., 2007; Oliva et al., 2003). Neurons from rat
brain stem and cortices preferentially adhere to regions coated with permissive guidance
cues such as LN and neurite outgrowth follows the micropatterned tracks (Vogt et al.,
2005; Yeung et al., 2001). Cellular adhesion and neurite extension onto underlying line
or grid patterned microcontact printed substrates have been observed in both dissociated
neurons (Vogt et al., 2005) and brain slices (Yeung et al., 2001). Optimal dimensions
of nodes for neuronal adhesion for cells were found to be in the range of 14-20μm (Ye-
ung et al., 2001). DRG neurite attachment was found to be dependent on FN stripe
width, with a minimum width of ~30μm required for cell attachment and neurite ex-
tension (Zhang et al., 2005b). In order to direct neurite growth to specific patterns of

17
the substrate, several micropatterning techniques have been used, including “inking” elas-
tomeric stamps and using adsorption to transfer patterns (Yang et al., 2005b), covalent bind-
ing of “inked” elastomeric stamps using 1-ethyl-3-(3-dimethylaminopropyl) carbodiimide/N-
hydroxysuccinimide (EDC/NHS) chemistry, photoimmobilization of molecules using polyal-
lylamine conjugation to N-4-(azidobenzoyloxy)succinimide) (PAA-azido chemistry) (Gomez
et al., 2007a; Gomez and Schmidt, 2007; Luo and Shoichet, 2004) and other methods of
protein immobilization using commercially available heterobifunctional crosslinkers (Zhang
et al., 2005b). Song et al. used photolithography and EDC/NHS chemistry to micropattern
poly-L-lysine (pLL) and/or LN on regions of conductive polypyrrole (pPy). Hippocampal
neurons adhered and extended neurites only on the pattern of pLL or LN, demonstrating a
method for fabricating micropatterns of molecular guidance cues in combination with con-
ductive polymers. More recently, neurite outgrowth assays have also focused on peptides
that correspond to locations of cell binding sites on permissive extracellular molecules such
as LN or fibronectin (FN). These key peptides include: Arg-Gly-Asp (RGD) (Tashiro et al.,
1991), Ile-Lys-Val-Ala-Val (IKVAV) (Tashiro et al., 1989) and Tyr-Ile-Gly-Ser-Arg (YIGSR)
(Graf et al., 1987; Massia et al., 1993) which have been shown to mediate cell attachment,
spreading, migration and neurite outgrowth; they have been incorporated into assays evalu-
ating the effect of molecular cues on axon guidance, the results of which will be described in
a later section. Micropatterned cues allow highly controlled directional guidance of neuronal
adhesion and axonal growth.
Incorporation of extracellular matrix molecules in a 3D matrix has also been investigated
(Cao and Shoichet, 2002; Dodla and Bellamkonda, 2006; Yu and Bellamkonda, 2001). Neu-
roblastoma cells showed increased cell adhesion on alginate gels that were coated with LN
or covalently linked to YIGSR peptide, and showed increased neurite number and length
on YIGSR peptide linked gels in a ligand density dependent manner (Dhoot et al., 2004).
Luo and Shoichet (Luo and Shoichet, 2004) have demonstrated that DRG neurites will grow
preferentially in channels modified to present GRGDS peptide in a 3D agarose gel. Dodla
and Bellamkonda (Dodla and Bellamkonda, 2006) have shown that concentration gradients
of photo-immobilized LN-1 in 3D agarose gels can direct DRG neurite growth in the direc-

18
tion of higher LN-1 concentration. Further, gels presenting concentration gradients of LN-1
promote faster neurite extension than gels presenting isotropic LN-1 concentrations, which
implies that patterning of chemical cues may be a separate parameter to be optimized within
the complexity of the 3D environment. Embryonic cortical neurons have been challenged
with choices between competing growth options of poly-D-lysine (PDL), 3D Matrigel and
microtopography. When presented with 2D PDL adsorbed surfaces and intermediate layer
of 3D-gelled Matrigel, neurons appeared to prefer PDL-coated 2D surfaces. When presented
with 2D PDL adsorbed surfaces, 3D Matrigel and grooved topography (3.5-15μm), neurites
preferred to extend into the 3D gel layer of Matrigel rather than along PDL surfaces (walls
and grooves) of the topographical substrates, differing from the result of neurite turning
into grooves in the absence of Matrigel. Growth cones therefore make growth decisions
that balance permissiveness and obstacles in topography and 3D architecture, resulting in
directional growth to minimize turning while remaining on the most permissive substrate
available (Li and Folch, 2005).
1.5.2 Molecular concentration gradients
Axon guidance by concentration gradients of soluble guidance cues has been studied ex-
tensively in vitro. Trophic factors such as nerve growth factor (NGF), brain derived neu-
rotrophic factor (BDNF), insulin-like growth factor (IGF-1, IGF-2) and fibroblast growth
factor (FGF) have been found to elicit turning of growth cones toward the molecule of
interest (Boyd and Gordon, 2003; Jones et al., 2003; Kato and Lindsay, 1994). Gene ther-
apy experiments using lentiviral vectors expressing NT-3 (Taylor et al., 2006) have shown
that increased growth through and beyond the inhibitory glial scar region is achievable, but
longer distance growth was not obtainable with the trophic stimulus alone, as the presence
of a continuing growth factor gradient beyond the lesion did not stimulate growth into those
areas.
Studies of molecular cues have found that chemotropic and extracellular matrix (ECM) guid-
ance cues attract or repel growth cones over a large distance range (Dickson, 2002; Rosoff et

19
al., 2005; Rosoff et al., 2004a; Tessier-Lavigne and Goodman, 1996). Micropatterned molec-
ular cues have also been studied, particularly protein gradients to orient and direct neurite
growth. Nerve growth factor (NGF) is a chemoattractive diffusible factor that is presented
in a gradient as a function of distance from the source and is able to elicit directed neurite
outgrowth and growth cone turning in vitro (Cao and Shoichet, 2001). Graded expression
of matrix molecules have been found in vivo in development such as the Eph/Ephrin system
in the developing retinotectal system and proteoglycans in the post injury glial scar envi-
ronment where CSPG and keratin sulfate proteoglycans (KSPG) are increasingly expressed
approaching the lesion site (reviewed by (Silver and Miller, 2004)). The mechanism of ax-
onal response to protein gradients is not well understood. LN has been suggested to guide
neurites in a manner similar to chemotaxis, where the growth cone machinery measures lo-
cal differences in LN concentration and directs growth toward the direction of higher levels
(Devreotes and Zigmond, 1988; Kindt and Lander, 1995). Experimental work has suggested
that axons could be guided by a wide range of parameters including the absolute molecular
concentration, the sign, direction, and slope of the gradient (Baier and Bonhoeffer, 1992;
Britland and McCaig, 1996; Isbister et al., 2003; Rosentreter et al., 1998; Song et al., 1998).
Cells are affected by their local environment and respond to chemical and mechanical stimuli
in adhesion and migration processes. In the specialized case of axon guidance, the ability of a
growth cone to respond to such guidance cues using these underlying mechanisms has been
studied extensively for soluble and matrix bound factors. Sperry proposed the chemoat-
traction model as the mechanism of long range axon guidance during development (Sperry,
1963); Carter proposed a theoretical model for haptotaxis and cell motility (Carter, 1967),
and contact guidance was proposed to be the mechanism for aligning axons to collagen fibrils
(Ebendal, 1976). Mathematical models of axon guidance have been proposed that simulate
the simple case of any attractive or repulsive cue presented to a growth cone (Buettner,
1994; Maskery et al., 2004). These models are generally phenomenological, and contain a
deterministic domain and a stochastic domain, where the deterministic domain refers to the
cellular response to external cues, and the stochastic regime reflects the randomness observed
in growth cone “sampling” seen using timelapse microscopy, and the inherent instability of

20
microtubules (reviewed by Maskery and Shinbrot, 2005).
Mathematical models suggest that fractional concentrations of soluble gradients must be
>2% to be sensed by the growth cone, whereas fractional concentrations of substrate bound
gradients must be >10%, predicting that growth cones are more sensitive to soluble gradi-
ents. The maximum guidance range of gradients have been calculated to be 1mm for soluble
gradients and 1cm for substrate bound gradients for either the absolute concentration change
case or the fractional concentration change case (Goodhill, 1998; Goodhill and Baier, 1998;
Goodhill et al., 2004; Goodhill and Urbach, 1999; Goodhill and Baier, 1998). In order to
generate gradients in vitro with the enough precision to change the concentration <10%
over the width of a growth cone (10-20μm), microfluidic techniques have been highly useful,
and reviewed in Keenan and Folch (Keenan and Folch, 2008), with the perspecitve of how
the technology of making concentration gradients over the microscale has developed.
Bellamkonda (Bellamkonda, 2006) has discussed the concept of anisotropy in structural and
molecular contexts of scaffold design, where anisotropy may facilitate faster and more robust
regeneration by exploiting the sensitivity of the growth cone to elicit directional growth.
For molecular cues, anisotropy translates to concentration gradients across the dimensions
of a growth cone. Concentration gradients of soluble neurotrophic factors have been widely
studied as they can be easily generated through diffusion (Rosoff et al., 2004b), and they have
been shown to contribute to the process of chemotaxis. Concentration gradients of substrate
bound molecules have also been generated using techniques such as micropatterning(Cornish
et al., 2002), microfluidics, and self-assembly of monolayers to covalently bind peptides
(Derek N. Adams, 2005; Dertinger et al., 2002b). von Philipsborn et al. (von Philipsborn
et al., 2006) showed guidance of retinal ganglia growth cones by discontinuous ephrinA5
gradients generated by microcontact printing. Neurite stop decisions depended on gradient
slope as well as the concentration of ephrinA5 present locally, where a decreasing slope and
lower ephrinA5 concentrations allowed further growth onto the gradient area. Adams et
al. (Derek N. Adams, 2005) demonstrated guidance of dorsal root ganglia (DRG) explants
by an increasing concentration gradient generated by photo-immobilization of the IKVAV
peptide. On these substrates, growth cones were able to turn up a gradient with a 10-25%

21
fractional difference in IKVAV concentration over 30μm. Li et al. (Li et al., 2007a) have
shown changes in neuronal response over a larger range of fractional concentration difference;
a 4% fractional difference in LN concentration over 25μm resulted in fewer DRG neurites
oriented toward higher LN concentration, whereas a 100% fractional concentration change
over 25μm resulted in more neurites oriented toward the higher LN concentration. Multi-
molecular opposing gradients fabricated to present high concentrations of LN intermixed
with low concentrations of CSPG were able to direct DRG neurite orientation in a similar
manner as single-cue LN gradients, guiding neurite outgrowth in the direction of higher LN
and lower CSPG concentrations.
1.6 Topographical cues
Topographical cues influence nerve growth and regeneration by contact guidance, and can be
combined with adhesion molecules that also play a role in contact guidance. Neurons have
the capacity to respond to topographical features in their microenvironments, and they have
been shown to adhere, migrate, and orient their axons to navigate surface features such as
grooves in substrates in both the micro- and nanoscales. Using microfabrication techniques
such as photolithography and soft lithography, topographic guidance of neurite outgrowth
has been explored in vitro with culture substrates that contain well-defined micropatterned
features.
1.6.1 Microgrooved topographies and cellular morphologies
Repeating rectangular microgrooves have been extensively studied to direct neurite growth
and alignment along a particular axis. Mahoney et al. (Mahoney et al., 2005) studied the
effects of microchannels of 20-60 m width and 11 m depth on PC12 cell cultures. Neurites
were directed along the axis of the grooves, with microchannels of 20-30μm most effective
at neurite direction. Polypropylene filaments have been found to direct DRG neurites and
SCs from DRG explants along the long axis of the filaments tested with an optimal filament
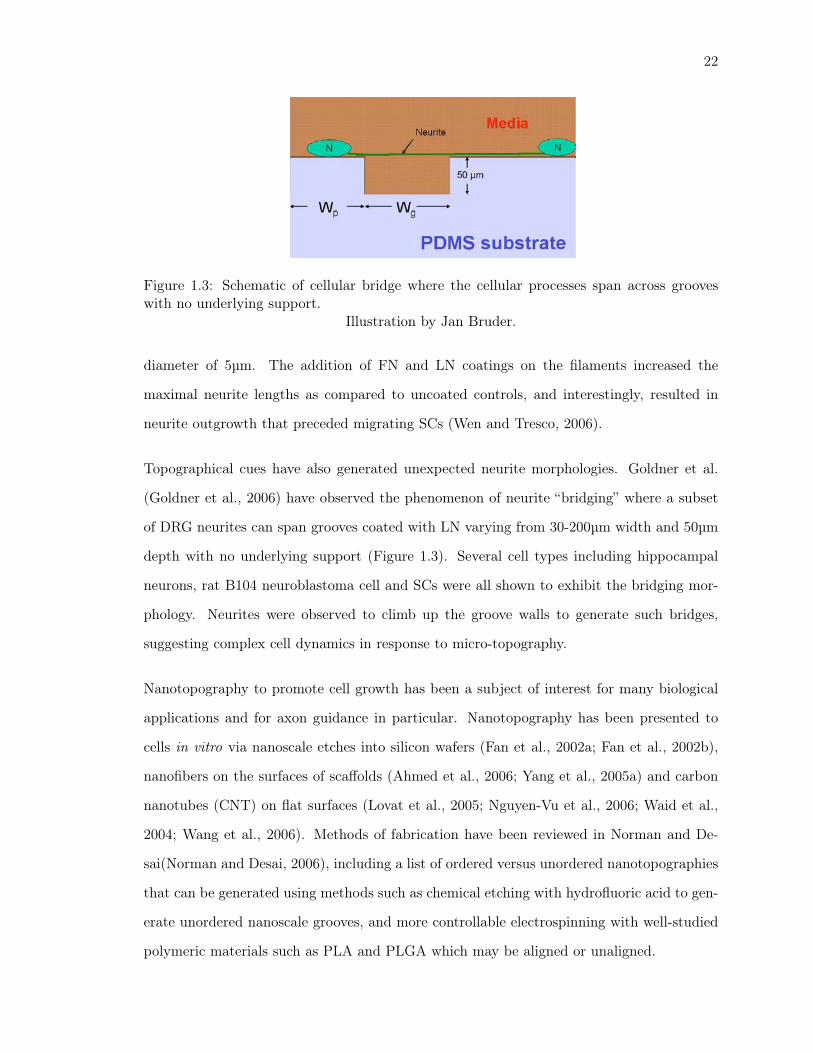
22
Figure 1.3: Schematic of cellular bridge where the cellular processes span across grooveswith no underlying support.
Illustration by Jan Bruder.
diameter of 5μm. The addition of FN and LN coatings on the filaments increased the
maximal neurite lengths as compared to uncoated controls, and interestingly, resulted in
neurite outgrowth that preceded migrating SCs (Wen and Tresco, 2006).
Topographical cues have also generated unexpected neurite morphologies. Goldner et al.
(Goldner et al., 2006) have observed the phenomenon of neurite “bridging” where a subset
of DRG neurites can span grooves coated with LN varying from 30-200μm width and 50μm
depth with no underlying support (Figure 1.3). Several cell types including hippocampal
neurons, rat B104 neuroblastoma cell and SCs were all shown to exhibit the bridging mor-
phology. Neurites were observed to climb up the groove walls to generate such bridges,
suggesting complex cell dynamics in response to micro-topography.
Nanotopography to promote cell growth has been a subject of interest for many biological
applications and for axon guidance in particular. Nanotopography has been presented to
cells in vitro via nanoscale etches into silicon wafers (Fan et al., 2002a; Fan et al., 2002b),
nanofibers on the surfaces of scaffolds (Ahmed et al., 2006; Yang et al., 2005a) and carbon
nanotubes (CNT) on flat surfaces (Lovat et al., 2005; Nguyen-Vu et al., 2006; Waid et al.,
2004; Wang et al., 2006). Methods of fabrication have been reviewed in Norman and De-
sai(Norman and Desai, 2006), including a list of ordered versus unordered nanotopographies
that can be generated using methods such as chemical etching with hydrofluoric acid to gen-
erate unordered nanoscale grooves, and more controllable electrospinning with well-studied
polymeric materials such as PLA and PLGA which may be aligned or unaligned.

23
Neuronal adhesion and viability on nanotopography have been most widely studied, and
results vary depending on the type of nanoscale substrate presented. Chemical etching of
silicon wafers found an optimal surface nano-roughness of 20-50nm to be the most permissive
for attachment of primary neurons isolated from the substantia nigra (Fan et al., 2002a).
Electrospun polyamide nanofibers with a median diameter of 180nm supported neuronal
growth and covalently linked tenascin-C-derived peptides increased the neurite outgrowth
of a number of CNS primary neurons including cerebellar granule, cerebral cortical, hip-
pocampal, motor and DRG neurons, indicating that nanotopography may act synergistically
with molecular cues to promote neurite growth (Ahmed et al., 2006). Nanofibrillar meshes
presenting IKVAV peptides have also been fabricated using self assembly of amphiphilic pep-
tides around cells in culture medium. These IKVAV linked nanofibers differentiated NPCs
more rapidly than the addition of soluble IKVAV peptide or LN (Silva et al., 2004). Cellu-
lar responses to substrates presenting carbon nanotubes have been evaluated; hippocampal
cells have been stimulated using CNT microelectrodes (Wang et al., 2006), PC12 neurite
formation has been supported by 2% CNT containing polycarbonate urethane (Waid et al.,
2004), and astrocytes have been shown to have decreased adhesion on CNT/polycarbonate
urethane substrates and decreased alkaline phosphatase production on low surface energy
nanophase fibers (McKenzie et al., 2004). Using nanoscale fabrication methods, it will be
exciting to generate biomaterials platforms that study combinations of nanoscale guidance
cues with other important cues such as electrical stimulation and molecular cues.
Neurons have the capacity to respond to topographical features in their microenvironments,
and grooves have been a widely studied geometry. The progression of guidance cues from
micro- to nanoscale resolution has shown that the guidance range encompasses both length
scales and can affect cell functions from cell differentiation of NPCs to neurite morphology
such as orientation, direction and length.

24
1.6.2 Dynamics of cell motility and process formation
A simple model (Equations 1.1 and 1.2) is adapted from the Langevin equation for Brown-
ion motion describing fibroblast motility (Dunn and Brown, 1987) from (Buettner, 1994).
This model was used to simulate a sharp border between a permissive and nonpermissive
substrate, LN and albumin. So the assumption that the receptor-mediated interaction be-
tween the growth cone and the substrate requires a critical number of receptors bound to
the permissive cue. Using these parameters, the model predicted that filopodial initiation
follows a Poisson distribution, length follows an exponential probability density function and
the rates of extension and retraction follow a linear relationship. Filopodia length and angle
can be predicted by predicting x and y coordinates at time t (Equation 1.3 and predicting
the filopodia initiation angle from x and y coordinates over time (Equation 1.4).
(Buettner, 1994)
dv
dt= −βv + n(t) (1.1)
β =1τ;α =
2s2
τ(1.2)
xt = xo + L cos θ, yt = y0 + L sin θ (1.3)
x0 = xc + rg(θ) cos θ, y0 = yc + rg(θ) sin θ (1.4)
where β = deterministic regime, determined experimentally from directional persistence
time τ or root-mean-square speed s of filopodial movement,
and n(t) =stochastic regime, which can be obtain from random Gaussian distribution.

25
1.7 Key signaling molecules involved in cell motility and pro-
cess formation
Guidance cues exert differential effects through specific ligand-receptor complexes and var-
ious adaptors and mediators that converge on similar cytoskeletal proteins to modulate
response. Rho family of GTPases are involved in actin assembly, particularly Cdc42, Rac
and Rho. DRG neurons grown on patterned chemical substrates and topographical sub-
strates both separately and in combination can be used to determine the precise roles of the
Rho GTPases in transducing chemical and topographical cues into cytoskeletal reorganiza-
tion. Cdc42 has been found to be involved in gradient sensing, Rac has been hypothesized
to play a role in stabilization of actin filaments.
Cytoskeletal reorganization via RhoGTPases plays a role in neurite growth by regulating cell
polarity and cell motility. Any external cue that results in a change in neurite behavior e.g.
turning, extension or retraction, requires changes in the cytoskeleton. Recently, the family
of Rho GTPases, molecular switches that regulate signal transduction pathways linking
plasma membrane receptors to filamentous actin, have been shown to be highly involved
in growth cone guidance and pathfinding, particularly in inhibitory environments like the
glial scar and CSPG substrates (reviewed in Dergham et al., 2002; Etienne-Manneville and
Hall, 2002; Luo, 2000). The Rho signaling pathway mediates neurite growth inhibition by a
number of repulsive guidance cues, such as CSPGs and myelin (Dergham et al., 2002; Jain
et al., 2004; Lehmann et al., 1999), plays a role in glial scar inhibition, and inhibition or
inactivation of Rho is sufficient to stimulate axon regeneration in inhibitory environments
(Dergham et al., 2002; Madura et al., 2004). Activation of Rac or Cdc42 promotes neurite
formation and extension, while Rho activation induces growth cone collapse and neurite
retraction through the assembly of contractile actin and myosin filaments (Govek et al.,
2005; Hall, 1998). Cdc42 has been of particular interest as it promotes the formation of
filopodia and plays a role in cell polarity in yeast, Saccharomyces cerevisiae, in addition to
its role in promoting neurite outgrowth. Giniger has hypothesized a model for the roles of
Rho family GTPases to each other. In Swiss 3T3 fibroblasts microinjection of active Rac or

26
Cdc42 leads to immediate changes in lamellipodia and filopodia respectively, and a delayed
Rho-dependent change in stress fibers occurs. Rho GTPases may be a convergence point
between multiple signal transduction pathways, as inhibition of these molecules have been
found to cause a variety of effects (Giniger, 2002).
1.8 Combination of guidance cues on in vitro platforms to
study interactions between cues
Growth cones are capable of integrating multiple cues simultaneously to make a net guidance
decision. Recent studies have addressed the question of how growth cones interpret two or
more guidance cues simultaneously. Guidance cues are highly conserved yet have diverse
effects on cellular behavior. This suggests that the growth cone’s capacity to integrate nu-
merous recognition pathways as it grows allows it to respond to the intricate cues present in
the CNS. Besides ligand diversity and response to single gradients, guidance integration can
occur to allow combinations of receptors and ligands to yield differential effects (reviewed by
(Yu and Bargmann, 2001)). Drosophila motoneuron growth cones can integrate semaphorin
II and netrins (Winberg et al., 1998), and Xenopus spinal neurons show reversed growth
cone turning when netrin-1 is applied singly or with Slit (Stein and Tessier-Lavigne, 2001),
showing multiple instances when growth cones must integrate contrasting information to
make a guidance decision. The hypothesized mechanism of this integration is that a sum-
mation of the cues occurs at the growth cone but the signal convergence point is unknown,
whether it is at the level of the ligand-receptor complex or further downstream (Rose and
Chiba, 1999). Growth cones can also integrate multiple types of guidance cues; Xenopus
spinal cord neurons have been found to integrate both electrical and adhesive cues, where for
most of the neurons, the galvanotropic cue was insufficient to reorient the alignment from
LN tracks, but a subset of neurons responded to the electrical cue even in the presence of
opposing LN guidance (Britland and McCaig, 1996). DRG neurons have been found to inte-
grate adhesive cues and topographical cues, where alignment to grooves could be promoted
with parallel LN tracks, and alignment could be pushed to the orthogonal direction from

27
grooves when orthogonal LN tracks were presented. This suggests that a hierarchy exists
where adhesive cues are more influential than topographical or electrical cues, but that the
growth cone can integrate directional information.
Combinations of defined topographical and molecular cues revealed synergies between cues.
Gomez et al. (Gomez et al., 2007b) studied the combined effects of NGF and microtopogra-
phy of microchannels on axon initiation/polarization and axon elongation of hippocampal
neurons. When presented with microchannel substrates of 1-2μm widths and 400-800μm
depths containing immobilized NGF on the surface, hippocampal neurons responded to the
combination of molecular and topographical stimulation with the longest neurites. The ob-
servations that topography had a stronger effect on polarization but no effect on elongation
suggested that both cues are required for maximal neurite growth (Gomez et al., 2007b;
Gomez and Schmidt, 2007). Foley et al. (Foley et al., 2005) observed that neuritogenesis
of PC12 cells cultured with sub-optimal concentrations of NGF in media, was modulated
by topographic feature size where neuritogenesis was increased when cells were cultured on
ridges of 70 and 250nm as compared to wider ridges (400-1900nm) and flat surfaces. Syn-
ergy between topography and adsorbed extracellular matrix molecules of LN also promoted
neurite alignment and outgrowth onto microgrooves (Miller et al., 2002). DRGs cultured on
substrates with groove depths of greater than 3 m and groove widths of 10 m in combina-
tion with 200μg/mL of LN showed maximal neurite outgrowth and alignment of up to 95%.
Zhang et al. (Zhang et al., 2006) developed a hybrid template that combines topographical
and molecular cues with channels of 5μm depth and 20-40μm width connecting to nodes
of 50-100μm widths and pLL to achieve geometric control over neurite connections for the
application of microelectronic circuits. Hippocampal neurites extended on pLL tracks and
avoided regions where no pLL was present. Studies such as these facilitate the investigation
of hierarchies and synergies between cues.

28
1.9 Three-dimensional environment and axon guidance
Comparisons of cellular growth in standard 2-dimensional (2D) monolayer cultures and 3-
dimensional (3D) matrix cultures that more closely resemble in vivo environments have
shown clear phenotypic differences. For example, previous studies have revealed differences
in cell surface area, stress fiber distribution, cell migration, focal adhesions, neurite and
growth cone dimensions, and protein and gene expression. Tissue engineering approaches
have allowed the development of assay formats that include the third dimension as a con-
trollable and defined parameter, and are used to elucidate cell-material interactions between
neurons and their extracellular matrix. Three-dimensional matrices that have been explored
include biologically based matrices such as alginate (Dhoot et al., 2004; Mosahebi et al.,
2001; Novikova et al., 2006), collagen I (Cullen et al., 2007; Li et al., 2007b; Ma et al., 2004;
O’Connor et al., 2001; O’Connor et al., 2000; Phillips et al., 2005; Willits and Skornia, 2004),
Matrigel™ (Matrigel)(Li et al., 2007b; Novikova et al., 2006) and fibrin (Ju et al., 2007; Régis
Pittier, 2005), as well as synthetic polymer based scaffolds such as poly lactide (PLA)(Bini
et al., 2004; Ngo et al., 2003), poly lactide-co-glycolide (PLGA) and agarose (Dodla and Bel-
lamkonda, 2006). Studies have characterized 3D matrices with regard to their chemical and
mechanical properties and their ability to support neuronal growth. Collagen gels have been
used successfully to differentiate neural stem cells (Ma et al., 2004) and NPCs (O’Connor
et al., 2000) with FGF in the culture medium, and functional synapses have formed in the
cultures (Ma et al., 2004). Addition of Matrigel to rat sympathetic neurons plated on pLL
substrates has been shown to induce rapid axogenesis with corresponding changes in micro-
tubule organization. Another aspect of differential regulation of neuronal cell culture in 3D
can be reflected in the global gene expression of neurons. Li et al. (Li et al., 2007b) showed
using microarray analysis that differentially regulated genes between 2D and 3D culture of
SH-SY5Y neuroblastoma cells included those involved in cytoskeletal reorganization, extra-
cellular matrix, metabolism and signaling. Gene expression trends were maintained over
cultures in different matrices (collagen and Matrigel) but morphological differences in 2D
and 3D cultures such as cell spreading and neurite growth appeared to be material-specific.
The stiffer 3D matrix of collagen supported longer neurites than 2D collagen, whereas in

29
the softer Matrigel, neurons in 3D extended shorter neurites than neurons in 2D.
Physical and mechanical cues such as stiffness have been known to impact a multitude of
cell functions such as adhesion, proliferation, migration, differentiation and morphology.
Durotaxis has been observed in many cell types, including neurons (Georges and Janmey,
2005). Neurite extension both during development and after an injury requires mechani-
cal interactions between growth cone and substrate. Parameters that have been shown to
influence DRG neurite extension include: substrate mechanical properties (Balgude et al.,
2001), ligand concentration (Schense and Hubbell, 2000) and geometry. Mechanical effects
appear to be highly dependent on cell type and the range of moduli presented. Leach et
al. (Leach et al., 2007) tested the NGF-dependent response of PC-12 cells on polyacry-
lamide substrates with varying stiffness, and by controlling the amount of FN present, kept
the adhesive ligand concentration constant over the samples tested. The range of substrate
stiffness tested (7-19kPa) spanned the physiological range as well as “very soft” and “very
stiff” substrates. A threshold response was observed where the softest substrates supported
fewer and shorter neurites, but above a threshold of ~100 Pa, longer and more branched
neurites were observed regardless of increasing shear modulus of the substrate. Willits and
Skornia (Willits and Skornia, 2004) studied the effects of mechanical stiffness on chick DRG
neurons. By varying the concentration of collagen used to gel the matrix, varying stiffnesses
(2.2-17Pa) were generated. After four days in culture, softer matrices resulted in longer neu-
rite lengths. In this experimental setup, it is interesting to note that an increase in interfiber
diameter corresponds with the decrease in mechanical stiffness and collagen concentration, a
geometric constraint which may contribute to the observed cellular response. Analysis and
modeling suggested complex non-linear cell-material interactions.
Mechanical stiffness has been found to influence other cell types, including astrocytes (Georges
et al., 2006). On soft gels of polyacrylamide with a shear modulus of 200Pa, suppression of
astrocyte growth has been observed in both monoculture and coculture experiments, with
low attachment and spreading and disorganized F-actin. This behavior is in contrast with
the growth of cortical neurons on the same soft substrates tested, where coculture experi-
ments show a significantly higher proportion of cortical neurons versus astrocytes on the soft
30
over the hard (9kPa shear modulus) substrates (Georges et al., 2006). These studies point
toward the development of materials tailored to support specific cell populations within the
nervous system.
Combining 3D environments with molecular guidance cues for neurite outgrowth to study
the effects of cues in a more in vivo-like environment is a logical extension of neuronal
assay formats in 3D. Neurotrophic factors can be incorporated into 3D cultures by the
addition of growth factors to culture medium(Deister and Schmidt, 2006), or in a more
controlled manner by covalent linkages between the growth factor and the matrix (Cao and
Shoichet, 2002; Kapur and Shoichet, 2003, 2004; Luo and Shoichet, 2004). Steepness of
NGF gradients was found to attract DRG (Rosoff et al., 2004b) and PC12 (Kapur and
Shoichet, 2004) neurite growth up the concentration gradient on collagen gels (Rosoff et al.,
2004b) and poly(2-hydroxyethylmethacrylate)(Kapur and Shoichet, 2004) respectively. Cao
and Shoichet (Cao and Shoichet, 2003) observed a synergistic effect on DRG outgrowth with
NGF and NT-3 presented in 3D agarose. When NT-3 was applied individually, there was
no directional growth. When the two growth factors were applied together, the guidance
range of neurites towards higher concentrations of NGF and NT-3 exceeded the guidance
range of an NGF gradient alone. Deister and Schmidt (Deister and Schmidt, 2006) adapted
a DRG explant assay in a shallow collagen gel to study the combinations of neurotrophic
factors in culture. After adding NGF, glial derived neurotrophic factor (GDNF) and ciliary
neurotrophic factor (CNTF) individually and in combination, total neurite outgrowth and
length were evaluated. The combination of three factors increased both neurite outgrowth
and length over cultures containing individual factors at the optimal concentration, implying
that interactions between neurotrophic factors can increase neuronal responsiveness in 3D.
1.10 Closing remarks
The progression of tissue engineering platforms from 2D to 3D has been widely noted. The
capacity to integrate guidance cues of interest in a specific and controlled manner has enabled

31
researchers to add a layer of complexity to in vitro systems for axon guidance to more closely
mimic the local in vivo environment while maintaining the ability for quantitative analysis.
Successful nerve growth requires the coordinated presentation of multiple cues, many of
which have been incorporated individually into biomaterial platforms designed to promote
regrowth. Quantitative data relating neurite extension to temporal and spatial combinations
of molecular, cellular and geometric cues are not yet available. Consequently, current ap-
proaches to nerve regeneration lack design parameters to develop nerve guidance therapies.
The experiments described in this proposal will allow us to determine these design parame-
ters by 1) identifying and quantifying the threshold level of these cues that are necessary to
elicit a response, 2) presenting molecules and unique geometries in combination in vitro to
test if these combinations act synergistically or in hierarchy to enhance neurite outgrowth
and 3) determining if the cytoskeletal pathways by which molecular cues and topograph-
ical cues are transduced work synergistically or competitively, by adding pharmacological
inhibitors to disrupt or stabilize key cytoskeletal proteins. Each stage of our experiments
will provide key data for a more complete and integrated understanding of the mechanisms
underlying nerve injury and regeneration and look towards new strategies of overcoming the
glial scar to gain functional recovery after spinal cord injury.
1.11 References
Ahmed I, Liu HY, Mamiya PC, Ponery AS, Babu AN, Weik T, Schindler M, Meiners S.
Three-dimensional nanofibrillar surfaces covalently modified with tenascin-C-derived pep-
tides enhance neuronal growth \emph{in vitro}. J Biomed Mater Res A, 2006; 76: 851-60.
Baier H, Bonhoeffer F. Attractive axon guidance molecules. Science, 1994; 265: 1541-2.
Baier H, Bonhoeffer F. Axon guidance by gradients of a target-derived component. Science,
1992; 255: 472-5.
Balgude AP, Yu X, Szymanski A, Bellamkonda RV. Agarose gel stiffness determines rate of
DRG neurite extension in 3D cultures. Biomaterials, 2001; 22: 1077-84.

32
Bastmeyer M, O’Leary DD. Dynamics of target recognition by interstitial axon branching
along developing cortical axons. J Neurosci, 1996; 16: 1450-9.
Bellamkonda RV. Peripheral nerve regeneration: an opinion on channels, scaffolds and
anisotropy. Biomaterials, 2006; 27: 3515-8.
Bini TB, Gao S, Xu X, Wang S, Ramakrishna S, Leong KW. Peripheral nerve regeneration by
microbraided poly(L-lactide-<I>co</I>-glycolide) biodegradable polymer fibers. Journal
of Biomedical Materials Research Part A, 2004; 68A: 286-95.
Boyd JG, Gordon T. Neurotrophic factors and their receptors in axonal regeneration and
functional recovery after peripheral nerve injury. Mol Neurobiol, 2003; 27: 277-324.
Britland S, McCaig C. Embryonic Xenopus neurites integrate and respond to simultaneous
electrical and adhesive guidance cues. Exp Cell Res, 1996; 226: 31-8.
Britland S, Perridge C, Denyer M, Morgan H, Curtis A, Wilkinson C. Morphogenetic guid-
ance cues can interact synergistically and hierarchically in steering nerve cell growth. Ex-
perimental Biology Online, 1997; 1: 1.
Buettner HM. Nerve growth dynamics. Quantitative models for nerve development and
regeneration. Ann N Y Acad Sci, 1994; 745: 210-21.
Cai J, Peng X, Nelson KD, Eberhart R, Smith GM. Permeable guidance channels containing
microfilament scaffolds enhance axon growth and maturation. J Biomed Mater Res A, 2005;
75: 374-86.
Cao X, Shoichet MS. Defining the concentration gradient of nerve growth factor for guided
neurite outgrowth. Neuroscience, 2001; 103: 831-40.
Cao X, Shoichet MS. Investigating the synergistic effect of combined neurotrophic factor
concentration gradients to guide axonal growth. Neuroscience, 2003; 122: 381-9.
Cao X, Shoichet MS. Photoimmobilization of biomolecules within a 3-dimensional hydrogel
matrix. J Biomater Sci Polym Ed, 2002; 13: 623-36.

33
Carter SB. Haptotaxis and the mechanism of cell motility. Nature, 1967; 213: 256-60.
Chalfoun CT, Wirth GA, Evans GR. Tissue engineered nerve constructs: where do we stand?
J Cell Mol Med, 2006; 10: 309-17.
Chen YY, McDonald D, Cheng C, Magnowski B, Durand J, Zochodne DW. Axon and
Schwann cell partnership during nerve regrowth. J Neuropathol Exp Neurol, 2005; 64:
613-22.
Chilton JK. Molecular mechanisms of axon guidance. Developmental Biology, 2006; 292:
13.
Colamarino SA, Tessier-Lavigne M. The axonal chemoattractant netrin-1 is also a chemore-
pellent for trochlear motor axons. Cell, 1995; 81: 621-9.
Connolly P. Bioelectronic interfacing: micro- and nanofabrication techniques for generating
predetermined molecular arrays. Trends Biotechnol, 1994; 12: 123-7.
Cornish T, Branch DW, Wheeler BC, Campanelli JT. Microcontact Printing: A Versatile
Technique for the Study of Synaptogenic Molecules. Molecular and Cellular Neuroscience,
2002; 20: 140.
Cullen D, Lessing M, LaPlaca M. Collagen-Dependent Neurite Outgrowth and Response
to Dynamic Deformation in Three-Dimensional Neuronal Cultures. Annals of Biomedical
Engineering, 2007; 35: 835.
Suter D, Forster P. Substrate-cytoskeletal coupling as a mechanism for the regulation of
growth cone motility and guidance. Journal of Neurobiology, 2000; 44: 97-113.
David S, Lacroix S. Molecular approaches to spinal cord reapir. Annual Review of Neuro-
science, 2003; 26: 411-40.
Deister C, Schmidt CE. Optimizing neurotrophic factor combinations for neurite outgrowth.
J Neural Eng, 2006; 3: 172-9.

34
Adams DN, Kao EY, Hypolite CL, Distefano MD, Hu WS, Letourneau PC.Growth cones
turn and migrate up an immobilized gradient of the laminin IKVAV peptide. Journal of
Neurobiology, 2005; 62: 134-47.
Dergham P, Ellezam B, Essagian C, Avedissian H, Lubell WD, McKerracher L. Rho signaling
pathway targeted to promote spinal cord repair. J Neurosci, 2002; 22: 6570-7.
Dertinger SKW, Chiu DT, Jeon NL, Whitesides GM. Generation of Gradients Having Com-
plex Shapes Using Microfluidic Networks. Anal. Chem., 2001; 73: 1240-6.
Dertinger SKW, Jiang X, Li Z, Murthy VN, Whitesides GM. Gradients of substrate-bound
laminin orient axonal specification of neurons. PNAS, 2002b; 99: 12542-7.
Devreotes PN, Zigmond SH. Chemotaxis in eukaryotic cells: a focus on leukocytes and
Dictyostelium. Annu Rev Cell Biol, 1988; 4: 649-86.
Dhoot NO, Tobias CA, Fischer I, Wheatley MA. Peptide-modified alginate surfaces as a
growth permissive substrate for neurite outgrowth. Journal of Biomedical Materials Re-
search Part A, 2004; 71A: 191-200.
Dickson BJ. Molecular mechanisms of axon guidance. Science, 2002; 298: 1959-64.
Dodla MC, Bellamkonda RV. Anisotropic scaffolds facilitate enhanced neurite extension in
vitro. J Biomed Mater Res A, 2006; 78: 213-21.
Dowell-Mesfin NM, Abdul-Karim MA, Turner AMP, Schanz S, Craighead HG, Roysam B,
Turner JN, Shain W. Topographically modified surfaces affect orientation and growth of
hippocampal neurons. Journal of Neural Engineering, 2004; 1: 78.
Dunn GA, Brown AF. A unified approach to analysing cell motility. J Cell Sci Suppl, 1987;
8: 81-102.
Ebendal T. The relative roles of contact inhibition and contact guidance in orientation of
axons extending on aligned collagen fibrils in vitro. Exp Cell Res, 1976; 98: 159-69.
35
Etienne-Manneville S, Hall A. Rho GTPases in cell biology. Nature, 2002; 420: 629.
Fan YW, Cui FZ, Chen LN, Zhai Y, Xu QY, Lee IS. Adhesion of neural cells on silicon
wafer with nano-topographic surface. Applied Surface Science, 2002a; 187: 313.
Fan YW, Cui FZ, Hou SP, Xu QY, Chen LN, Lee IS. Culture of neural cells on silicon wafers
with nano-scale surface topograph. Journal of Neuroscience Methods, 2002b; 120: 17.
Fawcett JW, Keynes RJ. Peripheral Nerve Regeneration. Annu. Rev. Neurosci, 1990; 13:
4350. Flaim CJ, Chien S, Bhatia SN. An extracellular matrix microarray for probing cellular
differentiation. Nat Meth, 2005; 2: 119.
Folch A, Toner M. Microengineering of cellular interactions. Annu Rev Biomed Eng, 2000a;
2: 227-56.
Foley JD, Grunwald EW, Nealey PF, Murphy CJ. Cooperative modulation of neuritogenesis
by PC12 cells by topography and nerve growth factor. Biomaterials, 2005; 26: 3639.
Fry EJ. Central Nervous System Regeneration: Mission Impossible? Clinical and Experi-
mental Pharmacology and Physiology, 2001; 28: 253-8.
Fujisawa H. Retinotopic analysis of fiber pathways in the regenerating retinotectal system
of the adult newt cynops Pyrrhogaster. Brain Res, 1981; 206: 27-37.
Georges PC, Janmey PA. Cell type-specific response to growth on soft materials. J Appl
Physiol, 2005; 98: 1547-53.
Georges PC, Miller WJ, Meaney DF, Sawyer ES, Janmey PA. Matrices with Compliance
Comparable to that of Brain Tissue Select Neuronal over Glial Growth in Mixed Cortical
Cultures. Biophys. J., 2006; 90: 3012-8.
Giniger E. How do Rho family GTPases direct axon growth and guidance? A proposal
relating signaling pathways to growth cone mechanics. Differentiation, 2002; 70: 385-96.
Goldner JS, Bruder JM, Li G, Gazzola D, Hoffman-Kim D. Neurite bridging across mi-
cropatterned grooves. Biomaterials, 2006; 27: 460-72.

36
Gomez N, Chen S, Schmidt CE. Polarization of hippocampal neurons with competitive
surface stimuli: contact guidance cues are preferred over chemical ligands. Journal of The
Royal Society Interface, 2007a; 4: 223.
Gomez N, Lu Y, Chen S, Schmidt CE. Immobilized nerve growth factor and microtopography
have distinct effects on polarization versus axon elongation in hippocampal cells in culture.
Biomaterials, 2007b; 28: 271.
Gomez N, Schmidt CE. Nerve growth factor-immobilized polypyrrole: bioactive electrically
conducting polymer for enhanced neurite extension. J Biomed Mater Res A, 2007; 81:
135-49.
Goodhill GJ. Diffusion in axon guidance. Eur J Neurosci, 1997; 9: 1414-21.
Goodhill GJ. Mathematical guidance for axons. Trends in Neurosciences, 1998; 21: 226.
Goodhill GJ, Baier H. Axon guidance: stretching gradients to the limit. Neural Comput,
1998; 10: 521-7.
Goodhill GJ, Gu M, Urbach JS. Predicting Axonal Response to Molecular Gradients with
a Computational Model of Filopodial Dynamics. Neural Comp., 2004; 16: 2221-43.
Goodhill GJ, Urbach JS. Theoretical analysis of gradient detection by growth cones. J
Neurobiol, 1999; 41: 230-41.
Goodman CS. Mechanisms and Molecules that Control Growth Cone Guidance. Annual
Review of Neuroscience, 1996; 19: 341-77.
Govek EE, Newey SE, Van Aelst L. The role of the Rho GTPases in neuronal development.
Genes Dev, 2005; 19: 1-49.
Graf J, Ogle RC, Robey FA, Sasaki M, Martin GR, Yamada Y, Kleinman HK. A pentapep-
tide from the laminin B1 chain mediates cell adhesion and binds to 67000 laminin receptor.
Biochemistry, 1987; 26: 6896-900.

37
Evans GRD. Peripheral nerve injury: A review and approach to tissue engineered constructs.
The Anatomical Record, 2001; 263: 396-404.
Hall A. Rho GTPases and the actin cytoskeleton. Science, 1998; 279: 509-14.
Hope RA, Hammond BJ, Gaze RM. The arrow model: retinotectal specificity and map
formation in the goldfish visual system. Proc R Soc Lond B Biol Sci, 1976; 194: 447-66.
Isbister CM, Mackenzie PJ, To KC, O’Connor TP. Gradient slope influences the pathfinding
decisions of neuronal growth cones in vivo. J Neurosci, 2003; 23: 193-202.
Jain A, Brady-Kalnay SM, Bellamkonda RV. Modulation of Rho GTPase activity alleviates
chondroitin sulfate proteoglycan-dependent inhibition of neurite extension. J Neurosci Res,
2004; 77: 299-307.
Jones DM, Tucker BA, Rahimtula M, Mearow KM. The synergistic effects of NGF and
IGF-1 on neurite growth in adult sensory neurons: convergence on the PI 3-kinase signaling
pathway. Journal of Neurochemistry, 2003; 86: 1116-28.
Ju YE, Janmey PA, McCormick ME, Sawyer ES, Flanagan LA. Enhanced neurite growth
from mammalian neurons in three-dimensional salmon fibrin gels. Biomaterials, 2007; 28:
2097-108.
Kapur TA, Shoichet MS. Chemically-bound nerve growth factor for neural tissue engineering
applications. J Biomater Sci Polym Ed, 2003; 14: 383-94.
Kapur TA, Shoichet MS. Immobilized concentration gradients of nerve growth factor guide
neurite outgrowth. J Biomed Mater Res A, 2004; 68: 235-43.
Kato AC, Lindsay RM. Overlapping and Additive Effects of Neurotrophins and CNTF on
Cultured Human Spinal Cord Neurons. Experimental Neurology, 1994; 130: 196.
Keilhoff G, Goihl A, Stang F, Wolf G, Fansa H. Peripheral nerve tissue engineering: autol-
ogous Schwann cells vs. transdifferentiated mesenchymal stem cells. Tissue Eng, 2006; 12:
1451-65.

38
Kindt RM, Lander AD. Pertussis toxin specifically inhibits growth cone guidance by a
mechanism independent of direct G protein inactivation. Neuron, 1995; 15: 79-88.
Lakatos A, Franklin RJM. Transplant mediated repair of the central nervous system: an
imminent solution? Current Opinion in Neurology December, 2002; 15: 701-5.
Lavik E, Langer R. Tissue engineering: current state and perspectives. Appl Microbiol
Biotechnol, 2004; 65: 1-8.
Le Beau JM, Liuzzi FJ, Depto AS, Vinik AI. Up-regulation of laminin B2 gene expression in
dorsal root ganglion neurons and nonneuronal cells during sciatic nerve regeneration. Exp
Neurol, 1995; 134: 150-5.
Leach JB, Brown XQ, Jacot JG, DiMilla PA, Wong JY. Neurite outgrowth and branching of
PC12 cells on very soft substrates sharply decreases below a threshold of substrate rigidity.
Journal of Neural Engineering, 2007; 4: 26.
Lehmann M, Fournier A, Selles-Navarro I, Dergham P, Sebok A, Leclerc N, Tigyi G, McK-
erracher L. Inactivation of Rho signaling pathway promotes CNS axon regeneration. J
Neurosci, 1999; 19: 7537-47.
Li G, Liu J, Hoffman-Kim D. Multi-Molecular Gradients of Permissive and Inhibitory Cues
Direct Neurite Outgrowth. Annals of Biomedical Engineering, 2008, epublished ahead of
print.
Li GN, Livi LL, Gourd CM, Deweerd ES, Hoffman-Kim D. Genomic and morphological
changes of neuroblastoma cells in response to three-dimensional matrices. Tissue Eng, 2007;
13: 1035-47.
Li Jeon N, Baskaran H, Dertinger SK, Whitesides GM, Van de Water L, Toner M. Neutrophil
chemotaxis in linear and complex gradients of interleukin-8 formed in a microfabricated
device. Nat Biotechnol, 2002; 20: 826-30.
Li N, Folch A. Integration of topographical and biochemical cues by axons during growth
on microfabricated 3-D substrates. Exp Cell Res, 2005; 311: 307-16.

39
Li N, Tourovskaia A, Folch A. Biology on a chip: microfabrication for studying the behavior
of cultured cells. Crit Rev Biomed Eng, 2003; 31: 423-88.
Lin F, Saadi W, Rhee SW, Wang SJ, Mittal S, Jeon NL. Generation of dynamic temporal
and spatial concentration gradients using microfluidic devices. Lab Chip, 2004; 4: 164-7.
Lovat V, Pantarotto D, Lagostena L, Cacciari B, Grandolfo M, Righi M, Spalluto G, Prato
M, Ballerini L. Carbon Nanotube Substrates Boost Neuronal Electrical Signaling. Nano
Lett., 2005; 5: 1107-10.
Luo L. Rho GTPases in neuronal morphogenesis. Nat Rev Neurosci, 2000; 1: 173-80.
Luo Y, Shoichet MS. A photolabile hydrogel for guided three-dimensional cell growth and
migration. Nat Mater, 2004; 3: 249.
Ma W, Fitzgerald W, Liu QY, O’Shaughnessy TJ, Maric D, Lin HJ, Alkon DL, Barker
JL. CNS stem and progenitor cell differentiation into functional neuronal circuits in three-
dimensional collagen gels. Experimental Neurology, 2004; 190: 276.
Madura T, Yamashita T, Kubo T, Fujitani M, Hosokawa K, Tohyama M. Activation of Rho
in the injured axons following spinal cord injury. EMBO Rep, 2004; 5: 412-7.
Mahoney MJ, Chen RR, Tan J, Saltzman WM. The influence of microchannels on neurite
growth and architecture. Biomaterials, 2005; 26: 771-8.
Manwaring ME, Walsh JF, Tresco PA. Contact guidance induced organization of extracel-
lular matrix. Biomaterials, 2004; 25: 3631-8.
Maskery S, Shinbrot T. Deterministic and stochastic elements of axonal guidance. Annu
Rev Biomed Eng, 2005; 7: 187-221.
Maskery SM, Buettner HM, Shinbrot T. Growth cone pathfinding: a competition between
deterministic and stochastic events. BMC Neurosci, 2004; 5: 22.

40
Massia SP, Rao SS, Hubbell JA. Covalently immobilized laminin peptide Tyr-Ile-Gly-Ser-Arg
(YIGSR) supports cell spreading and co-localization of the 67-kilodalton laminin receptor
with alpha-actinin and vinculin. J. Biol. Chem., 1993; 268: 8053-9.
McCaig CD, Rajnicek AM, Song B, Zhao M. Has electrical growth cone guidance found its
potential? Trends Neurosci, 2002; 25: 354-9.
McDonald JW, Liu X-Z, Qu Y, Liu S, Mickey SK, Turetsky D, Gottlieb DI, Choi DW.
Transplanted embryonic stem cells survive, differentiate and promote recovery in injured rat
spinal cord. Nat Med, 1999; 5: 1410.
McFarlane S. Metalloproteases: Carving Out a Role in Axon Guidance. Neuron, 2003; 37:
559.
McKenzie JL, Waid MC, Shi R, Webster TJ. Decreased functions of astrocytes on carbon
nanofiber materials. Biomaterials, 2004; 25: 1309.
Meek MF, Coert JH. Clinical Use of Nerve Conduits in Peripheral-Nerve Repair: Review of
the Literature. J reconstr Microsurg, 2002; 18: 097-110.
Miller C, Jeftinija S, Mallapragada S. Synergistic effects of physical and chemical guidance
cues on neurite alignment and outgrowth on biodegradable polymer substrates. Tissue Eng,
2002; 8: 367-78.
Mosahebi A, Simon M, Wiberg M, Terenghi G. A Novel Use of Alginate Hydrogel as Schwann
Cell Matrix. Tissue Engineering, 2001; 7: 525-34.
Mueller BK. Growth Cone Guidance: First Steps Towards a Deeper Understanding. Annual
Review of Neuroscience, 1999; 22: 351-88.
Ngo TTB, Waggoner PJ, Romero AA, Nelson KD, Eberhart RC, Smith GM. Poly(L-Lactide)
microfilaments enhance peripheral nerve regeneration across extended nerve lesions. Journal
of Neuroscience Research, 2003; 72: 227-38.

41
Nguyen-Vu TD, Chen H, Cassell AM, Andrews R, Meyyappan M, Li J. Vertically aligned
carbon nanofiber arrays: an advance toward electrical-neural interfaces. Small, 2006; 2:
89-94.
Norman J, Desai T. Methods for Fabrication of Nanoscale Topography for Tissue Engineer-
ing Scaffolds. Annals of Biomedical Engineering, 2006; 34: 89.
Novikova LN, Mosahebi A, Wiberg M, Terenghi G, Kellerth J, Novikov LN. Alginate hydro-
gel and matrigel as potential cell carriers for neurotransplantation. Journal of Biomedical
Materials Research Part A, 2006; 77A: 242-52.
O’Connor SM, Stenger DA, Shaffer KM, Ma W. Survival and neurite outgrowth of rat cor-
tical neurons in three-dimensional agarose and collagen gel matrices. Neuroscience Letters,
2001; 304: 189.
O’Connor SM, Stenger DA, Shaffer KM, Maric D, Barker JL, Ma W. Primary neural precur-
sor cell expansion, differentiation and cytosolic Ca2+ response in three-dimensional collagen
gel. Journal of Neuroscience Methods, 2000; 102: 187.
Offenhausser A, Bocker-Meffert S, Decker T, Helpenstein R, Gasteier P, Groll J, Moller M,
Reska A, Schafer S, Schulte P, Vogt-Eisele A. Microcontact printing of proteins for neuronal
cell guidance. Soft Matter, 2007; 3: 290-8.
Oliva AA, James CD, Kingman CE, Craighead HG, Banker GA. Patterning Axonal Guid-
ance Molecules Using a Novel Strategy for Microcontact Printing. Neurochemical Research,
2003; 28: 1639.
Patel N, Poo MM. Orientation of neurite growth by extracellular electric fields. J. Neurosci.,
1982; 2: 483-96.
Phillips JB, Bunting SC, Hall SM, Brown RA. Neural tissue engineering: a self-organizing
collagen guidance conduit. Tissue Eng, 2005; 11: 1611-7.
Polleux F, Morrow T, Ghosh A. Semaphorin 3A is a chemoattractant for cortical apical
dendrites. Nature, 2000; 404: 567-73.

42
Raivich G, Makwana M. The making of successful axonal regeneration: genes, molecules
and signal transduction pathways. Brain Res Rev, 2007; 53: 287-311.
Pittier R, Sauthier F, Hubbell JA, Hall H. Neurite extension and in vitro myelination within
three-dimensional modified fibrin matrices. Journal of Neurobiology, 2005; 63: 1-14.
Rose D, Chiba A. A Single Growth Cone is Capable of Integrating Simultaneously Presented
and Functionally Distinct Molecular Cues during Target Recognition. J. Neurosci., 1999;
19: 4899-906.
Rosentreter SM, Davenport RW, Loschinger J, Huf J, Jung J, Bonhoeffer F. Response of
retinal ganglion cell axons to striped linear gradients of repellent guidance molecules. J
Neurobiol, 1998; 37: 541-62.
Rosoff WJ, McAllister R, Esrick MA, Goodhill GJ, Urbach JS. Generating controlled molec-
ular gradients in 3D gels. Biotechnol Bioeng, 2005; 91: 754-9.
Rosoff WJ, Urbach JS, Esrick MA, McAllister RG, Richards LJ, Goodhill GJ. A new chemo-
taxis assay shows the extreme sensitivity of axons to molecular gradients. Nat Neurosci,
2004a; 7: 678-82.
Schense JC, Hubbell JA. Three-dimensional Migration of Neurites Is Mediated by Adhesion
Site Density and Affinity. J. Biol. Chem., 2000; 275: 6813-8.
Schmidt CE, Leach JB. Neural tissue engineering: strategies for repair and regeneration.
Annu Rev Biomed Eng, 2003; 5: 293-347.
Schmidt CE, Shastri VR, Vacanti JP, Langer R. Stimulation of neurite outgrowth using an
electrically conducting polymer. PNAS, 1997; 94: 8948-53.
Serini G, Bussolino F. Common Cues in Vascular and Axon Guidance. Physiology, 2004;
19: 348-54.
Silva GA, Czeisler C, Niece KL, Beniash E, Harrington DA, Kessler JA, Stupp SI. Selective
Differentiation of Neural Progenitor Cells byHigh-Epitope Density Nanofibers. Science,
2004; 303: 1352.

43
Silver J, Miller JH. Regeneration beyond the glial scar. Nat Rev Neurosci, 2004; 5: 146-56.
Song H, Ming G, He Z, Lehmann M, McKerracher L, Tessier-Lavigne M, Poo M. Conversion
of neuronal growth cone responses from repulsion to attraction by cyclic nucleotides. Science,
1998; 281: 1515-8.
Song HK, Toste B, Ahmann K, Hoffman-Kim D, Palmore GT. Micropatterns of positive
guidance cues anchored to polypyrrole doped with polyglutamic acid: a new platform for
characterizing neurite extension in complex environments. Biomaterials, 2006; 27: 473-84.
Sperry RW. Chemoaffinity In The Orderly Growth Of Nerve Fiber Patterns And Connec-
tions. Proc Natl Acad Sci U S A, 1963; 50: 703-10.
Stein E, Tessier-Lavigne M. Hierarchical organization of guidance receptors: silencing of
netrin attraction by slit through a Robo/DCC receptor complex. Science, 2001; 291: 1928-
38.
Stroock AD, Dertinger SK, Ajdari A, Mezic I, Stone HA, Whitesides GM. Chaotic mixer
for microchannels. Science, 2002a; 295: 647-51.
Stroock AD, Dertinger SK, Whitesides GM, Ajdari A. Patterning flows using grooved sur-
faces. Anal Chem, 2002b; 74: 5306-12.
Tashiro K-I, Sephel GC, Greatorex D, Sasaki M, Shirashi N, Martin GR, Kleinman HK,
Yamada Y. The RGD containing site of the mouse laminin A chain is active for cell attach-
ment, spreading, migration and neurite outgrowth. Journal of Cellular Physiology, 1991;
146: 451-9.
Tashiro K, Sephel GC, Weeks B, Sasaki M, Martin GR, Kleinman HK, Yamada Y. A syn-
thetic peptide containing the IKVAV sequence from the A chain of laminin mediates cell
attachment, migration, and neurite outgrowth. J. Biol. Chem., 1989; 264: 16174-82.
Taylor L, Jones L, Tuszynski MH, Blesch A. Neurotrophin-3 Gradients Established by
Lentiviral Gene Delivery Promote Short-Distance Axonal Bridging beyond Cellular Grafts
in the Injured Spinal Cord. J. Neurosci., 2006; 26: 9713-21.

44
Tessier-Lavigne M, Goodman CS. The molecular biology of axon guidance. Science, 1996;
274: 1123-33.
Thompson DM, Buettner HM. Neurite outgrowth is directed by schwann cell alignment in
the absence of other guidance cues. Ann Biomed Eng, 2006; 34: 161-8.
Tom VJ, Steinmetz MP, Miller JH, Doller CM, Silver J. Studies on the Development and
Behavior of the Dystrophic Growth Cone, the Hallmark of Regeneration Failure, in an In
Vitro Model of the Glial Scar and after Spinal Cord Injury. J. Neurosci., 2004; 24: 6531-9.
Vogt AK, Wrobel G, Meyer W, Knoll W, Offenhausser A. Synaptic plasticity in micropat-
terned neuronal networks. Biomaterials, 2005; 26: 2549-57.
von Philipsborn AC, Lang S, Loeschinger J, Bernard A, David C, Lehnert D, Bonhoeffer F,
Bastmeyer M. Growth cone navigation in substrate-bound ephrin gradients. Development,
2006; 133: 2487-95.
Waid MC, McKenzie JL, Price RL, Ejiofor JU, Webster TJ. Nano-biotechnology: carbon
nanofibres as improved neural and orthopaedic implants. Nanotechnology, 2004; 15: 48-54.
Walsh JF, Manwaring ME, Tresco PA. Directional neurite outgrowth is enhanced by engi-
neered meningeal cell-coated substrates. Tissue Eng, 2005; 11: 1085-94.
Wang H, Iovenitti P, Harvey E, Masood S. Numerical investigation of mixing in microchan-
nels with patterned grooves. Journal of Micromechanics and Microengineering, 2003; 13:
801.
Wang K, Fishman HA, Dai H, Harris JS. Neural Stimulation with a Carbon Nanotube
Microelectrode Array. Nano Lett., 2006; 6: 2043-8.
Wen X, Tresco PA. Effect of filament diameter and extracellular matrix molecule precoating
on neurite outgrowth and Schwann cell behavior on multifilament entubulation bridging
device in vitro. J Biomed Mater Res A, 2006; 76: 626-37.

45
Whitesides GMS, Abraham D. Flexible methods for microfluidics. Physics Today, Vol. 54
Issue 6, p42, , Jun2001, .
Willits RK, Skornia SL. Effect of collagen gel stiffness on neurite extension. J Biomater Sci
Polym Ed, 2004; 15: 1521-31.
Winberg ML, Mitchell KJ, Goodman CS. Genetic analysis of the mechanisms controlling
target selection: complementary and combinatorial functions of netrins, semaphorins, and
IgCAMs. Cell, 1998; 93: 581-91.
Yang F, Murugan R, Wang S, Ramakrishna S. Electrospinning of nano/micro scale poly(L-
lactic acid) aligned fibers and their potential in neural tissue engineering. Biomaterials,
2005a; 26: 2603.
Yang IH, Co CC, Ho C-C. Alteration of human neuroblastoma cell morphology and neurite
extension with micropatterns. Biomaterials, 2005b; 26: 6599.
Yeung CK, Lauer L, Offenhausser A, Knoll W. Modulation of the growth and guidance of
rat brain stem neurons using patterned extracellular matrix proteins. Neuroscience Letters,
2001; 301: 147.
Yu TW, Bargmann CI. Dynamic regulation of axon guidance. Nat Neurosci, 2001; 4 Suppl:
1169-76.
Yu X, Bellamkonda RV. Dorsal root ganglia neurite extension is inhibited by mechanical
and chondroitin sulfate-rich interfaces. J Neurosci Res, 2001; 66: 303-10.
Zhang J, Venkataramani S, Xu H, Song Y-K, Song H-K, Palmore GTR, Fallon J, Nurmikko
AV. Combined topographical and chemical micropatterns for templating neuronal networks.
Biomaterials, 2006; 27: 5734.
Zhang N, Yan H, Wen X. Tissue-engineering approaches for axonal guidance. Brain Res
Brain Res Rev, 2005a; 49: 48-64.

46
Zhang Z, Yoo R, Wells M, Beebe TP, Biran R, Tresco P. Neurite outgrowth on well-
characterized surfaces: preparation and characterization of chemically and spatially con-
trolled fibronectin and RGD substrates with good bioactivity. Biomaterials, 2005b; 26: 47.
Chapter 2
Evaluation of neurite outgrowth using
a novel application of circular analysis
Precise axon growth is required for making proper connections in development and after
injury. One method of studying axon guidance and growth is through in vitro outgrowth
assays that present controlled microenvironments. In this study, we applied circular sta-
tistical methods to evaluate directional neurite response. Specifically, the direction of neu-
rite outgrowth from dorsal root ganglia derived neurons on different substrate types was
quantitatively measured. Further, simulations of datasets with known circular parameters
reflecting expected neurite angle distributions from different substrate types were generated.
Circular statistical methods were utilized and compared to linear statistical models widely
used in the neuroscience literature. These analysis methods represent a useful tool for evalu-
ation of directionality of neurite outgrowth with applications that include: (1) assessment of
neurite outgrowth potential; (2) determination of isotropy of cellular responses to single and
multiple cues and (3) determination of the relative strengths of cues present in a complex
environment.
47

48
2.1 Introduction
Axon guidance during development and after injury has been studied in traditional cell
culture and in increasingly complex in vitro environments generated with tissue engineering
and other biomedical engineering techniques. One approach has been to manipulate the cells’
local microenvironment and observe neurite outgrowth in microenvironments containing cues
of interest. Studies of axon guidance often use in vitro neurite outgrowth assays (Ronn et
al., 2000; Smit et al., 2003; Thompson and Buettner, 2006; Weaver et al., 2003) as models to
elucidate the growth potential of neurons, the effects of the environment, and the mechanisms
underlying the axon growth process.
Quantitative assessment of neurite outgrowth in these assays represents a critical step in
gaining specific information on axon growth. Quantitative morphometric analyses depend
heavily on microscopy techniques (Meijering et al., 2004; Mitchell et al., 2007) and auto-
mated (Karlon et al., 1998; Price et al., 2006; Weaver et al., 2003) or semi-automated (Bil-
sland et al., 1999; Hynds and Snow, 2002; Thompson and Buettner, 2006) image analysis
tools which allow researchers to accurately assess neuronal and neurite growth. Parameters
that provide information on neuronal response may include the area of the neuron or neurite
(Abosch and Lagenaur, 1993), number of neurites (Abosch and Lagenaur, 1993; Le Roux
and Reh, 1994), neurite orientation, neurite length (Abosch and Lagenaur, 1993) and path
of migration. One widely used measure for the strength of a guidance cue is the direction
of neurite outgrowth following some underlying directional stimulus (Alexander et al., 2006;
Bruder et al., 2007; Deumens et al., 2004; Mahoney et al., 2005; Thompson and Buettner,
2006).
The geometry of neurite outgrowth is most meaningfully parameterized in a circular coor-
dinate system centered on the cell and rotationally aligned to the stimulus applied. The
distribution of neurite angles in culture can be described by circular statistical parameters,
such as mean ( c) and concentration ( ), in an analogous manner to linear statistical pa-
rameters mean ( ) and variance ( ). Circular variables have values that fall along a circle
and hence have specific properties related to the cyclic nature of the circular scale. The ap-

49
plication of these methods to neurite direction is analogous to the application of population
biology measures to cellular function.
Statistical analysis of circular variables differs from analysis of linear variables as there are
several properties of circular variables that need to be taken into account. Because circular
variables are finite and closed when a circular data set comes back on itself (at 0° and 360°),
the zero direction, the designation of magnitude, and the number and size of groups (in the
case of grouped data) are arbitrary. In addition, the mean angle of orientation cannot be
found by the simple summation of measured values and division by the sample size. The
sums of circular variables must be taken either modulo 360° if the sample is circular, or
taken modulo 180° if the sample is axial, i.e. where data occur as an undirected line as in
the example of geological fractures (Tran, 2007). For axial data in the present study, there is
symmetry about the y-axis hence there is no distinction between the north-south directions.
Analysis for linear variables approximates randomness by using a Poisson distribution; this
distribution does not translate to circular variables. In circular statistics, the null hypothesis
describing a random distribution is taken to be a uniform distribution, where all directions
may occur at equal probability, approximating randomness and reflecting the finite closure
of a circle (Fisher, 1993).
Neurite outgrowth angles are generally simple distributions, requiring display of data and
summary of a single random sample usually with single or bimodal groups. As such, a
null hypothesis of uniformity and randomness is generally appropriate, with the objective
to assess the uniformity of a given distribution of neurite angles cultured in different envi-
ronmental conditions. When the comparison of two or more samples of neurites cultured in
different conditions is of interest, regression analysis and statistical models may be useful
for description and prediction of cell response. Circular statistical methods complement
traditional linear statistical methods to describe and draw inferences about the population
of neurons and neurites being studied (Batschelet, 1981; Fisher, 1993). We propose in this
study that in many cases, circular statistical methods allow us to more robustly describe
the complexity of neurite outgrowth phenomena.

50
In this work, we employed circular statistical models to evaluate directional growth in a
variety of representative in vitro neurite outgrowth assays. Multiple statistical methods
were used to evaluate in vitro neurite outgrowth ranging from Gaussian based models and
nonparametric methods to hypothesis testing for circular samples. Here we report a com-
parison of circular and linear data presentation and statistical methods for evaluation of
several types of neurite outgrowth patterns.
2.2 Methods
2.2.1 Substrate preparation
Three types of substrates were used to evaluate the use of circular statistical methods on
directionality of neurite outgrowth: adsorbed uniform protein coating on glass, adsorbed
protein stripes and adsorbed protein gradients. Uniform protein coating was performed by
incubating protein solution for one hour on acid washed glass coverslips, washing twice with
sterile water and air drying.
Micropatterned laminin (LN, 50 g/mL) and chondroitin sulfate proteoglycans (CSPG, 10 g/mL)
stripes of 10 mm length, 50 m width and 50 m pitch were stamped onto glass coverslips
via micro-contact printing techniques as described in Bruder et al. (Bruder et al., 2006).
Briefly, grooved polydimethyl siloxane (PDMS) stamps fabricated using the method de-
scribed in Goldner et al. (Goldner et al., 2006), were submerged in 10% sodium dodecyl
sulfate in deionized water, rinsed in water, and incubated with 50 g/mL mouse LN in Hank’s
balanced salt solution without calcium or magnesium (HBSS-CMF) for 1 h. Glass coverslips
were plasma activated with a plasma cleaner/sterilizer (PDC-32 G, Med RF level), and in-
cubated in contact with stamps overnight to achieve adsorbed alternating stripes of either
LN or CSPG.
Protein gradients were generated with the use of a microfluidic gradient mixer, fabricated us-
ing soft lithography techniques in a modification of the method of Dertinger et al. (Dertinger

51
et al., 2002), described in Li et al. (Li et al., 2007). Briefly, the gradient mixer pattern was
designed in AutoCAD and transferred to a silicon wafer using photolithography. Using
the silicon wafer as a template and PDMS as an elastomeric replica, soft lithography was
used to fabricate the gradient mixer. The polymeric gradient mixer and a glass slide were
irreversibly bonded by plasma activation of both surfaces for 1 min. Single cue gradients
of LN or CSPG opposite bovine serum albumin (BSA, 3%, a neutral molecule for neurite
guidance), were generated as substrates to evaluate neurite directionality. Protein solutions
of LN or CSPG and BSA were pumped through the gradient mixer, at 0.2μL/min and al-
lowed to interdiffuse and adsorb overnight. The glass substrates containing the adsorbed
protein gradients were used as the substrates on which to culture dorsal root ganglia (DRG)
neurons.
2.2.2 Cell culture
DRG were dissected from the spinal columns of postnatal (P0-P4) rat pups and cleaned
of axons, blood, and connective tissue. DRG were incubated in 0.05% trypsin-EDTA in
HBSS-CMF at 37˚C for 60 min and dissociated by trituration. Cells were plated onto
substrates in Dulbecco’s modified eagle’s medium (DMEM) with 10% fetal bovine serum
(FBS), 4 mM L-glutamine, 100 U/ml penicillin, and 100 μg/ml streptomycin with 50 ng/ml
nerve growth factor (NGF). Cells were seeded at a density of 100,000 cells/mL, on uniformly
coated glass or micropatterned substrates and 12,500 cells/mL on gradient substrates. Phase
contrast microscopy at 100x magnification was performed using a Nikon Eclipse TE2000-S,
and images were captured with Hamamatsu-ORCA outputting to Openlab v.4.05 after 24
hours in culture.
2.2.3 Image analysis
To evaluate direction of neurite outgrowth on uniform substrates and micropatterned protein
stripes, the angles of all neurites in at least 6 fields of view were measured as the angle
between the vector from the cell body to the tip of the neurite and the vertical axis (0°,

52
°
90°
180°0°
°
°
°°
0°°°
180°
90° °90º or 270ºθangular
θaxial
Vertical
Vertical
Left Right
330º 30º
150º210º
Figure 2.1: Measurement of neurite angles.Schematic showing neurite angles measured in this study ( angular). Note that for alignmentto protein stripes, the data ( axial) is taken as axial data and the circular scale extends from0-180°.
Figure 2.1), using the measure tool in OpenLab software on phase contrast images. To
evaluate directional bias of neurites on gradient substrates, the angles ( ) of the longest
neurites of all neurons adhered to the gradient channel were measured as described above.
2.2.4 Linear statistical analysis
Linear descriptive statistics such as mean and standard deviation were calculated by equa-
tions described in Table I. Conventional statistical tests were performed using SPSS 14.
Linear probability density functions were tested against circular data as comparison (SPSS
14; listed in Table II). For the 2 test, the angle data was grouped into three groups: neu-
rites growing towards the left (210º-330º), right (30º-150º) and vertical (0º-30º, 150º-210º,
330º-360º). For the KS test, the angles of neurite outgrowth were grouped into 10º bins.

53
2.2.5 Circular data presentation
Circular data was plotted as a frequency distribution with neurites binned in ten degree bins,
and “wrapped” around a circle. Circular histograms were plotted using circular statistical
software package Oriana v2.02.
2.2.6 Circular Statistics
A common aim for analysis of directional data is to estimate the preferred direction and
distribution of data. To describe circular distributions, measures have been developed such
as circular mean angle ( ),the length of vector (R) and the concentration parameter ( )
(Batschelet, 1981; Fisher, 1993). These parameters take into account the periodicity in
angular data by using trigonometric functions, and the equations describing the calculations
are listed in Table 2.1.
Six one-sample goodness-of-fit tests were compared in this paper, to test against the null
hypothesis of uniformity of neurite angle distributions: Rayleigh’s test, Rao’s spacing test,
Kuiper’s test, Watson’s U2 test, chi-squared ( 2) test, and V-test, a modification of Rayleigh’s
test. The 2 goodness of fit tests are not strictly circular, but are generally accepted to be
appropriate for circular variables under certain conditions (listed in Table 1, (Batschelet,
1981; Fisher, 1993; Zar, 1996)). Equations for each circular goodness-of-fit test are listed in
Table II. Each type of test was developed for different data distributions. These tests differ
in their alternate hypotheses, where Rao’s and Kuiper’s test for randomness in the sample
against any alternative, and Rayleigh’s and Watson’s test against a unimodal alternative.
The V-test tests against a specified mean direction and was only performed for alignment
studies and computer simulations as these were the only cases in which an external direction
was applied.
Two multisample tests were performed in this study, to compare two datasets and determine
whether their distributions are different: Mardia-Watson-Wheeler test and Watson’s U2
test. Equations for each multisample test are listed in Table 2.2. Both tests determine

54
Table 2.1: Equations of calculations of mean and standard deviation to determine preferreddirection and spread of data.
Where i = angular data for the ith observation as i= 1,. . . , n and n = number ofobservations. Variance calculations performed by Oriana, according to Zar (Zar, 1999).

55
Table 2.2: Equations of test statistical parameters used in circular and linear tests.Where i = angular data for the ith observation as i= 1,. . . , n and n = number of obser-vations. Tables providing critical values of each test statistic are available from Batschelet(Batschelet, 1981) or from circular statistical software programs such as Oriana. Refer toTable 2.1 for definitions of variables.
whether the two samples differ significantly from each other in mean angle, angular variance
or both measures. Neurite angles on LN and CSPG striped substrates, LN striped and
gradient substrates, and LN and CSPG gradient substrates were compared against each other
to test if neurite outgrowth directions differed significantly on these substrates. Mardia-
Watson-Wheeler compares the resultant vector lengths (R), and Watson’s U2 test compares
the deviation between the cumulative density functions of the two populations (Batschelet,
1981). All circular data analysis was performed using Oriana v2.02c. Student t-test was
performed on the same datasets to compare circular methods to linear methods of comparing
means between two samples.
2.2.7 Simulations of circular distributions
Simulations approximating various circular distributions were performed using a custom
MATLAB program that generates circular random numbers from a specified distribution
with input parameters. Algorithms for simulation of data types (uniform, unimodal von
Mises (VM), and bimodal (BM) distributions with corresponding probability density func-

56
Table 2.3: Equations of probability density functions and parameters of statistical modelsused in simulation of neurite outgrowth.
tions described in Table 2.3) were taken from Fisher (Fisher, 1993). In each simulation,
random numbers were generated (n=5, 30, 100), input parameters included mean ( c), and
concentration ( ) corresponding to angular dispersion and simulation of each distribution
was run 100 times. Simulated uniform data were generated by transforming linear random
numbers in the range of 0 to 1 into degrees by using the RAND function in MATLAB modulo
360. Random numbers from VM and BM distributions were generated according to Fisher
(Fisher, 1993). BM distributions consisted of data drawn from two subsets of proportions p
and (1-p), with parameters ( c1, R1, 1) and ( c2, R2, 2) corresponding to each subset. In
this case, bimodal distributions were simulated as an equal mixture of two subpopulations
with VM distribution (p1=p2=0.5).
Two linear and four circular goodness-of-fit tests were performed on each experimental con-
dition similar to the experimental data described in section 2.5 to assess the probability
density function that would best describe the data. The percentage of significant simu-
lations (p<0.05) was determined for each experimental condition and Type I error was
determined for each experimental condition in the simulation (Table 2.7).
2.3 Results
Here we describe the evaluation of directional neurite outgrowth using linear and circular
statistics of two types of data: experimental data with unknown population parameters and
simulated data with known (user defined) population parameters.

57
2.3.1 Experimental Results
Experimental data of three different types of DRG neurite behavior were elicited from three
differently micropatterned substrates and simulations of established uniform, unimodal and
bimodal datasets were performed. Experimental neurite angle data were presented in circular
histograms customary for circular data, and also in more conventional ways of presenting
alignment, by bar graphs of neurites categorized in aligned and unaligned groups.
By varying micropatterns of proteins presented in culture using multiple substrates (uni-
form, striped, gradient), neurite outgrowth could be directed towards different directions.
Comparison of mean neurite angles and deviations from the vertical axis calculated both
with linear and with circular methods revealed differences in the abilities of linear and cir-
cular approaches to accurately reflect the complex distributions of neurites. The large linear
standard deviations reflected how linear methods fail to account for data clustering around
0°. Deviation from the vertical axis 0° or 180°, on a circular or angular scale, (Figure 2.2;
Table IV), showed that the circular mean angle avoided the convergence to 180°, providing
a better estimate of mean angle. For striped samples that aligned to the vertical axis, linear
methods yielded means of 135.01° and 182.93° for LN and CSPG respectively, while circu-
lar statistical methods yielded corresponding means that aligned with the vertical axis for
striped substrates (1.90° and 178.61° for LN and CSPG respectively). For gradient samples,
circular mean angles showed directed growth towards more permissive or less inhibitory
regions on gradient substrates (293.89° and 300.90° for LN and CSPG respectively). Corre-
sponding linear mean angles converged towards 180°, showing little directionality (197.58°
and 183.09° for LN and CSPG respectively).
Phase contrast images of neurons on uniformly coated LN (Figure 2.3) show neurite out-
growth in all directions. A grouped bar graph poorly reflects the uniformity of the dataset,
where more neurites appear to have grown in the “left” direction than in all others. A lin-
ear histogram of neurite data appears to show four modal groups (0-80°, 90-170°, 190-290°,
300-360°) and reveals the poor fit of a normal distribution. Data plotted on a circular axis
reflects the variability of the angular data and most clearly shows that angular data falls in

58
A B C
0 360180
Linear scale
0°
180°
90°270°
0°
180°
90°90°
Angular scale Axial scale
Figure 2.2: Visualization of linear and circular scales.(a) Linear data fall in a straight line with values increasing along the axes. (b) Angular datais shown on a circular scale where 0-360° wraps around on a circle. Scale used in this studyfor neurite angles on gradient substrates. (c) Axial data is shown on a circular scale withan axis of symmetry about the y-axis such that the scale extends from 0-180°. Scale usedin this study for neurite angles on striped substrates. Note that for circular histograms,concentric circles about the axes denote frequency of data.
even spacing around a circular scale.
When permissive LN and inhibitory CSPG were presented on substrates, DRG neurons ad-
hered to LN coated regions and avoided CSPG coated regions (Figure 2.4). DRG neurites
extended and aligned to LN stripes (Figure 4a) and to uncoated regions between CSPG
stripes (Figure 4e). Qualitative and quantitative analysis of the data show a larger popu-
lation and density of neurons and aligned neurites on LN striped substrates, as compared
to CSPG striped substrates, but the mean neurite outgrowth direction (the parameter of
interest) was similar for DRG neurons on both LN and CSPG striped substrates. Grouped
bar graphs, with groups defined as left: 210-330°, right: 30-150°, and aligned: 330-30° and
150-210°) are able to show that the data cluster around the vertical direction which is set to
correspond to alignment to the underlying pattern (Figure 4b, f). Linear histograms split
the data clusters, fail to recognize the relationship between 0-10° and 350-360°, and reveal a
poor fit to a normal distribution around the linear mean of 180° (Figure 4c, g). Data plotted
on circular axes show that the majority of the data falls within a 30° interval around the
vertical 0° direction (Figure 4d, h).
Analysis of neurite growth on gradient substrates illustrates how circular statistics can be
used to analyze neurite outgrowth patterns that are more complex (Figure 2.5). Phase

59
8 8
8
8
6 6
6
6
4 4
4
4
2 2
2
2
0º
90º
180º
270º
A B
C D
Vertical
Num
ber
of n
eurit
es
Direction
Neurite angle (degrees)0 60 120 180 240 300 360
Figure 2.3: Distribution of neurites after 24 hours in culture on uniformly coated LN sub-strates shows uniformity in neurite outgrowth angles.(a) Phase contrast image of DRG neurons on uniform LN coated glass surface. Bar =50 m. Arrows show the vectors that were used to evaluate the neurites. (b) Bar graphshows the corresponding grouped neurite outgrowth angle data. (c) Linear histogram showscorresponding distribution of neurite angles where each angle presented is the angle of thelongest neurite per neuron. Normal curve is fitted to the linear histogram around thelinear sample mean and standard deviation. (d) Circular histogram shows the correspondingdistributions of neurite angles where each angle presented is the angle of the longest neuriteper neuron.

60
40 40
40
40
30 30
30
30
20 20
20
20
10 10
10
10
0º
90º
180º
270º
40 40
40
40
30 30
30
30
20 20
20
20
10 10
10
10
0º
90º
180º
270º
A B D
E F
C
H
Num
ber
of n
eurit
es
Direction
Num
ber
of n
eurit
es
Direction0 60 120 180 240 300 360
Neurite angle (degrees)
0 60 120 180 240 300 360
Neurite angle (degrees)
LN LN LN LN LN
CSPG CSPG CSPG CSPG CSPG
G
Figure 2.4: Distribution of neurites after 24 hours in culture on micropatterned LN or CSPGstripes shows clustered and directed neurite outgrowth angles.Phase contrast images of DRG neurons on micropatterned LN (a) and CSPG (e) stripesrespectively on glass surface. Bar = 50 m. Arrows show the vectors that were used toevaluate the neurites. (b, f) Bar graphs show the corresponding grouped neurite outgrowthangle data. (c, g) Linear histograms show corresponding distributions of neurite angleswhere each angle presented is the angle of the longest neurite per neuron. Normal curveis fitted to the linear histogram around the linear sample mean and standard deviation.Circular histograms show the corresponding distributions of neurite angles on LN (d) andCSPG (h) striped substrates, where each angle presented is the angle of the longest neuriteper neuron. White arrows indicate mean neurite angles for directed distributions.

61
contrast images of DRGs plated on a LN gradient (Figure 5a) and a CSPG gradient (Figure
5e) show an overall trend of neurite growth toward the permissive LN and away from the
inhibitory CSPG, but the neurite response to the underlying substrate is not nearly as
obvious as that of DRGs cultured on protein stripes in Figure 4. Grouped bar graphs (Figure
5b, f) are able to show the bias towards the “left” edge of the channel, which was the more
permissive or the less inhibitory direction. Linear histograms appear to show three modal
groups (0-70°, 70-250°, 250-360°) for neurite growth on LN gradients (Figure 5c). For DRG
neurites on a CSPG gradient however, the neurite angle distribution is flattened and appears
more uniform (Fig 5g). Data plotted on circular axes show a similar trend to the grouped
bar graphs, where growth appears to be towards the more permissive or less inhibitory
regions (Figs. 5d, h). Similar to DRG response on protein stripes, the permissiveness of the
substrate is reflected by the number of neurons and neurites present, whereas the directional
guidance potential of the substrate is reflected by the angles at which the neurites extend.
Several circular and linear goodness-of-fit tests were performed for all experimental data
conditions with the null hypothesis of uniformity (Table 2.5). For neurites cultured on uni-
form LN substrates, patterned LN and CSPG stripes, and LN gradients, circular and linear
tests exhibited similar results. On uniform substrates, all circular and linear tests showed
no significant difference from a uniform distribution. On striped substrates and LN gradi-
ents, all circular and linear tests showed significant difference from a uniform distribution.
However, on CSPG gradients, a common linear test, KS, showed no significant difference
from uniformity whereas Rayleigh’s, Watson’s, Rao’s and Kuiper’s circular tests showed
significant difference from uniformity. Surprisingly, 2 tests for grouped data with 3 groups
were in better agreement with other circular tests than 2 tests for grouped data with 36
groups.
Multisample analysis showed no difference in neurite angles between LN striped and CSPG
striped samples. It also showed no difference in angles between LN gradient and CSPG gra-
dient samples. Both Mardia-Watson-Wheeler and Watson’s U2 test showed no significant
differences with p-values greater than 0.49 (Table 2.6). Student t-test was performed as a
comparison and also found neurite angles to be not significantly different on these substrates
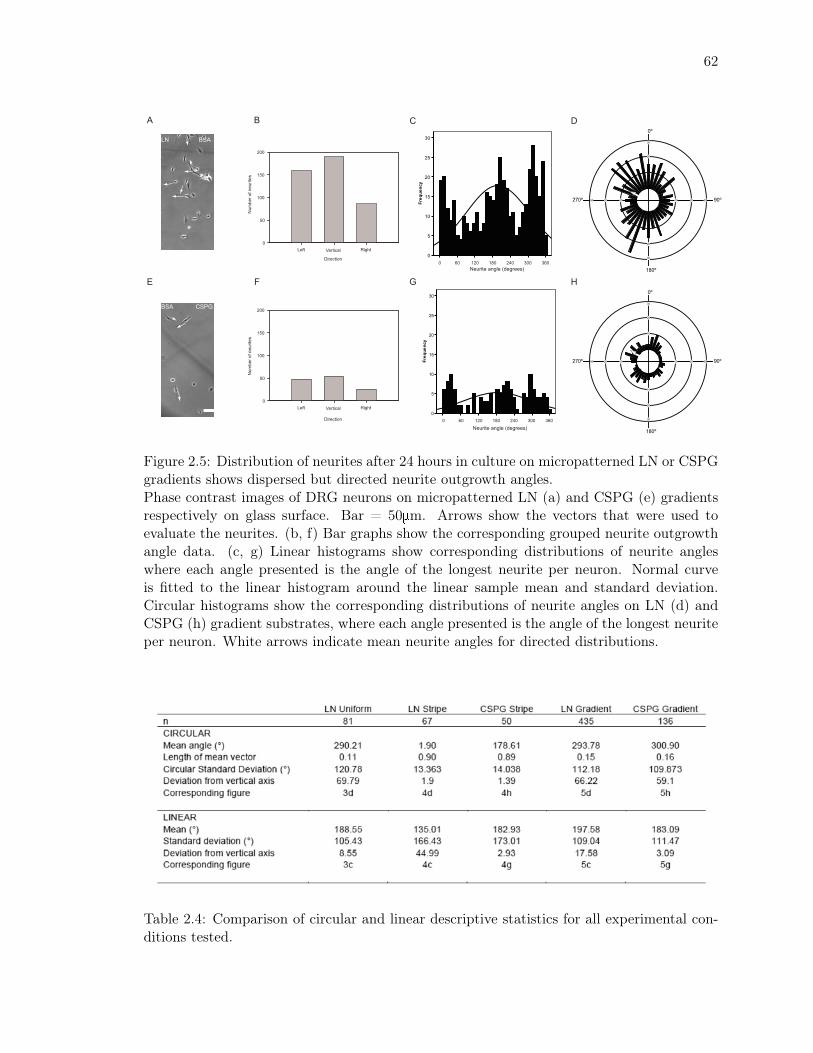
62
30 30
30
30
20 20
20
20
10 10
10
10
0º
90º
180º
270º
30 30
30
30
20 20
20
20
10 10
10
10
0º
90º
180º
270º
A B C
E F G H
LN BSA
BSA CSPG
VerticalN
umbe
r of
neu
rites
Direction
D
Neurite angle (degrees)0 60 120 180 240 300 360
Neurite angle (degrees)
0 60 120 180 240 300 360
Vertical
Num
ber
of n
eurit
es
Direction
Figure 2.5: Distribution of neurites after 24 hours in culture on micropatterned LN or CSPGgradients shows dispersed but directed neurite outgrowth angles.Phase contrast images of DRG neurons on micropatterned LN (a) and CSPG (e) gradientsrespectively on glass surface. Bar = 50 m. Arrows show the vectors that were used toevaluate the neurites. (b, f) Bar graphs show the corresponding grouped neurite outgrowthangle data. (c, g) Linear histograms show corresponding distributions of neurite angleswhere each angle presented is the angle of the longest neurite per neuron. Normal curveis fitted to the linear histogram around the linear sample mean and standard deviation.Circular histograms show the corresponding distributions of neurite angles on LN (d) andCSPG (h) gradient substrates, where each angle presented is the angle of the longest neuriteper neuron. White arrows indicate mean neurite angles for directed distributions.
Table 2.4: Comparison of circular and linear descriptive statistics for all experimental con-ditions tested.

63
Table 2.5: Comparison of circular and linear goodness-of-fit statistical tests for all experi-mental conditions tested.
One sample uniformity tests developed for circular variables were performed for allexperimental samples, including Rayleigh’s, Rao’s Spacing, Watson’s U2 and Kuiper’s test.Linear non-parametric one sample tests were also performed for all experimental samplesincluding chi-squared (performed on data grouped in 3 bins) and KS tests (performed on
ungrouped data). Significance levels taken to be p<0.05. Ha indicates the alternatehypothesis used.
at p<0.05 significance level, but p-values were much lower (p<0.1). Further examination
of data shows similar mean angles on LN and CSPG striped substrates and on LN and
CSPG gradient substrates (Table 2.4). Multisample analysis with Mardia-Watson-Wheeler
and Watson’s U2 test showed that neurites on striped LN and LN gradient substrates were
significantly different from each other. Comparison with Student t-test shows that linear
methods also show significant difference between neurite angles on LN stripe and gradi-
ent substrates (Table 2.6). Further examination of data shows differences in both mean
angles and circular standard deviation (Table 2.4. For CSPG striped versus CSPG gradi-
ent substrates, Student t-test comparison shows no significant difference in neurite growth.
However, circular analysis does show significant differences in neurite angles (Table 2.4).
Further examination of the data shows that this distinction is due to the convergence of the
linear mean towards 180° (Table 2.4).
2.3.2 Simulation Results
Simulations of circular data were performed to compare the results of circular and linear
goodness-of-fit tests for one sample statistical analysis of known distributions. Simulations

64
Table 2.6: Comparison of circular and linear multisample tests for all experimental condi-tions tested.Circular multisample tests Mardia-Watson-Wheeler and Watson’s U2 test were performedto determine differences between neurite outgrowth on pairs of substrate types. Linear
comparisons were performed using Student t-tests. Significance levels taken to be p<0.05.
of neurite angles were drawn from established circular statistical models such as uniform
distribution to model the experimental condition of applying no directional cue, VM distri-
bution to model the condition of applying one unidirectional cue and BM distribution to
model the condition of applying two cues from two different directions. Because the sample
size of neurite angles obtained from experimental data is variable based on the permissivity
of the substrate, the sample size in simulated data was varied from n=5 to n=100 to cover a
range of sample sizes used in neurite outgrowth analysis. Simulated circular data was only
presented in circular histograms (Figure 2.6).
For uniform distributions, all directions between 0° and 360° are equally likely to occur,
and c is undefined as R=0. VM distribution is the most commonly used model for uni-
modal samples of circular data. As κ approaches 0, the distribution converges to a uniform
distribution, and as κ approaches infinity, the distribution tends to concentration around
the direction c. Sample means of VM based data approached the population means (user-
defined c=0). Circular means were better approximated for simulated samples with tighter
distributions, c=11° where κ =0.85 and c=5° where κ =3 (Figure 6b, c). Circular his-
tograms of BM data highlight the difficulty in graphically assessing multimodality in data
(Figure 6d, e). The means calculated for a BM distribution of ( 1=0°, 2=90°) were 79°
and 61°. For BM distributions, histograms do not show a clear distinction between the two
subpopulations of data.
Table 2.7 shows the number of statistically significant (non-uniform) simulations out of 100

65
6 6
6
6
5 5
5
5
4 4
4
4
3 3
3
3
2 2
2
2
1 1
1
1
0º
90º
180º
270º 12.5 12.5
12.5
12.5
10 10
10
10
7.5 7.5
7.5
7.5
5 5
5
5
2.5 2.5
2.5
2.5
0º
90º
180º
270º 20 20
20
20
15 15
15
15
10 10
10
10
5 5
5
5
0º
90º
180º
270º
A B C
D E
8 8
8
8
6 6
6
6
4 4
4
4
2 2
2
2
0º
90º
180º
270º 10 10
10
10
7.5 7.5
7.5
7.5
5 5
5
5
2.5 2.5
2.5
2.5
0º
90º
180º
270º
Uniform von Mises (0°, 0.85)
Bimodal (0°, 0.85, 30°, 0.85)
von Mises (0°, 3)
Bimodal (0°, 3, 30°, 3)
Figure 2.6: Representative circular histograms of simulated data generated by MATLABalgorithm.Circular histograms of representative runs with n=100 angles generated from a (a) uniformcircular distribution, (b) dispersed VM distribution ( =0.85) with a mean of 0º, (c) tightVM distribution ( =3) with a mean of 0º, (d) dispersed BM distribution ( =0.85) withmeans 0º and 30º and (e) tight BM distribution ( =3) with means 0º and 30º.

66
trials, from each type of uniformity test listed in rows (Rayleigh, Rao’s spacing, Watson’s
U2, Kuiper’s and V-test). Watson’s U2 test was unavailable for n=5 samples as the test’s as-
sumptions require n=10 for analysis using this method. Simulated data is listed in columns,
with the type of distribution (uniform, VM and BM) described by its parameters ( , ).
For uniform distributions, the number presented in Table VII when taken as a percentage
corresponds to the Type I error of the given test. Type I error occurs when the null hypothe-
sis (in this case, distribution is uniform) is rejected by the test when the null hypothesis is in
fact true. A lower Type I error value indicates a better test for this type of data, as the test
is wrong less often. As expected, for all tests, as n increases, Type I error decreases. Lin-
ear goodness-of-fit tests showed low Type I error for uniform distributions, indicating that
nonparametric tests against a null hypothesis of uniformity such as KS tests are effective
for determining uniformity. For circular tests, where n is small, Rao’s spacing test has the
lowest Type I error, which is consistent with other studies comparing one sample statistical
tests (Bergin, 1991). For VM and BM distributions, the number of significant trials out of
100 corresponded to the power of the statistical test of interest. The expectation was that
the tests would find the data significantly different from the null hypothesis of uniformity.
Power is defined as the probability at which the null hypothesis will be rejected if it is false.
As expected, increasing sample size corresponded to increasing power of each test.
For VM and BM distributions with large sample sizes (approaching n=100) K-S tests found
VM and BM distributions to be significantly different from a Gaussian distribution. Overall
circular tests performed similarly for VM distributions, although Rao’s Spacing test was
less powerful than other circular statistical one-sample tests. V-test had the highest power
for VM datasets with small sample size and higher dispersion. For simulated data, the
hypothesized mean direction was known as it was user defined. It is important to note
that this hypothesized direction ( 0) must be assigned in advance of experimentation and
if the null hypothesis is not rejected by the V-test, it is unknown whether the population
is distributed uniformly or whether the distribution has a mean direction other than 0.
For one-sample data with an unknown external directional component, the Rayleigh test is
usually recommended for unimodal data. (Batschelet, 1981; Fisher, 1993) Both the Rayleigh

67
Table 2.7: Comparison of circular and linear goodness-of-fit statistical tests for simulateddata of known distribution.Each simulation in each condition was run 100 times, and each one-sample goodness of fit
test listed in Table II was run for each simulation. Type I errors are listed for allconditions and for all tests performed. Ha indicates the alternate hypothesis used.
test and Kuiper’s test yielded similar power levels for unimodal VM distributions, even for
distributions with relatively high angular dispersion (corresponding to a lower κ value).
The power of all circular statistical tests were higher than the corresponding linear K-S test
against uniformity for simulated VM and BM distributions, except in the case where n=100.
However, the power of the same test against a null hypothesis of a normal distribution is
very low, such that most simulations showed that a K-S test did not find the simulated
uniform distribution to be significantly different from a normal distribution.
As expected, one-sample uniformity tests exhibited low power when tested on BM distribu-
tions, as the cluster of data around two peaks began to resemble uniform data when both
distributions had low concentration values. V-test showed the highest power when testing
BM data against a null hypothesis. When the BM distribution was relatively clustered
(at the highest concentration value tested κ=3), all tests showed higher power in detecting
non-uniformity.

68
2.4 Discussion
The present study demonstrates that circular statistical methods may be used to analyze
biological data containing directional biases and anisotropy, particularly to quantify neu-
rite outgrowth. To analyze the direct effects of the underlying substratum of the culture
surface on neuronal outgrowth, we plated and cultured neurons at low density for 24 hours
and imaged the cultures for analysis. In the absence of directional cues, on uniform sub-
strates, neurites were randomly oriented. The neurons on substrates with patterned protein
stripes were highly aligned to the underlying stripe geometry. The neurons on substrates
with graded anisotropy in protein concentration were directed towards the more permissive
regions of the substrate.
In this report, we demonstrated the utility of an analysis procedure that we have found
to be useful for evaluating a wide range of neurite outgrowth phenomena. First, circular
histograms were plotted to visualize the data about a circular axis. The descriptive statistics
were calculated for each distribution, including the mean angle, length of the mean vector,
and the circular standard deviation. We then ran circular one-sample goodness-of-fit tests
against uniformity and compared the circular methods to commonly used linear statistical
methods. We simulated data with known distribution parameters to test the power of the
circular and linear goodness-of-fit tests.
We have shown that circular statistical methods show sufficient power and are a better
model than linear statistical methods to analyze directional neurite outgrowth on micropat-
terned substrates. Circular histograms and categorization allow easy visualization of data
clustering, as demonstrated by histograms of neurite angles grouped around the direction
of alignment. Circular data presentation avoids observational and truncation biases which
occur in linear statistical analyses, for more accurate characterization of data. Circular
statistical tests are more sensitive for smaller sample sizes, as shown by higher power of
circular tests for simulations containing low n’s. Further, they are more sensitive to com-
plex distributions, as shown by the performance of multisample tests in comparing neurite
angles on CSPG stripes versus CSPG gradients. The approximate linearity of a small arc,

69
in the case when data is clustered, is sometimes used to justify the application of linear
models to simplify data analysis; however, different degrees of dispersion depending on the
variability of the data can strongly affect the validity of this assumption. If there is any
appreciable variability of circular data, it has been noted that the average of the dataset is
better described by a resultant vector rather than the arithmetic mean (Fisher, 1993).
Evaluation of neurite outgrowth in vitro have included qualitative scoring systems with
grouped categorical quantification (Dertinger et al., 2002; Sonigra et al., 1999; Sorensen et
al., 2007), and measurement of neurite characteristics such as neurite length, area, number
and branching patterns (Kim et al., 2006; Mann et al., 1998; Recknor et al., 2004). A num-
ber of studies initially demonstrated the ability of patterned striped substrates to support
directional neurite outgrowth in vitro (Clark et al., 1993; Gomez and Letourneau, 1994) and
the ability of concentration gradients to direct neuronal growth up concentration gradients
(Walsh et al., 2005) by using traditional linear statistical methods. Categorization of circu-
lar data prior to using linear statistical methods has been a common approach to analyzing
directional data. After the categorization of angular data into bins for plotting histograms
(generally in bins of 10-20°), or into categories of “aligned” versus “unaligned,” linear statis-
tical tests can be applied to the groups of categorical data. ANOVAs are commonly used
to test the differences between the degrees of neurite alignment over different substrates or
experimental conditions (Macias et al., 2000; Sorensen et al., 2007). It is important to note
that ANOVAs assume a Gaussian model for the distribution of angles which may not be
accurate, depending on the population. Previous studies of neurite growth and orientation
have used nonparametric statistical tests such as the 2 test (Biran et al., 2003; Dertinger et
al., 2002; Manwaring et al., 2004; Smeal et al., 2005) and the Kolmogorov-Smirnov (KS) test
(Ming et al., 2001; Thompson and Buettner, 2006; Yuan et al., 2003). A rational for using
nonparametric tests is that circular data of neurite outgrowth angles are rarely expected to
approach a normal distribution (in a linear presentation) or a VM distribution (in a circular
presentation). The 2 and KS tests were also performed in this study and shown in some
cases to perform differently from circular tests. One limitation of linear statistical methods
for the application of directional neurite outgrowth in culture systems is that there may
70
be an overemphasis on the tails of the linear scale, in this case 0° and 180° or 360°. This
overemphasis can result in artificially inflating the calculated variance of the data.
Other studies that analyze cellular phenomenon, particularly of cell migration, have recog-
nized the need to present data in a nonlinear fashion in order to most appropriately visualize
and analyze movement data which is usually highly complex, with cell trajectories tracing
a relatively noisy path. If the nature of the path in response to a directional stimulus is
of interest, the migration angle is usually an important aspect of analysis. Recent stud-
ies have utilized circular visualizations for data presentation, most commonly using Rose
diagrams, where the frequency of migration angles are plotted around a circular axis with
the area of each bar corresponding to frequency (Frevert et al., 2006; Papakonstanti et al.,
2007; Saadi et al., 2006). In neuroscience literature, examples of visualization of angular
data using circular methods have included neuronal migration (Ward et al., 2003), neurite
outgrowth (Tailby et al., 2005), response to magnetic stimulation (Macias et al., 2000), and
mitochondrial organization in axonal transport (Miller and Sheetz, 2004).
2.5 Conclusion
In conclusion, we have applied a statistical method for graphically representing and analyz-
ing directional data pertaining to neurite growth that can be used to investigate neuronal
cultures and their interactions with their microenvironment in vitro. Despite recent ad-
vances, current approaches to nerve repair fall short of restoring complete function, and
in vitro systems that have been developed to more systematically study parameters affect-
ing neurite growth have become more specific and quantitative. The techniques described
here are useful in identifying directional neurite outgrowth patterns on in vitro platforms,
allowing us to better evaluate neurite growth trajectories that exhibit circular geometry.
Statistical methods such as uniformity tests provide a formal means to test hypotheses re-
lating to neuronal responses to complex microenvironments, and circular histograms provide
a visualization tool to investigate neuronal processes exhibiting circular geometries. This

71
approach offers a more informative way to probe the mechanisms of neurite outgrowth and
guidance.
2.6 Acknowledgements
The authors thank Elizabeth Deweerd for assistance with alignment and gradient experi-
ments, and Michael Sherback for assistance with MATLAB programming and for helpful
discussion of the manuscript. This work was funded by an NSF CAREER grant to DHK
and a Robert and Susan Kaplan Fellowship to GNL.
2.7 References
Abosch A, Lagenaur C. Sensitivity of neurite outgrowth to microfilament disruption varies
with adhesion molecule substrate. Journal of Neurobiology, 1993; 24: 344-55.
Alexander JK, Fuss B, Colello RJ. Electric field-induced astrocyte alignment directs neurite
outgrowth. Neuron Glia Biology, 2006; 2: 93.
Batschelet E. Circular statistics in biology. Academic Press: London, 1981. Bergin TM. A
Comparison Of Goodness-Of-Fit Tests For Analysis Of Nest Orientation In Western King-
birds (Tyrannus-Verticalis). Condor, 1991; 93: 164-71.
Bilsland J, Rigby M, Young L, Harper S. A rapid method for semi-quantitative analysis of
neurite outgrowth from chick DRG explants using image analysis. Journal of neuroscience
methods, 1999; 92: 75-85.
Biran R, Noble MD, Tresco PA. Directed nerve outgrowth is enhanced by engineered glial
substrates. Experimental Neurology, 2003; 184: 141-52.
Bruder JM, Lee AP, Hoffman-Kim D. Biomimetic materials replicating Schwann cell topog-
raphy enhance neuronal adhesion and neurite alignment in vitro. J Biomater Sci Polym Ed,
2007; 18: 967-82.
72
Bruder JM, Monu NC, Harrison MW, Hoffman-Kim D. Fabrication of Polymeric Replicas
of Cell Surfaces with Nanoscale Resolution. Langmuir, 2006; 22: 8266-70.
Clark P, Britland S, Connolly P. Growth cone guidance and neuron morphology on mi-
cropatterned laminin surfaces. J Cell Sci, 1993; 105: 203-12.
Dertinger SK, Jiang X, Li Z, Murthy VN, Whitesides GM. Gradients of substrate-bound
laminin orient axonal specification of neurons. Proc Natl Acad Sci U S A, 2002; 99: 12542-7.
Deumens R, Koopmans GC, den Bakker CGJ, Maquet V, Blacher S, Honig WMM, Jerome
R, Pirard JP, Steinbusch HWM, Joosten EAJ. Alignment of glial cells stimulates directional
neurite growth of CNS neurons in vitro. Neuroscience, 2004; 125: 591.
Fisher NI. Statistical Analysis of Circular Data. Cambridge University Press: Cambridge,
U.K, 1993.
Frevert CW, Boggy G, Keenan TM, Folch A. Measurement of cell migration in response to
an evolving radial chemokine gradient triggered by a microvalve. Lab Chip, 2006; 6: 849-56.
Goldner JS, Bruder JM, Li G, Gazzola D, Hoffman-Kim D. Neurite bridging across mi-
cropatterned grooves. Biomaterials, 2006; 27: 460-72.
Gomez TM, Letourneau PC. Filopodia initiate choices made by sensory neuron growth cones
at laminin/fibronectin borders in vitro. J. Neurosci., 1994; 14: 5959-72.
Hynds DL, Snow DM. A semi-automated image analysis method to quantify neurite pref-
erence/axon guidance on a patterned substratum. Journal of Neuroscience Methods, 2002;
121: 53.
Karlon WJ, Covell JW, McCulloch AD, Hunter JJ, Omens JH. Automated measurement
of myofiber disarray in transgenic mice with ventricular expression of ras. Anat Rec, 1998;
252: 612-25.
Kim IA, Park SA, Kim YJ, Kim SH, Shin HJ, Lee YJ, Kang SG, Shin JW. Effects of
mechanical stimuli and microfiber-based substrate on neurite outgrowth and guidance. J
Biosci Bioeng, 2006; 101: 120-6.

73
Le Roux PD, Reh TA. Regional differences in glial-derived factors that promote dendritic
outgrowth from mouse cortical neurons in vitro. J. Neurosci., 1994; 14: 4639-55.
Li G, Liu J, Hoffman-Kim D. Multi-Molecular Gradients of Permissive and Inhibitory Cues
Direct Neurite Outgrowth. Annals of Biomedical Engineering, 2007.
Macias MY, Battocletti JH, Sutton CH, Pintar FA, Maiman DJ. Directed and enhanced
neurite growth with pulsed magnetic field stimulation. Bioelectromagnetics, 2000; 21: 272-
86.
Mahoney MJ, Chen RR, Tan J, Saltzman WM. The influence of microchannels on neurite
growth and architecture. Biomaterials, 2005; 26: 771-8.
Mann F, Zhukareva V, Pimenta A, Levitt P, Bolz J. Membrane-Associated Molecules Guide
Limbic and Nonlimbic Thalamocortical Projections. J. Neurosci., 1998; 18: 9409-19.
Manwaring ME, Walsh JF, Tresco PA. Contact guidance induced organization of extracel-
lular matrix. Biomaterials, 2004; 25: 3631-8.
Meijering E, Jacob M, Sarria JC, Steiner P, Hirling H, Unser M. Design and validation of a
tool for neurite tracing and analysis in fluorescence microscopy images. Cytometry A, 2004;
58: 167-76.
Miller KE, Sheetz MP. Axonal mitochondrial transport and potential are correlated. J Cell
Sci, 2004; 117: 2791-804.
Ming G-l, Henley J, Tessier-Lavigne M, Song H-j, Poo M-m. Electrical Activity Modulates
Growth Cone Guidance by Diffusible Factors. Neuron, 2001; 29: 441-52.
Mitchell PJ, Hanson JC, Quets-Nguyen AT, Bergeron M, Smith RC. A quantitative method
for analysis of in vitro neurite outgrowth. Journal of neuroscience methods, 2007; 164:
350-62.
Papakonstanti EA, Ridley AJ, Vanhaesebroeck B. The p110delta isoform of PI 3-kinase
negatively controls RhoA and PTEN. EMBO J, 2007; 26: 3050-61.

74
Price RD, Oe T, Yamaji T, Matsuoka N. A simple, flexible, nonfluorescent system for the
automated screening of neurite outgrowth. J Biomol Screen, 2006; 11: 155-64.
Recknor JB, Recknor JC, Sakaguchi DS, Mallapragada SK. Oriented astroglial cell growth
on micropatterned polystyrene substrates. Biomaterials, 2004; 25: 2753-67.
Ronn LC, Ralets I, Hartz BP, Bech M, Berezin A, Berezin V, Moller A, Bock E. A simple
procedure for quantification of neurite outgrowth based on stereological principles. Journal
of neuroscience methods, 2000; 100: 25-32.
Saadi W, Wang S-J, Lin F, Jeon N. A parallel-gradient microfluidic chamber for quantitative
analysis of breast cancer cell chemotaxis. Biomedical Microdevices, 2006; 8: 109-18.
Smeal RM, Rabbitt R, Biran R, Tresco PA. Substrate Curvature Influences the Direction
of Nerve Outgrowth. Annals of Biomedical Engineering, 2005; 33: 376.
Smit M, Leng J, Klemke RL. Assay for neurite outgrowth quantification. BioTechniques,
2003; 35: 254-6.
Sonigra RJ, Brighton PC, Jacoby J, Hall S, Wigley CB. Adult rat olfactory nerve ensheathing
cells are effective promoters of adult central nervous system neurite outgrowth in coculture.
Glia, 1999; 25: 256-69.
Sorensen A, Alekseeva T, Katechia K, Robertson M, Riehle MO, Barnett SC. Long-term
neurite orientation on astrocyte monolayers aligned by microtopography. Biomaterials, 2007;
28: 5498-508.
Tailby C, Wright LL, Metha AB, Calford MB. Activity-dependent maintenance and growth
of dendrites in adult cortex. Proc Natl Acad Sci U S A, 2005; 102: 4631-6.
Thompson DM, Buettner HM. Neurite outgrowth is directed by schwann cell alignment in
the absence of other guidance cues. Ann Biomed Eng, 2006; 34: 161-8.
Tran NH. Fracture orientation characterization: Minimizing statistical modelling errors.
Computational Statistics & Data Analysis, 2007; 51: 3187-96.

75
Walsh JF, Manwaring ME, Tresco PA. Directional Neurite Outgrowth Is Enhanced by En-
gineered Meningeal Cell-Coated Substrates. Tissue Engineering, 2005; 11: 1085-94.
Ward M, McCann C, DeWulf M, Wu JY, Rao Y. Distinguishing between directional guidance
and motility regulation in neuronal migration. J Neurosci, 2003; 23: 5170-7.
Weaver CM, Pinezich JD, Lindquist WB, Vazquez ME. An algorithm for neurite outgrowth
reconstruction. Journal of neuroscience methods, 2003; 124: 197-205.
Yuan X-B, Jin M, Xu X, Song Y-Q, Wu C-P, Poo M-M, Duan S. Signalling and crosstalk
of Rho GTPases in mediating axon guidance. Nat Cell Biol, 2003; 5: 38-45.
Zar JH. Biostatistical Analysis. Prentice-Hall: Englewood Cliffs, NJ, 1996.

Chapter 3
Multi-Molecular Gradients of
Permissive and Inhibitory Cues
Direct Neurite Outgrowth
Correct development of neuronal tracts requires the coordination of multiple permissive and
inhibitory signals. By generating an in vitro microenvironment using soft lithography and
microfluidic techniques, multiple guidance cues can be presented in a spatially defined way.
Here we evaluated how neurites of dorsal root ganglia neurons responded to permissive and
inhibitory cues presented by substrate-bound molecular gradients. Linear gradients contain-
ing inhibitory chondroitin sulfate proteoglycan (CSPG) and/or permissive laminin-1 (LN)
were generated as single-cue gradients, parallel double-cue gradients, and opposing double-
cue gradients with varying slopes. Neurite growth was analyzed using circular statistical
methods, and for all gradients examined, neurons extended neurites toward regions of lower
CSPG and higher LN concentrations. Single-cue gradients elicited similarly directed neurite
growth responses at the higher concentrations tested for both LN and CSPG, and both
gradient slope and fractional concentration change affected neurite growth. When the two
contrasting molecular cues were presented together, neurites responded differently depending
on the directions of the gradients. Neurite growth on LN-CSPG double gradients of oppo-
76

77
site direction was strongly directed, while neurite growth on LN-CSPG double gradients of
parallel direction was uniform. These results represent an important step towards under-
standing how neurite growth is guided by complex microenvironments containing multiple
molecular cues.
3.1 Introduction
A fundamental issue in developmental neuroscience is how growing axons find their way
to establish the myriad of specific connections of the nervous system. This question is also
critical to efforts toward promoting regrowth after injury, since regenerating axons re-express
many characteristics from development. Answers were initially suggested by Ramón y Cajal,
who posited that axons navigate by chemotaxis (Ramon y Cajal, 1892), and later by Sperry,
who suspected that gradients of specific molecules could guide axons (Sperry, 1963).
The existence of attractive and repulsive molecules in the nervous system has been es-
tablished experimentally, and it is largely accepted that the graded expression of guidance
molecules plays an important role in forming the precise wiring of the nervous system (Dick-
son, 2002; Tessier-Lavigne and Goodman, 1996). However, how growing axons respond to
gradients of guidance cues and integrate this information into a functional response is less
well understood. Theoretical models provide differing hypotheses on how axons read gradi-
ents to infer critical guidance characteristics, and experiments have found differing cellular
responses depending on the cell type and range of concentrations and slopes tested (Goodhill
and Baier, 1998; Goodhill and Urbach, 1999; Loschinger et al., 2000).
Experimental work has suggested that axons could be guided by a wide range of parameters
including the absolute molecular concentration, the gradient sign or direction, the gradient
shape, the gradient slope or slope, and the fractional change in concentration (Bagnard et
al., 2000; Halfter, 1996; Isbister et al., 2003; Rosentreter et al., 1998; Song et al., 1998;
von Philipsborn et al., 2006). Previous studies of axon guidance by gradients have largely
focused on examining diffusible gradients of soluble molecules such as neurotrophic factors,

78
semaphorins, and netrins (Bagnard et al., 1998; Bagnard et al., 2000; Kennedy et al., 1994;
MacLennan et al., 1997; Song et al., 1998). Recently, gradients of soluble cues have been
deposited on the surfaces of three-dimensional collagen gels (Rosoff et al., 2004). Many
diffusible molecules reside in vivo largely bound within tissues and matrix (Kennedy et al.,
1994; MacLennan et al., 1997). Thus, it is important to consider the direction of axon
growth by surface-bound gradients, including gradients of soluble molecules, extracellular
matrix molecules, and cell surface molecules. While axon guidance by discontinuous surface-
bound molecules has been characterized for a number of systems, typically using variations
of the stripe assay (Rosentreter et al., 1998; Snow and Letourneau, 1992), until recently it
has been difficult to generate reproducible continuous gradients of surface-bound molecules
in vitro. Recent studies have demonstrated the fabrication of molecular gradients with high
degrees of resolution and control over gradient parameters through microfluidic techniques,
achieving definition on the scale of hundreds of microns (Dertinger et al., 2002).
In this study, we used microfluidic techniques to create substrate-bound gradients of laminin-
1 (LN), of chondroitin sulfate proteoglycan (CSPG), and of the two cues presented simulta-
neously. LN is a well-established permissive guidance cue that is present in developing and
regenerating axonal tracts, and that can influence neurite direction and speed and reduce
neurite retraction (Luckenbill-Edds, 1997). CSPGs are strong inhibitors of neurite growth
that are present in boundary regions of the developing brain and in the glial scar and de-
generating nerve after injury (Hoke and Silver, 1996). We analyzed the growth of postnatal
rat dorsal root ganglion (DRG) neurons in response to permissive versus inhibitory cues, to
single versus multi-cue gradients, to changes in absolute versus fractional molecular concen-
tration, and to changes in gradient direction. The motivation for these studies is to gain a
more rigorous comprehension of how growing neurons interpret their complex extracellular
environment in which permissive and repulsive guidance molecules act in combination to
direct axonal growth.

79
3.2 Materials and Methods
3.2.1 Fabrication of gradient mixer
The microfluidic gradient mixers used to generate patterns of protein gradients (Figure 3.1a)
were fabricated using soft lithography and rapid prototyping. Gradient mixer masks were
designed using patterns modified from Dertinger et al. (Dertinger et al., 2002), and patterns
were transferred onto silicon wafers using photolithography. Gradient mixers were made by
fabricating poly(dimethylsiloxane) (PDMS) impression replicas of the pattern from the sili-
con wafer masters. Gradient mixers were then assembled by adhesion of PDMS microchan-
nels to glass surfaces. Patterns for photolithography were designed with AutoCAD LT 2004
(Autodesk Inc, San Rafael, CA) and printed on high resolution transparent film at 10,000 dpi
(CAD/Art Services, Inc., Bandon, OR). Standard photolithography techniques were used
to pattern substrates. Silicon wafers (Silicon Sense Inc, Nashua, NH) were coated with a
layer of negative tone Nano SU-8 50 photoresist (MicroChem, Newton, MA) by spin coating
with a CEE100 spinner (Brewer Science, Rolla, MO) in a two stage process: 1) spinning at
500rpm for 10sec with a ramp of 100rpm/sec, and 2) spinning at 2000rpm for 30sec with a
ramp of 300rpm/sec. Wafers were baked at 65°C for 6min, baked at 95°C for 20min, and
slowly cooled to 22°C. Photoresist was polymerized by UV exposure through the patterned
film with a Karl Suss mask aligner (MJB3 UV300) at 5.3 mW/cm2 for 1.1min. Wafers were
baked at 65°C for 2min, 95°C for 5min, and slowly cooled. Non-crosslinked photoresist was
dissolved with SU-8 Developer (MicroChem), and wafers were rinsed with isopropyl alco-
hol (IPA) and dried under nitrogen. Tridecafluoro-1,1,2,2-tetrahydrooctyl-1-trichlorosilane
(silane, United Chemical Technologies, Bristol, PA) was deposited under vacuum onto the
micropatterned wafers to prevent adhesion of the photoresist to the polydimethylsiloxane
(PDMS) during casting. Sylgard 184 PDMS elastomer base (Dow Corning, Midland, MI)
was mixed with Sylgard 184 PDMS curing agent at a 10:1 wt/wt ratio, degassed, poured
onto micropatterned wafers to a thickness of 1-2 mm, and cured at 95°C for 60min. PDMS
replicas of gradient mixer patterns were cut out and inlet and outlet holes were made using
a steel punch. PDMS substrate and a clean glass slide were plasma activated at 10.5 W for
80
60 sec with a plasma cleaner/sterilizer (PDC – 32 G, Med RF level, Harrick, Pleasantville,
NY), and brought together immediately after activation to form an irreversible seal. To pre-
vent the final gradient channel from bonding irreversibly to the glass slide, the final channel
was covered with a piece of PDMS while plasma activation occurred. Immediately following
plasma activation and bonding of the PDMS and glass, the microchannels were filled with
poly-L-lysine (pLL) solution (1mg/mL, MW 30-70kDa, Sigma, St. Louis, MO) and allowed
to adsorb for 4 hours. Channels were rinsed with dH2O to remove excess pLL, and protein
solutions to generate gradients were applied and stored hydrated at 4ºC overnight.
3.2.2 Generation of protein gradients
Table 3.1 lists the types of gradients generated for this study. Polyethylene tubes inserted
into the inlet and outlet ports were attached to 1mL syringes containing varying mouse
LN solutions (10μg/mL or 50μg/mL, Invitrogen, Carlsbad, CA) varying CSPG solutions
from embryonic chick brain (10μg/mL or 20μg/mL; Chemicon, Temecula, CA), and 3%
bovine serum albumin (BSA) in phosphate buffered saline (PBS). Single-cue gradients of
LN and CSPG were generated by delivering either protein solution into one inlet of the
microchannels, and BSA, a neutral molecule, into the second inlet of the microchannels
with a syringe pump set to a constant flow rate of 0.2μL/min. Double contrasting gradients
were generated in a similar manner using LN and CSPG solutions in the respective inlets
to the gradient mixer. Double parallel gradients were generated by adding both LN and
CSPG solutions to one inlet, and BSA to the second inlet of the gradient mixer. The
solutions were delivered over 12h to allow adsorption of the proteins onto the glass slide.
After adsorption of the protein gradient, the PDMS covering the final gradient channel was
cut and peeled from the substrate to expose the area over the final gradient channel for cell
culture. Gradient-containing substrates were stored in PBS at 4°C overnight.

81
Proteinsolution 2
Proteinsolution 1
Inlets
Gradientmixer
channels
Finalchannel
(a)
Outlet solution
(b)
(c)
(d)
(e)
Merge
Figure 3.1: Microfluidic gradient mixer generates linear substrate-bound protein gradients.(a) Schematic diagram of gradient mixer used to generate multiple gradient types. Dashedrectangle shows the region analyzed in b-e. (b,c) Fluorescent micrographs of the double-cueopposing gradient (LN50/CSPG10) channel stained with anti-LN (b) and with anti-CSPG(c) immunohistochemistry. Bar = 50μm. (d) Corresponding densitometric analysis of pixelintensity of anti-LN (solid line) and anti-CSPG (dotted line) immunohistochemistry forLN50/CSPG10 gradients. r=0.96 for anti-LN, r=0.97 for anti-CSPG. (e) Densitometricanalysis of double cue parallel gradient (LN50CSPG10/BSA) stained with anti-LN (solidline) and anti-CSPG (dotted line) immunohistochemistry. r=0.76 for both molecules.

82
Substratename (Inlet1/Inlet 2)
Gradient Type Inlet 1concentration(μg mL−1)
Inlet 2concentration(μg mL−1)
Slope (LN)(μg
mL−1 m−1)
Slope (CSPG)(μgmL−1
μm−1)
LN50 Uniformpermissive
50 50 0 N/A
LN10 Uniformpermissive
10 10 0 N/A
LN50/BSA Singlepermissive
50 30,000 0.2 N/A
LN10/BSA Singlepermissive
10 30,000 0.04 N/A
LN50/LN40 Singlepermissive
50 40 0.2 N/A
BSA/CSPG10 Singleinhibitory
30,000 10 N/A 0.08
BSA/CSPG20 Singleinhibitory
30,000 20 N/A 0.08
LN50/CSPG10 Doubleopposing
50 10 0.2 0.04
LN10/CSPG10 Doubleopposing
10 10 0.04 0.04
LN10/CSPG20 Doubleopposing
10 20 0.04 0.08
LN50CSPG10/BSADouble parallel 50, 10 30,000 0.2 0.04
Table 3.1: Gradients tested
3.2.3 DRG neuronal cell culture
All reagents were from Invitrogen unless otherwise specified. DRG were dissected from the
spinal columns of postnatal (P0-P4) rat pups and cleaned of axons, blood, and connective
tissue. DRG were incubated in 0.05% trypsin-EDTA in Hank’s balanced salt solution with-
out calcium or magnesium at 37˚C for 60min and dissociated by trituration. Cells were
plated at 2600 cells/cm2 in 2mL of serum-containing medium: Dulbecco’s Modified Eagle’s
Medium, 10% fetal bovine serum, 4mM L-glutamine, penicillin (100U/ml)/streptomycin
(100μg/ml) and 50ng/ml nerve growth factor (7S; Sigma). Cultures were incubated at 37°C
with 5% CO2 in a humidified environment for 24h.
3.2.4 Visualization of gradients and DRG neurons
Samples were fixed with 2% paraformaldehyde (Sigma) in PBS for 20min at room tempera-
ture, then rinsed with PBS. Nonspecific staining was blocked by incubating for 1h at room
temperature with 10% goat serum, 1% bovine serum albumin (Sigma), in PBS (blocking
buffer) with the addition of 0.1% Triton X-100 (VWR) for permeabilization. Antibody

83
against neurofilament (mouse monoclonal RT97, 1:200, Developmental Studies Hybridoma
Bank, Iowa City, IA) was used to visualize neurons, and antibodies against LN (rabbit
polyclonal, 1:500, Biomedical Technologies Inc, Stoughton, MA) and against CSPG (mouse
monoclonal CS56, 1:100, Sigma) were used to visualize the gradient. Following incubation
with primary antibody, samples were rinsed in PBS, reacted for 1h at room temperature
with appropriate secondary antibody (The Jackson Laboratory, Bar Harbor, ME) diluted
1:200 in blocking buffer, and rinsed in PBS. As a control, samples were processed without
incubation with primary antibody. Samples were examined on a Nikon Eclipse TE2000-S
microscope, equipped with phase-contrast and epifluorescence optics with appropriate filter
cubes. Images were captured using a Hamamatsu Orca-ER camera and Orbit shutter con-
troller (Improvision, Lexington, MA), outputting to OpenLab v4.0.2 (Improvision) running
on Mac OS v10.2. Contrast adjustments for visualization were performed using the level
function in Adobe Photoshop CS2.
3.2.5 Characterization of gradients
To quantify intensity changes across the gradients, comparative densitometry was performed
for all samples. Intensity values for ten positions across the channel were measured using
OpenLab. Intensity units were calibrated to a scale of 0-100% where 100% represents the
highest intensity observed on the substrate corresponding to the highest concentration of
molecule and 0% represents no fluorescence. Least-squares regression was used to fit a linear
trend line to the data. For this analysis we defined each molecular concentration as a fraction
of the initial concentration applied at the inlet of the gradient mixer, based on theoretical
mixing in the microchannels as described by the following equation, where C(t,x) is the
concentration at time t and at point x, D the diffusion coefficient in cm2/s, t the time in
s, l the width of the channel in μm, h the width of the initial distribution in m, and C0
the initial concentration in the channel in \mug/mL (Jeon et al., 2000). The slope of each
molecular gradient was defined as the change in molecular concentration per micrometer,
where the inlet concentration was taken to be the maximal protein concentration, according
to the method of Dertinger et al. (Dertinger et al., 2002). Fractional concentration change

84
was defined as the percent concentration change (concentration change/initial maximum
concentration) across the width of a typical DRG neuron growth cone, 10μm.
3.2.6 Quantification of cell response and statistical analysis
For quantification of cellular adhesion, each gradient substrate area was analyzed in five
parallel, longitudinal regions across the width of the final microchannel. Each longitudinal
region was 50μm wide and contained different concentrations of LN and CSPG. Cell adhesion
was measured by counting the number of cells in each region for each substrate tested.
A 2 test was used to test for uniformity of the cell adhesion pattern. The length and
angle of the longest neurite were measured for all neurons on the final gradient channel
for which the neurite did not contact another neuron. This method was adapted from
Dertinger et al., where the longest neurite was taken to represent the direction of neurite
orientation, as the longest neurite eventually becomes the axon of a polarized cell (Dertinger
et al., 2002). Kuiper’s test for uniformity was used to evaluate if directionality of neurite
growth occurred on gradient substrates, in contrast to the alternate hypothesis of random
uniform outgrowth in all directions. Descriptive statistics such as circular mean vectors
(with magnitude and direction components corresponding to clustering about the mean and
mean direction respectively) and standard deviation were then determined to approximate
the expected norm and spread in the neurite angle distribution. To characterize the overall
direction of neurite outgrowth, neurite angles were further categorized into three categories:
1) growth towards the permissive cue, defined by angles in the range of 240-360° and 0-60°,
2) vertical growth, defined by angles in the range of 60-120° and 240-300°, 3) growth towards
the inhibitory cue, defined by angles in the range of 120-240° (Figure 3.2c). To evaluate the
effect of fractional concentration change on neurite orientation, the entire channel width was
analyzed in 25 regions of 10 microns, the width of a typical growth cone, and the longest
neurite of each neuron in each region was analyzed. To evaluate the effect of slope on neurite
orientation, the angles of the longest neurites from neurons growing on protein gradients
of different slopes were grouped. To evaluate the effect of regional adhesion on neurite
orientation, the number of neurons adhered to each region of 10 microns was measured

85
and normalized to the total number of neurons on each substrate. To test for correlation
between variables, i.e. neurite angle versus 25 regions for fractional concentration change,
neurite angle versus inlet concentration for slope, and neurite angle versus regional adhesion,
circular-linear coefficient and the associated significance were calculated. Oriana software
(Anglesey, Wales) was used, and significance levels were taken to be p<0.05.
3.3 Results
3.3.1 Multi-molecular gradients generated
Protein gradients were first generated in solution by interdiffusion of adjacent laminar
streams in microchannels, then the soluble gradients were adsorbed onto glass substrates
coated with pLL to form substrate-bound gradients (Figure 3.1a). Laminar flow through
the microchannels allowed for slow interdiffusion of the two proteins with even mixing and
adsorption. Serial dilution and intermixing of multiple streams of varying concentrations
gave rise to a step gradient at the convergence point of the streams, which formed a smooth
gradient in the final channel. Gradients of varying slopes across the 250μm width of the
channel were generated by changing the concentration of protein added to the inlet channels.
Quantitative densitometry of immunofluorescence images of the gradient channel confirmed
shapes of the adsorbed protein gradients generated (Figure 3.1b-e).
3.3.2 Molecular concentration and slope affect neurite growth
DRG neurons adhered and extended neurites on gradients, and were identified as neurons
by immunocytochemistry for neurofilament (Figure 3.5d-f), which facilitated distinction of
the neurons from the few DRG-derived Schwann cells in the cultures. As a control, DRG
neurons cultured on uniformly coated LN coverslips were double immunostained with an-
tibodies RT97 (anti-neurofilament) and S100 (a stain for glia), and imaged under confocal
microscopy (Figure 3.2a). Distinct cell populations of neurons and glia were observed, as

86
°
90°
180°0°
Θ
L
°
°
°°
°°
°°
θ
Cell extension type
Type A Type B Non-neuronal
Pixe
l int
ensi
ty
0
200
400
600
800
1000
neurons neurons
* * *
cells
(a) (b)
(c)
10 10
10
10
7.5 7.5
7.5
7.5
5 5
5
5
2.5 2.5
2.5
2.5
0
90
180
2700
90
180
270
0
90
180
270
(d)
(e)
Figure 3.2: (a) Neurofilament and S100 double immunostaining allows identification of DRGneurons and non-neuronal cells in culture.Overlaid confocal images of DRG cultures cultured on uniform LN substrates double stainedwith anti-neurofilament and Cy2 secondary antibody to identify neurons (red, indicated byarrows) and anti-S100 and Cy3 secondary antibody to stain for Schwann cells (green, indi-cated by arrowheads). Scale bar = 20μm. (b) Quantitative densitometry allows identifica-tion of DRG neuronal subtypes and non-neuronal cells. Histogram shows pixel intensitiesof anti-neurofilament stained DRG cultures on uniform LN substrates containing neuronalsubtypes A, B and non-neuronal cells. *denotes statistical significance from all other groupsat p<0.05. (c) Analysis of directional growth of neurites by quantifying the longest neu-rite per neuron. Schematic shows method of neurite angle measurement and the rangeof angles categorized as neurites growing “towards” or “away from” permissive/inhibitorycues presented, or growth in a “vertical” direction. (d) Concentration of LN affects neuriteoutgrowth. Dissociated DRG neurons were cultured on substrates with varied LN concen-trations and corresponding slopes. Graph of mean neurite angles, rescaled from a 360º scaleto a 180º scale for the linear plot, where mean angle of 0-60º is defined as growth towardLN, 60-120º is defined as vertical growth, and 120-180º is defined as growth away from LN,as shown in (c). Square, LN10/BSA; Circle, LN50/BSA; Triangle, LN50/LN40.

87
shown by the minimal overlap between the neurofilament and S100 stains. Further, the mor-
phology of the neurofilament positive cells was much different than that of the S100 positive
cells, where the neurofilament positive cells were higher in the z-direction and S100 positive
cells were flatter, showing that neurons were morphologically distinct from other cell popu-
lations in our culture system (data not shown). Comparative densitometry of neurofilament
stained DRG images captured at constant exposure time showed that brightness of staining
with anti-neurofilament is significantly different between the processes of neuronal subtypes
A and B and non-neuronal cells (Figure 3.2b), allowing identification of neuronal versus
non-neuronal populations in DRG cultures studied. A comparison of neuronal response to
substrates presenting varying concentrations and slopes of LN showed that both these vari-
ables affected neurite growth (Table 3.2, Figure 3.2). When [LN]max applied was increased
from 10 μg mL−1 to 50 μg mL−1 and slope was held constant at 0.04μg mL−1μm−1, neurite
outgrowth was directed on both gradients (Kuiper’s test; p<0.05), but neurite distributions
were different. Where [LN]max applied was 50 μg mL−1 the angles were biased towards the
direction of increasing [LN]. For the samples where the [LN]max applied was 10 g mL-1 ,
neurites did not grow equally in all directions, but the mean of the distribution of neurite
angles was 98°. Closer examination of the circular histogram of the LN10/BSA data (Figure
3.3e) revealed two clusters of neurites that contributed to this result, suggesting bimodal-
ity. One cluster of neurites grew at an angle between 50° and 70°, and a smaller cluster of
neurites grew in the direction of 240°. Taken together with the entire distribution, these
two clusters led to the nonuniform neurite angle distribution, with the corresponding mean
vector of 98°. This distribution differed from the neurite angle distribution of LN50/BSA,
where the majority of neurites grew towards the direction of higher [LN] (Figure 3.3c). When
[LN]max was held constant at 50μg/ml and slope was increased from 0-0.04 μg mL−1μm−1„
the neurite angle distribution changed from uniform (Kuiper’s test; p>0.05) to oriented to-
ward higher [LN] (Kuiper’s test; p<0.05). When the slope was increased further to 0.2 μg
mL−1μm−1„ the neurite angles remained oriented toward higher [LN]. Examination of the
mean neurite angles on gradients with varying [LN] shows that for [LN]max > 20μg, neurite
angles were directed toward higher [LN] (Figure 3.2d).

88
(a) (b)
(c) (d)
30 30
30
30
20 20
20
20
10 10
10
10
90
180
2700
90
180
270
30 30
30
30
20 20
20
20
10 10
10
10
90
180
2700
90
180
270
30 30
30
30
20 20
20
20
10 10
10
10
0
90
180
2700
90
180
270
30 30
30
30
20 20
20
20
10 10
10
10
0
90
180
2700
90
180
270
30 30
30
30
20 20
20
20
10 10
10
10
0
90
180
2700
90
180
270
30 30
30
30
20 20
20
20
10 10
10
10
0
90
180
2700
90
180
270
(e)
30 30
30
30
20 20
20
20
10 10
10
10
0
90
180
2700
90
180
270
30 30
30
30
20 20
20
20
10 10
10
10
0
90
180
2700
90
180
270
0
90
180
270
(f)
LN50/BSA BSA/CSPG10
LN50/BSA BSA/CSPG10
LN10/BSA BSA/CSPG20
Figure 3.3: DRG neurite outgrowth on single-cue gradients is directed toward higher LN orlower CSPG concentration.Phase contrast micrograph of dissociated DRG neurons cultured for 24 hours on single-cue LN50/BSA (a) or BSA/CSPG10 (b) gradients shown under phase contrast microscopy.Bar = 50μm. Arrows show the vectors that were used to evaluate the neurites. Circularhistograms show the corresponding distributions of neurite angles on single-cue LN50/BSA(c), BSA/CSPG10 (d), LN10/BSA (e) or BSA/CSPG20 (f) gradients, where each anglepresented is the angle of the longest neurite per neuron. White arrows indicate mean neuriteangles for directed distributions; mean angles were not shown for uniform distributions.

89
LN10 uniform LN50 uniform LN10/BSA LN50/LN40 LN50/BSA
Slope (μg mL-1 μm-1) 0 0 0.04 0.04 0.2[LN]max applied (μg mL-1) 10 50 10 50 50Angle distribution uniform uniform directed directed directedMean angle (º) N/A N/A 98 4 23
Table 3.2: Concentration and slope of LN gradients affect neurite outgrowth.Maximum applied LN concentration and slope characteristic of each type of substrate areshown, with resulting neurite angle distribution and mean neurite angle.
3.3.3 Neurite outgrowth on single-cue gradients of contrasting cues
Neuronal growth was compared on single-cue gradients whose maximum concentrations of
guidance cues were previously shown to influence neuronal growth, i.e. 50μg/ml LN and
10μg/ml CSPG in the applied solution (Figure 3.3a-d). DRG neurons extended neurites on
both LN and CSPG single-cue gradients, and Kuiper’s uniformity test showed that in each
case the distribution of neurite angles was directed, either toward higher concentrations of
permissive LN on LN gradients, or toward lower concentrations of inhibitory CSPG on CSPG
gradients. Comparison of the distributions of the neurite angles on LN gradients versus on
CSPG gradients revealed that the two distributions were directed to a similar degree, and
the distributions were not significantly different from each other (mean direction of 23.4°
for LN gradient and 30.9° for CSPG gradient). Neurite growth was analyzed in response
to the fractional concentration change (dC/C) across the width of an average DRG growth
cone (10μm). On the LN single-cue gradients, as the concentration of LN decreased linearly
from 100% on the left side of the gradient channel to 0% on the right side, the fractional
concentration change increased exponentially from 0% on the left side to 100% on the right
side (Figure 3.4a). The CSPG single-cue gradients contained similar absolute and fractional
concentration profiles to the LN gradients, except that the left-to-right directions were re-
versed, since CSPG was infused through the right inlet and LN was infused through the left
inlet for gradient generation (Figure 3.4b). On the LN gradient, more neurites were directed
toward a higher LN concentration when they encountered the highest change in fractional
concentration (100% change), whereas in contrast on the CSPG gradient, more neurites were
directed toward a lower CSPG concentration when they encountered the lowest change in
fractional concentration (4% change) (Figure 3.4c). This differential response on the gra-

90
Region
1 2 3 4 5
Num
ber
ofce
lls
0
50
100
150
200
250
30050μg/mL LN10μg/mL LN
Region
1 2 3 4 5
Num
ber
ofce
lls
0
50
100
150
200
250
30010μg/mL CSPG20μg/mL CSPG
(a) (b)
Figure 3.4: Growth evaluated in context of fractional concentration change.(a,b) Fractional concentration change (dashed lines) is exponential for gradients of linearslope (solid lines). Change in concentration is expressed as the percent change in concen-tration over a 10μm region, across the channel width, for LN gradients with LN in inlet1 (a) and for CSPG gradients with CSPG in inlet 2 (b). (c) Graph of neurite outgrowthdirection in response to change in fractional concentration for single-cue gradients. Region1 corresponds to a fractional concentration change of 4% in LN and 100% in CSPG, whileregion 25 corresponds to a fractional concentration change of 100% in LN and 4% in CSPG.
dient substrate may contribute to bimodality in neurite angle distributions when analyzed
as a whole. The influence of the change in concentration of molecular cues was tested by
varying inlet concentration, thus generating gradients of different maximum concentrations
and corresponding different slopes. Neurite growth direction was affected by slope, such
that when the LN gradient slope decreased from 0.2μg/mL μm-1 to 0.04μg/mL/μm, the
mean direction of the distribution of neurite angles changed from 23.4° (toward increasing
LN concentration) to 98° (oriented in a vertical, non-preferential direction) (Figure 3.3c, e).
When the CSPG gradient slope was increased from 0.04μg/mL/μm, to 0.08μg/mL/μm, the
neurite angle distribution changed from directed to not significantly directed (0.05<p<0.1)
as tested by Kuiper’s test; however, the mean direction changed from 30.9° (toward decreas-
ing CSPG concentration) to 17.6° (more oriented toward decreasing CSPG concentration)
(Figure 3.3d, f).

91
3.3.4 Neuronal adhesion and neurite elongation on single-cue gradients
Cell adhesion patterns were also influenced by the type of cue and the protein gradients
presented. Higher total numbers of DRG neurons adhered to LN gradients than to CSPG
gradients. DRG neurons adhered preferentially to regions of the substrates that contained
higher permissive LN and lower inhibitory CSPG concentrations. A χ2 test for uniformity
demonstrated that DRG neuronal adhesion patterns were non-uniform on the LN and the
CSPG gradients (p<0.05), and there was a graded increase in adhesion along the LN gra-
dient in the direction of increasing LN concentration. In contrast, there was a threshold
response in adhesion along the CSPG gradient with relatively small increases in adhesion
in the direction of decreasing CSPG concentration until the final 1/5 of the channel width,
where the frequency of adhered cells doubled in the region containing the lowest CSPG con-
centration (Figure ??). Varying the slope of concentration gradients across the width of the
channel of the LN gradient elicited different cellular adhesion responses, but changes were
not seen in response to varying the slope of the CSPG gradient. Decreasing the slope of the
LN gradient from 0.2μg/mL/μm to 0.04μg/mL/μm, changed the DRG neuronal adhesion
pattern from non-uniform to uniform, but increasing the slope of the CSPG gradient from
0.04μg/mL/μm to 0.08μg/mL/μm, did not alter the cell adhesion patterns. Neurite elon-
gation on single-cue gradients was evaluated by measuring the mean length of the longest
neurite for all neurons observed. No significant difference in length of the longest neurite
was found between substrates of different slopes or different types of cues (Table 4). To
ensure that directional neurite outgrowth and adhesion patterns were not a consequence of
the physical dimensions of the microchannels or of residual flow patterns during the gradient
generation step, neuronal response on uniformly coated substrates of the same dimensions
were tested. The distributions of neurite angles and neuronal adhesion were uniform across
the channel width of uniform substrates.
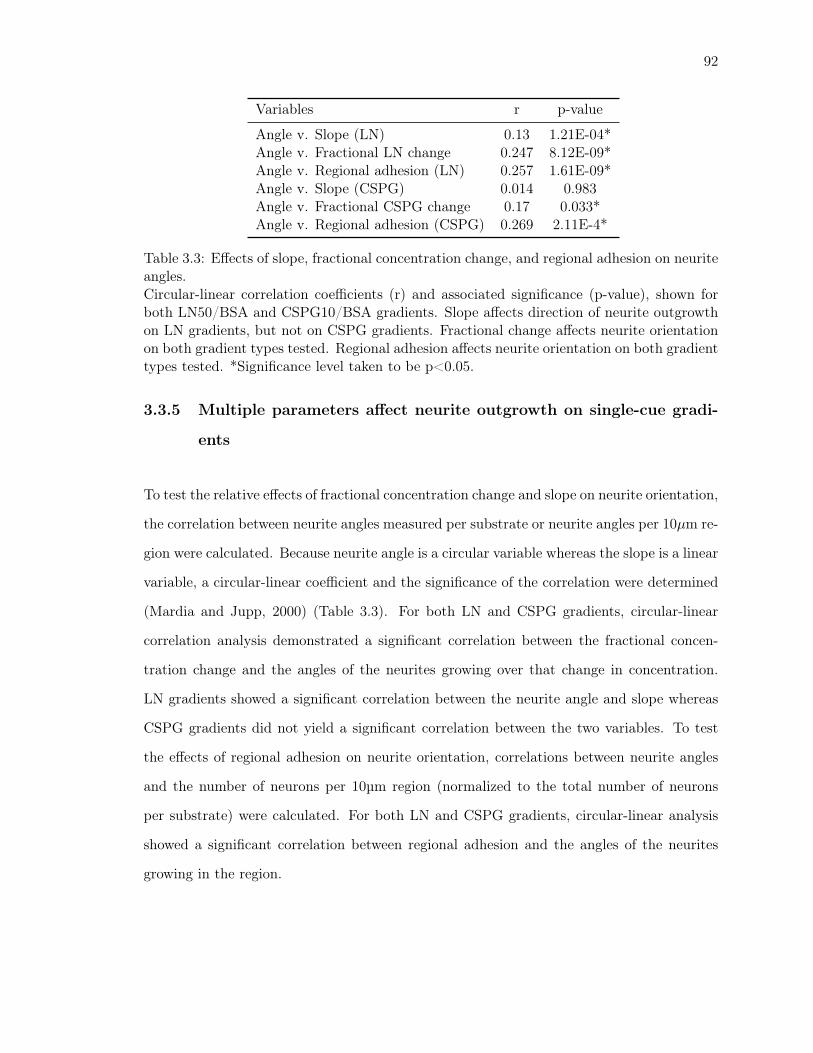
92
Variables r p-value
Angle v. Slope (LN) 0.13 1.21E-04*Angle v. Fractional LN change 0.247 8.12E-09*Angle v. Regional adhesion (LN) 0.257 1.61E-09*Angle v. Slope (CSPG) 0.014 0.983Angle v. Fractional CSPG change 0.17 0.033*Angle v. Regional adhesion (CSPG) 0.269 2.11E-4*
Table 3.3: Effects of slope, fractional concentration change, and regional adhesion on neuriteangles.Circular-linear correlation coefficients (r) and associated significance (p-value), shown forboth LN50/BSA and CSPG10/BSA gradients. Slope affects direction of neurite outgrowthon LN gradients, but not on CSPG gradients. Fractional change affects neurite orientationon both gradient types tested. Regional adhesion affects neurite orientation on both gradienttypes tested. *Significance level taken to be p<0.05.
3.3.5 Multiple parameters affect neurite outgrowth on single-cue gradi-
ents
To test the relative effects of fractional concentration change and slope on neurite orientation,
the correlation between neurite angles measured per substrate or neurite angles per 10μm re-
gion were calculated. Because neurite angle is a circular variable whereas the slope is a linear
variable, a circular-linear coefficient and the significance of the correlation were determined
(Mardia and Jupp, 2000) (Table 3.3). For both LN and CSPG gradients, circular-linear
correlation analysis demonstrated a significant correlation between the fractional concen-
tration change and the angles of the neurites growing over that change in concentration.
LN gradients showed a significant correlation between the neurite angle and slope whereas
CSPG gradients did not yield a significant correlation between the two variables. To test
the effects of regional adhesion on neurite orientation, correlations between neurite angles
and the number of neurons per 10μm region (normalized to the total number of neurons
per substrate) were calculated. For both LN and CSPG gradients, circular-linear analysis
showed a significant correlation between regional adhesion and the angles of the neurites
growing in the region.

93
Substrate n Mean length (μm) Standard deviation (μm)
LN 10 163 27.93 18.25LN50 135 45.03 44.12LN10/BSA 107 24.51 12.33LN50/BSA 434 28.74 18.71LN50/LN40 147 35.39 31.39BSA/CSPG10 136 16.36 6.89BSA/CSPG20 83 22.78 12.57LN10/CSPG10 31 41.70 63.42LN50/CSPG10 363 32.70 28.48LN50/CSPG20 75 27.73 32.46LN50CSPG10/BSA 82 30.44 16.21
Table 3.4: Neurite length is not affected by type of cue or by gradient slope. Mean andstandard deviation of length of longest neurite measured on all gradient substrates tested.
3.3.6 Neurite outgrowth on double-cue opposing gradients
Double-cue gradients were generated in which LN increased in concentration linearly from
right to left, and simultaneously, CSPG increased in concentration linearly from left to right
across the final channel width, by infusing LN into the left inlet and CSPG into the right
inlet of the same gradient mixer (Figure 3.1b-d). The DRG neuronal growth responses to
these double-cue opposing gradients were similar in orientation to the responses to single-cue
gradients of identical concentrations (Figure 3.5b, e, h, k – LN50/CSPG10). Mean neurite
direction was 340.6°, which was more directed toward increasing LN concentration and de-
creasing CSPG concentration than the mean directions for neurite growth on the single-cue
LN50/BSA and BSA/CSPG10 gradients (23.4° and 30.9°, respectively, see Figure 3.3c, d).
On double-cue opposing gradients of different slopes, DRG neuronal responses were also sim-
ilar to those on single-cue gradients, where neurite growth was vertical and non-preferential
on gradients with either decreased LN slope (from 0.2μg/mL/μm to 0.04μg/mL/μm) or
increased CSPG slope (from 0.2μg/mL/μm to 0.04μg/mL/μm) (Figure 3.5g-i). Similar to
neurite behavior on single-cue gradients, neurite length was not significantly different for
the double contrasting gradients tested (Table 3.4).

94
30 30
30
30
20 20
20
20
10 10
10
10
0
90
180
2700
90
180
270
30 30
30
30
20 20
20
20
10 10
10
10
0
90
180
2700
90
180
270
30 30
30
30
20 20
20
20
10 10
10
10
0
90
180
2700
90
180
270
30 30
30
30
20 20
20
20
10 10
10
10
0
90
180
2700
90
180
270
30 30
30
30
20 20
20
20
10 10
10
10
0
90
180
2700
90
180
270
30 30
30
30
20 20
20
20
10 10
10
10
0
90
180
2700
90
180
270
200
150
100
50
0
Num
ber
of c
ells
54321
Region
200
150
100
50
0
Num
ber
of c
ells
54321
Region
200
150
100
50
0
Num
ber
of c
ells
54321
Region
(a)(a) (b)(b) (c)(c)
(d)(d) (e)(e) (f)(f)
(g) (h) (i)
(j) (k) (l)
LN10/CSPG10 LN50/CSPG10 LN50/CSPG20
Figure 3.5: Neuronal response to double-cue opposing gradients.DRG neurons show preference for higher LN and lower CSPG concentrations on opposingdouble-cue gradients in both neurite outgrowth and adhesion patterns. (a-c) Phase contrastand (d-f) fluorescent images of DRG neurons stained with anti-neurofilament immunocy-tochemistry after 24 hours in culture on LN10/CSPG10 gradients (a, d), LN50/CSPG10gradients (b, e) and LN50/CSPG20 gradients (c, f). Arrows show vectors by which neuritesare evaluated. (g, i) Mean neurite angles (arrows) on circular histograms of neurite angleson LN10/CSPG10, LN50/CSPG20 gradients indicate angles directed toward the verticalaxis of the gradient channel (i.e. no directional preference). (h) Neurite angle distributionon LN50/CSPG10 gradient indicates preference towards direction of higher LN and lowerCSPG concentration. (j-k) Histogram of cell adhesion patterns analyzed in 5 regions of50μm width across the channel of LN10/CSPG10 (j), LN50/CSPG10 (k) and LN50/CSPG20(l) gradients. Cell adhesion patterns across opposing double-cue gradients changed whenslope was varied. Bar = 50μm.

95
3.3.7 Neuron adhesion patterns on double-cue opposing gradients
Adhesion patterns on LN50/CSPG10 gradient substrates were similar to those on single-
cue LN50/BSA gradient substrates, with a non-uniform distribution of cells across the mi-
crochannel width (p<0.05 by chi-squared test) and a graded decrease in cell number as the
concentration of LN decreased and the concentration of CSPG increased. By decreasing
the maximal concentration of LN applied or increasing the maximal concentration of CSPG
applied, (50μg/mL to 10μg/ml LN and 10μg/ml to 20μg/mL CSPG), cell adhesion was dra-
matically reduced (516 versus 91 cells and 516 versus 126 cells respectively). Decreasing only
the slope of the LN gradient (from 0.2μg/mL/μm to 0.04μg/mL/μm) resulted in similar cell
adhesion patterns across the microchannel, where a gradual decrease in cell number was
observed as the concentration of LN decreased and the concentration of CSPG increased
(Figure 3.5j-l). Increasing only the slope of the CSPG gradient (from 0.04μg/mL/μm to
0.08μg/mL/μm) changed the DRG neuronal adhesion pattern from uniform to non-uniform
(p=0.075).
3.3.8 Neuronal response to double-cue parallel gradient
A double-cue gradient was generated in which LN and CSPG both increased in concentra-
tion from right to left across the final channel width, by infusing LN and CSPG into the left
inlet and the neutral molecule BSA into the right inlet of the same gradient mixer. These
gradients were somewhat less linear than the double-cue opposing gradients (Figure 3.1e).
The DRG neuronal growth response to the double-cue parallel gradient (Figure 3.6) was
different from that to the double-cue opposing gradient (Figure 3.5). The neurite angle dis-
tribution was not directed on the parallel gradient (Figure 3.6b), in contrast to the directed
distribution on the opposing gradient. Neurite length was unaffected by the direction of the
protein gradients, with no significant difference between the two substrates tested (Table
3.4). Cellular adhesion was lower on the double-cue parallel gradient than on the double-cue
opposing gradient, even when the concentrations of the respective proteins were the same at
50μg/mL maximum LN and 10μg/mL maximum CSPG (141 cells on the parallel gradient

96
30 30
30
30
20 20
20
20
10 10
10
10
0
90
180
2700
90
180
270
30 30
30
30
20 20
20
20
10 10
10
10
0
90
180
2700
90
180
270
54321Region
60
50
40
30
20
10
0
Num
ber
of c
ells
(a) (b) (c)
Figure 3.6: Change in direction of gradients influences neurite angle and neuronal adhesionpatterns.(a) Phase contrast images of DRG neurons on double-cue parallel gradients ofLN50CSPG10/BSA after 24 hours in culture. Bar = 50μm. (b) The distribution of neuriteangles on parallel double-cue gradients is uniform as tested by Kuiper’s test for uniformity.(c) Adhesion patterns across the gradient channel width for LN50CSPG10/BSA double-cueparallel gradient are non-uniform.
versus 516 cells on the opposing gradient). The adhesion patterns were similar between the
two types of double-cue gradients, with a gradual decrease in cell adhesion across the width
of the microchannel toward region 5. Both distributions were non-uniform as determined
by a chi-squared uniformity test (Figure 3.6c).
3.4 Discussion
The main objective of this study was to analyze neurite outgrowth on molecular gradients
that varied in molecular type, molecular concentration, gradient direction, and gradient
slope. In previous studies, gradients containing a single guidance cue were generated by dif-
fusion from various source reservoirs over a given distance of a substrate, such as polymeric
membrane filter (Bagnard et al., 2000; Halfter, 1996) or hydrogels (Cao and Shoichet, 2001),
and most recently from patterned nanoliter sources (Rosoff et al., 2004). These methods have
been modified for covalent immobilization of the protein after gradient generation, by pho-
toimmobilization methods on hydrogels (Dodla and Bellamkonda, 2006). Our microfluidic
approach, modified from the method developed by Dertinger et al. (Dertinger et al., 2002),

97
provided several advantages in this study; (1) substrates were generated that contained re-
producible, linear gradients of protein concentration with micron-scale dimensions; (2) by
simply changing the types and concentrations of the inlet solutions, a wide variety of gradi-
ents were produced, including spatially well defined double-cue gradients, whose influence on
neurite outgrowth has not previously been investigated, and (3) exploiting the versatility of
this approach, we compared for the first time the effects of multiple molecular and gradient
parameters in the same study. Linear gradients over a distance of 250μm were generated
that contained specific combinations of the following molecules in substrate-bound form:
permissive LN, neutral BSA, and inhibitory CSPG. The single permissive, single inhibitory,
and double opposing gradients all directed the outgrowth of neurites from DRG neurons in
the direction of increasing LN concentration and of decreasing CSPG concentration. Neu-
ronal adhesion trends displayed corresponding preferences for higher LN and lower CSPG
concentrations. The single-cue gradients demonstrated similar strengths in their neurite
guidance abilities, regardless of the type of cue. The double opposing gradient displayed a
slightly stronger ability to direct neurites than the single gradients suggesting the possibility
that this gradient presentation may facilitate a slight synergism of the effects of these two
contrasting molecular cues. In contrast, when LN and CSPG were presented as a double
parallel gradient, the gradient did not direct neurite outgrowth, suggesting that the con-
trasting guidance effects of the permissive and inhibitory molecular cues counteracted each
other when concentrations of similar relative “strengths” were present in the same regions
for a parallel presentation.
Previous studies have suggested that neurite growth on gradients could be guided by nu-
merous parameters including the absolute molecular concentration, the gradient slope, the
fractional molecular concentration, and the gradient direction (Baier and Bonhoeffer, 1992;
Britland et al., 1996; Isbister et al., 2003; Rosentreter et al., 1998; Song et al., 1998). We
analyzed our data from single-cue gradient experiments in the context of the two models of
gradient detection: absolute change (to which we refer as slope) and fractional change in con-
centration. Within our system, the molecular concentration varied linearly across the 250μm
width of each gradient channel, as confirmed by immunofluorescence. Molecular concentra-

98
tion also varied between gradients of differing slopes. Fractional concentration change was
defined as the change in concentration over 10μm, the width of a typical DRG growth cone,
divided by the maximum molecular concentration along the gradient. Comparing growth
on single-cue gradients of permissive and inhibitory cues has shown that neurite orientation
is influenced by both slope and fractional change in concentration. Correlations between
neurite angle and the relative change in protein concentration of both models suggest that
fractional concentration change may play a larger role in orienting neurites, perhaps in part
through effects on adhesion.
The inclusion of an opposing cue in our system allowed us to determine whether additive
effects or synergism occurs when both permissive and inhibitory gradients are interpreted
simultaneously by a growth cone. Neuronal responses to the variations in relative gradi-
ent directions between the double-cue opposing gradients and double-cue parallel gradients
showed that the same combination of cues can elicit different neurite guidance and orienta-
tion responses when spatially patterned in different ways. Statistically significant differences
in neurite outgrowth direction and neuronal adhesion patterns in response to the concen-
tration, the gradient slope, and the gradient direction provide evidence that DRG neurons
respond to multiple substrate bound molecular cues by utilizing concentration, slope, and
directional information to make directional growth decisions.
Both LN and CSPG are present in the nervous system during development and after injury,
are co-localized in many regions (Kuecherer-Ehret et al., 1990; Tona et al., 1993), and
are important molecules for study because they play key roles in axon guidance. LN is
a glycoprotein localized in basement membrane and extracellular matrix. It can strongly
stimulate neuronal migration and neurite outgrowth, and its patterned expression during
development suggests its importance in axon guidance (Liesi et al., 1995; McLoon et al.,
1988). CSPGs are expressed in many regions of the developing nervous system that axons
avoid (Landolt et al., 1995; Oakley and Tosney, 1991; Snow et al., 1990), and CSPGs can
inhibit neurite growth in vitro (Condic, 2001; Snow and Letourneau, 1992; Tom et al.,
2004). The post-injury environment of the glial scar has been shown to express both LN
and CSPG, and the interactions of damaged axons with both molecules likely provide key

99
information to influence the potential for regeneration (Davies et al., 1999; Fitch et al.,
1999). Specifically, both growth-inhibiting and growth-promoting ECM molecules increase
simultaneously in reactive astroglia, thus the double cue parallel gradients mimic this in
vivo post-injury environment.
Early studies evaluated the effects of sharp borders of LN and CSPG on neurite growth
(Snow et al., 1990); subsequent work has presented the cues in gradient form, which is
relevant to their spatial distribution within the nervous system. Previous work has examined
the effect of single-cue LN gradients on axon guidance and neurite growth, with varying
results. Neurites from sympathetic neurons and DRG neurons have been demonstrated to
not orient in the direction of LN gradients (Dodla and Bellamkonda, 2006; McKenna and
Raper, 1988). Dertinger et al. found that LN gradients could orient initial axon polarization
from hippocampal neurons, but suggested that the gradient did not play a significant role in
guiding neurite outgrowth (Dertinger et al., 2002). In contrast, studies have shown guidance
of retinal axons by gradients of merosin (Halfter, 1996) and of neurites from DRG explants
by gradients of the IKVAV peptide (Adams et al., 2005). Our results for neurons plated
on single-cue LN gradients suggest that the graded presentation of substrate bound LN can
direct neurite growth. In the present study, the protein concentration ranges were chosen
from concentrations shown to affect neurite outgrowth after adsorption to a substrate. The
gradient shapes were linear, yielding varying fractional concentration changes across the
substrate. A larger range of fractional concentration changes was tested than in previous
studies: in the range of 0% change, corresponding to no gradient to 100% change where the
concentration doubles over the width of a growth cone. Other studies have reported neurite
turning and increased neurite outgrowth from culture on gradients with fractional changes
of 0.35-3.5% (Dodla and Bellamkonda, 2006; McKenna and Raper, 1988) and 10%(Adams
et al., 2005). For LN gradients in this study, the magnitude of fractional concentration
change affected the direction of neurite growth such that when the fractional concentration
change was 4% (Region 1 in our system), fewer neurites grew in the direction of higher
LN concentration, whereas when the fractional concentration change was 100% (Region 25
in our system), more neurites grew toward higher LN concentration. In general, neurites

100
on more shallow fractional concentration changes have been reported to be not oriented by
underlying LN gradients, while steeper fractional concentration changes resulted in growth
cone turning up a gradient.
Previous studies of axon guidance by proteoglycans have typically presented CSPG in com-
bination with a low concentration of LN, as CSPG is highly inhibitory to neurite outgrowth.
LN was excluded from the present experimental setup with a graded presentation of CSPG,
on which the neurite outgrowth response could be analyzed systematically. DRG neurons
showed preferential neurite outgrowth and adhesion patterns on single-cue CSPG gradients
that are consistent with the chemorepulsion associated with CSPG, i.e. directed away from
regions of higher CSPG concentration. CSPG functions can vary depending on what other
molecules are present in the surrounding local environment (Snow DM, 2002), i.e., the in-
hibitory effects of CSPG are reduced when CSPG is presented simultaneously with LN. In
response to simple parallel gradients of LN and the CSPG aggrecan, dystrophic endbulbs
were shown to enter regions containing LN and lower aggrecan concentration (Tom et al.,
2004). Snow et al. have reported that growth cones can grow onto and up increasing con-
centration steps of CSPG on a substrate (combined with a uniform low concentration of
LN) at concentrations that inhibit neurite growth when presented as a border (Snow and
Letourneau, 1992). Previously demonstrated effects of CSPG on LN conformation as well
as the increased expression of integrin receptors by neurons in response to CSPG speak to
the complexity of the interactions of these molecules as they influence neurite outgrowth
(Snow DM, 2002; Tom et al., 2004; Tona et al., 1993). In this study and others that include
two cues, the conformational presentation of the cues is expected to be influenced by steric
interactions, as both molecules are relatively large and CSPGs have an uneven negative
charge distribution depending on the structure of their GAG chains. However, while CSPG
has been hypothesized to inhibit axon growth by modulating the effects of LN by binding
to GAG binding sites (Snow DM, 2002), previous biochemical studies have suggested that
LN does not have a strong interaction with CSPGs, particularly when compared to heparin
sulfate proteoglycans (Herndon et al., 1999). In the present study, the orientation and adhe-
sion patterns of neurites and neurons of opposing double-cue gradients were consistent with

101
those on single-cue LN gradients, but the number of cells that adhered to the substrate was
lower when CSPG was introduced onto the substrates. For double-cue parallel gradients,
cell numbers were further reduced and the preference in directionality that neurites showed
for single permissive cue gradients and double opposing cue gradients was lost. These re-
sults suggest that the addition of CSPG modulates the guidance by LN but that the spatial
arrangement of these proteins is important in how this occurs.
The findings presented here provide new insights into the basic mechanisms of haptotactic
guidance and the neuronal mechanisms involved in sensing directional gradients of guidance
cues. These results show that DRG neurons can detect substrate bound gradients using two
gradient detection mechanisms that are the topics of much study: slope and fractional con-
centration change. This study shows that in response to double-cue gradients, DRG neurons
can incorporate information that includes the concentration, the gradient direction, and the
gradient slope and suggests that the growth cone may have a shifting internal baseline for
comparing more than one cue to the external environment. Many studies have focused on
response to single guidance cues to evaluate the mechanisms by which neurons read gradi-
ents; this work indicates that the introduction of more than one cue likely presents complex
interactions between cues that further affect neurite outgrowth. Studying both single cue
and double cue gradients allows us to conceptually deconstruct the complex environment of
the glial scar to study the individual and combined effects of the cues present in concentra-
tion gradients. In future studies it will be of interest to investigate how the parameters in a
complex system of multiple molecular, spatially defined, overlapping gradients are integrated
and are transduced through downstream signaling pathways. The roles of such factors as
neuron type and protein type will also be important to evaluate. This work is important
for understanding the mechanisms of growth cone navigation and directed axon growth and
guidance to enhance strategies for neurite growth promotion for nerve regeneration.

102
3.5 Acknowledgements
The authors thank Elise Cheng and Julie Richardson for assistance with gradient experi-
ments, and Elizabeth Deweerd and Helen Buettner for helpful discussion of the manuscript.
This work was funded by the Charles H. Hood Foundation and an NSF CAREER grant to
DHK.
3.6 References
Adams DN, Kao EYC, Hypolite CL, Distefano MD, Hu W, Letourneau PC. Growth cones
turn and migrate up an immobilized gradient of the laminin IKVAV peptide. Journal of
Neurobiology, 2005; 62: 134-47.
Bagnard D, Lohrum M, Uziel D, Puschel AW, Bolz J. Semaphorins act as attractive and
repulsive guidance signals during the development of cortical projections. Development,
1998; 125: 5043-53.
Bagnard D, Thomasset N, Lohrum M, Puschel AW, Bolz J. Spatial distributions of guidance
molecules regulate chemorepulsion and chemoattraction of growth cones. J Neurosci, 2000;
20: 1030-5.
Baier H, Bonhoeffer F. Axon guidance by gradients of a target-derived component. Science,
1992; 255: 472-5.
Britland S, Perridge C, Denyer M, Morgan H, Curtis A, Wilkinson C. Morphogenetic guid-
ance cues can interact synergistically and hierarchically in steering nerve cell growth. Exp
Biol Online, 1996; 1.
Cao X, Shoichet MS. Defining the concentration gradient of nerve growth factor for guided
neurite outgrowth. Neuroscience, 2001; 103: 831-40.
Condic ML. Adult Neuronal Regeneration Induced by Transgenic Integrin Expression. J.
Neurosci., 2001; 21: 4782-8.

103
Davies Y, Lewis D, Fullwood NJ, Nieduszynski IA, Marcyniuk B, Albon J, Tullo A. Pro-
teoglycans on normal and migrating human corneal endothelium. Exp Eye Res, 1999; 68:
303-11.
Dertinger SKW, Jiang X, Li Z, Murthy VN, Whitesides GM. Gradients of substrate-bound
laminin orient axonal specification of neurons. PNAS, 2002; 99: 12542-7.
Dickson BJ. Molecular mechanisms of axon guidance. Science, 2002; 298: 1959-64.
Dodla MC, Bellamkonda RV. Anisotropic scaffolds facilitate enhanced neurite extension in
vitro. J Biomed Mater Res A, 2006; 78: 213-21.
Fitch MT, Doller C, Combs CK, Landreth GE, Silver J. Cellular and molecular mechanisms
of glial scarring and progressive cavitation: in vivo and in vitro analysis of inflammation-
induced secondary injury after CNS trauma. J Neurosci, 1999; 19: 8182-98.
Goodhill GJ, Baier H. Axon guidance: stretching gradients to the limit. Neural Comput,
1998; 10: 521-7.
Goodhill GJ, Urbach JS. Theoretical analysis of gradient detection by growth cones. J
Neurobiol, 1999; 41: 230-41.
Halfter W. The Behavior of Optic Axons on Substrate Gradients of Retinal Basal Lamina
Proteins and Merosin. J. Neurosci., 1996; 16: 4389-401.
Herndon ME, Stipp CS, Lander AD. Interactions of neural glycosaminoglycans and proteo-
glycans with protein ligands: assessment of selectivity, heterogeneity and the participation
of core proteins in binding. Glycobiology, 1999; 9: 143-55.
Hoke A, Silver J. Proteoglycans and other repulsive molecules in glial boundaries during
development and regeneration of the nervous system. Prog Brain Res, 1996; 108: 149-63.
Isbister CM, Mackenzie PJ, To KC, O’Connor TP. Gradient slope influences the pathfinding
decisions of neuronal growth cones in vivo. J Neurosci, 2003; 23: 193-202.

104
Kennedy TE, Serafini T, de la Torre JR, Tessier-Lavigne M. Netrins are diffusible chemotrophic
factors for commissural axons in the embryonic spinal cord. Cell, 1994; 78: 425-35.
Kuecherer-Ehret A, Graeber MB, Edgar D, Thoenen H, Kreutzberg GW. Immunoelectron
microscopic localization of laminin in normal and regenerating mouse sciatic nerve. J Neu-
rocytol, 1990; 19: 101-9.
Landolt RM, Vaughan L, Winterhalter KH, Zimmermann DR. Versican is selectively ex-
pressed in embryonic tissues that act as barriers to neural crest cell migration and axon
outgrowth. Development, 1995; 121: 2303-12.
Liesi P, Hager G, Dodt HU, Seppala I, Zieglgansberger W. Domain-specific antibodies
against the B2 chain of laminin inhibit neuronal migration in the neonatal rat cerebellum.
J Neurosci Res, 1995; 40: 199-206.
Loschinger J, Weth F, Bonhoeffer F. Reading of concentration gradients by axonal growth
cones. Philos Trans R Soc Lond B Biol Sci, 2000; 355: 971-82.
Luckenbill-Edds L. Laminin and the mechanism of neuronal outgrowth. Brain Res Brain
Res Rev, 1997; 23: 1-27.
MacLennan AJ, McLaurin DL, Marks L, Vinson EN, Pfeifer M, Szulc SV, Heaton MB, Lee
N. Immunohistochemical localization of netrin-1 in the embryonic chick nervous system. J
Neurosci, 1997; 17: 5466-79.
Mardia K, Jupp P. Directional Statistics 2nd ed. John Wiley and Sons Ltd: Chichester,
England, 2000.
McKenna MP, Raper JA. Growth cone behavior on gradients of substratum bound laminin.
Dev Biol, 1988; 130: 232-6.
McLoon SC, McLoon LK, Palm SL, Furcht LT. Transient expression of laminin in the optic
nerve of the developing rat. J. Neurosci., 1988; 8: 1981-90.

105
Oakley RA, Tosney KW. Peanut agglutinin and chondroitin-6-sulfate are molecular markers
for tissues that act as barriers to axon advance in the avian embryo. Dev Biol, 1991; 147:
187-206.
Ramon y Cajal S. La rétine des vertébrés. Van In: Lierre, Belgium, 1892.
Rosentreter SM, Davenport RW, Loschinger J, Huf J, Jung J, Bonhoeffer F. Response of
retinal ganglion cell axons to striped linear gradients of repellent guidance molecules. J
Neurobiol, 1998; 37: 541-62.
Rosoff WJ, Urbach JS, Esrick MA, McAllister RG, Richards LJ, Goodhill GJ. A new chemo-
taxis assay shows the extreme sensitivity of axons to molecular gradients. Nat Neurosci,
2004; 7: 678-82.
Snow DM, Lemmon V, Carrino DA, Caplan AI, Silver J. Sulfated proteoglycans in astroglial
barriers inhibit neurite outgrowth in vitro. Experimental Neurology, 1990; 109: 111.
Snow DM, Letourneau PC. Neurite outgrowth on a step gradient of chondroitin sulfate
proteoglycan (CS-PG). J Neurobiol, 1992; 23: 322-36.
Snow DM SJ, Gurwell JA. Binding characteristics of chondroitin sulfate proteoglycans and
laminin-1, and correlative neurite outgrowth behaviors in a standard tissue culture choice
assay. Journal of Neurobiology, 2002; 51: 285-301.
Song H, Ming G, He Z, Lehmann M, McKerracher L, Tessier-Lavigne M, Poo M. Conversion
of neuronal growth cone responses from repulsion to attraction by cyclic nucleotides. Science,
1998; 281: 1515-8.
Sperry RW. Chemoaffinity In The Orderly Growth Of Nerve Fiber Patterns And Connec-
tions. Proc Natl Acad Sci U S A, 1963; 50: 703-10.
Tessier-Lavigne M, Goodman CS. The molecular biology of axon guidance. Science, 1996;
274: 1123-33.
106
Tom VJ, Steinmetz MP, Miller JH, Doller CM, Silver J. Studies on the Development and
Behavior of the Dystrophic Growth Cone, the Hallmark of Regeneration Failure, in an In
Vitro Model of the Glial Scar and after Spinal Cord Injury. J. Neurosci., 2004; 24: 6531-9.
Tona A, Perides G, Rahemtulla F, Dahl D. Extracellular matrix in regenerating rat sciatic
nerve: a comparative study on the localization of laminin, hyaluronic acid, and chondroitin
sulfate proteoglycans, including versican. J Histochem Cytochem, 1993; 41: 593-9.
von Philipsborn AC, Lang S, Loeschinger J, Bernard A, David C, Lehnert D, Bonhoeffer F,
Bastmeyer M. Growth cone navigation in substrate-bound ephrin gradients. Development,
2006; 133: 2487-95.

Chapter 4
Optimization of combinatorial protein
gradients for neurite outgrowth
Presentation of guidance molecules in an anisotropic manner has been shown to guide grow-
ing axons by chemotaxis. Here we evaluated the influence of specific parameters such as
molecular concentration, slope and direction of combinatorial laminin (LN) and chondroitin
sulfate proteoglycan (CSPG) gradients on dorsal root ganglia neurons. Linear combina-
torial gradients were generated using a microfluidic gradient mixing device. We analyzed
the growth of postnatal rat dorsal root ganglion neurons in response to permissive versus
inhibitory cues in multiple spatial presentations of gradients. Neuronal adhesion and neurite
growth were analyzed after 24 hour culture on various double-cue gradients. Slopes were
shown to exhibit a nonlinear relationship with cellular adhesion. Slope of LN showed a
linear correlation with neurite length while the slope of CSPG showed nonlinear correlations
with neurite length. The directionality of neurite outgrowth was evaluated using circular
statistical methods to determine the influence of the underlying gradients on neurite angles
of outgrowth. Optimization of inlet concentrations of molecular gradients was performed,
and maximizing LN while minimizing CSPG concentrations over the concentration ranges
tested was shown to maximize cellular adhesion and length. Addition of Rho kinase inhibitor
Y27632 significantly increased neurite length as compared to controls on opposing double
107

108
cue LN/CSPG gradients. The motivation for these studies is to gain a more rigorous compre-
hension of how growing neurons interpret their complex extracellular environment in which
permissive and repulsive guidance molecules act in combination to direct axonal growth.
These results represent an important step towards understanding how neurite growth is
guided by complex microenvironments containing multiple molecular cues.
4.1 Introduction
Promotion of neuron growth and direction of neurite outgrowth are primary goals in the
development of strategies for nerve repair. These goals also address a fundamental issue
in developmental neurobiology to understand how neurons sense and respond to changes in
their extracellular environment. Anisotropic distribution of guidance cues has been identified
as one important way in which guidance cues can direct growth, by exploiting the differential
response of growth cones (Bellamkonda, 2006). The existence of attractive and repulsive
guidance molecules in a graded fashion has been observed in vivo both in the developing
nervous system and the glial scar after injury. In addition, the response of neurons to these
gradients has been studied in in vivo and in vitro models, and it is largely accepted that
the graded expression of guidance molecules plays an important role in forming the precise
wiring of the nervous system (Gurdon and Bourillot, 2001), and can be used as a possible
strategy to overcome the inhibition of the post-injury environment.
However, the specific gradient parameters that strongly influence neurite growth are less
well understood. Previous theoretical (Goodhill and Urbach, 1999) and experimental studies
(Bagnard et al., 2000; von Philipsborn et al., 2006) have suggested that a range of gradient
parameters influence neurite growth including: direction, shape, slope or relative changes in
concentration, and absolute molecular concentration. Gradients generated by microfluidic
methods offer greater levels of precision, spatial and temporal control, the ability to quantify
gradient parameters, and the ability for quantitative cellular analysis on the single cell level,
which allow us to better investigate these gradient parameters (reviewed by Keenan and
Folch (Keenan and Folch, 2008)).

109
Combinatorial gradients have been studied previously as it was recognized that these exist
in vivo. Experimental work with combinatorial gradients of nerve growth factor (NGF),
neurotrophin-3 (NT-3) and brain-derived neurotrophic factor (BDNF) (Cao and Shoichet,
2003), semaphorins 3A and 3C (Bagnard et al., 2000), BDNF and LN (Wang et al., 2008),
and aggrecan and LN (Tom et al., 2004) have shown that combinatorial gradients are able
to elicit differential growth responses depending on the combinations of proteins presented.
In this study we examine the effects of multiple combinatorial protein gradients on DRG
neuron and neurite growth to determine the optimal spatial presentations of protein gra-
dients to direct neurite outgrowth and promote cellular adhesion and neurite outgrowth.
The two molecules used in this study are LN, a well-established permissive guidance cue
that is present in developing and regenerating axonal tracts (Buettner and Pittman, 1991)
and CSPGs, strong inhibitors of neurite growth that are present in boundary regions of the
developing brain and in the glial scar (Lemons et al., 2005). These molecules were chosen
as strong promoters and inhibitors of neurite growth in the post-injury microenvironment.
Here we show that DRG adhesion and neurite outgrowth respond differentially to differ-
ent features of protein gradients presented, showing complex responses to substrate bound
combinatorial protein gradients.
Further, strategies to overcome the inhibition present in the glial scar primarily from proteo-
glycans, were also explored in this study, including enzymatic digestion of inhibitory chon-
droitin sulfate chains with chondroitinase ABC (chABC) and the application of a pharma-
cological inhibitor to Rho kinase, Y27632. Digestion of glycosaminoglycan chains (Lemons
et al., 2003) and inhibition of glycosaminoglycan chain polymerization (Laabs et al., 2007)
have been shown to decrease the inhibition of CSPG. Modulating Rho kinase activity has
been shown to modulate neurite outgrowth on CSPG substrates(Jain et al., 2004). In this
study we show that inhibition of Rho kinase can affect neurite outgrowth, mitigating the
inhibitory effects of CSPG, on opposing LN/CSPG gradients.

110
4.2 Materials and methods
Unless otherwise stated, all materials were purchased from Sigma-Aldrich (St. Louis, MO).
4.2.1 Substrate fabrication
Microfluidic gradient mixers were used to generate patterns of protein gradients. These
devices were fabricated using photolithography and soft lithography. Masks containing pat-
terns of gradient mixers were designed with modifications from Dertinger et al. (Dertinger
et al., 2002), and described further in Li et al. (Li et al., 2008). Patterns were transferred to
silicon wafers using photolithography. Poly dimethyl siloxane (PDMS; Dow Corning) was
mixed 10:1 elastomer:curing agent and cast onto silicon wafers to produce a replica. Gradi-
ent mixers were then assembled by adhesion of PDMS microchannel molds to glass surfaces
after plasma activation (PDC-32 G, High RF level, Harrick, Pleasantville, NY). Gradient
mixers were coated with poly-L-lysine (100μg/mL, MW 30-70kDa) and incubated at 4°C
overnight.
Protein solutions were prepared for injection by syringe pump through the gradient mixer.
Mouse LN solutions (10μg/mL to 50μg/mL, Invitrogen, Carlsbad, CA), CSPG solutions
from embryonic chick brain (1μg/mL to 20μg/mL; Chemicon, Temecula, CA), and/or 3%
bovine serum albumin (BSA) in 0.1M phosphate buffered saline (PBS) were applied at the
inlets of the gradient mixer.
To test the effects of the core protein of the proteoglycans on neurite outgrowth, enzymatic
treatment of CSPG with chABC was performed to digest the chondroitin sulfate chains of
CSPG, leaving the core protein. CSPG solutions (10μg) were treated with 0.05U chABC
(units defined as the quantity of the enzyme that catalyzes the formation of 1 μmol of
unsaturated disaccharide from chondroitin sulfate C per minute) in 50mM Tris-HCl, 0.15M
NaCl, 3uM aprotinin, 20mM benzamidine, 1mM leupeptin, 1mM pepstatin A (Tris buffer)
by incubation at 37°C for 3 hours prior to injection into the gradient mixer. Enzymatically

111
digested solutions of 10μg/mL CSPG and 50μg/mL LN were applied in gradient mixer inlets
to generate opposing gradients, as described above.
Protein solutions were delivered over 12h to allow adsorption of the proteins onto the glass
slide. After adsorption of the protein gradient, the PDMS covering the final gradient channel
was cut and peeled from the substrate to expose the area over the final gradient channel for
cell culture. Gradient-containing substrates were stored in PBS at 4°C overnight.
4.2.2 DRG cell culture
DRG were dissected from the spinal columns of postnatal (P0-P4) rat pups and cleaned of
axons, blood, and connective tissue. DRG were incubated in 0.05% trypsin-EDTA in Hank’s
balanced salt solution without calcium or magnesium (Invitrogen, Carlsbad, CA) at 37˚C
for 60min and dissociated by trituration. Cells were plated at 2600 cells/cm2 in 2mL of
serum-containing medium: Dulbecco’s Modified Eagle’s Medium, 10% fetal bovine serum,
4mM L-glutamine, penicillin (100U/ml)/streptomycin (100μg/ml) (Invitrogen, Carlsbad,
CA) and 50ng/ml nerve growth factor (7S). Cultures were incubated at 37°C with 5% CO2
in a humidified environment for 24h.
To test the effects of Rho kinase activity on modulating the inhibition of neurite outgrowth
by CSPG gradients, Y27632 was added to DRG cultures on double cue gradients containing
LN gradients of -0.2μg/mL/μm and CSPG gradients of 0.04μg/mL/μm. After an initial in-
cubation time of 1 hour for plating (37°C, 5% CO2), 50μl of either pharmacological inhibitor
or culture media was added to the DRG cultures. ROCK inhibitor Y27632 was used at a
concentration of 10μM (Borisoff et al., 2003; Fournier et al., 2003; Yuan et al., 2003). Cells
were incubated (37°C, 5% CO2) for an additional 23 hours for a total of 24 hours.
4.2.3 Microscopy and Image analysis
Samples were examined on a Nikon Eclipse TE2000-S microscope, images were captured
using a Hamamatsu Orca-ER camera and Orbit shutter controller (Improvision, Lexington,

112
MA), outputting to OpenLab v4.0.2 (Improvision) running on Mac OS v10.2. Contrast
adjustments for visualization were performed using the level function in Adobe Photoshop
CS2.
Total cellular adhesion on the final microchannel presenting the protein gradients was ana-
lyzed. All cell bodies fixed and imaged at 24 hours after cell seeding were counted. Duplicate
samples were performed and analyzed. Neurite outgrowth was analyzed by evaluation of the
length of the longest neurite. Neurites longer than the length of a soma, and that did not
come into contact with another cell were included in this analysis. OpenLab software was
used to determine the average longest neurite length. The ruler tool was used to measure
the length of the process from the point on the soma where the process began to the tip
of the neurite visible under phase contrast microscopy. The direction of neurite outgrowth
was analyzed by the angle of the process outgrowth from the vertical (y) axis as measured
by the ruler tool in the OpenLab software.
4.2.4 Data analysis
Each experimental group contained duplicate samples, with a minimum of 10 measures per
condition. Results are shown as the mean ± standard error.
Gradient slope was calculated for each protein gradient generated by calculating the concen-
tration change across the gradient channel and dividing by the width of the gradient channel.
To test the influence of the slope of LN and CSPG gradients on DRG responses, the slope
of either LN or CSPG was held constant in magnitude, while the slope of the other protein
gradient was varied. Each dataset thus has gradients of both molecules present, but for
comparison across the dataset, slope of only one molecular gradient is varied to determine
the individual effects of the molecular gradient of interest.
Experimentally, LN solutions were applied from the left inlet port of the gradient mixer,
whereas CSPG solutions were applied from either the left or right inlet port. For analysis
of DRGs on constant CSPG slope with varying LN slope, the magnitude of CSPG slope

113
was held constant, and for the substrates where CSPG solutions were applied from the left
inlet port, the gradient calculations and neurite angle measurements were transformed to
allow our reference frame to denote a positive CSPG slope of 0.04μg/mL/μm. The gradient
mixer design is symmetrical, and as the magnitude of CSPG does not change, and the
serial dilution and mixing undergone by the CSPG solutions are the same, the gradient
calculations only reflect a change in sign.
To test the effects of gradient slope on cellular adhesion and neurite length, statistical
analysis was performed using one-way ANOVA testing and post-hoc analysis using Tukey’s
test for multiple comparison using SPSS 14.0 (SPSS, Inc., Chicago, IL). Data were plotted
on bar graphs and differences between substrates tested within each dataset were analyzed
for statistical significance.
To test the effects of gradient substrates on directional neurite growth, statistical analysis
was performed with circular statistical methods. Circular histograms are presented that
wrap a linear 0◦-180◦ scale around a circle, and show the mean direction. To determine
if the substrates elicited directional growth versus random uniform outgrowth, Rao’s spac-
ing tests were performed. To determine if direction of neurite outgrowth differed between
substrates, the multisample Mardia-Watson-Wheeler test was performed. All circular tests
were performed with Oriana 2.0 (Kovach Computing Services).
To test the effects of gradient direction on DRG response, data was grouped into the sub-
strate types that we defined as “opposing” or “parallel” (Li et al., 2008), where opposing
gradients presented LN and CSPG gradients in opposite directions, and parallel gradients
presented LN and CSPG gradients in the same direction. Statistical analysis was performed
on Design-Expert 7 (Stat-Ease). Input factors of LN and CSPG slopes for opposing and
parallel gradients were used at two levels (high/low) in a statistical model based on two-way
ANOVA, with response factors of cellular adhesion and neurite length.
Optimization with the ANOVA statistical model was also performed to determine the opti-
mal input values of LN and CSPG slopes within the experimental range for maximal cellular
adhesion and maximal neurite length using Design-Expert 7. As the statistical model for
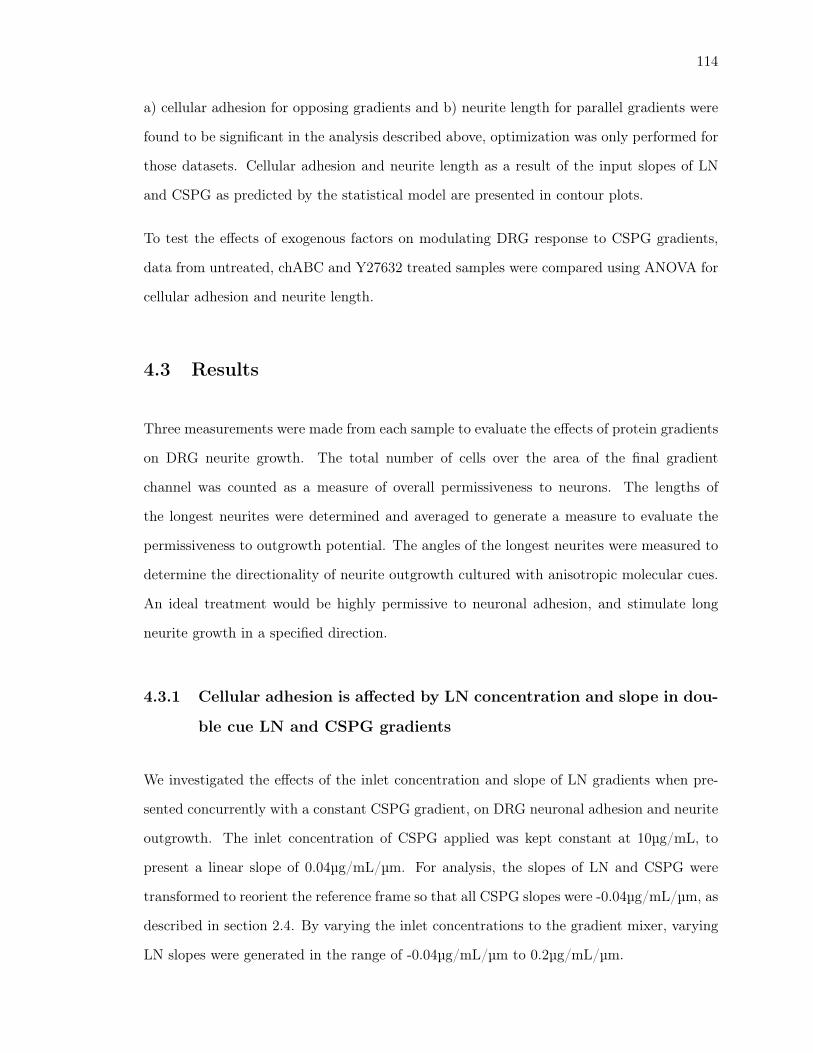
114
a) cellular adhesion for opposing gradients and b) neurite length for parallel gradients were
found to be significant in the analysis described above, optimization was only performed for
those datasets. Cellular adhesion and neurite length as a result of the input slopes of LN
and CSPG as predicted by the statistical model are presented in contour plots.
To test the effects of exogenous factors on modulating DRG response to CSPG gradients,
data from untreated, chABC and Y27632 treated samples were compared using ANOVA for
cellular adhesion and neurite length.
4.3 Results
Three measurements were made from each sample to evaluate the effects of protein gradients
on DRG neurite growth. The total number of cells over the area of the final gradient
channel was counted as a measure of overall permissiveness to neurons. The lengths of
the longest neurites were determined and averaged to generate a measure to evaluate the
permissiveness to outgrowth potential. The angles of the longest neurites were measured to
determine the directionality of neurite outgrowth cultured with anisotropic molecular cues.
An ideal treatment would be highly permissive to neuronal adhesion, and stimulate long
neurite growth in a specified direction.
4.3.1 Cellular adhesion is affected by LN concentration and slope in dou-
ble cue LN and CSPG gradients
We investigated the effects of the inlet concentration and slope of LN gradients when pre-
sented concurrently with a constant CSPG gradient, on DRG neuronal adhesion and neurite
outgrowth. The inlet concentration of CSPG applied was kept constant at 10μg/mL, to
present a linear slope of 0.04μg/mL/μm. For analysis, the slopes of LN and CSPG were
transformed to reorient the reference frame so that all CSPG slopes were -0.04μg/mL/μm, as
described in section 2.4. By varying the inlet concentrations to the gradient mixer, varying
LN slopes were generated in the range of -0.04μg/mL/μm to 0.2μg/mL/μm.

115
A
Substrates
BSA/LN10CSPG10
LN10/CSPG10BSA/LN20CSPG10
LN20/CSPG10BSA/LN50CSPG10
LN50/CSPG10
Num
ber
of c
ells
0
20
40
60
80
100
120
Substrates
BSA/LN10CSPG10
LN10/CSPG10BSA/LN20CSPG10
LN20/CSPG10BSA/LN50CSPG10
LN50/CSPG10
B
Neu
rite
leng
th (μ
m)
0
10
20
30
40
50* + #* + #
Figure 4.1: Effects of varyng LN concentration (LN10-50) and slope (-0.04 to 0.2μg/mL/μm)presented simulataneously with -0.04μg/mL/μm CSPG gradients (CSPG10) on cellular ad-hesion(A) and neurite length (B). *, +, # denote significantly different groups (p<0.05). Data
represents mean ±SEM for n=2 samples.
The inlet concentrations and slope of LN significantly affected cellular adhesion as tested
by ANOVA (p<0.05). Cellular adhesion was maximized, at 107 cells, on LN50/CSPG10
substrates, corresponding to the steepest negative slope tested, -0.2 μg/mL/μm (Figure
4.1a). Post-hoc analysis with Tukey’s test showed that the number of cells adhered onto the
LN50/CSPG10 substrate was significantly different from cell numbers on BSA/LN10CS10,
LN10/CSPG10 and LN20/CSPG10. Neurite length was not found to be significantly dif-
ferent on substrates with varying CSPG slope using ANOVA (p=0.512), with all neurite
lengths in the range of 22.9 μm to 33.5μm (Figure 4.1b).
A comparison of the neurite angle distributions of the longest neurites on substrates with
varying LN slopes and constant CSPG slope, showed that negative LN slopes (0.04, 0.08
and 0.2μg/mL/μm) elicited directed neurite outgrowth (Figure 4.2). A transformed positive
LN slope of 0.08μg/mL/μm was also able to direct neurites to a vertical orientation (6°).
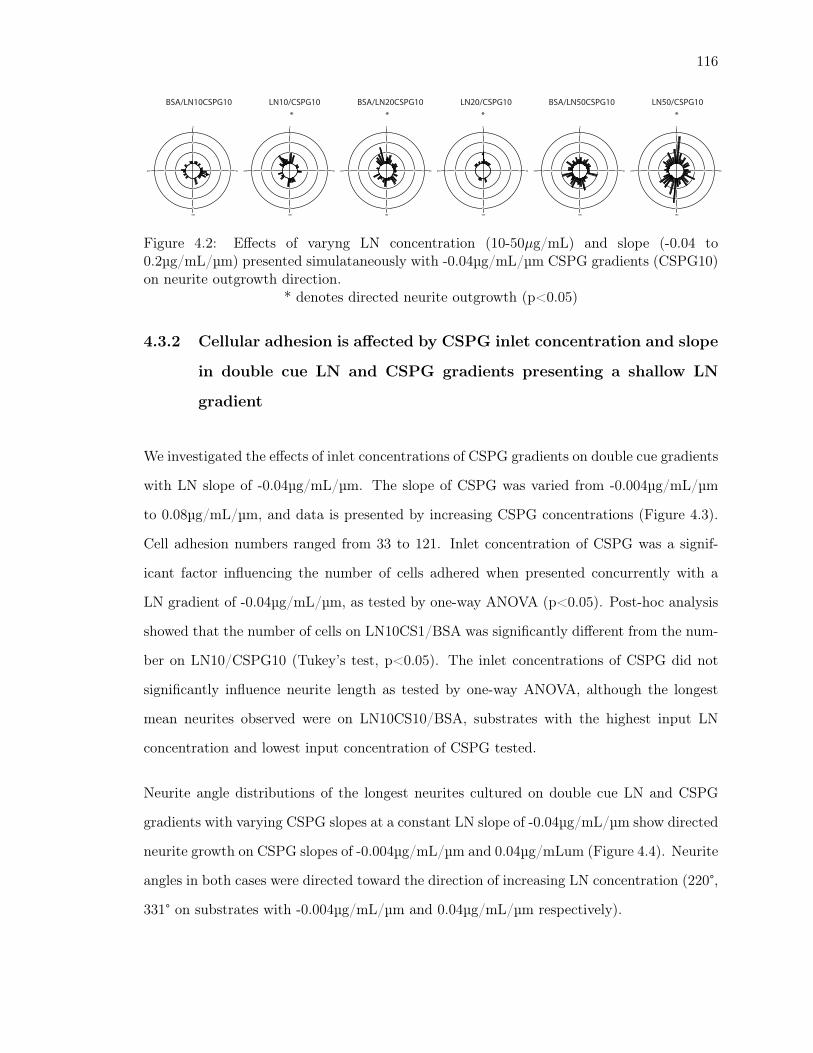
116
15 15
15
15
10 10
10
10
5 5
5
5
0
90
180
27015 15
15
15
10 10
10
10
5 5
5
5
0
90
180
27015 15
15
15
10 10
10
10
5 5
5
5
0
90
180
270 15 15
15
15
10 10
10
10
5 5
5
5
0
90
180
270 15 15
15
15
10 10
10
10
5 5
5
5
0
90
180
270 15 15
15
15
10 10
10
10
5 5
5
5
0
90
180
270
BSA/LN10CSPG10 BSA/LN50CSPG10BSA/LN20CSPG10LN10/CSPG10 LN50/CSPG10LN20/CSPG10
* * **
Figure 4.2: Effects of varyng LN concentration (10-50μg/mL) and slope (-0.04 to0.2μg/mL/μm) presented simulataneously with -0.04μg/mL/μm CSPG gradients (CSPG10)on neurite outgrowth direction.
* denotes directed neurite outgrowth (p<0.05)
4.3.2 Cellular adhesion is affected by CSPG inlet concentration and slope
in double cue LN and CSPG gradients presenting a shallow LN
gradient
We investigated the effects of inlet concentrations of CSPG gradients on double cue gradients
with LN slope of -0.04μg/mL/μm. The slope of CSPG was varied from -0.004μg/mL/μm
to 0.08μg/mL/μm, and data is presented by increasing CSPG concentrations (Figure 4.3).
Cell adhesion numbers ranged from 33 to 121. Inlet concentration of CSPG was a signif-
icant factor influencing the number of cells adhered when presented concurrently with a
LN gradient of -0.04μg/mL/μm, as tested by one-way ANOVA (p<0.05). Post-hoc analysis
showed that the number of cells on LN10CS1/BSA was significantly different from the num-
ber on LN10/CSPG10 (Tukey’s test, p<0.05). The inlet concentrations of CSPG did not
significantly influence neurite length as tested by one-way ANOVA, although the longest
mean neurites observed were on LN10CS10/BSA, substrates with the highest input LN
concentration and lowest input concentration of CSPG tested.
Neurite angle distributions of the longest neurites cultured on double cue LN and CSPG
gradients with varying CSPG slopes at a constant LN slope of -0.04μg/mL/μm show directed
neurite growth on CSPG slopes of -0.004μg/mL/μm and 0.04μg/mLum (Figure 4.4). Neurite
angles in both cases were directed toward the direction of increasing LN concentration (220°,
331° on substrates with -0.004μg/mL/μm and 0.04μg/mL/μm respectively).

117
A B
Figure 4.3: Effects of varyng CSPG concentration (CSPG1-20) and slope (-0.004 to0.08μg/mL/μm) presented simulataneously with -0.04μg/mL/μm LN gradients (LN10) oncellular adhesion
(A) and neurite length (B). * denotes significantly different groups (p<0.05). Datarepresents mean ±SEM for n=2 samples.
15 15
15
15
10 10
10
10
5 5
5
5
0
90
180
270 15 15
15
15
10 10
10
10
5 5
5
5
0
90
180
27015 15
15
15
10 10
10
10
5 5
5
5
0
90
180
270 15 15
15
15
10 10
10
10
5 5
5
5
0
90
180
270
LN10CSPG1/BSA LN10CSPG5/BSA LN10/CSPG10 LN10/CSPG20
* *
Figure 4.4: Effects of varyng CSPG concentration (CSPG1-20) and slope (-0.004 to0.08μg/mL/μm) presented simulataneously with -0.04μg/mL LN gradients (LN10) on neu-rite outgrowth direction.
* denotes directed neurite outgrowth (p<0.05)

118
A B
Figure 4.5: Effects of varyng CSPG concentration (1-20μg/mL) and slope (-0.004 to0.08μg/mL/μm) presented simulataneously with -0.2μg/mL LN gradients (LN50) on cel-lular adhesion
(A) and neurite length (B). * denotes significantly different groups (p<0.05). Datarepresents mean ±SEM for n=2 samples.
4.3.3 Neurite length is affected by CSPG inlet concentration and slope in
double cue LN and CSPG gradients presenting a steep LN gradient
We investigated the effects of inlet concentration of CSPG on double cue gradients with
LN slope of -0.2μg/mL/μm. The slope of CSPG was varied from -0.004μg/mL/μm to 0.08
μg/mL/μm and data is presented by increasing CSPG concentrations. The effect of CSPG
inlet concentrations on cellular adhesion was not significant, as tested by one-way ANOVA.
CSPG inlet concentrations significantly affected neurite length when presented concurrently
with a LN gradient of -0.2μg/mL/μm (Figure 4.5) as tested by one-way ANOVA (p<0.05).
Post-hoc analysis showed that mean neurite length on CSPG gradients with slopes of -
0.004μg/mL/μm was significantly different from neurite length on substrates with CSPG
slopes of 0.2μg/mL/μm on substrates presenting steep LN gradients (Tukey, p<0.05).
Neurite angle distribution on substrates with CSPG slope of -0.02μg/mL/μm to 0.04μg/mL/μm
was directed as shown from Rao’s spacing test (Figure 4.6). These correspond to double
cue parallel gradients and lower CSPG inlet concentrations applied, suggesting that slope of
CSPG gradients play a role in directing neurite outgrowth. Neurite outgrowth was directed
either vertically or toward higher LN concentrations.

119
LN50CSPG1/BSA LN50CSPG5/BSA LN50/CSPG10 LN50/CSPG20
* **
25 25
25
25
20 20
20
20
15 15
15
15
10 10
10
10
5 5
5
5
0
90
180
270 25 25
25
25
20 20
20
20
15 15
15
15
10 10
10
10
5 5
5
5
0
90
180
270 25 25
25
25
20 20
20
20
15 15
15
15
10 10
10
10
5 5
5
5
0
90
180
270 25 25
25
25
20 20
20
20
15 15
15
15
10 10
10
10
5 5
5
5
0
90
180
270
Figure 4.6: Effects of varyng CSPG concentration (1-20μg/mL) and slope (-0.004 to0.08μg/mL/μm) presented simulataneously with -0.2μg/mL/μm LN gradients (LN50) onneurite outgrowth direction.
* denotes directed neurite outgrowth (p<0.05)
4.3.4 The relationship between cellular adhesion and neurite length
To optimize the presentation of protein gradients, the goal is to maximize both cellular
adhesion and neurite length. Figure 4.7 shows adhesion and length normalized as a percent-
age of the maximal value in the dataset. By varying the inlet concentrations and slopes of
LN, cellular adhesion was maximized on LN50/CSPG10, whereas neurite length was maxi-
mized on LN10CSPG10/BSA substrates. As cellular adhesion was found to be significantly
affected by slope and neurite length was not from previous analysis, LN50/CSPG10 ap-
peared to be the optimal substrate for neurite outgrowth when the CSPG slope is presented
at -0.04μg/mL/μm. By varying the inlet concentrations and slopes of CSPG, with both
LN gradients tested (-0.04μg/mL/μm and -0.2μg/mL/μm), the lowest CSPG concentration
applied yielded maximal cellular adhesion and longest neurite outgrowth.
Presenting the data as a scatterplot enabled curve fitting to interpolate local maxima and
minima of responses with given input parameters (Figures 4.8). Cellular adhesion showed
similar and non-linear responses to the slope of protein gradients, with regression lines
described by third-order equations showing the best fit. Local maximum of cellular adhesion
for substrates with CSPG slope of 0.04μg/mL/μm was found for a LN slope 0.18μg/mL/μm.
Local minimum of cellular adhesion for the same substrate was found for a LN slope of -
0.05μg/mL/μm. The absolute maximum of cellular adhesion on this substrate over the
slopes tested was on the LN slope of -0.2μg/mL/μm. For substrates with LN slopes of -0.04

120
Figure 4.7: Comparison of cellular adhesion and neurite length as a normalized fraction ofmaximum adhesion and outgrowth of each dataset(A) varied LN slope, (B) varied CSPG slope on -0.04μg/mL/μm LN (LN10), (C) variedCSPG slope on -0.2μg/mL/μm LN (LN50). Black bars denote adhesion and gray bars
denote length of longest neurite.
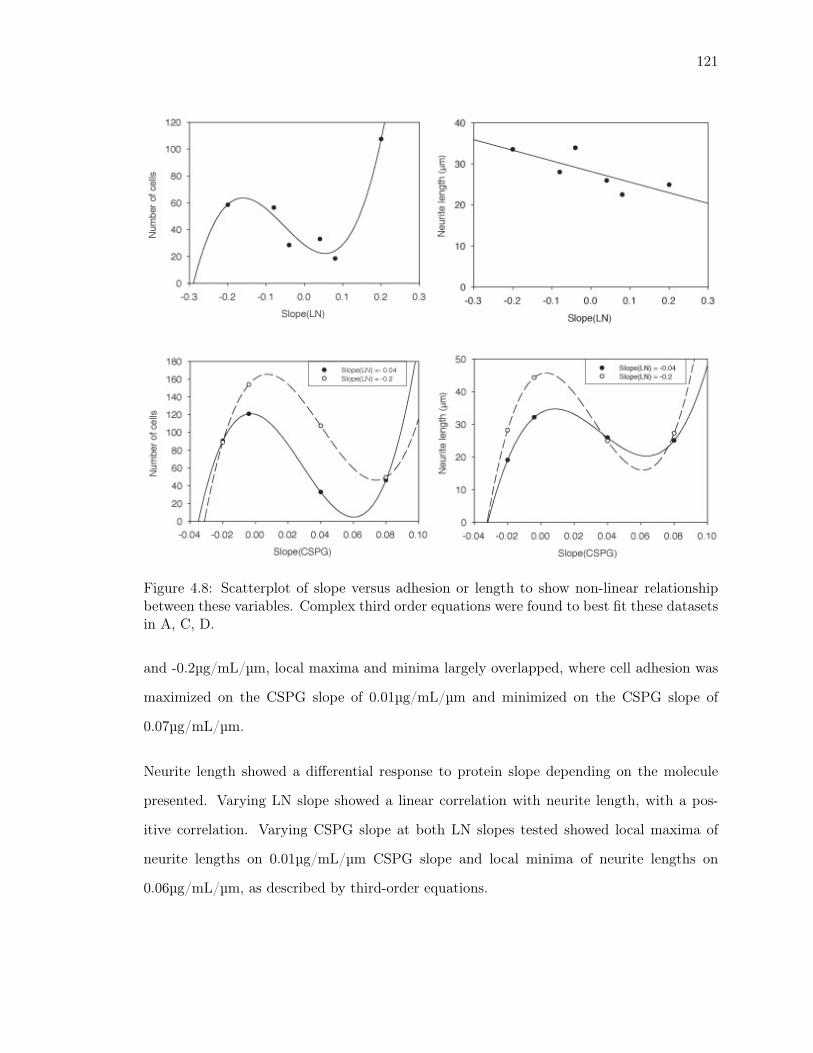
121
Figure 4.8: Scatterplot of slope versus adhesion or length to show non-linear relationshipbetween these variables. Complex third order equations were found to best fit these datasetsin A, C, D.
and -0.2μg/mL/μm, local maxima and minima largely overlapped, where cell adhesion was
maximized on the CSPG slope of 0.01μg/mL/μm and minimized on the CSPG slope of
0.07μg/mL/μm.
Neurite length showed a differential response to protein slope depending on the molecule
presented. Varying LN slope showed a linear correlation with neurite length, with a pos-
itive correlation. Varying CSPG slope at both LN slopes tested showed local maxima of
neurite lengths on 0.01μg/mL/μm CSPG slope and local minima of neurite lengths on
0.06μg/mL/μm, as described by third-order equations.

122
Opposing gradientsCellular adhesion
Parallel gradientsNeurite length
Term % Contribution p-value %Contribution p-valueANOVA 100 0.0406 100 0.0024A-LN 38.92642 0.0326 32.43936 0.0080B-CSPG 12.83397 0.1390 58.622 0.0023AB 33.13242 0.0415 not selected N/A
Table 4.1: Contribution of each input parameter (LN or CSPG) to ANOVA model
4.3.5 LN and CSPG concentrations elicit differential effects on neurite
outgrowth dependent on gradient direction
Substrates tested could also be sorted by the direction of the gradient presented. For these
double cue gradients, opposing gradients or parallel gradients can be generated. Cellular
adhesion was significantly affected by the inlet concentrations of LN and CSPG on substrates
presenting opposing gradients, and was not significantly affected by these concentrations on
parallel gradients. Neurite length was significantly affected by the inlet concentrations of LN
and CSPG on substrates presenting parallel gradients, as tested by ANOVA, and was not
significantly affected by these concentrations on opposing gradients. Equations below show
the multiple regression model used to describe the relationship between inlet concentration
and cellular adhesion on opposing gradients (Equation 4.1) and inlet concentration and
neurite length on parallel gradients (Equation 4.2). Table 4.1 shows the contributions of
each molecule to DRG responses.
Adhesion = 59.13 + 19.38A − 11.13B − 17.88(A ∗ B) (4.1)
ln(Length) = 3.38 + 0.18A − 0.24B (4.2)

123
Opposing gradients Parallel gradientsLN (μg/mL) 50 50CSPG (μg/mL) 10 1Adhesion 87.07 154Length (μm) 25.76 45.12Desirability (average of % maximumof adhesion and length)
0.537 0.844
Table 4.2: Optimized double cue gradients
4.3.6 Optimization of LN and CSPG slope to maximize cellular adhesion
and neurite outgrowth
Using the solver function in Design Expert 7, the solutions that maximize cellular adhesion
and neurite length from the ANOVA model were found by an iterative process and plotted
on a contour plot over the ranges of input parameters bound by the high/low levels tested in
the screening model. The optimal inlet concentrations are listed in Table 4.2. The contour
plots show the predicted number of cells and neurite length for all given ranges of LN and
CSPG slope, from interpolation of the ANOVA model. Figure 4.9A shows the nonlinear
response of cellular adhesion to double cue opposing gradients of LN and CSPG, where over
the ranges of LN concentrations tested (10μg/mL to 50μg/mL), 20μg/mL LN slope appears
to be a threshold below which cellular adhesion is unresponsive to CSPG slope presented,
and above which the slope of CSPG has a much larger effect on adhesion. Figure 4.9B shows
the linear response of neurite length on double cue parallel gradients of LN and CSPG, where
as LN slope is maximized and CSPG slope is minimized, neurite length is maximized.
4.3.7 Effects of treatments against inhibitory CSPG on neurite outgrowth
on double cue LN and CSPG gradients
In comparisons between untreated, chABC, and Y27632 treated cultures of DRG on LN50/CSPG10
gradients, cellular adhesion on these substrates were not significant different from each other
(Figure 4.10). Neurite length on Y27632 treated samples was significantly greater than
neurite lengths on untreated and chABC treated samples, as tested by oneway ANOVA
(57.64μm versus 24.93 μm on untreated controls). The untreated controls elicited directed
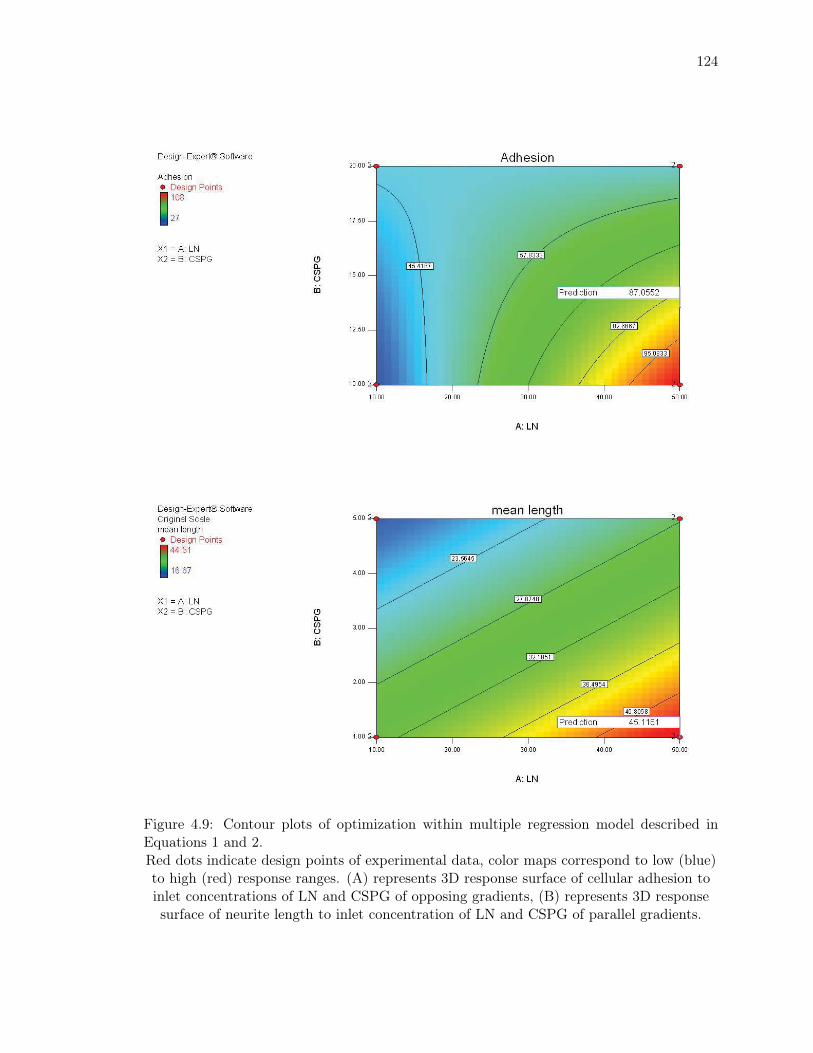
124
Figure 4.9: Contour plots of optimization within multiple regression model described inEquations 1 and 2.Red dots indicate design points of experimental data, color maps correspond to low (blue)to high (red) response ranges. (A) represents 3D response surface of cellular adhesion toinlet concentrations of LN and CSPG of opposing gradients, (B) represents 3D responsesurface of neurite length to inlet concentration of LN and CSPG of parallel gradients.

125
15 15
15
15
10 10
10
10
5 5
5
5
0
90
180
270 15 15
15
15
10 10
10
10
5 5
5
5
0
90
180
270 15 15
15
15
10 10
10
10
5 5
5
5
0
90
180
270
*
Figure 4.10: Addition of exogenous factors chABC and Y27632 affects neurite length onmultimolecular gradients.Cellular adhesion (A) and neurite length (B) on opposing LN50/CSPG10 gradients afterthe enzymatic digestion of CSPG with chABC, and addition of Y27632, a Rho kinaseinhibitor. Untreated controls are included as a comparison. (C) shows neurite angle
distribution on chABC, Y7632 treated samples and untreated controls. Data representsmean ±SEM for n=2 samples.
neurite growth towards the areas of higher LN concentration, while samples treated with
chABC and Y27632 showed neurite outgrowth in all random directions.
4.4 Discussion
The present study uses combinations of substrate bound linear gradients of LN and CSPG
to examine the neurite promoting effects of specific features of protein gradients such as
molecular concentration, and concentration change, corresponding to slope and gradient

126
direction. Gradients generated by microfluidic methods offer several advantages, the most
useful being the ability to create predictable, reproducible linear protein gradients with
precise spatial control over the scale of hundreds of microns (reviewed in (Keenan and Folch,
2008)). Gradient parameters are easily controlled by varying inlet concentrations and ports
used during the solution injection process through the microfluidic device. Linear adsorbed
gradients do not change over the timescale of cell culture used in these studies. DRG cells
were seeded at low density and analyzed only if they were not in contact with other cells in
order to isolate the effects of the gradients from other cell-cell guidance mechanisms.
Previous studies have used LN concentrations ranging from 1 g/cm2 (Buettner and Pittman,
1991) to 100μg/mL (Hammarback et al., 1985), and CSPG concentrations ranging from 3-
5μg/mL (Snow et al, 2000) to 100 μg/mL (Hynds and Snow, 2001) in studies investigating
selective adhesion of neurons to substrates. Laminin, a basement membrane associated gly-
coprotein, was chosen as a candidate molecule for neurite guidance, found in embryonic
development and peripheral nerve. CSPG, a heterogeneous class of extracellular matrix
molecules, have a complex role in the development of the nervous system, with both stimu-
latory and inhibitory effects (Lemons et al., 2005). CSPGs from embryonic chick brain used
in this study, have been shown to be inhibitory in vitro to DRG growth (Snow, 1994; Snow
et al., 2003).
The purpose of this study was to determine if key measures of growth promotion: adhe-
sion, neurite length and direction, were affected by molecular concentration, slope of each
molecular gradient, or gradient direction in combinatorial gradients of LN and CSPG. The
data show that for cellular adhesion, slope of LN and CSPG gradients appeared to have a
large effect. For neurite extension, the slope of CSPG had an effect only when steep LN
gradients were concurrently presented. This suggests that CSPG gradients play a larger role
in adhesion than extension, where inhibition occurs regardless of the slope of LN presented.
For the direction of neurite outgrowth, molecular concentration appeared to have a large
effect, showing that a combination of molecular concentration and anisotropy is most effec-
tive for directing neurite growth in a particular direction. A comparison of the relationship
between neurite adhesion and length showed that for combinatorial gradients, optimal values

127
of slope and direction do not necessarily coincide to maximize both adhesion and length.
This suggests that promoting adhesion and neurite extension may be regulated by different
guidance mechanisms. This is also supported by findings from Dou and Levine (Dou and
Levine, 1995), where cerebellar granule neurons were observed to attach equally well to
the LN coated surfaces and the LN-glycosaminoglycan coatings, but neurite outgrowth was
largely inhibited. Local maxima and minima for adhesion and neurite length were identified
to find the optimal LN and CSPG slopes individually over the ranges tested in this study.
Non-linear relationships between slope of LN and CSPG and adhesion showed a complex
relationship.
Combinations of guidance molecules have been tested and shown to have synergistic effects
on neurite outgrowth. Neurotrophic factor combinations of NGF, GDNF and CNTF were
found to have a synergistic effect on neurite extension (Deister and Schmidt, 2006). The
optimal concentration of all three factors applied in combination corresponded to the opti-
mum concentration of individual factors (50ng/mL NGF and 10ng/mL GDNF and CNTF)
resulted in increased neurite outgrowth compared to individually applied neurotrophic fac-
tors. Coating of substrates with different combinations of LN and CSPG has been shown
to elicit differential neurite outgrowth patterns. When the concentration of LN is low in
comparison to CSPG concentration, CSPGs inhibit neurite growth and induce growth cone
collapse or turning away from CSPG. When LN concentration is high in comparison to
CSPG concentration, neurites are able to grow on the substrate (Snow, 1994).
Multimolecular gradients have been studied, and the additive effects of each molecule have
been found to be nonlinear. Multimolecular soluble gradients of NGF and NT-3 gradients
have been found to work synergistically (Cao and Shoichet, 2003), and BDNF and LN
gradients have been observed to direct growth cone turning (Wang et al., 2008). Double
cue gradients of LN and CSPGs have been studied as models of the glial scar, where LN
and aggrecan gradients have been observed to elicit neuronal morphologies with dystrophic
endbulbs in adult axons consistent with regenerating axons through the glial scar in vivo
(Tom et al., 2004). In a previous study from this laboratory (Li et al. 2008) the effects of
multi-molecular gradients of permissive and inhibitory cues, LN and CSPG were explored,

128
which suggested that gradients presenting only one cue, either permissive or inhibitory, were
able to direct neurite growth in a similar manner, but there were large differences in cellular
adhesion. For double cue gradients, it was shown that neuronal responses were dependent
on gradient directions and elicited different neurite guidance and orientation responses when
spatially patterned in different ways.
Treatment using chABC and Y27632 were hypothesized to modulate response to CSPG on
double cue LN and CSPG gradients, as the addition of these exogenous factors modulate
response to CSPG stripes in vitro (Jain et al., 2004; Lemons et al., 2003; Monnier et al., 2003;
Snow et al., 1990). In this study, there was no reduction in inhibition when CSPGs were
enzymatically digested by chABC prior to generating the gradient. This may be due to ABC
digestion leaving behind digested sugar chain "stubs," which may have biological activity
(Lemons et al., 2003), as the “stubs” are not removed before the solution is injected into the
gradient mixer. Adsorption of these “stubs” to the substrate surface may be inhibitory to
neurite growth. Previous studies on the effect of Y27632 have shown that neurite length is
greatly increased by the addition of Y27632 to DRG cultures on CSPG substrates (Jain et
al., 2004; Monnier et al., 2003). Our results agree with these studies.
Neurons may respond differentially to the local environment if multiple complex cues present
conflicting information. Hence, it is important to consider combinatorial gradients separately
from single cue gradients as interactions between the molecules presented may add additional
complexity to the microenvironment. In this study, cellular responses have been shown
to correlate to molecular gradients in a non-linear fashion, with differential response to
specific gradient parameters such as slope or direction. Treatment using strategies such as
enzymatic digestion or pharmacological inhibition of downstream signaling pathways may
also elicit more complex cell responses when combinations of cues are presented, and further
investigations would clarify and elucidate how cells integrate such iniformation to make
growth decisions.

129
4.5 References
Bagnard D, Thomasset N, Lohrum M, Puschel AW, Bolz J. Spatial Distributions of Guidance
Molecules Regulate Chemorepulsion and Chemoattraction of Growth Cones. J. Neurosci.,
2000; 20: 1030-5.
Bellamkonda RV. Peripheral nerve regeneration: An opinion on channels, scaffolds and
anisotropy. Biomaterials, 2006; 27: 3515-8.
Buettner HM, Pittman RN. Quantitative effects of laminin concentration on neurite out-
growth in vitro. Developmental Biology, 1991; 145: 266-76.
Cao X, Shoichet MS. Investigating the synergistic effect of combined neurotrophic factor
concentration gradients to guide axonal growth. Neuroscience, 2003; 122: 381-9.
Deister C, Schmidt CE. Optimizing neurotrophic factor combinations for neurite outgrowth.
J Neural Eng, 2006; 3: 172-9.
Dertinger SK, Jiang X, Li Z, Murthy VN, Whitesides GM. Gradients of substrate-bound
laminin orient axonal specification of neurons. Proc Natl Acad Sci U S A, 2002; 99: 12542-7.
Dou CL, Levine JM. Differential effects of glycosaminoglycans on neurite growth on laminin
and L1 substrates. J. Neurosci., 1995; 15: 8053-66.
Goodhill GJ, Urbach JS. Theoretical analysis of gradient detection by growth cones. J
Neurobiol, 1999; 41: 230-41. Gurdon JB, Bourillot PY. Morphogen gradient interpretation.
Nature, 2001; 413: 797-803.
Hammarback JA, Palm SL, Furcht LT, Letourneau PC. Guidance of neurite outgrowth by
pathways of substratum-adsorbed laminin. Journal of Neuroscience Research, 1985; 13:
213-20.
Hynds DL, Snow DM. Fibronectin and laminin elicit differential behaviors from SH-SY5Y
growth cones contacting inhibitory chondroitin sulfate proteoglycans. Journal of Neuro-
science Research, 2001; 66: 630-42.

130
Jain A, Brady-Kalnay SM, Bellamkonda RV. Modulation of Rho GTPase activity alleviates
chondroitin sulfate proteoglycan-dependent inhibition of neurite extension. J Neurosci Res,
2004; 77: 299-307.
Keenan TM, Folch A. Biomolecular gradients in cell culture systems. Lab on a Chip, 2008;
8: 34-57.
Laabs TL, Wang H, Katagiri Y, McCann T, Fawcett JW, Geller HM. Inhibiting Gly-
cosaminoglycan Chain Polymerization Decreases the Inhibitory Activity of Astrocyte-Derived
Chondroitin Sulfate Proteoglycans. J. Neurosci., 2007; 27: 14494-501.
Lemons ML, Barua S, Abanto ML, Halfter W, Condic ML. Adaptation of Sensory Neurons
to Hyalectin and Decorin Proteoglycans. J. Neurosci., 2005; 25: 4964-73.
Lemons ML, Sandy JD, Anderson DK, Howland DR. Intact aggrecan and chondroitin
sulfate-depleted aggrecan core glycoprotein inhibit axon growth in the adult rat spinal cord.
Experimental Neurology, 2003; 184: 981-90.
Li G, Liu J, Hoffman-Kim D. Multi-Molecular Gradients of Permissive and Inhibitory Cues
Direct Neurite Outgrowth. Annals of Biomedical Engineering, 2008; [Epub ahead of print].
Monnier PP, Sierra A, Schwab JM, Henke-Fahle S, Mueller BK. The Rho/ROCK pathway
mediates neurite growth-inhibitory activity associated with the chondroitin sulfate proteo-
glycans of the CNS glial scar. Mol Cell Neurosci, 2003; 22: 319-30.
Snow DM. Neurite Outgrowth in Response to Patterns of Chondroitin Sulfate Proteoglycan:
Inhibition and Adaptation. Neuroprotocols, 1994; 4: 146-57.
Snow DM, Lemmon V, Carrino DA, Caplan AI, Silver J. Sulfated proteoglycans in astroglial
barriers inhibit neurite outgrowth in vitro. Exp Neurol, 1990; 109: 111-30.
Snow DM, Smith JD, Cunningham AT, McFarlin J, Goshorn EC. Neurite elongation on
chondroitin sulfate proteoglycans is characterized by axonal fasciculation. Experimental
Neurology, 2003; 182: 310-21.

131
Tom VJ, Steinmetz MP, Miller JH, Doller CM, Silver J. Studies on the Development and
Behavior of the Dystrophic Growth Cone, the Hallmark of Regeneration Failure, in an In
Vitro Model of the Glial Scar and after Spinal Cord Injury. J. Neurosci., 2004; 24: 6531-9.
von Philipsborn AC, Lang S, Loeschinger J, Bernard A, David C, Lehnert D, Bonhoeffer F,
Bastmeyer M. Growth cone navigation in substrate-bound ephrin gradients. Development,
2006; 133: 2487-95.
Wang CJ, Li X, Lin B, Shim S, Ming G-l, Levchenko A. A microfluidics-based turning assay
reveals complex growth cone responses to integrated gradients of substrate-bound ECM
molecules and diffusible guidance cues. Lab on a Chip, 2008; 8: 227-37.

Chapter 5
Genomic and Morphological Changes
of Neuroblastoma Cells in Response
to Three-Dimensional Matrices
Advances in neural tissue engineering require a comprehensive understanding of neuronal
growth in three dimensions. This study investigated the gene expression of SH-SY5Y hu-
man neuroblastoma cells when cultured in three-dimensional (3D) versus two-dimensional
(2D) environments. Microarray analysis demonstrated that in response to varying matrix
geometry, SH-SY5Y cells exhibited differential expression of 1766 genes in collagen I, in-
cluding those relevant to cytoskeleton, extracellular matrix, and neurite outgrowth. Cells
extended longer neurites in 3D versus 2D collagen I cultures. Real-time RT-PCR exper-
iments and morphological analysis comparing collagen I and Matrigel tested whether the
differential growth and gene expression reflected influences of culture dimension or culture
material. SH-SY5Y neuroblastoma cells responded to geometry by differentially regulat-
ing cell spreading and genes associated with actin in similar patterns for both materials;
however, neurite outgrowth and the expression of the gene encoding for neurofilament var-
ied with the type of material. Electron microscopy and mechanical analysis showed that
collagen I was more fibrillar than Matrigel, with larger interfiber distance and higher stiff-
132

133
ness. Taken together, these results suggest complex cell-material interactions, in which the
dimension of the culture material influences gene expression and cell spreading, and the
structural and mechanical properties of the culture material influence gene expression and
neurite outgrowth.
5.1 Introduction
Current goals for neural tissue engineering include replacing damaged or degenerated neural
tissue with a matrix containing neural progenitor cells, promoting the ingrowth of host
neurons into an acellular matrix, and generating in vitro systems in which to study neuronal
growth under conditions that mimic the in vivo nervous system environment. Neurons in
vivo adhere to and interact with the extracellular matrix (ECM); in tissue engineering,
hydrogels and other polymer matrices have been utilized to perform ECM functions. Recent
efforts have focused on promoting neuronal growth and directing neurite extension in three-
dimensional (3D) environments.
A variety of 3D matrices have been shown to support neuronal growth and neurite extension,
including microporous polystyrene scaffolds (Hayman et al., 2004), fibrin matrices (Pittier et
al., 2005), agarose hydrogels (Balgude et al., 2001), Matrigel hydrogels (Khan et al., 2002),
and collagen hydrogels (Ma et al., 2004; O’Connor et al., 2001). While studies have begun
to characterize these matrices with regard to their chemical composition and mechanical
properties, the underlying physiologic response of the neuron to the 3D environment is
not completely understood. Comparisons of neuronal growth as well as comparisons of
the growth of nonneuronal cells, in standard two-dimensional (2D) monolayer cultures as
compared to 3D matrix cultures that more closely resemble in vivo environments, have
shown clear phenotypic differences. For example, previous studies have revealed differences
in cellular surface area, stress fiber distribution, cellular migration, focal adhesions, neurite
and growth cone dimensions, and protein and gene expression (Balgude et al., 2001; Even-
Ram and Yamada, 2005; Hayman et al., 2004; Jaworski and Klapperich, 2006; Klapperich
and Bertozzi, 2004; Li et al., 2003; Pittier et al., 2005; Wang et al., 2003).

134
A powerful approach to investigate these differences is to examine the neuron’s global gene
expression profile. In this study, we used oligonucleotide microarrays to compare the gene
expression patterns of SH-SY5Y neuroblastoma cells grown in 3D versus 2D culture environ-
ments, with the aim of identifying molecules with putative roles in differentially interpreting
3D guidance cues and promoting neurite outgrowth. Neuroblastoma cells were initially cul-
tured in collagen hydrogel matrices and on collagen substrates. Matrigel was subsequently
utilized as an additional hydrogel matrix and substrate material, to determine if material
type influenced neuroblastoma growth response.
The motivation for these studies is to gain a more rigorous comprehension of the cellular and
molecular mechanisms underlying axon growth in a matrix that is physiologically relevant
in its three-dimensional geometry. The overarching goal is to combine materials design
requirements with knowledge of the physiological response of the neuron, in order to optimize
the development of biomaterials for neural tissue engineering.
5.2 Materials and Methods
5.2.1 Cell culture
All materials were purchased from Invitrogen (Carlsbad, CA) unless otherwise specified.
The human neuroblastoma cell line SH-SY5Y, ATCC#CRL-2266 (American Type Culture
Collection, Manassas, VA) was cultured in a 1:1 mixture of Eagle’s MEM Minimum Essen-
tial Medium (ATCC) and Ham’s F12 Medium (containing 2mM L-glutamine and 1.5g/l of
sodium bicarbonate) supplemented with 10% fetal bovine serum and 100 U/ml penicillin-
streptomycin. To further differentiate the cell line toward a neuronal phenotype, cell media
was supplemented with 10μM retinoic acid (RA) for three days. Cells cease proliferation
and 70% of cells are differentiated following this treatment (Navone et al., 2001; Rebhan et
al., 1994; Sidell, 1982).
Cell culture for RNA studies was performed using six-well plates as described below. Cell

135
culture for microscopy studies utilized donut dishes. For donut dish assembly, sterile, acid-
washed (sulfuric and nitric acid (5:1)) glass coverslips were affixed to 35x10mm tissue culture
dishes with 20 mm holes (Willco Wells, Amsterdam, Netherlands). For 2D cell culture on
collagen I substrates, dishes or wells were coated with 3 mg/ml of purified bovine dermal type
I collagen in 0.012 N HCl according to the manufacturer’s instructions (PureCol, Inamed
Co., Fremont, CA; also marketed as Vitrogen 100, Cohesion Technologies, Palo Alto, CA
and referred to hereafter as collagen I). SH-SY5Y cells (106 cells per well for 2D and 3D
RNA studies; 6.5 x 10⁴ cells per dish for 2D and 1.3 x10⁵ cells per dish for 3D microscopy
studies) cultured in RA-supplemented media were plated onto the collagen-coated wells or
dishes. For culture in 3D collagen I, matrices of 2ml final volume were prepared with a
mixture of 5X Dulbecco’s Modified Eagle’s Media (DMEM), collagen I, and SH-SY5Y cell
suspension in a ratio of 2:7:1, and the pH was adjusted to 7.3-7.4. This solution was plated
on wells or dishes and gelled at 37ºC with 5% CO2. RA-supplemented media was added 1
hour after plating. Cells were cultured for 24h in a humidified environment at 37ºC with
5% CO2.
For 2D culture on growth factor reduced MatrigelTM (BD Biosciences, Franklin Lakes, NJ,
referred to hereafter as Matrigel), wells or dishes were coated with 0.5ml Matrigel, and
incubated at 37ºC for 30 minutes. SH-SY5Y cells cultured in RA-supplemented media
were plated onto the gelled Matrigel. For culture in 3D Matrigel, matrices of 1.5ml final
volume were made with a mixture of Matrigel and cell suspension (SH-SY5Y cells in 50-100
μl DMEM; 0.5-0.8 x 10⁶ cells per well for 2D and 1-1.6 x 10⁶ cells per well for 3D RNA
studies; 2 x 10⁴ cells per dish for 2D and 4 x 10⁴ cells per dish for 3D microscopy studies),
plated on wells or dishes and incubated at 37ºC for 30 minutes. RA-supplemented media
was added 30 minutes after plating. Cells were cultured for 24h in a humidified environment
at 37ºC with 5% CO2.

136
5.2.2 RNA isolation
Cells grown in collagen I were treated with 0.5% collagenase (Sigma, St. Louis, MO) at
37ºC for 20-40 minutes, washed with 0.1M phosphate buffered saline, pH 7.4 (PBS), and
suspended in 100 μl of PBS. One ml of RNAlater stabilization reagent (Qiagen Inc. Valencia,
CA) was added and the cells were stored at 4ºC. Cells grown in Matrigel were treated
with MatriSperse Cell Recovery Solution (BD Biosciences) according to the manufacturer’s
instructions. The cells were resuspended in 100ul of PBS, one ml of RNAlater was added,
and the cells were stored at 4ºC. RNA was isolated with the RNAeasy Mini Kit (Qiagen).
RNA purity was determined by spectrophotometry, with an A260/A280 ratio of 1.9-2.1
indicating pure RNA.
5.2.3 Microarray analysis
RNA from collagen I cultures was converted into double stranded cDNA using a Super-
Script Double Stranded cDNA Synthesis Kit. Double stranded cDNA was converted into
cRNA using the BioArray High Yield RNA Transcript Labeling Kit (Enzo Diagnostics, New
York, NY). The cRNA was fragmented for target preparation according to the GeneChip
Expression Analysis Technical Manual (Affymetrix, Santa Clara, CA). Fragmented biotin-
labeled cRNA samples were hybridized for 16 h to U133A Human GeneChips (Affymetrix).
Chips were washed and labeled with streptavidin-phycoerythrin according to the Affymetrix
2 Stain Protocol. Chips were scanned using an Agilent Technologies G2500A GeneArray
scanner and Affymetrix MicroArray Suite (MAS) 5.0 software. Data analysis was performed
using MAS 5.0, Affymetrix Micro DB, and Data Mining Tool 3.0 software.
5.2.4 Real-time RT-PCR
RNA was prepared as described above and total RNA concentration was determined by
absorbance at 260 nm. Serial dilutions of RNA were made for RT-PCR reactions containing
100 ng, 10 ng, 1 ng, 0.5 ng, 0.25 ng or 0.125 ng of total RNA. All reactions were performed

137
in triplicate. The primers and probes were designed with QuantiProbe Design Software
(Qiagen, Valencia, CA). Reactions also contained 1X Quantitect Probe RT-PCR Master
mix, 1X Quantitect specific PCR primers and dual-labeled specific probe mix with a Car-
boxyFluorescein FAM fluorophore at the 3’ end of the specific probe and an Eclipse Dark
Quencher at the 5’ end. Reactions were carried out using an Applied Biosystems 7300 Real
Time PCR system using the following protocol: reverse transcription (30 minutes at 500oC),
initial activation step (15 minutes at 950C), and amplification (45 cycles of 15 seconds de-
naturation at 940C, 30 seconds annealing at 560oC and 30 seconds of extension at 760C).
Fluorescence data was collected during the annealing step.
5.2.5 Real-time RT-PCR analysis
Fold changes in gene expression were calculated relative to the level of glyceraldehyde-3-
phosphate dehydrogenase (GAPDH) mRNA in the samples. GAPDH was chosen as the
reference gene because microarray analysis indicated that its expression level did not change
when cells were plated on 2D versus 3D collagen. The efficiency calibrated model(Pfaffl et
al., 2002) was applied to the data to calculate relative expression of genes of interest (target
genes) as compared to GAPDH (reference gene) for each condition tested (2D or 3D) in each
matrix (collagen or Matrigel). Cycle threshold (Ct) values for a dilution series of 2D and
3D RNA were determined for reference and target genes. Ct values were plotted against log
of RNA concentration and efficiencies were calculated according to E = 10−1
Slope .
For each gene at each condition and matrix tested, three replicates of six serially diluted
concentrations were performed. These exceed the minimum requirement of three replicates
at three concentrations in order to yield data with sufficient statistical power, and the mini-
mum requirement of two replicates of three concentrations to yield data with an appropriate
dynamic range and reproducibility(Yuan et al., 2006). The mean Ct values for each input
concentration and each condition were used to calculate Ct values. Cts for each gene
were calculated by subtracting the Ct value of the 3D sample from that of the 2D sample.
Expression ratios between the conditions were calculated from the Cts for each gene in each

138
matrix using the following equation, with fold change corresponding to the expression ratio
for upregulated genes in 3D, and the reciprocal of the expression ratio for downregulated
genes in 3D: Expression ratio =E
ΔCttarget
target
EΔCtreference
reference
5.2.6 Quantification of neurite growth
After 24h of culture, 2D samples were examined on a Nikon Eclipse TE2000-S microscope
under phase-contrast optics using a 20X objective and 10X projection lens. Images were
captured using a Hamamatsu Orca-ER camera and Orbit shutter controller (Improvision,
Lexington, MA), outputting to OpenLab v4.0.2 (Improvision). Neurite lengths were mea-
sured using OpenLab software. Cells cultured in 3D were examined at multiple focal planes
under phase-contrast optics using a Zeiss Axiovert microscope using a 20X objective and
10X projection lens. Images were captured using a Hamamatsu Orca-ER camera and neu-
rite length segments were measured along the plane of focus using the ruler tool in Zeiss
Axiovision software, that allowed for continuous measurements between slices in a z-stack,
yielding a summation of length segments. The height of a stack was measured by counting
the number of focal planes, with an intra-plane distance of 1μm. The 3D neurite length
was then calculated using the Pythagorean theorem as the hypotenuse of a triangle with
the horizontal projection of neurite trajectory (x) and height of z-stacks (z) as the sides . A
neurite was defined as an extension exceeding the length of a cell body, and was included in
the analysis only if the neurite was the longest neurite of the neuron examined and did not
contact other cells (Wu et al., 2004; Yamashita et al., 2002; Yip et al., 1998). Neurons with
neurites that did not meet these criteria were not included in analysis of cell morphology.
A total of 90 neurites per condition, taken from 3 replicate samples for each condition, were
measured to determine the average neurite length.
5.2.7 Confocal microscopy
Confocal microscopy was used to view neurite extension on 2D substrates and in 3D gels.
SH-SY5Y cells were plated and labeled with phalloidin as described below. After 24h in

139
culture, samples were analyzed using a Leica TCS SP2 AOBS spectral confocal microscope.
A krypton-argon laser was used to excite at 488nm and cells were viewed using a 63X
objective lens. Multiple z scans were obtained and Voxx software or Leica confocal software
was used for image analysis.
5.2.8 Phalloidin staining
Cells grown on 2D substrates were fixed with 2% paraformaldehyde for 20 minutes, washed
with PBS, treated with 0.1% Triton X-100 for 5 minutes, washed twice with PBS, incubated
for 20 minutes with 1% bovine serum albumin (BSA) in PBS, stained for 20 minutes with
1 unit of Alexa Fluor 546 phalloidin (Molecular probes, Invitrogen, Carlsbad, CA), washed
with PBS, and visualized under epifluorescence and confocal microscopy. For cells grown in
3D gels, the staining protocol was the same, except that incubation periods were 2 hours
for paraformaldehyde, 30 minutes for Triton X-100, one hour for BSA, and one hour for
fluorescent phalloidin.
5.2.9 Mechanical characterization of gels using dynamic mechanical anal-
ysis
The storage modulus and loss modulus of the hydrogels were measured using a DMA 7e
Dynamic Mechanical Analyzer (Perkin Elmer, Wellesley, MA). Parallel plate geometry was
employed with 15 mm diameter plates. Acellular hydrogel samples, with thickness varying
from 2-4 mm, were subjected to static force of 11mN and an oscillating dynamic force of
10mN at 2.6 Hz at room temperature. The modulus of a sample was determined by averaging
data points between 1 and 3 minutes of a sample’s run on the DMA. Triplicate samples were
tested for each type of hydrogel.

140
5.2.10 Scanning electron microscopy
For examination under scanning electron microscopy (SEM), acellular samples were fixed in
Karnovsky’s fixative (Electron Microscopy Sciences, Hatfield, PA) for 3h and rinsed in 0.1M
cacodylate buffer (Sigma). Samples were washed with dH2O and dehydrated with graded
ethanols to 100% ethanol. Samples were dried by incubation with hexamethyldisilazane
(HMDS; Sigma) for 10min and a further incubation with fresh HMDS overnight. Samples
were examined with a Hitachi S-2700 scanning electron microscope using an acceleration
voltage of 3kV.
5.2.11 Transmission electron microscopy
For examination under transmission electron microscopy (TEM), acellular samples were
fixed in Karnovsky’s fixative for 3h and rinsed in 0.1M cacodylate buffer. Samples were
postfixed with 1% osmium tetroxide for 3h, washed with dH2O, and dehydrated with graded
ethanol washes to 100% ethanol. Samples of 1mm3 in size were cut from the original sample,
infiltrated with Spurr’s resin, and 85nm sections were cut with a diamond knife on a Reichert-
Jung Ultracut E. Sections were mounted on copper mesh grids and examined with a Phillips
EM 410 using a voltage of 80kV. TEM micrographs were analyzed to determine pore size as
approximated by inter-fibril distance, using Adobe Photoshop CS2. The distance between
fibrillar structures was measured in pixels using the line tool and converted to microns.
Ten measurements per image were taken with n=3 images for Matrigel and n=5 images for
collagen.
5.2.12 Statistical analysis
Statistics were performed on all quantitative measurements. To evaluate the effect of matrix
material on gene expression, Student t-tests were performed on calculated gene expression
fold changes for each gene in each matrix material for n=4 samples. To evaluate the sig-
nificance of dimensionality and materials on cell spreading and neurite outgrowth, one-way

141
analysis of variance (ANOVA) was performed in the between-subject design. Post-hoc mul-
tiple comparison analysis was done using the Bonferroni test. To evaluate the difference in
mechanical properties of the two gels tested, the Student t-test was used. SPSS 11.5 software
(SPSS, Inc., Chicago, IL) was used, and significance levels were taken to be p=0.05.
5.3 Results
5.3.1 SH-SY5Y cells exhibited differential gene expression in 3D versus
2D cultures
SH-SY5Y cells grown in 2D and 3D collagen I were recovered after 24h, RNA was extracted,
and 30-40 g of total RNA was obtained from 0.5-1.0x10⁷ cells. RNA was confirmed to be
free of degradation or DNA contamination. A total of 14,564 genes and expressed sequence
tags were screened by microarray analysis. Concordance analysis identified 1766 probesets
that were significantly differentially expressed with p ≤ 0.05. Of these, 919 known and 12
unknown genes were up-regulated in 3D cultures, and 823 known and 12 unknown genes
were down-regulated in 3D cultures. Fold changes of 1.5 fold or greater and found to be
significantly different by MAS 5 algorithms with p < 0.05 were taken to be differentially
expressed genes of interest (Costigan et al., 2002; Li and Wong, 2001). Known genes that
were differentially expressed in neuroblastoma cells cultured in 3D collagen I gels included
those encoding proteins involved in cytoskeleton, extracellular matrix, RNA metabolism,
protein metabolism, signal transduction, and other functions (fold change > 1.5 and p <
0.05; Table 5.1). Genes up-regulated in 3D cultures included those encoding cytoskeletal-
associated proteins such as actin filament 2 capping protein and signal transduction factors
such as midkine. Among the genes that were down-regulated in 3D cultures were genes
encoding the cytoskeletal proteins filamin A, actinin 1- 1, and talin 1, and genes encoding
extracellular matrix molecules such as fibronectin 1, collagen III 1 and versican.
Because initial pilot studies showed difference in neuronal morphology (see below), we se-
lected for further evaluation seven genes differentially expressed in 3D versus 2D that en-

142
Table 5.1: Microarray results of 2D versus 3D

143
coded for proteins relevant to the cytoskeleton, extracellular matrix, and neurite growth.
The gene for neurofilament was included in light of its relevance to neurite growth, even
though its fold change between 3D and 2D cultures was less than 1.5 by microarray analysis.
Fold changes for the RT-PCR experiments were calculated relative to the level of GAPDH
mRNA. The differential gene expression results from the microarray data were confirmed
by real time RT-PCR using samples from the same samples that had been used for the
microarray experiments. The RT-PCR experiments confirmed the differential expression of
three genes that had been shown by microarray to be up-regulated in 3D cultures: neurofil-
ament, midkine, and actin filament capping protein; and four genes that had been shown by
microarray to be down-regulated in 3D cultures: collagen III 1, actinin 1- 1, fibronectin 1
and filamin A (compare Table 1 and Table 2 – collagen I column). The sign of the average
fold change for each gene tested was identical between the RT-PCR and microarray results.
These experiments were extended to include a second type of hydrogel material, Matrigel, in
order to test whether the gene expression changes observed in cells cultured in 3D versus 2D
collagen reflected influences of culture dimension or culture material. Matrigel is composed
of 56% laminin, 31% collagen IV, and 8% entactin. The sign of the average 2D versus 3D fold
change for each gene tested was identical between the collagen and Matrigel results (Table
5.2). For five of the seven genes tested (filamin A, actinin 1 alpha 1, capping protein alpha 2,
fibronectin 1 and midkine), the magnitudes of the average fold changes were similar between
collagen and Matrigel cultures (p > 0.05; Table 5.2). The fold change for neurofilament was
significantly higher in collagen (p < 0.01), and the fold change for collagen III alpha 1 was
significantly higher in Matrigel (p < 0.001).
5.3.2 SH-SY5Y cells displayed different morphologies when grown in 3D
versus 2D cultures
SH-SY5Y neuroblastoma cells exhibited healthy growth with neurite extension on control
2D tissue culture plastic as well as under all four culture conditions tested – 2D collagen I,
3D collagen I, 2D Matrigel, and 3D Matrigel. For all culture conditions, after 24 hours in

144
Table 5.2: qPCR results
culture, some somata and neurites touched neighboring cells while other cells did not contact
adjacent cells. Neuronal morphology varied with the dimension of the substrate/matrix and
the type of material (Figures 5.15.25.3). After 24 hours in culture, the somata of SH-SY5Y
cells cultured in 3D matrices were globular in appearance (Figure 1B, 1D, 3B, 3D) while
cells on 2D substrates exhibited a flatter, more spread morphology (Figure 1A, 1C, 3A, 3C).
Quantitative image analysis of cell morphology supported these observations and showed
that neuroblastoma cells grown on 2D substrates had longer somata than cells grown in 3D
matrices (p < 0.001; Figure 2A). Cells grown on 2D Matrigel substrates tended to aggregate
into cell clusters (Figure 1C). Cell spreading was prominent in cells growing on 2D substrates
stained with phalloidin, showing a flat, angular morphology. Staining with phalloidin showed
that while actin was present in cells growing in both 2D (Figure 3A, C) and 3D (Figure 3B,
D), the filament organization of actin was not visible in 3D.
5.3.3 SH-SY5Y neurite outgrowth varied with type and dimension of
material
Quantitative analysis showed that SH-SY5Y cells grown with collagen I as the culture ma-
terial extended neurites that were longer in 3D cultures than in 2D cultures (47.2 + 1.5μm
versus 26.0 + 0.57μm, p<0.001, Figure 2B). Cells grown with Matrigel as the culture ma-
terial extended neurites with somewhat longer average lengths in 2D cultures than in 3D

145
Figure 5.1: Different morphologies of SH-SY5Y neuroblastoma cells in 3-dimensional (3D)and 2-dimensional (2D) cultures.Phase contrast micrographs of SH-SY5Y cells cultured for 24 h on 2D collagen I substrates
(A), on 2D Matrigel substrates (C), in 3D collagen I matrices (B), and in 3D Matrigelmatrices (D). Scale bar, 50 mm.

146
B
0
10
20
30
40
50
60
TCP Collagen CollagenMatrigel Matrigel
2D 3D
Neurite
length
(�m
)
A
0
10
20
30
TCP Collagen CollagenMatrigel Matrigel
2D 3D
Length
ofm
ajo
raxis
ofsom
a(�
m)
3D matrixneurite
z-planes}horizontal measurement (Sx)
Neurite length =(Sx2+z2)
vertical distance (z)x }
C
0.5
2D 3D
p-values TCP Collagen I Matrigel Collagen I Matrigel
2D TCP X 0.06 1 < 0.001 < 0.001Collagen I X 0.41 < 0.001 < 0.001Matrigel X < 0.001 < 0.001
3D Collagen I X 1Matrigel X
2D 3D
p-values TCP Collagen I Matrigel Collagen I Matrigel
2D TCP X 1 < 0.05 < 0.001 1Collagen I X < 0.001 < 0.001 1Matrigel X < 0.001 0.06
3D Collagen I X < 0.001Matrigel X
Figure 5.2: SH-SY5Y neuroblastoma cell spreading and neurite outgrowth varied with ma-terial type and geometry.Quantification of the length of the major axis of the soma (A) and neurite length (B) of
SH-SY5Y cells cultured for 24h on tissue culture plastic (TCP), on 2D collagen Isubstrates, on 2D Matrigel substrates, in 3D collagen I matrices, or in 3D Matrigel
matrices. Data are mean ± SEM. Cells were chosen for evaluation randomly across 3samples for each condition. n=82 for somata in 3D collagen I; n=90 for all other
conditions. Tables indicate p values for each pair-wise comparison. Figure 2C shows themethod of quantifying neurite length in 3D. A cartoon of a neuron grown in a 3D matrixin a typical orientation of soma and neurites spanning multiple focal planes. The inset is azoomed in view of the neuron and neurite in multiple z-planes taken using a Zeiss Axiovertmicroscope. The horizontal projection of each neurite segment in focus at each focal plane
is measured and summed ( x), the vertical projection of the entire neurite isapproximated to the nearest 1 m by taking the total of the z-stack height, and the
resultant neurite length is calculated using the Pythagorean theorem to determine thelength of the hypotenuse.

147
Figure 5.3: Visualization of actin in SH-SY5Y neuroblastoma cells in 3-dimensional (3D)and 2-dimensional (2D) cultures.Confocal micrographs of SH-SY5Y cells stained with phalloidin after culture for 24h on 2Dcollagen I substrates (A), on 2D Matrigel substrates (C), in 3D collagen I matrices (B),and in 3D Matrigel matrices (D). In cells cultured in 2D, filaments were visible, whereasstaining was more diffuse in cells in 3D. Scale bars, 50 mm (A,C) and 25 mm (B,D).

148
cultures (33.7 + 1.3μm versus 28.7 + 1.5μm), but this difference was not significant (p=0.06).
When neuroblastoma cells were cultured on 2D substrates, Matrigel supported the growth
of longer neurites than both collagen I (p<0.001) and tissue culture plastic (p<0.05). In
contrast, when cells were cultured in 3D matrices, collagen I supported longer neurites than
Matrigel (p<0.001). SH-SY5Y cells in 3D collagen I matrices often extended a single long
neurite, while cells in 3D Matrigel matrices typically extended several shorter neurites, in-
cluding one that could be easily observed to be the longest. Neurite diameters were similar
for all samples tested.
5.3.4 Collagen I and Matrigel differ in structure and mechanical proper-
ties
In light of the observed differences in the two matrices to support neurite outgrowth, we
compared the structures of collagen I and Matrigel by examination under scanning and
transmission electron microscopy (Figure 5.4). Scanning electron microscopy analysis of
3D collagen I and Matrigel matrices showed distinct structural differences between the two
matrices (Figure 4A, 4C). Collagen I matrices contained an intertwined fibrillar network,
while Matrigel surfaces contained a more dense, non-fibrillar structure with clustered ECM
molecules and tighter pores. These observations were extended to the internal structure of
the matrices upon examination with transmission electron microscopy (TEM; Figure 4B,
4D). Quantitative analysis was performed on the TEM images, since the incorporation of
resin during the processing helped to preserve the relative dimensions of the two matrices.
Collagen I matrices were more fibrillar in structure with fibrils of approximately 80-300nm
in diameter, and were more porous with inter-fiber distances of 3.9 + 0.7μm, as compared
to the more dense Matrigel matrices, with inter-fiber distances of 0.4 + 0.2μm.
Collagen I and Matrigel matrices also displayed different mechanical properties (Figure 5.5).
Dynamic mechanical analysis demonstrated that the storage modulus of the collagen I ma-
trices was larger than that for Matrigel matrices of the same volume and geometry (14.26 ±
0.34 versus 2.43 ± 0.44, p<0.001), indicating that the collagen I matrices were stiffer than

149
Figure 5.4: Distinct structural properties of collagen I and Matrigel matrices.Scanning electron micrographs of collagen I (A) and Matrigel (C) matrices and
transmission electron micrographs of collagen I (B) and Matrigel (D) matrices. Note themore fibrillar and porous structure of collagen I and the denser structure of Matrigel. Scale
bars, 5μm.

150
Figure 5.5: Distinct mechanical properties of collagen I and Matrigel matrices.Storage and loss modulus for collagen I and Matrigel matrices as measured using dynamicmechanical analysis. *p < 0.001; #p < 0.01. Data are mean ± standard error of the mean,
n = 3 for each condition.
the Matrigel matrices. The loss modulus for collagen I matrices was also larger than that for
Matrigel matrices (5.61 ± 0.86 versus 1.12 ± 0.13, p<0.01), suggesting that collagen I matri-
ces have a larger damping capacity than Matrigel matrices. By dividing the loss modulus by
the storage modulus we obtain the tangent of the loss angle (tan delta), which is a measure
of viscosity, where a smaller tan delta corresponds to a more viscous material. Collagen I
has a slightly higher tan delta value (0.39) than Matrigel (0.35), reflecting a slightly lower
viscosity of the collagen I matrices. Thus, in 3D cultures, SH-SY5Y neuroblastoma cells
extended longer neurites in an environment composed of a stiffer material with a slightly
lower viscosity and a higher damping capacity.
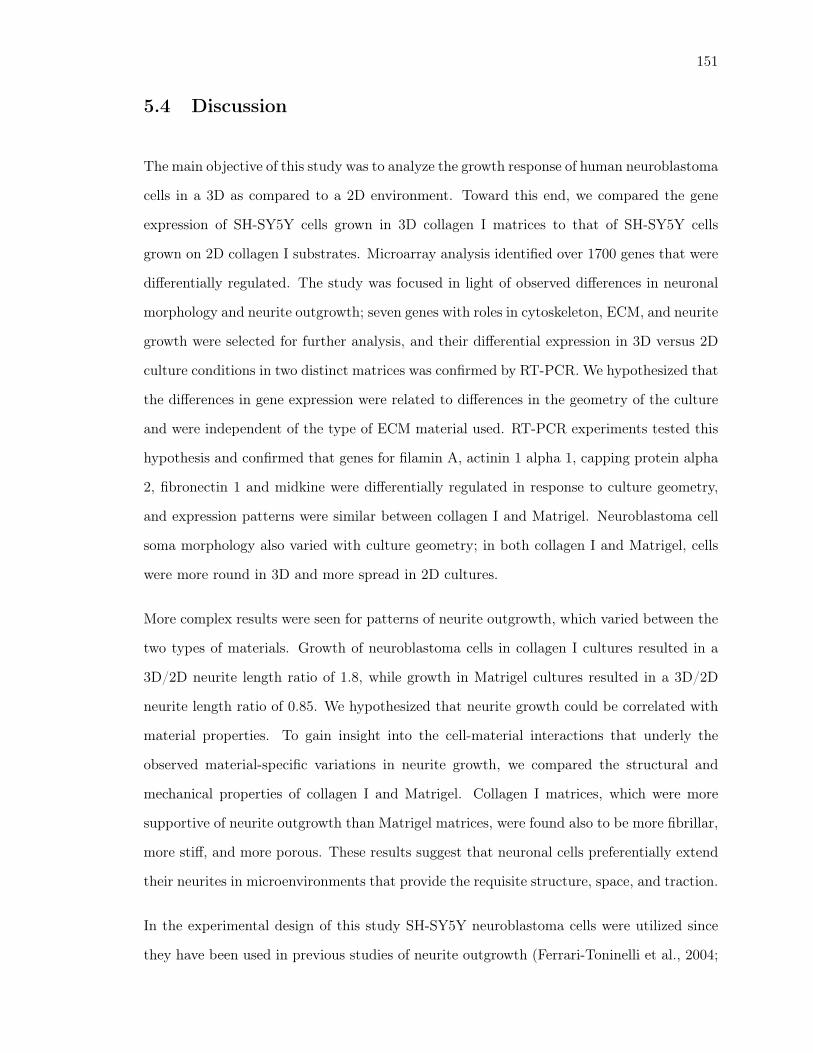
151
5.4 Discussion
The main objective of this study was to analyze the growth response of human neuroblastoma
cells in a 3D as compared to a 2D environment. Toward this end, we compared the gene
expression of SH-SY5Y cells grown in 3D collagen I matrices to that of SH-SY5Y cells
grown on 2D collagen I substrates. Microarray analysis identified over 1700 genes that were
differentially regulated. The study was focused in light of observed differences in neuronal
morphology and neurite outgrowth; seven genes with roles in cytoskeleton, ECM, and neurite
growth were selected for further analysis, and their differential expression in 3D versus 2D
culture conditions in two distinct matrices was confirmed by RT-PCR. We hypothesized that
the differences in gene expression were related to differences in the geometry of the culture
and were independent of the type of ECM material used. RT-PCR experiments tested this
hypothesis and confirmed that genes for filamin A, actinin 1 alpha 1, capping protein alpha
2, fibronectin 1 and midkine were differentially regulated in response to culture geometry,
and expression patterns were similar between collagen I and Matrigel. Neuroblastoma cell
soma morphology also varied with culture geometry; in both collagen I and Matrigel, cells
were more round in 3D and more spread in 2D cultures.
More complex results were seen for patterns of neurite outgrowth, which varied between the
two types of materials. Growth of neuroblastoma cells in collagen I cultures resulted in a
3D/2D neurite length ratio of 1.8, while growth in Matrigel cultures resulted in a 3D/2D
neurite length ratio of 0.85. We hypothesized that neurite growth could be correlated with
material properties. To gain insight into the cell-material interactions that underly the
observed material-specific variations in neurite growth, we compared the structural and
mechanical properties of collagen I and Matrigel. Collagen I matrices, which were more
supportive of neurite outgrowth than Matrigel matrices, were found also to be more fibrillar,
more stiff, and more porous. These results suggest that neuronal cells preferentially extend
their neurites in microenvironments that provide the requisite structure, space, and traction.
In the experimental design of this study SH-SY5Y neuroblastoma cells were utilized since
they have been used in previous studies of neurite outgrowth (Ferrari-Toninelli et al., 2004;

152
Sheehan et al., 2006; Shiraishi et al., 2006; Soumyanath et al., 2005), neuronal function
(Arun et al., 2006; Gutala et al., 2006; Navone et al., 2001), and gene expression (Dunckley
and Lukas, 2006; Gutala et al., 2006; Lee et al., 2006). They also contain a single cell type
as compared to primary neuronal cultures that typically contain multiple cell types, making
the cell line well suited for gene profiling experiments. Collagen was selected as a biomaterial
because it is a biological hydrogel, and its highly hydrated and porous structure is supportive
for cellular adhesion and neurite outgrowth (Lin et al., 2005; O’Connor et al., 2001). Cells
were seeded with similar cell numbers per condition, which required the use of unequal cell
densities between conditions. A pilot study testing changes in gene expression of fibronectin
in 2D versus 3D collagen under three different cell density conditions showed similar down-
regulation of the gene and similar fold changes between the three conditions, suggesting that
the different plating densities did not significantly influence the results of this study. Gene
expression was evaluated after 24 hours in culture, since at this time, neuroblastoma cells
have attached to their substrates and extended neurites; this timepoint is often used for
assessment of neurite outgrowth (Balgude et al., 2001) and gene expression (Jaworski and
Klapperich, 2006; Lafrenie et al., 1998; Li et al., 2003). The use of triplicate samples and the
combination of the fold-change (> 1.5) and p-value (< 0.05) criteria facilitated a rigorous
analysis of the changes observed in the microarray experiments, as described in previous
studies (Costigan et al., 2002; Li and Wong, 2001), and real-time RT-PCR with analysis
developed by Pfaffl(Pfaffl, 2001; Pfaffl et al., 2002) verified changes in selected genes.
A 3D culture environment surrounds cells with matrix material, providing structural sup-
port and matrix-derived molecular and chemical cues, and exerting physical forces from all
directions. This environment contrasts with a conventional 2D culture substrate on which
cells form adhesions and receive support only on their ventral surfaces. Matrix geometry
can influence cell migration (Even-Ram and Yamada, 2005; Friedl and Brocker, 2000; Friedl
et al., 1998; Lutolf and Hubbell, 2005; Vicente-Manzanares et al., 2005), signaling events
and other cellular functions (Bottaro et al., 2002; Cukierman et al., 2002; Geiger, 2001;
Rong et al., 2002; Stevens and George, 2005). In this study, SH-SY5Y neuroblastoma cells
displayed a more spread morphology with more prominent actin filaments when cultured

153
on 2D substrates, while they were more globular with more diffuse actin when cultured in
3D matrices. Similar 3D/2D differences in actin staining and morphology have been ob-
served for smooth muscle cells in collagen cultures (Li et al., 2003). Correlated with the
SH-SY5Y cells’ globular morphology in 3D was the downregulation of the actin crosslinking
proteins filamin A and actinin 1- 1 and the focal adhesion protein talin, which function
as connector proteins between the cytoskeleton and integrins, and thus are important in
mediating cell-matrix adhesions during cell spreading(Alberts et al., 2002a, b; Even-Ram
and Yamada, 2005; Feng and Walsh, 2004; Small et al., 2002; van der Flier and Sonnen-
berg, 2001; Vicente-Manzanares et al., 2005). Interestingly, kidney cells down-regulated
talin protein when cultured on 3D versus 2D Matrigel and collagen (Wang et al., 2003).
Also correlated with the reduced prominence of actin filaments was the upregulation in 3D
cultures of the gene for actin capping protein, that binds the growing plus ends of actin
filaments and regulates their growth. Taking these results together, we hypothesize that the
differences in cellular surface area could be mediated by restrictions from the surrounding
matrix in 3D.
These results have shown that both the dimension and type of material influence neurite
outgrowth. Both neuroblastoma cells (this study) and dorsal root ganglion neurons (pre-
liminary studies from our laboratory) extended longer neurites in 3D versus 2D collagen. In
other studies comparing growth in 3D and 2D cultures, shorter neurites have been found in
3D versus 2D fibrin cultures (Pittier et al., 2005), and the growth cones of neurons grown
in 3D agarose have been observed to be more globular than growth cones of neurons on 2D
agarose (Balgude et al., 2001). These variations in neurite outgrowth among different culture
materials suggest important roles for material-associated properties. In the present study,
neurite outgrowth and the correlated 3D upregulation of neurofilament gene expression were
enhanced by the stiffer, more fibrillar, and more porous collagen I matrix, as compared to
Matrigel. Interestingly, neurofilament protein has also been found to be increased by neu-
ral cells derived from human embryonic stem cells, when these cells were cultured in 3D
polystyrene scaffolds (Hayman et al., 2004). Collagen and fibrin gels have been shown to
promote neurite extension and neuron viability, particularly when aligned (Ceballos et al.,

154
1999; Dubey et al., 1999) and when compared to agarose gels (Lin et al., 2005; O’Connor
et al., 2001). Other studies have suggested that stiffness is inversely correlated and pore
size is positively correlated to neurite outgrowth (Balgude et al., 2001; Bellamkonda et al.,
1995; Dillon et al., 1998; Flanagan et al., 2002; Gunn et al., 2005; Krewson et al., 1994;
Yu and Bellamkonda, 2001). Future studies will be needed to elucidate the respective con-
tributions of material properties such as stiffness, porosity and surface energy, as well as
chemical composition, to cell-material interactions, and to further our comprehension of
how the multifaceted microenvironment influences cell function.
The 3D environment in which cells reside and function in vivo and that tissue engineers aim
to replicate, provides physical support and matrix-associated cues to cells from all directions.
Neuroblastoma cells respond to a 3D environment by regulating their gene expression and
changing their morphology and neurite outgrowth. The findings of this study suggest that
the regulation of these responses is complex, and depends on the geometry of the matrix as
well as on its composition, structure, and mechanical properties. The connection of these
material parameters and cellular responses is an important step toward the development of
tailored matrices for neural tissue engineering.
5.5 Acknowledgements
The authors thank Pilar Gil for help with initial RT-PCR experiments; Jan Bruder, Johnathon
Rollo, Beverly See, and Carl Simkevich for help with experimental analysis; Geoff Williams
for help with TEM and SEM; and Edwin Edwards for help with DMA. This work was funded
by the NIH COBRE Center for Genetics and Genomics (NIH P20 RR 15578-04).
5.6 References
Alberts B, Johnson A, Lewis J, Raff M, Roberts K, Walter P. Cell Junctions, Cell Adhesion,
and the Extracellular Matrix. In Gibbs S, editor. Molecular Biology of the Cell. Garland
Science: New York, 2002a: 1065-126.

155
Alberts B, Johnson A, Lewis J, Raff M, Roberts K, Walter P. The Cytoskeleton. In Gibbs
S, editor. Molecular Biology of the Cell. Garland Science: New York, 2002b: 907-82.
Arun P, Madhavarao CN, Moffett JR, Namboodiri MA. Regulation of N-acetylaspartate and
N-acetylaspartylglutamate biosynthesis by protein kinase activators. J Neurochem, 2006; 98:
2034-42.
Balgude AP, Yu X, Szymanski A, Bellamkonda RV. Agarose gel stiffness determines rate of
DRG neurite extension in 3D cultures. Biomaterials, 2001; 22: 1077-84.
Bellamkonda R, Ranieri JP, Bouche N, Aebischer P. Hydrogel-based three-dimensional ma-
trix for neural cells. J Biomed Mater Res, 1995; 29: 663-71.
Bottaro DP, Liebmann-Vinson A, Heidaran MA. Molecular signaling in bioengineered tissue
microenvironments. Ann N Y Acad Sci, 2002; 961: 143-53.
Ceballos D, Navarro X, Dubey N, Wendelschafer-Crabb G, Kennedy WR, Tranquillo RT.
Magnetically aligned collagen gel filling a collagen nerve guide improves peripheral nerve
regeneration. Exp Neurol, 1999; 158: 290-300.
Costigan M, Befort K, Karchewski L, Griffin RS, D’Urso D, Allchorne A, Sitarski J, Mannion
JW, Pratt RE, Woolf CJ. Replicate high-density rat genome oligonucleotide microarrays
reveal hundreds of regulated genes in the dorsal root ganglion after peripheral nerve injury.
BMC Neurosci, 2002; 3: 16.
Cukierman E, Pankov R, Yamada KM. Cell interactions with three-dimensional matrices.
Curr Opin Cell Biol, 2002; 14: 633-9.
Dillon GP, Yu X, Sridharan A, Ranieri JP, Bellamkonda RV. The influence of physical
structure and charge on neurite extension in a 3D hydrogel scaffold. J Biomater Sci Polym
Ed, 1998; 9: 1049-69.
Dubey N, Letourneau PC, Tranquillo RT. Guided neurite elongation and schwann cell in-
vasion into magnetically aligned collagen in simulated peripheral nerve regeneration. Exp
Neurol, 1999; 158: 338-50.
156
Dunckley T, Lukas RJ. Nicotinic modulation of gene expression in SH-SY5Y neuroblastoma
cells. Brain Res, 2006; 1116: 39-49.
Even-Ram S, Yamada KM. Cell migration in 3D matrix. Curr Opin Cell Biol, 2005; 17:
524-32.
Feng Y, Walsh CA. The many faces of filamin: a versatile molecular scaffold for cell motility
and signalling. Nat Cell Biol, 2004; 6: 1034-8.
Ferrari-Toninelli G, Paccioretti S, Francisconi S, Uberti D, Memo M. TorsinA negatively
controls neurite outgrowth of SH-SY5Y human neuronal cell line. Brain Res, 2004; 1012:
75-81.
Flanagan LA, Ju YE, Marg B, Osterfield M, Janmey PA. Neurite branching on deformable
substrates. Neuroreport, 2002; 13: 2411-5.
Friedl P, Brocker EB. The biology of cell locomotion within three-dimensional extracellular
matrix. Cell Mol Life Sci, 2000; 57: 41-64.
Friedl P, Zanker KS, Brocker EB. Cell migration strategies in 3-D extracellular matrix:
differences in morphology, cell matrix interactions, and integrin function. Microsc Res Tech,
1998; 43: 369-78.
Geiger B. Cell biology. Encounters in space. Science, 2001; 294: 1661-3.
Gunn JW, Turner SD, Mann BK. Adhesive and mechanical properties of hydrogels influence
neurite extension. J Biomed Mater Res A, 2005; 72: 91-7.
Gutala R, Wang J, Hwang YY, Haq R, Li MD. Nicotine modulates expression of amyloid
precursor protein and amyloid precursor-like protein 2 in mouse brain and in SH-SY5Y
neuroblastoma cells. Brain Res, 2006; 1093: 12-9.
Hayman MW, Smith KH, Cameron NR, Przyborski SA. Enhanced neurite outgrowth by
human neurons grown on solid three-dimensional scaffolds. Biochem Biophys Res Commun,
2004; 314: 483-8.
157
Jaworski J, Klapperich CM. Fibroblast remodeling activity at two- and three-dimensional
collagen-glycosaminoglycan interfaces. Biomaterials, 2006; 27: 4212-20.
Khan Z, Ferrari G, Kasper M, Tonge DA, Steiner JP, Hamilton GS, Gordon-Weeks PR.
The non-immunosuppressive immunophilin ligand GPI-1046 potently stimulates regenerat-
ing axon growth from adult mouse dorsal root ganglia cultured in Matrigel. Neuroscience,
2002; 114: 601-9.
Klapperich CM, Bertozzi CR. Global gene expression of cells attached to a tissue engineering
scaffold. Biomaterials, 2004; 25: 5631-41.
Krewson CE, Chung SW, Dai W, Saltzman WM. Cell Aggregation and Neurite Growth
in Gels of Extracellular Matrix Molecules. Biotechnology and Bioengineering, 1994; 43:
555-62.
Lafrenie RM, Bernier SM, Yamada KM. Adhesion to fibronectin or collagen I gel induces
rapid, extensive, biosynthetic alterations in epithelial cells. J Cell Physiol, 1998; 175: 163-73.
Lee JS, Kim IH, Kim SY. Changes in gene expression with increased transglutaminase 2 in
a SH-SY5Y cell line. Front Biosci, 2006; 11: 2774-81.
Li C, Wong WH. Model-based analysis of oligonucleotide arrays: expression index compu-
tation and outlier detection. Proc Natl Acad Sci U S A, 2001; 98: 31-6.
Li S, Lao J, Chen BP, Li YS, Zhao Y, Chu J, Chen KD, Tsou TC, Peck K, Chien S. Genomic
analysis of smooth muscle cells in 3-dimensional collagen matrix. Faseb J, 2003; 17: 97-9.
Lin PW, Wu CC, Chen CH, Ho HO, Chen YC, Sheu MT. Characterization of cortical
neuron outgrowth in two- and three-dimensional culture systems. J Biomed Mater Res B
Appl Biomater, 2005; 75: 146-57.
Lutolf MP, Hubbell JA. Synthetic biomaterials as instructive extracellular microenviron-
ments for morphogenesis in tissue engineering. Nat Biotechnol, 2005; 23: 47-55.

158
Ma W, Fitzgerald W, Liu QY, O’Shaughnessy TJ, Maric D, Lin HJ, Alkon DL, Barker
JL. CNS stem and progenitor cell differentiation into functional neuronal circuits in three-
dimensional collagen gels. Exp Neurol, 2004; 190: 276-88.
Navone F, Consalez GG, Sardella M, Caspani E, Pozzoli O, Frassoni C, Morlacchi E, Sitia
R, Sprocati T, Cabibbo A. Expression of KIF3C kinesin during neural development and in
vitro neuronal differentiation. Journal of Neurochemistry, 2001; 77: 741-53.
O’Connor SM, Stenger DA, Shaffer KM, Ma W. Survival and neurite outgrowth of rat
cortical neurons in three-dimensional agarose and collagen gel matrices. Neurosci Lett,
2001; 304: 189-93.
Pfaffl MW. A new mathematical model for relative quantification in real-time RT-PCR.
Nucleic Acids Res, 2001; 29: e45.
Pfaffl MW, Horgan GW, Dempfle L. Relative expression software tool (REST) for group-wise
comparison and statistical analysis of relative expression results in real-time PCR. Nucleic
Acids Res, 2002; 30: e36.
Pittier R, Sauthier F, Hubbell JA, Hall H. Neurite extension and in vitro myelination within
three-dimensional modified fibrin matrices. J Neurobiol, 2005; 63: 1-14.
Rebhan M, Vacun G, Bayreuther K, Rosner H. Altered ganglioside expression by SH-SY5Y
cells upon retinoic acid-induced neuronal differentiation. Neuroreport, 1994; 5: 941-4.
Rong Y, Sugumaran G, Silbert JE, Spector M. Proteoglycans synthesized by canine inter-
vertebral disc cells grown in a type I collagen-glycosaminoglycan matrix. Tissue Eng, 2002;
8: 1037-47.
Sheehan J, Eischeid A, Saunders R, Pouratian N. Potentiation of neurite outgrowth and
reduction of apoptosis by immunosuppressive agents: implications for neuronal injury and
transplantation. Neurosurg Focus, 2006; 20: E9.
Shiraishi M, Tanabe A, Saito N, Sasaki Y. Unphosphorylated MARCKS is involved in neurite

159
initiation induced by insulin-like growth factor-I in SH-SY5Y cells. J Cell Physiol, 2006;
209: 1029-38.
Sidell N. Retinoic acid-induced growth inhibition and morphologic differentiation of human
neuroblastoma cells in vitro. J Natl Cancer Inst, 1982; 68: 589-96.
Small JV, Stradal T, Vignal E, Rottner K. The lamellipodium: where motility begins.
Trends Cell Biol, 2002; 12: 112-20.
Soumyanath A, Zhong YP, Gold SA, Yu X, Koop DR, Bourdette D, Gold BG. Centella
asiatica accelerates nerve regeneration upon oral administration and contains multiple active
fractions increasing neurite elongation in-vitro. J Pharm Pharmacol, 2005; 57: 1221-9.
Stevens MM, George JH. Exploring and engineering the cell surface interface. Science, 2005;
310: 1135-8.
van der Flier A, Sonnenberg A. Function and interactions of integrins. Cell Tissue Res,
2001; 305: 285-98.
Vicente-Manzanares M, Webb DJ, Horwitz AR. Cell migration at a glance. J Cell Sci, 2005;
118: 4917-9.
Wang YK, Wang YH, Wang CZ, Sung JM, Chiu WT, Lin SH, Chang YH, Tang MJ. Rigidity
of collagen fibrils controls collagen gel-induced down-regulation of focal adhesion complex
proteins mediated by alpha2beta1 integrin. J Biol Chem, 2003; 278: 21886-92.
Wu Y, Sheng W, Chen L, Dong H, Lee V, Lu F, Wong CS, Lu WY, Yang BB. Versican
V1 isoform induces neuronal differentiation and promotes neurite outgrowth. Mol Biol Cell,
2004; 15: 2093-104.
Yamashita T, Higuchi H, Tohyama M. The p75 receptor transduces the signal from myelin-
associated glycoprotein to Rho. J Cell Biol, 2002; 157: 565-70.
Yip PM, Zhao X, Montgomery AM, Siu CH. The Arg-Gly-Asp motif in the cell adhesion
molecule L1 promotes neurite outgrowth via interaction with the alphavbeta3 integrin. Mol
Biol Cell, 1998; 9: 277-90.

160
Yu X, Bellamkonda RV. Dorsal root ganglia neurite extension is inhibited by mechanical
and chondroitin sulfate-rich interfaces. J Neurosci Res, 2001; 66: 303-10.
Yuan JS, Reed A, Chen F, Stewart CN, Jr. Statistical analysis of real-time PCR data. BMC
Bioinformatics, 2006; 7: 85.

Chapter 6
Conclusions and Future Directions
In this thesis, the main objective was to determine the contributions of different classes
of guidance cues individually or in combination to neurite growth, with particular focus
on molecular and topographical guidance cues. The interaction between a cell and its
microenvironment involves a complex mixture of many cues, and no single guidance cue has
been able to elicit directed and functional nerve regeneration. The objective of this thesis was
approached using three strategies: (1) to determine the salient and optimal parameters for
neurite guidance by anisotropic presentation of the extracellular matrix molecules, laminin
(LN) and chondroitin sulfate proteoglycans (CSPG), (2) to determine relationships between
physical three-dimensional (3D) cues and global changes in neuronal behavior, and (3) to
determine the important intracellular and extracellular events necessary for cellular bridging.
Chapter 1 provided a brief overview of the fundamental science behind the development of
nerve repair technologies, with a focus on in vitro studies that have both described cellular
phenomena and elucidated some mechanisms behind these phenomena. As highlighted in
Chapter 1, many in vitro biomaterials platforms have been studied that incorporate cues
with varying molecular cues and micropatterning, topographical features and dimensions,
and microstructural and architectural features, and many of these guidance features have
been included in the design of nerve guidance channels for the application of nerve repair.
The move to using in vitro platforms to further study the mechanisms of nerve growth and
161

162
neuronal interactions with their microenvironments after the observation of promising in
vivo results has given investigators a way to more precisely control the cues presented to
growing or regenerating axons to quantify the resulting cellular behavior. The use of micro-
fabrication techniques also marks an improvement in our ability to control the microscale
features incorporated in the substrates that are used to conduct these studies. Microfab-
rication techniques allow very precise spatiotemporal presentation of both molecules and
geometries of interest. The experimental work in this thesis has made extensive use of mi-
crofabrication techniques such as photolithography, soft lithography, microfluidics and micro
contact printing to deposit precise protein patterns and generate templates with microscale
topographical features.
An underlying goal of this thesis was to select the most appropriate analysis methods for
quantitative evaluation of neurite outgrowth in response to cues presented by in vitro bio-
material platforms. Statistical methods to summarize and describe distributions of cellular
responses have been critical for the analysis of the response of single cells in a population.
Inferential statistics have been heavily used in the present studies to take observed patterns
of neuronal responses and build statistical models that take into account randomness and
uncertainties to draw inferences about the process of neurite guidance by molecular and
topographical cues.
One particular application of circular statistics for the analysis of directional data, in this
case, neurite outgrowth angles, has been described in Chapter 2. Because neurite angles
are directional in nature, where the most suitable presentation of the data is on a circular
scale between 0° and 360°, which wraps upon itself, linear statistical methods that treat
the scale as a unidirectional line forever increasing are not appropriate for analysis of this
type of data. Instead, circular statistical methods have been developed where directional
data is broken down into their vector components and operations for statistical analyses
are performed in the polar coordinate system to account for geometry of the scale. These
methods that include one-sample uniformity tests such as Rayleigh’s, Rao’s and Kuiper’s
tests, and multisample comparison tests such as Watson’s U2 and Mardia-Watson-Wheeler
test have been described and applied to experimental neurite outgrowth data on different

163
substrate types (uniform, striped and gradient) and simulated directional data with known
parameters (mean direction and dispersion).
Future directions for applying directional analysis methods to neurite outgrowth studies
are to apply spherical statistical methods and models developed for datasets in geology and
crystallography to directional neurite outgrowth in 3D cultures. In the case of neurite growth
in 3D cultures, the polar coordinate system would not be sufficient to describe positional
and directional information. The application of spherical statistical models would allow for
better descriptive, correlation and regression methods for analysis of the spatial response of
neurite growth to the spatial organization of the 3D environment.
The first objective of this thesis was to understand which parameters of molecular gradients
would be optimal to promote and guide neurite growth. Anisotropy in molecular concen-
tration had been shown to be able to better guide neurite growth in previous studies, with
the hypothesis that anisotropic presentation of cues is able to exploit a geometry-dependent
differential response in the growth cone that would establish polarity or induce a directional
change in trajectory of growth.
Chapter 3 demonstrated that absolute and relative concentration changes across the growth
cone affect neurite directional growth, and slopes of protein gradients have differential effects
on dorsal root ganglia (DRG) cellular adhesion and neurite growth depending on the presence
of other proteins and protein gradients. Both absolute and relative concentration changes
were found to have an effect on the direction of neurite outgrowth on single cue gradients.
Differential adhesion across the gradient channel was seen for single cue gradients and double
cue contrasting gradients. This response was mainly due to concentration differences over
the channel area. Neurite length was not significantly changed on the substrates tested,
which suggested that these molecules do not play a large role in neurite extension. The
main finding of this chapter was that directional neurite growth was achieved with single
cue and double cue opposing LN and CSPG concentration gradients. Uniformly coated LN
and double cue parallel gradients did not elicit directional growth.
Chapter 4 demonstrated that gradient slope and direction of LN and CSPG had differential

164
effects on cellular adhesion and neurite growth. Cellular addhesion and parallel gradients
responded non linearly to slope of LN and CSPG, as expressed by μg/mL/μm. Opposing
gradients were shown to influence cellular adhesion, and parallel gradients were shown to
influence neurite length. Further analylsis with the ANOVA model showed that LN and
CSPG did not act independently on opposing gradients. Optimization of inlet concentrations
to maximize cellular adhesion and neurite length showed that increasing LN concentration
and decreasing CSPG concentrations were optimal for neurite outgrowth. Appendix B also
demonstrated the effects of Rho GTPases on neurite outgrowth on parallel gradients, which
starts to address the question of the mechanism of cellular response and neurite outgrowth
to these multimolecular gradients.
Future directions for this project include studying the effects of different molecular gradients
and combinations of molecular gradients. Of particular interest would be the optimization
of gradient parameters of both substrate bound factors such as the extracellular matrix
molecules studied here in combination with concentration gradients of soluble growth factors
or chemotropic factors such as nerve growth factor (NGF), brain derived neurotrophic factors
or other neurotrophins. These molecules act on neurons through different signal transduction
pathways and investigation of the intersection of these pathways may provide more insight
into the optimal microenvironments for neurite growth.
Another objective of this thesis was to study the influence of mechanical and physical cues
in 3D on neuron gene expression and morphology. Microarray analysis showed that for SH-
SY5Y neuroblastoma cells, RNA and protein metabolism were upregulated in 3D cultures,
and extracellular matrix gene expression was generally downregulated. Genes regulating
the cytoskeleton were differentially regulated with genes important for cell spreading such
as actinin 1 dependent on dimensionality. Gene expression for neurofilament and the corre-
sponding neurite lengths in 2D versus 3D culture were material-specific, with upregulation of
neurofilament and longer neurites in 3D collagen I cultures, and no change in neurofilament
expression and shorter neurites in 3D Matrigel. Characterization of the biomatrices showed
that collagen I was stiffer and more fibrillar than Matrigel which may have contributed to
these changes.
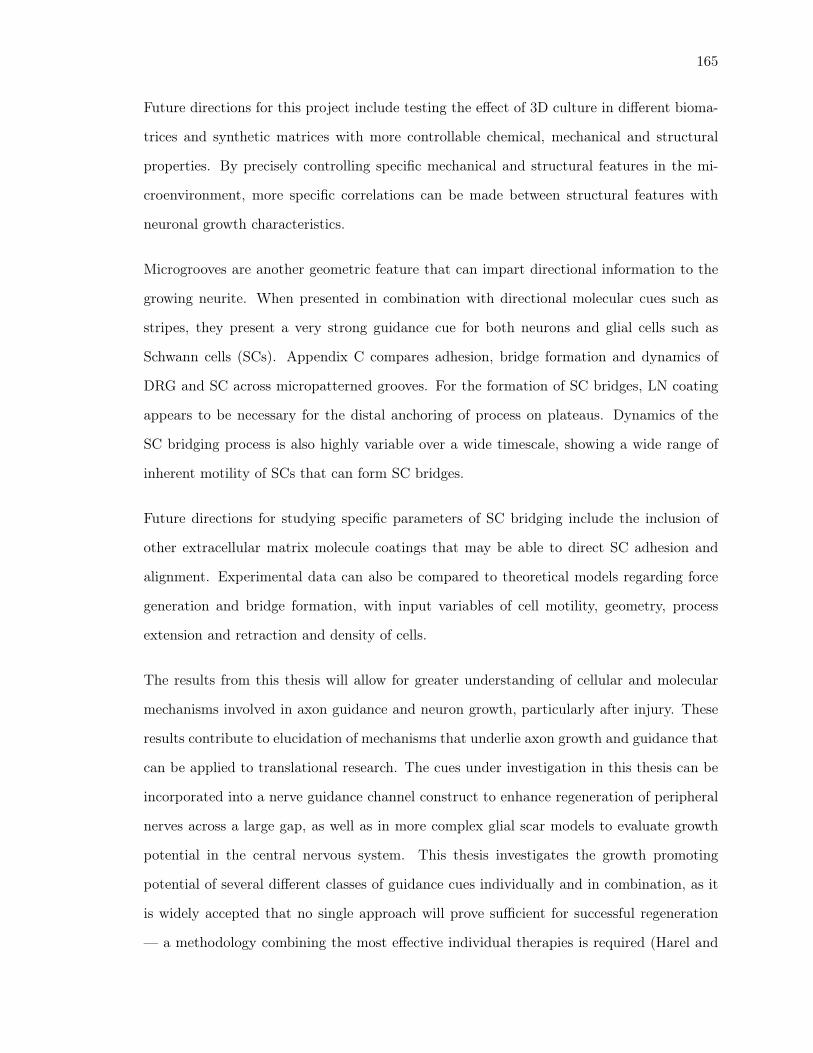
165
Future directions for this project include testing the effect of 3D culture in different bioma-
trices and synthetic matrices with more controllable chemical, mechanical and structural
properties. By precisely controlling specific mechanical and structural features in the mi-
croenvironment, more specific correlations can be made between structural features with
neuronal growth characteristics.
Microgrooves are another geometric feature that can impart directional information to the
growing neurite. When presented in combination with directional molecular cues such as
stripes, they present a very strong guidance cue for both neurons and glial cells such as
Schwann cells (SCs). Appendix C compares adhesion, bridge formation and dynamics of
DRG and SC across micropatterned grooves. For the formation of SC bridges, LN coating
appears to be necessary for the distal anchoring of process on plateaus. Dynamics of the
SC bridging process is also highly variable over a wide timescale, showing a wide range of
inherent motility of SCs that can form SC bridges.
Future directions for studying specific parameters of SC bridging include the inclusion of
other extracellular matrix molecule coatings that may be able to direct SC adhesion and
alignment. Experimental data can also be compared to theoretical models regarding force
generation and bridge formation, with input variables of cell motility, geometry, process
extension and retraction and density of cells.
The results from this thesis will allow for greater understanding of cellular and molecular
mechanisms involved in axon guidance and neuron growth, particularly after injury. These
results contribute to elucidation of mechanisms that underlie axon growth and guidance that
can be applied to translational research. The cues under investigation in this thesis can be
incorporated into a nerve guidance channel construct to enhance regeneration of peripheral
nerves across a large gap, as well as in more complex glial scar models to evaluate growth
potential in the central nervous system. This thesis investigates the growth promoting
potential of several different classes of guidance cues individually and in combination, as it
is widely accepted that no single approach will prove sufficient for successful regeneration
— a methodology combining the most effective individual therapies is required (Harel and

166
Strittmatter, 2006; Schwab, 2002).
In specific aim 1, neurite growth responses to specific parameters of molecular concentration,
slope and direction were quantified in vitro. From a basic science perspective, understanding
the specific contributions of two important molecules present in the glial scar in combination
may inform applications in nerve tissue engineering that aim to direct neurites in a partic-
ular direction. From an application perspective, using these optimized parameters in more
complex glial scar models would allow more direct evaluation of the regenerative potential
of externally applying concentration gradients in a post-injury environment. Translational
research that uses anisotropic presentations of molecules in the context of peripheral nerve
repair are discussed in Bellamkonda (Bellamkonda, 2006), where distribution of permissive
factors such as substrates (hydrogels/fibers), extracellular matrix (ECM) proteins or pep-
tides (LN), trophic factors (NGF), and glial cells were identified as essential components of
grafts. The specific parameters identified in specific aim 1 would suggest optimal ranges and
presentations of these essential components.
In specific aim 2, global changes in gene expression and morphology in response to dimension
were quantitatively assessed. From a basic science perspective, we have identified several
hundreds of genes that were up or down regulated simply by the change in the dimension
of culture conditions. These genes can be further investigated to address the question of
how 2D in vitro studies may relate to 3D in vivo studies. In vitro studies in 2D offer the
advantage of simplicity in experimental design, operation and analysis, but parallels cannot
be drawn directly. By identifying and understanding the specific differences between 2D
and 3D on a global scale, better platforms using tissue engineered approaches in 2D and
3D can be developed for the study of axon growth and guidance. From an application
perspective, all in vivo experiments are by necessity in 3D, but understanding the specific
effects of 2D versus 3D on neurons may allow for the design of substrates that exploit the
permissiveness of both types of geometry by distributing 2D-like substrates/surfaces in 3D
space, as suggested by Bellamkonda (Bellamkonda, 2006).
In specific aim 3, molecular and topographical cues were able to affect cellular bridging.

167
From an axon guidance perspective, cellular bridging appears to be a side effect of contact
guidance, where a subset of cells does not extend in the direction of the longitudinal axis
of grooves, but rather perpendicular it. From a basic science perspective, characterization
of the cellular bridges and their associated cell functions such as process extension, cellular
motility and force generation allows us to understand how this process occurs. From an
application perspective, spinal cord lesions have shown cysts and scars (Schwab, 2002) and
bridging may be useful to span areas of cysts, as there is no underlying support available
for cellular growth in those injured areas.
The studies described in this thesis have quantified cellular responses to specific extracel-
lular guidance cues. This information can be used both to add to the body of knowledge
of how axons grow and make growth decisions, both in development and after and injury,
and also applied to translational research as more precise methods of presenting guidance
cues become available. More generally, future directions for studying the specific effects
of protein gradients on neurite outgrowth include the investigation of focal adhesions to
specific ligands on the single cell level. Quantitative information on the spatial and tempo-
ral interactions of specific receptors on the cell surface with the molecules presented, and
intracellular organization would elucidate the mechanisms by which gradient sensing oc-
curred. The investigation of ligand-target patterns such as integrin clustering and activity
and organization of cytoskeletal elements such as actin or microtubules and the activity
of key signaling molecules such as Rho kinase would provide more detailed information on
how neurons respond to these molecular cues. By understanding the specific roles of these
intracellular signaling elements, we can begin to build a model of how a cell responds to a
complex environment such as the in vivo environment. Currently the studies in this thesis
contribute to the body of basic science knowledge regarding axon growth and guidance. Fu-
ture studies with a goal towards informing translational research using similar presentations
of guidance cues in more complex injury models can provide quantitive information to the
problem of nerve regeneration.

168
References
Bellamkonda RV. Peripheral nerve regeneration: an opinion on channels, scaffolds and
anisotropy. Biomaterials, 2006; 27: 3515-8.
Harel N, Strittmatter S. Can regenerating axons recapitulate developmental guidance during
recovery from spinal cord injury? Nat Rev Neurosci. 2006; 7(8): 603–616.
Schwab M., Repairing the Injured Spinal Cord. Science. 2002: 295(5557): 1029 - 1031

Appendix A
Tissue Engineered Platforms of Axon
Guidance
The following appendix has been published as shown in Tissue Engineering, Part B.
169

170
Tissue-Engineered Platforms of Axon Guidance
GRACE N. LI, M.Eng., and DIANE HOFFMAN-KIM, Ph.D.
ABSTRACT
Tissue engineering provides a valuable tool for in vitro investigation of complex in vivo environments.A particular application of tissue-engineered in vitro platforms in neuroscience and regenerative medicineis the fabrication of controlled microenvironments for the study of axon guidance, with the goal of in-forming strategies to overcome nerve injury. The innovative design of tissue-engineered scaffolds thatincorporate multiple guidance cues and cell types into various environments is advancing the under-standing of how neurons integrate guidance information to make growth decisions. This review focuses onrecent strategies that present neurons with multiple cues with micro- and nanoscale resolution in order tostudy the interactions between neurons and their local environment during axon guidance.
INTRODUCTION
AXON GUIDANCE HAS BEEN a topic of study in neuroscience
for many decades in developmental neurobiology and
in nerve regeneration, and many cues have been identified
that influence axon pathfinding. A number of these guidance
cues are soluble factors such as ephrins, netrins, and sema-
phorins.1–5 Other categories of guidance cues include bound
factors that guide through neuron–matrix interactions,6–9 to-
pographical cues that influence nerve growth through contact
guidance,10–15 and electrical cues that affect the rate and di-
rection of nerve growth.16–18 Experimental research using
traditional biological techniques has provided valuable in-
formation regarding the neuronal response to individual
guidance cues. However, the local environment that growing
nerves face is inherently complex and contains a rich mixture
of cues whose collective influence on growing nerves is not
completely understood. Biomedical engineers and neurosci-
entists have employed tissue engineering techniques to model
the complex in vivo environment of the nervous system as
a means of isolating and studying the specific interactions
between these cues and the neurons on which they act.
Historically, tissue engineering strategies have been used
in efforts to develop therapies for peripheral nerve and spi-
nal cord injury, combining biomaterials, cell therapy, and
drug delivery approaches.19–23 Strategies for nervous system
repair include preventing cell death by delivering anti-
inflammatory agents and neuroprotective agents and pro-
moting axonal growth to appropriate targets. The intrinsic
growth capacity of cells and the extracellular environment
contribute to the capability of axon regeneration. Manip-
ulating the cells’ local microenvironment has been a partic-
ular focus of much research, from nerve grafts to engineered
constructs. Regenerative repair in the peripheral nervous
system (PNS) is thought to be possible because of the
presence of growth-promoting cues provided by supportive
glia (i.e., Schwann cells; SCs),macrophages, andmonocytes.
More serious injuries to the PNS require surgical interven-
tion, most commonly autologous nerve grafts (reviewed
in24,25). The central nervous system (CNS) has much poorer
regenerative capacity because of the inhibitory post-injury
environment composed of degenerating myelin and the glial
scar, formed by hypertrophic reactive astrocytes. Similar
transplantation strategies for CNS injuries using embryonic
spinal cord26 or peripheral nerve tissue have met with lim-
ited success (reviewed in 27). The conventional paradigm of
tissue engineering, in which cells and scaffold materials are
combined to replace or regenerate diseased or injured tissue,
initially seemed particularly applicable to the problems of
nerve injury. However, it has been found that success-
ful nerve regeneration with complex, precise connections
requires more than the substitution of engineered tissue for
Department of Molecular Pharmacology, Physiology, and Biotechnology, Brown University, Providence, Rhode Island.
TISSUE ENGINEERING: Part BVolume 14, Number 1, 2008# Mary Ann Liebert, Inc.DOI: 10.1089/teb.2007.0181
33

171
injured tissue. A consensus has emerged that it will ulti-
mately require the coordinated presentation of multiple
permissive signals to be incorporated into tissue-engineered
biomaterial platforms designed to promote regrowth.
Hence, understanding the mechanisms underlying axon
guidance by multiple cues is a critical aspect of nerve re-
generation and one that can best be addressed using tissue
engineering approaches. Evans28 has reviewed the strategies
for traditional tissue-engineered constructs for nerve repair
according to component: scaffolds, support cells, growth
factors, and extracellular matrix (ECM). Scaffolds are
biomaterials-based and can be biological or synthetic.29
Support cells include glial cells of the CNS and PNS, neural
progenitor cells (NPCs), and cells genetically modified to
secrete growth-promoting molecules.30–32 Growth factors
can improve neuronal viability and increase neurite initia-
tion and outgrowth. ECM can increase cellular adhesion,
migration, and neurite initiation and extension. Incorpora-
tion of these permissive molecules is one way of promoting
axogenesis and neurite growth.
In 1993, Langer and Vacanti described tissue engineering
as ‘‘an interdisciplinary field that applies the principles of
engineering and life sciences toward the development of bi-
ological substitutes that restore, maintain, or improve tissue
function or a whole organ.’’33 More recently, MacArthur and
Oreffo defined tissue engineering as ‘‘understanding the prin-
ciples of tissue growth, and applying this to produce func-
tional replacement tissue for clinical use.’’34 Here we employ
both these descriptions in combination to provide the context
for this review.
Tissue engineering approaches can be used to create more
in vivo–like platforms for studies of axon guidance, because
they allow the generation of precisely controlled microenvi-
ronments that mimic specific features of the local in vivo
environment. These platforms can incorporate 3 dimensions,
cocultures of different cell types, and defined presentation
of molecules to enable the study of key neuronal functions.
One particular advantage of tissue-engineered platforms of
neural microenvironments is that they can present several
types of cues in a synergistic or a competitive manner to
elucidate their relative importance (Fig. 1). This article will
review studies from the past 5 years that employ tissue-
engineering approaches to advance the understanding of the
effects of the local microenvironment on axon guidance.
(See Table 1 for overview.)
PRESENTATION OF MOLECULAR CUESAS GRADIENTS AND MICROPATTERNS
Axon guidance by concentration gradients of soluble
guidance cues has been studied extensively in vitro. Trophic
factors such as nerve growth factor (NGF), brain-derived
neurotrophic factor (BDNF), insulin-like growth factor
(IGF-1, IGF-2), and fibroblast growth factor (FGF) have
been found to elicit turning of growth cones toward the
molecule of interest.35–37 Gene therapy experiments using
lentiviral vectors expressing NT-338 have shown that greater
growth through and beyond the inhibitory glial scar region is
achievable, but longer distance growth was not obtainable
with the trophic stimulus alone, because the presence of a
continuing growth factor gradient beyond the lesion did not
stimulate growth into those areas. The complexity of the
local post-injury CNS environment has motivated the de-
velopment of in vitro models of the glial scar, which have
largely focused on patterning the chemical cues present,
particularly permissive laminins (LNs) and inhibitory chon-
droitin sulfate proteoglycans (CSPGs39,40). More recently,
neurite outgrowth assays have also incorporated peptides
that correspond to locations of cell-binding sites on permis-
sive extracellular molecules such as LN or fibronectin (FN).
These key peptides include arg-gly-asp (RGD),41 ile-lys-
val-ala-val (IKVAV),42 and tyr-ile-gly-ser-arg (YIGSR),43,44
which have been shown to mediate cell attachment,
spreading, migration, and neurite outgrowth; they have been
incorporated into assays evaluating the effect of molecular
FIG. 1. Types of guidance cues incorporated into in vitro tissue-engineered platforms to investigate axon guidance and growth.
34 LI AND HOFFMAN-KIM

172
TABLE 1. OVERVIEW OF AXON GUIDANCE CUES
Cue Cellular response Reference
Molecular gradients
CSPG Growth towards [CSPG] [49]
EphrinA5 Growth towards low [EphrinA5] [48]
IKVAV Growth towards high [IKVAV] [7]
LN Growth towards high [LN] [8], [49], [98]
Molecular micropatterns
Fibronectin Neurite attachment dependent on stripe width [54]
LN Neurite extension on micropatterns only [52], [59]
Electrical cues
Endogenous Migration, differentiation, wound healing, neurite
extension
[60], [61]
Direct current Increase branching, growth rate [17], [66]
Synchronize firing, induce polarity [62], [63]
Astrocyte alignment [76]
Pulsed electromagnetic field Enhanced differentiation of PC12, inhibited
neurite extension
[67], [68]
Combined electrical and molecular cues
Electrical stimulation with NGF Longer neurite growth on substrates with pPy
and NGF than pPy alone
[56]
Structural and mechanical cues
Agarose Synergy between NT-3 and NGF [94]
GRGDS channels preferred [58]
Collagen Longer neurites in 3D [86]
Increased neurite length and interfiber diameter
on soft substrates
[85], [93]
Matrigel Longer neurites in 2D [86]
Induced axogenesis [92]
Polyacrylamide Longer neurites formed on stiffer substrates [103]
Topographical cues
Microchannels Neurites directed along grooves [10]
Microchannels with NGF Longest neurites observed with combined NGF
and topography
[106]
Neuritogenesis with sub-optimal [NGF] reduced
on nanogrooves
[107]
Microchannels with pLL Neurites extended only where pLL was present [109]
Microgrooves coated with LN Neurite alignment and ‘‘bridging’’ [13]
SC topography Neurite growth along SC topography pattern [126]
Cellular cues
Aligned astrocytes Astrocyte monolayer directed progenitor cell
growth
[122]
Aligned OEC/ONF Neurites oriented and grew in the direction of
glial cell culture
[124]
Aligned SC DRG neurites aligned to SC monolayer [31]
Nerve guidance channels
Alginate gels More myelinated axons and SC migration in vivo [143]
Collagen Gel contraction, uniaxial alignment of collagen
fibrils in vitro
[84]
Increase in myelinated axons in gels with RGD
in vivo
[84], [140], [143]
Ethylene vinyl acetate with NGF or GDNF Nerve cables, myelinated axons, motoneurons,
and DRG neurons supported in vivo
[135]
Fibrin gels with NT-3 Cellular infiltration after 9 days in vivo [38, 143]
PLA, PLGA Stimulate DRG neurite outgrowth in vitro [137]
Cellular infiltration observed after 13 days in vivo [148]
TISSUE-ENGINEERED PLATFORMS OF AXON GUIDANCE 35
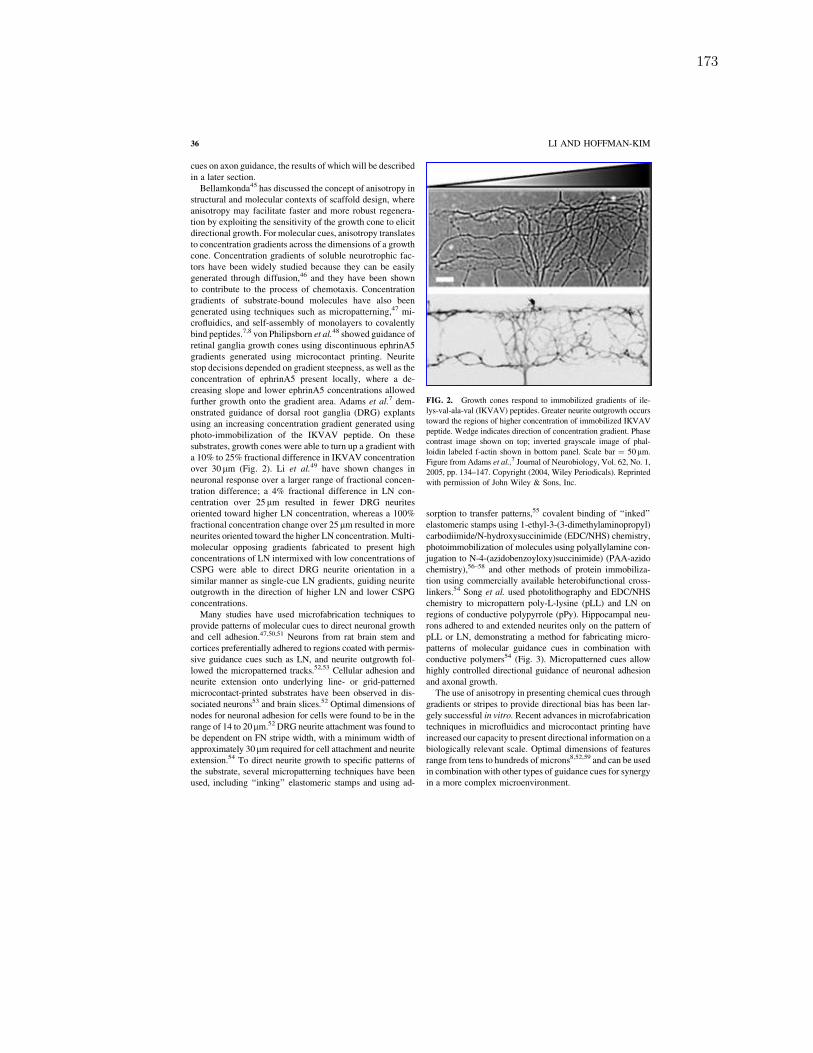
173
cues on axon guidance, the results of which will be described
in a later section.
Bellamkonda45 has discussed the concept of anisotropy in
structural and molecular contexts of scaffold design, where
anisotropy may facilitate faster and more robust regenera-
tion by exploiting the sensitivity of the growth cone to elicit
directional growth. For molecular cues, anisotropy translates
to concentration gradients across the dimensions of a growth
cone. Concentration gradients of soluble neurotrophic fac-
tors have been widely studied because they can be easily
generated through diffusion,46 and they have been shown
to contribute to the process of chemotaxis. Concentration
gradients of substrate-bound molecules have also been
generated using techniques such as micropatterning,47 mi-
crofluidics, and self-assembly of monolayers to covalently
bind peptides.7,8 von Philipsborn et al.48 showed guidance of
retinal ganglia growth cones using discontinuous ephrinA5
gradients generated using microcontact printing. Neurite
stop decisions depended on gradient steepness, as well as the
concentration of ephrinA5 present locally, where a de-
creasing slope and lower ephrinA5 concentrations allowed
further growth onto the gradient area. Adams et al.7 dem-
onstrated guidance of dorsal root ganglia (DRG) explants
using an increasing concentration gradient generated using
photo-immobilization of the IKVAV peptide. On these
substrates, growth cones were able to turn up a gradient with
a 10% to 25% fractional difference in IKVAV concentration
over 30 mm (Fig. 2). Li et al.49 have shown changes in
neuronal response over a larger range of fractional concen-
tration difference; a 4% fractional difference in LN con-
centration over 25 mm resulted in fewer DRG neurites
oriented toward higher LN concentration, whereas a 100%
fractional concentration change over 25 mm resulted in moreneurites oriented toward the higher LN concentration. Multi-
molecular opposing gradients fabricated to present high
concentrations of LN intermixed with low concentrations of
CSPG were able to direct DRG neurite orientation in a
similar manner as single-cue LN gradients, guiding neurite
outgrowth in the direction of higher LN and lower CSPG
concentrations.
Many studies have used microfabrication techniques to
provide patterns of molecular cues to direct neuronal growth
and cell adhesion.47,50,51 Neurons from rat brain stem and
cortices preferentially adhered to regions coated with permis-
sive guidance cues such as LN, and neurite outgrowth fol-
lowed the micropatterned tracks.52,53 Cellular adhesion and
neurite extension onto underlying line- or grid-patterned
microcontact-printed substrates have been observed in dis-
sociated neurons53 and brain slices.52 Optimal dimensions of
nodes for neuronal adhesion for cells were found to be in the
range of 14 to 20mm.52 DRG neurite attachment was found tobe dependent on FN stripe width, with a minimum width of
approximately 30mm required for cell attachment and neuriteextension.54 To direct neurite growth to specific patterns of
the substrate, several micropatterning techniques have been
used, including ‘‘inking’’ elastomeric stamps and using ad-
sorption to transfer patterns,55 covalent binding of ‘‘inked’’
elastomeric stamps using 1-ethyl-3-(3-dimethylaminopropyl)
carbodiimide/N-hydroxysuccinimide (EDC/NHS) chemistry,
photoimmobilization of molecules using polyallylamine con-
jugation to N-4-(azidobenzoyloxy)succinimide) (PAA-azido
chemistry),56–58 and other methods of protein immobiliza-
tion using commercially available heterobifunctional cross-
linkers.54 Song et al. used photolithography and EDC/NHS
chemistry to micropattern poly-L-lysine (pLL) and LN on
regions of conductive polypyrrole (pPy). Hippocampal neu-
rons adhered to and extended neurites only on the pattern of
pLL or LN, demonstrating a method for fabricating micro-
patterns of molecular guidance cues in combination with
conductive polymers54 (Fig. 3). Micropatterned cues allow
highly controlled directional guidance of neuronal adhesion
and axonal growth.
The use of anisotropy in presenting chemical cues through
gradients or stripes to provide directional bias has been lar-
gely successful in vitro. Recent advances in microfabrication
techniques in microfluidics and microcontact printing have
increased our capacity to present directional information on a
biologically relevant scale. Optimal dimensions of features
range from tens to hundreds of microns8,52,59 and can be used
in combination with other types of guidance cues for synergy
in a more complex microenvironment.
FIG. 2. Growth cones respond to immobilized gradients of ile-
lys-val-ala-val (IKVAV) peptides. Greater neurite outgrowth occurs
toward the regions of higher concentration of immobilized IKVAV
peptide. Wedge indicates direction of concentration gradient. Phase
contrast image shown on top; inverted grayscale image of phal-
loidin labeled f-actin shown in bottom panel. Scale bar ¼ 50mm.Figure from Adams et al.,7 Journal of Neurobiology, Vol. 62, No. 1,
2005, pp. 134–147. Copyright (2004, Wiley Periodicals). Reprinted
with permission of John Wiley & Sons, Inc.
36 LI AND HOFFMAN-KIM

174
PRESENTATION OF ELECTRICAL CUES
Endogenous electric fields in the form of voltage gradients
have been observed to polarize the nervous system along the
rostral–caudal axis during development (5–18mV/mm)60
and direct nerve growth and accelerate wound healing in the
rat cornea (þ 40mV/0.5mm).61 Steady direct-current elec-tric fields applied in vitro in solution (< 40mV/mm) havebeen shown to synchronize neuronal firing patterns in hip-
pocampal slices;62 induce polarization of pyramidal neu-
rons;63 and affect neurite orientation, branching, and growth
rate of Xenopus neurons in vitro.17 Firing patterns in neu-
ronal networks have been shown to respond to weaker
electric fields (140 mV/mm rms, 295 mV/mm peak ampli-
tude) than single neurons (185 mV/mm rms, 394 mV/mmpeak amplitude).62 Hence, electrical stimulation is thought
to have a significant effect on neurite differentiation and
extension. Parameters for optimization include frequency,
orientation, flux density, and wave form (direct current or
pulsed electromagnetic field).
Initial studies investigating the effect of electrical stimu-
lation on neurons were performed on Xenopus neurons ex-
posed to a steady direct current field. Extracellular electric
fields (0.1–10V/cm) applied in solution reversibly influenced
the direction of neurite growth and increased neurite initia-
tion and length in Xenopus.17 Primary cell types such as
embryonic chick DRGs were also used to assess the effects
of electric fields; neurites grew faster, turned, and branched
preferentially towards the cathode (25V/m, 10min dura-
tion).64 PC12 cells, a culture line derived from a rat adrenal
medulla pheochromocytoma, are widely used as a model
system for neuronal differentiation and studying the mech-
anism of action of NGF,65 particularly in studies of electrical
stimulation. PC12 cells and their subline PC6 cells respond
to NGF by shifting from a chromaffin cell-like phenotype to
a neurite-bearing sympathetic neuron-like phenotype in a
highly regular and dose-dependent manner,66 and much re-
search has been conducted to study the effects of electro-
magnetic fields on this particular type of NGF-stimulated
neurite outgrowth of PC12 cells.
Magnetic fields have enhanced neuronal differentiation in
PC12 cells, whereas they have inhibited neurite growth.
Morgado-Valle et al.67 have shown that low-frequency
magnetic fields (0.7mT, 2 h/day for 5 days, 60Hz) enhanced
differentiation of PC12 cells to a neuronal phenotype, a
process sensitive to modulation of L-Ca2þ channels by
channel agonists and blockers. Blackman et al.68 have shown
that a direct action of magnetic fields (100mT, sinusoidal,
FIG. 3. Dorsal root ganglia neurons follow micropatterns of poly-L-lysine–laminin immobilized on polyglutamic acid–doped poly-
pyrrole network at nodes (A) and on channels (B). Neurites stained positive for GAP-43 (green fluorescence). Cell nuclei were labeled
with 40,6-diamidino-2-phenylindole (blue fluorescence). Neurons preferentially adhere and neurites preferentially extend on micro-patterns. Figure reprinted from Biomaterials, Vol. 27, No. 3, Song et al.Micropatterns of positive guidance cues anchored to polypyrrole
doped with polyglutamic acid: A new platform for characterizing neurite extension in complex environments, pp. 473–484. Copyright
(2005), with permission from Elsevier.59 Color images available online at www.liebertpub.com/ten.
TISSUE-ENGINEERED PLATFORMS OF AXON GUIDANCE 37

175
50Hz) inhibits NGF-stimulated neurite outgrowth of PC12
cells. Pulsed electromagnetic fields have been found to de-
press DRG neurite growth69 (15A, 20 ms pulse duration, 10–25Hz) and PC6 cells70 (0.3mT, 20ms pulse duration, 2Hz)
when cultured with NGF. The degree of pulsation (10–100%
or direct current) had an effect on PC6 neurite initiation and
extension, where low pulse duty (10%) results in a lower
percentage of neurons with longer neurites, and conversely,
direct current does not inhibit neurite initiation, although
neurite lengths are decreased.71 Varying experimental con-
ditions investigating the effects of magnetic fields on neurite
outgrowth have made direct comparisons across different
studies difficult. Future work to standardize these parame-
ters would allow better comparisons to enable optimization
of these factors.
Molecules present in the environment under electrical
stimulation can affect the cellular response to an applied
electric field.16,72,73 Novel biomaterial platforms have been
developed to study the effects of electrical activity presented
on conducting surfaces in combination with molecular cues.
An applied constant current or constant voltage can enhance
axonal extension in vitro from neurons adhered to substrates
coated with the conductive polymer pPy.18,72 Gomez and
Schmidt57 compared the effects of electrical stimulation on
PC12 cell neurite growth when cultured on pPy alone and on
pPy with NGF. They observed longer neurites on constant
electrically stimulated (100mV, 2 h) pPy–NGF substrates,
than on pPy substrates without NGF. Electrical stimulation
can also be incorporated into biomaterial platforms as a tool
for drug delivery to deliver growth factors to promote nerve
growth. Richardson et al. incorporated neurotrophin-3 (NT-3)
in a film of pPy doped with p-toluene sulphonate galvano-
statically grown on gold electrodes. NT-3 was released using
electrical stimulation (1mA, 100-ms pulse), and neurite out-growth from auditory neurons (spiral ganglion neuron ex-
plants) was enhanced.74 The development of these tailored
biomaterial platforms allows systematic investigation of
the contributions of different types of cues in the neuronal
environment.
Electric fields have been found to influence the growth of
other cell types. Electrical gradients (> 10mV/mm) directneural crest cell migration toward the cathode.75 Of interest
for axon guidance is the effect of electrical stimulation on
astrocytes.76 On a cell culture platform that presented
electrical current in solution to multiple culture chambers,
astrocytes aligned after exposure to 1.63mA for 24 h.
These substrates were then used to direct DRG neurites,
which will be discussed in a later section.
PRESENTATION OF CUES IN 3 DIMENSIONS
Comparisons of cellular growth in standard 2-dimensional
(2D) monolayer cultures and 3-dimensional (3D) matrix
cultures that more closely resemble in vivo environments
have shown clear phenotypic differences. For example,
previous studies have revealed differences in cell surface
area, stress fiber distribution, cell migration, focal adhesions,
neurite and growth cone dimensions, and protein and gene
expression. Tissue engineering approaches have allowed the
development of assay formats that include the third dimension
as a controllable and defined parameter and are used to elu-
cidate cell–material interactions between neurons and their
ECM. Three-dimensional matrices that have been explored
include biologically based matrices such as alginate,77–79
collagen I,80–86 Matrigel,79,86 and fibrin,87,88 as well as syn-
thetic polymer-based scaffolds such as poly lactic acid
(PLA),89,90 poly lactic-co-glycolic acid (PLGA), and aga-
rose.91 Studies have characterized 3Dmatrices with regard to
their chemical and mechanical properties and their ability to
support neuronal growth. Collagen gels have been used
successfully to differentiate neural stem cells81 and NPCs83
with FGF in the culture medium, and functional synapses
have formed in the cultures.81 Addition of Matrigel to rat
sympathetic neurons plated onpLLsubstrates has been shown
to induce rapid axogenesis with corresponding changes in
microtubule organization. Another aspect of differential
regulation of neuronal cell culture in 3D can be reflected in
the global gene expression of neurons. Li et al.86 showed,
using microarray analysis, that differentially regulated genes
between 2D and 3D culture of SH-SY5Y neuroblastoma cells
included those involved in cytoskeletal reorganization, ECM,
metabolism, and signaling. Gene expression trends were
maintained over cultures in different matrices (collagen and
Matrigel), but morphological differences in 2D and 3D cul-
tures such as cell spreading and neurite growth appeared to be
material-specific. The stiffer 3Dmatrix of collagen supported
longer neurites than 2D collagen, whereas in the softer Ma-
trigel, neurons in 3D extended shorter neurites than neurons
in 2D.
Combining 3D environments with molecular guid-
ance cues for neurite outgrowth to study the effects of cues
in a more in vivo–like environment is a logical exten-
sion of neuronal assay formats in 3D. Neurotrophic factors
can be incorporated into 3D cultures by the addition of
growth factors to culture medium92 or in a more con-
trolled manner by covalent linkages between the growth
factor and the matrix.58,93–95 Steepness of NGF gradients
was found to attract DRG46 and PC1295 neurite growth
up the concentration gradient on collagen gels46 and
poly(2-hydroxyethylmethacrylate),95 respectively. Cao and
Shoichet96 observed a synergistic effect on DRG outgrowth
with NGF and NT-3 presented in 3D agarose. When NT-3
was applied individually, there was no directional growth.
When the 2 growth factors were applied together, the guid-
ance range of neurites toward higher concentrations of
NGF and NT-3 exceeded the guidance range of an NGF
gradient alone. Deister and Schmidt92 adapted a DRG ex-
plant assay in a shallow collagen gel to study the combina-
tions of neurotrophic factors in culture. After adding NGF,
glial-derived neurotrophic factor (GDNF), and ciliary neuro-
trophic factor (CNTF) individually and in combination,
38 LI AND HOFFMAN-KIM

176
total neurite outgrowth and length were evaluated. The
combination of 3 factors led to greater neurite outgrowth
and length than in cultures containing individual factors at
the optimal concentration, implying that interactions be-
tween neurotrophic factors can increase neuronal respon-
siveness in 3D.
Incorporation of ECM molecules in a 3D matrix has
also been investigated.91,93,97 Neuroblastoma cells showed
greater cell adhesion on alginate gels that were coated with
LN or covalently linked to YIGSR peptide and greater
neurite number and length on YIGSR peptide–linked gels in
a ligand density-dependent manner.78 Luo and Shoichet58
have demonstrated that DRG neurites will grow preferen-
tially in channels modified to present GRGDS peptide in a
3D agarose gel. Dodla and Bellamkonda91 have shown that
concentration gradients of photo-immobilized LN-1 in 3D
agarose gels can direct DRG neurite growth in the direction
of higher LN-1 concentration. Furthermore, gels presenting
concentration gradients of LN-1 promote faster neurite ex-
tension than gels presenting isotropic LN-1 concentrations,
which implies that patterning of chemical cues may be a
separate parameter to be optimized within the complexity of
the 3D environment (Fig. 4). Embryonic cortical neurons
have been challenged with choices between competing
growth options of poly-D-lysine (PDL), 3D Matrigel, and
microtopography. When presented with 2D PDL-adsorbed
surfaces and an intermediate layer of 3D-gelled Matrigel,
neurons appeared to prefer PDL-coated 2D surfaces. When
presented with 2D PDL-adsorbed surfaces, 3DMatrigel, and
grooved topography (3.5–15 mm), neurites preferred to ex-tend into the 3D gel layer of Matrigel rather than along PDL
surfaces (walls and grooves) of the topographical substrates,
differing from the result of neurite turning into grooves in
the absence of Matrigel. Growth cones therefore make
growth decisions that balance permissiveness and obstacles
in topography and 3D architecture, resulting in directional
growth to minimize turning while remaining on the most
permissive substrate available.98
The progression of tissue-engineering platforms from 2D
to 3D has been widely noted. The capacity to integrate
guidance cues of interest in a specific and controlled manner
has enabled researchers to add a layer of complexity to
in vitro systems for axon guidance to more closely mimic the
local in vivo environment while maintaining the ability for
quantitative analysis.
PRESENTATION OF MATERIALAND PHYSICAL CUES
Physical and mechanical cues such as stiffness have been
known to affect a multitude of cell functions such as ad-
hesion, proliferation, migration, differentiation, and mor-
phology. Durotaxis has been observed in many cell types,
including neurons.99 Neurite extension during development
and after an injury requires mechanical interactions be-
tween growth cone and substrate. Parameters that have
been shown to influence DRG neurite extension include
substrate mechanical properties,100 ligand concentration,101
and geometry. Mechanical effects appear to be highly de-
pendent on cell type and the range of moduli presented.
Leach et al.102 tested the NGF-dependent response of PC-
12 cells on polyacrylamide substrates with varying stiff-
ness, and by controlling the amount of FN present, kept the
adhesive ligand concentration constant over the samples
tested. The range of substrate stiffness tested (7–19 kPa)
spanned the physiological range as well as ‘‘very soft’’ and
‘‘very stiff ’’ substrates. A threshold response was observed
in which the softest substrates supported fewer and shorter
neurites but above a threshold of approximately 100Pa,
longer and more branched neurites were observed regardless
of increasing shear modulus of the substrate. Willits and
Skornia85 studied the effects of mechanical stiffness on chick
DRG neurons. By varying the concentration of collagen used
to gel the matrix, varying stiffnesses (2.2–17 Pa) were gen-
erated. After 4 days in culture, softer matrices resulted in
longer neurite lengths. In this experimental setup, it is in-
teresting to note that an increase in interfiber diameter cor-
responds to a decrease in mechanical stiffness and collagen
concentration, a geometric constraint that may contribute to
the observed cellular response. Analysis and modeling sug-
gested complex non-linear cell–material interactions.
Mechanical stiffness has been found to influence other
cell types, including astrocytes.103 On soft gels of poly-
acrylamide with a shear modulus of 200 Pa, suppression of
astrocyte growth has been observed in monoculture and
coculture experiments, with low attachment and spreading
and disorganized F-actin. This behavior is in contrast to the
growth of cortical neurons on the same soft substrates tested;
coculture experiments show a significantly higher propor-
tion of cortical neurons than astrocytes on the soft than on
the hard (9 kPa shear modulus) substrates.103 These studies
point toward the development of materials tailored to sup-
port specific cell populations within the nervous system.
PRESENTATION OF TOPOGRAPHICAL CUES
A number of studies have drawn attention to the fact that
interactions with a 3D extracellular microenvironment in-
fluence neuronal growth. Topographical cues influence nerve
growth and regeneration using contact guidance and can be
combined with adhesion molecules that also play a role in
contact guidance. Neurons have the capacity to respond to
topographical features in their microenvironments, and they
have been shown to adhere, migrate, and orient their axons
to navigate surface features such as grooves in substrates in
the micro- and nanoscales. Using microfabrication tech-
niques such as photolithography and soft lithography, to-
pographic guidance of neurite outgrowth has been explored
in vitro with culture substrates that contain well-defined
micropatterned features. Mahoney et al.10 studied the effects
TISSUE-ENGINEERED PLATFORMS OF AXON GUIDANCE 39

177
of microchannels of 20 to 60 mm in width and 11 mm in depthon PC12 cell cultures. Neurites were directed along the axis
of the grooves, with microchannels of 20 to 30 mm being
most effective at neurite direction. Polypropylene filaments
have been found to direct DRG neurites and SCs from DRG
explants along the long axis of the filaments tested with an
optimal filament diameter of 5 mm. The addition of FN and
LN coatings on the filaments led to greater maximal neurite
lengths than with uncoated controls and resulted in neurite
outgrowth that preceded migrating SCs.104
Combinations of defined topographical and molecular
cues revealed synergies between cues. Gomez et al.105
studied the combined effects of NGF and microtopography
of microchannels on axon initiation, polarization and elon-
gation of hippocampal neurons. When presented with mi-
crochannel substrates of 1- to 2-mm widths and 400- to 800-
mm depths containing immobilized NGF on the surface,
hippocampal neurons responded to the combination of
molecular and topographical stimulation with the longest
neurites. The observations that topography had a stronger
FIG. 4. Combination of 3-dimensional matrix with chemical cues: Anisotropy of laminin (LN) presentation in agarose gels can direct
neurite outgrowth to regions of higher LN. Arrow indicates higher LN concentration. (A) Neurite outgrowth in unmodified agarose gel.
(B–D) Neurite outgrowth in gels containing increasing steepness of LN concentration (0.017, 0.051, 0.121 mg/mL per mm respectively).
Scale bar ¼ 100mm. Figure from Dodla and Bellamkonda,91 Journal of Biomedical Materials Research Part A, Vol. 78A, No. 2, 2006,
pp. 213–221, Copyright (2006, Wiley Periodicals, Inc). Reprinted with permission of John Wiley & Sons, Inc.
40 LI AND HOFFMAN-KIM

178
effect on polarization but no effect on elongation suggested
that both cues are required for maximal neurite growth.57,105
Foley et al.106 observed that topographic feature size mod-
ulated neuritogenesis of PC12 cells cultured with sub-
optimal concentrations of NGF in media, with greater
neuritogenesis when cells were cultured on ridges of 70 and
250 nm than on wider ridges (400–1900 nm) and flat sur-
faces. Synergy between topography and adsorbed ECM
molecules of LN also promoted neurite alignment and out-
growth onto microgrooves.107 DRGs cultured on substrates
with groove depths of greater than 3 mm and groove widths
of 10 mm in combination with 200 mg/mL of LN showed
maximal neurite outgrowth and alignment of up to 95%.
Zhang et al.108 developed a hybrid template that combines
topographical and molecular cues with channels 5 mm deep
and 20 to 40 mm wide connecting to nodes of 50- to 100-mmwidths and pLL to achieve geometric control over neurite
connections for the application of microelectronic circuits.
Hippocampal neurites extended on pLL tracks and avoided
regions where no pLL was present. Studies such as these
facilitate the investigation of hierarchies and synergies
between cues.
Topographical cues have also generated unexpected
neurite morphologies. Goldner et al.13 have observed the
phenomenon of neurite ‘‘bridging,’’ in which a subset of
DRG neurites can span grooves coated with LN varying
from 30 to 200 mm wide and 50 mm deep with no underlying
support (Fig. 5). Several cell types, including hippocampal
neurons, rat B104 neuroblastoma cells, and SCs, were all
shown to exhibit the bridging morphology. Neurites were
observed to climb up the groove walls to generate such
bridges, suggesting complex cell dynamics in response to
micro-topography.
Nanotopography to promote cell growth has been a
subject of interest for many biological applications and
for axon guidance in particular. Nanotopography has been
FIG. 5. Dorsal root ganglia neurites show unusual ‘‘bridging’’ morphology (arrows) overmicrogrooves 50mmdeep. (A, C) Phase contrast
images at plateau and groove level, respectively. (B, D) Immunostained anti-neurofilament fluorescent images at plateau and groove level
respectively. Scale bar¼ 50mm. Figure reprinted from Biomaterials, Vol. 27, No. 3, Goldner et al.Neurite bridging across micropatternedgrooves, pp. 460–472. Copyright (2005), with permission from Elsevier.13 Color images available online at www.liebertpub.com/ten.
TISSUE-ENGINEERED PLATFORMS OF AXON GUIDANCE 41

179
presented to cells in vitro via nanoscale etches into silicon
wafers,109,110 nanofibers on the surfaces of scaffolds,111,112
and carbon nanotubes (CNTs) on flat surfaces.113–116
Methods of fabrication have been reviewed in Norman and
Desai,117 including a list of ordered versus unordered na-
notopographies that can be generated using methods such
as chemical etching with hydrofluoric acid to generate
unordered nanoscale grooves and more controllable elec-
trospinning with well-studied polymeric materials such as
PLA and PLGA, which may be aligned or unaligned.
Neuronal adhesion and viability on nanotopography have
been most widely studied, and results vary depending on the
type of nanoscale substrate presented. Chemical etching of
siliconwafers found an optimal surface nano-roughness of 20
to 50 nm to be the most permissive for attachment of primary
neurons isolated from the substantia nigra.109 Electrospun
polyamide nanofibers with a median diameter of 180 nm
supported neuronal growth, and covalently linked tenascin-
C–derived peptides increased the neurite outgrowth of a
number of CNS primary neurons, including cerebellar
granule, cerebral cortical, hippocampal, motor, and DRG
neurons, indicating that nanotopography may act synergis-
tically with molecular cues to promote neurite growth.111
Nanofibrillar meshes presenting IKVAV peptides have also
been fabricated using self assembly of amphiphilic peptides
around cells in culture medium. These IKVAV-linked na-
nofibers differentiated NPCs more rapidly than the addition
of soluble IKVAV peptide or LN118 (Fig. 6). Cellular re-
sponses to substrates presenting CNTs have been evaluated;
hippocampal cells have been stimulated using CNT micro-
electrodes,116 PC12 neurite formation has been supported
by 2% CNT containing polycarbonate urethane,115 and
astrocytes have been shown to have poorer adhesion to CNT–
polycarbonate urethane substrates and lower alkaline
phosphatase production on low-surface-energy nanophase
fibers.119 Using nanoscale fabrication methods, it will be
exciting to generate biomaterial platforms that study combi-
nations of nanoscale guidance cues with other important cues
such as electrical stimulation and molecular cues.
Neurons have the capacity to respond to topographical
features in their microenvironments, and grooves have been a
widely studied geometry. The progression of guidance cues
from micro- to nanoscale resolution has shown that the
guidance range encompasses both length scales and can af-
fect cell functions from cell differentiation of NPCs to neurite
morphology such as orientation, direction, and length.
PRESENTATION OF ALIGNMENTINFORMATION BY CELLS
Cocultures of neurons and glial cells have been investi-
gated using primary cells and cell lines to study the influence
of nonneuronal cells on axon guidance. Glial cells have been
observed to bridge lesions and promote axon growth after
injury in models of nerve damage.32,120 SCs play an essential
role in guiding neurites after injury in a transected nerve
model, and the inhibition of SC proliferation and migration
reduced axon growth.32 Coculture studies have been per-
formed to assess the effects of cell types present in the glial
scar in vivo, and scar-in-a-dish experiments have explored
injury environments in vitro.31 Recently, these cocultures
have been applied in novel biomaterials systems micro-
fabricated to present cues in a more systematic manner, with
cells from a more permissive environment being cocultured
in an oriented manner or an unoriented manner where no
FIG. 6. Nanofibrillar gels presenting ile-lys-val-ala-val (IKVAV
peptide are more effective at inducing differentiation of neural pro-
genitor cells. Differentiated neurons were labeled for ß-tubulin (in
green), and differentiated astrocytes (glial cells) were labeled for
Glial fibrillary acidic protein (in orange). (A) No neurite formation
from NPCs encapsulated in an IKVAV incorporated polyacrylamide
gel. (B) Neurite formation from a neural progenitor cell (NPC) neu-
rosphere cultured in a nanofibrillar gel presented with IKVAV on the
surface. Scale bar ¼ 100mm. Figure from Silva et al.,118 reprinted
from Science, 27 February 2004: Vol. 303, no. 5662, pp. 1352–1355.
Color images available online at www.liebertpub.com/ten.
42 LI AND HOFFMAN-KIM

180
underlying directional cue is presented. Thompson and
Buettner121 have shown that, in cocultures of SC and DRG
neurons, the underlying glial culture can direct neurite
growth (Fig. 7). When DRG neurons were seeded onto SC
monolayers oriented by microstamped LN stripes, neurites
oriented to the direction of SC alignment.
Cultures of neurons on astrocyte monolayers have shown
that astrocytes can direct neurite outgrowth in the direction of
astrocyte orientation,76 induce neurite turning to the under-
lying direction of astrocytes, and increase neurite length.122
Recknor et al.123 cocultured astrocytes with NPCs and ob-
served that confluent, directed astrocyte monolayers can
direct adult rat hippocampal progenitor cells and may con-
tribute to the differentiation process of these neural progen-
itor cells. Deumens et al.124 cultured neonatal cerebral
cortical neurons with olfactory ensheathing cells (OECs),
glial cells thought to be responsible for continuous growth of
peripheral axons in the olfactory system, and their associated
FIG. 7. Dorsal root ganglia cultured on aligned underlying Schwann cell (SC) monolayer culture are directed in the orientation of SCs.
Fluorescent images of 40,6-diamidino-2-phenylindole–stained SCs and neurofilament-stained DRGs on aligned (A, B) and unaligned
(C, D) SC monolayers. Figure from Thompson and Buettner, 2006.31 This figure first appeared in Annals of Biomedical Engineering
Vol. 34, No. 1, 2006, pp. 161–168. Reprinted with permission from the authors. Color images available online at www.liebertpub.com/ten.
TISSUE-ENGINEERED PLATFORMS OF AXON GUIDANCE 43

181
olfactory nerve fibroblasts (ONF) or neonatal astrocytes.
Greater neurite elongation was observed on OEC/ONF cul-
tures than on neonatal astrocyte cultures. OEC/ONF or as-
trocyte monolayers were aligned when cultured on aligned
porous poly(D,L) lactide scaffolds. Cortical neurites were
oriented in the direction of the underlying aligned OEC/ONF
or astrocyte culture.
Neuron–glial interactions have been observed because
glial cells are supportive cells in the CNS that can contribute
to the modulation of neuronal responses to their environ-
ment. By including these cells in neuronal cultures that focus
on guiding neurons and their extensions, a more complex
mixture of cues can be presented in a time-dependent and
feedback-dependent manner, which is much more similar to
interactions in vivo.
PRESENTATION OF CELLULARTOPOGRAPHY IN THE ABSENCE OF CELLS
Cells present a complex and dynamic set of cues that
include their topography and their ability to produce per-
missive and inhibitory molecules. To understand how these
cues affect neurons, it is useful to isolate the individual
complex effects of neighboring cells. Until now, the diffi-
culty in reproducing the complex shapes of cells without
including molecular components has left the influence of
cellular topography largely unexplored. To separate the
contributions of molecular cues from cellular topographical
cues, Bruder et al.124 have recently developed transparent,
biocompatible poly(dimethyl siloxane) substrates with bio-
mimetic, SC-shaped relief topography. As a result, the
contribution of cellular topography as an independent factor
in cocultures and, in particular, the role of SC topography in
axon guidance can be studied. Neurites have been found to
respond to SC topography by following the underlying di-
rection of SC alignment (Fig. 8).125 This micromolding
method can be extended to any cell type of interest, and
polymeric templates of directed astrocyte monolayers have
also been fabricated. In our laboratory, we have recently
found that micromolded polymeric replicas of aligned as-
trocytes can direct DRG neurite growth to the orientation
of astrocyte replicas.
NERVE GUIDANCE CHANNELS PRESENTCOMBINATIONS OF CUES TO DIRECT
AXON GROWTH
Nerve guidance channels (NGCs) are biomaterial-based
devices that are designed to be transplanted experimentally
for nerve repair, first studied as a possible alternative to
nerve autografts. NGCs aim to provide a conduit through
which regenerating axons can grow and connect to their
FIG. 8. Schwann cell (SC) replicas guide dorsal root ganglia (DRG) neurites. Phase contrast microscopy and scanning electron
microscopy (SEM) (inset) of fixed SC templates (A) and polymeric replicates (B) of cells cultured at 120,000 cell/mL aligned onto 50-
mm laminin stripes. DRG morphology visualized under phase contrast (C, D) and fluorescent micrographs (E, F) on flat poly-
dimethylsiloxane (C, E) or replicas (D, F) and stained with neurofilament immunocytochemistry (B, E). Scale bars, 200 mm for phase
contrast and fluorescent micrographs and 20mm for SEM micrographs. Figure reprinted from Bruder et al., Journal of Biomaterials
Science, Polymer Edition, Vol. 18, No. 8, 2007, pp. 967–982, with permission from Koninklijke Brill N.V.125 Color images available
online at www.liebertpub.com/ten.
44 LI AND HOFFMAN-KIM

182
appropriate targets (reviewed in 23,126,127). NGCs are an
example of a tissue-engineering approach to axon guidance
and nerve repair using cells and scaffolds to regenerate an
injured nerve by incorporating features in the NGC to mimic
the in vivo environment of a nerve autograft. By using in-
formation gained about guidance cues from in vitro studies
as reviewed above, researchers are optimizing the incorpo-
ration of biological factors and generating biomaterials to
present cues that stimulate the regeneration process. These
cues have been incorporated into synthetic nerve grafts with
the potential of increasing nerve growth after injury. NGCs
are typically transplanted and then evaluated in a rat sciatic
nerve model, a well-established in vivomodel for peripheral
nerve injury, with a gap distance of 10 to 15mm and di-
ameter of 1 to 2mm. In this final section, we provide a brief
review of recent advances in NGCs.
Topography of the NGC is a major component of guidance
information. The tube structure itself provides a directional
cue, providing a stronger topographical cue than unaligned
degenerating fascicles that are present at the injury site.128
Additional topography on the inner surfaces of the lumen can
be incorporated by alignment of fibers,11,89,129,130 mem-
branes,131 and surface roughness.132 The curvature of a
substrate has been found to provide relevant guidance in-
formation to growing neurites, where DRG neurites were
found to align in directions of minimal curvature, and to
increase branching on substrate areas with principal maximal
curvature.132 Microfilaments incorporated in NGCs can also
provide topographical guidance, with PLA microfilament-
containing conduits promoting tissue cable formation
and SC migration in vivo. In 60- to 80-mm microfilament-
incorporated poly-(L-lactide-co-DL-lactide), axon growth
was greater toward the distal stump.11 Higher packing den-
sity of PLA microfilaments has also been found to correlate
with the number of successfully regenerated nerves.89 Re-
cently, microfilaments have been combined in NGCs with
molecular cues such as heregulin-b1.130 Synergism between
heregulin (800 ng) and microfilaments (50–100mm) wasshown by more SCs in NGCs in vivo with both cues than
in those presenting each cue separately.
Addition of growth factors to NGCs has been widely stud-
ied to enhance axon growth through the conduit. Controlled-
release approaches have been used to fabricate polymeric
devices that can deliver growth factors to the site of injury
over time.133–138 Yang et al.136 fabricated a microporous
conduit of PLGA with single or multiple lumens that in-
corporated NGF in encapsulated and unencapsulated for-
mulations. Bioactive NGF release was measured up to 14
days in single- and multiple-channel NGCs; after subcuta-
neous implantation over 13 days, cellular infiltration was
observed. NGF microspheres of degradable polymers have
also been fabricated into NGCs by loading the microspheres
into silicone or polyphosphoester tubes.137 Addition of NGF
into NGCs was found to increase nerve fiber diameter and
density at the distal end of the injury site at the 3-month time
point. Fine et al.134 fabricated synthetic ethylene vinyl ac-
etate copolymer NGCs with NGF or GDNF incorporated
into the walls of the polymers to be released over 6 weeks.
Addition of NGF or GDNF was found to support nerve ca-
bles, myelinated axons, motoneurons, and DRG neurons
in vivo.
ECM molecules and gels can also be incorporated into
NGCs to provide sites of adhesion, to attract permissive glia,
and to promote axon growth.84,139–141 Alginate, collagen,
and fibrin sponges and gels have been used as materials to fill
the inner volume of NGCs.142 Hashimoto et al.142 observed
more myelinated axons and more SC migration from the
distal stump into alginate gels than into collagen sponges or
fibrin glues. By incorporating molecular cues, growth can be
enhanced. Rafiuddin Ahmed and Jayakumar139 incorporated
RGD peptides into a collagen matrix with a NGC in vivo and
showed more myelinated axons in RGD-incorporated gels
than in collagen controls. SCs proliferated at early stages
after implantation in proximity to RGD peptides. Taylor
et al.140 immobilized NT-3 into fibrin gels, thus combining a
biological 3D matrix with trophic factors. Implantation of
NT-3–loaded fibrin gels in an acute spinal cord suction ab-
lation after 9 days showed cellular infiltration into the matrix
and diminished glial fibrillary acidic protein-positive reac-
tive astrocytes.
Combining NGCs with tubular structure, biological or
polymeric matrices (collagen, fibrin, Matrigel, methylcel-
lulose, or channels), and neurotrophic factors (FGF, NT-3)
in a complete spinal cord transection allowed for compari-
son of matrices in NGCs.143 Although addition of each ma-
trix increased axon density, specific matrices elicited growth
from different subpopulations in the spinal cord. Fibrin pro-
moted growth from reticular neurons, and methylcellulose
promoted growth from vestibular and red nucleus neurons,
thus showing differential effects of matrix composition.
Mechanical properties of NGCs and incorporated matrices
can affect neurite growth. Poly(2-hydroxyethylmethacrylate-
co-methyl methacrylate) (PHEMA-MMA) channels with
varying elastic moduli (177, 311 kPa) showed an increase in
area and width of neural tissue within the stiffer NGCs.144
In longer-term implantation studies, these PHEMA-MMA
NGCs maintained their structural integrity for up to 8 weeks.
Collapse of NGCs was observed in 29% of samples after 16
weeks, and the collapsed samples had significantly lower
wall area than patent samples. To improve nerve graft
patency, poly(caprolactone) coil-reinforced PHEMA-MMA
tubes were fabricated to obtain NGCs with higher compres-
sive strength, allowing NGCs with mechanical integrity from
low modulus materials.145
Electrical guidance cues can also be incorporated into
NGCs using pPy.146 Electrical stimulation applied through
the electrically conductive biodegradable polymers en-
hanced neurite outgrowth in a current-dependent fashion,
promoting myelinated axons and SCs similar to those of the
native sciatic nerve.
Addition of SCs to NGCs provides an additional cellu-
lar guidance cue. Philips et al.84 incorporated SCs and
TISSUE-ENGINEERED PLATFORMS OF AXON GUIDANCE 45

183
fibroblasts into collagen gels, which contracted and resulted
in uniaxial alignment of collagen fibrils. This matrix was
then loaded into silicone tubes for an implantable construct.
Evans et al.147 injected SCs into PLA conduits in vivo, and
although axon density after 4 months was lower than that of
isografts, mean sciatic function indices were comparable,
suggesting promotion of functional recovery.
By taking lessons from in vitro studies such as those re-
viewed in this article and incorporating the cues that affect
axon guidance into NGCs in a systematic manner, in vivo
experiments can inform strategies to increase the effective-
ness of nerve regeneration.148 The biomaterial aspect of
NGCs allows scientists to design and optimize physical
parameters of the tube, including length, diameter, and wall
thickness, which all contribute to the topographical infor-
mation presented to growing neurons. Material properties of
polymers such as permeability, degradability, interior sur-
face morphology, and conductivity can also be modified for
optimal ingrowth of cells and neurite extension. Incorpora-
tion of scaffolds or 3D matrices in the lumen of the NGCs
allows a permissive substrate for cells to grow through, with
appropriate mechanical and chemical cues such as exoge-
nous trophic factors or ECM adhesion molecules dispersed
or patterned within the matrices. Thus far, functional re-
covery over clinically relevant lengths has not been achieved
with synthetic grafts, but these defined microenvironments
allow for the careful study of the processes of axon guidance
in a more controlled manner in vivo.
CONCLUSIONS
Tissue engineering approaches combine biomaterials,
cells, molecules, and cutting-edge micro- and nanofabrica-
tion to develop new scaffolds, platforms, and experiments
for the study of the key parameters in axon guidance. Major
goals for nerve regeneration include prevention of secondary
injury, compensation for demyelination, removal of inhibi-
tors to growth, promotion of axonal growth, direction of
newly growing axons to their proper targets, and replace-
ment of dead cells to regain functional recovery.149 These
goals highlight the importance of a multi-factorial approach
to tissue-engineering strategies for axon guidance and nerve
repair. In addition to transplantation, in which nerve
grafts150–152 and cellular transplants153,154 have been widely
studied, strategies include anti-inflammatory and anti-apo-
ptotic treatments (reviewed in 155,156), drugs or antibodies
that block the inhibitors of regeneration,157 growth factors to
promote axon sprouting,35,150 gene therapy to deliver growth
factors,158,159 (and reviewed in160), and transplantation of
stem cells with the potential to differentiate into new cell
populations to replace the injured or dead cells.161,162 One
major approach with these strategies is to employ neural
tissue–engineering principles to replace damaged or de-
generated neural tissue with a matrix containing guidance
cues including diffusible factors, substrate-bound factors,
electrical gradients, and topographical cues, with the aim of
incorporating these cues into nerve guidance channels to
increase ingrowth and precise reconnection of host neurons.
By using tissue engineering to present and examine multiple
guidance cues in a precise and systematically composed
manner in vitro and in vivo, we can gain critical information
for a deeper understanding of how axon guidance occurs
in vivo.
ACKNOWLEDGMENTS
This work was funded by National Science Foundation
CAREER and National Institute of Biomedical Imaging
and BioEngineering R21 grants to DHK and a Robert and
Susan Kaplan Fellowship to GNL.
REFERENCES
1. David, S. and Lacroix, S. Molecular approaches to spinal
cord repair. Annu Rev Neurosci 26, 411, 2003.
2. Chilton, J. K. Molecular mechanisms of axon guidance. Dev
Bio 292, 13, 2006.
3. Mueller, B. K. Growth Cone guidance: first steps towards
a deeper understanding. Annu Rev Neurosci 22, 351, 1999.
4. Raivich, G. and Makwana, M. The making of successful
axonal regeneration: genes, molecules and signal transduc-
tion pathways. Brain Res Rev 53, 287, 2007.
5. Serini, G. and Bussolino, F. Common cues in vascular and
axon guidance. Physiology 19, 348, 2004.
6. Daniel M. and Suter, P. F. Substrate-cytoskeletal coupling as
a mechanism for the regulation of growth cone motility and
guidance. J Neurobiol 44, 97, 2000.
7. Adams, D.N., Kao, E.Y.C., Hypolite, C.L., Distefano, M.D.,
Hu, W., and Letourneau, P.C. Growth cones turn and mi-
grate up an immobilized gradient of the laminin IKVAV
peptide. J Neurobiol 62, 134, 2005.
8. Dertinger, S. K. W., Jiang, X., Li, Z., Murthy, V. N., and
Whitesides, G. M. Gradients of substrate-bound laminin
orient axonal specification of neurons. Proc Natl Acad Sci
U S A 99, 12542, 2002.
9. McFarlane, S. Metalloproteases: carving out a role in axon
guidance. Neuron 37, 559, 2003.
10. Mahoney, M. J., Chen, R. R., Tan, J., and Saltzman, W. M.
The influence of microchannels on neurite growth and
architecture. Biomaterials 26, 771, 2005.
11. Cai, J., Peng, X., Nelson, K. D., Eberhart, R., and Smith, G.
M. Permeable guidance channels containing microfilament
scaffolds enhance axon growth and maturation. J Biomed
Mater Res A 75, 374, 2005.
12. Dowell-Mesfin, N. M., Abdul-Karim, M. A., Turner,
A. M. P., Schanz, S., Craighead, H. G., Roysam, B., Turner,
J. N., and Shain, W. Topographically modified surfaces af-
fect orientation and growth of hippocampal neurons. J Neural
Eng 1, 78, 2004.
46 LI AND HOFFMAN-KIM

184
13. Goldner, J. S., Bruder, J. M., Li, G., Gazzola, D., and
Hoffman-Kim, D. Neurite bridging across micropatterned
grooves. Biomaterials 27, 460, 2006.
14. Manwaring, M. E., Walsh, J. F., and Tresco, P. A. Contact
guidance induced organization of extracellular matrix. Bio-
materials 25, 3631, 2004.
15. Walsh, J. F., Manwaring, M. E., and Tresco, P. A. Direc-
tional neurite outgrowth is enhanced by engineered menin-
geal cell-coated substrates. Tissue Eng 11, 1085, 2005.
16. McCaig, C. D., Rajnicek, A. M., Song, B. and Zhao, M. Has
electrical growth cone guidance found its potential? Trends
Neurosci 25, 354, 2002.
17. Patel, N. and Poo, M. M. Orientation of neurite growth by
extracellular electric fields. J Neurosci 2, 483, 1982.
18. Schmidt, C. E., Shastri, V. R., Vacanti, J. P. and Langer, R.
Stimulation of neurite outgrowth using an electrically
conducting polymer. Proc Natl Acad Sci U S A 94, 8948,
1997.
19. Zhang, N., Yan, H., and Wen, X. Tissue-engineering ap-
proaches for axonal guidance. Brain Res Brain Res Rev 49,
48, 2005.
20. Chalfoun, C. T., Wirth, G. A., and Evans, G. R. Tissue
engineered nerve constructs: where do we stand? J Cell Mol
Med 10, 309, 2006.
21. Lavik, E. and Langer, R. Tissue engineering: current state
and perspectives. Appl Microbiol Biotechnol 65, 1, 2004.
22. Fry, E. J. Central nervous system regeneration: mission
impossible? Clin Exp Pharmacol Physiol 28, 253, 2001.
23. Schmidt, C. E. and Leach, J. B. Neural tissue engineering:
strategies for repair and regeneration. Annu Rev Biomed
Eng 5, 293, 2003.
24. Meek, M. F. and Coert, J. H. Clinical use of nerve conduits
in peripheral-nerve repair: review of the literature. J Re-
constr Microsurg 18, 097, 2002.
25. Fawcett, J. W. and Keynes, R. J. Peripheral nerve regener-
ation. Annu Rev Neurosci 13, 4350, 1990.
26. McDonald, J. W., Liu, X.-Z., Qu, Y., Liu, S., Mickey, S. K.,
Turetsky, D., Gottlieb, D. I., and Choi, D. W. Transplanted
embryonic stem cells survive, differentiate and promote
recovery in injured rat spinal cord. Nat Med 5, 1410, 1999.
27. Lakatos, A. and Franklin, R. J. M. Transplant mediated re-
pair of the central nervous system: an imminent solution?
Curr Opin Neurol 15, 701, 2002.
28. Gregory, R. D. E. Peripheral nerve injury: a review and ap-
proach to tissue engineered constructs. Anat Rec 263, 396,
2001.
29. Flaim, C. J., Chien, S., and Bhatia, S. N. An extracellular
matrix microarray for probing cellular differentiation. Nat
Meth 2, 119, 2005.
30. Keilhoff, G., Goihl, A., Stang, F., Wolf, G., and Fansa, H.
Peripheral nerve tissue engineering: autologous Schwann
cells vs. transdifferentiated mesenchymal stem cells. Tissue
Eng 12, 1451, 2006.
31. Thompson, D. M. and Buettner, H. M. Neurite outgrowth is
directed by Schwann cell alignment in the absence of other
guidance cues. Ann Biomed Eng 34, 161, 2006.
32. Chen, Y. Y., McDonald, D., Cheng, C., Magnowski, B.,
Durand, J., and Zochodne, D. W. Axon and Schwann cell
partnership during nerve regrowth. J Neuropathol Exp
Neurol 64, 613, 2005.
33. Langer, R. and Vacanti, J. P. Tissue engineering. Science
260, 920, 1993.
34. MacArthur, B. D. and Oreffo, R. O. Bridging the gap. Nature
433, 19, 2005.
35. Boyd, J. G. and Gordon, T. Neurotrophic factors and their
receptors in axonal regeneration and functional recovery
after peripheral nerve injury. Mol Neurobiol 27, 277, 2003.
36. Kato, A. C. and Lindsay, R. M. Overlapping and additive
effects of neurotrophins and cntf on cultured human spinal
cord neurons. Exp Neurol 130, 196, 1994.
37. Jones, D. M., Tucker, B. A., Rahimtula, M., and Mearow, K.
M. The synergistic effects of NGF and IGF-1 on neurite
growth in adult sensory neurons: convergence on the PI
3-kinase signaling pathway. J Neurochem 86, 1116, 2003.
38. Taylor, L., Jones, L., Tuszynski, M. H., and Blesch, A.
Neurotrophin-3 gradients established by lentiviral gene de-
livery promote short-distance axonal bridging beyond cellu-
lar grafts in the injured spinal cord. J Neurosci 26, 9713, 2006.
39. Tom, V. J., Steinmetz, M. P., Miller, J. H., Doller, C. M.,
and Silver, J. Studies on the development and behavior of
the dystrophic growth cone, the hallmark of regeneration
failure, in an in vitro model of the glial scar and after spinal
cord injury. J Neurosci 24, 6531, 2004.
40. Le Beau, J. M., Liuzzi, F. J., Depto, A. S., and Vinik, A. I.
Up-regulation of laminin B2 gene expression in dorsal root
ganglion neurons and nonneuronal cells during sciatic nerve
regeneration. Exp Neurol 134, 150, 1995.
41. Tashiro, K.-I., Sephel, G. C., Greatorex, D., Sasaki, M.,
Shirashi, N., Martin, G. R., Kleinman, H. K., and Yamada,
Y. The RGD containing site of the mouse laminin A chain is
active for cell attachment, spreading, migration and neurite
outgrowth. J Cell Physiol 146, 451, 1991.
42. Tashiro, K., Sephel, G. C., Weeks, B., Sasaki, M., Martin, G.
R., Kleinman, H. K., and Yamada, Y. A synthetic peptide
containing the IKVAV sequence from the A chain of lami-
nin mediates cell attachment, migration, and neurite out-
growth. J Biol Chem 264, 16174, 1989.
43. Graf, J., Ogle, R. C., Robey, F. A., Sasaki, M., Martin, G. R.,
Yamada, Y., and Kleinman, H. K. A pentapeptide from the
laminin B1 chain mediates cell adhesion and binds to 67000
laminin receptor. Biochemistry 26, 6896, 1987.
44. Massia, S. P., Rao, S. S., and Hubbell, J. A. Covalently
immobilized laminin peptide Tyr-Ile-Gly-Ser-Arg (YIGSR)
supports cell spreading and co-localization of the 67-
kilodalton laminin receptor with alpha-actinin and vinculin.
J Biol Chem 268, 8053, 1993.
45. Bellamkonda, R. V. Peripheral nerve regeneration: an opin-
ion on channels, scaffolds and anisotropy. Biomaterials 27,
3515, 2006.
46. Rosoff, W. J., Urbach, J. S., Esrick, M. A., McAllister, R. G.,
Richards, L. J., and Goodhill, G. J. A new chemotaxis assay
shows the extreme sensitivity of axons to molecular gradi-
ents. Nat Neurosci 7, 678, 2004.
47. Cornish, T., Branch, D. W., Wheeler, B. C., and Campanelli,
J. T. Microcontact printing: a versatile technique for the study
of synaptogenic molecules. Mol Cell Neurosci 20, 140, 2002.
48. von Philipsborn, A. C., Lang, S., Loeschinger, J., Bernard,
A., David, C., Lehnert, D., Bonhoeffer, F., and Bastmeyer,
M. Growth cone navigation in substrate-bound ephrin
gradients. Development 133, 2487, 2006.
TISSUE-ENGINEERED PLATFORMS OF AXON GUIDANCE 47

185
49. Li, G., Liu, J., and Hoffman-Kim, D. Multi-molecular gra-
dients of permissive and inhibitory cues direct neurite out-
growth. Ann Biomed Eng in press.
50. Offenhausser, A., Bocker-Meffert, S., Decker, T., Help-
enstein, R., Gasteier, P., Groll, J., Moller, M., Reska, A.,
Schafer, S., Schulte, P., and Vogt-Eisele, A. Microcontact
printing of proteins for neuronal cell guidance. Soft Matter 3,
290, 2007.
51. Oliva, A. A., James, C. D., Kingman, C. E., Craighead, H.
G., and Banker, G. A. patterning axonal guidance molecules
using a novel strategy for microcontact printing. Neurochem
Res 28, 1639, 2003.
52. Yeung, C. K., Lauer, L., Offenhausser, A., and Knoll, W.
Modulation of the growth and guidance of rat brain stem
neurons using patterned extracellular matrix proteins. Neu-
rosci Lett 301, 147, 2001.
53. Vogt, A. K., Wrobel, G., Meyer, W., Knoll, W., and Of-
fenhausser, A. Synaptic plasticity in micropatterned neuro-
nal networks. Biomaterials 26, 2549, 2005.
54. Zhang, Z., Yoo, R., Wells, M., Beebe, T. P., Biran, R., and
Tresco, P. Neurite outgrowth on well-characterized surfaces:
preparation and characterization of chemically and spatially
controlled fibronectin and RGD substrates with good bio-
activity. Biomaterials 26, 47, 2005.
55. Yang, I. H., Co, C. C., and Ho, C.-C. Alteration of human
neuroblastoma cell morphology and neurite extension with
micropatterns. Biomaterials 26, 6599, 2005.
56. Gomez, N., Chen, S., and Schmidt, C. E. Polarization of
hippocampal neurons with competitive surface stimuli:
contact guidance cues are preferred over chemical ligands.
J R Soc Interface 4, 223, 2007.
57. Gomez, N. and Schmidt, C. E. Nerve growth factor-
immobilized polypyrrole: bioactive electrically conducting
polymer for enhanced neurite extension. J Biomed Mater
Res A 81, 135, 2007.
58. Luo, Y. and Shoichet, M. S. A photolabile hydrogel for
guided three-dimensional cell growth and migration. Nat
Mater 3, 249, 2004.
59. Song, H. K., Toste, B., Ahmann, K., Hoffman-Kim, D., and
Palmore, G. T. Micropatterns of positive guidance cues an-
chored to polypyrrole doped with polyglutamic acid: a new
platform for characterizing neurite extension in complex
environments. Biomaterials 27, 473, 2006.
60. Shi, R. and Borgens, R. Three-dimensional gradients of
voltage during development of the nervous system as invisi-
ble coordinates for the establishment of embryonic pattern.
Dev Dyn 202, 101, 1995.
61. Song, B., Zhao, M., Forrester, J., and McCaig, C. Nerve re-
generation and wound healing are stimulated and directed by
an endogenous electrical field in vivo. J Cell Sci 117, 4681,
2004.
62. Francis, J. T., Gluckman, B. J., and Schiff, S. J. Sensitivity
of neurons to weak electric fields. J Neurosci 23, 7255, 2003.
63. Bikson, M., Inoue, M., Akiyama, H., Deans, J. K., Fox, J. E.,
Miyakawa, H., and Jefferys, J. G. R. Effects of uniform
extracellular DC electric fields on excitability in rat hippo-
campal slices in vitro. J Physiol 557, 175, 2004.
64. Wood, M. and Willits, R. K. Short-duration, DC electrical
stimulation increases chick embryo DRG neurite outgrowth.
Bioelectromagnetics 27, 328, 2006.
65. Greene, L. A. and Tischler, A. S. Establishment of a Nora-
drenergic clonal line of rat adrenal pheochromocytoma cells
which respond to nerve growth factor. Proc Natl Acad Sci
73, 2424, 1976.
66. Dichter, M. A., Tischler, A. S., and Greene, L. A. Nerve
growth factor-induced increase in electrical excitability and
acetylcholine sensitivity of a rat pheochromocytoma cell
line. Nature 268, 501, 1977.
67. Morgado-Valle, C., Verdugo-Dı́az, L., Garcı́a, D. E.,
Morales-Orozco, C., and Drucker-Colı́n, R. The role of
voltage-gated Ca2þ channels in neurite growth of cultured
chromaffin cells induced by extremely low frequency (ELF)
magnetic field stimulation. Cell Tissue Res 291, 217, 1998.
68. Blackman, C. F., Benane, S. G., and House, D. E. Evidence
for direct effect of magnetic fields on neurite outgrowth.
FASEB J. 7, 801, 1993.
69. Macias, M., Battocletti, J., Sutton, C., Pintar, F., and Mai-
man, D. Directed and enhanced neurite growth with pulsed
magnetic field stimulation. Bioelectromagnetics 21, 272,
2000.
70. Shah, J. P., Midkiff, P., Brandt, P. C., and Sisken, B. F.
Growth and differentiation of PC6 cells: the effects of pulsed
electromagnetic fields (PEMF). Bioelectromagnetics 22,
267, 2001.
71. Zhang, Y., Ding, J., Duan, W., and Fan, Y. W. Influence of
pulsed electromagnetic field with different pulse duty cycles
on neurite outgrowth in PC12 rat pheochromocytoma cells.
Bioelectromagnetics 26, 406, 2005.
72. Kotwal, A. and Schmidt, C. E. Electrical stimulation alters
protein adsorption and nerve cell interactions with electri-
cally conducting biomaterials. Biomaterials 22, 1055, 2001.
73. Cui, X., Wiler, J., Dzaman, M., Altschuler, R. A., and
Martin, D. C. In vivo studies of polypyrrole/peptide coated
neural probes. Biomaterials 24, 777, 2003.
74. Richardson, R. T., Thompson, B., Moulton, S., Newbold, C.,
Lum, M. G., Cameron, A., Wallace, G., Kapsa, R., Clark, G.,
and O’Leary, S. The effect of polypyrrole with incorporated
neurotrophin-3 on the promotion of neurite outgrowth from
auditory neurons. Biomaterials 28, 513, 2007.
75. Stump, R. F. and Robinson, K. R. Xenopus neural crest cell
migration in an applied electrical field. J Cell Biol 97, 1226,
1983.
76. Alexander, J. K., Fuss, B., and Colello, R. J. Electric field-
induced astrocyte alignment directs neurite outgrowth.
Neuron Glia Biol 2, 93, 2006.
77. Mosahebi, A., Simon, M., Wiberg, M., and Terenghi, G.
A novel use of alginate hydrogel as Schwann cell matrix.
Tissue Eng 7, 525, 2001.
78. Dhoot, N. O., Tobias, C. A., Fischer, I., and Wheatley, M. A.
Peptide-modified alginate surfaces as a growth permissive
substrate for neurite outgrowth. J Biomed Mater Res A 71,
191, 2004.
79. Novikova, L. N., Mosahebi, A., Wiberg, M., Terenghi, G.,
Kellerth, J., and Novikov, L. N. Alginate hydrogel and
matrigel as potential cell carriers for neurotransplantation.
J Biomed Mater Res A 77, 242, 2006.
80. Cullen, D., Lessing, M., and LaPlaca, M. Collagen-
dependent neurite outgrowth and response to dynamic
deformation in three-dimensional neuronal cultures. Ann
Biomed Eng 35, 835, 2007.
48 LI AND HOFFMAN-KIM

186
81. Ma, W., Fitzgerald, W., Liu, Q. Y., O’shaughnessy, T. J.,
Maric, D., Lin, H. J., Alkon, D. L., and Barker, J. L. CNS
stem and progenitor cell differentiation into functional
neuronal circuits in three-dimensional collagen gels. Exp
Neurol 190, 276, 2004.
82. O’Connor, S. M., Stenger, D. A., Shaffer, K. M., and Ma, W.
Survival and neurite outgrowth of rat cortical neurons in
three-dimensional agarose and collagen gel matrices. Neu-
rosci Lett 304, 189, 2001.
83. O’Connor, S. M., Stenger, D. A., Shaffer, K. M., Maric, D.,
Barker, J. L., and Ma, W. Primary neural precursor cell
expansion, differentiation and cytosolic Ca2þ response in
three-dimensional collagen gel. J Neurosci Methods 102,
187, 2000.
84. Phillips, J. B., Bunting, S. C., Hall, S. M., and Brown, R. A.
Neural tissue engineering: a self-organizing collagen guid-
ance conduit. Tissue Eng 11, 1611, 2005.
85. Willits, R. K. and Skornia, S. L. Effect of collagen gel
stiffness on neurite extension. J Biomater Sci Polym Ed 15,
1521, 2004.
86. Li, G. N., Livi, L. L., Gourd, C. M., Deweerd, E. S., and
Hoffman-Kim, D. Genomic and morphological changes of
neuroblastoma cells in response to three-dimensional ma-
trices. Tissue Eng 13, 1035, 2007.
87. Ju, Y. E., Janmey, P. A., McCormick, M. E., Sawyer, E. S.,
and Flanagan, L. A. Enhanced neurite growth from mam-
malian neurons in three-dimensional salmon fibrin gels.
Biomaterials 28, 2097, 2007.
88. Pittier, R., Sautier, F, Hubbell, J.A., and Hall, H. Neurite
extension and in vitro myelination within three-dimensional
modified fibrin matrices. J Neurobiol 63, 1, 2005.
89. Ngo, T. T. B., Waggoner, P. J., Romero, A. A., Nelson, K.
D., Eberhart, R. C., and Smith, G. M. Poly(L-Lactide) mi-
crofilaments enhance peripheral nerve regeneration across
extended nerve lesions. J Neurosci Res 72, 227, 2003.
90. Bini, T.B., Gao, S., Xu, X., Wang, S., Ramakrishna, S., and
Leong, K.W. Peripheral nerve regeneration by microbraided
poly(L-lactide-co-glycolide) biodegradable polymer fibers.
J Biomed Mater Res A 68, 286, 2004.
91. Dodla, M. C. and Bellamkonda, R. V. Anisotropic scaffolds
facilitate enhanced neurite extension in vitro. J Biomed
Mater Res A 78, 213, 2006.
92. Deister, C. and Schmidt, C. E. Optimizing neurotrophic
factor combinations for neurite outgrowth. J Neural Eng 3,
172, 2006.
93. Cao, X. and Shoichet, M. S. Photoimmobilization of bio-
molecules within a 3-dimensional hydrogel matrix. J Bio-
mater Sci Polym Ed 13, 623, 2002.
94. Kapur, T. A. and Shoichet, M. S. Chemically-bound nerve
growth factor for neural tissue engineering applications.
J Biomater Sci Polym Ed 14, 383, 2003.
95. Kapur, T. A. and Shoichet, M. S. Immobilized concentration
gradients of nerve growth factor guide neurite outgrowth.
J Biomed Mater Res A 68, 235, 2004.
96. Cao, X. and Shoichet, M. S. Investigating the synergistic
effect of combined neurotrophic factor concentration gradi-
ents to guide axonal growth. Neuroscience 122, 381, 2003.
97. Yu, X. and Bellamkonda, R. V. Dorsal root ganglia neurite
extension is inhibited by mechanical and chondroitin sulfate-
rich interfaces. J Neurosci Res 66, 303, 2001.
98. Li, N. and Folch, A. Integration of topographical and bio-
chemical cues by axons during growth on microfabricated 3-
D substrates. Exp Cell Res 311, 307, 2005.
99. Georges, P. C. and Janmey, P. A. Cell type-specific response
to growth on soft materials. J Appl Physiol 98, 1547, 2005.
100. Balgude, A. P., Yu, X., Szymanski, A., and Bellamkonda,
R. V. Agarose gel stiffness determines rate of DRG neurite
extension in 3D cultures. Biomaterials 22, 1077, 2001.
101. Schense, J. C. and Hubbell, J. A. Three-dimensional mi-
gration of neurites is mediated by adhesion site density and
affinity. J Biol Chem 275, 6813, 2000.
102. Leach, J. B., Brown, X. Q., Jacot, J. G., DiMilla, P. A., and
Wong, J. Y. Neurite outgrowth and branching of PC12 cells
on very soft substrates sharply decreases below a threshold
of substrate rigidity. J Neural Eng 4, 26, 2007.
103. Georges, P. C., Miller, W. J., Meaney, D. F., Sawyer, E. S.,
and Janmey, P. A. Matrices with compliance comparable to
that of brain tissue select neuronal over glial growth in
mixed cortical cultures. Biophys J 90, 3012, 2006.
104. Wen, X. and Tresco, P. A. Effect of filament diameter and
extracellular matrix molecule precoating on neurite out-
growth and Schwann cell behavior on multifilament en-
tubulation bridging device in vitro. J Biomed Mater Res A
76, 626, 2006.
105. Gomez, N., Lu, Y., Chen, S., and Schmidt, C. E. Im-
mobilized nerve growth factor and microtopography have
distinct effects on polarization versus axon elongation in
hippocampal cells in culture. Biomaterials 28, 271, 2007.
106. Foley, J. D., Grunwald, E. W., Nealey, P. F., and Murphy, C.
J. Cooperative modulation of neuritogenesis by PC12 cells
by topography and nerve growth factor. Biomaterials 26,
3639, 2005.
107. Miller, C., Jeftinija, S., and Mallapragada, S. Synergistic
effects of physical and chemical guidance cues on neurite
alignment and outgrowth on biodegradable polymer sub-
strates. Tissue Eng 8, 367, 2002.
108. Zhang, J., Venkataramani, S., Xu, H., Song, Y.-K., Song,
H.-K., Palmore, G. T. R., Fallon, J., and Nurmikko, A. V.
Combined topographical and chemical micropatterns for
templating neuronal networks. Biomaterials 27, 5734, 2006.
109. Fan, Y. W., Cui, F. Z., Chen, L. N., Zhai, Y., Xu, Q. Y., and
Lee, I. S. Adhesion of neural cells on silicon wafer with
nano-topographic surface. Appl Surf Sci 187, 313, 2002.
110. Fan, Y. W., Cui, F. Z., Hou, S. P., Xu, Q. Y., Chen, L. N.,
and Lee, I. S. Culture of neural cells on silicon wafers with
nano-scale surface topograph. J Neurosci Methods 120, 17,
2002.
111. Ahmed, I., Liu, H. Y., Mamiya, P. C., Ponery, A. S., Babu,
A. N., Weik, T., Schindler, M., and Meiners, S. Three-
dimensional nanofibrillar surfaces covalently modified with
tenascin-C-derived peptides enhance neuronal growth in vitro.
J Biomed Mater Res A 76, 851, 2006.
112. Yang, F., Murugan, R., Wang, S., and Ramakrishna, S.
Electrospinning of nano/micro scale poly(L-lactic acid)
aligned fibers and their potential in neural tissue engineering.
Biomaterials 26, 2603, 2005.
113. Lovat, V., Pantarotto, D., Lagostena, L., Cacciari, B.,
Grandolfo, M., Righi, M., Spalluto, G., Prato, M., and Bal-
lerini, L. Carbon nanotube substrates boost neuronal elec-
trical signaling. Nano Lett. 5, 1107, 2005.
TISSUE-ENGINEERED PLATFORMS OF AXON GUIDANCE 49

187
114. Nguyen-Vu, T. D., Chen, H., Cassell, A. M., Andrews, R.,
Meyyappan, M., and Li, J. Vertically aligned carbon nano-
fiber arrays: an advance toward electrical-neural interfaces.
Small 2, 89, 2006.
115. Waid, M. C., McKenzie, J. L., Price, R. L., Ejiofor, J. U.,
and Webster, T. J. Nano-biotechnology: carbon nanofibres
as improved neural and orthopaedic implants. Nanotech-
nology 15, 48, 2004.
116. Wang, K., Fishman, H. A., Dai, H., and Harris, J. S. Neural
stimulation with a carbon nanotube microelectrode array.
Nano Lett 6, 2043, 2006.
117. Norman, J. and Desai, T. Methods for fabrication of na-
noscale topography for tissue engineering scaffolds. Ann
Biomed Eng 34, 89, 2006.
118. Silva, G. A., Czeisler, C., Niece, K. L., Beniash, E., Har-
rington, D. A., Kessler, J. A., and Stupp, S. I. Selective
differentiation of neural progenitor cells by high-epitope
density nanofibers. Science 303, 1352, 2004.
119. McKenzie, J. L., Waid, M. C., Shi, R., and Webster, T. J.
Decreased functions of astrocytes on carbon nanofiber ma-
terials. Biomaterials 25, 1309, 2004.
120. Hasegawa, K., Chang, Y.-W., Li, H., Berlin, Y., Ikeda, O.,
Kane-Goldsmith, N., and Grumet, M. Embryonic radial glia
bridge spinal cord lesions and promote functional recovery
following spinal cord injury. Exp Neurol 193, 394, 2005.
121. Recknor, J. B., Sakaguchi, D. S., and Mallapragada, S. K.
Growth and Differentiation of astrocytes and neural pro-
genitor cells on micropatterned polymer films. Ann N Y
Acad Sci 1049, 24, 2005.
122. Biran, R., Noble, M. D., and Tresco, P. A. Directed nerve
outgrowth is enhanced by engineered glial substrates. Exp
Neurol 184, 141, 2003.
123. Deumens, R., Koopmans, G. C., den Bakker, C. G. J., Ma-
quet, V., Blacher, S., Honig, W. M. M., Jerome, R., Pirard,
J. P., Steinbusch, H. W. M., and Joosten, E. A. J. Alignment
of glial cells stimulates directional neurite growth of CNS
neurons in vitro. Neuroscience 125, 591, 2004.
124. Bruder, J. M., Monu, N. C., Harrison, M. W., and Hoffman-
Kim, D. Fabrication of polymeric replicas of cell surfaces
with nanoscale resolution. Langmuir 22, 8266, 2006.
125. Bruder, J. M., Lee, A. P., and Hoffman-Kim, D. Biomimetic
materials replicating Schwann cell topography enhance
neuronal adhesion and neurite alignment in vitro. J Biomater
Sci Polym Ed 18, 967, 2007.
126. Belkas, J. S., Shoichet, M. S., and Midha, R. Axonal guid-
ance channels in peripheral nerve regeneration. Oper Tech
Orthop 14, 190, 2004.
127. Battiston, B., Geuna, S. Ferrero, M., and Tos, P. Nerve repair
by means of tubulization: literature review and personal
clinical experience comparing biological and synthetic con-
duits for sensory nerve repair. Microsurgery 25, 258, 2005.
128. Pearson, R. G., Molino, Y., Williams, P. M., Tendler, S. J. B.,
Davies, M. C., Roberts, C. J., and Shakesheff, K. M. Spatial
confinement of neurite regrowth from dorsal root gan-
glia within nonporous microconduits. Tissue Eng 9, 201,
2003.
129. Bini, T.B., Gao, S., Xu, X., Wang, S., Ramakrishna, S., and
Leong, K.W. Peripheral nerve regeneration by microbraided
poly(L-lactide-co-glycolide) biodegradable polymer fibers.
J Biomed Mater Res A 68, 286, 2004.
130. Cai, J., Peng, X., Nelson, K. D., Eberhart, R., and Smith, G.
M. Synergistic improvements in cell and axonal migration
across sciatic nerve lesion gaps using bioresorbable filaments
and heregulin-beta1. J Biomed Mater Res A 69, 247, 2004.
131. Ning Zhang, C. Z. X. W. Fabrication of semipermeable
hollow fiber membranes with highly aligned texture for
nerve guidance. J Biomed Mater Res A 75, 941, 2005.
132. Smeal, R. M., Rabbitt, R., Biran, R., and Tresco, P. A.
Substrate curvature influences the direction of nerve out-
growth. Ann Biomed Eng 33, 376, 2005.
133. Patist, C. M., Mulder, M. B., Gautier, S. E., Maquet, V.,
Jerome, R., and Oudega, M. Freeze-dried poly(-lactic acid)
macroporous guidance scaffolds impregnated with brain-
derived neurotrophic factor in the transected adult rat tho-
racic spinal cord. Biomaterials 25, 1569, 2004.
134. Fine, E. G., Decosterd, I., Papaloizos, M., Zurn, A. D., and
Aebischer, P. GDNF and NGF released by synthetic guid-
ance channels support sciatic nerve regeneration across a
long gap. Eur J Neurosci 15, 589, 2002.
135. Aszmann, O. C., Korak, K. J., Kropf, N., Fine, E., Aebischer,
P., and Frey, M. Simultaneous GDNF and BDNF application
leads to increased motoneuron survival and improved
functional outcome in an experimental model for obstetric
brachial plexus lesions. Plast Reconstr Surg 110, 1066, 2002.
136. Yang, Y., De Laporte, L., Rives, C. B., Jang, J. H., Lin, W. C.,
Shull, K. R., and Shea, L. D. Neurotrophin releasing single
and multiple lumen nerve conduits. J Control Release 104,
433, 2005.
137. Xu, X., Yee, W.-C., Hwang, P. Y. K., Yu, H., Wan, A. C. A.,
Gao, S., Boon, K.-L., Mao, H.-Q., Leong, K. W., and Wang,
S. Peripheral nerve regeneration with sustained release of
poly(phosphoester) microencapsulated nerve growth factor
within nerve guide conduits. Biomaterials 24, 2405, 2003.
138. Mohanna, P. N., Young, R. C., Wiberg, M., and Terenghi, G.
A composite poly-hydroxybutyrate-glial growth factor con-
duit for long nerve gap repairs. J Anat 203, 553, 2003.
139. Rafiuddin Ahmed, M. and Jayakumar, R. Peripheral nerve
regeneration in RGD peptide incorporated collagen tubes.
Brain Res 993, 208, 2003.
140. Taylor, S. J., McDonald, J. W., and Sakiyama-Elbert, S. E.
Controlled release of neurotrophin-3 from fibrin gels for
spinal cord injury. J Control Release 98, 281, 2004.
141. Niere, M., Braun, B., Gass, R., Sturany, S., and Volkmer, H.
Combination of engineered neural cell adhesion molecules
and GDF-5 for improved neurite extension in nerve guide
concepts. Biomaterials 27, 3432, 2006.
142. Hashimoto, T., Suzuki, Y., Kitada, M., Kataoka, K., Wu, S.,
Suzuki, K., Endo, K., Nishimura, Y., and Ide, C. Peripheral
nerve regeneration through alginate gel: analysis of early
outgrowth and late increase in diameter of regenerating
axons. Exp Brain Res 146, 356, 2002.
143. Tsai, E. C., Dalton, P. D., Shoichet, M. S., and Tator, C. H.
Matrix inclusion within synthetic hydrogel guidance chan-
nels improves specific supraspinal and local axonal regen-
eration after complete spinal cord transection. Biomaterials
27, 519, 2006.
144. Tsai, E. C., Dalton, P. D., Shoichet, M. S., and Tator, C. H.
Synthetic hydrogel guidance channels facilitate regeneration
of adult rat brainstem motor axons after complete spinal cord
transection. J Neurotrauma 21, 789, 2004.
50 LI AND HOFFMAN-KIM
188
145. Katayama, Y., Montenegro, R., Freier, T., Midha, R.,
Belkas, J. S., and Shoichet, M. S. Coil-reinforced hydrogel
tubes promote nerve regeneration equivalent to that of nerve
autografts. Biomaterials 27, 505, 2006.
146. Zhang, Z., Rouabhia, M., Wang, Z., Roberge, C., Shi, G.,
Roche, P., Li, J., and Dao, L. H. Electrically conductive
biodegradable polymer composite for nerve regeneration:
electricity-stimulated neurite outgrowth and axon regenera-
tion. Artif Organs 31, 13, 2007.
147. Evans, G. R. D., Brandt, K., Katz, S., Chauvin, P., Otto, L.,
Bogle, M., Wang, B., Meszlenyi, R. K., Lu, L., Mikos, A.
G., and Patrick, C. W. Bioactive poly(-lactic acid) conduits
seeded with Schwann cells for peripheral nerve regeneration.
Biomaterials 23, 841, 2002.
148. Geller, H. M. and Fawcett, J. W. Building a bridge: engi-
neering spinal cord repair. Exp Neurol 174, 125, 2002.
149. McDonald, J. W. and Sadowsky, C. Spinal-cord injury.
Lancet 359, 417, 2002.
150. Coumans, J. V., Lin, T. T.-S., Dai, H. N., MacArthur, L.,
McAtee, M., Nash, C., and Bregman, B. S. Axonal regen-
eration and functional recovery after complete spinal cord
transection in rats by delayed treatment with transplants and
neurotrophins. J Neurosci 21, 9334, 2001.
151. Bregman, B. S., Coumans, J.-V., Dai, H. N., Kuhn, P. L.,
Lynskey, J., McAtee, M., Sandhu, F., and L. McKerracher,
G. D. Transplants and neurotrophic factors increase regen-
eration and recovery of function after spinal cord injury. In:
Heywood, C. A., ed. Progress in Brain Research. New York:
Elsevier, 2002, pp. 257–273.
152. Cheng, H., Cao, Y., and Olson, L. Spinal cord repair in adult
paraplegic rats: partial restoration of hind limb function.
Science 273, 510, 1996.
153. Rasouli, A., Bhatia, N., Suryadevara, S., Cahill, K., and
Gupta, R. Transplantation of preconditioned schwann cells
in peripheral nerve grafts after contusion in the adult spinal
cord. Improvement of recovery in a rat model. J Bone Joint
Surg Am 88, 2400, 2006.
154. Jones, L. L., Oudega, M., Bunge, M. B., and Tuszynski, M.
H. Neurotrophic factors, cellular bridges and gene therapy
for spinal cord injury. J Physiol 533, 83, 2001.
155. Hall, E. D. and Springer, J. E. Neuroprotection and Acute
spinal cord injury: a reappraisal. NeuroRX 1, 80, 2004.
156. Mattson, M. P. Apoptosis in neurodegenerative disorders.
Nat Rev Mol Cell Biol 1, 120, 2000.
157. Fouad, K., Schnell, L., Bunge, M. B., Schwab, M. E.,
Liebscher, T., and Pearse, D. D. Combining Schwann cell
bridges and olfactory-ensheathing glia grafts with chon-
droitinase promotes locomotor recovery after complete
transection of the spinal cord. J Neurosci 25, 1169, 2005.
158. Ohori, Y., Yamamoto, S.-i., Nagao, M., Sugimori, M., Ya-
mamoto, N., Nakamura, K., and Nakafuku, M. Growth
factor treatment and genetic manipulation stimulate neuro-
genesis and oligodendrogenesis by endogenous neural pro-
genitors in the injured adult spinal cord. J. Neurosci. 26,
11948, 2006.
159. Romero, M. I., Rangappa, N., Garry, M. G., and Smith, G.
M. Functional regeneration of chronically injured sensory
afferents into adult spinal cord after neurotrophin gene
therapy. J Neurosci 21, 8408, 2001.
160. Haastert, K. and Grothe, C. Gene therapy in peripheral
nerve reconstruction approaches. Curr Gene Ther 7, 221,
2007.
161. Lu, P., Jones, L. L., Snyder, E. Y., and Tuszynski, M. H.
Neural stem cells constitutively secrete neurotrophic factors
and promote extensive host axonal growth after spinal cord
injury. Exp Neurol 181, 115, 2003.
162. Teng, Y. D., Lavik, E. B., Qu, X., Park, K. I., Ourednik, J.,
Zurakowski, D., Langer, R., and Snyder, E. Y. Functional
recovery following traumatic spinal cord injury mediated by
a unique polymer scaffold seeded with neural stem cells.
Proc Natl Acad Sci 99, 3024, 2002.
Address reprint requests to:
Diane Hoffman-Kim, Ph.D.
Box G-B387
Brown University
Providence, RI 02912
E-mail: [email protected]
TISSUE-ENGINEERED PLATFORMS OF AXON GUIDANCE 51

Appendix B
Effects of RhoGTPases on Neurite
Outgrowth on Multimolecular
Gradients
The glial scar of hypertrophic astrocytes that form after an injury in the central nervous sys-
tem is well documented to be inhibitory, with several classes of growth inhibitory molecules
that are upregulated, including the family of extracellular matrix molecules known as chon-
droitin sulfate proteoglycans (CSPG) (Fitch and Silver, 1997; Jones et al., 2003; Morgenstern
et al., 2002). Using microfluidic techniques, proteins can be adsorbed on glass substrates in
a manner that mimics the gradient of CSPG found in vivo after spinal cord injury.
CSPG are organized in a crude gradient with the lowest concentrations in the lesion penum-
bra and the highest in the epicenter (Davies et al., 1999; Fitch and Silver, 1997), and
surprisingly, a permissive molecule, laminin (LN) is also present in the microenvironment
after an injury in a graded fashion. To study how gradients of guidance cues are detected and
transduced as neurites navigate complex inhibitory microenvironments, the glial scar was
modeled as two parallel gradients containing LN and CPSG, where higher concentrations of
both cues are present at one edge and decrease towards the opposite edge of a microchannel.
189
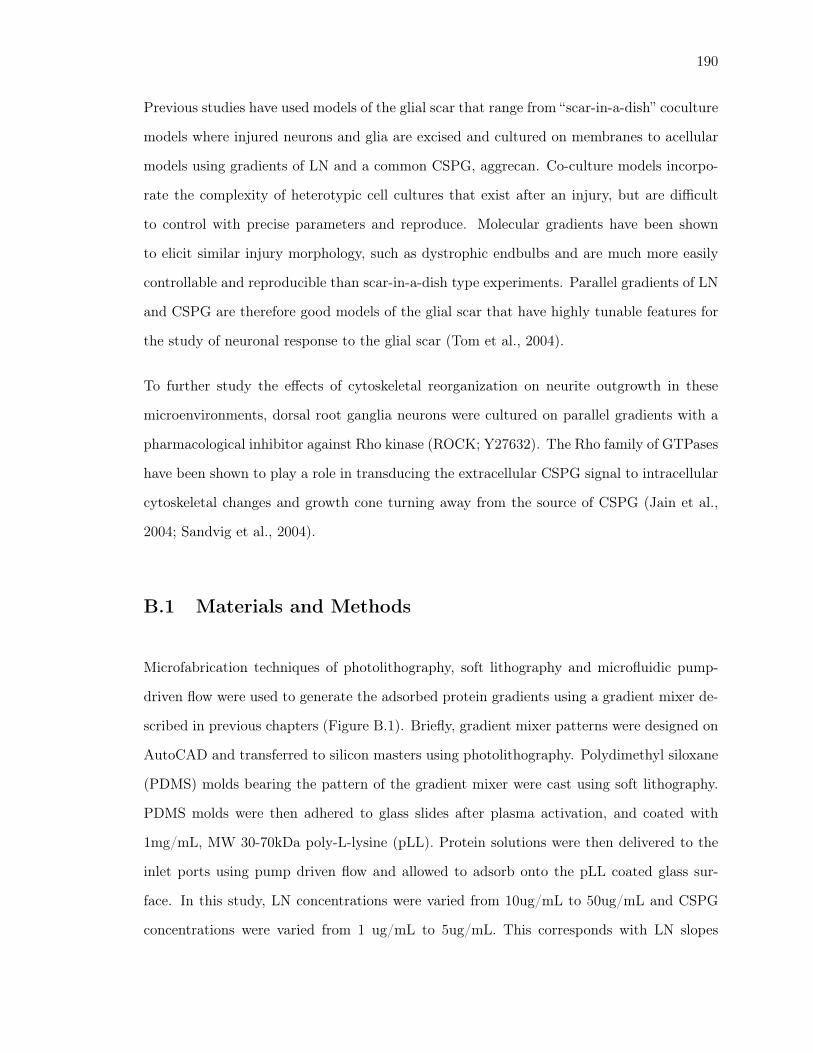
190
Previous studies have used models of the glial scar that range from “scar-in-a-dish” coculture
models where injured neurons and glia are excised and cultured on membranes to acellular
models using gradients of LN and a common CSPG, aggrecan. Co-culture models incorpo-
rate the complexity of heterotypic cell cultures that exist after an injury, but are difficult
to control with precise parameters and reproduce. Molecular gradients have been shown
to elicit similar injury morphology, such as dystrophic endbulbs and are much more easily
controllable and reproducible than scar-in-a-dish type experiments. Parallel gradients of LN
and CSPG are therefore good models of the glial scar that have highly tunable features for
the study of neuronal response to the glial scar (Tom et al., 2004).
To further study the effects of cytoskeletal reorganization on neurite outgrowth in these
microenvironments, dorsal root ganglia neurons were cultured on parallel gradients with a
pharmacological inhibitor against Rho kinase (ROCK; Y27632). The Rho family of GTPases
have been shown to play a role in transducing the extracellular CSPG signal to intracellular
cytoskeletal changes and growth cone turning away from the source of CSPG (Jain et al.,
2004; Sandvig et al., 2004).
B.1 Materials and Methods
Microfabrication techniques of photolithography, soft lithography and microfluidic pump-
driven flow were used to generate the adsorbed protein gradients using a gradient mixer de-
scribed in previous chapters (Figure B.1). Briefly, gradient mixer patterns were designed on
AutoCAD and transferred to silicon masters using photolithography. Polydimethyl siloxane
(PDMS) molds bearing the pattern of the gradient mixer were cast using soft lithography.
PDMS molds were then adhered to glass slides after plasma activation, and coated with
1mg/mL, MW 30-70kDa poly-L-lysine (pLL). Protein solutions were then delivered to the
inlet ports using pump driven flow and allowed to adsorb onto the pLL coated glass sur-
face. In this study, LN concentrations were varied from 10ug/mL to 50ug/mL and CSPG
concentrations were varied from 1 ug/mL to 5ug/mL. This corresponds with LN slopes

191
Figure B.1: Schematic of gradient fabrication methods.
ranging between -0.04ug/mL/um to -0.2ug/mL/um, and CSPG slopes ranging between -
0.004ug/mL/um and -0.02ug/mL/um.
PDMS mold over the gradient channel was cut off to expose the channel for cell seeding.
Dissociated dorsal root ganglia neurons (DRG) from postnatal day 0-4 rat pups were used
in these experiments. DRG were cultured at 25,000 cells/well over these substrates for 24
hours, then fixed with 2% paraformaldehyde. Cell adhesion in each 50um region across the
channel, neurite length and direction of neurite outgrowth were measured. All samples were
run in duplicate, and data analysis was performed using ANOVA.
For pharmacological treatment against RhoGTPases to study the effects of Rho kinase in
modulating the response to CSPG in parallel double cue gradients, 10uM Y27632 was applied
after 1 hour to DRGs cultured on parallel gradients of LN30CS5/BSA. Image and data
analysis was carried out after 24 hours in culture as described above.
Timelapse microscopy was performed on DRG cultures in LN30CSPG5/BSA substrates with
and without the addition of Y27632. Gradient fabrication was performed as described above,
and cell density was seeded at 100,000 cells/well. Phase-contrast images were taken at 10x.
OpenLab software allowed selection of 5 fields of view along the channel for automated
timelapse imaging at 10 minute intervals over 24 hours.
Data analysis of timelapse images was performed by manually tracking cell bodies and
growth cones (“tips” of the neurites as determined by phase contrast). These coordinates
were then used to determine the distance between cell body and growth cone, as well as the
angle of this vector with respect to the channel. The angle of the vector was determined for

192
each time point, and each tracked cell and neurite was divided into four categories based
on their outgrowth angles over time: consistently growing toward higher concentrations
of LN and CSPG (180-359°), consistently growing away from higher concentrations of LN
and CSPG (0-179°), turning toward LN and CSPG, or tuning away from LN and CSPG.
The percentages of cells falling into each category were calculated, and the corresponding
distance data for each of the angle groups was then grouped, averaged and the standard
deviation was taken.
B.2 Results
B.2.1 Varying the slope of LN and CSPG parallel gradients changes the
cellular adhesion patterns over the gradient channel
Cellular adhesion across the channel was evaluated by counting the number of cells in each
50um wide region as described above. Higher inlet concentrations of LN elicited relatively
higher cellular adhesion in regions 1 and 2, corresponding to higher levels of higher LN
and CSPG concentrations. Further, substrates with the highest inlet concentrations of LN
tested (LN50+CS1/BSA and LN50+CS5/BSA), showed a graded adhesion pattern across
the channel width. Lower concentrations of LN (10, 30ug/mL) applied elicited relatively
higher cellular adhesion in regions 2 and 3, corresponding to moderate LN and CSPG con-
centrations (Figure B.2a).
Lengths of the longest neurites were compared for cultures presenting parallel double cue
gradients of different slopes. Varying inlet concentrations of both LN and CSPG was found
to affect neurite length, as tested using oneway ANOVA. Post-hoc tests using Bonferroni’s
test showed interesting comparisons between the groups tested. When the CSPG inlet con-
centration was held constant at 1ug/mL while LN inlet concentrations were varied between
10 and 50ug/mL, neurite lengths were significantly increased. When the CSPG inlet con-
centration was held constant at 5ug/mL while LN inlet concentrations were varied between
10, 30 and 50ug/mL, neurite lengths were significantly different between the samples.

193
Figure B.2: Cellular adhesion (A) and neurite length (B) on parallel gradients with varyinginlet concentrations and slopes of LN and CSPG.

194
Cellular adhesion Neurite length% Contribution p-value % Contribution p-value
LN 12.90 0.098 32.35 0.003CSPG 62.11 0.009 58.62 0.008
Interaction 13.=6 0.090 not selected N/A
Table B.1: Effect of LN and CSPG slopes on cell adhesion and neurite length.
B.2.2 CSPG slopes presented have a larger effect than LN slopes on
cellular adhesion and neurite length on parallel gradient substrates
Using a 2 level factorial ANOVA design, the relationship between cellular responses (adhe-
sion, mean neurite length) and inlet concentration was modeled. Equation 1 describes the
relationship between LN and CSPG concentration and cell adhesion. Equation 2 describes
the relationship between LN and CSPG concentration and neurite length. The statistical
model showed that CSPG significantly affects cell adhesion and both LN and CSPG signifi-
cantly affect neurite length. The contributions of each input parameter (inlet concentration
of LN and CSPG) to the statistical model were calculated and tested for significance (Table
B.1).
B.2.3 ROCK inhibition alters cell adhesion patterns on parallel LN/CSPG
gradients
Parallel gradients presenting inlet LN concentration of 30ug/mL and inlet CSPG concen-
tration of 5ug/mL show a preference for cells to adhere towards the middle of the channel,
in Region 3, a region that corresponds to an intermediate concentration of both LN and
CSPG. The addition of Y27632 allows more cells to adhere onto the leftmost area of the
channel, Region 1, a region that corresponds with higher concentration of both LN and
CSPG. This suggests that the addition of Y27632 to a culture with moderate levels of both
LN and CSPG will allow cells to attach to LN rich areas that were inhibitory prior to the
addition of the drug (Figure B.3).

195
Figure B.3: ROCK inhibition alters cell adhesion patterns on parallel LN/CSPG gradients.
Figure B.4: ROCK inhibition increases neurite turning on parallel LN/CSPG gradients over24 hours.
B.2.4 ROCK inhibition increases neurite turning on parallel LN/CSPG
gradients over 24 hours
Timelapse anaylsis of neurite growth on LN30CS5/BSA substrates with the addition of
Y27632 showed a decrease in neurite turning, in either direction (towards and away from
regions of higher LN and CSPG concentrations) compared to the untreated controls (Figure
B.4). On LN30CSPG5/BSA substrates with no Y27632 treatment, 67% of neurites changed
directions over the 24 hour culture period, as compared to 34% on Y27632 treated cultures.
B.3 Discussion
Parallel LN and CSPG gradients of different slope were found to affect both cellular adhesion
and neurite length. The complex environment of the glial scar contains both molecules, and

196
their interaction particularly when combined with spatial pattening of the molecule shows
complex cellular responses. Studies in which antibodies to various antigens of laminin were
used on substrates coated with both laminin and CSPG showed that CSPG did not interfere
with the permissive effects of laminin by “masking” laminin (Qiu et al 2000). The mechanism
by which these conflicting cues do interact or interefere with each other as the cell attempts
to interpret them is still unclear. By varying the inlet concentration and slopes of each of
the LN and CSPG gradients in a parallel gradient environment, we can start to investigate
how the molecules may guide cellular adhesion or neurite outgrowth. Cellular adhesion
and neurite outgrowth in this study are both more affected by CSPG inlet concentration
than LN, the most marked result being that at lower concentrations of CSPG applied, LN
gradients elicit selective cellular adhesion to the regions 1 and 2, corresponding to the higher
LN and CSPG concentrations.
ROCK is a down stream effector of Rho, a member of the Rho family of GTPases, which
has been shown to mediate neurite growth inhibition. Specifically, activation of Rho induces
growth cone collapse and neurite retraction. Further, in the glial scar environment, an
increase in Rho activity has been observed after injury. In this study, it was shown that
ROCK inhibition was able to alter cellular adhesion patterns and increase the percentage of
cells adhering to regions presenting higher molecular concentrations of CSPG. This agrees
with results from previous studies which have shown that the inactivation of Rho is sufficient
to stimulate axon regeneration in inhibitory encivironments (Dergham et al., 2002; Madura
et al., 2004).
Dynamic stress fiber polymerization has been observed at the leading edge of growth cones
(Suter and Forscher, 2000), and F-actin turnover is thought to occur rapidly at this leading
edge, on the order of minutes: 3-5 minutes in neuroblastoma cells NG108-15 as visualized
by photoactivation experiments (Mallavarapu and Mitchison, 1999) and up to 10 minutes in
DRG growth cones (Gallo et al., 2002). Inhibiting actin turnover has been observed to cause
growth cone contraction and neurite retraction (due to endogenous actomyosin contractility),
and it has been hypothesized that some inhibitory cues may inhibit neurite extension by
inhibiting actin turnover (Gallo et al., 2002). Hence, the mechanism by which ROCK

197
inhibition (thereby Rho) could promote neurite growth was investigated in this study using
timelapse analysis of neurite growth dynamics. As RhoA is an important signaling molecule
that governs the polymerization and depolymerization of these stress fibers in neurites; which
influences neuronal motility and neurite extension, the dynamics of neurons over a 24 hour
time period in culture, observed at 10 minute intervals, reflected the intracellular cytoskeletal
organization. In this study, ROCK inhibition changed neurite extension/retraction dynamics
and neurite turning was increased.
In conclusion, we have developed an in vitro model of the glial scar incorporating LN and
CSPG with tunable gradient slope. LN appears to have a larger effect on cellular adhesion
and neurite extension than CSPG. ROCK appears to play a large role in inhibiting neurite
extension, as the inhibition of ROCK on these substrates resulted in longer neurites. ROCK
appears to elicit these changes through altering neurite extension, retraction and turning,
suggesting that regeneration across the scar may be successful if we can learn how to properly
apply ROCK inhibitors in a directed manner. We now have a better understanding of how
neurites navigate across the post injury environment of a glial scar, as modeled by two key
proteins present in gradient form in vivo. Importantly, our data suggest that LN can play
a large role in promoting cellular adhesion and neurite growth, even in the presence of the
highly upregulated inhibitory molecules in the CSPG family.
B.4 References
Davies SJA, Goucher DR, Doller C, Silver J. Robust Regeneration of Adult Sensory Axons in
Degenerating White Matter of the Adult Rat Spinal Cord. J. Neurosci., 1999; 19: 5810-22.
Dergham P, Ellezam B, Essagian C, Avedissian H, Lubell WD, McKerracher L. Rho signaling
pathway targeted to promote spinal cord repair. J Neurosci, 2002; 22: 6570-7.
Fitch MT, Silver J. Glial cell extracellular matrix: boundaries for axon growth in develop-
ment and regeneration. Cell Tissue Res, 1997; 290: 379-84.

198
Gallo G, Yee HF, Jr., Letourneau PC. Actin turnover is required to prevent axon retraction
driven by endogenous actomyosin contractility. J. Cell Biol., 2002; 158: 1219-28.
Jain A, Brady-Kalnay SM, Bellamkonda RV. Modulation of Rho GTPase activity alleviates
chondroitin sulfate proteoglycan-dependent inhibition of neurite extension. J Neurosci Res,
2004; 77: 299-307.
Jones LL, Margolis RU, Tuszynski MH. The chondroitin sulfate proteoglycans neurocan,
brevican, phosphacan, and versican are differentially regulated following spinal cord injury.
Exp Neurol, 2003; 182: 399-411.
Madura T, Yamashita T, Kubo T, Fujitani M, Hosokawa K, Tohyama M. Activation of Rho
in the injured axons following spinal cord injury. EMBO Rep, 2004; 5: 412-7.
Mallavarapu, A., and Mitchison, T. Regulated actin cytoskeleton assembly at filopodium
tips controls their extension and retraction. J. Cell Biol, 1999; 146:1097–1106.
Morgenstern DA, Asher RA, Fawcett JW. Chondroitin sulphate proteoglycans in the CNS
injury response. Prog Brain Res, 2002; 137: 313-32.
Sandvig A, Berry M, Barrett LB, Butt A, Logan A. Myelin-, reactive glia-, and scar-derived
CNS axon growth inhibitors: expression, receptor signaling, and correlation with axon re-
generation. Glia, 2004; 46: 225-51.
Suter DM, Forscher P. Substrate-cytoskeletal coupling as a mechanism for the regulation of
growth cone motility and guidance. J Neurobiol, 2000; 44: 97-113.
Tom VJ, Steinmetz MP, Miller JH, Doller CM, Silver J. Studies on the Development and
Behavior of the Dystrophic Growth Cone, the Hallmark of Regeneration Failure, in an In
Vitro Model of the Glial Scar and after Spinal Cord Injury. J. Neurosci., 2004; 24: 6531-9.

Appendix C
Bridging and motility on
micropatterned grooves
C.1 Introduction
Neurons and glia respond to physical cues in their microenvironment. Surface topography
has been shown to be important for tissue engineering, as a way in which biomaterials can
influence cell behavior. Topographical features can direct a wide range of cellular functions
such as activation, orientation, and migration (reviewed in (Curtis and Wilkinson, 1997)).
One specific way in which topography can induce changes in cell response is through contact
guidance, where anisotropic topographical features direct cells to align their orientation and
morphology along the long axis of topographical features (Manwaring et al., 2004; Rajnicek
and McCaig, 1997). The contact guidance phenomenon has been described in particular
in regard to the response of cells to repeating grooved topography over a wide range of
microscale features (Song and Uhrich, 2007). Many cell types have been shown to exihibit
contact guidance when cultured on grooved substrates presenting nano- to micro-scaled
features, including fibroblasts, astrocytes and neurons. Schwann cells (SC) in particular,
have been shown to increase alignment to microgrooved substrates, as compared to flat
substrates presenting no topographical cue (Hsu et al., 2005; Miller et al., 2002).
199

200
Anisotropic topographical features may also direct cell responses in a different manner from
contact guidance. Grooved topographical features can also direct cells to extend across
grooves and plateaus, with no apparent underlying support. This morphology, termed “cel-
lular bridging” has been observed in primary neurons: dorsal root ganglia (DRG), hippocam-
pal, neuroblastoma (B104) cells, SC, and fibroblasts (Goldner et al., 2006). Cells exhibit
complex interactions with grooved substrates, where complex mechanisms of cell adhesion,
process extension and tension are required for pulling a cell 50μm above its initial adhesion
point.
Molecular cues also provide guidance information for neurons and glia. In the context of
topography, non-uniformity in protein deposition on the edges of topographical features has
been proposed to play a role in contact guidance (Lopez et al., 1993). Experiments studying
the morphology of focal adhesion formations on fibroblasts on microtextured surfaces have
shown that these surfaces can influence the orientation of intracellular and extracellular pro-
teins (den Braber et al., 1998). Hence the presentation of both molecular and topographical
cues may have synergistic effects on neurite outgrowth.
In this study, we evaluated the formation and dynamics of DRG and SC bridges on mi-
crogrooved substrates presenting different patterns of molecular cues using different methods
of protein deposition (adsorbed and covalent binding of proteins to surfaces). Here we show
that there are differences in DRG and SC adhesion preferences and bridging morphology,
and that the cells undergoing the bridging formation process are highly motile and dynamic.
C.2 Materials and Methods
All reagents were obtained from Invitrogen unless otherwise specified.
C.2.1 Substrate preparation
Microgrooved substrates were fabricated using photolithography and soft lithography as de-
scribed in Goldner et al. (Goldner et al., 2006). Briefly, masks containing the substrate

201
patterns were designed using AutoCAD, as a series of repeating lines 50μm wide, spaced
70μm apart, over a 1cm x 1cm area. Patterns were transferred onto silicon wafers using pho-
tolithography. Substrates for cell culture were then made by fabricating poly(dimethylsiloxane)
(PDMS) impression replicas with 1-2mm thickness, of the pattern from the silicon wafer
masters.
C.2.2 Protein coating
Several micropatterns were fabricated using both passive adsorption techniques and covalent
attachment techniques. Several surfaces were selectively coated, all surfaces (total), plateau
surfaces (plateau) and groove and wall surfaces (groove). Schematic of each are shown in
Figure C.1.
C.2.2.1 Adsorption
Substrates were coated via adsorption with either 3% fluorescein isothiocyanate conjugated
bovine serum albumin (FITC-BSA) or 50μg/mL LN. For coating on all surfaces (total coat-
ing), substrates were plasma activated at 10.5W for 60 s with a plasma cleaner/sterilizer
(PDC – 32 G, Med RF level, Harrick), sterilized by immersion in 70% ethanol, and rinsed
with sterile dH2O. Substrates were incubated with protein solutions for one hour, and rinsed
with dH2O before plating.
For selective coating on surfaces of groove floors and walls (groove coating), the edges of
the grooved substrates including the ends of the grooves were removed, creating channels.
PDMS substrates were plasma activated as described above and reversibly adhered to a
glass coverslip. FITC-BSA or LN solutions were applied to the open ends of the channel,
allowing capillary action to passively draw the protein solution into the channels. Excess
protein solution was applied at each end of the channel to prevent drying, and incubated at
room temperature for 1 hour. Excess protein was then removed using an air stream and the
PDMS substrate was then removed from the coverslip.

202
A
B
C
D
Figure C.1: Selective micropatterns of microgrooved substrates.(A) total coated and (B) plateau coated substrates were fabricated via adsorption andcovalent attachment methods, (C) groove coated substrates were fabricated via adsorptiononly, and (D) shows substrates with no surface modification. P, plateau, W, wall and F,floor.

203
For selective coating on plateau surfaces (plateau coating), a modified method of micro-
contact printing was used. Glass coverslips were submerged in 10% sodium docecyl sulfate
(SDS; Sigma-Aldrich) and sonicated, rinsed in dH2O and dried. Coverslips were coated with
50μg/mL LN for one hour, and excess protein solution was removed using an airstream.
PDMS substrates were plasma activated as described above and reversibly adhered to the
coated glass coverslip for 1 hour at room temperature before being removed from the cover-
slip.
C.2.2.2 Covalent protein attachment
Substrates were coated covalently with ,either 3% FITC-BSA or 50μg/mL LN. Substrates
were cleaned by immersion in 10% SDS solution and sonicated for 5 minutes. Substrates
were rinsed with distilled H2O, then methanol, and baked at 45°C for 5 minutes. Substrates
were then incubated with 5% 3-Aminopropyl Trimethoxysilane (APTS, Aldrich) in 100%
ethanol at 30rpm for 10 minutes. Substrates were then rinsed with ethanol, dried, then
baked at 80°C for 2 hours. The substrates were then coated with a 5mg/ml solution of the
crosslinker Bis[sulfosuccinimidyl] suberate (BS3, Pierce) in Phosphate Buffered Saline (PBS)
for 20 minutes at room temperature. Substrates were rinsed with PBS to remove excess BS3.
For control samples, substrates were then dried with pressurized air in preparation for cell
seeding. Protein solutions were then applied depending on the micropattern desired. For
uniformly coated samples, substrates were then coated with protein solution for 1 hour
at room temperature. For plateau coated samples, substrates were microstamped with
a coverslip coated with protein solution (as described above). For orthogonally coated
samples, substrates were microstamped with an adsorbed protein coated grooved substrate
(as described above), applied orthogonally to underlying grooved substrates.
C.2.3 Cell culture
Dissociated DRG neurons from postnatal day 0-4 rat pups were used in these experiments.
DRG were seeded at 110,000 cells/mL for bridging experiments. DRG were cultured in

204
Dulbecco’s Modified Eagle Medium (DMEM), 10% fetal bovine serum (FBS), penicillin
(100U/mL), streptomycin (100μg/mL) and 50ng/mL nerve growth factor, on microgrooved
substrates described above for 24 hours.
SC from adult rat sciatic nerve (SC, P4 through P10, a gift from the Bunge lab) were used
in these studies. SC were cultured in DMEM supplemented with 10%FBS, 1% L-glutamine,
2μM forskolin, 10μg/mL bovine pituitary extract, 226μM heregulin (gift from Genentech),
and penicillin (100U/mL), streptomycin (100μg/mL) (SC media) on poly(L-lysine) coated
surfaces 0.01% (PLL; Sigma). SC were seeded at 50,000 cells/mL for adhesion and endpoint
bridging studies and 25,000cells/mL for timelapse studies.
Two methods of cell seeding were used in these studies: drop seeding, where the cell sus-
pension with the final seeding density in 200 μL was dropped onto the surface of the mi-
crogrooved substrates. After the initial incubation at 37◦ for 3 hours with 200μL media
where the cells adhered to the substrated, 3mL of media was added to the cultures. In
solution seeding, a cell suspension with the final seding density in 5mL of media was added
to the culture dish with the microgrooved substrate. Culture dishes were gently agitated
(30rpm, 10min) for more even seeding across the entire substrate surface. Drop seeding was
used for all DRG cultures, both drop seeding and solution seeding were used for SC cultures
and specified in the relevant sections. Solution seeding was used for all SC timelape studies.
C.2.4 Image analysis
Epifluorescence microscopy with a Nikon Eclipse TE2000-S was used to visualize LN coated
surfaces after immuohistochemistry. Phase contrast microscopy using a Nikon Eclipse TE2000-
S was used to visualize cellular bridges. All analysis was performed on unfixed samples. A
bridge was defined as a cell extension or cell body that spanned from one plateau or wall
to the adjacent plateau or wall without underlying support. Distinction between bridge
types was determined by varying the depth (z) plane of focus and determining the depth
at which bridges formed. This was easily distinguishable as the bridge came into focus
at specific focal planes that corresponded to the depth at which the bridge formed. Most

205
analyses done in this study was on “plateau-level bridges,” defined as bridges that formed
in z-planes within -10μm of the plateau. Some analysis was done on “wall bridges,” defined
as bridges that formed in z-planes between -10μm and -40μm from the plateau. For total
coated and plateau coated samples, cells and bridges on 10 grooves were evaluated on n=2
or n=3 samples. For groove coated samples, cells and bridges on 20 grooves were evaluated
on n=3 samples, as substrate preparation of groove coated samples required cutting half of
the available grooved area.
C.2.5 Scanning electron microscopy
To visualize cellular morphologies and cellular bridges under scanning electron microscopy
(SEM), samples were fixed using Karnovsky’s fixative for 3 hours, rinsed in 0.1M sodium
cacodylate buffer, and postfixed in 1% osmium tetroxide (OsO4) in 0.1M cacodylate buffer
for 1hour. Samples were incubated in 1% thiocarbohydrazide (TCH) for 30 minutes, 0.5%
OsO4 for 30 minutes and dehydrated using graded ethanols to 100% ethanol. Following
air-drying and gold-palladium sputter coating, samples were imaged using a Hitachi S-270
SEM with 15kV acceleration voltage.
C.2.6 Timelapse analysis
Phase contrast images of four fields of view (two in the center of the grooves and two at
groove edges) were captured every 10 minutes over 24 hours. Images at each field of view
were captured as z-stacks of 70μm, with seven z-planes with 10μm intervals. Z-stacks were
oriented so that an image was taken at 10μm above the level of the plateau and 10μm below
the level of the groove. After 24 hours, image sequences were organized for analysis with
Volocity software and exported as Quicktime movies.
Soma of individual SC were tracked over 24 hours using ImageJ Manual Tracker. Z-positions
of soma over time were recorded and from those data, distance and velocity were calculated.
Velocity was calculated both over the each 10 minute interval, and over the climbing period
of bridge formation.

206
C.2.7 Modeling of force generation during bridging process
Tension forces required to pull a soma upwards on the groove were modeled as a system of
two cables in static equilibrium. Figure C.2 shows a free body diagram with forces acting
on the soma at particular geometries during bridge formation. Assumptions include no
translational and rotational motion by the soma, equal contribution of each process, and
frictionless and massless processes. Equations listed in Figure C.2 show the force calculations
and parameters for the model. Figure C.2 shows the input parameters used in the force
calculations, FzT = forces in z direction, FT =tension force, Fb =buoyancy force, Fd =drag
force, Fg =force due to gravity, m=mass, a =acceleration, R =radius of cell, ρ =density.
Values for cell density from (Schnaar and Schaffner, 1981).
C.3 Results
C.3.1 Preferential adhesion on micropatterned grooves
DRG and SC adhesion at 3 hours and 24 hours were evaluated on micropatterned substrates
with selective LN coating. The majority of DRGs on all substrates tested were in the grooves
at both 3 hours and 24 hours (Figure C.3). For SC on substrates with plateau or groove
LN coating, the majority of cells initially adhered on surfaces in grooves at 3 hours, and
moved onto the plateau surfaces by 24 hours in culture. For SC on substrates with total LN
coating, cells were more evenly dispersed between groove and plateau surfaces at 3 hours,
and more cells adhered on the plateau surfaces at 24 hours (Figure C.3).

207
Fg = mg
Fb = −mvρg
Fd = −6πηrV
∑Fz=ma = 0 = 2FT sin θ + FB − Fg − Fd
Parameters SC DRGCell density (g/cm2) 1.049 1.004Media density (g/cm2) 1.00 1.00Viscosity, η 1.69E-3 1.69E-3Volume (μm3) 8540 53400Mass (g) 8.57E-9 5.36E-8
Figure C.2: Free body diagram showing forces acting on a cell soma during bridge formationunder static equilibrium and input parameters used in the model.Where Fg =gravitational force, Fb =buoyancy force, Fd =drag force, m= mass, g= ac-celeration due to gravity, v = specific vlume, ρ =density, η =viscosity, r= radius, V =velocity

208
Cells in grooves after 3h
Micropatterned LN
total
coat
plateau
coat
groove
coat% c
ells
in g
rooves a
t 3h a
fter
cell
seedin
g
0.0
0.2
0.4
0.6
0.8
1.0
1.2SC
DRG
Cells on plateaus after 3h
Micropatterned LN
total
coat
plateau
coat
groove
coat
% c
ells
on p
late
aus a
t 3 h
ours
aft
er
cell
seedin
g
0.0
0.2
0.4
0.6
0.8
1.0
1.2SC
DRG
Micropatterned LN
total
coat
plateau
coat
groove
coat
% c
ells
in g
roove a
t 24 h
ours
aft
er
cell
seedin
g
0.0
0.2
0.4
0.6
0.8
1.0
1.2SC
DRG
Cells on plateaus after 24 h
Micropatterned LN
total
coat
plateau
coat
groove
coat
% c
ells
on p
late
aus a
t 24 h
ours
aft
er
cell
seedin
g
0.0
0.2
0.4
0.6
0.8
1.0
1.2SC
DRG
A B
C D
Cells in grooves after 24h
Figure C.3: Preferential cellular adhesion on micropatterned substrates.(A) At 3 hours, DRG preferentially adhered to grooves on all micropatterned LN substratestested. SC preferentially adhered to grooves, on plateau and groove coated substrates, andadhered to plateaus on total coated substrates. (B) At 24 hours, DRG preferentially adheredto grooves on all micropatterned LN substrates. SC preferentially adhered to plateaus onall micropatterned LN substrates.

209
C.3.2 Bridges across micropatterned grooves exhibit several stereotypic
morphologies
DRG and Schwann cell processes formed bridges with diverse morphologies. Bridges were
classified as “plateau” bridges and “wall” bridges, based on the depth at which the bridges
were formed, as described in section C.2.4 (Figure C.4a, b). Plateau bridges were further
classified as (1) “typical” bridges, described in Goldner et al. (Goldner et al., 2006), processes
across two adjacent plateaus with no underlying support at the center of the groove (Figure
C.4a), (2) “soma” bridges where a cell body along with processes spanned across two adjacent
plateaus and (3) “end” bridges where processes across two adjacent plateaus at the groove
edge (Figure C.4c). Bridges have been observed to be composed of a single neurite or
multiple neurites, and qualitatively DRG bridges appear to be more complex, with more
cell-cell interactions than Schwann cell bridges.
C.3.3 SC exhibit much higher incidence of bridging on selectively coated
grooved substrates
The number of bridges formed over 24 hours on micropatterned susbtrates with selective
LN coating was evaluated for DRG and Schwann cell culture. Only plateau bridges were
evaluated in this comparison. SCs formed more bridges than DRGs on all substrates tested
(Figure C.5). It is interesting to note that both SCs and DRGs were able to form bridges on
selectively coated (plateau and groove coated) substrates using the drop seeding method.
C.3.4 Method of protein attachment on microgrooved substrates affects
SC bridging
Protein coating was performed both by passive adsorption of LN solutions onto plasma
activated PDMS surfaces, as well as covalent attachment of LN using bifunctional linkers
APTS and BS3. Attachment of FITC-BSA showed that even coating was achieved using

210
P
P
W
P
P
W
P P P P
A B
C D
Figure C.4: Scanning electron micrographs of SC bridges of various morphologies.(A) plateau bridges with extensions at the z-plane of the plateau, (B) wall bridges, (C) endbridges that occur on the edge of the groove, and (D) floor-to-wall bridges. Only plateaubridges were evaluated for studies using DRGs, SCs on covalently attached LN substratesand timelapse studies. Plateau and wall bridges were evaluated in studies with SCs onadsorbed LN substrates. P, plateau, W, wall and arrow indicate bridges.
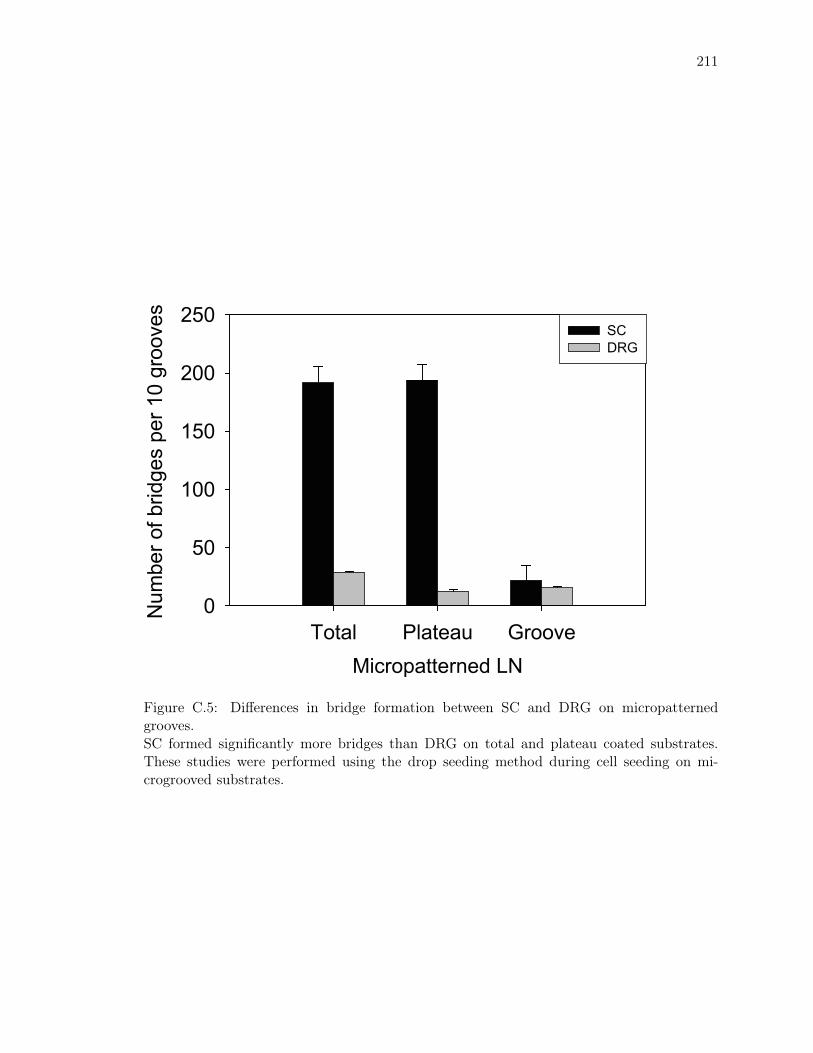
211
Micropatterned LN
Total Plateau Groove
Num
ber
of b
ridge
s pe
r 10
gro
oves
0
50
100
150
200
250SCDRG
Figure C.5: Differences in bridge formation between SC and DRG on micropatternedgrooves.SC formed significantly more bridges than DRG on total and plateau coated substrates.These studies were performed using the drop seeding method during cell seeding on mi-crogrooved substrates.

212
Bridge type SC DRGfast (time to bridge in min) <300 <1200slow(time to bridge in min) >300 >1200variant change in z direction
Table C.1: Criteria for bridge types used in timelapse analysis
both of these methods, and selective coating of specific surfaces was feasible using micro-
contact printing techniques. SC were seeded using the solution seeding method, and SC
bridges on total and plateau coated substrates were directly compared (Figure C.6). SC
plateau bridges formed on total LN coated substrates by either method, but significantly
more bridges formed on covalent than on adsorbed LN substrates (t-test p<0.05). SC bridges
were unable to form on adsorbed plateau LN coated substrates, but were observed on co-
valent LN coated substrates (Figure C.7). SC bridging on grooved substrates coated with
intermediary chemicals used in the covalent linking process was also evaluated as a control
(Figure C.7b).
C.3.5 Bridge formation dynamics
Soma of DRG and SC were tracked in the z-direction over time as bridges were forming over
grooved substrates. This data was plotted in several ways to visualize cell trajectories over
time: (1) all z heights measured for a particular cell type was averaged over each timepoint
to obtain an “average” trajectory for the cell type (Figure 7a, b), (2) bridges were sorted
by their dynamics into “fast”, “slow” and “variant” (criteria listed in Table C.1 for each cell
type), grouped and averaged over each timepoint for the average trajectory for each bridge
type (Figure 7c, d), (3) only the climbing phase of the soma were evaluated such that t0
was taken to be when the soma was observed to make its first movement in the z-direction
to determine the stereotypic trajectory each cell type (Figure 7e,f).
Average trajectories of SC (Figure 7a) and DRG (Figure 7b) show differences between SC
and DRG bridging dynamics. DRG appear to make constant upward progress in the groove,
whereas SC appear to have a climbing phase (0-400min), a suspension phase (400-800min)
and then a climbing phase (800-1200min). This could be an effect of more variable SC

213
Figure C.6: Differences in SC bridge types between substrates with different micropatternedcoatings.SC preferentially form wall bridges on total and groove coated substrates. SC did notform bridges on plateau coated substrates. These studies were performed using the solutionseeding method during cell seeding on microgrooved substrates.

214
Substrate coating (LN adsorbed)
Total Plateau Groove
Num
ber
of b
ridge
s
0
10
20
30
40
50
60
70
Substrate coating
Total LN
PlateauLN
BS3 APTS no coat
Num
ber
of b
ridge
s
0
10
20
30
40
50
60
70
Figure C.7: SC formed more bridges on (B) covalently coated substrates than (A) adsorptioncoated substrates.SC were able to form bridges on covalent plateau coated substrates. SC were also able toform bridges on coatings of intermediate chemicals used in the covalent attachment process(B).

215
SC DRGFg (N) -8.79E-11 -5.25E-10Fb (N) 8.37E-11 5.23E-10Fd(N) 1.38E-15 5.36E-16FzT (N) -1.72E-10 -1.05E-9
Table C.2: Gravitational, Buoyancy, Drag and Tension forces generated by SC and DRGduring bridging as calculated by static equilibrium model.
bridging dynamics. The variability can be seen in Figure 7c, where the three types of SC
bridges, fast, slow and variant were graphed and shown to be very different from each other.
DRGs were more consistent in their trajectories as seen in Figure 7d. To determine if there
were stereotypic climbing paths of SC and DRG, we reorganized the data so time 0 was
taken to be the time at which climbing started. Figures 7e, f show that for SC, the initial
climbing phases (<100min) between all bridges were very similar in trajectory and speeds,
whereas the intermediate climbing phases (200-600min) for DRG bridging was much more
consistent than the initial and ending phases of bridging.
C.3.6 Forces generated during cellular bridging
Table C.2 shows the estimated forces associated with the static equilibrium system, and the
minimum amount of force generation in the z direction required by the cells to form bridges
using two processes. DRG bridges appear to require a larger force than SC bridges, based
on differences in soma size, and upward velocity of the cells. Figure C.9 shows the calculated
tension forces (FT ) each process is required to generate as the soma moves up the groove. In
these calculations, a cell is assumed to have only two processes, and forces required are then
based on the geometry of static loading. This correlates to experimental observations of
bridge morphology, where DRG neurite bridges are more likely than SC to involve networks
of neurites, and more neurites appear to be involved in bridging. This could be due to the
larger forces needed to form DRG bridges.

216
A
Time (min)
0 200 400 600 800 1000 1200 1400
z di
stan
ce (μ
m)
0
10
20
30
40
50
60
C
Time (min)
0 200 400 600 800 1000 1200 1400
z di
stan
ce (μ
m)
0
10
20
30
40
50
60
slowfastvariant
B
Time (min)
0 200 400 600 800 1000 1200 1400
z di
stan
ce (μ
m)
0
10
20
30
40
50
60
70
80
D
Time (min)
0 200 400 600 800 1000 1200 1400
z di
stan
ce (μ
m)
0
10
20
30
40
50
60
70
80
variantfastslow
E
Time (min)
0 200 400 600 800
z di
stan
ce (μ
m)
0
10
20
30
40
50
60
slowfastvariant
F
Time (min)
0 200 400 600 800 1000 1200
z di
stan
ce (μ
m)
0
10
20
30
40
50
60
70
80
variantslowfast
SC DRGVelocity (μm/min) 0.521 0.101Climbingvelocity (μm/min) 0.454 0.126Time to reach plateau (min) 33.29 1015.5
Figure C.8: Timelapse trajectories of SC and DRG bridging and associated velocities.Trajectory data show data ± SEM of average z-distance of all SC bridges (A) and all DRGbridges (B) over time. Regression lines are fitted to each set of trajectory data, shown ongraph. Trajectory data was then separated into “fast,” “slow” and “variant” bridge typesand plotted for SC (C) and DRG (D) bridges. Trajectory data was then normalized at thestart of climbing, to normalize change in z direction. Average of climbing trajectories for(E) SC and (F) DRG were plotted.
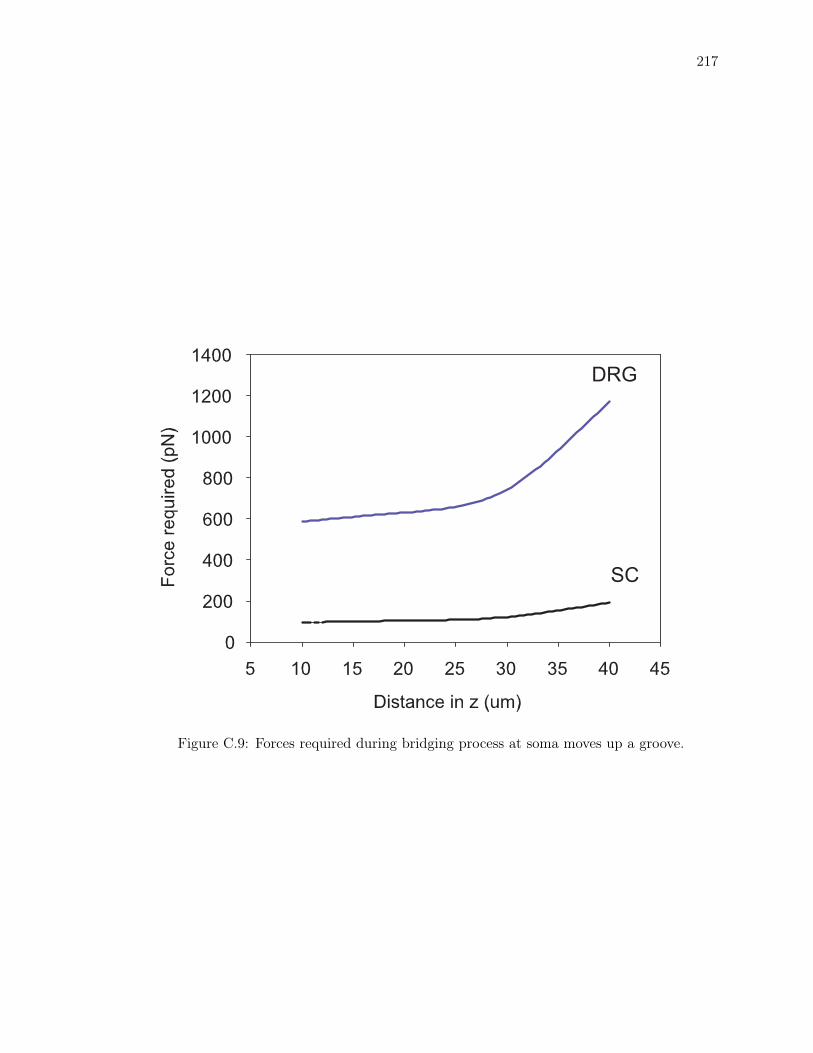
217
Figure C.9: Forces required during bridging process at soma moves up a groove.
218
C.4 Discussion
Extensive studies have shown that micropatterned coatings with permissive molecules and
microgrooved topographies are able to direct neurons and glia in culture. Cellular bridging
has been described as a phenomenon where cells pull their soma vertically upwards within
a groove. Hence, how this bridging process occurs is of interest and in this study we studied
several factors such as cellular adhesion, selective micropatterns of LN, and varied coating
methods of LN to clarify their influence on the bridge formation process.
LN is an important extracellular matrix molecule for both cellular adhesion and the for-
mation of protrusions for DRG and SC. DRG (Li et al., 2008) and SC (McCarthy et al.,
1983) have shown haptotactic migration up gradients of LN in traditional two dimensional
cell culture. Selective coating with LN on 3D substrates allows us to observe preferential
seeding and migration on distinct areas of LN coating or no coating, depending on the mi-
cropattern applied. Differences between DRG and SC adhesion patterns on microgrooved
substrates were observed, where initial cell seeding (after 3 hours) did not appear to achieve
uniformity in cellular adhesion, where the majority of all cells adhered to the surfaces of the
grooves. However at 24 hours, the majority of DRG remained in the grooves whereas the
majority of SC were observed on the surfaces of the plateaus. This may indicate a higher
motility of SC as compared to DRG.
Comparison of bridging at 24 hours also showed that SC formed significantly more bridges
than DRG, under similar cell seeding conditions. Initial cell seeding conditions were varied
slightly between SC and DRG as SC replicate while DRG neurons do not divide. SC were
seeded at 50,000 cells/ substrate and DRG were seeded at 110,000 cells/substrate, and
SC formed more bridges after 24 hours. Cell-cell interactions are involved in the bridging
phenomenon as shown in Goldner et al. (Goldner et al., 2006), where an optimal cell seeding
density of 125,000 cells/substrate was reported. In the subsequent parts of this study, cell
seeding density was adjusted for optimal bridging density at 24 hours in order to make
comparisons across different micropatterns on microgrooved substrates.
Coating method was found to significantly affect bridge formation on both types of mi-

219
cropatterned LN substrates tested (total and plateau coated substrates). Covalent binding
of proteins is hypothesized to be a more controlled way of protein deposition and hence
more effective in allowing cells to adhere to these surfaces. Studies with L1 and fibronectin
have shown that adsorption with poly-D-lysine and covalent binding show similar amounts
of protein on the substrate. However, depending on cell type, covalently attached L1 and
fibronectin may or may not have an effect on cellular adhesion and neurite length (Webb
et al., 2001). Covalent attachment of Tyr-Ile-Gly-Ser-Arg (YIGSR), a peptide found on the
B1 chain of LN was found to allow for higher strengths of NG108-15 adhesion than com-
pare to adsorbed LN (Cargill et al., 1999). Hence adhesion and process outgrowth on these
substrates may be different. Our studies agree with these observations, where increased SC
bridging was observed on covalently attached LN surfaces.
Timelapse studies show highly dynamic SC and DRG cultures and allowed the study of
bridges that formed before the 24 hour period in endpoint studies. Cell motility appears to
play a role in the bridging process, and within each cell type there are different trajecto-
ries and motilities exhibited by the cell. Metabolic and cytoskeletal functions could affect
bridging dynamics and morphologies and would be a future direction of the research.
Topography is capable of eliciting various morphologies from neurons and glia, and under-
standing the underlying mechanisms by which bridges form and stabilize are important for
understanding the roles of the microenvironment on the neurite growth phenomenon.
C.5 References
Cargill RS, Dee KC, Malcolm S. An assessment of the strength of NG108-15 cell adhesion
to chemically modified surfaces. Biomaterials, 1999; 20: 2417-25.
Curtis A, Wilkinson C. Topographical control of cells. Biomaterials, 1997; 18: 1573-83.
den Braber ET, de Ruijter JE, Ginsel LA, von Recum AF, Jansen JA. Orientation of ECM
protein deposition, fibroblast cytoskeleton, and attachment complex components on silicone
microgrooved surfaces. J Biomed Mater Res, 1998; 40: 291-300.

220
Goldner JS, Bruder JM, Li G, Gazzola D, Hoffman-Kim D. Neurite bridging across mi-
cropatterned grooves. Biomaterials, 2006; 27: 460-72.
Hsu S, Chen C, Lu PS, Lai C, Chen CJ. Oriented Schwann cell growth on microgrooved
surfaces. Biotechnology and Bioengineering, 2005; 579-88.
Li G, Liu J, Hoffman-Kim D. Multi-Molecular Gradients of Permissive and Inhibitory Cues
Direct Neurite Outgrowth. Annals of Biomedical Engineering, 2008.
Lopez G, Biebuyck HA, Harteer R, Kumar A, Whitesides G. Fabrication and imaging of
two-dimensional patterns of proteins adsorbed on self-assembled monolayers by scanning
electron microscopy. Journal of the American Chemical Society, 1993; 115:10774-10782.
Manwaring ME, Walsh JF, Tresco PA. Contact guidance induced organization of extracel-
lular matrix. Biomaterials, 2004; 25: 3631-8.
McCarthy JB, Palm SL, Furcht LT. Migration by haptotaxis of a Schwann cell tumor line
to the basement membrane glycoprotein laminin. J. Cell Biol., 1983; 97: 772-7.
Miller C, Jeftinija S, Mallapragada S. Synergistic effects of physical and chemical guidance
cues on neurite alignment and outgrowth on biodegradable polymer substrates. Tissue Eng,
2002; 8: 367-78.
Rajnicek A, McCaig C. Guidance of CNS growth cones by substratum grooves and ridges:
effects of inhibitors of the cytoskeleton, calcium channels and signal transduction pathways.
J Cell Sci, 1997; 110: 2915-24.
Schnaar RI, Schaffner AE. Separation of cell types from embryonic chicken and rat spinal
cord: characterization of motoneuron-enriched fractions. J. Neurosci., 1981; 1: 204-17.
Song M, Uhrich KE. Optimal Micropattern Dimensions Enhance Neurite Outgrowth Rates,
Lengths, and Orientations. Annals of Biomedical Engineering, 2007; 35: 1812.
Webb K, Budko E, Neuberger TJ, Chen S, Schachner M, Tresco PA. Substrate-bound human
recombinant L1 selectively promotes neuronal attachment and outgrowth in the presence of
astrocytes and fibroblasts. Biomaterials, 2001; 22: 1017-28.