coupling dehydrogenation of ethylbenzene with ...
197
COUPLING DEHYDROGENATION OF ETHYLBENZENE WITH HYDROGENATION OF NITROBENZENE IN AN AUTOTHERMAL CATALYTIC MEMBRANE REACTOR by Nabeel Salim M. Abo-Ghander B.Sc., King Fahd University of Petroleum & Minerals, Saudi Arabia (2000) M.Sc., King Fahd University of Petroleum & Minerals, Saudi Arabia (2003) A THESIS SUBMITTED IN PARTIAL FULFILLMENT OF THE REQUIREMENTS FOR THE DEGREE OF Doctor of Philosophy in The Faculty of Graduate Studies (Chemical & Biological Engineering) The University of British Columbia (Vancouver) February 2011 © Nabeel Salim M. Abo-Ghander, 2011
-
Upload
khangminh22 -
Category
Documents
-
view
0 -
download
0
Transcript of coupling dehydrogenation of ethylbenzene with ...

COUPLING DEHYDROGENATION OF
ETHYLBENZENE WITH HYDROGENATION OF
NITROBENZENE IN AN AUTOTHERMAL CATALYTIC
MEMBRANE REACTOR
by
Nabeel Salim M. Abo-Ghander
B.Sc., King Fahd University of Petroleum & Minerals, Saudi Arabia (2000)
M.Sc., King Fahd University of Petroleum & Minerals, Saudi Arabia (2003)
A THESIS SUBMITTED IN PARTIAL FULFILLMENT OF
THE REQUIREMENTS FOR THE DEGREE OF
Doctor of Philosophy
in
The Faculty of Graduate Studies
(Chemical & Biological Engineering)
The University of British Columbia
(Vancouver)
February 2011
© Nabeel Salim M. Abo-Ghander, 2011

ii
ABSTRACT
Dehydrogenation of ethylbenzene and hydrogenation of nitrobenzene form an interesting pair of
reactions to be coupled in a catalytic membrane reactor. The former is reversible and
thermodynamically limited, supplying hydrogen with a net endothermality, while the latter is
irreversible and exothermic, consuming hydrogen to produce aniline. In this work, coupling of
these two reactions is simulated in a catalytic fixed bed membrane reactor where hydrogen
produced on the dehydrogenation side is transferred through hydrogen membranes to the
hydrogenation side where it reacts to produce aniline. Heat generated on the hydrogenation side
is transferred to the dehydrogenation side, where it is utilized by the endothermic
dehydrogenation reaction to improve the styrene yield.
A pseudo-homogeneous model for the coupled reactor based on the concept of fixed bed reactors
accounting for both the diffusion of hydrogen and transfer of heat is first developed. The effects
of the operating and design parameters considered on the production of styrene and aniline show
conflicting behaviour, i.e. improving the yield of styrene results in decreased production of
aniline. Consequently, the cocurrent configuration of the coupled reactor was optimized within
constraints so that it can be operated effectively to produce ~98% styrene as a one limiting
option or ~80% aniline at the other extreme.
The intraparticle diffusion resistance, a major limitation in fixed bed reactors, is evaluated by
developing a heterogeneous reactor model based on Fickian diffusion and the dusty gas model
for both isothermal and non-isothermal catalyst pellets. Both heterogeneous models predict a
significant reduction in yield and conversion relative to the pseudo-homogeneous model,
indicating the importance of heterogeneity. This reduction is generally less severe for the dusty
gas model than for Fickian diffusion. The mean square deviation and absolute deviation along
the reactor are calculated for all models relative to the heterogeneous reactor model with dusty
gas for non-isothermal catalyst pellets, considered to be the most rigorous model tested.
Assuming isothermality causes larger deviations than assuming Fickian diffusion. The deviations
in the predictions of the homogenous model and the heterogeneous models from those of the
dusty gas model for non-isothermal pellets are ~6% and ~11%, respectively.

iii
PREFACE
The work in this thesis is based on modeling and simulation of a proposed catalytic membrane
reactor used to couple dehydrogenation of ethylbenzene with hydrogenation of nitrobenzene. It is
the first attempt to integrate these two industrially important processes in a single reactor so that
hydrogen produced on the dehydrogenation side diffuses through the membrane wall to react
with nitrobenzene to produce aniline. Heat produced on the hydrogenation side is also transferred
through the membrane wall to break the endothermality on the dehydrogenation side and shift
the yield of styrene above its thermodynamic limit. The reactor is designed and optimized to be
operated continuously to produce simultaneously styrene from the dehydrogenation side and
aniline from the hydrogenation side.
This project was completed under the supervision of Profs. John Grace, Said Elnashaie, and C.
Jim Lim who are also co-authors of the manuscripts. Inputs from Prof. Jan Van Impe and Dr.
Filip Logist, BioTeC and OPTEC, Department of Chemical Engineering, Katholieke
Universiteit, were also important in solving the optimization problem of the proposed membrane
reactor described in chapter 3, and the heterogeneous model of the reactor based on Fickian
diffusion and the dusty gas model discussed in chapters 4 and 5.
My role in this research work leading to this dissertation included:
1. Setting up the statements of all problems.
2. Deriving all reactor models.
3. proposing the numerical techniques which might be used to solve the proposed problem.
4. Receiving suggestions and comments from my co-authors, coordinating and
incorporating these.
5. Writing and debugging all numerical Matlab codes to solve sets of initial and boundary
value problems.
6. Doing the optimization computations.
7. Collecting the results from programs and reproducing them in the proper formats.

iv
8. Preparing the manuscripts, i.e. text, tables, and figures, and correcting them after revision
by the co-authors
9. Submitting the corrected manuscripts to the journals for publications after preparing all
the necessary documents such as cover letters and lists of suggested reviewers.
10. Receiving the reviewers‘ comments from the journals, discussing them with the co-
authors, and drafting detailed responses and revisions.
Slightly modified versions of chapters 2 and 3 have already been published as follows:
Nabeel S. Abo-Ghander, John R. Grace, Said S.E.H. Elnashai, and C. Jim Lim, 2008.
Modeling of a novel membrane reactor to integrate dehydrogenation of ethylbenzene to
styrene with hydrogenation of nitrobenzene to aniline, Chemical Engineering Science,
63(7), 1817-1826.
Nabeel S. Abo-Ghander, Filip Logist, John R. Grace, Jan F.M. Van Impe, Said S.E.H.
Elnashaie, and C. Jim Lim 2010. Optimal design of an autothermal membrane reactor
coupling the dehydrogenation of ethylbenzene to styrene with the hydrogenation of
nitrobenzene to aniline, Chemical Engineering Science, 65(10), 3113-3127.
A version of chapter 5 has been already submitted for publication, and a modified version of
chapter 4 will be submitted soon.

v
TABLE OF CONTENTS
ABSTRACT ............................................................................................................. ii
PREFACE ............................................................................................................... iii
TABLE OF CONTENTS ........................................................................................ v
LIST OF TABLES ................................................................................................. ix
LIST OF FIGURES ............................................................................................... xi
NOMENCLATURE ............................................................................................. xiv
ACKNOWLEDGEMENTS .............................................................................. xviii
CHAPTER 1 INTRODUCTION ............................................................................ 1
1.1. Thesis Overview ................................................................................................... 1
1.2. Coupling of Chemical Reactions ......................................................................... 2
1.2.1. Thermal coupling of chemical reactions ............................................................... 2
1.2.2. Coupling of chemical reaction with in-situ separation ........................................ 5
1.2.3. Coupling of chemical reaction via both in-situ separation and heat transfer ... 7
1.3. Sources of Novelty in this Thesis ........................................................................ 8
1.4. Thesis Objectives ................................................................................................ 11
1.5. Challenges and Obstacles Encountered in this Thesis ................................... 12
1.6. Derivation of the Reactor Pseudo-homogeneous Model ................................ 13
1.7. References ........................................................................................................... 22
CHAPTER 2 PSEUDO-HOMOGENEOUS MODELING OF A NOVEL
MEMBRANE REACTOR TO INTEGRATE DEHYDROGENATION OF
ETHYLBENZENE TO STYRENE WITH HYDROGENATION OF
NITROBENZENE TO ANILINE ........................................................................27
2.1. Introduction ........................................................................................................ 27
2.2. Theory ................................................................................................................. 29
2.2.1. Assumptions........................................................................................................... 29
2.2.2. Reaction kinetics ................................................................................................... 30
2.2.3. Pseudo -homogeneous model of the coupled membrane reactor...................... 32
2.2.4. Initial and boundary conditions .......................................................................... 35
vi
2.2.5. Simulation conditions ........................................................................................... 35
2.3. Results and Discussion ....................................................................................... 36
2.3.1. Hydrogen molar flowrate ..................................................................................... 37
2.3.2. Conversion of ethylbenzene ................................................................................. 38
2.3.3. Yield of styrene ...................................................................................................... 38
2.3.4. Conversion of nitrobenzene ................................................................................. 38
2.3.5. Temperature profiles ............................................................................................ 38
2.3.6. Practical considerations........................................................................................ 39
2.4. Conclusions ......................................................................................................... 40
2.5. References ........................................................................................................... 53
CHAPTER 3 OPTIMAL DESIGN OF AN AUTOTHERMAL MEMBRANE
REACTOR COUPLING THE DEHYDROGENATION OF
ETHYLBENZENE TO STYRENE WITH THE HYDROGENATION OF
NITROBENZENE TO ANILINE BASED ON PSEUDO-HOMOGENEOUS
MODEL ...................................................................................................................55
3.1. Introduction ........................................................................................................ 55
3.2. Literature Review .............................................................................................. 57
3.3. Reactor Configuration ....................................................................................... 59
3.4. Chemical Reactions and Kinetic Expressions ................................................. 60
3.5. Mathematical Reactor Model ........................................................................... 61
3.6. The Optimization Problem ................................................................................ 62
3.7. Details of the Numerical Solution ..................................................................... 67
3.8. Results and Discussion ....................................................................................... 69
3.9. Sensitivity Analysis Based on Pseudo-Homogeneous Model: ........................ 75
3.10. Conclusions ......................................................................................................... 76
3.11. References ........................................................................................................... 92
CHAPTER 4 HETEROGENEOUS MODELING OF AUTOTHERMAL
MEMBRANE REACTOR COUPLING DEHYDROGENATION OF
ETHYLBENZENE TO STYRENE WITH HYDROGENATION OF
NITROBENZENE TO ANILINE: FICKIAN DIFFUSION MODEL .............95
vii
4.1. Introduction ........................................................................................................ 95
4.2. Reactor Configuration ....................................................................................... 97
4.3. Reactor Model .................................................................................................... 99
4.4. Results and Discussion ..................................................................................... 105
4.4.1. Conversion of ethylbenzene and nitrobenzene ................................................. 105
4.4.2. Yield of styrene, benzene, and toluene on dehydrogenation side ................... 106
4.4.3. Hydrogen molar flow rates on dehydrogenation and hydrogenation sides ... 106
4.4.4. Temperature profiles along coupled reactor .................................................... 107
4.4.5. Reaction effectiveness factors and reaction rates ............................................ 108
4.4.6. Component effectiveness factors ....................................................................... 110
4.4.7. Behaviour inside catalyst pellets on both sides of coupled reactor ................ 111
4.4.8. Effect of intraparticle diffusion resistance on optimal reactor design ........... 113
4.5. Conclusions ....................................................................................................... 115
4.6. References ......................................................................................................... 134
CHAPTER 5 COMPARISON OF DIFFUSION MODELS IN MODELLING
A CATALYTIC MEMBRANE FIXED BED REACTOR COUPLING
DEHYDROGENATION OF ETHYLBENZENE WITH HYDROGENATION
OF NITROBENZENE .........................................................................................136
5.1. Introduction ...................................................................................................... 136
5.2. Reactor Configuration ..................................................................................... 138
5.3. Reactor Model .................................................................................................. 139
5.3.1. Diffusion inside catalyst pellets .......................................................................... 140
5.3.1. Diffusion models for catalyst pellets .................................................................. 142
5.4. Results and Discussion ..................................................................................... 149
5.4.1. Conversion of ethylbenzene and nitrobenzene ................................................. 150
5.4.2. Yield of styrene, benzene, and toluene on dehydrogenation side ................... 150
5.4.3. Hydrogen molar flow rates on dehydrogenation and hydrogenation sides ... 151
5.4.4. Temperature profiles on both sides of coupled reactor ................................... 152
5.4.5. Predictions of styrene yields and nitrobenzene conversions in the coupled
reactor by the various models........................................................................................... 152
5.5. Conclusions ....................................................................................................... 154

viii
5.6. References ......................................................................................................... 168
CHAPTER 6 OVERALL CONCLUSIONS AND RECOMMENDATIONS 172
6.1. Conclusions ....................................................................................................... 172
6.2. Recommendations ............................................................................................ 176
6.3. References ......................................................................................................... 177

ix
LIST OF TABLES
Table 2.1 Arrhenius equation and equilibrium constants for ethylbenzene reactions. ........ 41
Table 2.2 Unit conversion constants for reaction rates of dehydrogenation network. ......... 42
Table 2.3 Design and operating conditions for dehydrogenation (shell side) reaction of
ethylbenzene to styrene. ...................................................................................................... 43
Table 2.4 Operating conditions for hydrogenation (tube side) reaction of nitrobenzene to
aniline. .................................................................................................................................. 44
Table 3.1 Summary of stoichiometric equations, heats of reactions and reaction rate
expressions. .......................................................................................................................... 77
Table 3.2 Numerical values of kinetic pre-exponential constants and activation energies. . 78
Table 3.3 Model equations for integrated catalytic membrane reactor. ............................... 79
Table 3.4 Values of constant variables in the optimization problem. .................................... 80
Table 3.5 Representative solutions for the Pareto frontier. .................................................... 81
Table 3.6 Nominal values of the fixed variables used in the sensitivity analysis ................... 82
Table 4.1 Stoichiometric equations, heats of reactions and reaction rate expressions for
reactions considered. ......................................................................................................... 116
Table 4.2 Frequency factors and activation energies for reactions considered. ................. 117
Table 4.3 Heterogeneous model for the coupled reactor based on Fickian diffusion. ........ 118
Table 4.4 Dimensional and operating parameters for hybrid catalytic membrane reactor
for base case. ...................................................................................................................... 119
Table 4.5 Representative solutions for Pareto frontier*. ...................................................... 120
Table 5.1 Stoichiometric equations, heats of reactions and reaction rate expressions for
reactions in coupled reactor. ............................................................................................ 155
Table 5.2 Frequency factors and activation energies for reactions in the coupled reactor.
............................................................................................................................................. 156
Table 5.3 Heterogeneous model equations for coupled catalytic membrane reactor. ........ 157
Table 5.4 Base case dimensional and operating parameters for coupled catalytic membrane
reactor. ................................................................................................................................ 158
Table 5.5 Representative solutions for Pareto frontier. Constrained limits are bolded..... 159

x
Table 5.6 Deviations of the predictions inside the coupled reactor from the non-isothermal
dusty gas heterogeneous reactor model. .......................................................................... 160

xi
LIST OF FIGURES
Figure 1.1 Schematic diagram of the reactor coupling dehydrogenation of ethylbenzene
with hydrogenation of nitrobenzene .................................................................................. 19
Figure 1.2 Schematic representation of a differential element inside the reactor for
cocurrent flow. Large arrows show directions of mass and heat fluxes. ........................ 20
Figure 1.3 Schematic representation of a differential element inside the reactor for
countercurrent flow. Large arrows show directions of mass and heat fluxes. .............. 21
Figure 2.1 Schematic diagram showing integrated reactor configuration. ........................... 45
Figure 2.2 Schematic diagram showing a differential element inside the membrane reactor.
............................................................................................................................................... 46
Figure 2.3 Molar flow of hydrogen on uncoupled adiabatic fixed bed and coupled cocurrent
and countercurrent cases of the novel membrane reactor. For operating conditions see
Tables 2.3 and 2.4. For countercurrent case, feed is from the right for the
hydrogenation compartment; otherwise all feeds are from the left. .............................. 47
Figure 2.4 Comparison of ethylbenzene conversions on dehydrogenation side for uncoupled
adiabatic fixed bed and for coupled cocurrent and countercurrent cases. For operating
conditions, see Tables 2.3 and 2.4. ...................................................................................... 48
Figure 2.5 Comparison of styrene yields on dehydrogenation side for uncoupled adiabatic
fixed bed and for coupled cocurrent and countercurrent cases. For operating
conditions, see Tables 2.3 and 2.4. ...................................................................................... 49
Figure 2.6 Conversion of nitrobenzene on hydrogenation side for cocurrent and
countercurrent membrane reactor configurations. For operating conditions, see Tables
2.3 and 2.4. ............................................................................................................................ 50
Figure 2.7 Effect of number of hydrogenation tubes on temperature profiles in
dehydrogenation and hydrogenation compartments for the cocurrent case. For
operating conditions, see Tables 2.3 and 2.4. .................................................................... 51
Figure 2.8 Effect of number of hydrogenation tubes on temperature profiles in the
dehydrogenation and hydrogenation compartments for coupled countercurrent case.
For operating conditions, see Tables 2.3 and 2.4. ............................................................. 52

xii
Figure 3.1 Conceptual design of integrated catalytic membrane reactor coupling
dehydrogenation of ethylbenzene with hydrogenation of nitrobenzene. ........................ 83
Figure 3.2 Flowchart showing how the Tomlab solvers, i.e. glbDirect and snopt, are linked
to the reactor model. ........................................................................................................... 84
Figure 3.3 Pareto optimal set obtained by simultaneous maximization of styrene yield and
nitrobenzene conversion. .................................................................................................... 85
Figure 3.4 (a, b) Feed molar flowrate of ethylbenzene; (c, d) Steam-to-ethylbenzene molar
ratio on dehydrogenation side; (e, f) Feed temperature on dehydrogenation side
corresponding to Pareto optimal set. ................................................................................. 86
Figure 3.5 (a, b) Feed pressure on dehydrogenation side; (c, d) Molar feed of nitrobenzene
on hydrogenation side; (e, f) Steam-to-nitrobenzene molar ratio on hydrogenation side
corresponding to Pareto optimal set. ................................................................................. 87
Figure 3.6 (a, b) Feed temperature on hydrogenation side; (c, d) Feed pressure on
hydrogenation side; (e, f) Number of hydrogenation tubes corresponding to Pareto
optimal set. ........................................................................................................................... 88
Figure 3.7 (a, b) Net diameter of dehydrogenation side; (c, d) Hydrogenation tube
diameter; and (e, f) Length of reactor corresponding to the Pareto optimal set. .......... 89
Figure 3.8 (a) Styrene yield and nitrobenzene yield along the membrane reactor at three
different optimal Pareto solutions; (b) Temperature profiles on both shell andtube
sides of the membrane reactor at three different optimal Pareto solutions. .................. 90
Figure 3.9: Sensitivity analysis on some key operating variables. .......................................... 91
Figure 4.1 Schematic of the coupled membrane fixed bed reactor. ..................................... 121
Figure 4.2 Infinitesimal slice inside catalyst pellets on dehydrogenation side showing terms
considered in: (a) mole balance, and (b) energy balance. .............................................. 122
Figure 4.3 Schematic sequence of computations for the catalyst and reactor models. ...... 123
Figure 4.4 Conversion of key components: (a) Ethylbenzene on dehydrogenation side, and
(b) Nitrobenzene on hydrogenation side. ........................................................................ 124
Figure 4.5 Yield of: (a) Styrene, (b) Benzene, and (c) Toluene on dehydrogenation side. . 125
Figure 4.6 Hydrogen molar flowrates on: (a) dehydrogenation side, and (b) hydrogenation
side. ..................................................................................................................................... 126
Figure 4.7 Temperature profiles on: (a) dehydrogenation side, and (b) hydrogenation. ... 127

xiii
Figure 4.8 Reaction effectiveness factor profiles versus bulk temperature for: (a, b)
dehydrogenation reactions, and (c) hydrogenation reaction. ........................................ 128
Figure 4.9 Actual reaction rates and their values at surface conditions versus bulk
temperature for all reactions. ........................................................................................... 129
Figure 4.10 Component effectiveness factor profiles versus dimensionless axial distance for:
(a) ethylbenzene, styrene, hydrogen, benzene, and toluene on dehydrogenation side; (b)
nitrobenzene on hydrogenation side. ............................................................................... 130
Figure 4.11 Intraparticle profiles of component mole fraction, temperature and component
effective diffusivities at fractional lengths of 0.1, 0.5, and 0.80 for both the isothermal
and non-isothermal catalyst pellet case on dehydrogenation side. ............................... 131
Figure 4.12 Intraparticle profiles of component mole fraction, temperature and component
effective diffusivities at fractional lengths of 0.1, 0.5, and 0.80 for both the isothermal
and non-isothermal catalyst pellet case on hydrogenation side. ................................... 132
Figure 4.13 Styrene yield, nitrobenzene conversion, and temperature profiles for the
optimal designs of the coupled membrane reactor, i.e. solution A (a, b, c), solution B (d,
e, f), solution C (g, h, i). ..................................................................................................... 133
Figure 5.1 Schematic of coupled catalytic membrane for cocurrent configuration. .......... 161
Figure 5.2 Molar and heat fluxes across a small shell inside a catalyst pellet. .................... 162
Figure 5.3 Computational sequence coupling dusty gas model equations with reactor model
equations. ............................................................................................................................ 163
Figure 5.4 Conversion of (a) ethylbenzene on dehydrogenation side, and (b) nitrobenzene
on hydrogenation side for base case operating conditions in Table 5.4. ...................... 164
Figure 5.5 Yield of (a) Styrene, (b) Benzene, and (c) Toluene along dehydrogenation side
for base case operating conditions in Table 5.4. ............................................................. 165
Figure 5.6 Hydrogen molar flowrate variation along reactor for base case operating
conditions in Table 5.4 on: (a) dehydrogenation side, (b) hydrogenation side. ........... 166
Figure 5.7 Temperature profiles along the reactor for base case operating conditions in
Table 5.4 on: (a) dehydrogenation side, and (b) hydrogenation side. ........................... 167

xiv
NOMENCLATURE
A matrix of the linear constraints.
Acs, A’cs cross-sectional area of shell and tube sides, [m2].
ai constant, 1 for hydrogen, 0 otherwise, [-].
b constant, 0 for cocurrent configuration, 1 for countercurrent configuration, [-].
Cpi, Cp’i heat capacity of component i on shell and tube sides, [J/mole/K].
C(X) vector of equality and inequality nonlinear constraints.
eqc p vector of nonlinear equality constraints, [-].
ineqc p vector of nonlinear inequality constraints, [-].
Ci, C’i concentration of i inside catalyst pellets on shell and tube sides, [mole/m3].
D area-equivalent diameter on shell side, [m].
Dij, D’ij binary diffusivity of i into j on shell and tube sides, [m2/s].
Dim diffusivity of component i into the mixture on shell side, [m2/s].
Dik, D’ik Knudsen diffusivity of i on shell and tube sides, [m2/s].
,e e
ij ijD D effective binary diffusivity of i into j on shell and tube sides j, [m2/s].
e
imD effective diffusivity of component i into mixture on shell side, [m2/s].
,e e
ik ikD D effective Knudsen diffusivity of i on shell and tube sides, [m2/s].
,e e
ie ieD D mean diffusivity of i on shell and tube sides, [m2/s].
Dp, D’p diameter of catalyst particles on shell and tube sides, [m].
Dt diameter of tube, [m].
Ej, E’ activation energy of reaction j on shell side and hydrogenation reaction on tube
side, [J/mole/K].
F(X) vector of the objective functions, [-].
J(p) vector of objective functions, [-].

xv
Ji molar flux of component i, [mole/m2/s].
JNB nitrobenzene conversion generic function, [-].
JSY styrene yield generic function, [-].
Hi, H’i enthalpy of component i on shell and tube sides, [J/mole].
k, k’ thermal conductivities of catalyst on shell and tube sides, [Jm/s].
kio reaction i pre-exponential factor, [mole/Km/kg cat/s/bar
n],
(for k1 and k2, m=0, n=1; for k3 and k5, m=0, n=2; for k4, m=0, n=1.5;
for k6, m=3, n=3).
ki reaction i rate constant, [mole/Km/kg cat/s/bar
n],
(for k1 and k2, m=0, n=1; for k3 and k5, m=0, n=2; for k4, m=0, n=1.5;
for k6, m=3, n=3).
KNB nitrobenzene adsorption constant, [1/Pa].
2HK hydrogen adsorption constant, [1/Pa0.5
].
L total length of reactor, [m].
N number of tubes in hybrid reactor, [-].
Ni, N’i molar flux of component i inside catalyst particles on shell and tube sides,
[mole/m2/s].
Np number of points at which styrene yields and nitrobenzene conversion are
predicted, [-].
nNBo feed molar flowrates of nitrobenzene on tube side [mole/s].
ni, n’i molar flow rate of component i on shell and tube sides, [mole/s].
nEBf feed molar flowrate of ethylbenzene on shell side, [mole/s].
nNBf feed molar flowrate of nitrobenzene, on tube side [mole/s].
pi, p’i partial pressure of component i on shell and tube sides, [bar].
P, P’ total pressure on shell side and tube side, [bar].
Pf, P’f feed pressure on shell side and tube side, [bar].
p vector of decision variables, [-]
Lp lower bound vector of decision variables, [-]

xvi
Up upper bound vector of decision variables, [-]
Q' heat transferred from tube side to shell side per unit length, [W/m].
Qo pre-exponential constant of hydrogen membrane, [mole/m/s/bar0.5
].
rj rate of reaction j on shell side, [mole/kg cat/s].
r' rate of hydrogenation reaction on tube side, [mole/kg cat/s].
r1, r2 inner and outer radii of hydrogenation tube, [m].
r3-r2 thickness of palladium membrane, [m].
SOR steam-to-ethylbenzene ratio, [-].
SOR’ steam-to-nitrobenzene ratio, [-].
T, T’ temperature on shell and tube sides, [K].
Tf, T’f feed temperature on shell side and tube side, [K].
Ts, T’s temperature at surface of catalyst pellet on shell and tube sides, [K].
XNB conversion of nitrobenzene on tube side, [-].
NBX reference conversion of nitrobenzene, i.e. predictions by heterogeneous reactor
model with dusty gas diffusion for non-isothermal catalyst pellets at designated
distances along reactor, [-].
xi, x’i mole fraction inside catalyst pellet on shell and tube sides, [-].
xis, x’is mole fraction at surface of catalyst pellet on shell and tube sides, [-].
YST yield of styrene, [-].
STY reference yield of styrene, i.e. predictions by heterogeneous reactor model with
dusty gas diffusion for non-isothermal catalyst pellets at designated distances
along reactor, [-].
y, y’ radial coordinate inside catalyst pellet on shell and tube sides, [-].
z axial coordinate along reactor, [m].
j
H T heat of reaction j at temperature T on shell side, [J/mole].
H T heat of hydrogenation reaction at temperature T‘on tube side, [J/mole].
Greek Letters

xvii
Δz thickness of differential element, [m].
ω, ω' dimensionless radial distance inside catalyst pellets on shell and tube sides, [-].
ρs, ρ’s catalyst density on shell and tube sides, [kg/m3].
ε, ε' bed voidage on shell and tube side, [-].
σij stoichiometric coefficient of reactant i in reaction j, [-].
2Hδ thickness of hydrogen permeation membrane, [m].
η effectiveness factor, [-].
Abbreviations
AN aniline.
BZ benzene
NB nitrobenzene.
ST steam.
TO toluene

xviii
ACKNOWLEDGEMENTS
Praise to Allah, the creator of the whole universe for blessing me with the strength, support and
patience to complete this work after all obstacles and challenges and may His peace and blessings
be upon the Messenger, his family, his companions, and all those who follow his way until the
Day of Judgment.
I would like to express my deepest and honest appreciation to Canada, country of equality, and
the Canadian people for the great and wonderful hospitality over the last five years in which I
fully accessed all facilities as if I were Canadian. I‘m very proud of this unforgotten stage of my
life!
Being a student in the University of British Columbia (UBC) and especially in the Chemical and
Biological Engineering Department (CHBE) is really a precious blessing that can‘t be offered to
too many students. UBC is really a place where work can be gathered with peace of mind.
I would like also to express my thanks to the government of Saudi Arabia and King Fahd
University of Petroleum & Minerals (KFUPM) for financially sponsoring my studies at UBC.
I would like to express my sincere and warm appreciation to my supervisor Prof. John R Grace
for his continuous and outstanding support and patience during the course of this work. He is one
of few who can positively sharpen the career as well as the character of students.
My co-supervisor Prof. Said H. S. Elnashaie deserves warm thanks for his guidance and
suggestions especially in the earlier stages of the work. Without that, I would have wasted much
time.
I‘m also very thankful to Prof. C. Jim Lim for his contribution in the early design stage of the
work. The information and suggestions he shared with us were of great importance and utilized
in optimizing the reactor.

xix
I owe sincere thanks to Prof. Jan Van Impe and Dr. Filip Logist from BioTeC and OPTEC,
Department of Chemical Engineering, Katholieke Universiteit Leuven, with whom I have
collaborated at some stages of the work. Their contribution and suggestions were of great
importance shedding light on dark corners, especially pertaining to the challenging reactor
optimization problem.
I will never forget to express my warmest regards, thanks and sincere prayers to my beloved
parents who were/are the driving force in all aspects of my life. I will never forget their support,
warm wishes and prayers which assisted me greatly during my work. I‘m sure that they will be
so proud of my achievement!
I am also very thankful to my brother Walid, professional engineer at Saudi ARAMCO, and all
my brothers and sisters for their continuous encouragement and support.
My wife ―Alaa‖ and the little beloved and sweetie son ―Salim‖, who is now three years and
seven months old, deserves my thanks and regards for being patient with me. I admit that I
wasn‘t fair enough with them as I was totally busy with my work, but I promise to compensate
them in near future.
Finally, I would like to thank all my CHBE friends who shared their knowledge and experience
with me. Special thanks are to Nayef Al-Saifi, Mohammed Rakib, Saifuddin Shaikh, Andres
Mahecha-Botero, and Monica N. Danon-Schaffer.

xx
Dedicated to my Parents,
brothers, sisters, wife
and
my little beloved son “Salim”
Not the Unbelievers see that the heavens and the earth were joined together (as one unit of
creation), before we clove them asunder? We made from water every living thing. Will they not
then believe?
Holy Quran, Al-Anbiyaa, Chapter 21, verse 30

1
CHAPTER 1 INTRODUCTION
1.1. Thesis Overview
This thesis analyses the coupling of two industrial catalytic reactions, i.e. dehydrogenation of
ethylbenzene and hydrogenation of nitrobenzene, in a membrane reactor such that hydrogen
produced on the dehydrogenation side is permeated through hydrogen membranes and is utilized
to produce aniline on hydrogenation side, with heat also transferred across the membrane. The
manuscript is divided into six chapters covering different aspects of the research problems.
Chapter 1 discusses the concept of coupling reactions in general, dividing such cases into three
categories. An extensive literature review is presented in which different reaction systems and
reactor configurations are identified. The novelty in the present work and the goals of the
research are also provided.
In chapter 2, the simplified homogenous reactor model for the coupled catalytic membrane
reactor coupling dehydrogenation of ethylbenzene with hydrogenation of nitrobenzene is
derived, with assumptions identified. The advantages of the coupled reactor over conventional
uncoupled fixed bed reactors on the yield of styrene for both cocurrent and countercurrent
configurations are shown. In addition, the effects of key operating parameters such as the number
of hydrogenation tubes are investigated.
Chapter 3 tackles the difficult problem of optimizing the design of the coupled catalytic
membrane reactor for the cocurrent configuration, considering 12 operating and design
parameters. Two objective functions, i.e. styrene yield on the dehydrogenation side and
production of aniline on the hydrogenation side, are considered simultaneously leading to
different optima depending on the relative importance of the main two products.

2
Chapter 4 discusses the effect of the intraparticle resistance on the performance of the cocurrent
configuration of the coupled reactor using the heterogeneous model based on Fickian diffusion
for isothermal and non-isothermal catalyst pellets. Effectiveness factors and overall reaction rates
evaluated at the surface of the catalyst pellets are also displayed and discussed.
In chapter 5, a rigorous heterogeneous reactor model based on the dusty gas model is developed
for both isothermal and non-isothermal catalyst pellets. Predictions from this new model are
compared with those of the pseudo-homogenous model developed in chapter 2 and the
heterogeneous reactor model based on the simplified Fickian diffusion in chapter 4.
Chapter 6 summarizes the main overall findings and gives recommendations for future work.
1.2. Coupling of Chemical Reactions
Coupling of chemical reactions with heat transfer, separation, or other chemical reactions is a
promising techniques for eliminating unnecessary heat transfer and separation units such as heat
exchangers and separators, better utilization of energy, minimization of fuel, improving the
thermodynamic conversions and yields of thermodynamically limited reactions, and reducing
reactor volumes. Coupling can be successfully achieved in fixed bed reactors as well as fluidized
bed reactors in which chemical reactions are coupled with transport processes to transfer, remove
or supply heat and mass. There are three categories or modes of coupling:
1.2.1. Thermal coupling of chemical reactions
Heat transfer units such as heat exchangers can be eliminated when chemical reactions are
coupled with heat transfer. This coupling can occur in fixed bed reactors when the heat
accompanying the effluent stream of exothermic reactions is utilized to heat the feed steam. In
fluidized bed reactors, however, catalyst particles can act as energy carriers after being
recirculated from catalyst regenerators (van Sint Annaland and Nijssen, 2002; van Sint Annaland
et al., 2002a).

3
Exothermic and endothermic reaction can also be coupled together in a direct or indirect fashion.
Combining both, i.e. endothermic and exothermic reactions, in the same chamber results in direct
coupling, whereas periodically operated reactors result in indirect coupling (Kulkarni and
Dudukovic, 1996). The chemical reactors used to achieve this form of coupling are normally
fixed beds operated periodically in two semi-cycles: exothermic and endothermic semi-cycles. In
the exothermic semi-cycles, the bed is heated with the catalyst particles acting as energy storage
media, while in the endothermic semi-cycles, the reacting mixture is heated.
This concept of coupling has been used to couple a number of reactions. For example, Haynes et
al. (1992) studied the coupling of dehydrogenation of ethylbenzene in a reverse flow reactor
system. The reactor was divided into two beds so that when bed 1 was engaged in the reaction
cycle, bed 2 was undergoing regeneration by injecting steam. It was reported (Haynes et al.,
1992) that the conversion of ethylbenzene could reach 100%, compared to 51% for the simple
fixed bed reactor. Kulkarni (1996) and Kulkarni and Dudukovic (1996, 1997, and 1998) studied
the behaviour of an asymmetric bidirectional fixed bed reactor with both highly exothermic and
endothermic reactions alternatively occurring in the gas phase. Choudhary and Mulla (1997)
introduced a Sr-promoted La2O3 catalyst for partial oxidation of ethane to ethylene. At higher
temperature or ethane-to-oxygen ratio, the rate of the exothermic ethane oxidation reaction
became significant causing the process to accelerate and be more economical due to the thermal
coupling of the two reactions. It was possible to achieve a conversion of more than 50% with an
ethylene selectivity of more than 80% in less than 10 ms. A review by Kolios et al. (2000)
discussed the underlying principle, applications of thermal coupling of chemical reactions, and
the stability of the resulting dynamic systems.
Ismagilov et al. (2001) studied experimentally the coupling of steam reforming with methane
combustion in a 1.5 cm long tubular catalytic reactor. A methane conversion of 65% could be
achieved as a result of this coupling. In a catalytic plate reactor, the feasibility of coupling ethane
dehydrogenation with methane combustion was studied by Zanfir and Gavriilidis (2001), Zanfir
and Gavriilidis (2003) and Zanfir and Gavriilidi (2004) based on a two-dimensional reactor
model. The reactor was operated in a continuous cocurrent and countercurrent mode, and it was
found that the temperature profiles on both sides could be adjusted by varying the catalyst

4
loading and thermal conductivity of the metallic wall so that hot and cold spots inside the
reactors were eliminated. Improving of the thermal coupling was one of the objectives.
A review by Kolios et al. (2002) discussed the concept of autothermal coupling of reactions as
well as a proposed new reactor configuration. It was reported that controlling the temperature on
both sides of the barriers is a key issue. The dynamics of a reverse flow reactor coupling
dehydrogenation of propane with methane combustion was studied by van Sint Annaland et al.
(2002a) and van Sint Annaland et al. (2002b). Two reactor configurations were considered:
sequential and continuous. In the first part of this study, the dehydrogenation of propane was
assumed to be irreversible, while its reversibility was considered in the second part. The
sequentially reversed reactor generally showed better performance than the continuous one. The
results of these two studies were verified against experimental data showing that the coupling is
very effective and that the reversibility of the dehydrogenation of propane can be minimized by
providing inactive zones at both ends of the reactor where the temperature is low (van Sint
Annaland and Nijssen, 2002). For better heat coupling, Glöckler et al. (2003) suggested use of
side-distributed fuel stream in a reverse flow reactor, coupling styrene synthesis (production
cycle) with hydrogen combustion (regeneration cycle).
Kolios et al. (2004) and Kolios et al. (2005) studied the thermal coupling of steam reforming
with methane combustion in a catalytic reactor operated in both cocurrent and countercurrent
manners. The stability of the countercurrent configuration, as well as alternative designs and tips
were given to improve the heat exchange between the two sides of the reactors. A proof of
concept experiment showed the efficiency of the process. Direct and indirect coupling of
exothermic and endothermic reactions was evaluated by Ramaswamy et al. (2006) and
Ramaswamy et al. (2008) based on a one-dimensional fixed bed reactor model. The effects of a
number of operating parameters on the reactor conversions and the temperature profiles were
investigated. The thermal coupling of methanol reforming with the partial oxidation of methanol
was studied experimentally on a Cu/Zn/Al2O3 catalyst sprayed on plated catalyst. It was shown
that coupling is feasible and that operation is stable because the reactor was able to adjust itself
to changing loads.
5
To sum up, coupling of exothermic and endothermic reactions in autothermal reactors is feasible
with heat released from the exothermic reaction used to regenerate the catalyst and shift the
thermodynamic limitation of endothermic reactions. Applying this idea can result in smaller
reactors, as well as eliminating unnecessary heat transfer units. Effective heat transfer, stability
of operation and avoiding the formation of hot and cold spots inside the reactors are major
research challenges.
1.2.2. Coupling of chemical reaction with in-situ separation
Coupling of chemical reactions with in-situ separation can occur in reactors equipped with
membranes or chemical sorbents such as carbon dioxide (CO2) acceptors. Hydrogen and oxygen
are removed in membrane reactors, while carbon dioxide (CO2) is removed from reacting
mixtures when a CO2 acceptor such as dolomite particles reacts with CO2 to produce calcium
carbonate by the reaction:
2 3 CaO CO CaCO
3
298
kJH 178.8 10
kmol (1.1)
For membrane reactors, the production of hydrogen from steam reforming reactions can be
enhanced by allowing hydrogen to permeate from the reaction side to the permeate side. When
in-situ separation is coupled with chemical reactions, the conversion and yields of the
thermodynamically limited reactions such as steam reforming and dehydrogenation of
ethylbenzene can be significantly enhanced.
Several membrane reactors as well as reactor models have been proposed to investigate this
concept. For example, Abdalla and Elnashaie (1994) studied the dehydrogenation of
ethylbenzene to styrene in a membrane reactor for four different catalysts, one being the
industrial one. A mathematical model based on the heterogeneous modeling of fixed bed reactors
was also proposed, with diffusion inside the catalyst pellets modeled using the dusty gas model.
It was found that operating the reaction in a membrane reactor could enhance the styrene yield
by 20% to 30%.

6
A reactor model was presented by Kim et al. (1999) to predict the production of hydrogen in a
cocurrently configured membrane methane steam reformer with a heated external wall. The
prediction of the model was better than that derived at the assumption of constant temperature.
The model was used to investigate the effect of some parameters such as steam-to-methane feed
ratio, feed pressure on the reaction side, catalyst diameter and sweep gas flowrate. Dittmeyer et
al. (2001) discussed the use of palladium membranes for dehydrogenation reactions and liquid-
phase hydrogenation reactions. The oxidative dehydrogenation of n-butane was studied by
Assabumrungrat et al. (2002) in a fixed bed membrane reactor. A two-dimensional model was
developed accounting for both the radial heat and mass dispersions in both reactors, with the
external wall of the reactor maintained at a constant temperature. It was found that the membrane
could help to avoid the hot spots in the reactor when oxygen distribution on the reaction side is
controlled. Optimization of the configuration was essential to avoid a drop in methane
selectivity. A comparative study was performed by Hou and Hughes (2003) involving
dehydrogenation of propane in fixed and membrane reactors. Kinetic data were first obtained
from the fixed bed reactor, and then used to simulate the performance of composite and porous
membrane reactors. The performance of both membrane reactors was found to be better than the
fixed bed. The effects of operating conditions such as contact time, flowrates of the sweep gas
and pressure were also investigated. Addition of hydrogen to the feed of an n-hexane catalytic
membrane reformer was studied by Itoh et al. (2003a). They found that hydrogen should be
added because it participates in the initial steps of the mechanism of the reaction and prevents
catalyst deactivation. In a palladium membrane reactor, Itoh et al. (2003b) was able to extract
80% of the hydrogen produced in the reaction chamber when the pressure on the permeation side
was reduced to 0.1 bar. The effects of operating conditions such as temperature, reactor pressure
and permeate pressure were also evaluated.
In fluidized bed reactors, installing hydrogen membranes can greatly enhance the performance
compared to non-membrane reactors. For example, dehydrogenation of ethylbenzene to styrene
was studied by Abdalla and Elnashaie (1995) in a fluidized bed reactor with and without
membranes. Fluidization increased the conversion of ethylbenzene, but not the yield, while the
presence of membranes improved both. The effects of a number of operating and design
parameters were investigated. Steam reforming was studied experimentally by Mahecha-Botero
7
et al. (2008) in a fluidized reactor containing vertical membrane panels. The purity of hydrogen
collected experimentally was >99.99% and the performance of the reactor was governed by the
active membrane surface area. A comprehensive model for gas fluidized-bed reactors developed
by Mahecha-Botero et al. (2006) was utilized to model the reactor, and accurate predictions were
obtained. Rakib et al. (2008) studied the steam reforming of naphtha in a bubbling fluidized bed
membrane reactor with n-heptane as the representative component. The use of membranes
greatly enhanced both the conversion and the yield of hydrogen. A useful review was provided
by Deshmukh et al. (2007) in which the application and challenges of membrane fluidized bed
reactors were discussed. A theoretical study comparing performance of catalytic membranes with
membrane fluidized beds performance was published by Gallucci et al. (2010), with steam
reforming as the system reaction. At some operating conditions, it was found that the area of
membrane required to achieve a certain conversion in catalytic membrane reactors is twice that
required in fluidized bed reactors, making the fluidized bed more economical and attractive.
In summary, the use of hydrogen membranes with thermodynamically-limited reactions to
remove hydrogen from the reaction side can greatly enhance conversion, as well as yield in
catalytic and fluidized reactors. These reactor systems need to be optimized to achieve maximum
benefit.
1.2.3. Coupling of chemical reaction via both in-situ separation and heat transfer
In membrane reactors, complementary reactions can be coupled such that hydrogen or oxygen
diffuse through permeable membranes to the permeate side to react, and another useful product
can be produced. In addition to diffusion, heat produced by exothermic reactions on one side can
be transferred through the membrane wall to the other side where endothermic reactions take
place, resulting in greater improvement and smaller reactors compared to membrane reactors
with only in-situ separation.
A number of configurations and coupled reactions were proposed. For example, coupling
dehydrogenation of ethylbenzene with hydrogenation of benzene was explored in a shell and
tube catalytic fixed membrane reactor by Elnashaie et al. (2000) and Moustafa and Elnashaie

8
(2000). Both studies predicted enhanced ethylbenzene conversion (>90%), styrene yield (~90%)
and benzene conversion (>80%) compared to the industrial units. Methane steam reforming
(endothermic) and oxidative reforming (exothermic) were coupled in a novel circulating fast
fluidized bed membrane reformer to overcome the thermodynamic and diffusion limitations of
the steam reforming. Both hydrogen and oxygen permeative tubes were installed inside the
reformer to remove hydrogen produced from the steam reforming reactions and supply oxygen to
the oxidative reforming reaction. The reformer was operated autothermally and was able to
achieve hydrogen productivity 8 times that of industrial fixed bed reactor and 118 times that of a
bubbling bed membrane reformer (Chen et al., 2003). For higher hydrocarbon feed, the optimal
design was obtained and the effect of catalyst deactivation was negligible in the new process
(Chen et al., 2003). Combining the process with a catalyst regenerating unit made the process
more efficient in terms of hydrogen production and energy utilization for higher hydrocarbons
(Chen and Elnashaie, 2005a). The dynamic behavior of all proposed combinations was
investigated by Chen and Elnashaie (2005a), and Chen and Elnashaie (2005b). Abashar (2004)
studied also the coupling of dehydrogenation of ethylbenzene with hydrogenation of benzene in
a fixed bed reactor containing intermingled dehydrogenation and hydrogenation catalyst pellets.
A substantial increase in ethylbenzene conversion was observed (to ~100%) in addition to
substantial energy savings.
In general, this form of coupling is more promising but more complex, than the previously
mentioned ones. Careful design and optimization of the reactors can lead to smaller, energy-
saving units compared to existing industrial reactors. However, safety and other practical issues
must be considered to assure longevity and safe operation.
1.3. Sources of Novelty in this Thesis
In this thesis, the pair of chemical reactions coupled in a catalytic membrane fixed bed reactor
must be chosen such that certain objectives are achieved. First, the thermodynamic limitation of
the dehydrogenation reaction must be shifted by the permeation of hydrogen from the reaction
side to the permeate side. Secondly, hydrogen diffusion through the membrane should participate
in another useful reaction in which another a useful product is produced on the permeate side,

9
rather than being combusted to produce steam and heat. Thirdly, heat produced on the permeate
side should be transferred efficiently and in the proper direction to the dehydrogenation side to
further assist in overcoming the equilibrium limitation of the dehydrogenation reaction and
increasing overall productivity. Fourth, the process must proceed within the potential
temperature limitations of membranes. Finally, the process should be operated in a continuous
mode so that both sides of the reactor can produce simultaneously two different products.
After surveying a wide variety of reactions, it was found that an interesting pair to couple and
meet the constraints and objectives identified in the previous paragraph is dehydrogenation of
ethylbenzene and hydrogenation of nitrobenzene. The former is composed of six reactions
producing styrene as a main product and benzene, toluene, and light gases such as hydrogen,
ethylene, methane, carbon monoxide and carbon dioxide as side products according to the
stoichiometric equations:
22563256 HCHCHHCCHCHHC 298
kJ117.6
moleH (1.2)
42663256 HCHCCHCHHC 298
kJ105.4
moleH (1.3)
435623256 CHCHHCHCHCHHC 298
kJ54.6
moleH (1.4)
2422 422 HCOHCOH 298
kJ210.2
moleH (1.5)
242 3HCOCHOH 298
kJ206.1
moleH (1.6)
222 HCOCOOH 298
kJ41.2
moleH (1.7)
The first of these reactions, which is the main reaction, is reversible and endothermic, with the
forward reaction to styrene favored by operating at high temperature and low pressure. In
industrial fixed bed reactors producing styrene by these reactions, temperature drops along the
reactor due to the net endothermality unless heat is supplied externally.

10
Styrene is one of the most important monomers for the manufacture of thermoplastic and
synthetic rubbers. More than 90% of total styrene is produced by the dehydrogenation of
ethylbenzene at a temperature of 550-650oC and atmospheric or sub atmospheric pressure in the
presence of a Fe2O3 catalyst. Its worldwide annual demand has grown at a rate of 5 to 6%
(Hermann et al., 1997; She et al., 2001).
In the proposed coupled membrane reactor shown schematically in Figure 1.1, dehydrogenation
of ethylbenzene takes place on the shell side as it is mechanically better to operate the shell side
of the reactor at a higher pressure than the tube side. Hydrogen produced on the dehydrogenation
side diffuses through hydrogen-selective membranes to the tube side where it reacts with
nitrobenzene to produce aniline. This hydrogenation reaction is irreversible and exothermic. The
production of one mole of aniline requires one mole of nitrobenzene and three moles of
hydrogen in accordance with the stoichiometric equation:
6 5 2 2 6 5 2 23 2C H NO H C H NH H O 298
kJΔH = -443.0
mole (1.8)
The feed to the hydrogenation side of the coupled reactor contains no hydrogen, with all the
required hydrogen permeating through the membrane from the dehydrogenation side.
Commercially, aniline is a crucial raw material for synthetic dyes, rubber, chemicals, amino
resins and polyurethane. It is produced by hydrogenating nitrobenzene on a palladium catalyst
supported on α-alumina carrier in fixed bed reactors. Due to the high heat release, it is normally
conducted in fluidized bed reactors or in small-diameter fixed bed reactors (Amon et al., 1999;
Diao et al., 2005; Sun et al., 2002).
Dehydrogenation of ethylbenzene and hydrogenation of nitrobenzene are industrially important
processes due to the increasing worldwide demands for both styrene and aniline, their market
prices and wide usage. They also form a promising pair of reactions to be coupled in a catalytic
membrane reactor so that hydrogen and heat are exchanged between the two sides of the reactor.
However, the feasibility of coupling has not been evaluated yet. This thesis is a real attempt to
couple both processes, proving the concept of coupling, evaluating the benefits arising from the

11
new process, and providing an optimized design for the coupled reactor considering both high
productivities of styrene and aniline and safe operation for membranes. Theoretically, the
achievement of these objectives requires linking the numerical solution of complex initial and
boundary value problems representing the reactor models with efficient optimization subroutines
to obtain the best values satisfying the constraints imposed and maximizing the productivity of
the reactor.
1.4. Thesis Objectives
The objectives of this research project are:
1. To develop a novel configuration for an integrated autothermal reactor, with two
reactions coupled by means of both hydrogen transfer and heat transfer.
2. To obtain design equations for this novel configuration based on pseudo-homogeneous
modeling of fixed bed reactors for both cocurrent and countercurrent configurations
3. To optimize the performance of the coupled reactor based on maximizing the
productivities on both sides of the reactor for the cocurrent configuration.
4. To obtain rigorous model design equations accounting for diffusional resistance inside
the catalyst pellets based on both Fickian diffusion and the dusty gas model.
5. To investigate the effect of intraparticle diffusion on the optimal design of the coupled
reactor obtained in (3).
The original plans for this project included other tasks such as designing and operating a lab-
scale reactor, optimizing the countercurrent configuration of the coupled reactors, repeating the
optimization of reactor, but with new developed models accounting for the diffusional
resistances, and investigating the dynamics and multiplicity behaviour which may result from
coupling these two processes. However, these tasks have been left for future work due to the
complexity of the numerical solutions, as discussed in the next section, as well as limitations in
time, funds and facilities.

12
1.5. Challenges and Obstacles Encountered in this Thesis
While working on this thesis project, a number of challenges were encountered. The numerical
solution of pseudo-homogeneous reactor model was difficult especially for the countercurrent
configuration, which turned the modeling equations into a boundary value problem. Different
strategies and several numerical techniques had to be attempted to obtain the solutions, such as
the simple shooting method, multiple shooting method, orthogonal collocation, and false-
transient method. The major challenge in solving the reactor model equations was to find good
initial guessing profiles for 14 components, 2 temperatures and 2 pressures on both the
dehydrogenation and hydrogenation sides of the membrane reactor. The continuation method
with orthogonal collocation technique were finally found to perform the best, although
significant time is needed to obtain the solution for each operating condition. This unfortunately
made optimization of the countercurrent configuration almost impossible on normal desktop
computers. Consequently, dedicated power stations are recommended for optimizing the
countercurrent configuration of the coupled reactor. It was also found that calculating the
Jacobian matrix by finite difference techniques makes the problem unsolvable, especially when
the axial profiles of molar flowrates and temperatures becomes flat before the reactor exit. The
analytical form of the Jacobian matrix was provided by performing manual differentiation and
compared to the finite difference one to assure its reliability.
Solving the multiobjective optimization problem discussed in chapter 2 was also challenging in
obtaining the solution set itself as well as the uniformity of the set. Significant time was spent
attempting to solve the problem using the Evolutionary/and Genetic algorithms, but both failed.
Several populations were created and used to initialize the optimization cycle but with no
success. Finally, the multi-objective optimization problem turned out to be a single objective
problem and has been solved numerically several times with a varying constraint to obtain the
solution set. Unfortunately, the resulting solution set was found to suffer from the existence of
local optimal solutions, so it had to be filtered to remove them. The solution of the single
objective problem was challenging also due to the non-linearity. The solution couldn‘t be
obtained without running a global solver for a number of iterations, usually >1000 iterations,

13
with the solution of the global solver then used as an initial guess for a local solver. For these
cases, the use of commercial solvers was crucial and beneficial.
Evaluating diffusional resistances in chapters 4 and 5 using Fickian diffusion and the dusty gas
model for the catalyst pellets involved numerical complexity due to the nature of the resulting
boundary value problems and its linkage with the reactor model equations. As mentioned above,
the analytical Jacobian matrix was of great importance. Usually, 10 points along the radial
direction of the catalyst pellets and constant profiles were enough to locate the solution. Without
using the analytical Jacobian matrix, around 300 points would be needed along the
computational domain. The numerical solution of reactor model equations along with the
catalysts pellets equations was then time consuming.
Due to the nature of the problem considered in this thesis, the whole work was turned out to be
entirely theoretical and predictive. It is believed that the complexity involved until this stage is
sufficient and challenging enough to fit the time requirement and facility offered.
1.6. Derivation of the Reactor Pseudo-homogeneous Model
In this work, the pseudo-homogeneous model of the coupled reactor was used extensively to
prove the concept of coupling dehydrogenation of ethylbenzene with hydrogenation of
nitrobenzene in the proposed catalytic membrane reactor, to predict the overall behavior of the
reactor, and to optimize its performance. This model is simple and requires little time to solve.
The pseudo-homogeneous model for the coupled membrane reactor is based on the following
assumptions:
1. Steady state flow on both sides of the coupled reactor.
2. Ideal gas law applies on both shell and tube sides.
3. Plug flow on both shell and tube sides, justified because both Peclet numbers are of order
1000.
14
4. The external and intraparticle mass transfer resistances for the catalyst pellets are
neglected.
5. Catalyst deactivation is negligible.
6. The external wall of the reactor is well insulated, giving rise to an adiabatic reactor.
7. Pressure drop is calculated using Ergun‘s equation.
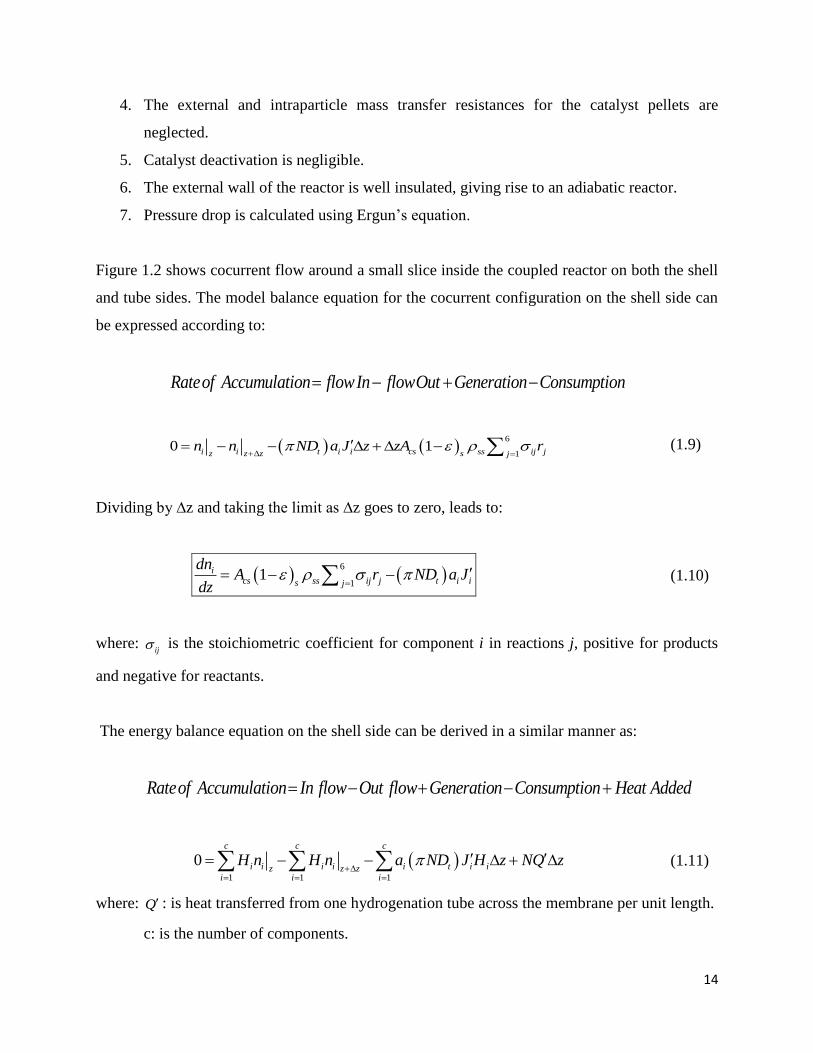
Figure 1.2 shows cocurrent flow around a small slice inside the coupled reactor on both the shell
and tube sides. The model balance equation for the cocurrent configuration on the shell side can
be expressed according to:
Rateof Accumulation flowIn flowOut Generation Consumption
6
10 1i i t i i cs ss ij jsz z z j
n n ND a J z zA r
(1.9)
Dividing by ∆z and taking the limit as ∆z goes to zero, leads to:
6
11i
cs ss ij j t i is j
dnA r ND a J
dz
(1.10)
where: ij is the stoichiometric coefficient for component i in reactions j, positive for products
and negative for reactants.
The energy balance equation on the shell side can be derived in a similar manner as:
Rateof Accumulation In flow Out flow Generation Consumption Heat Added
1 1 1
0c c c
i i i i i t i iz z zi i i
H n H n a ND J H z NQ z
(1.11)
where: Q : is heat transferred from one hydrogenation tube across the membrane per unit length.
c: is the number of components.

15
ia =1for hydrogen and ia =0 for all other components except hydrogen.
Dividing by z , taking the limit, and then substituting for idn
dz from the mole balance, we
obtain:
1 1
c i
i i i t i i
i i
dn H Q a ND J H
dz
(1.12)
If it is assumed that there is no phase change, equation (1.12) becomes:
10
11
1
1j
i i i ij j s cs i t iji
c
i t i i
i
dTn Cp H r A a D N J
dz
NQ a D N J H
(1.13)
6
1
10
1
1cs s R jjj
i pi
i
A H T r NQdT
dzn C
(1.14)
On the tube side, where dehydrogenation of nitrobenzene takes place, the mole balance equation
can be derived for a single tube as:
Rateof Accumulation In flow Out flow Generation Consumption
0 1i i i t i i s csz z zn n a D J z r A z
(1.15)
Dividing by ∆z and taking the limit as ∆z goes to zero, leads to:

16
1ii t i i s cs
dna D J r A
dz
(1.16)
The energy balance equation for a one hydrogenation tube is given by:
4 4
1 1 1
0c
i i i i i t i iz z zi i i
H n H n a D J H z Q z
(1.17)
Dividing by z , taking the limit as z goes to zero, leads to:
4
1 1
c
i i i t i i
i i
dn H a D J H Q
dz
(1.18)
4
1 1
ci i
i i i t i i
i i
dH dnn H a D J H Q
dz dz
(1.19)
After substituting for idn
dz
from the mole balance and cancelling similar terms on both side of the
equation, we obtain:
4
1 1
1c
ii i i t i i s cs i t i i
i i
dHn H a D J r A a D J H Q
dz
(1.20)
4
1 1
1c
ii i t i i i R s cs
i i
dHn a D J H H H T r A Q
dz
(1.21)
1
4
1
1c
i t i i i R s cs
i
i pi
i
a D J H H H T r A QdT
dzn C
(1.22)

17
1
4
1
1
Tc
i t i i R s cs
i T
i ip
i
a D J Cp dT H T r A QdT
dzn C
(1.23)
For the countercurrent configuration shown in Figure 1.3, the mole balance equation on the shell
side can be written as:
5
11i
cs s ij j t i ij
dnA r ND a J
dz
(1.24)
while the energy balance equation is expressed as:
1
1
1j
cs s R jjj
c
i pi
i
A H T r NQdT
dzn C
(1.25)
On the tube side of the coupled reactor, the mole balance for each hydrogenation tube can be
expressed as:
0 1i iz i t i i s csz z zn n a D J z r A z
(1.26)
Dividing by z and taking the limit as z goes to zero, leads to:
1ii t i i s cs
dna D J r A
dz
(1.27)
The energy equation can be written for the slice as:

18
4 4
1 1 1
0c
i i i i i t i iz zzi i i
H n H n a D J H z Q z
(1.28)
Dividing by z , taking the limit as z goes to zero, we obtain:
4
1 1
c
i i i t i i
i i
dn H a D J H z Q
dz
(1.29)
4
1 1
ci i
i i i t i i
i i
dH dnn H a D J H z Q
dz dz
(1.30)
Substituting for idn
dz
from the mole balance (1.27), gives:
4
1 1
1c
ii i i t i i s cs i t i
i i
dHn H a D J r A a D J H Q
dz
(1.31)
1 1
1c c
ii i t i i i R s c
i i
dHn a D J H H H T r A Q
dz
(1.32)
1
1
1c
i t i i i R s cs
i
c
i ip
i
a D J H H H T r A QdT
dzn C
(1.33)
1
1
1
Tc
i t i i R s cs
i T
c
i ip
i
a D J Cp dT H T r A QdT
dzn C
(1.34)
These equations are solved in chapters 2 and 3 for the coupled dehydrogenation of ethylbenzene
and hydrogenation of nitrobenzene processes.

19
Feed to the hydrogenation side
(Tube Side)Feed to the dehydrogenation side
(Shell Side)
Products from the hydrogenation
side, i.e. unreacted nitrobenzene,
aniline
Products from the dehydrogenation side, i.e.
unreacted ethylbenzene, styrene, benzene,
toluene, and light gases
Figure 1.1 Schematic diagram of the reactor coupling dehydrogenation of ethylbenzene
with hydrogenation of nitrobenzene
z
r

20
Figure 1.2 Schematic representation of a differential element inside the reactor for
cocurrent flow. Large arrows show directions of mass and heat fluxes.
Membrane
Wall
Axial
direction
Outer Wall ni ni
z z+∆z ∆z
n’i n’i
J’i
Q’
Q’ r
z

21
Figure 1.3 Schematic representation of a differential element inside the reactor for
countercurrent flow. Large arrows show directions of mass and heat fluxes.
n’i
Membrane
Wall
Axial
direction
Outer Wall ni ni
z z+∆z ∆z
n’i
J’i
Ji Q’
Q’
r
z

22
1.7. References
Abashar, M. E. E., 2004. Coupling of ethylbenzene dehydrogenation and benzene hydrogenation
reactions in fixed bed catalytic reactors, Chemical Engineering and Processing 43(10),
1195-1202.
Abdalla, B. K., Elnashaie, S. S. E. H., 1995. Fluidized bed reactors without and with selective
membranes for the catalytic dehydrogenation of ethylbenzene to styrene, Journal of
Membrane Science 101(1-2), 31-42.
Abdalla, B. K., Elnashaie, S. S. E. H., 1994. Catalytic dehydrogenation of ethylbenzene to
styrene in membrane reactors, AICHE Journal 40(12), 2055-2059.
Amon, B., Redlingshöfer, H., Klemm, E., Dieterich, E., Emig, G., 1999. Kinetic investigations of
the deactivation by coking of a noble metal catalyst in the catalytic hydrogenation of
nitrobenzene using a catalytic wall reactor, Chemical Engineering and Processing 38(4-
6), 395-404.
Assabumrungrat, S., Rienchalanusarn, T., Praserthdam, P., Goto, S., 2002. Theoretical study of
the application of porous membrane reactor to oxidative dehydrogenation of n-butane,
Chemical Engineering Journal 85(1), 69-79.
Chen Z., Prasad P., Yan Y., Elnashaie S., 2003. Simulation for steam reforming of natural gas
with oxygen input in a novel membrane reformer, Fuel Processing Technology 83, 235-
252.
Chen, Z., Elnashaie, S. S. E. H., 2005a. Autothermal CFB Membrane Reformer for Hydrogen
production from heptane, Chemical Engineering Research and Design 83(7), 893-899.
Chen, Z., Elnashaie, S. S. E. H., 2005b. bifurcation behaviour during the hydrogen production in
two compatible configurations of a novel circulating fluidized bed membrane reformer,
Chemical Engineering Research and Design 83(6), 679-685.
Chen, Z., Yan, Y., Elnashaie, S. S. E. H.., 2003. Modeling and optimization of a novel
membrane reformer for higher hydrocarbons, AIChE Journal 49(5), 16.
Choudhary, V. R., Mulla, S. A. R., 1997. coupling of exothermic and endothermic reactions in
oxidative conversion of natural gas into ethylene/olefins over diluted SrO/La2O3/SA5205
catalyst, Industrial & Engineering Chemistry Research 36(9), 3520-3527.

23
Deshmukh, S. A. R. K., Heinrich, S., Mörl, L., van Sint Annaland, M., Kuipers, J. A. M., 2007.
Membrane assisted fluidized bed reactors: Potentials and hurdles, Chemical Engineering
Science 62(1-2), 416-436.
Diao, S., Qian, W., Luo, G., Wei, F., Wang, Y., 2005. Gaseous catalytic hydrogenation of
nitrobenzene to aniline in a two-stage fluidized bed reactor, Applied Catalysis A: General
286(1), 30-35.
Dittmeyer, R., Höllein, V., Daub, K., 2001. Membrane reactors for hydrogenation and
dehydrogenation processes based on supported palladium, Journal of Molecular Catalysis
A: Chemical 173(1-2), 135-184.
Elnashaie, S. S. E. H., Moustafa, T., Alsoudani, T., Elshishini, S. S., 2000. Modeling and basic
characteristics of novel integrated dehydrogenation — hydrogenation membrane catalytic
reactors, Computers & Chemical Engineering 24(2-7), 1293-1300.
Gallucci, F., Van Sintannaland, M., Kuipers, J. A. M., 2010. Theoretical comparison of packed
bed and fluidized bed membrane reactors for methane reforming, International Journal of
Hydrogen Energy 35(13), 7142-7150.
Glöckler, B., Kolios, G., Eigenberger, G., 2003. Analysis of a novel reverse-flow reactor concept
for autothermal methane steam reforming, Chemical Engineering Science 58(3-6), 593-
601.
Haynes, T. N., Georgakis, C., Caram, H. S., 1992. The application of reverse flow reactors to
endothermic reactions, Chemical Engineering Science 47(9-11), 2927-2932.
Hermann, C., Quicker, P., Dittmeyer, R., 1997. Mathematical simulation of catalytic
dehydrogenation of ethylbenzene to styrene in a composite palladium membrane reactor,
Journal of Membrane Science 136(1-2), 161-172.
Hou, K., Hughes, R., 2003. A comparative simulation analysis of propane dehydrogenation in
composite and microporous membrane reactors, Journal of Chemical Technology &
Biotechnology 78(1), 35-41.
Ismagilov, Z. R., Pushkarev, V. V., Podyacheva, O. Y., Koryabkina, N. A., Veringa, H., 2001. A
catalytic heat-exchanging tubular reactor for combining of high temperature exothermic
and endothermic reactions, Chemical Engineering Journal 82(1-3), 355-360.

24
Itoh, N., Xu, W. C., Hara, S., Kakehida, K., Kaneko, Y., Igarashi, A., 2003a. Effects of hydrogen
Removal on the catalytic reforming of n-hexane in a palladium membrane reactor,
Industrial & Engineering Chemistry Research 42(25), 6576-6581.
Itoh, N., Tamura, E., Hara, S., Takahashi, T., Shono, A., Satoh, K., Namba, T., 2003b. Hydrogen
recovery from cyclohexane as a chemical hydrogen carrier using a palladium membrane
reactor, Catalysis Today 82(1-4), 119-125.
Jun-Hun Kim, Byung-Seok Choi and Jongheop Yi, 1999. Modified simulation of methane steam
reforming in Pd-membrane/packed-bed type reactor, Journal of Chemical Engineering of
Japan 32, 760-769.
Kolios, G., Frauhammer, J., Eigenberger, G., 2000. Autothermal fixed-bed reactor concepts,
Chemical Engineering Science 55(24), 5945-5967.
Kolios, G., Glöckler, B., Gritsch, A., Morillo, A., Eigenberger, G., 2005. Heat-integrated reactor
concepts for hydrogen production by methane steam reforming, Fuel Cells 5(1), 52-65.
Kolios, G., Gritsch, A., Glöckler, B., Sorescu, G., Frauhammer, J., 2004. Novel reactor concepts
for thermally efficient methane steam reforming: a modeling and simulation, Industrial &
Engineering Chemistry Research 43(16), 4796-4808.
Kolios, G., Frauhammer, J., Eigenberger, G., 2002. Efficient reactor concepts for coupling of
endothermic and exothermic reactions, Chemical Engineering Science 57(9), 1505-1510.
Kulkarni, M. S., 1996. Dynamics of asymmetric fixed-bed reactors: Coupling of exothermic and
endothermic reactions, D.Sc. Dissertation, St. Louis, MO, Washington University.
Kulkarni, M. S., Dudukovic, M. P., 1998. Periodic operation of asymmetric bidirectional fixed-
bed reactors with temperature limitations, Industrial & Engineering Chemistry Research
37(3), 770-781.
Kulkarni, M. S., Dudukovic, M. P., 1997. Periodic operation of asymmetric bidirectional fixed-
bed reactors: energy efficiency, Chemical Engineering Science 52(11), 1777-1788.
Kulkarni, M. S., Dudukovic', M. P., 1996. Dynamics of gas phase and solid phase reactions in
fixed bed reactors, Chemical Engineering Science 51(11), 3083-3088.
Mahecha-Botero, A., Grace, J., Elnashaie, S. S. E. H., and Lim, C. J., 2006. Comprehensive
modeling of gas fluidized-bed reactors allowing for transients, multiple flow regimes and
selective removal of species, International Journal of Chemical Reactor Engineering 4,
A11.

25
Mahecha-Botero, A., Boyd, T., Gulamhusein, A., Comyn, N., Lim, C. J., Grace, J. R., Shirasaki,
Y., Yasuda, I., 2008. Pure hydrogen generation in a fluidized-bed membrane reactor:
Experimental findings, Chemical Engineering Science 63(10), 2752-2762.
Moustafa, T. M., Elnashaie, S. S. E. H., 2000. Simultaneous production of styrene and
cyclohexane in an integrated membrane reactor, Journal of Membrane Science 178(1-2),
171-184.
Rakib, M. A., Grace, J. R., Elnashaie, S. S. E. H., Lim, C. J., Bolkan, Y. G., 2008. Kinetic
simulation of a compact reactor system for hydrogen production by steam reforming of
higher hydrocarbons, The Canadian Journal of Chemical Engineering 86(3), 403-412.
Ramaswamy, R. C., Ramachandran, P. A., Duduković, M. P., 2008. Coupling exothermic and
endothermic reactions in adiabatic reactors, Chemical Engineering Science 63(6), 1654-
1667.
Ramaswamy, R. C., Ramachandran, P. A., Duduković, M. P., 2006. Recuperative coupling of
exothermic and endothermic reactions, Chemical Engineering Science 61(2), 459-472.
She, Y., Han, J., Ma, Y. H., 2001. Palladium membrane reactor for the dehydrogenation of
ethylbenzene to styrene, Catalysis Today 67(1-3), 43-53.
Sun, A., Qin, Z., Wang, J., 2002. Reaction coupling of ethylbenzene dehydrogenation with
nitrobenzene hydrogenation, Catalysis Letters 79(1), 33-37.
van Sint Annaland, M., Nijssen, R. C., 2002. A novel reverse flow reactor coupling endothermic
and exothermic reactions: an experimental study, Chemical Engineering Science 57(22-
23), 4967-4985.
van Sint Annaland, M., Scholts, H. A. R., Kuipers, J. A. M., van Swaaij, W. P. M., 2002a. A
novel reverse flow reactor coupling endothermic and exothermic reactions. Part I:
comparison of reactor configurations for irreversible endothermic reactions, Chemical
Engineering Science 57(5), 833-854.
van Sint Annaland, M., Scholts, H. A. R., Kuipers, J. A. M., van Swaaij, W. P. M., 2002b. A
novel reverse flow reactor coupling endothermic and exothermic reactions: Part II:
Sequential reactor configuration for reversible endothermic reactions, Chemical
Engineering Science 57(5), 855-872.
Zanfir, M., Gavriilidis, A., 2004. Influence of flow arrangement in catalytic plate reactors for
methane steam reforming, Chemical Engineering Research and Design 82(2), 252-258.

26
Zanfir, M., Gavriilidis, A., 2003. Catalytic combustion assisted methane steam reforming in a
catalytic plate reactor, Chemical Engineering Science 58(17), 3947-3960.
Zanfir, M., Gavriilidis, A., 2001. Modelling of a catalytic plate reactor for dehydrogenation–
combustion coupling, Chemical Engineering Science 56(8), 2671-2683.
27
Chapter 2 PSEUDO-HOMOGENEOUS MODELING OF A NOVEL
MEMBRANE REACTOR TO INTEGRATE DEHYDROGENATION OF
ETHYLBENZENE TO STYRENE WITH HYDROGENATION OF
NITROBENZENE TO ANILINE†
2.1. Introduction
Styrene is one of the most important monomers for the manufacture of polystyrene used in
thermoplastic and synthetic rubbers. Styrene is currently produced by two industrial processes:
dehydrogenation of ethylbenzene and as a by-product in the epoxidation of propane with
ethylbenzene hydroperoxide and Mo comple-based catalyst (Cavani, 1995). More than 90% of
total styrene is produced by the catalytic dehydrogenation of ethylbenzene at operating
temperatures of 550-650oC and atmospheric or sub-atmospheric pressure in the presence of
Fe2O3 catalyst. Worldwide demand is growing at 5 to 6% per year (Hermann et al., 1997; Shu et
al., 2001). The catalytic dehydrogenation reaction of ethylbenzene is reversible, endothermic and
severely limited by thermodynamic equilibrium, with a maximum ethylbenzene conversion of
less than 50% (Abashar, 2004).
The potential for enhancement of styrene yield by catalyst improvement appears to be limited
due to the fact that the main bottleneck is related to the thermodynamic equilibrium. Therefore,
great efforts are needed to improve the performance through process design modification
(Abashar, 2004). Moustafa and Elnashaie (2000); and Elnashaie et al. (2000) investigated the
performance of a membrane catalytic reactor to couple the dehydrogenation of ethylbenzene to
styrene with the hydrogenation of benzene to cyclohexane. A hybrid fixed bed reactor was
† A version of this chapter was published: Nabeel S. Abo-Ghander, John R. Grace, Said S.E.H. Elnashai,
and C. Jim Lim, 2008. Modeling of a novel membrane reactor to integrate dehydrogenation of
ethylbenzene to styrene with hydrogenation of nitrobenzene to aniline, Chemical Engineering Science,
63(7), 1817-1826.

28
modeled using a rigorous reactor model, leading to prediction of remarkable enhancement in
both the conversion of ethylbenzene and yield of styrene compared to an industrial catalytic
reactor operated by the Polymer Corporation in Sarnia, Canada. They reported an almost 51%
conversion of ethylbenzene and 45% yield of styrene. Abashar (2004) investigated a similar
configuration and obtained a substantial increase in the conversion of ethylbenzene to nearly
100%.
From these previous studies, coupling of hydrogenation and dehydrogenation reactions may
enable both the concentration and temperature profiles along the reactor to be manipulated,
shifting the conversion of thermodynamically limited reactions to higher values, and efficiently
using the heat liberated by an exothermic reaction to provide the endothermic heat requirements
of the other reaction (Amon, 1999). In the initial stage of our current work, we conducted an
extensive literature review to find a pair of industrial reactions which could be coupled in such a
way that hydrogen needed on one side of a membrane could be provided by dehydrogenation on
the other side, while, at the same time, heat needed for an endothermic reaction could be
supplied by exothermic heat release and transfer from the other side. A promising pair was found
to be the dehydrogenation of ethylbenzene to styrene, coupled with the hydrogenation of
nitrobenzene to aniline.
The integrated membrane reactor simulated for these two reactions is shown schematically in
Figure 2.1. It consists of a shell compartment surrounding a tube compartment. Catalytic
dehydrogenation of ethylbenzene to styrene is assumed to take place in the shell, whereas
hydrogenation of nitrobenzene to aniline occurs inside the tubes, with fixed beds of different
catalysts on both sides. Hydrogen-selective membranes separate the two compartments. Heat is
transferred continuously through the membrane from the exothermic reaction inside the tubes to
the endothermic reaction on the shell side. At the same time, hydrogen is transferred
continuously through the hydrogen selective membrane from the dehydrogenation reaction on
the shell side to the hydrogenation reaction on the tube side. The heat supplied from the tube
compartment and the transfer of hydrogen from the compartment where the catalytic
dehydrogenation of ethylbenzene is taking place should aid significantly in enhancing the
conversion of ethylbenzene and the yield of styrene. The overall reactor requires a larger
29
dehydrogenation cross-sectional area than the hydrogenation cross-sectional area because of the
stoichiometry of the reaction, i.e. one mole of ethylbenzene generates one mole of hydrogen,
whereas one mole of nitrobenzene requires three moles of hydrogen to produce one mole of
aniline. However, large surface area is also required to promote heat transfer between the two
sides of the coupled reactor. In this study, both cocurrent and countercurrent configurations are
investigated.
2.2. Theory
In this preliminary exploration of the performance of the coupled reactor, a pseudo-
homogeneous model is used. In this model, the fluid and solid catalyst are treated as one pseudo-
homogeneous phase. Intrapaticle gradients of temperature and concentration are ignored so that
everywhere in the catalyst bed, the concentration and temperature are assumed to be the same as
the corresponding local values of the bulk fluid. We will examine these assumptions, showing
them to be the reasonable first approximation, in future work where a heterogeneous model is
developed.
2.2.1. Assumptions
To derive the governing equations for both sides of the integrated fixed bed membrane reactor,
the following assumptions are adopted:
1. Steady state operation.
2. Ideal gas behaviour on both sides.
3. Plug flow on both shell and tube sides, with both axial Peclet numbers of order 1000.
4. Pseudo-homogeneous one-dimensional models, i.e. radial Peclet number >> 1.0.
5. Catalyst deactivation is neglected.
6. The pressure drop along the reactor is calculated based on Ergun‘s equation.

30
2.2.2. Reaction kinetics
The reaction network for the dehydrogenation of ethylbenzene to styrene is (Abashar, 2004;
Moustafa and. Elnashaie, 2000; Elnashaie et al., 2000; Abdulla and Elnashaie, 1993):
22563256 HCHCHHCCHCHHC 298
kJΔH =117.6
mole (2.1)
42663256 HCHCCHCHHC 298
kJΔH =105.4
mole (2.2)
435623256 CHCHHCHCHCHHC 298
kJΔH =-54.6
mole (2.3)
2422 422 HCOHCOH 298
kJΔH =210.2
mole (2.4)
242 3HCOCHOH 298
kJΔH =206.1
mole (2.5)
222 HCOCOOH 298
kJΔH =-41.2
mole (2.6)
In this network, all side reactions are irreversible with the only reversible reaction being the main
reaction which produces styrene. The corresponding rate equations, expressed as functions of
component partial pressure in bars, are (Abashar, 2004; Moustafa and Elnashaie, 2000; Elnashaie
et al., 2000; Abdulla and Elnashaie, 1993):
2
1 1
ST H
EB
A
p pr k p
K
(2.7)
2 2 EBr k p (2.8)
23 3 EB Hr k p p (2.9)
2 2 4
1 2
4 4 H O C Hr k p p (2.10)
2 45 5 H O CHr k p p (2.11)

31
26 6 3 H O CO
Pr k p p
T
(2.12)
with rate constants defined as:
RT
EAk i
ii exp (2.13)
The numerical values of Ai and Ei in Table 2.1 are used to calculate the rates of reactions in
kmole (kg catalyst)-1
s-1
. Tobe able to use the partial pressure in Pascals and then reaction rates in
mole (kg catalyst)-1
s-1
, the right hand side of the above rate equations (2.7-2.12) have to be
multiplied by the constants in Table 2.2.
On the tube side, the hydrogenation reaction of nitrobenzene to aniline is given (Amon, 1999)
by:
6 5 2 2 6 5 2 23 2C H NO H C H NH H O 295
kJΔH =-443.0
mole (2.14)
The rate equation of this reaction is estimated (Amon, 1999) by:
222
22
1 HHNBNB
HNBHNB
pKpK
ppKKkr
(2.15)
with reaction rate constant defined as:
TR
EAk exp103
(2.16)
where:

32
A’=0.186, E’=10.0kJ
mole,
2
3 0.5
HK 4.427 10 Pa , 5 1
NBK 1.510 10 Pa
2.2.3. Pseudo -homogeneous model of the coupled membrane reactor
To obtain the mole balance equation and the energy balance equation, a differential element
along the axial direction inside the membrane reactor was considered, as shown in Figure 2.2.
After writing steady state balances, both sides of the resulting equations were divided by the
thickness of the differential element, which was then forced to approach zero. The resulting
balances equations of the shell side can be expressed as:
Mole balance:
6
311 2i
ij j cs s i ij
dnr A r Na J
dz
(2.17)
Energy balance:
6
1
10
1
1j cs sj j
i ii
H T r A NQdT
dz n Cp
(2.18)
Pressure drop:
3
150 111.75
g
g c p p
dP GG
dz g D D
(2.19)
The corresponding balance equations on the tube side can be expressed as:
Mole balance:
31 1 2bi
i cs s i i
dnr A r a J
dz
(2.20)

33
Energy balance:
3 1
4
1
2 1
1
Ti
i i i cs sib T
i ii
r a J Cp dT H T r A QdT
dz n Cp
(2.21)
Pressure drop:
3
150 111 1.75
b g
g c p p
dP GG
dz g D D
(2.22)
where: 0b for cocurrent configuration
1b for countercurrent configuration.
In equation (2.17) and (2.18), “N” is the number of membrane tubes. The flux term “Ji” in
equations (2.17), (2.20), and (2.21) only applies to hydrogen, i.e. 1ia . This term disappears for
all other components, i.e. 0ia .
The hydrogen flux across a palladium membrane surface is calculated by Sievert‘s law (Chen
2004; Shu, 1994), i.e.
22
2
2
2
,exp
HH
H
PH
o
H PPRT
EQ
J
(2.23)
The pre-exponential constant, permeation activation energy, and the thickness of the hydrogen
permeation membrane are taken to be 6.33×10⁻⁷
mol m-1
sec-1
Pa-0.5
, 15.7 kJ mol-1
, and 1~2×10⁻⁵
m, respectively (Chen 2004; Shu, 1994). Heat transfer across the membrane involves convection
from the gas mixture to the membrane, conduction across the membrane layer, and finally
convection from the membrane to the second gas mixture. Radiation is neglected. The membrane
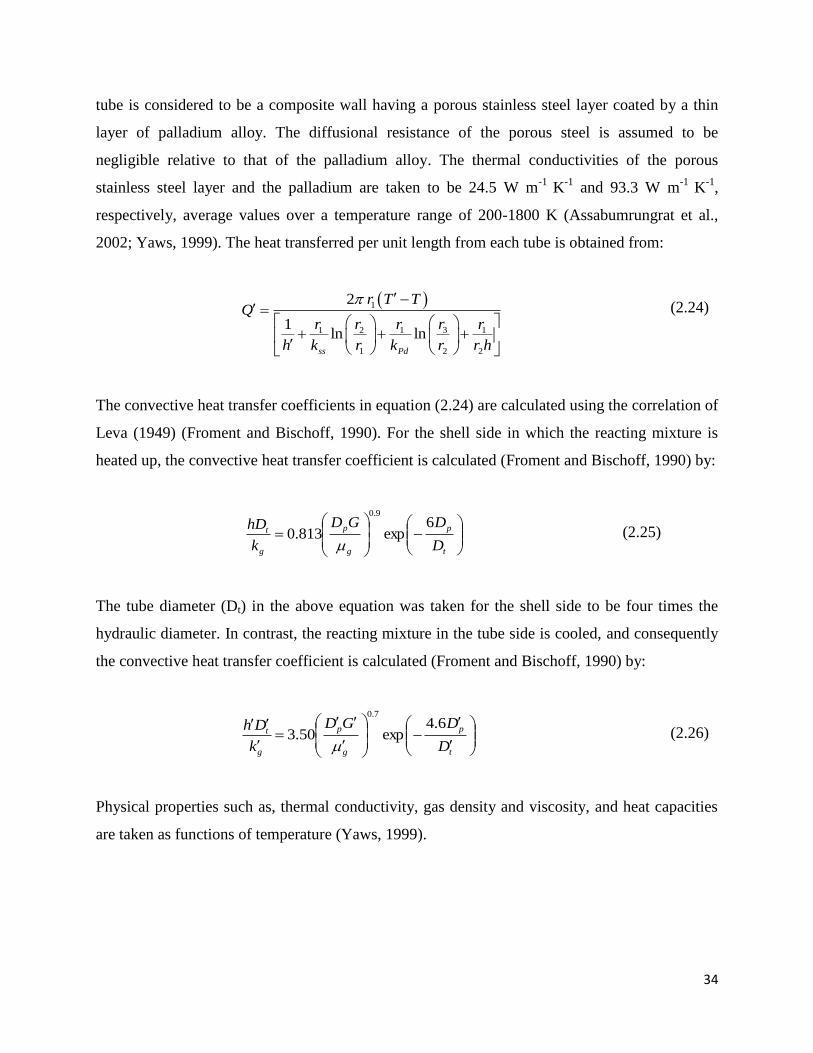
34
tube is considered to be a composite wall having a porous stainless steel layer coated by a thin
layer of palladium alloy. The diffusional resistance of the porous steel is assumed to be
negligible relative to that of the palladium alloy. The thermal conductivities of the porous
stainless steel layer and the palladium are taken to be 24.5 W m-1
K-1
and 93.3 W m-1
K-1
,
respectively, average values over a temperature range of 200-1800 K (Assabumrungrat et al.,
2002; Yaws, 1999). The heat transferred per unit length from each tube is obtained from:
1
31 2 1 1
1 2 2
2
1ln ln
ss Pd
r T TQ
rr r r r
h k r k r r h
(2.24)
The convective heat transfer coefficients in equation (2.24) are calculated using the correlation of
Leva (1949) (Froment and Bischoff, 1990). For the shell side in which the reacting mixture is
heated up, the convective heat transfer coefficient is calculated (Froment and Bischoff, 1990) by:
t
p
g
p
g
t
D
DGD
k
hD 6exp813.0
9.0
(2.25)
The tube diameter (Dt) in the above equation was taken for the shell side to be four times the
hydraulic diameter. In contrast, the reacting mixture in the tube side is cooled, and consequently
the convective heat transfer coefficient is calculated (Froment and Bischoff, 1990) by:
t
p
g
p
g
t
D
DGD
k
Dh 6.4exp50.3
7.0
(2.26)
Physical properties such as, thermal conductivity, gas density and viscosity, and heat capacities
are taken as functions of temperature (Yaws, 1999).

35
2.2.4. Initial and boundary conditions
In the case of the cocurrent operation 0b , the above system of differential equations gives an
initial value problem which can be solved by a Runge-Kutta Verner fifth and sixth order method
with an automatic step size, double precision calculation, and a relative error of 1×10-12
to ensure
high accuracy. The initial conditions for the cocurrent configuration are:
At: 0z
Shell Compartment: ffifi PPTTnn ;; (2.27)
Tube Compartment: ffifi PPTTnn ;; (2.28)
For the countercurrent operation case 1b , the above differential equations result in a split
two-point boundary value problem which can be solved by orthogonal collocation (Villadsen and
Michelsen, 1978; Trefethen, 2000). The boundary conditions for the countercurrent
configuration are:
At: 0z inlet end of dehydrogenation compartment
Shell Compartment: ffifi PPTTnn ;; (2.29)
At: Lz inlet end of hydrogenation compartment
Tube Compartment: ffifi PPTTnn ;; (2.39)
2.2.5. Simulation conditions
The operating conditions for both sides of the reactor are given in Tables 2.3 and 2.4. For the
dehydrogenation of ethylbenzene to styrene, the feed molar flowrates are the same as those
presented by (Moustafa and Elnashaie, 2000; Elnashaie et al, 2000; Abdulla and Elnashaie,

36
1993), whereas the molar flowrate of nitrobenzene is based on stoichiometry. More steam is
provided in the feed line to prevent coke from forming on the catalyst. This leads to justifying
the neglect of catalyst deactivation on the reactor model. The performance on the
dehydrogenation side is compared with an adiabatic reference case without membrane having
identical feed conditions. The simulation results of the novel reactor in the nitrobenzene side are
not compared with any reference case because the hydrogenation is essentially irreversible (not
limited by thermodynamic equilibrium) with hydrogen supplied along the length of the reactor
through the hydrogen-permeative tubes, rather than via a hydrogen feed stream, making
comparison with industrial data not possible.
2.3. Results and Discussion
The achievable performance as far as conversion of ethylbenzene and yield of styrene are
concerned is much better than for the corresponding uncoupled industrial fixed bed reactors
operated at the same conditions. The coupled membrane reactor also has the potential to give
even better conversion of ethylbenzene and yield of styrene by increasing the length of the
reactor, since the two profiles continue to evolve with distance. In this work, the practical life
time of membranes at high temperature was taken into consideration in the specification that the
membrane temperature must not exceed 900 K at any point along the membrane reactor.
Although the feed temperature to the dehydrogenation side in our proposed reactor was below
that used by Moustafa and Elnashaie (2000) by more than 70.0 K, a considerable enhancement
could be obtained. Because of this low operating temperature, this proposed reactor is expected
to operate more economically than that modelled by Moustafa and Elnashaie (2000). In addition,
at the lower temperature the production of side products, in particular benzene and toluene, are
expected to be reduced so that more of the fed ethylbenzene results in the production of styrene.
On the tube side, the conversion of nitrobenzene to aniline is also very favorable, providing
another positive feature of the composite reactor. Autothermality is also achieved in the system
because the exothermic heat generated by the hydrogenation of nitrobenzene is sufficient to
provide the endothermic heat consumed by the dehydrogenation of ethylbenzene.

37
2.3.1. Hydrogen molar flowrate
Hydrogen molar flowrates for an uncoupled fixed bed reactor and for coupled cocurrent and
countercurrent membrane reactors are shown in Figure 2.3. Hydrogen is generated and built up
in the uncoupled fixed bed reactor case while producing styrene. For the coupled cocurrent case,
on the other hand, hydrogen produced on the dehydrogenation side diffuses immediately through
the membrane walls of the hydrogenation tubes where it meets nitrobenzene to react and produce
aniline. The comparable rates of the net production of hydrogen on the dehydrogenation side and
diffusion of hydrogen through the palladium membrane prevent the hydrogen from accumulating
on the dehydrogenation side, where it reduces the net reaction rate. The coupled countercurrent
case is of special interest due to the presence of a maximum where the flowrate of hydrogen
reaches a maximum and then decreases. At the feed end of the dehydrogenation side ( 0z ), the
rate of production of hydrogen by reactions (2.1), (2.4), (2.5), and (2.6) surpasses both the rate of
consumption of hydrogen by reaction (2.3) and the rate of diffusion of hydrogen through the
palladium membrane. This leads to an increase in the number of moles of hydrogen until a point
is reached where the hydrogen flowrate has achieved its maximum value, i.e. where the rate of
change of molar flowrate of hydrogen at that point with respect to the length of the reactor is
zero. At this point, the rate of the production of hydrogen is balanced by both the rate of
consumption of hydrogen by reaction (2.3) and the rate of diffusion of hydrogen through the
membrane. Beyond that point, the process is dominated by consumption of hydrogen by reaction
(2.3) and diffusion of hydrogen through the membrane. Consequently, the molar flowrate of
hydrogen decreases along the reactor. This trend induces similar behaviour in the hydrogenation
tubes. As nitrobenzene moves from its feed point at z=3.0m , it reacts with permeate hydrogen.
Another maximum is reached where the rate of diffusion of hydrogen through the membrane is
balanced by its rate of consumption by the hydrogenation reaction. This point is located to the
left (on Figure 2.3) of that on the dehydrogenation side. After passing this maximum, the rate of
consumption of hydrogen dominates, causing the amount of hydrogen in the hydrogenation tubes
to drop quickly.

38
2.3.2. Conversion of ethylbenzene
The predicted conversion of ethybenzene on the dehydrogenation side is shown in Figure 2.4 for
the same three cases. For the operating conditions chosen, the conversion reaches 23.4% for the
uncoupled adiabatic fixed bed case, 54.6% for the cocurrent membrane reactor, and 61.7% for
the membrane reactor with a countercurrent flow configuration. Coupling of the two reactions
clearly has the potential to provide significant improvement in performance. Moreover, the heat
generated by the exothermic hydrogenation reaction is put to good use, rather than being simply
rejected to cooling water.
2.3.3. Yield of styrene
Three cases are investigated: an uncoupled fixed bed case corresponding to contemporary
industial operation, a cocurrent coupled case, and a countercurrent coupled case. Results for the
three cases appear in Figure 2.5. The lowest yield by a considerable margin is predicted for the
uncoupled adiabatic fixed bed where the maximum yield is 18.9%. For the membrane reactor,
the predicted yield increases to 52.5% for the cocurrent flow configuration and 57.7% for the
countercurrent case.
2.3.4. Conversion of nitrobenzene
Figure 2.6 plots the predicted conversion of nitrobenzene as a function of distance along the
reactor for the hydrogenation reaction to aniline. The countercurrent membrane reactor is seen to
give higher conversion than the cocurrent case because of the large driving forces. The
conversion for the cocurrent case is predicted to reach 51.1%, while 57.9% is calculated for the
corresponding countercurrent case.
2.3.5. Temperature profiles
Temperature profiles for the uncoupled adiabatic fixed bed reactor and both the cocurrent and
countercurrent membrane reactors are plotted in Figures 2.7 and 2.8 for different numbers of

39
membrane tubes. Heat is continuously supplied from the exothermic nitrobenzene-to-aniline
reaction on the tube side to the endothermic dehydrogenation of ethylbenzene on the shell side.
The temperature variation is larger at the inlet in the coupled countercurrent case than for
coupled cocurrent flow. The fall in temperature for both cases of the coupled membrane reactor
is much less than for the uncoupled fixed bed reactor. In the countercurrent case of the coupled
reactor, the temperature on the dehydrogenation side drops because the heat transfer from the
nitrobenzene side decreases due to the low driving force, i.e. the temperatures on both sides
become similar.
Predicted temperature profiles on the hydrogenation side where the nitrobenzene-to-aniline
reaction occurs are also plotted in Figures 2.7 and 2.8 for different numbers of membrane tubes.
The temperature rises from 860 K at the feed point to slightly more than 920 K for the coupled
cocurrent flow case, and to a little greater than 945 K for the coupled countercurrent flow
configuration. The large temperature rise for the coupled countercurrent coupled case is due to
the large driving force, causing more permeation of hydrogen through the membranes and
consequently increasing the nitrobenzene conversion. However, the temperature reaches a peak
where both heat generated on the nitrobenzene side due to the reaction and energy carried by the
permeating hydrogen are balanced by heat transfer through the membrane to the ethylbenzene
side. Later, the temperature decreases because of the dominance of the heat transfer through the
membrane.
2.3.6. Practical considerations
Coupling the exothermic hydrogenation reaction with the endothermic dehydrogenation reaction
is predicted to be capable of providing a significant improvement in reactor performance and
energy integration. However, it must be noted that palladium membranes are currently limited to
temperatures of ~ 900 K. The maximum temperature could be reduced by increasing the number
of membrane tubes giving more surface area and permitting more heat transfer rate between the
compartments. This is illustrated in Figures 2.7 and 2.8 where the axial temperature profiles in
both compartments of the coupled membrane reactor are plotted, with flowrate unaltered. Note
that the maximum temperature can be maintained below 880 K, with countercurrent operation

40
giving higher maximum temperature than the cocurrent option. Note also that the countercurrent
configuration is likely to be very difficult to start up in practice and that a dynamic model is
required to be solved to have an idea about the time needed until steady-state is reached. Hence,
cocurrent operation process control and safety aspects are also expected to be easier to provide
for the cocurrent configuration. Hence, despite the advantages of countercurrent operation,
cocurrent flow is more likely to be practical for the foreseeable future. Finally, while pseudo-
homogeneous one-dimensional models, like that used here, provide a good initial sense of what
could be achieved in coupled fixed bed reactors, more comprehensive heterogeneous models
with fewer simplifying assumptions are needed prior to proof-of-concept experiments on such
reactors. As noted above, more comprehensive modeling is in progress.
2.4. Conclusions
The performance of a novel tube-in-shell membrane reactor, first investigated by Moustafa and
Elnashaie (2000), with two coupled reactions, an exothermic hydrogenation and an endothermic
dehydrogenation reaction in parallel, has been modeled and evaluated for cocurrent and
countercurrent operation. Pseudo-homogeneous models have been used to describe the behavior
of the system. In the range of the parameters considered, the simulation predicts a marked
increase in the conversion of ethylbenzene and yield of styrene when the dehydrogenation of
ethylbenzene to styrene is coupled with the hydrogenation of nitrobenzene. The results from the
countercurrent mode of operation were in all cases more favorable than those from the cocurrent
mode of operation due to the large driving forces for hydrogen diffusion and heat transfer
between the two sides of the coupled reactor. The simulation results suggest that coupling may
be feasible. However, the performance of the reactor needs to be proven experimentally and
tested over a range of parameters under practical operating conditions.

41
Table 2.1 Arrhenius equation and equilibrium constants for ethylbenzene reactions.
Reaction No. Frequency Factor
a
Ai
Activation Energya,
(kJ/mole)
Ei
2.7 0.85
90.9
2.8 14.00 208.1
2.9 0.56 91.5
2.10 0.12 104.0
2.11 -3.21 65.7
2.12 21.24 73.6
Equilibrium constant
RT
FK A exp
2cTbTaF 1227251 /a kJ mole
126.267 / /a kJ mole K 3 22.194 10 / /c kJ mole K
a obtained from Abdulla and Elnashaie, (1993);Moustafa and
Elnashaie (2000); Elnashaie et. al (2000); Assabumrungrat et. al(2002).

42
Table 2.2 Unit conversion constants for reaction rates of dehydrogenation network.
Reaction rate
equation No.
Constant to
multiply right
side by
2.7 1/100
2.8 1/100
2.9 1/107
2.10 1/104.5
2.11 1/107
2.12 1/1012

43
Table 2.3 Design and operating conditions for dehydrogenation (shell side) reaction of
ethylbenzene to styrene.
Parameter Values and dimensions
Length of the reactor 3.0 m
Cross-sectional area of the
shell side 3.0 m
2
Feed molar flow rates of a:
Ethylbenzene 30.0 mole/s
Styrene 0.1861 mole/s
Hydrogen 0.0 mole/s
Benzene 0.03056 mole/s
Ethylene 0.0 mole/s
Toluene 0.2444 mole/s
Methane 0.0 mole/s
Carbon monoxide 0.0 mole/s
Carbon dioxide 0.0 mole/s
Steam 140.0 mole/s
Inlet temperature 850 K
Inlet pressure 4.5×10⁵
Pa
Catalyst density b 1500 kg/m
3
Diameter of catalyst particle 4.7×10³
m
Void fraction 0.48
a obtained from Abdulla and Elnashaie, (1993);
Moustafa and Elnashaie (2000); Elnashaie et. al (2000). b
obtained from Assabumrungrat et. al (2002).
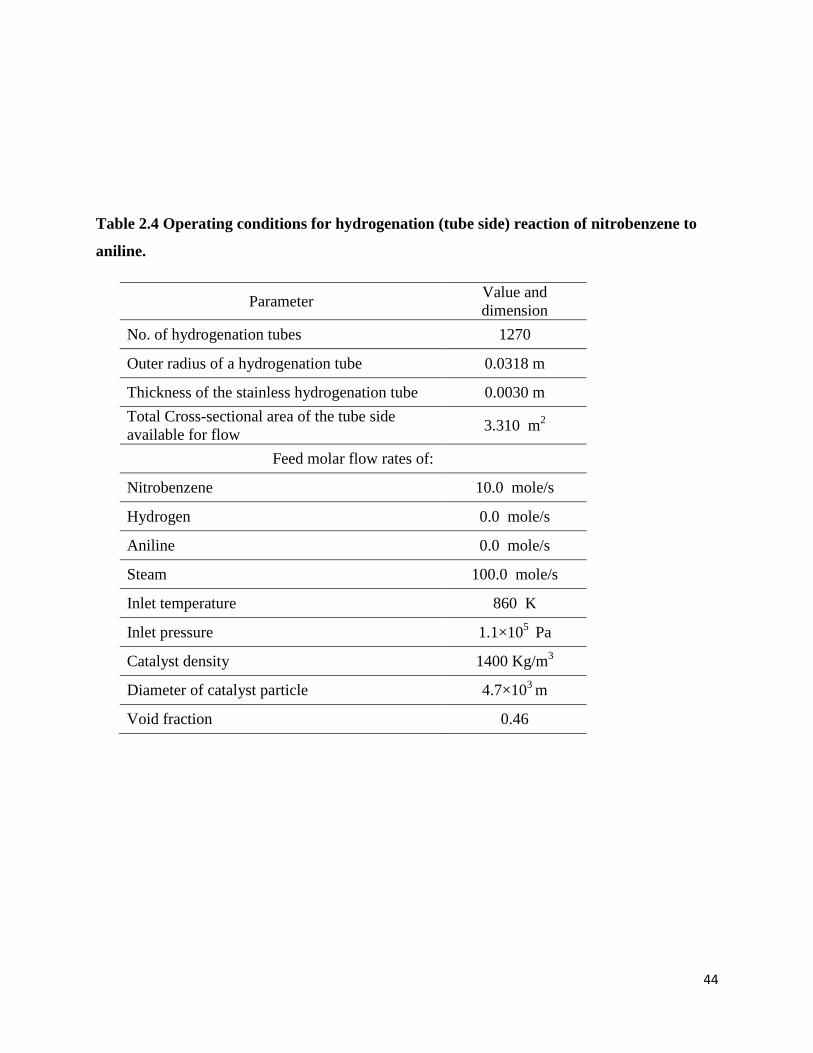
44
Table 2.4 Operating conditions for hydrogenation (tube side) reaction of nitrobenzene to
aniline.
Parameter Value and
dimension
No. of hydrogenation tubes 1270
Outer radius of a hydrogenation tube 0.0318 m
Thickness of the stainless hydrogenation tube 0.0030 m
Total Cross-sectional area of the tube side
available for flow 3.310 m
2
Feed molar flow rates of:
Nitrobenzene 10.0 mole/s
Hydrogen 0.0 mole/s
Aniline 0.0 mole/s
Steam 100.0 mole/s
Inlet temperature 860 K
Inlet pressure 1.1×10⁵
Pa
Catalyst density 1400 Kg/m3
Diameter of catalyst particle 4.7×10³
m
Void fraction 0.46

45
Figure 2.1 Schematic diagram showing integrated reactor configuration.
H2
Permeation
Heat
Transfer
Cross-section in the
reactor showing the
membrane tubes
Hyd
roge
natio
n of
Nitr
oben
zene
Deh
ydro
gena
tion
of E
thyl
benz
ene

46
Figure 2.2 Schematic diagram showing a differential element inside the membrane reactor.
z z+Δz
r1r2
r3
Hydrogenation of
Nitrobenzene to Aniline
Dehydrogenation of
Ethylbenzene to Styrene
ni ni
n’i n’i
Δzni ni
J’i
J’i
Q’
Q’
zr

47
Axial Coordinate, z (m)
0.0 0.5 1.0 1.5 2.0 2.5 3.0
Mola
r F
low
rate
of
Hydro
gen
(m
ole
s/s)
0
2
4
6
8
10
No membranes (Dehydrohenation of Ethylbenzene)
Membrane Cocurrent Configuration (Dehydrogenation Side)
Membrane Countercurrent Configuration (Dehydrogenation Side)
Membrane Cocurrent Configuration (Hydrogenation Side)
Membrane Countercurrent Configuration (Hydrogenation Side)
Figure 2.3 Molar flow of hydrogen on uncoupled adiabatic fixed bed and coupled cocurrent
and countercurrent cases of the novel membrane reactor. For operating conditions see
Tables 2.3 and 2.4. For countercurrent case, feed is from the right for the hydrogenation
compartment; otherwise all feeds are from the left.

48
Axial Coordinate, z(m)
0.0 0.5 1.0 1.5 2.0 2.5 3.0
Co
nv
ersi
on
of
Eth
ylb
enze
ne
0.0
0.1
0.2
0.3
0.4
0.5
0.6
0.7
No membranes
Membrane (Cocurrent Configuration)
Membrane (Countercurrent Configuration)
Figure 2.4 Comparison of ethylbenzene conversions on dehydrogenation side for uncoupled
adiabatic fixed bed and for coupled cocurrent and countercurrent cases. For operating
conditions, see Tables 2.3 and 2.4.
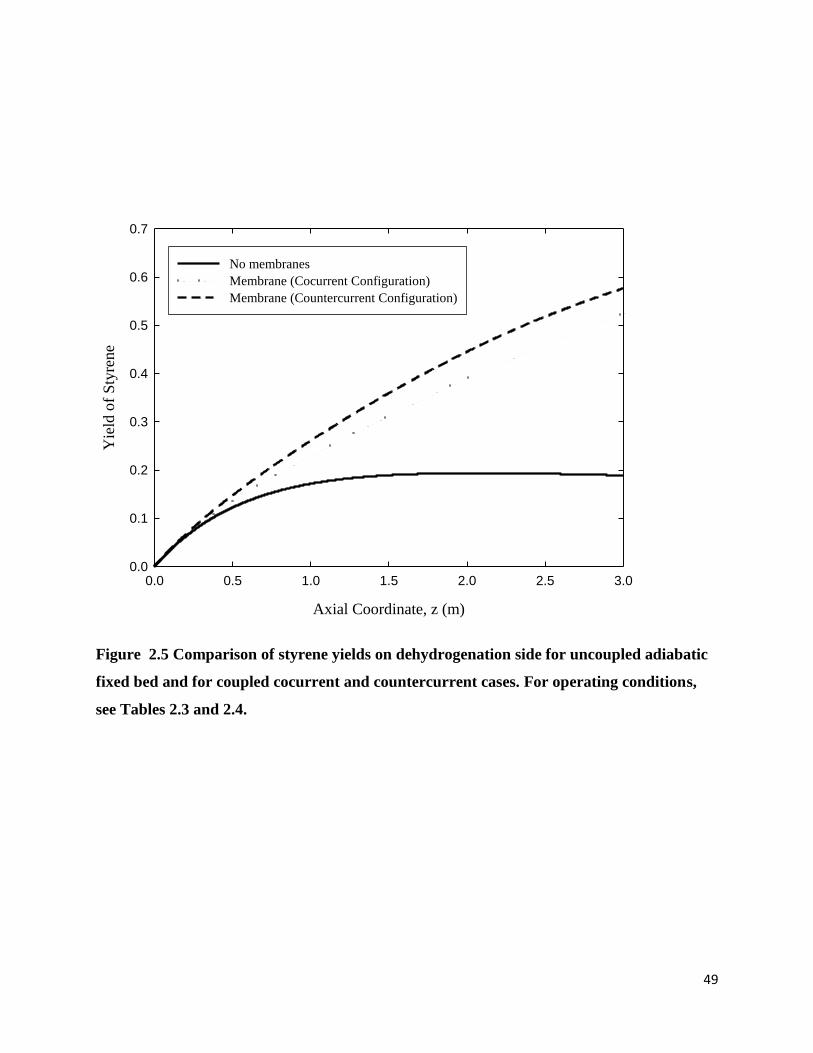
49
Axial Coordinate, z (m)
0.0 0.5 1.0 1.5 2.0 2.5 3.0
Yie
ld o
f S
tyre
ne
0.0
0.1
0.2
0.3
0.4
0.5
0.6
0.7
No membranes
Membrane (Cocurrent Configuration)
Membrane (Countercurrent Configuration)
Figure 2.5 Comparison of styrene yields on dehydrogenation side for uncoupled adiabatic
fixed bed and for coupled cocurrent and countercurrent cases. For operating conditions,
see Tables 2.3 and 2.4.

50
Axial Coordinate, z (m)
0.0 0.5 1.0 1.5 2.0 2.5 3.0
Co
nv
ersi
on
of
Nit
rob
enze
ne
0.0
0.1
0.2
0.3
0.4
0.5
0.6
0.7
Cocurrent Configuration
Countercurrent Configuration
Figure 2.6 Conversion of nitrobenzene on hydrogenation side for cocurrent and
countercurrent membrane reactor configurations. For operating conditions, see Tables 2.3
and 2.4.

51
Axial Coordinate, z (m)
0.0 0.5 1.0 1.5 2.0 2.5 3.0
Tem
per
ature
on E
thylb
enze
ne
Sid
e, (
K)
780
800
820
840
860
880
Tem
per
ature
on N
itro
ben
zene
Sid
e, (
K)
850
860
870
880
890
900
910
920
930
No Membrane 1270 tubes1300 tubes1400 tubes2500 tubes
Figure 2.7 Effect of number of hydrogenation tubes on temperature profiles in
dehydrogenation and hydrogenation compartments for the cocurrent case. For operating
conditions, see Tables 2.3 and 2.4.

52
Axial Coordinate, z (m)
0.0 0.5 1.0 1.5 2.0 2.5 3.0
Tem
per
ature
o
n E
thylb
enze
ne
Sid
e (K
)
780
800
820
840
860
880
Tem
per
ature
on N
itro
ben
zene
Sid
e (K
)
840
860
880
900
920
940
960
No membranes1270 tubes1300 tubes1400 tubes2500 tubes
Figure 2.8 Effect of number of hydrogenation tubes on temperature profiles in the
dehydrogenation and hydrogenation compartments for coupled countercurrent case. For
operating conditions, see Tables 2.3 and 2.4.
53
2.5. References
Abdulla, B. K., Elnashaie, S.S.E.H, (1993). A membrane reactor for the production of styrene
from ethylbenzene. Journal of Membrane Science, 85(3), 229-239.
Amon B., Redlingshofer H., Klemm E., Dieterich E., Emig G., (1999). Kinetic investigation of
deactivation by coking of a noble metal catalyst in the catalytic hydrogenation of
nitrobenzene using a catalytic wall reactor. Chemical Engineering and Processing,
38(4), 395-404.
Hermann Ch., Quicker P., Dittmeyer R., (1997). Mathematical simulation of catalytic
dehydrogenation of ethylbenzene to styrene in a composite palladium membrane
reactor. Journal of Membrane Science, 136 (1), 161-172.
Yaws C. (1999). Chemical Properties Handbook: Physical, Thermodynamics, Engironmental
Transport, Safety & Health Related Properties for Organic & Inorganic Chemical,
McGraw-Hill, New York, 1999.
Cavani F., Trifirò F., (1995). Alternative processes for the production of styrene. Applied
Catalyst, 133 (2), 219-239.
Froment G., Bischoff K. (1990). Chemical Reactor Analysis and Design. John Wiley and Sons:
New York.
Valladsen J., Michelsen M. L (1978). Solution of Differential Equation Models by Polynomial
Approximation. New Jersey, Prentice Hall.
Trefethen L. (2000). Spectral Methods in MATLAB. Society for Industrial and Applied
Mathematics. Philadelphia.
Abashar M.E.E., (2004). Coupling of ethylbenzene dehydrogenation and benzene hydrogenation
reactions in fixed bed catalytic reactors. Chemical Engineering and Processing, 43(10),
1195-1202.
Shu, Grandjean B.P.A., Kaliaguine S., (1994). Methane steam reforming in symmetric Pd- and
Pd-Ag/porous SS membrane reactor. Applied Catalyst, A119, 305-325.
Elnashaie S.S.E.H., Moustafa T., Alsoudani T., Elshishini S. S., (2000). Modeling and basic
characteristics of novel integrated dehydrogenation-hydrogenation membrane catalytic
reactors. Computer Chemical Engineering, 24(2), 1293-1300.

54
Assabumrungrat S., Suksomboon K., Praserthdam P., Tagawa T., Goto Sh., (2002). Simulation
of a Palladium Membrane Reactor for Dehydrogenation of Ethylbenzene. Journal of
Chemical Engineering of Japan, 35(3), 263-273.
Moustafa T. M., Elnashaie S.S.E.H., (2000). Simultaneous production of styrene and
cyclohexane in an integrated membrane reactor. Journal of Membrane Science, 178(1),
171-184.
She Y., Han J., Ma Y.H., (2001). Palladium membrane reactor for the dehydrogenation of
ethylbenzene to styrene. Catalyst Today, 67(1), 43-53.
Chen Zhongxiang, (2004). a Novel Circulating Fluidized Bed Membrane Reformer for Efficient
Pure Hydrogen Production for Fuel Cells From Higher Hydrocarbons. Auburn
University, PhD Thesis.

55
CHAPTER 3 OPTIMAL DESIGN OF AN AUTOTHERMAL MEMBRANE
REACTOR COUPLING THE DEHYDROGENATION OF
ETHYLBENZENE TO STYRENE WITH THE HYDROGENATION OF
NITROBENZENE TO ANILINE BASED ON PSEUDO-HOMOGENEOUS
MODEL†
3.1. Introduction
Styrene and aniline are important intermediate products in the petrochemical industry. Styrene is
used in the production of the polystyrene, acrylonitrile-butadiene-styrene resins (ABS), and a
variety of other polymers. Its commercial production is performed by the dehydrogenation of
ethylbenzene. This dehydrogenation reaction is reversible and thermodynamically limited with a
maximum achievable conversion of about 50% (Elnashaie et al. 2000). Aniline, on the other
hand, is used in, e.g. the synthesis of methylene diphenyl diisocyanate (MDI) and as an additive
in rubber processing. About 85% of global aniline is produced via a catalytic process using
metal-supported catalysts (Sangeetha et al. 2009). Because of their industrial importance, styrene
and aniline manufacturing plants have large capacities (estimated as 100,000 tons/year for
styrene). Hence, the investment cost in those plants is high, so that any small enhancement in the
process could yield significant financial rewards (Babu et al. 2005, Li et al. 2003).
To overcome the thermodynamic limitation on the dehydrogenation of ethylbenzene to styrene,
novel process designs involving membrane reactors have been proposed in recent years. In these
† A version of this chapter was published: Nabeel S. Abo-Ghander, Filip Logist, John R. Grace, Jan F.M.
Van Impe, Said S.E.H. Elnashaie, and C. Jim Lim 2010. Optimal design of an autothermal membrane
reactor coupling the dehydrogenation of ethylbenzene to styrene with the hydrogenation of nitrobenzene
to aniline, Chemical Engineering Science, 65(10), 3113-3127.

56
reactors, the reaction of interest is promoted by hydrogen-selective membrane walls which
remove hydrogen from the reaction chamber to a separate compartment where hydrogen is either
extracted by a sweep gas (Abdalla and Elnashaie, 1993, Abdalla and Elnashaie, 1994, Abdalla
and Elnashaie, 1995, Hermann et al. 1997) or reacted separately to generate another useful
product (Elnashaie et al. 2000, Moustafa and Elnashaie, 2000). The enhancements in conversion
of ethylbenzene and yield of styrene were predicted to be considerable. Among these possible
membrane reactors, the configuration proposed in chapter 2 is of special interest because it
allows the coupling with a second important industrial process. To improve the production of
styrene in such membrane reactors, it is crucial to seek an optimal design which considers
geometry, design and operational variables, since a small improvement could provide high
dividends to the petrochemical industry and consumers.
In view of this aim, mathematical models and optimization techniques are valuable tools.
However, this configuration involves several key elements to model the reactor, for example heat
transferred across the membrane walls by conduction, as well as diffusion of hydrogen from the
dehydrogenation side to the hydrogenation side.
Therefore, this chapter addresses the model based optimization of the design of the cocurrent
flow configuration of the fixed bed membrane reactor introduced by in chapter 2. A bi-objective
optimization problem with twelve (12) parameters is formulated and solved to obtain a Pareto
set. Afterwards, the designer will be able to select one design out of this set of equally good
reactors, based on his preferences. The optimization problem solved in this paper is unique
because it concerns the coupling of reactions in fixed bed membrane reactors, as well as the
production of two main chemical products, namely styrene and aniline.
The structure of this chapter is as follows. Section 3.2 reviews some interesting results reported
in literature with respect to model based reactor design optimization. Sections 3.3, 3.4 and 3.5
introduce for the fixed bed membrane reactor under study: the reactor configuration, the reaction
kinetics and the mathematical reactor model, respectively. Sections 3.5 and 3.6 describe the
optimization problem formulation and provide some details about the numerical solution

57
strategy. Section 3.7 discusses the obtained numerical results. Finally, Section 3.8 summarizes
the main conclusions.
3.2. Literature Review
In optimization problems, feasible solutions are sought which correspond to extremes of one or
more objective functions. This is important in early design stages of any chemical process where
process parameters have to be within certain limits and to satisfy certain constraints imposed by,
e.g. safety and environmental legislations. This type of problems has been addressed in the
literature by a number of researchers. For example, Sheel and Crowe (1969) modeled an existing
ethylbenzene dehydrogenation reactor and optimized its performance using a profit function
defined as the difference between the gain due to the production of styrene and fuel gases, i.e.
methane and ethylene, and the loss due to steam usage and by-products, i.e. toluene and benzene.
In the same study, the case of a double bed reactor was also considered. The decision variables
considered were the steam temperature, steam rate and reactor depth. It was concluded that the
reactor would work better if the constraints on both the temperature and steam flow were
relaxed. Clough and Ramirez (1976) studied the effect of injecting steam into a styrene reactor at
a point downstream of the reactor inlet. Optimization was performed to find the best injection
point considering a profit objective function defined as the difference between the market value
of the products and the utility cost. A styrene pilot plant was constructed and the results
confirmed the improvement predicted by the model.
In all of the previous studies, only a single objective was considered. However, in practice often
multiple and conflicting objective functions are present (see, e.g., Bhaskar et al. (2000) for an
overview until the year 2000). These optimization problems differ conceptually from the single
objective optimization problems. As a result of the conflicting objectives, there is no single
optimal solution, but rather a set of solutions which best satisfies all objectives. These solutions
are referred to as Pareto-optimal solutions. Broadly speaking, a feasible point is a Pareto-optimal
solution if it is impossible to improve one objective function without worsening at least one of
the others. The exact mathematical description can be found in, e.g. Das and Dennis (1998), or
Miettinen (1999).
58
For instance, Lim et al. (2001) optimized the production of methyl ethyl ketone (MEK) from the
dehydration of sec-butyl alcohol considering bi-objective functions, i.e. profit and environmental
functions. The problem was solved by an improved version of the normal boundary intersection
(NBI) method (Das and Dennis, 1998) which combined the original NBI method with the
summation of weighted objective functions. The enhanced method gave evenly-distributed
Pareto points and reliable optimization results, even in a non-convex region of the Pareto curve.
Li et al. (2003) treated the same problem as addressed by Clough and Ramirez (1976), but with
two objective functions. Both the adiabatic and steam-injected styrene reactors were considered,
while styrene production and styrene selectivity were taken as the objective functions of the
optimization problem. The problem was solved using a non-dominated sorting genetic algorithm
(NSGA) (Srinivas and Deb, 1995). Optimization of the reactor showed that the production and
selectivity of styrene could be improved compared to the current operating conditions after
obtaining reliable NSGA results. The multi-objective differential evolution algorithm was
introduced by Babu et al. (2005). This algorithm was applied to the optimization of the styrene
reactor, and the results were compared with those obtained from the NSGA. In the optimization
problem, three objective functions were considered, i.e. styrene production, styrene yield, and
styrene selectivity. The Pareto set based on the new algorithm was found to be much better than
that obtained by the NSGA, as reflected in the profit function. Tarafder et al. (2005a) studied the
optimization of a double-bed styrene manufacturing reactor and compared the results with those
for a single bed and steam-injected reactor. Three objective functions were considered, i.e.
styrene molar flowrate, styrene selectivity and total heat duty required by the process. The
problem was solved using elitist NSGA-II (Deb et al. 2002), which works more efficiently and
quickly than NSGA. The production of styrene in the double-bed reactor was higher than in the
other two reactors. The production of ethylene in an industrial ethylene reactor was investigated
by Tarafder et al. (2005b) considering two and three objective functions, i.e. conversion of
ethane, selectivity of ethylene, and flow rate of ethylene. The elitist NSGA-II algorithm was used
to solve the problem. 100% ethane conversion and more than 90% ethylene selectivity were
reported.
For catalytic membrane reactors, a multi-objective optimization problem was studied by Cheng
et al. (2008) for a methanol reactor and a hydrogen production reactor. The elitist NSGA-II

59
algorithm was again used to obtain an optimal solution with three objective functions, i.e.
product flowrate (methanol or hydrogen), reactant flowrates (hydrogen or methane), and exergy
loss of the reactor. The problem was solved to evaluate the effect of key membrane
characteristics like membrane thickness and membrane area per unit length on these objective
functions. More recently, Logist et al. (2009) reported the efficient generation of Pareto sets for
several (bio)chemical processes described by ordinary differential equations based on a
combination of (i) novel deterministic multiple objective optimization routines (i.e. Normal
Boundary intersection and Normalized Normal Constraint (Messac and Mattson, 2004)) and (ii)
an advanced deterministic multiple shooting optimization approach (Leineweber et al. 2003a,
Leineweber et al. 2003b).
3.3. Reactor Configuration
Figure 3.1 depicts the membrane reactor, with only one hydrogenation tube portrayed for
simplicity. There are two compartments separated by a hydrogen perm-selective membrane. The
outer compartment is for the dehydrogenation of ethylbenzene to styrene, while the
hydrogenation reaction of nitrobenzene to aniline takes place in the inner compartment. The
external wall of the outer shell is assumed to be adiabatic. Although this assumption cannot be
perfectly true, it is likely to be a good approximation for large industrial reactors with an
excellent outer insulation.
In simple fixed bed reactors in which ethylbenzene is continuously dehydrogenated, styrene,
hydrogen, and secondary products like benzene and toluene are produced, and the temperature
drops along the reactor length due to the endothermic reaction. In the membrane reactor
considered in Figure 3.1, hydrogen produced in the outer shell, diffuses through the hydrogen-
selective membranes to the inner compartment under the influence of the difference in hydrogen
partial pressures on the two sides. Inside the tubes, the diffused hydrogen encounters
nitrobenzene and steam in the presence of a hydrogenation catalyst, where it reacts via an
irreversible exothermic hydrogenation reaction. Heat produced by this reaction is transferred
from the tube compartment through the hydrogen-selective membrane walls to the shell
compartment where it provides the endothermic heat of the dehydrogenation of ethylbenzene.

60
The transfer of hydrogen from the shell compartment to the tube compartment, while heat flows
in the opposite direction, promotes the formation of more styrene. However, the heat transferred
from the tube compartment decreases the temperature and as a result lowers the rate of reaction.
3.4. Chemical Reactions and Kinetic Expressions
The main reactions taking place in the outer shell are listed below.
22563256 HCHCHHCCHCHHC 298
kJ117.6
moleH (3.1)
42663256 HCHCCHCHHC 298
kJ105.4
moleH (3.2)
435623256 CHCHHCHCHCHHC 298
kJ54.6
moleH (3.3)
2422 422 HCOHCOH 298
kJ210.2
moleH (3.4)
242 3HCOCHOH 298
kJ206.1
moleH (3.5)
222 HCOCOOH 298
kJ41.2
moleH (3.6)
The first reaction is the principal reaction in the shell, producing one mole of styrene per one
mole of ethylbenzene. This reaction is endothermic and reversible. It is favoured by high
temperatures and low pressures (Le Chatellier‘s principle). In most modern designs, this process
is carried out in three reactors in series, with heat supplied either by heating the reactants
entering each stage or by injecting hot steam with the feed stream. By applying this procedure,
the forward reaction can be boosted. In addition to producing styrene, there are two side
products, benzene and toluene, resulting from thermally cracking ethylbenzene at high
temperatures. These side reactions reduce the selectivity to styrene. On the other side of the
integrated reactor (tube side), a single reaction takes place where the diffused hydrogen reacts
with the feed steam consisting of nitrobenzene and steam in order to produce aniline.

61
OHNHHCHNOHC 22562256 23 298
kJΔH =-443.0
mole (3.7)
This hydrogenation reaction is irreversible and exothermic, with three moles of hydrogen
reacting with one mole of nitrobenzene in order to produce each mole of aniline. The heat of
reaction and the kinetic expressions for the reactions on both sides of the integrated reactor are
summarized in Tables 3.1 and 3.2.
3.5. Mathematical Reactor Model
To derive the model equations for the membrane reactor, a slice of infinitesimal length is
considered on both sides of the coupled reactor. Mass, energy and momentum balances are then
derived based on the following assumptions.
1. Steady state operation.
2. Ideal gas behavior on both sides.
3. Plug flow for the fixed beds on both the shell and tube sides, with axial mass Peclet numbers
estimated to be of order 1000.
4. Negligible axial heat dispersion, with axial heat Peclet numbers >> 1.0.
5. Pseudo-homogeneous one-dimensional model, radial Peclet number >> 1.0.
6. Catalyst deactivation is neglected.
7. Pressures along both compartments are calculated based on Ergun‘s equation.
The resulting mole, energy and pressure equations for both sides of the integrated reactor are
summarized in Table 3.3 where the balance equation on the hydrogenation side is for one tube.
The heat transfer from each hydrogenation tube across the membrane per unit length is estimated
assuming a composite circular tube with a convective heat resistance on the tube side, followed
by a conductive heat resistance due to the presence of a layer of stainless steel with a thickness of
0.0012 m, followed by another conductive heat resistance due to the presence of a palladium
layer with a thickness of 20×10-6
m, and finally a convective resistance on the shell side as
illustrated in chapter 2. The convective heat transfer coefficients on both sides of the reactors are

62
calculated using the correlations accompanying the heat transfer equation in Table 3.3, assuming
that the reacting mixture on the dehydrogenation side is always heated, while that on the
hydrogenation side is always cooled (Froment and Bischoff, 1990). The total heat exchanged
between the two sides of the coupled reactor, i.e. the dehydrogenation side and hydrogenation
side, is estimated by multiplying the total number of hydrogenation tubes by the heat released
from a single hydrogenation tube.
3.6. The Optimization Problem
In the current thesis, two objective functions are considered and split between the
dehydrogenation and the hydrogenation sides. On the dehydrogenation side, the requirement is to
maximize the yield of styrene, whereas that on the hydrogenation side is to maximize the
conversion of nitrobenzene. The two objective functions may then be defined as:
Maximize:
0
0
EB
STST
STn
nLn
FedneEthylbenzeofMoles
ProducedStyreneofMolesY
(3.16)
Maximize:
0
0
NB
NBNB
NBn
Lnn
FedneNitrobenzeofMoles
ReactedneNitrobenzeofMolesX
(3.17)
Maximization of the conversion of nitrobenzene on the hydrogenation side results in maximizing
the production of aniline on the same side. Twelve decision variables are considered, i.e. the feed
molar flowrate of ethylbenzene on the dehydrogenations side nEBo, the steam-to-ethylbenzene
ratio SOR, the feed temperature on the dehydrogenation side Tf, the feed pressure on the
dehydrogenation side Pf, the feed molar flowrate of nitrobenzene on the hydrogenation side nNBo,
the steam-to-nitrobenzene ratio SOR', the feed temperature on the hydrogenation side Tf', the
feed pressure on the hydrogenation side Pf', the number of hydrogenation tubes N, the area-
equivalent diameter on the dehydrogenation side D, the diameter of the membrane tube Dt, and
the reactor length L. However, the solutions of the above mentioned problem are required to
satisfy the several constraints:

63
1. The feed molar flowrate of ethylbenzene on the dehydrogenation side is taken to be
between -25% and 10% of the nominal value of 10.24 moles/s. These bounds are
consistent with the industrial case since the plant can operate at a much lower capacity,
but not at a much higher capacity (Yee et al. 2003).
7.66 11.27EBfn mole/s (3.18)
2. The lower limit on the steam-to-ethylbenzene ratio is set as 7 to prevent coke formation
on the catalyst surface. At the same time, too much steam cannot be used because it
would make the process economically unfeasible. As for industrial practice, the upper
limit is set to 20 (Yee, et al, 2003).
7.0 20.0SOR (3.19)
3. The lower bound on the feed temperature on the dehydrogenation side is set at 780 K to
ensure that the reacting mixture is not too cold for the reaction to occur, while the upper
limit is set at 915 K to protect the membrane.
780 900fT K (3.20)
4. Although the dehydrogenation of ethybenzene to styrene is favoured at lower pressures,
it is important to work at a relatively higher pressure to create a favorable driving force
for hydrogen permeation through the membrane. The lower limit on the feed pressure is
chosen as 1.0 bar while its upper limit is set at 4.0 bar to prevent violation of the ideal gas
law and to avoid costly pressure vessel designs.
1.0 4.0fP bar (3.21)
5. The maximum amount of hydrogen which can be produced based on these bounds (3.18)
is 11.27 mole/s. From the stoichiometry of the hydrogenation equation, each mole of

64
nitrobenzene needs to react with three mole of hydrogen arriving from the
dehydrogenation side. Hence, the maximum amount of nitrobenzene that can react with
the diffused hydrogen is around ~3.77 mole/s. The molar flowrate of nitrobenzene in a
single hydrogenation tube, considering an average of 1750 tubes, is ~0.002 moles/s. This
limit neglects the hydrogen produced from side reactions, i.e. reactions (3.4), (3.5), and
(3.6). Consequently, the upper limit is set at 0.005 mole/s to allow for any additional
hydrogen produced, so that:
0.002 0.005NBfn mole/s (3.22)
6. Bounds on the steam-to-nitrobenzene ratio are set so that:
2.0 4.0SOR (3.23)
7. Bounds on the feed temperature on the hydrogenation side are chosen as:
780 900fT K (3.24)
8. Bounds on the feed pressure on the hydrogenation side are established at:
1.0 4.0fP bar (3.25)
9. Hydrogen flux and rate of heat transfer from the hydrogenation side to the
dehydrogenation side can be greatly enhanced by increasing the number of hydrogenation
tubes (i.e. increasing the contact surface area), but an excessive number of tubes would
escalate manifolding issues and cost. Hence, the number of hydrogenation tubes is
bounded by:
1000 2500N (3.26)

65
10. The area-equivalent diameter on shell side is set to be within the limits chosen by Li et al.
(2003a):
1.95 3.0D m (3.27)
11. Bounds on the diameter of the hydrogenation tube are specified as:
2 22.5 10 5.5 10tD m (3.28)
12. To limit the reactor length, we require that:
1.5 4.0L (3.28)
13. To ensure that heat is always transferred from the hydrogenation side to the
dehydrogenation side, the following constraint is adopted:
0.0f fT T K (3.29)
14. To ensure that hydrogen is always transferred from the dehydrogenation side to the
hydrogenation side, we stipulate that:
0.0f fP P bar (3.30)
15. Palladium membranes are currently limited to temperatures lower than about 923 K.
Hence, the temperature along the hydrogenation side is required to be less than or equal
to 915 K in order to ensure the durability and sustainability of the membranes.
max
0
915.0 0.0z L
T z
K (3.31)

66
16. It is important to achieve autothermality on the dehydrogenation side. This leads to the
following nonlinear equality constraint to ensure that the outlet temperature of the
dehydrogenation side is equal to the feed temperature of the dehydrogenation side:
0.0fT T L K (3.32)
The entire optimization problem can now be formulated as the following multiple objective
dynamic optimization problem.
Maximize: )(pJ
Subject to: pxfx
,dz
d with 0)0( xx z
ULppp (3.33)
0Αp
0pc eq
0pc ineq
where:
T
p EBf f f NBf f f t tn ,SOR ,T ,P ,n ,SOR ,T ,P ,N ,D ,D ,L ,
NB
ST
X
YpJ ,
pxfx
,dz
dis the reactor model described by equations (8) to (13),
-27.66,7,780,1.0,0.02,2.0,780,1.0,1000,1.95,2.5 10 ,1.5T
pL
T-211.27,20,900,4.0,0.05,4.0,900,4.0,2500,3.0,5.5 10 ,4.0p
U
000010001000
000001000100A ,
LTT feq pc

67
max
0
915.0c pineq
z L
T z
All other variables not included in the decision variable vector p are maintained at their
industrial values as specified in Table 3.4.
3.7. Details of the Numerical Solution
To solve the above mentioned problem numerically, a number of approaches can be tried. The
most common approach is the weighted sum (WS) method. It starts by linearly combining all
objective functions of interest using weight vectors, and then solving the system considering the
constraints. However, the WS fails to obtain solutions in non-convex regions of the Pareto set,
and the Pareto optimal solutions generated are not necessarily evenly-distributed (even if the
weight is varied evenly (Das and Dennis, 1997)).
Alternatively, multi-objective evolutionary strategies (EAs) and genetic algorithms (GAs) (Deb,
2001) have been successfully adopted by a number of researchers. GAs are based on the
Darwinian theory of evolution while EAs are modified versions of GAs in which different
operators are used to generate the candidate solutions, e.g. mutation, recombination,
reproduction, and selection. However Messac et al. (2003) mentioned that methods from these
classes may suffer from lack of producing well-distributed Pareto solutions.
Hence, the Normalized Normal Constraint (NNC) method and the Normal Boundary Intersection
(NBI) method, introduced by Messac and Mattson, (2004), Messac et al. (2003) and Das and
Dennis, (1998), have been used to solve the bi-objective optimization problems under study.
These deterministic methods are easy to implement and able to produce evenly-distributed
(local) Pareto solutions in a limited amount of time. Both methods suffer, however, from
producing non-Pareto optimal solutions, but these can be removed by applying a Pareto filter.
To solve the problem at hand, both the NNC and NBI methods have been implemented in Matlab
to obtain the Pareto frontier. A Pareto filter has been applied to remove all non-Pareto points.
68
Since optimization solvers are mostly designed for minimization problems, the problem of
maximizing the objective functions defined in equations (3.16) and (3.17) has been first
transformed into a minimization problem by introducing the following generic functions for both
objectives:
SY
SYY
J
1
1 (3.34)
NB
NBX
J
1
1 (3.35)
Minimization of equations (3.34) and (3.35) results in maximizing the styrene yield on the
dehydrogenation side and the nitrobenzene conversion on the hydrogenation side. To evaluate
the generic function defined by equations (3.34), and (3.35), model equations (3.8) to (3.13) have
been solved numerically considering equations (3.14), and (3.15). For the cocurrent
configuration of the catalytic reactor, these model equations form a set of initial value problems
which can be solved by any integrating subroutine for given initial conditions. The Matlab
integrator ode15s has been employed with a relative tolerance of 1×10⁻¹⁰
to ensure accuracy. To
apply the NNC and NBI methods, it was required that anchor points be found which correspond
to the best possible values for the respective individual objectives. Then, the utopia point was
found which corresponds to all objectives simultaneously being at their best possible values.
While the utopia point was used to normalize the system objective functions defined by (3.34)
and (3.35), the anchor points have been used to construct the utopia line. This utopia line was
divided into forty (40) segments, with an optimization problem solved at each segment. Two
commercial solvers purchased from Tomlab have been utilized to solve the resulting
optimization problems. Those solvers were linked to the reactor model equations as shown in
Figure 3.2. Each solution cycle was started with the global glbDirect solver, and was finished
with the local snopt solver. At the beginning, the global solver glbDirect was run for 100
iterations, and then its output was used to initiate the local solver snopt which converged to the
feasible solution. It should also be noted that the solutions with both techniques, i.e. NNC and
NBI, have been obtained independently, with the same problem solved assuming that no solution

69
was at hand, i.e. none of the solutions have been used to provide a starting guess for any other
technique.
3.8. Results and Discussion
The optimization study has been carried out on an industrial scale catalytic membrane reactor
integrating the dehydrogenation of ethylbenzene to styrene with the hydrogenation of
nitrobenzene to aniline. Catalyst properties, such as bulk densities and particle diameters for both
reactions, have been assumed to be uniform on both sides of the integrated catalytic membrane
reactor. The molar flowrates of other components in the dehydrogenation feed stream, i.e.
styrene, benzene, and toluene, have been treated as impurities at their industrial levels, as shown
in Table 3.4.
To confirm the optimization results, two numerical techniques have been implemented, namely
the NNC and NBI methods. The results from both numerical techniques were filtered using a
Pareto filter in order to remove all non-Pareto optimal points from the solution set.
The Pareto optimal solution set corresponding to the simultaneous maximization of styrene yield
and nitrobenzene conversion is plotted in Figure 3.3. Both NNC and NBI methods gave the same
Pareto optimal set which is a favorable sign of confirmation for both the reliability and
correctness of the results. It can be also seen that along the Pareto set, while one objective
improves, the other worsens, causing none of the solutions to dominate over the others. This
makes all solutions of the Pareto set equally good. Hence, the final decision of the reactor design
and operating point should be based on additional information which normally depends on either
experience or site specifications. From the results, it is possible to optimally design the integrated
catalytic membrane reactor to provide a 97% styrene yield and 20% nitrobenzene conversion at
one extreme, and a 47% styrene yield and 80% nitrobenzene conversion at the other extreme. In
between, a gradual evolution of both objectives is mostly observed, whereas a gap in the
conversion of nitrobenzene is present when the yield of styrene is about 0.55. This gap appeared
after filtering the results of the optimal solutions so that all local or non-Pareto design parameters
70
were removed. The removed design parameters are dominated by the upper part of the Pareto
solution in which the design parameters result in better reactor performance.
To quantify the role of the decision variables in realizing the objectives, the decision variables
are plotted in Figures 3.4 to 3.7. Although the general trend is always clear, some ‗scatter‘ may
be present in some plots. Its presence reflects the fact that in certain regions, some of the
decision variables have a limited influence on the cost functions, which makes the exact
determination of the optimal values hard. However, it should be emphasized that, as their
influence on the costs is only limited, an exact determination is not required for industrial
practice.
In Figure 3.4a and 3.4b, the styrene yield and nitrobenzene conversion are plotted against the
feed molar flowrate of ethylbenzene, illustrating the conflicting nature of both objectives. The
styrene yield decreases sharply at a low ethylbenzene flowrate, scatters after that for a wide
spectrum of ethylbenzene flowrates with a styrene yield mean value of 65%, and finally
decreases sharply at higher flowrates. A qualitative explanation is that as the molar flowrate of
ethylbenzene increases, the rates of the side reactions become significant because their reaction
rates are directly proportional to the partial pressure of ethylbenzene. Also, the residence time
decreases, leading to an unfinished reaction, negatively affecting the styrene yield on the
dehydrogenation side. On the other hand, increasing the ethylbenzene flowrate has a positive
effect on nitrobenzene conversion. This increase continues until a level of 50% nitrobenzene
conversion is reached where the effect becomes almost insignificant. Then, at higher flowrates
the nitrobenzene conversion increases sharply until an upper ceiling of about 80% nitrobenzene
conversion is reached. This is because when the molar flowrate of ethylbenzene increases, the
production of hydrogen becomes significant due to the contribution from the side reactions.
Consequently, more hydrogen is available for transfer to the hydrogenation side.
In Figures 3.4c and 3.4d, the yield of styrene and the nitrobenzene conversion are plotted against
the steam-to-ethylbenzene molar ratio. High styrene yields can be favored by operating the
dehydrogenation side at a low ratio of 7.0, whereas high nitrobenzene conversions are induced
by operating the dehydrogenation side at a high ratio of 20.0. The styrene yield is high at low

71
steam-to-ethylbenzene ratios because the production of hydrogen from the steam reactions
becomes insignificant, in turn suppressing the backward reaction of the main reaction producing
styrene. The nitrobenzene conversion is favored by a high steam ratio on the dehydrogenation
side because there will be more hydrogen produced in that reaction chamber, leading to
increasing the amounts of hydrogen transferred to the hydrogenation side.
The effects of the dehydrogenation feed temperature on styrene yield and nitrobenzene
conversion are plotted in Figures 3.4e and 3.4f. The feed temperature on the dehydrogenation
side shows a conflicting effect on both objectives: as the feed temperature on the
dehydrogenation side increases, the styrene yield increases, whereas the nitrobenzene conversion
decreases. The styrene yield approaches the limit of 97% because the forward reaction producing
styrene is favored by high temperatures as well as by receiving heat from the hydrogenation
chamber transferred from the hydrogenation reaction. Although this phenomenon helps breaking
the endothermality of the dehydrogenation side, and producing a high styrene yield, it also
creates a drop in temperature inside the hydrogenation side, leading to low nitrobenzene
conversions.
The feed pressure on the dehydrogenation side also shows a conflicting effect on both objectives
as shown in Figures 3.5a and 3.5b: as it increases, the styrene yield increases, but the
nitrobenzene decreases. This occurs because increasing the feed pressure creates a significant
driving force for the transfer of hydrogen from the dehydrogenation side to the hydrogenation
side leading to higher styrene yields. However, as the styrene is produced on the
dehydrogenation side, the temperature drops, creating a significant temperature gradient between
the two compartments and helping to transfer more heat from the hydrogenation side, which
reduces the nitrobenzene conversion.
The effect of the feed molar flowrate of nitrobenzene on both objectives is plotted in Figures
3.5c and 3.5d. As the molar flowrate of nitrobenzene on the hydrogenation feed stream increases,
the styrene yield increases because of a larger heat transfer between the two compartments.
However, the heat transfer has a negative effect on the conversion of nitrobenzene as it reduces
the temperature inside the tubes, causing the hydrogenation reaction to take place at a lower
72
temperature. Increasing the molar flowrate of nitrobenzene in the feed stream of the
hydrogenation side leads to an unfinished reaction which reduces the nitrobenzene conversion.
The effect of steam-to-nitrobenzene ratio plotted in Figures 3.5e and 3.5f shows no effect, as this
parameter mainly reduces the temperature along the hydrogenation side and maintains it below
915.0 K by diluting the reacting mixture on the hydrogenation side. Note that the optimum value
corresponds to the boundary.
The effect of the feed temperature of the hydrogenation feed on both objectives is the same as
that of the dehydrogenation side and is plotted in Figures 3.6a and 3.6b. As the feed temperature
of the hydrogenation side increases, more heat is produced on the hydrogenation side due to the
reaction. However, the heat produced transfers across the membrane to break the endothermality
on the dehydrogenation side, resulting in a high styrene yield and low conversion of
nitrobenzene (due to a lower production of aniline on the hydrogenation side). The similar
behavior of the feed temperature of the dehydrogenation and the feed temperature of the
hydrogenation side may result from applying too many constraints on the temperatures on both
sides, i.e. constraints (3.29), (3.31), and (3.32). These constraints favor optimal designs in which
both sides of the reactor operate at the same feed temperature.
In Figure 3.6c and 3.6d both objectives are plotted against the pressure of the hydrogenation
feed. There is scatter visible with respect to both objectives. A low feed pressure on the
hydrogenation side of 1.0 bar is preferred in order to increase the yield of styrene to around 75%,
while a styrene yield of 97% can be achieved at a pressure of about 4.0 bar. For the nitrobenzene
conversion, it is preferable to operate the reactor at a pressure as low as 1.0 bar in order to
achieve a conversion of 80%. A higher pressure lowers the conversion to 20%.
The effect of the number of hydrogenation tubes with regard to both objectives is depicted in
Figures 3.6e and 3.6f. The values are scattered, with an increasing trend in general for the yield
of styrene as a function of the number of tubes. For the nitrobenzene conversion, the trend is also
scattered but reversed, i.e. increasing the number of hydrogenation tubes decreases the
nitrobenzene conversion. A qualitative explanation is that, as the number of the hydrogenation

73
tubes increases, the rate of the heat transfer across the membrane increases, leading to more
styrene production on the dehydrogenation side. However, removal of hydrogen from the
dehydrogenation side makes the effect of the endothermic dehydrogenation reaction significant,
to the extent that the dehydrogenation side eventually acts as a ―heat sink‖. Consequently, heat is
transferred at a significant rate from the hydrogenation side which acts as a heat source, causing
the kinetic rate to decrease and, as a result, a drop in the nitrobenzene conversion is observed.
In Figure 3.7a and 3.7b, the effect of the area-equivalent diameter on shell side is plotted against
both objectives. For the yield of styrene, there is scatter, with an increasing trend in general. To
increase the yield of styrene on the dehydrogenation side, a higher area-equivalent diameter on
shell side is required, leading to a higher residence time. However, increasing the area-equivalent
diameter on shell side leads to decreasing the conversion of nitrobenzene because more heat will
be transferred to break the endothermality of the dehydrogenation side.
The effect of the hydrogenation tube diameter on both objectives is displayed in Figures 3.7c and
3.7d. The behavior is scattered with mixed trends. The yield of styrene increases in general as the
diameter of the hydrogenation tubes increases, whereas the nitrobenzene conversion decreases.
Increasing the diameter of the hydrogenation tube enhances both the rate of hydrogen removal
from the dehydrogenation side and heat transfer across the membrane from the hydrogenation
side to the dehydrogenation side by increasing the surface area available for both fluxes.
Consequently, styrene is produced at a higher rate on the dehydrogenation side, causing the
temperature to drop and the dehydrogenation side to act eventually as a heat sink. This results in
decreasing the rate of hydrogen transfer to the hydrogenation side and in increasing the rate of
heat transferred from the hydrogenation compartment. Consequently, a drop in nitrobenzene
conversion is observed.
In Figure 3.7e and 3.7f, both objectives are plotted against the length of the catalytic reactor.
Both show no trend with this variable, and the searching subroutine is limited by the variable
bounds.

74
To illustrate the differences in optimal designs of the membrane reactor, three solutions located
along the Pareto set have been chosen. For these solutions, the reactor profiles for the styrene
yield, the nitrobenzene conversion and the temperatures on both sides have been plotted in
Figure 3.8a and 3.8b. The three solutions, whose numerical values are listed in Table 3.5,
represent the case where: (i) styrene is the product of overriding importance (solution A), (ii)
both styrene and aniline are equally important (solution B), and finally (iii) aniline is the product
of overwhelming importance (solution C).
For solution A, the yield of styrene increases monotonically along the reactor on the
dehydrogenation side until it reaches around 97%, while the conversion of nitrobenzene cannot
achieve more than 21% on the hydrogenation side. The temperature along the dehydrogenation
reaction decreases in the first part of the reactor due to the endothermality of the reactions, but it
then recovers as a result of the transfer of heat from the hydrogenation side to the
dehydrogenation side through the hydrogen membrane wall. The exit temperature of the
dehydrogenation side is exactly the same as the feed temperature, indicating the satisfaction of
the imposed nonlinear autothermality constraint. The temperature on the hydrogenation side
increases at the beginning of the reactor due to the reaction with diffused hydrogen, but it
decreases later due to the transfer of the heat to the dehydrogenation compartment.
For solution B, the styrene yield and nitrobenzene conversion increase on both sides of the
reactor compartments until a styrene yield of 56% and a nitrobenzene conversion of 55% are
achieved. The temperature profiles on both sides of the reactor are similar to those in solution A.
For solution C, the production of aniline is higher than that of styrene, i.e. 80% nitrobenzene
conversion and 49% styrene yield, with no structural differences observed in the temperature
profiles on both sides of the reactor compared to solutions A and B. Note that the maximum
temperature on both sides of the reactor does not exceed 915 K, thereby protecting the durability
of the membranes.

75
3.9. Sensitivity Analysis Based on Pseudo-Homogeneous Model:
The effects of some key operating variables including the feed temperature and feed pressure of
the dehydrogenation side, feed temperature and feed pressure of the hydrogenation side and
number of hydrogenation tubes on the styrene yield and nitrobenzene conversion are plotted in
Figure 3.9. In this analysis, the effect of each variable has been studied independently while
keeping all other variables constant at the nominal values summarized in Table 3.6.
Increasing the feed temperature of the dehydrogenation side enhances both the styrene yield and
the nitrobenzene conversion of the coupled reactor as shown in Figure 3.9a. However, it is
noticed that above ~910K, the styrene yield drops due to the significance of the reverse reaction.
The improvement of the nitrobenzene conversion on the hydrogenation side results from the fact
that more hydrogen is available for permeation from the dehydrogenation side to the
hydrogenation as the dehydrogenation feed temperature increases.
The effect of the feed pressure on the dehydrogenation on both the styrene yield and
nitrobenzene conversion is shown in Figure 3.9b. As the feed pressure on the dehydrogenation
side increases, the styrene yield and nitrobenzene conversion increase due to the increase in
permeation rate resulting from the larger driving force between the two sides of the coupled
reactor.
Figure 3.9c plots the effect of increasing the feed temperature of the hydrogenation side on the
styrene yield and nitrobenzene conversion. It is seen that as the feed temperature of the
hydrogenation side increases, both the styrene yield and the nitrobenzene conversion increase
because the rates of hydrogen permeation and heat transfer are enhanced between the two sides,
i.e. high temperature on the hydrogenation side enhances the rate of heat transfer to the
dehydrogenation side so that more styrene yield and hydrogen are produced.
Increasing the feed pressure of the hydrogenation side as shown in Figure 3.9d has an
insignificant effect on both the styrene yield and the nitrobenzene conversion. Increasing the feed

76
pressure of the hydrogenation side results in a pressure profile which can prevent hydrogen from
diffusing from the dehydrogenation side to the hydrogenation side.
The effect of increasing the number of hydrogenation tubes on both styrene yield and
nitrobenzene conversion is shown in Figure 3.9e. As the number of hydrogenation tubes
increases, the rate of heat transfer between the two sides of the coupled reactor is enhanced due
to the increase in the surface area. This causes the styrene yield on the dehydrogenation side to
increase, but the nitrobenzene conversion drops due to the slower reaction.
3.10. Conclusions
In this work, an optimal design of a catalytic membrane coupling dehydrogenation of
ethylbenzene to styrene with hydrogenation of nitrobenzene to aniline has been obtained. To
achieve this goal, a bi-objective optimization problem with linear and nonlinear constraints has
been formulated. The focus has been on maximizing the styrene yield on the dehydrogenation
side while simultaneously maximizing the nitrobenzene conversion on the hydrogenation side.
Bounds and constraints with real industrial values have been imposed on both operational and
design variables. Two numerical techniques, i.e. the normalized normal constraints (NNC)
method and the normal boundary intersection (NBI) method, have successfully solved the
problem giving evenly distributed Pareto solutions after applying a Pareto filter. Both techniques
gave the same Pareto set although the optimization problems have been solved independently.
From this Pareto set, it is seen that there exist two classes of reactor designs with styrene yields
and nitrobenzene conversions going from values of about 50% and 80% when nitrobenzene
conversion is focused on, to values of about 97% and 20% when the styrene yield is emphasized.
The different optimal designs have been illustrated for the coupled catalytic fixed bed membrane
reactor and the effects of different decision variables have been explained qualitatively. From the
present Pareto optimal results, the designer will be able to select one design for the coupled
reactor based on his personal preferences. Hence, these results are very valuable for the
procedure of designing a reactor in which both reactions are integrated. Based on the sensitivity
analysis, the degree of complexity of the optimization problem may be reduced by fixing some
variables at limiting values and searching for optimal values for the remaining ones.

77
Table 3.1 Summary of stoichiometric equations, heats of reactions and reaction rate expressions.
Chemical Reaction Heat of Reaction Kinetic Equation Reference
1. Reactions on Dehydrogenation Side a
22563256 HCHCHHCCHCHHC mole
kJ117.6ΔH298 2
1 1
ST H
EB
A
p pr k p
K
Elnashaie et al. (1993)
42663256 HCHCCHCHHC mole
kJ105.4ΔH298
EBpkr 22 Elnashaie et al. (1993)
435623256 CHCHHCHCHCHHC mole
kJ54.6ΔH298
23 3 EB Hr k p p Elnashaie et al. (1993)
2422 422 HCOHCOH mole
kJ210.2ΔH298
2 2 4
1 2
4 4 H O C Hr k p p Elnashaie et al. (1993)
242 3HCOCHOH mole
kJ206.1ΔH298
2 45 5 H O CHr k p p Elnashaie et al. (1993)
222 HCOCOOH mole
kJ41.2ΔH298 COOH pp
T
Pkr
2366
Elnashaie et al. (1993)
2. Reaction on Hydrogenation Side b
OHNHHCHNOHC 22562256 23 mole
kJ443.0ΔH298 2
22
22
1 HHNBNB
HNBHNB
pKpK
ppKKkr
Amon et al. (1999)
a partial pressures are given in (bar)
b partial pressures are given in (kPa)

78
Table 3.2 Numerical values of kinetic pre-exponential constants and activation
energies.
Reaction kioa Ei (kJ/kmole) Reference
3.1b 8.32×10
3 0.909×10
5
Elnashaie et al. (1993)
3.2 4.23×10⁹ 2.080×10
5
3.3 6.13×10³ 0.915×10
5
3.4 3.95×10³ 1.040×10
5
3.5 1.42×10² 0.657×10
5
3.6 5.80×10¹²
0.736×10⁵
3.7c
1.86×10⁻⁴
10.0×10³ Amon, et al (1999)
a )exp(
36
10
RT
Ekk i
ioi , where kio is the pre-exponential factor, for 61 i
)exp(103
RT
Ekk i
ioi , for 7i .
b The equilibrium constant is calculated by: )exp(
RT
FK A
, where:
2cTbTaF ,
23 /10194.2,/27.126,16.122725 KcKba c kPaK NB
21051.1 , 5.014.02
kPaK H

79
Table 3.3 Model equations for integrated catalytic membrane reactor.
Balance
Equations Mathematical Expressions Equation
Dehydrogenation Side
Mole iiscsj
jiji JNarAr
dz
dn3
6
121
(3.8)
Energy
6
1
10
1
1j cs sj j
i ii
H T r A NQdT
dz n Cp
(3.9)
Pressure
G
DDg
G
dz
dP
p
g
pcg
75.111501
3
(3.10)
Hydrogenation Side (per tube)
Mole iiscsii JarAr
dz
nd321
(3.11)
Energy
4
1
13 12
iii
i
i
T
T
scsiii
pCn
QArTHdTCpJar
dz
Td
(3.12)
Pressure
G
DDg
G
dz
Pd
p
g
pcg
75.111501
3
(3.13)
Hydrogen diffusion from one hydrogenation tube per unit length
Diffusion of
Hydrogen
across the
Membrane
22
2
2
2
,exp
HHH
PH
o
H PPRT
EQ
J
where: -03107.29oQ (mole.m)/(m
2.min.atm
0.5), 61025
2
H m
3, 105.20
2PHE J/mole
(3.14)
Heat transfer from one hydrogenation tube per unit length
Heat
Transferred
across the
Membrane
hr
r
r
r
k
r
r
r
k
r
h
TTrQ
Pdss 2
1
2
31
1
21
1
lnln1
2
where:
88.22ssk W/m×K, 3.93Pdk W/m×K
t
p
g
p
g
t
D
DGD
k
hD 6exp813.0
9.0
t
p
g
p
g
t
D
DGD
k
Dh 6.4exp50.3
7.0
(3.15)

80
Table 3.4 Values of constant variables in the optimization problem.
Dehydrogenation Side
Item Value Unit
Styrene molar feed flowrate 0.1861 mole/s
Benzene molar feed flowrate 0.0306 mole/s
Toluene molar feed flowrate 0.2444 mole/s
Catalyst density 2146.3 kg/m3
Catalyst particle diameter 4.7×10⁻³
m
Bed voidage 0.48 ---
Hydrogenation Side
Catalyst density 1400 kg/m3
Catalyst particle diameter 3.6×10⁻³
m
Bed voidage 0.46 ---

81
Table 3.5 Representative solutions for the Pareto frontier.
Parameter Optimal Solution A Optimal Solution B Optimal Solution C
Value Unit Value Unit Value Unit
Deh
yd
rogen
ati
on
Sid
e
Feed Molar of Ethylbenzene 7.66 mole/s 9.36 mole/s 11.27 mole/s
Steam-to- Ethylbenzene Ratio 7.00 --- 7.00 --- 20.00 ---
Feed Temperature on Shell Side 825.41 K 780.00 K 820.02 K
Feed Pressure on Shell Side 4.00 bar 2.52 bar 4.00 bar
Hyd
rogen
ati
on
Sid
e
(on
e tu
be)
Feed Molar of Nitrobenzene 0.005 mole/s 0.002 mole/s 0.002 mole/s
Steam-to- Nitrobenzene Ratio 4.00 --- 4.00 --- 4.00 ---
Feed Temperature on Tube Side 825.41 K 780.00 K 820.02 K
Feed Pressure on Tube Side 3.62 bar 1.00 bar 1.00 bar
Dim
ensi
on
al
Va
ria
ble
s
No. of Hydrogenation Tubes 2500 tubes 1582 tubes 1000 tubes
Area-Equivalent Diameter on
Dehydrogenation Side 3.00 m 2.39 m 1.95 m
Diameter of Hydrogenation Tube 0.048 m 0.035 m 0.040 m
Reactor Length 4.00 m 4.00 m 4.00 m
Ob
ject
ive
fun
ctio
ns
Yield of Styrene 0.975 --- 0.564 --- 0.491 ---
Conversion of Nitrobenzene 0.211 --- 0.555 --- 0.796 ---

82
Table 3.6 Nominal values of the fixed variables used in the sensitivity analysis
Parameter Values Units
Dimensional Variables
Cross-sectional area-equivalent
diameter of dehydrogenation side 1.95 m
Inside diameter of hydrogenation
tubes 3.5×10
-2 m
Length of reactor 4.0 m
Operating Conditions of Dehydrogenation Side
Feed molar flowrate of ethylbenzene 10.242 mole/s
Feed molar flowrate of styrene 0.1861 mole/s
Feed molar flowrate of benzene 0.0306 mole/s
Feed molar flowrate of toluene 0.2444 mole/s
Feed molar flowrate of steam 125.86 mole/s
Bed voidage 0.48 ----
Operating Conditions per tube on Hydrogenation Side
Feed molar flowrate of nitrobenzene 0.003 mole/s
Feed molar flowrate of steam 0.008 mole/s
Bed voidage 0.46 ----

83
Feed to Dehydrogenation Side
Feed to
Hydrogenation Side
INS
UL
AT
ED
WA
LL
INS
UL
AT
ED
WA
LL
H2
Per
mea
tion
Hea
t
Tra
nsfe
r
H2
Per
mea
tion
Hyd
roge
n pe
rmea
tive
mem
bran
e
Hyd
roge
n pe
rmea
tive
mem
bran
e
Product of
Hydrogenation Side
(Aniline)
Products of Dehydrogenation Side
(Styrene, Benzene, Toluene, and Light
Gases)
Figure 3.1 Conceptual design of integrated catalytic membrane reactor coupling
dehydrogenation of ethylbenzene with hydrogenation of nitrobenzene.

84
Reactor Model
Equations
Random
Initial Guess
ode15s
Matlab Differential
Equation Solver
Global solver
glbDirect
Linear
Constraints
Variable
Bounds
Local Solver
snopt
Control
Variables
Objective
Functions
Nonlinear
Contraints
Solution of the
Global solver
Solution of the local solver
(Solution of the Optimization
Problem)
Control
Variables
Figure 3.2 Flowchart showing how the Tomlab solvers, i.e. glbDirect and snopt, are
linked to the reactor model.
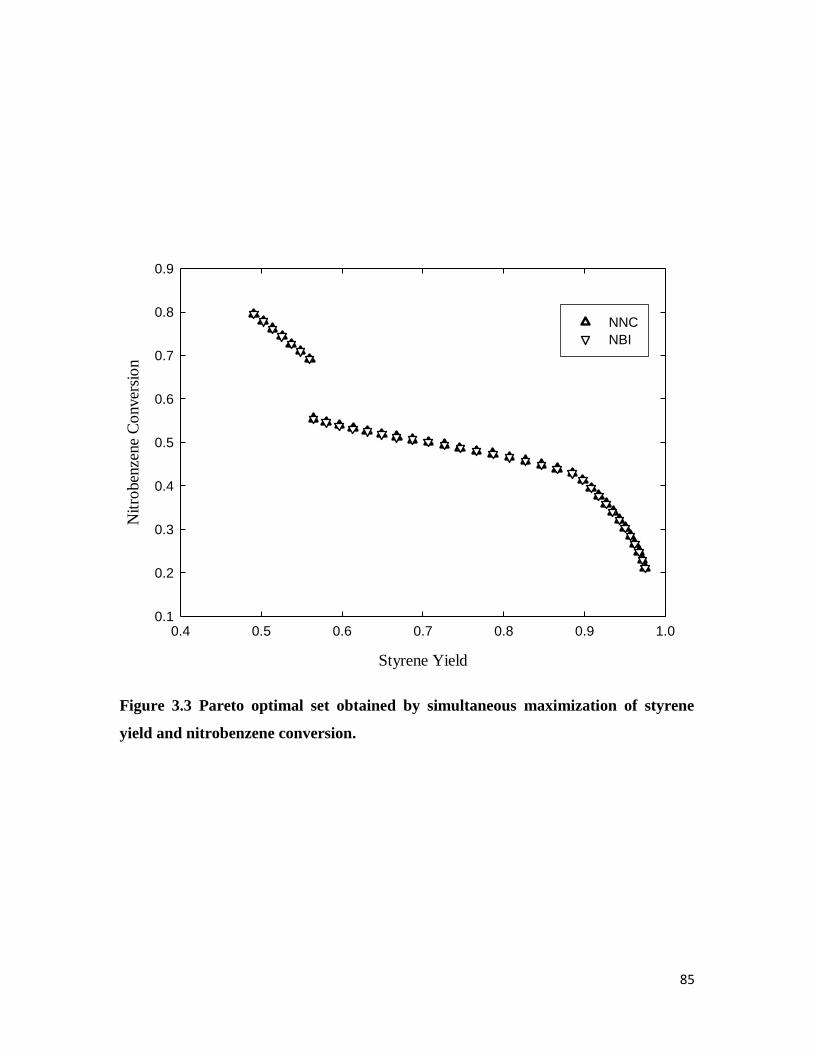
85
Styrene Yield
0.4 0.5 0.6 0.7 0.8 0.9 1.0
Nit
roben
zene
Co
nver
sio
n
0.1
0.2
0.3
0.4
0.5
0.6
0.7
0.8
0.9
NNC
NBI
Figure 3.3 Pareto optimal set obtained by simultaneous maximization of styrene
yield and nitrobenzene conversion.

86
Feed molar flowrate
of Ethylbenzene, nEBf (moles/s)
7 8 9 10 11 12
Yie
ld o
f S
tyre
ne,
YS
T
0.4
0.5
0.6
0.7
0.8
0.9
1.0
NC
NBI
Feed molar flowrate
of Ethylbenzene, nEBf (moles/s)
7 8 9 10 11 12
Conver
sion o
f N
itro
ben
zene,
XN
B
0.1
0.2
0.3
0.4
0.5
0.6
0.7
0.8
0.9
NC
NBI
(a) (b)
Steam-to-Ethylbenzene Ratio, SOR
6 8 10 12 14 16 18 20 22
Yie
ld o
f S
tyre
ne,
YS
T
0.4
0.5
0.6
0.7
0.8
0.9
1.0
NC
NBI
Steam-to-Ethylbenzene Ratio, SOR
6 8 10 12 14 16 18 20 22
Conver
sion o
f N
itro
ben
zene,
XN
B
0.1
0.2
0.3
0.4
0.5
0.6
0.7
0.8
0.9
NC
NBI
(c) (d)
Feed Temperature on Shell Side,Tf (K)
770 780 790 800 810 820 830 840
Yie
ld o
f S
tyre
ne,
YS
T
0.4
0.5
0.6
0.7
0.8
0.9
1.0
NC
NBI
(e)
Feed Temperature on Shell Side, Tf (K)
770 780 790 800 810 820 830 840
Conver
sion o
f N
itro
ben
zene,
XN
B
0.1
0.2
0.3
0.4
0.5
0.6
0.7
0.8
0.9
NC
NBI
(f)
Figure 3.4 (a, b) Feed molar flowrate of ethylbenzene; (c, d) Steam-to-ethylbenzene
molar ratio on dehydrogenation side; (e, f) Feed temperature on dehydrogenation
side corresponding to Pareto optimal set.

87
Feed Pressure on Shell Side, Pf (bar)
1.5 2.0 2.5 3.0 3.5 4.0 4.5
Yie
ld o
f S
tyre
ne,
YS
T
0.4
0.5
0.6
0.7
0.8
0.9
1.0
NC
NBI
(a)
Feed Pressure on Shell Side, Pf (bar)
1.5 2.0 2.5 3.0 3.5 4.0 4.5
Conver
sion o
f N
itro
ben
zene,
XN
B
0.1
0.2
0.3
0.4
0.5
0.6
0.7
0.8
0.9
NC
NBI
(b)
Feed molar flowrate
of Nitrobenzene (x103), n
NBf (mole/s)
1.5 2.0 2.5 3.0 3.5 4.0 4.5 5.0 5.5
Yie
ld o
f S
tyre
ne,
YS
T
0.4
0.5
0.6
0.7
0.8
0.9
1.0
NC
NBI
(c)
Feed molar flowrate
of Nitrobenzene(x103), n
NBf (mole/s)
1.5 2.0 2.5 3.0 3.5 4.0 4.5 5.0 5.5
Conver
sion o
f N
itro
ben
zene,
XN
B
0.1
0.2
0.3
0.4
0.5
0.6
0.7
0.8
0.9
NC
NBI
(d)
Steam-to-Nitrobenzene Ratio, SOR'
3.0 3.5 4.0 4.5 5.0
Yie
ld o
f S
tyre
ne,
YS
T
0.4
0.5
0.6
0.7
0.8
0.9
1.0
NC
NBI
(e)
Steam-to-Nitrobenzene Ratio, SOR'
3.0 3.5 4.0 4.5 5.0
Con
ver
sion
of
Nit
rob
enze
ne,
XN
B
0.1
0.2
0.3
0.4
0.5
0.6
0.7
0.8
0.9
(f)NC
NBI
Figure 3.5 (a, b) Feed pressure on dehydrogenation side; (c, d) Molar feed of
nitrobenzene on hydrogenation side; (e, f) Steam-to-nitrobenzene molar ratio on
hydrogenation side corresponding to Pareto optimal set.

88
Feed Temperature on Tube Side,T'f (K)
770 780 790 800 810 820 830 840
Yie
ld o
f S
tyre
ne,
YS
T
0.4
0.5
0.6
0.7
0.8
0.9
1.0
NNC
NBI
(a)
Feed Temperature on Tube Side,T'f (K)
770 780 790 800 810 820 830 840
Co
nver
sio
n o
f N
itro
ben
zene,
XN
B
0.1
0.2
0.3
0.4
0.5
0.6
0.7
0.8
0.9
NNC
NBI(b)
Feed Pressure on Tube Side, P'f (bar)
0.5 1.0 1.5 2.0 2.5 3.0 3.5 4.0 4.5
Yie
ld o
f S
tyre
ne,
YS
T
0.4
0.5
0.6
0.7
0.8
0.9
1.0
NNC
NBI
Feed Pressure on Tube Side, P'f (bar)
0.5 1.0 1.5 2.0 2.5 3.0 3.5 4.0 4.5
Co
nver
sio
n o
f N
itro
ben
zene,
XN
B
0.1
0.2
0.3
0.4
0.5
0.6
0.7
0.8
0.9
NNC
NBI
Number of Hydrogenation Tubes, Nt (tubes)
800 1000 1200 1400 1600 1800 2000 2200 2400 2600
Yie
ld o
f S
tyre
ne,
YS
T
0.4
0.5
0.6
0.7
0.8
0.9
1.0
NNC
NBI
Number of Hydrogenation Tubes, Nt (tubes)
800 1000 1200 1400 1600 1800 2000 2200 2400 2600
XS
T
0.1
0.2
0.3
0.4
0.5
0.6
0.7
0.8
0.9
NNC
NBI
(e) (f)
(c)(d)
Figure 3.6 (a, b) Feed temperature on hydrogenation side; (c, d) Feed pressure on
hydrogenation side; (e, f) Number of hydrogenation tubes corresponding to Pareto
optimal set.

89
Area-Equivalent Diameter of Shell Side, D (m)
1.8 2.0 2.2 2.4 2.6 2.8 3.0 3.2
Yie
ld o
f S
tyre
ne,
YS
T
0.4
0.5
0.6
0.7
0.8
0.9
1.0
NC
NBI
Area-Equivalent Diameter of Shell Side, D (m)
1.8 2.0 2.2 2.4 2.6 2.8 3.0 3.2
Conver
sion o
f N
itro
ben
zene,
XN
B
0.1
0.2
0.3
0.4
0.5
0.6
0.7
0.8
0.9
NC
NBI
(a) (b)
Diameter of Hydrogenation Tubes, Dt (m)
0.030 0.035 0.040 0.045 0.050 0.055 0.060
Yie
ld o
f S
tyre
ne,
YS
T
0.4
0.5
0.6
0.7
0.8
0.9
1.0
NC
NBI
Diameter of Hydrogenation Tubes, Dt (m)
0.030 0.035 0.040 0.045 0.050 0.055 0.060
Conver
sion o
f N
itro
ben
zene,
XN
B
0.1
0.2
0.3
0.4
0.5
0.6
0.7
0.8
0.9
NC
NBI
(c) (d)
Length of Reactor, L (m)
3.90 3.92 3.94 3.96 3.98 4.00 4.02
Yie
ld o
f S
tyre
ne,
YS
T
0.4
0.5
0.6
0.7
0.8
0.9
1.0
NC
NBI
Length of Reactor, L (m)
3.90 3.92 3.94 3.96 3.98 4.00 4.02
Conver
sion o
f N
itro
ben
zene,
XN
B
0.1
0.2
0.3
0.4
0.5
0.6
0.7
0.8
0.9
NC
NBI
(f)(e)
Figure 3.7 (a, b) Net diameter of dehydrogenation side; (c, d) Hydrogenation tube
diameter; and (e, f) Length of reactor corresponding to the Pareto optimal set.

90
Dimensionless Axial Direction
0.0 0.2 0.4 0.6 0.8 1.0
Sty
rene
Yie
ld, a
nd N
itro
benz
ene
Con
vers
ion
0.0
0.2
0.4
0.6
0.8
1.0
Optimal Solution A, Styrene Yield Profile
Optimal Solution A, Nitrobenzene Conversion Profile
Optimal Solution B, Styrene Yield Profile
Optimal Solution B, Nitrobenzene Conversion Profile
Optimal Solution C, Styrene Yield Profile
Optimal Solution C, Nitrobenzene Conversion Profile
Dimensionless Axial Direction
0.0 0.2 0.4 0.6 0.8 1.0
Tem
pera
ture
, (K
)
740
760
780
800
820
840
860
880
900
920
940
Optimal Solution A, Temperature Profile in Shell Side
Optimal Solution A, Temperature Profile in Tube Side
Optimal Solution B, Temperature Profile in Shell Side
Optimal Solution B, Temperature Profile in Tube Side
Optimal Solution C, Temperature Profile in Shell Side
Optimal Solution C, Temperature Profile in Tube Side
(a)
(b)
Figure 3.8 (a) Styrene yield and nitrobenzene yield along the membrane reactor at
three different optimal Pareto solutions; (b) Temperature profiles on both shell
andtube sides of the membrane reactor at three different optimal Pareto solutions.

91
Feed Temperature on
Dehydrogenation Side (K)
780 800 820 840 860 880 900 920 940 960 980
Sty
rene
Yie
ld a
nd N
itro
ben
zene
Conver
sion
0.3
0.4
0.5
0.6
0.7
0.8
0.9
1.0
Feed Temperature on Hydrogenation Side (K)
750 800 850 900 950 1000 1050
Sty
rene
Yie
ld a
nd N
itro
ben
zene
Conver
sion
0.30
0.35
0.40
0.45
0.50
0.55
0.60
0.65
Feed Pressure on
Dehydrogenation Side (bar)
0 2 4 6 8 10 12
Sty
rene
Yie
ld a
nd N
itro
ben
zene
Conver
sion
0.1
0.2
0.3
0.4
0.5
0.6
0.7
0.8
0.9
Feed Temperature on
Hydrogenation Side (bar)
0 1 2 3 4 5 6
Sty
rene
Yie
ld a
nd N
itro
ben
zene
Conver
sion
0.36
0.38
0.40
0.42
0.44
0.46
0.48
0.50
0.52
Hydrogenation Tubes x 10-2
8 10 12 14 16 18 20 22 24 26
Sty
rene
Yie
ld a
nd N
itro
ben
zene
Conver
sion
0.25
0.30
0.35
0.40
0.45
0.50
0.55
0.60
(a) (b)
(c) (d)
(e)
Styrene Yield
Nitrobenzene Conversion
Styrene Yiels
Nitrobenzene Conversion
Styrene Yield
Nitrobenzene Conversion
Styrene Yield
Nitrobenzene Conversion
Styrene Yield
Nitrobenzene Conversion
Figure 3.9: Sensitivity analysis on some key operating variables.

92
3.11. References
Abdalla BK, Elnashaie SSEH. Fluidized bed reactors without and with selective
membranes for the catalytic dehydrogenation of ethylbenzene to styrene. Journal of
Membrane Science 1995; 101(1-2): 31-42.
Abdalla BK, Elnashaie SSEH. A membrane reactor for the production of styrene from
ethylbenzene. Journal of Membrane Science 1993; 85(3):229-239.
Abdalla BK, Elnashaie SSEH. Catalytic dehydrogenation of ethylbenzene to styrene in
membrane reactors. AICHE Journal 1994; 40(12):2055-2059.
Babu BV, Chakole PG, Syed Mubeen JH. Multiobjective differential evolution (MODE)
for optimization of adiabatic styrene reactor. Chemical Engineering Science 2005;
60(17):4822-4837.
Bhaskar V, Gupta SK, Ray AK. Applications of multiobjective optimization in chemical
engineering. Reviews in Chemical Engineering 2000; 16(1):1-54.
Cheng S, Chen H, Chang H, Chang C, Chen Y. Multi-objective optimization for two
catalytic membrane reactors-Methanol synthesis and hydrogen production.
Chemical Engineering Science 2008; 63(6):1428-1437.
Clough DE, Ramirez WF. Mathematical modelling and optimization of the
dehydrogenation of ethylbenzene to form styrene. AICHE Journal 1976;
22(6):1097-1105.
Das I, Dennis J. Normal-boundary intersection: A new method for generating the Pareto
surface in nonlinear multicriteria optimization problems. SIAM journal on
optimization 1998; 8:631-657.
Das I, Dennis JE. Closer look at drawbacks of minimizing weighted sums of objectives
for Pareto set generation in multicriteria optimization problems. Structural
Optimization 1997; 14(1):63-69.
Deb K. Multi-objective optimization using evolutionary algorithms. Chichester, England:
John Wiley & Sons; 2001.
Deb K, Pratap A, Agarwal S, Meyarivan T. A fast and elitist multiobjective genetic
algorithm: NSGA-II. IEEE Transactions on Evolutionary Computation 2002;
6(2):182-197.

93
Elnashaie, S.S.E.H.; Moustafa, T.; Alsoudani, T.; Elshishini, S.S. Modeling and basic
characteristics of novel integrated dehydrogenation-hydrogenation membrane
catalytic reactors. Computers and Chemical Engineering 2000; (24): 1293-1300.
Froment GF, Bischoff KB. Chemical reactor analysis and design. 2nd ed. New York:
Wiley; 1990.
Hermann C, Quicker P, Dittmeyer R. Mathematical simulation of catalytic
dehydrogenation of ethylbenzene to styrene in a composite palladium membrane
reactor. Journal of Membrane Science. 1997; 136(1-2):161-172.
Leineweber DB, Bauer I, Bock HG, Schlöder JP. An efficient multiple shooting based
reduced SQP strategy for large-scale dynamic process optimization. Part I:
Theoretical aspects. Computers and Chemical Engineering 2003a; 27(2):157-166.
Leineweber DB, Schäfer A, Bock HG, Schlöder JP. An efficient multiple shooting based
reduced SQP strategy for large-scale dynamic process optimization. Part II:
Software aspects and applications. Computers and Chemical Engineering 2003b;
27(2):167-174.
Li Y, Rangaiah GP, and Ray AK. Optimization of styrene reactor design for two
objectives using a genetic algorithm. International Journal of Chemical Reactor
Engineering 2003; 1: http://www.bepress.com/ijcre/vol1/A13.
Lim Y, Floquet P, Joulia X. Efficient implementation of the normal boundary intersection
(NBI) method on multiobjective optimization problems. Industrial and Engineering
Chemistry Research 2001; 40(2):648-655.
Logist F, Van Erdeghem PMM, Van Impe JF. Efficient deterministic multiple objective
optimal control of (bio)chemical processes. Chemical Engineering Science 2009;
64(11):2527-38.
Messac A, Ismail-Yahaya A, Mattson CA. The normalized normal constraint method for
generating the Pareto frontier. Structural and Multidisciplinary Optimization 2003;
25(2):86-98.
Messac A, Mattson C. Normal constraint method with guarantee of evenrepresentation of
complete Pareto frontier. AIAA Journal 2004; 42(10):2101–11.
Miettinen K. Nonlinear Multiobjective Optimization. Boston: Academic Publishers;
1999.
94
Moustafa TM, Elnashaie SSEH. Simultaneous production of styrene and cyclohexane in
an integrated membrane reactor. Journal of Membrane Science 2000; 178(1-2):171-
184.
Sangeetha P, Shanthi K, Rao KSR, Viswanathan B, Selvam P. Hydrogenation of
nitrobenzene over palladium-supported catalysts-Effect of support. Applied
Catalysis A: General 2009; 353(2):160-165.
Sheel JGP, Crowe CM. Simulation and Optimization of an Existing Ethylbenzene
Dehydrogenation Reactor. Canadian Journal of Chemical Engineering. 1969;
47(2):183-187.
Srinivas N, Deb K. Multiobjective function optimization using nondominated sorting
genetic algorithms. Evolutionary Computation Journal 1995; 2:221-248.
Tarafder A, Rangaiah GP, Ray AK. Multiobjective optimization of an industrial styrene
monomer manufacturing process. Chemical Engineering Science 2005a; 60(2):347-
363.
Tarafder A, Lee BCS, Ray AK, Rangaiah GP. Multiobjective optimization of an
industrial ethylene reactor using a nondominated sorting genetic algorithm.
Industrial and Engineering Chemistry Research 2005b; 44(1):124-141.
Yee AKY, Ray AK, Rangaiah GP. Multiobjective optimization of an industrial styrene
reactor. Computers and Chemical Engineering 2003; 27(1):111-130.

95
CHAPTER 4 HETEROGENEOUS MODELING OF
AUTOTHERMAL MEMBRANE REACTOR COUPLING
DEHYDROGENATION OF ETHYLBENZENE TO STYRENE WITH
HYDROGENATION OF NITROBENZENE TO ANILINE: FICKIAN
DIFFUSION MODEL†
4.1. Introduction
Coupling of reactions in a single reactor can be very beneficial, offering a number of
advantages such as eliminating unnecessary heat transfer units (Stitt, 2004), reducing
overall heat losses, cost savings (Fukuhara and Igarashi, 2005) and significant gains in
yield and/or conversions due to shifting the thermodynamic equilibrium conversion by
continuously removing one of the reaction products and supplying heat to the
endothermic reactions (Abashar, 2004).
In the last two decades, a number of studies have appeared addressing the usefulness of
reaction coupling. An interesting reaction for this purpose involves the dehydrogenation
of ethylbenzene to styrene. Abdalla and Elnashaie (1993) developed a rigorous model to
describe the behavior of a membrane reactor in which ethylbenzene was dehydrogenated
to styrene. The dusty gas model was used to describe the diffusion inside the catalyst
pellets. Later, this model was used to extract intrinsic kinetics from data obtained from an
industrial reactor and to investigate the potential economic advantages of a hydrogen-
selective membrane. It was found that a membrane reactor could considerably improve
the ethylbenzene conversion, and the yield and selectivity of styrene. Abdalla and
Elnashaie (1994) studied the effect of the sweep gas flow rates in a catalytic membrane
reactor in which dehydrogenation of ethylbenzene to styrene took place. An appreciable
enhancement in ethylbenzene conversion, styrene yield and selectivity were observed in
the proposed membrane reactor. Abdalla and Elnashaie (1995) proposed a fluidized bed
† A slightly revised version of this chapter will be submitted for publication.

96
with and without a selective membrane for dehydrogenating ethylbenzene to styrene.
Different design and operating parameters, i.e. bubble diameter, steam-to-ethylbenzene
ratio, feed temperature, and number of fluidized beds in series, were investigated. It was
demonstrated that a careful choice of those parameters could improve the ethylbenzene
conversion and styrene yield compared to industrial fixed bed reactors. Hermann et al.
(1997) studied dehydrogenation of ethylbenzene to styrene in a composite Pd/porous
stainless steel membrane fixed bed reactor. A model was presented in which different
types of diffusion were considered. After adjusting the kinetics available to match the
conversion and selectivity, the model predicted more than 90% ethylbenzene conversion
as the pressure increased, with no observable decrease in styrene selectivity.
Elnashaie et al. (2000) mathematically coupled dehydrogenation of ethylbenzene to
styrene with hydrogenation of benzene to cyclohexane in a membrane fixed bed reactor.
This study replaced the sweep gas on the shell side with a second useful reaction to
produce another useful product, i.e. cyclohexane. Both cocurrent and countercurrent
configurations of the membrane reactor were considered with kinetics of four different
catalysts, one being an industrial catalyst. With commercial membranes, the new
configured reactor was predicted to give 79% ethylbenzene conversion, and 72% styrene
yield, significantly higher than for the industrial fixed bed reactor. Moustafa and
Elnashaie (2000) investigated coupling dehydrogenation of ethylbenzene with the
hydrogenation of benzene in a membrane reactor. A rigorous mathematical model was
developed in which the intraparticle diffusion on both sides was considered. In the hybrid
reactor, the predicted yield of styrene was as high as 87%. Abashar (2004) studied the
coupling of the same two reactions, but in a fixed bed reactor. The reactor chamber
contained intermingled dehydrogenation and hydrogenation catalysts. A number of the
operating parameters were examined and a substantial increase in ethylbenzene
conversion was predicted in the new fixed bed reactor.
In chapter 2, coupling of dehydrogenation of ethylbenzene to styrene with hydrogenation
of nitrobenzene to aniline in a shell-and-tube autothermal reactor was modeled. The
model included for the first time heat transfer across the membrane due to hydrogen

97
diffusion, as well as due to conduction. Both cocurrent and countercurrent configurations
were examined, and substantial enhancement was predicted compared to the fixed bed
reactor. For the operating conditions investigated, the conversion reached 23.4% for the
uncoupled adiabatic fixed bed case, 54.6% for the cocurrent membrane reactor, and
61.7% for the membrane reactor in a countercurrent flow configuration. The styrene yield
predicted for the uncoupled adiabatic fixed bed was 18.9%. For the membrane reactor,
the predicted yield increased to 52.5% for the cocurrent flow configuration and 57.7% for
the countercurrent case. Apart from membrane reactors, other forms and concepts of
reaction coupling, such as coupling endothermic reactions with exothermic ones for
efficient utilization of energy, have also been considered (Czechowicz et al., 2004;
Fukuhara and Igarashi, 2005; Glockler et al., 2003; van Sint Annaland and Nijssen, 2002;
Van et al., 2002).
These studies indicate that component effectiveness factors can play a significant role for
dehydrogenation of ethylbenzene to styrene in fixed bed reactors. As a result, the
homogenous model of in chapter 2 should be adjusted to consider the catalyst
intraparticle diffusion on both sides of the membrane reactor. To achieve this aim, the
diffusion model based on Fick‘s law is extended in order to account for diffusion inside
the catalyst pellets on both sides of the membrane. This new model is then used: (i) to
study the molar flow rates of selected key components and temperature profiles compared
with those from the pseudo-homogeneous model; (ii) to evaluate the performance of
optimal reactor designs in terms of the styrene yield on the dehydrogenation side,
conversion of nitrobenzene on the hydrogenation side, and temperature profiles on both
sides of the reactor.
4.2. Reactor Configuration
The configuration of interest is portrayed in Figure 4.1. In the shell compartment packed
with catalyst particles, ethylbenzene (EB) is dehydrogenated to produce styrene (ST) as
the main product; benzene (BZ), toluene (TO), ethylene and other light gases are side
products. The chemical equations representing the reactions are:

98
22563256 HCHCHHCCHCHHC 298
kJ117.6
moleH (4.1)
42663256 HCHCCHCHHC 298
kJ105.4
moleH (4.2)
435623256 CHCHHCHCHCHHC 298
kJ54.6
moleH (4.3)
2422 422 HCOHCOH 298
kJ210.2
moleH (4.4)
242 3HCOCHOH 298
kJ206.1
moleH (4.5)
222 HCOCOOH 298
kJ41.2
moleH (4.6)
The first reaction in this network is the main reversible, endothermic one. From Le
Chatelier‘s principle, the forward reaction, i.e. production of styrene, is favored by
operating at low pressure and high temperature.
Hydrogen produced in this compartment diffuses through palladium hydrogen-selective-
membrane walls to the inside of cylindrical tubes extending along the reactor. The tube
walls are permeable to hydrogen with a layer of stainless steel of a thickness of 1.2 mm
coated with a palladium layer of thickness 20 µm. On the tube side, the diffused
hydrogen reacts with nitrobenzene (NB) to produce aniline (AN):
6 5 2 2 6 5 2 23 2C H NO H C H NH H O 298
kJΔH =-433.0
mole (4.7)
This reaction is irreversible and highly exothermic. In chapter 2, it was shown that
coupling these two reactions, i.e. dehydrogenation of ethylbenzene with the
hydrogenation of nitrobenzene, could be very beneficial. Removing hydrogen from the
dehydrogenation side and providing heat to the same side from the hydrogenation heat of
reaction were predicted to play very important roles in increasing the styrene yield. The
external wall of the coupled reactor is treated as adiabatic, a reasonable assumption due to

99
the small surface area-to-volume ratio. Expressions for the rate of reactions and
numerical values for the pre-exponential constants and activation energies are listed in
Tables 4.1 and 4.2. The shell side of this reactor is assumed to be packed with an iron
oxide (Fe2O3) catalyst promoted with potassium carbonate (K2CO3) and chromium oxide
(Cr2O3) while the tube side is packed with a palladium catalyst supported on an α-
alumina carrier.
4.3. Reactor Model
The differential equations governing the behavior of the catalytic membrane reactor
coupling dehydrogenation of ethylbenzene with hydrogenation of nitrobenzene are based
the following assumptions:
1. Steady-state operation.
2. Ideal gas behavior in both the tube and shell of the reactor.
3. Plug flow for the fixed beds on both shell and tube sides, with axial Peclet
numbers ~1000.
4. Heterogeneous model, i.e. significant gradients in concentrations / temperatures
inside the catalyst pellets.
5. The flow rate on both sides is high enough to minimize the external mass and heat
transfer resistances. Hence, only intraparticle diffusion needs to be considered.
6. Reactor external wall well insulated leading to an adiabatic reactor.
7. Catalyst deactivation is neglected.
8. Pressure gradients in both the shell and tubes are based on Ergun‘s equation.
9. Spherical catalyst pellets.
10. Cocurrent flow in the shell and tube.
The reactor model differential equations are derived by considering an infinitesimal
element inside the reactor through which both moles and energy flow. Hydrogen diffuses
from the dehydrogenation side to the hydrogenation side, whereas heat is transferred from
the hydrogenation to the dehydrogenations side. The reactor model equations (4.8) to

100
(4.15) and rates of both hydrogen diffusion and heat transfer per unit length and are given
in Table 4.3.
The model equations describing the diffusion inside the catalyst pellets are based on the
following assumptions.
1. Steady-state molar and energy flow.
2. Porous structure of all catalyst pellets is spatially ant timewise uniform.
3. Ideal gas law.
4. The concentration and temperature profiles are symmetrical around the centre of
the spherical catalyst particles.
5. External mass and heat transfer resistances are negligible
6. Negligible viscous flow inside the pellets inducing isobaric diffusion.
7. Convective diffusion is neglected; only ordinary molecular and Knudsen diffusion
are significant.
8. Diffusion is represented by Fick‘s law with the component diffusion coefficient
obtained from molecular diffusion and Knudsen diffusion coefficients.
9. For mathematical simplicity, the variation of the effective component diffusivity
coefficient along the radial direction is negligible.
10. Heat flux introduced by species, i.e. Dufour effect, is negligible.
11. Thermal conductivities of the catalyst pellets on both the shell and tube sides of
the reactor are uniform on each side.
To derive the catalyst model equations, a small spherical shell inside the catalyst pellets is
considered across which both moles and heat flow as shown in Figure 4.2. Applying the
balance equations, and expressing the molar flux using Fick‘s law leads to the following.
Catalyst mole balance equation on dehydrogenation side:
2 6
21
2 1i iij j
jie
d C dCr
dy y dy D
(4.16)

101
Catalyst energy balance equation on dehydrogenation side:
2 6
21
2 1jj
je
d T dTH T r
dy y dy k
(4.17)
Catalyst mole balance equation on hydrogenation side:
ie
iii
D
r
yd
Cd
yyd
Cd
22
2
(4.18)
Catalyst energy balance equation on hydrogenation side:
ek
rTH
yd
Td
yyd
Td
22
2
(4.19)
These coupled equations form a split boundary value problem describing the molar and
energy flow inside the catalyst on both the dehydrogenation and hydrogenation sides. The
boundary conditions are:
Dehydrogenation side:
0
0
0
dy
dT
dy
dC
y
i
(4.20)
s
isi
pTT
CCRy (4.21)
Hydrogenation side:
102
0
0
0
yd
Td
yd
Cd
y
i
(4.22)
s
isi
pTT
CCRy (4.23)
The effective diffusivities, i.e. ieD and ieD , of component i in equations (4.16) and (4.18)
are calculated considering both the effective binary diffusivity of component i in a
mixture e
imD and the effective Knudsen diffusivity e
ikD (Elnashaie et al., 1993;R. B. Bird,
W.E. Stewart, E.N. Lightfoot, 1960):
e
ik
e
imie DDD
111 (4.24)
The binary diffusivity of component i in the above equation is estimated on the
dehydrogenation side from the well-known Wilke equation (Elnashaie et al., 1993;R. B.
Bird, W.E. Stewart, E.N. Lightfoot, 1960):
10
1
1 1
1
i
jim i ijj i
x
D x D
(4.25)
The effective diffusivities are obtained (Elnashaie et al., 1993) from:
im
e
im DD
(4.26)
where ε is the internal porosity of the catalyst pellet and τ is the tortuosity, and both are
assumed to be isotropic properties.

103
The numerical solution of model equations (4.16)-(4.19) evaluates the average reaction
rates as well as the average heat released or absorbed due to reactions. Those values can
be related to the reaction rates and heat released or absorbed at bulk conditions, i.e.
concentrations and temperature, through the concept of effectiveness factors, defined for
chemical reactions as the ratio of the rate of reaction with pore resistance to the rate of
reaction evaluated at the surface conditions:
2
0
3
4
4,3
pR
j
j
j is s p
r y dy
r C T R
(4.27)
with 1 6j for dehydrogenation side and 1j for hydrogenation side. When the
dimensionless catalyst radius (ω =y/Rp) is introduced into equation (4.27), the volume-
averaged reaction rate can be formulated as:
1.0
2
0
, 3j j is s jr C T r d (4.28)
with 1 6j for the dehydrogenation side and 1j for the hydrogenation side. For
non-isothermal catalyst pellets, a thermal effectiveness factor, relating the actual heat
released or absorbed to that at the surface conditions, can be defined as:
1.0
2
0
, 3H
j s j is s jH T r C T r H T d (4.29)
Component effectiveness factors can be defined as:

104
2
1 0
3
1
4
4,3
pRj
ij j
j
i j
ij j is s p
j
r y dy
r C T R
(4.30)
again with 1 6j for the dehydrogenation side and 1j for the hydrogenation side.
Integral terms in equations (4.27) to (4.30) are evaluated here by the trapezoidal rule.
Equation (4.28) and (4.29) representing the actual reaction rate and heat released or
absorbed are used to update reactor model equations (4.8)-(4.13) in Table 4.3.
The conversions of ethylbenzene and nitrobenzene on both sides of the membrane reactor
and component yields on the dehydrogenation side are defined as:
on DehydrogenationSide
Conversions
on HydrogenationSide
EBo EBEB
EBo
NBo NBNB
NBo
n nX
n
n nX
n
(4.31)
Yields
ST SToST
EBo
BZ BZoBZ
EBo
TO TOoTO
EBo
n nY
n
n nY
n
n nY
n
(4.32)
The sequence of computations followed to link the reactor model equations with the
catalyst pellets model equations is shown schematically in Figure 4.3. The sequence starts
by using the bulk conditions to establish the boundary conditions to solve the catalyst
model equations (4.16) and (4.17) on the dehydrogenation side and (4.18) and (4.19) on
the hydrogenation side. These numerical solutions are then used to evaluate the molar and
heat flux at the surface of the catalyst numerically by evaluating equations (4.28) and
(4.29), substituted in the reactor model equations, i.e. (4.8) to (4.13), which can then be

105
integrated one step forward. This procedure is repeated until the entire length of the
reactor is covered.
In this computational sequence, two Matlab
(The MathWorks, Natick) subroutines are
invoked. The catalyst model equations based on Fickian diffusion are solved by bvp4c
with a relative tolerance of 1×10⁻⁴
, while the reactor model equations are integrated by
ode15s with a relative tolerance of 1×10⁻⁸
.
4.4. Results and Discussion
The effect of the intraparticle diffusion on the performance of the catalytic membrane
reactor coupling dehydrogenation of ethylbenzene with hydrogenation of nitrobenzene to
aniline was simulated for the operating conditions listed in Table 4.4. The component
molar flow rates and feed pressure on the dehydrogenation side are based on industrial
fixed bed reactors. A feed temperature difference of 20 K is chosen to ensure that heat
always transfers in the right direction, i.e. from the hydrogenation to the dehydrogenation
side.
In the following sub-sections, the predictions of several reactor variables are compared
and discussed based on three models, i.e. (i) pseudo-homogeneous model, (ii)
heterogeneous model with isothermal catalyst pellets, and (iii) heterogeneous model with
non-isothermal catalyst pellets.
4.4.1. Conversion of ethylbenzene and nitrobenzene
The conversion of (i) ethylbenzene on the dehydrogenation side and of (ii) nitrobenzene
on the hydrogenation side are plotted versus the dimensionless distance along the reactor
in Figures 4.4a and 4.4b for the pseudo-homogeneous and heterogeneous model with
isothermal and non-isothermal catalyst pellets. In Figure 4.4a, the conversion of
ethylbenzene on the dehydrogenation side of the catalytic membrane reactor increases
monotonically along the catalytic membrane reactor due to the consumption of

106
ethylbenzene. For the selected operating and design conditions, the pseudo-homogeneous
model predicts an ethylbenzene conversion of ~88%. When the effect of intraparticle
diffusion is included, the ethylbenzene conversion predicted by the heterogeneous model
is significantly lower, ~78% for isothermal pellets and ~71% for non-isothermal pellets.
Conversion of nitrobenzene on the hydrogenation side of the catalytic membrane reactor
in Figure 4.4b shows similar behavior to that of ethylbenzene, i.e. it increases
monotonically along the reactor. It is predicted to reach ~68% by the homogenous model,
~59% by the heterogeneous model for isothermal catalyst pellets, and ~52% by the
heterogeneous model for non-isothermal pellets.
4.4.2. Yield of styrene, benzene, and toluene on dehydrogenation side
Figures 4.5a, 4.5b, and 4.5c, plot the yields of styrene, benzene, and toluene versus the
dimensionless axial distance along the reactor. All three yields increase along the reactor,
with appreciable differences in prediction among the models. The pseudo-homogeneous
model for the catalytic membrane reactor predicts a styrene yield of ~82%, a benzene
yield of ~5.0%, and a toluene yield of ~1.0%. The heterogeneous model, on the other
hand, predicts a styrene yield of ~73%, a benzene yield of ~4.6%, and a toluene yield of
~0.8% for isothermal catalyst pellets while it predicts corresponding yields of ~69%,
~3.2% and ~0.6% for non-isothermal pellets.
4.4.3. Hydrogen molar flow rates on dehydrogenation and hydrogenation sides
The molar flow rates of hydrogen on both sides of the catalytic membrane reactor are
plotted versus the dimensionless axial distance in Figures 4.6a and 4.6b. As shown in
Figure 4.6a, the hydrogen molar flow rate on the dehydrogenation side predicted by both
homogenous and heterogeneous models increases monotonically in the first portion of the
reactor fraction length until it reaches a maximum where the rate of hydrogen diffusion to
the hydrogenation side is balanced by the hydrogen net production due to the reactions.
After that, the hydrogen molar flow rate continues at a nearly constant level to the reactor
107
exit. The hydrogen flow rate predicted by the heterogeneous model for the non-
isothermal catalyst pellets is significantly lower than that predicted by either the
homogenous model or the heterogeneous model with isothermal catalyst pellets, due to
the significant effect of temperature. This gives a strong indication of the significance of
intraparticle heat resistance in retarding the chemical reactions and the diffusion through
the membranes.
The molar flow rate inside the hydrogenation tubes is plotted in Figure 4.6b as a function
of the dimensionless axial distance. All three models predict monotonically increasing
profiles, with a significant difference for the heterogeneous model with non-isothermal
catalyst pellets. At the reactor entrance, the homogenous model and the heterogeneous
model for the isothermal catalyst pellets give similar predictions over 40% of the reactor
length, with a somewhat higher subsequent value for the heterogeneous model with
isothermal catalyst pellets resulting from a higher hydrogen diffusion rate compared to
that predicted by the homogenous model. The difference in the predictions of these two
models becomes more pronounced as the reactor exit is approached. The prediction of the
heterogeneous model for the non-isothermal case is considerably lower than for the other
two models due to the temperature gradient inside the catalyst pellets.
4.4.4. Temperature profiles along coupled reactor
Temperature profiles along the reactor on both the shell and tube sides are plotted in
Figures 4.7a and 4.7b. In Figure 4.7a, the temperature on the dehydrogenation side
decreases over the first 15% of the reactor length due to the net endothermic heat of the
reaction. A point is then reached where the heat lost is balanced by the heat gained from
the hydrogenation side. Given the large temperature difference established between the
two sides of the integrated reactor, the temperature on the shell side then increases over
the reminder of the reactor due to significant heat transfer from the tube side. The
temperature profiles predicted by all three models are similar in shape.

108
In Figure 4.7b, the temperature profiles predicted by the three models, are plotted against
dimensionless axial distance along the reactor. The temperature on the hydrogenation
side rises due to the high exothermic heat of reaction. A clear maximum temperature is
obtained from the homogenous model about 40% of the way along the reactor at which
the heat transferred to the dehydrogenation side balances the endothermic requirement of
the main reaction. This point is clearly observable for the pseudo-homogeneous model,
while it is less observable in the profiles predicted by the heterogeneous model for
isothermal catalyst pellets, and not observable for the heterogeneous model with non-
isothermal catalyst pellets.
From the temperature profiles on both sides of the reactor, it should be noted that the
intraparticle diffusion resistance not only retards the chemical reactions, but also the heat
transfer between the two sides by reducing the driving force, i.e. the temperature
difference between the dehydrogenation and hydrogenation compartments.
4.4.5. Reaction effectiveness factors and reaction rates
Intraparticle effectiveness factors, defined as the ratios of the observed rates of reaction to
those evaluated if the surface conditions prevailed throughout the catalyst pellets are
plotted versus the bulk temperature in Figure 4.8 for both sides of the membrane. Actual
reaction rates and those evaluated at the conditions of the catalyst surface are plotted in
Figure 4.9. In Figure 4.8a, effectiveness factors for both reactions (4.1) and (4.2) exhibit a
strong nonlinear behavior with different turning points. The bulk temperatures at which
the turns take place correspond to the axial location inside the reactor at which the net
endothermic heat of reactions balances the heat transferred from the hydrogenation side.
While the effectiveness factors of reactions (4.1) and (4.2) for the isothermal case are
slightly lower than 1.0, those for the non-isothermal case are significantly lower,
indicating the significance of the intraparticle heat resistance. Consequently, the
difference between the actual reaction rates and these evaluated at the conditions of the
catalyst pellet surface for reactions (4.1) and (4.2) is higher for the non-isothermal case
than for the isothermal catalyst pellets, as shown in Figure 4.9. As the bulk temperature
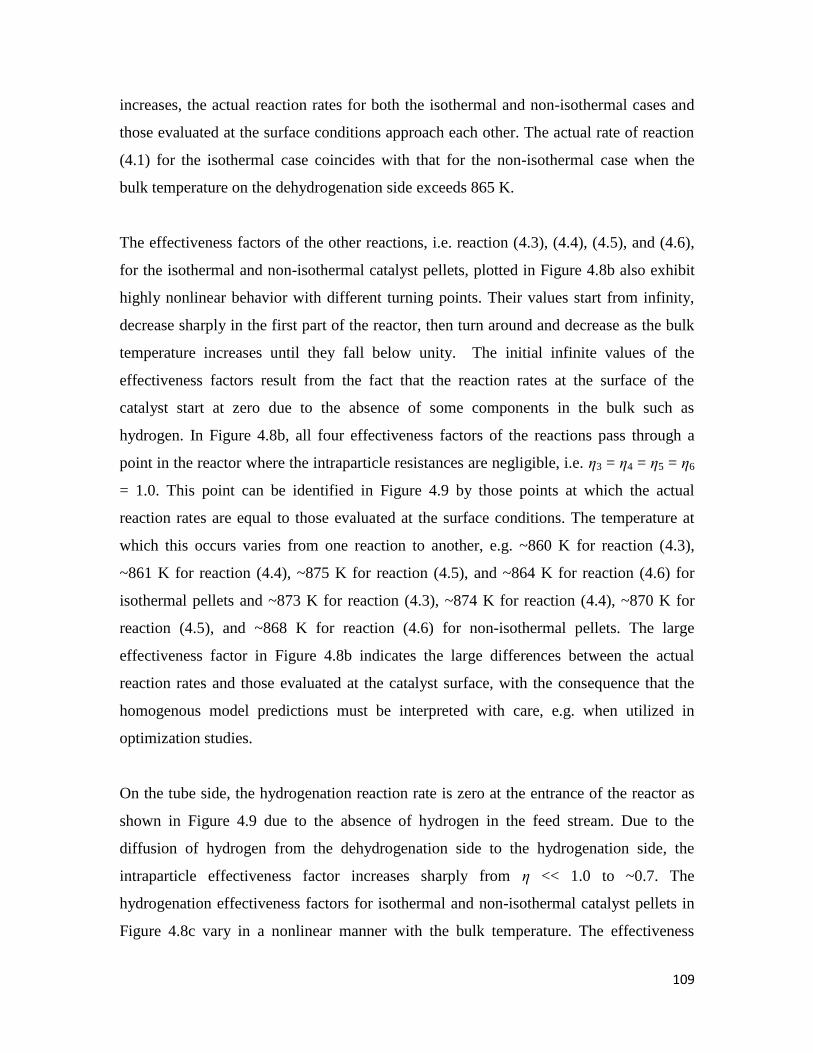
109
increases, the actual reaction rates for both the isothermal and non-isothermal cases and
those evaluated at the surface conditions approach each other. The actual rate of reaction
(4.1) for the isothermal case coincides with that for the non-isothermal case when the
bulk temperature on the dehydrogenation side exceeds 865 K.
The effectiveness factors of the other reactions, i.e. reaction (4.3), (4.4), (4.5), and (4.6),
for the isothermal and non-isothermal catalyst pellets, plotted in Figure 4.8b also exhibit
highly nonlinear behavior with different turning points. Their values start from infinity,
decrease sharply in the first part of the reactor, then turn around and decrease as the bulk
temperature increases until they fall below unity. The initial infinite values of the
effectiveness factors result from the fact that the reaction rates at the surface of the
catalyst start at zero due to the absence of some components in the bulk such as
hydrogen. In Figure 4.8b, all four effectiveness factors of the reactions pass through a
point in the reactor where the intraparticle resistances are negligible, i.e. η3 = η4 = η5 = η6
= 1.0. This point can be identified in Figure 4.9 by those points at which the actual
reaction rates are equal to those evaluated at the surface conditions. The temperature at
which this occurs varies from one reaction to another, e.g. ~860 K for reaction (4.3),
~861 K for reaction (4.4), ~875 K for reaction (4.5), and ~864 K for reaction (4.6) for
isothermal pellets and ~873 K for reaction (4.3), ~874 K for reaction (4.4), ~870 K for
reaction (4.5), and ~868 K for reaction (4.6) for non-isothermal pellets. The large
effectiveness factor in Figure 4.8b indicates the large differences between the actual
reaction rates and those evaluated at the catalyst surface, with the consequence that the
homogenous model predictions must be interpreted with care, e.g. when utilized in
optimization studies.
On the tube side, the hydrogenation reaction rate is zero at the entrance of the reactor as
shown in Figure 4.9 due to the absence of hydrogen in the feed stream. Due to the
diffusion of hydrogen from the dehydrogenation side to the hydrogenation side, the
intraparticle effectiveness factor increases sharply from η << 1.0 to ~0.7. The
hydrogenation effectiveness factors for isothermal and non-isothermal catalyst pellets in
Figure 4.8c vary in a nonlinear manner with the bulk temperature. The effectiveness

110
factors for both isothermal and non-isothermal cases are almost identical for temperatures
on the hydrogenation side lower than 970 K. Similar behavior is shown in Figure 4.9,
with a constant difference between the actual reaction rates and those evaluated at the
condition of the surface of the catalyst pellets. For temperatures exceeding 970 K, the
effectiveness factors for both cases diverge, approaching unity as shown in Figure 4.8c
and 4.9, with the actual reaction rates and those evaluated at the surface approach each
other.
4.4.6. Component effectiveness factors
The component effectiveness factors defined by equation (4.30) are the ratios of the
actual net production rates of component i to those evaluated for the surface conditions of
the catalyst pellets. In Figure 4.10, they are plotted for key species i.e., ethylbenzene,
styrene, hydrogen, benzene, toluene and nitrobenzene for the heterogeneous model with
both isothermal and non-isothermal catalyst pellets. On the dehydrogenation side, the
component effectiveness factors show a non-monotonic behavior when plotted against
the dimensionless axial distance along the reactor for all components except toluene for
both isothermal and non-isothermal catalyst pellets. The toluene effectiveness factor is
infinite at the inlet of the reactor because components involved in the production reaction
diffuse to the active sites of the catalyst and react. It then decreases with increasing
distance along the reactor, passing a point where the actual rate of production reaction is
equal to the reaction rate at the surface conditions (ηTO = 1.0) as hydrogen is produced on
the dehydrogenation side and the surface reaction rate becomes significant, finally it
approaches ηTO = 0.80. As hydrogen is produced in the bulk, the toluene effectiveness
factor drops sharply. In general, the component effectiveness factors reflect the fact that
the net production rates of the components from the pseudo-homogeneous model are not
as accurate as from the heterogeneous models.
The nitrobenzene effectiveness factors on the hydrogenation side for both isothermal and
non-isothermal catalyst pellets plotted in Figure 4.10b behave in a similar manner. They
are mathematically undefined at the inlet point of the rector, due to the absence of

111
hydrogen in the compartment making both the diffusion to the catalyst active sites as well
as reaction at the surface zero. As hydrogen diffuses to the hydrogenation compartment
though the membrane, a sharp increase is observed in both effectiveness factors, heading
toward 1.0. Note that the differences between both factors for isothermal and non-
isothermal catalyst pellets are negligible.
4.4.7. Behaviour inside catalyst pellets on both sides of coupled reactor
In Figure 4.11, the intraparticle mole fractions, temperature and component effective
diffusivity profiles on the dehydrogenation side are plotted at three axial positions, i.e.
z/L = 0.1, 0.5, and 0.8. The abscissa in Figure 4.11 is interpreted as the dimensionless
radial distance inside the catalyst pellet, i.e. ω = 0.0 represents the centre of the catalyst
pellet, while ω = 1.0 indicates its surface.
As can be seen, the ethylbenzene mole fraction at the pellet surface decreases as the
fractional length increases from 0.1 (close to the inlet of the reactor) to 0.8 (close to the
exit) due to the consumption in the bulk while the opposite is true for styrene. Production
of the other selected components, i.e. hydrogen, benzene, and toluene, are limited. The
mole fraction of hydrogen on the surface of the catalyst pellet is less than 0.01 due to
diffusion through the membrane to the hydrogenation side.
The thermal resistance inside the catalyst pellet is detrimental as it reduces the production
of all components inside the catalyst particles. The drop in temperature inside the catalyst
pellet decreases from ~50 K at z/L = 0.1 to ~25 K at z/L = 0.8. This is because at the inlet
of the reactor, the mole fractions of the reactants are high at the catalyst surface, while
this is no longer the case when the reactor exit is approached.
Hydrogen has the highest effective diffusivities inside the catalyst pellet because of its
small molecular size. As a consequence for the heat transferred from the tube side to the
shell side, the diffusivities increase with the distance along the reactor. Inside the
catalyst, however, hydrogen diffusivity decreases as the centre of the particle is

112
approached due to the drop in temperature. The effect of temperature on the component
effective diffusivities is greater than that of compositions when both isothermal and non-
isothermal profiles are compared. The effective diffusivities of the other components, i.e.
ethylbenzene, styrene, benzene and toluene, are limited within the range from 44 to 53
cm2/h. The effective diffusivity of ethylbenzene decreases as the outlet of the reactor is
approached as a result for the decrease of ethylbenzene concentration in the bulk phase.
Similar behavior is also observed inside the catalyst pellet, but this decrease becomes
more pronounced as the temperature inside the catalyst pellets drops. The effective
diffusivities of styrene, benzene and toluene increase at the surface of the catalyst pellets
as the outlet of the reactor is approached due to their production in the bulk, and the
increase in temperature due to the heat transfer, whereas they decrease inside the catalyst
as the centre is approached due to the drop in temperature which has a more pronounced
effect than variation in mole fractions.
On the hydrogenation side, the mole fraction of nitrobenzene decreases at the surface of
the catalyst as the fractional length increases from 0.1 to 0.8 and also as the centre of the
catalyst pellet is approached. This drop in mole fraction is more significant for the
isothermal catalyst pellets than for the non-isothermal catalyst pellets. Aniline, on the
other hand, exhibits the opposite behavior, it increases at the surface of the catalyst and
inside the catalyst pellets with increasing distance along the reactor and decreasing radius
inside the catalyst pellet.
The temperature profile, on the other hand, decreases at the surface of the catalyst as the
fraction length increases, i.e. it is ~990 K at z/L = 0.1 and ~980 K at z/L = 0.8. This
decrease is due to the transfer of heat from the hydrogenation side to the dehydrogenation
side. The rise in the temperature inside the catalyst pellet is ~35 K, and this is maintained
as the exit of the reactor is approached.
As far as the effective component diffusivities are concerned, it is observed that hydrogen
maintains the same performance due to its highest effective diffusivity. An increase in the
effective diffusivities of most components is also observed as the dimensionless radial

113
distance ω goes to 0 when the profiles of isothermal catalyst pellets are compared to
those for non-isothermal pellets. For nitrobenzene, the effective diffusivities decrease
slightly at the surface of the catalyst and inside the catalyst as a result of being consumed
in the bulk and inside the catalyst. Aniline effective diffusivities, however, increase at the
surface of the catalyst pellets as the exit of the reactor is approached and inside the
catalyst pellets as the centre is approached due to its production in the bulk, as well as
inside the catalyst. The temperature rise for the non-isothermal catalyst pellets also plays
an important role in enhancing the diffusivities of aniline.
4.4.8. Effect of intraparticle diffusion resistance on optimal reactor design
In chapter 3, the bi-objective optimization problem of this coupled membrane reactor was
addressed. The two objective functions considered were: (i) the yield of styrene on the
dehydrogenation side, and (ii) the conversion of nitrobenzene on the hydrogenation side.
The homogenous reactor model was used for the calculations. 12 operating and design
parameters were used to optimize the objectives considering a number of linear and
nonlinear constraints. The Pareto set, representing the set of optimal solutions, was
obtained by similar approaches as in Filip et al. (2009) using two numerical scalarisation
based multi-objective techniques: the normalized normal constrained method and the
normal boundary intersection method. In this optimization problem, the production of
styrene on the dehydrogenation side can be increased by maximizing the yield of styrene
whereas the production of aniline can be increased on the hydrogenation side by
maximizing the conversion of nitrobenzene. Optimal solutions are summarized in Table
4.5 representing three cases where the focus is on: (i) production of styrene only (solution
A), (ii) production of both styrene and aniline (solution B), and (iii) production of aniline
only (solution C).
Testing the heterogeneous reactor model developed for the membrane reactor has
revealed differences in the values of both objectives, i.e. styrene yield and nitrobenzene
conversion, for all three optimal solutions. For instance, the homogenous model predicts
a styrene yield of 0.975 on the dehydrogenation side for solution A, whereas the

114
heterogeneous predicts 0.930 for the isothermal catalyst pellets and 0.925 for the
non-isothermal pellets. On the hydrogenation side, the pseudo-homogeneous model
predicts a nitrobenzene conversion of 0.211, whereas the heterogeneous model predicts
0.208 for isothermal pellets and 0.202 for non-isothermal pellets. For solution B, the
homogenous model predicts a styrene yield of 0.564 on the dehydrogenation side,
whereas the heterogeneous model 0.518 for isothermal pellets and 0.488 for non-
isothermal catalyst pellets. The nitrobenzene conversion predicted on the hydrogenation
side is 0.555 by the homogenous model, 0.508 by the heterogeneous model for the
isothermal catalyst pellets, and 0.477 by the heterogeneous model for the non-isothermal
catalyst pellets. For solution C, the styrene yield predicted on the dehydrogenation side
by the homogenous model is 0.491, 0.428 by the heterogeneous model for the isothermal
pellets, and 0.396 by heterogeneous model for the non-isothermal pellets. On the
hydrogenation side, the predicted nitrobenzene conversion is 0.796 from the homogenous
model, 0.720 from the heterogeneous model for isothermal pellets, and 0.675 by the
heterogeneous model for non-isothermal pellets. There are also significant differences in
temperature profiles along both sides of the reactor. These differences may result in
overestimating the design and operating parameters due to neglecting important effects
caused by the intraparticle diffusion resistance. Styrene yield, nitrobenzene conversion
and temperature profiles on both sides of the reactor are plotted in Figure 4.13.
In summary, the pseudo-homogeneous model systematically overestimates the
conversion and yield by 5 to 15% of their actual values. However, the computation times
required for one simulation of the pseudo-homogeneous model and the heterogeneous
non-isothermal model are less than 4 seconds and around a day, respectively. Supplying
the analytical Jacobians for the boundary value problems in the catalyst pellet models as
well as using vectorization options can help significantly in reducing the execution time
to around twenty minutes. Hence, as the trends are generally well-captured by the simpler
pseudo-homogeneous model, this one may in practice serve for a preliminary rapid
screening of different alternatives or even a first systematic optimization purpose.
Nevertheless, these results must be interpreted with due care, given the model‘s tendency

115
for overestimating. Afterwards, the design and optimization can be fine-tuned based on
the more complex heterogeneous (non-isothermal) model.
4.5. Conclusions
A heterogeneous model based on Fickian diffusion for the membrane reactor, integrating
the dehydrogenation of ethylbenzene with the hydrogenation of nitrobenzene, is
developed in which the intraparticle diffusion resistance is considered, assuming both
isothermal and non-isothermal conditions. It is found that intraparticle diffusion
resistances are significant and should be taken into consideration as they not only retard
the chemical reactions, but also the driving forces for permeation, as well as the heat
transfer. The homogenous model used earlier in earlier chapters to optimize the
membrane reactor of interest results in overestimation of both the styrene yield and the
nitrobenzene conversion in the integrated reactor by 5 to 15% of their actual values.
Hence, if possible, the full model should preferably be used in any further optimization
studies. The dusty gas model, considered to be more rigorous than the Fickian diffusion
model, should also be utilized to evaluate more precisely the effect of the intraparticle
diffusion resistance.

116
Table 4.1 Stoichiometric equations, heats of reactions and reaction rate expressions for reactions considered.
Chemical Reaction Heat of Reaction Kinetic Equation Reference
Dehydrogenation Side a
6 5 2 3 6 5 2 2C H CH CH C H CHCH H mole
kJ117.6ΔH298 2
1 1
ST H
EB
A
p pr k p
K
Elnashaie et al. (1993)
42663256 HCHCCHCHHC mole
kJ105.4ΔH298 EBpkr 22 Elnashaie et al. (1993)
435623256 CHCHHCHCHCHHC mole
kJ54.6ΔH298
23 3 EB Hr k p p
Elnashaie et al. (1993)
2422 422 HCOHCOH mole
kJ210.2ΔH298
2 2 4
1 2
4 4 H O C Hr k p p
Elnashaie et al. (1993)
242 3HCOCHOH mole
kJ206.1ΔH298
2 45 5 H O CHr k p p
Elnashaie et al. (1993)
222 HCOCOOH mole
kJ41.2ΔH298 COOH pp
T
Pkr
2366
Elnashaie et al. (1993)
Hydrogenation Side b
OHNHHCHNOHC 22562256 23 mole
kJ443.0ΔH298
222
22
1 HHNBNB
HNBHNB
pKpK
ppKKkr
Amon, et al. (1999)
a partial pressure in (bars)
b partial pressure in (kPa)

117
Table 4.2 Frequency factors and activation energies for reactions considered.
Reaction kioa Ei (kJ/kmole) Reference
1b 8.32×10
3 0.909×10
5
Elnashaie et al.
(1993)
2 4.23×10⁹ 2.080×10
5
3 6.13×10³ 0.915×10
5
4 3.95×10³ 1.040×10
5
5 1.42×10² 0.657×10
5
6 5.80×10¹²
0.736×10⁵
7c
1.86×10⁻⁴
10.0×10³ Amon, et al. (1999)
a )exp(
36
10
RT
Ekk i
ioi , where kio is the pre-exponential factor for 61 i
)exp(103
RT
Ekk i
ioi , for 7i .
b The equilibrium constant is calculated by: )exp(
RT
FK A
, where:
2cTbTaF ,
3 2122725.16, 126.27 / K, 2.194 10 / Ka b c
c 21.51 10 kPaNBK ,
2
0.50.14kPaHK

118
Table 4.3 Heterogeneous model for the coupled reactor based on Fickian diffusion.
Balance
Equations Mathematical Expressions Equation
Dehydrogenation Side
Mole 1.0
6 2
31
0
3 1 2i
ij j cs s i ij
dnr d A r Na J
dz
(4.8)
Energy
1.06 2
1
0
10
1
3 1j cs sj j
i ii
H T r d A NQdT
dz n Cp
(4.9)
Pressure
G
DDg
G
dz
dP
p
g
pcg
75.111501
3
(4.10)
Hydrogenation Side (per tube)
Mole iiscsii JarAdr
dz
nd3
0.1
0
2 213
(4.11)
Energy
1.0
2
3 1
0
4
1
2 3 ' 1
Ti
i i i cs si
T
i ii
r a J Cp dT H T r d A QdT
dz n Cp
(4.12)
Pressure
3
150 111.75
g
g c p p
dP GG
dz g D D
(4.13)
Hydrogen diffusion from one hydrogenation tube per unit length
Diffusion of
Hydrogen
Across
Membrane
22
2
2
2
,exp
HHH
PH
o
H PPRT
EQ
J
where:
-3107.29oQ (mole×m)/(m2×min×atm
0.5), 61025
2
H m,
3, 105.20
2PHE J/mol
(4.14)
Heat transfer from one hydrogenation tube per unit length
Heat
Transfer
Across
Membrane
hr
r
r
r
k
r
r
r
k
r
h
TTrQ
Pdss 2
1
2
31
1
21
1
lnln1
2
where:
88.22ssk W/m×K, 3.93Pdk W/m×K
t
p
g
p
g
t
D
DGD
k
hD 6exp813.0
9.0
t
p
g
p
g
t
D
DGD
k
Dh 6.4exp50.3
7.0
(4.15)

119
Table 4.4 Dimensional and operating parameters for hybrid catalytic membrane
reactor for base case.
Parameter Values Units
Dimensional Variables
Net diameter of the
dehydrogenation side 1.95 M
Diameter of the
hydrogenation tube 3.5×10
-2 M
Total number of the
hydrogenation tubes 1500 ----
Length of the reactor 4.0 M
Operating Conditions (Dehydrogenation Side)
Ethylbenzene 10.242 mole/s
Styrene 0.1861 mole/s
Benzene 0.0306 mole/s
Toluene 0.2444 mole/s
Steam 125.86 mole/s
Temperature 880.0 K
Pressure 2.5 Bar
Catalyst density 2146.3 kg/m3
Catalyst thermal
conductivity 0.3 J/m/s
Pore diameters 4800×10-10
M
Catalyst porosity 0.35 ----
Catalyst tortuosity 4.0 ----
Bed voidage 0.48 ----
Operating Conditions per one tube (Hydrogenation Side)
Nitrobenzene 0.003 mole/s
Steam 0.008 mole/s
Temperature 900.0 mole/s
Pressure 1.0 Bar
Catalyst density 1400 kg/m3
Catalyst thermal
conductivity 0.05 J/m/s
Pore diameters 5000×10-10
M
Catalyst porosity 0.40 ----
Catalyst tortuosity 4.0 ----
Bed voidage 0.46 ----

120
Table 4.5 Representative solutions for Pareto frontier*.
Parameter Optimal
Solution A
Optimal
Solution B
Optimal
Solution C
Deh
yd
rog
enat
ion S
ide
Feed Molar of Ethylbenzene (mole/s) 7.66 9.36 11.27
Steam-to-Ethylbenzene Ratio 7.00 7.00 20.00
Feed Temperature on Shell Side (K) 825.41 780.00 820.02
Feed Pressure on Shell Side (bar) 4.00 2.52 4.00
Hy
dro
gen
atio
n S
ide
(per
tub
e)
Feed Molar of Nitrobenzene per one tube
(mole/s) 0.005 0.002 0.002
Steam-to-Nitrobenzene Ratio 4.00 4.00 4.00
Feed Temperature on Tube Side (K) 825.41 780.00 820.02
Feed Pressure on Tube Side (bar) 3.62 1.00 1.00
Dim
ensi
on
al V
aria
ble
s No. of Hydrogenation Tubes 2500 1582 1000
Equivalent-area Diameter of
Dehydrogenation Side (m) 3.00 2.39 1.95
Diameter of Hydrogenation Tube (m) 0.048 0.035 0.040
Reactor Length (m) 4.00 4.00 4.00
Yie
ld o
f S
tyre
ne
Pseudo-homogeneous Modeling 0.9747 0.5644 0.4909
Heterogeneous Modeling based on Fickian
diffusion model (Isothermal Catalyst
Pellets)
0.9300 0.5124 0.4259
Heterogeneous Modeling based on Fickian
diffusion model (Non-isothermal Catalyst
Pellets)
0.9245 0.4775 0.3859
Co
nv
ersi
on
of
Nit
rob
enze
ne
Pseudo-homogeneous Modeling 0.2119 0.5548 0.7957
Heterogeneous Modeling based on Fickian
diffusion model (Isothermal Catalyst
Pellets)
0.2078 0.5018 0.7130
Heterogeneous Modeling based on Fickian
diffusion model (Non-isothermal Catalyst
Pellets)
0.2011 0.4663 0.6594
* Bold values are constrained limits.
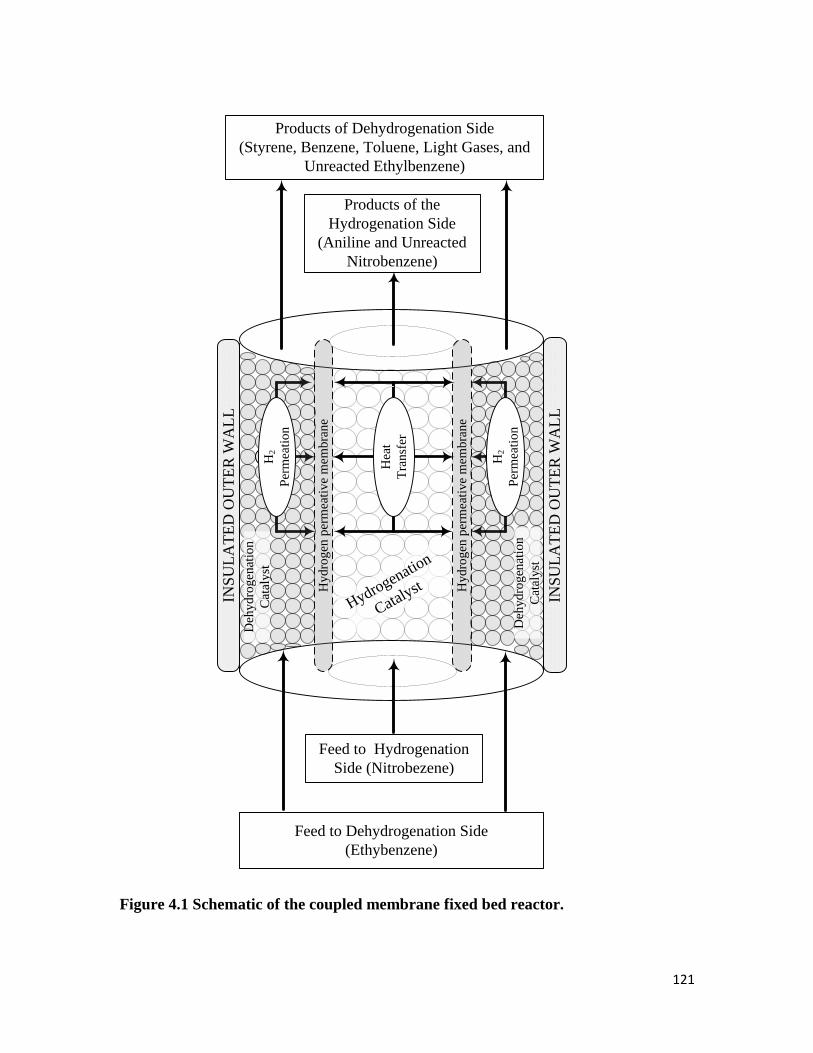
121
Feed to Dehydrogenation Side
(Ethybenzene)
Feed to Hydrogenation
Side (Nitrobezene)
INS
UL
AT
ED
OU
TE
R W
AL
L
INS
UL
AT
ED
OU
TE
R W
AL
L
Hy
dro
gen
per
mea
tiv
e m
emb
ran
e
Hy
dro
gen
per
mea
tiv
e m
emb
ran
e
H2
Per
mea
tio
n
H2
Per
mea
tio
n
Hea
t
Tra
nsf
er
Deh
yd
rog
enat
ion
Cat
aly
st
Hydrogenation
Catalyst
Deh
yd
rog
enat
ion
Cat
aly
st
Products of Dehydrogenation Side
(Styrene, Benzene, Toluene, Light Gases, and
Unreacted Ethylbenzene)
Products of the
Hydrogenation Side
(Aniline and Unreacted
Nitrobenzene)
Figure 4.1 Schematic of the coupled membrane fixed bed reactor.

122
Moles out at
y+Δy,
24 iy y
y N
Net rate of production within
differential element,
Moles in
at y,
24 iy
y N
Net rate of heat produced
within differential element,
2
1
4j
jjj
H T r y y
Heat in
at y,
24y
y q
24y y
y q
2
1
4j
ij j
j
r y y
(a) (b)
Figure 4.2 Infinitesimal slice inside catalyst pellets on dehydrogenation side showing terms considered in: (a) mole balance,
and (b) energy balance.
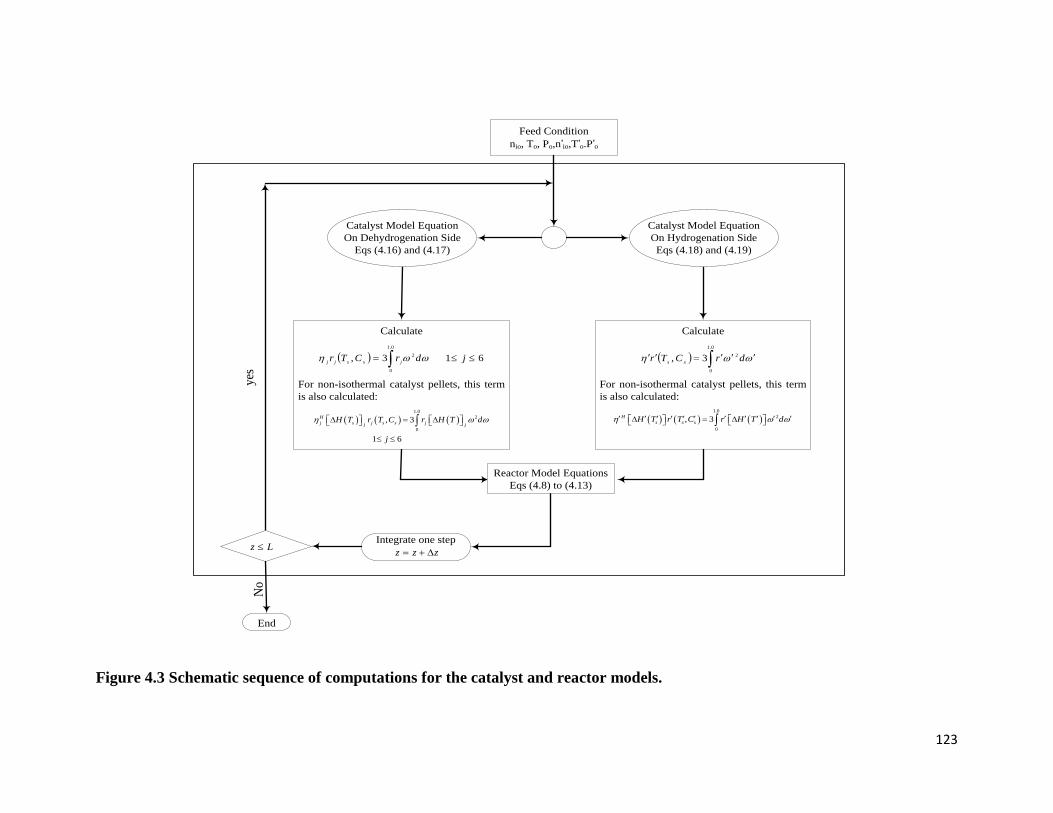
123
0.1
0
23, drCTrss
1.0
2
0
, 3H
s s sH T r T C r H T d
Lz zzz
Reactor Model Equations
Eqs (4.8) to (4.13)
1.0
2
0
, 3
1 6
H
j s j s s jj jH T r T C r H T d
j
613,
0.1
0
2 jdrCTrjssjj
Calculate
For non-isothermal catalyst pellets, this term
is also calculated:
Feed Condition
nio, To, Po,n’io,T’o.P’o
Catalyst Model Equation
On Dehydrogenation Side
Eqs (4.16) and (4.17)
Catalyst Model Equation
On Hydrogenation Side
Eqs (4.18) and (4.19)
Integrate one step
End
yes
No
Calculate
For non-isothermal catalyst pellets, this term
is also calculated:
Figure 4.3 Schematic sequence of computations for the catalyst and reactor models.

124
Dimensionless Axial Distance
0.0 0.2 0.4 0.6 0.8 1.0
Co
nver
sio
n o
f E
thyl
benz
ene
(XE
B)
0.0
0.2
0.4
0.6
0.8
1.0
Dimensionless Axial Distance
0.0 0.2 0.4 0.6 0.8 1.0
Co
nver
sio
n o
f N
itro
benz
ene
(XN
B)
0.0
0.2
0.4
0.6
0.8
1.0
(a)
(b)
Pseudo-Homogeneous Model
Heterogeneous Model
(Isothermal Case)
Heterogeneous Model
(Nonisothermal Case)
Pseudo-Homogeneous Model
Heterogeneous Model
(Nonisothermal Case)
Heterogeneous Model
(Isothermal Case)
Figure 4.4 Conversion of key components: (a) Ethylbenzene on dehydrogenation
side, and (b) Nitrobenzene on hydrogenation side.

125
Dimensionless Axial Distance
0.0 0.2 0.4 0.6 0.8 1.0
Sty
rene
Yie
ld (
YS
T)
0.0
0.2
0.4
0.6
0.8
1.0
Dimensionless Axial Distance
0.0 0.2 0.4 0.6 0.8 1.0
Ben
zene
Yie
ld (
YB
Z)
x 10
2
0.0
1.0
2.0
3.0
4.0
5.0
6.0
Dimensionless Axial Distance
0.0 0.2 0.4 0.6 0.8 1.0
To
luen
e Y
ield
(Y
TO)
x 10
2
0.0
0.2
0.4
0.6
0.8
1.0
1.2
(c)
(a) (b)
Pseudo-Homogeneous ModelPseudo-Homogeneous Model
Pseudo-Homogeneous Model
Heterogeneous Model
(Isothermal Case)
Heterogeneous Model
(Isothermal Case)
Heterogeneous Model
(Isothermal Case)
Heterogeneous Model
(Non-isothermal Case)
Heterogeneous Model
(Non-isothermal Case)
Heterogeneous Model
(Non-isothermal Case)
Figure 4.5 Yield of: (a) Styrene, (b) Benzene, and (c) Toluene on dehydrogenation side.

126
Dimensionless Axial Distance
0.0 0.2 0.4 0.6 0.8 1.0
Hyd
rogen
Mo
lar
Fo
wra
te o
n
Deh
ydro
gen
atio
n S
ide
(mo
les/
s)
0.0
0.2
0.4
0.6
0.8
1.0
1.2
Pseudo-Homogeneous Model
Heterogeneous Model
(Isothermal Case)
Heterogeneous Model
(Non-isothermal Case)
Dimensionless Axial Distance
0.0 0.2 0.4 0.6 0.8 1.0
Hyd
rogen
Mo
lar
Fo
wra
te o
n
Hyd
rogen
atio
n S
ide
(mo
les/
s)
x 10
4
0.0
0.5
1.0
1.5
2.0
2.5
Heterogeneous Model
(Non-isothermal Case)
Heterogeneous Model
(Isothermal Case)
Pseudo-Homogeneous Model
(a)
(b)
Figure 4.6 Hydrogen molar flowrates on: (a) dehydrogenation side, and (b)
hydrogenation side.
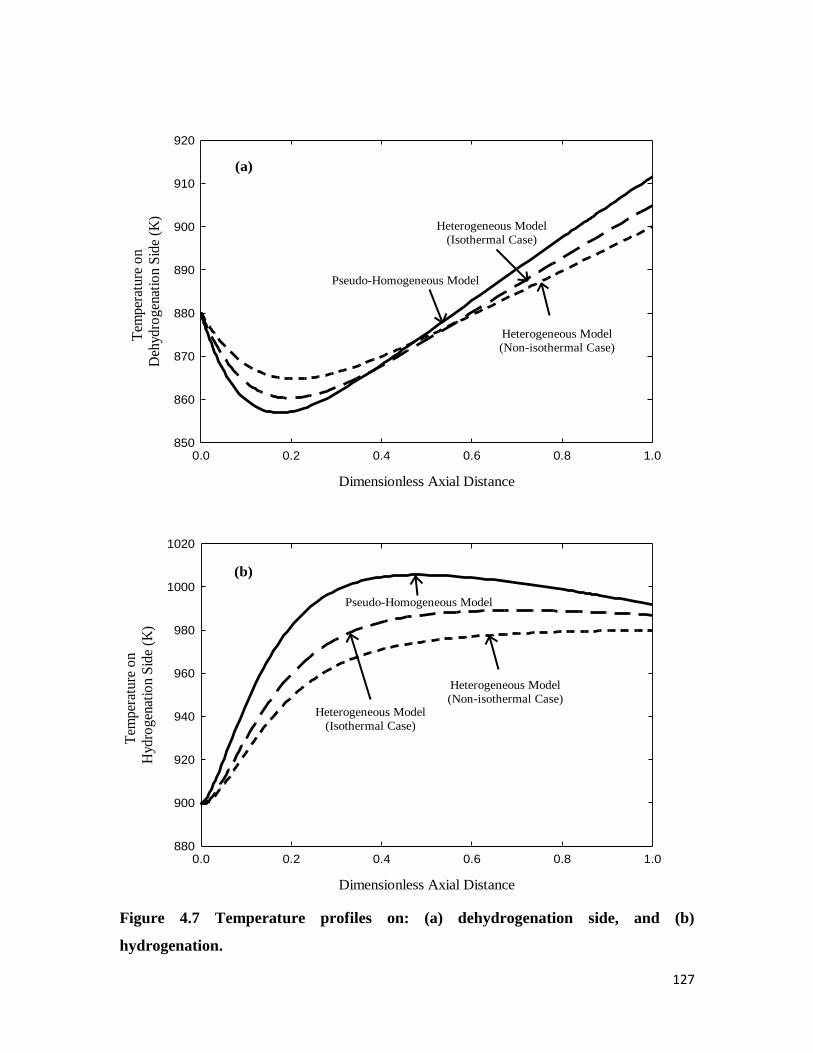
127
Dimensionless Axial Distance
0.0 0.2 0.4 0.6 0.8 1.0
Tem
per
atu
re o
n
Deh
ydro
gen
atio
n S
ide
(K)
850
860
870
880
890
900
910
920
Dimensionless Axial Distance
0.0 0.2 0.4 0.6 0.8 1.0
Tem
per
atu
re o
n
Hyd
rog
enat
ion S
ide
(K)
880
900
920
940
960
980
1000
1020
Heterogeneous Model
(Non-isothermal Case)
Heterogeneous Model
(Non-isothermal Case)
Heterogeneous Model
(Isothermal Case)
Pseudo-Homogeneous Model
Pseudo-Homogeneous Model
Heterogeneous Model
(Isothermal Case)
(a)
(b)
Figure 4.7 Temperature profiles on: (a) dehydrogenation side, and (b)
hydrogenation.
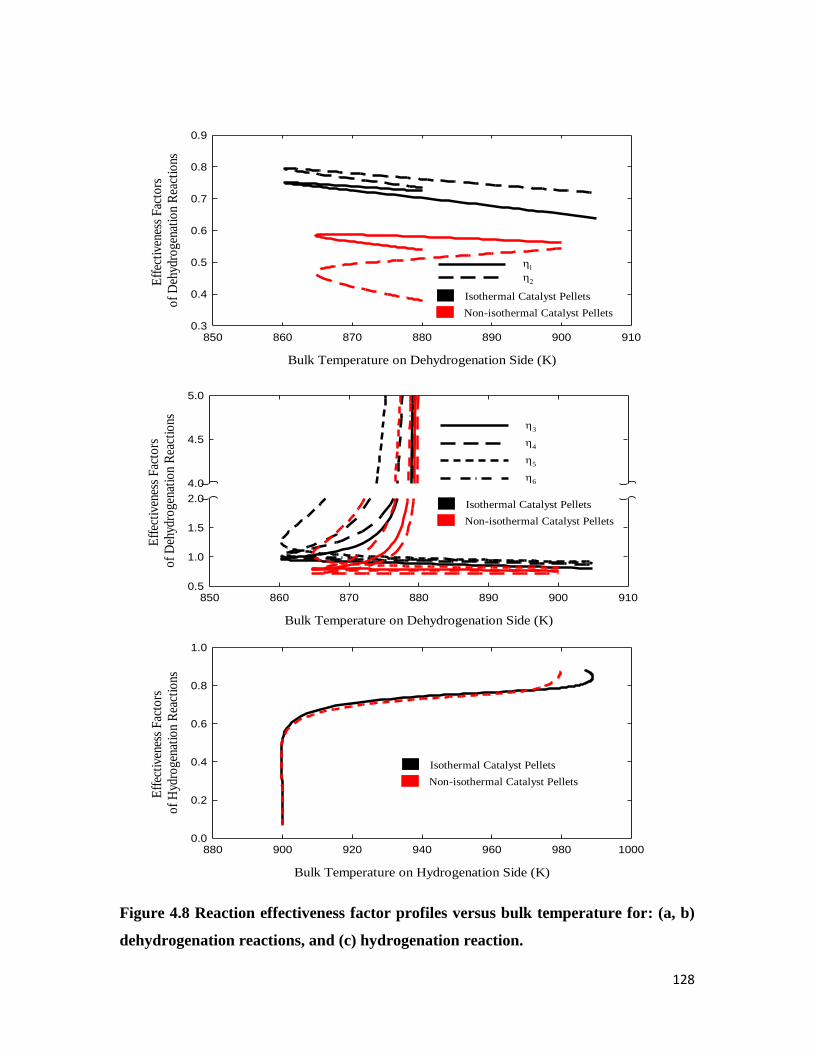
128
Bulk Temperature on Dehydrogenation Side (K)
850 860 870 880 890 900 910
Eff
ecti
vene
ss F
acto
rs
of
Deh
ydro
gena
tio
n R
eact
ions
0.3
0.4
0.5
0.6
0.7
0.8
0.9
Isothermal Catalyst Pellets
Non-isothermal Catalyst Pellets
Bulk Temperature on Dehydrogenation Side (K)
850 860 870 880 890 900 910
Eff
ecti
vene
ss F
acto
rs
of
Deh
ydro
gena
tio
n R
eact
ions
0.5
1.0
1.5
2.0
4.0
4.5
5.0
3
4
5
6
Isothermal Catalyst Pellets
Non-isothermal Catalyst Pellets
Bulk Temperature on Hydrogenation Side (K)
880 900 920 940 960 980 1000
Eff
ecti
vene
ss F
acto
rs
of
Hyd
roge
nati
on
Rea
ctio
ns
0.0
0.2
0.4
0.6
0.8
1.0
Isothermal Catalyst Pellets
Non-isothermal Catalyst Pellets
Figure 4.8 Reaction effectiveness factor profiles versus bulk temperature for: (a, b)
dehydrogenation reactions, and (c) hydrogenation reaction.

129
Bulk Temperature on Dehydrogenation Side (K)
850 860 870 880 890 900 910
Rea
ctio
n R
ate
(1
),
(m
ole
/kg
cat/
s) x
10
4
2
4
6
8
10
12
14
16
18
20
Bulk Temperature on Dehydrogenation Side (K)
850 860 870 880 890 900 910
Rea
ctio
n R
ate
(2
),
(mole
/kg
cat/
s) x
10
4
0.0
0.2
0.4
0.6
0.8
1.0
1.2
Bulk Temperature on Dehydrogenation Side (K)
850 860 870 880 890 900 910
Rea
ctio
n R
ate
(3
),
(m
ole
/kg
cat/
s) x
10
4
0.00
0.02
0.04
0.06
0.08
0.10
0.12
Bulk Temperature on Dehydrogenation Side (K)
850 860 870 880 890 900 910
Rea
ctio
n R
ate
(4
),
(mole
/kg
cat/
s) x
10
4
0.0
0.1
0.2
0.3
0.4
0.5
Bulk Temperature on Dehydrogenation Side (K)
850 860 870 880 890 900 910
Rea
ctio
n R
ate
(5
),
(mole
/kg
cat/
s) x
10
4
0.00
0.01
0.02
0.03
0.04
0.05
0.06
0.07
Bulk Temperature on Dehydrogenation Side (K)
850 860 870 880 890 900 910
Rea
ctio
n R
ate
(6
),
(mole
/kg
cat/
s) x
10
4
0.0
0.2
0.4
0.6
0.8
1.0
Bulk Temperature on Hydrogenation Side (K)
880 900 920 940 960 980 1000
Hyd
rog
enati
on
Rea
ctio
n
Rate
, (
mole
/kg
cat/
s) x
10
4
0.0
2.0
4.0
6.0
8.0
10.0
12.0
Actual Reaction Rates
Reaction Rate at Catalyst Surface
Isothermal Catalyst Pellets
Non-isothermal Catalyst Pellets
Figure 4.9 Actual reaction rates and their values at surface conditions versus bulk
temperature for all reactions.
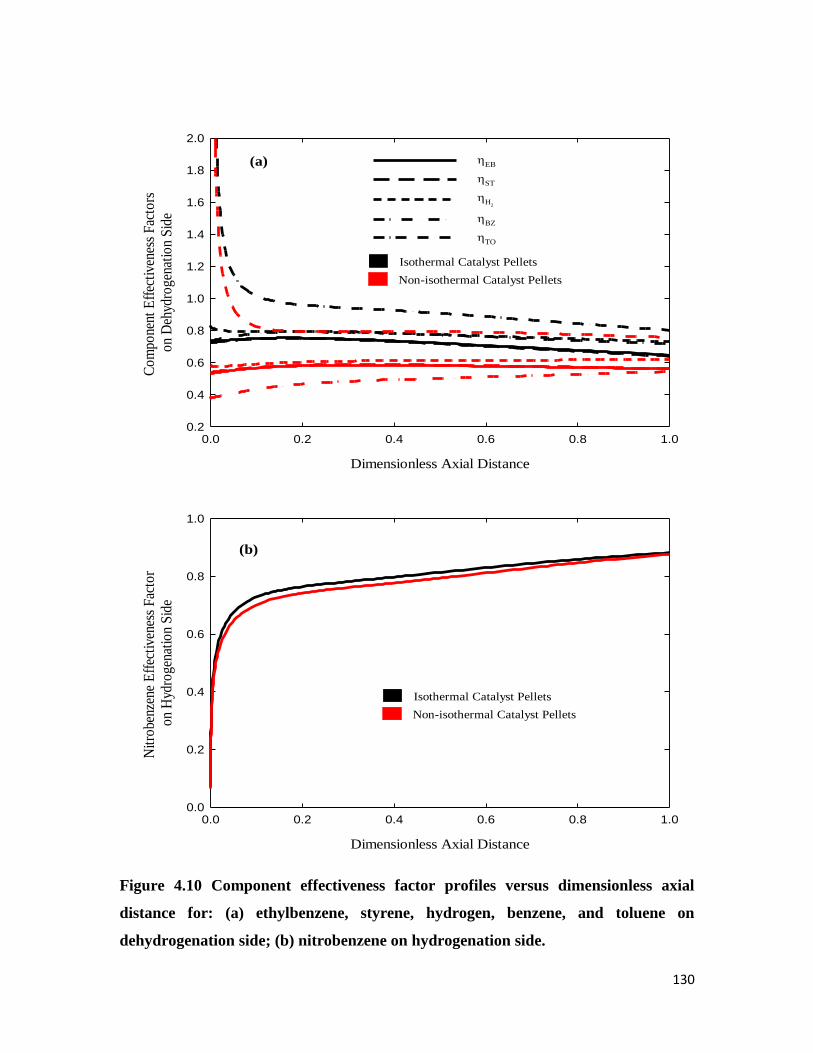
130
Dimensionless Axial Distance
0.0 0.2 0.4 0.6 0.8 1.0
Co
mpo
nent
Eff
ecti
vene
ss F
acto
rs
on
Deh
ydro
gena
tio
n S
ide
0.2
0.4
0.6
0.8
1.0
1.2
1.4
1.6
1.8
2.0
Isothermal Catalyst Pellets
Non-isothermal Catalyst Pellets
EB
ST
H
2
BZ
TO
Dimensionless Axial Distance
0.0 0.2 0.4 0.6 0.8 1.0
Nit
robe
nzen
e E
ffec
tive
ness
Fac
tor
on
Hyd
roge
nati
on
Sid
e
0.0
0.2
0.4
0.6
0.8
1.0
Isothermal Catalyst Pellets
Non-isothermal Catalyst Pellets
(a)
(b)
Figure 4.10 Component effectiveness factor profiles versus dimensionless axial
distance for: (a) ethylbenzene, styrene, hydrogen, benzene, and toluene on
dehydrogenation side; (b) nitrobenzene on hydrogenation side.

131
0.0 0.2 0.4 0.6 0.8 1.0
Com
pone
nt D
iffu
sivi
ties,
(cm
2 /hr)
36404448525660
350
360
370
380
390
400
Dimensionless Radial Distance,
0.0 0.2 0.4 0.6 0.8 1.0
Com
pone
nt D
iffu
sivi
ties,
(cm
2 /hr)
36404448525660
350
360
370
380
390
400
Dimensionaless Radial Distance,
0.0 0.2 0.4 0.6 0.8 1.0
Com
pone
nt M
ole
Frac
tion
0.00
0.01
0.02
0.03
0.04
0.05
0.06
0.07
Dimensionless Radial Distance,
0.0 0.2 0.4 0.6 0.8 1.0
Com
pone
nt M
ole
Frac
tion
0.00
0.01
0.02
0.03
0.04
0.05
0.06
0.07
Dimensionless Radial Distance,
0.0 0.2 0.4 0.6 0.8 1.0
Dimensionless Radial Distance,
0.0 0.2 0.4 0.6 0.8 1.0
Tem
pera
ture
(K
)
810
820
830
840
850
860
870
880
890
900
EBST
H2 TO BZ
Dimensionless Radial Distance,
0.0 0.2 0.4 0.6 0.8 1.0
Dimensionless Radial Distance,
0.0 0.2 0.4 0.6 0.8 1.0
ST
BZ
EB
H2
TO
H2
H2
H2
BZ
EB
STTO
BZ
EB ST
TO BZ
EB
STTO
Dimensionless Radial Distance,
Tem
pera
ture
(K
)
810
820
830
840
850
860
870
880
890
900
EB
ST
H2BZ TO
z/L ~ 0.1
z/L ~ 0.1
z/L ~ 0.1
z/L ~ 0.5
z/L ~ 0.5
z/L ~ 0.5
z/L ~ 0.8
z/L ~ 0.8
z/L ~ 0.8
Isothermal Catalyst Pellet Case
Non-isothermal Catalyst Pellet Case
Dimensionless Radial Distance,
Figure 4.11 Intraparticle profiles of component mole fraction, temperature and component effective diffusivities at fractional
lengths of 0.1, 0.5, and 0.80 for both the isothermal and non-isothermal catalyst pellet case on dehydrogenation side.

132
Dimensionless Radial Distance,
0.0 0.2 0.4 0.6 0.8 1.0
Dimensionless Radial Distance,
0.0 0.2 0.4 0.6 0.8 1.0
Dimensionless Radial Distance,
0.0 0.2 0.4 0.6 0.8 1.0
Tem
pera
ture
(K)
920
930
940
950
960
970
980
990
1000
1010
1020
1030
Dimensionless Radial Distance,
0.0 0.2 0.4 0.6 0.8 1.0
Tem
pera
ture
(K)
920
930
940
950
960
970
980
990
1000
1010
1020
1030
Dimensionless Radial Distance,
0.0 0.2 0.4 0.6 0.8 1.0
Com
pone
nt D
ifusiv
ities
(cm
2 /hr)
90
100
110
120
130
140
750
780
810
840
870
900
Dimensionless Radial Distance,
0.0 0.2 0.4 0.6 0.8 1.0
Com
pone
nt D
ifusiv
ities
(cm
2 /hr)
90
100
110
120
130
140
750
780
810
840
870
900
NB
NB
H2
H2
AN
AN
z/L ~ 0.5z/L ~ 0.1
z/L ~ 0.8
z/L ~ 0.8z/L ~ 0.1
Dimensionless Radial Distance,
0.0 0.2 0.4 0.6 0.8 1.0
Com
pone
nt M
ole
Frac
tion
0.00
0.05
0.10
0.15
0.20
0.25
0.30
Dimensionless Radial Distance,
0.0 0.2 0.4 0.6 0.8 1.0
Dimensionless Radial Distance,
0.0 0.2 0.4 0.6 0.8 1.0
Com
pone
nt M
ole
Frac
tion
0.00
0.05
0.10
0.15
0.20
0.25
0.30
NB
H2
AN
AN
NB
H2 NB H2
AN
z/L ~ 0.1
z/L ~ 0.5
z/L ~ 0.8
H2
NBAN
z/L ~ 0.5
Isothermal Catalyst Pellet Case
Non-isothermal Catalyst Pellet Case
Figure 4.12 Intraparticle profiles of component mole fraction, temperature and component effective diffusivities at fractional
lengths of 0.1, 0.5, and 0.80 for both the isothermal and non-isothermal catalyst pellet case on hydrogenation side.

133
Dimensionless Axial Distance
0.0 0.2 0.4 0.6 0.8 1.0
Styr
ene
Yie
ld
0.0
0.1
0.2
0.3
0.4
0.5
Dimensionless Axial Distance
0.0 0.2 0.4 0.6 0.8 1.0
Styr
ene
Yie
ld
0.0
0.2
0.4
0.6
0.8
Dimensionless Axial Distance
0.0 0.2 0.4 0.6 0.8 1.0
Styr
ene
Yie
ld
0.0
0.2
0.4
0.6
0.8
1.0
Pseudo-Homogeneous model
Heterogeneous model (Isothermal catalyst pellets)
Heterogeneous model (Non-isothermal catalyst pellets)
Dimensionless Axial Distance
0.0 0.2 0.4 0.6 0.8 1.0
Nit
robe
nzen
e C
onve
rsio
n
0.00
0.05
0.10
0.15
0.20
0.25
Dimensionless Axial Distance
0.0 0.2 0.4 0.6 0.8 1.0
Tem
pera
ture
Pro
file
s (K
)
760
780
800
820
840
860
880
900
920
Dimensionless Axial Distance
0.0 0.2 0.4 0.6 0.8 1.0N
itro
benz
ene
Con
vers
ion
0.0
0.1
0.2
0.3
0.4
0.5
0.6
Dimensionless Axial Distance
0.0 0.2 0.4 0.6 0.8 1.0
Tem
pera
ture
Pro
file
s (K
)
740
760
780
800
820
840
860
880
900
920
Dimensionless Axial Distance
0.0 0.2 0.4 0.6 0.8 1.0
Nit
robe
nzen
e C
onve
rsio
n
0.0
0.2
0.4
0.6
0.8
1.0
Dimensionless Axial Distance
0.0 0.2 0.4 0.6 0.8 1.0
Tem
pera
ture
Pro
file
s (K
)
800
820
840
860
880
900
920
Dehydrogenation
SideHydrogenation
SideHydrogenation
Side
Hydrogenation
SideDehydrogenation
SideDehydrogenation
Side
(a)
(b)
(c)
(d)
(e)
(f)
(g)
(h)
(i)
Figure 4.13 Styrene yield, nitrobenzene conversion, and temperature profiles for the optimal designs of the coupled membrane
reactor, i.e. solution A (a, b, c), solution B (d, e, f), solution C (g, h, i).

134
4.6. References
Abashar, M. E. E., 2004. Coupling of ethylbenzene dehydrogenation and benzene
hydrogenation reactions in fixed bed catalytic reactors, Chemical Engineering
and Processing 43(10), 1195-1202.
Abdalla, B. K., Elnashaie, S. S. E. H., 1995. Fluidized bed reactors without and with
selective membranes for the catalytic dehydrogenation of ethylbenzene to
styrene, Journal of Membrane Science 101(1-2), 31-31.
Abdalla, B. K., Elnashaie, S. S. E. H., 1993. A membrane reactor for the production of
styrene from ethylbenzene, Journal of Membrane Science 85(3), 229-239.
Abdalla, B. K., Elnashaie, S. S. E. H., 1994. Catalytic dehydrogenation of ethylbenzene
to styrene in membrane reactors, AICHE Journal 40(12), 2055-2059.
Czechowicz, D., Skutil, K., Torz, A., Taniewski, M., 2004. An integrated process of
oxidative coupling of methane and pyrolysis of naphtha in a scaled-up unit,
Journal of Chemical Technology and Biotechnology 79(2), 182-186.
Elnashaie, S. S. E. H., Moustafa, T., Alsoudani, T., Elshishini, S. S., 2000. Modeling and
basic characteristics of novel integrated dehydrogenation-hydrogenation
membrane catalytic reactors, Computers & Chemical Engineering 24(2-7), 1293-
1300.
Elnashaie, S. S. E. H., Abdalla, B. K., Hughes, R., 1993. Simulation of the industrial
fixed bed catalytic reactor for the dehydrogenation of ethylbenzene to styrene:
Heterogeneous dusty gas model, Industrial and Engineering Chemistry Research
32(11), 2537-2541.
Logist F, Van Erdeghem PMM, Van Impe JF. Efficient deterministic multiple objective
optimal control of (bio)chemical processes. Chemical Engineering Science 2009;
64(11):2527-38.
Fukuhara, C., Igarashi, A., 2005. Performance simulation of a wall-type reactor in which
exothermic and endothermic reactions proceed simultaneously, comparing with
that of a fixed-bed reactor, Chemical Engineering Science 60(24), 6824-6834.

135
Glockler, B., Kolios, G., Eigenberger, G., 2003. Analysis of a novel reverse-flow reactor
concept for autothermal methane steam reforming, Chemical Engineering Science
58(3-6), 593-601.
Hermann, C., Quicker, P., Dittmeyer, R., 1997. Mathematical simulation of catalytic
dehydrogenation of ethylbenzene to styrene in a composite palladium membrane
reactor, Journal of Membrane Science 136(1-2), 161-172.
Moustafa, T. M., Elnashaie, S. S. E. H., 2000. Simultaneous production of styrene and
cyclohexane in an integrated membrane reactor, Journal of Membrane Science
178(1-2), 171-184.
Bird R. B., Stewart W.E., Lightfoot E.N., 1960. Transport Phenomena. : Wiley: New
York.
Stitt, E. H., 2004. Multifunctional reactors? 'Up to a point Lord Copper', Chemical
Engineering Research and Design 82(2), 129-139.
van Sint Annaland, M., Nijssen, R. C., 2002. A novel reverse flow reactor coupling
endothermic and exothermic reactions: an experimental study, Chemical
Engineering Science 57(22-23), 4967-4985.
Van, S. A., Scholts, H. A. R., Kuipers, J. A. M., Van Swaaij, W. P. M., 2002. A novel
reverse flow reactor coupling endothermic and exothermic reactions. Part II:
Sequential reactor configuration for reversible endothermic reactions, Chemical
Engineering Science 57(5), 855-872.

136
CHAPTER 5 COMPARISON OF DIFFUSION MODELS IN
MODELLING A CATALYTIC MEMBRANE FIXED BED REACTOR
COUPLING DEHYDROGENATION OF ETHYLBENZENE WITH
HYDROGENATION OF NITROBENZENE†
5.1. Introduction
Membrane reactors can significantly improve the production rates of thermodynamically-
limited reactions. Hydrogen-selective membranes permit hydrogen produced by reactions
to escape under the influence of the difference in the hydrogen partial pressures to the
permeate side where an inert gas such as nitrogen can be used to purge hydrogen. This
type of reactor is promising for thermodynamically limited reactions such as steam
reforming. A number of studies have reported that when steam reforming is operated in
membrane reactors, hydrogen yields can exceed those in simple fixed bed reactors
(Balasubramanian et al., 1999; Chen and Elnashaie, 2005; Chen et al., 2003; Itoh et al.,
2003; Rakib et al., 2008; Tiemersma et al., 2006; Uemiya et al., 1990).
Another type of reaction suffering from thermodynamic limitations is the one involving
the production of olefins from inexpensive paraffins via dehydrogenation. Shifting the
equilibrium production rate of these thermodynamically-limited dehydrogenation
reactions was the objective of a number of studies reported in the last decade. Several
reactor configurations and models have stimulated these configurations. In general, the
hydrogen membranes facilitate hydrogen transfer to the permeate side where it is
collected by a sweep gas (Hermann et al., 1997; Itoh et al., 2003) or utilized as a reactant
in complementary reactions (Abdalla et al., 1997; Elnashaie et al., 2000; Itoh and Wu,
1997; Moustafa and Elnashaie, 2000).
† A version of this chapter has been submitted for publication.

137
Dehydrogenation of ethylbenzene to styrene and hydrogenation of nitrobenzene to aniline
complement each other and constitute a synergistic pair of reactions to couple in a
catalytic membrane fixed bed reactor. Diffusion of hydrogen produced on the
dehydrogenation side through hydrogen-selective membranes assists greatly in shifting
forward the equilibrium conversion of ethylbenzene, while simultaneously improving the
yield of styrene compared with fixed bed reactors without membranes. Combining the
two reactions in this manner helps to significantly increase the production of styrene on
the dehydrogenation side and to produce aniline as a second useful product on the
hydrogenation side. Transferring the heat released from the hydrogenation side to the
dehydrogenation side also helps to promote the forward dehydrogenation reaction of
ethylbenzene, consequently enhancing the styrene yield (see chapter 2). In this
configuration, it is possible to boost the styrene yield from ~40% in catalytic industrial
reactors (Moustafa and Elnashaie, 2000) to ~98% in an optimized catalytic membrane
reactor (see chapter 3).
Abo-Ghander et al. (2010) briefly assessed the effect of the intraphase transport by
considering diffusion inside the catalyst pellets on both sides of the coupled membrane
reactor. The Fickian diffusion model was used in which the reactants are assumed to
diffuse through a stagnant bulk phase with the diffusivities of components in the reacting
mixture along the radial direction inside the catalyst pellets evaluated by the well-known
Wilke equation. The predictions of the heterogeneous model are significantly less than
that of the pseudo-homogeneous model, providing an indication of the importance of the
intraparticle transport resistances.
In catalytic packed bed reactors, the components in reacting mixtures have to diffuse
through tortuous complex networks of pores ranging from macropores to micropores to
reach active sites, where they react. Hence, the selection of an appropriate diffusion
model accounting for intraphase resistances is highly important when modeling these
types of reactors. The Fickian diffusion model is considered to yield accurate predictions
if the reacting component diffuses in a large excess of a second component and there is
no appreciable change in the number of moles. In contrast, the dusty gas model is

138
considered to be more general and more rigorous, but also more complex. As the
assumptions for Fickian diffusion may not always be met in the studied reactor
(Elnashaie and Abashar, 1993; Elnashaie et al., 1993), the aim of this chapter is not only
to rigorously evaluate the effect of intraparticle diffusion, but also to compare the Fickian
diffusion and the dusty gas models. Moreover, the differences between the predictions of
isothermal versus non-isothermal catalyst pellets are studied.
Section 5.2 introduces the reactor configuration, while Section 5.3 describes the reactor
models and focuses especially on the incorporation of intraphase resistances based on the
Fickian diffusion and the dusty gas model. Section 5.4 presents and compares the
simulation results for all models. Finally, Section 5.5 summarizes the main conclusions.
5.2. Reactor Configuration
A conceptual schematic of the integrated reactor proposed in chapter 2 appears in Figure
5.1. The reactor is composed of two compartments provided by a shell containing a
bundle of hydrogenation tubes. On the shell side, dehydrogenation of ethylbenzene takes
place producing styrene and hydrogen. Five side reactions also occur, producing benzene,
toluene, and light gases like ethylene, methane, carbon monoxide, and carbon dioxide.
The stoichiometric equations on the shell side can be expressed as:
22563256 HCHCHHCCHCHHC 298
kJ117.6
moleH (5.1)
42663256 HCHCCHCHHC 298
kJ105.4
moleH (5.2)
435623256 CHCHHCHCHCHHC 298
kJΔH 54.6
mole (5.3)
2422 422 HCOHCOH 298
kJ210.2
moleH (5.4)
242 3HCOCHOH 298
kJ206.1
moleH (5.5)

139
222 HCOCOOH 298
kJΔH = 41.2
mole (5.6)
In industrial fixed bed reactors producing styrene, the temperature tends to drop along the
reactor due to the endothermic nature of the main reaction if sufficient heat is not
supplied. In the proposed membrane reactor, hydrogen produced on the shell side diffuses
through a palladium hydrogen-selective-membranes to the tube side where it intermingles
with a feed stream containing only nitrobenzene and steam. The membrane wall
considered is made up of two layers: a layer of stainless steel of a thickness 0.0012 m,
coated by a palladium layer of a thickness 20×10-6
m.
Inside the membrane tubes, cocurrently flowing nitrobenzene reacts with hydrogen to
produce aniline as a second major useful product from the integrated membrane reactor.
6 5 2 2 6 5 2 23 2C H NO H C H NH H O 298
kJΔH = 443.0
mole (5.7)
This hydrogenation reaction is irreversible and highly exothermic. The heat generated by
this reaction is transferred through the membrane layer and heats the reacting mixture on
the dehydrogenation side.
The catalyst on the shell side is composed of iron oxide (Fe2O3) promoted by potassium
carbonate (K2CO3) and chromium oxide (Cr2O3), whereas that on the tube side is a
palladium catalyst supported on an α-alumina carrier. Tables 5.1 and 5.2 summarize the
kinetics, frequency factors and activation energies (Amon et al., 1999; Elnashaie et al.,
1993).
5.3. Reactor Model
The differential equations governing the behavior of different chemical species on both
sides of the reactor, as well as the temperature profiles are derived considering two

140
infinitesimal slices across which exchanges of moles and energy take place. The
following assumptions are adopted.
1. Steady state operation.
2. Ideal gas behavior on both the shell and tube compartments.
3. Plug flow for the fixed beds on both the shell and tube sides, with Peclet numbers
~1000.
4. Heterogeneous model, i.e. there are concentration and temperature gradients
within the catalyst particles.
5. The flow rates on both sides are large enough to minimize external mass and heat
transfer resistances. Only intraparticle diffusion is considered.
6. The reactor external wall is insulated leading to an adiabatic reactor.
7. Catalyst deactivation is neglected.
8. Pressure gradients along both compartments are estimated based on Ergun‘s
equation.
Along the integrated membrane reactor, hydrogen diffuses from the dehydrogenation side
to the hydrogenation side while heat is transferred from the hydrogenation to the
dehydrogenation side. The reactor model equations and the rates of both hydrogen
diffusion and heat transfer per unit length are given in Table 5.3.
5.3.1. Diffusion inside catalyst pellets
Fixed bed reactors suffer from diffusion limitations resulting in temperature and
concentration gradients between the bulk and surface of the catalysts (external mass and
heat transfer), and between the surface of the catalyst pellets and the active sites inside
the catalysts (intraparticle mass and heat transfer). Consequently, the concentration and
temperature profiles between those phases are not flat anymore causing the pseudo-
homogeneous model predictions to be not always highly accurate (Elnashaie and
Elshishini, 1993).

141
Operating the reactor at high flow rates can greatly enhance the external mass and heat
transfer coefficients, consequently minimizing the effect of external mass and heat
transfer resistances. The effect of the intraparticle heat and mass transfer resistances,
however, cannot be reduced due to the significant size of the catalyst pellets, ranging
from 6 to 14 mm. As a result, neglecting the effect of the intraparticle resistance when
modeling fixed bed reactors may result in a considerable discrepancy between the model
predictions and reality (Elnashaie and Alhabdan, 1989).
Two diffusion models are commonly used to account for the intraparticle mass transfer
resistance, namely the Fickian diffusion model and the dusty gas model. The Fickian
diffusion model is in general less accurate, but is the most widely used due to its
simplicity (Veldsink et al., 1995). It can be easily derived from the dusty gas model after
neglecting the effect of the ratio of component molar fluxes. This approximation reduces
the accuracy of the Fickian diffusion model especially in reactive systems subject to
changes in molar flow rates.
The dusty gas model is more rigorous than the Fickian diffusion model. It is considered
to be the most rigorous of the models for investigated treating diffusion in non-ideal
systems and for systems influenced by external force fields (Krishna and Wesselingh,
1997). It can also be used to model diffusion in macro- and micro-porous catalysts
(Veldsink et al., 1995), adsorbents (Krishna, 1990) and membranes (Beuscher and
Gooding, 1999). The porous medium is treated in the dusty gas model as composed of
giant fixed molecules uniformly distributed in space, and referred to as dust and treated as
one component of the gas mixture. The model has been used widely in the modeling of
reactive systems involving gases.
Both models have been used by a number of researchers to predict the diffusion inside
catalysts. For example, the Fickian diffusion model was used by Wang et al. (2001) to
model diffusion inside non-isothermal catalysts in Fischer-Tropsch synthesis. Diffusion
inside the catalyst pellets has been studied for steam reforming of methane based on the
Fickian diffusion model, the dusty gas model and another simplified model derived from

142
the dusty gas model. Because the reaction is characterized by high diffusion limitations, a
deviation in the predictions of the Fickian diffusion model and a (simplified) dusty gas
model was observed at high steam-to-methane ratios. The dusty gas model is
recommended for rigorous predictions of the influence of intraparticle diffusion (Abashar
and Elnashaie, 1993; Elnashaie et al., 1992; Elnashaie and Abashar, 1993; Soliman et al.,
1988).
5.3.1. Diffusion models for catalyst pellets
The molar and energy fluxes inside the catalyst pellets are estimated based on the
following assumptions:
1. Steady-state molar and energy flow.
2. Particles are spherical and their porous structure is isentropic.
3. Ideal gas law.
4. Concentration and temperature profiles within the catalyst particles are spherically
symmetrical.
5. External mass and heat transfer resistances are negligible due to the high gas flow
rates.
6. Negligible viscous flow inside the catalyst particles; the pellets are isobaric.
7. Convective diffusion is neglected, only ordinary molecular and Knudsen diffusion
are significant for gas motion within the solid particles.
8. Convective energy transfer is negligible.
9. Thermal conductivities of the catalyst pellets are constant on both sides of the
reactor.
To obtain the dusty gas model describing the diffusion inside the catalyst pellets, the
molar and energy fluxes around a small shell inside the catalyst pellet on the
dehydrogenation side are considered as shown in Figure 5.2. Applying the balance
equations around the shell with no accumulation leads to:

143
6
2 2 2
1
4 4 4 0i i ij jy y y
j
y N y N r y y
(5.16)
6
2 2 2
1
4 4 4 0jy y y
j
y q y q H T r y y
(5.17)
When the shell thickness approaches zero, equations (5.16) and (5.17) become:
6
1
2ii ij j
j
dNN r
dy y
(5.18)
6
1
2jj
j
dqq H T r
dy y
(5.19)
Expressing the heat flux in equation (5.19) by Fourier‘s law leads to:
2 6
21
2 1jj
je
d T dTH T r
dy y dy k
(5.20)
The molar flux in equation (5.18) is related to the component mole fractions by the
Stefan-Maxwell diffusion equation. When the pressure drop is neglected, this can be
written (Veldsink et al., 1995) as:
10
1
i j j i ii e e
j ij ikj i
x N x N NPx
RT D D
(5.21)
For a one-dimensional problem in spherical coordinates, equation (5.21) becomes:
10
1
i j j ii i
e ej ij ikj i
x N x Ndx NP
RT dy D D
(5.22)

144
Equations analogous to equations (5.18), (5.20) and (5.22) may be written to describe the
diffusion inside the catalyst pellets on the hydrogenation side:
2ii i
dNN r
dy y
(5.23)
2
2
2
e
H T rd T dT
dy y dy k
(5.24)
4
1
i j j ii i
e ej ij ikj i
x N x Ndx NP
RT dy D D
(5.25)
Alternatively, diffusion inside the catalyst pellets can be described by the Fickian
diffusion model. For multicomponent systems, Fick‘s law is expressed (Froment and
Bischoff, 1990; Elnashaie and Elshishini, 1993) as:
i ie
dCN D
dy (5.26)
where the diffusivity of component i is expressed as:
1 1 1
e e
ie im ikD D D (5.27)
The diffusivity of component i in the mixture is calculated using the Wilke equation:
10
1
1 ji
jim ijj i
xx
D D
1 10i (5.28)

145
where effective diffusivities are defined (Froment and Bischoff, 1990; Elnashaie and
Elshishini, 1993) as:
e
im imD D
(5.29)
Inserting equation (5.27) into (5.18) gives the Fickian diffusion model on the
dehydrogenation side (Abo-Ghander et al., 2010) as:
2 6
21
2 1i iij j
jie
d C dCr
dy y dy D
(5.30)
Similarly, on the hydrogenation side, the Fickian diffusion model equation is written as:
2
2
2i i i
ie
d C dC r
dy y dy D
(5.31)
In the above set of equations, the dusty gas model requires solution of the coupled
equations (5.18), (5.20) and (5.22) on the dehydrogenation side and (5.23), (5.24) and
(5.25) on the hydrogenation side. On the other hand, the Fickian diffusion model is given
by the coupled equations (5.20) and (5.30) on the dehydrogenation side and (5.24) and
(5.31) on the hydrogenation side. Each pair of these equations forms a set of split
boundary value problems describing the molar and energy fluxes inside the catalyst on
both sides of the reactor. These pairs must be solved at each axial position along the
reactor to evaluate the volume-averaged reaction rates, as well as the volume-averaged
heat of reactions. The corresponding boundary conditions for the dusty gas model are:
Dehydrogenation side:
Centre of the catalyst pellets:
0
00
iN
y dT
dy
(5.32)
146
Surface of the catalyst pellets: i is
p
s
x xy R
T T
(5.33)
Hydrogenation side:
Centre of the catalyst pellets:
0
00
iN
y dT
dy
(5.34)
Surface of the catalyst pellets: i is
p
s
x xy R
T T
(5.35)
For the Fickian diffusion mode, the boundary conditions are:
Dehydrogenation side:
Centre of the catalyst pellets:
0
0
0
idC
dyy
dT
dy
(5.36)
Surface of the catalyst pellets: i is
p
s
C Cy R
T T
(5.37)
Hydrogenation side:
Centre of the catalyst pellets:
0 0
0
0
idC
dyy
dT
dy
(5.38)

147
Surface of the catalyst pellets: i is
p
s
C Cy R
T T
(5.39)
Numerical solution of the dusty gas and Fickian diffusion models on the hydrogenation
side of the reactor leads to the evaluation of the volume-averaged reaction rates and the
volume averaged heat released or absorbed due to reactions. These values can be related
to the bulk concentrations and temperatures through effectiveness factors, defined as the
ratio of the reaction rate with pore resistance to the reaction rate which would prevail if
the concentrations and temperature throughout the particles were equal to those at the
surface.
2
0
3
4
4,3
pR
j
j
j is s p
r y dy
r C T R
(5.40)
Introducing the dimensionless catalyst radius (p
y
R ) into equation (5.40) leads to:
1.0
2
0
, 3j j is s jr C T r d (5.41)
where:
1 6 for the dehydrogenation sidej
1 for the hydrogenation sidej
For non-isothermal catalyst pellets, the volume-averaged heat of reaction is defined as:
1.0
2
0
[ ] , 3 [ ] ,j s j is s j j iH T r C T H T r C T d (5.42)
with j as for equation (5.41). Integral terms in equations (5.41) and (5.42) were evaluated
numerically by the trapezoidal rule. Equations (5.41) and (5.42) represent the actual

148
reaction rates and actual heat of reactions, and they are used to update the reactor model,
equations (5.8) to (5.13) in Table 5.3.
The conversion of ethylbenzene on the dehydrogenation side, the conversion of
nitrobenzene on the hydrogenation side and component yields on the dehydrogenation
side along the reactor are defined as:
DehydrogenationSide
Conversion
HydrogenationSide
EBo EBEB
EBo
NBo NBNB
NBo
n nX
n
n nX
n
(5.43)
Yield
ST SToST
EBo
BZ BZoBZ
EBo
TO TOoTO
EBo
n nY
n
n nY
n
n nY
n
(5.44)
Mean square and absolute deviations from the rigorous model predictions are defined for
the styrene yield and nitrobenzene conversion as:
2
1
2
1
1( ) for styrene yield
Mean square deviation
1( ) for nitrobenzeneconversion
p
p
N
i i
ST ST
ip
N
i i
NB NB
ip
Y YN
X XN
(5.45)
1
1
1for styrene yield
Mean absolute deviation1
for nitrobenzeneconversion
p
p
N
i i
ST ST
ip
N
i i
NB NB
ip
Y YN
X XN
(5.46)

149
The sequence of computations which successfully couples the diffusion models with the
reactor model is depicted in Figure 5.3. At the reactor inlet, the feed conditions, i.e. feed
molar flow rates, inlet temperatures and inlet pressures, provide boundary conditions for
the catalyst equations (5.33), (5.35), (5.37) and (5.39). The dusty gas model and the
Fickian diffusion model equations on both sides of the reactor are solved numerically
using the Matlab
(The MathWorks, Natick) routine bvp4c with a relative tolerance of
1×10⁻⁴
in order to retrieve the molar flux, mole fraction and temperature profiles inside
the catalyst pellets. Those profiles are used to calculate the volume-averaged reaction
rates and volume-averaged heat of reactions by numerically evaluating the integrals in
equations (5.41) and (5.42). The reactor model equations are then integrated one step
forward and this procedure continues until the whole length is covered. For this
integration the Matlab
routine ode15s is employed with relative and absolute tolerances
of 1×10⁻⁸
.
5.4. Results and Discussion
The model of the catalytic membrane reactor was solved for the operating conditions in
Table 5.4. The molar flow rate and feed pressure were set to match the industrial values
given by Moustafa and Elnashaie (2000). The feed temperature on the dehydrogenation
side was adjusted to ensure the sustainability of the membrane, i.e. the local temperature
of the membrane must never exceed 923 K. On the hydrogenation side, the total molar
feed rate is 17 mole/s composed of only nitrobenzene and steam. The feed temperature on
the hydrogenation side is chosen to ensure that heat always flows from the hydrogenation
to the dehydrogenation side. Three models, i.e. the pseudo-homogeneous and
heterogeneous based on the Fickian diffusion and the dusty gas model, are evaluated. In
addition, the influence of isothermal versus non-isothermal catalyst pellets is assessed for
both heterogeneous models.

150
5.4.1. Conversion of ethylbenzene and nitrobenzene
The conversion of ethylbenzene on the dehydrogenation side and nitrobenzene on the
hydrogenation side versus the dimensionless distance along the membrane reactor are
plotted in Figures 5.4a and 5.4b for the homogenous model and heterogeneous models
based on Fickian diffusion and the dusty gas model, for isothermal and non-isothermal
catalyst particles. All three models predict monotonic increases on the dehydrogenation
side as shown in Figure 5.4a. The predictions of the three models, however, diverge due
to the different methods of assessing the intraphase transport resistances. For example,
the overall ethylbenzene conversion is predicted to be ~88% by the pseudo-homogeneous
model, ~78% and ~71% by the heterogeneous reactor model based on Fickian diffusion
for isothermal and non-isothermal catalyst pellets, and ~79% and ~75% according to the
heterogeneous reactor model incorporating the dusty gas model for isothermal and non-
isothermal catalyst pellets, respectively.
On the hydrogenation side, the nitrobenzene conversion is plotted versus the axial
dimensionless distance in Figure 5.4b. The overall conversion is predicted to be ~68% by
the pseudo-homogeneous model compared with ~59% and ~52% by the heterogeneous
reactor model with Fickian diffusion for isothermal and non-isothermal catalyst pellets,
and ~61% and ~57% according to the heterogeneous reactor model in conjunction with
the dusty gas model for isothermal and non-isothermal catalyst pellets, respectively.
5.4.2. Yield of styrene, benzene, and toluene on dehydrogenation side
The yields of styrene, benzene, and toluene on the dehydrogenation side are plotted
against the dimensionless axial distance based on all three reactor models in Figures 5.5a,
5.5b, and 5.5c, respectively. The yields of all three components from the reactor models
are predicted to increase monotonically along the reactors. Predictions, on the other
hand, differ from one model to another due to the alternative intraparticle resistances. For
example, the homogenous model predicts an overall styrene yield of ~82%, a benzene
yield of ~5.0%, and a toluene yield of ~1.0%, whereas the heterogeneous reactor model

151
with Fickian diffusion predicts respective overall yields of ~73%, ~4.4% and ~0.9% for
isothermal pellets and a styrene yield of ~68%, a benzene yield of ~3.0%, and a toluene
yield of ~0.6% for non-isothermal pellets. The heterogeneous reactor model based on the
dusty gas model predicts an overall styrene yield of ~73%, a benzene yield of ~4.6%, and
a toluene yield of ~0.8% for isothermal pellets and respective overall yields of ~69%,
~4.4% and ~0.9% for non-isothermal pellets.
5.4.3. Hydrogen molar flow rates on dehydrogenation and hydrogenation sides
Predicted hydrogen molar flow rates on both sides of the reactor are plotted in Figures
5.6a, and 5.6b. On the dehydrogenation side, the hydrogen molar flow rate is predicted to
increase linearly in the first portion of the membrane reactor as indicated in Figure 5.6a
due to the significant net production of hydrogen. However, this is then balanced by the
hydrogen diffusion through the membrane, causing the molar flow rate of hydrogen to
become almost constant on the dehydrogenation side. The difference in predicting
hydrogen molar flow rates between the homogenous reactor model and the heterogeneous
model with Fickian diffusion for non-isothermal pellets is ~0.4 mole/s, whereas it is ~0.2
mole/s for the heterogeneous reactor model based on the dusty gas model for non-
isothermal pellets.
On the hydrogenation side, the hydrogen molar flow rate is predicted to increase along
the membrane reactor by all three reactor models, due to the significant hydrogen
diffusion rate compared to its consumption rate. The heterogeneous reactor model based
on Fickian diffusion for the isothermal pellet predicts a higher hydrogen flow near the
entrance on the hydrogenation side than the homogenous model. The heterogeneous
reactor model based on the dusty gas model for the non-isothermal pellets predicts a
hydrogen flow similar to that predicted by the pseudo-homogeneous model, whereas the
other models all predict smaller hydrogen flow rates.

152
5.4.4. Temperature profiles on both sides of coupled reactor
Predicted temperature profiles along the dehydrogenation side are plotted in Figure 5.7a
for the pseudo-homogeneous model, the heterogeneous model with the Fickian diffusion
and the dusty gas model for the isothermal and the non-isothermal cases. In all five cases,
the temperature is predicted to decrease at the entrance of the reactor due to the net
endothermicity on the dehydrogenation side until a minimum is reached where the heat
absorbed by reactions is balanced by that transferred from the hydrogenation side.
Beyond this point, the temperature increases monotonically until the outlet of the reactor.
The point of balance occurs at a fractional length of ~0.2, but at different temperatures.
The lowest temperature at which the point of balance occurs is predicted by the pseudo-
homogeneous model, while the highest is predicted by the heterogeneous reactor model
with Fickian diffusion for non-isothermal pellets. The heterogeneous dusty gas model
predicts intermediate values for both isothermal and non-isothermal pellets.
As shown in Figure 5.7b, the temperature on the hydrogenation side is predicted to
increase along the reactor due to the high heat release from the hydrogenation reaction.
Only the homogenous model predicts a clear point of balance. The temperatures predicted
by the heterogeneous models become almost constant until the end of the reactor after a
monotonic increase. The heterogeneous reactor model based on the dusty gas model gives
intermediate temperature profiles for both isothermal and non-isothermal pellets
compared to both the pseudo-homogeneous reactor model and the heterogeneous model
with Fickian diffusion.
5.4.5. Predictions of styrene yields and nitrobenzene conversions in the coupled
reactor by the various models
Previously, optimal trade-off curves for conflicting conversion and yield objectives were
determined based on the pseudo-homogeneous reactor model in chapter 3 using multi-
objective approaches similar to those ones employed by Logist et al. (2009). The
calculated optimal operating and design parameters for the coupled reactor are

153
summarized in Table 5.5 for three cases: (i) focus on the production of only styrene, case
A, (ii) equal focus on styrene and aniline as products, case B and (iii) focus on the
production of only aniline, case C. The coupled reactor is simulated for these three cases
using the heterogeneous reactor model based on dusty gas diffusion, listing the yield of
styrene and the conversion of nitrobenzene in Table 5.5. The predicted styrene yields and
nitrobenzene conversions differ significantly indicating the importance of intraparticle
transport resistances and the sensitivity to the diffusion model inside the catalyst pellets.
When Fickian diffusion is used to describe the intraparticle diffusion, the predicted
styrene yields and nitrobenzene conversions are reduced more than when the dusty gas
model is utilized. The pseudo-homogeneous reactor model predicts higher styrene yields
and nitrobenzene conversions because the effect of the intraparticle resistance is
neglected. The Fickian diffusion model underestimates both the styrene yields and
nitrobenzene conversions because it can be strictly applied for dilute systems. It also
cannot also account for the change of moles as dusty gas model does in reactive systems.
All the previously mentioned reasons result in making the Fickian diffusion model only
an approximating tool for complex reactive systems, not a well-predicting one.
The deviations of the pseudo-homogeneous model, the heterogeneous model with Fickian
diffusion for isothermal and non-isothermal catalyst pellet cases and the heterogeneous
model with dusty gas for the isothermal catalyst pellet case from the heterogeneous
model with dusty gas for the non-isothermal catalyst pellet case are given in Table 5.6 for
the base case operating conditions listed in Table 5.4 and the three optimization cases of
Table 5.5. The prediction of the heterogeneous dusty gas model for the non-isothermal
catalyst pellets is taken as the most accurate and sophisticated predictive model. The
predictions of the styrene yield and nitrobenzene conversion by all other models are
evaluated along the reactor with a dimensionless spacing of 0.1. Deviations are evaluated
based on both the mean square deviation and mean absolute deviation. The highest
deviation is observed for the homogenous reactor model, while the lowest is for the
heterogeneous model with Fickian diffusion for the non-isothermal catalyst pellet case.
The predictions of all other models are intermediate between these two models. The
assumption of isothermality causes greater deviations than the Fickian diffusion

154
simplification for all investigated cases. Moreover, even the worst heterogeneous model
yields in all cases predictions within 6% of the most accurate model, compared to
deviations of up to ~11% for the pseudo-homogeneous model.
5.5. Conclusions
A catalytic membrane fixed bed reactor coupling the dehydrogenation of ethylbenzene
with the hydrogenation of nitrobenzene is modeled in three ways: via the previously
employed pseudo-homogeneous model and with two heterogeneous models, one
employing Fickian diffusion and the other the dusty gas model employing the Stefan-
Maxwell equations to describe intraparticle transport. In these last two, both isothermal
and non-isothermal catalyst pellets are considered. The pseudo-homogeneous model
overestimates both the yield of styrene on the dehydrogenation side and the conversion of
nitrobenzene on the hydrogenation side, while the heterogeneous Fickian diffusion model
under-predicts these quantities. The heterogeneous dusty gas diffusion model is more
rigorous than the heterogeneous Fickian diffusion model, and it generally results in
predictions intermediate between the homogenous and heterogeneous Fickian models.
When all three models are compared with the heterogeneous reactor model with the dusty
gas diffusion model for non-isothermal pellets, the highest deviation is observed for the
pseudo-homogeneous reactor model, while the lowest is provided by the heterogeneous
reactor model with Fickian diffusion for non-isothermal catalyst pellets. However, even
the least rigorous pseudo-heterogeneous models yield predictions within 6% of the most
rigorous model, while the deviations are up to ~11% for the pseudo-homogeneous model.

155
Table 5.1 Stoichiometric equations, heats of reactions and reaction rate expressions for reactions in coupled reactor.
Chemical Reaction Heat of Reaction Kinetic Equation Reference
Dehydrogenation Side a
6 5 2 3 6 5 2 2C H CH CH C H CHCH H mole
kJ117.6ΔH298 2
1 1
ST H
EB
A
p pr k p
K
Elnashaie, et al (1993)
6 5 2 3 6 6 2 4C H CH CH C H C H mole
kJ105.4ΔH298
EBpkr 22 Elnashaie, et al (1993)
435623256 CHCHHCHCHCHHC mole
kJ54.6ΔH298
23 3 EB Hr k p p
Elnashaie, et al (1993)
2422 422 HCOHCOH mole
kJ210.2ΔH298
2 2 4
1 2
4 4 H O C Hr k p p
Elnashaie, et al (1993)
242 3HCOCHOH mole
kJ206.1ΔH298
2 45 5 H O CHr k p p
Elnashaie, et al (1993)
222 HCOCOOH mole
kJ41.2ΔH298
26 6 3 H O CO
Pr k p p
T
Elnashaie, et al (1993)
Hydrogenation Side b
OHNHHCHNOHC 22562256 23 mole
kJ443.0ΔH298
2 2
2 2
2
1
NB H NB H
NB NB H H
k K K p pr
K p K p
Amon, et al. (1999)
a partial pressure in (bars)
b partial pressure in (kPa)
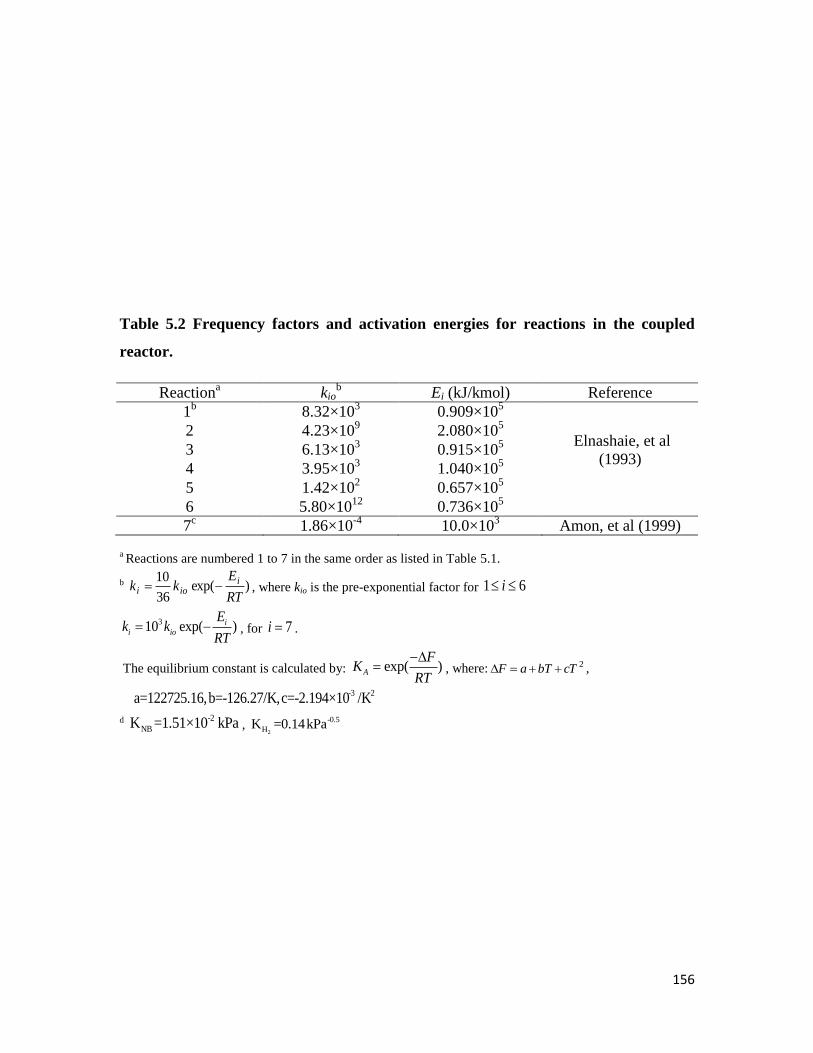
156
Table 5.2 Frequency factors and activation energies for reactions in the coupled
reactor.
Reactiona
kiob Ei (kJ/kmol) Reference
1b 8.32×10
3 0.909×10
5
Elnashaie, et al
(1993)
2 4.23×10⁹ 2.080×10
5
3 6.13×10³ 0.915×10
5
4 3.95×10³ 1.040×10
5
5 1.42×10² 0.657×10
5
6 5.80×10¹²
0.736×10⁵
7c
1.86×10⁻⁴
10.0×10³ Amon, et al (1999)
a Reactions are numbered 1 to 7 in the same order as listed in Table 5.1.
b )exp(
36
10
RT
Ekk i
ioi , where kio is the pre-exponential factor for 61 i
310 exp( )i
i io
Ek k
RT , for 7i .
The equilibrium constant is calculated by: exp( )A
FK
RT
, where: 2cTbTaF ,
-3 2a=122725.16,b=-126.27/K,c=-2.194×10 /K
d
-2
NBK =1.51×10 kPa , 2
-0.5
HK =0.14kPa

157
Table 5.3 Heterogeneous model equations for coupled catalytic membrane reactor.
Balance
Equations Mathematical Expressions Equation
Dehydrogenation Side
Mole iiscsj
jiji JNarAdr
dz
dn3
6
1
0.1
0
2 213
(5.8)
Energy
10
1
6
1
0.1
0
2 13
iii
scsj
jj
Cpn
QAdrTH
dz
dT
(5.9)
Pressure
G
DDg
G
dz
dP
p
g
pcg
75.111501
3
(5.10)
Hydrogenation Side (per tube)
Mole iiscsii JarAdr
dz
nd3
0.1
0
2 213
(5.11)
Energy
1.0
2
3 1
0
4
1
2 3 1
Ti
i i i cs si
T
i ii
r a J Cp dT H T r d A QdT
dz n Cp
(5.12)
Pressure
3
150 111.75
g
g c p p
dP GG
dz g D D
(5.13)
Additional Relations
Diffusion of
hydrogen
across
membrane per
tube
2
2 2 2
2
,exp
H P
o
H H H
H
EQ
RTJ P P
where:
-03107.29oQ (mole×m)/(m2×min×atm
0.5),
610252
H m,
3, 105.20
2PHE J/mole
(5.14)
Heat transfer
across
membrane per
tube
1
31 2 1 1
1 2 2
2
1ln ln
ss Pd
r T TQ
rr r r r
h k r k r r h
where:
kss=22.88 W/m/K, kPd=93.30 W/m/K, 0.9
60.813 exp
p pt
g g t
D G DhD
k D
0.7
4.63.50 exp
p pt
g g t
D G Dh D
k D
(5.15)

158
Table 5.4 Base case dimensional and operating parameters for coupled catalytic
membrane reactor.
Parameter Values Units
Dimensional Variables
Cross-sectional area-equivalent
diameter of dehydrogenation side 1.95 m
Inside diameter of hydrogenation
tubes 3.5×10
-2 m
Total number of hydrogenation tubes 1500 ----
Length of reactor 4.0 m
Operating Conditions of Dehydrogenation Side
Feed molar flowrate of ethylbenzene 10.242 mole/s
Feed molar flowrate of styrene 0.1861 mole/s
Feed molar flowrate of benzene 0.0306 mole/s
Feed molar flowrate of toluene 0.2444 mole/s
Feed molar flowrate of steam 125.86 mole/s
Feed temperature 880.0 K
Feed pressure 2.5 bar
Catalyst density 2146.3 kg/m3
Catalyst thermal conductivity 0.3 J/m/s
Pore diameter 4800×10-10
m
Catalyst porosity 0.35 ----
Catalyst tortuosity 4.0 ----
Bed voidage 0.48 ----
Operating Conditions per tube on Hydrogenation Side
Feed molar flowrate of nitrobenzene 0.003 mole/s
Feed molar flowrate of steam 0.008 mole/s
Inlet temperature 900.0 K
Inlet pressure 1.0 bar
Catalyst density 1400 kg/m3
Catalyst thermal conductivity 0.05 J/m/s
Pore diameter 5000×10-10
m
Catalyst porosity 0.40 ----
Catalyst tortuosity 4.0 ----
Bed voidage 0.46 ----

159
Table 5.5 Representative solutions for Pareto frontier. Constrained limits are bolded
Parameter Optimal case A Optimal case B Optimal case C
Deh
yd
rog
enat
ion
Sid
e
Feed Molar flowrate of Ethylbenzene
(mole/s) 7.66 9.36 11.27
Steam-to-Ethylbenzene Ratio 7.00 7.00 20.00
Feed Temperature on Shell Side (K) 825.41 780.00 820.02
Feed Pressure on Shell Side (bar) 4.00 2.52 4.00
Hy
dro
gen
atio
n
Sid
e
(on
e tu
be
bas
is)
Feed Molar flowrate of Nitrobenzene
(mol/s) 0.005 0.002 0.002
Steam-to-Nitrobenzene Ratio 4.00 4.00 4.00
Feed Temperature on Tube Side (K) 825.41 780.00 820.02
Feed Pressure on Tube Side (bar) 3.62 1.00 1.00
Dim
ensi
on
al
Var
iab
les
No. of Hydrogenation Tubes 2500 1582 1000
Equivalent-area Diameter of
Dehydrogenation Side (m) 3.00 2.39 1.95
Diameter of Hydrogenation Tube (m) 0.048 0.035 0.040
Reactor Length (m) 4.00 4.00 4.00
Yie
ld o
f S
tyre
ne
Pseudo-homogeneous Modeling
0.975 0.564 0.491
Het
ero
gen
eou
s
Mo
del
ing
Fickian
Diffusion
Model
Isothermal
Catalyst Pellets 0.930 0.512 0.426
Non-isothermal
Catalyst Pellets 0.925 0.478 0.386
Dusty Gas
Model
Isothermal
Catalyst Pellets 0.942 0.522 0.429
Non-isothermal
Catalyst Pellets 0.894 0.4864 0.3956
Co
nv
ersi
on
of
Nit
rob
enze
ne Pseudo-homogeneous Modeling 0.211 0.555 0.796
Het
ero
gen
eou
s
Mo
del
ing
Fickian
Diffusion
Model
Isothermal
Catalyst Pellets 0.208 0.502 0.713
Non-isothermal
Catalyst Pellets 0.201 0.467 0.6594
Dusty Gas
Model
Isothermal
Catalyst Pellets 0.210 0.514 0.727
Non-isothermal
Catalyst Pellets 0.204 0.479 0.681

160
Table 5.6 Deviations of the predictions inside the coupled reactor from the non-isothermal dusty gas heterogeneous reactor
model.
Reactor Models
Yield of Styrene Conversion of Nitrobenzene
Root mean square
deviation
Absolute mean
deviation
Root mean square
deviation
Absolute mean
deviation
Op
erat
ing
Co
nd
itio
n i
n
Tab
le 5
.4
Pseudo-homogeneous 0.113 0.109 0.0848 0.0801
Heterogeneous, Fickian, Isothermal 0.0294 0.0286 0.0167 0.0155
Heterogeneous, Fickian, Non-isothermal 0.0214 0.0211 0.0312 0.0284
Heterogeneous, Dusty Gas , Isothermal 0.0335 0.0321 0.0297 0.0281
Cas
e A
Pseudo-homogeneous 0.111 0.110 0.0193 0.0187
Heterogeneous, Fickian, Isothermal 0.0442 0.0436 0.0073 0.0071
Heterogeneous, Fickian, Non-isothermal 0.0108 0.0095 0.0027 0.0026
Heterogeneous, Dusty Gas , Isothermal 0.0557 0.0055 0.0094 0.0092
Cas
e B
Pseudo-homogeneous 0.0521 0.0485 0.0530 0.0499
Heterogeneous, Fickian, Isothermal 0.0188 0.0178 0.0160 0.0147
Heterogeneous, Fickian, Non-isothermal 0.0087 0.0086 0.0101 0.0096
Heterogeneous, Dusty Gas , Isothermal 0.0243 0.0225 0.0250 0.0234
Cas
e C
Pseudo-homogeneous 0.0717 0.0674 0.0990 0.0934
Heterogeneous, Fickian, Isothermal 0.0225 0.0211 0.0247 0.0225
Heterogeneous, Fickian, Non-isothermal 0.0092 0.0090 0.0177 0.0164
Heterogeneous, Dusty Gas , Isothermal 0.0242 0.0224 0.0380 0.0357

161
Feed to Dehydrogenation Side
(Ethylbenzene)
Feed to Hydrogenation
Side (Nitrobenzene)
INS
UL
AT
ED
OU
TE
R W
AL
L
INS
UL
AT
ED
OU
TE
R W
AL
L
Hydro
gen
per
mea
tive
mem
bra
ne
Hydro
gen
per
mea
tive
mem
bra
ne
H2
Per
mea
tion
H2
Per
mea
tion
Hea
t
Tra
nsf
er
Deh
ydro
gen
atio
n
Cat
alyst
Hydrogenation
Catalyst
Deh
ydro
gen
atio
n
Cat
alyst
Products of Dehydrogenation Side
(Styrene, Benzene, Toluene, Light Gases, and
Unreacted Ethylbenzene)
Products of
Hydrogenation Side
(Aniline and Unreacted
Nitrobenzene)
Figure 5.1 Schematic of coupled catalytic membrane for cocurrent configuration.

162
Radial direction
y Δy
Net Production:Net Heat
Produced:
2
In
4
iy
yN
2O
ut
4
iy
y
yN
2
1
4j
ij j
j
r y y
2
In4
y
yq
2
Out4
y
y
yq
2
1
[ ] 4j
j j
j
H T r y y
Figure 5.2 Molar and heat fluxes across a small shell inside a catalyst pellet.

163
0.1
0
23, drCTrss
0.1
0
23, dTHrCTrTHsss
Lz zzz
Reactor Model Equations
Eqs (5.8) to (5.13)
61
3,
0.1
0
2
j
dTHrCTrTHjjssjjsj
613,
0.1
0
2 jdrCTrjssjj
Numerically, calculate
For non-isothermal catalyst pellets, this term
is also calculated:
Catalyst Model Equation
On Dehydrogenation Side
Eqs (5.18), (5.20), and (5.22) for the dusty
gas model and
Eqs (5.30), and (5.20) for the Fickian
diffusion model
Integrate one step
End
yes
No
Numerically, calculate
For non-isothermal catalyst pellets, this term
is also calculated:
Read
Feed Condition
nio, To, Po,n‘io,T‘o.P‘o
Catalyst Model Equation
On Hydrogenation Side
Eqs (5.23), (5.24), and (5.25) for the dusty
gas model and
Eqs (5.31), and (5.24) for the Fickian
diffusion model
Figure 5.3 Computational sequence coupling dusty gas model equations with reactor model equations.

164
Dimensionless Axial Distance
0.0 0.2 0.4 0.6 0.8 1.0
Co
nver
sio
n o
f E
thyl
benz
ene
0.0
0.2
0.4
0.6
0.8
1.0
Dimensionless Axial Distance
0.0 0.2 0.4 0.6 0.8 1.0
Co
nver
sio
n o
f N
itro
benz
ene
0.0
0.2
0.4
0.6
0.8
Pseudo-Homogeneous Model
Dusty Gas Model
Fickian Diffusion Model
Isothermal Catalyst Pellets
Non-isothermal Catalyst Pellets
Isothermal Catalyst Pellets
Non-isothermal Catalyst Pellets
Pseudo-Homogeneous Model
Fickian Diffusion Model
Dusty Gas Model
(a)
(b)
Figure 5.4 Conversion of (a) ethylbenzene on dehydrogenation side, and (b)
nitrobenzene on hydrogenation side for base case operating conditions in Table 5.4.

165
Dimensionless Axial Distance
0.0 0.2 0.4 0.6 0.8 1.0
Sty
rene
Yie
ld
0.0
0.2
0.4
0.6
0.8
1.0
Dimensionless Axial Distance
0.0 0.2 0.4 0.6 0.8 1.0
Ben
zene
Yie
ld x
102
0.0
1.0
2.0
3.0
4.0
5.0
6.0
Dimensionless Axial Distance
0.0 0.2 0.4 0.6 0.8 1.0
To
luen
e Y
ield
x10
2
0.0
0.2
0.4
0.6
0.8
1.0
1.2
Isothermal Catalyst Pellets
Non-isothermal Catalyst Pellets
Isothermal Catalyst Pellets
Non-isothermal Catalyst Pellets
Isothermal Catalyst Pellets
Non-isothermal Catalyst Pellets
Pseudo-Homogeneous Model
Pseudo-Homogeneous Model
Pseudo-Homogeneous Model
Fickian Diffusion ModelFickian Diffusion Model
Fickian Diffusion Model
Dusty Gas Model
Dusty Gas Model
Dusty Gas Model
(a) (b)
(c)
Figure 5.5 Yield of (a) Styrene, (b) Benzene, and (c) Toluene along dehydrogenation side for base case operating conditions in
Table 5.4.
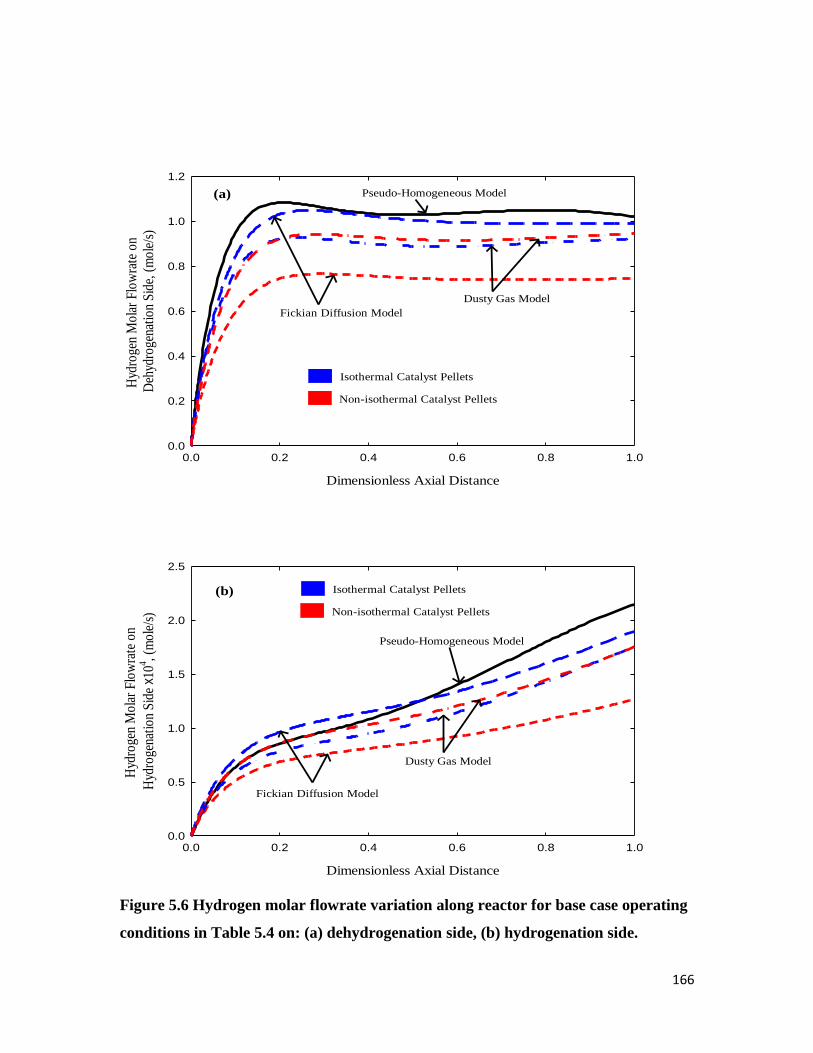
166
Dimensionless Axial Distance
0.0 0.2 0.4 0.6 0.8 1.0
Hyd
roge
n M
olar
Flo
wra
te o
n
Deh
ydro
gena
tion
Sid
e, (
mol
e/s)
0.0
0.2
0.4
0.6
0.8
1.0
1.2
Dimensionless Axial Distance
0.0 0.2 0.4 0.6 0.8 1.0
Hyd
roge
n M
olar
Flo
wra
te o
n
Hyd
roge
nati
on S
ide
x 104 , (
mol
e/s)
0.0
0.5
1.0
1.5
2.0
2.5
Pseudo-Homogeneous Model
Pseudo-Homogeneous Model
Fickian Diffusion Model
Fickian Diffusion Model
Dusty Gas Model
Dusty Gas Model
Isothermal Catalyst Pellets
Non-isothermal Catalyst Pellets
Isothermal Catalyst Pellets
Non-isothermal Catalyst Pellets
(a)
(b)
Figure 5.6 Hydrogen molar flowrate variation along reactor for base case operating
conditions in Table 5.4 on: (a) dehydrogenation side, (b) hydrogenation side.

167
Dimensionless Axial Distance
0.0 0.2 0.4 0.6 0.8 1.0
Tem
per
ature
Pro
file
s o
n
Deh
ydro
gen
atio
n S
ide
(K)
850
860
870
880
890
900
910
920
Dimensionless Axial Distance
0.0 0.2 0.4 0.6 0.8 1.0
Tem
per
ature
Pro
file
s o
n
Hyd
rogen
atio
n S
ide
(K)
880
900
920
940
960
980
1000
1020
Pseudo-Homogeneous Model
Pseudo-Homogeneous Model
Isothermal Catalyst Pellets
Non-isothermal Catalyst Pellets
Isothermal Catalyst Pellets
Non-isothermal Catalyst Pellets
Fickian Diffusion Model
Fickian Diffusion Model
Dusty Gas Model
Dusty Gas Model
(a)
(b)
Figure 5.7 Temperature profiles along the reactor for base case operating conditions
in Table 5.4 on: (a) dehydrogenation side, and (b) hydrogenation side.

168
5.6. References
Abashar, M. E., Elnashaie, S. S., 1993. Mathematical modelling of diffusion-reaction,
and solution algorithm for complex reaction networks in porous catalyst pellets—
steam reforming of natural gas, Mathematical and Computer Modelling 18(7), 85-
100.
Abo-Ghander, N. S., Logist, F., Grace, J. R., Van Impe, J. F. M., Elnashaie, S. S. E. H.,
Lim, C. J., 2010. Feasibility of coupling dehydrogenation of ethylbenzene with
hydrogenation of nitrobenzene in an autothermal catalytic membrane reactor:
modeling study, Proceedings of the 9th International Symposium on Dynamics and
Control of Process Systems, 365.
Amon, B., Redlingshöfer, H., Klemm, E., Dieterich, E., Emig, G., 1999. Kinetic
investigations of the deactivation by coking of a noble metal catalyst in the catalytic
hydrogenation of nitrobenzene using a catalytic wall reactor, Chemical Engineering
and Processing 38(4-6), 395-404.
Abdalla B. K., Al-Khowaiter S. H., Elshishini S. S., Elnashaie S. S. E. H., October 12 -
17, 1997. Maximization of styrene yield from the catalytic dehydrogenation of
ethylbenzene in fixed and fluidized bed configurations with and without selective
membranes, 15th World Petroleum Congress, Beijing, China .
Balasubramanian, B., Lopez Ortiz, A., Kaytakoglu, S., Harrison, D. P., 1999. Hydrogen
from methane in a single-step process, Chemical Engineering Science 54(15-16),
3543-3552.
Beuscher, U., H. Gooding, C., 1999. The influence of the porous support layer of
composite membranes on the separation of binary gas mixtures, Journal of
Membrane Science 152(1), 99-116.
Chen, Z., Elnashaie, S. S. E. H., 2005. Autothermal CFB Membrane Reformer for
Hydrogen Production from Heptane, Chemical Engineering Research and Design
83(7), 893-899.
Chen, Z., Prasad, P., Yan, Y., Elnashaie, S., 2003. Simulation for steam reforming of
natural gas with oxygen input in a novel membrane reformer, Fuel Processing
Technology 83(1-3), 235-252.

169
Elnashaie, S. S. E. H., Alhabdan, F. M., 1989. A computer software package for the
simulation and optimization of an industrial ammonia converter based on a rigorous
heterogeneous model, Mathematical and Computer Modelling 12(12), 1589-1600.
Elnashaie, S. S. E. H., Moustafa, T., Alsoudani, T., Elshishini, S. S., 2000. Modeling and
basic characteristics of novel integrated dehydrogenation — hydrogenation
membrane catalytic reactors, Computers & Chemical Engineering 24(2-7), 1293-
1300.
Elnashaie, S. S. E. H., Soliman, M. A., Abashar, M. E., Almuhana, S., 1992.
Mathematical modelling of diffusion and reaction for gas-solid catalytic systems
with complex reaction networks. Negative effectiveness factors, Mathematical and
Computer Modelling 16(12), 41-53.
Elnashaie, S. S. E. H., Abashar, M. E. E., 1993. Steam reforming and methanation
effectiveness factors using the dusty gas model under industrial conditions,
Chemical Engineering and Processing 32(3), 177-189.
Elnashaie, S. S. E. H., Abdalla, B. K., Hughes, R., 1993. Simulation of the industrial
fixed bed catalytic reactor for the dehydrogenation of ethylbenzene to styrene:
heterogeneous dusty gas model, Industrial & Engineering Chemistry Research
32(11), 2537-2541.
Elnashaie S.S.E.H., Elshishini S.S., 1993. Modelling, Simulation and Optimization of
Industrial Fixed Bed Catalytic Reactors. Amesterdam: Gordon and Breach Science
Publisher.
Froment G. F., Bischoff K. B. , 1990. Chemical Reactor Analysis and Design. USA: John
Wiley & Sons, Inc.
Hermann, C., Quicker, P., Dittmeyer, R., 1997. Mathematical simulation of catalytic
dehydrogenation of ethylbenzene to styrene in a composite palladium membrane
reactor, Journal of Membrane Science 136(1-2), 161-172.
Itoh, N., Xu, W. C., Hara, S., Kakehida, K., Kaneko, Y., Igarashi, A., 2003. Effects of
hydrogen removal on the catalytic reforming of n-hexane in a palladium membrane
reactor, Industrial & Engineering Chemistry Research 42(25), 6576-6581.
170
Itoh, N., Wu, T., 1997. An adiabatic type of palladium membrane reactor for coupling
endothermic and exothermic reactions, Journal of Membrane Science 124(2), 213-
222.
Krishna, R., 1990. Multicomponent surface diffusion of adsorbed species: a description
based on the generalized Maxwell—Stefan equations, Chemical Engineering
Science 45(7), 1779-1791.
Krishna, R., Wesselingh, J. A., 1997. The Maxwell-Stefan approach to mass transfer,
Chemical Engineering Science 52(6), 861-911.
Logist, F., Van Erdeghem, P. M. M., Van Impe, J. F., 2009. Efficient deterministic
multiple objective optimal control of (bio)chemical processes, Chemical
Engineering Science 64(11), 2527-2538.
Moustafa, T. M., Elnashaie, S. S. E. H., 2000. Simultaneous production of styrene and
cyclohexane in an integrated membrane reactor, Journal of Membrane Science
178(1-2), 171-184.
Rakib, M. A., Grace, J. R., Elnashaie, S. S. E. H., Lim, C. J., Bolkan, Y. G., 2008.
Kinetic simulation of a compact reactor system for hydrogen production by steam
reforming of higher hydrocarbons, The Canadian Journal of Chemical Engineering
86(3), 403-412.
Soliman, M. A., El-Nashaie, S. S. E. H., Al-Ubaid, A. S., Adris, A., 1988. Simulation of
steam reformers for methane, Chemical Engineering Science 43(8), 1801-1806.
Tiemersma, T. P., Patil, C. S., Sint Annaland, M. v., Kuipers, J. A. M., 2006. Modelling
of packed bed membrane reactors for autothermal production of ultrapure hydrogen,
Chemical Engineering Science 61(5), 1602-1616.
Uemiya, S., Sato, N., Ando, H., Matsuda, T., Kikuchi, E., 1990. Steam reforming of
methane in a hydrogen-permeable membrane reactor, Applied Catalysis 67(1), 223-
230.
Veldsink, J. W., Versteeg, G. F., Van Swaaij, W. P. M., Van Damme, R. M. J., 1995. The
use of the dusty-gas model for the description of mass transport with chemical
reaction in porous media, The Chemical Engineering Journal and the Biochemical
Engineering Journal 57(2), 115-125.

171
Wang, Y., Xu, Y., Xiang, H., Li, Y., Zhang, B., 2001. Modeling of Catalyst Pellets for
Fischer-Tropsch Synthesis, Industrial & Engineering Chemistry Research 40(20),
4324-4335.

172
CHAPTER 6 OVERALL CONCLUSIONS AND
RECOMMENDATIONS
6.1. Conclusions
In this project, coupling dehydrogenation of ethylbenzene to styrene with hydrogenation
of nitrobenzene to aniline has been modeled in a catalytic membrane reactor. The
proposed catalytic membrane reactor used to couple the two reactions is composed of two
sides: shell and tube. On the shell side, dehydrogenation of ethylbenzene takes place and
styrene is produced along the reactor. In addition to styrene, benzene, toluene, and other
light gases such as ethylene, methane carbon monoxide and carbon dioxide are also
produced as side products. The main reaction, i.e. the one producing styrene, is reversible
with the yield of styrene thermodynamically limited to ~0.40 in industry. The overall
ethylbenzene conversion is also thermodynamically limited to ~0.45. The temperature
drops along industrial fixed bed reactors in which the process is carried out due to the net
endothermic nature of the reactions.
On tube side, however, nitrobenzene is hydrogenated to produce aniline. This reaction is
irreversible and exothermic with a relatively large heat of reaction. Stoichiometrically,
three moles of hydrogen are required for each mole of nitrobenzene to produce one mole
of aniline and with a heat output of 443.0 kJ/mole. Consequently, the temperature
increases along the industrial reactor.
In the proposed catalytic membrane reactor, the reactions are coupled by making the
walls of hydrogenation tubes permeable to hydrogen. Hydrogen and heat are then
exchanged between the two sides, resulting in improved styrene yield on the
dehydrogenation sides and production of aniline on the hydrogenation side.
The new proposed reactor is novel and useful because:

173
1. This pair of reactions can be coupled because they are complementary, i.e. one
produces hydrogen while the other requires hydrogen.
2. The reactor is able to produce two valuable products, i.e. styrene on the
dehydrogenation side and aniline on the hydrogenation side with substantial
improvement in conversions and yields.
3. Unlike the other coupling systems presented in the literature, hydrogen, diffusing
through the membrane to the tube, is utilized for a useful reaction to produce
another valuable product, i.e. aniline, rather than simply being burnt to produce
heat only.
4. Heat produced due to the hydrogenation reaction is transferred through the
membrane tube and used to assist in shifting the equilibrium conversion of
ethylbenzene and the yield of styrene.
In this study, optimal designs for the proposed reactor are obtained for which the yield of
styrene on the dehydrogenation side and production of aniline on the hydrogenation side
form a pair of objective functions. The optimization problem is classified as bi-objective,
with the yield of styrene and the production of aniline maximized simultaneously subject
to constraints. The pseudo-homogeneous model of the proposed reactor is used to
calculate both objective functions. Two numerical optimization techniques are utilized to
solve the challenging numerical problem, involving the conversion of the bi-objective
optimization problem into a single one and applying an extra constraint. A total of 12
operating and dimensional variables with proper bounds and a number of linear and
nonlinear constraints were considered. The solution of this problem results in a set of
equally good solution referred to as a Pareto set. It is found that the proposed reactor can
be constructed to produce a styrene yield at ~97% and a nitrobenzene conversion at
~20% as one extreme case. At another extreme, the same reactor can be operated to
produce a styrene yield of ~49% and a nitrobenzene conversion of ~80%.
Due to the conflicting nature of both objective functions, the effects of the decision
variables are non-monotonic along the Pareto-optimal set. For example:

174
1. Increasing the feed molar flowrate of ethylbenzene decreases the styrene yield as
the production of the side products increases and the residence time decreases
leading to unfinished reactions, while the effect on the tube side is to enhance the
nitrobenzene conversion.
2. Increasing the ratio of ethylbenzene-to-steam reduces the yield of styrene and
enhances the conversion of nitrobenzene.
3. Increasing the feed temperature on the shell side assists in enhancing the yield of
ethylbenzene, but reduces the conversion of nitrobenzene.
4. Increasing the feed pressure on the dehydrogenation side enhances the styrene
yield, but decreases nitrobenzene conversion.
5. Increasing the feed molar flowrate nitrobenzene enhances the styrene yield, but
reduces the nitrobenzene conversion.
6. The steam-to-nitrobenzene ratio on the hydrogenation side has little influence, as
it is mainly used to maintain the temperature below 923 K.
7. Increasing the feed temperature of hydrogenation enhances the yield of
ethylbenzene, but at the same time, reduces the conversion of nitrobenzene.
8. It is favorable to operate at a high hydrogenation feed pressure to enhance the
yield of styrene, whereas it is preferable to maintain low pressure to increase the
conversion of nitrobenzene.
9. As the number of hydrogenation tubes increases, the yield of styrene increases,
whereas the nitrobenzene conversion decreases.
10. Increasing the cross-sectional area of the dehydrogenation side increases the
styrene yield, but decreases the conversion of nitrobenzene.
11. As the diameter of the hydrogenation tubes increases, the yield of styrene
increases while the conversion of nitrobenzene decreases.
12. Due to the low temperature range imposed as a constraint inside the reactor, i.e.
below 923K, the reactor tends to operate at the upper limit of the length.
The effect of intraparticle resistance is assessed using two heterogeneous models, one
based on Fickian diffusion while the other is based on the dusty gas model. Along the
reactor, the catalyst pellets on both sides are solved assuming both isothermal and non-

175
isothermal particles. The reaction rates in the homogenous reactor model equations are
altered considering diffusion at the surface of the catalyst pellets. It is found that:
1. The intraphase transport resistance reduces both the reaction rates and the
magnitude of the transported quantities, i.e. hydrogen diffusion and heat transfer.
Styrene yield and nitrobenzene conversion are therefore decreased.
2. Infinite values of component effectiveness factors result when the concentration
of hydrogen is zero in the bulk, while the flux at the surface of the catalyst pellets
is significant.
3. All reaction effectiveness factors on the dehydrogenation side show non-
monotonic behavior as the bulk temperature changes. The trend changes at the
point of heat balance, i.e. when the heat transfer from the hydrogenation side
balances the net endothermic requirement for heat on the dehydrogenation side.
4. Diffusion of hydrogen from the dehydrogenation side to the hydrogenation side
causes a sharp increase in the effectiveness factor of the hydrogenation reaction.
5. The reduction in performance due to the thermal resistance inside the catalyst is
more pronounced than that resulting from the mass diffusion resistance.
6. The predicted yields and conversions from the heterogeneous reactor model with
Fickian diffusion are ~7% to ~10% less than that of pseudo-homogeneous model.
7. The heterogeneous reactor model with intraparticle diffusion based on the dusty
gas model is ~4% to ~7% less than for the pseudo-homogeneous model. The
heterogeneous reactor model based on Fickian diffusion model overestimates the
effect of the intraphase resistance compared to heterogeneous reactor model based
on the dusty gas model.
8. The heterogeneous reactor model combined with the dusty gas model is
recommended to describe the diffusion inside the catalyst pellets, as it is more
rigorous than the heterogeneous reactor model with Fickian diffusion.
9. It is recommended to supply the analytical Jacobian matrix required to solve the
catalyst pellets problems on both sides of the reactor. This can help to reduce the
execution time and the rounding off error that might arise from other techniques
such as finite differences.

176
6.2. Recommendations
As future work, the following directions are proposed:
1. Construct a proof-of-concept experimental catalytic membrane reactor in which
all the complex safety issues arising from the reactions or processes are fully
addressed.
2. With the aid of high capacity computers, solve the optimization problem again
considering diffusion inside the catalyst pellets. Two optimal Pareto sets should
be obtained and compared for the heterogeneous reactor model based on Fickian
diffusion and for the heterogeneous reactor model, combined with the dusty gas
model.
3. Optimizing the performance of the reactor with the cost as the objective function
to be minimized.
4. Perform a sensitivity analysis based on the pseudo-heterogeneous model of the
coupled reactor.
5. Set up and solve the optimal control problem. For example, the admissible
hydrogen profile can be calculated on both sides of the reactor maximizing both
the yield of styrene and the conversion of nitrobenzene. Compare the feasibility of
implementing this profile with the admissible profile of temperatures.
6. Assess the effect of catalyst deactivation and compare with the effect of
intraphase diffusion to determine which one has a greater overall influence.
Deactivation by coking of the palladium catalyst supported on α-alumina used on
the hydrogenation side is found to be pronouncing and could be determined
quantitatively (Amon, 1999).
7. Obtain the optimal design of the countercurrent configuration of the proposed
reactor.
8. Evaluate the behavior of the reaction system for a fluidized bed reactor on one or
both sides, and compare the results with those for the fixed bed reactor.
9. Compare the advantages of the optimal design of the proposed catalytic
membrane reactor with the optimal design of the fluidized bed reactor.

177
6.3. References
Amon, B., Redlingshöfer, H., Klemm, E., Dieterich, E., Emig, G., 1999. Kinetic
investigations of the deactivation by coking of a noble metal catalyst in the catalytic
hydrogenation of nitrobenzene using a catalytic wall reactor, Chemical Engineering
and Processing 38(4-6), 395-404.