Land-Atmosphere Coupling Between a Land Surface ...
153
Land-Atmosphere Coupling Between a Land Surface Hydrological Model and a Regional Climate Model Florian Zabel München 2012
-
Upload
khangminh22 -
Category
Documents
-
view
0 -
download
0
Transcript of Land-Atmosphere Coupling Between a Land Surface ...

Land-Atmosphere Coupling Between a Land Surface
Hydrological Model and a Regional Climate Model
Florian Zabel
München 2012


Land-Atmosphere Coupling Between a Land Surface
Hydrological Model and a Regional Climate Model
Florian Zabel
Dissertation an der Fakultät für Geowissenschaften der Ludwig-Maximilians-Universität
München
vorgelegt von Florian Zabel aus München
München, den 21.06.2012

Erstgutachter: Prof. Dr. Wolfram Mauser Zweitgutachter: Prof. Dr. Ralf Ludwig Tag der mündlichen Prüfung: 12.12.2012

but I am fine

Zusammenfassung
vi
1. ZUSAMMENFASSUNG
Die Landoberfläche beeinflusst das Wetter- und Klimageschehen in grundlegender Art und
Weise. Der Bio-, Pedo- und Kryosphäre kommt dabei eine besondere Bedeutung als
Klimatreiber zu. Durch aerodynamischen Widerstand, Albedo, Emissivität und den Austausch
latenter und fühlbarer Wärme über Boden und Pflanzen steuern verschiedene
Landoberflächen mit ihren jeweils unterschiedlichen charakteristischen Eigenschaften das
Geschehen in der Atmosphäre maßgeblich mit. Die räumliche Heterogenität der
Landoberfläche als auch die zeitliche Dynamik der auf der Landoberfläche ablaufenden
Prozesse stellen eine wesentliche Herausforderung in Landoberflächenmodellen dar. Die
komplexen Wechselwirkungen zwischen atmosphärischen Prozessen und solchen auf der
Landoberfläche sowie damit einhergehender Rückkopplungseffekte können in Modellen nur
simuliert werden, wenn ein Austausch von Energie- und Masseflüssen zwischen diesen
Modellkomponenten stattfindet. Klimamodelle berücksichtigen diese wechselseitigen
Beziehungen seit jeher, mit zunehmender Bedeutung und Komplexität. Hier werden die
Energieflüsse der Landoberfläche in eigens dafür entwickelten Landoberflächenmodellen als
sogenannte untere Randbedingung an die Atmosphäre im Klimamodell übergeben. Die
Landoberfläche wird in Klimamodellen jedoch meist nur grob und stark vereinfacht
berücksichtigt, um die Wechselbeziehungen zwischen Landoberfläche und Atmosphäre für
bestimmte wissenschaftliche Fragestellungen hinreichend zu simulieren. Gegenwärtig werden
große Anstrengungen unternommen, um Landoberflächenmodelle in Klimamodellen zu
verbessern.
Hydrologische Modelle auf der anderen Seite beschreiben Landoberflächen mit einem Fokus
auf hydrologische Prozesse mit hoher räumlicher Auflösung (z.B. Boden-Pflanzen
Interaktionen, vertikale und horizontale Bewegung von Wasser auf der Landoberfläche und
im Boden, Schnee und Eis). Dabei behandeln sie jedoch den meteorologisch-atmosphärischen
Antrieb aus Klimamodellen in der Regel exogen und können daher Interaktionen und
Rückkopplungseffekte zwischen der Landoberfläche und der Atmosphäre nicht
berücksichtigen. Hydrologische Modelle wurden bislang erfolgreich mit Daten aus regionalen
Klimamodellen angetrieben, um z.B. regionale Auswirkungen des Klimawandels auf die
Hydrologie in kleinen Einzugsgebieten zu simulieren und zu erforschen. Für eine konsistente
Analyse der regionalen Auswirkungen des Klimawandels müsste das hydrologische Modell

Zusammenfassung
vii
jedoch bidirektional mit dem Klimamodell gekoppelt werden, um explizit Rückkopplungen
berücksichtigen zu können.
Inhalt dieser Arbeit war daher die bidirektionale Kopplung eines hydrologischen
Landoberflächenmodells mit einem regionalen Klimamodell, mit der Zielsetzung die Vorteile
hochauflösender hydrologischer Modelle mit der Fähigkeit von Klimamodellen, nämlich die
Berücksichtigung von Wechselwirkungen und Rückkopplungen zwischen Landoberfläche
und Atmosphäre, zu verbinden.
Beim Vergleich des Landoberflächenmodells NOAH, wie es aktuell im Klimamodell MM5
benutzt wird, mit dem hydrologischen Landoberflächenmodell PROMET zeigte sich, dass die
selben physikalischen Prozesse in den Modellen verschieden formuliert werden. Die in
PROMET implementierten Prozessbeschreibungen innerhalb des Boden-Pflanzen-
Atmosphären-Kontinuums sind detaillierter, komplexer und umfangreicher als jene in NOAH.
Dafür sind umfangreichere Pflanzen- und Bodenparametrisierungen notwendig, die für die
Prozessbeschreibungen in den Modellen erforderlich sind. Die dafür benötigten Daten werden
in PROMET aus Literatur, Messungen und Fernerkundungsdaten abgeleitet. Neben der
unterschiedlichen Parametrisierung benutzen die Modelle aus den verschiedenen Disziplinen
unterschiedliche räumliche und zeitliche Skalen. So rechnet PROMET mit 1 × 1 km2 auf einer
feineren räumlichen Skala als NOAH (45 × 45 km2) und kann somit die räumliche
Heterogenität für das Modellgebiet in Mitteleuropa mit einer wesentlich höheren Genauigkeit
darstellen. Dafür benötigt PROMET u.a. einen höheren Informationsgehalt in den
Eingangsdaten (wie z.B. Landbedeckung bzw. Landnutzung, Boden, Gelände).
Um diese Informationen für das Simulationsgebiet von Zentraleuropa (1170 × 1170 km2) in
hoher räumlicher Auflösung bereitstellen zu können, wurde ein neuer Landnutzungsdatensatz
erzeugt. Durch die Kombination bereits existierender Landnutzungsklassifikationen,
hochauflösenden MERIS-NDVI Fernerkundungsdaten und statistischen Datensätzen konnte
die räumliche Heterogenität v.a. innerhalb von landwirtschaftlich bewirtschafteten Flächen
verbessert werden. Daraus resultierten deutliche zeitliche und räumliche Veränderungen in
der Verdunstungssimulation an der Oberen Donau, was dort schließlich zu einer
Verbesserung der Wasserbilanz führte. Die Verbesserungen waren dabei vor allem auf
unterschiedliche phänologische Entwicklungen von verschiedenen Ackerfrüchten
zurückzuführen.

Zusammenfassung
viii
Aus den unterschiedlichen Modellkonzepten ergaben sich im Vergleich mit NOAH stark
unterschiedliche Ergebnisse in der Verdunstung, die in Norditalien bis zu 280 mm Jahr-1
betrug. Dabei spielten die Landnutzung und insbesondere versiegelte urbane Flächen eine
wesentliche Rolle, die in NOAH auf Grund der groben Auflösung im Modellgebiet nicht
berücksichtigt werden. Durch deren thermodynamische und hydraulische Eigenschaften
tragen versiegelte Flächen deutlich weniger zur Verdunstung bei, als z.B. mit Vegetation
bewachsene Flächen, die durch Transpiration pflanzenverfügbares Wasser aus dem Boden
verdunsten. Daneben führten vor allem unterschiedliche Boden- und Vegetationsparameter zu
unterschiedlicher Bodenfeuchte und unterschiedlichen Verdunstungsraten.
Bidirektional gekoppelt ändert sich der Zustand der Atmosphäre von MM5 als Reaktion auf
veränderte untere Randbedingungen durch den Austausch von NOAH mit PROMET. Folglich
stieg z.B. die jährliche Mitteltemperatur im Modellierungsgebiet um 1 K und der
Niederschlag ging um 56 mm zurück. Somit konnte gezeigt werden, dass physikalisch
basierte hydrologische Modelle wie PROMET in der Lage sind, die unteren
Randbedingungen für Klimamodelle in bidirektional gekoppelten Modellläufen adäquat
bereitzustellen. Die daraus resultierenden Zustandsänderungen der Atmosphäre als Reaktion
auf die geänderten unteren Randbedingungen sind sowohl nachvollziehbar, als auch in einer
realistischen Größenordnung. Die durch PROMET induzierten Änderungen der Masse- und
Energieflüsse zwischen Landoberfläche und Atmosphäre führten beim Betrachten der
Verdunstung schließlich sowohl zu positiven, als auch zu negativen Rückkopplungseffekten.
Die vorherrschenden hydrologischen Bedingungen bestimmten dabei das positive oder
negative Vorzeichen, als auch die Stärke der Rückkopplung. In bereits trockenen Regionen in
ungekoppelten Simulationen, wie z.B. in Norditalien, führte sommerliche Hitze zu einem
vermehrten Austrocknen der Böden und damit zu mehr Wasserstress bei Pflanzen. Dies
mündete in einen Rückgang der Verdunstung um bis zu 30 % und wiederum in eine geringere
Verdunstungskühlung. Nördlich der Alpen hingegen war das Gegenteil der Fall. Hier führte
ein Anstieg der Temperaturen zu überwiegend mehr Verdunstung, da der Boden hier meist
noch genug pflanzenverfügbares Wasser beinhaltete.
Weitere Analysen zeigten außerdem, dass Klimamodelle wie MM5 im bidirektional
gekoppelten Modus durch die genauere Repräsentation der Landoberfläche in PROMET
profitieren, indem z.B. die Simulation von tageszeitlichen, monatlichen und jährlichen
Temperaturverläufen im Vergleich mit Messergebnissen an der Oberen Donau verbessert
wurden. Dabei konnte vor allem der Temperaturverlauf an den bisher zu kühlen, frühen

Zusammenfassung
ix
Nachmittagsstunden verbessert werden. Ein Vergleich mit Messungen zeigte zudem eine
Verbesserung bei der Simulation von eintreffender Sonnenstrahlung, was darauf schließen
lässt, dass Prozesse wie Wolkenbildung ebenfalls präziser abgebildet wurden. Die in
Klimamodellen, vor allem in Gebieten mit starkem Relief, meist überschätzten Niederschläge,
wurden deutlich reduziert, wenngleich die Unsicherheiten v.a. in der räumlichen Verteilung
von simulierten Niederschlagsmengen über den Alpen auf Grund von schwierig zu
simulierenden subskaligen Konvektionsprozessen in den Klimamodellen immer noch eine
große Herausforderung darstellen. Durch die bidirektionale Kopplung konnten dennoch alle
Terme der Wasserbilanz für das Einzugsgebiet der Oberen Donau verbessert werden.
Durch die Berücksichtigung von gegenseitigen Wechselbeziehungen und Rückkopplungen in
die Simulation ist es mit dem entwickelten Ansatz möglich, nicht nur die Auswirkungen des
Klimawandels auf die Hydrologie der Landoberflächen, sondern auch die hydrologischen
Auswirkungen auf das Klima in Modellen besser zu erfassen. Somit ermöglicht die
bidirektionale Kopplung von Landoberflächenmodellen wie PROMET mit Klimamodellen,
genauere Aussagen und weitergehende Analysen als bisher über die Auswirkungen von
Landoberflächenprozessen auf verschiedener Aspekte des Klimawandels sowohl in der
Atmosphäre (z.B. Temperatur, Wolkenbildung, Niederschlag), als auch durch
Rückkopplungen induzierte Änderungen auf der Landoberfläche selbst (z.B. Bodenfeuchte,
Schnee- und Eisschmelze, Landnutzung, Verstädterung, Albedo, Verdunstung,
Pflanzenwachstum, Abflussbildung, Perkolation, Permafrost).

Summary
x
2. SUMMARY
The land surface influences weather and climate in a fundamental way. The bio-, pedo- and
cryosphere play a particularly important role as climate drivers. By aerodynamic resistance,
albedo, emissivity, and the exchange of latent and sensible heat via soil and plants, the land
surface largely controls the processes within the atmosphere. The spatial heterogeneity of land
surface properties and the temporal variability of land surface processes are a major challenge
in land surface models. The complex interactions between atmospheric processes and those
on the land surface and concomitant feedback effects can only be allowed in simulations, if
energy and mass fluxes are exchanged between these model components. Climate models
have always taken into account these interrelationships with increasing importance and
complexity. Here, the energy flows of the land surface are transferred to the atmosphere as the
lower boundary conditions. The representation of the land surface in current climate models,
however, is coarse and does not sufficiently address certain scientific questions in terms of
interactions between the land surface and the atmosphere. Thus, great efforts are currently
being made to improve land surface models in climate models.
In contrast to land surface representations in climate models, land surface hydrological
models (LSHMs) take the land surface with a focus on hydrological processes into detailed
spatial account (e.g. soil-plant interactions, vertical and lateral water flows, snow and ice).
However, they usually consider the atmosphere as an exogenous driver only, thereby
neglecting interactions and feedbacks between the land surface and the atmosphere. LSHMs
have been driven successfully with data from regional climate models, for example in order to
simulate regional impacts of climate change on the hydrology in small catchment areas. A
consistent analysis of the regional impacts of climate change, would request to couple the
hydrological model bi-directionally with the climate model to explicitly take into account
feedback effects.
Therefore, the purpose of this thesis is a bi-directional (two-way) coupling of a LSHM with a
regional climate model (RCM), with the aim to combine the advantages of high resolution
LSHMs with the ability to simulate land-atmosphere interactions and feedbacks with RCMs.
A comparison of the land surface model NOAH, as it is currently used within the climate
model MM5, with the land surface hydrological model PROMET, showed that the same
physical processes are formulated differently in the models. Thus, the process descriptions as

Summary
xi
formulated in PROMET are more detailed, complex and more comprehensive than in NOAH.
Therefore, more detailed plant and soil parameterizations are needed, which are necessary for
the process descriptions in the models. In PROMET, the required data are derived from
literature, measurements and remote sensing data. Besides the different parameterizations, the
models from different disciplines are using different spatial and temporal scale. PROMET
(1 × 1 km2) simulates on a finer spatial scale than NOAH (45 × 45 km2) and, thus, the spatial
heterogeneity for the model area in Central Europe is at higher accuracy. This requires greater
information content in the input data of PROMET (land use, soil, terrain).
To provide this information for the modelling domain of Central Europe (1170 × 1170 km2)
with high spatial resolution, a new land use/cover dataset was compiled. By combining
existing land use/cover datasets, high resolution MERIS-NDVI remote sensing and statistical
data, the spatial heterogeneity could be improved, especially for different types of crops
within arable land. Consequently, the spatial and temporal behaviour of simulated
evapotranspiration resulted in an improved simulation of the water balance for the Upper
Danube. The improvements were mainly due to differences in phenological development of
different agricultural crops.
The different model concepts resulted in greatly different results in simulated
evapotranspiration when compared to NOAH. The difference was up to 280 mm year-1 in
northern Italy. Thereby, the land-use and particularly sealed urban areas played an important
role, which are not included in the model domain in NOAH due to the coarse spatial
resolution. Due to their thermodynamic and hydraulic properties, these areas contribute
substantially less to evapotranspiration in contrast to vegetated surfaces that transpire
available soil water. Additionally, different soil and vegetation parameters resulted in
different soil moisture and different evapotranspiration rates.
Bi-directionally coupled, the state of the atmosphere of MM5 responses to changes due to the
changed lower boundary conditions by the exchange of NOAH with PROMET.
Consequently, the annual mean near surface air temperature in the modelling domain
increased around 1K and precipitation decreased by 56 mm. Thus, it could be shown that
physically-based models such as PROMET are able to provide the lower boundary conditions
for climate models in bi-directionally coupled model runs in an adequate way. The resulting
changes within the atmosphere in response to the modified lower boundary conditions are
both understandable and in a realistic order of magnitude. PROMET induced changes in land-
atmosphere mass and energy flows finally led to both positive and negative feedback effects

Summary
xii
on the evaporation. Thereby, the prevailing hydrological conditions determined the positive or
negative signs, as well as the strength of the feedback. In regions that were already dry in
uncoupled simulations, e.g. in Northern Italy, summer heat resulted in even more drying of
the soil and, thus, to greater water stress in plants, which resulted in lower evaporation rates
by up to 30 % and in turn in less evaporative cooling. North of the Alps, however, the
opposite was the case. Here, a rise in temperatures predominantly increased evaporation
because soil water was still available for plants.
Further analysis also showed that climate models such as MM5 benefit in the bi-directionally
coupled mode from the more detailed representation of the land surface in PROMET. As an
example, the simulation of the diurnal, monthly and annual cycle of the near surface air
temperature could be improved when compared with measurements for the Upper Danube.
Thereby, particularly a cold bias in the simulated daily maximum temperatures in the early
afternoon hours could be improved. In comparison to measurements, the amount of incoming
solar radiation has also been improved, which suggests that processes such as cloud formation
have also been reproduced more accurately. The climate models generally overestimated
precipitation, especially in mountainous areas. However, precipitation amounts could be
reduced, although uncertainties in alpine precipitation still remain high due to subscale
convection is still challenging to simulate in climate models. The bi-directional coupling
could finally improve all terms of the water balance for the catchment area of the Upper
Danube.
By incorporating feedbacks into the simulation, it is therefore possible to detect not only the
effects of climate change on the land surface hydrology, but also the hydrological impact on
the climate. Thus enabling the bidirectional coupling of land surface models such as
PROMET with climate models, allows more precise statements and further analysis of the
impact of land surface processes on different aspects of climate change both in the
atmosphere (e.g. temperature, cloud formation, precipitation), as well as by feedback-induced
changes upon the land surface itself (e.g. soil moisture, snow and ice melt, land use,
urbanization, albedo, evapotranspiration, plant growth, runoff, percolation, permafrost).

Acknowledgements
xiii
3. ACKNOWLEDGEMENTS
The work was carried out at the Ludwig-Maximilians-University in Munich at the chair of
Geography and Remote Sensing at the Department of Geography. As the head of the chair
and my supervisor, Prof. Dr. Wolfram Mauser deserves my first and most sincere thanks for
giving me the opportunity to work on this thesis and providing me with excellent advises,
professional working conditions and the needed computational resources for the performed
simulations. I always appreciated his valuable review and his open, friendly and direct mind.
Already as a student, he fascinated me for the broad field and modern opportunities of
geographical topics. Also, I want to express my gratefulness to Prof. Dr. Ralf Ludwig for the
review of this thesis. Further, I want to thank all the employees of the chair and all my dear
colleagues.
This interdisciplinary study could not have been achieved without the background of the
GLOWA-Danube project. The financial funding of GLOWA-Danube by the German ministry
of Education and Research (BMBF) is gratefully acknowledged. Thereby, I want to thank all
the former GLOWA- colleagues, especially Dr. Markus Muerth, Dr. Daniel Waldmann,
Dr. Monika Prasch and Andrea Reiter.
My special thanks go to Dr. Thomas Marke and Dr. Tobias Hank for their valuable expertise
and cooperation. Many thanks also go to the meteorologists Prof. Dr. Günther Zängl, Andreas
Pfeiffer and Dr. Clemens Wastl for the great collaboration within the GLOWA-Danube
project and, in regards of this study, their expert meteorological knowledge concerning the
regional climate model MM5.
Further, I would like to thank all my fellow Ph.D. students and roommates for the valuable
discussions, the cooperation, their technical support and the nice atmosphere. Thus, my
special thanks go to Florian Schlenz, Thomas Sailer, Tamara Avellan, Birgitta Putzenlechner,
Shrabana Datta, and all the others not named here.
It is my special concern to thank my band A HOME. A HEART. WHATEVER. and namely
the band members Dr. Marcus Schreiner and Tobias Mecklinger for the great and intense time
we have already spent together. The rehearsals and gigs were always the best choice to clear
my mind from work, relax, refresh and re-energize.

Acknowledgements
xiv
Finally, I want to thank my parents, sisters, brothers, nieces and nephews, my friends and
particularly Emily for their support and motivation, and for having the best and most
wonderful friends one can have.

Table Of Contents
xv
4. TABLE OF CONTENTS
1. ZUSAMMENFASSUNG VI
2. SUMMARY X
3. ACKNOWLEDGEMENTS XIII
4. TABLE OF CONTENTS XV
5. LIST OF FIGURES XVIII
6. LIST OF TABLES XXI
7. INTRODUCTION - 22 -
7.1. Interactions - 23 -
7.2. Feedbacks in the Coupled System - 26 -
7.3. Land Surface Heterogeneity - 27 -
7.4. State of the Art in RCMs - 29 -
7.5. State of the Art in LSHMs - 32 -
7.6. Research Objectives – Bi-directional Coupling Approach - 34 -
8. PUBLICATIONS - 36 -
8.1. Framework of the Thesis - 36 -
8.2. Overview of the publications - 38 -
8.3. Transition to Publication I - 39 -
8.4. Publication I - 40 -
Improving arable land heterogeneity information in available land cover products for land surface modelling using MERIS NDVI data - 41 -
Abstract - 41 - Introduction - 42 -
Existing land use/cover maps - 42 - Heterogeneity of arable land - 43 -
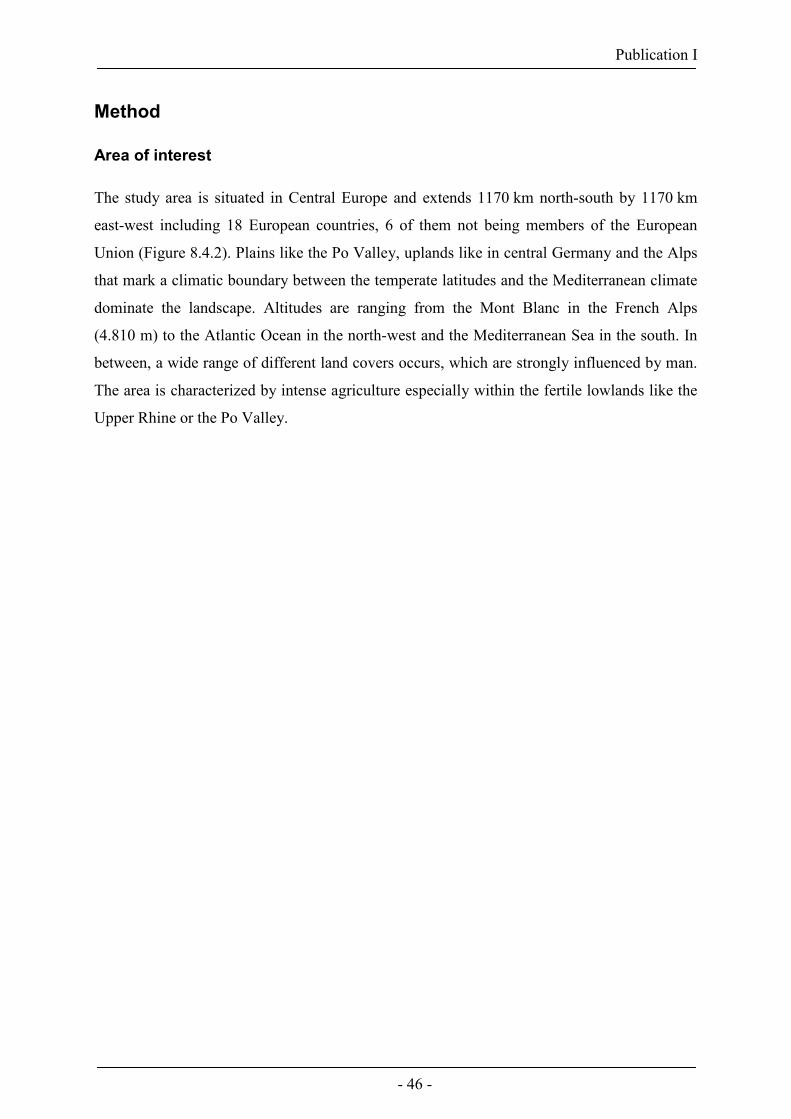
Method - 46 - Area of interest - 46 - Hydrological model - 47 - Land use/cover classification - 48 -
Fusion of CLC 2000 and CLC Switzerland and adaptation to PROMET - 48 - Subdivision of arable land via MERIS NDVI data - 52 - Statistical subdivision of phenological classes - 56 -

Table Of Contents
xvi
Results - 58 - Resulting land use/cover map - 58 - Impact on simulated evapotranspiration - 60 - Validation of the Water Balance - 62 -
Conclusions - 64 - Acknowledgement - 66 - References - 67 -
8.5. Transition to Publication II - 70 -
8.6. Publication II - 71 -
Inter-comparison of two land-surface models applied at different scales and their feedbacks while coupled with a regional climate model - 72 -
Abstract - 72 - Introduction - 74 - Methods - 76 -
Models and setup - 76 - Coupling approach - 78 - Study area - 80 - Comparison of modelling approaches - 81 -
Scales - 81 - Land use - 81 - Plant parameterization - 83 - Soil water hydraulic and plant physiology - 83 -
Results and discussion - 84 - Comparing NOAH and PROMET-offline - 84 - Quantification of feedbacks using PROMET-interact - 90 -
Air temperature - 91 - Precipitation - 92 - Evapotranspiration - 93 -
Conclusions - 97 - Acknowledgements - 99 - References - 100 -
8.7. Transition to Publication III - 104 -
8.8. Publication III - 105 -
Analysis of feedback effects and atmosphere responses when 2-way coupling a hydrological land surface model and a regional climate model - 106 - A case study for the Upper-Danube catchment - 106 -
Abstract - 106 - Introduction - 108 - Materials and Method - 111 - Results and Discussion - 113 -
Differences between PROMET and NOAH - 113 - Atmosphere responses - 114 -
Planetary boundary layer - 114 - Solar incoming radiation - 115 - Temperature - 116 - Precipitation - 118 -
Feedback effects - 121 - Evapotranspiration - 121 -

Table Of Contents
xvii
Water Balance - 121 - Conclusions and Outlook - 123 - Acknowledgements - 125 - References - 126 -
9. SYNTHESIS - 129 -
10. OUTLOOK - 131 -
11. REFERENCES - 133 -
12. APPENDIX - 141 -
12.1. Underlying Model Formulations - 142 -
12.1.1. NOAH - 142 -
12.1.2. PROMET - 145 -
12.1.3. References - 149 -
12.2. Curriculum Vitae - 152 -

List Of Figures
xviii
5. LIST OF FIGURES
Figure 7.1: The climate system (IPCC, 2001). .................................................................. - 22 -
Figure 7.1.1: Energy balance at the land surface, divided into the radiation balance (red arrows), the water balance (black, straight arrows) and the heat fluxes (black, curved arrows). ............................................................................................. - 23 -
Figure 7.2.1: Impulse-response and feedback mechanisms. ............................................... - 26 -
Figure 8.1.1: Continuity of the publications in the framework of the thesis. ...................... - 37 -
Figure 8.4.1: Seasonal development of LAI for maize and winter wheat for a test side in southern Germany (April to October 2004). Vertical error bars represent the minimum and maximum observations. ........................................................ - 44 -
Figure 8.4.2: Topography (based on SRTM data) of the area of interest, showing the European countries as well as the boundaries of the Upper Danube catchment. .. ...................................................................................................................... - 47 -
Figure 8.4.3: Reclassification of forested areas labelled as 'mixed forest' (m) to an evenly distribution of deciduous (20) and coniferous (21) forest. The Pixels are alternately classified to coniferous and deciduous. ...................................... - 50 -
Figure 8.4.4: Temporal change of MERIS NDVI, masked for arable land as a subtraction of Bimonth 4 with Bimonth 3. .......................................................................... - 53 -
Figure 8.4.5: Decision tree for the differentiation of three phenological categories (spring, summer, equal) using the change signal of two MERIS NDVI images for Bimonth 3 and Bimonth 4 2005. .................................................................. - 54 -
Figure 8.4.6: Phenological subclasses of arable land from CLC after splitting with MERIS NDVI. ........................................................................................................... - 55 -
Figure 8.4.7: Resulting land cover map based on CLC 2000 and CLC 1990 Switzerland and being transformed to the PROMET classification, after phenological subclasses of arable land gathered by MERIS NDVI were further statistically reclassified with the help of the EUROSTAT dataset. .................................................... - 59 -
Figure 8.4.8: Modelled mean monthly evapotranspiration (1971-2000) in May and August with three different land use/cover classification schemes implemented in PROMET (CLC winter wheat, CLC maize and the new land use/cover approach) for the Upper Danube catchment. ................................................ - 61 -
Figure 8.6.1: a) Principle of driving the hydrological model PROMET offline with data from the RCM MM5 within which the NOAH-LSM provides the lower boundary conditions (left). b) Interactive coupling of PROMET with the atmospheric part of MM5, thus providing the lower boundary conditions via the scaling interface SCALMET (right). ....................................................................................... - 77 -
Figure 8.6.2: Land use classification of the NOAH-LSM (45 × 45 km2) for the whole MM5 model domain and the inner coupling domain (left). PROMET land use classification (1 × 1 km2) for the coupling domain with MM5. ................... - 82 -
Figure 8.6.3: Correlation (r) of net radiation between PROMET-offline and NOAH for daily mean values (left) and difference plot of annual mean net radiation between PROMET-offline and the NOAH-LSM, scaled to the MM5 spatial resolution (right). ........................................................................................................... - 84 -

List Of Figures
xix
Figure 8.6.4: Annual mean shortwave reflection [W m-2] (1 January 1996 - 31 December 1999) of the NOAH-LSM (left) and PROMET-offline (right). ................... - 85 -
Figure 8.6.5: Difference plot of annual mean longwave outgoing radiation between PROMET-offline and the NOAH-LSM (left) and difference plot of annual mean Bowen ratio between PROMET-offline and the NOAH-LSM (right), each scaled to the MM5 spatial resolution. ........................................................... - 86 -
Figure 8.6.6: Annual mean evapotranspiration of NOAH-LSM (left) and PROMET-offline (right) ............................................................................................................ - 87 -
Figure 8.6.7: Difference plot between PROMET-offline and NOAH-LSM showing the annual mean evapotranspiration. .............................................................................. - 88 -
Figure 8.6.8: Monthly mean evapotranspiration from 1996 - 1999 simulated by the NOAH-LSM and PROMET-offline for pixels, dominated by impermeable area (share > 20 %) in the upscaled PROMET land use. The PROMET-offline results are shown for all corresponding PROMET-offline pixels as well as for vegetated pixels only, neglecting impervious surfaces. ............................... - 89 -
Figure 8.6.9: Upscaled share of impervious area of the PROMET land use versus the difference of evapotranspiration between PROMET-offline and NOAH, illustrated with a bivariante colour map (Teuling et al., 2011). ................... - 89 -
Figure 8.6.10: Daily mean evapotranspiration (normalized by maximum) plotted against soil moisture of the third soil layer (scaled between wilting point and saturation) for the NOAH-LSM and PROMET-offline, showing the vegetated pixels of the Milan area (left) and the Rhine-Neckar area (right) for July and August (1996-1999). ................................................................................................. - 90 -
Figure 8.6.11: Subtraction image (MM5/PROMET-interact - MM5/NOAH) of the annual mean near surface air temperature [K] (1 January 1996 - 31 December 1999). ... ...................................................................................................................... - 92 -
Figure 8.6.12: Subtraction image (MM5/PROMET-interact - MM5/NOAH) of the annual precipitation [mm] (1 January 1996 - 31 December 1999). ......................... - 93 -
Figure 8.6.13: Subtraction image of PROMET-interact and PROMET-offline simulation for annual mean evapotranspiration (1 × 1 km2). ............................................... - 94 -
Figure 8.6.14: Monthly evapotranspiration rates [mm] (1 January 1996 - 31 December 1999) of PROMET-offline simulation and PROMET-interact simulation exemplarily for the Milan and Rhine-Neckar pixels. ....................................................... - 95 -
Figure 8.6.15: Daily mean evapotranspiration (normalized by maximum) plotted against soil moisture of the third soil layer (scaled between wilting point and saturation) showing the PROMET-interact simulation in comparison to the PROMET-offline and NOAH results for the vegetated pixels of the Milan area (left) and the Rhine-Neckar area (right) for July and August (1996-1999). ................ - 96 -
Figure 8.8.1: Schematic illustration of 1-way (left) and 2-way coupling (right) a LSHM with a RCM. .......................................................................................................... - 109 -
Figure 8.8.2: Spatially averaged monthly land surface mass and energy fluxes (evapotranspiration, sensible heat flux, long-wave outgoing radiation, short-wave outgoing radiation) for the Upper-Danube catchment simulated with the NOAH-LSM and with PROMET offline respectively for the years 1996-1999. .. .................................................................................................................... - 113 -

List Of Figures
xx
Figure 8.8.3: Monthly course of the planetary boundary layer height (1996-1999). ........ - 115 -
Figure 8.8.4: Monthly course of the total incoming short-wave radiation (1996-1999). .. - 115 -
Figure 8.8.5: Difference plot between PROMET/MM5 and NOAH/MM5 annual mean near surface air temperature in the Upper Danube Basin, downscaled to 1 km. - 116 -
Figure 8.8.6: Monthly mean temperature of fully coupled NOAH-MM5 simulation, PROMET-MM5 simulation in comparison with measurements in the Upper-Danube catchment. ..................................................................................... - 117 -
Figure 8.8.7: Monthly mean diurnal cycle (1996-1999) of the near surface air temperature (3-hourly) for the Upper-Danube catchment. ............................................. - 118 -
Figure 8.8.8: Monthly convective and total precipitation of MM5 simulations coupled with NOAH and PROMET compared to measurements. ................................... - 119 -
Figure 8.8.9: Over- and underestimation of annual simulated PROMET/MM5 (left) and NOAH/MM5 (right) precipitation in the Upper Danube Basin, downscaled to 1 km and subtracted from measurements. .................................................. - 120 -
Figure 8.8.10: Monthly mean evapotranspiration in the Upper Danube Basin of 1-way and 2-way coupled PROMET simulations (1996-1999). .................................. - 121 -
Figure 12.1.1: Model components of PROMET (Mauser and Bach, 2009). .................... - 146 -

List Of Tables
xxi
6. LIST OF TABLES
Table 7.1.1: Typical Albedo values for different land surfaces (Marshall and Plumb, 2008). .... ...................................................................................................................... - 24 -
Table 8.4.1: PROMET land use/cover classes. ................................................................... - 48 -
Table 8.4.2: Transformation of CORINE Land Cover 2000 into the PROMET classes. ... - 49 -
Table 8.4.3: Transformation of the CORINE Land Cover 1990 Switzerland into the PROMET classes. .......................................................................................................... - 50 -
Table 8.4.4: Statistical distribution of coniferous and deciduous forest [km²] for each Swiss canton (Swiss Federal Statistical Office, 2004)............................................ - 51 -
Table 8.4.5: Priority list and 'Fill-up-Order' for the statistical reclassification of 'spring-crops', 'summer-crops' and 'equally-active' crops into 15 different types of arable land. ...................................................................................................................... - 57 -
Table 8.4.6: Water balance of three PROMET simulations using the CLC winter wheat, the CLC maize and the new land use/cover approach in comparison to the measured gauge in Achleiten as mean values from 1971 - 2000 for the month of August. .......................................................................................................... - 63 -
Table 8.8.1: Measured annual mean runoff at the outlet of the Upper Danube catchment at Achleiten in comparison with simulated runoff of NOAH/MM5 and PROMET/MM5 in either 1-way or 2-way coupled configuration. ............ - 122 -

Introduction
- 22 -
7. INTRODUCTION
The climate system consists of the earth's atmosphere, oceans and the terrestrial components
including the biosphere, the hydrosphere, the soils, the cryosphere and the orography (Figure
7.1). These components are all linked with each other by fluxes of mass, heat and momentum.
Thereby, physical, chemical and biological interactions occur on a wide range of spatial and
temporal scales, making the climate system extremely complex (Bridgman and Oliver, 2006).
Initial perturbations within one component lead to responses in other components. Resulting
feedback mechanisms may amplify or reduce changes in response to the initial perturbation
and hence are very important aspects in the climate system (IPCC, 2001). Thus, for modelling
the climate adequately and provide climate scenarios, all components must be interactively
connected and represented in a realistic way (IPCC, 2001). Therefore, climate models must be
able to represent the land surface energy and water balance, the spatial heterogeneity of the
land surface, the temporal variability of its complex interdependent processes, human
activities and natural processes that impact upon the land surface, and the surface-atmosphere
interactions (Pitman, 2003). Nevertheless, land-atmosphere interactions are still one of the
key sources of uncertainties in current climate scenarios and simulations (IPCC, 2007a).
Figure 7.1: The climate system (IPCC, 2001).

Introduction
- 23 -
7.1. Interactions
Figure 7.1.1: Energy balance at the land surface, divided into the radiation balance (red arrows), the water balance (black, straight arrows) and the heat fluxes (black, curved arrows).
The components of the climate system are not closed systems in a physical sense, since matter
and heat is exchanged with its surroundings through atmosphere-land and land-atmosphere
interactions. Thereby, the interactions between the components form inter-componential
balances (see Figure 7.1.1). The key equations that represent the role of the land surface in
climate are the energy balance (Eq. 2) and the surface water balance (Eq. 3) (Pitman, 2003).
Besides, the surface influences momentum exchange and, biogeochemical exchange, such as
the carbon balance.
The Earth's only significant energy source it the exogenous solar radiation. On its way to the
land surface, it is attenuated on gas-molecules (e.g. N2, O2, H2O vapor, CO2, CH4, and O3)
and aerosols in the Earth's atmosphere by processes of scattering and absorption (Monteith
and Unsworth, 2008). Thus, the land surface receives the transmitted direct and forward
scattered diffuse short-wave solar radiation.
The incoming solar radiation ( ↓S ) at the land surface is further reflected or absorbed,
depending on the surface's albedo (α ). Albedo naturally changes with solar insolations angle,
vegetation phenology, rain and snowfall, but can also be changed directly by natural and

Introduction
- 24 -
human induced land cover change or indirectly, e.g., by fertilizing effects on vegetation.
Typical albedo values for different land surfaces are shown in Table 7.1.1.
Table 7.1.1: Typical Albedo values for different land surfaces (Marshall and Plumb, 2008).
Land surface Albedo [%]
Forest 6-18
City 14-18
Grass 7-25
Ice 20-77
Snow (old to fresh) 40-95
The land surface continuously emits long-wave radiation ( ↑L ) following the Stefan-
Boltzmann-law, depending on the characterized emissivity and the temperature of a specific
land surface type. The emitted long-wave radiation is partly absorbed by atmospheric gases
that in turn re-radiate from the atmosphere to the land surface which is known as the
greenhouse effect ( ↓L ) (Marshall and Plumb, 2008). Eventually, the radiation balance
(Eq. 1) from short- and longwave radiation results in the net radiation ( nR ), which describes
the total amount of energy that is available at the land surface.
↑−↓+−↓= LLSRn )1( α (Eq. 1)
The available net radiation is partitioned into sensible ( H ), latent ( LE ), and the soil or
ground heat flux (G ), as described in the land surface energy balance (Eq.2).
GHLERn ++= (Eq. 2)
Consequently, a decrease of latent heat will automatically result in an increase of sensible heat
if net-radiation and soil heat flux remain constant. The distribution of the net radiation into
latent, sensible and soil heat is driven by complex inter-dependent processes within the soil-
plant-atmosphere continuum. Thereby, soil heat transfer is largely determined by the current
soil moisture and the thermal properties of the soil matrix (Muerth and Mauser, 2012). The
water pathway via the soil through the roots into the leaf and passing via the stomata into the
laminar and finally the turbulent atmosphere is driven by the potential difference of water
vapour pressure between the surface and the atmosphere. These processes occur on a wide
range of temporal scales ranging from minutes (canopy resistance), weeks (vegetation
phenology) to years (vegetation dynamics). The flux of momentum itself is not affecting the

Introduction
- 25 -
surface energy balance, but it is of importance because the atmospheric resistance to heat and
mass transport is closely related to this flux (Berge, 1990).
Atmospheric processes are largely sensitive to the partitioning of net radiation into latent and
sensible heat. More latent heat contributes to more water vapour in the atmosphere and tends
towards increasing cloudiness and precipitation, whereas increased sensible heat tends to heat
the planetary boundary layer and increase convection (Kabat et al., 2004; Pitman, 2003).
The atmosphere is the most unstable and rapidly changing fluid part of the climate system. Its
turbulent moving air masses within the planetary boundary layer in the lower part of the
atmosphere transport the received heat and mass from the land surface vertically and
horizontally (Berge, 1990). Thereby, the height of the boundary layer depends upon the
strength of the surface-generated mixing. When the Earth's surface is heated by the Sun,
thermal heat is transferred upwards (convection). This enables the boundary layer to extend
its height up to 2 km, while by night, when atmosphere cools down slower than the surface,
there is a downward transfer of heat and the height of the boundary layer shrinks to less than
100 m (Oke, 1987).
Atmospheric water vapour from evaporation stays on average 9.1 days in the atmosphere
before it condenses and, finally, falls down as precipitation, thus forming the water balance
(Eq. 3) (Baumgartner and Liebscher, 1996):
SREP ∆−−= (Eq. 3)
, where precipitation ( P ) results in surface and subsurface runoff ( R ), evaporation ( E ), and
S∆ , describing the change in water storage, e.g., within the soil, the snowpack, ice or water
bodies.

Introduction
- 26 -
7.2. Feedbacks in the Coupled System
In any dynamic system, an external impulse (=energy input) (+) results in a response. The
process-response system describes the connection between cause and effect as a function of
time (Oke, 1987). A feedback occurs when the result of an initial process (A) triggers changes
in a second process (B), that in turn influences the initial one (see Figure 1.2-1) (IPCC, 2001).
A
B
Input Output+Feedback
Response
Figure 7.2.1: Impulse-response and feedback mechanisms.
Thereby, feedbacks may amplify (positive feedback) or dampen (negative feedback) the
initial perturbation (Bridgman and Oliver, 2006). Consequently, a chain of mutually
influencing effects starts, until a stable equilibrium is readjusted. While forcings are defined
to be external to a system, feedbacks are describing internal processes.
The land-atmosphere system is characterized by strong positive and negative feedback loops
that are yet little understood (Bridgman and Oliver, 2006; IPCC, 2007a). A simple example is
the snow or ice-albedo positive feedback loop whereby snow or ice melting exposes more
dark ground, which in turn leads to lower albedo. This result in lower short-wave reflection
and increasing heat absorption that in turn causes higher air temperature and again more snow
melt. A reduction in vegetation, e.g., due to urbanization, deforestation or a reduction in leaf
area or in roots, results in reduced transpiration which yields in an increase of sensible heat at
the costs of latent heat. Thus, less evaporative cooling is warming the near surface
temperature, which in turn affects plant transpiration (Kabat et al., 2004). Low soil moisture
may also result in less evaporative cooling, thereby affecting convection, precipitation and air
temperature that in turn feed back to soil moisture (Seneviratne et al., 2010; Fischer et al.,
2007a). Studies of the summer 2003 heat wave demonstrated the importance of soil moisture
in terms of its impact on atmospheric processes (Schär et al., 2004; Loew et al., 2009; Fischer
et al., 2007b).

Introduction
- 27 -
7.3. Land Surface Heterogeneity
The land surface fluxes are strongly related to the land surface characteristics. Thereby, the
land surface is highly variable in all aspects in space, such that measurements taken one metre
or two apart may report substantial differences in everything from soil moisture, through soil
characteristics, to the type of vegetation (Pitman, 2003; Kabat et al., 2004). The enormous
spatial variability of land cover, soil and the topography, due to their different properties is
described in this thesis by the land surface heterogeneity. Thereby, the combination of the
land cover, soil and topographic characteristics result in highly complex spatial
differentiations and temporal dynamics of individual hydrological processes (Kabat et al.,
2004), thus affecting the atmosphere.
The land cover, soils and the topography by slope, aspect and elevation control how much
energy received from the sun is returned to the atmosphere (Monteith and Unsworth, 2008).
Also, the terrain elevation is an important roughness property and also affects the air
temperature with strong impacts, e.g., on mountainous snow cover. The soils have different
hydraulic properties, such as texture and pore-size distribution. They determine, e.g., the
infiltration rate, soil water tension and maximum soil water content.
Because of different thermodynamic properties, such as thermal conductivity and heat
capacity, different radiation properties, such as albedo and emissivity, and different roughness
properties, and different hydraulic properties, the land cover and land use strongly influences
atmosphere processes. Thereby, vegetated land elementary differs from non-vegetated
surfaces, such as open water, bare soil, snow and ice, rock or urban areas. Besides, a broad
palette of different types of vegetation exists, such as deciduous broadleaf and coniferous
forest or grassland. The behaviour of the stomata resistance and, with changing vegetation
phenology, leaf area index (LAI), root depth and albedo are important vegetation properties
for plant transpiration (Bach, 1995).
Anthropogenic impacts upon the land through intensive agriculture, deforestation and
urbanization, tremendously changed the land surface, with large effects on climate (Bridgman
and Oliver, 2006; Kabat et al., 2004; IPCC, 2007b).
The spatial heterogeneity of the land surface and the temporal variability at which land
surface processes take place both are major challenges in modelling the land surface. With
decreasing spatial scale and aggregation, the precision of the land use and land cover, the soil

Introduction
- 28 -
and orography information is decreasing. The homogenization of these datasets in coarse
scaled models leads to an information loss. The spatial distribution and spatial combination of
soil, topography and vegetation type are essentially important in order to provide the
prevailing conditions and properties at a certain point to the model. The parameterization of
different soil types and land use/cover types describe the hydraulic, phenological, thermal and
energetic properties. With increasing spatial scale, more individual plants can be located,
resolved, parameterized and distinguished by the model. An increase of spatial resolution is
increasing computational resources with square weight. Since computational resources are
limited, a coarse resolution is often chosen to shorten the simulation time, e.g., for long-term
scenario simulations in climate models.

Introduction
- 29 -
7.4. State of the Art in RCMs
A climate model is the numerical representation of the climate system based on the physical,
chemical and biological properties of its components, their interactions and feedback
processes, and accounting for all or some of its known properties (IPCC, 2001). Regional
climate models (RCMs) being forced with exogenous model data on the lateral boundaries of
the limited modelling area, extend the coarse description of atmospheric processes within
GCMs towards increased spatial resolution, thereby capturing the regional structures of each
model grid point on continental scales (Giorgi, 2001; Jacob et al., 2007; Kueppers et al., 2008;
Laprise, 2008; Mc Gregor, 1997; Michalakes, 1997; Quintanar et al., 2009; Schär et al., 2004;
Stocker, 2004; Zampieri et al., 2011). At present, RCMs' grid squares are usually around
50 × 50 km2. RCMs have always taken into account the interrelationships between the land
surface and the atmosphere (Pitman, 2003). Therefore, the land surface energy and matter
fluxes, representing the lower boundary conditions, are passed to the atmospheric part of the
RCM.
Land surface models (LSMs) within RCMs have undergone large improvements in the past
decades (van den Hurk et al., 2011). The Project for the Intercomparison of Land-Surface
Parameterization Schemes (PILPS) started 1992 for evaluating and intercomparing LSMs
within a common framework, with the aim of improving the understanding of current and
future parameterization schemes used to represent regional to continental scales (Dickinson,
1995; Famiglietti and Wood, 1991; Polcher et al., 1998; Wood et al., 1998; Yang et al., 1998;
Henderson-Sellers et al., 1996; Timbal and Henderson-Sellers, 1998; Pitman and Henderson-
Sellers, 1998). One of the key findings within PILPS was the need to run LSMs decoupled
from the host atmospheric model for model comparison and comparison with measurements,
and the recognition of the need to formally conserve energy and matter (van den Hurk et al.,
2011). The complexity, spatial heterogeneity and temporal variability of land surface
processes and the need for a more detailed view of it is a long standing discussion in
atmospheric sciences (Henderson-Sellers et al., 1995; Henderson-Sellers et al., 2008;
Dickinson, 1995; Dickinson et al., 1991). There is evidence that more advanced and robust
LSMs, which increasingly consider the spatial heterogeneity and complexity of land surface
biophysical and hydrological processes in the soil-plant-atmosphere continuum on a finer
scale will reduce the uncertainties in the current modelling of land-atmosphere processes
(Essery et al., 2003; Hagemann et al., 2001; Koster et al., 2004; Laprise, 2008; Molod and
Salmun, 2002; Seth et al., 1994; Yu, 2000).

Introduction
- 30 -
Therefore, huge efforts are currently being made in several projects to resolve the spectrum of
land surface challenges within the International Geosphere-Biosphere Programme (IGBP) and
the World Climate Research Programme (WCRP), such as the Integrated Land Ecosystem-
Atmosphere Processes Study (iLEAPS), the Global Energy and Water Cycle Experiment
(GEWEX), and the Global Land Atmosphere System Study (GLASS) framework which was
launched in 1999 (van den Hurk et al., 2011). The main focus of attention of GLASS is model
development and evaluation, thereby enclosing various projects, such as the Global Soil
Wetness Project (GSWP) (Dirmeyer, 2011), the Global Land Atmosphere Coupling
Experiment (GLACE) (Koster et al., 2004; Koster et al., 2006), the Local coupled land-
atmosphere Modelling Project (LoCo) (van den Hurk and Blyth, 2008) and the Land-Use and
Climate, Identification of robust impacts (LUCID) project (Pitman et al., 2009). These
projects aim at transforming the ability of LSMs to realistically represent land surface
processes and fluxes and the complex interactions and feedbacks with the atmosphere to
capture the climate sensitivity at different spatial scales. Further, they work on improving the
specification of the land surface characteristics of their temporal and spatial variability, e.g.,
to assess the sensitivity of surface fluxes to the specification of canopy conductance, leaf area
index, surface roughness and rooting depth.
Due to the latest progress, LSMs have developed from simple bucket schemes to more
realistic land surface representations, including more and more aspects of physical land
surface modelling, anthropogenic effects and interactions (Pitman, 2003). Vegetation
dynamics and their responses to environmental conditions, surface and subsurface hydrology,
dynamic evolution of snowpack and the representations of urban, lake and biogeochemical
processes are recently implemented in LSMs (Pitman, 2003; van den Hurk et al., 2011).
However, the major concern of current LSMs is the sufficient representation of land
heterogeneity at the local to regional scale and sub-grid-scale processes (Bridgman and
Oliver, 2006; IPCC, 2007b; Pitman, 2003). By not allowing for small-spatial-scale processes,
their capacity to model future climate change is limited, especially with respect to
hydrological consequences and their role of coupling and feedbacks (Bridgman and Oliver,
2006; IPCC, 2007b; Pitman, 2003). Current key uncertainties in RCMs include the role of the
soil, the cryosphere, human-induced impacts on the land use, land-atmosphere interactions as
well as land surface parameters, such as vegetation parameters or the depth of the
hydrological soil reservoir (IPCC, 2007a). Thereby, they typically ignore horizontal
movement of surface and sub-surface water within the soil. They do not capture basic

Introduction
- 31 -
hydrological processes, such as permafrost, the impact of frozen soil on infiltration or soil
heat transfer, roots and their effects on moisture availability, the whole issue of groundwater
(IPCC, 2007b; Muerth and Mauser, 2012; Pitman, 2003). Yet, most of the LSMs do not
incorporate site-specific soil properties or the influence of soil moisture on heat transfer
(Muerth and Mauser, 2012).

Introduction
- 32 -
7.5. State of the Art in LSHMs
Hydrologists have developed empirical, conceptual and more and more physically-based land
surface hydrological models (LSHMs) spanning a wide range of complexity.
They have developed from simple reservoir models, producing the runoff unit hydrograph as
a response to precipitation input for basins and sub-basins, to not-calibrated and physically
based models, taking in detailed into account the spatial properties of the catchment (Mauser
and Bach, 2009).
They go beyond reproducing runoff at gauges of small scale catchment areas and now
consider in detail the hydrologic land surface processes, thereby capturing land surface
heterogeneity with high spatial resolution of about 1 × 1 km2 and are more and more
extending to continental scales (Bharati et al., 2008; Devonec and Barros, 2002; Garcia-
Quijano and Barros, 2005; Kuchment et al., 2006; Kunstmann et al., 2008; Ludwig and
Mauser, 2000; Mauser and Bach, 2009; Schulla and Jasper, 1999; Wagner et al., 2009).
Thereby, they describe the characteristics of a wide range of natural vegetation and
agricultural crops. The physically based models aim at understanding the interactions between
the different land surface and subsurface compartments, namely soil, vegetation, snow and
ice, groundwater in producing the resulting river runoff (Ludwig and Mauser, 2000; Ludwig
et al., 2003a; Ludwig et al., 2003b; Mauser and Schädlich, 1998; Mauser and Bach, 2009;
Strasser, 1998). They include detailed descriptions of vertical and lateral soil water, ground
water, including related flow regulations and man-made structures (Koch et al., 2011). They
describe in detail mass and heat transfer within the soil (Muerth and Mauser, 2012),
incorporating the effects of frozen soils, vegetation dynamics (Hank, 2008), snow and ice
dynamics (Prasch et al., 2006; Prasch et al., 2011; Strasser et al., 2007; Weber et al., 2010) as
well as mass and heat exchange with the atmosphere. Thereby, they capture the major land
surface processes in the soil-plant-atmosphere continuum with high spatial and temporal
resolution (Loew, 2008; Loew et al., 2009; Marke , 2008; Strasser and Mauser, 2001).
The meteorological drivers as input to LSHMs can either be provided by measurements or by
RCMs. The latter has been used for recent hydrological impact studies on climate change
scenarios (Marke, 2008; Marke et al., 2011; Kotlarski et al., 2005; Kunstmann and Stadler,
2005). A major issue in these studies is the scale gap between the RCMs and the hydrological
impact models, since hydrological models usually act on much finer spatial scale in order to

Introduction
- 33 -
resolve the relevant hydrological processes realistically (IPCC, 2007b; Marke, 2008).
Thereby, the meaning of large spatial domains is increasing for hydrological models with
respect to capture impacts of hydrological dynamics and processes on climate and climate
change (Cloke and Hannah, 2011).
In contrast to LSMs designed for atmosphere applications, the atmosphere is usually
considered as an exogenous driver only. Therefore, they do not allow for interactions and
feedbacks between the atmosphere and the land surface.

Introduction
- 34 -
7.6. Research Objectives – Bi-directional Coupling Approach
While RCMs allow for exchanging fluxes in a coupled land-atmosphere system, their
representation of the land surface is usually coarse. Often, they do not sufficiently capture
important land surface hydrological processes or even neglect hydrologically important land
surface characteristics. On the other hand, LSHMs describe the processes at the land surface,
including the surface energy, radiation and water balance with high spatial and temporal
detail. However, they do not allow for feedbacks between the land surface and the
atmosphere, since they usually consider the atmosphere as an exogenous driver only.
Nevertheless, both models use physically based parameterizations and formulations for
describing the same land surface processes, thereby closing the energy balance at the land
surface and following the rules of mass and energy conservation.
Therefore, the basic idea of this thesis was the combination of the advantages of current
LSHMs with the advantages of existing RCMs. The recent developments in LSMs show that
there is a huge scientific demand for improving LSMs within RCMs. In the hydrological
community one is used to deal with climate data, though, the impact of hydrological changes
on climate has never been discussed as explosive as today. Nevertheless, the scientific tools
for detailed hydrological simulations are not able to cope with hydrological impacts on
climate and resulting feedbacks.
Therefore, a bi-directional coupling approach was developed, that allows for a coupling
between a LSHM with the atmospheric part of a RCM across the different scales between
both models. Coupling a LSHM with a RCM has never been investigated explicitly. The
potential of such an approach has already been recognized e.g. in Chen and Dudhia (2001),
who suggests to apply LSHMs originally designed for surface hydrology to atmospheric
applications. Van den Hurk et al. (2011) stimulates a rethinking of the concept of fixed land
models that are driven by fixed atmosphere forcings in various scientific arenas (weather
prediction, catchment hydrology, ocean science).
By coupling a LSHM bi-directionally with a RCM, the RCM would benefit from the
advanced understanding and representation of the land surface from the LSHM. In return, the
LSHM would profit from the possibility to include feedback effects between the high
resolution land surface and the atmosphere.

Introduction
- 35 -
Overall, these improvements could lead to a scientific benefit in modelling and understanding
land-atmosphere interactions and, thus, reduce uncertainties within current climate
projections.
While LSHMs already deal with studying of the land surface under the influence of changing
meteorological conditions, the bi-directional coupling approach opens the opportunity for
hydrological models to investigate hydrological impacts at the land surface on the climate,
e.g., due to climate or land use change. This includes possible benefits, impacts and links to
related issues, such as water and food supply, energy, health, and biodiversity.
Within the framework of the GLOWA-Danube project within which this work took place, the
developed coupling approach was implemented in the LSHM PROMET and the RCM MM5.
These models were applied and adapted for the modelling domain of Central Europe.

Publications
- 36 -
8. PUBLICATIONS
8.1. Framework of the Thesis
This cumulative thesis includes three integral publications forming the framework of this
thesis. Thereby, each publication can be put in the overall context of the thesis, addressing the
research objectives and goals as described. Hence, Figure 8.1.1 illustrates the continuity of the
publications within the framework.
While the first publication describes an integral method for improving land use/cover
heterogeneity information, it can be regarded as a substantial part of the data acquisition and
preparation for the bi-directional coupling approach between PROMET and the atmospheric
part of MM5 that is further described in publication II.
The main focus of publication II is the model comparison between the LSM within the RCM
MM5 (NOAH) and the LSHM PROMET and the methodical description of the coupling
approach. On the basis of the model comparison, the differences between the model results
are explained.
While results are shown and discussed within publication II for the whole coupling domain of
Central Europe, they are finally validated and compared with measurements for the specific
Upper Danube watershed in the study of publication III.

Publications
- 37 -
Land Use and Land Cover Information
§ The Role of land use and land cover in LSMs§ Spatial and temporal aspects of land surface heterogeneity
and impact on evapotranspiration§ Improvement of land surface heterogeneity information
Bi-directional coupling between PROMET and MM5
§ Model comparison between NOAH and PROMET§ Methodical description of the coupling approach§ Results
Validation of the Results for the Upper Danube Catchment
§ Validation of temperature and precipitation§ Validation of the water balance
Data Aquisition and Preperation
Methodology and Results
Results and Validation
Publication I
Publication II
Publication III
Figure 8.1.1: Continuity of the publications in the framework of the thesis.
Publications
- 38 -
8.2. Overview of the publications
The dissertation encloses the following three integral publications:
Publication I
Zabel, F., Hank, T.B., Mauser, W.: Improving arable land heterogeneity information in
available land cover products for land surface modelling using MERIS NDVI data.
Hydrol. Earth Syst. Sci., 14, 2073–2084, Doi:10.5194/hess-14-2073-2010, 2010
Publication II
Zabel, F., Mauser, W., Marke, T., Pfeiffer, A., Zängl, G., and Wastl, C.: Inter-comparison of
two land-surface models applied at different scales and their feedbacks while coupled
with a regional climate model, Hydrol. Earth Syst. Sci., 16, 1017-1031,
Doi:10.5194/hess-16-1017-2012, 2012.
Publication III
Zabel, F. Mauser, W.: Analysis of feedback effects and atmosphere responses when 2-way
coupling a hydrological land surface model with a regional climate model. A case study
for the Upper-Danube catchment, Hydrol. Earth Syst. Sci. Discuss., 9, 7543-7570,
Doi: 10.5194/hessd-9-7543-2012, 2012.

Transition to Publication I
- 39 -
8.3. Transition to Publication I
In the framework of this thesis, the first paper is about the acquisition and preparation of land
surface information (see Figure 8.1.1). The aim of this paper is to develop a yet not existing
high resolution land use/cover dataset for the later use with PROMET in the bi-directional
coupling approach for Central Europe, covering the large spatial area of 1170 × 1170 km2.
The large spatial extend was necessary to allow for feedbacks within the bi-directional
coupling approach with the RCM, since climate models are designed to simulate large spatial
scales.
The study forms an integral part of this thesis, since the compiled land surface information is
essential for the further coupling approach. The land cover information has strong impact on
both albedo and partitioning of energy and matter fluxes from the surface to the atmosphere
(Ge et al., 2007). It determines the type of vegetation and thereby the seasonal development of
plant phenology, canopy structure and leaf area, which in turn, through vegetation height and
leaf area index, determines the aerodynamic and evapotranspirative properties of the land
surface.
Therefore, this publication describes a developed approach, combing existent land use
classifications with high resolution remote sensing NDVI data and statistical datasets. Thus, it
is shown that land surface heterogeneity, including the crop variability within arable land, is
an essential aspect for hydrological modelling with high impact on energy and matter fluxes.
The impact of land surface heterogeneity information on the simulation of evapotranspiration
is exemplarily demonstrated for the Upper Danube basin.

Publication I
- 40 -
8.4. Publication I
Zabel, F., Hank, T.B., Mauser, W.: Improving arable land heterogeneity information in
available land cover products for land surface modelling using MERIS NDVI data.
Hydrol. Earth Syst. Sci., 14, 2073–2084, Doi:10.5194/hess-14-2073-2010, 2010

Publication I
- 41 -
Improving arable land heterogeneity information in
available land cover products for land surface modelling
using MERIS NDVI data
F. Zabel1, T. B. Hank1 and W. Mauser1
[1] Department of Geography, Ludwig-Maximilians-Universität (LMU), Munich, Germany
Correspondence to: F. Zabel ([email protected])
Abstract
Regionalization of physical land surface models requires the supply of detailed land cover
information. Numerous global and regional land cover maps already exist but generally, they
do not resolve arable land into different crop types. However, arable land comprises a huge
variety of different crops with characteristic phenological behaviour, demonstrated in this
paper with Leaf Area Index (LAI) measurements exemplarily for maize and winter wheat.
This affects the mass and energy fluxes on the land surface and thus its hydrology. The
objective of this study is the generation of a land cover map for central Europe based on
CORINE Land Cover (CLC) 2000, merged with CORINE Switzerland, but distinguishing
different crop types. Accordingly, an approach was developed, subdividing the land cover
class arable land into the regionally most relevant subclasses for central Europe using
multiseasonal MERIS Normalized Difference Vegetation Index (NDVI) data. The satellite
data were used for the separation of spring and summer crops due to their different
phenological behaviour. Subsequently, the generated phenological classes were subdivided
following statistical data from EUROSTAT. This database was analysed concerning the
acreage of different crop types. The impact of the improved land use/cover map on
evapotranspiration was modelled exemplarily for the Upper Danube catchment with the
hydrological model PROMET. Simulations based on the newly developed land cover
approach showed a more detailed evapotranspiration pattern compared to model results using
the traditional CLC map, which is ignorant of most arable subdivisions. Due to the improved

Publication I
- 42 -
temporal behaviour and spatial allocation of evapotranspiration processes in the new land
cover approach, the simulated water balance more closely matches the measured gauge.
Introduction
The land surface and its properties are highly influenced by human activities such as
agriculture or surface sealing. Land use/cover information is a key component of climate and
hydrological models since the land cover primarily controls the energy fluxes on the land
surface (Monteith and Unsworth, 1990; Lu and Shuttleworth, 2002; Masson et al., 2002). In a
land use/cover map, each pixel of the land surface is associated to a label that characterizes
the land use/cover following a predefined nomenclature. The accuracy of land use/cover
products has a strong effect on the model results (Ge et al., 2007). The regional hydrological
relevance of the mapped agricultural land cover heterogeneity is the focus of this paper.
Existing land use/cover maps
Thanks to the development of new remote sensing sensors with improved spatial and spectral
resolution, various global, regional and local classifications with a spatial resolution of 1 km
or even higher exist (Defries and Belward, 2000; Cihlar, 2000; Herold et al., 2007).
ECOCLIMAP, for example, is a well-known global land cover product with a spatial
resolution of 1 km (Masson et al. 2002). The Global Land Cover (GLC) 2000 classification
compiled by the Joint Research Centre (JRC) and the European Space Agency (ESA) using
SPOT-4 remote sensing data also features a spatial resolution of 1 km (Bartholomé and
Belward, 2005). As a successor of GLC 2000, GLOBCOVER uses ENVISAT MERIS fine
resolution data (300 m) for mapping the global land cover (Arino et al., 2007; Defourny et al.,
2006). The MERIS images used for the GLOBCOVER product were acquired between
January 2005 and June 2006 within the frame of the ESA GLOBCOVER project (Bicheron et
al., 2008). The data are provided by POSTEL (Pôle d’Observation des Surfaces continentales
par TELédétection). These land cover products use different thematic legends but are fully
compatible with the LCCS (Land Cover Classification System) used by the Food and
Agriculture Organisation (FAO) and the United Nations Environment Programme (UNEP),
which comprises 22 different types of land cover (Di Gregorio et al., 2000). As these maps
provide global land cover information, they may not necessarily be suitable for regional or
local studies. The CORINE Land Cover (CLC) classification is the most detailed regional
land cover product available for Europe. It distinguishes 44 classes of land cover with a

Publication I
- 43 -
spatial resolution of 100 m (Heymann et al., 1994; EEA, 2006; Bossard et al., 2000). The data
are available for download at the EEA (European Environmental Agency). Many studies
comparing the available land cover products e.g. CLC 2000 and GLC 2000 (Neumann et al.,
2007; Herold et al., 2007) provide information on applicability and accuracy of the different
maps.
Heterogeneity of arable land
Energy and matter fluxes are influenced directly by the land surface. Vegetation is a key
element for SVAT (Soil-Vegetation-Atmosphere-Transfer) models, regarding its function as
an interface between the land surface and the atmosphere (e.g. as a regulator of transpiration)
(Monteith and Unsworth, 1990). The land surface has a strong feedback effect on the
atmosphere and hence on the climate (Bounoua et al., 2000). Unfortunately most global and
regional land cover datasets derived from satellites group croplands into just a few categories,
thereby excluding information that is critical for answering key questions of current research
(Monfreda et al. 2008; Herold et al., 2007). According to CLC, arable land accounts for 46 %
of the study area and thereby represents the class with the largest proportion of all land cover
classes in central Europe. However, croplands include a variety of species with different
phenology and physiology (Lokupitiya et al., 2009).
Exemplarily shown in Figure 8.4.1 for maize and winter wheat based on the temporal
development of Leaf Area Index (LAI), the growth cycles of specific crops may differ largely.
While the main growth period of winter wheat occurs between May and June, the
measurements show that maize grows fastest between July and August.

Publication I
- 44 -
Figure 8.4.1: Seasonal development of LAI for maize and winter wheat for a test side in southern Germany (April to October 2004). Vertical error bars represent the minimum and maximum observations.
The ground based LAI measurements shown in Figure 8.4.1 were collected during a field
campaign conducted in southern Germany (approx. 25 km south-west of the city of Munich),
monitoring maize and winter wheat stands during the growing season in 2004. The data points
represent values of total LAI, measured by means of the Plant Canopy Analyzer LAI-2000
instrument (LICOR Inc., Lincoln, NE, USA). Each point corresponds to the average of five
individual sample points within a winter wheat and a maize stand respectively. Vertical error
bars indicate the observed minimum and maximum within each of the test fields. Although
the investigated stands were comparably homogenous and strongly developed, which may
cause the absolute values to appear slightly elevated compared to less well developed fields,
the general seasonal growth pattern can be considered representative for these crops in
southern Germany. The distinct difference of the temporal dynamics of leaf area accumulation
and decrease of wheat and maize accounts well for the characteristic seasonal growth patterns
of both crops. While the wheat site was ripening during July and already harvested at the
beginning of August, the maize site did not reach its maximum development before the
beginning of September. Since the displayed values were derived from non-destructive
measurements, only the total LAI of the crops can be considered. If the effect of chlorophyll
decomposition during the ripening phase is additionally taken into account, the seasonal

Publication I
- 45 -
disparities between both crops would become even more apparent. Nonetheless, the readings
displayed in Figure 1 clearly indicate that there is a temporal gap in the seasonal behaviour of
maize and winter wheat of about 2 months. Bsaibes et al. (2009) showed similar results for
temporal dynamics of LAI in southern France with a temporal shift forward in time of
approximately 2 weeks. Those findings support the assumption of this typical seasonal
behaviour of LAI development for the entire European area of interest.
The different phenology not only has an impact on the primary productivity during the
growing season but also on the energy and matter fluxes such as evapotranspiration, sensible
heat flux or long- and shortwave outgoing radiation as well as on CO2 fluxes or soil moisture
(Lokupitiya et al., 2009). This must be taken into account when modelling the processes on
the land surface. A diverse vegetation phenology within the arable land makes it necessary to
split this class into subdivisions of different crop types. Approaches for unmixing cropland
out of multitemporal remote sensing data have been carried out successfully using
NOAA/AVHRR time series (Probeck et al., 2003). Studies for higher resolution information
nevertheless show that amounts of manual interpretation and cloud-free high spatial resolution
imagery are required for operational implementation over large areas and in multiple years
(Lobell and Asner, 2004). However, the approach described in this paper uses existing land
cover products improving them with the help of remote sensing products combined with
statistical data.
Publication I
- 46 -
Method
Area of interest
The study area is situated in Central Europe and extends 1170 km north-south by 1170 km
east-west including 18 European countries, 6 of them not being members of the European
Union (Figure 8.4.2). Plains like the Po Valley, uplands like in central Germany and the Alps
that mark a climatic boundary between the temperate latitudes and the Mediterranean climate
dominate the landscape. Altitudes are ranging from the Mont Blanc in the French Alps
(4.810 m) to the Atlantic Ocean in the north-west and the Mediterranean Sea in the south. In
between, a wide range of different land covers occurs, which are strongly influenced by man.
The area is characterized by intense agriculture especially within the fertile lowlands like the
Upper Rhine or the Po Valley.

Publication I
- 47 -
Figure 8.4.2: Topography (based on SRTM data) of the area of interest, showing the European countries as well as the boundaries of the Upper Danube catchment.
Hydrological model
The physically based hydrological model PROMET (Processes of Radiation, Mass and
Energy Transfer) used in this study to investigate the regional impact of agricultural land
information was developed and validated for the Upper Danube catchment (Mauser and Bach,
2009; Mauser and Schädlich, 1998). The model can be operated on variable scales, but was
applied with a spatial resolution of 1 km in this study. Hence, a land use/cover scheme that
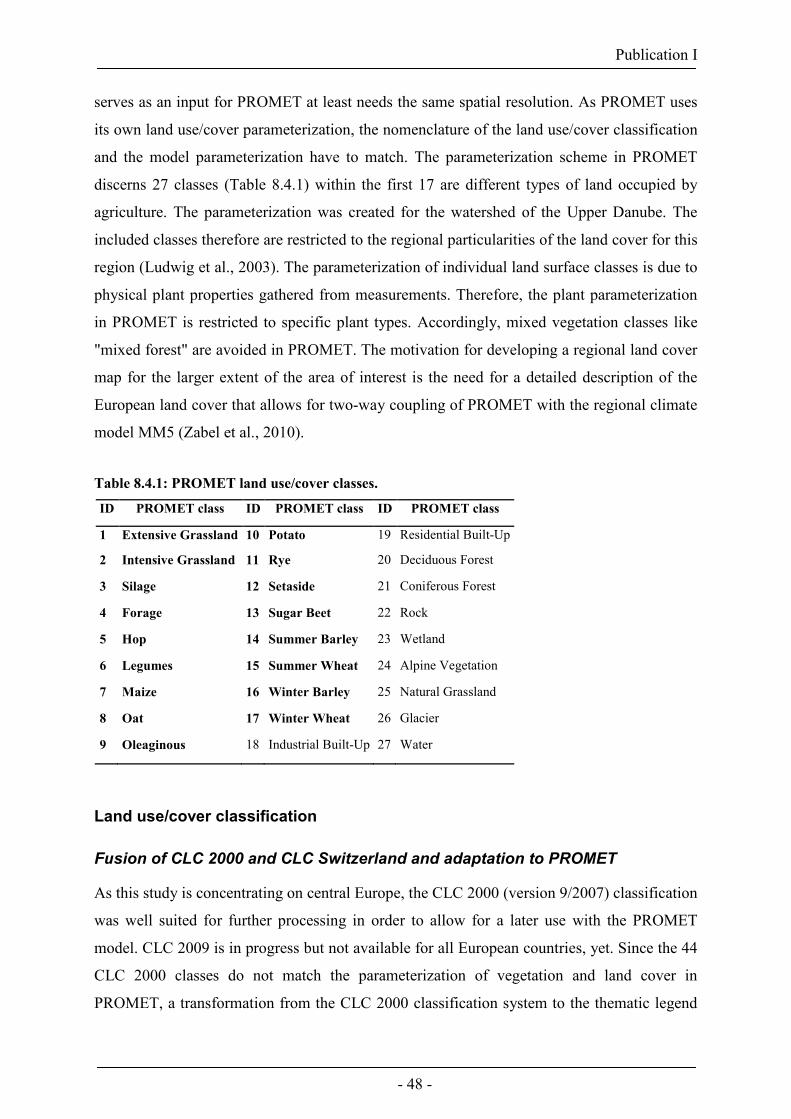
Publication I
- 48 -
serves as an input for PROMET at least needs the same spatial resolution. As PROMET uses
its own land use/cover parameterization, the nomenclature of the land use/cover classification
and the model parameterization have to match. The parameterization scheme in PROMET
discerns 27 classes (Table 8.4.1) within the first 17 are different types of land occupied by
agriculture. The parameterization was created for the watershed of the Upper Danube. The
included classes therefore are restricted to the regional particularities of the land cover for this
region (Ludwig et al., 2003). The parameterization of individual land surface classes is due to
physical plant properties gathered from measurements. Therefore, the plant parameterization
in PROMET is restricted to specific plant types. Accordingly, mixed vegetation classes like
"mixed forest" are avoided in PROMET. The motivation for developing a regional land cover
map for the larger extent of the area of interest is the need for a detailed description of the
European land cover that allows for two-way coupling of PROMET with the regional climate
model MM5 (Zabel et al., 2010).
Table 8.4.1: PROMET land use/cover classes.
ID PROMET class ID PROMET class ID PROMET class
1 Extensive Grassland 10 Potato 19 Residential Built-Up
2 Intensive Grassland 11 Rye 20 Deciduous Forest
3 Silage 12 Setaside 21 Coniferous Forest
4 Forage 13 Sugar Beet 22 Rock
5 Hop 14 Summer Barley 23 Wetland
6 Legumes 15 Summer Wheat 24 Alpine Vegetation
7 Maize 16 Winter Barley 25 Natural Grassland
8 Oat 17 Winter Wheat 26 Glacier
9 Oleaginous 18 Industrial Built-Up 27 Water
Land use/cover classification
Fusion of CLC 2000 and CLC Switzerland and adaptation to PROMET
As this study is concentrating on central Europe, the CLC 2000 (version 9/2007) classification
was well suited for further processing in order to allow for a later use with the PROMET
model. CLC 2009 is in progress but not available for all European countries, yet. Since the 44
CLC 2000 classes do not match the parameterization of vegetation and land cover in
PROMET, a transformation from the CLC 2000 classification system to the thematic legend

Publication I
- 49 -
of PROMET was necessary. This was done following the conversion scheme shown in
Table 8.4.2.
Table 8.4.2: Transformation of CORINE Land Cover 2000 into the PROMET classes.
ID LABEL3 ID LABEL 1.1.1. Continuous urban fabric → 19 Residential Built-Up 1.1.2. Discontinuous urban fabric → 19 Residential Built-Up 1.2.1. Industrial or commercial units → 18 Industrial Built-Up 1.2.2. Road and rail networks and associated land → 18 Industrial Built-Up 1.2.3. Port areas → 18 Industrial Built-Up 1.2.4. Airports → 18 Industrial Built-Up 1.3.1. Mineral extraction sites → 18 Industrial Built-Up 1.3.2. Dump sites → 18 Industrial Built-Up 1.3.3. Construction sites → 18 Industrial Built-Up 1.4.1. Green urban areas → 19 Natural Grassland 1.4.2. Sport and leisure facilities → 19 Natural Grassland 2.1.1. Non-irrigated arable land → Arable Land 2.1.2. Permanently irrigated land → Arable Land 2.1.3. Rice fields → Rice Fields 2.2.1. Vineyards → Vineyards 2.2.2. Fruit trees & berry plantations → Fruits & Berries 2.2.3. Olive groves → Olive Groves 2.3.1. Pasture → Pasture 2.4.1. Annual crops associated with permanent crops → Arable Land 2.4.2. Complex cultivation patterns → Arable Land 2.4.3. Land principally occupied by agriculture, with significant
areas of natural vegetation → Arable Land
2.4.4. Agro-forestry areas → 21 Coniferous Forest 3.1.1. Broad-leaved forest → 20 Deciduous Forest 3.1.2. Coniferous forest → 21 Coniferous Forest 3.1.3. Mixed forest → 20/21 50 % Deciduous Forest, 50 %
Coniferous Forest 3.2.1. Natural grasslands → 25 Natural Grassland 3.2.2. Moors and heathland → 23 Wetland 3.2.3. Sclerophyllous vegetation → 25 Natural Grassland 3.2.4. Transitional woodland-shrub → 20 Deciduous Forest 3.3.1. Beaches, dunes, sands → 22 Rock 3.3.2. Bare rocks → 22 Rock 3.3.3. Sparsely vegetated areas → 25 Natural Grassland 3.3.4. Burnt areas → 25 Natural Grassland 3.3.5. Glaciers and perpetual snow → 26 Glacier 4.1.1. Inland marshes → 23 Wetland 4.1.2. Peat bogs → 23 Wetland 4.2.1. Salt marshes → 23 Wetland 4.2.2. Salines → 23 Wetland 4.2.3. Intertidal flats → 23 Wetland 5.1.1. Water courses → 27 Water 5.1.2. Water bodies → 27 Water 5.2.1. Coastal lagoons → 27 Water 5.2.2. Estuaries → 27 Water 5.2.3. Sea and ocean → 27 Water
Although the CLC 2000 classes 'rice fields', 'vineyards', 'fruit trees & berry plantations', and
'olive groves' are not implemented in the parameterization of PROMET yet (as they are
irrelevant in the Upper Danube catchment), they were not reclassified in order to be able to

Publication I
- 50 -
introduce the crop specific parameterization to PROMET at a later point in time. The
compiled classes 'arable land' and 'pasture', which are both not parameterized in PROMET,
state the basis for a further processing. Since 'mixed forest' does not exist within the land
cover nomenclature of PROMET, it was evenly distributed into the coniferous and deciduous
forest category using a uniform pattern (Figure 8.4.3).
Figure 8.4.3: Reclassification of forested areas labelled as 'mixed forest' (m) to an evenly distribution of deciduous (20) and coniferous (21) forest. The Pixels are alternately classified to coniferous and deciduous.
Since Switzerland is missing within the CLC 2000, the map was completed with the CLC
1990 Switzerland classification having a spatial resolution of 250 m and again using a
different nomenclature of land use/cover classification. Land use/cover change from 1990 to
2000 in Switzerland is supposed to be negligible. The transformation of the Swiss land cover
classification to the PROMET classes is shown in Table 8.4.3.
Table 8.4.3: Transformation of the CORINE Land Cover 1990 Switzerland into the PROMET classes.
ID LABEL1 ID PROMET-LABEL 11 Urban fabric → 19 Residential Built-Up 12 Industrial, commercial and transport units → 18 Industrial Built-Up 13 Mine, dump and construction sites → 18 Industrial Built-Up 14 Artificial non-agricultural vegetated areas → 19 Residential Built-Up 21 Arable land → Arable Land 22 Permanent crops → Arable Land 23 Pasture → Pasture 24 Heterogeneous agricultural areas → Arable Land 31 Forests → 20/21 Deciduous / Coniferous Forest 32 Shrub and/or herbaceous vegetation associations → 25 Natural Grassland 33 Open spaces with little or no vegetation → 25 Natural Grassland 41 Inland wetlands → 23 Wetland 51 Inland waters → 27 Water

Publication I
- 51 -
As Table 8.4.3 demonstrates, CLC 1990 Switzerland has a lack of glaciers and no
differentiation between coniferous and deciduous forest. The glaciers for Switzerland were
added using the GLOBCOVER glacier classification (Bicheron et al. 2008) as a glacier mask
for the new classification approach. Furthermore, the Swiss forest was divided into coniferous
and deciduous forest by using statistical data of the Swiss Federal Statistical Office for each
canton (Table 8.4.4).
Table 8.4.4: Statistical distribution of coniferous and deciduous forest [km²] for each Swiss canton (Swiss Federal Statistical Office, 2004).
Canton Coniferous Forest
Mixed Coniferous
Forest
Mixed Deciduous
Forest
Deciduous Forest
Total Forest
Not classified
Région Lémanique 955 414 278 226 1873 37
Espace Mittelland 1105 856 693 417 3070 80
Nordwestschweiz 108 167 229 149 654
Zürich 165 143 136 46 489
Ostschweiz 1708 494 361 231 2794 65
Zentralschweiz 564 327 208 95 1195 19
Tessin 351 189 139 601 1279 26
First, all Swiss forested area located at elevations above 1200 meters was generally
reclassified to coniferous forest according to the following rule.
If the land cover was 'forest' and the altitude was higher than 1200 m, then the land cover was
reclassified to 'coniferous forest'.
This corresponds to the climatic limit of deciduous forest in Switzerland. The underlying
digital elevation model (DEM) used for this decision consisted of 90 m Shuttle Radar
Topography Mission (SRTM) data. After the entire forest above 1200 m was identified as
coniferous forest, the rest of the forested area was reclassified following the statistical
allocation for each canton (Swiss Federal Statistical Office, 2004) (Table 8.4.4), subtracting
the coniferous forested area above 1200 m that has already been classified. The sections
'mixed coniferous forest' and 'mixed deciduous forest' of the statistics each have a fraction of
50 - 90 % of coniferous or deciduous forest respectively but were regarded as unmitigated
(100 %) coniferous or deciduous forest.
After the modified and reclassified CLC 2000 and CLC 1990 Switzerland were merged to one
map, more adaptations were necessary for a subsequent division of the class 'natural

Publication I
- 52 -
grassland'. In order to meet the regional characteristics of the alpine vegetation, the class
'natural grassland' was further reclassified to 'rock' or 'alpine vegetation' based on three
assumptions:
• If the land cover was 'natural grassland' and the altitude was higher than 2400 m, then
the land cover was reclassified to 'rock'.
• If the land cover was 'natural grassland' and the altitude was between 1400 m and
2400 m, then the land cover was reclassified to 'alpine vegetation'.
• If the land cover was 'natural grassland' and the slope was higher than 30 %, then the
land cover was reclassified to 'rock'.
Subdivision of arable land via MERIS NDVI data
Thus, a land cover map for central Europe was created by merging the CLC 2000 and CLC
Switzerland into one consistent land use/cover map and translating them into the PROMET
nomenclature. Further, it was necessary to divide the class 'arable land' into subclasses in
order to cover the natural heterogeneity of different crop types in central Europe. Figure 8.4.1
demonstrates the different phenological development of maize and winter wheat, using LAI as
example. The context of these measurements can be transferred to the Normalized
Differenced Vegetation Index (NDVI), because of a strong correlation between LAI and
NDVI (Baret and Guyot, 1991; Bach, 1995). In order to classify the distinct phenological
behaviours of different crops according to their photosynthetic activity (maximum LAI/NDVI
in spring or summer), a multiseasonal NDVI dataset gathered from POSTEL (Pôle
d‘Observation des Surfaces continentales par TELédétection) was taken into account
(Bicheron et al., 2008). With a spatial resolution of 300 m, it provides information about the
photosynthetic activity of vegetation in a two monthly temporal resolution. The dataset can be
accessed online free of charge from bimonth 6, 2004 to bimonth 3, 2006 via the POSTEL
portal. This approach uses two NDVI scenes of bimonth 3 (May, June) and bimonth 4 (July,
August) from the year 2005, since the different photosynthetic activities at these points in
time can be used to make assumptions about the type of crop that is growing (Figure 8.4.1).
Preparing the data for a change detection approach, the bimonth 4 imagery was subtracted
from bimonth 3 (Figure 8.4.4). The blue coloured areas in Figure 8.4.4 indicate a phenological
behaviour of crops with a photosynthetic maximum in spring while red coloured areas
indicate a temporal shift of plant activity to summer. Obviously, within the area of interest,

Publication I
- 53 -
significant distinctions in temporal change of NDVI can be made. It is striking that some
regions like the northern part of the Po Valley, are clearly distinguished from others.
Figure 8.4.4: Temporal change of MERIS NDVI, masked for arable land as a subtraction of Bimonth 4 with Bimonth 3.
Using a decision tree as shown in Figure 8.4.5, the change of NDVI, masked with the area of
arable land was classified into three different phenological classes.

Publication I
- 54 -
Figure 8.4.5: Decision tree for the differentiation of three phenological categories (spring, summer, equal) using the change signal of two MERIS NDVI images for Bimonth 3 and Bimonth 4 2005.
The NDVI may return values between 0 and 1 for the dry land surface. Detected changes
falling below 0.1 were treated as being within a range of uncertainty and thus were classified
as 'equally-active'. Changes exceeding 0.1 were classified as 'spring-crops' or 'summer-crops'
respectively.

Publication I
- 55 -
Figure 8.4.6: Phenological subclasses of arable land from CLC after splitting with MERIS NDVI.
As a result it is possible to differentiate between the phenological classes 'spring-crops',
'summer-crops' and vegetation that does not show a change in activity within this time period,
called 'equally active' (Figure 8.4.6). The denotation 'summer-crops' groups all kinds of crop
plants like maize, potato, sugar beet or legumes that show a phenological behaviour with the
highest rate of growth in summer and that significantly exist within the area of interest, while

Publication I
- 56 -
'spring-crops' are e.g. winter wheat, winter barley, rape, oat or rye with highest rates of growth
in spring. Regions dominated by 'summer-crops' can be recognized e.g. in the Rhine Valley
(Figure 8.4.6). The Po Valley shows a separation into 'summer-crops' north and 'spring-crops'
south of the Po. Along the Po River, 'equally-active' land was classified. While central
Germany, Poland as well as the Czech Republic are mostly covered with 'spring-crops',
Hungary, Croatia in the east but also the Netherlands and Belgium in the north-west are
mainly covered by 'summer-crops'. The resulting map subsequently is used for a further
statistical subdivision of these phenological-classes to specific crop types.
Statistical subdivision of phenological classes
This was done with the help of statistical information from the Statistical Office of the
European Communities (EUROSTAT) for each so-called NUTS region (Nomenclature des
unités territoriales statistiques) in the area of interest. The NUTS regions represent
administrative regions within the countries of the European Union. The EUROSTAT dataset
used for this study includes information on the 2006 acreage of different crop types for each
NUTS region. The gathered classes 'spring-crops', 'summer-crops', 'equally-active' and
'pasture' (Figure 8.4.6) are subdivided with the help of the statistical dataset. The classes 'rice',
'vine' and 'olives' are already spatially located within the CLC 2000 dataset and therefore do
not need to be taken into account for the statistical reclassification. A check-up showed that
the sum of area of these classes agrees fairly well with the EUROSTAT statistics for each
NUTS region. All vegetables of the statistics were merged with the class 'fruits & berries'.
Therefore, the class label changed to 'vegetables, fruits & berries'. Among the other classes,
the absolute amount of area associated to each crop type was converted into the percentage of
arable land for each NUTS region. Finally, the regional distribution was based on a decision
scheme as shown in Table 8.4.5. According to the priorities listed in Table 8.4.5, the first
class to be distributed was winter wheat since it is the most widely spread crop type in central
Europe. As winter wheat is a spring active crop type, it was evenly distributed into the class
'spring-crops' for each NUTS region. If the spring crop area derived from MERIS was too
small to contain all the winter wheat area that should be distributed according to the statistics,
the remaining winter wheat areas were further distributed evenly among the class 'equally-
active', according to the 'Fill-up-Order' in Table 8.4.5. Following the priority of Table 8.4.5,
the next crop type to be distributed was maize as it is the second most frequent land use of
arable land within the area of interest.
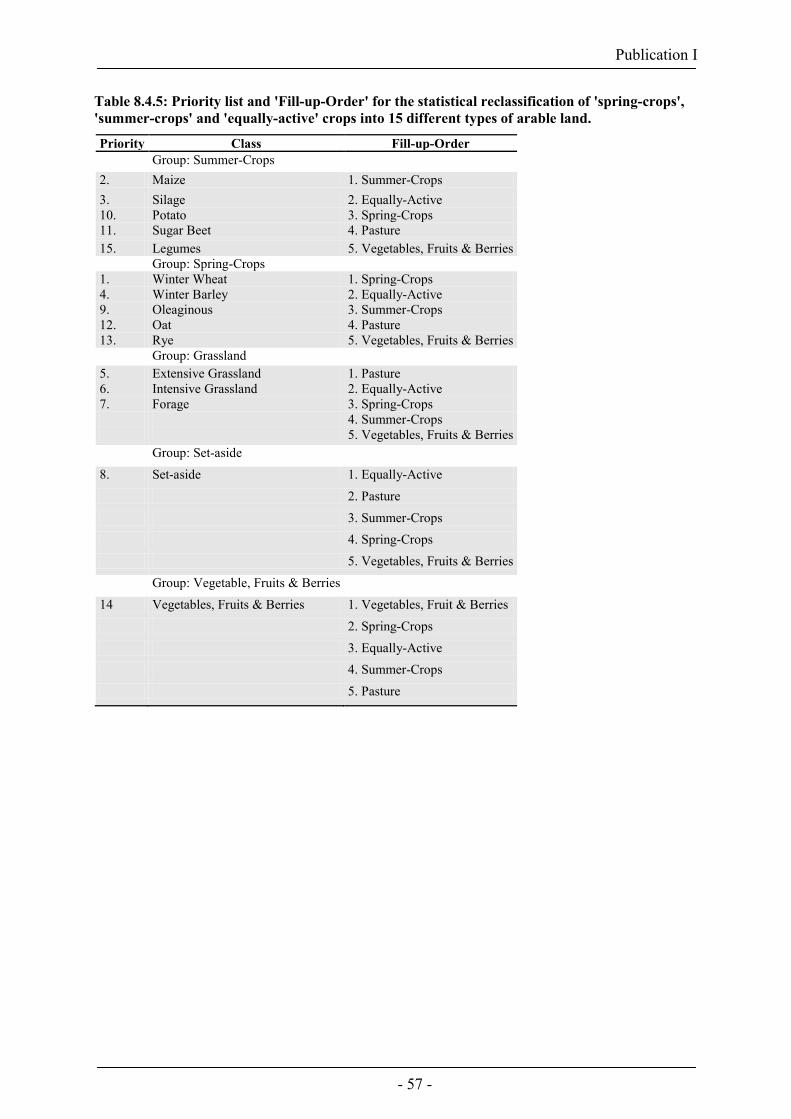
Publication I
- 57 -
Table 8.4.5: Priority list and 'Fill-up-Order' for the statistical reclassification of 'spring-crops', 'summer-crops' and 'equally-active' crops into 15 different types of arable land.
Priority Class Fill-up-Order Group: Summer-Crops 2. Maize 1. Summer-Crops 3. Silage 2. Equally-Active 10. Potato 3. Spring-Crops 11. Sugar Beet 4. Pasture 15. Legumes 5. Vegetables, Fruits & Berries Group: Spring-Crops 1. Winter Wheat 1. Spring-Crops 4. Winter Barley 2. Equally-Active 9. Oleaginous 3. Summer-Crops 12. Oat 4. Pasture 13. Rye 5. Vegetables, Fruits & Berries Group: Grassland 5. Extensive Grassland 1. Pasture 6. Intensive Grassland 2. Equally-Active 7. Forage 3. Spring-Crops 4. Summer-Crops 5. Vegetables, Fruits & Berries Group: Set-aside 8. Set-aside 1. Equally-Active 2. Pasture 3. Summer-Crops 4. Spring-Crops 5. Vegetables, Fruits & Berries Group: Vegetable, Fruits & Berries 14 Vegetables, Fruits & Berries 1. Vegetables, Fruit & Berries 2. Spring-Crops 3. Equally-Active 4. Summer-Crops 5. Pasture

Publication I
- 58 -
Results
Resulting land use/cover map
As a result, the percentage of each individual subclass of arable land matches the statistical
percentage derived from the EUROSTAT statistical data for each NUTS region. However,
due to the purely statistical distribution, there is no guarantee for the correct spatial
positioning of the pixels. Hence, an accuracy matrix as it is often shown to demonstrate the
significance of a land use/cover classification cannot be applied at this point. Nonetheless, the
likelihood for a correct placement of a pixel was increased by using the multitemporal NDVI
dataset.

Publication I
- 59 -
Figure 8.4.7: Resulting land cover map based on CLC 2000 and CLC 1990 Switzerland and being transformed to the PROMET classification, after phenological subclasses of arable land gathered by MERIS NDVI were further statistically reclassified with the help of the EUROSTAT dataset.
Figure 8.4.7 shows the resulting land cover map including 18 subclasses of land occupied by
agriculture at a spatial resolution of 1 km. In order to allow for subscale modelling, the same

Publication I
- 60 -
approach was applied for the generation of a 100 m land cover map using CLC (100 m) as
base data. In this case, the MERIS NDVI images were resampled from 300 m to the final
resolution of 100 m.
The patterns of Figure 8.4.6 still can be recognized in Figure 8.4.7 e.g. in the region of the
Rhine Valley that is dominated by maize according to the statistical reclassification. This can
be taken as an indication for the reliability of the NDVI approach, since the NUTS statistics
match the NDVI in the Rhine Valley well (compare Figures. 8.4.6 and 8.4.7.). In addition, the
segregation within the Po-Valley is reproduced in Figure 8.4.7 in comparison with Figure
8.4.6. Partly, the agricultural areas are fragmented and heterogeneous, due to the applied even
distribution method. Due to a lack of the statistical data for Croatia as well as for Bosnia and
Herzegovina, all 'summer-crops' in that area were reclassified to maize and all 'spring-crops'
to winter wheat, while the class 'equally-active' was labelled as pasture.
Impact on simulated evapotranspiration
As the new land use/cover approach is accounting for the spatial heterogeneity of arable land
and thus is respecting the different phenological behaviour of different crop types, modelled
evapotranspiration is expected to be improved using the new land use/cover approach.
Therefore, the model PROMET (Mauser and Bach, 2009) was applied to the simulation of the
hydrology of the Upper Danube catchment exemplarily, using three different land use/cover
schemes as input data.
The first two land cover schemes both consisted of the reclassified CLC 2000 and CLC
Switzerland neglecting the subdivision of arable land. A plant parameterization of the class
'arable land' is not possible. Only a mixed parameterization of a homogeneous class 'arable
land' could handle the diversity of crops within the class 'arable land'. Nonetheless, this cannot
reasonably represent reality. Therefore, all arable land was consequently reclassified to maize
(CLC maize) respectively winter wheat (CLC winter wheat) since PROMET is well
parameterized for the simulation of these crop types. Maize and winter wheat were assumed
to represent summer (maize) and spring crops (winter wheat) respectively as these classes
state two possible extremes. The third land cover scheme finally consisted of the improved
land cover approach mapped in Figure 8.4.7 (New approach). Investigating the hydrological
impact, the evapotranspiration was modelled with PROMET using a spatial resolution of

Publication I
- 61 -
1 km and a temporal increment of 1 hour for the time period from 1971 – 2000. The model
was driven by spatially interpolated meteorological data from 277 weather stations (Mauser
and Bach, 2009).
Figure 8.4.8: Modelled mean monthly evapotranspiration (1971-2000) in May and August with three different land use/cover classification schemes implemented in PROMET (CLC winter wheat, CLC maize and the new land use/cover approach) for the Upper Danube catchment.
Comparing the modelled monthly mean evapotranspiration of 'CLC winter wheat' and 'CLC
maize' (Figure 8.4.8) for the month of May as well as for August, a distinct behaviour in
evapotranspiration due to the different phenological development of spring- and summer
crops is obvious. While the 'CLC winter wheat' classification in May already shows high
values of monthly evapotranspiration for the winter wheat areas of up to 70 mm, the maize
classification (CLC maize) does not contribute to evapotranspiration yet (Figure 8.4.8). In
August, however, the winter wheat already is harvested and therefore does not transpire
anymore, while the maize transpires between 80 mm and 100 mm per month and therefore is
heavily involved with the catchment evapotranspiration. This clearly demonstrates a huge
impact of the land use on the simulated evapotranspiration. Regional differences of up to
80 mm per month depending on whether the land use is maize or winter wheat may occur.
Only within the new land use approach, it is possible to trace spring and summer active crops

Publication I
- 62 -
in the modelled evapotranspiration. This gives a more realistic picture of the spatial behaviour
of evapotranspiration in May and August. Spatial patterns of simulated evapotranspiration for
the new land use approach in Figure 8.4.8 indicate the different phenological state of spring
and summer crops in May and August respectively. While spring active crops are dominating
the northern part of the catchment area, summer active crops are dominating the eastern part
according to the land cover distribution assumed in Figure 8.4.7. Even more, the influence of
the new land use approach on the evapotranspiration is supposed to be stronger in regions
where a clear majority of spring or summer crops is cultivated, such as the Upper Rhine
Valley, which is clearly dominated by maize. Other studies also found significant differences
in evapotranspiration and energy fluxes corresponding to different crop types using similar
model approaches (Richter and Timmermans, 2009).
Validation of the Water Balance
Figure 8.4.8 clearly indicates a huge impact of the land use/cover on the simulated
evapotranspiration. This affects the simulated water balance in the Upper Danube catchment.
In order to quantify the improvement of the new land use/cover approach, the water balance
was calculated using the three land use/cover classifications 'CLC winter wheat', 'CLC maize'
and the new land use approach. The resulting runoff was compared to the measured runoff
volume at the outlet gauge in Achleiten. Since the Upper Danube catchment is evenly
fractioned in spring and summer crops and therefore, the yearly evapotranspiration sums
between the three land use classifications do not differ largely, the water balance for the
whole year is supposed to be similar. Only during the growing season from May to
September, the new land use approach has an impact on the amount of evapotranspiration and
therefore on the water balance. Runoff formation in the Upper Danube catchment is
predominantly influenced by snow cover dynamics. In order to clearly identify the
improvement caused by the new land cover approach, the month of August was selected for
further analysis since the influence of the snow cover was supposed to be comparably small.

Publication I
- 63 -
Table 8.4.6: Water balance of three PROMET simulations using the CLC winter wheat, the CLC maize and the new land use/cover approach in comparison to the measured gauge in Achleiten as mean values from 1971 - 2000 for the month of August.
Precipitation Evapotranspiration Runoff Measured Gauge (Achleiten)
CLC winter wheat 117 mm 55 mm 62 mm 55 mm
CLC maize 117 mm 74 mm 43 mm 55 mm
New approach 117 mm 64 mm 53 mm 55 mm
The observed monthly mean precipitation in August (1971-2000) was 117 mm. PROMET
returned mean monthly evapotranspiration of 55 mm (CLC winter wheat), 74 mm (CLC
maize) and 64 mm (New approach) respectively. According to the water balance, this leads to
mean monthly runoff values of 62 mm (CLC winter wheat), 43 mm (CLC maize) and 53 mm
(New approach) respectively. Compared to the measured runoff value gathered from the
outlet gauge in Achleiten (55 mm), the new approach significantly improves the model results
(see Table 8.4.6).

Publication I
- 64 -
Conclusions
The changing characteristics of crop phenology in the course of the growing season due to
differences in albedo, crop height, aerodynamic properties and leaf and stomata properties
affect the mass - and energy fluxes on the land surface (Allen et al., 1998). As shown, LAI
measurements clearly indicate a heterogeneous phenological behaviour of different crop
types. In order to describe these effects in a physical model, a land use/cover scheme is
necessary that supplies adequate heterogeneity with high spatial resolution, in combination
with an accurate classification and parameterization of the plants properties. By grouping
various crop types into only one mixed class of 'arable land', most available land use/cover
products cannot take the heterogeneity within the different crops into account. Therefore, we
developed a land cover map that uses the high resolution of the CLC classification but
comprises the heterogeneity of arable land. Thus, phenological classes due to multiseasonal
MERIS NDVI imagery data were compiled in order to distinguish crop types following their
different phenological behaviour. Subsequently, the generated phenological classes were
subdivided following statistical data from EUROSTAT for each NUTS region. The land
use/cover scheme strongly affects the simulated evapotranspiration of a hydrological model.
Therefore, modelling the evapotranspiration for the Upper Danube catchment with the
hydrological model PROMET, the new land use approach was compared to two possible
extremes: In one case, the class arable land was interpreted as pure spring crop (winter
wheat), whereas in a second case the complete arable land area was assumed to represent a
summer crop (maize). With the new heterogeneous land cover approach, the regional
characteristics of arable crops can be addressed with a higher level of detail. Due to those
improvements, the simulated monthly evapotranspiration especially in May and August shows
large differences in comparison with the simulations using the two possible homogeneous
classifications, especially in regions dominated by spring or summer crops respectively. The
different spatial and temporal behaviour of modelled evapotranspiration again affects the
water balance for the Upper Danube catchment in case of the three land use classifications.
The modelled runoff was compared to measured data from the outlet gauge in Achleiten for a
30-year period from 1971 to 2000. The new land use approach could improve the model
results significantly. The importance of land use/cover information is increasing when
investigating the interactions between the land surface and the atmosphere (Tian et al., 2004).
However, feedback effects from the land surface to the atmosphere are not considered in this
study. Vegetation development and land use/cover heterogeneity have a significant influence

Publication I
- 65 -
on climate model simulations such as predictions of surface temperature and precipitation.
Thus, for the application in climate models, both the spatial and temporal distributions of
vegetation are required with a high level of detail (Lu and Shuttleworth, 2002).

Publication I
- 66 -
Acknowledgement
The research described in this paper was carried out at the Department of Geography of the
Ludwig-Maximilians-Universität in Munich, Germany as part of the GLOWA-Danube
project, which was funded by BMBF from 2000 to 2010. The support is gratefully
acknowledged.

Publication I
- 67 -
References
Allen, R., Pereira, L., Raes, D. and Smith, M.: Crop evapotranspiration, FAO Irrigation and Drainage
Paper 56, FAO, Rome, 300 pp., 1998.
Arino, O., Leroy, M., Ranera, F., Gross, D., Bicheron, P., Crockman, C., Defourny, P., Cancutsem, C.,
Achard, F., Durieux, L. and Bourg, L. et al.: Globcover - a global land cover service with
MERIS, in: GlobCover at the Envisat Symposium, Montreux, Switzerland, April 2007, 2007.
Bach, H.: Die Bestimmung hydrologischer und landwirtschaftlicher Oberflächenparameter aus
hyperspektralen Fernerkundungsdaten, Münchener Geographische Abhandlungen, B21,
Birkenhauer, J., Gierloff-Emden, H. G., Mauser, W., Rögner, K., Rust, U., Wieneke, F. and
Wilhelm, F. (Eds.), Munich, Germany, 175 pp., 1995.
Baret, F. and Guyot, G.: Potentials and limits of vegetation indices for LAI and APAR assessment,
Remote Sens. Environ., 35,161–173, 1991.
Bartholomé, E. and Belward A. S.: GLC2000: a new approach to global land cover mapping from
Earth observation data, Int. J. Remote Sensing, 26/9, 1959 – 1977, 2005.
Bicheron, P., Defourny, P., Brockmann, C.,Schouten L., Vancutsem C., Huc M., Bontemps S., Leroy
M., Achard F., Herold M., Ranera F. and Arino O. (2008): GLOBCOVER - Products
Description and Validation Report, POSTEL and Medias-France, Toulouse, France, 47 pp.,
2008.
Bounoua, L., Collatz, J. G., Los, S. O., Sellers, P. J., Dazlich, D.A., Tucker, C. J. and Randall, D. A.:
Sensitivity of Climate to Changes in NDVI, Journal of Climate, 13, 2277 - 2292, 2000.
Bossard, M., Feranec, J. and Otahel, J.: CORINE Land Cover Technical Guide, EEA, Copenhagen,
Technical report No 40, 105 pp., 2000.
Bsaibes, A., Courault, D., Baret, F., Weiss, M., Olioso, A., Jacov, F., Hagolle, O., Marloie, O.,
Bertrand, N., Desfond, V. and Kzemipour, F.: Albedo and LAI estimates from FORMOSAT-2
data for crop monitoring, Remote Sensing of Environment, 113, 716 - 729, 2009.
Cihlar, J.: Land cover mapping of large areas from satellites: status and research priorities, Int. J.
Remote Sensing, 21, 1093 - 1114, 2000.
Defourny, P., Vancutsem, C., Bicheron, P., Brockmann, C., Nino, F., Schouten, L. and Leroy, M.:
GLOBCOVER - A 300m global land cover product for 2005 using ENVISAT MERIS time
series, in: Proceedings of ISPRS Commission VII Mid-Term Symposium, Enschede,
Netherlands, May 2006, 2006.
Defries, R. S. and Belward, A. S.: Global and regional land cover characterization from satellite data:
an introduction to the Special Issue, Int. J. Remote Sensing, 21/6, 1083 - 1092, 2000.

Publication I
- 68 -
Di Gregorio, A. and Jansen, L. J. M.: Land Cover Classification System (LCCS): Classification
concepts and user manual, FAO, Rome, available at:
http://www.fao.org/docrep/003/x0596e/x0596e00.htm, access: 31 Mai 2010, 2000.
EEA (Ed.): The thematic accuracy of Corine land cover 2000, EEA, Copenhagen, Technical report No
7/2006, 90 pp., 2006.
Ge, J., Qi, J., Lofgren, B.M., Moore, N., Torbick, N. and Olson, J. M.: Impacts of land use/cover
classification accuracy on regional climate simulations, J. Geophys. Res., 112, D05107,
doi:10.1029/2006JD007404, 2007.
Herold, M., Mayaux, P., Woodcock, C. E., Baccini, A. and Schmullios, C.: Some challenges in global
land cover mapping: An assessment of agreement and accuracy in existing 1 km datasets,
Remote Sensing of Environment, 112, 2538 - 2556, 2008.
Heymann, Y., Steenmans, Ch., Croissille and G., Bossard, M.: CORINE land cover, Technical guide,
Office for Official Publications of the European Communities, Luxembourg, 137 pp., 1994.
Lambin, E. F. and Geist, H.(Eds.): Land-Use and Land-Cover Change, Local Processes and Global
Impacts, The IGBP Series, Springer, Berlin, 222 pp., 2006.
Lobell, B. D. and Asner, G. P.: Cropland distributions from temporal unmixing of MODIS data,
Remote Sensing of Environment, 93, 412 - 422, 2004.
Lokupitiya, E., Denning, S., Paustian, K., Baker, I., Schaefer, K., Verma, S., Meyers, T., Bernacchi, C.
J., Suyker, A. and Fischer, M.: Incorporation of crop phenology in Simple Biosphere Model
(SiBcrop) to improve land-atmosphere carbon exchanges from croplands, Biogeosciences, 6,
969 - 986, 2009.
Lu, L. and Shuttleworth, W. J.: Incorporating NDVI-Derived LAI into the Climate Version of RAMS
and Its Impact on Regional Climate, American Meteorological Society, 3, 347 - 362, 2002.
Ludwig, R., Probeck, M. and Mauser, W.: Mesoscale water balance modelling in the Upper Danube
watershed using sub-scale land cover information derived from NOAA-AVHRR imagery and
GIS-techniques, Physics and Chemistry on the Earth, 28, 1351 - 1364, 2003.
Masson, V., Champeaux, J-L., Chauvin, F. Meriguet, Ch. and Lacaze, R.: A Global Database of Land
Surface Parameters at 1-km Resolution in Meteorological and Climate Models, Journal of
Climate, 16, 1261 - 1282, 2002.
Mauser, W. and Bach, H.: PROMET – Large scale distributed hydrological modelling to study the
impact of climate change on the water flows of mountain watersheds, Journal of Hydrology,
376, 362 - 377, 2009.
Mauser, W. and Schädlich, S.: Modelling the spatial distribution of evapotranspiration on different
scales using remote sensing data, Journal of Hydrology, 212, 250 - 267, 1998.

Publication I
- 69 -
Monfreda, C., Ramankutty, N. and Foley, J. A.: Farming the planet: 2. Geographic distribution of crop
areas, yields, physiological types, and net primary production in the year 2000, Global
Biochemical Cycles, 22, GB1022, doi:10.1029/2007GB002947, 2008.
Monteith J. L. and Unsworth M. H.: Principles of environmental physics, 3rd Edition, Jeanne Lawson
(Ed.), Elsevier, London, 440 pp., 1990.
Neumann, K., Herold, M., Hartley, A. and Schmullius, C.: Comparative assessment of CORINE2000
and GLC2000: Spatial analysis of land cover data for Europe, International Journal of Applied
Earth Observation and Geoinformation, 9, 425 - 437, 2007.
Probeck, M., Ludwig, R. and Mauser, W.: Fusion of NOAA-AVHRR imagery and geographical
information system techniques to derive subscale land cover information for the upper Danube
watershed, Hydrol. Process., 19, 2407 - 2418, 2005.
Richter, K. and Timmermans, W. J.: Physically based retrieval of crop characteristics for improved
water use estimates, Hydrol. Earth Syst. Sci., 13, 663-674, 2009.
Swiss Federal Statistical Office (Ed.): Waldmischungsgrad der Schweiz, Bundesamt für Statistik,
Sektion Geoinformation, Neuchâtel, 12 pp., 2004.
Tian, Y., Dickinson, R. E., Zhou, L. and Shaikh, M.: Impact of new land boundary conditions from
Moderate Resolution Imaging Spectroradiometer (MODIS) data on the climatology of land
surface variables, Journal of Geophysical Research, 109, D20115, doi:10.1029/2003JD004499,
2004.
Torbick, N., Lusch, D., Qi, J. Moore, N., Olson, J. Ge, J.: Developing land use/land cover
parameterization for climate-land modeling in East Africa, Int. J. Remote Sensing, 27, 4227 -
4244, 2006.
Waser, L. T. and Schwarz, M.: Comparison of large-area land cover products with national forest
inventories and CORINE land cover in the European Alps, International Journal of Applied
Earth Observation and Geoinformation, 8, 196 - 207, 2006.
Zabel, F., Mauser, W., Marke, T., Pfeiffer, A., Zängl, G. and Wastl, C.: Two-way coupling the
hydrological model PROMET with the regional climate model MM5, in: Geophysical Research
Abstracts, 12, EGU General Assembly, Vienna, Austria, 3–8 Mai 2010, EGU2010-3140, 2010.
Transition to Publication II
- 70 -
8.5. Transition to Publication II
Publication II is introducing the bi-directionally coupling approach between the LSHM
PROMET and the RCM MM5 and demonstrates the resulting effects (see Figure 8.1.1).
Thereby, the high resolution land use/cover dataset, compiled in publication I is used as an
essential input for the PROMET model, allowing for distinguishing a broad palette of
vegetation and crops, including a variety of natural and artificial surfaces within the
simulation of the land surface fluxes. A detailed comparison in publication II demonstrates
the huge differences between the NOAH-LSM as the integral LSM of the RCM MM5 and the
LSHM MM5. Throughout the comparison, the impact of the different physical formulations
(see Appendix 12.1), different parameterizations of plants and soil, and the different spatial
scales, on the offline (uncoupled from the atmospheric model) model results are investigated.
After the offline model comparison, the impacts of online (fully coupled with the atmospheric
model) coupling PROMET with MM5 on the atmosphere and the land surface by feedback
effects, are investigated for the model domain of Central Europe. Thereby, the different
spatial behaviour of the resulting evapotranspiration within the online coupled approach is
analyzed more precisely by focusing on different regions within the model domain.
The study of publication II clearly proves that the LSHM PROMET is able to provide the
lower boundary conditions for the atmospheric part of MM5 within the introduced coupling
approach. By allowing for feedbacks between the LSHM and MM5, both land-atmosphere
and atmosphere-land matter and energy fluxes are affected by different spatial and temporal
behaviour.
It is explained that, for hydrological models in general and all downstream models that are
driven offline with RCM output, online coupling overcomes systematic inconsistencies that
appear in the offline coupled approach. For the first time, this study quantifies these
inconsistencies exemplarily for the PROMET model.

Publication II
- 71 -
8.6. Publication II
Zabel, F., Mauser, W., Marke, T., Pfeiffer, A., Zängl, G., and Wastl, C.: Inter-comparison of
two land-surface models applied at different scales and their feedbacks while coupled
with a regional climate model, Hydrol. Earth Syst. Sci., 16, 1017-1031,
Doi:10.5194/hess-16-1017-2012, 2012.

Publication II
- 72 -
Inter-comparison of two land-surface models applied at
different scales and their feedbacks while coupled with a
regional climate model
F. Zabel1, W. Mauser1, T. Marke1,2, A. Pfeiffer3, G. Zängl3,4, C. Wastl3,5
[1] Department of Geography, Ludwig-Maximilians-Universität (LMU), Munich, Germany
[2] Institute of Geography and Regional Sciences, University of Graz, Austria
[3] Institute of Meteorology, Ludwig-Maximilians-Universität (LMU), Germany
[4] Deutscher Wetterdienst (DWD), Offenbach, Germany
[5] Department of Ecoclimatology, Technical University of Munich (TUM), Germany
Correspondence to: F. Zabel ([email protected])
Abstract
Downstream models are often used in order to study regional impacts of climate and climate
change on the land surface. For this purpose, they are usually driven offline (i.e., 1-way) with
results from regional climate models (RCMs). However, the offline approach does not allow
for feedbacks between these models. Thereby, the land surface of the downstream model is
usually completely different to the land surface which is used within the RCM. Thus, this
study aims at investigating the inconsistencies that arise when driving a downstream model
offline instead of interactively coupled with the RCM, due to different feedbacks from the use
of different land surface models (LSM). Therefore, two physically based LSMs which
developed from different disciplinary background are compared in our study: while the
NOAH-LSM was developed for the use within RCMs, PROMET was originally developed to
answer hydrological questions on the local to regional scale. Thereby, the models use
different physical formulations on different spatial scales and different parameterizations of
the same land surface processes that lead to inconsistencies when driving PROMET offline
with RCM output. Processes that contribute to these inconsistencies are, as described in this
study, net radiation due to land use related albedo and emissivity differences, the
redistribution of this net radiation over sensible and latent heat, for example, due to different

Publication II
- 73 -
assumptions about land use impermeability or soil hydraulic reasons caused by different plant
and soil parameterizations. As a result, simulated evapotranspiration, e.g., shows considerable
differences of max. 280 mm yr−1. For a full interactive coupling (i.e., 2-way) between
PROMET and the atmospheric part of the RCM, PROMET returns the land surface energy
fluxes to the RCM and, thus, provides the lower boundary conditions for the RCM
subsequently. Accordingly, the RCM responses to the replacement of the LSM with overall
increased annual mean near surface air temperature (+1 K) and less annual precipitation
(-56 mm) with different spatial and temporal behaviour. Finally, feedbacks can set up positive
and negative effects on simulated evapotranspiration, resulting in a decrease of
evapotranspiration South of the Alps a moderate increase North of the Alps. The
inconsistencies are quantified and account for up to 30 % from July to September when
focused to an area around Milan, Italy.

Publication II
- 74 -
Introduction
A multitude of studies deal with possible regional impacts of global climate change on a
variety of land surface processes. These studies use the results of regional climate models
(RCMs), which describe the processes in the atmosphere and at the land surface, thus,
including atmosphere interactions both for oceans and land. Modelling climate, therefore,
always requires an adequate representation of land surface processes within the climate
model. The changing meteorological drivers are further used as input to downstream models,
which determine the impacts of the simulated climate change on the processes to be
investigated. Downstream models are used to analyze the impacts of climate change on a
broad palette of natural and/or societal developments and vulnerability including the land
surface water cycle, land use and vegetation, agricultural yield and food security, human
health, energy consumption, and many more (IPCC, 2007). Thereby, they usually focus on
specific thematic questions that RCMs can not or only insufficiently address and on specific
regions at high spatial resolution.
Nonetheless, the complexity and heterogeneity of land surface processes and the need for a
more detailed view of the land surface is a long standing discussion in atmospheric sciences
(Dickinson et al., 1991; Henderson-Sellers et al., 2008). There is evidence that more advanced
and robust land surface models (LSMs), which increasingly consider the spatial heterogeneity
(land-use, soil, elevation) and complexity of land surface biophysical and hydrological
processes in the soil-plant-atmosphere continuum on an appropriate scale will reduce the
uncertainties in the current modelling of land-atmosphere processes (Essery et al., 2003;
Hagemann et al., 2001; Molod and Salmun, 2002; Seth et al., 1994; Yu, 2000).
Meanwhile, hydrologists have developed empirical, conceptual and more and more
physically-based land surface hydrological models (LSHMs) spanning a wide range of
complexity. They include detailed descriptions of vertical and lateral soil water and energy
flows, vegetation dynamics and related flow regulations, snow and ice dynamics as well as
energy and mass exchange with the atmosphere, and, thereby, cover the major land surface
processes in the soil-plant-atmosphere continuum. However, in contrast to LSMs designed for
atmosphere applications, the atmosphere is usually considered as an exogenous driver only.
At the same time as RCMs have become capable of physically downscaling the GCMs
outputs to a resolution of 50 - 10 km, LSHMs evolved from their original application in small
watersheds to large basins. With the improving spatial resolution of the RCMs and the

Publication II
- 75 -
increasing areal coverage of the LSHMs, the scales covered by the two model families tend to
converge (Chen et al., 1996; Henderson-Sellers et al., 1995; Yang et al., 1998). The RCMs'
output at high spatial resolution now allows downstream impact models on the local to
regional scale to use the results of RCM simulations offline as model input (Figure 8.6.1a).
By now, the hydrological community uses simulation results from RCMs as input for their
LSHMs (Kotlarski et al., 2005). However, the LSHMs operating at the land surface usually
represent land surface in a totally different manner than the LSMs used within the RCM.
Due to the different scales between impact models and RCMs and because of the huge
numerical load the impacts are usually assessed with, downstream impact models are usually
run offline. This means that they consider the meteorological outputs of the RCMs as
exogenous input only and do not feed back to the atmosphere. However, land-atmosphere
interactions are largely driven by soil moisture and soil temperature, vegetation dynamics and
evapotranspiration as well as snow and ice dynamics (Fischer et al., 2007; Koster et al., 2004;
Koster and Suarez, 1994; Martin, 1998; Orlowsky and Seneviratne, 2010; Pitman, 2003;
Schär et al., 2004; Zeng et al., 2003). A consistent analysis of the regional impacts of climate
change, therefore, would request to have the impact models directly coupled within the RCMs
to be able to explicitly consider the feedbacks.
While coupling a RCM with a physically based hydrological downstream impact model
offline, the model chain results in two LSMs - one within the regional climate and one within
the impact model, both describing the same land surface processes (Figure 8.6.1a). However,
they are not identical which leads to inconsistencies within the offline model chain. They may
have their causes in different scales between the LSMs, different coverage of land surface
categories, different process descriptions and different parameterizations, etc. Although these
inconsistencies are hardly ever quantified, they are only justified when land-atmosphere
interactions are weak.
The following analysis uses a case study to compare two LSMs, one representing a LSM used
within a RCM and a hydrological downstream climate impact model. It further aims at
investigating the inconsistencies which arise due to different feedbacks from using the
hydrological impact model offline and interactively integrated the impact model within the
RCM (Figure 8.6.1b).

Publication II
- 76 -
Methods
Models and setup
In order to describe the discrepancies and inconsistencies between a classical LSM used
within a RCM and a LSHM, we applied the fifth-generation Mesoscale Model (MM5) (Grell
et al., 1994) together with the NOAH-LSM (Chen and Dudhia, 2001a, b) at a spatial
resolution of 45 × 45 km2. Besides, from the hydrological model family, we applied the
LSHM PROMET (Mauser and Bach, 2009) at a spatial resolution of 1 × 1 km2. MM5 was
modified and adapted to our specific simulation requirements and our model domain (Pfeiffer
and Zängl, 2009; Zängl, 2002). The MM5 model domain covers most of the European
continent and has a size of 79 grid-boxes in West-East and 69 grid-boxes in South-North
direction with the lower left corner at (8.2° W, 35.6° N) and the upper right corner at (43.2° E,
61.0° N) (Figure 8.6.2) (Pfeiffer and Zängl, 2009). Lateral boundary conditions are provided
6-hourly by ECMWF ERA-40 reanalysis-data (Uppala et al., 2005). The simulation was
carried out from 1 July 1995 to 31 December 1999, using a spin-up time of 6 months for all
model runs. The initial soil moisture conditions were set to field capacity (pF = 2.3) in
PROMET and were initialized using ERA-40 soil moisture data [Vol-%] in NOAH.
While the NOAH-LSM was originally developed for the use in regional atmosphere
applications, PROMET represents a LSHM, originally designed to study the impact of climate
on hydrology on the local to regional scale. Due to the different demands on each of the
models, they are supposed to differ in multiple aspects. Therefore, concerning this paper, we
first conceptually compare both LSMs in terms of different scales, model physics and
parameterizations. Further, evapotranspiration simulated both with the NOAH-LSM and
coupled offline with PROMET (in the course of this paper named as PROMET-offline) are
compared to each other (Figure 8.6.1a). In this case, both models are using the same
meteorological forcing. The model results of NOAH and PROMET-offline are compared to
each other in order to quantify the differences when being forced with same meteorological
data.

Publication II
- 77 -
MM5atmosphere
NOAH-LSM PROMEToffline
1 km45 km
MM5atmosphere
45 km
PROMETinteract
1 km
45 km
MM5/NOAH
EvapotranspirationEvapotranspiration Evapotranspiration
MM5/PROMET
Meteoro-logical drivers
Land surface energy fluxes
Meteoro-logicaldata
Interactions
b)a)
UpscalingLatent heat
Sensible heatLongwave rad.Shortwave rad.Momentum flux
DownscalingTemperaturePrecipitationDirect sol. rad.Diffuse sol. rad.Longwave rad.HumiditySurface pressureWind speed
SCALMET
Interactions
Figure 8.6.1: a) Principle of driving the hydrological model PROMET offline with data from the RCM MM5 within which the NOAH-LSM provides the lower boundary conditions (left). b) Interactive coupling of PROMET with the atmospheric part of MM5, thus providing the lower boundary conditions via the scaling interface SCALMET (right).
Interactions between the downstream model and the atmospheric part of the RCM are not
possible within the offline coupled approach. Downstream models which are only weakly
affected by feedbacks between the land surface and the atmosphere, e.g., those who study the
effect of climate change on energy demand for heating buildings, may neglect that issue.
However, the hydrosphere of the land surface strongly interacts with the atmosphere.
Therefore, we further interactively (often also called 2-way, bi-directionally or bilaterally)
couple PROMET with the atmospheric part of MM5, thereby replacing the NOAH-LSM in
MM5 with PROMET. Thus, PROMET now provides the lower boundary conditions for the
atmospheric part of MM5 (in the course of this paper named as PROMET-interact) (Figure
8.6.1b). Another possible option by coupling the NOAH-LSM offline with meteorological
data coming from the MM5/PROMET-interact simulation is not addressed in this study, since
it is scientifically irrelevant regarding the downstream model approach.

Publication II
- 78 -
Due to the substitution of the NOAH-LSM with PROMET, interactions between the RCM
and the downstream hydrological impact model can now be taken into account. Consequently,
the atmospheric part of MM5 responses to the replacement of the LSM. Therefore, we
compare the temperature and precipitation output, simulated both with MM5/NOAH and with
MM5/PROMET-interact, respectively. Finally, the impact of the feedbacks on simulated
evapotranspiration is investigated by comparing the offline and the interactively coupled
PROMET results.
A validation and comparison of the model results with measurements is beyond the scope of
this paper, but will be dealt with in further studies.
Coupling approach
The interactions between the land surface and the atmosphere are based on the exchange of
latent and sensible heat, short and longwave radiation as well as momentum (Campbell and
Norman, 2000). Since the NOAH-LSM is an integral part of MM5, it is required within the
RCM to model the land surface processes at the same temporal and spatial resolution as the
atmospheric model components of MM5. PROMET differs from MM5 both in temporal and
spatial resolution.
For the interactive coupling of PROMET with MM5, PROMET substitutes the NOAH-LSM
within the coupling domain of MM5, extending 1170 × 1170 km2 (Figure 8.6.2).
Consequently, the coarse meteorological data provided by MM5 (45 × 45 km2) has to be
downscaled to the higher resolution of the land surface model (1 × 1 km2) for the coupling
domain. Further, the surface fluxes simulated by PROMET at a resolution of 1 km have to be
upscaled to the MM5 model resolution. This is done by applying the scaling tool SCALMET
(Scaling Meteorological variables) (Marke, 2008; Marke et al., 2011). The statistical
downscaling can either be used with regression based approaches (Daly et al., 2002) or
empirical gradients (Liston and Elder, 2006), using elevation-dependencies in order to scale
the meteorological data to the fine resolution grid. The adjustable simulation time step within
PROMET, which also constitutes the exchange time step between PROMET and MM5, is set
to 9 minutes in the current study. This allows PROMET to run synchronously with MM5,
which uses an internal time-step of 135 seconds.
In addition to the offline downscaling approach, a 2-way (i.e., bi-directional) and, therefore,
interactive coupling mode was implemented in SCALMET allowing for a linear upscaling of

Publication II
- 79 -
the scalar surface fluxes (see Figure 8.6.2). In order to close the energy balance within the
interactive coupled land-atmosphere system, the downscaling as well as the upscaling
approach strictly conserves mass and energy within the scaling processes in SCALMET for
each variable. Hence, no bias correction is carried out in the framework of the model runs
presented in this study. Therefore, any bias of the RCM is inevitably inherited by the LSM
and vice versa.

Publication II
- 80 -
Study area
The study area according to the coupling domain is situated in Central Europe and extends
1170 km North-South by 1170 km East-West including 18 European countries with the lower
left corner at 3.9° E, 42.9° N and the upper right corner at 20.0° E, 53.3° N. Plains like the Po
and Upper Rhine Valley, uplands like in central Germany and mountainous regions in the
Alps, which mark a climatic boundary between the temperate latitudes and the Mediterranean
climate, compose a complex landscape. Altitudes are ranging from the Mont Blanc in the
French Alps (4810 m) to the North Sea in the North-West and the Mediterranean Sea in the
South. The area is characterized by intense agriculture especially within the fertile lowlands
like the Upper Rhine or the Po Valley and densely populated areas such as the Ruhr region,
Berlin, or Milan.

Publication II
- 81 -
Comparison of modelling approaches
Since both applied models developed from different disciplinary background, the concepts
behind the models vary in many aspects. While the goal of the development of the LSM was
to implement an appropriate LSM for weather prediction and climate simulations, PROMET
was developed for hydrological river catchment studies on the local and regional scale. A
complete description of the NOAH-LSM is given by Chen and Dudhia (2001a, b) and
Mitchell (2005). A comprehensive model description of PROMET can be found in Mauser
and Bach (2009).
Nevertheless, both models describe the pathways of water and energy at the land surface in a
physically based manner, thus conserving mass and energy and closing the energy balance at
the land surface without a calibration. They are describing the same land surface processes on
different scales, thereby using different formulations and parameterizations. Thus, the model
results basically must be comparable and the differences between the model results must be
traceable to the conceptual differences.
Scales
One major difference is the differently applied spatial resolution. Within the GLOWA-
Danube project, in which this study took place, MM5 and, thus, the NOAH-LSM was applied
in climate mode with a single domain having a horizontal spatial resolution of 45 km and an
integration internal time step of 135 seconds. The coarse spatial resolution was set in order to
be able to simulate long time series for regional climate scenarios until the year 2100 with the
available computational resources.
PROMET was applied at 1 km spatial resolution since it has been extensively validated in
different regions in the world at 1 km spatial resolution (Mauser and Bach, 2009).
Due to the different spatial resolution, the models' underlying land-use (Figure 8.6.2), the
digital elevation model (DEM) as well as the soil textures vary in spatial heterogeneity.
Land use
The land cover information has a strong effect on albedo, emissivity and partitioning of
energy and matter fluxes from the surface to the atmosphere (Ge et al., 2007). Land cover
determines the type of vegetation and, thereby the seasonal development of plant phenology,

Publication II
- 82 -
canopy structure and leaf area, which in turn, through vegetation height and leaf area index,
determines the aerodynamic and evapotranspirative properties of the land surface. The
combined vegetation and soil properties determine soil moisture development and the reaction
of the land surface to changing fractions of latent and sensible heat fluxes influenced by
vegetation water stress. Figure 8.6.2 shows the land use classifications used by NOAH and by
PROMET, respectively.
Figure 8.6.2: Land use classification of the NOAH-LSM (45 × 45 km2) for the whole MM5 model domain and the inner coupling domain (left). PROMET land use classification (1 × 1 km2) for the coupling domain with MM5.
Impervious surfaces such as scattered urban areas are not classified in the NOAH
classification, since they are small scaled and, thus, not mapped at the coarse resolution in
NOAH. While most of the land is homogeneously treated as one class of mixed arable land in
NOAH, PROMET separates arable land into 17 individual crop types using different crop
specific parameterizations. A detailed description of the land use/cover map used in PROMET
is given in Zabel et al. (2010).
For example, while for Berlin, the Ruhr Region or Milan, NOAH classifies one class
representing a mixture of dryland, cropland and pasture, the 45 × 45 respective upscaled
PROMET pixels for each of the same area show a high share of urbanization - e.g.,
Berlin: 43 %, Ruhr region 55 %, Milan 37 % (Figure 8.6.2).

Publication II
- 83 -
Plant parameterization
The parameterization for each of the vegetation types in PROMET is taken from literature and
remote sensing data (Bach, 1995; Mauser and Bach, 2009). Typical daily change of the
dynamic plant parameters (LAI, albedo, root depth and plant height) were taken from the
analysis of time series of LANDSAT images in Southern Germany in combination with
extensive field measurements on typical plant stands (Mauser and Bach, 2009), thereby taking
into account phenological behaviour of different stands and spatial heterogeneity (Zabel et al.,
2010).
On the other hand, MM5 uses monthly values of green vegetation fraction (also known as
Fcover) for each grid cell at the model's spatial resolution in order to allow for seasonal
phenological behaviour of vegetation. The green vegetation fraction is derived from remote-
sensing NDVI data and accordingly is also used within the NOAH-LSM to control the degree
of urbanization and impervious surfaces for each grid cell. Due to known problems in NDVI
scaling (Bach and Verhoef, 2003; Gutman and Ignatov, 1997; Richter and Timmermans,
2009), vegetation fraction was generally decreased by 30 percent which helped to improve the
simulation of summertime near surface temperature substantially (Pfeiffer and Zängl, 2009).
Soil water hydraulic and plant physiology
Besides different underlying soil textures, the models use different physical approaches to
describe the pathway of water through the soil and the plant into the atmosphere. Here,
PROMET uses a more comprehensive approach, following Baldocchi et al. (1987) and Jarvis
(1976), taking more soil and plant specific parameters into account. NOAH uses soil specific
water contents [Vol-%] to parameterize wilting point, saturation and field capacity for
calculating plant transpiration, while PROMET calculates soil water content from soil water
potential and takes plant specific functions of leaf water potential into account, including a
functional dependence between stomatal conductance and plant suction when calculating
plant transpiration.

Publication II
- 84 -
Results and discussion
Comparing NOAH and PROMET-offline
The offline coupled model approach results in two LSMs, namely the NOAH-LSM and
PROMET. The differences between the two models result in different portioning of latent and
sensible heat, while incoming solar radiation, temperature and precipitation are the same for
both models in offline configuration (see Figure 8.6.1a). As a result, net radiation shows a
high temporal correlation between PROMET and NOAH, except for Alpine areas
(Figure 8.6.3). Here, large differences in snow cover affect shortwave reflection and, thus, net
radiation. Nevertheless, the PROMET net radiation in the remaining domain is higher than the
NOAH net radiation (Figure 8.6.3), due to different land surface properties in terms of
emissivity and albedo. Overall, more energy is available at the PROMET land surface
(Figure 8.6.3).
Figure 8.6.3: Correlation (r) of net radiation between PROMET-offline and NOAH for daily mean values (left) and difference plot of annual mean net radiation between PROMET-offline and the NOAH-LSM, scaled to the MM5 spatial resolution (right).
While albedo is handled as a prognostic variable in both LSMs, snow cover is less dominant
in the Alpine regions in the NOAH simulation due to the use of different snow modules and
lower altitudes in mountainous regions caused by scale issues. Due to the higher spatial
resolution in PROMET, spatial heterogeneity - especially in mountainous regions can be
captured more realistically. Thus, not only snow processes, but also radiation processes can be

Publication II
- 85 -
calculated with higher spatial and process detail considering, e.g., aspect, slope and altitude
more accurately.
Consequently, shortwave reflection increased mainly in the Alpine part of the model domain
(Figure 8.6.4), reducing net radiation in winter and spring in the PROMET simulation, while
net radiation is increased in the summer months, when the snowpack has melted in
mountainous regions.
Figure 8.6.4: Annual mean shortwave reflection [W m-2] (1 January 1996 - 31 December 1999) of the NOAH-LSM (left) and PROMET-offline (right).
The higher net radiation in the PROMET simulation in the non-alpine areas mainly is due to
differently assumed emissivities of the land surfaces, resulting in overall lower emissivity
and, therefore, lower longwave outgoing radiation in the PROMET simulation (Figure 8.6.5,
left).

Publication II
- 86 -
Figure 8.6.5: Difference plot of annual mean longwave outgoing radiation between PROMET-offline and the NOAH-LSM (left) and difference plot of annual mean Bowen ratio between PROMET-offline and the NOAH-LSM (right), each scaled to the MM5 spatial resolution.
Further, the different portioning of the available energy at the land surface into latent and
sensible heat is shown in Figure 8.6.5 (right) by subtracting the annual mean Bowen ratio.
Finally, more available energy at the land surface is proportionally given more into sensible
than into latent heat in the PROMET simulation, where finally the Bowen ratio remarkably
increased in areas with high share of urbanization (Figure 8.6.5). The degree of urbanization
shows a correlation of r = 0.71 with the difference plot of the Bowen ratio.
Figure 8.6.6 compares the annual mean evapotranspiration from 1996-1999 simulated by the
NOAH-LSM (left) and by the offline PROMET approach (right). Regarding the hydrological
context of this paper, latent heat is shown as evapotranspiration in [mm].
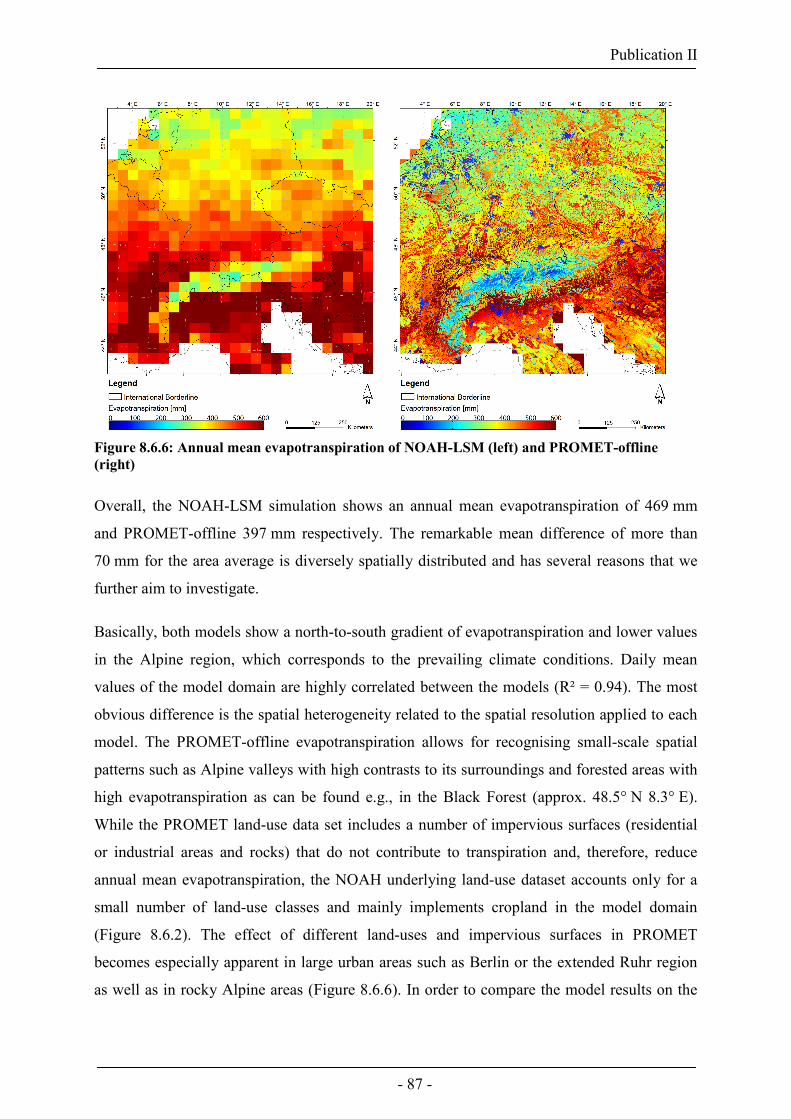
Publication II
- 87 -
Figure 8.6.6: Annual mean evapotranspiration of NOAH-LSM (left) and PROMET-offline (right)
Overall, the NOAH-LSM simulation shows an annual mean evapotranspiration of 469 mm
and PROMET-offline 397 mm respectively. The remarkable mean difference of more than
70 mm for the area average is diversely spatially distributed and has several reasons that we
further aim to investigate.
Basically, both models show a north-to-south gradient of evapotranspiration and lower values
in the Alpine region, which corresponds to the prevailing climate conditions. Daily mean
values of the model domain are highly correlated between the models (R² = 0.94). The most
obvious difference is the spatial heterogeneity related to the spatial resolution applied to each
model. The PROMET-offline evapotranspiration allows for recognising small-scale spatial
patterns such as Alpine valleys with high contrasts to its surroundings and forested areas with
high evapotranspiration as can be found e.g., in the Black Forest (approx. 48.5° N 8.3° E).
While the PROMET land-use data set includes a number of impervious surfaces (residential
or industrial areas and rocks) that do not contribute to transpiration and, therefore, reduce
annual mean evapotranspiration, the NOAH underlying land-use dataset accounts only for a
small number of land-use classes and mainly implements cropland in the model domain
(Figure 8.6.2). The effect of different land-uses and impervious surfaces in PROMET
becomes especially apparent in large urban areas such as Berlin or the extended Ruhr region
as well as in rocky Alpine areas (Figure 8.6.6). In order to compare the model results on the

Publication II
- 88 -
same spatial scale, we aggregated the PROMET-offline result to the spatial resolution of
45 × 45 km2 and finally subtracted it from the NOAH evapotranspiration (Figure 8.6.7).
Figure 8.6.7: Difference plot between PROMET-offline and NOAH-LSM showing the annual mean evapotranspiration.
The highest difference of evapotranspiration can be found at the Milan pixel. Here,
evapotranspiration is reduced by 283 mm from 707 mm (NOAH) to 424 mm (PROMET-
offline).
Further, Figure 8.6.8 compares the models' evapotranspiration by assuming a similar land use
in both models. For this purpose, impermeable areas are ignored when upscaling the
1 × 1 km2 PROMET evapotranspiration to the MM5 spatial resolution. Figure 8.6.8 shows the
monthly mean values only for pixels with a share of impermeable area of at least 20 % in the
upscaled PROMET land use classification. Thereby, different assumptions in the LSMs'
underlying land use classification in terms of impervious surfaces result in great differences in
summer (up to 21 mm month-1 in July) and small differences in winter (1 mm month-1 in
January). By neglecting impervious surfaces, the prominent annual gap of 130 mm year-1 is
reduced to 46 mm year-1 and the difference in July is reduced to 6 mm month-1 (Figure 8.6.8).

Publication II
- 89 -
0
10
20
30
40
50
60
70
80
1 2 3 4 5 6 7 8 9 10 11 12
month
evap
otra
nspi
ratio
n [m
m]
NOAH-LSM PROMET-offline PROMET-offline w/o impervious surfaces
Figure 8.6.8: Monthly mean evapotranspiration from 1996 - 1999 simulated by the NOAH-LSM and PROMET-offline for pixels, dominated by impermeable area (share > 20 %) in the upscaled PROMET land use. The PROMET-offline results are shown for all corresponding PROMET-offline pixels as well as for vegetated pixels only, neglecting impervious surfaces.
For a spatially differentiated consideration of the impact of impermeable areas for the
coupling domain, Figure 8.6.9 shows the difference of simulated evapotranspiration between
PROMET-offline and NOAH versus the upscaled share of impermeable land in the PROMET
land use classification, illustrated with a bivariante colour map (Teuling et al., 2011).
Figure 8.6.9: Upscaled share of impervious area of the PROMET land use versus the difference of evapotranspiration between PROMET-offline and NOAH, illustrated with a bivariante colour map (Teuling et al., 2011).

Publication II
- 90 -
Another important aspect contributing to inconsistencies are due to different soil hydraulics,
affecting soil moisture and, therefore, soil evaporation and plants transpiration. The functional
dependence between soil moisture of the third soil layer and evapotranspiration for the Milan
and Rhine-Neckar vegetated pixels for daily values in July and August is shown in Figure
8.6.10 for each model. Scaled between saturation and wilting point, PROMET operates in a
drier part of the sensitivity curve, thereby more restricting evapotranspiration than the NOAH-
LSM (Figure 8.6.10). PROMET reacts more sensitive to increasing soil suction and
decreasing soil moisture, respectively. While the wilting point is never reached in the Rhine-
Neckar area, it is already reached on several days in the PROMET-offline simulation from
July to August in the Milan area (Figure 8.6.10, left). The soil layer thickness of the third soil
layer is 1 m in both models, reaching from 1 to 2 m in the NOAH-LSM and from 0.5 to 1.5 m
in PROMET, respectively.
0
0,2
0,4
0,6
0,8
1
0 0,2 0,4 0,6 0,8 1
scaled soil moisture
scal
ed e
vapo
tran
spira
tion
NOAH PROMET-off line
0
0,2
0,4
0,6
0,8
1
0 0,2 0,4 0,6 0,8 1
scaled soil moisture
scal
ed e
vapo
tran
spira
tion
NOAH PROMET-off line
Figure 8.6.10: Daily mean evapotranspiration (normalized by maximum) plotted against soil moisture of the third soil layer (scaled between wilting point and saturation) for the NOAH-LSM and PROMET-offline, showing the vegetated pixels of the Milan area (left) and the Rhine-Neckar area (right) for July and August (1996-1999).
Quantification of feedbacks using PROMET-interact
The simulated latent and sensible heat between the NOAH-LSM and PROMET-offline, as
showed differ both in spatial and temporal manner. When using PROMET instead of NOAH
within MM5, the response of the atmosphere to the changed land surface fluxes now result in
feedbacks that in turn affect the land surface energy fluxes. Thus, the inconsistencies within
the offline coupling approach due to neglecting those feedbacks are quantified. Therefore,
PROMET is now interactively coupled with MM5, thereby substituting the NOAH-LSM and

Publication II
- 91 -
finally providing the lower boundary conditions for the MM5 atmosphere (Figure 8.6.1b).
Energy conservation is guaranteed within the interactively coupled system. The feedbacks can
amplify or dump an initial perturbation to the system. As a result, a new equilibrium between
the land surface and the atmosphere establishes and, therefore, changes the energy fluxes in
both directions. This chapter first describes the responses of the MM5 atmosphere triggered
by the replacement of the LSM. Finally, the impact of feedbacks on the interactively coupled
PROMET (PROMET-interact) evapotranspiration is investigated and compared against the
PROMET-offline simulation.
Air temperature
Figure 8.6.11 compares the annual mean near surface air temperature between the MM5
simulation either using the NOAH-LSM or PROMET-interact. While the mean temperature
over the coupling domain is 9.4° C in the MM5/PROMET-interact simulation, it is 8.5° C in
the MM5/NOAH simulation. Despite the replacement of the NOAH-LSM, still a similar
temperature can be reproduced within the MM5/PROMET-interact simulation with regional
differences.
A higher net radiation in the MM5/PROMET-interact simulation than in the MM5/NOAH
simulation as well as less evapotranspiration and, thus, less evaporative cooling result in
mutually dependent higher near surface air temperature in the MM5/PROMET-interact
simulation, except for mountainous regions. Here, snow cover plays a prominent role in the
PROMET simulation, affecting sensible heat particularly in spring, when available energy is
put into snow melt in the PROMET simulation, while energy is put into sensible heat
resulting in increasing near surface air temperature in the NOAH simulation. Possible reasons
for the different snow cover may be the use of different snow modules and scale issues due to
different underlying DEMs.
The MM5 atmospheric model responses to the replacement of the NOAH-LSM with
PROMET with higher temperatures by up to 2.4 K (in the Ruhr region) as shown in
Figure 8.6.11.

Publication II
- 92 -
Figure 8.6.11: Subtraction image (MM5/PROMET-interact - MM5/NOAH) of the annual mean near surface air temperature [K] (1 January 1996 - 31 December 1999).
While the annual mean near surface air temperature for the PROMET Milan pixels is 1.6 K
warmer (14.2° C) than the MM5/NOAH simulation (12.6° C), maximum differences (3.3 K)
appear in June, while in winter, when energy assumption at the land surface is low,
temperature is hardly affected by feedbacks.
Precipitation
Besides temperature, precipitation is another parameter strongly interacting with the land
surface and having large hydrological impacts on LSHMs. The changed lower boundary
conditions in the PROMET-interact simulation result in less annual precipitation amounts,
especially South of the Alps (Figure 8.6.12). While the annual precipitation amount over the
simulation area is 830 mm in the MM5/PROMET-interact simulation, it is 886 mm in the
MM5/NOAH simulation. The spatial patterns of annual precipitation amounts between
MM5/NOAH and MM5/PROMET-interact simulations are almost the same. However, total
precipitation amounts decrease mostly North and South of the Alps and in the Po-Valley by
up to 213 mm (Figure 8.6.12).

Publication II
- 93 -
Figure 8.6.12: Subtraction image (MM5/PROMET-interact - MM5/NOAH) of the annual precipitation [mm] (1 January 1996 - 31 December 1999).
Maximum differences compared to the MM5/NOAH simulation occur mainly in August,
when almost 50 mm less precipitation is simulated for the Milan area by using the PROMET-
interact land surface within MM5. Concerning the Milan pixels, the annual precipitation
differs by 164 mm which is about 15 %. The decrease of total precipitation is difficult to
diagnose. It is mainly based on a decrease of convective precipitation in summer. The
different portioning of energy into sensible and latent heat overall results in an increase of
sensible heat in the PROMET simulation, except for mountainous areas in winter and spring
due to snow cover. With increasing sensible heat flux, the planetary boundary layer height is
increasing which results in dryer air masses. As a result, cloud fraction and convection are
inhibited and, thus, convective precipitation is decreasing especially in summer.
Evapotranspiration
By allowing for feedbacks between the high resolution PROMET land surface and the MM5
atmosphere, the land surface in turn is affected by the changed atmospheric conditions. The
impact of these feedback effects on evapotranspiration is shown in Figure 8.6.13, thereby
quantifying the inconsistencies between the offline and interactive coupling approach.
Overall, the annual PROMET-interact evapotranspiration (405 mm) is a little higher than in
the annual PROMET-offline simulation (397 mm).

Publication II
- 94 -
However, a more detailed spatial analysis shows remarkably smaller annual
evapotranspiration rates in the Mediterranean area South of the Alps while annual
evapotranspiration rates slightly increased North of the Alps (Figure 8.6.13). The highest
impact of the feedbacks on evapotranspiration can be found in the Northern part of Italy,
where evapotranspiration rates decreased by up to 150 mm due to dryer conditions.
Figure 8.6.13: Subtraction image of PROMET-interact and PROMET-offline simulation for annual mean evapotranspiration (1 × 1 km2).
For the Milan pixels, the annual distinction is approx. 55 mm which is 13 % of the annual
evapotranspiration. The inconsistencies of the offline coupling approach are most relevant in
the summer months, when PROMET-interact shows decreased evapotranspiration rates, e.g.,
in July of up to 20 mm (27 %), while in the winter months evapotranspiration is hardly
affected by the feedback mechanisms (Figure 8.6.14). When focusing on the Milan region,
evapotranspiration decreased by 30 % from July to September while at the same time
temperature increased by 2.7 K and precipitation decreased by 37 %.
North of the Alps as exemplarily shown for the Rhine Neckar area, annual evapotranspiration
slightly increased by 4 mm year-1 (1.9 %). Thereby, the moderate increase mainly occurred
from Mai to August and accounted for 3.2 % (2 mm) (Figure 8.6.14).

Publication II
- 95 -
0
20
40
60
80
100
1 2 3 4 5 6 7 8 9 10 11 12month
evap
otra
nspi
ratio
n [m
m]
PROMET-offline Milan PROMET-offline Rhine-NeckarPROMET-interact Milan PROMET-interact Rhine-Neckar
Figure 8.6.14: Monthly evapotranspiration rates [mm] (1 January 1996 - 31 December 1999) of PROMET-offline simulation and PROMET-interact simulation exemplarily for the Milan and Rhine-Neckar pixels.
According to Figure 8.6.10, Figure 8.6.15 now shows the degree to which the soil moisture-
evapotranspiration interaction is responsible for the sign of the feedback. For the Milan area
PROMET-interact now operates in a yet drier regime. While plants' water suction already
reached the wilting point in PROMET-offline simulations on several days (Figure 8.6.10),
feedback effects in the PROMET-interact simulations now result in an even drier soil where
soil moisture is closer to the wilting point from July to August (Figure 8.6.15). This results in
a higher level of plants' water-stress, restricting transpiration more. North of the Alps,
exemplarily shown for the Rhine-Neckar area, where precipitation is also reduced upon
implementing PROMET into MM5, PROMET-interact also operates in a yet drier regime,
however, far away from reaching the wilting point (Figure 8.6.15). Thus, still enough soil
water is available for plant transpiration and evaporation. Therefore, the feedbacks -
especially the increased air temperature and radiation have predominantly positive effects on
transpiration here.

Publication II
- 96 -
0
0,2
0,4
0,6
0,8
1
0 0,2 0,4 0,6 0,8 1
scaled soil moisture
scal
ed e
vapo
tran
spira
tion
NOAH PROMET-off line PROMET-interact
0
0,2
0,4
0,6
0,8
1
0 0,2 0,4 0,6 0,8 1
scaled soil moisture
scal
ed e
vapo
tran
spira
tion
NOAH PROMET-off line PROMET-interact
Figure 8.6.15: Daily mean evapotranspiration (normalized by maximum) plotted against soil moisture of the third soil layer (scaled between wilting point and saturation) showing the PROMET-interact simulation in comparison to the PROMET-offline and NOAH results for the vegetated pixels of the Milan area (left) and the Rhine-Neckar area (right) for July and August (1996-1999).

Publication II
- 97 -
Conclusions
Offline driving a LSM with RCM output can lead to inconsistencies since feedbacks between
the offline driven LSM and the RCM are not taken into account. The study has shown that
considerable discrepancies occur between LSMs used within RCMs and downstream climate
impact models. The different scales, parameterizations and formulations describing identical
land surface processes in the NOAH-LSM, used within the RCM MM5, and the downstream
hydrological model PROMET contribute to the inconsistencies. Consequently, net radiation
was higher in the PROMET-offline simulation due to different albedo and emissivity settings.
The different redistribution of this net radiation into sensible and latent heat resulted in an
overall higher Bowen ratio due to e.g., more impermeable areas (such as urban areas) in the
PROMET land use while the NOAH-LSM assumes the land surface to rather homogeneously
consist of arable land for the coupling domain. Finally, different soil hydraulics due to
different soil/plant parameterizations and different physical formulations lead to considerable
hydrological differences which resulted in lower soil moisture and lower evapotranspiration.
By coupling PROMET interactively with the RCM MM5, thereby substituting the NOAH-
LSM, PROMET provides the lower boundary conditions to the atmospheric part of MM5.
Subsequently, the scaling interface SCALMET closes the scale gap between the models and
ensures mass- and energy conservation within the down- and the upscaling of linear and
nonlinear energy fluxes. Consequently, the atmosphere responded to the replacement of the
LSM with increased annual air temperatures by up to 2 K and decreased annual precipitation
by up to 213 mm mainly due to less convection in summer.
Finally, by comparing the offline driven and the interactive simulation, we were able to
quantify the inconsistencies that occur when neglecting the feedbacks. The study has shown
that the inconsistencies that arise when using PROMET offline instead of interactively
coupled with MM5 are strong (up to 150 mm year-1) and, therefore, may not be neglected.
Further, we demonstrated that these inconsistencies can affect evapotranspiration positively as
well as negatively, depending on the prevailing hydrological conditions. The temperature
increase and precipitation decrease led to drier conditions in the interactively coupled
simulation. As a result, evapotranspiration decreased in regions mainly South of the Alps with
already dry conditions in summer, where soil moisture was close to the wilting point.
Thereby, evapotranspiration decreased by 30 % from June to September, e.g., for the Milan
area. North of the Alps, however, the level of soil moisture was far away from reaching the
wilting point due to more humid conditions than in the Mediterranean area. The feedbacks

Publication II
- 98 -
affected evapotranspiration positively here, due to increased temperature and more radiation.
Although precipitation decreased, still enough soil water was available for plant transpiration
and evaporation. The impact of the feedbacks on evapotranspiration was almost negligible in
winter but considerably high in the summer months, when energy conversion at the land
surface is high, finally resulting in greater feedbacks.
Further studies will compare the offline and interactive coupling approach with observation
data for annual, monthly, and diurnal time series.

Publication II
- 99 -
Acknowledgements
The research described in this paper was carried out at the Department of Geography of the
Ludwig-Maximilians-Universität in Munich, Germany as part of the GLOWA-Danube
project, which was funded by BMBF (Federal Ministry of Education and Research) from
2000 to 2010. The support is gratefully acknowledged. The authors want to thank the Editor
Bart van den Hurk and the anonymous reviewers for their valuable remarks which
considerably improved the paper.

Publication II
- 100 -
References
Bach, H., and Verhoef, W.: Sensitivity studies on the effect of surface soil moisture on canopy
reflectance using the radiative transfer model GeoSAIL, Igarss 2003: Ieee International
Geoscience and Remote Sensing Symposium, Vols I - Vii, Proceedings, 1679-1681, 2003.
Baldocchi, D. D., Hicks, B. B., and Camara, P.: A canopy stomatal resistance model for gaseous
deposition to vegetated surfaces, Atmospheric Environment (1967), 21, 91-101, Doi:
10.1016/0004-6981(87)90274-5, 1987.
Campbell, G. S., and Norman, J. M.: An Introduction To Environmental Biophysics, Secend Edition
ed., Springer, New York, 2000.
Chen, F., Mitchell, K., Schaake, J., Xue, Y., Pan, H.-L., Koren, V., Duan, Q. Y., Ek, M., and Betts, A.:
Modeling of land surface evaporation by four schemes and comparison with FIFE observations,
Journal of Geophysical Research, 101(D3), 7251–7268, 10.1029/95JD02165, 1996.
Chen, F., and Dudhia, J.: Coupling an Advanced Land Surface–Hydrology Model with the Penn
State–NCAR MM5 Modeling System. Part I: Model Implementation and Sensitivity, Monthly
Weather Review, 129, 569-585, 2001a.
Chen, F., and Dudhia, J.: Coupling an Advanced Land Surface–Hydrology Model with the Penn
State–NCAR MM5 Modeling System. Part II: Preliminary Model Validation, Monthly Weather
Review, 129, 587-604, 2001b.
Daly, C., Gibson, W. P., Taylor, G. H., Johnson, G. L., and Pasteris, P.: A knowledge-based approach
to the statistical mapping of climate, Climate Research, 22, 14, 99-113, 2002.
Dickinson, R. E., Henderson-Sellers, A., Rosenzweig, C., and Sellers, P. J.: Evapotranspiration models
with canopy resistance for use in climate models, a review, Agricultural and Forest
Meteorology, 54, 373-388, Doi: 10.1016/0168-1923(91)90014-h, 1991.
Essery, R. L. H., Best, M. J., Betts, R. A., and Cox, P. M.: Explicit Representation of Subgrid
Heterogeneity in a GCM Land Surface Scheme, Journal of Hydrometeorology, 4, 530-543,
2003.
Fischer, E. M., Seneviratne, S. I., Vidale, P. L., Lüthi, D., and Schär, C.: Soil Moisture–Atmosphere
Interactions during the 2003 European Summer Heat Wave, Journal of Climate, 20, 5081-5099,
2007.
Ge, J., Qi, J., Lofgren, B. M., Moore, N., Torbick, N., and Olson, J. M.: Impacts of land use/cover
classification accuracy on regional climate simulations, Journal of Geophysical Research, 112,
12, 10.1029/2006JD007404, 2007.

Publication II
- 101 -
Gutman, G., and Ignatov, A.: Satellite-derived green vegetation fraction for the use in numerical
weather prediction models, Advances in Space Research, 19, 477-480, 10.1016/s0273-
1177(97)00058-6, 1997.
Hagemann, S., Botzet, M., and Machenhauer, B.: The summer drying problem over south-eastern
europe: sensitivity of the limited area model HIRHAM4 to improvements in physical
parameterization and resolution, Physics and Chemistry of the Earth, Part B: Hydrology, Oceans
and Atmosphere, 26, 391-396, Doi: 10.1016/s1464-1909(01)00024-7, 2001.
Henderson-Sellers, A., Dickinson, R. E., and Pitman, A. J.: Atmosphere-landsurface modelling,
Mathematical and Computer Modelling, 21, 5-10, Doi: 10.1016/0895-7177(95)00045-4, 1995.
Henderson-Sellers, A., Irannejad, P., and McGuffie, K.: Future desertification and climate change: The
need for land-surface system evaluation improvement, Global and Planetary Change, 64, 129-
138, DOI: 10.1016/j.gloplacha.2008.06.007, 2008.
IPCC: Climate Change 2007: Impacts, Adaptation and Vulnerability. Contribution of Working Group
II to the Fourth Assessment Report of the Intergovernmental Panel on Climate Change,
Cambridge University Press, Cambridge, United Kingdom and New York, NY, USA., 976pp,
2007.
Jarvis, P. G.: The Interpretation of the Variations in Leaf Water Potential and Stomatal Conductance
Found in Canopies in the Field, Philosophical Transactions of the Royal Society of London.
Series B, Biological Sciences, 273, 593-610, 1976.
Koster, R. D., and Suarez, M. J.: The components of a 'SVAT' scheme and their effects on a GCM's
hydrological cycle, Advances in Water Resources, 17, 61-78, Doi: 10.1016/0309-
1708(94)90024-8, 1994.
Koster, R. D., Dirmeyer, P. A., Guo, Z. C., Bonan, G., Chan, E., Cox, P., Gordon, C. T., Kanae, S.,
Kowalczyk, E., Lawrence, D., Liu, P., Lu, C. H., Malyshev, S., McAvaney, B., Mitchell, K.,
Mocko, D., Oki, T., Oleson, K., Pitman, A., Sud, Y. C., Taylor, C. M., Verseghy, D., Vasic, R.,
Xue, Y. K., Yamada, T., and Team, G.: Regions of strong coupling between soil moisture and
precipitation, Science, 305, 1138-1140, 2004.
Kotlarski, S., Block, A., Böhm, U., Jacob, D., Keuler, K., Knoche, R., Rechid, D., and Walter, A.:
Regional climate model simulations as input for hydrological applications: Evaluation of
uncertainties., Advances in Geosciences, 5, 119-125, 2005.
Liston, G. E., and Elder, K.: A Meteorological Distribution System for High-Resolution Terrestrial
Modeling (MicroMet), Journal of Hydrometeorology, 7, 17, 2006.

Publication II
- 102 -
Marke, T.: Development and Application of a Model Interface To couple Land Surface Models with
Regional Climate Models For Climate Change Risk Assessment In the Upper Danube
Watershed, Fakultät für Geowissenschaften, Ludwig-Maximilians-Universität, München, 2008.
Marke, T., Mauser, W., Pfeiffer, A., and Zängl, G.: A pragmatic approach for the downscaling and
bias correction of regional climate simulations – evaluation in hydrological modeling, Geosci.
Model Dev. Discuss., 4, 45-63, 10.5194/gmdd-4-45-2011, 2011.
Martin, P. H.: Land-surface characterization in climate models: biome-based parameter inference is
not equivalent to local direct estimation, Journal of Hydrology, 212-213, 287-303, Doi:
10.1016/s0022-1694(98)00212-1, 1998.
Mauser, W., and Bach, H.: PROMET - Large scale distributed hydrological modelling to study the
impact of climate change on the water flows of mountain watersheds, Journal of Hydrology,
376, 362-377, DOI: 10.1016/j.jhydrol.2009.07.046, 2009.
Mitchell, K.: The Community Noah Land-Surface Model (LSM), 2005.
Molod, A., and Salmun, H.: A global assessment of the mosaic approach to modeling land surface
heterogeneity, Journal of Geophysical Research, 107, 4217, 10.1029/2001jd000588, 2002.
Orlowsky, B., and Seneviratne, S. I.: Statistical Analyses of Land–Atmosphere Feedbacks and Their
Possible Pitfalls, Journal of Climate, 23, 3918-3932, 2010.
Pfeiffer, A., and Zängl, G.: Validation of climate-mode MM5-simulations for the European Alpine
Region, Theoretical Applied Climatology, 101, 93-108, DOI 10.1007/s00704-009-0199-5,
2009.
Pitman, A. J.: The evolution of, and revolution in, land surface schemes designed for climate models,
International Journal of Climatology, 23, 479-510, 10.1002/joc.893, 2003.
Richter, K., and Timmermans, W. J.: Physically based retrieval of crop characteristics for improved
water use estimates, Hydrology and Earth System Sciences, 13, 663-674, 2009.
Schär, C., Vidale, P. L., Lüthi, D., Frei, C., Häberli, C., Liniger, M. A., and Appenzeller, C.: The role
of increasing temperature variability in European summer heatwaves, Nature, 427, 332-336,
2004.
Seth, A., Giorgi, F., and Dickinson, R. E.: Simulating fluxes from heterogeneous land surfaces -
explicit subgrid method employing the biosphere-atmosphere transfer scheme (BATS), Journal
of Geophysical Research-Atmospheres, 99, 18651-18667, 1994.
Teuling, A. J., Stöckli, R., and Seneviratne, S. I.: Bivariate colour maps for visualizing climate data,
International Journal of Climatology, 31, 1408-1412, 10.1002/joc.2153, 2011.

Publication II
- 103 -
Uppala, S. M., Kallberg, P. W., Simmons, A. J., Andrae, U., Bechtold, V. D. C., Fiorino, M., Gibson,
J. K., Haseler, J., Hernandez, A., Kelly, G. A., Li, X., Onogi, K., Saarinen, S., Sokka, N., Allan,
R. P., Andersson, E., Arpe, K., Balmaseda, M. A., Beljaars, A. C. M., Berg, L. V. D., Bidlot, J.,
Bormann, N., Caires, S., Chevallier, F., Dethof, A., Dragosavac, M., Fisher, M., Fuentes, M.,
Hagemann, S., Hólm, E., Hoskins, B. J., Isaksen, L., Janssen, P. A. E. M., Jenne, R., McNally,
A. P., Mahfouf, J.-F., Morcrette, J.-J., Rayner, N. A., Saunders, R. W., Simon, P., Sterl, A.,
Trenberth, K. E., Untch, A., Vasiljevic, D., Viterbo, P., and Woollen, J.: The ERA-40 Re-
analysis., Quarterly Journal of the Royal Meteorological Society,, 131, 2961-3012,
10.1256/qj.04.176, 2005.
Yang, Z.-L., Dickinson, R. E., Shuttleworth, W. J., and Shaikh, M.: Treatment of soil, vegetation and
snow in land surface models: a test of the Biosphere-Atmosphere Transfer Scheme with the
HAPEX-MOBILHY, ABRACOS and Russian data, Journal of Hydrology, 212-213, 109-127,
Doi: 10.1016/s0022-1694(98)00205-4, 1998.
Yu, Z.: Assessing the response of subgrid hydrologic processes to atmospheric forcing with a
hydrologic model system, Global and Planetary Change, 25, 1-17, Doi: 10.1016/s0921-
8181(00)00018-7, 2000.
Zabel, F., Hank, T. B., and Mauser, W.: Improving arable land heterogeneity information in available
land cover products for land surface modelling using MERIS NDVI data, Hydrology and Earth
System Sciences, 14, 2073-2084, doi:10.5194/hess-14-2073-2010, 2010.
Zängl, G.: An improved method for computing horizontal diffusion in a sigma-coordinate model and
its application to simulations over mountainous topography., Monthly Weather Review, 130,
1423-1432, 2002.
Zeng, X. M., Zhao, M., Su, B. K., Tang, J. P., Zheng, Y. Q., Zhang, Y. J., and Chen, J.: Effects of the
land-surface heterogeneities in temperature and moisture from the "combined approach" on
regional climate: a sensitivity study, Global and Planetary Change, 37, 247-263, Doi:
10.1016/s0921-8181(02)00209-6, 2003.

Transition to Publication III
- 104 -
8.7. Transition to Publication III
The study of publication II has introduced the bi-directional coupling approach and
demonstrated the resulting impacts upon the simulation results for the coupling domain of
Central Europe. For quality statements about the results from the online coupling,
comparisons to measured data and validation of the water balance for a specific catchment are
carried out in publication III. Therefore, the Upper Danube catchment was chosen, since in
the framework of the GLOWA-Danube project, the data from a dense network of
meteorological monitoring stations and gauge measurements were available and the water
balance of the Upper Danube was well researched.
Atmospheric responses to the online coupling and occurring feedbacks in the catchment are
described. The results from online and offline simulations are compared to measurements.
Thus, a validation of the bi-directional coupling approach was possible. It is shown that the
investigated near surface air-temperature and the components of the water balance,
precipitation, evapotranspiration and runoff are improved by the online coupling.

Publication III
- 105 -
8.8. Publication III
Zabel, F. Mauser, W.: Analysis of feedback effects and atmosphere responses when 2-way
coupling a hydrological land surface model with a regional climate model. A case study
for the Upper-Danube catchment, Hydrol. Earth Syst. Sci. Discuss., 9, 7543-7570,
Doi: 10.5194/hessd-9-7543-2012, 2012.

Publication III
- 106 -
Analysis of feedback effects and atmosphere responses
when 2-way coupling a hydrological land surface model
with a regional climate model
A case study for the Upper-Danube catchment
F. Zabel1, W. Mauser1
[1] Department of Geography, Ludwig-Maximilians-Universität (LMU), Munich, Germany
Correspondence to: F. Zabel ([email protected])
Abstract
Most land surface hydrological models (LSHMs) take land surface processes (e.g. soil-plant-
atmosphere interactions, lateral water flows, snow and ice) into detailed spatial account. On
the other hand, they usually consider the atmosphere as exogenous driver only, thereby
neglecting feedbacks between the land surface and the atmosphere. Regional climate models
(RCMs), on the other hand, generally describe land surface processes much coarser but
naturally include land-atmosphere interactions. What is the impact on RCMs performance of
the differently applied model physics and spatial resolution of LSHMs? In order to investigate
this question, this study analyses the impact of replacing the land surface model (LSM) within
a RCM by a LSHM.
Therefore, a 2-way coupling approach was applied for a full integration of the LSHM
PROMET (1 × 1 km2) and the atmospheric part of the RCM MM5 (45 × 45 km2). The scaling
interface SCALMET is used for down- and upscaling the linear and non-linear fluxes between
the model scales.
The response of the MM5 atmosphere to the replacement is investigated and validated for
temperature and precipitation for a 4 year period from 1996 to 1999 for the Upper-Danube
catchment. By substituting the NOAH-LSM with PROMET, simulated non-bias-corrected

Publication III
- 107 -
near surface air temperature significantly improves for annual, monthly and daily courses,
when compared to measurements from 277 meteorological weather stations within the Upper-
Danube catchment. The mean annual bias was improved from -0.85 K to -0.13 K. In
particular, the improved afternoon heating from May to September is caused by increased
sensible heat flux and decreased latent heat flux as well as more incoming solar radiation in
the fully coupled PROMET/MM5 in comparison to the NOAH/MM5 simulation. Triggered
by the LSM replacement, precipitation overall is reduced, however simulated precipitation
amounts are still of high uncertainty, both spatially and temporally. The distribution of
precipitation follows the coarse topography representation in MM5, resulting in a spatial shift
of maximum precipitation northwards the Alps. Consequently, simulation of river runoff
inherits precipitation biases from MM5. However, by comparing the water balance, the bias
of annual average runoff was improved from 21.2 % (NOAH/MM5) to 4.4 %
(PROMET/MM5) when compared to measurements at the outlet gauge of the Upper-Danube
watershed in Achleiten.

Publication III
- 108 -
Introduction
Land surface models designed for hydrological studies (LSHMs) need meteorological data as
input in order to simulate the pathway of water and energy at the land surface. This can be
provided by measurements or regional climate models (RCMs). The latter is often used for
hydrological impact studies on climate change scenarios. However, most LSHMs consider the
atmosphere as an exogenous model driver only, applying a 1-way coupling approach and
usually a correction of the systematic biases of temperature and precipitation (Marke et al.,
2011a; Senatore et al., 2011), when driving LSHMs with data provided by a RCM (see
Figure 8.8.1). Thereby, the 1-way coupled model chain includes redundancy of two different
land surface models, describing the same land surface processes. By not allowing for
feedbacks between the downstream LSHM and the atmosphere of the RCM, inconsistencies
occur when driving the LSHM offline with RCM output (Zabel et al., 2012).
Physically based LSHMs are usually designed to simulate small scale river basins on high
spatial resolution, which allows for modelling physical processes with high process and
spatial detail. They have intensely been validated reproducing gauge measurements and have
recently extended from small to large scale river basins in the order of 1 million km² (Mauser
and Bach, 2009; Ludwig et al., 2003). However, they go beyond reproducing runoff at gauges
of small scale catchment areas and now consider in detail land surface processes (Garcia-
Quijano and Barros, 2005; Kuchment et al., 2006; Kunstmann et al., 2008; Ludwig and
Mauser, 2000; Mauser and Bach, 2009; Schulla and Jasper, 1999). The physically based
models aim at understanding the interactions between the different land surface
compartments, namely soil, vegetation, snow and ice in producing the resulting river runoff.
Some are not calibrated with measured runoff and, thereby, in a strict sense, they conserve
mass and energy at the land surface. They include detailed descriptions of vertical and lateral
soil water and energy flows, vegetation dynamics and related flow regulations, snow and ice
dynamics as well as energy and mass exchange with the atmosphere and, accordingly, land
surface processes in the soil-plant-atmosphere continuum. However, for modelling runoff
over mountainous terrain with RCM forcing adequately, a bias correction of the RCM data is
necessary (Marke et al., 2011b).
On the other hand, LSMs designed for the use within RCMs, developed from coarse spatial
resolution on continental scales, use a comparatively simple physical description of the land
surface processes with simple parameterizations, in order to keep computational demand low

Publication III
- 109 -
(Chen and Dudhia, 2001; Henderson-Sellers et al., 1995; Henderson-Sellers et al., 1996;
Pitman, 2003; Pitman and Henderson-Sellers, 1998; Wood et al., 1998). During the past years,
they have become more and more complex, considering vegetation dynamics, biogeochemical
processes, surface and subsurface hydrology, dynamic development of snowpack and include
representations of urban and artificial areas as well as lakes (van den Hurk et al., 2011). Due
to the latest developments, LSM and LSHMs overall seem to converge in terms of their
physical skills. Nevertheless, a gap remains between the spatial resolution of RCMs and
LSHMs. Therefore, we investigate the impacts of directly coupling a high resolution LSHM
with a low resolution RCM using an appropriate up-and downscaling approach.
RCMLand surface
Downscaling
RCMatmosphere
LSHM LSHM
RCMatmosphere
Dow
nscalingUps
calin
g
1 km 1 km
45 km45 km
45 km Figure 8.8.1: Schematic illustration of 1-way (left) and 2-way coupling (right) a LSHM with a RCM.
As shown in multiple studies, an improvement of physical parameterization and spatial
resolution in RCMs is supposed to improve simulation results (Hagemann et al., 2001; Zängl,
2007a). 2-way coupling a LSHM with a RCM potentially seems to be a very powerful
approach (Chen and Dudhia, 2001). Mölders and Raabe (1997) e.g. applied a 2-way coupling
approach for a 24 h weather prediction forecast for a small domain of 225 × 150 km2.
Simulating large scale watersheds and longer time periods could not be considered at that
time due to computational limitations. The central question concerning this study is, whether
RCMs could benefit in terms of an improved modelling of atmospheric and land surface
processes (e.g. temperature, precipitation, evapotranspiration, and runoff) from the spatially

Publication III
- 110 -
and process-wise more detailed land surface description when substituting the LSM of the
RCM with a high spatial resolution LSHM and a spatial scaling mechanism.
In this study we take the Upper-Danube catchment (A = 77000 km²) over a 4-year period
from 1996 - 1999 to compare simulation results of atmospheric and land surface hydrology
variables and simulated water balance with measurements, using the original MM5-NOAH
and a replacement of NOAH with the high resolution PROMET-LSHM and a bi-directional
scaling interface.

Publication III
- 111 -
Materials and Method
The RCM applied in this study is the fifth-generation Mesoscale Model (MM5) (Grell et al.,
1994), developed by the Pennsylvania State University (Penn State) and the National Center
for Atmospheric Research (NCAR). It was modified and adapted to our specific simulation
requirements and our specific model domain (Pfeiffer and Zängl, 2009; Zängl, 2002). MM5 is
used in climate mode with a horizontal spatial resolution of 45 km and an internal time step of
135 seconds. ECMWF ERA-40 reanalysis-data (Uppala et al., 2005) are used to nudge the
double-nested MM5 model solutions 6-hourly at the lateral boundaries of the first nesting
domain that covers the European continent with 79 grid-boxes in west-east and 69 grid-boxes
in south-north directions (Pfeiffer and Zängl, 2009).
The NOAH-LSM (Chen and Dudhia, 2001) as an integral component of MM5 is an advanced
physically based LSM designed for the use in atmosphere application such as MM5 and, thus,
it uses the same spatial resolution than the atmosphere model. It has been developed with the
goal of a simple but robust parameterization, taking the most important aspects of land surface
hydrology into account (Chen and Dudhia, 2001). As a physically based LSHM, PROMET
uses a more hydrological view on the land surface with a more detailed spatial resolution of
1 km and different physical formulations than the NOAH-LSM (Zabel et al., 2012). Detailed
model descriptions of PROMET can be found in (Mauser and Bach, 2009, Muerth and
Mauser, 2012).
An enhanced 2-way coupling approach, which takes care of the different spatial resolutions of
the two components is used in this study for fully coupling the LSHM PROMET with the
RCM MM5 for the model domain of Central Europe (Zabel et al., 2012). Therefore, the
NOAH-LSM is replaced with PROMET and the bi-directional scaling tool SCALMET (Zabel
et al., 2012). Thus, PROMET results of scalar surface fluxes, which are latent and sensible
heat, short- and longwave outgoing radiation and momentum, are linearly upscaled to 45 km.
These upscaled fluxes serve as the lower boundary conditions for the MM5 atmosphere and,
consequently, MM5 results downscaled to 1 km provide the inputs to PROMET (Zabel et al.,
2012). Besides, the non-scalar radiation temperature at the surface or at the top of the
vegetation canopy respectively is given to MM5, since it is needed for initializing the
convection scheme at each coupling time step. It is calculated from the upscaled emissivity
and the upscaled emission of longwave radiation of the PROMET land surface using the
Stefan-Boltzmann-law. The adjustable coupling time step for exchanging the fluxes between

Publication III
- 112 -
both models in both directions was set to 9 min in the current study. This allows PROMET to
run synchronously with MM5, which uses an internal time-step of 135 s.
SCALMET assures the conservation of mass and energy during the up- and downscaling
process. In order to guarantee for a consistent coupling between the models, a bias correction
is not applied in this study. Further, PROMET maintains mass and energy at the land surface
and is not calibrated with measured discharges.
A more detailed model comparison between PROMET and NOAH and methodological
explanation of the coupling approach between PROMET and MM5 is given in Zabel et al.
(2012). Within this paper, the results of three different configurations are compared with
measurements (see Figure 8.8.1):
• NOAH fully, interactively coupled with the atmospheric part of MM5
• PROMET offline driven with MM5 output
• PROMET interactively (bi-directionally) coupled with MM5, applying the 2-way
coupling approach
All simulation results are compared with measurements from 277 meteorological weather
stations, spatially interpolated to the Upper Danube catchment. The catchment is situated in
Central Europe, has an area of 76.653 km² and is characterized by a complex terrain, covering
parts of the Alps in Southern Germany, Austria, Switzerland and Italy. Altitudes reach from
4049 m a.s.l. at Piz Bernina to 287 m a.s.l. at the catchment's outlet at the gauge in Achleiten.
The lowlands north of the Alps are characterized by heterogeneous land and soil patterns,
intense agriculture and high population density. The prevailing climate is characterized by the
temperate latitudes with an annual precipitation gradient ranging from 550 mm in the
Northern part of the catchment to more than 2000 mm in the Alps.

Publication III
- 113 -
Results and Discussion
Differences between PROMET and NOAH
evapotranspiration
0
20
40
60
80
1 2 3 4 5 6 7 8 9 10 11 12
month
evap
otra
nspi
ratio
n [m
m]
NOAH PROMET offline
sensible heat flux
-20
0
20
40
60
1 2 3 4 5 6 7 8 9 10 11 12
month
heat
flux
[W
/m²]
NOAH PROMET offline
longwave radiation out
250
300
350
400
1 2 3 4 5 6 7 8 9 10 11 12
month
radi
atio
n [W
/ m²]
NOAH PROMET offline
shortwave radiation out
0
20
40
60
1 2 3 4 5 6 7 8 9 10 11 12
month
radi
atio
n [W
/m²]
NOAH PROMET offline Figure 8.8.2: Spatially averaged monthly land surface mass and energy fluxes (evapotranspiration, sensible heat flux, long-wave outgoing radiation, short-wave outgoing radiation) for the Upper-Danube catchment simulated with the NOAH-LSM and with PROMET offline respectively for the years 1996-1999.
As can be seen in Figure 8.8.2, offline driven with RCM output, PROMET simulates less
long-wave outgoing radiation and more short-wave outgoing radiation than NOAH. The
lower long-wave outgoing radiation is mainly due to lower values of land surface emissivity
within the PROMET parameterization than within the NOAH parameterization, while the
higher amount of reflected short-wave radiation mainly results from a more heterogeneous
land use and land cover in PROMET, having a higher number of land use/cover classes with
high albedo values, such as urban area or rock. Further, snow cover increased short-wave
reflection especially from March to May due to a spatially more detailed underlying
topography, resulting in higher elevations in the Alpine area. In the PROMET simulation,
snow cover still was predominant in the higher altitudes in May, while the high altitudes are
averaged out in the NOAH topography due to the coarse spatial resolution.
Overall, net radiation for the Upper-Danube catchment is higher by 8 W/m². This net radiation
is further differently distributed into latent and sensible heat due to different assumptions in

Publication III
- 114 -
the model's underlying land surfaces in terms of topography, soil and land use/cover
properties (Zabel et al., 2012). Further, evapotranspiration is considerably lower due to
impervious surfaces, such as urban area and rock that do not contribute to transpiration in
PROMET while NOAH mainly implements a mixture of cropland and forest (Zabel et al.,
2012) for the Upper-Danube. Consequently, sensible heat is higher in summer but lower in
the winter months (Figure 8.8.2) due to snow cover effects in the PROMET simulation in the
Alpine area. While energy goes into snow melt instead of into sensible heat in the PROMET
simulation, available net radiation has to become sensible heat in the NOAH-LSM. The
higher spatial resolution in PROMET results in a more detailed modelling of the snow cover,
especially in the spatially heterogeneous Alps with strong impact on the sensible heat flux.
Thus, more energy goes into snow melt in the PROMET simulation, which explains the
overall lower heat fluxes in the PROMET simulation although net radiation is a little higher.
Atmosphere responses
By replacing NOAH with PROMET and a bi-directional scaling interface, a full interactive
coupling with the atmospheric part of MM5 is achieved and the modelled atmosphere
responds to the replacement of the LSM.
Planetary boundary layer
Due to the tendency of higher sensible heat flux without snow cover in the PROMET model,
the height of the planetary boundary layer is increasing in the PROMET/MM5 bi-directional
coupling in summer and decreasing in winter over the Upper-Danube catchment
(Figure 8.8.3). Consequently, this has far-reaching implications to the moisture content of air
masses as well as the stability of stratification. Sensible heat is a sensitive parameter, affecting
cloud fraction, convection and, thus, precipitation as well as solar radiation. In our setup,
MM5 uses the Kain-Fritsch-2-scheme which turned out to be the best parameterization of the
convection scheme for the simulation area, being tested with the NOAH-LSM with respect to
simulated rainfall amounts (Pfeiffer and Zängl, 2010). This scheme was further applied to the
PROMET/MM5 simulation, without adaptation and without testing other convection
parameterization schemes in combination with PROMET.

Publication III
- 115 -
0
100
200
300
400
500
600
1 2 3 4 5 6 7 8 9 10 11 12
month
heig
ht [
m]
NOAH/MM5 PROMET/MM5 Figure 8.8.3: Monthly course of the planetary boundary layer height (1996-1999).
Solar incoming radiation
Total incoming radiation, as the sum of direct and diffuse radiation, increases by the use of
the PROMET land surface from 106 W/m² (NOAH) to 112 W/m². Measurements of radiation
(117 W/m²) calculated via the proportion of cloud cover from 277 meteorological stations are
compared to simulation results in Figure 8.8.4. The monthly incoming short-wave radiation is
increased in the summer months and, thereby, closer to the measurements while the influence
of the land surface on the atmospheric conditions is low in winter. The basic shape of the
PROMET and NOAH curves is similar since it is mainly controlled by the passing low-
pressure systems imposed onto the simulations by the ERA-40 lateral boundary forcing.
0
50
100
150
200
250
1 2 3 4 5 6 7 8 9 10 11 12month
radi
atio
n [W
/m²]
NOAH/MM5 PROMET/MM5 Measurements
Figure 8.8.4: Monthly course of the total incoming short-wave radiation (1996-1999).

Publication III
- 116 -
Temperature
Figure 8.8.5: Difference plot between PROMET/MM5 and NOAH/MM5 annual mean near surface air temperature in the Upper Danube Basin, downscaled to 1 km.
The higher solar incoming radiation as well as lower evaporative cooling in PROMET results
in an increase of the annual mean near surface air temperature from 5.93° C to 6.65° C in the
fully coupled PROMET/MM5 simulations. The increase mainly occurs North of the Alps and
near the city of Munich (Figure 8.8.5). Measurements from 277 meteorological weather
stations show 6.78° C for the Upper-Danube catchment and the respective years. Thus, annual
bias could be reduced from -0.85 K to -0.13 K. In addition, the monthly behaviour was
improved in fully coupled PROMET/MM5 simulations when compared to measurements (see
Figure 8.8.6).

Publication III
- 117 -
-5
0
5
10
15
20
1 2 3 4 5 6 7 8 9 10 11 12
month
tem
pera
ture
[°C
]
NOAH/MM5 PROMET/MM5 Measurements
Figure 8.8.6: Monthly mean temperature of fully coupled NOAH-MM5 simulation, PROMET-MM5 simulation in comparison with measurements in the Upper-Danube catchment.
Figure 8.8.7 shows the simulated diurnal cycle of the near surface air temperature for
NOAH/MM5, PROMET/MM5 and measurements respectively. The impact of the land
surface is marginal in the winter months due to low energy inputs on the land surface.
Therefore, the bi-directional coupling approach with PROMET has almost no effect on the air
temperature in the winter months. On the contrary, the diurnal cycle is strongly affected by
the changed land surface in the summer months. Here, by using PROMET, near surface air
temperature heats up faster and stronger. A cold bias of up to 2 K in the NOAH/MM5
simulation, especially in the afternoon hours in summer, corresponds to the results of Pfeiffer
and Zängl (2009). Compared to measurements, a clear improvement can be investigated from
May to September, where the diurnal course and particularly the maximum can be reproduced
considerably better.
In August e.g., the mean maximum temperature is measured at 19.7° C. While the
NOAH/MM5 simulations only reaches 16.9° C in the afternoon hours, the changed lower
boundary conditions lead to a mean maximum daily temperature of 19.0° C in bi-directionally
coupled PROMET-MM5 simulations.

Publication III
- 118 -
JAN
-6
-4
-2
0
2
4
0 3 6 9 12 15 18 21
hour (utc)
[°C]
NOAH/MM5 PROMET/MM5 Measured
FEB
-6
-4
-2
0
2
4
0 3 6 9 12 15 18 21
hour (utc)
[°C]
NOAH/MM5 PROMET/MM5 Measured
MAR
-2
0
2
4
6
8
0 3 6 9 12 15 18 21
hour (utc)
[°C]
NOAH/MM5 PROMET/MM5 Measured
APR
0
2
4
6
8
10
12
0 3 6 9 12 15 18 21
hour (utc)
[°C]
NOAH/MM5 PROMET/MM5 Measured
MAY
5
7
9
11
13
15
17
0 3 6 9 12 15 18 21
hour (utc)
[°C]
NOAH/MM5 PROMET/MM5 Measured
JUN
5
8
11
14
17
20
0 3 6 9 12 15 18 21
hour (utc)
[°C]
NOAH/MM5 PROMET/MM5 Measured
JUL
10
12
14
16
18
20
0 3 6 9 12 15 18 21
hour (utc)
[°C]
NOAH/MM5 PROMET/MM5 Measured
AUG
10
12
14
16
18
20
22
0 3 6 9 12 15 18 21
hour (utc)
[°C]
NOAH/MM5 PROMET/MM5 Measured
SEP
5
7
9
11
13
15
17
0 3 6 9 12 15 18 21
hour (utc)
[°C]
NOAH/MM5 PROMET/MM5 Measured
OCT
4
6
8
10
12
0 3 6 9 12 15 18 21
hour (utc)
[°C]
NOAH/MM5 PROMET/MM5 Measured
NOV
-2
0
2
4
6
0 3 6 9 12 15 18 21
hour (utc)
[°C]
NOAH/MM5 PROMET/MM5 Measured
DEC
-5
-3
-1
1
3
0 3 6 9 12 15 18 21
hour (utc)
[°C]
NOAH/MM5 PROMET/MM5 Measured Figure 8.8.7: Monthly mean diurnal cycle (1996-1999) of the near surface air temperature (3-hourly) for the Upper-Danube catchment.
Precipitation
The measured annual precipitation for the area of the Upper-Danube is 1045 mm. While the
NOAH/MM5 approach calculated 1180 mm, the fully coupled PROMET/MM5 approach
simulated 1095 mm. Thus, annual bias was reduced from 12.9 % to 4.8 %. In particular,
winter and spring precipitation is clearly overestimated (Figure 8.8.8) in both MM5
simulations. However, precipitation amounts are reduced in the summer months as a respond
of coupling the PROMET land surface with MM5, while winter and spring precipitation
hardly changes (Figure 8.8.8).

Publication III
- 119 -
0
40
80
120
160
1 2 3 4 5 6 7 8 9 10 11 12month
prec
ipita
tion
[mm
]
NOAH/MM5 convective NOAH/MM5PROMET/MM5 convective PROMET/MM5Measurements
Figure 8.8.8: Monthly convective and total precipitation of MM5 simulations coupled with NOAH and PROMET compared to measurements.
The decrease of monthly precipitation from May to September in the results of
PROMET/MM5 is mainly due to the decrease of convective precipitation by 20 %, while non-
convective precipitation is reduced by 9 % (Figure 8.8.8). Therefore, it can be pointed out that
the change of the land surface predominantly affects convective precipitation that finally
decreases during summer for the Upper-Danube catchment. This results in an improvement
for June and August but not in May and July.
However, heavy precipitation events such as in May 1999 due to special weather conditions
are not properly reproduced in the Upper-Danube in both simulations where heavy
precipitation is generally underestimated (Zängl, 2007b).
Further, Zängl (2007a) found a resolution-dependence, drastically affecting the MM5 model
skill in the Alpine part of the model domain. By refining the mesh size from 9 km to 1 km,
simulated precipitation could be considerably improved, due to a better representation of the
topography in the atmosphere model. However, the coarse resolution of MM5 in our study
(45 km) is not suitable for reproducing precipitation properly in the Alps and the foothills of
the Alps. The coarse resolution of the MM5 topography results in a northwards shift of
precipitation away from the Alps, when compared with measurements. Consequently,
precipitation is overestimated in the Alpine foreland and underestimated in the Alps, due to
leeward effects (see Figure 8.8.9).

Publication III
- 120 -
Figure 8.8.9: Over- and underestimation of annual simulated PROMET/MM5 (left) and NOAH/MM5 (right) precipitation in the Upper Danube Basin, downscaled to 1 km and subtracted from measurements.
The use of PROMET instead of NOAH does not change the coarse resolution of the MM5
underlying topography. Therefore, the precipitation shift appears in both simulations while the
annual overestimation in the alpine foreland is reduced in the PROMET simulations while at
the same time the underestimation in the Alpine regions is increased. From this, we conclude
that precipitation improved in the Northern part of the Upper-Danube catchment with low
influence of the Alps and low relief.
Advective inflowing air masses passing the MM5 model domain, dominantly driven by the
lateral boundary conditions (ERA-40), are one source of uncertainty, which ERA-40 data
inherit to the RCM.
The coarse resolution of MM5 is another source for overestimating precipitation especially in
winter, which coincides with the findings of Pfeiffer and Zängl (2010).
In addition, a systematic underestimation of wintertime snowfall in the observational dataset
mainly in the Alpine domain should be considered in the evaluation.

Publication III
- 121 -
Feedback effects
Evapotranspiration
By coupling PROMET bi-directionally with MM5, simulated evapotranspiration increases
between May and August and decreases slightly from September to April due to changed
atmospheric conditions such as the increased temperature and solar radiation that feed back to
the land surface in the bi-directional coupling case (Figure 8.8.10).
0
20
40
60
80
100
1 2 3 4 5 6 7 8 9 10 11 12month
[mm
]
PROMET 1-way coupled PROMET 2-way coupled
Figure 8.8.10: Monthly mean evapotranspiration in the Upper Danube Basin of 1-way and 2-way coupled PROMET simulations (1996-1999).
Zabel et al. (2012) showed that the change of evapotranspiration in the fully coupled
PROMET/MM5 simulations highly depends on the simulated soil moisture. Since wilting
point is hardly ever reached in the Upper-Danube catchment, evapotranspiration is marginally
affected by soil moisture and can thereby increase in summer.
Water Balance
By the use of PROMET's baseflow, interflow and surface runoff as well as channel hydraulics
components, simulated time series of monthly, daily and hourly runoff can be compared
against hourly gauge measurements (Mauser and Bach, 2009). NOAH has the ability for
modelling surface runoff formation but lacks in the option for simulating of lateral and river
channel flow.

Publication III
- 122 -
However, it is not the intention of this study to estimate the ability of bias corrected RCM
inputs to reproduce runoff in the Upper Danube watershed. Since a bias correction would
have been counterproductive in this study, biases of the RCM, particularly precipitation biases
are handed over to the land surface components and, therefore, drastically affect runoff
simulations.
Due to the coarse spatial resolution of 45 km in our study, the spatial patterns of precipitation
follow the coarse spatial resolution of the underlying MM5 topography (45 × 45 km2). The
scale mismatch to the 1 km topography of PROMET, therefore, leads to inadequate spatial
shifts and biases in runoff that cannot be corrected without a bias correction.
Consequently, analogously to precipitation, a spatially detailed analysis of simulated river
runoff underlies strong uncertainties in the Alps and the Alpine foreland. Nevertheless,
regarding the annual water balance, simulated and annual averaged river runoff at the
catchment's outlet was compared to the measured annual average runoff at the outlet of the
Upper Danube Basin in Achleiten, which was determined to be 1412 m³ s-1 for the considered
years. The results are shown in Table 8.8.1.
Mean surface runoff [mm] simulated by the NOAH-LSM for the Upper-Danube catchment
and converted into the catchment's discharge, is 1712 m³ s-1. Thus, NOAH/MM5 strongly
overestimates annual mean runoff. One way coupling of PROMET with MM5 results in a
simulated average lateral river runoff of 1583 m³ s-1 and a considerable improvement from the
NOAH/MM5 case. The full 2-way coupling of PROMET and MM5 leads to a simulated
average river runoff of 1474 m³ s-1. This value can be considered to compare quite well with
the observed 1412 m³ s-1. Thus, the annual bias could be reduced from 21.1 % (NOAH) to
4.4 % (2-way coupled PROMET).
Table 8.8.1: Measured annual mean runoff at the outlet of the Upper Danube catchment at Achleiten in comparison with simulated runoff of NOAH/MM5 and PROMET/MM5 in either 1-way or 2-way coupled configuration.
Model Configuration Runoff
NOAH 1712 m³ s-1
PROMET, 1-way coupled 1583 m³ s-1
PROMET, 2-way coupled 1474 m³ s-1
Measurements 1412 m³ s-1

Publication III
- 123 -
Conclusions
In this study, we investigated the impacts of replacing the land surface module of the RCM
MM5 with the LSHM PROMET for the Upper-Danube catchment. As shown, it is possible to
use LSHMs embedded in RCMs, which offers new opportunities for both, the atmospheric
and the hydrological community.
Through that replacement, the spatial resolution of the land surface representation improved
from 45 km² to 1 km², which was dealt with by a bi-directional scaling interface that arranged
the 2-way coupling between the models. It could be shown that different spatial scales and
assumptions between the land surface models NOAH and PROMET lead to different
simulation results of latent and sensible heat, as well as long- and short-wave outgoing
radiation. Thereby, PROMET evapotranspiration was lower, while sensible heat flux tends to
be higher. By applying the full 2-way coupling between PROMET and MM5, the atmosphere
responded to the changed lower boundary conditions. As a consequence, mean annual
temperature increased from 5.93° C to 6.65° C due to more incoming solar radiation and less
evaporative cooling which lead to more sensible heat flux. Compared to meteorological
measurements (6.78° C), simulated near surface air temperature improved also for monthly
and diurnal courses. Particularly afternoon heating was modelled more adequately by the use
of PROMET. The impact of the PROMET land surface scheme on changes in the atmosphere
is strongest in summer, when energy transformation at the land surface strongly affects
atmosphere processes.
The impact on precipitation is difficult to diagnose, due to high uncertainties induced by the
complex terrain of the catchment. Overall, precipitation was reduced mainly due to decreased
convective precipitation in summer which can be explained by the rise of the planetary
boundary layer due to more sensible heat flux. As a result, the moisture content of air masses
is reduced and cloud fraction and convection are finally impeded. However, simulated
precipitation shows a spatial shift northwards into the Alpine forelands when compared to
measurements in the Upper-Danube catchment, as a result of the coarse description of the
topography in MM5. The high temporal and spatial bias of precipitation, mainly in the Alps
and the Alpine foreland is inherited to runoff simulation results in PROMET.
The NOAH river runoff for the Upper-Danube catchment converted from surface runoff [mm]
was 1712 m³ s-1, which means a strong overestimation of annual runoff. Simulated annual

Publication III
- 124 -
river runoff improved to 1583 m³ s-1 when using the 1-way coupled PROMET/MM5 approach
due to less precipitation and higher evapotranspiration. Finally, the fully coupled
PROMET/MM5 approach improved the simulation of the outlet gauge in Achleiten to
1474 m³ s-1 without a bias correction in comparison to gauge measurements in Achleiten
(1412 m³ s-1).
We conclude from these results that when comparing simulation results of an RCM using
different land use schemes, all investigated meteorological and hydrological parameters
improved in comparison with observations when moving from NOAH/MM5 to a fully-
coupled PROMET/MM5.

Publication III
- 125 -
Acknowledgements
The research described in this paper was carried out at the Department of Geography of the
Ludwig-Maximilians-University in Munich, Germany, as part of the GLOWA-Danube
project, which was funded by BMBF from 2000 to 2010. The support is gratefully
acknowledged.

Publication III
- 126 -
References
Chen, F., and Dudhia, J.: Coupling an Advanced Land Surface–Hydrology Model with the Penn
State–NCAR MM5 Modeling System. Part I: Model Implementation and Sensitivity, Monthly
Weather Review, 129, 569-585, 2001.
Garcia-Quijano, J. F., and Barros, A. P.: Incorporating canopy physiology into a hydrological model:
photosynthesis, dynamic respiration, and stomatal sensitivity, Ecological Modelling, 185, 29-49,
Doi: 10.1016/j.ecolmodel.2004.08.024, 2005.
Hagemann, S., Botzet, M., and Machenhauer, B.: The summer drying problem over south-eastern
europe: sensitivity of the limited area model HIRHAM4 to improvements in physical
parameterization and resolution, Physics and Chemistry of the Earth, Part B: Hydrology, Oceans
and Atmosphere, 26, 391-396, Doi: 10.1016/s1464-1909(01)00024-7, 2001.
Henderson-Sellers, A., Dickinson, R. E., and Pitman, A. J.: Atmosphere-landsurface modelling,
Mathematical and Computer Modelling, 21, 5-10, Doi: 10.1016/0895-7177(95)00045-4, 1995.
Henderson-Sellers, A., McGuffie, K., and Pitman, A. J.: The Project for Intercomparison of Land-
surface Parametrization Schemes (PILPS): 1992 to 1995, Climate Dynamics, 12, 849-859,
1996.
Kuchment, L. S., Demidov, V. N., and Startseva, Z. P.: Coupled modeling of the hydrological and
carbon cycles in the soil-vegetation-atmosphere system, Journal of Hydrology, 323, 4-21, Doi:
10.1016/j.jhydrol.2005.08.011, 2006.
Kunstmann, H., Jung, G., Wagner, S., and Clottey, H.: Integration of atmospheric sciences and
hydrology for the development of decision support systems in sustainable water management,
Physics and Chemistry of the Earth, Parts A/B/C, 33, 165-174, Doi: 10.1016/j.pce.2007.04.010,
2008.
Ludwig, R., and Mauser, W.: Modelling Catchment Hydrology within a GIS-based SVAT-model
framework, Hydrology and Earth System Sciences, 4, 239-249, 2000.
Ludwig, R., Probeck, M., and Mauser, W.: Mesoscale water balance modelling in the Upper Danube
watershed using sub-scale land cover information derived from NOAA-AVHRR imagery and
GIS-techniques, Physics and Chemistry of the Earth, Parts A/B/C, 28, 1351-1364, Doi:
10.1016/j.pce.2003.09.011, 2003.
Marke, T., Mauser, W., Pfeiffer, A., and Zängl, G.: A pragmatic approach for the downscaling and
bias correction of regional climate simulations – evaluation in hydrological modeling, Geosci.
Model Dev. Discuss., 4, 45-63, Doi: 10.5194/gmdd-4-45-2011, 2011a.

Publication III
- 127 -
Marke, T., Mauser, W., Pfeiffer, A., Zängl, G., and Jacob, D.: The effect of downscaling on river
runoff modeling: a hydrological case study in the Upper Danube Watershed, Hydrol. Earth Syst.
Sci. Discuss., 8, 6331-6384, Doi: 10.5194/hessd-8-6331-2011, 2011b.
Mauser, W., and Bach, H.: PROMET - Large scale distributed hydrological modelling to study the
impact of climate change on the water flows of mountain watersheds, Journal of Hydrology,
376, 362-377, Doi: 10.1016/j.jhydrol.2009.07.046, 2009.
Mölders, N., and Raabe, A.: Testing the effect of a two-way-coupling of a meteorological and a
hydrologic model on the predicted local weather, Atmospheric Research, 45, 81-107, Doi:
10.1016/s0169-8095(97)00035-5, 1997.
Muerth, M., and Mauser, W.: Rigorous evaluation of a soil heat transfer model for mesoscale climate
change impact studies, Environmental Modelling & Software, 35, 149-162,
Doi: 10.1016/j.envsoft.2012.02.017, 2012.
Pfeiffer, A., and Zängl, G.: Validation of climate-mode MM5-simulations for the European Alpine
Region, Theoretical and Applied Climatology, 101, 93-108, Doi: 10.1007/s00704-009-0199-5,
2010.
Pitman, A. J., and Henderson-Sellers, A.: Recent progress and results from the project for the
intercomparison of landsurface parameterization schemes, Journal of Hydrology, 212-213, 128-
135, Doi: 10.1016/s0022-1694(98)00206-6, 1998.
Pitman, A. J.: The evolution of, and revolution in, land surface schemes designed for climate models,
International Journal of Climatology, 23, 479-510, Doi: 10.1002/joc.893, 2003.
Schulla, J., and Jasper, K.: Model description of WaSiM-ETH, Institute of Geography, ETH Zürich,
1999.
Senatore, A., Mendicino, G., Smiatek, G., and Kunstmann, H.: Regional climate change projections
and hydrological impact analysis for a Mediterranean basin in Southern Italy, Journal of
Hydrology, 399, 70-92, 10.1016/j.jhydrol.2010.12.035, 2011.
Uppala, S. M., Kallberg, P. W., Simmons, A. J., Andrae, U., Bechtold, V. D. C., Fiorino, M., Gibson,
J. K., Haseler, J., Hernandez, A., Kelly, G. A., Li, X., Onogi, K., Saarinen, S., Sokka, N., Allan,
R. P., Andersson, E., Arpe, K., Balmaseda, M. A., Beljaars, A. C. M., Berg, L. V. D., Bidlot, J.,
Bormann, N., Caires, S., Chevallier, F., Dethof, A., Dragosavac, M., Fisher, M., Fuentes, M.,
Hagemann, S., Hólm, E., Hoskins, B. J., Isaksen, L., Janssen, P. A. E. M., Jenne, R., McNally,
A. P., Mahfouf, J.-F., Morcrette, J.-J., Rayner, N. A., Saunders, R. W., Simon, P., Sterl, A.,
Trenberth, K. E., Untch, A., Vasiljevic, D., Viterbo, P., and Woollen, J.: The ERA-40 Re-
analysis, Quarterly Journal of the Royal Meteorological Society, 131, 2961-3012,
Doi: 10.1256/qj.04.176, 2005.

Publication III
- 128 -
van den Hurk, B., Best, M., Dirmeyer, P., Pitman, A., Polcher, J., and Santanello, J.: Acceleration of
Land Surface Model Development over a Decade of Glass, Bulletin of the American
Meteorological Society, 92, 1593-1600, Doi: 10.1175/bams-d-11-00007.1, 2011.
Wood, E. F., Lettenmaier, D. P., Liang, X., Lohmann, D., Boone, A., Chang, S., Chen, F., Dai, Y.,
Dickinson, R. E., Duan, Q., Ek, M., Gusev, Y. M., Habets, F., Irannejad, P., Koster, R., Mitchel,
K. E., Nasonova, O. N., Noilhan, J., Schaake, J., Schlosser, A., Shao, Y., Shmakin, A. B.,
Verseghy, D., Warrach, K., Wetzel, P., Xue, Y., Yang, Z.-L., and Zeng, Q.-c.: The Project for
Intercomparison of Land-surface Parameterization Schemes (PILPS) Phase 2(c) Red-Arkansas
River basin experiment:: 1. Experiment description and summary intercomparisons, Global and
Planetary Change, 19, 115-135, Doi: 10.1016/s0921-8181(98)00044-7, 1998.
Zabel, F., Mauser, W., Marke, T., Pfeiffer, A., Zängl, G., and Wastl, C.: Inter-comparison of two land-
surface models applied at different scales and their feedbacks while coupled with a regional
climate model, Hydrol. Earth Syst. Sci., 16, 1017-1031, Doi: 10.5194/hess-16-1017-2012, 2012.
Zängl, G.: An improved method for computing horizontal diffusion in a sigma-coordinate model and
its application to simulations over mountainous topography., Monthly Weather Review, 130,
1423-1432, 2002.
Zängl, G.: To what extent does increased model resolution improve simulated precipitation fields? A
case study of two north-Alpine heavy-rainfall events, Meteorologische Zeitschrift, 16, 571-580,
2007a.
Zängl, G.: Interaction between Dynamics and Cloud Microphysics in Orographic Precipitation
Enhancement: A High-Resolution Modeling Study of Two North Alpine Heavy-Precipitation
Events, Monthly Weather Review, 135, 2817-2840, Doi: 10.1175/mwr3445.1, 2007b.

Synthesis
- 129 -
9. SYNTHESIS
The aim of the thesis was the bi-directional coupling of the LSHM PROMET with the RCM
MM5. The complexity of interactions, responses and feedbacks which occur between the
atmosphere and the heterogeneous land surface were the key issues addressed in the
publications.
It can be pointed out that the land surface does remarkably affect land surface matter and
energy fluxes. It was proven that a more detailed view on land surface heterogeneity is
evidentially important to describe hydrological processes at the land surface. Atmospheric
responses were largely sensitive to land surface heterogeneity, due to effects on albedo, mass
and heat fluxes that result from different land surface land cover, soil and topographic
properties. Thereby, the prevailing hydrological conditions determined both the positive or
negative sign and the strength of the feedbacks.
An approach was presented, that enables a bi-directionally coupling between LSHMs and
RCMs across different spatial scales. Thereby, PROMET is able to provide lower boundary
conditions for RCMs. In comparison to the NOAH-LSM that is used within the RCM MM5,
PROMET more realistically matches land surface heterogeneity. The physical formulations
are taking hydrological aspects at the land surface, such as soil and plant processes, runoff
formation, snowpack and evapotranspiration, more detailed into account. Consequently, land
surface fluxes of heat and matter differ between PROMET and NOAH both, spatially and
temporally. The processes in the atmosphere respond adequately and in a comprehensible way
to the replacement of the NOAH-LSM with PROMET. As shown, the air temperature, the
planetary boundary layer height, cloud fraction and precipitation are influenced by the
PROMET land surface. The changed atmospheric conditions feed back to the land surface.
Consequently, positive and negative feedbacks lead to increased and decreased
evapotranspiration, depending on the prevailing hydrological conditions, varying both
spatially and temporally.
By the use of PROMET, all investigated processes were improved for seasonal, monthly and
diurnal cycles in comparison with measurements for the Upper Danube catchment.
Precipitation was at least improved for annual values, however still high uncertainties remain.
The improved representation of the land surface has led to better simulation of the diurnal
Synthesis
- 130 -
variation of surface heat and water fluxes, improving the water balance and hence the forcings
for boundary-layer dynamics and convection.
In conclusion, the results can be viewed from both, the meteorological and the hydrological
point of view. From the meteorological point of view, the bi-directional coupling between the
LSHM PROMET and the RCM MM5 resulted in a more realistic simulation of the lower
boundary conditions that yielded in improved simulation of atmospheric processes. Thus, it
was demonstrated that bi-directional coupling LSHMs with RCMs can make valuable
contributions to an improved land surface representation in current RCMs.
From the hydrological point of view, the study addresses the topic of the inconsistency
between atmospheric and land surface models. It shows that due to more detailed
parameterizations, formulations and underlying land surface information, the equilibrium
hydrological balance in the PROMET model is different from the NOAH model, but
moreover, that this difference is regionally amplified when the PROMET model is allowed an
online interaction with the atmosphere.

Outlook
- 131 -
10. OUTLOOK
Due to the successful application of the bi-directional coupling approach, exemplarily for a
4-year simulation period, an extension to long term scenarios, e.g. until 2100, would be a
possible next step in further studies. This could further improve the understanding and
knowledge about future climate and land-surface hydrological feedbacks, such as permafrost
melting effects on climate. Thus, a contribution could be given to improve climate scenarios.
For further improvements, the bi-directional hydrological coupling should not only be applied
to RCMs, but also to GCMs. This could be achieved by allowing the RCM to dynamically
exchange fluxes with the model providing the lateral boundaries, or by coupling the
PROMET high resolution land surface with a GCM bi-directionally. However, global
simulations at a 1 km spatial grid at the land surface would require a massive increase of
computational resources.
A potentially powerful approach for improving the interrelationship between the land surface
and the atmosphere processes would be the extension of the land surface model grid from the
boundary into the lower atmosphere layers. This would particularly improve the simulation of
small-scale clouds, which would aid in improving precipitation patterns and amounts in high
relief areas (Pitman, 2003; Zängl 2007).
Another step forward would be the inclusion of the nitrogen and carbon cycle in the land-
atmosphere exchange, which is already implemented in the scaling tool SCALMET. So-called
'third generation' LSMs (Pitman, 2003; Kabat et al., 2004) take advantage of the relationship
of photosynthesis and stomatal conductance (Farquhar et al., 1980), therefore including plants'
carbon assimilation and uptake explicitly in the simulations. PROMET already provides the
option that allows for the simulations of plants' carbon uptake (Hank, 2008). The integration
of the carbon cycle in the bi-directional coupling approach would therefore be another
obvious step that would contribute to further improvements in the land-atmosphere
interrelations.
It became clear that the land surface and its hydrological characteristics are one of the key
aspects of climate sensibility with respect to their influence on the climate through direct and
indirect effects on climate variables. The human impacts upon the land surface, land use
change, water management, urbanization and vegetation as well as impacts of climate change
on the land surface, plants and the water cycle therefore are key issues concerning the land

Outlook
- 132 -
surface that, however, must be considered more precisely in climate scenarios. This requires
land surface hydrological models that are able to capture large spatial domains with high
spatial resolution. A coupling with models from other scientific disciplines, such as economic
models for detecting land use change and investigating ecosystem services, could be a
promising future extension of coupling integrative processes.

References
- 133 -
11. REFERENCES
Bach, H.: Die Bestimmung hydrologischer und landwirtschaftlicher Oberflächenparameter aus
hyperspektralen Fernerkundungsdaten, Münchner Geographische Abhandlungen, München,
1995.
Baumgartner, A., and Liebscher, H.-J.: Lehrbuch der Hydrologie, 2. Auflage ed., Allgemeine
Hydrologie - quantitative Hydrologie, Gebrüder Borntraeger, Berlin und Stuttgart, 1996.
Berge, H. F. M. ten: Heat and water transfer in bare topsoil and the lower atmosphere, Pudoc,
Wageningen, 1990.
Bharati, L., Rodgers, C., Erdenberger, T., Plotnikova, M., Shumilov, S., Vlek, P., and Martin, N.:
Integration of economic and hydrologic models: Exploring conjunctive irrigation water use
strategies in the Volta Basin, Agricultural Water Management, 95, 925-936, Doi:
10.1016/j.agwat.2008.03.009, 2008.
Bridgman, H. A., and Oliver, J. E.: The Global Climate System. Patterns, Processes, and
Teleconnections, Cambridge University Press, New York, 331 pp., 2006.
Chen, F., and Dudhia, J.: Coupling an Advanced Land Surface–Hydrology Model with the Penn
State–NCAR MM5 Modeling System. Part I: Model Implementation and Sensitivity, Monthly
Weather Review, 129, 569-585, 2001.
Cloke, H. L., and Hannah, D. M.: Large-scale hydrology: advances in understanding processes,
dynamics and models from beyond river basin to global scale, Hydrological Processes, 25, 991-
995, 10.1002/hyp.8059, 2011.
Devonec, E., and Barros, A. P.: Exploring the transferability of a land-surface hydrology model,
Journal of Hydrology, 265, 258-282, Doi: 10.1016/s0022-1694(02)00111-7, 2002.
Dickinson, R. E., Henderson-Sellers, A., Rosenzweig, C., and Sellers, P. J.: Evapotranspiration models
with canopy resistance for use in climate models, a review, Agricultural and Forest
Meteorology, 54, 373-388, Doi: 10.1016/0168-1923(91)90014-h, 1991.
Dickinson, R. E.: Land processes in climate models, Remote Sensing of Environment, 51, 27-38, Doi:
10.1016/0034-4257(94)00062-r, 1995.
Dirmeyer, P. A.: A History and Review of the Global Soil Wetness Project (GSWP), Journal of
Hydrometeorology, 12, 729-749, 10.1175/jhm-d-10-05010.1, 2011.
Essery, R. L. H., Best, M. J., Betts, R. A., and Cox, P. M.: Explicit Representation of Subgrid
Heterogeneity in a GCM Land Surface Scheme, Journal of Hydrometeorology, 4, 530-543,
2003.

References
- 134 -
Famiglietti, J. S., and Wood, E. F.: Evapotranspiration and runoff from large land areas: Land surface
hydrology for atmospheric general circulation models, Surveys in Geophysics, 12, 179-204,
Doi: 10.1007/bf01903418, 1991.
Farquhar, G. D., Caemmerer, S. V., and Berry, J. A.: A biochemical-model of photosynthetic CO2
assimilation in leaves of c-3 species, Planta, 149, 78-90, 1980.
Fischer, E. M., Seneviratne, S. I., Lüthi, D., and Schär, C.: Contribution of land-atmosphere coupling
to recent European summer heat waves, Geophysical Research Letters, 34,
Doi: 10.1029/2006GL029068, 2007a.
Fischer, E. M., Seneviratne, S. I., Vidale, P. L., Lüthi, D., and Schär, C.: Soil Moisture–Atmosphere
Interactions during the 2003 European Summer Heat Wave, Journal of Climate, 20, 5081-5099,
2007b.
Garcia-Quijano, J. F., and Barros, A. P.: Incorporating canopy physiology into a hydrological model:
photosynthesis, dynamic respiration, and stomatal sensitivity, Ecological Modelling, 185, 29-49,
Doi: 10.1016/j.ecolmodel.2004.08.024, 2005.
Ge, J., Qi, J., Lofgren, B.M., Moore, N., Torbick, N. and Olson, J. M.: Impacts of land use/cover
classification accuracy on regional climate simulations, J. Geophys. Res., 112, D05107,
Doi: 10.1029/2006JD007404, 2007.
Hank, T. B.: A Biophysically Based Coupled Model Approach For the Assessment of Canopy
Processes Under Climate Change Conditions, Fakultät für Geowissenschaften, Ludwig-
Maximilians-Universität, München, 2008.
Hagemann, S., Botzet, M., and Machenhauer, B.: The summer drying problem over south-eastern
europe: sensitivity of the limited area model HIRHAM4 to improvements in physical
parameterization and resolution, Physics and Chemistry of the Earth, Part B: Hydrology, Oceans
and Atmosphere, 26, 391-396, Doi: 10.1016/s1464-1909(01)00024-7, 2001.
Henderson-Sellers, A., Dickinson, R. E., and Pitman, A. J.: Atmosphere-landsurface modelling,
Mathematical and Computer Modelling, 21, 5-10, Doi: 10.1016/0895-7177(95)00045-4, 1995.
Henderson-Sellers, A., McGuffie, K., and Pitman, A. J.: The Project for Intercomparison of Land-
surface Parametrization Schemes (PILPS): 1992 to 1995, Climate Dynamics, 12, 849-859,
1996.
Henderson-Sellers, A., Irannejad, P., and McGuffie, K.: Future desertification and climate change: The
need for land-surface system evaluation improvement, Global and Planetary Change, 64, 129-
138, Doi: 10.1016/j.gloplacha.2008.06.007, 2008.

References
- 135 -
IPCC: Climate Change 2001: The Scientific Basis. Contribution of Working Group I to the Third
Assessment Report of the Intergovernmental Panel on Climate Change, Cambridge University
Press, Cambridge, United Kingdom and New York, NY, USA, 881pp, 2001.
IPCC: Climate Change 2007: The Physical Science Basis. Contribution of Working Group I to the
Fourth Assessment Report of the Intergovernmental Panel on Climate Change Cambridge
University Press, Cambridge, United Kingdom and New York, NY, USA, 996pp, 2007a.
IPCC: Climate Change 2007: Impacts, Adaptation and Vulnerability. Contribution of Working Group
II to the Fourth Assessment Report of the Intergovernmental Panel on Climate Change,
Cambridge University Press, Cambridge, United Kingdom and New York, NY, USA., 976pp,
2007b.
Jacob, D., Bärring, L., Christensen, O. B., Christensen, J. H., Castro, M. d., Déqué, M., Giorgi, F.,
Hagemann, S., Hirschi, M., Jones, R., Kjellström, E., Lenderink, G., Rockel, B., Sánchez, E.,
Schär, C., Seneviratne, S. I., Somot, S., Ulden, A. v., and Hurk, B. v. d.: An inter-comparison of
regional climate models for Europe: model performance in present-day climate, Climatic
Change, 81, 31-52, Doi: 10.1007/s10584-006-9213-4, 2007.
Kabat, P., Claussen, M., Dirmeyer, P. A., Gash, J. H. C., de Guenni, L. B., Meybeck, M., Vörösmarty,
C. J., Hutjes, R. W. A., and Lütkemeier, S.: Vegetation, Water, Humans And The Climate: A
New Perspective On An Interactive System, Global Change - The IGBP Series, Springer, Berlin
Heidelberg New York, 566 pp., 2004.
Koch, F., Prasch, M., Bach, H., Mauser, W., Appel, F., and Weber, M.: How Will Hydroelectric
Power Generation Develop under Climate Change Scenarios? A Case Study in the Upper
Danube Basin, MDPI Energies, 4, 33, Doi: 10.3390/en4101508, 2011.
Koster, R. D., Dirmeyer, P. A., Guo, Z. C., Bonan, G., Chan, E., Cox, P., Gordon, C. T., Kanae, S.,
Kowalczyk, E., Lawrence, D., Liu, P., Lu, C. H., Malyshev, S., McAvaney, B., Mitchell, K.,
Mocko, D., Oki, T., Oleson, K., Pitman, A., Sud, Y. C., Taylor, C. M., Verseghy, D., Vasic, R.,
Xue, Y. K., Yamada, T., and Team, G.: Regions of strong coupling between soil moisture and
precipitation, Science, 305, 1138-1140, 2004.
Koster, R. D., Guo, Z., Dirmeyer, P. A., Bonan, G., Chan, E., Cox, P., Davies, H., Gordon, C. T.,
Kanae, S., Kowalczyk, E., Lawrence, D., Liu, P., Lu, C.-H., Malyshev, S., Mcaveney, B.,
Mitchell, K., Mocko, D., Oki, T., Oleson, K. W., Pitman, A., Sud, Y. C., Taylor, C. M.,
Verseghy, D., Vasic, R., Xue, Y., and Yamada, T.: GLACE: The Global Land–Atmosphere
Coupling Experiment. Part I: Overview, Journal of Hydrometeorology, 7, 590-610, 2006.
Kotlarski, S., Block, A., Böhm, U., Jacob, D., Keuler, K., Knoche, R., Rechid, D., and Walter, A.:
Regional climate model simulations as input for hydrological applications: Evaluation of
uncertainties, Advances in Geosciences, 5, 119-125, 2005.

References
- 136 -
Kuchment, L. S., Demidov, V. N., and Startseva, Z. P.: Coupled modeling of the hydrological and
carbon cycles in the soil-vegetation-atmosphere system, Journal of Hydrology, 323, 4-21, Doi:
10.1016/j.jhydrol.2005.08.011, 2006.
Kueppers, L. M., Snyder, M. A., Sloan, L. C., Cayan, D., Jin, J., Kanamaru, H., Kanamitsu, M.,
Miller, N. L., Tyree, M., Du, H., and Weare, B.: Seasonal temperature responses to land-use
change in the western United States, Global and Planetary Change, 60, 250-264, Doi:
10.1016/j.gloplacha.2007.03.005, 2008.
Kunstmann, H., and Stadler, C.: High resolution distributed atmospheric-hydrological modelling for
Alpine catchments, Journal of Hydrology, 314, 105-124, Doi: 10.1016/j.jhydrol.2005.03.033,
2005.
Kunstmann, H., Jung, G., Wagner, S., and Clottey, H.: Integration of atmospheric sciences and
hydrology for the development of decision support systems in sustainable water management,
Physics and Chemistry of the Earth, Parts A/B/C, 33, 165-174, Doi: 10.1016/j.pce.2007.04.010,
2008.
Laprise, R.: Regional climate modelling, Journal of Computational Physics, 227, 3641-3666, Doi:
10.1016/j.jcp.2006.10.024, 2008.
Loew, A.: Impact of surface heterogeneity on surface soil moisture retrievals from passive microwave
data at the regional scale: The Upper Danube case, Remote Sensing of Environment, 112, 231-
248, Doi: 10.1016/j.rse.2007.04.009, 2008.
Loew, A., Holmes, T., and Jeu, R. d.: The European heat wave 2003: early indicators from
multisensoral microwave remote sensing?, Journal of Geophysical Research, 114, Doi:
10.1029/2008JD010533, 2009.
Ludwig, R., and Mauser, W.: Modelling Catchment Hydrology within a GIS-based SVAT-model
framework, Hydrology and Earth System Sciences, 4, 239-249, 2000.
Ludwig, R., Mauser, W., Niemeyer, S., Colgan, A., Stolz, R., Escher-Vetter, H., Kuhn, M., Reichstein,
M., Tenhunen, J., Kraus, A., Ludwig, M., Barth, M., and Hennicker, R.: Web-based modelling
of energy, water and matter fluxes to support decision making in mesoscale catchments--the
integrative perspective of GLOWA-Danube, Physics and Chemistry of the Earth, Parts A/B/C,
28, 621-634, Doi: 10.1016/s1474-7065(03)00108-6, 2003a.
Ludwig, R., Probeck, M., and Mauser, W.: Mesoscale water balance modelling in the Upper Danube
watershed using sub-scale land cover information derived from NOAA-AVHRR imagery and
GIS-techniques, Physics and Chemistry of the Earth, Parts A/B/C, 28, 1351-1364, Doi:
10.1016/j.pce.2003.09.011, 2003b.

References
- 137 -
Marke, T.: Development and Application of a Model Interface To couple Land Surface Models with
Regional Climate Models For Climate Change Risk Assessment In the Upper Danube
Watershed, Fakultät für Geowissenschaften, Ludwig-Maximilians-Universität, München, 2008.
Marke, T., Mauser, W., Pfeiffer, A., and Zängl, G.: A pragmatic approach for the downscaling and
bias correction of regional climate simulations – evaluation in hydrological modeling, Geosci.
Model Dev. Discuss., 4, 45-63, Doi: 10.5194/gmdd-4-45-2011, 2011.
Marshall, J., and Plumb, R. A.: Atmosphere, ocean, and climate dynamics: an introductory text,
International Geophysics Series, edited by: Dmowska, R., Hartmann, D., and Rossby, H. T.,
Elsevier Academic Press, Amsterdam, 2008.
Mauser, W., and Schädlich, S.: Modelling the spatial distribution of evapotranspiration on different
scales using remote sensing data, Journal of Hydrology, 212-213, 250-267, Doi: 10.1016/s0022-
1694(98)00228-5, 1998.
Mauser, W., and Bach, H.: PROMET - Large scale distributed hydrological modelling to study the
impact of climate change on the water flows of mountain watersheds, Journal of Hydrology,
376, 362-377, Doi: 10.1016/j.jhydrol.2009.07.046, 2009.
Mc Gregor, J. L.: Regional Climate Modelling, Meterology and Atmospheric Physics, 63, 105-117,
1997.
Michalakes, J.: MM90: A scalable parallel implementation of the Penn State/NCAR Mesoscale Model
(MM5), Parallel Computing, 23, 2173-2186, 1997.
Molod, A., and Salmun, H.: A global assessment of the mosaic approach to modeling land surface
heterogeneity, Journal of Geophysical Research, 107, 4217, Doi: 10.1029/2001jd000588, 2002.
Monteith, J. L., and Unsworth, M. H.: Principles of Environmental Physics, Third Edition ed.,
Elsevier, New York, 2008.
Muerth, M., and Mauser, W.: Rigorous evaluation of a soil heat transfer model for mesoscale climate
change impact studies, Environmental Modelling & Software, 35, 149-162,
Doi: 10.1016/j.envsoft.2012.02.017, 2012.
Oke, T. R.: Boundary Layer Climates, Second Edition ed., Routledge, London and New York, 1987.
Pitman, A. J., and Henderson-Sellers, A.: Recent progress and results from the project for the
intercomparison of landsurface parameterization schemes, Journal of Hydrology, 212-213, 128-
135, Doi: 10.1016/s0022-1694(98)00206-6, 1998.
Pitman, A. J.: The evolution of, and revolution in, land surface schemes designed for climate models,
International Journal of Climatology, 23, 479-510, Doi: 10.1002/joc.893, 2003.

References
- 138 -
Pitman, A. J., de Noblet-Ducoudré, N., Cruz, F. T., Davin, E. L., Bonan, G. B., Brovkin, V., Claussen,
M., Delire, C., Ganzeveld, L., Gayler, V., van den Hurk, B. J. J. M., Lawrence, P. J., van der
Molen, M. K., Müller, C., Reick, C. H., Seneviratne, S. I., Strengers, B. J., and Voldoire, A.:
Uncertainties in climate responses to past land cover change: First results from the LUCID
intercomparison study, Geophys. Res. Lett., 36, L14814, Doi: 10.1029/2009gl039076, 2009.
Polcher, J., McAvaney, B., Viterbo, P., Gaertner, M. A., Hahmann, A., Mahfouf, J. F., Noilhan, J.,
Phillips, T., Pitman, A., Schlosser, C. A., Schulz, J. P., Timbal, B., Verseghy, D., and Xue, Y.:
A proposal for a general interface between land surface schemes and general circulation models,
Global and Planetary Change, 19, 261-276, Doi: 10.1016/s0921-8181(98)00052-6, 1998.
Prasch, M., Strasser, U., and Mauser, W.: Validation of a physically based snow model for the
simulation of the accumulation and ablation of snow (ESCIMO). In: Berchtesgaden National
Park Research Report Proceedings of the Alpine Snow Workshop, Munich, 2006,
Prasch, M., Marke, T., Strasser, U., and Mauser, W.: Large scale integrated hydrological modelling of
the impact of climate change on the water balance with DANUBIA, Advances in Science and
Research, 7, 9, Doi: 10.5194/asr-7-61-2011, 2011.
Quintanar, A. I., Mahmood, R., Motley, M. V., Yan, J., Loughrin, J., and Lovanh, N.: Simulation of
boundary layer trajectory dispersion sensitivity to soil moisture conditions: MM5 and Noah-
based investigation, Atmospheric Environment, 43, 3774-3785,
Doi: 10.1016/j.atmosenv.2009.04.005, 2009.
Schär, C., Vidale, P. L., Lüthi, D., Frei, C., Häberli, C., Liniger, M. A., and Appenzeller, C.: The role
of increasing temperature variability in European summer heatwaves, Nature, 427, 332-336,
2004.
Schulla, J., and Jasper, K.: Model description of WaSiM-ETH, Institute of Geography, ETH Zürich,
1999.
Seneviratne, S. I., Corti, T., Davin, E. L., Hirschi, M., Jaeger, E. B., Lehner, I., Orlowsky, B., and
Teuling, A. J.: Investigating soil moisture-climate interactions in a changing climate: A review,
Earth-Science Reviews, 99, 125-161, Doi: 10.1016/j.earscirev.2010.02.004, 2010.
Seth, A., Giorgi, F., and Dickinson, R. E.: Simulating fluxes from heterogeneous land surfaces -
explicit subgrid method employing the biosphere-atmosphere transfer scheme (BATS), Journal
of Geophysical Research-Atmospheres, 99, 18651-18667, 1994.
Stocker, T.: Einführung in die Klimamodellierung, Universität Bern, Bern, 2004.
Strasser, U., and Mauser, W.: Modelling the Spatial and Temporal Variations of the Water Balance for
the Weser Catchment 1965-1994, Journal of Hydrology, 254, 199-214, 2001.

References
- 139 -
Strasser, U., Franz, H., and Mauser, W.: Distributed modelling of snow processes in the
Berchtesgaden National Park (Germany), in: Berchtesgaden National Park Research Report
Proceedings of the Alpine Snow Workshop, Munich, 2007, 117–130, 2007.
Timbal, B., and Henderson-Sellers, A.: Intercomparisons of land-surface parameterizations coupled to
a limited area forecast model, Global and Planetary Change, 19, 247-260, Doi: 10.1016/s0921-
8181(98)00051-4, 1998.
van den Hurk, B., and Blyth, E. M.: WATCH/LoCo workshop report, GEWEX newsletter, 18, 3,
2008.
van den Hurk, B., Best, M., Dirmeyer, P., Pitman, A., Polcher, J., and Santanello, J.: Acceleration of
Land Surface Model Development over a Decade of Glass, Bulletin of the American
Meteorological Society, 92, 1593-1600, Doi: 10.1175/bams-d-11-00007.1, 2011.
Wagner, S., Kunstmann, H., Bárdossy, A., Conrad, C., and Colditz, R. R.: Water balance estimation of
a poorly gauged catchment in West Africa using dynamically downscaled meteorological fields
and remote sensing information, Physics and Chemistry of the Earth, Parts A/B/C, 34, 225-235,
Doi: 10.1016/j.pce.2008.04.002, 2009.
Weber, M., Braun, L., Mauser, W., and M., P.: Contribution of rain, snow- and icemelt in the Upper
Danube discharge today and in the future, Geografia Fisica e Dinamica Quaternaria, 33, 221-
230, 2010.
Wood, E. F., Lettenmaier, D. P., Liang, X., Lohmann, D., Boone, A., Chang, S., Chen, F., Dai, Y.,
Dickinson, R. E., Duan, Q., Ek, M., Gusev, Y. M., Habets, F., Irannejad, P., Koster, R., Mitchel,
K. E., Nasonova, O. N., Noilhan, J., Schaake, J., Schlosser, A., Shao, Y., Shmakin, A. B.,
Verseghy, D., Warrach, K., Wetzel, P., Xue, Y., Yang, Z.-L., and Zeng, Q.-c.: The Project for
Intercomparison of Land-surface Parameterization Schemes (PILPS) Phase 2(c) Red-Arkansas
River basin experiment:: 1. Experiment description and summary intercomparisons, Global and
Planetary Change, 19, 115-135, Doi: 10.1016/s0921-8181(98)00044-7, 1998.
Yang, Z.-L., Dickinson, R. E., Shuttleworth, W. J., and Shaikh, M.: Treatment of soil, vegetation and
snow in land surface models: a test of the Biosphere-Atmosphere Transfer Scheme with the
HAPEX-MOBILHY, ABRACOS and Russian data, Journal of Hydrology, 212-213, 109-127,
Doi: 10.1016/s0022-1694(98)00205-4, 1998.
Yu, Z.: Assessing the response of subgrid hydrologic processes to atmospheric forcing with a
hydrologic model system, Global and Planetary Change, 25, 1-17, Doi: 10.1016/s0921-
8181(00)00018-7, 2000.
Zampieri, M., Giorgi, F., Lionello, P., and Nikulin, G.: Regional climate change in the Northern
Adriatic, Physics and Chemistry of the Earth, Parts A/B/C, In Press, Corrected Proof,
Doi: 10.1016/j.pce.2010.02.003, 2011.

References
- 140 -
Zängl, G.: To what extent does increased model resolution improve simulated precipitation fields? A
case study of two north-Alpine heavy-rainfall events, Meteorologische Zeitschrift, 16, 571-580,
2007.

Appendix
- 141 -
12. APPENDIX

Appendix
- 142 -
12.1. Underlying Model Formulations
This Section gives an overview of the underlying model formulations, used in the models
NOAH and PROMET for describing the land surface evapotranspiration.
The LSMs applied in this study are the NOAH-LSM and PROMET. Both models describe the
pathways of water and energy at the land surface in a physically based manner.
Evapotranspiration is the sum of plant transpiration ( tE ) via soil, root, leaf and the stomata
and evaporation from the bare soil ( dirE ) and evaporation of water intercepted by the canopy
or other surfaces ( iE ) (Eq. A1). It is driven by the gradient of vapour pressure between the
surface and the surrounding air, passing the laminar boundary layer into the free atmosphere,
finally carried away by the turbulent mass transport of wind within the atmospheric boundary
layer expressed by the aerodynamic resistance. Thus, modelling evapotranspiration is a
complex issue which requires taking multiple aspects into account.
tidir EEEE ++= (A1)
12.1.1. NOAH
The NOAH-LSM was originally designed for the use in RCMs and is part of the MM5
modelling system. The NOAH-LSM is an updated version of the OSU-LSM. A complete
description of the NOAH and OSU-LSM is given in Chen and Dudhia (2001b, a) and
Mitchell (2005). The older version of MM5 documented in Grell et al. (1994), already
included a simple land surface model which does not take basic hydrological effects like snow
cover into account. The land use had a coarse resolution and soil moisture was defined as a
function of land use with seasonal values that cannot change during the simulation or respond
to precipitation. Vegetation evapotranspiration and runoff processes were not included (Chen
and Dudhia, 2001b).
The goal of the development of the NOAH-LSM was to implement an appropriate LSM for
weather prediction and more hydrological applications that reflect the major effects of
vegetation on the long-term evolution of surface evaporation and soil moisture and to get
along with relatively few parameters for short and long-time within continental-domain
applications. The NOAH-LSM is the result of the further developments of LSMs, designed
for atmosphere applications over the last years and scientific studies like the PILPS project.

Appendix
- 143 -
Potential evaporation is calculated within the NOAH-LSM using a Penman-based energy
balance approach (Mahrt and Ek, 1984) including a stability-dependent aerodynamic
resistance. It includes a 4-Layer soil model and a canopy resistance approach of Jaquemin and
Noilhan (1990) and Planton (1989). The prognostic variables are the moisture and
temperature of the soil layers, water stored on the canopy and snow stored on the ground.
Daily surface runoff is computed by the Simple Water Balance (SWB) model (Schaake et al.,
1996). The NOAH-LSM computes actual evapotranspiration separately for the following
components: Direct evaporation (Eq. A2), evaporation of intercepted water (Eq. A3) and
transpiration (Eq. A4).
( ) pfdir EE βσ−= 1 (A2)
nc
pfi SW
EE
= σ (A3)
−=
nc
cpft SW
BEE 1σ (A4)
Besides the green vegetation fraction ( fσ ), the NOAH-LSM is taking the soil water content
( β ), the intercepted canopy water content ( cW ), the maximum canopy capacity ( S ) as well
as a plant coefficient ( cB ) as a function of canopy resistance into account (Chen et al., 1996).
The green vegetation fraction ( fσ ) strongly influences simulation results since it acts as a
fundamental weighting coefficient of potential evaporation ( pE ) within the calculation of all
components of evapotranspiration. MM5 uses monthly values of green vegetation fraction
( fσ ) (also known as Fcover) for each grid cell at the model's spatial resolution in order to
control seasonal phenological development of vegetation as well as the degree of urbanization
and impervious surfaces for each grid cell. It is defined as a function of NDVI (Eq. A5).
0
0
NDVINDVINDVINDVI
f−∞
−=σ (A5)
Where 0NDVI and ∞NDVI are the lower and upper 5% of the global NDVI distribution for
the whole year and, therefore, describe the signals from bare soil and not-vegetated areas and
dense green vegetation respectively (Chen et al., 1996; Gutman and Ignatov, 1997). Since the

Appendix
- 144 -
∞NDVI is likely to reach saturation, this approach tends to overestimate fσ (Richter and
Timmermans, 2009). Uncertainties of NDVI due to soil moisture, soil type and colour, dead
vegetation and shadow-effects within the plant stand as well as atmospheric effects such as
cloud contamination and angular effects of the radiometer field-of-view (FOV) affect
satellite-based measurements of the vegetation fraction, making it an unreliable quantity
(Bach and Verhoef, 2003; Gutman and Ignatov, 1997; Richter and Timmermans, 2009).
Further, the use of the 5th percentile of NDVI for calculating the vegetation fraction assumes
a dense vegetation for all pixels in the model domain (Gutman and Ignatov, 1997). The green
vegetation fraction concerning this study was gathered by a 5-year time series of NDVI (Chen
et al., 1996; Gutman and Ignatov, 1997) from AVHRR (US Geological Survey (USGS)), with
a spatial resolution of 10 minutes (18.5 km) and global coverage. It was further generally
reduced by 30 percent since it proved to be too high for our simulation area and this reduction
helped to improve the simulation of summertime near surface temperature substantially
(Pfeiffer and Zängl, 2009).
The canopy treatment represented by the plant coefficient ( cB ) within tE is a function of the
canopy resistance ( cR ), where hC is the surface exchange coefficient for heat and moisture;
∆ depends on the slope of the saturation specific humidity curve; rR is a function of surface
air temperature, surface pressure, and hC (Eq. A6) (Chen and Dudhia, 2001b),
rhc
rc
RCR
RB∆
++
∆+
=1
1 (A6)
The canopy resistance ( cR ) is formulated as follows in the NOAH-LSM (Eq. A7):
4321
min
FFFFLAIR
R cc = (A7)
, where 4F is the water-stress function with respect to soil moisture while 1F , 2F and 3F
represent the effects of solar radiation, vapour pressure deficit and air temperature on the
canopy resistance. The values of all functions range between 0 and 1; LAI is the leaf area
index and mincR is the minimum canopy resistance which is set to 40 s m-1 for the class
'dryland, cropland and pasture' (Jacquemin and Noilhan, 1990; Noilhan and Planton, 1989).

Appendix
- 145 -
The maximum value of the canopy resistance is set to 5000 s m-1 for all plants. The LAI does
not change with season and for all land use classes of the NOAH-LSM has a value of 4.0. The
temperature-stress function is the same for all plants, the optimum transpiration temperature
being parameterized with 298 K (Chen and Dudhia, 2001b). The dynamic function of water-
stress ( 4F ) is a factor for the availability of soil moisture, however neglecting plant specific
parameters (Eq. A8).
( )( )( )∑
= +Θ−ΘΘ−Θ
=3
1 214
i zzwref
ziwi
ddd
F (A8)
It is a function of volumetric soil moisture content (Θ ) and the soil specific parameters of
field capacity ( refΘ ) and the wilting point ( wΘ ) for the upper three soil layers integrated in
the rooted zone with its individual thickness ( zid ) (Chen and Dudhia, 2001b), parameterized
as percentage values of soil moisture.
12.1.2. PROMET
PROMET was developed for hydrological river catchment studies on the local and regional
scale. It describes processes at the land surface physically based with high detail and
complexity using several sub-modules (Figure A4). It conserves mass and energy and closes
the energy balance of the land surface. Consequently, it is not calibrated. It was applied in this
study with an hourly temporal and 1 km spatial resolution. An extensive model description
can be found in Mauser and Bach (2009) and Muerth and Mauser (2012).
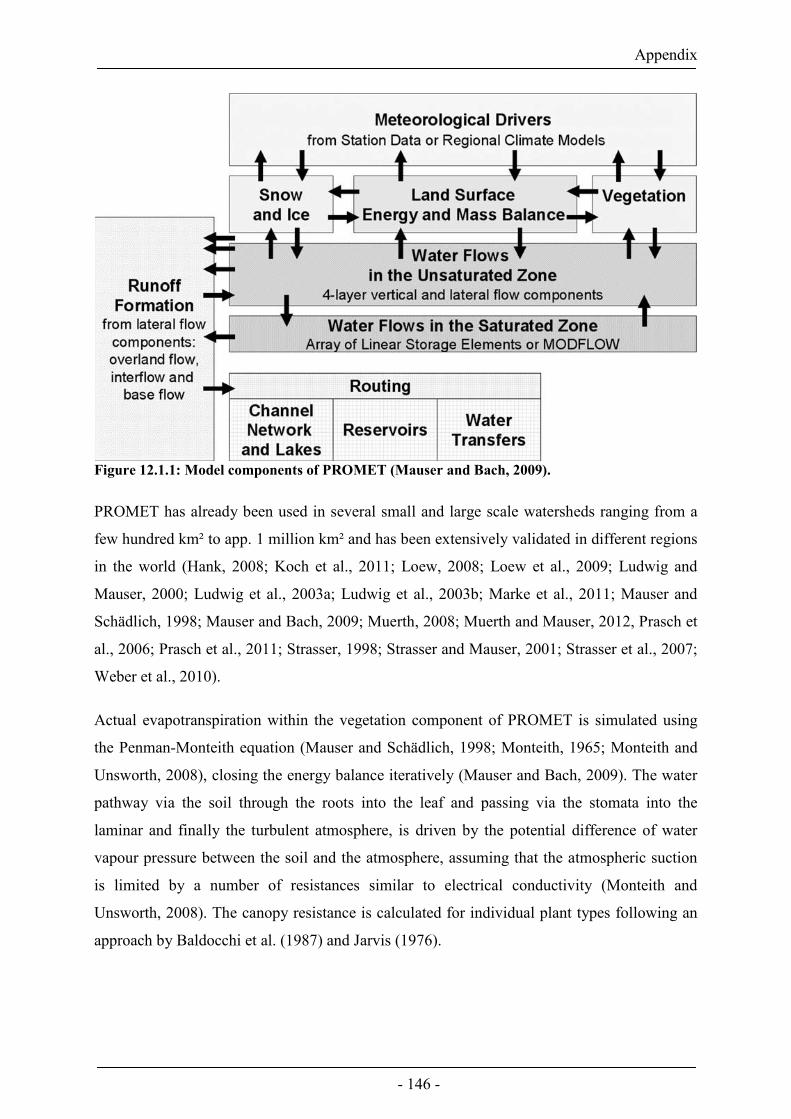
Appendix
- 146 -
Figure 12.1.1: Model components of PROMET (Mauser and Bach, 2009).
PROMET has already been used in several small and large scale watersheds ranging from a
few hundred km² to app. 1 million km² and has been extensively validated in different regions
in the world (Hank, 2008; Koch et al., 2011; Loew, 2008; Loew et al., 2009; Ludwig and
Mauser, 2000; Ludwig et al., 2003a; Ludwig et al., 2003b; Marke et al., 2011; Mauser and
Schädlich, 1998; Mauser and Bach, 2009; Muerth, 2008; Muerth and Mauser, 2012, Prasch et
al., 2006; Prasch et al., 2011; Strasser, 1998; Strasser and Mauser, 2001; Strasser et al., 2007;
Weber et al., 2010).
Actual evapotranspiration within the vegetation component of PROMET is simulated using
the Penman-Monteith equation (Mauser and Schädlich, 1998; Monteith, 1965; Monteith and
Unsworth, 2008), closing the energy balance iteratively (Mauser and Bach, 2009). The water
pathway via the soil through the roots into the leaf and passing via the stomata into the
laminar and finally the turbulent atmosphere, is driven by the potential difference of water
vapour pressure between the soil and the atmosphere, assuming that the atmospheric suction
is limited by a number of resistances similar to electrical conductivity (Monteith and
Unsworth, 2008). The canopy resistance is calculated for individual plant types following an
approach by Baldocchi et al. (1987) and Jarvis (1976).

Appendix
- 147 -
The stomata resistance ( cR ) is a function of radiation ( PAR ), temperature ( 1F ), ambient
humidity ( 2F ), CO2 in the atmosphere and the leaf water potential ( 3F ) (Jarvis and Morison,
1981) (Eq. A9).
321
min )(FFF
PARRR c
c = (A9)
PAR is calculated according to the fractions of sunlit and shaded leaf area and the PAR flux
densities on the respective leaves (Baldocchi et al., 1987). The relation of temperature,
humidity deficit and leaf water potential to the stomata resistance is described with 1F , 2F
and 3F following Jarvis (1976), returning values between 0 and 1. An increase in temperature
beyond a plant specific optimum results in an increase of stomata resistance since the plant's
stomata will close in order to protect itself against dehydration, which results in a decrease of
transpiration. The conductivity is reduced to the minimum stomata conductivity, which is the
conductivity of the cuticle.
The inhibition of transpiration due to water stress (Eq. A10) is quantified in PROMET in
terms of leaf water potential, which depends in a plant-specific way to the soil water potential
( sΨ ) within the rooted soil layers (= root water uptake reduction function).
ΨΨ +Ψ−+Ψ= baRF rs *))(( 03 (A10)
The stomatal conductance shows no dependence on leaf water potential below a plant specific
threshold ( 0Ψ ) of suction and an approximately linear plant specific decrease beyond
(Baldocchi et al., 1987), and takes the resistance of the transition from the soil to the root ( rR )
into account (Biscoe et al., 1976). The parameters rR , 0Ψ , Ψa and Ψb are parameterized for
each plant type in PROMET where Ψa describes the plant specific slope and Ψb the plant
specific intercept of the function. The soil water potential ( sΨ ) as in PROMET is a function
of soil type and soil water content following an approach of Brooks and Corey (1964) (Eq.
A11).
ms S /1
1−⋅Ψ=Ψ (A11)

Appendix
- 148 -
, where 1Ψ is the air entry tension (bubbling pressure head), S is the saturation of the
effective pore space with water and m is the pore-size distribution index, which are all
parameters available within the soil parameterization of PROMET.

Appendix
- 149 -
12.1.3. References
Bach, H., and Verhoef, W.: Sensitivity studies on the effect of surface soil moisture on canopy
reflectance using the radiative transfer model GeoSAIL, Igarss 2003: Ieee International
Geoscience and Remote Sensing Symposium, Vols I - Vii, Proceedings, 1679-1681, 2003.
Baldocchi, D. D., Hicks, B. B., and Camara, P.: A canopy stomatal resistance model for gaseous
deposition to vegetated surfaces, Atmospheric Environment (1967), 21, 91-101, Doi:
10.1016/0004-6981(87)90274-5, 1987.
Biscoe, P. V., Cohen, Y., and Wallace, J. S.: Daily and Seasonal Changes of Water Potential in
Cereals, Philosophical Transactions of the Royal Society of London. Series B, Biological
Sciences, 273, 565-580, 1976.
Brooks, R. H., and Corey, A. T.: Hydraulic properties of porous media, Colorado State University,
1964.
Chen, F., Mitchell, K., Schaake, J., Xue, Y., Pan, H.-L., Koren, V., Duan, Q. Y., Ek, M., and Betts, A.:
Modeling of land surface evaporation by four schemes and comparison with FIFE observations,
Journal of Geophysical Research, 101(D3), 7251–7268, 10.1029/95JD02165, 1996.
Chen, F., and Dudhia, J.: Coupling an Advanced Land Surface–Hydrology Model with the Penn
State–NCAR MM5 Modeling System. Part II: Preliminary Model Validation, Monthly Weather
Review, 129, 587-604, 2001a.
Chen, F., and Dudhia, J.: Coupling an Advanced Land Surface–Hydrology Model with the Penn
State–NCAR MM5 Modeling System. Part I: Model Implementation and Sensitivity, Monthly
Weather Review, 129, 569-585, 2001b.
Gutman, G., and Ignatov, A.: Satellite-derived green vegetation fraction for the use in numerical
weather prediction models, Advances in Space Research, 19, 477-480, 10.1016/s0273-
1177(97)00058-6, 1997.
Hank, T. B.: A Biophysically Based Coupled Model Approach For the Assessment of Canopy
Processes Under Climate Change Conditions, Fakultät für Geowissenschaften, Ludwig-
Maximilians-Universität, München, 2008.
Jacquemin, B., and Noilhan, J.: Sensitivity study and validation of a land surface parameterization
using the HAPEX-MOBILHY data set, Boundary-Layer Meteorology, 52, 93-134,
10.1007/bf00123180, 1990.
Jarvis, P. G.: The Interpretation of the Variations in Leaf Water Potential and Stomatal Conductance
Found in Canopies in the Field, Philosophical Transactions of the Royal Society of London.
Series B, Biological Sciences, 273, 593-610, 1976.

Appendix
- 150 -
Koch, F., Prasch, M., Bach, H., Mauser, W., Appel, F., and Weber, M.: How Will Hydroelectric
Power Generation Develop under Climate Change Scenarios? A Case Study in the Upper
Danube Basin, MDPI Energies, 4, 33, 10.3390/en4101508, 2011.
Loew, A.: Impact of surface heterogeneity on surface soil moisture retrievals from passive microwave
data at the regional scale: The Upper Danube case, Remote Sensing of Environment, 112, 231-
248, DOI: 10.1016/j.rse.2007.04.009, 2008.
Loew, A., Holmes, T., and Jeu, R. d.: The European heat wave 2003: early indicators from
multisensoral microwave remote sensing?, Journal of Geophysical Research, 114,
10.1029/2008JD010533. , 2009.
Ludwig, R., and Mauser, W.: Modelling Catchment Hydrology within a GIS-based SVAT-model
framework, Hydrology and Earth System Sciences, 4, 239-249, 2000.
Ludwig, R., Probeck, M., and Mauser, W.: Mesoscale water balance modelling in the Upper Danube
watershed using sub-scale land cover information derived from NOAA-AVHRR imagery and
GIS-techniques, Physics and Chemistry of the Earth, Parts A/B/C, 28, 1351-1364, DOI:
10.1016/j.pce.2003.09.011, 2003a.
Ludwig, R., Taschner, S., and Mauser, W.: Modelling floods in the Ammer watershed – Experiences,
Limitations and Challenges from a Coupled Meteo-Hydrological Model Approach, Hydrology
and Earth System Sciences 7, 833-847, 2003b.
Mahrt, L., and Ek, M.: The Influence of Atmosperic Stability on Potential Evaporation, Journal of
Climate and Applied Meteorology, 23, 222-234, 1984.
Marke, T., Mauser, W., Pfeiffer, A., and Zängl, G.: A pragmatic approach for the downscaling and
bias correction of regional climate simulations – evaluation in hydrological modeling, Geosci.
Model Dev. Discuss., 4, 45-63, 10.5194/gmdd-4-45-2011, 2011.
Mauser, W., and Schädlich, S.: Modelling the spatial distribution of evapotranspiration on different
scales using remote sensing data, Journal of Hydrology, 212-213, 250-267, Doi: 10.1016/s0022-
1694(98)00228-5, 1998.
Mauser, W., and Bach, H.: PROMET - Large scale distributed hydrological modelling to study the
impact of climate change on the water flows of mountain watersheds, Journal of Hydrology,
376, 362-377, DOI: 10.1016/j.jhydrol.2009.07.046, 2009.
Mitchell, K.: The Community Noah Land-Surface Model (LSM), 2005.
Monteith, J. L.: Evaporation and the environment, Symposia of the Society for Experimental Biology,
19, 205-234, 1965.
Monteith, J. L., and Unsworth, M. H.: Principles of Environmental Physics, Third Edition ed.,
Elsevier, New York, 2008.

Appendix
- 151 -
Muerth, M. J.: A Soil Temperature and Energy Balance Model for Integrated Assessment of Global
Change Impacts at the regional scale, Fakultät für Geowissenschaften, Ludwig-Maximilians-
Universität, München, 2008.
Muerth, M., and Mauser, W.: Rigorous evaluation of a soil heat transfer model for mesoscale climate
change impact studies, Environmental Modelling & Software, 35, 149-162,
Doi: 10.1016/j.envsoft.2012.02.017, 2012.
Noilhan, J., and Planton, S.: A Simple Parameterization of Land Surface Processes for Meteorological
Models, Monthly Weather Review, 117, 14, 1989.
Pfeiffer, A., and Zängl, G.: Validation of climate-mode MM5-simulations for the European Alpine
Region, Theoretical Applied Climatology, DOI 10.1007/s00704-009-0199-5, 2009.
Prasch, M., Strasser, U., and Mauser, W.: Validation of a physically based snow model for the
simulation of the accumulation and ablation of snow (ESCIMO). in: Berchtesgaden National
Park Research Report Proceedings of the Alpine Snow Workshop, Munich, 2006,
Prasch, M., Marke, T., Strasser, U., and Mauser, W.: Large scale integrated hydrological modelling of
the impact of climate change on the water balance with DANUBIA, Advances in Science and
Research, 7, 9, 10.5194/asr-7-61-2011, 2011.
Richter, K., and Timmermans, W. J.: Physically based retrieval of crop characteristics for improved
water use estimates, Hydrology and Earth System Sciences, 13, 663-674, 2009.
Schaake, J. C., Koren, V. I., Duan, Q.-Y., Mitchell, K., and Chen, F.: Simple water balance model for
estimating runoff at different spatial and temporal scales, Journal of Geophysical Research, 101,
7461-7475, 10.1029/95jd02892, 1996.
Strasser, U., and Mauser, W.: Modelling the Spatial and Temporal Variations of the Water Balance for
the Weser Catchment 1965-1994, Journal of Hydrology, 254, 199-214, 2001.
Strasser, U., Franz, H., and Mauser, W.: Distributed modelling of snow processes in the
Berchtesgaden National Park (Germany), in: Berchtesgaden National Park Research Report
Proceedings of the Alpine Snow Workshop, Munich, 2007, 117–130,
Weber, M., Braun, L., Mauser, W., and M., P.: Contribution of rain, snow- and icemelt in the Upper
Danube discharge today and in the future, Geografia Fisica e Dinamica Quaternaria, 33, 221-
230, 2010.

Curriculum Vitae
- 152 -
12.2. Curriculum Vitae
Personal
Name: Florian Zabel
Date of Birth: 17.03.1981
Place of Birth: Munich, Germany
Degree: Dipl. Geogr. (phys.)
Email: [email protected]
Scientific career
Since 2010 Collaboration in the Global Assessment of Land Use dynamics on
Greenhouse Gas Emissions and Ecosystem Services (GLUES) project.
2008-2010 Collaboration in the GLOWA-Danube project (Globaler Wandel des
Wasserkreislaufs).
2006-2008 Student assistant at the National Committee on Global Change Research (NKGCF).
School and Education
2008-2012 Ph.D. studies at the Department of Geography, LMU Munich.
2007 Academic degree of graduate physical geographer.
Diploma thesis: "Vergleichende Analyse skalierter meteorologischer
Eingabedaten der regionalen Klimamodelle CLM, MM5 und REMO für
die hydrologische Modellierung im Einzugsgebiet der Oberen Donau".
2001-2007 University studies of physical Geography at the LMU, Munich.
Subsidiary subjects: Computer Science, Remote Sensing, Chemistry.
1991-2000 High-School at the Viscardi-Gymnasium Fürstenfeldbruck

- 153 -