Improved land–atmosphere relations through distributed footprint sampling in a subtropical...
6
Improved land–atmosphere relations through distributed footprint sampling in a subtropical scrubland during the North American monsoon Enrique R. Vivoni a, * , Christopher J. Watts b , Julio C. Rodrı ´guez b , Jaime Garatuza-Paya ´n c , Luis A. Me ´ ndez-Barroso a , Juan A. Sa ´ iz-Herna ´ ndez b a Arizona State University, Tempe, AZ, USA b Universidad de Sonora, Hermosillo, Sonora, Mexico c Instituto Tecnolo ´gico de Sonora, Ciudad Obrego ´n, Sonora, Mexico article info Article history: Received 29 January 2009 Received in revised form 15 September 2009 Accepted 23 September 2009 Available online 21 October 2009 Keywords: Ecohydrology Eddy covariance Energy balance Semiarid Soil moisture Sonoran desert abstract The relation between land surface states and fluxes is fundamental for quantifying the ecohydrological controls on the North American monsoon. In this study, we utilize distributed sampling around an eddy covariance tower in Sonora, Me ´xico, to evaluate the impact of footprint variations in soil moisture (q) and temperature (T s ) on surface flux partitioning. Results indicate that spatial variability is important to capture when q or T s have a high spatial mean and control the dominant surface flux, either latent (lE) or sensible (H) heat. As a result, we found that q and T s measurements at the tower may not be representative of the footprint-averaged states, with larger discrepancies for T s due to the radiative heterogeneity. Using the spatially-averaged land surface conditions in the footprint moder- ately improves the relations with the surface fluxes as quantified by the Bowen ratio (B) and the evaporative fraction (EF). To our knowledge, this is a first attempt to address the scale discrepancy between aggregated flux measurements from an eddy covariance tower and the effective land surface states within the footprint through distributed sampling. Improvements in land–atmosphere relations are more significant for footprint conditions exhibiting high spatial variability or a large bias as compared to the tower site measurements. Ó 2009 Elsevier Ltd. All rights reserved. 1. Introduction Land surface conditions or states are hypothesized to control the partitioning of sensible (H) and latent heat (lE) fluxes over a range of different climate settings (e.g., Alfieri et al., 2007; Blanken et al., 2001; Williams and Albertson, 2004). For example, soil moisture (q) exerts control on the amount of evapotranspiration (ET) in the North American monsoon (NAM) region as quantified using the eddy covariance (EC) technique (Vivoni et al., 2008a). Typically, EC measurements aggregate turbulent fluxes within a time-variable footprint around the tower and thus represent spatially-averaged exchanges between the land and atmosphere (e.g., Detto et al., 2006; Li et al., 2008). In theory, aggregated turbulent fluxes derived from the EC technique should be compared to the ‘effective’ or spatially-averaged land surface conditions within the EC footprint. In practice, however, a small number of land surface measure- ments, such as soil moisture, are collected at the tower site (e.g., Running et al., 1999; Watts et al., 2007; Williams and Albertson, 2004), ignoring the land surface states within the EC footprint but further from the tower. To our knowledge, the scale discrepancy between the spatially-averaged (or aggregated) EC fluxes in the tower footprint and the point-scale land surface states near the tower has not been previously addressed. One approach to remedy this situation is through distributed footprint sampling of land surface conditions around an EC tower. Water-limited ecosystems are potentially more vulnerable to the mismatch between tower flux and land surface measurements due to their heterogeneous vegetation composition. In the NAM region, for example, ecosystems are composed of mixtures of different plant types and bare soil (Caso et al., 2007; Trejo and Dirzo, 2002; Vivoni et al., 2007). As a result, quantification of land surface states should account for the complex assemblage of vegetated and bare patches. In another heterogeneous landscape, Detto et al. (2006) described an approach for characterizing conditions around an EC tower through high-resolution (2.8 m) thermal imagery. Surface temperature (T s ) data were then used with a footprint model (Hsieh et al., 2000) to decompose the aggregated EC flux and estimate the * Corresponding author at: School of Earth and Space Exploration and School of Sustainable Engineering and the Built Environment, Arizona State University, Bateman Physical Sciences Center, F-Wing, Room 650-A, Tempe, AZ 85287, USA. Tel.: þ1 480 965 5228; fax: þ1 480 965 8102. E-mail address: [email protected] (E.R. Vivoni). Contents lists available at ScienceDirect Journal of Arid Environments journal homepage: www.elsevier.com/locate/jaridenv 0140-1963/$ – see front matter Ó 2009 Elsevier Ltd. All rights reserved. doi:10.1016/j.jaridenv.2009.09.031 Journal of Arid Environments 74 (2010) 579–584
Transcript of Improved land–atmosphere relations through distributed footprint sampling in a subtropical...
lable at ScienceDirect
Journal of Arid Environments 74 (2010) 579–584
Contents lists avai
Journal of Arid Environments
journal homepage: www.elsevier .com/locate/ jar idenv
Improved land–atmosphere relations through distributed footprint samplingin a subtropical scrubland during the North American monsoon
Enrique R. Vivoni a,*, Christopher J. Watts b, Julio C. Rodrıguez b, Jaime Garatuza-Payan c,Luis A. Mendez-Barroso a, Juan A. Saiz-Hernandez b
a Arizona State University, Tempe, AZ, USAb Universidad de Sonora, Hermosillo, Sonora, Mexicoc Instituto Tecnologico de Sonora, Ciudad Obregon, Sonora, Mexico
a r t i c l e i n f o
Article history:Received 29 January 2009Received in revised form15 September 2009Accepted 23 September 2009Available online 21 October 2009
Keywords:EcohydrologyEddy covarianceEnergy balanceSemiaridSoil moistureSonoran desert
* Corresponding author at: School of Earth and SpaSustainable Engineering and the Built EnvironmenBateman Physical Sciences Center, F-Wing, Room 65Tel.: þ1 480 965 5228; fax: þ1 480 965 8102.
E-mail address: [email protected] (E.R. Vivoni).
0140-1963/$ – see front matter � 2009 Elsevier Ltd.doi:10.1016/j.jaridenv.2009.09.031
a b s t r a c t
The relation between land surface states and fluxes is fundamental for quantifying the ecohydrologicalcontrols on the North American monsoon. In this study, we utilize distributed sampling around aneddy covariance tower in Sonora, Mexico, to evaluate the impact of footprint variations in soil moisture(q) and temperature (Ts) on surface flux partitioning. Results indicate that spatial variability isimportant to capture when q or Ts have a high spatial mean and control the dominant surface flux,either latent (lE) or sensible (H) heat. As a result, we found that q and Ts measurements at the towermay not be representative of the footprint-averaged states, with larger discrepancies for Ts due to theradiative heterogeneity. Using the spatially-averaged land surface conditions in the footprint moder-ately improves the relations with the surface fluxes as quantified by the Bowen ratio (B) and theevaporative fraction (EF). To our knowledge, this is a first attempt to address the scale discrepancybetween aggregated flux measurements from an eddy covariance tower and the effective land surfacestates within the footprint through distributed sampling. Improvements in land–atmosphere relationsare more significant for footprint conditions exhibiting high spatial variability or a large bias ascompared to the tower site measurements.
� 2009 Elsevier Ltd. All rights reserved.
1. Introduction
Land surface conditions or states are hypothesized to control thepartitioning of sensible (H) and latent heat (lE) fluxes over a rangeof different climate settings (e.g., Alfieri et al., 2007; Blanken et al.,2001; Williams and Albertson, 2004). For example, soil moisture (q)exerts control on the amount of evapotranspiration (ET) in theNorth American monsoon (NAM) region as quantified using theeddy covariance (EC) technique (Vivoni et al., 2008a). Typically, ECmeasurements aggregate turbulent fluxes within a time-variablefootprint around the tower and thus represent spatially-averagedexchanges between the land and atmosphere (e.g., Detto et al.,2006; Li et al., 2008). In theory, aggregated turbulent fluxes derivedfrom the EC technique should be compared to the ‘effective’ orspatially-averaged land surface conditions within the EC footprint.
ce Exploration and School oft, Arizona State University,0-A, Tempe, AZ 85287, USA.
All rights reserved.
In practice, however, a small number of land surface measure-ments, such as soil moisture, are collected at the tower site (e.g.,Running et al., 1999; Watts et al., 2007; Williams and Albertson,2004), ignoring the land surface states within the EC footprint butfurther from the tower. To our knowledge, the scale discrepancybetween the spatially-averaged (or aggregated) EC fluxes in thetower footprint and the point-scale land surface states near thetower has not been previously addressed. One approach to remedythis situation is through distributed footprint sampling of landsurface conditions around an EC tower.
Water-limited ecosystems are potentially more vulnerable to themismatch between tower flux and land surface measurements dueto their heterogeneous vegetation composition. In the NAM region,for example, ecosystems are composed of mixtures of differentplant types and bare soil (Caso et al., 2007; Trejo and Dirzo, 2002;Vivoni et al., 2007). As a result, quantification of land surface statesshould account for the complex assemblage of vegetated and barepatches. In another heterogeneous landscape, Detto et al. (2006)described an approach for characterizing conditions around an ECtower through high-resolution (2.8 m) thermal imagery. Surfacetemperature (Ts) data were then used with a footprint model (Hsiehet al., 2000) to decompose the aggregated EC flux and estimate the
E.R. Vivoni et al. / Journal of Arid Environments 74 (2010) 579–584580
relation between ET and q for individual patches. In this study, weexplore an alternative approach accounting for the spatial patternsof land surface states (Ts and q) through distributed measurementsin the EC tower footprint.
The relation between aggregated fluxes and effective states isimportant since the footprint area for spatial averaging becomesmore comparable to the resolutions of numerical model forecasts andremote sensing observations. As a result, this relation could be used totest prognostic models of land–atmosphere interactions (Gutzleret al., 2005) or to derive additional variables from remote sensingdata (Timmermans et al., 2007). In addition, simple relationsbetween surface fluxes and states at the footprint-scale may be usefulfor minimalistic models (Juang et al., 2007) of land–atmosphereinteractions. Given the dramatic vegetation seasonality during theNAM (Watts et al., 2007), this relation should vary with ecosystemcomposition and its dynamics. Here, we demonstrate that footprint-averaged surface conditions improve the relation with aggregated ECfluxes in a subtropical scrubland experiencing seasonal greeningduring the North American monsoon. This finding is potentiallyuseful for the design of land–atmosphere studies in a range of otherclimate settings and landscape conditions.
2. Materials and methods
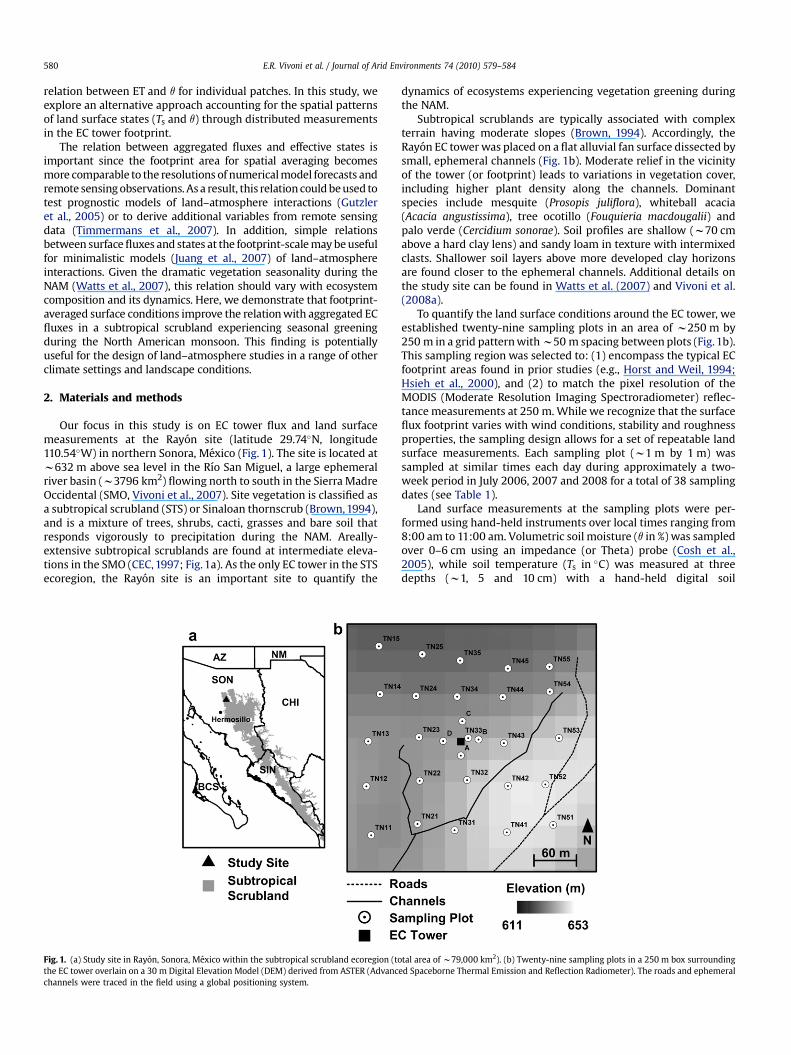
Our focus in this study is on EC tower flux and land surfacemeasurements at the Rayon site (latitude 29.74�N, longitude110.54�W) in northern Sonora, Mexico (Fig. 1). The site is located atw632 m above sea level in the Rıo San Miguel, a large ephemeralriver basin (w3796 km2) flowing north to south in the Sierra MadreOccidental (SMO, Vivoni et al., 2007). Site vegetation is classified asa subtropical scrubland (STS) or Sinaloan thornscrub (Brown, 1994),and is a mixture of trees, shrubs, cacti, grasses and bare soil thatresponds vigorously to precipitation during the NAM. Areally-extensive subtropical scrublands are found at intermediate eleva-tions in the SMO (CEC, 1997; Fig. 1a). As the only EC tower in the STSecoregion, the Rayon site is an important site to quantify the
Fig. 1. (a) Study site in Rayon, Sonora, Mexico within the subtropical scrubland ecoregion (tothe EC tower overlain on a 30 m Digital Elevation Model (DEM) derived from ASTER (Advancchannels were traced in the field using a global positioning system.
dynamics of ecosystems experiencing vegetation greening duringthe NAM.
Subtropical scrublands are typically associated with complexterrain having moderate slopes (Brown, 1994). Accordingly, theRayon EC tower was placed on a flat alluvial fan surface dissected bysmall, ephemeral channels (Fig. 1b). Moderate relief in the vicinityof the tower (or footprint) leads to variations in vegetation cover,including higher plant density along the channels. Dominantspecies include mesquite (Prosopis juliflora), whiteball acacia(Acacia angustissima), tree ocotillo (Fouquieria macdougalii) andpalo verde (Cercidium sonorae). Soil profiles are shallow (w70 cmabove a hard clay lens) and sandy loam in texture with intermixedclasts. Shallower soil layers above more developed clay horizonsare found closer to the ephemeral channels. Additional details onthe study site can be found in Watts et al. (2007) and Vivoni et al.(2008a).
To quantify the land surface conditions around the EC tower, weestablished twenty-nine sampling plots in an area of w250 m by250 m in a grid pattern with w50 m spacing between plots (Fig. 1b).This sampling region was selected to: (1) encompass the typical ECfootprint areas found in prior studies (e.g., Horst and Weil, 1994;Hsieh et al., 2000), and (2) to match the pixel resolution of theMODIS (Moderate Resolution Imaging Spectroradiometer) reflec-tance measurements at 250 m. While we recognize that the surfaceflux footprint varies with wind conditions, stability and roughnessproperties, the sampling design allows for a set of repeatable landsurface measurements. Each sampling plot (w1 m by 1 m) wassampled at similar times each day during approximately a two-week period in July 2006, 2007 and 2008 for a total of 38 samplingdates (see Table 1).
Land surface measurements at the sampling plots were per-formed using hand-held instruments over local times ranging from8:00 am to 11:00 am. Volumetric soil moisture (q in %) was sampledover 0–6 cm using an impedance (or Theta) probe (Cosh et al.,2005), while soil temperature (Ts in �C) was measured at threedepths (w1, 5 and 10 cm) with a hand-held digital soil
tal area of w79,000 km2). (b) Twenty-nine sampling plots in a 250 m box surroundinged Spaceborne Thermal Emission and Reflection Radiometer). The roads and ephemeral
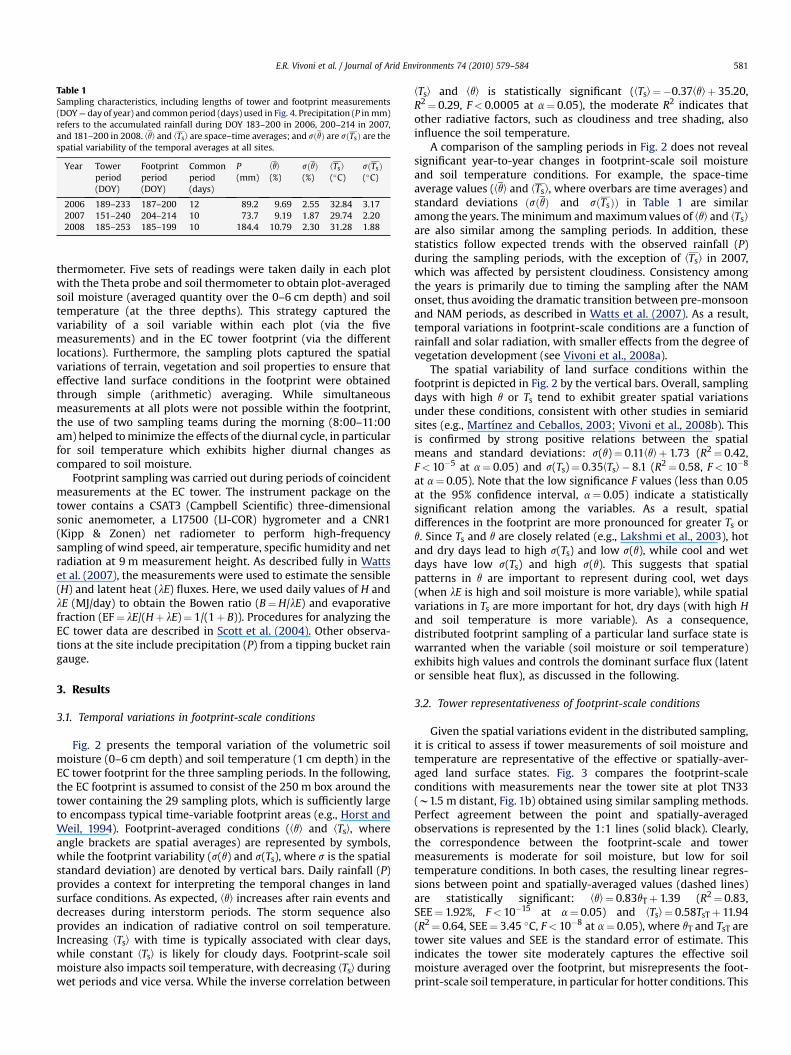
Table 1Sampling characteristics, including lengths of tower and footprint measurements(DOY¼ day of year) and common period (days) used in Fig. 4. Precipitation (P in mm)refers to the accumulated rainfall during DOY 183–200 in 2006, 200–214 in 2007,and 181–200 in 2008. CqD and CTsD are space–time averages; and sðqÞ are sðTsÞ are thespatial variability of the temporal averages at all sites.
Year Towerperiod(DOY)
Footprintperiod(DOY)
Commonperiod(days)
P(mm)
CqD
(%)sðqÞ(%)
CTsD
(�C)sðTsÞ(�C)
2006 189–233 187–200 12 89.2 9.69 2.55 32.84 3.172007 151–240 204–214 10 73.7 9.19 1.87 29.74 2.202008 185–253 185–199 10 184.4 10.79 2.30 31.28 1.88
E.R. Vivoni et al. / Journal of Arid Environments 74 (2010) 579–584 581
thermometer. Five sets of readings were taken daily in each plotwith the Theta probe and soil thermometer to obtain plot-averagedsoil moisture (averaged quantity over the 0–6 cm depth) and soiltemperature (at the three depths). This strategy captured thevariability of a soil variable within each plot (via the fivemeasurements) and in the EC tower footprint (via the differentlocations). Furthermore, the sampling plots captured the spatialvariations of terrain, vegetation and soil properties to ensure thateffective land surface conditions in the footprint were obtainedthrough simple (arithmetic) averaging. While simultaneousmeasurements at all plots were not possible within the footprint,the use of two sampling teams during the morning (8:00–11:00am) helped to minimize the effects of the diurnal cycle, in particularfor soil temperature which exhibits higher diurnal changes ascompared to soil moisture.
Footprint sampling was carried out during periods of coincidentmeasurements at the EC tower. The instrument package on thetower contains a CSAT3 (Campbell Scientific) three-dimensionalsonic anemometer, a L17500 (LI-COR) hygrometer and a CNR1(Kipp & Zonen) net radiometer to perform high-frequencysampling of wind speed, air temperature, specific humidity and netradiation at 9 m measurement height. As described fully in Wattset al. (2007), the measurements were used to estimate the sensible(H) and latent heat (lE) fluxes. Here, we used daily values of H andlE (MJ/day) to obtain the Bowen ratio (B¼H/lE) and evaporativefraction (EF¼ lE/(Hþ lE)¼ 1/(1þ B)). Procedures for analyzing theEC tower data are described in Scott et al. (2004). Other observa-tions at the site include precipitation (P) from a tipping bucket raingauge.
3. Results
3.1. Temporal variations in footprint-scale conditions
Fig. 2 presents the temporal variation of the volumetric soilmoisture (0–6 cm depth) and soil temperature (1 cm depth) in theEC tower footprint for the three sampling periods. In the following,the EC footprint is assumed to consist of the 250 m box around thetower containing the 29 sampling plots, which is sufficiently largeto encompass typical time-variable footprint areas (e.g., Horst andWeil, 1994). Footprint-averaged conditions (CqD and CTsD, whereangle brackets are spatial averages) are represented by symbols,while the footprint variability (s(q) and s(Ts), where s is the spatialstandard deviation) are denoted by vertical bars. Daily rainfall (P)provides a context for interpreting the temporal changes in landsurface conditions. As expected, CqD increases after rain events anddecreases during interstorm periods. The storm sequence alsoprovides an indication of radiative control on soil temperature.Increasing CTsD with time is typically associated with clear days,while constant CTsD is likely for cloudy days. Footprint-scale soilmoisture also impacts soil temperature, with decreasing CTsD duringwet periods and vice versa. While the inverse correlation between
CTsD and CqD is statistically significant (CTsD¼�0.37CqDþ 35.20,R2¼ 0.29, F< 0.0005 at a¼ 0.05), the moderate R2 indicates thatother radiative factors, such as cloudiness and tree shading, alsoinfluence the soil temperature.
A comparison of the sampling periods in Fig. 2 does not revealsignificant year-to-year changes in footprint-scale soil moistureand soil temperature conditions. For example, the space-timeaverage values (CqD and CTsD, where overbars are time averages) andstandard deviations ðsðqÞ and sðTsÞÞ in Table 1 are similaramong the years. The minimum and maximum values of CqD and CTsD
are also similar among the sampling periods. In addition, thesestatistics follow expected trends with the observed rainfall (P)during the sampling periods, with the exception of CTsD in 2007,which was affected by persistent cloudiness. Consistency amongthe years is primarily due to timing the sampling after the NAMonset, thus avoiding the dramatic transition between pre-monsoonand NAM periods, as described in Watts et al. (2007). As a result,temporal variations in footprint-scale conditions are a function ofrainfall and solar radiation, with smaller effects from the degree ofvegetation development (see Vivoni et al., 2008a).
The spatial variability of land surface conditions within thefootprint is depicted in Fig. 2 by the vertical bars. Overall, samplingdays with high q or Ts tend to exhibit greater spatial variationsunder these conditions, consistent with other studies in semiaridsites (e.g., Martınez and Ceballos, 2003; Vivoni et al., 2008b). Thisis confirmed by strong positive relations between the spatialmeans and standard deviations: s(q)¼ 0.11CqDþ 1.73 (R2¼ 0.42,F< 10�5 at a¼ 0.05) and s(Ts)¼ 0.35CTsD� 8.1 (R2¼ 0.58, F< 10�8
at a¼ 0.05). Note that the low significance F values (less than 0.05at the 95% confidence interval, a¼ 0.05) indicate a statisticallysignificant relation among the variables. As a result, spatialdifferences in the footprint are more pronounced for greater Ts orq. Since Ts and q are closely related (e.g., Lakshmi et al., 2003), hotand dry days lead to high s(Ts) and low s(q), while cool and wetdays have low s(Ts) and high s(q). This suggests that spatialpatterns in q are important to represent during cool, wet days(when lE is high and soil moisture is more variable), while spatialvariations in Ts are more important for hot, dry days (with high Hand soil temperature is more variable). As a consequence,distributed footprint sampling of a particular land surface state iswarranted when the variable (soil moisture or soil temperature)exhibits high values and controls the dominant surface flux (latentor sensible heat flux), as discussed in the following.
3.2. Tower representativeness of footprint-scale conditions
Given the spatial variations evident in the distributed sampling,it is critical to assess if tower measurements of soil moisture andtemperature are representative of the effective or spatially-aver-aged land surface states. Fig. 3 compares the footprint-scaleconditions with measurements near the tower site at plot TN33(w1.5 m distant, Fig. 1b) obtained using similar sampling methods.Perfect agreement between the point and spatially-averagedobservations is represented by the 1:1 lines (solid black). Clearly,the correspondence between the footprint-scale and towermeasurements is moderate for soil moisture, but low for soiltemperature conditions. In both cases, the resulting linear regres-sions between point and spatially-averaged values (dashed lines)are statistically significant: CqD¼ 0.83qTþ 1.39 (R2¼ 0.83,SEE¼ 1.92%, F< 10�15 at a¼ 0.05) and CTsD¼ 0.58TsTþ 11.94(R2¼ 0.64, SEE¼ 3.45 �C, F< 10�8 at a¼ 0.05), where qT and TsT aretower site values and SEE is the standard error of estimate. Thisindicates the tower site moderately captures the effective soilmoisture averaged over the footprint, but misrepresents the foot-print-scale soil temperature, in particular for hotter conditions. This
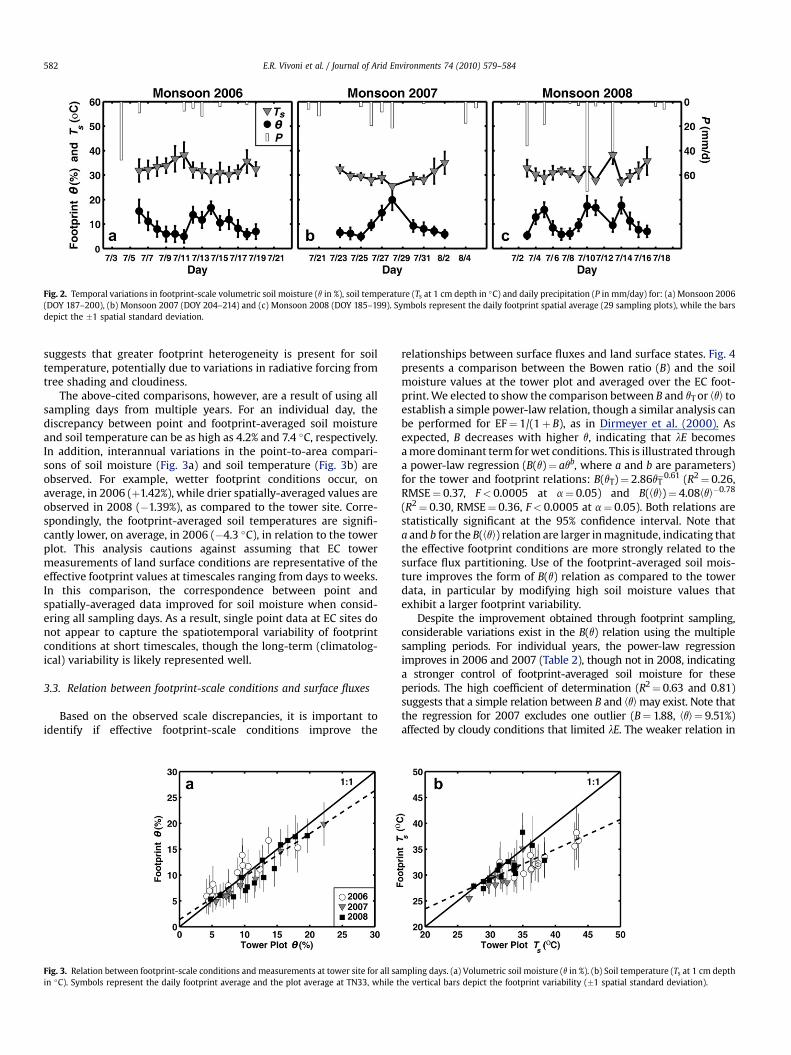
Fig. 2. Temporal variations in footprint-scale volumetric soil moisture (q in %), soil temperature (Ts at 1 cm depth in �C) and daily precipitation (P in mm/day) for: (a) Monsoon 2006(DOY 187–200), (b) Monsoon 2007 (DOY 204–214) and (c) Monsoon 2008 (DOY 185–199). Symbols represent the daily footprint spatial average (29 sampling plots), while the barsdepict the �1 spatial standard deviation.
E.R. Vivoni et al. / Journal of Arid Environments 74 (2010) 579–584582
suggests that greater footprint heterogeneity is present for soiltemperature, potentially due to variations in radiative forcing fromtree shading and cloudiness.
The above-cited comparisons, however, are a result of using allsampling days from multiple years. For an individual day, thediscrepancy between point and footprint-averaged soil moistureand soil temperature can be as high as 4.2% and 7.4 �C, respectively.In addition, interannual variations in the point-to-area compari-sons of soil moisture (Fig. 3a) and soil temperature (Fig. 3b) areobserved. For example, wetter footprint conditions occur, onaverage, in 2006 (þ1.42%), while drier spatially-averaged values areobserved in 2008 (�1.39%), as compared to the tower site. Corre-spondingly, the footprint-averaged soil temperatures are signifi-cantly lower, on average, in 2006 (�4.3 �C), in relation to the towerplot. This analysis cautions against assuming that EC towermeasurements of land surface conditions are representative of theeffective footprint values at timescales ranging from days to weeks.In this comparison, the correspondence between point andspatially-averaged data improved for soil moisture when consid-ering all sampling days. As a result, single point data at EC sites donot appear to capture the spatiotemporal variability of footprintconditions at short timescales, though the long-term (climatolog-ical) variability is likely represented well.
3.3. Relation between footprint-scale conditions and surface fluxes
Based on the observed scale discrepancies, it is important toidentify if effective footprint-scale conditions improve the
Fig. 3. Relation between footprint-scale conditions and measurements at tower site for all sain �C). Symbols represent the daily footprint average and the plot average at TN33, while t
relationships between surface fluxes and land surface states. Fig. 4presents a comparison between the Bowen ratio (B) and the soilmoisture values at the tower plot and averaged over the EC foot-print. We elected to show the comparison between B and qT or CqD toestablish a simple power-law relation, though a similar analysis canbe performed for EF¼ 1/(1þ B), as in Dirmeyer et al. (2000). Asexpected, B decreases with higher q, indicating that lE becomesa more dominant term for wet conditions. This is illustrated througha power-law regression (B(q)¼ aqb, where a and b are parameters)for the tower and footprint relations: B(qT)¼ 2.86qT
�0.61 (R2¼ 0.26,RMSE¼ 0.37, F< 0.0005 at a¼ 0.05) and B(CqD)¼ 4.08CqD
�0.78
(R2¼ 0.30, RMSE¼ 0.36, F< 0.0005 at a¼ 0.05). Both relations arestatistically significant at the 95% confidence interval. Note thata and b for the B(CqD) relation are larger in magnitude, indicating thatthe effective footprint conditions are more strongly related to thesurface flux partitioning. Use of the footprint-averaged soil mois-ture improves the form of B(q) relation as compared to the towerdata, in particular by modifying high soil moisture values thatexhibit a larger footprint variability.
Despite the improvement obtained through footprint sampling,considerable variations exist in the B(q) relation using the multiplesampling periods. For individual years, the power-law regressionimproves in 2006 and 2007 (Table 2), though not in 2008, indicatinga stronger control of footprint-averaged soil moisture for theseperiods. The high coefficient of determination (R2¼ 0.63 and 0.81)suggests that a simple relation between B and CqD may exist. Note thatthe regression for 2007 excludes one outlier (B¼ 1.88, CqD¼ 9.51%)affected by cloudy conditions that limited lE. The weaker relation in
mpling days. (a) Volumetric soil moisture (q in %). (b) Soil temperature (Ts at 1 cm depthhe vertical bars depict the footprint variability (�1 spatial standard deviation).
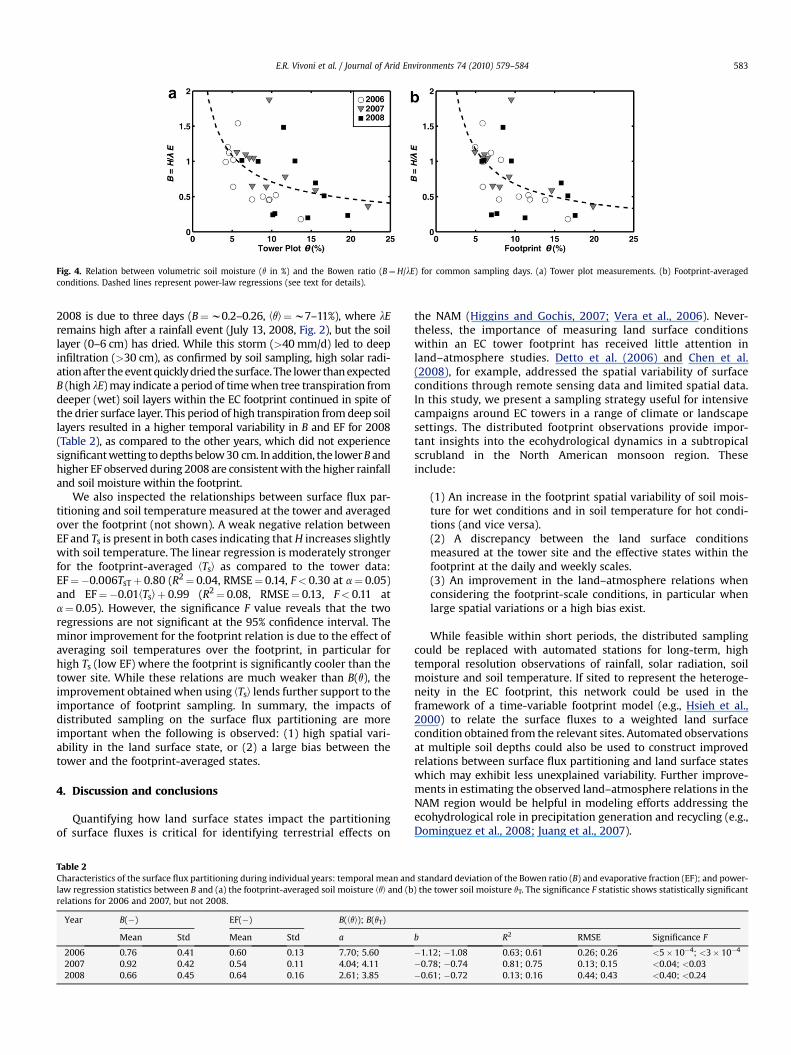
Fig. 4. Relation between volumetric soil moisture (q in %) and the Bowen ratio (B¼H/lE) for common sampling days. (a) Tower plot measurements. (b) Footprint-averagedconditions. Dashed lines represent power-law regressions (see text for details).
E.R. Vivoni et al. / Journal of Arid Environments 74 (2010) 579–584 583
2008 is due to three days (B¼w0.2–0.26, CqD¼w7–11%), where lEremains high after a rainfall event (July 13, 2008, Fig. 2), but the soillayer (0–6 cm) has dried. While this storm (>40 mm/d) led to deepinfiltration (>30 cm), as confirmed by soil sampling, high solar radi-ation after the event quickly dried the surface. The lower than expectedB (high lE) may indicate a period of time when tree transpiration fromdeeper (wet) soil layers within the EC footprint continued in spite ofthe drier surface layer. This period of high transpiration from deep soillayers resulted in a higher temporal variability in B and EF for 2008(Table 2), as compared to the other years, which did not experiencesignificant wetting to depths below 30 cm. In addition, the lower B andhigher EF observed during 2008 are consistent with the higher rainfalland soil moisture within the footprint.
We also inspected the relationships between surface flux par-titioning and soil temperature measured at the tower and averagedover the footprint (not shown). A weak negative relation betweenEF and Ts is present in both cases indicating that H increases slightlywith soil temperature. The linear regression is moderately strongerfor the footprint-averaged CTsD as compared to the tower data:EF¼�0.006TsTþ 0.80 (R2¼ 0.04, RMSE¼ 0.14, F< 0.30 at a¼ 0.05)and EF¼�0.01CTsDþ 0.99 (R2¼ 0.08, RMSE¼ 0.13, F< 0.11 ata¼ 0.05). However, the significance F value reveals that the tworegressions are not significant at the 95% confidence interval. Theminor improvement for the footprint relation is due to the effect ofaveraging soil temperatures over the footprint, in particular forhigh Ts (low EF) where the footprint is significantly cooler than thetower site. While these relations are much weaker than B(q), theimprovement obtained when using CTsD lends further support to theimportance of footprint sampling. In summary, the impacts ofdistributed sampling on the surface flux partitioning are moreimportant when the following is observed: (1) high spatial vari-ability in the land surface state, or (2) a large bias between thetower and the footprint-averaged states.
4. Discussion and conclusions
Quantifying how land surface states impact the partitioningof surface fluxes is critical for identifying terrestrial effects on
Table 2Characteristics of the surface flux partitioning during individual years: temporal mean andlaw regression statistics between B and (a) the footprint-averaged soil moisture CqD and (brelations for 2006 and 2007, but not 2008.
Year B(�) EF(�) B(CqD); B(qT)
Mean Std Mean Std a
2006 0.76 0.41 0.60 0.13 7.70; 5.602007 0.92 0.42 0.54 0.11 4.04; 4.112008 0.66 0.45 0.64 0.16 2.61; 3.85
the NAM (Higgins and Gochis, 2007; Vera et al., 2006). Never-theless, the importance of measuring land surface conditionswithin an EC tower footprint has received little attention inland–atmosphere studies. Detto et al. (2006) and Chen et al.(2008), for example, addressed the spatial variability of surfaceconditions through remote sensing data and limited spatial data.In this study, we present a sampling strategy useful for intensivecampaigns around EC towers in a range of climate or landscapesettings. The distributed footprint observations provide impor-tant insights into the ecohydrological dynamics in a subtropicalscrubland in the North American monsoon region. Theseinclude:
(1) An increase in the footprint spatial variability of soil mois-ture for wet conditions and in soil temperature for hot condi-tions (and vice versa).(2) A discrepancy between the land surface conditionsmeasured at the tower site and the effective states within thefootprint at the daily and weekly scales.(3) An improvement in the land–atmosphere relations whenconsidering the footprint-scale conditions, in particular whenlarge spatial variations or a high bias exist.
While feasible within short periods, the distributed samplingcould be replaced with automated stations for long-term, hightemporal resolution observations of rainfall, solar radiation, soilmoisture and soil temperature. If sited to represent the heteroge-neity in the EC footprint, this network could be used in theframework of a time-variable footprint model (e.g., Hsieh et al.,2000) to relate the surface fluxes to a weighted land surfacecondition obtained from the relevant sites. Automated observationsat multiple soil depths could also be used to construct improvedrelations between surface flux partitioning and land surface stateswhich may exhibit less unexplained variability. Further improve-ments in estimating the observed land–atmosphere relations in theNAM region would be helpful in modeling efforts addressing theecohydrological role in precipitation generation and recycling (e.g.,Dominguez et al., 2008; Juang et al., 2007).
standard deviation of the Bowen ratio (B) and evaporative fraction (EF); and power-) the tower soil moisture qT. The significance F statistic shows statistically significant
b R2 RMSE Significance F
�1.12; �1.08 0.63; 0.61 0.26; 0.26 <5� 10�4; <3� 10�4
�0.78; �0.74 0.81; 0.75 0.13; 0.15 <0.04; <0.03�0.61; �0.72 0.13; 0.16 0.44; 0.43 <0.40; <0.24
E.R. Vivoni et al. / Journal of Arid Environments 74 (2010) 579–584584
Acknowledgements
We acknowledge funding from the NOAA Climate ProgramOffice (GC07-019), the NSF IRES Program (OISE 0553852) and theU.S. Fulbright Program. We also thank the numerous undergraduateand graduate students and researchers from the U.S. and Mexicowho participated in the distributed field sampling: T. Meixner, J.Zarate, J.B.J. Harrison, J. Kleissl, E.A. Yepez, M. Gurrola, A. Robles, G.Mascaro, M. Gebremichael, S. Yatheendradas, S. Archer, R. O’Keefe,A. Martinez, W. DeFoor, J. Craft, K. Bandy, T. Dotson, F. Di Benedetto,L. Liuzzo, L. Martini, L. Alvarez, L. De La Cruz, S. Padilla, S. Naif, J.Luna, N. Rodriguez, D. Martinez, J. Navarro, J. Cuevas, M. Molina, J.Gutierrez, J. Velazquez, E. Valenzuela, M. Valenzuela, C. Galaviz, T.Tarin, J. Esquer, E. Perez, B. Rivera, J. Benitez, K. Gutierrez, M. Varelaand J. Arellano.
References
Alfieri, J.G., Blanken, P.D., Yates, D.N., Steffen, K., 2007. Variability in the environ-mental factors driving evapotranspiration from a grazed rangeland duringsevere drought conditions. Journal of Hydrometeorology 2, 207–220.
Blanken, P.D., Black, T.A., Neumann, H.H., den Hartog, G., Yang, P.C., Nesic, Z., Lee, X.,2001. The seasonal water and energy exchange above and within a boreal aspenforest. Journal of Hydrology 245, 118–136.
Brown, D.E., 1994. Biotic Communities Southwestern United States and North-western Mexico. University of Utah Press, Salt Lake City, UT.
Caso, M., Gonzalez-Abraham, C., Ezcurra, E., 2007. Divergent ecological effects ofoceanographic anomalies on terrestrial ecosystems of the Mexican Pacific coast.Proceedings of the National Academy of Sciences 104, 10530–10535.
CEC, 1997. Ecological Regions of North America. Commission for EnvironmentalCooperation, Montreal, Canada.
Chen, X., Rubin, Y., Ma, S., Baldocchi, D., 2008. Observations and stochastic modelingof soil moisture control on evapotranspiration in a California oak savanna.Water Resources Research 44, W08409. doi:10.1029/2007WR006646.
Cosh, M.H., Jackson, T.J., Bindlish, R., Famiglietti, J.S., Ryu, D., 2005. Calibration of animpedance probe for estimation of surface soil water content over large regions.Journal of Hydrology 311, 49–58.
Detto, M., Montaldo, N., Albertson, J.D., Mancini, M., Katul, G., 2006. Soil moistureand vegetation controls on evapotranspiration in a heterogeneous Mediterra-nean ecosystem on Sardinia, Italy. Water Resources Research 42, W08419.doi:10.1029/2005WR004693.
Dirmeyer, P.A., Zeng, F.J., Ducharne, A., Morrill, J.C., Koster, R.D., 2000. The sensitivityof surface fluxes to soil water content in three land surface schemes. Journal ofHydrometeorology 1, 121–134.
Dominguez, F., Kumar, P., Vivoni, E.R., 2008. Precipitation recycling variability andecoclimatological stability – a study using NARR data. Part II: North Americanmonsoon region. Journal of Climate 21, 5187–5203.
Gutzler, D.S., Kim, H.K., Higgins, R.W., Juang, H., Kanamitsu, M., Mitchell, K., Mo, K.,Pegion, P., Ritchie, E., Schemm, J.K., Schubert, S., Song, Y., Yang, R., 2005. TheNorth American monsoon model assessment project. Bulletin of the AmericanMeteorological Society 86, 1423–1429.
Higgins, W., Gochis, D., 2007. Synthesis of results from the North AmericanMonsoon Experiment (NAME) process study. Journal of Climate 20, 1601–1607.
Horst, T.W., Weil, J.C., 1994. How far is far enough?: the fetch requirements formicrometeorological measurement of surface fluxes. Journal of Atmosphericand Oceanic Technology 11, 1018–1025.
Hsieh, C.I., Katul, G., Chi, T., 2000. An approximate analytical model for footprintestimation of scalar fluxes in thermally stratified atmospheric flows. Advancesin Water Resources 23, 765–772.
Juang, J.Y., Katul, G.G., Porporato, A., Stoy, P.C., Siquiera, M.S., Detto, M., Kim, H.S.,Oren, R., 2007. Eco-hydrologic controls on summertime convective rainfalltriggers. Global Change Biology 13, 887–896.
Lakshmi, V., Jackson, T.J., Zehrfuhs, D., 2003. Soil moisture–temperature relation-ships: results from two field experiments. Hydrological Processes 17,3041–3057.
Li, F., Kustas, W.P., Anderson, M.C., Prueger, J.H., Scott, R.L., 2008. Effect of remotesensing spatial resolution on interpreting tower-based flux observations.Remote Sensing of Environment 112, 337–349.
Martınez, J., Ceballos, A., 2003. Temporal stability of soil moisture in a large-field experiment in Spain. Soil Science Society of America Journal 67,1647–1656.
Running, S.W., Baldocchi, D.D., Turner, D.P., Gower, S.T., Bakwin, P.S., Hibbard, K.A.,1999. A global terrestrial monitoring network integrating tower fluxes, flasksampling, ecosystem modeling and EOS satellite data. Remote Sensing ofEnvironment 70, 108–127.
Scott, R.L., Edwards, E.A., Shuttleworth, W.J., Huxman, T.E., Watts, C.J.,Goodrich, D.C., 2004. Interannual and seasonal variations of fluxes of water andcarbon dioxide from a riparian woodland ecosystem. Agricultural and ForestMeteorology 122, 65–84.
Timmermans, W.J., Kustas, K.J., Anderson, M.C., French, A.N., 2007. An intercom-parison of the surface energy balance algorithm for land (SEBAL) and the two-source energy balance (TSEB) modeling schemes. Remote Sensing of Environ-ment 108, 369–384.
Trejo, I., Dirzo, R., 2002. Floristic diversity of Mexican seasonally dry tropical forests.Biodiversity and Conservation 11, 2063–2084.
Vera, C., Higgins, W., Amador, J., Ambrizzi, T., Garreaud, R., Gochis, D., Gutzler, D.,Lettenmaier, D., Marengo, J., Mechoso, J., Nogues-Paegle, J., Silva Dias, P.L.,Zhang, C., 2006. Toward a unified view of the American monsoon systems.Journal of Climate 19, 4977–5000.
Vivoni, E.R., Gutierrez-Jurado, H.A., Aragon, C.A., Mendez-Barroso, L.A.,Rinehart, A.J., Wyckoff, R.L., Rodrıguez, J.C., Watts, C.J., Bolten, J.D., Lakshmi, V.,Jackson, T.J., 2007. Variation of hydrometeorological conditions along a topo-graphic transect in northern Mexico during the North American monsoon.Journal of Climate 20, 1792–1809.
Vivoni, E.R., Moreno, H.A., Mascaro, G., Rodriguez, J.C., Watts, C.J., Garatuza-Payan, J.,Scott, R.L., 2008a. Observed relation between evapotranspiration and soilmoisture in the North American monsoon region. Geophysical Research Letters35, L22403. doi:10.1029/2008GL036001.
Vivoni, E.R., Gebremichael, M., Watts, C.J., Bindlish, R., Jackson, T.J., 2008b.Comparison of ground-based and remotely-sensed surface soil moisture esti-mates over complex terrain during SMEX04. Remote Sensing of Environment112, 314–325.
Watts, C.J., Scott, R.L., Garatuza-Payan, J., Rodrıguez, J.C., Prueger, J.H., Kustas, W.P.,Douglas, M., 2007. Changes in vegetation condition and surface fluxes duringNAME 2004. Journal of Climate 20, 1810–1820.
Williams, C.A., Albertson, J.D., 2004. Soil moisture controls on canopy-scale waterand carbon fluxes in an African savanna. Water Resources Research 40,W090302. doi:10.1029/2004WR003208.