ECOLOGICAL FOOTPRINT
90
ECOLOGICAL FOOTPRINT of the Russian Regions
-
Upload
khangminh22 -
Category
Documents
-
view
0 -
download
0
Transcript of ECOLOGICAL FOOTPRINT
ECOLOGICAL FOOTPRINT of the Russian Regions

Moscow 2014
ECOLOGICAL FOOTPRINTof the Russian Regions

Authors:Evgeny Shvarts, Pavel Boev, Alexey Knizhnikov, Alexander Voropaev, Agatha Postnova, Scott Mattoon, Mathis Wackernagel, Golnar Zokai, Katsunori Iha, Michael Borucke, Elias Lazarus, Jason Ortego, Geoff Trotter.
Ecological Footprint of the Russian Regions / edited by Pavel A. Boev. — WWF-Russia. — Moscow, 2014. 88 pages
ISBN 978-5-9901107-0-0
The report jointly designed by WWF-Russia and the Global Footprint Network contains data on the Ecological Footprint and Biocapacity of the Russian Federation. The report makes it possible to assess the sustainability of regional development and provides authorities and business leader with a toolkit to evaluate the effectiveness of sustainable development. This study also examines the possibilities of using biocapacity and Ecological Footprint indicators to assess the investment attractiveness of regions and sectors of the Russian economy. The project is the first attempt to apply Footprint methodology at the regional level in Russia.
This report has been developed with financial support from Teplocom Holding.
Any full or partial reproduction of this work is subject to authorisation from the owners (WWF-Russia).
Distributed free of charge.
© Text WWF-Russia 2014. All right reserved.
Cover photograph: © Global Warming Images / WWF-Canon.
УДК 332.1(470):502/504(042.3)
ББК 20.1
Э40
Э40
УДК 332.1(470):502/504(042.3)
ББК 20.1

Ecological Footprint of the Russian Regions | 3
CONTENTsForeword . . . . . . . . . . . . . . . . . . . . . . . . . . . . . . . . . . . . . . . . . . . . . . . . . . . . . . . . . . . . . . . . . . . 4Opening remarks . . . . . . . . . . . . . . . . . . . . . . . . . . . . . . . . . . . . . . . . . . . . . . . . . . . . . . . . . . . . . 6Introduction . . . . . . . . . . . . . . . . . . . . . . . . . . . . . . . . . . . . . . . . . . . . . . . . . . . . . . . . . . . . . . . . . . . . . . 7Key findings . . . . . . . . . . . . . . . . . . . . . . . . . . . . . . . . . . . . . . . . . . . . . . . . . . . . . . . . . . 8The Ecological Footprint and biocapacity . . . . . . . . . . . . . . . . . . . . . . . . . . . . . . . . . . . . . . . . . . . . 10
Prelude . . . . . . . . . . . . . . . . . . . . . . . . . . . . . . . . . . . . . . . . . . . . . . . . . . . . . . . . . . . . . . . . . . . . . 12
Section 1. The Global Context . . . . . . . . . . . . . . . . . . . . . . . . . . . . . . . . . . . . . . . . . . . . . . . . . . . . . . 141.1. Biocapacity and Ecological Footprint: global supply and demand dynamics . . . . . . 161.2. National biocapacity reserves and deficits . . . . . . . . . . . . . . . . . . . . . . . . . . . 181.3. World biocapacity and Ecological Footprint . . . . . . . . . . . . . . . . . . . . . . . . . . . . 201.4. The Nations with the Largest Biocapacity Reserve . . . . . . . . . . . . . . . . . . . . . . . . . . . . . 22Biocapacity and Biodiversity . . . . . . . . . . . . . . . . . . . . . . . . . . . . . . . . . . . . . . . . . . . . . 24
Section 2. What is Russia’s situation? . . . . . . . . . . . . . . . . . . . . . . . . . . . . . . . . . . . . . . . . . . . . 302.1. USSR / Russian Federation: Biocapacity and Footprint time trends . . . . . . . . . . . . . 322.2. Footprint of consumption vs. Footprint of production . . . . . . . . . . . . . . . . . . . . . . . . . 342.3. World HDI — Footprint . . . . . . . . . . . . . . . . . . . . . . . . . . . . . . . . . . . . . . . . . . . . . . . 362.4. Ecological Footprint and International Trade . . . . . . . . . . . . . . . . . . . . . . . . . . . . . . . . 38Gas flaring reduction: Opportunities for increased resource efficiency in Russia . . . . . . . . . . . . . . . . . . . . . . . . . . . . . . . . 42
Section 3. Russia’s Federal Subjects: Where do they stand? . . . . . . . . . . . . . . . . . . . . . . . . . . . . . . 463.1. Biocapacity deficit and reserve in the Federal Subjects . . . . . . . . . . . . . . . . . . . . . . . . 483.2. Ecological Footprint and Types of Consumption . . . . . . . . . . . . . . . . . . . . . . . . . . . . . 523.3. Adjusted HDI and Ecological Footprint in the Russian Regions . . . . . . . . . . . . . . . . 553.4. Biocapacity Stock and Adjusted HDI in the Russian Regions . . . . . . . . . . . . . . . . . . . 58Footprint and Russian Forests . . . . . . . . . . . . . . . . . . . . . . . . . . . . . . . . . . . . . . . . . . . . . . . . 60
Section 4. What’s Next? . . . . . . . . . . . . . . . . . . . . . . . . . . . . . . . . . . . . . . . . . . . . . . . . . . . . . . . . . 624.1. What do we propose? . . . . . . . . . . . . . . . . . . . . . . . . . . . . . . . . . . . . . . . . . . . . . . . . . . . . 644.2. Choosing our Future . . . . . . . . . . . . . . . . . . . . . . . . . . . . . . . . . . . . . . . . . . . . . . . . . 654.3. Questions . . . . . . . . . . . . . . . . . . . . . . . . . . . . . . . . . . . . . . . . . . . . . . . . . . . . . . . . . . . . . . 684.4. Next Step: Test, Explore and Choose . . . . . . . . . . . . . . . . . . . . . . . . . . . . . . . . . . . . . . . 70
Appendix . . . . . . . . . . . . . . . . . . . . . . . . . . . . . . . . . . . . . . . . . . . . . . . . . . . . . . . . . . . . . . . . . . 71Standard methodology . . . . . . . . . . . . . . . . . . . . . . . . . . . . . . . . . . . . . . . . . . . . . . . . . . . . . . . 72Glossary . . . . . . . . . . . . . . . . . . . . . . . . . . . . . . . . . . . . . . . . . . . . . . . . . . . . . . . . . . . . . . . . . 76References . . . . . . . . . . . . . . . . . . . . . . . . . . . . . . . . . . . . . . . . . . . . . . . . . . . . . . . . . . . . . . . . 81Name Directory for Russian Federal Subjects . . . . . . . . . . . . . . . . . . . . . . . . . . . . . . . . . . . 83Data Table — Profiles of the Russian Regions: Ecological Footprint, Biocapacity, Human, and Economic Development . . . . . . . . . . . . . . . . . . . . . . . . . . . . . . . . . . . . . . . . . . 84

4 | Ecological Footprint of the Russian Regions
Careful management of Russia’s natural assets is a critical component of safeguarding, if not increasing, Russia’s overall wealth. For several years Russia had benefited heavily from high market prices for fossil fuels. The boosted income
allowed its economy to expand for the past decade. But is this a lasting strategy?
What if Russia further depletes its natural capital? What if climate change turns out to be a greater challenge than anticipated, affecting the productivity of Russia’s ecosystems or eroding the utility of fossil fuel? Without its natural capital, would Russia still have the ability to maintain high income and human development?
Russia’s ecological resources, if managed carefully and efficiently, may act as a safety net and allow Russia to capitalize on its renewable wealth without jeopardizing the welfare of future generations. But this requires investments in its economy, so it can be regenerative, rather than just bank on liquidating its natural capital.
If Russia is to remain among the world’s leading economies and enhance the wellbeing of its citizens, it must take steps to safeguard its resource base — both mineral and biological — and to invest in science, education, culture, and technology to build a regenerative, knowledge-based economy.
As the first step toward a sustainable future, Global Footprint Network has developed a methodology allowing nations (as well as regions, cities and even households) to measure their demand on nature and compare it against their renewable natural wealth. Based on this accounting methodology, WWF and Global Footprint Network have for the first time calculated the Ecological Footprint and biocapacity for Russia’s 83 Federal Subjects1. We hope that policymakers and business leaders will use these data and accompanying analysis as a baseline in their efforts to build a safe, prosperous, and fulfilling future for all.
Evgeny Shvarts,
WWF-Russia
1 Number of Federal Subjects as of 2009.
FOREwORd
© ОЛЕГ С
ЕРД
ЕЧНИКО
В

BIOCAPACITYBiological capacity is the ability of an ecosystem to regenerate and provide services that compete for space. These services include producing useful biological materials, hosting human infrastructure in biologically productive areas, and absorbing waste such as carbon dioxide emissions from fossil fuel.
ECOLOGICAL FOOTPRINTA measure of the area of biologically productive land and water an individual, population or activity requires to produce all the resources it consumes and to sequester its waste. Because of data limitations, the main form of waste included in the National Footprint Accounts is carbon dioxide from burning fossil fuels. Both Ecological Footprint and biocapacity results are expressed in a globally comparable, standardized unit called a global hectare (gha) — a hectare of biologically productive land or sea area with world average bioproductivity in a given year.
BIOCAPACITY dEFICIT ANd REsERVEThe difference between the Ecological Footprint and the biocapacity of a region or country. A biocapacity deficit occurs when the Footprint of a population exceeds the biocapacity of the area available to that population. A biocapacity reserve occurs when the available biocapacity of an area exceeds the Footprint of that area’s population.
ECOLOGICAL OVERsHOOTWhen a population’s demands on an ecosystem exceed the capacity of that ecosystem to regenerate the resources demanded. Overshoot results in ecological assets being diminished and carbon waste accumulating in the atmosphere. Overshoot can occur locally and globally.
Ecological Footprint of the Russian Regions | 5

6 | Ecological Footprint of the Russian Regions
Andrey Lipatov, Director General, «Teplocom Holding HC» CJSC
OPENING REmARksTechnical advancement, increasing income and better lifestyle over the past decades made it a habit for humanity to squander resources without thinking of the consequences of irresponsible consumption and the welfare of future generations. It is however more and more evident that a country’s most stable currency is the ecological and resource potential, which guarantees its economic independence and welfare. Preservation of a country’s natural capital is a joint effort to be undertaken together by the government, business community, and each and every household.
It is indeed very welcome that sustainable resource management and responsible consumption in all fields of work have become a country-wide concern. Many charitable and conservation organizations engage themselves with the preservation of our ecological wealth, while businesses deal with similar issues as part of their corporate social responsibility. If we join our efforts we will be able to become stronger and more efficient and will have all the opportunities to build a fulfilling future.
Teplocom views nature conservation as an important contribution to Russia’s sustainable development and an integral part of its own social obligations. Our products help people to measure and save resources they consume, while engineering solutions we provide can guarantee the highest standards of energy efficiency. Our company follows the principles of responsible business practices and supports charitable projects at the federal and regional levels in the field of ecology and responsible consumption. Environmental values are incorporated in the Teplocom brand: our corporate color is orange, the color of the sun, energy of the future, the color of a bright and warm world in which people live in harmony with nature. Our cooperation with WWF aims to maintain ecological balance and preserve the environment. Even though business is committed to efficiency, the overall human consumption of ecological resources is becoming less efficient. Today humanity demands more than the ecosystems of our planet can renew; in 9 months people and their economic activities consume what the Earth needs 1 year to replenish. Not surprisingly, the more advanced a nation is in terms of economic development, the more resources it needs to support its citizens’ lifestyles and the more it contributes to the depletion of
the ecological resources of the Earth. The aim of the project “Ecological Footprint of Russia’s Federal Subjects”, jointly implemented by WWF and Global Footprint Network and funded by Teplocom, is to measure this inefficiency. Ecological Footprint is a clear, easy-to-understand indicator showing the contribution of each region to Russia’s total demand on nature.
To take stock of what we have is the first step to efficient use of resources: we can’t speak of rationalization if we do not have correct estimations of our current consumption. It is the data that give us a reliable picture of the energy sector; based on the measurements, we can understand the key issues and outline steps to address them. This Report reveals Federal Subjects which have particularly high potential for improving resource management. It would however be incorrect to limit the study only to the analysis of negative effects of increasing Ecological Footprint – that is why the Report also examines the regions’ potential for sustainable development which is higher for regions with substantial biocapacity reserves.
It is however to be borne in mind that these opportunities could only be realized provided that available resources are managed sustainably and responsibly. This could be achieved through increasing energy efficiency of the Russian economy.
This report has been designed as an easy-to-use tool for local entities, including regional and municipal authorities working in the field of efficient natural resource management. The Report will also help Teplocom to implement our strategic projects, including creating the ‘Investment Atlas’ of Russian regions and participation in the state training program to improve technical skills of the key staff responsible for energy efficiency in public and budgetary organizations.
We expect that the next study of Russia’s Ecological Footprint, conducted in some five years, will demonstrate the effectiveness of the joint efforts of Government, business, and society in conserving our planet and preserving the country's ecological wealth.

Ecological Footprint of the Russian Regions | 7
Humanity’s dependence on nature is self-evident. Our economies and livelihoods, human welfare and the quality of our lives — even life itself — are powered and made possible by ecological services
such as healthy food, clean water, stable climate and fresh air.
But we are causing unprecedented stress to our planet. The global population is growing. Consumption and waste are increasing. We no longer live within nature’s budget.
For decades, humanity’s demands on nature — our Ecological Footprint — have exceeded Earth’s regenerative capacity — its biocapacity. By 2009, the latest year with a complete data set, humanity’s annual resource use was equivalent to what the planet can replenish in 1.5 years. Every year, the gap widens between our Footprint and available biocapacity.
Many nations are running a biocapacity deficit. To compensate, they turn to trade, overuse their own resources or the global commons. As ecological constraints tighten, a nation’s ability to succeed will become more dependent on its ability to access ecological services.
This is our new reality. Nations are increasingly reliant on trade to support their demand on nature. Biocapacity, our ecosystems’ ability to renew natural resources, is growing in value — and is under ever greater stress.
Russia is among the handful of nations that holds an advantage. Its vast biocapacity wealth meets its population’s demands, and provides for its trading partners. Indeed, Russia is unique in having both a relatively large population and increasing biocapacity reserves. If Russia can maintain this advantage, it will have an important economic advantage in an ecologically constrained world.
Yet Russia’s biocapacity reserve, enormous as it is, is not immune to risk. Russia’s reliance on fossil fuel exports has brought it great financial income, but at the cost of diminished ecosystems and a failure to develop a sustainable economy. Other exports, such as hydropower and timber products (legally and illegally harvested), put biodiversity and biocapacity at risk. Meanwhile, Russia’s own per capita Ecological Footprint, albeit lower than its domestic biocapacity, is still above what is available globally. If everyone on the planet lived the lifestyle of an average Russian, humanity would need 2.5 Earths to sustain its material demands.
Russia is at a crossroads. It can continue to liquidate its resource wealth for short-term gain. Or it can start tracking its demands on and supply of renewable resources, and manage its wealth for long-term success. We believe that this second option would be one of the best possible investments Russia can make to secure its prosperity and the lasting well-being of its citizens.
INTROduCTION

kEY FINdINGs
The 1991 dissolution of the Soviet Union created seven new nations with biocapacity reserves. Today, only four of them, including Russia, have biocapacity reserves.
In 2009, the year for which the most recent data is available, Russia’s Ecological Footprint was 4.0 gha per person, whereas its available biocapacity was 6.6 gha per person. This means Russia’s per capita demand for nature’s services was 60 per cent of what its ecosystems provided — a reserve that has been growing since independence.
While there are other nations with biocapacity reserves, only a few are not experiencing a decline in those reserves.
Russia’s growing biocapacity reserve is significant for two reasons: Russia is the world’s largest country, occupying 11.5 per cent of the world’s landmass. Its total biocapacity wealth is fourth largest in the world. And Russia is the sole G8 country* with a growing biocapacity reserve, which makes it the world’s only major economy not facing a growing dependence on the ecosystems of other nations.
Of the world’s ten most populous countries, only Russia, Brazil and Indonesia had biocapacity reserves in 2009, but the reserves of the latter two were steadily declining.
This means that most of the world’s economies, and most of the world’s population, are becoming ever more dependent on the global commons and the ecosystems of other nations.
Russia is among the few nations that, with careful management of its resource demands, can securely maintain its biocapacity reserve for decades to come.
Ü
Ü
Ü
Ü
Ü
Ü
Ü
* Russia’s membership is currently suspended.
8 | Ecological Footprint of the Russian Regions

Ecological Footprint of the Russian Regions | 9
Figure 1
Only four of the seven nations with biocapacity reserves that emerged upon the dissolution of the Soviet Union still have biocapacity reserves today.
NOTE: Spikes in the graphs may represent geopolitical discontinuities, such as the dissolution of the Soviet Union.
Kazakhstan’s biocapacity reserve, which had widened the first several years of the nation’s independence, began narrowing by the late 1990s, until it crossed the deficit threshold around 2004. Kyrgyzstan now runs an ecological deficit and has slowly trended in this direction since gaining independence. Turkmenistan’s biocapacity reserve vanished by the early 2000s, although its demand on resources has sharply declined in recent years.
In contrast, the biocapacity reserves of Estonia, Latvia, Lithuania and Russia have been increasing in recent years.
Results for Georgia are unavailable.
Estonia
Kazakhstan
Kyrgyzstan
Latvia
Lithuania
Russian Federation
Turkmenistan
0.0
2.0
4.0
6.0
8.0
10.0
12.0
1961 1965 1969 1973 1977 1981 1985 1989 1993 1997 2001 2005 2009
Global H
ectares per capita
Deficit Reserve
Ecological Footprint Biocapacity
Cropland Grazing Land Forest Land
0.0
0.5
1.0
1.5
2.0
2.5
3.0
3.5
4.0
4.5
5.0
1961 1965 1969 1973 1977 1981 1985 1989 1993 1997 2001 2005 2009
Global H
ectares per capita
Deficit Reserve
Ecological Footprint Biocapacity
Cropland Grazing Land Forest Land
0.0
0.5
1.0
1.5
2.0
2.5
1961 1965 1969 1973 1977 1981 1985 1989 1993 1997 2001 2005 2009
Global H
ectares per capita
Deficit Reserve
Ecological Footprint Biocapacity
Cropland Grazing Land Forest Land
0.0
1.0
2.0
3.0
4.0
5.0
6.0
7.0
8.0
9.0
1961 1965 1969 1973 1977 1981 1985 1989 1993 1997 2001 2005 2009
Global H
ectares per capita
Deficit Reserve
Ecological Footprint Biocapacity
Cropland Grazing Land Forest Land
0.0
1.0
2.0
3.0
4.0
5.0
6.0
1961 1965 1969 1973 1977 1981 1985 1989 1993 1997 2001 2005 2009
Global H
ectares per capita
Deficit Reserve
Ecological Footprint Biocapacity
Cropland Grazing Land Forest Land
0.0
1.0
2.0
3.0
4.0
5.0
6.0
7.0
1961 1965 1969 1973 1977 1981 1985 1989 1993 1997 2001 2005 2009
Global H
ectares per capita
Deficit Reserve Ecological Footprint Biocapacity
Cropland Grazing Land Forest Land
0.0
0.5
1.0
1.5
2.0
2.5
3.0
3.5
4.0
4.5
5.0
1961 1965 1969 1973 1977 1981 1985 1989 1993 1997 2001 2005 2009
Global H
ectares per capita
Deficit Reserve Ecological Footprint Biocapacity
Cropland Grazing Land Forest Land

THE ECOLOGICAL FOOTPRINT
ANd BIOCAPACITY
CROPs GRAZINGPROduCTs FOREsT
PROduCTs
THE ECOLOGICAL FOOTPRINT
wHAT Is BIOCAPACITY?
CROPLANd GRAZING LANd the area required to produce food and fibre for human consumption, feed for livestock, oil crops and rubber.
the area of grassland used, in addition to crop feeds, to raise livestock for meat, dairy, hide and wool products.
10 | Ecological Footprint of the Russian Regions

sEAFOOdBuILT-uP LANd
CARBON FOOTPRINT
Figure 2
Land use categories comprising the Ecological Footprint (see Appendix and Borucke et al., 2013, for additional information on the calculation methodology for each of these categories).
THE ECOLOGICAL FOOTPRINT
BuILT-uP LANd FOREsT LANd FIsHING GROuNds the area of forest required to support the harvest of fuel wood, pulp and timber products (the forest product Footprint), and the area of land required to sequester CO2 emissions, primarily from fossil fuels burning, that are not absorbed by oceans (the carbon Footprint).
the area of marine and inland waters used to harvest fish and other seafood.
the biologically productive areas covered by human infrastructure, including transportation, housing and industrial structure.
Figure 3
Biocapacity Components
Ecological Footprint of the Russian Regions | 11

12 | Ecological Footprint of the Russian Regions
For more than 40 years, our planet has gone deeper into ecological overshoot.
Today, humanity demands from nature 50 per cent more than what the biosphere can renew. If current trends continue, humanity will be using the ecological resources and services of about three Earths by 2050. It is physically impossible to maintain such a high level of overshoot.
How will nations remain economically successful if their access to essential resources becomes more limited?
Each country is in a unique situation: Some nations have more biocapacity than others, and a handful have more biocapacity than their populations use. But the reserves of almost every nation are in decline.
Russia is in an advantageous position. Not only is it among the few remaining nations with biocapacity reserve, but Russia’s per capita biocapacity wealth is increasing. In 2009, its biocapacity reserve was 372 million gha.
But pressures from around the world are mounting. If Russia tracks and carefully manages its biocapacity wealth, it can thrive even as most countries struggle. What are Russia’s options as global resource constraints tighten? There are great opportunities for Russia, but also great risks.
PRELudE

Ecological Footprint of the Russian Regions | 13
A country’s Ecological Footprint of consumption is derived by tracking how much biologically productive area it takes to absorb a population’s waste2 and to generate all the resources it consumes. Consumption is estimated by adding imports to domestic production, while subtracting exports (see box above).
All commodities carry with them an embedded amount of bioproductive land and sea area necessary to produce them and sequester the associated waste; international trade flows can thus be seen as flows of embedded Ecological Footprint.
2 The only “waste stream” included in the national and regional assessments is carbon dioxide waste from fossil fuel burning. In theory, the Ecological Footprint measures all human-generated waste materials that exert pressure on the Earth’s regenerative capacity. But in practice the inclusion of more waste streams is limited by data constraints
EFC EFP EFI EFE= + ( )
Ecological Footprint of Consumption
The Ecological Footprint of consumption indicates the consumption of biocapacity by a country’s inhabitants.In order to assess the total domestic demand for resources and ecological services of a population, we use the Ecological Footprint of consumption (EFC). EFC accounts for both the export of national resources and ecological services for use in other countries, and the import of resources and ecological services for domestic consumption.EFc is most amenable to change by individuals through changes in their consumption behavior.
Ecological Footprint of Production Net Ecological Footprint of Trade
The Ecological Footprint of production indicates the consumption of biocapacity resulting from production processes within a given geographic area, such as a country or region.It is the sum of all the bioproductive areas within a country necessary for supporting the actual harvest of primary products (cropland, grazing land, forestland and fishing grounds), the country’s built-up area (roads, factories, cities), and the area needed to absorb all fossil fuel carbon emissions generated within the country.This measure mirrors the gross domestic product (GDP), which represents the sum of the values of all goods and services produced within a country’s borders.
The Ecological Footprint of imports and exports indicate the use of biocapacity within international trade.Embedded in trade between countries is a use of biocapacity, the net Ecological Footprint of trade (the Ecological Footprint of imports minus the Ecological Footprint of exports). If the Ecological Footprint embodied in exports is higher than that of imports, then a country is a net exporter of renewable resources and ecological services.Conversely, a country whose Footprint of imports is higher than that embodied in exports depends on the renewable resources and ecological services generated by ecological assets from outside its geographical boundaries.
Figure 4
Tracking production, consumption and net trade with the Ecological Footprint: The Ecological Footprint associated with each country’s total consumption is calculated by summing the Footprint of its imports and its production, and subtracting the Footprint of its exports. This means that the resource use and emissions associated with producing a car that is manufactured in Russia, but sold and used in China, will contribute to China’s rather than Russia’s Ecological Footprint of consumption.
-

sECTION 1THE GLOBAL CONTExT~In the early 1970s, humanity crossed into ecological overshoot.
Biocapacity deficits, once only accrued by cities and a few countries, were now a global reality. Humanity’s aggregate demand on nature now exceeded what our biosphere could renew.
Forty years later, most countries are running biocapacity deficits, and countries that do still have biocapacity reserves are diminishing them. Meanwhile, populations and resource demands continue to grow.

© B
RE
NT S
TIRTO
N / G
ETTY IM
AG
ES

In the early 1970s, humanity crossed into ecological overshoot.
Biocapacity deficits, once only accrued by cities and a few countries, became a global reality. Humanity’s aggregate demand on nature now exceeded what our biosphere could renew.
Forty years later, most countries are running biocapacity deficits, and countries that do still have biocapacity reserves are diminishing them. Meanwhile, populations and resource demands continue to grow.
According to Global Footprint Network’s most recent National Footprint Accounts, in 2009
humanity demanded 1.5 times more from the planet than Earth could replenish — a doubling from 1961, when people used approximately three-quarters of the planet’s biocapacity. If trends follow even the moderate projections of UN agencies, humanity will use the resources of nearly three Earths by the middle of this century.
1.1. BIOCAPACITY ANd ECOLOGICAL
FOOTPRINT: GLOBAL suPPLY ANd dEmANd dYNAmICs
In 2009, the last year for which complete Ecological Footprint data are currently available, Earth’s biocapacity was almost 12 billion gha. That same year, humanity’s Ecological Footprint was over 17.6 billion gha — 1.5 times the planet’s capacity to keep up with this demand.
For more than a half century, the largest and fastest growing component of our Ecological Footprint has been carbon. In 1961, the carbon component made up 35 per cent of humanity’s total Ecological
Figure 5
Humanity’s Ecological Footprint compared
to global biocapacity, 1961-2009. In 2009,
humanity’s per capita Footprint and biocapacity
were 2.6 gha and 1.8 gha respectively. Since the
early 1970s, humanity’s demand on Earth has
exceeded what the planet can renewably provide.
This ecological overshoot has steadily grown during
the past 40 years, to the point that it now takes
1.5 Earths to regenerate the resources we use
every year (Global Footprint
Network, 2013).
16 | Ecological Footprint of the Russian Regions
0.0
0.5
1.0
1.5
2.0
2.5
3.0
3.5
1961 1965 1969 1973 1977 1981 1985 1989 1993 1997 2001 2005 2009
Global H
ectares per capita
Deficit Reserve
Ecological Footprint Biocapacity
Time Trend of World

Figure 6
Humanity’s Ecological Footprint by land
area, 1961-2009. The largest component of
humanity’s Ecological Footprint today is the
carbon Footprint (55 per cent). This component
represents more than half the Ecological Footprint
for one-quarter of the countries tracked by
Global Footprint Network, and it is the largest
component for nearly half of the 219 countries assessed by the National
Footprint Accounts (Global Footprint
Network, 2013).
The global appetite for ecological resources and services is unsustainable. Overshoot is possible for a limited time, but at the cost of depletion and degradation of resources. This poses great risks for economies. Weaker natural capital stocks erode economic opportunities and increase social pressures.
We can already recognize many of the signs of global ecological overshoot: drought and climate change, depleted fisheries, deforestation and soil degradation. Given global trends the past four decades, these and other signs will become more frequent in the near future. As the competition for resources gets stiffer, even high-income countries can expect increasing costs of everyday purchases, such as plastic and aluminum products, and declining value of economic assets that depend on cheap energy resource inputs, including airplanes, airports, hotels and ski resorts in distant locations.
Global overshoot exposes every country to risk. Those with a secure resource base will be best positioned to safeguard their economies and their citizens’ quality of life.
Footprint. By 2009, carbon was 55 per cent of our Footprint.
The increase in fossil fuel consumption (and carbon emissions) has had a direct impact on biocapacity and other Footprint components. Much of today’s improved agricultural productivity, for instance, depends on fertilizers, pumps, tractors, and other machinery that are heavily dependent on fossil fuel input.
But for all the world’s technological gains, developments in energy efficiency have not kept pace with the growth in populations and per capita demands on biocapacity. We may have more fuel-efficient automobiles on our roads, but we are still operating more automobiles on our roads than ever before. And if burning more fossil fuels gives us higher agricultural yields (and greater food production), it also increases the risks associated with anthropogenic climate change.
Ecological Footprint of the Russian Regions | 17
0
0.2
0.4
0.6
0.8
1
1.2
1.4
1.6
Eco
logi
cal F
ootp
rint
in N
umbe
r of
Pla
nets
1961 1971 1981 1991 2001
Seafood Grazing Products
Forest Products Crops
Carbon Footprint
Built-up Land
Time Trend by Component

18 | Ecological Footprint of the Russian Regions
In 1961, 131 of the 182 countries tracked by the National Footprint Accounts had more ecological assets available to produce the resources and services, on aggregate, than their residents consumed. All other countries consumed more than their domestic ecosystems produced (See Figure 7). By 2009, only 80 countries out of the 219 covered by the National Footprint Accounts had not fallen into deficit, and the reserves of almost every one of these 80 countries were narrowing.
Countries with biocapacity deficits import more resources than they export, deplete their ecological assets or use the global commons. Each of these strategies carries economic and social risks.
Dependence on imported resources exposes a country to both supply disruption and price volatility. Overharvesting causes a direct loss of ecological assets, which affects supply and makes a country more dependent on imports. Burning fossil fuels and emitting carbon dioxide into the global commons comes at a cost, even in the absence of significant CO2 taxes. As
1.2. NATIONAL BIOCAPACITY
REsERVEs ANd dEFICITs
0–50%
50–100%
100–150%
>150%
0–50%
50–100%
100–150%
>150%
ECOLOGICALFOOTPRINTEXCEEDSBIOCAPACITY BY
BIOCAPACITYEXCEEDSECOLOGICALFOOTPRINT BY
no data 1961 2009
NATIONAL BIOCAPACITY REsERVEs ANd dEFICITs

Ecological Footprint of the Russian Regions | 19
0–50%
50–100%
100–150%
>150%
0–50%
50–100%
100–150%
>150%
ECOLOGICALFOOTPRINTEXCEEDSBIOCAPACITY BY
BIOCAPACITYEXCEEDSECOLOGICALFOOTPRINT BY
no data 1961 2009
fossil fuels become more difficult to find and extract, prices increase. And climate change, independent of one’s own emissions, imposes costs on us all.
The most vulnerable countries are those in ecological deficit without the financial strength, political clout, or national power to compete for the biocapacity they lack. But even high-income nations share these risks.
Figure 7Biocapacity status of the world’s countries in 1961 (left) and 2009 (right). A biocapacity reserve (green) means the country’s Ecological Footprint is less than the national biocapacity; a biocapacity deficit (red) means the country’s Ecological Footprint is greater than the national biocapacity. Fifty years ago, 1.7 billion people lived in countries that had more biocapacity than their residents demanded. Today six billion out of seven billion people live in countries where residents demand more than what their ecosystems can renew (Global Footprint Network, 2013).
From 1992 to 2009, Russia’s per capita Ecological Footprint declined by 30 per cent (from 5.7 to 4.0 gha), mainly because of the country’s 24 per cent decrease in the carbon Footprint component. The drop in carbon Footprint was predominantly the result of economic decline and partial de-industrialization following the dissolution of the USSR.
Russia’s per capita biocapacity has remained a stable 6.6 gha during this same period.
Between 1992 and 2009, Russia’s per capita biocapacity reserve expanded from 0.9 to
2.6 gha, due in large part to a decline in per capita consumption. This makes Russia unique in having both a relatively large population and increasing biocapacity reserves. Today, Russia’s residents use the ecological resources of 0.6 Russias.
But even with this growing reserve, Russia’s resource use is still above the limits of the world average available biocapacity of 1.8 gha per person. If everyone on the planet lived the average lifestyle of Russian residents, humanity would need 2.5 Earths to sustain our demand on nature.
20 | Ecological Footprint of the Russian Regions
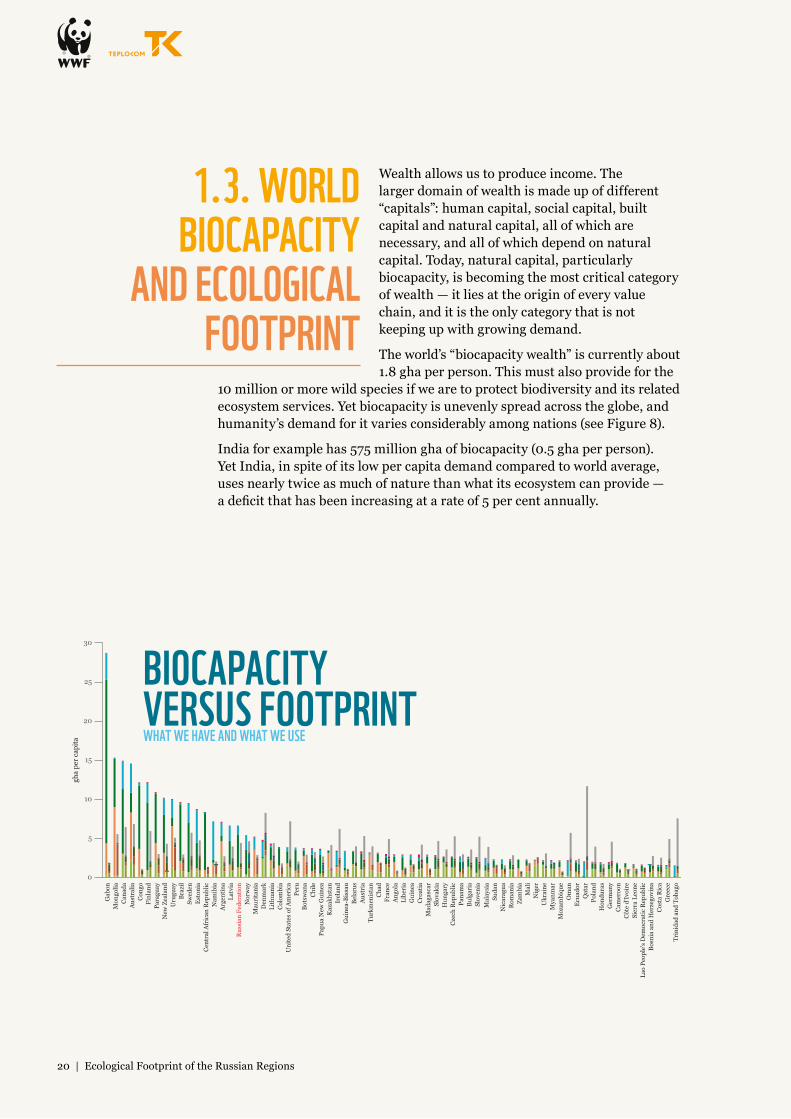
Wealth allows us to produce income. The larger domain of wealth is made up of different “capitals”: human capital, social capital, built capital and natural capital, all of which are necessary, and all of which depend on natural capital. Today, natural capital, particularly biocapacity, is becoming the most critical category of wealth — it lies at the origin of every value chain, and it is the only category that is not keeping up with growing demand.
The world’s “biocapacity wealth” is currently about 1.8 gha per person. This must also provide for the
10 million or more wild species if we are to protect biodiversity and its related ecosystem services. Yet biocapacity is unevenly spread across the globe, and humanity’s demand for it varies considerably among nations (see Figure 8).
India for example has 575 million gha of biocapacity (0.5 gha per person). Yet India, in spite of its low per capita demand compared to world average, uses nearly twice as much of nature than what its ecosystem can provide — a deficit that has been increasing at a rate of 5 per cent annually.
1.3. wORLd BIOCAPACITY
ANd ECOLOGICAL FOOTPRINT
Seafood
Grazing Products
Forest Products
Crops
Built-up Land
Carbon Footprint
ECOLOGICAL FOOTPRINTBIOCAPACITY
Fishing Grounds
Grazing Land
Forest Land
Cropland
Built-up Land
Gab
onM
ongo
liaC
anad
aA
ustr
alia
Con
goFi
nlan
dPa
ragu
ayN
ew Z
eala
ndU
rugu
ayB
razi
lSw
eden
Est
onia
Cen
tral
Afr
ican
Rep
ublic
Nam
ibia
Arg
enti
naLa
tvia
Rus
sian
Fed
erat
ion
Nor
way
Mau
rita
nia
Den
mar
kLi
thua
nia
Col
ombi
aU
nite
d St
ates
of A
mer
ica
Peru
Bot
swan
aC
hile
Papu
a N
ew G
uine
aK
azak
hsta
nIr
elan
dG
uine
a-B
issa
uB
elar
usA
ustr
iaTu
rkm
enis
tan
Cha
dFr
ance
Ang
ola
Libe
ria
Gui
nea
Cro
atia
Mad
agas
car
Slov
akia
Hun
gary
Cze
ch R
epub
licPa
nam
aB
ulga
ria
Slov
enia
Mal
aysi
aSu
dan
Nic
arag
uaR
oman
iaZa
mbi
aM
ali
Nig
erU
krai
neM
yanm
arM
ozam
biqu
eO
man
Ecu
ador
Qat
arPo
land
Hon
dura
sG
erm
any
Cam
eroo
nC
ôte
d'Iv
oire
Sier
ra L
eone
Lao
Peop
le's
Dem
ocra
tic
Rep
ublic
Bos
nia
and
Her
zego
vina
Cos
ta R
ica
Gre
ece
Trin
idad
and
Tob
ago
Eri
trea
Spai
nM
exic
oSe
rbia
Sene
gal
Bur
kina
Fas
oSo
mal
iaU
nite
d K
ingd
omB
elgi
umK
yrgy
zsta
nIn
done
sia
Turk
eyPo
rtug
alG
hana
Sout
h A
fric
aSw
itze
rlan
dTh
aila
ndG
eorg
iaG
ambi
aIt
aly
Nig
eria
Vie
t nam
Gua
tem
ala
Net
herl
ands
Cam
bodi
aB
enin
Swaz
iland
Tuni
sia
Uzb
ekis
tan
Alb
ania
Chi
naTi
mor
-Les
teLe
soth
oU
gand
aA
rmen
iaA
zerb
aija
nZi
mba
bwe
Cub
aM
oroc
coB
ahra
inTo
goM
alaw
iE
gypt
Saud
i Ara
bia
Eth
iopi
aU
nite
d A
rab
Em
irat
esE
l Sal
vado
rPh
ilipp
ines
Yem
enJa
pan
Syri
an A
rab
Rep
ublic
Alg
eria
Mau
riti
usTa
jikis
tan
Dom
inic
an R
epub
licN
epal
Ken
yaR
wan
daIn
dia
Sri L
anka
Bur
undi tia
wuK
hsedalgnaB
natsinahgfA
natsikaPnonabeLacia
maJitia
HlearsIsurpy
CqarInadroJoci
R otreuPyrotirreT nainitselaP deipucc
Ogno
K gnoH
eropagniS
30
25
20
15
10
5
0
gha
per
capi
ta
BIOCAPACITY VERSUS FOOTPRINTWHAT WE HAVE AND WHAT WE USE

Ecological Footprint of the Russian Regions | 21
Brazil has 1.8 billion gha of biocapacity (about 9.6 gha per person), more than any other country. Brazilians’ consumption corresponds to 30 per cent of their country’s biocapacity. Even with this bounty of nature, Brazil is overharvesting or degrading some of its local ecosystems. As Brazil’s population and domestic demand has increased the past 50 years, its per capita biocapacity reserve has declined 73 per cent. In addition to local consumption, Brazil uses 9 per cent of its biocapacity to meet export demands. If it fails to arrest this per capita decline in biocapacity reserves, Brazil could cross into deficit within the next 50 years (see Section 1.4).
In contrast, Russia has 941 million gha of biocapacity, of which 60 per cent meets domestic consumption and 8 per cent meets trade demands. And Russia’s biocapacity reserve is growing. This means that Russia is less dependent per capita on the biocapacity of other nations than most of the world’s other economies.
Russia has 941 million gha of biocapacity and an Ecological Footprint of 569 million gha, giving it a reserve of about 372 million gha (as of 2009).
Only Brazil has a total biocapacity reserve larger than Russia’s. Russia’s per capita biocapacity, however, is growing, while Brazil’s has been in a steep decline.
Figure 8Per capita Ecological Footprint and biocapacity ranked by countries’ per capita biocapacity. (Graph includes countries with populations of one million or more only.) (Global Footprint Network, 2013).
Seafood
Grazing Products
Forest Products
Crops
Built-up Land
Carbon Footprint
ECOLOGICAL FOOTPRINTBIOCAPACITY
Fishing Grounds
Grazing Land
Forest Land
Cropland
Built-up Land
Gab
onM
ongo
liaC
anad
aA
ustr
alia
Con
goFi
nlan
dPa
ragu
ayN
ew Z
eala
ndU
rugu
ayB
razi
lSw
eden
Est
onia
Cen
tral
Afr
ican
Rep
ublic
Nam
ibia
Arg
enti
naLa
tvia
Rus
sian
Fed
erat
ion
Nor
way
Mau
rita
nia
Den
mar
kLi
thua
nia
Col
ombi
aU
nite
d St
ates
of A
mer
ica
Peru
Bot
swan
aC
hile
Papu
a N
ew G
uine
aK
azak
hsta
nIr
elan
dG
uine
a-B
issa
uB
elar
usA
ustr
iaTu
rkm
enis
tan
Cha
dFr
ance
Ang
ola
Libe
ria
Gui
nea
Cro
atia
Mad
agas
car
Slov
akia
Hun
gary
Cze
ch R
epub
licPa
nam
aB
ulga
ria
Slov
enia
Mal
aysi
aSu
dan
Nic
arag
uaR
oman
iaZa
mbi
aM
ali
Nig
erU
krai
neM
yanm
arM
ozam
biqu
eO
man
Ecu
ador
Qat
arPo
land
Hon
dura
sG
erm
any
Cam
eroo
nC
ôte
d'Iv
oire
Sier
ra L
eone
Lao
Peop
le's
Dem
ocra
tic
Rep
ublic
Bos
nia
and
Her
zego
vina
Cos
ta R
ica
Gre
ece
Trin
idad
and
Tob
ago
Eri
trea
Spai
nM
exic
oSe
rbia
Sene
gal
Bur
kina
Fas
oSo
mal
iaU
nite
d K
ingd
omB
elgi
umK
yrgy
zsta
nIn
done
sia
Turk
eyPo
rtug
alG
hana
Sout
h A
fric
aSw
itze
rlan
dTh
aila
ndG
eorg
iaG
ambi
aIt
aly
Nig
eria
Vie
t nam
Gua
tem
ala
Net
herl
ands
Cam
bodi
aB
enin
Swaz
iland
Tuni
sia
Uzb
ekis
tan
Alb
ania
Chi
naTi
mor
-Les
teLe
soth
oU
gand
aA
rmen
iaA
zerb
aija
nZi
mba
bwe
Cub
aM
oroc
coB
ahra
inTo
goM
alaw
iE
gypt
Saud
i Ara
bia
Eth
iopi
aU
nite
d A
rab
Em
irat
esE
l Sal
vado
rPh
ilipp
ines
Yem
enJa
pan
Syri
an A
rab
Rep
ublic
Alg
eria
Mau
riti
usTa
jikis
tan
Dom
inic
an R
epub
licN
epal
Ken
yaR
wan
daIn
dia
Sri L
anka
Bur
undi tia
wuK
hsedalgnaB
natsinahgfA
natsikaPnonabeLacia
maJitia
HlearsIsurpy
CqarInadroJoci
R otreuPyrotirreT nainitselaP deipucc
Ogno
K gnoH
eropagniS
30
25
20
15
10
5
0
gha
per
capi
ta
BIOCAPACITY VERSUS FOOTPRINTWHAT WE HAVE AND WHAT WE USE

22 | Ecological Footprint of the Russian Regions
We live in a world that is becoming more ecologically constrained by the day. And as pressure grows, only a handful of biocapacity-rich countries might keep their advantage. The others will become increasingly dependent on trade to meet their resource needs, exposing them to possible price volatility and supply disruption.
Today, 77 nations (of all nations tracked by the National Footprint Accounts) have biocapacity reserves, and their populations represent less than 15 per cent of the world population. Only a handful of these nations have a large enough
biocapacity reserve to meet not only their own populations’ resource demands but those of other large populations. But as Figure 9 shows, almost every one of these nations are steadily shrinking their biocapacity reserves.
1.4. THE NATIONs wITH THE LARGEsT
BIOCAPACITY REsERVE
Brazil
Peru Democratic Republic of Congo
Mali Bolivia
Figure 9A selection of countries with the world’s largest per capita biocapacity (Global Footprint Network, 2013).
0.0
10.0
20.0
30.0
40.0
50.0
60.0
1961 1965 1969 1973 1977 1981 1985 1989 1993 1997 2001 2005 2009
Glo
bal H
ecta
res
per c
apita
Reserve Ecological Footprint Biocapacity
0.0
5.0
10.0
15.0
20.0
25.0
1961 1965 1969 1973 1977 1981 1985 1989 1993 1997 2001 2005 2009
Glo
bal H
ecta
res
per c
apita
Reserve Ecological Footprint Biocapacity
0.0
2.0
4.0
6.0
8.0
10.0
12.0
14.0
16.0
1961 1965 1969 1973 1977 1981 1985 1989 1993 1997 2001 2005 2009
Glo
bal H
ecta
res
per c
apita
Reserve Ecological Footprint Biocapacity
0.0
0.5
1.0
1.5
2.0
2.5
3.0
3.5
4.0
4.5
5.0
1961 1965 1969 1973 1977 1981 1985 1989 1993 1997 2001 2005 2009
Glo
bal H
ecta
res
per c
apita
Reserve Ecological Footprint Biocapacity
0.0
2.0
4.0
6.0
8.0
10.0
12.0
1961 1965 1969 1973 1977 1981 1985 1989 1993 1997 2001 2005 2009
Glo
bal H
ecta
res
per c
apita
Reserve Ecological Footprint Biocapacity
0,0
2,0
4,0
6,0
8,0
10,0
12,0
1961 1965 1969 1973 1977 1981 1985 1989 1993 1997 2001 2005 2009
0.0
5.0
10.0
15.0
20.0
25.0
1961 1965 1969 1973 1977 1981 1985 1989 1993 1997 2001 2005 2009
Glo
bal H
ecta
res
per c
apita
Reserve Ecological Footprint Biocapacity
0.0
5.0
10.0
15.0
20.0
25.0
1961 1965 1969 1973 1977 1981 1985 1989 1993 1997 2001 2005 2009
Glo
bal H
ecta
res
per c
apita
Reserve Ecological Footprint Biocapacity
Argentina

Ecological Footprint of the Russian Regions | 23
Among nations both with and without biocapacity reserves, there are some that are increasing their per capita biocapacity. Most, however, are experiencing a concurrent growth in their Footprint. Russia is unique in having both a relatively large population and increasing biocapacity reserves.
Canada Australia
Mongolia Colombia
Mozambique Zambia
Figure 10
0.0
5.0
10.0
15.0
20.0
25.0
30.0
35.0
1961 1965 1969 1973 1977 1981 1985 1989 1993 1997 2001 2005 2009
Glo
bal H
ecta
res
per c
apita
Reserve Ecological Footprint Biocapacity
0.0
5.0
10.0
15.0
20.0
25.0
30.0
1961 1965 1969 1973 1977 1981 1985 1989 1993 1997 2001 2005 2009
Glo
bal H
ecta
res
per c
apita
Reserve Ecological Footprint Biocapacity
0.0
2.0
4.0
6.0
8.0
10.0
12.0
1961 1965 1969 1973 1977 1981 1985 1989 1993 1997 2001 2005 2009
Glo
bal H
ecta
res
per c
apita
Reserve Ecological Footprint Biocapacity
0.0
10.0
20.0
30.0
40.0
50.0
60.0
1961 1965 1969 1973 1977 1981 1985 1989 1993 1997 2001 2005 2009
Glo
bal H
ecta
res
per c
apita
Reserve Ecological Footprint Biocapacity
0.0
1.0
2.0
3.0
4.0
5.0
6.0
7.0
1961 1965 1969 1973 1977 1981 1985 1989 1993 1997 2001 2005 2009
Glo
bal H
ecta
res
per c
apita
Reserve Ecological Footprint Biocapacity
0.0
1.0
2.0
3.0
4.0
5.0
6.0
7.0
8.0
9.0
1961 1965 1969 1973 1977 1981 1985 1989 1993 1997 2001 2005 2009
Glo
bal H
ecta
res
per c
apita
Reserve Ecological Footprint Biocapacity
0,0
1,0
2,0
3,0
4,0
5,0
6,0
7,0
1961
1964
1967
1970
1973
1976
1979
1982
1985
1988
1991
1994
1997
2000
2003
2006
2009
Glo
bal H
ecta
res
per c
apita
Biocapacity and Ecological Footprint: global supply
and demand dynamics
Deficit
Reserve
Ecological Footprint
BiocapacityUSSR Russian Federation
24 | Ecological Footprint of the Russian Regions
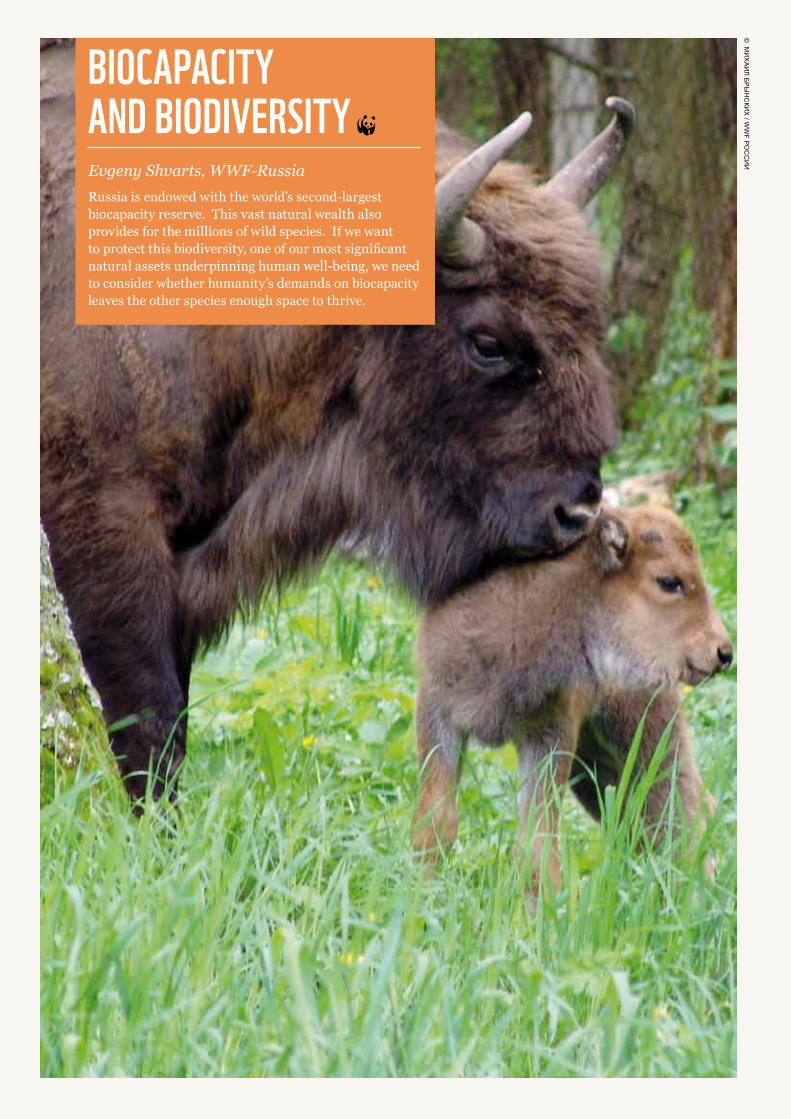
BIOCAPACITY ANd BIOdIVERsITY~Evgeny Shvarts, WWF-RussiaRussia is endowed with the world’s second-largest biocapacity reserve. This vast natural wealth also provides for the millions of wild species. If we want to protect this biodiversity, one of our most significant natural assets underpinning human well-being, we need to consider whether humanity’s demands on biocapacity leaves the other species enough space to thrive.
© М
ИХАИЛ БРЫНСКИ
Х / W
WF РО
ССИИ

To demonstrate how sufficient amounts of biocapacity positively affect the sustainability of keystone species and ecosystem health, WWF-Russia analyzed the population numbers of several game (Eurasian elk, wild boar, European roe deer, red deer, Siberian musk deer, reindeer, grey wolf, and brown bear) and endangered species (European bison, saiga antelope, Amur leopard, and Amur tiger — see figures 11 through 22).
Based on state monitoring data, WWF concludes that the ecological resources that support game species in the Russian Federation are stable or improving: Population numbers of most of the hoofed mammals and the brown bear have been increasing, while the grey wolf population has remained stable.
Population numbers of the endangered species selected for this study confirm that when measures are taken to preserve habitats and prevent poaching, there is sufficient available biocapacity to restore wild populations of both large carnivores and most large herbivore mammals (like the European bison).
Figure 11Eurasian elk wild
population and harvesting numbers
Figure 12 Wild boar population and
harvesting numbers
Ecological Footprint of the Russian Regions | 25
10 000
19 000
28 000
37 000
46 000
55 000
64 000
73 000
82 000
100
150
200
250
300
350
400
Har
vest
of a
nim
als,
uni
ts
Years
Pop
ulat
ion
num
ber,
thou
sand
uni
ts
Population number Harvesting
9000
14 000
19 000
24 000
29 000
34 000
0
100
200
300
400
500
600
700
800
900
1000
Har
vest
of a
nim
als,
uni
ts
Pop
ulat
ion
num
ber,
thou
sand
uni
ts
Years
Population number Harvesting
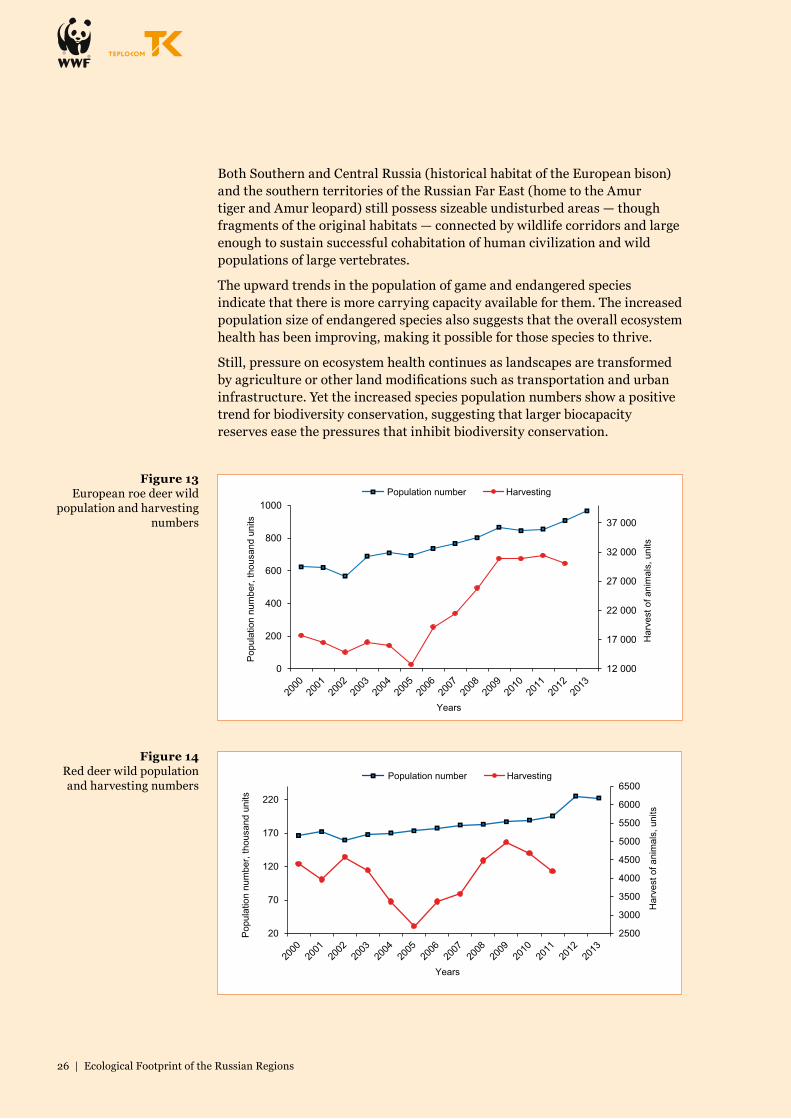
Both Southern and Central Russia (historical habitat of the European bison) and the southern territories of the Russian Far East (home to the Amur tiger and Amur leopard) still possess sizeable undisturbed areas — though fragments of the original habitats — connected by wildlife corridors and large enough to sustain successful cohabitation of human civilization and wild populations of large vertebrates.
The upward trends in the population of game and endangered species indicate that there is more carrying capacity available for them. The increased population size of endangered species also suggests that the overall ecosystem health has been improving, making it possible for those species to thrive.
Still, pressure on ecosystem health continues as landscapes are transformed by agriculture or other land modifications such as transportation and urban infrastructure. Yet the increased species population numbers show a positive trend for biodiversity conservation, suggesting that larger biocapacity reserves ease the pressures that inhibit biodiversity conservation.
Figure 13European roe deer wild
population and harvesting numbers
Figure 14Red deer wild population and harvesting numbers
26 | Ecological Footprint of the Russian Regions
12 000
17 000
22 000
27 000
32 000
37 000
0
200
400
600
800
1000
Har
vest
of a
nim
als,
uni
ts
Pop
ulat
ion
num
ber,
thou
sand
uni
ts
Years
Population number Harvesting
2500
3000
3500
4000
4500
5000
5500
6000
6500
20
70
120
170
220
Har
vest
of a
nim
als,
uni
ts
Pop
ulat
ion
num
ber,
thou
sand
uni
ts
Years
Population number Harvesting

But there are exceptions. Poaching of the male saiga antelope, whose horns are highly valued in traditional Asian medicine, and habitat transformation caused by longtime pasture degradation (resulting from commercial overgrazing), has led to a steady decline of saiga populations. The grey wolves that populated the shelterbelt forest plantations created in 1948–1953 have increasingly infiltrated the saiga’s habitats, also contributing to the decline of this critically endangered species.
Also, with increasing climate change, one of the growing drivers of biodiversity loss, ecosystem health may suffer further degradation.
How can Russia continue to preserve its biodiversity assets? There are a variety of potential solutions. One of the most important government actions would be to mandate meaningful “environmental impact” analyses of new transport infrastructure (primarily highways and high-speed rail lines) with clear, enforceable mitigation requirements such as creating new protected areas to conserve wildlife habitats in zones with little or virtually no economic activity.
Figure 15Siberian musk deer wild
population and harvesting numbers
Figure 16Reindeer wild population and harvesting numbers
Ecological Footprint of the Russian Regions | 27
2800
3300
3800
4300
4800
5300
5800
0
50
100
150
200
250
Har
vest
of a
nim
als,
uni
ts
Pop
ulat
ion
num
ber,
thou
sand
uni
ts
Years
Population number Harvesting
20 000
29 000
38 000
47 000
56 000
65 000
100
300
500
700
900
1100
1300
Har
vest
of a
nim
als,
uni
ts
Pop
ulat
ion
num
ber,
thou
sand
uni
ts
Years
Population number Harvesting

Figure 17Saiga antelope wild
population numbers
Figure 18Grey wolf wild population
and harvesting numbers
Figure 19Brown bear wild
population and harvesting numbers
28 | Ecological Footprint of the Russian Regions
0
5
10
15
20
25
30
35
40
2000 2001 2002 2003 2004 2005 2006 2007 2008 2009 2010 2011 2012 2013 2014
Years
Population dynamicsApproximation of the linear function
Pop
ulat
ion
num
ber,
thou
sand
uni
ts
300050007000900011 00013 00015 00017 00019 00021 000
0
10
20
30
40
50
60
70
Har
vest
of a
nim
als,
uni
ts
Pop
ulat
ion
num
ber,
thou
sand
uni
ts
Years
Population number Harvesting
2800
3300
3800
4300
4800
5300
5800
0
50
100
150
200
250
Har
vest
of a
nim
als,
uni
ts
Pop
ulat
ion
num
ber,
thou
sand
uni
ts
Years
Population number Harvesting
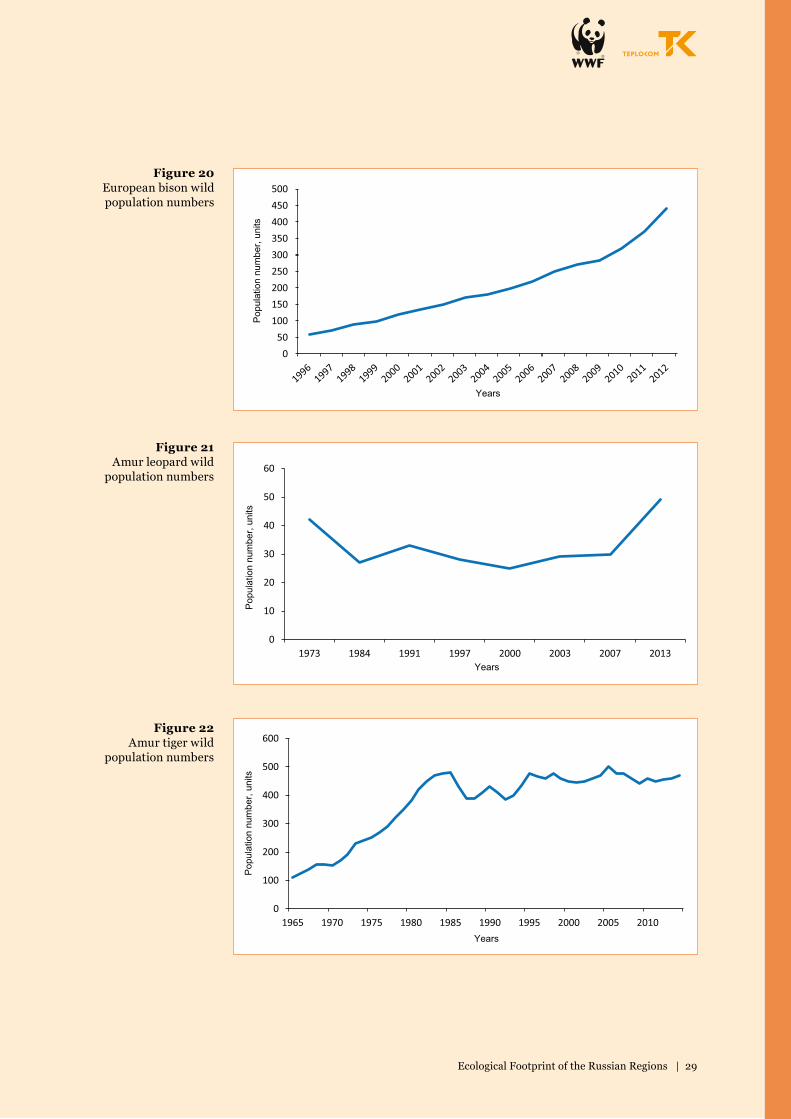
Figure 20European bison wild population numbers
Figure 21Amur leopard wild
population numbers
Figure 22Amur tiger wild
population numbers
Ecological Footprint of the Russian Regions | 29
050
100150200250300350400450500
Years
Pop
ulat
ion
num
ber,
units
0
10
20
30
40
50
60
1973 1984 1991 1997 2000 2003 2007 2013Years
Pop
ulat
ion
num
ber,
units
0
100
200
300
400
500
600
1965 1970 1975 1980 1985 1990 1995 2000 2005 2010Years
Pop
ulat
ion
num
ber,
units

30 | Ecological Footprint of the Russian Regions
sECTION 2wHAT Is RussIA’s sITuATION?Russia has 941 million gha of biocapacity and an Ecological Footprint of 569 million gha, giving it a reserve of about 372 million gha (as of 2009). Only Brazil has a total biocapacity reserve larger than Russia’s. Russia’s per capita biocapacity, however, is growing, while Brazil’s has been in a steep decline.

Ecological Footprint of the Russian Regions | 31
© С
ЕРГЕ
Й ТР
ЕПЕТ / W
WF РО
ССИИ

32 | Ecological Footprint of the Russian Regions
From 1961 to 1991, the Soviet Union’s per capita Ecological Footprint increased 40 per cent as its per capita biocapacity declined by 23 per cent. By the time it broke apart, the Soviet Union — which held a biocapacity reserve 50 years ago — was running a significant biocapacity deficit. (See Figure 23).
The causes of the Soviet Union’s ecological decline are easily identified. Its population between 1961 and 1991 increased 33 per cent, while per capita demand on biocapacity grew 40 per cent during the same period. The impacts from inefficient energy usage and residents’ growing demands for fossil fuels were especially significant during this continuous 30-year Footprint increase. (See Figures 24-26).
Russia’s emergence as a biocapacity-wealthy nation is attributed to a number of factors. Upon independence, the Russian Federation had a smaller population and a larger per capita share of biocapacity than did the USSR. The economic shock that followed Russia’s first years of independence decreased economic activities and with it resource demand (see Section 2.3). Per capita consumption immediately decreased in almost all Footprint categories, with carbon emissions dropping by 28 per cent between 1992 and 1998.
2.1. ussR / RussIAN FEdERATION: BIOCAPACITY
ANd FOOTPRINT TImE TRENds
Figure 23
0
50 000
100 000
150 000
200 000
250 000
300 000
350 000
0
200 000 000
400 000 000
600 000 000
800 000 000
1 000 000 000
1 200 000 000
1 400 000 000
1 600 000 000
1 800 000 000
1961 1967 1973 1979 1985 1991 1997 2003 2009
Popu
latio
n
Glob
al h
ecta
res
Динамика биоемкости, экологического следа и численности населения в Российской Федерации
Biocapacity total
Ecological Footprint total
Population
Figure 24 Russian Federation Footprint, Biocapacity, and Population Trends
0,0
1,0
2,0
3,0
4,0
5,0
6,0
7,0
1961
1964
1967
1970
1973
1976
1979
1982
1985
1988
1991
1994
1997
2000
2003
2006
2009
Glo
bal H
ecta
res
per c
apita
Biocapacity and Ecological Footprint: global supply and demand dynamics
Deficit
Reserve
Ecological Footprint
BiocapacityUSSR Russian Federation

Ecological Footprint of the Russian Regions | 33
In short, while per capita biocapacity jumped, a much smaller population and a rapid drop in per capita demand caused a swift reduction in Russia’s total Footprint. The result was a boon to the nation’s biocapacity situation.
Since independence, Russia’s per capita biocapacity has fluctuated between 6.0 gha and 6.6 gha (with important gains in the forest component), with a small but continual increase from 1998 to 2008. Russia’s Ecological Footprint has been more turbulent: A steep cut from a per capita high of 5.7 gha in 1992 to a low of 3.2 gha in 1998, then climbing to 4.4 gha in 2008.
Russia’s Ecological Footprint dipped to 4.0 gha per person in 2009, mostly due to a decline in demand for fossil fuel and hence a decreased carbon Footprint.
In 2009, Russia’s per capita Ecological Footprint was 4.0 gha. Russia was ranked 51st highest at the global level, with its per capita Footprint about 1.5 times the world average of 2.6 gha. In comparison, the average per capita Ecological Footprint in the BRIICS countries (Brazil, Russia, India, Indonesia, China, and South Africa) was 2.3 gha, and the average in the European Union was 5.2 gha. Those averages were 60 per cent and 130 per cent of Russia’s Ecological Footprint, respectively. Russia’s largest component of its overall Footprint was carbon (60 per cent), followed by cropland (21 per cent) and forest products (10 per cent).
Figure 25
Figure 26
0
1
2
3
4
5
6
1961
1964
1967
1970
1973
1976
1979
1982
1985
1988
1991
1994
1997
2000
2003
2006
2009
Glo
bal h
ecta
res p
er c
apita
Russian Federation EF 1961- 2009
Built-up Footprint
Fish Footprint
Forest Products Footprint
Grazing Footprint
Crop Footprint
Carbon Footprint
0
1
2
3
4
5
6
7
1961
19
63
1965
19
67
1969
19
71
1973
19
75
1977
19
79
1981
19
83
1985
19
87
1989
19
91
1993
19
95
1997
19
99
2001
20
03
2005
20
07
2009
Glo
bal h
ecta
res p
er c
apita
Russian Federation BC 1961- 2009
Built-up Land
Fishing Grounds
Forest Land
Grazing Land
Crop Land
Russian Federation Biocapacity 1961 - 2009
Russian Federation Ecological Footprint 1961 - 2009

34 | Ecological Footprint of the Russian Regions
Even during the Soviet Union’s final years, when its biocapacity deficit grew ever larger, the country remained primarily dependent on its own biocapacity. As Figure 29 shows, the Soviet Union’s Footprint of Consumption and its Footprint of Production grew in parallel until they started to diverge in the 1980s. This suggests that imports supplied relatively little of the country’s resource demands until its dissolution in the 1990s, and that the Soviet Union maintained its biocapacity deficit by liquidating its natural capital and overusing the global commons.
In contrast, Russia has been exporting more of its resource base since 1994 than the Soviet Union during the last 30 years of its existence.
Russia’s reported 4.0 gha per capita Ecological Footprint is a measure of its Footprint of Consumption. The 2009 Footprint of Production (4.5 gha per capita), compared with the Footprint of Consumption, indicates the difference between Russia’s domestic resource use and growing export demands (the difference of 0.5 gha per person corresponds to the embodied resources in net exports).
Unlike for many countries with biocapacity reserves, Russia’s larger Footprint of Production is still within its resource limits.
2.2. FOOTPRINT OF CONsumPTION Vs.
FOOTPRINT OF PROduCTION

Ecological Footprint of the Russian Regions | 35
Figure 27
Figure 28
Figure 29
Russian Federation EF Consumption Time Series
Russian Federation EF Production Time Series
Russian Federation EFc and EFp Time Series
0
1
2
3
4
5
6
1961
1964
1967
1970
1973
1976
1979
1982
1985
1988
1991
1994
1997
2000
2003
2006
2009
GH
A P
er C
apita
Динамика экологического следа потребления в Российской Федерации
Carbon
Total EF
Non-Carbon EF
0
1
2
3
4
5
6
1961
1964
1967
1970
1973
1976
1979
1982
1985
1988
1991
1994
1997
2000
2003
2006
2009
GH
A P
er C
apita
Динамика экологического следа производства в Российской Федерации
Carbon
Total EF
Non-Carbon EF
2
2.5
3
3.5
4
4.5
5
5.5
6
1961 1969 1977 1985 1993 2001 2009
Glob
al h
ecta
res p
er ca
pita
Russian Federation EFc and EFp Timeseries
Net Import
Net Export
EF production
EF consumption

36 | Ecological Footprint of the Russian Regions
National progress toward meeting development goals can be assessed by using the United Nations’ Human Development Index (HDI), which aggregates education, longevity and income into one number (UNDP, 2013).
UNDP defines an HDI score of 0.7 as the threshold for high development. The biocapacity
available on the planet is calculated as 1.8 gha per person. Combining these two thresholds gives clear minimum conditions for globally sustainable human development (see Figure 30). Countries in the light-blue section of the lower right-hand box exhibit high levels of development within globally replicable resource demand. As of 2009 no countries occupy the dark-blue section, which represents very high levels of sustainable development.
The traditional path to development has been resource-intensive: Higher development achievements have involved increased resource use. However, access to growing levels of ecological resources is no longer guaranteed in today’s world, and this reality may threaten long-term improvements in human welfare if the conventional path is taken. Countries that pursue the path of sustainable development will be best positioned to meet their future needs.
2.3. wORLd HdI — FOOTPRINT
Figure 30 The Ecological Footprint in relation
to the HDI. Russian Federation’s time trend is shown for the years 1992 to
2009. The shading in the background of this figure indicates the HDI
thresholds for high and very high human development, based on UNDP,
2013 (Global Footprint Network, 2013).
Very High Human
Development
High Human
Development
World biocapacity per capita 2009
World biocapacity per capita 1961
0
2
4
6
8
10
12
14
0
2
4
6
8
10
12
14
0.0 0.2 0.4 0.6 0.8 1.0
Ecol
ogic
al F
ootp
rint
(gha
per
cap
ita)
U.N. Human Development Index (HDI)
Russian Federation Ecological Footprint-HDI, 1992-2009 Africa
Middle East/Central Asia
Asia-Paci�c
South America
Central America/Caribbean
North America
EU
Other Europe
Country Timeseries
Minimum Sustainable Development Quadrant

Ecological Footprint of the Russian Regions | 37
Russia has shown great success in the area of human development. Figure 30 tracks Russia’s progress in terms of resource and human development from 1992-2009. Even through the 1990s, when its economy experienced a rapid decline and its demands on biocapacity dropped dramatically, Russia registered minimal setbacks as a high-ranking HDI country, with high standards of health and education.
However, Russia is now demanding more biocapacity per person than is globally available, and the world’s growing population is increasing that discrepancy. And for several years, Russia appeared to have increased its residents’ HDI at the expense of higher demands on its biocapacity: As Russia’s HDI climbed steadily between 1998 and 2009, so did its Ecological Footprint.
Russia’s Ecological Footprint dropped in 2009 without affecting its progress in HDI; however, this trend is unlikely to continue, as the decrease was largely due to a temporary decline in demand for fossil fuel corresponding with the global economic downturn.
Very High Human
Development
High Human
Development
World biocapacity per capita 2009
World biocapacity per capita 1961
0
2
4
6
8
10
12
14
0
2
4
6
8
10
12
14
0.0 0.2 0.4 0.6 0.8 1.0
Ecol
ogic
al F
ootp
rint
(gha
per
cap
ita)
U.N. Human Development Index (HDI)
Russian Federation Ecological Footprint-HDI, 1992-2009 Africa
Middle East/Central Asia
Asia-Paci�c
South America
Central America/Caribbean
North America
EU
Other Europe
Country Timeseries
Minimum Sustainable Development Quadrant

38 | Ecological Footprint of the Russian Regions
Human demand on biocapacity reaches across the globe. A biocapacity-rich nation, for example, might use only a fraction of what its biocapacity provides for domestic consumption, but puts additional demand on its ecosystems for producing export goods. Inversely, a biocapacity deficit can be maintained not only through domestic overuse, but also through imports and a reliance on the global commons. To more fully understand a population’s
resource demands, then, means to track both local production and consumption trends, as well as trends in trade.
Two of Russia’s primary trading partners — China and the Netherlands — are illustrative examples of foreign countries’ impact on Russia’s Ecological Footprint and biocapacity situation, and Russia’s impact on theirs.
ChinaThe structure of Russian export to China generally reflects the overall commodity-based nature of Russia’s external trade. Thus mineral fuels, specifically crude and refined oil, account for 65 – 70 per cent of the monetary value of Russia’s total exports to China, followed by wood and wood products at 5 – 8 per cent. Russian roundwood is a particularly important import commodity for China: According to 2013 official trade statistics, Russian roundwood made up 24 per cent of all roundwood imported into China in the first nine months of the year (8.56 million cubic meters)3.
Export of illegally logged wood and wood products (and in particular round wood) to China negatively impacts wildlife conservation goals in Siberia and the Russian Far East. While illegal logging has dramatically decreased in the European part of Russia (thanks in part to WWF efforts and extensive Forest Stewardship Council certification), it still poses a threat to biodiversity conservation to the east of the Urals (see Forestry section).
The volume of Russian electricity export to China is relatively modest as compared to energy exports to the EU countries, but it has been steadily increasing (2011 alone saw a more than 26 per cent increase compared to
2.4. ECOLOGICAL FOOTPRINT ANd
INTERNATIONAL TRAdEPavel Boev,
WWF-Russia
Figure 31 China’s Ecological
Footprint and biocapacity trends from 1961 to
2009 (Global Footprint Network, 2013)
0,0
0,5
1,0
1,5
2,0
2,5
1961 1965 1969 1973 1977 1981 1985 1989 1993 1997 2001 2005 2009
Glo
bal H
ecta
res
per c
apita
Ecological Footprint Biocapacity
3 Unless specified otherwise, cited trade statistics are as reported by the Integrated Foreign Economic Information Portal / Ministry of Economic Development.

Ecological Footprint of the Russian Regions | 39
2010) and it will likely grow dramatically in coming decades. The proposed construction of at least two new major hydropower projects, with a total capacity of 10GW, in the Russian Far East is largely intended to meet more of China’s energy demands. If these hydropower projects help shut down existing coal-powered plants, they could potentially reduce fossil fuel use, the associated CO2 emissions and black carbon pollution in China, the world’s Number 1 consumer of coal. But the benefits are uncertain: Rather than replacing current coal-based energy sources, these dams may only add to China’s energy consumption. And their construction would threaten biodiversity of Russia’s Far East and jeopardize the stability of the freshwater ecosystems in the Amur Basin.
China accounts for up to 10.6 per cent of Russia’s total trade turnover (in monetary terms). Even though Russia enhances its economic position by exporting its natural capital (especially timber and hydropower) to China, unsustainable production of these commodities can undermine future productivity.
China’s Footprint has been growing at an ever-increasing pace since 1973 (Figure 31). In addition, it has turned from being a net-exporter of biocapacity to becoming a net importer of biocapacity since the mid-1990s (Figure 32). If current trends persist, it would not take long before China’s demand for resources exceeds what Russia could ever supply.
China, the world’s largest net exporter of goods and services (in monetary terms), has in the past 20 years become increasingly dependent on the biocapacity of other nations to sustain its economy and growing domestic consumption. It is now also putting increased pressure on the global commons—particularly on forests and oceans, which are required to sequester its carbon dioxide emissions—as well as overexploiting its own resources. China’s net import of biocapacity makes the country vulnerable to supply disruption and price volatility inherent in any dependence on external suppliers. The carbon deficit is not yet an economic challenge, but could increasingly represent a risk as well, if the effort to access fossil fuel becomes increasingly higher, or if humanity agrees on and implements the phasing out of fossil fuels.
This growing dependence on external biocapacity, and China’s transformation in the late 1980s from a net Footprint exporter to net importer, are illustrated
Figure 32 China has been a net
importer of biocapacity since the mid-1990s. This means that the
biocapacity embodied in imports now exceeds the biocapacity embodied in
exports (Global Footprint Network, 2013)

40 | Ecological Footprint of the Russian Regions
in Figure 32. Even as China’s Ecological Footprint exceeded its biocapacity by the early 1970s, China was still a net exporter of biocapacity: it exported more biocapacity (embodied in goods and services, and including carbon emissions) than it got back from its trading partners. By the early 1990s, when its Ecological Footprint began to expand at a fast rate, China’s net balance had shifted. Today, China’s Ecological Footprint is twice as large as what its ecosystems can renew, a deficit made up in part by its reliance on other nations’ biocapacity (through trade or via carbon emissions).
The NetherlandsRussia’s bilateral trade with the Netherlands provides a graphic case study of how exports can impact both consumer and provider.
As the Footprint of imported goods and services is added to the importing nation’s total Footprint (see page 6 graphic and appendices), some of the Netherlands’ Footprint of cropland and grazing land for food production consumed by the Russian population (i.e., the Footprint) is assumed by Russia. Physically, however, these fields and pastures are located in the Netherlands, adding to the environmental stress in this densely populated country.
The converse is true, too. Crude and refined oil, petroleum products, natural gas, and coal account on the average for around 80 per cent of the Russia’s total export value to the Netherlands (a figure which rose to 88.5 per cent in the first quarter of 2013, as reported by the Russian Ministry of Economic Development)4.
These Russian exports add to the Netherlands’ carbon Footprint component that accounts for almost half of the country’s total Ecological Footprint (Figure 34), and contribute to the accumulation of greenhouse gases in the global atmosphere.
In Russia, there is a more immediate environmental impact associated with the extraction of fossil fuel for exports.
To maintain reasonable living standards and high human development, since 1998 Russia has been increasing oil extraction5, often at the expense of
Figure 33 Trade is a major
mechanism for the Netherlands to access
resources it does not have available within its
boundaries. Figure 33 shows how consistently
large the net-imports in the Netherlands
have been over recent decades (Global Footprint
Network, 2013)
4 Integrated Foreign Economic Information Portal / Ministry of Economic Development: http://www.ved.gov.ru/exportcountries/nl/nl_ru_relations/nl_ru_trade/ 5 US Energy Information Administration, 2014, http://www.eia.gov/countries/country-data.cfm?fips=RS
0
1
2
3
4
5
6
7
8
1961
1964
1967
1970
1973
1976
1979
1982
1985
1988
1991
1994
1997
2000
2003
2006
2009
Glo
bal h
ecta
res
per c
apita
Net Imports
EF Consumption
EF Production

Ecological Footprint of the Russian Regions | 41
eroding biocapacity reserves and endangering the ecosystem services they provide.
Russia’s extractive industries are largely inefficient: The average oil recovery factor for exploited oilfields hardly reaches 38 per cent6, while associated flaring contributes greatly to Russia’s carbon emissions and local pollution (see Flaring section). Poorly performing technology and no incentives for investing in technological improvement discourage the full use of the capacity of oil and gas fields, and operators — instead of investing in technical modernization at existing fields — more often move to other locations once their current deposits no longer yield high returns.
Russia’s oil exports carry other environmental risks. Most of the fossil fuels exported to the Netherlands (and the EU in general) are transported to the Russian border by a land-based pipeline infrastructure. Constructed in the 1970s and 1980s, these pipelines often cut through and fragment important habitats, which is particularly destructive in the fragile arctic and subarctic ecosystems. Pipeline leaks, too, both damage the environment and cause significant financial losses (the Russian government estimated oil losses at 17–20 million tons in 20107).
This economic dimension is frequently overlooked in the debate over environmental degradation. For many years, the EU’s dependence on Russian oil and gas has been the subject of heated political debate in the West. Yet this is a mutual dependence, and one that makes Russia’s economic development and human welfare heavily dependent on fossil fuel price volatility. In recent years, high oil and gas prices and the guaranteed demand in the EU have both delayed Russia’s economic diversification, and encouraged further exploitation of its mineral wealth, including environmentally risky offshore drilling in the Arctic.
The NetherlandsWith a service-sector oriented, post-industrial economy, the Dutch are able to generate high average incomes for their residents. This income enables high standards of living and levels of consumption in the Netherlands. In financial terms it remains one of the world’s major exporting countries of goods and services. But in physical terms, it is a significant importer of biocapacity. Even the Netherlands’ Footprint of production is significantly larger than the country’s biocapacity, adding to the nation’s risk of economic instability in an era increasingly shaped by ecological constraints.
Figure 34 Ecological Footprint per capita in Netherlands by component, 1961–2009
6 Minutes of the Presidential Fuel and Energy Complex Commission meeting, Moscow, February 2013http://www.kremlin.ru/news/17511 7 Ministry of Economic Development, 2011 http://www.economy.gov.ru/wps/wcm/connect/eef56e80447195d5a577e5af753c8a7e/zakl.doc?MOD=AJPERES&CACHEID=eef56e80447195d5a577e5af753c8a7e
0
1
2
3
4
5
6
7
8
1961 1965 1969 1973 1977 1981 1985 1989 1993 1997 2001 2005 2009
Glo
bal h
ecta
res
per c
apita
Carbon Footprint Built-up Footprint
Fish Footprint Forest Products Footprint
Crop Footprint Grazing Footprint

42 | Ecological Footprint of the Russian Regions
GAs FLARING REduCTION: OPPORTuNITIEs FOR INCREAsEd REsOuRCE EFFICIENCY IN RussIA~Alexey Knizhnikov, WWF-RussiaGas flaring, the venting or uncontrolled combustion of gas associated with petroleum exploitation, represents a significant resource inefficiency in Russia.
© G
LOB
AL W
AR
MIN
G IM
AG
ES
/ WW
F-CA
NO
N

In 2011, 140 billion cubic meters of natural gas was flared worldwide, 85 per cent of which originated from 20 countries. Russia, the world’s largest contributor of flaring-related greenhouse gas emissions, accounted for 26.7 per cent of global flaring (see Figure 35).
Beyond the CO2 emissions and obvious source of local pollution, the lack of economic use of this valuable resource erodes national competitiveness and reduces energy security. In 2011, Russia’s petroleum fields flared about 35 billion cubic meters of natural gas without any industrial benefit — an annual economic loss of more than $5 billion, according to the World Bank.
Some regions, such as Khanty–Mansi Autonomous Okrug, and companies operating in Russia have reported great progress in flaring reduction. Other regions, particularly in Eastern Siberia, have increased flaring (see Figures 36 and 37). Indeed, the volume of gas associated with petrol extraction in Eastern Siberia is four times less than that of Khanty–Mansi Autonomous Okrug — but Eastern Siberia’s gas flaring is 1.5 times greater. (In Eastern Siberia’s Krasnoyarsk Krai, for instance, 98.5 per cent of all associated petroleum gas is lost to flaring. See Figure 38.)
Since 2009, WWF-Russia has led a public campaign to support associated petroleum gas (APG) utilization and flaring reduction. WWF-Russia engages in policy dialogue with government agencies and oil and gas companies to promote regulatory frameworks and corporate policies and standards that restrict flaring and facilitate economic utilization of APG through market-oriented structures, such as open third-party access regimes and cost-reflective pricing. WWF-Russia has also called on the federal government and main oil producing-regions and companies to join the Global Gas Flaring Reduction (GGFR) partnership of the World Bank.
Figure 35 Twenty countries were
responsible for 85 per cent of the world’s gas
flaring in 2011. This was equivalent to 30 per cent of the EU's
gas consumption, and represents 1.2 per cent of global emissions of
carbon dioxide per year. Russia was responsible
for 26.7 per cent of total global flaring — about
twice as much as second-ranked Nigeria
Ecological Footprint of the Russian Regions | 43

The utilization of flarable gas in Russia is only about 75 per cent. This points to dramatic opportunities for improved performance and economic gain. The KhMAO region of Russia, for example, had only 78.5 per cent utilization of APG in 2007; today it has about 90 per cent utilization. When Azerbaijan joined the GGFR partnership in 2008, it was utilizing 90 per cent of its APG. Within two years, Azerbaijan’s national oil company SOCAR had reduced APG flaring and venting by almost half. By 2013, Azerbaijan had reached 96 per cent utilization.
Figure 36 Flaring of associated petroleum gas (in bln. m3) in the Russian regions, 2010 – 2012
APG flaring in Russia by extraction region, 2010–2012
44 | Ecological Footprint of the Russian Regions

Figure 37 Extraction of associated petroleum gas (in bln. m3) in the Russian regions, 2010 – 2012
Figure 38 Level of APG utilization by Russia’s main oil companies, 2010 – 2012
Extraction of associated petroleum gas in the Russian regions, 2010–2012
Level of APG utilization by Russia’s main oil companies, 2010–2012
Ecological Footprint of the Russian Regions | 45

46 | Ecological Footprint of the Russian Regions
sECTION 3RussIA’s FEdERAL suBjECTs: wHERE dO THEY sTANd?Fully understanding Russia's supply of and demand on ecological services requires considering the disparity in natural capital and resource use among Russia’s 83 Federal Subjects: In 2009, seven Federal Subjects alone contributed 49 per cent of Russia’s biocapacity; 12 Federal Subjects contributed 50 per cent of Russia’s Ecological Footprint.

Ecological Footprint of the Russian Regions | 47
© В
ЛАДИМИР ФИЛОНОВ / W
WF РО
ССИИ

48 | Ecological Footprint of the Russian Regions
Fully understanding Russia's supply of and demand on ecological services requires considering the disparity in natural capital and resource use among Russia’s Federal Subjects: In 2009, seven Federal Subjects alone contributed 49 per cent of Russia’s biocapacity; 12 Federal Subjects contributed 50 per cent of Russia’s Ecological Footprint.
The per capita biocapacity of each Federal Subject is a function of both population and land productivity. A total of 26 Russian Federal Subjects were found to have a greater per capita biocapacity value than the national average biocapacity of 5.5 gha per capita; seven of those are categorized as “extremely high biocapacity states,” with seven to almost 96 times the national average of terrestrial biocapacity. Out of these 26 top biocapacity-wealthy Federal Subjects, Tyumen Oblast (which includes Yamalo-Nenets Autonomous Okrug and Khanti-Mansi) had an Ecological Footprint of 4.4 gha per capita, and Komi Republic had an Ecological Footprint of 4.1 gha per capita; both Footprint values were greater than the national average of 4 gha per person.
3.1. BIOCAPACITY dEFICIT ANd REsERVE
IN THE FEdERAL suBjECTs
Figure 39
Biocapacity Deficit and Reserve of Russian Federal Subjects
7
2640
80
29
8
27
30
28
51
79
35
54
78
19
523
20
31
83
18
33
52
21
8
17
36
25
122
1673
69
68
27
2
67
77
81
34
12
66
76
11 65
71
82
43
6
74
39
4
38
75 14
49
72
53
56
47
24
59
3
57
58
10
5045
46
9
44 55
3748
15
13
70
63
64
6261
41
60
42
32
ECOLOGICAL FOOTPRINT EXCEEDS BIOCAPACITY BY
BIOCAPACITYEXCEEDSECOLOGICAL FOOTPRINT BY
> 150 %
100 - 150 %
50 - 100 %
0 - 50 % > 200 %
100 - 200 %
50 - 100 %
0 - 50 %

Ecological Footprint of the Russian Regions | 49
All of the middle- and low-ranked biocapacity Federal Subjects reported smaller biocapacity values than the national average. Only two of the middle-ranked Federal Subjects had a Footprint larger than the national average (Sverdlovsk Oblast, 4.6 gha, and Sakhalin Oblast, 4.3 gha) as did nine of the low-ranked Federal Subjects (Dagestan Republic reporting the highest Footprint in this category, at 6.5 gha).
Figure 40
Figure 41
0
100
200
300
400
500
600
Chukotka Autonomous Okrug
Sakha (Yakutia) Republic
Magadan Oblast Kamchatka Krai Krasnoyarsk Krai
Glo
bal h
ecta
res p
er ca
pita
Federal Subjects with Extremely High Biocapacity
Ecological Footprint
Biocapacity
0
5
10
15
20
25
Glo
bal h
ecta
res p
er ca
pita
Federal Subjects with High Biocapacity Ecological Footprint
Biocapacity

50 | Ecological Footprint of the Russian Regions
Note for graphs: Total biocapacity at the sub-national level is calculated using a top-down approach: Net Primary Productivity (NPP) estimates are used to allocate the national biocapacity of Russia (calculated in Russia’s National Footprint Accounts) to the Federal Subjects. NOTE: In this graph, data reported for the Arkhangelsk region also include Nenets Autonomous Okrug data; data reported for the Tyumen region include Yamalo-Nenets Autonomous Okrug and Khanti-Mansi data.
As data was unavailable indicating which portion of the fishing grounds is allocated to which Federal Subject, the fish component was excluded from the biocapacity assessment of the Federal Subjects. All biocapacity calculations of Russia’s Federal Subjects therefore pertain only to terrestrial biocapacity.
Figure 42
Figure 43
0
1
2
3
4
5
6
Glo
bal h
ecta
res p
er ca
pita
Federal Subjects with Middle Biocapacity Ecological Footprint
Biocapacity
0
1
2
3
4
5
6
7
Glo
bal h
ecta
res p
er c
apita
Federal Subjects with Low Biocapacity Ecological Footprint
Biocapacity

Ecological Footprint of the Russian Regions | 51
Fourteen of the 23 middle- and all 34 of the low-ranked Federal Subjects reported biocapacity deficits. As expected, the largest per cent deficits were found in Moscow (39,638 per cent), St. Petersburg (22,923 per cent) and Moscow Oblast (952 per cent), all densely populated urban areas that are dependent on the hinterlands to supply their resource needs. However, larger Federal Subjects also reported staggering deficits: Republic of Dagestan, distinguished with Russia’s largest per capita Footprint, runs an 822 per cent deficit, for example, and Chelyabinsk Oblast a 263 per cent deficit.
All of the 49 Federal Subjects included in the highest-, high- and middle-ranked biocapacity categories reported a greater biocapacity value than the global average of 1.8 gha per person.
Only 3 Federal Subjects had an Ecological Footprint at or below the global per capita biocapacity (Altai Republic, 1.8 gha; Tuva Republic, 1.7 gha; and Republic of Kalmykia, 1.6 gha). And only 17 of Russia’s Federal Subjects reported an Ecological Footprint size smaller than or as small as the world average Footprint of 2.6 gha per person.
Figure 44 Top ten federal subjects in terms of contribution
toward Russia’s total Ecological Footprint
(Global Footprint Network, 2013)
12%
6%
5%
4%
4%
3%
3%
3% 3%
3%
54%
Top Ten Contributors to Russia's Ecological Footprint Moscow City Moscow Oblast St. Petersburg
Krasnodar Krai Republic of Bashkortostan Sverdlovsk Oblast
Republic of Dagestan Republic of Tatarstan Rostov Oblast
Tyumen Oblast Other

52 | Ecological Footprint of the Russian Regions
Individuals’ daily activities are primary Footprint drivers. Socio-economic factors, income level, food, goods and services consumed, as well as the wastes generated, all contribute to a country’s per capita Ecological Footprint.
Even though citizens have little direct control over how a country produces its electricity or how companies produce goods and services, households do have a substantial influence on decisions made by governments and businesses in the long-term. It is therefore important to
understand how much individuals’ daily activities contribute to a country’s Footprint size and composition.
The overall Ecological Footprint contains three types of consumption: 1) short-term consumption paid for by households (HH); 2) short-term consumption paid for by government (GOV), such as police equipment, school supplies for public schools, paper for public administration; and 3) lasting goods and services, or “gross fixed capital formation” (GFCF), such as construction of housing, bridges, roads and factories.
The first component is further broken down into five categories: food, housing, transport, goods and services. This breakdown provides the basic data to identify the size of the various Ecological Footprint components, which enables government and private sector decision-makers to focus on potential areas and strategies to reduce overall Footprints.
3.2. ECOLOGICAL FOOTPRINT ANd TYPEs
OF CONsumPTION
Figure 45 Ecological Footprint
of each Federal Subject by consumption activity
(Global Footprint Network, 2013)
0
1
2
3
4
5
6
7
Russ
ian
Fede
ratio
n
Repu
blic
of D
ages
tan
Mos
cow
City
Repu
blic
of B
ashk
orto
stan
St. P
eter
sbur
g
Repu
blic
of T
atar
stan
Kras
noda
r Kra
iYa
mal
o-N
enet
sAu
tono
mou
s Okr
ugSv
erdl
ovsk
Obl
ast
Chec
hen
Repu
blic
Mos
cow
Obl
ast
Astr
akha
n O
blas
tKh
anty
-Man
siAu
tono
mou
s Okr
ug
Tyum
en O
blas
t
Rost
ov O
blas
t
Sakh
alin
Obl
ast
Stav
ropo
l Kra
i
Sam
ara
Obl
ast
Kom
i Rep
ublic
Kaba
rdin
o-Ba
lkar
Rep
ublic
Volg
ogra
d O
blas
t
Perm
Kra
iRe
publ
ic o
f Nor
thO
sset
ia –
Ala
nia
Nov
osib
irsk
Obl
ast
Chel
yabi
nsk
Obl
ast
Mur
man
sk O
blas
t
Om
sk O
blas
t
Sakh
a (Y
akut
ia) R
epub
lic
Nizh
ny N
ovgo
rod
Obl
ast
Food Housing Personal TransportationGoods Services GovernmentGross Fixed Capital Formation
Glo
bal h
ecta
res p
er c
apita

Ecological Footprint of the Russian Regions | 53
Ecological Footprint can be analyzed for any population. For this report, we analyzed the Footprint of Federal Subjects — and they show considerable variation (Figures 45-47). Differences in lifestyle, economic structure, and the carbon Footprint required to generate each unit of electricity, as well as geographical and cultural differences, affect the Ecological Footprint.
Looking at the final demand category level, the main contributor of Russia’s Ecological Footprint comes from direct household spending for short-term consumption, accounting for 70 per cent of total demand. This means that daily decisions made at the household level have the power to change the course of Russia’s Ecological Footprint trends.
Among the daily consumption and service categories shaping the “direct household expenditure” component, those that contributed the most to the Ecological Footprint were “Food” (with a low of 23 per cent in Nenets Autonomous District to a high of 64 per cent in the Chechen Republic), and “Housing” (a low of 10 per cent in Chechen Republic and a high of 40 per cent in Moscow Oblast). Transportation was also a large contributor in Nenets (38 per cent), Moscow city (32 per cent) and the Republic of Bashkortostan (32 per cent).
Each of these categories impacted the Federal Subjects’ Footprint differently. The “Food” category put more demand on cropland, grazing land and fishing grounds than it did on other land-use types. The other two household activities caused a demand mainly on the carbon sequestration capacity of the planet.
Figure 46 Ecological Footprint
of each Federal Subject by consumption activity
(Global Footprint Network, 2013)
0
0,5
1
1,5
2
2,5
3
3,5
4
Belg
orod
Obl
ast
Repu
blic
of B
urya
tia
Leni
ngra
d O
blas
t
Kalu
ga O
blas
t
Kalin
ingr
ad O
blas
t
Zaba
ykal
sky
Krai
Lipe
tsk
Obl
ast
Kem
erov
o O
blas
t
Repu
blic
of A
dyge
aN
enet
sAu
tono
mou
s Okr
ugSm
olen
sk O
blas
t
Nov
goro
d O
blas
t
Kras
noya
rsk
Krai
Kare
lia R
epub
lic
Khab
arov
sk K
rai
Ore
nbur
g O
blas
t
Tula
Obl
ast
Uly
anov
sk O
blas
t
Tam
bov
Obl
ast
Brya
nsk
Obl
ast
Penz
a O
blas
t
Kurs
k O
blas
t
Sara
tov
Obl
ast
Orlo
v O
blas
t
Psko
v O
blas
t
Arkh
ange
lsk O
blas
t
Alta
i Kra
i
Ryaz
an O
blas
t
Food Housing Personal TransportationGoods Services GovernmentGross Fixed Capital Formation
Glo
bal h
ecta
res p
er c
apita

54 | Ecological Footprint of the Russian Regions
To reduce sub-national Footprints, it is important to understand the complex connections between international and inter-provincial supply chains and consumption patterns. Unique provincial features, such as geographic conditions and culture, also play an important role. These variations demonstrate the need for the adoption of state and regionalized Ecological Footprint assessments to wisely manage ecological assets. Maintaining and enhancing biocapacity — especially at a sub-national scale — is critical for achieving sustainable standards of living.
Figure 47Ecological Footprint
of each Federal Subject by consumption activity
(Global Footprint Network, 2013)
0
0,5
1
1,5
2
2,5
3
Udm
urt R
epub
lic
Chuv
ash
Repu
blic
Tver
Obl
ast
Repu
blic
of I
ngus
hetia
Kurg
an O
blas
t
Kara
chay
–Che
rkes
s Rep
ublic
Irkut
sk O
blas
t
Kiro
v O
blas
t
Voro
nezh
Obl
ast
Mag
adan
Obl
ast
Yaro
slavl
Obl
ast
Tom
sk O
blas
t
Mar
i El R
epub
lic
Amur
Obl
ast
Prim
orsk
y Kr
ai
Volo
gda
Obl
ast
Jew
ish A
uton
omou
s Obl
ast
Repu
blic
of K
haka
ssia
Kost
rom
a O
blas
t
Ivan
ov O
blas
t
Kam
chat
ka K
rai
Chuk
otka
Aut
onom
ous O
krug
Vlad
imir
Obl
ast
Repu
blic
of M
ordo
via
Alta
i Rep
ublic
Tuva
Rep
ublic
Repu
blic
of K
alm
ykia
Food Housing Personal TransportationGoods Services GovernmentGross Fixed Capital Formation
Glo
bal h
ecta
res p
er c
apita

Ecological Footprint of the Russian Regions | 55
Russia has made notable progress over the last 20 years in implementing policies that enable residents to improve the quality of their life. Every Federal Subject can be categorized as having a medium-, high-, or very high-HDI* value, and compares favourably with much of the world (see Figure 48).
3.3. AdjusTEd HdI ANd ECOLOGICAL FOOTPRINT
IN THE RussIAN REGIONs
The Human development IndexIn the early 1990s, Indian economist and Nobel laureate Amartya Sen and former Finance Minister of Pakistan Mahbub ul Haq created a measure for human development that was simple, outcome based, and not solely focused on income. The result, published by the United Nations Development Programme, was the Human Development Index — now the most prominent alternative progress measure to GDP (UNDP, 2013).
The Human Development Index (HDI) is composed of three domains: longevity, basic education and income. For the last component, the logarithm of income is measured, since an extra dollar to a high-income person is worth less than the extra dollar to a low-income person.
The basic formula is explained in the global Human Development Report (see Section 2.3). In this and the following section, Federal Subjects’ HDI rankings were calculated using regional GDP, from which extractive income was excluded. This makes the calculation more consistent with the intention behind the HDI, which focuses on the ability to generate income. Hence the number should not include income from liquidation of assets.
This slight modification (i.e., “adjusted HDI”) helps rectify the bias toward low-population density regions with large extractive sectors. In those regions, the reported GDP does not necessarily translate into local income since the assets may be held by people and entities outside the Federal Subject.
The data table (see pp. 84-87) shows the calculation as well as the HDI calculated from unadjusted GDP numbers.

56 | Ecological Footprint of the Russian Regions
In 2009, 18 Federal Subjects were classified as having Medium Human Development, that is an HDI value below the 23rd per centile of all Federal Subjects; 61 were classified as having High Human Development, that is an HDI value between the 23rd and 98th per centile of all Federal Subjects; and one had Very High Human Development (above 98th per centile).
During the same period, however, the Ecological Footprint of every Federal Subject exceeded the global average available per capita biocapacity of 1.8 global hectares.
More study is required to determine which Federal Subjects have most improved well-being at the expense of resource security, and which Subjects remain most exposed (time trends are not presently available at the sub-national level). But Global Footprint Network data show that from 2008 to 2009 Russia’s per capita Ecological Footprint decreased by 10 per cent (reaching the value of 4.0 gha per person) after a 10-year increase. If this national decline in resource demand was sustained in following years, it would mean that average consumption habits moved toward the sustainable consumption quadrant even as Russia’s HDI improved.
Figure 48
Very High Human
Development
High Human
Development
World biocapacity per capita 2009
World biocapacity per capita 1961
0
2
4
6
8
10
12
14
0
2
4
6
8
10
12
14
0.0 0.2 0.4 0.6 0.8 1.0
Ecol
ogic
al F
ootp
rint (
gha
per c
apita
)
U.N. Human Development Index (HDI)
Ecological Footprint vs. Adjusted HDI for 83 Russian Federal Subjects and other countries in 2009
Africa Middle East/Central Asia Asia-Paci�c South America Central America/Caribbean North America EU Other Europe 83 Federal Subjects of Russia
Minimum Sustainable Development Quadrant
Russian Federation biocapacity per capita

Ecological Footprint of the Russian Regions | 57
This would be an important development. Even for countries — or Federal Subjects — with large biocapacity reserves, exceeding the regenerative capacity of their ecological assets compromises future generations’ ability to meet their own demands. With the apparent global increase in resource shortages, current generations might be unable to replicate the improvements in human welfare seen in the recent past.
Very High Human
Development
High Human
Development
World biocapacity per capita 2009
World biocapacity per capita 1961
0
2
4
6
8
10
12
14
0
2
4
6
8
10
12
14
0.0 0.2 0.4 0.6 0.8 1.0
Ecol
ogic
al F
ootp
rint (
gha
per c
apita
)
U.N. Human Development Index (HDI)
Ecological Footprint vs. Adjusted HDI for 83 Russian Federal Subjects and other countries in 2009
Africa Middle East/Central Asia Asia-Paci�c South America Central America/Caribbean North America EU Other Europe 83 Federal Subjects of Russia
Minimum Sustainable Development Quadrant
Russian Federation biocapacity per capita

58 | Ecological Footprint of the Russian Regions
Measuring a nation or sub-nation’s Ecological Footprint against its HDI value does not completely inform us of its potential to deliver and maintain high human welfare.
A nation that has both a high HDI and high Footprint might meet its resource demand — and subsidize its human welfare — not only through domestic overuse, but also through imports and a reliance on the global commons. But the viability of a state or nation is shaped more by local biocapacity than by the global average.
To more fully understand a Federal Subject’s human welfare, then, means to track both its Footprint (as reported in Section 3.4) as well as how it is positioned compared to its own biocapacity.
As Figure 49 illustrates, many of Russia’s Federal Subjects have both a high (or very high) HDI value and high biocapacity. These Federal Subjects can be considered the best positioned, as they already have a high human development and the biocapacity reserve to guarantee its residents access.
3.4. BIOCAPACITY sTOCk ANd AdjusTEd HdI
IN THE RussIAN REGIONs
Figure 49Relationship between biocapacity access and adjusted HDI for the Russian Federal Subjects. This graph shows Subjects in four possible states along the axes of high versus low human development, and Subjects with more biocapacity than Footprint (ecological reserve) versus countries with more Footprint than biocapacity (ecological deficit) (Global Footprint Network, 2013).
0
2
4
6
8
10
12
0.65 0.70 0.75 0.80 0.85 0.90 0.95
Ratio
Bio
capa
city
: Ec
olog
ical
Foo
tprin
t
Adjusted Human Development Index
Access to Biocapacity vs. Adjusted HDI for Russian Federal Subjects
High
hum
an d
evel
opm
ent
Very
hig
h hu
man
dev
elop
men
t
Biocapacity = Ecological Footprint
Biocapacity de�cit High HDI
Biocapacity reserve Lower HDI
Biocapacity reserve
Biocapacity de�cit Lower HDI

Ecological Footprint of the Russian Regions | 59
Federal Subjects in the other quadrants are in lesser advantageous positions: To the lower right, those with high HDI but low biocapacity may be challenged to maintain their level of human welfare as their biocapacity becomes more constrained. Federal Subjects in the upper-left quadrant have medium/low HDI, but sufficiently high biocapacity to better meet their residents’ resource demands.
In the lower-left quadrant, Federal Subjects that have a low HDI and low biocapacity, are the most disadvantaged. They have neither the HDI nor the level of biocapacity to help them change their position.
It is not enough for Russia to look back on its success in increasing development; it needs to look forward to an increasingly biocapacity-constrained future and consider how best to maintain the well-being of its economy, its environment and its people.
Figure 50Biocapacity and HDI
in the Federal Subjects
7
2640
80
29
8
27
30
28
51
79
35
54
78
19
523
20
31
83
18
33
52
21
8
17
36
25
122
1673
69
68
27
2
67
77
81
34
12
66
76
11 65
71
82
43
6
74
39
4
38
75 14
49
72
53
56
47
24
59
3
57
58
10
5045
46
9
44 55
3748
15
13
70
63
64
6261
41
60
42
32
Four Categories of Russian Federal Subjects
Biocapacity Deficit & Very High HDI
Biocapacity Reserve & Lower HDI
Biocapacity Reserve & Very High HDI
Biocapacity Deficit & Lower HDI

60 | Ecological Footprint of the Russian Regions
FOOTPRINT ANd RussIAN FOREsTs~ Alexander Voropaev, WWF-RussiaMost of Russia’s biocapacity wealth is forest: It stretches over more than 795 million hectares (ha), comprising almost 21 per cent of the world’s forest cover. Russia’s forest lands may be even more expansive than what is officially reported. Recent studies show that some of Russia’s officially classified agricultural lands (in Central and Northern European Russia in particular) have been abandoned for 30 or more years and are now overgrown with trees.
© СЕРГЕ
Й ТР
ЕПЕТ / W
WF РО
ССИИ

Even such an enormous bounty, however, can come under threat: Poorly managed fires, industrial logging of intact boreal forests and over-logging (legal and otherwise) of valuable timber stands in industrial forests have all degraded Russia’s forests. The short growing season for forests (due to Russia’s long, harsh winters) makes recovery from deforestation more difficult than for other areas.
Voluntary forest certification — sustainable forest management practices that are certified credible by an independent auditor — has proven to be an invaluable tool for safeguarding Russia’s biocapacity wealth. Certification supports management practices that can sustain harvest rates, ensure the legality of harvested wood, and protect biodiversity. By engaging local stakeholders in forest management, voluntary forest certification both improves the quality of life of forest workers and local communities as well as better ensures the long-term economic and ecological success of these forestry operations.
Voluntary forest certification started in Russia in 2000 when the Forest Stewardship Council (FSC) issued the first forest management certificate for 32.7 thousand ha to a Russian forest management unit in Altai. Today, FSC-certified forest areas cover about 38 million ha and have extended to most parts of Russia. FSC certification in Russia is expected to exceed 50 million ha by 2016.
Ecological Footprint of the Russian Regions | 61

62 | Ecological Footprint of the Russian Regions
sECTION 4wHAT’s NExT?This report argues that ecological constraints are becoming an ever greater determinant of economic success in the 21st century. As global demand for biocapacity increases, humanity goes further into ecological overshoot and competition for natural capital will become harsher, shifting economic pressures and opportunities. Every country will be affected, but each quite differently.

Ecological Footprint of the Russian Regions | 63
© G
LOB
AL W
AR
MIN
G IM
AG
ES
/ WW
F-CA
NO
N

64 | Ecological Footprint of the Russian Regions
Russia and other countries with biocapacity reserves will have an advantage. With its stable population size, and relatively stable per capita consumption, Russia’s demand for ecological services has remained within the limits of what its ecosystems can replenish. Russia’s large biocapacity reserve, if managed carefully, gives
its people and its economy an edge over global competitors, and provides an opportunity to maintain a high level of human development.
Still, the universal question for any country is this: How can we secure the highest quality of life for our citizens in a way that endures?
Many countries, including Russia, are already selling off their natural assets for quick economic gain. Even more have become highly dependent on fossil fuel — as a convenient energy source for consumers, and as an easy income generator for those who extract the fuels.
Russia still has plenty of fossil fuel reserves. But worldwide, the lack of sequestration capacities for the emitted CO2 presents a greater constraint than the availability of these reserves. This creates dilemmas and adds uncertainty to both consumers and providers. And it could radically change the value of fossil fuel-dependent investments.
Using easily available and relatively cheaply priced resources is an enticing path for nations that want to improve their living standards. But economic gain at the expense of eroding biocapacity reserves and depleting non-renewable assets is not a robust strategy for building long-lasting results. It will make these economies more vulnerable, adding political and social strain.
Russia’s biocapacity reserve, as enormous as it is, will be at risk as long as it is not valued and managed. To many, it seems a productive and sound proposition to prioritize development that works within nature's budget. But such development requires decision-making that focuses on strengthening natural assets, rather than liquidating them. The solution lays in better understanding the critical choices we can make.
4.1. wHAT dO wE PROPOsE?
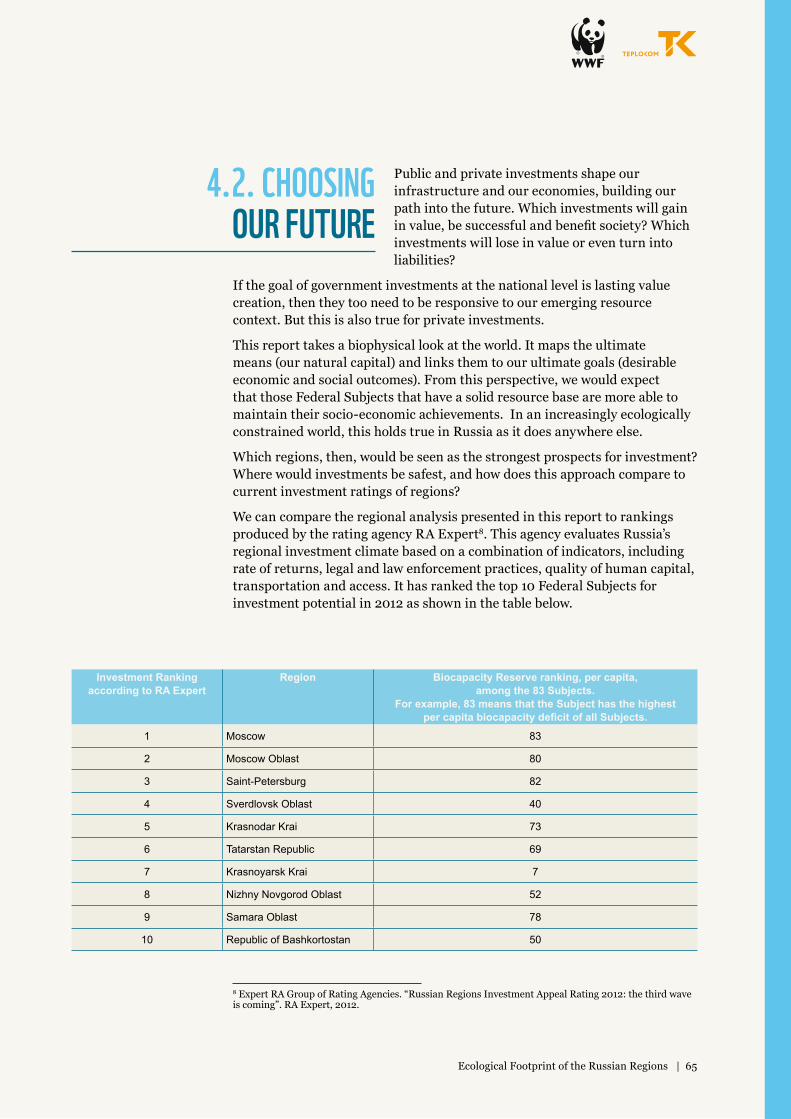
Ecological Footprint of the Russian Regions | 65
Public and private investments shape our infrastructure and our economies, building our path into the future. Which investments will gain in value, be successful and benefit society? Which investments will lose in value or even turn into liabilities?
If the goal of government investments at the national level is lasting value creation, then they too need to be responsive to our emerging resource context. But this is also true for private investments.
This report takes a biophysical look at the world. It maps the ultimate means (our natural capital) and links them to our ultimate goals (desirable economic and social outcomes). From this perspective, we would expect that those Federal Subjects that have a solid resource base are more able to maintain their socio-economic achievements. In an increasingly ecologically constrained world, this holds true in Russia as it does anywhere else.
Which regions, then, would be seen as the strongest prospects for investment? Where would investments be safest, and how does this approach compare to current investment ratings of regions?
We can compare the regional analysis presented in this report to rankings produced by the rating agency RA Expert8. This agency evaluates Russia’s regional investment climate based on a combination of indicators, including rate of returns, legal and law enforcement practices, quality of human capital, transportation and access. It has ranked the top 10 Federal Subjects for investment potential in 2012 as shown in the table below.
4.2. CHOOsING OuR FuTuRE
Investment Ranking according to RA Expert
Region Biocapacity Reserve ranking, per capita, among the 83 Subjects.
For example, 83 means that the Subject has the highest per capita biocapacity deficit of all Subjects.
1 Moscow 83
2 Moscow Oblast 80
3 Saint-Petersburg 82
4 Sverdlovsk Oblast 40
5 Krasnodar Krai 73
6 Tatarstan Republic 69
7 Krasnoyarsk Krai 7
8 Nizhny Novgorod Oblast 52
9 Samara Oblast 78
10 Republic of Bashkortostan 50
8 Expert RA Group of Rating Agencies. “Russian Regions Investment Appeal Rating 2012: the third wave is coming”. RA Expert, 2012.

66 | Ecological Footprint of the Russian Regions
Many of them also have the largest biocapacity deficits of all Subjects, and only one of them — Krasnoyarsk Krai, which is among the wealthiest Federal Subjects in terms of natural resources — has a biocapacity reserve. In fact, these 10 Federal Subjects combined already make up 43 per cent of the Russian Footprint (see Figure 51 below).
Indeed, this is the paradox: Nine of the 10 regions that are conventionally ranked highest for investments are those with comparatively large biocapacity deficits.
So, which ranking reflects the safest investment strategy?
Our perspective is clear. If investors act in accordance to conventional rankings, we expect a continuation of the same development pattern that Russia has followed the last two decades: Biocapacity pressure and Footprints will grow in core industrialized and populated regions, while resource-harvesting regions (especially those heavily invested in oil and gas extraction) will continue to liquidate their natural capital without investing in future development. However, if investments are instead made on positive social outcomes plus robust resource wealth management to feed the necessary economic activities, long-term and sustainable growth could be achieved.
Even as Russian consumption grows and Federal Subjects liquidate and export their natural capital (fossil fuels, minerals, timber, food), the country still does not invest adequately in human capital or resource management. Indeed, while the UN Human Development Index ranks Russia high in human development, large portions of the population have yet to benefit.
Figure 51The top rated investment Subjects make up 43 per
cent of Russia’s Footprint. Moscow City alone
generates 12 per cent of Russia’s total Footprint
(Global Footprint Network, 2013)
12%
6%
5%
3%
4%
3%
2% 2%
2%
4%
57%
Contribution of top 10 federal subjects with highest investment ranking to Russia's Ecological Footprint
Moscow City Moscow Oblast St. Petersburg Sverdlovsk Oblast Krasnodar Krai Republic of Tatarstan Krasnoyarsk Krai Nizhny Novgorod Oblast Samara Oblast Republic of Bashkortostan Other

Ecological Footprint of the Russian Regions | 67
The disparity between biocapacity-wealthy and biocapacity-poor regions has been known to policymakers for decades. But many have yet to recognize this discrepancy as a risk.
Still, experts reported that environmental risks increased in 2012. They also expect them to exert greater pressure on investors in 2014 and beyond. Growing pressure on biocapacity and an increasing Ecological Footprint combined with lack of adequate investments into sustainable development, including energy efficiency, preserving biocapacity-rich areas, and human development, could well erode Russia’s HDI achievements.

68 | Ecological Footprint of the Russian Regions
Are these physical descriptions an accurate representation of the current state of affairs?If yes, why is this not guiding investments? Is it because of misperceptions, or are there other factors that are so compelling as to override resource concerns?
4.3. QuEsTIONs:
Russia’s development dilemmaMany decades of intermittent success with the state-planned economy led to the broad consensus —shared by both the academia and decision-makers — that economic growth and prosperity are only possible when the country’s whole territory is being developed in a state-directed, uniformly homogenous way. This approach often led to ineffective use of limited resources and hindered the development of promising regions within Russia, as territories considered less favourable by the government were forced to engage in constant attempts to catch up. Despite the heavy redistribution of income in their favour, these territories rarely were successful.
While strategic planning is necessary for economic and spatial development, there are alternative
approaches worth considering which could simultaneously increase human welfare and reduce anthropogenic impact on the country’s unique ecosystems.
Instead of trying to evenly distribute the limited budgetary resources and private (including foreign) investment across the entire territory, planners in Russia might concentrate on the Federal Subjects with the highest investment prospects, which would likely yield bigger returns. While the highest-investment prospects in Russia tend to be those with relatively low biocapacity and high Ecological Footprint, a targeted approach could help unlock the capacity of these “growth areas,” and at the same time, postpone liquidation of Russia’s renewable biological wealth.
Ecological Footprint of the Russian Regions | 69
This approach, however, does not mean abandoning current and future plans of economic development and increasing human welfare in regions with high biocapacity and/or rich biodiversity, which currently have fewer opportunities for conventional (industrial) development or are unable to attract the necessary investment. It is exactly in such cases that the regulatory and redistributive role of the government must be exercised — by means of fiscal, financial, and infrastructural stimuli —to strengthen the knowledge- and service-based economy which is dependent on science, education, culture, and the arts.
Furthermore, though biocapacity is a valuable asset in many ways similar to other natural resources, its value is rarely considered when assessing
development prospects for regions, industries, or human capital. As a first step towards recognizing biocapacity as a factor of development and as an important tool to preserve our renewable wealth, a subvention-based mechanism could be developed. This mechanism could provide for the preservation of ecosystem services and associated biodiversity in the least developed biocapacity donor regions of the Russian Federation.
we can secure a sustainable future through corresponding investment strategies. since we cannot fully know the future, investing is like gambling. But what is the best bet? In our bet, how many of our assets should we place on conventional wisdom, and how many on the insights presented in this report?
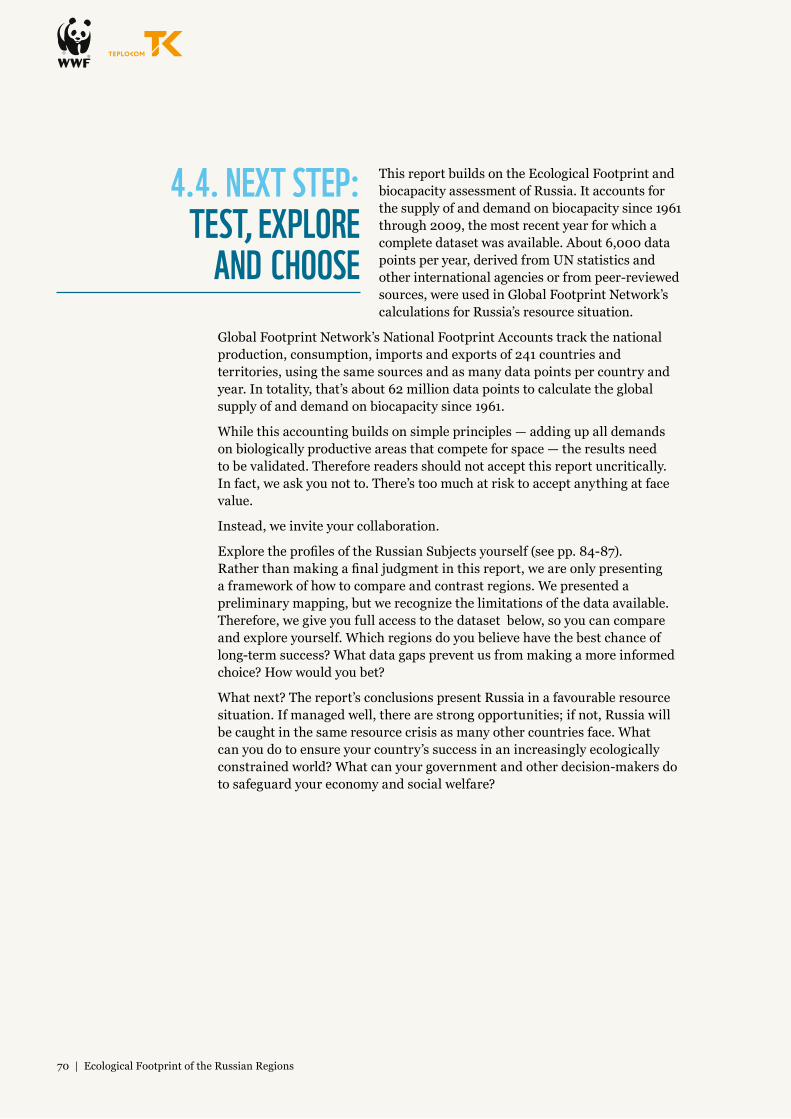
70 | Ecological Footprint of the Russian Regions
This report builds on the Ecological Footprint and biocapacity assessment of Russia. It accounts for the supply of and demand on biocapacity since 1961 through 2009, the most recent year for which a complete dataset was available. About 6,000 data points per year, derived from UN statistics and other international agencies or from peer-reviewed sources, were used in Global Footprint Network’s calculations for Russia’s resource situation.
Global Footprint Network’s National Footprint Accounts track the national production, consumption, imports and exports of 241 countries and territories, using the same sources and as many data points per country and year. In totality, that’s about 62 million data points to calculate the global supply of and demand on biocapacity since 1961.
While this accounting builds on simple principles — adding up all demands on biologically productive areas that compete for space — the results need to be validated. Therefore readers should not accept this report uncritically. In fact, we ask you not to. There’s too much at risk to accept anything at face value.
Instead, we invite your collaboration.
Explore the profiles of the Russian Subjects yourself (see pp. 84-87). Rather than making a final judgment in this report, we are only presenting a framework of how to compare and contrast regions. We presented a preliminary mapping, but we recognize the limitations of the data available. Therefore, we give you full access to the dataset below, so you can compare and explore yourself. Which regions do you believe have the best chance of long-term success? What data gaps prevent us from making a more informed choice? How would you bet?
What next? The report’s conclusions present Russia in a favourable resource situation. If managed well, there are strong opportunities; if not, Russia will be caught in the same resource crisis as many other countries face. What can you do to ensure your country’s success in an increasingly ecologically constrained world? What can your government and other decision-makers do to safeguard your economy and social welfare?
4.4. NExT sTEP: TEsT, ExPLORE
ANd CHOOsE
Ecological Footprint of the Russian Regions | 71
APPENdIx
Includes: • standard methodology• Glossary• References• Name directory for Russian
Federal subjects• data Table — Profiles of the
Russian Regions: Ecological Footprint, Biocapacity, Human, and Economic development

72 | Ecological Footprint of the Russian Regions
sTANdARd mETHOdOLOGY
CALCuLATING THE ECOLOGICAL FOOTPRINT ANd BIOCAPACITYThe National Footprint Accounts track individual countries’ use of ecological services and resources and the biocapacity available in each country. As with any resource accounts, they are static, quantitative descriptions of outcomes for any given year in the past for which data exist. Detailed calculation methodologies of the most recently updated Accounts are described in the Calculation Methodology for the National Footprint Accounts, 2012 Edition (Global Footprint Network, 2013). Implementation of the National Footprint Accounts through database-supported templates is described in the Guidebook to the National Footprint Accounts (Kitzes et al. 2008) and the method paper by Borucke et al. (2013). Kitzes et al. (2009) outline the research agenda for future improvements.
The National Footprint Accounts, 2012 edition, calculates the Ecological Footprint and biocapacity for 241 countries, territories and regions, from 1961 to 2009.
ECOLOGICAL FOOTPRINT The National Footprint Accounts, 2012 Edition, tracks human demand for biocapacity and compares it to how much biocapacity is available. There are five area types of biocapacity: cropland, grazing land, forests, fishing grounds and built-up land. Two biocapacity demand categories share the forest biocapacity: the Forest Products Footprint and the Carbon Footprint. The Ecological Footprint of each major land use type is calculated by adding together the contributions of products and activities which compete for bioproductive space. Built-up land reflects the bioproductivity compromised by infrastructure and hydropower. The Carbon Footprint represents the carbon absorptive capacity of a world average hectare of forest needed to absorb carbon dioxide emissions from burning fossil fuels, after removing the ocean sequestration capacity from the equation.
The Ecological Footprint calculates the combined demand for ecological resources, wherever they are located, and presents this demand as the global average area needed to support a specific human activity. This quantity is expressed in units of global hectares. A global hectare is defined as a biologically productive hectare with world average bioproductivity.
By expressing all results as a common unit, biocapacity and the various Footprints can be directly compared across land use types and countries.

Ecological Footprint of the Russian Regions | 73
Measurements of demand for resource production and waste assimilation are translated into global hectares by dividing the total amount of a resource consumed by the yield per hectare and by dividing the waste emitted by the absorptive capacity per hectare. Yields are calculated based on various international statistics, primarily those from the United Nations Food and Agriculture Organization (FAO ResourceSTAT Statistical Databases).
Yields are mutually exclusive: if two crops are grown at the same time on the same hectare, one portion of the hectare is assigned to one crop and the remainder to the other. This method avoids double counting and follows the same logic as measuring the size of a farm: each hectare is only counted once, even though it might provide multiple services.
The Ecological Footprint, in its most basic form, is calculated using the following equation:
EF = D/Y
where D is the annual demand of a product and Y is the annual yield of the same product (Borucke et al, 2013). Yield is expressed in global hectares. In practice, global hectares are estimated with the help of two factors: the yield factors, which compare national average yield per hectare to world average yield in the same land category; and the equivalence factors, which capture the relative productivity among the various land and sea area types.
Taking into account these factors, the formula of the Ecological Footprint becomes:
EF = (P/YN)×YF×EQF
where P is the amount of a product harvested or waste emitted (equal to D above), YN is the national average yield for P, and YF and EQF are the respective yield factors and equivalence factors for the country and land use type in question. The yield factor is the ratio of national-to-world-average yields, which is calculated as the annual availability of usable products and varies by country and year. Equivalence factors translate the supply of or demand for an area of a specific land use type (e.g. world average cropland or grazing land) into units of world average biologically productive area expressed in global hectares. These factors can vary by land use type and year.
Annual demand for manufactured or derivative products (e.g. flour or wood pulp) is converted into primary product equivalents (e.g., wheat or roundwood) through the use of extraction rates. These quantities of primary product equivalents are then translated into the Ecological Footprint. The Ecological Footprint also embodies the energy required during the manufacturing process.

74 | Ecological Footprint of the Russian Regions
CONsumPTION, PROduCTION, ANd TRAdE The National Footprint Accounts calculate the Footprint of a population from a number of perspectives. The most “popular”, or most widely-reported, calculation is the Ecological Footprint of the consumption of a population, typically just called Ecological Footprint. For a given country, the Ecological Footprint of consumption measures the biocapacity demanded by the final consumption of all the residents of that country. In theory, the demand from visitors and tourists should be excluded, but in practice, the existing data does not allow that distinction to be calculated; and as a result the numbers reflect the consumption of all residents and visitors. For the same reason, the “ecological demands” made by Russia’s residents while travelling abroad are not included in this assessment.
The final consumption figure includes the country’s household consumption as well as its collective consumption, such as that made by schools, roads and fire stations, for example, which serve the households but may not be directly paid for by the households.
In contrast, a country’s primary production Ecological Footprint is the sum of the Footprints for all resources harvested and all waste generated within the country’s geographical borders. This includes the total area within a country required to support the actual harvest of primary products (cropland, grazing land, forest land and fishing grounds); the country’s infrastructure and hydropower (built-up land); and the area needed to absorb fossil fuel-related CO2 emissions generated within the country (Carbon Footprint).
The difference between a country’s Production and Consumption Footprint is trade, and is shown by the following equation:
EFC = EFP + EFI - EFE
where EFC is the Ecological Footprint of consumption, EFP is the Ecological Footprint of production, and EFI and EFE are the Footprints of imported and exported commodity flows respectively.
BIOCAPACITY The calculation of a country’s biocapacity begins with the total amount of bioproductive land and sea available in that country. “Bioproductive” refers to areas of land and water that support significant photosynthetic activity and accumulation of biomass. Barren areas of low or dispersed productivity are ignored. This is not to say that places such as the Sahara Desert, Antarctica, or the alpine environments of various countries do not support life; simply that their production is too widespread to be directly harvestable and is negligible in quantity.

Ecological Footprint of the Russian Regions | 75
Biocapacity is an aggregate measure of the amount of area available, weighted by the productivity of that area. It represents the ability of a biosphere to produce crops, livestock (pasture), timber products (forest) and seafood, as well as the biosphere’s ability to uptake CO2 in forests. It also measures how much of this regenerative capacity is occupied by infrastructure (built-up land). In short, it measures the ability of the available terrestrial and aquatic areas to provide ecological services. A country’s biocapacity for any land use type is calculated as:
BC = A×YF×EQF
where BC is the biocapacity, A is the available area of a given land use type, and YF and EQF are the yield factors and equivalence factors, respectively, for the land use type in question in that country.

76 | Ecological Footprint of the Russian Regions
GLOssARYDurable capital that is either owned or can be used in production, whether natural, manufactured or human. Assets are not directly consumed, but they yield products and/or services that people do consume.
Ecological assets are defined as the biologically productive areas of land and sea that generate the renewable resources and ecological services for which there is human demand.
The ability of ecological assets to produce useful biological materials and ecological services such as absorbing the CO2 emissions generated by humans, using current management schemes and extraction technologies. Biocapacity is measured in global hectares. “Useful” biological materials are defined as those which the human economy actually demanded in a given year. Biocapacity includes only biologically productive land: cropland, forest, fishing grounds, grazing land and built-up land; deserts, glaciers and the open ocean are excluded.
When used in Ecological Footprint studies, the Carbon Footprint indicates the biocapacity required to sequester (through photosynthesis) the CO2 emissions produced by fossil fuel combustion. Although fossil fuels are extracted from Earth’s crust and are not regenerated in human time scales, their use creates a demand for ecological services if the resultant CO2 does not accumulate in the atmosphere.
The Ecological Footprint therefore includes a Carbon Footprint component, which represents the biocapacity (typically that of unharvested forests) needed to absorb the remaining portion of the “fossil CO2” that is not absorbed by the ocean. The Carbon Footprint component of the Ecological Footprint should not be confused with the “Carbon Footprint” indicator used in climate change debates. This latter indicates the tonnes of carbon (or tonnes of carbon per rubel or dollar) that are directly and indirectly caused by an activity or are accumulated over the life stages of a product, rather than the Ecological Footprint’s carbon component, which measures demand on a bioproductive area (see Galli et al., 2012 for details).
The ability of a country to maintain and secure its prosperity.
AssETs
BIOCAPACITY
CARBON FOOTPRINT
COmPETITIVENEss

Ecological Footprint of the Russian Regions | 77
Use of goods or services. The term consumption has two different meanings, depending on context. As commonly used in Footprint analyses, it refers to the use of goods or services. A consumed good or service embodies all the resources, including energy, necessary to provide it to the consumer (also known as embedded Footprint). In full life-cycle accounting, everything used along the production chain is taken into account, including any losses along the way. For example, consumed food includes not only the plant or animal matter people eat or waste in the household, but also that lost during processing or harvest, as well as all the energy used to grow, harvest, process and transport the food. As used in Input-Output analysis, consumption has a strict technical meaning. Two types of consumption are distinguished: intermediate and final. According to (economic) System of National Accounts terminology, intermediate consumption refers to the use of goods and services by a business in providing goods and services to other businesses. Final consumption refers to non-productive use of goods and services by households, the government, the capital sector, and foreign entities.
Ecological Footprint analyses can allocate total Footprint among consumption components, typically Food, Housing, Personal Transport, Goods and Services — often with further resolution into sub-components. Consistent categorization across studies allows for comparison of the Footprint of individual consumption components across regions, and the relative contribution of each category to the region’s overall Footprint.
The difference between the biocapacity and the Ecological Footprint of consumption of a region or country. A biocapacity deficit occurs when the Ecological Footprint of a population exceeds the biocapacity produced by the ecological assets available in the country where that population lives. If there is a regional or national biocapacity deficit, it means that the region is importing biocapacity through trade or liquidating regional ecological assets. In contrast, global overshoot, which means biocapacity deficit at a global level, cannot be compensated through trade.
Again determined by the comparison between the biocapacity and the Ecological Footprint of consumption of a region or country, a biocapacity reserve exists when the biocapacity of a region exceeds its population’s Ecological Footprint of consumption. Biocapacity reserve is thus the converse of biocapacity deficit.
Although a country in biocapacity reserve may still import natural resources, overuse individual components of domestic resources, and emit carbon dioxide to the global commons, a biocapacity reserve indicates that a country may be capable of maintaining its current lifestyle utilizing only domestically available ecological assets.
CONsumPTION
CONsumPTION COmPONENTs (also consumption
categories)
BIOCAPACITY dEFICIT
BIOCAPACITY REsERVE
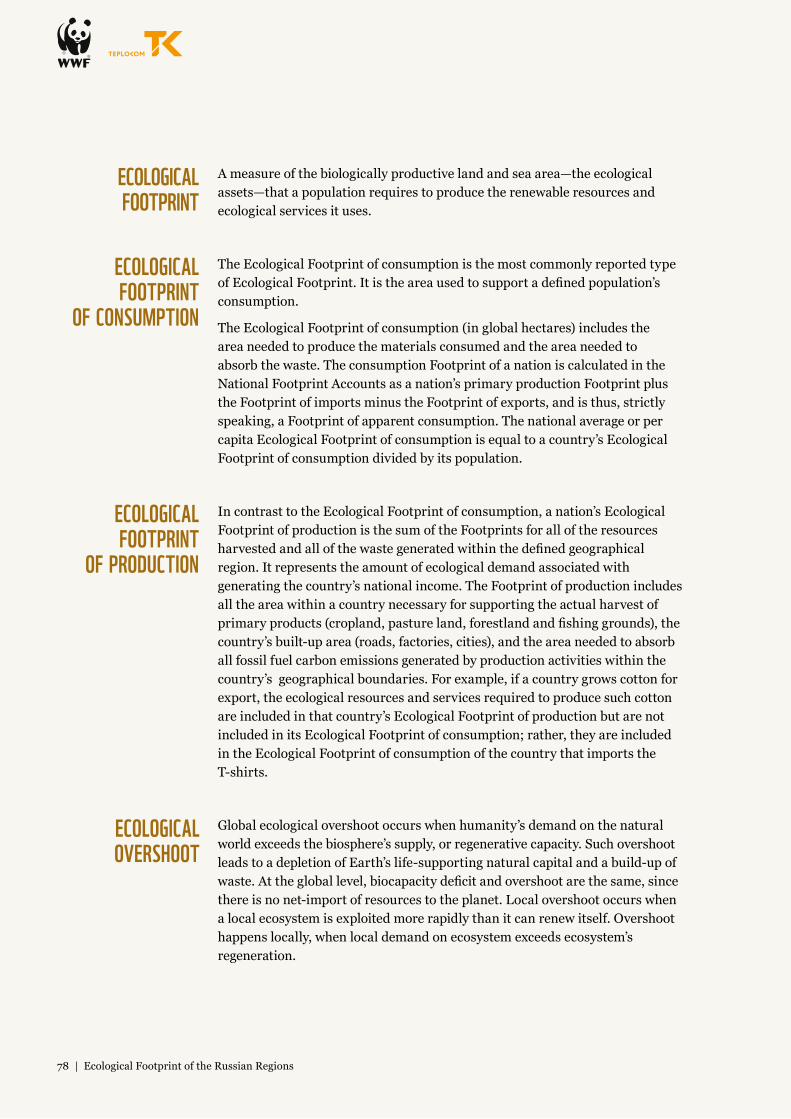
78 | Ecological Footprint of the Russian Regions
A measure of the biologically productive land and sea area—the ecological assets—that a population requires to produce the renewable resources and ecological services it uses.
The Ecological Footprint of consumption is the most commonly reported type of Ecological Footprint. It is the area used to support a defined population’s consumption.
The Ecological Footprint of consumption (in global hectares) includes the area needed to produce the materials consumed and the area needed to absorb the waste. The consumption Footprint of a nation is calculated in the National Footprint Accounts as a nation’s primary production Footprint plus the Footprint of imports minus the Footprint of exports, and is thus, strictly speaking, a Footprint of apparent consumption. The national average or per capita Ecological Footprint of consumption is equal to a country’s Ecological Footprint of consumption divided by its population.
In contrast to the Ecological Footprint of consumption, a nation’s Ecological Footprint of production is the sum of the Footprints for all of the resources harvested and all of the waste generated within the defined geographical region. It represents the amount of ecological demand associated with generating the country’s national income. The Footprint of production includes all the area within a country necessary for supporting the actual harvest of primary products (cropland, pasture land, forestland and fishing grounds), the country’s built-up area (roads, factories, cities), and the area needed to absorb all fossil fuel carbon emissions generated by production activities within the country’s geographical boundaries. For example, if a country grows cotton for export, the ecological resources and services required to produce such cotton are included in that country’s Ecological Footprint of production but are not included in its Ecological Footprint of consumption; rather, they are included in the Ecological Footprint of consumption of the country that imports the T-shirts.
Global ecological overshoot occurs when humanity’s demand on the natural world exceeds the biosphere’s supply, or regenerative capacity. Such overshoot leads to a depletion of Earth’s life-supporting natural capital and a build-up of waste. At the global level, biocapacity deficit and overshoot are the same, since there is no net-import of resources to the planet. Local overshoot occurs when a local ecosystem is exploited more rapidly than it can renew itself. Overshoot happens locally, when local demand on ecosystem exceeds ecosystem’s regeneration.
ECOLOGICAL FOOTPRINT
ECOLOGICAL FOOTPRINT
OF CONsumPTION
ECOLOGICAL FOOTPRINT
OF PROduCTION
ECOLOGICAL OVERsHOOT

Ecological Footprint of the Russian Regions | 79
A global hectare is defined as a hectare with world-average productivity for all biologically productive land and water in a given year. Biologically productive land includes areas such as cropland, forest, and fishing grounds, and excludes deserts, glaciers, and the open ocean. Global hectares are the common, standardized unit used for reporting Ecological Footprint and biocapacity across time and for areas throughout the world. The use of global hectares recognizes that different types of land have a different ability to produce useful goods and services for humans. One hectare of cropland can produce a greater quantity of useful and valuable food products than a single hectare of grazing land, for example. By converting both cropland and pasture into global hectares, they can be compared on an equal basis. Additional information on the global hectares and the way they are calculated is provided in Borucke et al. (2013).
Also note that global hectares are standardized against the last year of analysis. They could be called “constant global hectares” similar to “constant U.S. dollars.” Constant global hectares refer to the basket of ecological services that a global hectare could provide in the last year of analysis. If productivity increased, this means it took more hectares in the past to produce one global hectare worth of ecological services.
HDI is a summary composite index that measures a country’s average achievements in three basic aspects of human development: Health—Life expectancy at birth (number of years a newborn infant would live if prevailing patterns of mortality at the time of birth were to stay the same throughout the child’s life); Knowledge—The adult literacy rate and the combined primary, secondary and tertiary gross enrolment ratio; and Standard of living— GDP per capita (PPP US$). Note that for the Russian Subjects’ HDI, the extractive income was excluded to better represent the income generation differences among the Federal Subjects.
Input-Output (IO) analysis is a mathematical tool widely used in economics to analyze the flows of goods and services between sectors in an economy, using data from IO tables. IO analysis assumes that everything produced by one industry is consumed either by other industries or by final consumers, and that these consumption flows can be tracked. If the relevant data are available, IO analyses can be used to track both physical and financial flows. Combined economic-environment models use IO analysis to trace the direct and indirect environmental impacts of industrial activities along production chains, or to assign these impacts to final demand categories. In Ecological Footprint studies, IO analysis is used to apportion Ecological Footprints among production activities, or among categories of final demand (or consumption categories).
GLOBAL HECTAREs (GHA)
HumAN dEVELOPmENT
INdEx (HdI)
INPuT-OuTPuT ANALYsIs

80 | Ecological Footprint of the Russian Regions
The central data set that calculates the Ecological Footprints and biocapacities of over 150 nations and the world from 1961 to the present (generally with a lag due to data availability). The ongoing development, maintenance and upgrades of the National Footprint Accounts are coordinated by Global Footprint Network and its 70+ partners.
Earth’s natural assets (soil, air, water, flora and fauna), and the ecosystem services resulting from them, make human life possible (Natural Capital Declaration). This is the “Living Natural Capital” definition; others also include subsoil minerals and fossil fuel as part of natural capital.
Net Primary Productivity (NPP) is the net amount of energy a plant accumulates during a time period. NPP can also be understood as the amount of mass a plant gains (or how much it grows) over some period of time. NPP is calculated by subtracting the plant's respiration (the total amount of energy/mass lost by the plant as it breathes) from the gross primary productivity (the total amount of energy/mass taken in by the plant) (Foley et al., 1996; Kucharik et al., 2000).
NATIONAL FOOTPRINT ACCOuNTs
NET PRImARY PROduCTIVITY
NATuRAL CAPITAL

Ecological Footprint of the Russian Regions | 81
REFERENCEsAnnual Report on the status and use of forests in the Russian Federation in 2012, available online at http://www.rosleshoz.gov.ru/docs/other/79/Ezhegodnyj_doklad_o_sostoyanii_i_ispolyzovanii_lesov_Rossijskoj_Federatcii_za_2012_g.pdf
Expert RA Group of Rating Agencies. “Russian Regions Investment Appeal Rating 2012: a third wave is coming”. RA Expert, 2012.
Federal State Statistics Service of the Russian Federation, 2009. Gross Regional Product structure by type of economic activity in 2009, available online at http://www.gks.ru/wps/wcm/connect/rosstat_main/rosstat/ru/statistics/accounts/#
Foley, J.A., I. C. Prentice, N. Ramankutty, S. Levis, D. Pollard, S. Sitch, and A. Haxeltine (1996) An Integrated Biosphere Model of Land Surface Processes, Terrestrial Carbon Balance and Vegetation Dynamics, Global Biogeochemical Cycles, 10, 603–628.
FSC certification database, 2014, available online at http://info.fsc.org/certificate.php
Global Footprint Network, 2013. National Footprint Accounts, 2012 Edition. Available online at http://www.footprintnetwork.org.
Integrated Foreign Economic Information Portal / Ministry of Economic Development, 2013. Information note on bilateral trade relations between the Russian federation and the Netherlands. Available online at http://www.ved.gov.ru/exportcountries/nl/nl_ru_relations/nl_ru_trade/
Integrated Foreign Economic Information Portal / Ministry of Economic Development, 2013. Information note on bilateral trade relations between the Russian federation and the People’s Republic of China. Available online at http://www.ved.gov.ru/exportcountries/cn/cn_ru_relations/cn_ru_trade/
Kucharik, C.J., J. A. Foley, C. Delire, V. A. Fisher, M. T. Coe, J. Lenters, C. Young-Molling, N. Ramankutty, J. M. Norman, and S. T. Gower (2000): Testing the performance of a dynamic global ecosystem model: Water balance, carbon balance and vegetation structure. Global Biogeochemical Cycles 14 (3), 795–825.
Minutes of the Presidential Fuel and Energy Complex Commission meeting, Moscow, February 2013, available online at http://www.kremlin.ru/news/17511
Ministry of Economic Development of the Russian Federation, 2011. Regulatory impact assessment on the draft resolution of the Government of the Russian Federation “On the prevention and elimination of oil spills on the territory of the Russian Federation, on its continental shelf and in its exclusive economic zone», available online at http://www.economy.gov.ru/wps/wcm/connect/eef56e80447195d5a577e5af753c8a7e/zakl.doc? MOD=AJPERES&CACHEID=eef56e80447195d5a577e5af753c8a7e
Shvarts E., A Shestakov, 2000. Protected Areas and Sustainable Development: A Chance for Biodiversity or a New Self-Deception. In: Nature Conservation: Bridges between West and East. Swiss Fed. Inst. for Forest, Snow and Landscape Research, 2000, 23–29 pp.
UNDP (United Nations Development Programme). 2013. 2013 Human Development Report. Available at hdr.undp.org/en/2013-report.Russian Forestry Agency (Rosleshoz), 2012.

82 | Ecological Footprint of the Russian Regions
National Footprint Accounts calculating sources:FAO and IIASA (International Institute for Applied Systems Analysis), 2000. Global Agro — Ecological Zones. http://www.fao.org/ag/agl/agll/gaez/index.htm.
FAO, 1998. Global Fiber Supply Model. ftp://ftp.fao.org/docrep/fao/006/X0105E/X0105E.pdf.
Food and Agriculture Organization of the United Nations (FAO) Statistical Databases. Available at faostat.fao.org/site/291/default.aspx.
Gracey, K., Lazarus, E., Borucke, M., Moore, D., Cranston, G., Iha, K., Larson, J., Morales, J.C., Wackernagel, M., Galli, A., 2012. Guidebook to the National Footprint Accounts: 2011 Edition. Oakland: Global Footprint Network. www.footprintnetwork.org/methodology.
Gulland, J.A. 1971. The Fish Resources of the Ocean. West Byfleet, Surrey, United Kingdom: Fishing News.
Haberl, H., Erb, K.H., Krausmann, F., Gaube, V., Bondeau, A., Plutzar, C., Gingrich, S., Lucht, W., Fischer-Kowalski, M., 2007. Quantifying and mapping the human appropriation of net primary production in earth’s terrestrial ecosystems. Proc. Natl. Acad. Sci. 104, 12942–12947.
IPCC (Intergovernmental Panel on Climate Change), 2006. 2006 IPCC Guidelines for National Greenhouse Gas Inventories Volume 4: Agriculture Forestry and Other Land Use. Available at www.ipcc — nggip.iges.or.jp/public/2006gl/vol4.html.
Khatiwala, S., Primeau, F., Hall, T., 2009. Reconstruction of the history of anthropogenic CO 2 concentrations in the ocean. Nature, 462, 346–350.
Pauly, D., and Christensen, V., 1995. Primary production required to sustain global fisheries. Nature, 374, 255–257.
Rees, W.E., 1992. Ecological footprints and appropriated carrying capacity: What urban economics leaves out. Environment and Urbanization 4, 121–130.
UNECE and FAO, 2000. Temperate and Boreal Forest Resource Assessment. Geneva: UNECE, FAO.
Other statistical databases include: COMTRADE; CORINE Land Cover; Global Land Use Database from the Center for Sustainability and the Global Environment (SAGE) at University of Wisconsin; International Energy Agency (IEA)

Ecological Footprint of the Russian Regions | 83
NAmE dIRECTORY FOR RussIAN FEdERAL suBjECTs
(as of 2009) 1 Kurgan Oblast 43 Kostroma Oblast 2 Novgorod Oblast 44 Belgorod Oblast 3 Ulyanovsk Oblast 45 Kaluga Oblast 4 Tula Oblast 46 Vladimir Oblast 5 Saratov Oblast 47 Tambov Oblast 6 Kursk Oblast 48 Lipetsk Oblast7 Krasnoyarsk Krai 49 Ryazan Oblast 8 Arkhangelsk Oblast 50 Moscow Oblast 9 Karachay–Cherkess Republic 51 Kamchatka Krai
10 Republic of Dagestan 52 Primorsky Krai 11 Stavropol Krai 53 Jewish Autonomous Oblast 12 Tver Oblast 54 Amur Oblast 13 Ivanov Oblast 55 Republic of Mordovia 14 Udmurt Republic 56 Bryansk Oblast 15 Mari El Republic 57 Pskov Oblast 16 Omsk Oblast 58 Astrakhan Oblast 17 Tyumen Oblast 59 Sakhalin Oblast 18 Altai Krai 60 Republic of Ingushetia 19 Tomsk Oblast 61 Republic of North Ossetia–Alania 20 Novosibirsk Oblast 62 Kabardino-Balkar Republic 21 Perm Krai 63 Chechen Republic22 Republic of Bashkortostan 64 Kaliningrad Oblast 23 Sverdlovsk Oblast 65 Republic of Kalmykia 24 Chelyabinsk Oblast 66 Krasnodar Krai 25 Murmansk Oblast 67 Rostov Oblast 26 Sakha Republic 68 Volgograd Oblast 27 Chukotka Autonomous Okrug 69 Kirov Oblast 28 Magadan Oblast 70 Chuvash Republic 29 Yamalo-Nenets 71 Republic of Tatarstan 30 Khanty-Mansi 72 Yaroslavl Oblast 31 Karelia Republic 73 Orenburg Oblast 32 Saint Petersburg 74 Samara Oblast 33 Nenets Autonomous Okrug 75 Penza Oblast 34 Leningrad Oblast 76 Nizhny Novgorod Oblast 35 Komi Republic 77 Kemerovo Oblast 36 Vologda Oblast 78 Republic of Buryatia 37 Orlov Oblast 79 Zabaykalsky Krai 38 Smolensk Oblast 80 Irkutsk Oblast 39 Voronezh Oblast 81 Altai Republic 40 Khabarovsk Krai 82 Republic of Khakassia 41 Republic of Adygea 83 Tuva Republic 42 Moscow City

84 | Ecological Footprint of the Russian Regions
Per Capita Ecological Footprint, gha
Region
Popu
latio
n(2
010 C
ensu
s, pr
elim
inar
y)
Coun
try G
DP p
.c.
(PPP
) [In
tl.$]
»
% o
f GDP
for E
xtra
ctive
Re
sour
ces
GDP
Extra
ctive
p.c.
[In
tl.$]
GDP
w/o
extra
ctive
ac
tiviti
es p
.c. [I
ntl.$
]
Inco
me I
ndex
GDP
Inco
me I
ndex
GDP
m
inus
Ext
ract
ives
Long
evity
Inde
x be
twee
n 0-
1
Educ
ation
Inde
x
HDI 2
009
HDI*
2009
(exc
ludi
ng
extra
ctive
inco
me)
Bioc
apac
ity pe
r cap
(20
09) [
gha/c
ap]
Tota
l Foo
tprin
t [g
ha/ca
p]
Foot
prin
t of F
ood
[g
ha/ca
p]
Foot
prin
t of H
ousin
g [g
ha/ca
p]
Foot
prin
t of
Tran
spor
tatio
n
[gha
/cap]
Foot
prin
t of G
oods
[g
ha/ca
p]
Foot
prin
t of S
ervic
es
[gha
/cap]
Foot
prin
t of G
ov
sect
ors
[gha
/cap]
Foot
prin
t of G
FCF
[g
ha/ca
p]
Inve
stm
ent A
peal
Ratin
g
(RA
Expe
rt, 20
12)
Moscow 11 503 501 $40 805 0,0% $0 $40 805 1,00 1,00 0,81 1,08 0,96 0,96 0,01 5,90 1,06 0,70 1,34 0,64 0,39 0,69 1,09 1
St. Petersburg 4 879 566 $25 277 0,0% $0 $25 277 0,92 0,92 0,77 1,02 0,90 0,90 0,02 5,19 1,12 0,84 0,92 0,48 0,28 0,61 0,94 3
Tyumen region 3 395 755 $57 175 50,5% $28 873 $28 302 1,00 0,94 0,74 0,91 0,88 0,86 20,27 4,40 0,93 0,83 0,61 0,51 0,22 0,52 0,77 31
The Republic of Tatarstan 3 786 488 $23 290 22,8% $5 310 $17 980 0,91 0,87 0,76 0,92 0,86 0,85 0,92 4,93 1,41 0,96 0,49 0,49 0,21 0,60 0,77 6
Sakhalin Region 497 973 $43 462 55,7% $24 208 $19 254 1,00 0,88 0,66 0,89 0,85 0,81 4,87 4,27 0,92 0,74 0,71 0,40 0,20 0,50 0,78 51
Belgorod region 1 532 526 $19 569 8,4% $1 644 $17 925 0,88 0,87 0,77 0,91 0,85 0,85 0,80 3,45 0,96 0,62 0,37 0,36 0,19 0,42 0,53 17
Tomsk Oblast 1 047 394 $19 064 22,0% $4 194 $14 870 0,88 0,83 0,72 0,96 0,85 0,84 16,44 2,67 0,70 0,50 0,30 0,29 0,14 0,32 0,43 45
The Republic of Sakha (Yakutia) 958 528 $21 159 28,3% $5 988 $15 171 0,89 0,84 0,69 0,92 0,84 0,82 150,93 3,57 1,05 0,61 0,39 0,36 0,18 0,44 0,54 19
Krasnoyarsk Territory 2 828 187 $20 779 5,0% $1 039 $19 740 0,89 0,88 0,71 0,90 0,83 0,83 38,16 3,24 0,71 0,57 0,48 0,33 0,19 0,38 0,56 7
Omsk region 1 977 665 $16 213 0,1% $16 $16 197 0,85 0,85 0,73 0,92 0,83 0,83 3,22 3,60 1,01 0,69 0,40 0,35 0,13 0,43 0,58 30
Komi Republic 901 189 $22 335 29,4% $6 566 $15 769 0,90 0,84 0,69 0,90 0,83 0,81 26,57 4,08 0,97 0,85 0,53 0,35 0,16 0,48 0,74 44
Orenburg region 2 033 072 $19 507 34,8% $6 788 $12 719 0,88 0,81 0,71 0,90 0,83 0,81 1,61 3,17 0,79 0,66 0,36 0,33 0,11 0,38 0,55 28
Lipetsk region 1 173 513 $17 902 0,7% $125 $17 777 0,87 0,86 0,72 0,90 0,83 0,83 1,11 3,32 0,93 0,62 0,37 0,32 0,13 0,40 0,53 42
Arkhangelsk region 1 227 626 $19 310 31,5% $6 083 $13 227 0,88 0,82 0,71 0,90 0,83 0,81 23,01 2,90 0,64 0,49 0,48 0,30 0,13 0,34 0,52 47
Sverdlovsk region 4 297 747 $15 811 2,7% $427 $15 384 0,85 0,84 0,72 0,92 0,83 0,83 2,68 4,57 1,02 0,68 0,82 0,47 0,23 0,54 0,81 4
Krasnodar region 5 226 647 $13 899 0,8% $111 $13 788 0,82 0,82 0,76 0,90 0,83 0,83 0,76 4,75 1,22 1,05 0,46 0,44 0,20 0,57 0,81 5
Novosibirsk region 2 665 911 $13 383 3,6% $482 $12 901 0,82 0,81 0,73 0,94 0,83 0,83 2,76 3,72 0,88 0,68 0,55 0,35 0,17 0,44 0,66 16
Republic of Bashkortostan 4 072 292 $15 797 8,0% $1 264 $14 533 0,84 0,83 0,73 0,90 0,83 0,82 1,73 5,67 1,17 0,83 1,26 0,45 0,18 0,65 1,12 10
Chelyabinsk region 3 476 217 $15 098 1,0% $151 $14 947 0,84 0,84 0,72 0,92 0,83 0,83 1,00 3,61 0,80 0,75 0,43 0,40 0,17 0,43 0,64 12
Samara region 3 215 532 $14 520 11,8% $1 713 $12 807 0,83 0,81 0,72 0,93 0,83 0,82 0,59 4,23 0,90 0,76 0,69 0,35 0,25 0,50 0,78 9
Kursk region 1 127 081 $12 860 6,6% $849 $12 011 0,81 0,80 0,72 0,94 0,82 0,82 1,47 3,01 0,68 0,49 0,57 0,25 0,10 0,35 0,57 37
Udmurtia 1 521 420 $15 290 24,2% $3 700 $11 590 0,84 0,79 0,72 0,91 0,82 0,81 1,86 2,85 0,61 0,57 0,37 0,30 0,15 0,34 0,51 39
Yaroslavl region 1 272 468 $14 760 0,1% $15 $14 745 0,83 0,83 0,73 0,91 0,82 0,82 1,90 2,70 0,78 0,59 0,18 0,29 0,11 0,33 0,41 38
Volgograd region 2 610 161 $13 200 5,0% $660 $12 540 0,81 0,81 0,74 0,91 0,82 0,82 1,21 3,90 0,87 0,96 0,39 0,37 0,15 0,46 0,72 22
Saratov region 2 521 892 $12 812 2,8% $359 $12 453 0,81 0,81 0,74 0,92 0,82 0,82 1,00 2,95 0,88 0,67 0,20 0,27 0,10 0,36 0,47 21
Moscow region 7 095 120 $17 255 0,3% $52 $17 203 0,86 0,86 0,72 0,88 0,82 0,82 0,43 4,53 0,92 1,24 0,41 0,37 0,17 0,52 0,89 2
Nizhny Novgorod region 3 310 597 $14 709 0,1% $15 $14 694 0,83 0,83 0,70 0,92 0,82 0,82 1,50 3,54 0,79 0,69 0,49 0,35 0,17 0,42 0,63 8
Rostov region 4 277 976 $11 302 0,9% $102 $11 200 0,79 0,79 0,74 0,92 0,82 0,82 0,95 4,33 1,01 1,12 0,40 0,34 0,14 0,51 0,81 11
Voronezh region 2 335 380 $11 036 0,5% $55 $10 981 0,79 0,78 0,73 0,94 0,82 0,82 0,64 2,73 0,79 0,48 0,31 0,29 0,10 0,33 0,43 23
Magadan region 156 996 $16 748 18,6% $3 115 $13 633 0,85 0,82 0,65 0,95 0,82 0,81 126,44 2,72 0,68 0,64 0,30 0,19 0,09 0,32 0,50 73
Perm Krai 2 635 276 $16 642 13,3% $2 213 $14 429 0,85 0,83 0,69 0,90 0,82 0,81 3,76 3,88 0,82 0,68 0,65 0,37 0,18 0,46 0,72 13
Orel region 786 935 $11 214 0,1% $11 $11 203 0,79 0,79 0,73 0,93 0,81 0,81 1,94 2,95 0,75 0,53 0,41 0,28 0,12 0,35 0,51 63
Kaliningrad region 941 873 $14 136 7,3% $1 032 $13 104 0,83 0,81 0,71 0,90 0,81 0,81 1,12 3,40 0,92 0,61 0,48 0,28 0,13 0,41 0,58 29
Kemerovo region 2 763 135 $18 721 25,2% $4 718 $14 003 0,87 0,82 0,67 0,89 0,81 0,80 1,77 3,30 0,92 0,51 0,45 0,35 0,17 0,40 0,51 15
North Ossetia-Alania 712 980 $9 343 0,3% $28 $9 315 0,76 0,76 0,78 0,90 0,81 0,81 0,62 3,77 1,03 0,76 0,40 0,33 0,16 0,45 0,63 62
Kaluga region 1 010 930 $14 500 0,6% $87 $14 413 0,83 0,83 0,71 0,89 0,81 0,81 1,99 3,40 0,78 0,76 0,36 0,37 0,13 0,40 0,60 32
Irkutsk region 2 428 750 $15 987 5,3% $847 $15 140 0,85 0,84 0,67 0,91 0,81 0,81 14,73 2,74 0,69 0,49 0,35 0,29 0,13 0,33 0,45 18
Vologda region 1 202 444 $14 327 0,1% $14 $14 313 0,83 0,83 0,71 0,90 0,81 0,81 7,71 2,47 0,66 0,56 0,22 0,23 0,10 0,30 0,41 55
Chuvash Republic 1 251 619 $10 971 0,0% $0 $10 971 0,78 0,78 0,73 0,91 0,81 0,81 0,82 2,85 0,59 0,44 0,59 0,24 0,11 0,33 0,55 54
The Republic of Dagestan 2 910 249 $9 337 0,5% $47 $9 290 0,76 0,76 0,82 0,86 0,81 0,81 0,71 6,51 2,32 1,38 0,34 0,63 0,12 0,80 0,92 33
Republic of Mordovia 834 755 $11 394 0,0% $0 $11 394 0,79 0,79 0,73 0,90 0,81 0,81 1,82 2,23 0,55 0,48 0,27 0,20 0,08 0,26 0,40 67
Murmansk region 795 409 $15 555 11,1% $1 727 $13 828 0,84 0,82 0,70 0,88 0,81 0,80 9,32 3,61 0,68 0,72 0,58 0,31 0,19 0,42 0,70 40
Chukotka Autonomous Okrug 50 526 $39 220 40,8% $16 002 $23 218 1,00 0,91 0,55 0,88 0,81 0,78 527,13 2,25 0,77 0,47 0,15 0,18 0,07 0,28 0,33 78
PROFILEs OF THE RussIAN REGIONs: ECOLOGICAL FOOTPRINT, BIOCAPACITY, HumAN, ANd ECONOmIC dEVELOPmENT
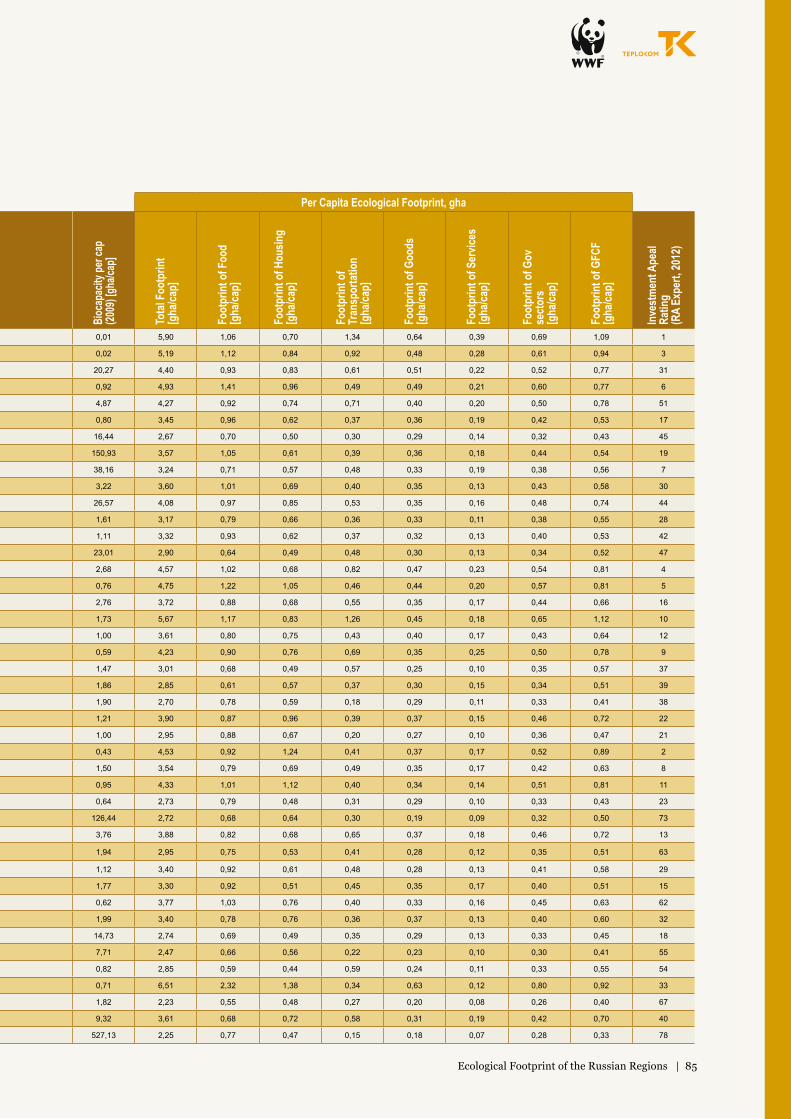
Ecological Footprint of the Russian Regions | 85
Per Capita Ecological Footprint, gha
Region
Popu
latio
n(2
010 C
ensu
s, pr
elim
inar
y)
Coun
try G
DP p
.c.
(PPP
) [In
tl.$]
»
% o
f GDP
for E
xtra
ctive
Re
sour
ces
GDP
Extra
ctive
p.c.
[In
tl.$]
GDP
w/o
extra
ctive
ac
tiviti
es p
.c. [I
ntl.$
]
Inco
me I
ndex
GDP
Inco
me I
ndex
GDP
m
inus
Ext
ract
ives
Long
evity
Inde
x be
twee
n 0-
1
Educ
ation
Inde
x
HDI 2
009
HDI*
2009
(exc
ludi
ng
extra
ctive
inco
me)
Bioc
apac
ity pe
r cap
(20
09) [
gha/c
ap]
Tota
l Foo
tprin
t [g
ha/ca
p]
Foot
prin
t of F
ood
[g
ha/ca
p]
Foot
prin
t of H
ousin
g [g
ha/ca
p]
Foot
prin
t of
Tran
spor
tatio
n
[gha
/cap]
Foot
prin
t of G
oods
[g
ha/ca
p]
Foot
prin
t of S
ervic
es
[gha
/cap]
Foot
prin
t of G
ov
sect
ors
[gha
/cap]
Foot
prin
t of G
FCF
[g
ha/ca
p]
Inve
stm
ent A
peal
Ratin
g
(RA
Expe
rt, 20
12)
Moscow 11 503 501 $40 805 0,0% $0 $40 805 1,00 1,00 0,81 1,08 0,96 0,96 0,01 5,90 1,06 0,70 1,34 0,64 0,39 0,69 1,09 1
St. Petersburg 4 879 566 $25 277 0,0% $0 $25 277 0,92 0,92 0,77 1,02 0,90 0,90 0,02 5,19 1,12 0,84 0,92 0,48 0,28 0,61 0,94 3
Tyumen region 3 395 755 $57 175 50,5% $28 873 $28 302 1,00 0,94 0,74 0,91 0,88 0,86 20,27 4,40 0,93 0,83 0,61 0,51 0,22 0,52 0,77 31
The Republic of Tatarstan 3 786 488 $23 290 22,8% $5 310 $17 980 0,91 0,87 0,76 0,92 0,86 0,85 0,92 4,93 1,41 0,96 0,49 0,49 0,21 0,60 0,77 6
Sakhalin Region 497 973 $43 462 55,7% $24 208 $19 254 1,00 0,88 0,66 0,89 0,85 0,81 4,87 4,27 0,92 0,74 0,71 0,40 0,20 0,50 0,78 51
Belgorod region 1 532 526 $19 569 8,4% $1 644 $17 925 0,88 0,87 0,77 0,91 0,85 0,85 0,80 3,45 0,96 0,62 0,37 0,36 0,19 0,42 0,53 17
Tomsk Oblast 1 047 394 $19 064 22,0% $4 194 $14 870 0,88 0,83 0,72 0,96 0,85 0,84 16,44 2,67 0,70 0,50 0,30 0,29 0,14 0,32 0,43 45
The Republic of Sakha (Yakutia) 958 528 $21 159 28,3% $5 988 $15 171 0,89 0,84 0,69 0,92 0,84 0,82 150,93 3,57 1,05 0,61 0,39 0,36 0,18 0,44 0,54 19
Krasnoyarsk Territory 2 828 187 $20 779 5,0% $1 039 $19 740 0,89 0,88 0,71 0,90 0,83 0,83 38,16 3,24 0,71 0,57 0,48 0,33 0,19 0,38 0,56 7
Omsk region 1 977 665 $16 213 0,1% $16 $16 197 0,85 0,85 0,73 0,92 0,83 0,83 3,22 3,60 1,01 0,69 0,40 0,35 0,13 0,43 0,58 30
Komi Republic 901 189 $22 335 29,4% $6 566 $15 769 0,90 0,84 0,69 0,90 0,83 0,81 26,57 4,08 0,97 0,85 0,53 0,35 0,16 0,48 0,74 44
Orenburg region 2 033 072 $19 507 34,8% $6 788 $12 719 0,88 0,81 0,71 0,90 0,83 0,81 1,61 3,17 0,79 0,66 0,36 0,33 0,11 0,38 0,55 28
Lipetsk region 1 173 513 $17 902 0,7% $125 $17 777 0,87 0,86 0,72 0,90 0,83 0,83 1,11 3,32 0,93 0,62 0,37 0,32 0,13 0,40 0,53 42
Arkhangelsk region 1 227 626 $19 310 31,5% $6 083 $13 227 0,88 0,82 0,71 0,90 0,83 0,81 23,01 2,90 0,64 0,49 0,48 0,30 0,13 0,34 0,52 47
Sverdlovsk region 4 297 747 $15 811 2,7% $427 $15 384 0,85 0,84 0,72 0,92 0,83 0,83 2,68 4,57 1,02 0,68 0,82 0,47 0,23 0,54 0,81 4
Krasnodar region 5 226 647 $13 899 0,8% $111 $13 788 0,82 0,82 0,76 0,90 0,83 0,83 0,76 4,75 1,22 1,05 0,46 0,44 0,20 0,57 0,81 5
Novosibirsk region 2 665 911 $13 383 3,6% $482 $12 901 0,82 0,81 0,73 0,94 0,83 0,83 2,76 3,72 0,88 0,68 0,55 0,35 0,17 0,44 0,66 16
Republic of Bashkortostan 4 072 292 $15 797 8,0% $1 264 $14 533 0,84 0,83 0,73 0,90 0,83 0,82 1,73 5,67 1,17 0,83 1,26 0,45 0,18 0,65 1,12 10
Chelyabinsk region 3 476 217 $15 098 1,0% $151 $14 947 0,84 0,84 0,72 0,92 0,83 0,83 1,00 3,61 0,80 0,75 0,43 0,40 0,17 0,43 0,64 12
Samara region 3 215 532 $14 520 11,8% $1 713 $12 807 0,83 0,81 0,72 0,93 0,83 0,82 0,59 4,23 0,90 0,76 0,69 0,35 0,25 0,50 0,78 9
Kursk region 1 127 081 $12 860 6,6% $849 $12 011 0,81 0,80 0,72 0,94 0,82 0,82 1,47 3,01 0,68 0,49 0,57 0,25 0,10 0,35 0,57 37
Udmurtia 1 521 420 $15 290 24,2% $3 700 $11 590 0,84 0,79 0,72 0,91 0,82 0,81 1,86 2,85 0,61 0,57 0,37 0,30 0,15 0,34 0,51 39
Yaroslavl region 1 272 468 $14 760 0,1% $15 $14 745 0,83 0,83 0,73 0,91 0,82 0,82 1,90 2,70 0,78 0,59 0,18 0,29 0,11 0,33 0,41 38
Volgograd region 2 610 161 $13 200 5,0% $660 $12 540 0,81 0,81 0,74 0,91 0,82 0,82 1,21 3,90 0,87 0,96 0,39 0,37 0,15 0,46 0,72 22
Saratov region 2 521 892 $12 812 2,8% $359 $12 453 0,81 0,81 0,74 0,92 0,82 0,82 1,00 2,95 0,88 0,67 0,20 0,27 0,10 0,36 0,47 21
Moscow region 7 095 120 $17 255 0,3% $52 $17 203 0,86 0,86 0,72 0,88 0,82 0,82 0,43 4,53 0,92 1,24 0,41 0,37 0,17 0,52 0,89 2
Nizhny Novgorod region 3 310 597 $14 709 0,1% $15 $14 694 0,83 0,83 0,70 0,92 0,82 0,82 1,50 3,54 0,79 0,69 0,49 0,35 0,17 0,42 0,63 8
Rostov region 4 277 976 $11 302 0,9% $102 $11 200 0,79 0,79 0,74 0,92 0,82 0,82 0,95 4,33 1,01 1,12 0,40 0,34 0,14 0,51 0,81 11
Voronezh region 2 335 380 $11 036 0,5% $55 $10 981 0,79 0,78 0,73 0,94 0,82 0,82 0,64 2,73 0,79 0,48 0,31 0,29 0,10 0,33 0,43 23
Magadan region 156 996 $16 748 18,6% $3 115 $13 633 0,85 0,82 0,65 0,95 0,82 0,81 126,44 2,72 0,68 0,64 0,30 0,19 0,09 0,32 0,50 73
Perm Krai 2 635 276 $16 642 13,3% $2 213 $14 429 0,85 0,83 0,69 0,90 0,82 0,81 3,76 3,88 0,82 0,68 0,65 0,37 0,18 0,46 0,72 13
Orel region 786 935 $11 214 0,1% $11 $11 203 0,79 0,79 0,73 0,93 0,81 0,81 1,94 2,95 0,75 0,53 0,41 0,28 0,12 0,35 0,51 63
Kaliningrad region 941 873 $14 136 7,3% $1 032 $13 104 0,83 0,81 0,71 0,90 0,81 0,81 1,12 3,40 0,92 0,61 0,48 0,28 0,13 0,41 0,58 29
Kemerovo region 2 763 135 $18 721 25,2% $4 718 $14 003 0,87 0,82 0,67 0,89 0,81 0,80 1,77 3,30 0,92 0,51 0,45 0,35 0,17 0,40 0,51 15
North Ossetia-Alania 712 980 $9 343 0,3% $28 $9 315 0,76 0,76 0,78 0,90 0,81 0,81 0,62 3,77 1,03 0,76 0,40 0,33 0,16 0,45 0,63 62
Kaluga region 1 010 930 $14 500 0,6% $87 $14 413 0,83 0,83 0,71 0,89 0,81 0,81 1,99 3,40 0,78 0,76 0,36 0,37 0,13 0,40 0,60 32
Irkutsk region 2 428 750 $15 987 5,3% $847 $15 140 0,85 0,84 0,67 0,91 0,81 0,81 14,73 2,74 0,69 0,49 0,35 0,29 0,13 0,33 0,45 18
Vologda region 1 202 444 $14 327 0,1% $14 $14 313 0,83 0,83 0,71 0,90 0,81 0,81 7,71 2,47 0,66 0,56 0,22 0,23 0,10 0,30 0,41 55
Chuvash Republic 1 251 619 $10 971 0,0% $0 $10 971 0,78 0,78 0,73 0,91 0,81 0,81 0,82 2,85 0,59 0,44 0,59 0,24 0,11 0,33 0,55 54
The Republic of Dagestan 2 910 249 $9 337 0,5% $47 $9 290 0,76 0,76 0,82 0,86 0,81 0,81 0,71 6,51 2,32 1,38 0,34 0,63 0,12 0,80 0,92 33
Republic of Mordovia 834 755 $11 394 0,0% $0 $11 394 0,79 0,79 0,73 0,90 0,81 0,81 1,82 2,23 0,55 0,48 0,27 0,20 0,08 0,26 0,40 67
Murmansk region 795 409 $15 555 11,1% $1 727 $13 828 0,84 0,82 0,70 0,88 0,81 0,80 9,32 3,61 0,68 0,72 0,58 0,31 0,19 0,42 0,70 40
Chukotka Autonomous Okrug 50 526 $39 220 40,8% $16 002 $23 218 1,00 0,91 0,55 0,88 0,81 0,78 527,13 2,25 0,77 0,47 0,15 0,18 0,07 0,28 0,33 78

86 | Ecological Footprint of the Russian Regions
Per Capita Ecological Footprint, gha
Region
Popu
latio
n(2
010 C
ensu
s, pr
elim
inar
y)
Coun
try G
DP p
.c.
(PPP
) [In
tl.$]
»
% o
f GDP
for E
xtra
ctive
Re
sour
ces
GDP
Extra
ctive
p.c.
[In
tl.$]
GDP
w/o
extra
ctive
ac
tiviti
es p
.c. [I
ntl.$
]
Inco
me I
ndex
GDP
Inco
me I
ndex
GDP
m
inus
Ext
ract
ives
Long
evity
Inde
x be
twee
n 0-
1
Educ
ation
Inde
x
HDI 2
009
HDI*
2009
(exc
ludi
ng
extra
ctive
inco
me)
Bioc
apac
ity pe
r cap
(20
09) [
gha/c
ap]
Tota
l Foo
tprin
t [g
ha/ca
p]
Foot
prin
t of F
ood
[g
ha/ca
p]
Foot
prin
t of H
ousin
g [g
ha/ca
p]
Foot
prin
t of
Tran
spor
tatio
n
[gha
/cap]
Foot
prin
t of G
oods
[g
ha/ca
p]
Foot
prin
t of S
ervic
es
[gha
/cap]
Foot
prin
t of G
ov
sect
ors
[gha
/cap]
Foot
prin
t of G
FCF
[g
ha/ca
p]
Inve
stm
ent A
peal
Ratin
g
(RA
Expe
rt, 20
12)
Republic of Khakassia 532 403 $13 680 10,3% $1 409 $12 271 0,82 0,80 0,70 0,90 0,81 0,80 5,38 2,41 0,58 0,42 0,34 0,26 0,11 0,29 0,41 75
Astrakhan region 1 010 073 $12 610 2,7% $340 $12 270 0,81 0,80 0,72 0,90 0,81 0,81 0,51 4,43 1,01 0,99 0,54 0,40 0,16 0,52 0,82 58
Ulyanovsk region 1 292 799 $11 794 2,0% $236 $11 558 0,80 0,79 0,73 0,90 0,81 0,81 1,15 3,14 0,75 0,55 0,54 0,24 0,12 0,37 0,58 48
Ryazan region 1 154 114 $11 510 0,3% $35 $11 475 0,79 0,79 0,71 0,92 0,81 0,81 2,17 2,86 0,72 0,55 0,43 0,20 0,10 0,34 0,53 53
Penza region 1 386 186 $10 764 0,5% $54 $10 710 0,78 0,78 0,74 0,90 0,81 0,81 1,29 3,04 0,90 0,55 0,35 0,30 0,09 0,37 0,48 49
Leningrad region 1 716 868 $21 549 2,7% $582 $20 967 0,90 0,89 0,70 0,82 0,81 0,80 3,15 3,41 0,76 0,84 0,40 0,23 0,11 0,39 0,67 27
Tambov region 1 091 994 $11 469 0,0% $0 $11 469 0,79 0,79 0,73 0,89 0,80 0,80 1,14 3,11 0,82 0,56 0,41 0,30 0,11 0,37 0,52 56
Khabarovsk Krai 1 343 869 $12 320 4,8% $591 $11 729 0,80 0,80 0,69 0,92 0,80 0,80 24,17 3,19 0,65 0,63 0,45 0,37 0,14 0,38 0,58 34
Primorsky Krai 1 956 497 $12 574 1,2% $151 $12 423 0,81 0,80 0,70 0,91 0,80 0,80 3,97 2,53 0,63 0,48 0,30 0,25 0,15 0,30 0,42 20
Stavropol region 2 786 281 $8 725 0,8% $70 $8 655 0,75 0,74 0,76 0,90 0,80 0,80 1,00 4,24 0,88 0,88 0,70 0,32 0,13 0,49 0,85 24
Karachay-Cherkessia. 478 859 $8 669 1,5% $130 $8 539 0,74 0,74 0,78 0,88 0,80 0,80 1,44 2,76 0,75 0,62 0,19 0,23 0,21 0,34 0,43 74
Tula region 1 553 925 $12 671 0,3% $38 $12 633 0,81 0,81 0,70 0,90 0,80 0,80 1,07 3,16 0,99 0,64 0,24 0,32 0,11 0,39 0,47 35
Republic of Karelia 643 548 $12 931 4,8% $621 $12 310 0,81 0,80 0,69 0,89 0,80 0,80 14,48 3,20 0,75 0,68 0,40 0,29 0,12 0,38 0,58 59
Novgorod region 634 111 $16 397 0,1% $16 $16 381 0,85 0,85 0,66 0,89 0,80 0,80 6,36 3,25 0,81 0,72 0,34 0,30 0,13 0,39 0,57 64
Kamchatka Krai 322 079 $12 931 4,1% $530 $12 401 0,81 0,80 0,68 0,90 0,80 0,80 52,85 2,34 0,48 0,54 0,31 0,19 0,09 0,27 0,46 70
Altai Territory 2 419 755 $10 295 0,8% $82 $10 213 0,77 0,77 0,73 0,89 0,80 0,80 3,03 2,87 0,66 0,59 0,39 0,27 0,10 0,34 0,52 26
Kurgan region 910 807 $10 833 0,6% $65 $10 768 0,78 0,78 0,71 0,90 0,80 0,79 2,95 2,83 0,69 0,50 0,46 0,23 0,10 0,33 0,51 68
Republic of Adygea 439 996 $8 583 1,0% $86 $8 497 0,74 0,74 0,75 0,89 0,80 0,79 1,12 3,29 0,79 0,81 0,29 0,32 0,11 0,39 0,59 76
Smolensk region 985 537 $11 845 0,5% $59 $11 786 0,80 0,80 0,68 0,91 0,79 0,79 3,49 3,26 0,76 0,61 0,53 0,25 0,12 0,38 0,61 46
Vladimir region 1 443 693 $11 666 0,4% $47 $11 619 0,79 0,79 0,69 0,90 0,79 0,79 1,37 2,24 0,60 0,44 0,26 0,21 0,09 0,27 0,37 36
Kirov region 1 341 312 $9 634 0,3% $29 $9 605 0,76 0,76 0,72 0,90 0,79 0,79 5,57 2,73 0,63 0,49 0,44 0,26 0,10 0,32 0,50 57
Kostroma 667 562 $10 941 0,1% $11 $10 930 0,78 0,78 0,70 0,89 0,79 0,79 5,69 2,40 0,63 0,42 0,32 0,25 0,10 0,29 0,39 71
Republic of Buryatia 972 021 $11 148 4,6% $513 $10 635 0,79 0,78 0,67 0,92 0,79 0,79 14,25 3,43 0,89 0,69 0,44 0,29 0,12 0,41 0,60 52
Bryansk region 1 278 217 $9 345 0,1% $9 $9 336 0,76 0,76 0,71 0,90 0,79 0,79 1,85 3,06 0,93 0,64 0,22 0,30 0,13 0,37 0,46 41
Amur Oblast 830 103 $13 115 10,5% $1 377 $11 738 0,81 0,80 0,66 0,90 0,79 0,78 20,20 2,61 0,57 0,68 0,27 0,20 0,09 0,30 0,51 65
Tver region 1 353 392 $12 228 0,2% $24 $12 204 0,80 0,80 0,67 0,89 0,79 0,79 4,36 2,85 0,79 0,49 0,37 0,30 0,11 0,34 0,46 43
Kabardino-Balkaria 859 939 $7 666 0,1% $8 $7 658 0,72 0,72 0,79 0,86 0,79 0,79 0,81 3,95 1,15 0,84 0,33 0,38 0,15 0,48 0,63 61
Mari El Republic 696 459 $10 265 0,0% $0 $10 265 0,77 0,77 0,70 0,89 0,79 0,79 2,03 2,66 0,68 0,54 0,30 0,28 0,10 0,32 0,45 72
Republic of Kalmykia 289 481 $8 087 2,5% $202 $7 885 0,73 0,73 0,73 0,89 0,78 0,78 4,83 1,65 0,49 0,32 0,17 0,15 0,06 0,20 0,26 82
Zabaykalsky region (Trans-Bikal Region)
1 107 107 $11 926 7,1% $847 $11 079 0,80 0,79 0,66 0,89 0,78 0,78 16,38 3,32 0,98 0,68 0,31 0,30 0,11 0,40 0,53 50
Ivanovo region 1 061 651 $7 425 0,2% $15 $7 410 0,72 0,72 0,70 0,91 0,78 0,78 1,36 2,36 0,69 0,61 0,14 0,17 0,07 0,28 0,40 60
Pskov region 673 423 $9 877 0,2% $20 $9 857 0,77 0,77 0,66 0,89 0,77 0,77 5,34 2,94 0,78 0,61 0,34 0,26 0,09 0,35 0,51 66
The Chechen Republic 1 268 989 $5 023 3,5% $176 $4 847 0,65 0,65 0,80 0,84 0,76 0,76 0,61 4,57 2,30 0,38 0,24 0,59 0,12 0,61 0,33 69
Republic of Atai 206 168 $7 520 1,6% $120 $7 400 0,72 0,72 0,68 0,89 0,76 0,76 17,01 1,80 0,44 0,33 0,26 0,17 0,06 0,21 0,32 81
Republic of Ingushetia 412 529 $3 494 2,4% $84 $3 410 0,59 0,59 0,89 0,80 0,76 0,76 0,42 2,85 1,18 0,44 0,31 0,13 0,04 0,35 0,40 77
Jewish Autonomous Region 176 558 $9 849 0,3% $30 $9 819 0,77 0,77 0,64 0,88 0,76 0,76 10,75 2,44 0,60 0,56 0,20 0,28 0,11 0,29 0,41 79
Republic of Tyva 307 930 $7 578 4,7% $356 $7 222 0,72 0,71 0,58 0,89 0,73 0,73 20,19 1,66 0,47 0,24 0,23 0,18 0,09 0,20 0,25 80
Khanty-Mansi Autonomous Okrug
1 532 243 - - - - - - - - - 0,86 18,79 4,40 0,82 0,73 0,77 0,50 0,26 0,52 0,80 14
Yamal-Nenets Autonomous Okrug
522 904 - - - - - - - - - 0,86 59,27 4,62 1,04 0,91 0,57 0,57 0,18 0,55 0,79 25
Nenets Autonomous Okrug 42 090 - - - - - - - - - 0,81 187,41 3,27 0,50 0,57 0,82 0,20 0,07 0,36 0,75 83

Ecological Footprint of the Russian Regions | 87
Per Capita Ecological Footprint, gha
Region
Popu
latio
n(2
010 C
ensu
s, pr
elim
inar
y)
Coun
try G
DP p
.c.
(PPP
) [In
tl.$]
»
% o
f GDP
for E
xtra
ctive
Re
sour
ces
GDP
Extra
ctive
p.c.
[In
tl.$]
GDP
w/o
extra
ctive
ac
tiviti
es p
.c. [I
ntl.$
]
Inco
me I
ndex
GDP
Inco
me I
ndex
GDP
m
inus
Ext
ract
ives
Long
evity
Inde
x be
twee
n 0-
1
Educ
ation
Inde
x
HDI 2
009
HDI*
2009
(exc
ludi
ng
extra
ctive
inco
me)
Bioc
apac
ity pe
r cap
(20
09) [
gha/c
ap]
Tota
l Foo
tprin
t [g
ha/ca
p]
Foot
prin
t of F
ood
[g
ha/ca
p]
Foot
prin
t of H
ousin
g [g
ha/ca
p]
Foot
prin
t of
Tran
spor
tatio
n
[gha
/cap]
Foot
prin
t of G
oods
[g
ha/ca
p]
Foot
prin
t of S
ervic
es
[gha
/cap]
Foot
prin
t of G
ov
sect
ors
[gha
/cap]
Foot
prin
t of G
FCF
[g
ha/ca
p]
Inve
stm
ent A
peal
Ratin
g
(RA
Expe
rt, 20
12)
Republic of Khakassia 532 403 $13 680 10,3% $1 409 $12 271 0,82 0,80 0,70 0,90 0,81 0,80 5,38 2,41 0,58 0,42 0,34 0,26 0,11 0,29 0,41 75
Astrakhan region 1 010 073 $12 610 2,7% $340 $12 270 0,81 0,80 0,72 0,90 0,81 0,81 0,51 4,43 1,01 0,99 0,54 0,40 0,16 0,52 0,82 58
Ulyanovsk region 1 292 799 $11 794 2,0% $236 $11 558 0,80 0,79 0,73 0,90 0,81 0,81 1,15 3,14 0,75 0,55 0,54 0,24 0,12 0,37 0,58 48
Ryazan region 1 154 114 $11 510 0,3% $35 $11 475 0,79 0,79 0,71 0,92 0,81 0,81 2,17 2,86 0,72 0,55 0,43 0,20 0,10 0,34 0,53 53
Penza region 1 386 186 $10 764 0,5% $54 $10 710 0,78 0,78 0,74 0,90 0,81 0,81 1,29 3,04 0,90 0,55 0,35 0,30 0,09 0,37 0,48 49
Leningrad region 1 716 868 $21 549 2,7% $582 $20 967 0,90 0,89 0,70 0,82 0,81 0,80 3,15 3,41 0,76 0,84 0,40 0,23 0,11 0,39 0,67 27
Tambov region 1 091 994 $11 469 0,0% $0 $11 469 0,79 0,79 0,73 0,89 0,80 0,80 1,14 3,11 0,82 0,56 0,41 0,30 0,11 0,37 0,52 56
Khabarovsk Krai 1 343 869 $12 320 4,8% $591 $11 729 0,80 0,80 0,69 0,92 0,80 0,80 24,17 3,19 0,65 0,63 0,45 0,37 0,14 0,38 0,58 34
Primorsky Krai 1 956 497 $12 574 1,2% $151 $12 423 0,81 0,80 0,70 0,91 0,80 0,80 3,97 2,53 0,63 0,48 0,30 0,25 0,15 0,30 0,42 20
Stavropol region 2 786 281 $8 725 0,8% $70 $8 655 0,75 0,74 0,76 0,90 0,80 0,80 1,00 4,24 0,88 0,88 0,70 0,32 0,13 0,49 0,85 24
Karachay-Cherkessia. 478 859 $8 669 1,5% $130 $8 539 0,74 0,74 0,78 0,88 0,80 0,80 1,44 2,76 0,75 0,62 0,19 0,23 0,21 0,34 0,43 74
Tula region 1 553 925 $12 671 0,3% $38 $12 633 0,81 0,81 0,70 0,90 0,80 0,80 1,07 3,16 0,99 0,64 0,24 0,32 0,11 0,39 0,47 35
Republic of Karelia 643 548 $12 931 4,8% $621 $12 310 0,81 0,80 0,69 0,89 0,80 0,80 14,48 3,20 0,75 0,68 0,40 0,29 0,12 0,38 0,58 59
Novgorod region 634 111 $16 397 0,1% $16 $16 381 0,85 0,85 0,66 0,89 0,80 0,80 6,36 3,25 0,81 0,72 0,34 0,30 0,13 0,39 0,57 64
Kamchatka Krai 322 079 $12 931 4,1% $530 $12 401 0,81 0,80 0,68 0,90 0,80 0,80 52,85 2,34 0,48 0,54 0,31 0,19 0,09 0,27 0,46 70
Altai Territory 2 419 755 $10 295 0,8% $82 $10 213 0,77 0,77 0,73 0,89 0,80 0,80 3,03 2,87 0,66 0,59 0,39 0,27 0,10 0,34 0,52 26
Kurgan region 910 807 $10 833 0,6% $65 $10 768 0,78 0,78 0,71 0,90 0,80 0,79 2,95 2,83 0,69 0,50 0,46 0,23 0,10 0,33 0,51 68
Republic of Adygea 439 996 $8 583 1,0% $86 $8 497 0,74 0,74 0,75 0,89 0,80 0,79 1,12 3,29 0,79 0,81 0,29 0,32 0,11 0,39 0,59 76
Smolensk region 985 537 $11 845 0,5% $59 $11 786 0,80 0,80 0,68 0,91 0,79 0,79 3,49 3,26 0,76 0,61 0,53 0,25 0,12 0,38 0,61 46
Vladimir region 1 443 693 $11 666 0,4% $47 $11 619 0,79 0,79 0,69 0,90 0,79 0,79 1,37 2,24 0,60 0,44 0,26 0,21 0,09 0,27 0,37 36
Kirov region 1 341 312 $9 634 0,3% $29 $9 605 0,76 0,76 0,72 0,90 0,79 0,79 5,57 2,73 0,63 0,49 0,44 0,26 0,10 0,32 0,50 57
Kostroma 667 562 $10 941 0,1% $11 $10 930 0,78 0,78 0,70 0,89 0,79 0,79 5,69 2,40 0,63 0,42 0,32 0,25 0,10 0,29 0,39 71
Republic of Buryatia 972 021 $11 148 4,6% $513 $10 635 0,79 0,78 0,67 0,92 0,79 0,79 14,25 3,43 0,89 0,69 0,44 0,29 0,12 0,41 0,60 52
Bryansk region 1 278 217 $9 345 0,1% $9 $9 336 0,76 0,76 0,71 0,90 0,79 0,79 1,85 3,06 0,93 0,64 0,22 0,30 0,13 0,37 0,46 41
Amur Oblast 830 103 $13 115 10,5% $1 377 $11 738 0,81 0,80 0,66 0,90 0,79 0,78 20,20 2,61 0,57 0,68 0,27 0,20 0,09 0,30 0,51 65
Tver region 1 353 392 $12 228 0,2% $24 $12 204 0,80 0,80 0,67 0,89 0,79 0,79 4,36 2,85 0,79 0,49 0,37 0,30 0,11 0,34 0,46 43
Kabardino-Balkaria 859 939 $7 666 0,1% $8 $7 658 0,72 0,72 0,79 0,86 0,79 0,79 0,81 3,95 1,15 0,84 0,33 0,38 0,15 0,48 0,63 61
Mari El Republic 696 459 $10 265 0,0% $0 $10 265 0,77 0,77 0,70 0,89 0,79 0,79 2,03 2,66 0,68 0,54 0,30 0,28 0,10 0,32 0,45 72
Republic of Kalmykia 289 481 $8 087 2,5% $202 $7 885 0,73 0,73 0,73 0,89 0,78 0,78 4,83 1,65 0,49 0,32 0,17 0,15 0,06 0,20 0,26 82
Zabaykalsky region (Trans-Bikal Region)
1 107 107 $11 926 7,1% $847 $11 079 0,80 0,79 0,66 0,89 0,78 0,78 16,38 3,32 0,98 0,68 0,31 0,30 0,11 0,40 0,53 50
Ivanovo region 1 061 651 $7 425 0,2% $15 $7 410 0,72 0,72 0,70 0,91 0,78 0,78 1,36 2,36 0,69 0,61 0,14 0,17 0,07 0,28 0,40 60
Pskov region 673 423 $9 877 0,2% $20 $9 857 0,77 0,77 0,66 0,89 0,77 0,77 5,34 2,94 0,78 0,61 0,34 0,26 0,09 0,35 0,51 66
The Chechen Republic 1 268 989 $5 023 3,5% $176 $4 847 0,65 0,65 0,80 0,84 0,76 0,76 0,61 4,57 2,30 0,38 0,24 0,59 0,12 0,61 0,33 69
Republic of Atai 206 168 $7 520 1,6% $120 $7 400 0,72 0,72 0,68 0,89 0,76 0,76 17,01 1,80 0,44 0,33 0,26 0,17 0,06 0,21 0,32 81
Republic of Ingushetia 412 529 $3 494 2,4% $84 $3 410 0,59 0,59 0,89 0,80 0,76 0,76 0,42 2,85 1,18 0,44 0,31 0,13 0,04 0,35 0,40 77
Jewish Autonomous Region 176 558 $9 849 0,3% $30 $9 819 0,77 0,77 0,64 0,88 0,76 0,76 10,75 2,44 0,60 0,56 0,20 0,28 0,11 0,29 0,41 79
Republic of Tyva 307 930 $7 578 4,7% $356 $7 222 0,72 0,71 0,58 0,89 0,73 0,73 20,19 1,66 0,47 0,24 0,23 0,18 0,09 0,20 0,25 80
Khanty-Mansi Autonomous Okrug
1 532 243 - - - - - - - - - 0,86 18,79 4,40 0,82 0,73 0,77 0,50 0,26 0,52 0,80 14
Yamal-Nenets Autonomous Okrug
522 904 - - - - - - - - - 0,86 59,27 4,62 1,04 0,91 0,57 0,57 0,18 0,55 0,79 25
Nenets Autonomous Okrug 42 090 - - - - - - - - - 0,81 187,41 3,27 0,50 0,57 0,82 0,20 0,07 0,36 0,75 83

Ecological Footprint of the Russian Regions
Edited by Pavel A. Boev
Proof-read by Elena A. Dubchenko
Translated by Marina A. Marey
Design by Denis N. Kopeykin
Cover photograph: Global Warming Images / WWF-Canon
Printed in the Russian Federation by IndexMarket
WWF-Russia
109240 Russia, Moscow, Nikoloyamskaya St., 19, bld. 3

WWF's Mission StatementTo stop the degradation of the planet's natural environment and to build a future in which humans live in harmony with nature
www.wwf.ru
WWF-Russia109240 Russia, Moscow, Nikoloyamskaya St., 19, bld. 3Tel: + 7 (495) 727 0939, Fax: + 7 (495) 727 0938
6.6 gha per personavailable biocapacity in the Russian Federation in 2009
60%of Russia’s overall Footprint is carbon
2.5 Earthswould need the humanity to sustain our demand on nature if everyone on the planet lived the average lifestyle of Russian residents
4 gha per person average Russian’s Ecological Footprint. This is 1.5 times more than the World average
941 million gha is Russia’s total amount of biocapacity which with the Ecological Footprint of 569 million gha gives it a reserve of about 372 million gha (as of 2009)
Care about our Planet? Donate now: www.wwf.ru/donateWWW.WWF.RU