Consumer Footprint Basket of Products indicator on ...
184
Consumer Footprint Basket of Products indicator on Household goods Valentina Castellani, Carme Hidalgo, Laura Gelabert, Maria Rosa Riera, Marta Escamilla, Esther Sanyé Mengual, Serenella Sala 2019 EUR 29710 EN
-
Upload
khangminh22 -
Category
Documents
-
view
0 -
download
0
Transcript of Consumer Footprint Basket of Products indicator on ...

Consumer Footprint
Basket of Products indicator on Household goods
Valentina Castellani, Carme Hidalgo,
Laura Gelabert, Maria Rosa Riera,
Marta Escamilla, Esther Sanyé
Mengual, Serenella Sala
2019
EUR 29710 EN

This publication is a Technical report by the Joint Research Centre (JRC), the European Commission’s science
and knowledge service. It aims to provide evidence-based scientific support to the European policymaking
process. The scientific output expressed does not imply a policy position of the European Commission. Neither
the European Commission nor any person acting on behalf of the Commission is responsible for the use that
might be made of this publication. For information on the methodology and quality underlying the data used in
this publication for which the source is neither Eurostat nor other Commission services, users should contact
the referenced source. The designations employed and the presentation of material on the maps do not imply
the expression of any opinion whatsoever on the part of the European Union concerning the legal status of any
country, territory, city or area or of its authorities, or concerning the delimitation of its frontiers or boundaries.
Contact information
Name: Serenella Sala
Email: [email protected]
EU Science Hub
https://ec.europa.eu/jrc
JRC116120
EUR 29710 EN
PDF ISBN 978-92-76-01614-4 ISSN 1831-9424 doi:10.2760/462368
Print ISBN 978-92-76-01613-7 ISSN 1018-5593 doi:10.2760/908332
Luxembourg: Publications Office of the European Union, 2019
© European Union, 2019
The reuse policy of the European Commission is implemented by the Commission Decision 2011/833/EU of 12
December 2011 on the reuse of Commission documents (OJ L 330, 14.12.2011, p. 39). Except otherwise noted,
the reuse of this document is authorised under the Creative Commons Attribution 4.0 International (CC BY 4.0)
licence (https://creativecommons.org/licenses/by/4.0/). This means that reuse is allowed provided appropriate
credit is given and any changes are indicated. For any use or reproduction of photos or other material that is
not owned by the EU, permission must be sought directly from the copyright holders.
All content © European Union 2019, except: cover image, Federico Rostagno, image 82193464. Source:
Fotolia.com.
How to cite this report: Castellani V., Hidalgo C., Gelabert L., Riera M.R., Escamilla M., Sanyé Mengual E., Sala
S., Consumer Footprint. Basket of Products indicator on Household goods, EUR 29710 EN, Publications Office of
the European Union, Luxembourg, 2019, ISBN 978-92-76-01614-4, doi:10.2760/462368, JRC116120.
i
Contents
Acknowledgements ................................................................................................ 1
Abstract ............................................................................................................... 2
1 The European Union (EU) Consumer Footprint ....................................................... 4
2 Environmental impacts of consumer goods ........................................................... 7
3 Basket model for household goods ....................................................................... 9
3.1 Description of the BoP household goods.......................................................... 9
3.1.1 Product groups in the BoP household goods and related quantities ........... 10
3.2 Life Cycle Inventory of the BoP .................................................................... 13
3.2.1 General assumptions adopted in the life cycle inventory of products ......... 15
3.2.2 Lifespan of products ........................................................................... 15
3.2.3 LCI of components manufacture .......................................................... 16
3.2.4 LCI of production ............................................................................... 16
3.2.5 LCI of packaging ................................................................................ 18
3.2.6 LCI of logistics ................................................................................... 21
3.2.7 LCI of use phase ................................................................................ 22
3.2.8 LCI of End of Life ............................................................................... 23
4 Results of baseline’s hotspot analysis ................................................................. 26
4.1 Contribution by life cycle stages .................................................................. 33
4.2 Most relevant elementary flows ................................................................... 36
4.3. Contribution by product groups ................................................................... 39
4.4. Trends: consumption and environmental impacts between 2010 and 2015 ....... 42
5. Main hotspots ................................................................................................. 45
6. Eco-innovations relevant for the BoP household goods ......................................... 46
7. EU Ecolabel and GPP criteria on household goods and eco-innovation scenarios on the
BoP household goods ........................................................................................... 48
8. Scenarios of eco-innovation for the area of consumption household goods .............. 54
8.1. Selection of scenarios on EU Ecolabel criteria ................................................ 54
8.2. List of the scenarios tested in the BoP household goods .................................. 58
8.3. Scenario 1 – Larger use of Totally Chlorine Free (TCF) pulp in paper products and
sanitary products ............................................................................................. 59
8.4. Scenario 2 – Reducing the impact of electricity use in the textile sector ............ 66
8.5. Scenario 3 – Improving reuse (second-hand products) ................................... 72
8.6. Scenario 4 – Using textiles with recycled input materials for clothes manufacturing
............................................................................................................... 78
8.7. Scenario 5 – EU Ecolabel scenario on liquid soap ........................................... 83
8.8. Scenario 6 – EU Ecolabel scenario on shampoo .............................................. 93
8.9. Scenario 7 – EU Ecolabel scenario on dishwasher detergent ............................ 99

ii
8.10. Scenario 8 – EU Ecolabel scenario on laundry detergent ......................... 105
8.11. Scenario 9 – EU Ecolabel scenario on upholstered seat ........................... 112
8.12. Scenario 10 - Overall potential from the analysed EU Ecolabel scenarios ... 117
8.13. Sensitivity analyses on EU Ecolabel scenarios ........................................ 120
8.14. Summary of results from scenario analysis ........................................... 122
9. Conclusions .................................................................................................. 125
References ....................................................................................................... 129
List of abbreviations and definitions ..................................................................... 140
List of boxes ..................................................................................................... 142
List of figures .................................................................................................... 143
List of tables ..................................................................................................... 145
Annexes ........................................................................................................... 148
Annex 1. Bill of materials of the representative products in the BoP ..................... 148
Annex 2. Datasets used to model packaging production and end of life ................ 160
Annex 3. Global normalization factors for the Environmental Footprint method (EF 3.0)
............................................................................................................. 162
Annex 4. Network graphs of the inventory of most contributing elementary flows .. 163

1
Acknowledgements
The content of the present report has been developed in the context of the Administrative
Arrangement (AA) “Indicators and assessment of the environmental impact of EU
consumption (LC-IND2)” (AA no. 070201/2015/SI2.705230/SER/ENV.A1) and the AA
“Application of the consumption footprint indicators in policy analysis (Consumption
Footprint)” (AA no. 07.0201/2018/790087/AA/ENV.B.1). This report is a milestone of
Deliverable 3.
The authors acknowledge the support of Carlo Gittoi (Chimica HTS Srl) in defining the
formulations of EU Ecolabel products in the scenarios 5, 6, 7, and 8.
Taija Sinkko, Antoine Beylot, and Carla Caldeira provided an internal review of the report.
Project responsible for DG Environment: Jiannis Kougoulis
Authors of the report:
Castellani Valentina: whole report
Carme Hidalgo: chapter 8.1, 8.7, 8.8, 8.9, 8.10, 8.11, 8.12, 8.13, 8.14, 9.
Laura Gelabert: chapter 8.1, 8.7, 8.8, 8.9, 8.10, 8.11, 8.12.
Maria Rosa Riera: chapter 8.1, 8.7, 8.8, 8.9, 8.10, 8.11, 8.12, 8.13, 8.14, 9.
Marta Escamilla: chapter 8.1, 8.7, 8.8, 8.9, 8.10, 8.11, 8.12, 8.13, 8.14, 9.
Esther Sanyé Mengual: chapter 4, 4.2 (results calculated with EF 3.0), 4.4.
Sala Serenella: project responsible for JRC and overall scientific coordinator of the project.
Disclaimer:
The study underpinning the calculation of the Consumer Footprint started in 2016 and run
in parallel to the Environmental Footprint (EF) pilot phase. Hence, the modelling approach
adopted and the life cycle inventory data used are not fully compliant with EF rules and are
only intended to illustrate the use of Life Cycle Assessment (LCA) to define the baseline of
impacts due to consumption in Europe and to test eco-innovation and policy options against
that baseline.
Moreover, the calculation of life cycle indicators (in this case the Consumer Footprint
indicators) is subject to periodical refinement, improvement, and evolution. The present
report describes the main methodological elements and results. For the latest versions
(including updates, improvements or errata corrige), please refer to the dedicated webpage
of the EPLCA website: http://eplca.jrc.ec.europa.eu/sustainableConsumption.html.
Please address comments or requests for further information or clarification on the
contents of the report to [email protected]

2
Abstract
The Consumer Footprint aims at assessing the potential environmental impacts due to
consumption. The calculation of the Consumer Footprint of the European Union (EU) is
based on the Life Cycle Assessment (LCA) of representative products (or services)
purchased and used in one year by an EU citizen. This report details the subset indicator
of the basket of products (BoP) on household goods, which is built to assess the impact
associated to household goods in the EU, from raw material extraction to end of life. The
reference flow is the amount of household goods purchased and used by an average EU
citizen in a reference year (2010). It consists of a process-based life cycle inventory model
for a basket of products that represents the most relevant household goods product
groups, selected by a number of criteria, including importance in terms of mass, relevance
in economic value, and listed in the products for which an Ecolabel has been defined. In
total, 30 representative products were modelled, considering the following product groups:
detergents, rinse-off cosmetics, absorbent hygiene products, furniture, bed mattresses,
footwear, clothes (textile products), and paper products.
The Consumer Footprint for the BoP household goods is assessed using 15 environmental
impact categories as for the ILCD impact assessment method and running a sensitivity
with the Environmental Footprint method (EF 3.0). Results for the year 2010 show that the
most impacting life cycle stage for the majority of products is the manufacture of
components (raw materials, ingredients or intermediate products) that are used to produce
the final products. The product groups that emerge as hotspots in most of the impact
categories are detergents, furniture, paper products, and clothes. The role of this product
groups rely not only on a high environmental impact intensity per single product but also
on a large consumption intensity by EU citizen. The step of impact normalization and equal
weighting of impact categories highlights that the most relevant impacts of the BoP
household goods occur in human toxicity (cancer and non-cancer effects), resource
depletion (and especially fossil resources), and ionising radiation. The relative share of
these categories varies according to the set of normalisation factors used (EU-27 or global
references). The employment of the weighting set of the EF method increases the relevance
of climate change and resource use, while decreasing the importance of human toxicity.
When considering the EF3.0 impact method, freshwater ecotoxicity becomes the most
relevant impact category, followed by ionising radiation and fossil resources use. An
assessment of the year 2015 unveils an increasing trend of the environmental impact due
to a larger consumption, partially associated to an increased population from EU-27 to EU-
28 (inclusion of Croatia).
The Consumer Footprint BoP household goods baseline has been assessed against 10 eco-
innovation scenarios, referring to improvement options related to the main drivers of
impact (e.g. components manufacture) and acting on the most relevant product groups.
Among the scenarios assessed, the options that allow for a higher reduction of impacts are
the ones related to the use of less impacting electricity mixes in the production phase and
to the reuse of products (clothes and furniture). Six scenarios were specifically aimed at
assessing the impact of substituting some average products (namely liquid soap, shampoo,
dishwasher detergent, laundry detergent, and upholstered seat) with products that are
compliant with the EU Ecolabel criteria. Results show that the environmental profile of EU
Ecolabelled products is generally better than the one of the average products in the market
and reduces the environmental impact of their product group (e.g. laundry and dishwasher
detergent for the detergents product group). However, the effect that the choice of EU
Ecolabelled products had on the overall impact coming from purchase and use of household
goods resulted to be relatively limited mainly due to the relative share of the tested
products over the entire environmental impacts of the BoP (from 0.4% to 7.0% of the
overall normalized impact for the entire baseline BoP). Moreover, each EU Ecolabel scenario
was assuming a 100% replacement of the product on the market with an EU Ecolabel
option. This means that under more realistic market shares, the contribution to impact
reduction is even lower as the replacement share of each assessed product would be
smaller. However, the scenarios assess specific products rather than all the variety of

3
household goods under the EU Ecolabel scheme and, thereby, the overall effect of the EU
Ecolabel scheme was not the goal of this assessment. Furthermore, the results of LCA
focused on the specific impact categories which are currently part of the Environmental
Footprint method. This means that certain aspects covered by Ecolabel criteria (such as
biodegradability) are not accounted for.
Regarding the role of consumers, the study showed that users' behaviour could have a
relevant effect on the impact of household goods consumption. For instance, for detergents
and personal care products, a relevant share of the improvement potential is related to a
proper use by consumers (e.g. by saving water and energy and avoiding overdosing during
the use phase). For this reason, promoting purchase of more sustainable products may not
be sufficient to reduce the environmental impacts of consumption, but it has to be
accompanied with complementary actions. In the case of household goods, awareness
campaigns towards a more responsible consumption behaviour showed a large potential in
improving the environmental impacts related to the use (e.g. dosage, energy use) and end
of life cycle stages (e.g. reuse of products).

4
1 The European Union (EU) Consumer Footprint
Assessing the environmental impact due to consumption of goods and services is a crucial
step towards achieving the sustainable development goal related to responsible production
and consumption (SDG 12). The evaluation of the impacts is an essential step towards
designing better solutions and policy options in the context of the European Green Deal of
the political guidelines of the President-elect of the European Commission (von der Leyen,
2019). Since 2010, as part of its commitment towards more sustainable production and
consumption, the European Commission has developed an assessment framework to
monitor the evolution of environmental impacts associated to EU consumption adopting
LCA as reference methodology (EC-JRC, 2012a; EC-JRC, 2012b). The present study is
expanding the initial assessment framework to ensure a more complete and robust
evaluation of the impacts, addressing SDG 12, partially SDG11 (on sustainable cities and
communities), SDG 9 (on industry, innovation and infrastructure), and SDG 8 (on
sustainable economic growth), and assessing impact on a number of environmental impact
categories related to other SDGs, mainly the ones addressing ecosystems quality and
human health (Box 1).
Box 1 Overview of the link between SDGs, the assessment of the environmental impact of consumption and the impact quantification with Life Cycle Assessment (Environmental Footprint method).
The assessment framework aims to support a wide array of policies, such as those related
to circular economy, resource efficiency, and eco-innovation. The environmental impact of
EU consumption is assessed adopting two sets of life cycle-based indicators: the Consumer
Footprint and the Consumption Footprint, which have a complementary role in assessing
impacts (Box 2).
The Consumer Footprint adopts a bottom-up approach, aiming at assessing the potential
environmental impact of the consumption of an average EU citizen in relation to the impacts
of representative products. In fact, the Consumer Footprint is based on the results of the
Life Cycle Assessment (LCA) of more than 100 representative products purchased and used
in one year by an EU citizen. The Consumer Footprint allows assessing environmental
impacts along each step of the products life cycle (raw material extraction, production, use
phase, re-use/recycling, and disposal), and accounts for both imported goods and those
produced in EU.
For the calculation of the Consumer Footprint, the consumption of EU citizens is split into
five key areas (food, housing, mobility, household goods, and appliances). For each area,
a respective Basket of representative Products (BoP) has been built based on statistics on
consumption and stock of products. For each of the five BoPs, a baseline scenario has been
calculated, taking as reference the consumption of an average EU citizen in 2010. To assess
the trends in consumption, an additional baseline is calculated for the year 2015.
5
This report focuses on the BoP household goods, which is one of the 5 key areas of
consumption identified for calculating the Consumer Footprint.
The developed LCAs are in line with the International Life Cycle Data system (ILCD)
guidelines and follow, to the extent it is possible and relevant, the Environmental Footprint
methods as published in the Communication "Building the Single Market for Green
Products" (EC, 2013). The quality of the models has been ensured by periodical model
refinements. In order to allow for periodical updates, the models has been built with a
parametric approach. Hence, for example, the amount and structure of consumption could
be updated to more recent reference years using data on apparent consumption (i.e. BoP
composition and relative relevance of representative products) taken from Eurostat.
The baseline models allow the identification of the environmental hotspots along the
products life cycle and within the consumption area of each specific BoP. Then, results of
the hotspot analysis are used as a basis for the selection of actions towards environmental
burden reduction, covering interventions such as: shifts in consumption patterns,
behavioural changes, implementation of eco-solutions, or a combination of the previous
ones. For each of the actions, a scenario has been developed, by acting on the baseline
model and simulating the changes associated to the specific intervention. The LCA results
of each scenario are then compared to the results of the baseline, to identify potential
benefits or impacts coming from the implementation of the solution tested, as well as to
unveil possible trade-offs.
Complementary to the Consumer Footprint, also the Consumption Footprint indicator was
developed by the European Commission Joint Research Centre (EC-JRC). The Consumption
Footprint is basically a top-down approach, aiming at assessing the potential environmental
impact of EU apparent consumption, accounting for both domestic impacts (production and
consumption at country level with a territorial approach) and trade-related impacts. The
impacts are assigned to the country where the final consumer is located. As mentioned
above, this report focuses on the Consumer Footprint indicator and in particular to the
Consumer Footprint Basket of Product (BoP) indicator for household goods.

6
Box 2 Overview of the two life cycle-based indicators for assessing the environmental impact of EU
consumption.

7
2 Environmental impacts of consumer goods
As highlighted by the European Environmental Agency (EEA, 2012), current EU
consumption patterns generate relevant environmental pressures, which are not limited to
greenhouse gas emissions, but include also the use of natural resources, acidifying
emissions, etc. Some of these pressures originate directly from the use of products and
services, whereas some others are generated along the production chains of consumer
goods.
In addition, an increasing share of products consumed in the EU is imported from other
parts of the world. Therefore, also part of the environmental impacts of the production of
goods that occur outside the EU is due to EU consumption patterns. Consequently, the
focus of EU environmental policies on sustainable consumption and production has
gradually evolved over recent decades from a focus mainly on cleaner production, through
sustainable products, to a more holistic approach to sustainable consumption and
production. This entails, for instance, the choice of raw materials and ingredients that are
less impacting both in their production chain and at their end of life.
Specific hotspots and related improvement options can be identified for different types of
household products, as illustrated below. Cosmetics and pharmaceutical products have a
relevant impact on the aquatic environment after their use, when their components are
released into municipal wastewater (Ternes et al., 2004). UV filters, preservatives and
surfactants used in the formulation of cosmetics and detergents can have toxic effects on
aquatic organisms (Vita et al., 2018; Liu and Wong, 2013) and the efficacy of removal of
these substances by conventional wastewater treatment is limited (Liu and Wong, 2013;
Barbosa et al., 2016). Ultraviolet (UV) filters can also bioaccumulate and scientific studies
indicated their potential for estrogenic activity (Brausch and Rand, 2011).
Due to those known issues, several Research and Development (R&D) activities in the field
of cosmetics and detergents have been focused on the choice of ingredients that can help
to reduce the environmental impact associated to their production chain and to their
disposal at the end of life (Philippe et al., 2012; Ramli, 2017). The use of ingredients from
renewable feedstock is one of the most studied options. Trujillo-Cayado et al. (2018)
discussed emulsions formulated with renewable components as a sustainable alternative
to products containing traditional organic solvents in surfactants. Secchi et al. (2016)
assessed, through Life Cycle Assessment (LCA), the use of a C16–18 triglycerides mixture
derived from olive oil industry by-products as an ingredient for a cosmetic cream. Martinez
et al. (2017) performed a LCA of a bio-based cosmetic cream containing refined palm
kernel oil. In parallel, attention is given to innovative wastewater treatment systems, able
to improve the removal rate for pharmaceuticals and personal care products (Luo et al.,
2014; Zhang et al., 2014, Ferreira et al., 2016).
Another hotspot is the presence of chemicals in consumer products. Many of these products
may be sources of chemicals that have a diverse spectrum of health effects, including
endocrine disruption and associations with asthma (Dodson et al., 2012, Kabir et al.,
2015). Previous research suggests that consumer products are a source of phthalates,
alkylphenols, parabens, polychlorinated biphenyls (PCBs), and polybrominated diphenyl
ether (PBDE) flame retardants at household level (e.g. Rudel et al. 2003). However,
research in this field is still needed, especially because of the large range of products and
of compounds potentially released.
Phillips and colleagues (2018) characterized chemicals in 100 consumer products – which
included formulations (e.g., shampoos, paints), articles (e.g., upholsteries, shower
curtains), and foods (cereals) with the aim to support prioritization of chemicals based on
potential human health risks. Vojta et al. (2017) analysed 137 individual samples of various
consumer products, building materials and waste, to identify and characterize potential
sources of halogenated flame-retardants (e.g. upholstered furniture) in indoor
environment. Pourzahedi et al. (2016) conducted a LCA for 15 nanosilver-enabled
consumer products, investigating hotspots and patterns of contribution.

8
Absorbent products have been largely identified as a relevant source of impact, especially
because they contribute to the volume of municipal solid waste (Arena et al., 2016;
Cordella et al., 2015). Options to reduce their impact include the reduction of the average
weight of products (mainly due to the introduction of superabsorbent polymers – SAP)
(Edana, 2015), the use of alternative materials - such as bio-based plastic, hemp, and
bamboo, in order to improve compostability (e.g. Mirabella et al., 2013), and the
substitution of disposable products (e.g. baby diapers) with reusable ones (DEFRA, 2008;
O’Brien et al., 2009). Potential recycling options has been studied as well (Torrijos et al.,
2014; Arena et al., 2016).
A growing number of studies that quantify the environmental impacts coming from overall
consumption and use of household goods in a life cycle perspective has been published in
the scientific literature. Some of them are based on process-based LCA (e.g. Kalbar et al.,
2016), whereas others make use of input-output data (e.g. Duarte et al., 2010; Zhu et al.,
2010; 2010; Ivanova et al., 2016; Wood et al., 2017).
Ivanova et al. (2016) assessed the contribution of several household consumption
categories (namely food, mobility, housing, clothing & footwear, manufactured products,
and services) to the direct and embodied environmental impacts generated by household
consumption. According to their results, manufactured products and clothing & footwear
together account for 21% of the carbon footprint of EU households, 17% of their land
footprint, 25% of material footprint, and 16% of water footprint. Consumption of
manufactured products is particularly relevant for the material footprint of EU households.
Clothing is the second most land-intensive consumption category (after food, which is the
main contributor), and the second most water-intensive (again after food), with a
requirement of 0.05 m3 of blue water per euro spent.
The environmental impact associated to household consumption of goods depends, on the
one hand, on the intensity of the impacts coming from the production and trade of goods
and, on the other hand, on the lifestyle of people, i.e. on their consumption habits and
choices. Therefore, solutions to reduce the impact of household consumption should entail
both eco-innovation of the production processes and a change in lifestyles and consumption
habits.
According to Druckman and Jackson (2016), one of the main determinants of households’
carbon footprint is income, with carbon footprints increasing with increasing incomes.
However, other drivers, such as household size and composition, rural or urban location
and type of energy supply, also play a part. The link between the available income and the
intensity of environmental impact of household consumption is underlined by several
authors (e.g. Ivanova et al, 2016; Kalbar et al., 2016; Tukker et al., 2010; Büchs and
Schnepf, 2013; Duarte et al., 2012). This is a relevant issue to be considered when
analysing options for improvement, because at higher income levels, the reduction of
consumption in one area can generate a rebound effect, i.e. can liberate money that may
be spent in other consumption area, which could be even more intense in terms of
environmental impact per unit of product consumed (Font Vivanco et al., 2018).
Due to the environmental relevance of household goods, the present study aims at
assessing the environmental impact of household consumption in the EU with a life cycle
perspective. The use of LCA as approach for assessing the impact allows for considering a
wide range of impacts, going beyond carbon footprint (which, for some product categories,
may not be sufficient to highlight potential hotspots).
The BoP household goods assesses the impact of household goods consumption in the EU
using a bottom-up approach, based on the selection of representative products and related
life cycle inventories. The aim is to define a baseline scenario, modelled considering the
statistics about household goods consumption by an average EU citizen, as a reference for
evaluating the potential improvements coming from eco-innovation and behavioural
changes in this area of consumption.

9
3 Basket model for household goods
The main goal of the BoP household goods is to assess the average environmental impact
per EU citizen associated with the consumption of products that relate to daily life of a
household (e.g. detergents, personal care products, furniture, etc.), and to provide
recommendations for the way forward by including the analysis of existing eco-innovation
strategies and targets for improving the environmental performance of products in the
household goods sector. This section describes the scope and the structure of the Basket
of Product (BoP) on household goods, including the Life Cycle Inventory (LCI). The aim is
to enable illustrate how the BoP is modelled, in order to help the interpretation of the
results and, if needed, to replicate the exercise. This section describes the scope and the
structure of the Consumer Footprint of the BoP on household goods. The LCI covered under
the BoP household goods is included in this report.
3.1 Description of the BoP household goods
In order to comprehensively assess the impact of consumption at EU level, in 2012 the
European Commission’s Joint Research Centre developed a life cycle-based method that
focuses on specific representative products which were then upscaled to overall EU
consumption figures, named the Basket of Products (BoP) indicators (EC-JRC, 2012). The
project (called LC-IND) focused on indicators to measure the environmental impact of the
consumption of goods and services by the average EU citizen, focusing on housing, food
and transport, via the identification and environmental assessment of the most
representative products of each category (the so-called BoP). This report covers an
additional BoP called “household goods”, added to the previous ones, to complement them
and to enlarge the scope of the assessment.
The definition and characterization of the household goods sector was performed for EU-
27 countries in order to assess the environmental impacts of the EU-27 household goods
representative basket of products (BoP household goods) for the reference year 2010.
The BoP household goods consists of a process-based LCI model for a BoP that represents
the most relevant household goods product groups. The selection of the product groups to
be included in the basket was based mainly on the list of product groups already covered
by the EU Ecolabel and Green Public Procurement (GPP) criteria, complemented with the
product groups for which a Product Environmental Footprint (PEF) (EC, 2013) pilot was
ongoing at the time of the study (2018). The reason of this choice was twofold: on the one
hand, the products groups that are covered by EU Ecolabel or GPP criteria are selected
based on their market significance in terms of stock volume and sales and importance of
the environmental impact generated. This is in line with the rationale for the selection of
the representative products for the other BoPs (e.g. for BoP food). On the other hand, one
of the aim of the BoP household goods is to support the analysis of the environmental
savings potential related to the implementation of non-energy requirements coming from
the Ecodesign, EU Ecolabel, and GPP policies. Therefore, it is important that the BoP has a
scope that is similar to the ones of the abovementioned policies.
The selected product groups (and related representative products) that form the BoP are:
— detergents (all-purpose cleaners and sanitary cleaners, detergents for dishwashers,
detergents for hand dishwashing, liquid laundry detergents, and powder laundry
detergents),
— sanitary products (absorbent hygiene products: baby diapers, sanitary pads, tampons,
and breast pads),
— personal care products (rinse-off cosmetics: bar soaps, liquid soaps, shampoos, and
hair conditioner),
— furniture (bedroom wooden furniture, kitchen furniture, upholstered seats, non-
upholstered seats, and wooden tables),
— bed mattresses,

10
— footwear (work and waterproof (WW), sport, leisure, and fashion footwear),
— clothes (textile products) (t-shirt, blouse, trousers, and jeans),
— paper products (newspapers, books, and toilet paper).
For each product group in the basket, an inventory model based on representative products
has been developed. Data about representative products have been taken mainly from
background reports compiled for the definition of EU Ecolabel criteria and from the
screening reports of the PEF pilots (see chapter 3.2). The impact of each representative
product is then multiplied by the mass of the total product group, as consumed in one year
by an average EU citizen (Table 1).
3.1.1 Product groups in the BoP household goods and related quantities
A quantitative and qualitative analysis of the structure of EU-27 household consumption
was performed for the selected product groups, including an analysis of international trade.
Data on apparent consumption (defined as Production - Exports + Imports) of the
representative products were taken from the Eurostat database (Eurostat, 2015). These
data are reported in Table 1 as “per capita apparent consumption”. An additional analysis
was performed to check to which extent the apparent consumption of the representative
products could represent the overall consumption of the related product groups selected
for the basket. The coverage of the product groups (i.e. % of quantity or value of the
representative products compared to the whole quantity or value of the product group that
they represent) was calculated based on the quantity (in mass, pieces or pairs) and on the
value (in euros).
As illustrated in Table 2, the representativeness of the products included in the basket
ranges from full representation to relatively low (in some cases, below 50% of the entire
product group). Therefore, it was decided to upscale the apparent consumption of each
product (i.e. the amount included in the basket) to represent the 100% of the apparent
consumption of the product groups selected. This is a relevant approximation by which it
is assumed that, for instance, a t-shirt, may be representative for the impact of other kind
of clothes (textile products) that are not included in the basket. However, it was deemed
more useful to have this approximation instead of underrepresenting the actual
consumption of the considered product groups. For this purpose, an upscale of the annual
consumed quantities of each representative product per EU citizen was performed, based
on data regarding the coverage of the single representative products within the
corresponding product group (Table 2). The coverage by quantity was considered as the
first option for the calculation of upscaled quantities of apparent consumption. However,
for some of the product groups the coverage calculated by quantity and by value is quite
different (Table 2). This is generally due to a lack of data about quantities (and especially
about import and export) for most of the products in the product group considered. For
this reason, the coverage by economic value was used as a basis for the upscale of the
product groups for which data on coverage by quantity were considered not robust enough
(see comments in Table 2).
Table 1 summarises the values of per capita apparent consumption of the representative
products, the coverage of the product group (either by quantity or mass) used as a basis
for upscaling the apparent consumption and, finally, the values of the apparent
consumption (upscaled) used in the baseline model of the BoP household goods.
Finally, it has to be considered that the product groups selected for the BoP do not
represent all the household goods that EU citizens purchase and use in their everyday life.
There are some product groups, such as pharmaceuticals, which can generate significant
environmental impacts both in the production and in the use stage and that are not taken
into account in the present analysis. Therefore, their potential additional contribution
should be taken into account when interpreting the results of the BoP household goods and
of the sum of the impact of all the BoPs. As well, several products of the daily life that can
have a role in the overall environmental impacts due to their consumption intensity are not
included in the BoP, such as, for example, plates, glasses, and household textiles.

11
Table 1. Composition of the BoP household goods in terms of product groups, representative products and related quantities (referred to the reference
flow, i.e. household goods consumption of an average EU-27 citizen in the reference year 2010) (Source: Eurostat, 2015).
Product group Representative product
Total apparent
consumption
(unit/year 2010)
Per capita apparent
consumption
(unit/ citizen*year-1)
Coverage by
representative
products (%)
Per capita apparent
consumption upscaled
(unit/ citizen*year-1)
Unit
Detergents
All-Purpose Cleaners and Sanitary Cleaners (500mL) 5,020,703,455 9.99
100
9.99 kg
Detergents for Dishwashers (tablet) 1,220,288,309 2.43 2.43 kg
Hand Dishwashing Detergents (650mL) 878,530,349 1.75 1.75 kg
Laundry Detergents liquid (650mL) 5,040,246,743 10.03 10.03 kg
Laundry Detergents powder (dose) 1,558,000,147 3.10 3.10 kg
Sanitary products
(absorbent
hygiene
products)
Baby diapers 786,735,433 1.57
49
3.22 kg
Sanitary pads 991,362,870 1.97 4.05 kg
Tampons 22,536,286 0.04 0.09 kg
Breast pads 135,840,184 0.27 0.56 kg
Personal care
(Rinse-off
cosmetics)
Bar soap 718,676,400 1.43
31
4.59 kg
Liquid soap (255mL) 285,135,500 0.57 1.82 kg
Shampoo (255mL) 490,190,553 0.98 3.13 kg
Hair conditioner (255mL) 324,550,414 0.65 2.07 kg
Furniture
Bedroom wooden furniture 65,991,756 0.131
66
0.20 p
Kitchen furniture 99,635,746 0.198 0.30 p
Upholstered seat 62,131,672 0.124 0.19 p
Non-Upholstered seat (wooden seat) 89,872,496 0.179 0.27 p
Dining room furniture (wooden table) 54,735,761 0.109 0.17 p
Bed mattresses Mattress (Latex, polyurethane and spring mattresses) 39,946,072 0.079 89 0.09 p
Footwear
Work and Waterproof (WW) 120,544,539 0.24
50
0.48 pa
Sport 152,705,002 0.30 0.61 pa
Leisure 575,848,245 1.15 2.29 pa
Fashion 575,848,245 1.15 2.29 pa
Clothes (textile
products)
T-shirt 3,533,705,142 7.03
22
31.80 p
Women blouse 949,656,480 1.89 8.55 p
Men trousers 415,925,233 0.83 3.74 p
Jeans 532,586,108 1.06 4.79 p
Paper products
Newspaper 13,958,343,439 45.99
31
90.50 kg
Book 2,969,875,678 5.91 19.26 kg
Toilet paper 3,631,492,140 7.23 23.55 kg
p = pieces; pa = pair

12
Table 2. Coverage of the quantity and value of the product groups by the representative products modelled in the BoP. The % highlighted in green were
used to upscale the quantity of the apparent consumption used in the functional unit (F.U.) of the BoP household goods.
Product
group
Total
value
(€)
Value
covered
by the
BoP (€)
Value
covered
by the BoP
(%)
Total
quantity
(unit)
Quantity
covered by
the BoP
(unit)
Quantity
covered
by the
BoP (%)
Comment
Detergents 1.29E+10 1.29E+10 100 1.37E+10
(kg)
1.37E+10
(kg) 100
No direct correspondence between the products in the BoP and
the product categories in Prodcom. Therefore, the whole value of
the category was allocated to BoP products. This is the reason for
100% coverage.
Sanitary
products
(absorbent
hygiene
products)
7.33E+09 4.58E+09 63 3.98E+09
(kg)
1.94E+09
(kg) 49
Results of coverage by value and by mass are equally robust,
because data on mass and value are available for all the products
considered. Data on coverage by mass are considered for the
study.
Personal care
(Rinse-off
cosmetics)
1.63E+10 5.08E+09 31 1.12E+09
(kg)
1.00E+09
(kg) 89
Results on coverage by value are more robust, because
availability of data on mass is very low (data are available only
for some of the products in the product group)
Furniture 5.20E+10 3.42E+10 66 6.75E+08
(p) 3.25E+08 (p) 48
Results on coverage by value are more robust, because
availability of data on mass is very low (data - especially for
import and exports - are available only for some of the products
in the product group)
Bed mattresses 3.78E+09 3.34E+09 89 4.95E+07
(p) 4.08E+07 (p) 82 No data for import and export quantities.
Footwear 2.08E+10 7.63E+09 37 2.85E+09
(pa)
1.42E+09
(pa) 50
Results of coverage by value and by mass are equally robust,
because data on mass and value are available for all the products
considered. Data on coverage by mass are considered for the
study.
Clothes
(textile
products)
8.10E+10 1.90E+10 23 2.46E+10
(p) 5.43E+09 (p) 22
Results of coverage by value and by mass are equally robust,
because data on mass and value are available for most of the
products considered. Data on coverage by mass are considered
for the study.
Paper products 8.57E+10 2.16E+10 25 6.70E+10
(kg)
2.06E+10
(kg) 31
Results of coverage by value and by mass are equally robust,
because data on mass and value are available for most of the
products considered. Data on coverage by mass are considered
for the study.

13
3.2 Life Cycle Inventory of the BoP
The reference system is the EU-27 per capita consumption in 2010 for the products listed
in Table 1. The functional unit (F.U.) is defined as the consumption of household goods by
an average EU citizen in one year (reference year 2010).
Life cycle stages considered in the life cycle of the representative products are reported in
Table 3.
Table 3. Summary of life cycle stages and related activities included in the BoP household goods.
Life cycle stage Activities included
Components
manufacture
Manufacture of raw materials
Transport of raw materials to the production site
Production
Energy and water consumption for product manufacture
Direct emissions from product manufacturing process
Waste generation and treatment at the production
Packaging Manufacture of packaging
Final disposal of packaging
Logistics International transport (import of finished products)
Transport to retailer
Use Transport of the products from retailer to consumer’s home
Energy and water for product use (when relevant)1
End of life (EoL)
Final disposal of the product at end of life
Wastewater treatment (for detergents, personal care
products, and toilet paper)
To model the process-based life cycle inventories of the selected representative products,
the following approach was followed:
1. Priority was given to the inventories already defined in the EU Ecolabel background
reports published by the EU Ecolabel Product Bureau2 and in the screening studies
of the PEF pilots3 available in March-May 2017, since they are based on a market
analysis and on stakeholders’ feedback.
2. When a complete life cycle inventory was not available in one of these sources, data
were complemented with information coming from previous studies published in the
scientific literature, technical reports, or Environmental Product Declarations
(EPDs).
Table 4 reports an overview of the data sources used for each of the representative
products modelled in the BoP.
Table 4. Overview of LCI data sources used to model the representative products.
Product
Group Representative product Data source Type
Detergents
All-Purpose Cleaners and Sanitary Cleaners
Arendorf et al., 2014a EU Ecolabel background report
Detergents for Dishwashers Arendorf et al., 2014b EU Ecolabel background report
Hand Dishwashing
Detergents Arendorf et al., 2014c
EU Ecolabel
background report
(1) Use phase of clothes (i.e. washing cycles) is not included in the model, to avoid double counting with the
use phase of detergents (2) http://susproc.jrc.ec.europa.eu/product_bureau/projects.html (3) https://webgate.ec.europa.eu/fpfis/wikis/spaces/viewspace.action?key=EUENVFP

14
Product
Group Representative product Data source Type
Laundry Detergents liquid Screening report of the PEF pilot on Household Heavy Duty Liquid Laundry Detergents (HDLLD) for machine wash
PEF screening report
Laundry Detergents powder Arendorf et al., 2014d EU Ecolabel background report
Sanitary products (absorbent hygiene products)
Baby diapers
EC-JRC, 2013a EU Ecolabel background report
Sanitary pads
Tampons
Breast pads
Personal care (rinse-off cosmetics)
Bar soap
Escamilla et al., 2012 EU Ecolabel background report
Liquid soap
Shampoo
Hair conditioner
Furniture
Bedroom wooden furniture Iritani et al., 2015 Scientific paper
Kitchen furniture González-García et al., 2011 Scientific paper
Upholstered seat Castellani et al., 2015 Scientific paper
Non-Upholstered seat (wooden seat)
Interviews with a furniture company Data from industry
Dining room furniture (wooden table)
Interviews with a furniture company Data from industry
Bed mattresses
3 types: Latex, polyurethane (PUR) and spring
EC-JRC, 2013b EU Ecolabel background report
Footwear
Work and waterproof (WW)
Screening report of the PEF pilot on footwear
PEF screening report
Sport
Leisure
Fashion
Clothes
(textile products)
T-shirt
Screening report of the PEF pilot on T-shirts (Bill of Materials, packaging and transports); van der Velden et al., 2014 (electricity for spinning of fibres); Zhang et al., 2015 (electricity for cutting and sewing the textile)
PEF screening report; Scientific papers
Women blouse
Ellebæk Larsen et al., 2007 - EDIPTEX project report (BoM); van der Velden et al., 2014 (electricity for spinning of fibres); Zhang et al., 2015 (electricity for cutting and sewing the textile)
Technical report; Scientific papers
Men trousers
Marks & Spencer plc, 2002 (BoM); van der Velden et al., 2014 (electricity for spinning of fibres); Zhang et al., 2015 (electricity for cutting and sewing the textile)
Industry report; Scientific papers
Jeans
ADEME, (2006); van der Velden et al., 2014 (electricity for spinning of fibres); Zhang et al., 2015 (electricity for cutting and sewing the textile)
Industry report; Scientific papers
Paper products
Newsprint
Screening report of the PEF pilot on intermediate paper (pulp and paper production); Rafenberg and Eric, 1998
PEF screening report; Scientific paper
Book
Screening report of the PEF pilot on intermediate paper (pulp and paper production); Castellani et al., 2015 (book production)
PEF screening report; Scientific paper
Toilet paper
Screening report of the PEF pilot on intermediate paper (pulp and paper production); EPD, 2016
PEF screening report; EPD

15
3.2.1 General assumptions adopted in the life cycle inventory of products
In order to ensure consistency within the whole BoP, some cross-cutting assumptions have
been adopted for all the representative products. These assumptions refer mainly to the
following life cycle stages of the products: transport, use, and imports.
Transport of raw materials is included in the stage “Components manufacture”. Transport
of finished products occurs from the production site to the site of retailing stage and from
retailing to the home of the final consumers. When specific data about transport distances
and modes were available in the sources used to model the representative products, these
data were used in the BoP model. When specific data were not available, transport was
modelled according to Product Environmental Footprint Category Rules (PEFCRs) (EC,
2017a).
Regarding the use phase, for transport from retail to home of big products (furniture and
bed mattresses), a transport by van was estimated. For the transport of small products,
the assumption applied is that 30 products are bought in a single purchase by the final
consumer. Therefore, the impact of transport is allocated between the purchased products
considering that each product is one thirty of the items purchased (3.33% of the transport
burden), for a transport distance of 4 km (Vanderheyden and Aerts, 2014), by passenger
car. This transport is included in the life cycle of the product.
Towards considering the imports of products (i.e. the share of products that are produced
outside the EU and then imported as finished products), the following approach was
considered:
— Country-specific import data for the BoP household goods were taken from the Eurostat
international trade database for the year 2010 (Eurostat, 2015). A selection of the most
relevant countries in terms of quantity of product imported was considered, with the
aim to cover at least 90% of the quantity imported for each representative product
considered.
— For the share of production known to occur outside the EU, a specific electricity mix
was created, to represent the real conditions of the production sites (according to the
share of imports from extra-EU countries, calculated before). Details are provided in
section 3.2.4.
For the share of products imported to the EU an international transport was modelled,
based on distances and means of transport used for each product (with the exception of
newspapers, for which data on imports per country were not available). Details are
provided in section 3.2.6.
3.2.2 Lifespan of products
The products included in the BoP household goods have different lifespans. For the
environmental assessment, the following assumptions were considered:
— liquid and powder detergents (all-purpose cleaners and sanitary cleaners, detergents
for dishwashers, hand dishwashing detergents, laundry detergents liquid, and laundry
detergents powder) have a lifespan under a year;
— sanitary products (absorbent hygiene products: baby diapers, sanitary pads, tampons,
and breast pads) have a lifespan under a year;
— personal care (rinse-off cosmetic products: bar soap, liquid soap, shampoo, and hair
conditioner) have a lifespan under a year;
— furniture (bedroom wooden furniture, kitchen furniture, upholstered seat, non-
upholstered seat (wooden seat), and wooden table) have a lifespan of 15 years,
according to the EU Ecolabel background reports;
— bed mattresses (latex, PUR, and spring) have a lifespan of 10 years, according to the
EU Ecolabel background report;

16
— footwear (work and waterproof, sport, leisure, and fashion) have a lifespan of a year,
according to the PEFCR;
— clothes (textile products) (t-shirt, women blouse, men trousers, and jeans) have a
lifespan of a year, according to the PEFCR;
— paper products have a lifespan under a year (newsprint and toilet paper) and of 10
years (book).
3.2.3 LCI of components manufacture
The Bill of Materials (BoM) for each of the representative products was taken from the
reference sources reported in Table 4. Details of the BoM modelled for each product are
provided in Annex 1. Transport of raw materials to the production site is also included in
this stage.
3.2.4 LCI of production
The inventory of the production stage was built for each activity included in the production
chain of each product by collecting literature or database data. The main sources of data
are reported in Table 4. The definition of the energy mixes used in the production stage
was based on the results of the analysis done about the international transport of imported
products by country. For each product, the European electricity mix was used for the share
of production that is known to happen in Europe. The dataset for the European electricity
mix “Electricity, low voltage {Europe without Switzerland}| market group” (from ecoinvent
3.2 library) was used to represent the EU electricity profile.
For the share of production known to occur outside the EU, a specific electricity mix was
created, to represent the real conditions of the production sites (according to the share of
imports from extra-EU countries).
Finally, the PEF screening reports of footwear and clothes detail a specific electricity mix
based on the most relevant production sites for those products. In this case, priority was
given to these data, because they were agreed within a group of stakeholders that includes
some of the most important companies producing those products.
Table 5 reports the electricity mixes created for the imported share of each representative
product in the BoP household goods. Regarding clothes, the PEF screening report on T-
shirts reports detailed electricity mixes (based on production countries) for each of the
production phases from yarn spinning to cutting and sewing of the finished product. Table
6 reports the different electricity mixes modelled for each of those phases, based on data
reported in the PEF screening report.

17
Table 5. Electricity mixes used to model the share of production that occurs outside the EU (based on the ratio of finished products that are imported to
EU-27 and on the ratio of countries from which they are imported – source: Eurostat, 2015).
*Source: PEF screening report
Chin
a
Turk
ey
United S
tate
s
Sw
itzerl
and
Indonesia
Mala
ysia
Vie
tnam
Isra
el
Cro
atia
Mexic
o
Thailand
Bra
zil
Serb
ia
Ukra
ine
Canada
Norw
ay
Bosnia
and H
erz
egovin
a
United A
rab E
mir
ate
s
Russia
n F
edera
tion
South
Afr
ica
Austr
alia
India
Egypt
Lebanon
Sanitary products 13.0 17.3 32.8 22.2 4.6 5.2 4.9
Bar soap 7.4 32.9 9.0 11.1 41.5 1.8 9.2
Liquid soap 29.4 6.5 6.7 31.8 3.0 11.3 2.7 11.3
Shampoo 14.1 20.3 39.0 14.2 4.2 4.0 1.6 2.0 2.0
Hair conditioner 4.0 2.5 67.1 6.0 1.7 2.9 4.8 3.4 2.2
Detergents 6.7 9.6 30.9 4.1 11.7 4.3 7.1 13.2 2.3
Kitchen furniture 63.6 3.9 2.7 3.6 3.2 3.3 8.0 3.4
Bedroom furniture 50.3 5.5 3.9 13.2 6.9 16.0
Upholstered seat 86.1 4.2 4.7 2.7 2.3
Non-upholstered seat 76.0 5.9 2.6 15.5
Wooden table 99.1
Bed mattresses 49.5 34.4 4.3 3.6 8.2
Book 59.5 3.4 27.8 6.2
Toilet paper 9.8 3.6 4.2 50.7 3.6 3.0 7.9 3.6 11.8 4.8
Work and waterproof footwear* 70.0 2.6 9.5 16.7
Sport footwear* 56.0 22.0 22.0
Fashion footwear* 33.9 33.0 33.0
Leisure footwear* 58.5 8.3 33.3
Electricity mix share (%)
Household goods products

18
Table 6. Electricity mixes used to model the production phases of clothes (spinning, texturizing of synthetic yarns, knitting and dyeing, and cutting and sewing of the final product).
3.2.5 LCI of packaging
The LCI of the packaging of products in the BoP household goods has been modelled
consistently with what was done in the main sources of data considered for modelling the
representative products (Table 4). It includes primary packaging and secondary packaging
(only for products for which data were available in the original sources). It is assumed that
rinse-off cosmetics (personal care), footwear, and toilet paper do not require secondary
packaging; and that furniture and bed mattresses are sold without primary packaging,
while newspapers and books are sold without any packaging. Table 7 illustrates the
assumptions made about packaging of the products in the BoP.
China Turkey India Bandlagesh Pakistan Indonesia Japan Thailand Europe Morocco
Spinning 63.0 4.0 23.0 5.0 4.0
Texturizing 81.0 2.0 13.0 2.0 2.0
Knitting and dyeing 44.0 17.0 28.0 11.0
Cutting and sewing 22.0 18.0 8.0 46.0 5.0
Electricity mix share (%)Production process

19
Table 7. Modelling of packaging for the products in the BoP.
Description of packaging Packaging materials [g] per unit of product
Product Primary Secondary PET
(bottle grade)
PET (amorphous)
PP HDPE LDPE PS Paper Card board
Reference flow of the product
All-Purpose Cleaners (APC)
500 mL bottle (LDPE) with trigger (LDPE + PP)
Cardboard box (10 bottles/per box)
34 11 10 - 11 - - 20 500 mL (1 bottle)
Detergents for
Dishwashers Flow rap film (PP)
Cardboard box +
shrinkwrap (LDPE) - - 0.35 - 0.18 - - 3
20 g of detergent
used for one washing cycle
Hand Dishwashing
Detergents
650 mL bottle (PET)
with cap (PP)
Cardboard box (16
bottles per box) 36.5 - 3.8 - - - - 21
1 bottle (0.65mL) of manual
dishwasher detergent
Laundry Detergents liquid
650 mL bottle (High density polyethylene - HDPE) with cap (PP)
Cardboard box (6 bottles per box)
- - 0.8 3.7 - - - 15 75 mL of detergent (1 laundry cycle)
Laundry Detergents powder
Cardboard box Cardboard case (20 boxes per case)
- - - - - - - 5
85 grams of a powder laundry detergent (1
laundry cycle)
Baby diapers Plastic bag (LDPE) Cardboard box - - - - 0.45 - - 3.5 1 diaper
Sanitary pads Plastic bag (LDPE) Cardboard box - - - - 0.1 - - 0.8 1 sanitary pad
Tampons PE wrap (LDPE) Cardboard box - - - - 0.1 - - 0.8 1 tampon
Breast pads Plastic bag (LDPE) Cardboard box - - - - 0.05 - - 0.4 1 breast pad
Bar soap Paper wrapping n.a. - - - - - - 15 - 1 bar soap (100g)
Liquid soap 255 mL bottle (HDPE) n.a. - - - 39 - - - - 255 mL (1 bottle)
Shampoo 255 mL bottle (HDPE) n.a. - - - 39 - - - - 255 mL (1 bottle)
Hair conditioner 255 mL bottle (HDPE) n.a. - - - 39 - - - - 255 mL (1 bottle)
Bedroom wooden
furniture No packaging
Cardboard box +
polystyrene (PS) - - - - - 3080 - 22600 1 furniture piece
Kitchen furniture No packaging Cardboard box + polystyrene (PS) + plastic film (LDPE)
- - - - 24 45 - 2400 1 furniture piece

20
Description of packaging Packaging materials [g] per unit of product
Product Primary Secondary PET
(bottle grade)
PET (amorphous)
PP HDPE LDPE PS Paper Card board
Reference flow of the product
Upholstered seat No packaging Cardboard + plastic film (LDPE)
- - - - 540 - - 60 1 furniture piece
Non-upholstered seat No packaging Cardboard box + polystyrene (PS)
- - - - - 50 - 292 1 furniture piece
Dining room furniture No packaging Cardboard box - - - - - - - 525 1 furniture piece
Bed mattresses No packaging Cardboard box +
polystyrene (PS) - - - - - 534 - 56 1 mattress
WW shoes Cardboard box + wrapping paper
n.a. - - - - - - 171 69 1 pair of shoes
Sport shoes Cardboard box + wrapping paper
n.a. - - - - - - 18 185 1 pair of shoes
Leisure shoes Cardboard box + wrapping paper
n.a. - - - - - - 6 30 1 pair of shoes
Fashion shoes Cardboard box + wrapping paper
n.a. - - - - - - 13 85 1 pair of shoes
T-shirt Plastic bag (LDPE) Cardboard box - - - - 10 - - 43.3 1 T-shirt
Women blouse Plastic bag (LDPE) Cardboard box - - - - 10 - - 43.3 1 blouse
Men trousers Plastic bag (LDPE) Cardboard box - - - - 16 - - 55 1 pair of trousers
Jeans Plastic bag (LDPE) Cardboard box - - - - 16 - - 55 1 pair of jeans
Newspaper No packaging No packaging - - - - - - - - 1 newspaper
Book No packaging No packaging - - - - - - - - 1 book
Toilet paper Paper wrapping + Plastic bag (LDPE)
n.a. - - - - 20 - - 29 1 pack (4 rolls)

21
3.2.6 LCI of logistics
Logistics consists of international transportation from outside the EU and transport of
processed goods from industry to retailing. As mentioned before, for the inventory of the
international transport of imported finished products, the share of imported goods over the
total amount of apparent consumption (production minus export plus import) was
calculated. Results are reported in Table 8.
Table 8. Summary of the share of imported goods, the sea transport distance, and the road transport distance for each representative product.
Product Group Representative product Import (% of
apparent consumption)
Sea transport (km/unit)
Road transport (km/unit)
Detergents All-Purpose Cleaners (APC)
3.3 7,543 857
Detergents for Dishwashers
Hand-Dishwashing Detergents
Laundry Detergents liquid
Laundry Detergents powder
Sanitary
products (absorbent hygiene products)
Baby diapers 6.7
4,924 915 Sanitary pads 1.9
Tampons 20.7
Breast pads 12.8
Personal care (rinse-off cosmetics)
Bar soap 18.1 4,318 1,247
Liquid soap 13.1 7,374 876
Shampoo 6.5 5,428 978
Hair conditioner 12.4 6,554 793
Furniture Bedroom wooden furniture 11.8 12,836 1,430
Kitchen furniture 0.6 12,259 1,184
Upholstered seat 25.4 16,047 1,195
Non-Upholstered seat 58.4 16,185 1,341
Dining room furniture 23.6 17,049 1,131
Bed mattresses 3 types: Latex, PUR and spring 2.7 10,230 1,244
Footwear Work and waterproof (WW) 66.5 13,153 1,233
Sport 93.7 15,819 1,439
Leisure 99.2 16,853 1,268
Fashion
Clothes (textile products)
T-shirt 94.7 9,964 1,380
Women blouse 85.4 9,897 1,535
Men trousers 93.5 12,062 1,299
Jeans 94.7 12,062 1,299
Paper products Newspaper 0 0 0
Book 0.9 14,466 1,118
Toilet paper 1.2 2,504 760
For each unit (kg, pair or piece) of imported goods, the inventory of transport for each
mode (road or sea transport) is also calculated. The transport of finished products is
assumed to occur from the capital of the exporting country to the city of Frankfurt, which
is considered a central destination for the arrival of imports in the EU. For exporting
countries directly connected to the EU by land, such as Switzerland or Belarus, only a
transport by lorry is considered from the capital of the exporting country to the city of
Frankfurt. For the others, the transport is considered to be composed by: a transport by
lorry between the capital of the exporting country and the country's main port; a transport
by ship from the port of the exporting country to the main EU ports and, finally, a transport
by lorry between the port of destination and the city of Frankfurt. Rotterdam and Marseille
are considered as the EU ports of arrival of the goods.

22
The distances are calculated by using www.sea-distances.org and Google maps. This
transport is allocated to a percentage of the final product in the LCI model, corresponding
to the share of imported goods out of the total apparent consumption of that kind of
product.
3.2.7 LCI of use phase
The use phase consists of the transport to the consumers’ home (by private car or van, as
described before), and of the use of the product at home. For most of the products in the
BoP (namely absorbent hygiene products, furniture, bed mattresses, and paper products),
the impact of the use was considered null or negligible. In these cases, only the transport
from retailer to home is included in the use stage. For some other type of products, the
use of the product at home constitutes a relevant stage in the whole life cycle, hence it
has been modelled in detail (Table 9).
The use of laundry detergents implies the use of water (and the use of electricity to warm
it). The same water (and related electricity), plus the detergent itself, may be part of the
use stage of clothes (that are part of the items washed). Therefore, to avoid double
counting within the same basket, the amount of water and electricity used for laundry is
allocated only to the detergent life cycle. This assumption leads, of course, to a lower
impact of clothes compared to studies where the life cycle of clothes is assessed alone, and
should be taken into account when analysing results of the contribution of product
categories to the overall impact of the whole BoP.
A possible double counting may also occur in the case of the use of shampoo and hair
conditioner (both used in the washing of the hair). In this case, a 50-50 allocation of the
water used was implemented, i.e. 50% to the shampoo and 50% to the hair conditioner.
Coherently with the assumptions made in the original source (EU Ecolabel background
report), the heating of the water used for the shower and the energy needed for drying
the hair are not included in the system boundaries, as they are optional and not directly
related to the products.
Table 9. Inventory data for the use of product at home.
Product
Reference
quantity (for
washing cycle)
Electricity
(kWh)
Water
(L) Notes
All purpose
cleaner 4.7 g4 0.04 0.55
Water temperature: 40°C. Use scenario
as described in the EU Ecolabel report
(Arendorf et al., 2014a), based on
Koheler and Wildbolz (2009)
Dishwasher
detergent 20 g5 1.42 18.5
Water temperature: 60°C. Use scenario
as described in the EU Ecolabel report
(Arendorf et al., 2014b), based on
Stamminger et al. (2007) and EC
(2007)
Hand
dishwashing
detergent
8-12 mL6 0.05-0.11 7.5-15
Water temperature: 40°C. Use scenario
as described in the EU Ecolabel report
(Arendorf et al., 2014c), based on
Stamminger et al. (2007) and Koheler
and Wildbolz (2009)
Laundry
detergent
(liquid)
75mL 50 0.6 Water temperature: 40°C. Use scenario
as described in the PEF screening report
(4) Corresponding to 5 spraying cycles, needed to clean an area of 0.24 m2. (5) Quantity used for washing of four place settings in the dishwasher. (6) Quantity used for manual washing of four place settings: 8 ml in case of "full sink", 12 ml in case of "direct
application". The ratio between “full sink” and “direct application” assumed in the BoP model is 50-50.

23
Product
Reference
quantity (for
washing cycle)
Electricity
(kWh)
Water
(L) Notes
Laundry
detergent
(powder)
85g 0.53 49
Water temperature: 40°C. Use scenario
as described in the EU Ecolabel report
(Arendorf et al., 2014d), based on EC
(2007) and Koheler and Wildbolz (2009)
Bar soap 2g7 (not
included) 3
Use scenario as described in the EU
Ecolabel report (Escamilla et al., 2012)
Liquid soap
(hand)8 2g9
(not
included) 3
Use scenario as described in the EU
Ecolabel report (Escamilla et al., 2012)
Liquid soap
(shower) 13g
(not
included) 22
Use scenario as described in the EU
Ecolabel report (Escamilla et al., 2012)
Shampoo 10.5g10 (not
included) 22
Use scenario as described in the EU
Ecolabel report (Escamilla et al., 2012)
Hair
conditioner 14g11
(not
included) 22
Use scenario as described in the EU
Ecolabel report (Escamilla et al., 2012)
3.2.8 LCI of End of Life
The end of life (EoL) stage in the BoP is modelled in a way that allows separating the
burdens and benefits of recycling from the rest of the system, in order to provide a clearer
picture of their contributions to the total impact. Two systems are identified: “S”, referring
to the system excluding recycling activities, and “R”, referring to the burdens and benefits
of recycling and reuse activities. Figure 1 illustrates the approach followed for all the BoPs’
models used to calculate the Consumer Footprint in the EU.
Figure 1. Illustration of the approach adopted to model EoL as waste treatment and recycling, as systems “S” and “R”.
The sum of the two, named System “S+R”, is the one which allows evaluating in a more
comprehensive way those aspects which are of interest also in the context of circular
economy: the additional module “R” quantifies burdens and benefits of activities such as
recycling and reuse. Details on activities included in each system are provided in Figure 2.
(7) Dose product for 1 washing action: 2g, reference flow 100g (one bar soap), number of washing per reference
flow: 50. (8) It is assumed that half of the liquid soap is used to wash the hands and half is used for the shower. (9) Dose product for 1 washing action: 2g, reference flow 255g (one bottle), number of washing per reference
flow: 128. (10) Dose product for 1 washing action: 10.5g, reference flow 255g, number of washing per reference flow: 24. (11) Dose product for 1 washing action: 14g, reference flow 255g, number of washing per reference flow: 18.

24
Figure 2. EoL activities included in System S, R and S+R.
In the BoP household goods, when specific information about the rate of recycling was
available in the data sources used (Table 4), this was applied in the models. When specific
information was not available, or when no (or negligible) recycling is done for a specific
type of product, it is assumed that the product goes into the unsorted municipal waste
stream. A scenario based on the values of proportion of the material in the product that is
used for energy recovery at EoL (R3) according to PEFCR rules, i.e. 55% of unsorted
municipal solid wastes to landfill and 45% to incineration, was applied. Assumptions on
EoL scenario for the products in the BoP household goods are summarised in Table 10.
The end of life of packaging materials was modelled following the distinction of the systems
S and R, then summed in the system S+R, used for the hotspot analysis. EoL of packaging
is included in the packaging life cycle phase. Details of the datasets used to model the two
systems are provided in Annex 2.
Therefore, the “R” system includes the burdens and benefits of recycling of (a) the product
itself at the end of life stage according to the rates provided by data sources (i.e., 11% of
clothes (textile products) and 62% of newspaper and books) and (b) the packaging of the
products.
Table 10. Summary of assumption on EoL scenario for the products in the BoP household goods.
Product Group Representative product EoL scenario
Detergents
All-Purpose Cleaners (APC)
100% to wastewater treatment (together with the water used in the use phase)
Detergents for Dishwashers
Hand Dishwashing Detergents
Laundry Detergents liquid
Laundry Detergents powder
Sanitary products (absorbent hygiene products)
Baby diapers
0% recycling 45% incineration 55% landfill
Sanitary pads
Tampons
Breast pads
Personal care (rinse-off cosmetics)
Bar soap 100% to wastewater treatment (together with the water used in the use phase)
Liquid soap
Shampoo
Hair conditioner
Furniture
Bedroom wooden furniture
0% recycling
45% incineration 55% landfill
Kitchen furniture
Upholstered seat
Non-Upholstered seat (wooden seat)
Dining room furniture (wooden table)
Bed mattresses 3 types: Latex, PUR and spring 0% recycling 45% incineration 55% landfill

25
Footwear
Work and waterproof 0% recycling 45% incineration 55% landfill
Sport
Leisure
Fashion
Clothes (textile products)
T-shirt 11% recycling (of which, 87% as rags, avoided product: textile12;
13% as insulation material, avoided product: rock wool13)
37.4 % incineration
51.6% landfill
Women blouse
Men trousers
Jeans
Paper products
Newspaper 62% recycling (avoided product: pulp production for graphic paper14)
17% incineration 20% landfill
Book
Toilet paper 100% to wastewater treatment (together with the water used in the use phase)
12 Mixed: cotton, polyester and viscose. 13 0.89 kg of avoided rock wool per kg of textile recycled. 14 0.8 kg of avoided pulp per kg of paper recycled.

26
4 Results of baseline’s hotspot analysis
The upscaled inventory of the BoP household goods (reference flow: consumption of
household goods by an average EU citizen in the reference year 201015) has been
characterized using ILCD v. 1.08 (EC-JRC, 2011) (Table 11) and normalized using ILCD
EU-27 normalisation factors (Benini et al., 2014) (Table 14), including also the comparison
with country-specific normalisation factors addressing water scarcity in the different
countries, and ILCD Global normalization factors (Sala et al., 2016) (Table 15). Normalized
results have been weighting using the equal weighting of ILCD and the weighting set
developed for the EF as sensitivity (Sala et al., 2018). Impacts of long-term emissions
have been excluded.
Overall BoP households and per capita results shown in Table 11 and Table 13, respectively,
refer to the systems S, R and S+R, for comparison. Results of the hotspot analysis refer
only to the System S+R, which includes burdens and credits associated to recycling
activities.
Table 11. Characterized results (ILCD) for the whole BoP household goods baseline (overall
impacts of household goods consumption in EU in 2010).
Impact category Unit System S+R System S System R
Climate change kg CO2 eq 7.00E+11 7.26E+11 -2.58E+10
Ozone depletion kg CFC-11 eq 5.67E+04 5.95E+04 -2.77E+03
Human toxicity, non-cancer CTUh 9.40E+04 9.97E+04 -5.65E+03
Human toxicity, cancer CTUh 2.39E+04 2.42E+04 -3.69E+02
Particulate matter kg PM2.5 eq 5.72E+08 6.14E+08 -4.17E+07
Ionizing radiation, effects on
human health (HH) kBq U235 eq
4.47E+10 4.66E+10 -1.99E+09
Photochemical ozone
formation kg NMVOC eq
2.08E+09 2.18E+09 -1.02E+08
Acidification molc H+ eq 4.10E+09 4.28E+09 -1.79E+08
Terrestrial eutrophication molc N eq 8.17E+09 8.53E+09 -3.61E+08
Freshwater eutrophication kg P eq 5.66E+07 5.89E+07 -2.27E+06
Marine eutrophication kg N eq 1.14E+09 1.19E+09 -4.45E+07
Freshwater ecotoxicity CTUe 8.65E+11 8.85E+11 -2.01E+10
Land use kg C deficit 2.16E+12 2.37E+12 -2.06E+11
Water resource depletion m3 water eq 5.43E+10 5.68E+10 -2.47E+09
Resource depletion kg Sb eq 7.40E+07 7.03E+07 3.65E+06
15 The hotspot analysis presented in this chapter has been run considering the functional unit of the basket with
upscaled quantities of representative products, as reported in Table 1.

27
Table 12. Characterized results (ILCD) for the F.U. of the BoP household goods baseline (impacts
of household goods consumption by an average EU citizen in 2010).
Impact category Unit System S+R System S System R
Climate change kg CO2 eq 1.39E+03 1.44E+03 -5.14E+01
Ozone depletion kg CFC-11 eq 1.13E-04 1.18E-04 -5.52E-06
Human toxicity, non-cancer CTUh 1.87E-04 1.98E-04 -1.13E-05
Human toxicity, cancer CTUh 4.75E-05 4.82E-05 -7.34E-07
Particulate matter kg PM2.5 eq 1.14E+00 1.22E+00 -8.30E-02
Ionizing radiation, effects on
human health (HH) kBq U235 eq
8.89E+01 9.28E+01 -3.96E+00
Photochemical ozone
formation kg NMVOC eq
4.13E+00 4.33E+00 -2.02E-01
Acidification molc H+ eq 8.16E+00 8.51E+00 -3.57E-01
Terrestrial eutrophication molc N eq 1.63E+01 1.70E+01 -7.19E-01
Freshwater eutrophication kg P eq 1.13E-01 1.17E-01 -4.52E-03
Marine eutrophication kg N eq 2.28E+00 2.36E+00 -8.86E-02
Freshwater ecotoxicity CTUe 1.72E+03 1.76E+03 -4.01E+01
Land use kg C deficit 4.30E+03 4.71E+03 -4.11E+02
Water resource depletion m3 water eq 1.08E+02 1.13E+02 -4.91E+00
Resource depletion kg Sb eq 1.47E-01 1.40E-01 7.27E-03
The relative relevance of some impact categories varies quite significantly depending on
the set of normalisation references used (Table 13 and Table 14). The most relevant impact
is resource depletion when applying the default EU-27 set (25%), while it is human toxicity,
cancer effects when applying global normalisation references (39%). The contribution of
toxicity-related impact categories is further checked and discussed with the improved
impact assessment models for toxicity-related impacts included in the EF 3.0 package
(Saouter et al., 2018) due to limitations of the current model (Saouter et al., 2017a;
2017b), which only cover 50% of the elementary flows contributing to toxicity (Zampori et
al., 2016).
Resource depletion is the impact category that varies the most between the two sets, being
the most relevant (25%) in the case of EU-27 normalisation and the fourth most relevant
(9%) in the case of global normalisation. The variation of water resource depletion is even
higher (from 23% with EU-27 references to 0% with global references). However, it is
worth to consider that the default ILCD EU-27 normalization factor for water resource
depletion is calculated using average EU values, whereas the characterization factors are
country-specific. When applying country-specific normalization factors (ILCD EU 27
country-specific) the relevance of water depletion is reduced from 23% to 3%.
If the results of the BoP household goods per citizen are normalised referring to the average
impact per person in EU-27 (Sala et al., 2015) and applying equal weighting (Figure 3),
the impact category mineral, fossil and renewable resource depletion assumes the highest
relevance (25%) compared to the others. The second most important impact category is
water resource depletion (23%) and the third is human toxicity, cancer effects (22%).
When comparing the equal weighting used in ILCD with the weighting factors developed
for the EF, the relevance of impact category change (Table 13 and Table 14). In general,
resource depletion and climate change show an increased relevance for the EF method
(Figure 3). On the contrary, the relevance of human toxicity, cancer decreases.

28
Table 13. Normalized results (ILCD EU-27) for the BoP household goods per capita baseline. Relevance of impacts after normalization with equal and EF
weighting of impact categories. Country-specific normalization factors (NFs) considers the calculation of water resource depletion at the country level with specific water scarcity values.
Impact category
System S+R (ILCD EU-27) System S+R (ILCD EU-27 country-specific)
Value (per person)
Relevance (%) Value (per person)
Relevance (%)
Equal WFs EF WFs Equal WFs EF WFs
Climate change 1.52E-01 2.6 6.7 1.52E-01 3.3 8.5
Ozone depletion 5.25E-03 0.1 0.1 5.25E-03 0.1 0.1
Human toxicity, non-cancer 3.50E-01 6.0 1.3 3.50E-01 7.6 1.7
Human toxicity, cancer 1.27E+00 21.8 5.6 1.27E+00 27.4 7.2
Particulate matter 3.01E-01 5.2 5.6 3.01E-01 6.5 7.2
Ionizing radiation, human health 7.92E-02 1.4 0.8 7.92E-02 1.7 1.1
Photochemical ozone formation 1.31E-01 2.3 1.3 1.31E-01 2.8 1.7
Acidification 1.74E-01 3.0 2.2 1.74E-01 3.8 2.9
Terrestrial eutrophication 9.33E-02 1.6 0.7 9.33E-02 2.0 0.9
Freshwater eutrophication 7.64E-02 1.3 0.4 7.64E-02 1.7 0.6
Marine eutrophication 1.35E-01 2.3 0.8 1.35E-01 2.9 1.1
Freshwater ecotoxicity 1.94E-01 3.3 0.8 1.94E-01 4.2 1.0
Land use 5.72E-02 1.0 0.9 5.72E-02 1.2 1.2
Water resource depletion 1.34E+00 23.0 23.8 1.37E-01 3.0 3.1
Resource depletion 1.47E+00 25.2 48.7 1.47E+00 31.8 61.9
TOTAL (single weighted) (Pt) - 3.88E-01 4.79E-01 - 3.08E-01 3.77E-01

29
Table 14. Normalized results (ILCD Global) for the BoP household goods per capita baseline.
Relevance of impacts after normalization with equal and EF weighting of impact categories.
Impact category
System S+R
Total BoP Per capita
Value Value
Relevance (%)
Equal
WFs
EF
WFs
Climate change 1.33E-02 1.82E-01 5.8 23.0
Ozone depletion 3.52E-04 4.84E-03 0.2 0.2
Human toxicity, non-cancer 2.87E-02 3.94E-01 12.5 4.3
Human toxicity, cancer 8.98E-02 1.23E+00 39.1 15.7
Particulate matter 6.49E-03 8.91E-02 2.8 4.8
Ionizing radiation HH 2.34E-02 3.20E-01 10.2 9.6
Photochemical ozone formation 7.40E-03 1.02E-01 3.2 2.9
Acidification 1.07E-02 1.47E-01 4.7 5.4
Terrestrial eutrophication 6.70E-03 9.20E-02 2.9 2.0
Freshwater eutrophication 3.22E-03 4.41E-02 1.4 0.7
Marine eutrophication 5.85E-03 8.03E-02 2.5 1.4
Freshwater ecotoxicity 1.06E-02 1.46E-01 4.6 1.7
Land use 2.45E-03 3.36E-02 1.1 1.6
Water resource depletion 7.08E-04 9.71E-03 0.3 0.5
Resource depletion 2.00E-02 2.75E-01 8.7 26.1
TOTAL (single weighted) (Pt) - - 2.10E-01 1.67E-01
Figure 3. Results of normalized results considering equal weighting and EF weighting and equal weighting of impact categories for the BoP household goods, EU normalization.
Resource depletion is highly relevant for almost all product groups (above 40% for sanitary
products, furniture and paper products). The same applies to water depletion, even if with
a slightly lower level of contribution. Each product group has a different distribution of the
remaining impact categories in terms of relevance. Human toxicity, cancer effect is the

30
most relevant one for personal care products, bed mattresses, and footwear (for which it
contributes to more than 70% of the overall impact of the product groups). When global
normalisation factors are applied, human toxicity, cancer effects becomes the most
relevant impact category for almost all the product groups in the basket. On the contrary,
resource depletion is less relevant than before for almost all the product groups. This is
due to the fact that EU normalization factors consider only the resources extracted in EU.
Therefore, global factors are more representative of the impact on resources.
As a sensitivity analysis, the BoP household goods has been analysed with the impact
assessment method developed in the context of the transition phase of the Environmental
Footprint (EC - JRC, 2018) (called here “EF 3.0”), where some impact categories considered
in ILCD were updated with recent impact assessment models and factors16. Table 15
presents the updated list of impact assessment models used in the EF 3.0 method, with
differences with ILCD highlighted in green. Results of characterization and normalization
with the EF 3.0 method are presented in Table 16 for the whole BoP household goods
baseline and in Table 17 for an average EU citizen. Global normalization factors for the EF
3.0 method have been used (updated from Crenna et al., 2019, Annex 3).
Table 15. Impact categories, models and units of EF 3.0 impact assessment method. Differences with ILCD (EC-JRC, 2011) are highlighted in green.
Impact category Reference model Unit
Climate change IPCC, 2013 kg CO2 eq
Ozone depletion World Meteorological Organisation
(WMO), 1999 kg CFC-11 eq
Human toxicity, non-cancer based on USEtox2.1 model (Fantke et
al., 2017), adapted as in Saouter et
al. (2018)
CTUh
Human toxicity, cancer based on USEtox2.1 model (Fantke et
al., 2017), adapted as in Saouter et al.
(2018)
CTUh
Particulate matter Fantke et al., 2016 Disease
incidence
Ionising radiation, human
health Frischknecht et al., 2000 kBq U235 eq
Photochemical ozone
formation, human health
Van Zelm et al., 2008, as applied in
ReCiPe, 2008 kg NMVOC eq
Acidification Posch et al., 2008 molc H+ eq
Eutrophication, terrestrial Posch et al., 2008 molc N eq
Eutrophication, freshwater Struijs et al., 200917 kg P eq
Eutrophication, marine Struijs et al., 2009 kg N eq
Ecotoxicity, freshwater
based on USEtox2.1 model (Fantke et
al., 2017), adapted as in Saouter et
al. (2018)
CTUe
Land use
Soil quality index based on an
updated LANCA model (De Laurentiis
et al., 2019) and on the LANCA CF
version 2.5 (Horn and Meier, 2018)
Pt
Water use AWARE 100 (based on; UNEP, 2016) m3 water eq
Resource use, fossils Abiotic Depletion Potential (ADP)
fossils (van Oers et al., 2002) MJ
Resource use, minerals and
metals
Abiotic ultimate reserve (van Oers et
al., 2002) kg Sb eq
16 Main results of this report employ the original impact assessment method (ILCD) to be aligned with the method
adopted in the individual reports, namely the other four basket of products. However, this sensitivity assessment displays as well the methodological advancements in the Environmental Footprint, with the newest method.
17 CF for emissions of P to soil changed from 1 to 0.05 kg Peq/kg

31
When the EF 3.0 method is applied, the impact on freshwater ecotoxicity is the most
relevant after normalization and equal weighting of impact categories (Table 16). This
result differs from the ILCD results with global normalization (Table 15) due to a different
approach in the toxicity impact assessment between ILCD and EF 3.0 (Saouter et al.,
2018). Ionising radiation is the second most relevant impact category due to the relevance
of EU in nuclear energy at the global level (Crenna et al., 2019). When fossil resources are
considered separately from mineral and metal ones (as it is in the EF 3.0 method), it is
evident that the main contribution to resource depletion comes from the use of fossil
resources. The impact on water resources (5.7%) is higher than the one obtained with
ILCD when using global normalization references (0%), but lower than the one obtained
with ILCD using EU-27 references. The relevance of the categories are equal at the EU
citizen level (Table 17). When comparing ILCD and EF weighting approaches, climate
change and fossils resource use gain relevance, in detriment of freshwater ecotoxicity.
Table 16. Characterized and normalized results for the whole BoP household goods baseline (impacts of consumption of household goods in EU in 2010) with EF 3.0 method, applied to the
system S+R. Global normalization and equal and EF weighting.
Impact category Unit Characte
rization
Normali
zation
Relevance (%)
Equal
WFs
EF WFs
Climate change kg CO2 eq 7.48E+11 1.34E-02 7.1 26.2
Ozone depletion kg CFC-11 eq 5.97E+04 1.61E-04 0.1 0.1
Human toxicity,
non-cancer CTUh
1.02E+04 6.42E-03 3.4 1.1
Human toxicity,
cancer CTUh
5.85E+02 5.02E-03 2.7 1.0
Particulate matter Disease
incidence
3.90E+04 9.51E-03 5.0 7.9
Ionising radiation,
human health kBq U235 eq
4.47E+10 1.53E-03 0.8 0.7
Photochemical ozone
formation, human health kg NMVOC eq
2.13E+09 7.59E-03 4.0 3.4
Acidification molc H+ eq 4.10E+09 1.07E-02 5.7 6.2
Eutrophication,
terrestrial molc N eq
8.17E+09 6.70E-03 3.6 2.3
Eutrophication,
freshwater kg P eq
5.55E+07 5.01E-03 2.7 1.3
Eutrophication,
marine kg N eq
1.14E+09 8.48E-03 4.5 2.3
Ecotoxicity,
freshwater CTUe
1.99E+13 6.76E-02 35.9 12.0
Land use Pt 1.31E+13 1.82E-03 1.0 1.3
Water use m3 water eq 1.06E+12 1.34E-02 7.1 10.6
Resource use,
fossils MJ
1.10E+13 2.45E-02 13.0 18.9
Resource use,
minerals and metals kg Sb eq
2.91E+06 6.63E-03 3.5 4.6
Total (single weighted) Pt - - 1.18E-02 1.08E+00

32
Table 17. Characterized and normalized results for the F.U. of the BoP household goods baseline
(impacts of consumption by an average EU citizen in 2010) with EF 3.0 method, applied to the system S+R. Global normalization and equal weighting.
Impact category Unit Characte
rization
Normali
zation
Relevance (%)
Equal
WFs
EF WFs
Climate change kg CO2 eq 1.49E+03 2.67E-11 7.1 26.2
Ozone depletion kg CFC-11 eq 1.19E-04 3.22E-13 0.1 0.1
Human toxicity,
non-cancer CTUh
2.02E-05 1.28E-11 3.4 1.1
Human toxicity,
cancer CTUh
1.17E-06 1.00E-11 2.7 1.0
Particulate matter Disease
incidence
7.77E-05 1.89E-11 5.0 7.9
Ionising radiation,
human health kBq U235 eq
8.89E+01 3.05E-12 0.8 0.7
Photochemical ozone
formation, human health kg NMVOC eq
4.23E+00 1.51E-11 4.0 3.4
Acidification molc H+ eq 8.16E+00 2.13E-11 5.7 6.2
Eutrophication,
terrestrial molc N eq
1.63E+01 1.34E-11 3.6 2.3
Eutrophication,
freshwater kg P eq
1.10E-01 9.93E-12 2.7 1.3
Eutrophication,
marine kg N eq
2.27E+00 1.68E-11 4.5 2.3
Ecotoxicity,
freshwater CTUe
3.96E+04 1.35E-10 35.9 12.0
Land use Pt 2.61E+04 3.63E-12 1.0 1.3
Water use m3 water eq 2.11E+03 2.68E-11 7.1 10.6
Resource use,
fossils MJ
2.19E+04 4.89E-11 13.0 18.9
Resource use,
minerals and metals kg Sb eq
5.79E-03 1.32E-11 3.5 4.6
Total (single weighted) Pt - - 2.35E-11 2.15E-09

33
4.1 Contribution by life cycle stages
Details on the contribution of life cycle stages to each impact category are provided in
Table 18 (system S+R), Figure 4 (system S+R), and Figure 5 (only System S).
Table 18. Contribution of different life cycle stages to the impact categories (based on the characterized inventory results of System S+R before normalization and weighting).
Climate change Human toxicity, non-cancer
effects Particulate matter
Life cycle stage Contrib. (%) Life cycle stage Contrib. (%) Life cycle stage Contrib. (%)
Components
manufacture 34.1
Components
manufacture 41.3
Components
manufacture 45.7
Production 23.4 End of life 25.2 Production 34.5
Use 22.6 Use 15.7 Use 14.3
Packaging 10.2 Production 9.6 Logistics 3.3
End of life 5.6 Logistics 5.3 End of life 2.6
Logistics 4.2 Packaging 2.9 Packaging -0.3
Ozone depletion Human toxicity, cancer effects Ionizing radiation HH
Life cycle stage Contrib. (%) Life cycle stage Contrib. (%) Life cycle stage Contrib. (%)
Components
manufacture 45.3
Components
manufacture 71.2 Use 41.4
Use 37.1 End of life 12.9
Components
manufacture 33.2
Logistics 9.5 Use 9.9 Production 19.4
Production 6.6 Production 4.3 Logistics 4.4
Packaging 1.2 Logistics 0.8 Packaging 1.7
End of life 0.3 Packaging 0.8 End of life -0.1
Photochemical ozone formation Acidification Terrestrial eutrophication
Life cycle stage Contrib. (%) Life cycle stage Contrib. (%) Life cycle stage Contrib. (%)
Components
manufacture 40.9
Components
manufacture 44.9
Components
manufacture 49.7
Production 22.4 Production 24.6 Production 19.2
Use 21.9 Use 20.8 Use 18.3
Logistics 8.9 Logistics 5.3 Logistics 8.2
End of life 3.3 End of life 2.9 End of life 3.0
Packaging 2.5 Packaging 1.5 Packaging 1.6
Freshwater eutrophication Marine eutrophication Freshwater ecotoxicity
Life cycle stage Contrib. (%) Life cycle stage Contrib. (%) Life cycle stage Contrib. (%)
Components
manufacture 35.3
Components
manufacture 37.1
Components
manufacture 54.6
Use 24.2 End of life 28.3 Use 14.5
End of life 21.9 Production 13.1 Logistics 10.6
Production 17.0 Use 11.9 End of life 9.3
Packaging 0.9 Logistics 5.3 Production 5.6
Logistics 0.7 Packaging 4.3 Packaging 5.3
Land use Water resource depletion Resource depletion
Life cycle stage Contrib. (%) Life cycle stage Contrib. (%) Life cycle stage Contrib. (%)
Components
manufacture 78.1
Components
manufacture 37.5
Components
manufacture 56.4
Use 12.6 Use 29.2 Use 22.6
Production 6.6 Production 20.2 End of life 7.4
Logistics 4.9 End of life 11.8 Packaging 6.7
Packaging 0.4 Packaging 0.8 Production 4.9
End of life -2.6 Logistics 0.5 Logistics 2.0
The life cycle stages in orange are the ones identified as “most relevant” for the impact category, as they are contributing to more than 80%.
The role of the different life cycle stages in the overall environmental impacts depends on
the impact category. Considering the main contributing life cycle stages by impact
category, components manufacture, production and use were the most relevant. For some
impact categories, end of life and logistics contributed to some extent.

34
Components’ manufacture (ingredients, raw materials or intermediate products) is the
most impacting stage for most of the impact categories, apart from ionizing radiation.
There are several reasons behind this contribution. In some cases, the largest impact is
generated in the very first stage of the life cycle of the materials used. This is the case, for
instance, of natural-based raw materials, such as cotton, rape oil, and wood (used,
respectively, for textiles, soaps, and furniture and paper products). The agricultural phase
of these components is the main contributor to some impact categories, such as land use,
ecotoxicity and water use. In other cases, the impact comes from the processes needed to
transform raw materials into ingredients or intermediates of the final products, which imply
the use of chemical additives and energy. The production of pulp (used in absorbent
hygiene products and in paper products) generates emissions to water and air that have a
significant contribution to the environmental profile of the final products. The same applies
to the tanning process needed to transform skins and hides into leather (to be used, e.g.,
in footwear), which, due to the use and emissions of chromium, generates impacts on
human toxicity.
The impact of the production stage is generally due to the use of electricity and to the
emissions to water and air. One of the production processes that is more relevant in the
production stage is the production of clothes, due to the large amount of electricity needed
to transform the fibres into yarn, then into textile and finally into clothes. Moreover, it has
to be considered that the largest part of the production of clothes happens outside the EU,
in countries that have an electricity mix that is more impacting than the EU one (e.g. China
or India, where the contribution of coal to the national electricity mix is quite high).
Regarding the use stage, the most contributing activity is the heating of the water needed
for cleaning (i.e. in the use stage of detergents), also because for many products the use
stage does not imply any impact, except for the transport from the site of purchase to the
home of the client.
Logistics (i.e. transport from the production site to the retail) has a lower contribution
compared to the first stages of the life cycle of household goods. The same is for
packaging, which has a contribution lower than 10% to all the impact categories
considered, also due to the recycling of packaging at the end of life.
Finally, if the benefits from recycling are included (system S+R) (Figure 4), the end of life
of some product groups helps to mitigate the impacts coming from the rest of the life cycle,
thanks to the benefits coming from the recycling of products at their end of life. Within the
baseline scenario of the BoP household goods, recycling is assumed to be in place only for
some of the product groups (clothes and paper products), to reflect the actual situation, in
which recycling is mainly applied to packaging materials. When considering the system
S+R, the EoL phase generates a benefit on land use, because of the recycling of paper
(especially newspapers) at the EoL, and the avoided use of virgin wood from forests.
However, this benefit is offset by the impact coming from other phases, so there is no
benefit for the whole BoP. In general, the difference between the impact of the BoP when
considering system S+R or system S (Figure 5) alone is generally small (Table 11 and
Table 13).

35
Figure 4. Contribution of different life cycle stages to the impact categories (based on the
characterized inventory results before normalization and weighting) (System S+R).
Figure 5. Contribution of different life cycle stages to the impact categories (based on the characterized inventory results before normalization and weighting) (System S).

36
4.2 Most relevant elementary flows
Table 19 reports the most relevant elementary flows for each impact category. Within each
impact category, for the flow that contributes the most, the main process from which it
originates is specified (marked with *). The inventory networks of the most important
flow(s) are reported in Annex 4.
Table 19. Contribution of elementary flows to each impact category of the ILCD method.
Climate change Human toxicity, non-cancer effects
Particulate matter
Elementary flow % Elementary flow % Elementary flow % Carbon dioxide, fossil* 83.6 Zinc to soil* 32.2 Particulates ≤ 2.5* 74.9 Methane, biogenic 6.7 Zinc to air 23.1 sulphur dioxide 21.6 Methane, fossil 6.6 Mercury to air 20.9 Lead to air 5.3
*Electricity mix EU (used for water heating)
*Tyre wear emissions (lorry) *Electricity mix, IN
Ozone depletion Human toxicity, cancer effects Ionizing radiation HH Elementary flow % Elementary flow % Elementary flow % Methane, bromotrifluoro-, Halon 1301* 52.7
Chromium to water* 54.3
Carbon-14 to air* 94.4
Ethane, 1,2-dichloro-1,1,2,2-tetrafluoro-, CFC-114 23.1
Chromium VI to water 30.8
Methane, bromochlorodifluoro-, Halon 1211 15.2
Chromium to air 7.1
Methane, tetrachloro-, CFC-10 7.1
Methane, dichlorodifluoro-, CFC-12 2.2
*Petroleum production (onshore)18 *Chrome-tanned finished leather *Spent nuclear fuel (FR electricity mix)
Photochemical ozone formation Acidification Terrestrial eutrophication Elementary flow % Elementary flow % Elementary flow % Nitrogen oxides* 73.8 Sulphur dioxide* 63.4 Nitrogen oxides to air* 79.9 NMVOCs 12.9 Nitrogen oxides 27.7 Ammonia to air 20.0 Sulphur dioxide 7.8 Ammonia 8.9
*Electricity, low voltage, CN *Electricity, medium voltage, EUR without CH
*Electricity, low voltage, CN
Freshwater eutrophication Marine eutrophication Resource depletion Elementary flow (%) Elementary flow (%) Elementary flow (%) Phosphate to water* 91.0 Nitrogen oxides to air* 52.1 Indium* 75.2 Phosphorus to water 5.6 Nitrate to water 29.0 Cadmium 9.0
Ammonium to water 14.6 Nickel 3.1 Tantalum 2.2 Lead 2.0 Silver 1.7 Zirconium 1.3
*Wastewater, from residence *Electricity, low voltage, CN *Zinc-lead extraction
18 Halon emissions in the petroleum production datasets are related to the equipment for fire extinguishing. In
the European Union, the use of Halon 1301 has been forbidden for any new oil, gas and petrochemicals facilities since 2010, and by 2020, all fire extinguishing systems using Halon must have been replaced. However, this is not always the case for petroleum production plants in the rest of the world.

37
Table 19 (cont.). Contribution of elementary flows to each impact category of the ILCD
method.
Land occupation Water resource depletion Freshwater ecotoxicity Elementary flow % Elementary flow % Elementary flow %
Occupation, forest, intensive*
39.8 Water, cooling, DE* 11.1 Chromium to water* 14.9
Occupation, arable 34.5 Water, cooling, SA 10.0 Antimony to air 11.8 Occupation, arable, non-irrigated, intensive
4.5 Water, cooling, PL 8.3 Chlorpyrifos to soil 10.0
Occupation, traffic area, road network
4.4 Water, river, RoW 8.1 Antimony to water 9.7
Occupation, traffic area, rail/road embankment
3.5 Water, cooling, CN 5.8 Chromium VI to water 8.4
*Wood (for pulp making) Water, cooling, FR 4.7 Zinc to water 4.7
Land transformation Water, cooling, ES 4.6 Vanadium to air 4.6 Elementary flow % Water, cooling, IN 4.1 Zinc to soil 3.2 From forest to mineral extraction site*
32.2 Water, river, Europe 3.9 Copper to air 3.0
From pasture and meadow to industrial area
8.7 Water, well, RoW 3.7 Diflubenzuron to soil 2.8
From pasture and meadow, intensive to arable, non-irrigated, intensive
6.2 Water, cooling, UA
3.3 Zinc to air 2.4 From forest, extensive to traffic area, rail/road embankment
3.7 Profenofos to soil 2.4
*Onshore well, oil/gas production *Electricity mix, DE *Transport, passenger car, Europe
As for other areas of consumption (e.g. household appliances) (Reale et al., 2019),
electricity production plays a relevant role for many impact categories (either due to the
use of electricity in the production or in the use of products) (e.g. particulate matter, land
transformation). Transport contributes to climate change, mainly because of passenger
transport (i.e. the customer transport). Freshwater ecotoxicity, human toxicity, cancer
effects, and land occupation are driven by pulp production (Table 19).
When comparing the flow contribution with the ILCD and EF 3.0 methods, some differences
are unveiled (Table 20). The inclusion of cooling as a contributor to water depletion is
debated and represents one of the main differences between the model recommended in
the ILCD method (Frischknecht, 2009) and the model included in the EF 3.0 (Boulay et al.,
2016). When assessing the BoP with ILCD, the impact of cooling is excluded (not
consistently with the original method) and the most contributing elementary flow is “Net
water use in Europe without Switzerland”.

38
Table 20. Most relevant elementary flows for resource depletion, water scarcity, land use and
particulate matter, when applying EF 3.0 method.
Resource depletion, minerals and metals
Resource depletion, energy carriers
Climate change
Elementary flow Contr. (%)
Elementary flow Contr. (%)
Elementary flow Contr. (%)
Cadmium* 32.4 Coal, hard* 29.6 Carbon dioxide, fossil* 78.3 Lead 21.8 Oil, crude 22.5 Methane, biogenic 9.6 Gold 13.9 Natural gas 21.2 Methane, fossil 9.0 Silver 8.7 Uranium 16.6 Dinitrogen monoxide 1.4
Copper 7.7 Coal, brown 8.9 Carbon dioxide, land transformation
0.8
Chromium 4.3 Gas, mine 0.5 Zinc 3.5 Peat 0.2
*Zinc-lead mining *Hard coal mining, CN *Transport, passenger car
Water scarcity (country) Land occupation Land transformation
Elementary flow Contr. (%)
Elementary flow Contr. (%)
Elementary flow Contr. (%)
Net water use in Europe without Switzerland*
61.1 Occupation, forest, intensive* 62.5
From forest to mineral extraction site*
31.9
Net water use, unspecified region
19.6 Occupation, arable 16.5 From pasture and meadow, to industrial area
10.8
Net water use in CN 10.9 Occupation, traffic area, road network 4.4
From forest, extensive, to traffic area, rail/road embankment
8.1
Net water use in US 7.2 Occupation, traffic area, rail/road embankment 3.3
From forest, extensive, to forest, intensive
4.9
*Tap water in the use of shampoo, soap, and laundry liquid detergents
*Wood (for pulp making) *Oil and gas onshore infrastructure
Freshwater ecotoxicity Human toxicity, cancer effects Human toxicity, non-cancer effects
Elementary flow Contr. (%)
Elementary flow Contr. (%)
Elementary flow Contr. (%)
Aluminium to soil* 53.1 Formaldehyde to air* 24.5 Mercury to air* 32.7
Aluminium to air 15.7 Chromium to water 23.1 Carbon monoxide, fossil to air
11.5
Chloride to water 9.1 Benzo(a)pyrene to air 13.8 Chlorine to water 9.0
Aluminium to water 6.4 Chromium VI to water 11.7 Lead to air 8.1 Aluminium (ion) to water 2.7 Chromium to air 10.5 Chlorine to air 5.1
*Sludge from pulp production *Sludge from pulp production *Cast iron production
Particulate matter
Elementary flow Contr. (%)
Particulates < 2.5* 74.8 Sulphur dioxide 15.7 Ammonia 6.2 Nitrogen oxides 3.3
*Electricity mix, IN

39
4.3. Contribution by product groups
The larger contribution to the overall impacts generated by the BoP household goods per
product groups is due to paper products, detergents, furniture and clothes, with different
shares depending on the impact category considered (Figure 6 and Table 21). This
contribution is partly due to inherent properties of the life cycle of the products considered
and partly to the amount of each product in the BoP (Table 1). Similar results are obtained
when analysing the S system, without considering the recycling (Figure 7).
Figure 6. Contribution by product groups at the characterization stage (System S+R).
As mentioned before, the main hotspots in the life cycle of detergents (especially
dishwasher and laundry liquid detergents) are the eutrophication potential of some of the
ingredients used, and the use of electricity to heat the water needed during the use stage
(which generates the impact on ionising radiation and water resource depletion, due to the
use of water for cooling the electricity generation plants).
Furniture products contribute the most to particulate matter, due to the use of coal in
the production of the electricity used to produce the flame-retardants of the sofa. Their
contribution is quite relevant also for ozone depletion, due to the emissions of Halon 1301
(as fire extinguisher), coming from the production of petroleum, as background process of
the production of diesel fuel, used in freight transport.
As already discussed, an important hotspot for the clothes (as apparel items) is the use
of electricity during the phases that transform the raw fibres into textiles (spinning,
yarning, texturizing, etc.). This generates impacts on climate change, particulate matter,
acidification, and water resource depletion. The most contributing product in this group is
the T-shirt, mainly because of the high quantity purchased by EU citizens in one year (also
as effect of the upscale of apparent consumption for this product group).

40
Footwear is highly relevant for human toxicity, cancer effects, because of the emissions
of chromium, which is used in the chrome-tanning process in the production of leather
used in fashion shoes.
Paper products contribute quite significantly to most of the impact categories, both
because of the high amount of paper products consumed in one year (especially as
newspapers and toilet paper) and because of the impacts coming from the pulp production
process and the printing of paper.
Personal care products (rinse-off cosmetics) do not appear to be significant in most of
the impact categories considered. The only exceptions are the contribution to human
toxicity (non-cancer effects), freshwater eutrophication, and marine eutrophication. This
contribution comes mainly from the ingredients of the soaps and shampoos and from the
wastewater treatment needed after the use of the products.
Finally, sanitary products do not contribute significantly to any of the impact categories,
except for ozone depletion and resource depletion where contributions are more relevant.
This is mainly due to the very low amount of products purchased by an average EU citizen
in one year, compared to the other product groups.
Figure 7. Contribution by product groups at the characterization stage (System S).

41
Table 21. Contribution of each representative product to the characterized results of the BoP household goods (system S+R). A colour scale is applied,
from red (highest contributor) to green (lowest contributor), for each impact category.
APC cleanerDishwasher
detergent
Hand
dishwashing
detergent
Laundry
liquid
detergent
Laundry
powder
detergent
Baby diaper Sanitary pad Tampon Breast pad Bar soap Liquid soap ShampooHair
conditionerWardrobe Kitchen
Climate change 4.2% 7.0% 0.7% 4.4% 1.4% 1.5% 2.6% 0.1% 0.5% 1.7% 0.4% 0.5% 0.3% 7.5% 3.4%
Ozone depletion 5.7% 10.0% 1.0% 7.2% 2.3% 1.6% 4.0% 0.1% 1.0% 1.6% 0.5% 0.6% 0.5% 9.3% 5.8%
Human toxicity, non-cancer effects 3.3% 6.0% 0.6% 8.7% 2.9% 0.8% 1.7% 0.1% 0.4% 7.9% 2.8% 3.2% 1.6% 5.0% 3.6%
Human toxicity, cancer effects 1.4% 2.6% 0.3% 3.0% 1.1% 0.5% 1.1% 0.0% 0.2% 2.9% 0.9% 1.0% 0.5% 4.0% 2.3%
Particulate matter 2.3% 3.9% 0.4% 2.8% 1.0% 1.6% 2.7% 0.1% 0.5% 1.9% 0.3% 0.4% 0.3% 9.5% 4.4%
Ionizing radiation HH 8.4% 15.3% 1.5% 8.2% 3.1% 1.6% 2.5% 0.1% 0.5% 1.1% 0.3% 0.4% 0.2% 5.8% 4.0%
Photochemical ozone formation 3.4% 5.3% 0.7% 3.9% 1.4% 1.4% 2.7% 0.1% 0.6% 2.0% 0.4% 0.6% 0.3% 10.7% 4.3%
Acidification 4.1% 7.2% 0.8% 4.7% 1.6% 1.3% 2.1% 0.1% 0.4% 2.9% 0.4% 0.5% 0.3% 7.7% 3.7%
Terrestrial eutrophication 2.9% 5.0% 0.6% 3.7% 1.3% 1.1% 2.1% 0.1% 0.4% 4.6% 0.4% 0.5% 0.3% 8.4% 3.7%
Freshwater eutrophication 6.0% 11.1% 0.9% 10.4% 3.1% 1.2% 1.7% 0.1% 0.3% 7.1% 2.6% 2.9% 1.5% 4.2% 2.8%
Marine eutrophication 3.1% 5.5% 0.4% 8.4% 2.6% 0.9% 1.5% 0.1% 0.3% 9.5% 2.8% 3.2% 1.6% 6.9% 2.7%
Freshwater ecotoxicity 1.7% 2.6% 0.3% 3.4% 1.1% 0.9% 3.1% 0.2% 0.8% 4.1% 0.9% 1.1% 0.6% 5.8% 2.1%
Land use 1.5% 2.6% 0.3% 2.7% 0.7% 0.9% 2.4% 0.1% 0.5% 7.5% 0.3% 0.4% 0.2% 8.0% 6.4%
Water resource depletion 6.0% 10.9% 1.3% 6.9% 2.0% 1.1% 1.3% 0.1% 0.2% 2.7% 0.8% 1.0% 0.5% 3.1% 2.5%
Mineral, fossil & ren resource depletion 2.1% 3.7% 0.4% 2.5% 3.9% 1.1% 4.4% 0.2% 1.1% 1.8% 0.3% 0.4% 0.2% 5.0% 22.2%
Impact category
Detergents Sanitary products Personal care Furniture
Bed mattress
SofaWooden
seat
Wooden
table
Bed
mattressWW shoes Sport shoes
Leisure
shoes
Fashion
shoesT-shirt Blouse Trousers Jeans Newspaper Book Toilet paper
Climate change 3.9% 1.9% 1.1% 1.5% 0.7% 0.5% 1.6% 1.4% 10.2% 10.5% 1.6% 4.1% 14.3% 2.9% 7.6%
Ozone depletion 3.7% 1.3% 1.2% 1.5% 0.5% 0.3% 1.2% 1.2% 0.7% 1.2% 0.4% 0.9% 22.0% 4.2% 8.5%
Human toxicity, non-cancer effects 2.6% 0.8% 0.7% 1.7% 1.6% 0.2% 0.8% 2.6% 5.3% 2.4% 0.7% 2.2% 14.1% 2.3% 13.3%
Human toxicity, cancer effects 3.2% 0.6% 0.6% 2.5% 19.4% 0.1% 0.4% 32.4% 2.4% 0.7% 0.3% 1.2% 4.3% 0.7% 9.4%
Particulate matter 5.1% 2.9% 1.5% 1.8% 0.9% 0.8% 2.3% 1.7% 16.0% 3.6% 2.2% 7.2% 10.4% 1.9% 9.6%
Ionizing radiation HH 3.2% 1.4% 1.4% 1.0% 0.4% 0.3% 0.9% 1.5% 5.1% 1.2% 0.6% 1.4% 18.0% 3.9% 6.8%
Photochemical ozone formation 4.8% 2.1% 1.4% 1.8% 0.9% 0.7% 2.5% 2.2% 11.4% 3.4% 1.7% 4.5% 13.5% 2.7% 8.6%
Acidification 4.6% 2.1% 1.3% 2.0% 1.5% 0.5% 2.0% 2.9% 12.4% 3.0% 1.7% 5.4% 12.5% 2.6% 7.7%
Terrestrial eutrophication 4.7% 1.9% 1.2% 3.0% 2.5% 0.5% 2.0% 4.5% 13.4% 2.6% 1.4% 5.8% 11.5% 2.4% 7.4%
Freshwater eutrophication 3.4% 1.1% 0.8% 1.3% 1.2% 0.3% 1.2% 1.7% 7.3% 1.4% 0.8% 3.3% 11.8% 2.4% 6.2%
Marine eutrophication 3.6% 1.3% 0.9% 1.6% 1.8% 0.4% 1.4% 3.1% 8.8% 5.0% 1.0% 3.9% 10.2% 2.1% 5.5%
Freshwater ecotoxicity 3.9% 0.8% 0.8% 2.4% 5.8% 0.2% 1.7% 10.2% 12.4% 4.6% 0.5% 6.7% 12.8% 2.2% 6.4%
Land use 3.8% 2.6% 2.9% 1.6% 1.1% 0.1% 1.4% 2.0% 11.7% 1.1% 0.3% 6.1% 16.5% 2.6% 11.4%
Water resource depletion 3.9% 1.2% 0.9% 0.9% 0.4% 0.3% 1.6% 1.1% 10.3% 1.4% 0.8% 5.4% 11.1% 2.5% 17.7%
Mineral, fossil & ren resource depletion 1.3% 0.6% 0.6% 1.2% 0.4% 0.2% 0.9% 3.4% 4.3% 1.2% 0.8% 1.8% 22.6% 3.4% 7.9%
Footwear Clothes Paper products
Impact category
Furniture

42
4.4. Trends: consumption and environmental impacts between
2010 and 2015
The aim of this section is to update the baseline to the closest year for which data are
available in order to have an updated overview of the impacts coming from the
consumption of household goods in EU households. The consumption of each
representative product in the BoP has been updated to the selected year (2015).
Table 22 details the consumption of each representative product per EU citizen in 2015.
Consistently, the number of EU citizens has been updated. The amount consumed per
person is reported considering that the number of citizens grew from 502,489,100 to
508,401,408, according to Eurostat. Technologies are assumed to be the same of the
baseline 2010.
Between 2010 and 2015, the consumption per average EU citizen increased for most of
the representative products, apart from most of the personal care products (rinse-off
cosmetics: bar soap, shampoo, and hair conditioner), most of the furniture (with the
exception of dining room furniture), most of the footwear (with the exception of sport
footwear), and newspaper. Liquid soap was the product with the highest increase in
consumption (+130%). Contrarily, the consumption of hair conditioner showed the largest
reduction (-39%).
In terms of environmental impacts, Figure 8 shows the evolution of the impact related to
household goods consumption between 2010 and 2015. The largest increases are observed
for the impact categories water resource depletion (+15.2%) and human toxicity, non-
cancer (12.3%). The increase in ionizing radiation (+10.7%), ozone depletion (10.4%),
and freshwater eutrophication (+10.1%) slightly surpasses the 10%. The rest of the
categories show an increase under 10%, being human toxicity, cancer, the one with the
lowest variation (+3.6%).
In general, the environmental impacts related to the household goods consumed by EU
citizens show an increasing trend between 2010 and 2015, mainly related to an increased
consumption per capita of most of the representative products included in the BoP
household goods (Table 22). These results are in line with an increased impact of the
overall household consumption (including also food, mobility, housing, and appliances)
(Sala et al., 2019).

43
Table 22. Composition of the BoP household goods in terms of product groups, representative
products, upscaled consumption of an average EU-27 citizen in years 2010 and 2015, and variation between the two assessed years (Source: Eurostat, 2015).
Product group Representative product
Per capita apparent
consumption
upscaled
(unit/ citizen*year-1)
Unit Variation
2010 2015 (%)
Detergents
All-Purpose Cleaners and
Sanitary Cleaners (500mL) 9.99 11.32 kg +13
Detergents for
Dishwashers (tablet) 2.43 2.75 kg +13
Hand Dishwashing
Detergents (650mL) 1.75 1.98 kg +13
Laundry Detergents liquid
(650mL) 10.03 11.36 kg +13
Laundry Detergents
powder (dose) 3.10 3.51 kg +13
Sanitary products
(absorbent
hygiene products)
Baby diapers 4.05 5.24 kg +29
Sanitary pads 4.05 6.44 kg +59
Tampons 0.09 0.14 kg +56
Breast pads 0.56 0.91 kg +63
Personal care
(rinse-off
cosmetics)
Bar soap 4.59 4.06 kg -12
Liquid soap (255mL) 1.82 4.18 kg +130
Shampoo (255mL) 3.13 2.04 kg -35
Hair conditioner (255mL) 2.07 1.26 kg -39
Furniture
Bedroom wooden furniture 0.199 0.19 p -5
Kitchen furniture 0.301 0.27 p -10
Upholstered seat 0.188 0.15 p -20
Non-Upholstered seat
(wooden seat) 0.271 0.18 p -34
Dining room furniture
(wooden table) 0.165 0.18 p +9
Bed mattresses Mattress (Latex, PUR and
spring mattresses) 0.090 0.10 p +11
Footwear
Work and Waterproof
(WW) 0.48 0.45 pa -6
Sport 0.61 0.82 pa +34
Leisure 2.29 2.13 pa -7
Fashion 2.29 2.13 pa -7
Clothes (textile
products)
T-shirt 31.80 34.7 p +9
Women blouse 8.55 9.32 p +9
Men trousers 3.74 4.08 p +9
Jeans 4.79 5.22 p +9
Paper products
Newspaper 90.50 85.05 kg -6
Book 19.26 25.07 kg +30
Toilet paper 23.55 36.39 kg +55
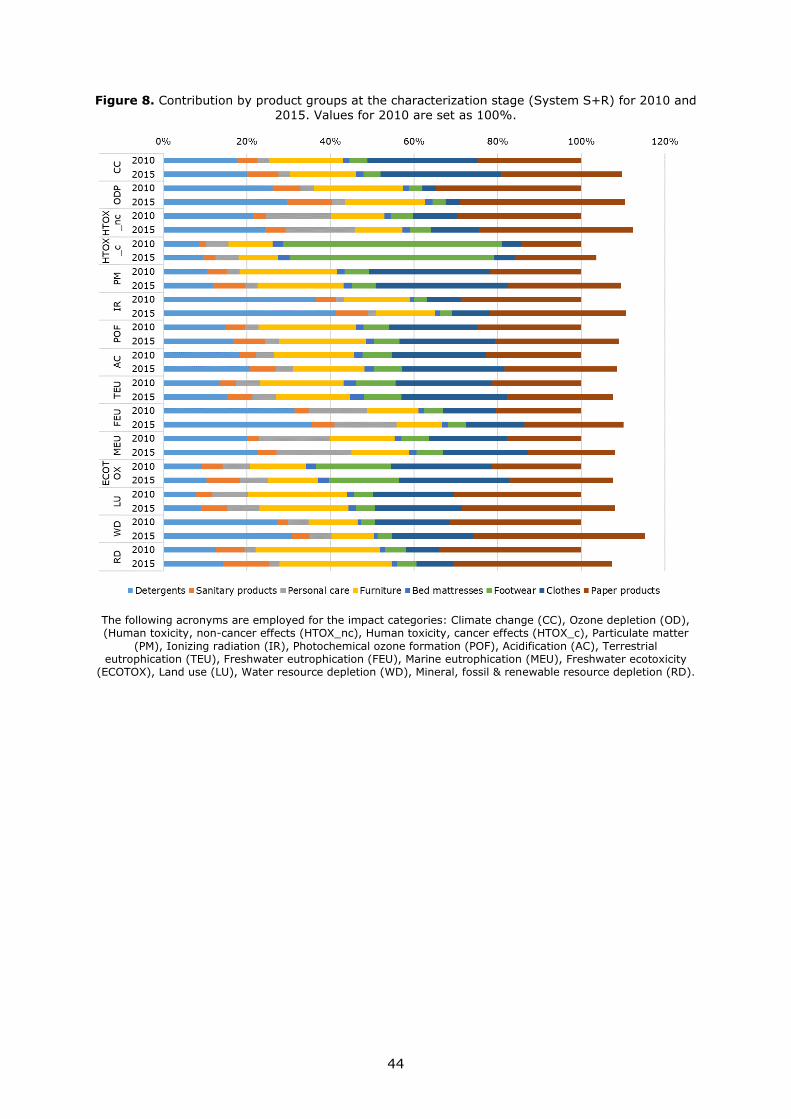
44
Figure 8. Contribution by product groups at the characterization stage (System S+R) for 2010 and
2015. Values for 2010 are set as 100%.
The following acronyms are employed for the impact categories: Climate change (CC), Ozone depletion (OD), (Human toxicity, non-cancer effects (HTOX_nc), Human toxicity, cancer effects (HTOX_c), Particulate matter
(PM), Ionizing radiation (IR), Photochemical ozone formation (POF), Acidification (AC), Terrestrial eutrophication (TEU), Freshwater eutrophication (FEU), Marine eutrophication (MEU), Freshwater ecotoxicity
(ECOTOX), Land use (LU), Water resource depletion (WD), Mineral, fossil & renewable resource depletion (RD).

45
5. Main hotspots
In summary, the main hotspots identified for the BoP household goods are the following:
— Toxicity impact categories appear to be relevant in the different method employed.
While human toxicity, cancer effects, is the most relevant in ILCD, freshwater
ecotoxicity results in the largest contributor when using EF 3.0. Other relevant impacts
are on resource depletion (and especially on fossil resources, when depletion of fossil
and mineral resources is assessed separately) and on ionising radiation.
— For almost all the product groups, the life cycle stage that contributes the most to the
overall impact is the manufacture of components (raw materials, ingredients or
intermediate products) that are used to produce the final product.
— Among the product groups included in the BoP, the ones that contribute the most to
the overall impact are detergents, furniture, paper products, and clothes. This
contribution is the result of two combined factors: the environmental profiles of the
representative products analysed and the amount of products included in the functional
unit (i.e. amount of products purchased by an average EU citizen in one year, as in the
case of T-shirts). Each product group has different hotspots in terms of the type of
impacts and the life cycle stage in which the impacts are generated.
— The differences between System S+R and System S are generally small. In the baseline
scenario, there is no recycling at end of life for most of the product groups, mainly
because their recyclability potential at the moment is low and because they cannot be
easily separated from the unsorted urban waste stream. Furthermore, benefits from
recycling and reuse are mainly offset at the whole BoP level due to the impacts
generated in other life cycle phases.
— The assessment of year 2015 shows an increasing trend in the environmental impact
of the consumption of household goods, mainly due to a growth in the consumption of
most of the products.
Regarding methodological aspects, the relative importance of impact categories after
normalization and weighting of results varies according to the LCIA method and the set of
normalisation factors used (EU-27 or global references).
However, it is important to highlight that the BoP does not cover all the product groups
that are part of the household consumption of goods. For instance, pharmaceuticals are
not included in the BoP, but are known hotspots for some environmental impacts (e.g.
emissions to water after use). Therefore, when interpreting the results of the BoP
household goods, the potential additional impact coming from these product groups should
be considered. It is important to notice that also other approaches, based on environmental
extended input output tables, miss products groups that could be of relevance (see the
study of Castellani et al. 2019). Hence, it is not possible to estimate their potential
contribution to overall consumption.
The results of the hotspot analysis on the baseline of the BoP household goods are generally
in line with the hotspot addressed by the EU Ecolabel and GPP criteria for the product
groups included in the basket. Possible synergies among eco-innovation strategies and the
feasibility of developing scenarios on these topics are discussed in the following section.
46
6. Eco-innovations relevant for the BoP household goods
Towards assessing different scenarios considering eco-innovations in the life cycle of the
products included in the BoP household goods, this section illustrates the main findings of
a literature review on eco-innovation for the area of consumption covered by the BoP
household goods. It is summarized as a list of areas of improvement, some of them
specifically related to one BoP, others cross-cutting among BoPs, and the related
information needed to drive the further selection. These areas of improvements and related
eco-innovation constitute a long list of possible scenarios that may be tested on the BoP
baseline.
Based on the areas of concern identified by the hotspot analysis, and focusing on product
categories that emerged as more critical, possible improvements and eco-innovation
needed in the household goods supply chain to make these strategies operational were
identified. The main areas of eco-innovation are the ones listed in Table 23.
For detergents and personal care products, the main efforts of manufacturers to reduce
the environmental impact of the products are concentrated on the formulation. Most of the
innovations proposed refer to the use of less impacting surfactants (generally focusing on
natural-based and renewable ingredients) and, in the case of detergents, to the
development of formulations that allow for proper washing with lower temperatures (i.e.
allowing for energy savings). The reduction of packaging is also taken into consideration.
In the case of detergents this is achieved through the compaction of the detergent,
whereas in the case of personal care products, through the reduction of unnecessary
packaging (e.g. packaging that has no functional purpose but has the function of making
the product more appealing). An important effort of detergent manufacturers is devoted
also to the development of consumers’ information campaigns on the correct dosage of
detergents (e.g. the “cleanright” campaign by the International Association for Soaps,
Detergents and Maintenance Products - A.I.S.E.).
For pulp-based products, i.e. paper products and hygiene products containing cellulose,
possible solutions to reduce the environmental impact of the supply chain refer to the use
of pulp obtained from certified wood (i.e. wood coming from forests that are sustainably
managed), to the use of pulp from recycled paper, and to the reduction of potentially
harmful chemical additives in pulp making. The use of totally chlorine-free (TCF) pulp, i.e.
pulp bleached without chlorine, is an example.
The same principle applies in the choice of leather (e.g. used in footwear) that is tanned
with a chrome-free process.
The choice of more environmentally friendly chemicals and related processing of the raw
materials is relevant also for textiles. Some of the innovations proposed refer to the use of
more environmentally friendly dyes or the implementation of solutions for a more efficient
wastewater treatment. Energy-efficiency and water-efficiency measures in the production
process (e.g. the transformation of fibres into textile) are also suggested. For natural fibres
such as cotton, the agricultural stage (cultivation of raw fibres) is an important
environmental hotspot, like any other agricultural activity. Therefore, the use of cotton
coming from organic agriculture is proposed, especially in the apparel sector.
Finally, there are some cross-cutting measures that could be applied to several product
groups and that might generate important benefits. They are generally linked to the
extension of the service life of products (e.g. through a better maintenance or by promoting
the reuse at the end of the first life) and to the recycling, in closed or open loops, of the
materials that compose the products.

47
Table 23. Overview of eco-innovation options relevant for the BoP household goods.
Product group Areas of
eco-innovation
Proposed solutions and
eco-innovation References
Detergents
and personal
care products
Product formulation
Choice of less impacting
surfactants, builders and solvents
(e.g., by using natural-
based/renewable ingredients)
Grbavčić et al. (2015)
Siwayanan et al. (2014)
Keshwani et al. (2015)
Dreja et al. (2014)
Sahota (2014)
Barve and Dighe (2016).
Improved formulation to allow for a
proper washing at lower
temperature
AISE (2017)
Honisch et al. (2016)
Khan et al. (2013)
Dosage of product in
the use phase
Consumers education on correct
dose of detergents AISE and Cefic (2017)
Packaging
Reduced packaging (by avoiding
packaging that is not necessary or
by compacting the detergent)
Nessi et al. (2014)
García-Arca et al. (2017)
Saouter et al. (2002)
Wood-based
and pulp-
based
products
(furniture,
paper
products and
sanitary
products)
Fibres sourcing
Use of wood from sustainable
managed forests
Sikkema et al. (2016)
Dieterich and Auld (2015).
Use of pulp from recycled paper
Sikkema et al. (2016)
Ghose and Chinga-Carrasco
(2013).
Pèlach Serra et al. (2016)
Chemical additives Reduction/substitution of chemical
additives in pulp making
Ghose & Chinga-Carrasco
(2013).
Pèlach Serra et al. (2016)
Bleaching Totally chlorine-free (TCF) pulp
bleaching
Popp et al. (2011),
González-García et al. (2009),
EC-JRC (2015)
Textiles (in
clothes,
mattresses
and furniture)
Water and energy use
in textile manufacture
Energy-efficiency and water-
efficiency measures in the
production process
Alkaya and Demirer (2014),
Ozturk et al. (2016)
Organic cotton Use of cotton from organic
agriculture Rieple and Singh (2010)
Chemicals/wastewater
Use of more environmentally
friendly dyes, improvement of
water treatment
Kant (2012)
Ozturk et al. (2016)
Agnhage (2017)
Leather (in
footwear) Tanning Chrome-free tanning
Krishnamoorthy et al. (2013)
Zuriaga-Agustí et al. (2015)
Mutlu et al. (2014)
Cross-cutting
Extension of the
service life of products Longer life/reuse of products
Alkaya and Demirer (2014)
Laitala and Boks (2012)
Armstrong et al. (2015)
Niinimäki and Hassi (2011)
Castellani et al. (2015)
Recycling of product
components
Closed-loop or open-loop recycling
of materials (e.g. textiles)
WRAP (2011)
Björquist (2017)
Leonas (2017)
Vadicherla & Saravanan (2014)
Fluorine-free repellent
coatings
Use of fluorine-free repellent
coating (e.g. for furniture and
textiles)
Rabnawaz et al. (2015)
Lei et al. (2017)
Hill et al. (2016)

48
7. EU Ecolabel and GPP criteria on household goods and eco-
innovation scenarios on the BoP household goods
The EU Ecolabel is a key element of the EU Sustainable Product policy. It is in line with the
objectives of such policies and of the wider objectives within the EU2020 and the 7th
European Environmental Action Programme (EAP) as well as the Roadmap to a Resource
Efficient Europe. Thus, the EU Ecolabel Regulation should be considered in the context of
these wider policy initiatives of resource efficiency and the single market for green
products. EU Ecolabel is especially relevant since it is the only policy approach that explores
the total environmental impact of a product, identifying the key life cycle stages to be
addressed through the criteria and thereby also addressing the increasing global impact as
a result of EU production and, in particular, consumption. The life cycle approach is
becoming a cornerstone of environmental decision making, and the EU Ecolabel has led
the way in this respect. Other policy approaches, and evidence gathering, are moving to a
closer alignment with the EU Ecolabel’s approach.
The study on the Evaluation of the Implementation of the EU Ecolabel Regulation (EC,
2017b) stated the situation of EU Ecolabel and its relation with EU Policies and with respect
to market and consumption patterns.
It is recognised that continued pressure from consumption and production in the EU, as
noted in the latest State of the Environment Report from the EEA (EEA, 2015), means
there is a continuous need to improve the sustainability of that consumption and
production. The study also finds that the EU Ecolabel remains relevant as a tool that fulfils
the role of promoting goods and services at the top end of the market, an area that is
covered by other policy tools to a limited extent – although there is some overlap with the
Energy Label in some cases. For this reason, the EU Ecolabel should still be considered as
relevant in its objectives and in the issues it seeks to address. The EU Ecolabel supports
companies and consumers in their own efforts to produce and consume with less
environmental impact. The study on the Evaluation of the Implementation of the EU
Ecolabel Regulation confirms that there is still a need to further focus on sustainable
consumption and production, supporting the role of the EU Ecolabel and the issues
addressed (such as water, material consumption, hazardous materials, end of life, etc.).
The same study reported increasing trends from 2009 to 2015 in the number of products
and licenses for the product groups studied. Licenses were 1,015 in 2009 and 2,010 in
2015. The number of products, i.e. items on the market, has increased from 19,000 in
2011 to 44,000 in 2015 (it should be noted that one license could correspond to more than
one product, for instance, when there are different models of the same range of products).
Regarding the degree of awareness of the EU Ecolabel, a Eurobarometer survey in 2017
(Eurobarometer, 2017) recorded that more than half of EU citizens have seen or heard
about at least one EU Ecolabel. More than a quarter of respondents (27%) said that they
have seen or heard about the EU Ecolabel, while other country-specific labels presented a
high level of awareness in their countries of origin (the Nordic Swan, Bra Miljöval, the Blue
Angel, etc.). There is considerable variation between Member States in levels of awareness
of the EU Ecolabel. This is highest in Luxembourg (62%), France (61%), and Denmark
(51%), and lowest in Romania (13%), Bulgaria (14%), and the Czech Republic (16%).
Among those who are aware of at least one EU Ecolabel, 30% say they have bought a
product carrying the EU Ecolabel. Around one third of respondents (32%) say that EU
Ecolabels play an important role in their purchasing decisions, while a quarter (25%) say
that they do not. Among those respondents who have seen or heard about the EU Ecolabel
(27%), more than three-quarters (78%) trust that products carrying this label are
environmentally-friendly.
The evaluation study also found that consumers have a higher awareness of the EU
Ecolabel for beauty care and for cleaning products. This suggests that awareness is
product-specific, since these particular product groups have a direct impact on individual
human health and wellbeing, leading consumers to show a higher degree of interest in
their environmental impact as well as their health impact, which influences their purchasing

49
choices. This evaluation also identifies these products as typically everyday products that
can be bought in supermarkets or in a similar purchasing situation.
Green Public Procurement (GPP) or green purchasing is a voluntary instrument towards a
more resource-efficient EU economy. GPP focuses on Europe's public authorities as
consumers and the employment of their purchasing power to prioritize environmentally
friendly options. As major consumers, choosing goods, services and tenders with a lower
impact to the environment can make a relevant contribution to a sustainable EU
consumption and production. A key aspect of GPP is that enhancing green purchasing by
EU institutions can enhance the demand of sustainable goods and services thereby
stimulating eco-innovation.
The current EU Ecolabel and GPP criteria for the product groups that compose the BoP
household goods refer to the main issues identified as hotspot for each product group and
are based on the most important areas of improvements identified through literature
review and a workshop with relevant stakeholders. Even if identified with a different
approach, they form a good starting point for the selection of the areas of improvements
to be developed as scenarios of eco-innovation for the BoP household goods. Both EU
schemes (EU Ecolabel and GPP) are used to identify the areas of improvement for
household goods (Table 24). However, only EU Ecolabel is quantitatively evaluated in this
report with specific scenarios (see Chapter 8).
Among the sets of criteria currently available for the product groups in the basket, there
are some cross-cutting themes that are common to several types of products.
For detergents and personal care product, the main issue identified is the formulation of
the product itself, leading to requirements such as avoiding the use of fragrances, reducing
the use of antimicrobials (or substitution with pine oil) and biocides, reducing or avoiding
the use of phosphorus and phosphate and the choice of biodegradable surfactants, to
reduce the eutrophication potential. When bio-based ingredients are used, sustainable
sourcing of palm oil, palm kernel oil, and their derivatives shall be ensured. Other criteria
for detergents refer to the information and education of consumers, in order to avoid over
dosage (e.g. in case of concentrated products) and to reduce the amount of energy used
for heating the water during washing. Another issue considered is the type and size of
packaging.
For products that use cellulose as raw material (absorbent hygiene products and paper
products) the criteria focus on the pulp production process. Some of them refer to the
emissions to water and to air coming from chlorine bleaching (Adsorbable Organic Halogens
– AOX –, Chemical Oxygen Demand – COD –, phosphorus, sulphur and nitrogen oxides),
and suggest the use of Elemental Chlorine Free (ECF) pulp. Others are related to the
emissions coming from the use of additives, such as optical brighteners or wet strength
agents. The type and the amount of additives for paper making and de-inking of paper (for
recycling) are considered as well. For printed paper, the type of inks and solvents used for
printing becomes relevant, as well as the emissions of VOCs during the printing process.
Finally, due to the large impacts generated during the production of paper products, their
recycling is an important issue to be considered (even if the rate of recycling of paper at
the end of life is, on average, already quite high in the EU, i.e. around 60-70%).
Regarding the sustainable sourcing of materials, for all products that are wood-based (i.e.
products using cellulose, paper products, and furniture), the choice of wood coming from
sustainable managed forests is to be preferred. However, it has to be noted that the
certification of sustainable management of forests include criteria about issues that cannot
be captured by LCA (e.g. working conditions, illegal logging, employment of local workers,
effects on biodiversity and ecosystem services).
For furniture, other criteria about the materials used are more focused on the use of
hazardous substances for coating of metals, manufacturing of plastics (e.g. vinyl chloride
monomer), the heavy metal content in paints, primers and varnishes, and the use of flame

50
retardants for upholstered furniture (and mattresses). Emissions of formaldehyde and
VOCs during the use stage are also taken into account.
The use of organic cotton is suggested for products that include cotton textile as the main
or one of the raw materials, such as clothes, upholstered furniture, bed mattresses,
absorbent hygiene products, and footwear. The substitution of conventional cotton with
organic cotton might have relevant impact on the environmental profile of these products,
because the impact coming from agricultural activities are usually quite relevant in the
whole life cycle. The same could apply for products with leather components, because the
tanning process can be quite impacting, due to the use of chromium. Chrome-free tanning
can be an option to reduce the impacts due to the use of leather (e.g. in footwear). In
addition, the reduction of the amount of water used in the tanning process is mentioned
as a criterion for EU Ecolabel products.
Other criteria for footwear refer to the emissions to water from the production of leather,
textiles, and rubber, the use of hazardous substances in the manufacturing process (e.g.
adhesives), on the solutions to reduce the amount of raw materials used for a pair of shoes
and on the durability of the products.
Durability and life extension is a matter of concern also for textiles, together with the
energy use during the manufacturing of fibres and textiles, both natural and man-made
(e.g. scouring of wool, spinning and weaving of nylon and other fibres).
Table 24 reports the criteria mentioned before, the product groups and life cycle stage to
which they could be applied and discuss the feasibility of developing scenarios based on
these criteria.
Starting from the feasibility analysis reported in Table 24 and considering also the
relevance of some aspects that emerged as hotspot in the baseline analysis, a set of
scenarios testing EU Ecolabel criteria on some of the product groups included in the basket
has been developed. The selection of scenarios related to EU Ecolabel criteria is discussed
in chapter 8.

51
Table 24. Summary of EU Ecolabel and GPP criteria for the product groups included in the BoP, with specification of products and life cycle stage to
which the different criteria could be applied as well as the feasibility of implementation in the BoP model. The scenarios where the area of improvement has been applied are reported.
Area of improvementa Product groups Life cycle stage Comment Scenarios
Emissions to water Detergents/soap
and shampoos
Components
manufacture/ Use/EoL
Applicable. The topic can be addressed by one or more
scenarios, acting on the composition of the products, the dosage in the use stage, the type of waste water treatment.
5-8
Avoiding the use of fragrances
Detergents/soap and shampoos
Components manufacture
Not applicable. Fragrances are not included in the LCI model of the BoP, because there are no available datasets for LCI of
fragrances.
-
Reducing the use of antimicrobials (or substitution with pine oil) and biocides
Detergents/soap and shampoos
Components manufacture
Applicable. Possible scenario on improved formulation of products.
5-8
Reducing or avoiding the use of phosphorus and
phosphate
Detergents/soap and shampoos
Components manufacture
Applicable. Possible scenario on improved formulation of products.
5-8
Choice of biodegradable surfactants
Detergents Components manufacture
Applicable. Possible scenario on improved formulation of products.
7, 8
Sustainable sourcing of
palm oil, palm kernel oil and their derivatives
Detergents/soap
and shampoos
Components
manufacture
Not applicable. Issue that cannot be fully captured by LCA as
sustainable sourcing entails aspects beyond the environmental dimension.
-
Education of consumers Detergents/soap and shampoos
Use Applicable. The topic can be addressed by scenarios on consumers’ behaviour (e.g. reduction of product dose per use).
5-8
Packaging Detergents/soap and shampoos/footwear
Packaging Applicable. Possible scenario on concentrated formulation of products.
5-8
No chlorine bleaching Absorbent hygiene products/paper products
Components manufacture
Applicable. Possible scenario assuming 100% TCF pulp as input. 1
Emissions to water from pulp production
Absorbent hygiene products/paper
products
Components manufacture
Applicable to some extent. Some of the datasets used for modelling pulp production contain aggregated emissions, so that
it is not easy to identify correctly the ones to be modified in a possible scenario. In addition, ILCD method does not provide a CF for the aggregated flow “AOX”, so it would be difficult to account for the differences between processes with high AOX
emissions and lower AOX emission. A sensitivity analysis could be done, by using a proxy CF for AOX.
1
a Criteria with grey background present limitation or are not applicable in the current BoP model.

52
Table 24 (cont.). Summary of EU Ecolabel and GPP criteria for the product groups included in the BoP, with specification of products and life cycle stage
to which the different criteria could be applied as well as the feasibility of implementation in the BoP model. The scenarios where the area of improvement has been applied are reported.
Area of improvementa Product groups Life cycle stage Comment Scenarios
Use of additives (optical
brighteners or wet strength agents)
Absorbent hygiene
products/paper products
Production Not applicable. No optical brighteners are so far included in the
model of Absorbent Hygiene Products or paper products. Wet strength agents are included only in the model of toilet paper. A scenario on toilet paper without wet strength agents would not make sense, because the criterion is about avoiding wet
strength agents to improve recyclability (that is not an issue for toilet paper).
-
Excluding additives that are classified as hazardous substances and mixtures
Absorbent hygiene products/paper products
Production To be analysed further, to see if the way in which the LCI of the BoP is modelled can match the way in which the criteria are formulated.
-
Inks and solvents used for printing
Printed paper products
Production Applicable to some extent (e.g. for some of the solvents used for printing).
-
VOCs emissions during manufacturing
Printed paper products/Footwear
Production To be analysed further, to see if the way in which the LCI of the BoP is modelled can match the way in which the criteria are formulated.
-
Recycling of paper Printed paper
products
EoL Applicable. Possible scenario assuming higher share of de-inked
paper as input.
-
Wood/cellulose from sustainable managed forests
Absorbent Hygiene products/Furniture/ Paper products
Components manufacture
Not applicable. Issue that cannot be fully captured by LCA. -
Heavy metal content in paints, primers and
varnishes
Furniture Components manufacture
Applicable to some extent. Paints and varnishes in furniture products within the BoP household goods have been modelled
relying on background data (from ecoinvent database). Therefore, it is not straightforward to understand which input and emissions should be modified in a possible scenario.
-
Flame retardants Furniture/Bed mattresses
Production Applicable. However, it has to be noted that flame retardants are included only in the BoM of the sofa (upholstered seat) and
that the ones included are compliant with the EU Ecolabel
criteria.
-
Emissions of VOCs and formaldehyde during the use stage
Furniture Use Not applicable. The model of the BoP so far does not include any emissions in the use stage.
-
a Criteria with grey background present limitation or are not applicable in the current BoP model.

53
Table 24 (cont.). Summary of EU Ecolabel and GPP criteria for the product groups included in the BoP, with specification of products and life cycle stage
to which the different criteria could be applied as well as the feasibility of implementation in the BoP model. The scenarios where the area of improvement has been applied are reported.
Area of improvementa Product groups Life cycle stage Comment Scenarios
Use of hazardous
substances for coating of metals, manufacturing of plastics (e.g. vinyl chloride monomer)
Furniture Production Applicable to some extent. Metals and plastics in furniture
products within the BoP household goods have been modelled relying on background data (from ecoinvent database). Therefore, it is not straightforward to understand which inputs and emissions should be modified in a possible scenario.
-
Use of organic cotton instead of conventional one
Clothes, upholstered furniture, bed
mattresses, absorbent hygiene products and footwear
Components manufacture
Applicable. Possible scenario with organic cotton replacing conventional one.
-
Chrome-free tanning process
Footwear Components manufacture
Applicable to some extent. Possible scenario modelling the use of chrome-free tanning (e.g. vegetable tanning) instead of
chrome tanning. However, a full LCI of vegetable tanning process is not available in commercial databases, neither in publicly available sources (e.g. scientific literature or technical reports).
-
Reduction of water use in
the tanning process
Footwear Components
manufacture
Applicable. Possible scenario on water saving measures in
tanning process.
-
Lower material intensity Footwear Production Applicable to some extent. To model a scenario, specific expertise in the field is needed, to understand how dematerialization can be achieved while ensuring the same performance of the product.
-
Durability/ Reparability/Reusability
Clothes/Footwear Use/EoL Applicable. One or more scenarios on extended product life, second hand markets, etc.
3
Improve the share of products that are recycled at the EoL
All products EoL Applicable. Possible cross-cutting scenario. -
Reduce the impact of electricity used for manufacturing of fibres, textiles and clothes
Clothes Production Applicable. Possible scenario testing different energy mixes or electricity from renewable sources.
2
Use of recycled materials Clothes Components
manufacture
Applicable. Possible scenario testing textiles with recycled input
materials for clothes.
4
a Criteria with grey background present limitation or are not applicable in the current BoP model.

8. Scenarios of eco-innovation for the area of consumption
household goods
The selection of the scenarios for the BoP Household goods is based on the long list coming
from the literature review (Table 23) and the analysis of EU Ecolabel and GPP criteria (Table
24). Scenarios are selected only for products included in the BoP household goods. Priority
is given to:
— scenarios that are expected to address the most relevant hotspots identified in the
baseline (e.g. changing the electricity mix for the production phase of textile products
or using recycled fibres to produce textiles);
— scenarios able to simulate the effect of EU policies, especially if in relation to the
hotspots of the consumption sector, as emerged from the assessment of the BoP
baseline (e.g. for BoP household goods, a group of scenarios is related to the choice of
EU Ecolabel products with improved formulations, such as soaps, shampoos, and
detergents);
— scenarios related to changes in consumer behaviour, such as the reuse of products,
e.g. by reselling them in second hand shops.
8.1. Selection of scenarios on EU Ecolabel criteria
Starting from the analysis of the EU Ecolabel criteria presented in Table 24, a further
analysis of the potential improvement areas for three product groups (soaps and
shampoos, dishwasher and laundry detergents, and upholstered seats) has been done. The
analysis considered the results of the hotspot analysis done on the baseline scenario
(reference year 2010) of the BoP household goods and the results of the LCA studies done
for the base case scenarios considered in the background studies done for the selection of
the EU Ecolabel criteria19.
After the identification of the hotspots of each product group, different actions have been
detected in order to improve the environmental performance of the scenarios. The following
life cycle stages have been considered, in line with the baseline scenario: components
manufacture, production, logistics, packaging, use, and EoL. The proposed actions and
their potential application are summarised in Table 25.
The improvement potential has been defined taking as a basis the level of enhancement
(high, medium, or low) of each eco-innovation action identified for the different products.
This level has been defined by the authors, based on the following criteria:
— the relative relevance of that parameter in terms of environmental impacts and
potential savings, according to the LCA results for the base case scenario
— the feasibility of incorporating this eco-innovation measure in the product category,
due to technical, market and usability limitations related to each product typology
— the possibility of including this measure in the LCA modelling
The eco-design actions included in the EU Ecolabel as mandatory or optional requirement
have been selected to be analysed as improvement action of the baseline scenario. For the
improvement actions included in Table 25 which are not covered by EU Ecolabel criteria,
but which have been identified as having a medium and high improvement potential, some
sensitivity analyses have been performed. Based on the analysis presented before, it has
been decided to run scenarios that include the implementation of mandatory EU Ecolabel
criteria (for the actions that can be modelled in LCA and with the current life cycle inventory
of the baseline scenario). Sensitivity analyses have been run for those actions that are not
mandatory according to the EU Ecolabel criteria, but could still have an improvement
potential. Table 26 reports a summary of the scenarios and sensitivity analyses developed.
19 The full documentation of the preparatory work done for the selection of EU Ecolabel criteria can be found at:
http://susproc.jrc.ec.europa.eu/product_bureau/projects.html. Reference to specific documents used for the analysis are provided in the description of each scenario, presented in the following chapters.

55
Table 25. Potential innovation actions for the product groups considered.
Liquid soaps and shampoos
Dishwasher and laundry detergents
Upholstered Seat
Life cycle stage Eco-innovation actions Included in EU
Ecolabel Improvement
potential Included in EU Ecolabel
Improvement potential
Included in EU Ecolabel
Improvement potential
Components manufacture
Selection of more sustainable
ingredients/materials Yes. Mandatory Medium Yes. Mandatory Medium
Yes.
Mandatory High
Restriction of substances classified under hazard statements
Yes. Mandatory Medium Yes. Mandatory Medium Yes.
Mandatory Medium
Selection of local providers / ingredients / materials
No Low No Low No Low
Production
Reduction of energy and water consumption
No Medium No Medium No Medium
Reduction of emissions No Medium No Medium No Low
Intensification and improvement of efficiency of processes
No Low No Low No Low
Waste prevention /waste management No Medium No Medium No Medium
Clean manufacturing and environmental management
No Low No Low No Low
Packaging
Ecodesign on the packaging No Low No Low No Low
Elimination of packaging components Yes. Mandatory Low Yes. Optional High No Low
Reduction of weight Yes. Mandatory High Yes. Mandatory High No Low
Refilling systems Yes. Optional High No Low No -
Recycled content (increase % of cardboard packaging)
Yes. Optional Medium Yes. Optional High No Medium
Improvement of capacity / volume of the product
Yes. Optional Medium Yes. Optional High No -
Selection of sustainable materials No Low Yes. Optional High No Medium
Restriction of substances classified under hazard statements
Yes. Mandatory High Yes. Mandatory High No Low
Logistics
Reduction of weight transported (packaging)
No High No High No Medium
Local consumption (km0) No Low No Low No Low
Optimization of logistics and tertiary packaging
No Low No Low No Medium

56
Liquid soaps and shampoos
Dishwasher and laundry detergents
Upholstered Seat
Life cycle stage Eco-innovation actions Included in EU
Ecolabel Improvement
potential Included in EU Ecolabel
Improvement potential
Included in EU Ecolabel
Improvement potential
Use of less pollutant means of transport No Low No Low No Low
Use phase
Reduction of water consumption No Medium No High No Medium
Reduction of dosage: packaging ecodesign, awareness and fitness for use
No Medium Yes. Mandatory High No Medium
Reduction of energy consumption No Low Yes. Mandatory High No Low
Maintenance and cleaning activities No - No - No Low
Extension of lifespan of the product No - No - Yes.
Mandatory Medium
End of life
Wastewater treatment - hazardous substances in water
No Low No Low No Low
Recyclability of packaging - EU rates Yes. Mandatory High Yes. Mandatory High No High
Reduction of product losses- Design of packaging dosage system
Yes. Mandatory Medium No Low No -
Design for disassembly No - No - Yes.
Mandatory High
*Mandatory means that the product has to consider the action to be certified by EU Ecolabel. **Optional means that EU Ecolabel includes a criterion referring to this topic, however a product does not need to include the requirement to be certified by EU Ecolabel. (For references, see the section “rationale for building the scenario”, in the following chapters)
Legend: Action covered by EU Ecolabel criteria Action not covered by EU Ecolabel criteria
High Improvement potential Medium Improvement potential Low Improvement potential

57
Table 26. Summary of scenarios and sensitivity analyses performed on the BoP household goods.
Liquid soaps Shampoos Dishwasher detergents Laundry detergents Upholstered Seat
Components manufacture
Formulation according to criteria requirements included in EU Ecolabel
Formulation according to criteria requirements included in EU Ecolabel
Formulation according to criteria requirements included in EU Ecolabel
Formulation according to criteria requirements included in EU Ecolabel
Design according to EU Ecolabel criteria: design for a better recyclability
Production
Reduction of energy consumed during manufacturing process: 5%, 10% and 20% compared to the base-case
Reduction of energy consumed during manufacturing process: 5%, 10% and 20% compared to the base-case
Reduction of energy consumed during manufacturing process: 5%, 10% and 20% compared to the base-case
Reduction of energy consumed during manufacturing process: 5%, 10% and 20% compared to the base-case
Reduction of energy consumed during manufacturing process: 5%, 10% and 20% compared to the base-case
Packaging
Increase of the packaging capacity, reduction of material, and use of 20% of HDPE from recycled material
Increase of the packaging capacity, reduction of material, and use of 20% of HDPE from recycled material
Substitution of primary packaging with water-soluble plastic, 100% of cardboard from recycled material in secondary packaging
Increase of packaging capacity
Substitution of the plastic film packaging by a cardboard box
Packaging end of life
Improve recycling rates: for plastic packaging (60% and 100%) and for cardboard packaging (90% and 100%)
Improve recycling rates: for plastic packaging (60% and 100%) and for cardboard packaging (90% and 100%)
Improve recycling rates: for plastic packaging (60% and 100%) and for cardboard packaging (90% and 100%)
Improve recycling rates: for plastic packaging (60% and 100%) and for cardboard packaging (90% and 100%)
Improve recycling rates: for plastic packaging (60% and 100%) and for cardboard packaging (90% and 100%)
Logistics Use of Euro 6 lorries for transport
Use of Euro 6 lorries for transport
Use of Euro 6 lorries for transport
Use of Euro 6 lorries for transport
Use of Euro 6 lorries for transport
Use phase
10% dosage reduction 10% dosage reduction Reduction of dosage (5%), electricity (37%) and water (46%)
Reduction of dosage (7%) and electricity consumed (24%)
Lifespan extension: giving a second life of 2.1 years to the product
Reduction of water use (5% and 10%)
Reduction of water use (5% and 10%)
End of life
Improvement related with the water reduction during use and considering direct emissions to water
Improvement related with the water reduction during use
Improvement related to reduction of water use
Recycling rates improvement according to a better design for disassembly
Legend: Considered in eco-innovation action Considered in sensitivity analysis

58
8.2. List of the scenarios tested in the BoP household goods
Following the criteria presented before, a total of 10 scenarios have been selected and
modelled in the context of the BoP household goods. These scenarios include four scenarios
of eco-innovation strategies implemented to different life cycle stages of representative
products (see Table 24 in section 7):
— Scenario 1 – Larger use of Totally Chlorine Free (TCF) pulp in paper products and
sanitary products
— Scenario 2 – Reducing the impact of electricity use in the textile sector
— Scenario 3 – Improving reuse (second-hand products)
— Scenario 4 – Using textiles with recycled input materials for clothes manufacturing
Six of the scenarios focus on the eco-innovations supported by the EU Ecolabel criteria (as
described in Table 26 in section 8.1). While five of them evaluate the implementation of
these criteria to a specific product, a scenario including all the EU Ecolabel scenarios is also
assessed:
— Scenario 5 – EU Ecolabel scenario on liquid soap
— Scenario 6 – EU Ecolabel scenario on shampoo
— Scenario 7 – EU Ecolabel scenario on dishwasher detergent (DD)
— Scenario 8 – EU Ecolabel scenario on laundry detergent (LD)
— Scenario 9 – EU Ecolabel scenario on upholstered seat
— Scenario 10 – Overall potential from the analysed EU Ecolabel scenarios
Regarding the scenarios on the EU Ecolabel, these scenarios evaluate the effect of the EU
Ecolabel at the single product level and the potential effect to the environmental impacts
of the whole BoP household goods. It is not in scope of this assessment to evaluate the
overall effect of the EU Ecolabel scheme.

59
8.3. Scenario 1 – Larger use of Totally Chlorine Free (TCF) pulp in
paper products and sanitary products
Description and aim:
This scenario aims at testing the influence of replacing elemental chlorine free (ECF) with
totally chlorine free (TCF) pulp in paper products and in sanitary products that contain
pulp.
Area of intervention:
— Hotspot addressed: emissions coming from the use of chlorine in pulp bleaching.
— Product groups: Paper products and sanitary products
— Life cycle stage: component manufacture
Policy relevance: EU Water Framework Directive (EC, 2000).
Rationale for building the scenario:
The use of chlorine as an additive for sulphate (or kraft) pulp bleaching, and the related
emission of chlorinated organic compounds to water is one of the environmental hotspots
of the pulp and paper industry (see Section 4.3). It may affect the environmental profile
of paper products and, more generally, of products that contain pulp as raw material of
the product. For the BoP household goods, this is the case of sanitary and paper products.
In the EU, chlorine (Cl2) and hypochlorite (e.g. NaOCl) have been phased out as primary
bleaching chemicals in recent years. According to EC-JRC (2015), the two main types of
bleaching methods in use in the EU are elemental chlorine free (ECF), i.e. when no
molecular or gaseous chlorine is used in the bleaching, and totally chlorine free (TCF)
bleaching. All ECF mills use chlorine dioxide in the bleaching sequences and in a few cases
also ozone, alkali for the extraction of the dissolved lignin, and peroxide and oxygen for
the reinforcement of the extraction stages. TCF bleaching uses oxygen, ozone or peracetic
acid and peroxide with alkali for lignin extraction. Both methods are predominant in EU
pulp production. Since the beginning of the 1990s, TCF bleaching has become the
predominantly used bleaching method in EU sulphite pulp mills (EC-JRC, 2015). On the
contrary, ECF is by far the most common bleaching method (around 90% of the market)
used for sulphate pulp production in the EU.
The TCF scenario aims at modelling the effects of a complete substitution of ECF sulphate
(kraft) pulp with TCF sulphate (kraft) pulp in the representative products of the BoP
household goods (namely in paper products and in sanitary products).
Parameters modified in the model:
To model the assumption of 100% substitution of ECF kraft pulp with TCF kraft pulp, the
ecoinvent dataset “Sulfate pulp {country or region}| production, elementary chlorine free
bleached” used in the baseline model was substituted with the correspondent ecoinvent
dataset for TCF pulp, “Sulfate pulp {country or region}| production, totally chlorine free
bleached”. The quantity of the pulp input has not been modified.
The substitution has been applied to:
— Kraft pulp used to produce graphic paper (in the LCI of the book and of the newspaper)
— Kraft pulp used to produce tissue paper (in the LCI of toilet paper)
— The share of bleached kraft pulp included in the dataset for the global market average
of kraft pulp (“Sulfate pulp {GLO}| market for”) used in the LCIs of sanitary products.
The different environmental profiles of the datasets employed in the baseline (Sulfate pulp,
ECF bleached) and in this scenario (Sulfate pulp, TCF bleached) are further discussed in
the results (Figure 10).

60
Results:
The comparison between the baseline and the scenario TCF applied to the whole BoP (i.e.
applying the substitution to all the products that contain bleached kraft pulp) shows a slight
reduction of impact (less than 1%) in most of the impact categories and an increase of the
impact due to particulate matter emissions (+3.6%) and due to land use (+0.3%) (Table
27). The reason of this difference is that the two bleaching methods (ECF and TCF) do not
differ only for the type and amount of the bleaching agent, but also for other parameters
of the process such as the energy use and the related emissions, which are higher for TCF
than for ECF.
Table 27. Comparison between the baseline scenario (consumption and use of household goods in the baseline year 2010 by an average EU citizen) and the scenario TCF.
Impact category Unit Baseline Scenario
TCF
Variation
(%)
Climate change kg CO2 eq 1.39E+03 1.39E+03 -0.4
Ozone depletion kg CFC-11 eq 1.13E-04 1.13E-04 -0.1
Human toxicity, non-cancer CTUh 1.87E-04 1.87E-04 0.1
Human toxicity, cancer CTUh 4.75E-05 4.71E-05 -0.7
Particulate matter kg PM2.5 eq 1.14E+00 1.18E+00 3.6
Ionizing radiation, effects on
human health (HH) kBq U235 eq 8.89E+01 8.87E+01 -0.2
Photochemical ozone
formation kg NMVOC eq 4.13E+00 4.11E+00 -0.6
Acidification molc H+ eq 8.16E+00 8.14E+00 -0.2
Terrestrial eutrophication molc N eq 1.63E+01 1.62E+01 -0.6
Freshwater eutrophication kg P eq 1.13E-01 1.13E-01 -0.1
Marine eutrophication kg N eq 2.28E+00 2.27E+00 -0.4
Freshwater ecotoxicity CTUe 1.72E+03 1.72E+03 -0.3
Land use kg C deficit 4.30E+03 4.31E+03 0.3
Water resource depletion m3 water eq 1.08E+02 1.08E+02 -0.1
Resource depletion kg Sb eq 1.47E-01 1.47E-01 -0.2
It is worthy to note that the major improvement from the TCF process compared to a
chlorine based bleaching or an ECF bleaching is expected on the freshwater ecotoxicity
impact category, thanks to the reduction of emissions of AOX to water. However, the ILCD
method does not include a CF for the generic elementary flow “Adsorbable Organic
Halogens (AOX)”, but only for specific substances that are included in this group. On the
contrary, the datasets representing the inventory of resources and emissions of the pulp
production process usually include the generic flow for AOX, because a specific breakdown
of substances is not available from the production plants. Therefore, the emission of AOX
(and the related reduction in the TCF scenario) is not taken into account in the results
presented in Table 27.
To overcome this limitation of the method, a CF was calculated for AOX. The proposed CF
is a weighted average of CFs for single AOX compounds already included in ILCD, weighted
according to the composition of AOX emissions from the pulp and paper industry, as
provided by INFRAS (1998). Details of the calculation are summarized in Table 28.
Table 28. Input data used for the calculation of a freshwater ecotoxicity CF for AOX emissions to water from pulp and paper production.
Main compounds in
AOX from pulp and
paper production
(INRAS, 1998)
Amount of compound
(kg) in 1 kg of AOX
emitted (INRAS, 1998)
CF in ILCD
(CTUe/kg)
Calculated
weighted CF
(CTUe/kg)
4-chlorobenzenamine 0.850 5.42E+03
4.65E+03 1,2-dichlorobenzene 0.075 4.40E+01
1,2,3-trichlorobenzene 0.075 5.59E+02

61
Table 29 reports the results of the TCF scenario compared to the baseline assessed using
the ILCD method with the additional CF for AOX. When the emission of AOX is taken into
account at the impact assessment phase, the reduction of freshwater ecotoxicity impact
increases from -0.3% to -2.5%. However, the improvement in the environmental profile
of the whole BoP is still limited and the increase in the impact of particulate matter emission
remains larger than the reduction of ecotoxicity.
Table 29. Results of the comparison between the baseline and the scenario TCF assessed using ILCD with the additional CF for AOX.
Impact category Unit Baseline Scenario
TCF
Variation
(%)
Climate change kg CO2 eq 1.39E+03 1.39E+03 -0.4
Ozone depletion kg CFC-11 eq 1.13E-04 1.13E-04 -0.1
Human toxicity, non-cancer CTUh 1.87E-04 1.87E-04 0.1
Human toxicity, cancer CTUh 4.75E-05 4.71E-05 -0.7
Particulate matter kg PM2.5 eq 1.14E+00 1.18E+00 3.6
Ionizing radiation kBq U235 eq 8.89E+01 8.87E+01 -0.2
Photochemical ozone formation kg NMVOC eq 4.13E+00 4.11E+00 -0.6
Acidification molc H+ eq 8.16E+00 8.14E+00 -0.2
Terrestrial eutrophication molc N eq 1.63E+01 1.62E+01 -0.6
Freshwater eutrophication kg P eq 1.13E-01 1.13E-01 -0.1
Marine eutrophication kg N eq 2.28E+00 2.27E+00 -0.4
Freshwater ecotoxicity CTUe 1.77E+03 1.73E+03 -2.5
Land use kg C deficit 4.30E+03 4.31E+03 0.3
Water resource depletion m3 water eq 1.08E+02 1.08E+02 -0.1
Resource depletion kg Sb eq 1.47E-01 1.47E-01 -0.2
Figure 9 shows the same results of Table 29, highlighting the contribution per product
group and per life cycle stage. As shown in the figure, the scenario has a limited effect, as
only the production phase of paper products (where the substitution takes place) is
affected. The Scenario 1 affects sanitary and paper products, which contribute to 30.1%
of the normalized impact of the baseline BoP household goods.

62
Figure 9. Scenario 1 in comparison with the baseline scenario (with total from the baseline set as
100%): split into the contributions of (a) the various product groups and (b) the life cycle stages. Method: ILCD with the additional CF for AOX.
Abbreviations: GWP (Climate change), ODP (Ozone depletion), HTP nc (Human toxicity, non-cancer effects), HTP c (Human toxicity, cancer effects), PMFP (Particulate matter), IRP (Ionizing Radiation HH), POFP (Photochemical ozone formation), AP (Acidification), TEP (Terrestrial eutrophication), FEP (Freshwater eutrophication), MEP (Marine eutrophication), FETP (Freshwater ecotoxicity), LU (Land use), WRD (Water resource depletion), RD (Mineral, fossil & renewable resource depletion), all from the ILCD v1.08 method (EC-JRC, 2011).

63
The results for the whole BoP household goods are influenced also by the amount of paper
products and sanitary products bought by an average citizen in one year, compared to the
quantity of other representative products in the BoP. Therefore, the same comparison is
run considering a single unit of two products affected by the scenario, namely baby diaper
and newspaper. Results are presented in Table 30 and Table 31.
Table 30. Results of the comparison between 1 baby diaper as it is in the baseline and 1 baby diaper in the scenario TCF (using ILCD with the additional CF for AOX).
Impact category Unit Diaper in
baseline
Diaper in
scenario TCF
Variation
(%)
Climate change kg CO2 eq 6.68E+00 6.66E+00 -0.2
Ozone depletion kg CFC-11 eq 5.55E-07 5.55E-07 -0.1
Human toxicity, non-cancer CTUh 4.77E-07 5.00E-07 4.8
Human toxicity, cancer CTUh 6.68E-08 6.56E-08 -1.8
Particulate matter kg PM2.5 eq 5.55E-03 5.72E-03 3.1
Ionizing radiation, effects on
human health (HH) kBq U235 eq
4.48E-01 4.47E-01 -0.2
Photochemical ozone
formation kg NMVOC eq
1.76E-02 1.75E-02 -0.5
Acidification molc H+ eq 3.30E-02 3.29E-02 -0.2
Terrestrial eutrophication molc N eq 5.68E-02 5.65E-02 -0.6
Freshwater eutrophication kg P eq 4.14E-04 4.16E-04 0.6
Marine eutrophication kg N eq 6.12E-03 6.09E-03 -0.6
Freshwater ecotoxicity CTUe 4.64E+00 4.63E+00 -0.2
Land use kg C deficit 1.15E+01 1.16E+01 0.4
Water resource depletion m3 water eq 3.79E-01 3.79E-01 -0.1
Resource depletion kg Sb eq 5.04E-04 5.03E-04 -0.2
Most of the impact categories show a decrease, although some trade-offs are present. In
the case of baby diaper, human toxicity, non-cancer shows the largest increase (4.8%)
due higher emissions of zinc to soil in the TCF scenario (Table 30). Regarding the
newspaper, the largest increase is found in particulate matter, where the TCF shows a
large foreground emission of PM<2.5m to air (Table 31).
Table 31. Results of the comparison between 1 newspaper as it is in the baseline and 1 newspaper
in the scenario TCF (using ILCD with the additional CF for AOX).
Impact category Unit Newspaper
in baseline
Newspaper
in scenario
TCF
Variation
(%)
Climate change kg CO2 eq 2.19E+00 2.16E+00 -1.4
Ozone depletion kg CFC-11 eq 2.74E-07 2.74E-07 -0.3
Human toxicity, non-cancer CTUh 2.91E-07 2.91E-07 -0.2
Human toxicity, cancer CTUh 2.24E-08 2.03E-08 -9.2
Particulate matter kg PM2.5 eq 1.31E-03 1.56E-03 18.9
Ionizing radiation, effects on
human health (HH) kBq U235 eq
1.76E-01 1.76E-01 -0.5
Photochemical ozone
formation kg NMVOC eq
6.19E-03 6.04E-03 -2.3
Acidification molc H+ eq 1.13E-02 1.12E-02 -1.0
Terrestrial eutrophication molc N eq 2.06E-02 2.00E-02 -2.9
Freshwater eutrophication kg P eq 1.46E-04 1.46E-04 -0.4
Marine eutrophication kg N eq 2.56E-03 2.50E-03 -2.3
Freshwater ecotoxicity CTUe 2.68E+00 2.41E+00 -10.1
Land use kg C deficit 7.83E+00 7.91E+00 1.0
Water resource depletion m3 water eq 1.33E-01 1.32E-01 -0.5
Resource depletion kg Sb eq 3.68E-04 3.66E-04 -0.4

64
The reduction of impacts on freshwater ecotoxicity and other impact categories and the
increase of the impact from particulate matter emissions are larger for the newspaper than
for the baby diaper. This is due to the higher share of EFC pulp over the total amount of
kraft pulp contained in the newspaper compared to the one in the diaper.
In fact, 99.7% of the kraft pulp contained in the newspaper is ECF bleached (the remaining
is either TCF bleached or unbleached), whereas only 25.3% of the kraft pulp in the diaper
is ECF bleached (and the remaining, and larger, part is either TCF or unbleached).
Consequently, the substitution of ECF with TCF pulp in the newspaper has a larger effect
on the environmental profile of the newspaper compared to the effect on the diaper.
As a further analysis, Figure 10 reports the results of the assessment of 1 kg of pulp
produced with the two bleaching methods (ECF and TCF) and without any bleaching. The
results confirm the trends already emerged from the previous analyses: avoiding the use
of chlorine for bleaching significantly reduces the impacts on freshwater ecotoxicity. On
the contrary, the emissions of particulate matter (PM) are higher if the bleaching is reduced
or excluded from the production process. This could be because the bleaching process is
generally coupled with the recovery of lignin and chemicals as black liquor, which is burned
in a closed loop in the pulp mill and contributes to reduce the need of heat and electricity
provided by external sources and to reduce the emissions of PM of the overall process.
In conclusion, the use of TCF bleaching in substitution to ECF bleaching allows for reducing
the impact in most of the impact categories considered (and especially on freshwater
ecotoxicity). However, it also generates additional impacts on other impact categories
(mainly particulate matter, but also ionizing radiation and acidification), which are more
influenced by the effect of the increased energy need coming from this type of bleaching
process. Therefore, the use of a more sustainable energy mix, e.g. with a higher share of
renewable energy sources and a reduced intensity in emission of particulate matter, could
help to improve the environmental profile of the TCF pulp production process.
Figure 10. Results of the comparison between 1 kg of pulp not bleached, 1 kg of ECF pulp, and 1 kg of TCF pulp (using ILCD with the additional CF for AOX).
(For the abbreviations of the names of impact categories see note to Figure 9)

65
It is worthy to mention that the current set of criteria for the EU Ecolabel of paper products
include a mandatory requirement of avoiding the use of chlorine gas as a bleaching agent
(i.e. to use ECF pulp), but no mandatory requirement for TCF pulp.
Other options for chlorine free bleaching have been analysed in the scientific literature. An
example is the use of enzymes. The use of laccase or xylanases in the bleaching process
could help to reduce the environmental impacts coming from this stage of the pulp process
(Fu et al., 2005; Monje et al., 2010) and it has already been incorporated in the bleaching
sequences of some pulp mills (Bajpai, 2004). However, this technology is not widespread
among pulp mills and ECF pulp bleaching is still the most used process for chemical pulping
(AkzoNobel, 2017). In fact, there could be some critical challenges before this enzyme can
be fully implemented for pulp bleaching at the industrial scale, such as the costs of
production of those enzymes at large scale, the current low production efficiency and the
cost of mediators used in the process (Singh et al., 2015; Fillat et al., 2017).

66
8.4. Scenario 2 – Reducing the impact of electricity use in the
textile sector
Description and aim:
These two scenarios (2a/2b) aim at testing some options to reduce the impact of the
electricity used in manufacturing textiles and clothes, by using more environmentally
sustainable energy mixes, including a higher share of electricity from renewable sources.
Area of intervention:
— Hotspot addressed: impacts from electricity use in the manufacturing of textiles and
clothes
— Product group: Clothes (Textile products)
— Life cycle stage: production
Policy relevance: Energy efficiency directive (EC 2012) and resource efficiency directive
(EC 2011).
Rationale for building the scenario:
The assessment of the baseline highlighted the use of electricity during the phases that
transform the raw fibres into textiles (spinning, yarning, texturizing, etc.) as one of the
hotspots of the BoP household goods (especially for t-shirts). This affects especially the
impact categories climate change, particulate matter, acidification, and water resource
depletion and it is partly because most of the clothes that are bought by EU citizens are
produced outside the EU, in countries where the electricity mix has larger shares of coal
and oil and, hence, generate larger environmental impacts.
The scenario tests the effects of using the EU electricity mix, i.e. assuming that textiles
and clothes are produced in the EU rather than imported from abroad, and of using an
electricity mix with a larger share of electricity coming from renewable sources. In the
present scenario, this assumption was applied only to the production of textiles, because
the use of electricity mixes that are more impacting than the EU one emerged as a hotspot
in the assessment of the baseline scenario. However, the effect of the same change applied
to all the product groups in the BoP could be analysed as well.
Parameters modified in the model:
In the BoP model, the production phase of representative textile products (t-shirt, blouse,
trousers, and jeans) includes the following uses of electricity: electricity for spinning;
electricity for texturizing of synthetic yarns; electricity for knitting and dyeing of textiles;
and electricity for cutting and sewing of final product. The electricity mixes included in the
baseline model for these activities represent the real conditions of the production sites, as
reported in section 3.2.4. (Table 6).
In the scenario on the EU electricity mix (scenario 2a), all the electricity used in the
production phases mentioned before is modelled with the ecoinvent dataset for the average
European electricity mix, i.e. “Electricity, low voltage {Europe without Switzerland}|
market group for”. In the scenario on a larger share of electricity produced from renewable
sources (scenario 2b), the expected mix for the gross electricity generation by source in
the year 2030, based on the EC’s report “EU Reference Scenario 2016 – Energy, transport
and GHG emissions Trends to 2050” (EC, 2016), is used. The electricity mix EU 2030 has
been modelled in the context of the scenario modelling for the BoP appliances (Reale et
al., 2019), as described below. The same dataset is substituted to the electricity mixes
used for textile production in the model of the BoP household goods, as described before
for the scenario “EU mix”.
Based on the general modelling structure of the electricity sector within ecoinvent version
3 (described in Treyer and Bauer 2016), market datasets for the various voltage levels
(i.e. high, medium, and low) have been established. With the exception of “solar” and
“waste” sources, all other production activities are linked to the high voltage market. For

67
“waste”, this is done on the medium voltage level, while “solar” production is modelled as
electricity, low voltage, from various types of photovoltaics installations. For the
subsequent transformation from high to medium and then to low voltage, the parameters
from the current German electricity mix datasets in ecoinvent are used. In total, this leads
to the following five new datasets for such a future electricity mix in the EU, the first
dataset of which will be the linking element to the examined scenarios in this study:
— market for electricity 2030, low voltage/EU-28
— electricity 2030 voltage transformation, from medium to low voltage/EU-28
— market for electricity 2030, medium voltage/EU-28
— electricity 2030 voltage transformation, from high to medium voltage/EU-28
— market for electricity 2030, high voltage/EU-28
The resulting electricity mix EU 2030 and related datasets used for modelling are reported
in Table 32.

68
Table 32. Electricity mix of the European electricity market dataset and the expected 2030 EU electricity mix based on the EU Reference Scenario 2016
(EC, 2016).
Energy source
European electricity market(1)
2030 expected gross electricity
generation(2) Used dataset for 2030 mix (3)
% GWhe %
Nuclear energy 31.3 777,743 22.0 Electricity production, nuclear, pressure water reactor/FR
Solids 26.7 562,741 16.0 Electricity production, hard coal/DE and Electricity production, lignite/DE (4)
Oil (incl. refinery gas) 2.4 19,341 0.5 Electricity production, oil/DE
Gas (incl. derived gas) 18.8 654,930 18.6 Electricity production, natural gas, combined cycle power plant/DE
Biomass-waste 3.0 283,469 8.0 Electricity out of heat and power co-generation, biogas, gas engine/DE and Electricity out of heat and power co-generation, wood chips, 6667 kW, state-of-the-art 2014/DE and Electricity, from municipal waste incineration to generic market/DE (5)
Hydro (pumping) 0.9 - -
Hydro
(no pumping) 6.6 378,979 10.7
Electricity production, hydro, reservoir, alpine region/ CH and Electricity production, hydro, river-of-
river/CH (6)
Wind 6.7 608,460 17.3 Electricity production, wind, >3MW turbine, onshore/ DE and Electricity production, wind, 1-3MW turbine, offshore/DE (7)
Solar 3.4 232,129 6.6 Electricity production, photovoltaic, 3kWp slanted-roof installation, multi-Si, panel mounted/DE and Electricity production, photovoltaic, 3kWp slanted-roof installation, single-Si, panel mounted/DE and Electricity production, photovoltaic, 570kWp open ground installation, multi-Si/DE (8)
Geothermal (& others) 0.2 9,736 0.3 Electricity production, deep geothermal/DE
(1) Calculated considering the 60% of the share of the European without Switzerland dataset (Germany, France, United Kingdom, Italy, Spain, and Ukraine). (2) Values for EU28 for the year 2030. Source: European Commission 2016. (3) Data from the background database ecoinvent v3.2. Due to a lack of respective average data for Europe, the here mentioned “national” datasets have been chosen as
respective proxy for an “average” European dataset. (4) Based on the EU Power Statistics 2015 spreadsheet, 49% Hard Coal and 51% Lignite are expected in 2030 (Source: http://www.eurelectric.org/factsdb/). (5) Based on the EU Power Statistics 2015 spreadsheet, 49% Biomass (here represented by the “wood” dataset), 36% Biogas & Bioliquids (“biogas” dataset) and 15% from
Waste incineration (“waste” dataset) are expected in 2030 (Source: http://www.eurelectric.org/factsdb/).
(6) Based on the EU Power Statistics 2015 spreadsheet, 65% Reservoir and 35% Run-of-River are expected in 2030 (Source: http://www.eurelectric.org/factsdb/). (7) Based on the EU Power Statistics 2015 spreadsheet, 73% Onshore and 27% Offshore Production of Wind electricity are expected in 2030 (Source:
http://www.eurelectric.org/factsdb/). (8) According to the EU Power Statistics 2015 spreadsheet, also 2030 less than 0.5% of solar-based electricity is expected to be produced in concentrated solar plants (CSP);
hence, here 100% PV-based production is assumed – split (based on the outlook for 2030 in IEA 2010 and the modelling of PV in this study here) in 34% open ground, 31% Mono-Si and 35% Multi-Si (Source: http://www.eurelectric.org/factsdb/).

69
Results:
When the two alternative electricity mixes are used for textile production (assuming that
textile production would happen in the EU), the impact on most of the impact categories
considered is reduced compared to the baseline scenario (Table 33, Figure 11). The effect
of this substitution on the impact of the whole BoP household goods is proportional to the
contribution of textile production activities to the overall impact of the BoP, as illustrated
in section 4.
Table 33. Results of the comparison between the baseline and scenarios 2a and 2b.
Impact category
Unit Baseline Scenario
2a Variation
(%) Scenario
2b Variation
(%)
Climate change kg CO2 eq
1.39E+03 1.31E+03 -6.3 1.28E+03 -8.3
Ozone depletion kg CFC-11 eq
1.13E-04 1.19E-04 5.1 1.18E-04 4.5
Human toxicity, non-cancer
CTUh 1.87E-04 1.86E-04 -0.6 1.85E-04 -1.2
Human toxicity, cancer
CTUh 4.75E-05 4.75E-05 0.0 4.71E-05 -0.8
Particulate matter
kg PM2.5 eq
1.14E+00 8.93E-01 -21.5 8.72E-01 -23.4
Ionizing
radiation, effects on human health (HH)
kBq U235 eq
8.89E+01 9.71E+01 9.3 9.13E+01 2.8
Photochemical ozone formation
kg NMVOC
eq
4.13E+00 3.84E+00 -7.1 3.74E+00 -9.5
Acidification molc H+ eq
8.16E+00 7.51E+00 -7.9 7.16E+00 -12.2
Terrestrial eutrophication
molc N eq
1.63E+01 1.52E+01 -6.8 1.48E+01 -8.8
Freshwater eutrophication
kg P eq 1.13E-01 1.13E-01 0.0 1.10E-01 -2.7
Marine eutrophication
kg N eq 2.28E+00 2.18E+00 -4.3 2.15E+00 -5.6
Freshwater ecotoxicity
CTUe 1.72E+03 1.72E+03 -0.1 1.71E+03 -0.5
Land use kg C deficit
4.30E+03 4.29E+03 -0.3 4.29E+03 -0.3
Water resource depletion
m3 water eq
1.08E+02 1.08E+02 0.3 1.05E+02 -2.4
Resource depletion
kg Sb eq 1.47E-01 1.50E-01 1.9 1.52E-01 3.3
The highest reduction (about 23%) is obtained for particulate matter impact, due to the
substitution of the Chinese and Indian electricity mixes, which include a high share of
electricity from coal. The use of EU mix and EU mix 2030 for textile production leads also
to a reduction of climate change impact, up to 8% in the case of EU mix 2030. Impacts on
human toxicity (non-cancer effects), photochemical ozone formation, acidification,
eutrophication (terrestrial, marine, and freshwater) and freshwater ecotoxicity are reduced
as well. The lowest reduction happens for land use (less than 1%), whereas acidification is
reduced by 8% in the case of the EU mix and by 12% in the case of EU mix 2030. Scenario
2a (EU mix) shows no decrease in human toxicity, cancer, and freshwater eutrophication.
On the contrary, the two scenarios show a slight increase of the impact on ozone depletion,
ionizing radiation, and resource depletion; and employing the EU mix is also related to a
slight increase in water resource depletion. The increase in ionising radiation is due to the
higher share of nuclear energy compared to the energy mix used in the baseline.
Additional impacts are generated also for resource depletion (greater for the EU mix 2030
than for the EU mix). In order to better analyse the effect of the scenarios on fossil and

70
mineral resources, the same inventory was characterized also using CML-IA method v. 4.8
as implemented in the EF 3.0 method presented before (Figure 11). This method applies
the abiotic depletion (ADP) concept, as it is in the version recommended in the ILCD
method, but considering the contribution of energy carriers and mineral and metal
resources separately. In addition, it takes the crustal content as reference for the
calculation of the ADP, instead of the reserve base, as it is in the version recommended in
the ILCD method.
Results of this sensitivity analysis (included in Figure 11 as FRD and MRD) show that the
two alternative electricity mixes contribute to reduce the impact on fossil resources, but
cause an increased impact on mineral and metal resources. A contribution analysis
highlighted that this is mainly due to the use of zinc in the infrastructure of German heat
and power co-generation from biogas, which is part of the EU electricity mix (with different
shares in the EU mix and in the EU mix 2030).

71
Figure 11. Scenario 2a (EU mix) and scenario 2b (EU mix 2030) in comparison with the baseline scenario (with total from the baseline set as
100%) - split into the contributions of (a) the various product groups and (b) the life cycle stages.
(For the abbreviations of the names of ILCD impact categories see note to Figure 9; additional impact categories from CML-IA method: FRD: fossil resource depletion, MRD: mineral and metal resource depletion)

72
8.5. Scenario 3 – Improving reuse (second-hand products)
Description and aim:
The scenario aims at assessing potential effects of the promotion of reuse practices (e.g.
through donation at a charity organization or selling to second hand shops). The scenario
focuses on textile products (clothes) and furniture.
Area of intervention:
— Hotspot addressed: impacts from the production of textiles and furniture.
— Product groups: clothes and furniture.
— Life cycle stage: EoL by adding a further use phase, before sending the product to final
EoL scenario.
Policy relevance: Circular economy package (EC 2015).
Rationale for building the scenario:
In this scenario it is assumed that a share of the textile and furniture products that are
purchased by an average EU citizen (i.e. which are part of the F.U. of the BoP household
goods) is reused by other users, before getting to the EoL scenario modelled in the baseline
(Table 34).
Table 34. EoL scenario for textiles and furniture, as assumed in the baseline of the BoP household goods.
Textiles Furniture
Treatment Share (%) Treatment Share (%)
Landfilling 52 Landfilling 55
Incineration 37 Incineration 45
Recycling, of which: 87% as rags 13% as insulation material (in substitution of rock wool)
11, of which: 9.6 (rags) 1.4 (insulation material)
The reuse of products as second-hand items entails both the prolongation of the lifetime
of that product and any additional activity needed to ensure the reuse, such as the
transport of the product from the first user to the second one or from the first user to a
second-hand shop and then to the second user.
As explained in section 3.1, the F.U. of the BoP household goods is composed by the
number of items purchased in one year, calculated as apparent consumption per person
per year. This means that the baseline model does not include explicitly the duration of the
product as number of years for which that product is owned by the consumer. In fact, the
F.U. does not consider the stock of products (e.g. T-shirts) owned by a citizen, but only
the amount of new product purchased every year. The lifetime of the products is implicitly
included in that number: in fact, if on average a product is lasting more years than another
(as it could be the case for a wardrobe compared to a T-shirt), the number of new items
purchased every year is most probably lower than for a less lasting product.
The way in which the baseline scenario is modelled allows for a more robust definition of
the F.U. (because the apparent consumption can be easily calculated from statistics,
without the need to make an assumption for the average lifetime of products). However,
this specific feature limits the possibility to model reuse simply as an increase in the
number of years for which the product is used. Therefore, a different approach needs to
be considered.
The rationale applied to model the scenario is based on the methodology proposed by
WRAP (2011) and further developed by Castellani et al. (2015) to calculate the potential
environmental benefits of reuse through second-hand shops. The study by Castellani et al.
(2015) assumes that, in case the item sold as second-hand product is bought to substitute

73
the purchase of a new item, this has two main effects: an additional impact coming from
the transport to the second-hand user and an avoided impact from the production of a new
item (i.e. avoided impact of life cycle phases up to the retail and transport to client) (Figure
12). However, considering a full substitution (i.e. a substitution ratio of 1:1, re-used
product : new product) is a limited approach when assessing the environmental benefits
of re-use (second-hand) strategies.
Figure 12. Avoided impacts and additional impact coming from the reuse of products.
Source: Castellani et al. (2015).
In the present study, the additional transport of the reused product from the first user to
the second one is modelled in the use phase of the reused product. The avoided impact of
the first stages of the life cycle, thanks to the reuse of a share of products bought by
citizens, is modelled as a reduction of the impacts in the first stages of the life cycle of the
product.
Figure 13 compares the life cycle stages in the baseline and in scenario 3, which includes
a share of products that are reused. In Figure 13a) a conventional life cycle for a product
in the BoP household goods is depicted, from components manufacture to the EoL. When
calculating the inventory of BoP household goods, the inventory of a reference product, as
illustrated here, is multiplied by the quantity of new products of that type that are bought
in one year (apparent consumption) to calculate the reference flow. In Figure 13b) it
assumed (as an example) that 15% of the new products bought by EU citizens follow a
slightly different route, with the addition of a “second-life” before the EoL. As explained
before, this implies an additional transport compared to the conventional route, because
the product needs to be transferred from the first user to the second one (either directly
or through a reseller, e.g. a second-hand shop). In case the second-hand product fully
substitutes the purchase of a new one, the avoided production of a new product (up to the
purchase, i.e. including the logistics) should be included in the modelling. In scenario 3,
this is done by reducing the amount of the upstream phase (before the first use) by 15%,
to account for the fact that the “second life” of the 15% of the products bought in one year
is assumed to replace the production of new ones. As illustrated in Figure 13c), in scenario
3 the use phase is still allocated to 100% of products (because also the products that are
then reused have a first use phase) and the same happens for the EoL (because also the
reused product will end up in the EoL scenario after their “second life”).

74
Figure 13 a-c. Comparison of life cycle stages in case of a conventional life cycle of a product and
in case of a reuse as second-hand-product: a) conventional life cycle, b) reuse of a fraction of products purchased, c) reuse and avoided impacts as modelled in scenario 3.

75
Parameters modified in the model:
To calculate the share of items purchased that goes into a “second life” (15% in the
example showed in Figure 13), it is necessary to know how many people would engage in
reuse practices (i.e. selling/donating and buying/using second-hand products) and which
share of the product they buy would be affected by this activity.
Results of an Eurobarometer survey on the attitudes of EU citizens towards waste
management and resource efficiency (Eurobarometer, 2014) show that on average (with
variations across Member States) 55% of respondents would buy second-hand furniture
and 34% would buy second-hand textiles.
Those data are confirmed to some extent by a survey of 8,670 respondents carried out in
Belgium, Italy, Portugal, and Spain. The results indicated that 52% of the respondents
participated in second-hand market activities (either as buyers or sellers or both) (OCU et
al., 2016).
On the contrary, there is no information available on the share of products that may be
sold through second-hand market, after their “first life”. Therefore, two assumptions are
made for the scenario.
As a first option (scenario 3a), it is assumed that only 25% of the furniture and apparel
items bought by EU citizens goes into the second-hand market and have a “second life”
before EoL. There could be several reasons for not selling them as second-hand products,
e.g. they are discarded because they are damaged, they are considered old-fashioned
(especially for clothes), it is difficult to carry them to the second user (especially for
furniture), etc. In this case, the reduction applied to the first part of the life cycle of
products (as illustrated in the example in Figure 13c) is 13.75% (equal to 25% of the
items, applied by 55% of citizens) for furniture pieces and 8.5% (equal to 25% of the
items, applied by 34% of citizens) for apparel pieces.
A second option (scenario 3b) explores the maximum potential of reuse, by assuming that
100% of the items purchased by the share of citizens that participate in reuse activities
(55% in the case of furniture and 34% in the case of textiles) will have a second user. In
this case, the reduction applied is 55% for furniture and 34% for textiles (apparel).
In both cases, the additional transport from the first user to the second one is assumed to
be equal to the transport to client modelled in the use phase of the “first life”.
Results:
When scenario 3a is applied, the effect on the overall impact of the BoP household goods
is quite limited and the reduction of impact is below 5% in all the impact categories (Figure
14).
When the more optimistic assumption of 100% of items reused is applied (scenario 3b),
the effect is larger and the reduction of impacts is up to 20% in some impact categories.
The highest reduction (21%) occurs for particulate matter, thanks to the avoided
production of furniture components and of textiles, including the use of electricity from
countries outside the EU.
In general, the reuse of clothes generates a larger impact reduction compared to furniture
(Figure 14). This is because the transport of furniture pieces from the first to the second
user needs to be done with a van or a truck, whereas the transport of clothes can be done
by private car (or, in the case it is done by van, a higher number of pieces can be
transported at the same time). The need of additional transport for furniture is also the
reason for the slight increase of impact on ozone depletion in scenario 3a. On the contrary,
when a higher share of reuse is applied, the additional impact is compensated by the higher
savings in the production phase. For the first phases of the life cycle, up to the use phase,
the scenarios entail a reduction of the impact (Figure 14), due to the assumptions made
to model the extension of the lifetime of products, as explained before.

76
Figure 14. Scenario 3a (25% reuse) and scenario 3b (100% reuse) in comparison with the baseline scenario (with total from the baseline set as 100%):
split into the contributions of (a) the various product groups and (b) the life cycle stages.
(For the abbreviations of the names of impact categories see note to Figure 9)

77
Since furniture and textiles together contributed on average to about 31% of the
normalized impact of the entire BoP household goods, the result of scenario 3b can be
considered promising. Of course, it is hardly feasible that people involved in reuse activities
will apply this option to 100% of the furniture and apparel pieces that they own, however
the scenario shows that there is an interesting potential in those activities. Some apparel
brands, like Filippa K, Boomerang, Zara, H&M, and I:CO, have already put in place take-
back schemes to ensure proper collection of textile products from customers in their stores
for reuse/resell, and eventually recycle them if enable to reuse (Aziz, 2018). Awareness
campaigns could also leverage the involvement of a higher share of citizens compared to
the ones that already declared their willingness to participate in the second-hand market.
It could be also interesting to explore the possibility to include footwear in the analysis. At
the moment there are no data on the current share of footwear that is reused neither the
share of citizens willing to buy or sell footwear after use, probably because it is a relatively
small segment compared to the second-hand market for clothes. If those data will become
available in the future, footwear could be easily included in the scenario and could
contribute to increase the reduction of impacts from the household goods consumption
sector.

78
8.6. Scenario 4 – Using textiles with recycled input materials for
clothes manufacturing
Description and aim:
The scenario aims at assessing potential effects of the use of recycled textiles as input
material for some of the household goods considered in the study.
Area of intervention:
— Hotspot addressed: impacts from the production of textiles as product components.
— Product groups: clothes, furniture, and footwear.
— Life cycle stage: components manufacture.
Policy relevance: Circular economy package (EC 2015).
Rationale for building the scenario:
The production of textiles (either from synthetic or natural fibres) has some relevant
impacts, related to the use of virgin resources and, in case of natural fibres, to the
agricultural activities needed to cultivate them. One of the options to reduce the
environmental burden of textile production would be to use recycled input fibres. In
principle, all textiles could be recycled at the end of their life (Hawley, 2006). However,
the recycling of textiles (either from apparel or household items) is very rare in practice,
and the recycling processes of textile fibres which are performed today are mainly down-
cycling, which means a material of lower quality than the original material is produced,
e.g. to be used as input in cleaning wipes or padding in car seats (Peterson, 2015).
There are several reasons fostering this situation. The first one is economic: since the cost
of textiles today is very low (also because they are generally produced in low-wage
countries), the use of virgin materials such as cotton and crude oil is cheaper than recycling
of textile fibres (Peterson, 2015). Secondly, more technical-related issues such as the use
of fibre blends in textile products, the need to separate fibres of different colours, and the
presence of non-textiles materials (e.g. buttons and zippers) limit the viability of fibre-to-
fibre recycling (Elander & Ljungkvist, 2016). Thirdly, the collection rate of textile waste is
generally quite low, so there is a lack of input material for recycling activities. Of course,
this could be also linked with the lack of demand of those materials, due to the economic
reasons explained before. This would mean that, in case more economically viable options
would be available, the collection might be improved.
The existing technologies for textile recycling techniques can be divided into two groups:
mechanical recycling and chemical recycling (Björquist, 2017; Leonas, 2017; Vadicherla
and Saravanan, 2014).
Mechanical recycling of textiles entails the disintegration of the textile material by
mechanical action back to a fibrous form. Mechanical recycling may lead to a down-cycled
material of mixed fibres. Shredded textiles are commonly used as bulk material, e.g.
padding, inside new products (Björquist, 2017). An interesting exception regards denim
waste, which can be more easily identified in textile waste sorting. There are several jeans
companies, such as G-star and Nudie jeans, which use post-consumer denim waste in their
products (Luiken and Bouwhuis, 2015). However, one problem with this type of recycling
for yarn spinning, especially when using post-consumer waste, is the loss in fibre length.
Therefore, recycled fibres are usually blended with a proportion of virgin fibres, to obtain
a high quality yarn (Gulich, 2006).
Another type of mechanical recycling is the reprocessing of thermoplastic polymers, from
plastic waste, to form new filaments or other types of products (Leonas, 2017). The most
well-known example of commercial success for textile applications is the processing of PET

79
bottles into new polyester fibres20 (Vadicherla and Saravanan, 2014). Currently, almost
70% of PET from bottle is recycled into fibres (Shen et al., 2010).
Chemical recycling entails the chemical processing of the polymers of the fibres, which can
be fully or partly depolymerized (Shen et al., 2010). The monomers or oligomers can then
be used as feedstock to produce new polymers. The Japanese company Teijin has
developed a closed-loop system for recycling of returned polyester garments by
depolymerisation to dimethyl terephthalate (monomer) and subsequent re-polymerization
to textile fibres (Teijin, 2017). The technology was developed in collaboration with
Patagonia Inc., to recycle discarded polyester apparels chemically to new polyester fibre
of enough quality to be used as raw material (Patagonia, 2011). The Swedish company
re:newcell have patented a technology (Henriksson and Lindström, 2013) for producing a
cellulose raw material from old cotton textiles. However, all these processes are still limited
in terms of market coverage, because the best results can be obtained when input
materials are composed by a single type of fibre. This is rarely the case with post-consumer
textile waste, because most of the garments that are on the market today consist of a
mixture of materials (Elander & Ljungkvist, 2016). The most common blend is between
polyester and cotton and it is usually called “polycotton”.
Several techniques are available for separating the two components of polycotton and then
to recycle one of the two, even if there is yet no commercial large scale recycling of
polyester and cotton blended textiles (Björquist, 2017):
— One of the options studied (and applied) is to dissolve cellulose of polycotton fabric in
N-methylmorpholine N-oxide (NMMO) (Lyocell process) and then to recycle the
polyester (Sankauskaitė et al., 2014).
— An approach that would preserve also the cellulose in cotton is to depolymerize the
polyester. Alkaline hydrolysis was also used by Palme et al. (2017) and pure raw
materials of polyester monomers as well as a cotton residue was produced from new
hospital sheets containing cotton and polyester.
— A recent patent by VTT- Technical Research Centre of Finland (VTT, 2017) presents a
modification of the viscose process, using cellulose carbamate instead of carbon
disulfide (CarbaCell process). According to the inventors, this process can be easily
implemented in existing viscose processing plants, can reduce the environmental
impacts associated to the use of carbon disulfide and allows for the recovery of both
fibres (cotton and polyester). The technology is now at a pilot stage.
As mentioned before, open-loop recycling of PET, from bottles to polyester fibres is a well-
established and well-known technology. On the contrary, closed-loop recycling of fibres
from textile waste is a process still under development, with only some examples already
in place in the market (mainly at the pilot stage, especially in the case of recycling from
polycotton).
The present scenario focuses on the first type of recycling, by modelling the use of recycled
PET pellets and fibres, obtained from collected PET bottles, used as input material for
polyester textiles in the representative products of the BoP household goods.
Parameters modified in the model:
A dataset representing the LCI of PET pellet production through the recycling of PET bottles
is modelled, based on the process described in Arena et al. (2003) and Shen et al. (2011).
The process described by the LCI dataset is classified as semi-chemical recycling according
to Shen et al. (2010). This process is chosen because the quality of the staple fibre obtained
through mechanical recycling of PET from bottles is usually more suitable for use in non-
woven textiles. On the contrary, the filament obtained through semi-mechanical recycling
(i.e. mechanical recycling with the addition of some chemical additives) is more suitable
for use in footwear, technical textiles, and apparel.
20 In the textile industry, PET is referred to as polyester (Björquist, 2017).

80
This process entails two phases: the PET bottle-to-flake production and then the PET pellet
production (from PET flakes). PET pellets are then used as input for the production of the
polyester fibre used in textiles. The LCI for PET pellet production was substituted to the
virgin PET pellet input (dataset “Polyethylene terephthalate, granulate, amorphous” from
ecoinvent 3.2 database) in the dataset representing polyester textile production, used as
input in the following representative products: sanitary pad, upholstered seat (sofa),
footwear (all types), T-shirt, jeans, and men trousers.
Results
The environmental profile of the recycled PET pellets shows a general reduction of the
impacts compared to the virgin PET (ecoinvent dataset) (Figure 15). In general, the impact
of recycled PET pellets is between 60% and 90% for all the impact categories, with the
exception of ionizing radiation (25%) and ozone depletion (40%). The highest reduction
occurs for human toxicity, cancer effects, and particulate matter (90% in both cases).
Figure 15. Comparison of the environmental profile of virgin PET and recycled PET.
(For the abbreviations of the names of impact categories see note to Figure 9)
When comparing the polyester textile obtained with the two types of PET pellets (virgin or
recycled), the difference is lower, because of the contribution of other processes and
materials needed to convert the pellets into fibres and then into textile (Figure 16).

81
Figure 16. Comparison of polyester textile obtained from virgin PET pellets or recycled PET pellets.
(For the abbreviations of the names of impact categories see note to Figure 9).
Figure 17 shows the results (with the contribution of product groups and life cycle stages)
of scenario 4 at the BoP scale, i.e. the effect of using polyester textiles from recycled PET
pellets in the reference products of the BoP household goods (as replacement of polyester
textile whenever occurring in the products). As shown in the figure, the overall effect of
the replacement on the impact of the BoP is generally below 1% for all the impact
categories considered. This effect is very low considering that the eco-innovation evaluated
is related to different products in the BoP household goods that contribute up to 33.9% of
the normalized impact.
It would be interesting to assess the potential improvement that could come from the
results of the ongoing research about the recycling of polycotton, once sufficiently robust
inventory data would be available, because of the large share of products potentially
involved. That type of solution could also have a potential role in helping the
implementation of a circular economy strategy, because it is applicable at the end of life
of textiles. For the same reason, it could also help to enlarge the share of recyclable textiles
and the share of recycled content in apparel items.

82
Figure 17. Scenario 4 in comparison with the baseline scenario (with total from the baseline set as
100%) – split into the contributions of (a) the various product groups and (b) the life cycle stages.
(For the abbreviations of the names of impact categories see note to Figure 9)

83
8.7. Scenario 5 – EU Ecolabel scenario on liquid soap
Description and aim:
The aim of this scenario is to examine the potential environmental benefits coming from
the use of an EU Ecolabelled product, compared to base-case liquid soap products modelled
in the baseline scenario.
Area of intervention:
— Hotspot addressed: impacts from the whole life cycle of liquid soap.
— Product group: personal care.
— Life cycle stage: components manufacture (formulation of the product) and use
(dosage).
Policy relevance: Commission Decision of 9 December 2014 establishing the ecological
criteria for the award of the EU Ecolabel for rinse-off cosmetic products (i.e. personal care).
Background information:
Liquid soaps represent a relevant percentage of all bath and soaps products, being more
popular than bar soaps (Figure 18).
Figure 18. Market share of bath and soap products.
Source: Mintel Database. European Market, 2017.
The LCA study done for the base-case liquid soap included in the baseline scenario
(Escamilla et al., 2012) unveiled that environmental impact hotspots occur in different life
cycle stages of the product: use stage, release to water, packaging, and chemicals used
as raw materials. The relative contribution to environmental impacts and the improvement
potential of each stage is summarized below, according to LCA study results obtained using
the IMPACT 2002+ endpoint impact method (all midpoint impact categories normalized,
weighted, and aggregated to a single value):
— Components manufacture: 10% of environmental impacts are associated to this stage.
The potential of improvement and the regulation of the EU Ecolabel are high. Selecting
less harmful substances from each functional group will improve the environmental
profile of the product, since besides this stage these changes will also have benefits
during manufacturing, use of the product, and end of life wastewater treatment.
— For manufacturing, representing on average 11% of impacts, limited improvement
potential is expected. Moreover, resources consumption during manufacturing is not
regulated by EU Ecolabel.

84
— Packaging has a high improvement potential and several eco-innovations actions can
be applied. Packaging of liquid soaps has a contribution on average of 17% of the
overall impact. Decreases in weight results in direct decreases of environmental
impacts. Measures to decrease the weight are: increase capacity, lighter packaging,
and refilling systems. This issue is regulated by EU Ecolabel through the Packaging
Impact Ratio criterion (Packaging), which calculates through a formula the maximum
ration between the weight of the packaging and the weight of the content, including
variables such as refilling systems and recycled content. Since decreasing the use of
virgin materials decreases the environmental impact, increasing the recycled content
will be explored as well.
— Distribution has an average of 8% of contribution of product environmental impact.
Improving transport efficiency (logistics) and decreasing weight of packaging can
reduce the environmental impact due to saving of fossil fuel use.
— Use contributes to an average of 24% of the impact of the product. Reducing dose and
water consumption can bring benefits in this stage.
— Release of product into water after its use contributes to 19% of the impacts.
Improvements on formulation using substances less toxic will reduce the impact coming
from wastewater treatment.
In the baseline scenario, the functional unit for this product group has been defined as a
bottle of liquid soap containing 255 g of product, related to the number of cleaning actions
by bottle. The same functional unit is used in the eco-innovation scenario.
Rationale for building the scenario:
The eco-innovation scenario for liquid soap has been defined incorporating modifications
from the base-case scenario, according to the current EU Ecolabel requirement criteria of
rinse-off cosmetics (i.e. personal care). For those areas where improvement potential was
identified but that are not directly covered by EU Ecolabel criteria, sensitivity analyses have
been modelled. The summary of the main changes for each life cycle stage and the
rationale for each modification are detailed in the sections below.
To define the components manufacture21 for the eco-innovation scenario, the following
steps and sources of information have been followed (for all the scenarios with a change
in the formulation of products, i.e. scenarios 5, 6, 7, and 8):
— Analysis of the formulation of the base-case product. Those ingredients posing a higher
environmental impact and/or which are restricted by the EU Ecolabel have been
identified in order to be substituted in the eco-innovation product scenario.
— Analysis of components of currently EU Ecolabelled products. Five products
representative from the countries with a major number of EU Ecolabelled products in
the market have been selected. Information from their formulation has been gathered
from a commercial market database (Mintel database).
— Theoretical formulation of a standard EU Ecolabelled product, ensuring (based on
expert-knowledge) that the final product will comply with the fitness for use and
technical performance required by EU Ecolabel, and that it is equivalent to the base-
case product. The formulation has been modified according to the five available
commercial formulations and considering the sustainability limitations from EU Ecolabel
criteria. The formula was built based on current EU Ecolabelled products on the market
and checked by experts in the field. However, its performance was not tested. The
formulation used in the scenario is presented in Table 36.
— Analysis of the EU Ecolabel criteria for rinse-off cosmetics (i.e. personal care) with
requirements regarding raw materials:
21 The components manufacture life cycle stage comprises the substances used in the formulation of the final
product (including the raw materials extraction and processing) and the transport of these substances from the supplier to the production site.

85
o Criterion 1 – Toxicity - Critical Dilution Volume (CDV)
o Criterion 2 – Biodegradability
o Criterion 3 – Limitation of hazardous substances
— The values of CDV and biodegradability have been analysed in both formulations in
order to verify that the EU Ecolabelled formulation is compliant with the EU Ecolabel
criteria and that all changes on formulation allow a better performance on these criteria
(Table 35). For the EU Ecolabelled formulation the CDV is higher than the base-case
formulation (but still far below the threshold), since adjustments had to be done in
order to be compliant with Anaerobically non-biodegradable (ANBO) and Anaerobically
non-biodegradable (aANBO) thresholds.
Table 35. Score for Criteria 1 and 2 of EU Ecolabel for soaps.
CDV ANBO (surf)
aANBO (surf)
ANBO (org)
aANBO (org)
EU criteria thresholds 18,000 0 0 25 25
Base-case formulation 5,799.00 0 1.20 0 93.60
EU Ecolabel formulation 6,971.60 0 0.00 23.90 23.90
Table 36. Components formulation for eco-innovation scenario. Liquid soap.
Input/output Function
BASELINE SCENARIO ECO-INNOVATION SCENARIO
Formulation (%)
Quantity (g)
Formulation (%)
Quantity (g)
Water 84.4 216.35 84.34 215.067
Sodium lauryl ether sulphate
Surfactant 6.8 17.53 7.50 19.125
Disodium Cocoamphodiacetate
Surfactant 2.5 6.503 - -
Sodium chloride Other 0.5 1.403 2.20 5.610
Cocoamidopropyl betaine Surfactant 1.0 2.678 2.50 6.375
C8-C16 fatty alcohol glucoside
Surfactant 1.2 3.06 - -
Coco glucoside Surfactant - - 2.50 6.375
Polyol coconut fatty acid ester
Emolients 0.5 1.275 - -
Citric acid monohydrated PH adjustment 0.5 1.275 0.50 1.275
Benzyl alcohol Preservatives 0.2 0.501 - -
Potassium sorbate Preservatives 0.03 0.085 0.30 0.383
Sodium benzoate Preservatives 0.2 0.501 0.15 0.765
Sodium chloride Other 2 5.1 - -
Methylchloroisothiazolinone and Methylisothiazolinone (CMI:MI) (3:1).
Preservatives - - 0.01 0.026
TOTAL 100 255 100 255
This life cycle stage includes the transport of all ingredients to the production site except
water. The same distances and the same transportation modes as in the base-case scenario
were assumed (Table 37).

86
Table 37. Inventory values for transport of component. Liquid soap.
Transport of raw materials to production site
Freight lorry 16-32 kt 500 km
Freight, sea, transoceanic 15,000 km
The production life cycle stage is not covered directly by the rinse-off cosmetics EU
Ecolabel criteria. For this reason any changes from the base-case scenario have not been
done for the eco-innovation scenario in this stage. Nevertheless, there are different EU
environmental policies referring to the manufacturing process, such as EMAS, ISO 14001,
etc. The production impact is mainly influenced by the energy consumption. A reduction of
the impact could be achieved by the reduction of the energy consumed or the use of
renewable energy sources. A sensitivity analysis has been done varying the energy
consumption to estimate the influence of this improvement measure in the final impact
results. Details and results are presented in section 8.13.
Regarding the packaging, the following variations have been introduced based on the EU
Ecolabel packaging criterion. Criterion number 4 of rinse-off cosmetics EU Ecolabel criteria
regulates the relative weight of packaging and content, establishing a maximum ratio of
0.28 g of packaging by gram of content, this ratio is named Packaging Impact Ratio (PIR).
The formula for the calculation of this PIR includes primary and secondary packaging, as
well as factors as refilling and recycled materials (Box 3).
Box 3. Packaging Impact Ratio (PIR). PIR = (W + (Wrefill × F) + N + (Nrefill × F))/(D + (Drefill × F))
Where:
— W — weight of packaging (primary + proportion of secondary (1), including labels)(g)
— Wrefill — weight of refill packaging (primary + proportion of secondary (1), including
labels) (g)
— N — weight of non-renewable + non-recycled packaging (primary + proportion of
secondary (1), including labels) (g)
— Nrefill — weight of non-renewable and non-recycled refill packaging (primary +
proportion of secondary (1), including labels) (g)
— D — weight of product contained in the ‘parent’ pack (g)
— Drefill — weight of product delivered by the refill (g)
— F — number of refills required to meet the total refillable quantity, calculated as follows:
F = V × R/Vrefill
Where:
— V — volume capacity of the parent pack (mL)
— Vrefill — volume capacity of the refill pack (mL)
— R — the refillable quantity. This is the number of times that the parent pack can be
refilled
When F is not a whole number, it should be rounded up to the next whole number.
In case no refill is offered, PIR shall be calculated as follows:
PIR = (W + N)/D
The manufacturer shall provide the number of foreseen refilling, or use the default values
of R = 5 for plastics and R = 2 for cardboard.
The current format of the packaging for the base-case product is a packaging of 255 mL
of capacity with 39g weight, 100% virgin HDPE. These characteristics give an EU Ecolabel
Packaging Impact Ratio (PIR) value of 0.306, whereas the current maximum PIR for these
products according to EU Ecolabel criteria is 0.28. In the background report of the
development of EU Ecolabel criteria for soaps, shampoos, and hair conditioners, 57 EU
Ecolabelled products were analysed; results showed that non-refilling packaging average
weight/content ratio for these products were 0.25, whereas for refilling products the
average ratio was 0.17. For this reason, the following improvements are proposed:

87
1. Increase of the capacity from 255mL to 300mL.
Several capacity formats are found for these products on the market (Table 38). Therefore,
it is considered feasible to assume an increase in the packaging capacity compared to the
baseline scenario.
Table 38. Market share of packaging capacities for Liquid soap products (Escamilla et al., 2012).
Capacity (mL)
Percentage of products on the
market (liquid soap, shampoos
and hair conditioners) (%)
250 43
300 18
200 15
500 8
400 8
Other capacities 8
2. Change of material from virgin HDPE to HDPE with a 20% content of recycled PE.
Recycled content up to 25% in packaging is feasible without compromising the packaging
barrier characteristics (both in an interior layer in multilayer packaging or in a mixed
polymer in monolayer packaging). For recycled material, the inputs for recycling processes
have been considered (i.e. electricity), without accounting for impact savings linked to
substitution of virgin material in order to avoid double counting with End of life processing.
3. A refilling system with a lighter packaging (25g for refilling packaging).
According to EU Ecolabel criterion on packaging (criterion 4), five refilling actions have
been considered, i.e. the parent packaging is refilled five times after its first use. It allows
for important packaging material reduction. Some soap products have the option of refilling
or reusable package, where the refill package is usually lighter than the conventional one.
It is quite usual in hand-soaps where refillable package has a dispenser and refill package
is a simple bottle. There exists some other soap products with refill packaging such as body
liquid soap. Among all liquid soap products of the EU market, 10% have refilling systems.
According to Background report of rinse-off cosmetics (Escamilla et al., 2012), refilling
systems can provide packaging savings of nearly 80% of weight, which can be converted
to approximately 80% of saving of environmental impact of the packaging stage, as it
mainly results from raw material consumption. The assessment done in the background
report shows that environmental impacts are directly proportional to the packaging weight.
For instance, in accordance with the results obtained in the technical analysis, in the case
of liquid soaps, by using a refilling system, the total environmental impact of the product
decreases by 18% with respect to the original soap with non-refill packaging.
4. Lighter packaging due to material reduction: from 39g (for 255mL) to 42g (for 300mL).
Considering the refilling system and the capacities, the improved packaging for a functional
unit of 255g of liquid soap is of 23.66g.
With these measures, the product will have a PIR value of 0.17 following the EU Ecolabel
formula, being compliant with EU Ecolabel and being in line with data from current EU
Ecolabelled liquid soap products.
For the end of life of packaging, the same hypotheses for the final treatment of packaging
waste in the baseline have been considered. For the treatment of packaging waste, the
base-case scenario considered a percentage of recycling of 31.9% for PE (Annex 2). Since
the packaging is already considered as being 100% recyclable for the base-case scenario
and the percentage is defined according to current EU statistics, no changes have been
applied for the eco-innovation scenario. However, a sensitivity analysis has been done
increasing the recyclability ratio. Details and results are provided in section 8.13.

88
For the logistics life cycle stage, the same values for both the base-case scenario and the
eco-innovation scenario have been considered. However, a sensitivity analysis has been
done testing the effect of using trucks with a better emission profile (EURO 6 vehicles).
Details and results are provided in section 8.13.
Some EU Ecolabel requirements are related to the use stage regarding the dosage:
— EU Ecolabel requires for dosing system designs that allow a proper dosage avoiding
spillage of the product due to over-doses;
— EU Ecolabel also has a criterion regarding fitness for use to guarantee a good washing
efficiency.
For this reason, the dose has been reduced by 10% compared to the base-case scenario.
This change reduces the quantity of soap by cleaning action for those life cycle stages
linked to the product (manufacturing, packaging, and transport), whereas the quantity of
water during use is unchanged. With this change, the quantity needed for the same number
of cleaning actions, have changed from 255g to 229.5g. The quantity of annual
consumption for the overall BoP would change from 1.82 kg/year to 1.64 kg/year (Table
39).
Some tests run by Deb Group (2018) concluded that a dose of 0.7 mL is the lowest dose
sufficient to comfortably spread across all surfaces of most people’s hand: the test
concluded that this dose is the best balance between required effectiveness and economics.
Most of liquid soap dispensers have a dosage system of about 1.5 mL. These data indicate
that the doses defined in the base-case scenario can be decreased with a correct dosage
system without compromising functionality.
Table 39. Dosage values for Use stage. Liquid soap.
BASE-CASE SCENARIO ECO-INNOVATION SCENARIO
Handwashing Shower Handwashing Shower
Dosage (g) 2 13 1.8 11.7
Electricity Not included Not included Not included Not included
Water (L) 2.5 22 2.5 22
The quantity of water used has not been changed, being the same for the two scenarios,
since EU Ecolabel does not cover use stage or information to users. Nevertheless, an
environmental awareness from user could condition the use done for this product.
Consumer behaviour can have a direct influence to the dose and the quantity of water
consumed during a washing use. Therefore, this aspect has been addressed in a dedicated
sensitivity analysis. Details and results are presented in section 8.13.
For the End of life stage, a standard urban wastewater treatment for the domestic
wastewater generated (water consumed during use and the quantity of the product) has
been modelled. These values have been kept from the base-case scenario without
variation. EU Ecolabel includes a restriction on environmental hazardous substances,
reducing the amount of toxic and pollutant substances that could end-up to the
environment after the waste treatment stage. A further analysis has been done assuming
direct release of these substances to the water compartment after use, as a worst-case
scenario. With this analysis, the toxicity effect of these substances could be quantified,
although several limitations are found in current impact methods and characterisation
factors for these emissions (Table 40). When the substances of the two formulations are
modelled as emissions to water, it can be observed that only few substances have
characterisation factors (CFs), and only for toxicity categories (human toxicity and
freshwater toxicity). The rest of impact categories do not have CFs for these emissions.

89
Table 40. Availability of characterisation factors for substances that are emitted to water at the
EoL of liquid soap.
BASELINE SCENARIO
ECO-INNOVATION SCENARIO
CF for Human toxicity, cancer effects
CF for Freshwater toxicity
Input/output Quantity Quantity
Water 84.4% 84.34% NA NA
Sodium lauryl ether sulphate 6.8% 7.50% NA NA
Disodium Cocoamphodiacetate 2.5% - NA NA
Sodium chloride 0.5% 2.20% NA NA
Cocoamidopropyl betaine 1.0% 2.50% NA NA
C8-C16 fatty alcohol glucoside 1.2% - NA NA
Coco glucoside - 2.50% NA NA
Polyol coconut fatty acid ester 0.5% - NA NA
Citric acid monohydrated 0.5% 0.50% NA NA
Benzyl alcohol 0.2% - √ NA
Potassium sorbate 0.03% 0.30% NA NA
Sodium benzoate 0.2% 0.15% √ √
Sodium chloride 2% NA NA
Methylchloroisothiazolinone and Methylisothiazolinone (CMI:MI) (3:1).
- 0.01% NA √
The impact on human toxicity is higher in the base case formulation than in the eco-
innovation one (Figure 19), because of the presence of benzyl alcohol. On the other hand,
the impact in the freshwater category is higher for the eco-innovation formulation due to
the presence of CMI:MI. In both cases, results are not representative, since only 3 out of
13 substances have (eco)toxicity characterisation factors for water emissions.
Figure 19. Toxicity assessment of substances modelled as emissions to water.
For this reason, besides results of LCA, reference literature data on current impacts from
the release of cosmetic and personal care products into the environment has been
gathered. It is known that since these products are used in huge quantities in the EU, they
are continuously released into the environment in very large amounts. Cosmetics pose the
most pressing ecological problems compared to pharmaceuticals because they are used in
much larger quantities and throughout the course of life and, being intended for external
application, are not subjected to metabolic transformation; therefore they are introduced
unaltered into the environment in large amounts during washing, showering or bathing
(Juliano et al., 2017).

90
Even if most of the water containing substances from cosmetics and personal care products
is treated in wastewater treatment plants, it has to be considered that the treatment plants
are not always effective in removing chemicals used as cosmetic ingredients. Some of
these substances can end up on surface water or they can accumulate in sewage sludge
during wastewater treatment and then enter the environment as a fertilizer on crops. Some
of the ingredients of these products are biologically active and are characterized by
persistence and bioaccumulation potential, posing a threat to ecosystem and human
health. Some cosmetic ingredients are considered environmental emerging pollutants of
particular concern such as UV filters, some preservatives (parabens, triclosan), and
microplastics (Juliano et al., 2017). The most problematic cosmetics ingredients for
wastewater treatment (WWT) are restricted in EU Ecolabelled products (such as non-
biodegradable surfactants, parabens, microplastics, etc.). These restrictions would
represent environmental benefits related to the decrease of risk of pollution of water and
soil. Nevertheless, these improvements are not always reflected in LCA results, as seen
before, due to the limitations of the current LCA impact methods for toxicity categories.
Parameters modified in the model:
Following the rationale, Table 41 reports a summary of the parameters that have been
changed in the eco-innovation model compared to the base-case.
Table 41. Parameters modified in the eco-innovative scenario for liquid soap.
Liquid soaps
Components manufacture
Formulation according to Criteria requirements included in EU Ecolabel (Table 36).
Packaging Increase of the packaging capacity and reduction of material, 20% of HDPE from recycled material, and inclusion of a refilling system. The new value for packaging is 23.66g for functional unit (255g of product).
Use phase
Reduction of dosage: 10%. The new dosage is 1.8g for liquid soap used for hand washing and 11.7 for liquid soap used for shower (Table 39). As consequence of this, the quantity of annual consumption for the overall BoP changes from 1.82
kg/year to 1.64 kg/year.
Results:
Scenario results were analysed for the single product (Figure 20) and for the overall BoP
(Figure 21). For the individual analysis of a liquid soap product, the analysis has been done
for the same functional unit, i.e. hand cleaning actions and showers (50% of each type of
use) for a bottle of 255g (base-case scenario). Due to the dosage reduction, the equivalent
reference flow for the same number of cleaning actions for the eco-innovation actions is
229g for those life cycle stages related to the production of the product, whereas for the
use stage and the end of life the same quantity of water has been considered, since it is
linked to the number of washing actions. Main savings are related to the reduction of the
amount of product used due to the reduced dose, which proportionally reduces the impacts
in all life cycle stages. Reduction of impacts can be observed also in components
manufacture and primary packaging and packaging EoL stages (Figure 20). When the
environmental impact profile of both products are compared, the product of the eco-
innovation scenario shows reductions in the environmental impact for all impact categories
(Figure 20). Impact reductions vary between 12.4% (GWP) to 0.1% (LU) depending on
the impact category, as it can be seen in the figure below. Savings are quite limited, since
the most impacting life cycle stages, i.e. use (accounting for water use) and end of life,
remain unchanged. Regarding the rest of the life cycle stages which have been modified in
the eco-innovation scenario, the highest savings are found in packaging and the EoL of
packaging (50% of reduction on average). Ingredients manufacturing presents also a
reduction of around 10%, but it is related to the use of a lower quantity of ingredients by
cleaning actions due to the reduction of dose, not for the substitution of ingredients. The
rest of life cycle stages (distribution and import) show also improvements of around 10%
in relation to the reduction of dose, although their relative contribution is low.

91
Figure 20. Individual analysis of liquid soap products - Comparative assessment of baseline and
eco-innovation scenarios of liquid soap. “Imports” include the transport of the imported finished products.
(For the abbreviations of the names of impact categories see note to Figure 9)
If the eco-innovation scenario for liquid soap is considered in the context of the whole BoP
household goods (Figure 21), it can be seen that improvements are quite limited, since
personal care products have quite low contribution to impact in comparison to other
product categories for the BoP in the base case. Liquid soap contributes to 0.8% of the
normalized impact of the whole BoP. For this reason, the potential effect on the overall BoP
from the improvements in this product is quite limited. Nevertheless, it can be seen that
for Eco-innovation scenario, personal care products have a better performance in all impact
categories, with reduction of the impacts of the category going from 1.5% (GWP) to 0.02%
(LU), depending on the impact category. Nevertheless when considering the effect of 100%
EU Ecolabelled liquid soaps in the overall environmental burdens of the BoP household
goods, the effect is almost negligible. Although reductions of the overall BoP’s impact are
quite limited if only liquid soaps scenario is modified (generally below 1%), it would
contribute to the overall eco-innovation BoP where these improvements are assessed
together with the other four Eco-innovation scenarios. At the life cycle stage level, although

92
very limited, reductions of impacts of the BoP household goods are mainly found in the
packaging life cycle stage (0.4% on average).
Figure 21. Scenario 5 in comparison with the baseline scenario (with total from the baseline set as 100%) – split into the contributions of (a) the various product groups and (b) the life cycle stages.
(For the abbreviations of the names of impact categories see note to Figure 9)

93
8.8. Scenario 6 – EU Ecolabel scenario on shampoo
Description and aim:
The aim of this scenario is to examine the potential environmental benefits coming from
the use of an EU Ecolabelled product, compared to base-case shampoo products modelled
in the baseline scenario.
Area of intervention:
— Hotspot addressed: impacts from the whole life cycle of shampoo.
— Product group: Personal care.
— Life cycle stage: components manufacture (formulation of the product) and use
(dosage).
Policy relevance: Commission Decision of 9 December 2014 establishing the ecological
criteria for the award of the EU Ecolabel for rinse-off cosmetic products (i.e. personal care).
Background information:
The LCA results of the base-case shampoo in the background study for the selection of EU
Ecolabel criteria (Escamilla et al., 2012) showed that hotspots from all life cycle stages are
related to the use stage, release to water, packaging, and chemicals used as raw materials.
The relative contribution to environmental impacts and the improvement potential of each
stage is summarized below; according to LCA study results obtained using the IMPACT
2002+ endpoint impact method (all midpoint impact categories normalized, weighted, and
aggregated to a unique value):
— Components manufacture: 9% of impacts are associated to this stage. The potential of
improvement and the regulation of the EU Ecolabel are high. Selecting less harmful
substances from each functional group will improve the environmental profile of the
product, since these changes will also have benefits besides this stage: during
manufacturing, use of the product, and end of life wastewater treatment.
— Manufacturing, representing on average 12% of impacts, has limited improvement
potential since industrial processes are standard processes from databases and primary
data from industry are not available. Moreover consumptions during manufacturing are
not regulated by EU Ecolabel.
— Packaging has a high improvement potential and several eco-innovation actions can be
applied. Packaging of shampoo has a contribution on average representing 22% of the
overall impact. Decreases in weight result in direct decreases of environmental impacts.
Measures to decrease the weight are: increase capacity, lighter packaging, and refilling
systems. This issue is regulated by EU Ecolabel through the PIR criterion (Packaging)
(Box 3). Also decreasing the use of virgin materials reduces the environmental impact,
increasing the recycled content will be explored as well.
— Distribution represents on average 7% of the product environmental impact. Improving
efficiency in logistics and decreasing weight of packaging bring savings due to reducing
fossil fuel use.
— Use contributes to 28% of impact of the product, on average. Reducing dose and water
consumption can bring environmental benefits in this stage.
Release of product into water after its use contributes to 20% of the environmental
impacts. Improvements on formulation using substances less toxic will reduce the impact
coming from wastewater treatment.
Rationale for building the scenario:
The eco-innovation scenario has been defined incorporating modifications from the base-
case scenario, according to the current EU Ecolabel criteria of rinse-off cosmetics (i.e.
personal care). For those areas where improvement potential was identified but they are
not directly covered by EU Ecolabel criteria, sensitivity analyses have been modelled. The

94
summary of the main changes for each life cycle stage are detailed in the paragraphs
below.
The functional unit for this product group has been defined as a bottle of shampoo
containing 255g of product in the baseline scenario. This functional unit has been
maintained for comparison.
The components manufacture life cycle stage comprises the substances used in the
formulation of the final product (including the raw materials extraction and processing)
and the transport of these substances from the supplier to the production site.
To define the components for the eco-innovation scenario, the same approach, steps, and
sources of information than the ones used for liquid soap (Scenario 5) have been followed.
The resulting formulation is presented in Table 42.
Table 42. Components formulation for eco-innovation scenario. Shampoo.
BASE-CASE SCENARIO
ECO-INNOVATION SCENARIO
Input/output Observations Formulation (%)
Quantity (g)
Formulation (%)
Quantity (g)
Water 88.32 225.22 88.05 224.527
Sodium laureth sulphate
Anionic surfactant
7.00 17.85 7.00 17.85
Cocoamidopropyl betaine
Amphoteric surfactant
2.50 6.375 2.00 5.1
Fatty alkanolamides Non-ionic surfactant
0.50 1.275 - -
Coco glucoside Non-ionic surfactant
- - 0.80 2.04
Propylene glycol Surfactant Viscosity controlling agent
1.50 3.825 - -
Glycerine Surfactant Viscosity
controlling agent
- - 1.50 3.825
Sodium benzoate Preservatives 0.05 0.127 0.765 0.30
Benzyl alcohol Preservatives 0.05 0.127 - -
Lactic acid pH adjustment 0.08 0.204 - -
Potassium sorbate 0.15 0.3825
Sodium chloride - - 0.10 0.255
Citric acid - - 0.10 0.255
TOTAL 100 255 100 255
This life cycle stage includes the transport of all ingredients except water. Values are the
same as for the base-case scenario (Table 43).
Table 43. Inventory values for transport of components. Shampoo.
Transport of raw materials to production site (except water)
Freight lorry 16-32 kt 500 km
Freight, sea, transoceanic 15,000 km
The values of CDV and biodegradability have been analysed in both formulations in order
to verify that the EU Ecolabelled formulation is compliant with the EU Ecolabel criteria and
that all changes on formulation allow a better performance on these criteria. In this case,
CDV is slightly higher, but the new formulation is compliant with biodegradability
thresholds (Table 44).

95
Table 44. Score for Criteria 1 and 2 of EU Ecolabel for shampoo.
CDV ANBO (surf)
aANBO (surf)
ANBO (org)
aANBO (org)
EU criteria thresholds 18,000 0 0 25 25
Base-case formulation 2,009 0 7.00 0 599.30
EU Ecolabel formulation 3,528 0 0.00 0 12.7
The production life cycle stage is not covered directly for the rinse-off cosmetics EU
Ecolabel criteria. For this reason, as done in liquid soap, any changes from the base-case
scenario have not been done for the eco-innovation scenario in this stage. Accordingly, a
sensitivity analysis has been done by varying the energy consumption in order to estimate
the influence of this improvement measure in the overall impact results. Details and results
are presented in section 8.13.
For the logistics life cycle stage, the same values than the base-case scenario have been
kept for the eco-innovation scenario. The same sensitivity analysis performed for liquid
soap has been done, changing the road vehicles for vehicles with a better emission profile
(changing from EURO4 to EURO6). Details and results are presented in section 8.13.
For the characteristics of the packaging, the following variations have been introduced
based on the EU Ecolabel packaging criterion.
The current format of the packaging for the base-case product is a packaging of 250mL of
capacity with 39g weight, 100% virgin HDPE. This characteristic gives a PIR value of 0.306,
whereas the current maximum PIR for these products according to EU Ecolabel criteria is
0.28. In the background report of the development of EU Ecolabel criteria for soaps,
shampoos, and hair conditioners, 57 EU Ecolabelled products were analysed. Results
showed that non-refilling packaging average weight/content ratio for these products were
0,25; whereas for refilling products the average ratio was 0.17. For this reason, the
following improvements are proposed.
1. Increase of the capacity from 255mL to 300mL.
2. Change of material from virgin HDPE to HDPE with a 20% content of recycled PE.
3. Lighter packaging due to material reduction: from 39g (for 255mL) to 42g (for
300mL); which represent 35.7g of packaging for containing 255g of product.
Considering the refilling system and the capacities, the improved packaging for a functional
unit of 255g of liquid soap is of 35.7g for functional unit.
With these measures, following the EU Ecolabel formula the product will have a PIR value
of 0.25, being compliant with EU Ecolabel and being in line with data for current EU
Ecolabelled liquid soaps products.
For the end of life of packaging, the same hypotheses for the final treatment of packaging
waste have been considered (as in Annex 2). A sensitivity analysis has been done
considering higher recycling ratios for PE material, following the same considerations than
for liquid soaps.
Some EU Ecolabel requirements are related to the use stage regarding the dosage:
— EU Ecolabel asks for dosing system design, which allows a proper dosage avoiding
spillage of the product due to over-doses.
— EU Ecolabel also has a criterion regarding fitness for use to guarantee a good washing
efficiency.
For this reason the dose has been reduced by 10% with the respect to dose on base-case
scenario, i.e. from 10.5g to 9.45g (Table 45). This change has no effect on the modelling
of the individual scenario, but the quantity of annual consumption for the overall BoP
household goods would change from 3.13 kg/year to 2.817 kg/year.

96
Table 45. Dosage values for Use stage. Shampoo.
Parameter BASE-CASE SCENARIO
ECO-INNOVATION SCENARIO
Dosage (g) 10.5 9.45
Electricity Not included Not included
Water (L) 22 22
The quantity of water used is the same for the two scenarios, since EU Ecolabel does not
cover use stage or information to users about water. Nevertheless, the environmental
awareness of users could condition the use phase of this product. Consumer behaviour can
have a direct influence to the dose and the quantity of water consumed during washing
use. For this reason, a sensitivity analysis has been done reducing the quantity of water
respectively by 5% and 10%, in order to see how this measure would affect the overall
environmental impact of the product. Details and results are presented in section 8.13.
For the End of life stage, a standard urban wastewater treatment for the domestic
wastewater generated (water consumed during use and the quantity of the product) is
modelled. These values have been kept from the base-case scenario without variation.
Parameters modified in the model:
Table 46 reports a summary of the parameters that have been changed in the base-case
model, following the justifications exposed in the rationale.
Table 46. Parameters modified in the eco-innovation scenario for shampoo.
Shampoo
Components manufacture
Formulation according to Criteria requirements included in EU Ecolabel (Table 42)
Packaging Increase of the packaging capacity, reduction of material, and 20% of HDPE from recycled material. The new value for packaging is 35.7g for functional unit (255g of product)
Use phase 10% dosage reduction. The new dosage is 9.45g per shower (Table 45). As consequence of this, the quantity of annual consumption for the overall BoP changes from 3.13 kg/year to 2.82 kg/year.
Results:
Scenario results were analysed for the single product (Figure 22) and for the overall BoP
(Figure 23). For the individual analysis of shampoo products, the analysis has been done
for the same functional unit (shower actions for a bottle of 255g in the case of the base-
case scenario); due to the reduction on dose, the equivalent reference flow for the same
number of cleaning actions for the eco-innovation actions is 229.5g for those life cycle
stages related to the production of the product, whereas for the use stage and the end of
life the same quantity of water has been considered, since it is linked to the number of
washing actions.
Main savings are related to the reduction of the amount of product use due to the reduced
dose, which proportionally reduces the impacts in all life cycle stages. Impact minimization
can be observed also in components manufacture, primary packaging, and EoL of
packaging stages. All impact categories are reduced except ozone depletion, which
increases its value due to some ingredients present in the eco-innovation scenario
formulation, especially due to the sodium benzoate, which has a higher concentration in
the eco-innovation scenario. Environmental savings vary between 0.5% (FETP, HTPnc) and
10% (GWP), depending on the impact category (Figure 22).
Savings are quite limited, since the most impacting life cycle stages, i.e. use (accounting
for water use) and end of life remain unchanged. For the rest of the life cycle stages
modified, the highest savings are found in packaging and EoL of packaging (20% of
reduction on average. Ingredients manufacturing presents also a reduction of around 10%,
but it is related to the use of a lower quantity of ingredients by cleaning actions due to the
reduction of dose, not for the substitution of ingredients. The rest of life cycle stages

97
(distribution and import) show also improvements of around 10% in relation to the
reduction of dose, although their relative contribution is low.
Figure 22. Individual analysis of shampoo products - Comparative assessment of baseline and eco-innovation scenarios of shampoo. “Imports” include the transport of the imported finished
products.
(For the abbreviations of the names of impact categories see note to Figure 9)
When the eco-innovation scenario for shampoo is considered for the category of Personal
care products, it can be seen that improvements on the overall BoP are quite limited, since
shampoo contributes to only 1.0% of the normalized impact of the whole BoP household
goods. For this reason, the potential effect on the overall BoP from the improvements in
this product is quite limited (Figure 23). Moreover, inside the category of personal care,
there are other products such as shampoo, hair conditioning products or solid bars that
have remained unchanged and have relevant contribution.
Despite these limitations, it can be seen that for Eco-innovation scenario, product care has
a better performance in all impact categories, with reduction of all the impacts of the
categories except ODP.

98
Figure 23. Scenario 6 in comparison with the baseline scenario (with total from the baseline set as
100%) – split into the contributions of the various product groups.
(For the abbreviations of the names of impact categories see note to Figure 9)
Nevertheless, the effect on the overall BoP ranges between 0.01% and 0.04%, depending
on the impact category. ODP is the only category with highest impacts in eco-innovation
scenarios compared to the baseline scenario (+0.11%). No variations are observed in
FETP. Although it is not appreciated in Figure 23 because reductions are very limited,
reductions of impacts of BoP by life cycle stages are mainly found in packaging (0.25% on
average). Minor improvements are also found in the life cycle production and logistics, with
variations lower than 0.02%.

99
8.9. Scenario 7 – EU Ecolabel scenario on dishwasher detergent
Description and aim:
The aim of this scenario is to examine the potential environmental benefits coming from
the use of an EU Ecolabelled dishwasher detergent product, compared to base-case
dishwasher detergent (DD) products modelled in the baseline scenario.
Area of intervention:
— Hotspot addressed: impacts from the whole life cycle of dishwasher detergent.
— Product group: detergents.
— Life cycle stage: components manufacture (formulation of the product) and use
(dosage).
Policy relevance: Commission Decision (EU) 2017/1216 of 23 June 2017 establishing the
EU Ecolabel criteria for dishwasher detergents.
Background information:
The stage that has a higher contribution on the environmental impact of DD is the use
phase. The impact is mainly caused by the energy used to heat the water during the wash
cycle. On average, the second most contributing stage in the potential impact of DD is the
manufacture of components. The ingredients used in the formulation could be important
contributors to the total environmental impact, especially in the impact categories of
terrestrial ecotoxicity, marine eutrophication, and marine ecotoxicity. This impact is related
with different ingredients: surfactant, builder, sodium carbonate, alkali, and citric acid.
When other life cycle stages are considered, packaging has a significant impact because of
the non-recycled content of the secondary packaging, and the wastewater treatment
(included in the end of life stage) contributes to the impact in some impact categories.
The background study for the selection of EU Ecolabel criteria for Dishwasher Detergents
(DD) (Arendorf et al., 2014a) have analysed different variables to identify their contribution
to the environmental impacts. The impact assessment method used for the LCA study is
ReCiPe and the study highlighted that:
— The washing program defines the temperature and duration of the cycles, and it affects
the energy consumed during the washing. A reduction of washing temperature has an
important reduction in different impact categories, such as climate change, human
toxicity, or freshwater and marine ecotoxicity;
— A reduction of the dosage does not affect the size of the impacts;
— The surfactant origin is relevant for the impact category of land transformation;
— The energy source considered in the analysis is important: for example, considering
the French energy mix reduces the impact on climate change by more than 80%. The
source used to generate energy is related to lower emissions and resource
consumptions;
— Ingredients have a higher influence on the impact categories of human toxicity,
terrestrial ecotoxicity, freshwater ecotoxicity, and marine ecotoxicity. The ingredient
used in the formulation will affect the potential environmental impact of those
categories.
Rationale for building the scenario:
Different modifications have been included in the eco-innovation scenario of DD since EU
Ecolabel covers most of the life cycle stages of Detergents. For phases not covered by EU
Ecolabel criteria, a sensitivity analysis has been performed.
Dosage for Dishwasher Detergents has been changed, following the recommendations
included in Criterion 1 of EU Ecolabel. This modification alters the quantity of annual
consumption for the overall BoP: from 2.43 kg/year to 2.31 kg/year.

100
The components manufacture includes the environmental impact of the raw material
production, and the transport from the producer to the DD production location. Different
criteria are related to this stage and have been considered to define the eco-innovation
scenario: toxicity to aquatic organisms, biodegradability, excluded and restricted
substances, and sustainable sourcing of palm oil, palm kernel oil, and their derivatives.
The proposed formulation for the eco-innovation scenario is presented in Table 47. On the
other hand, the assumptions considered for the transport have been maintained.
Table 47. Components formulation for eco-innovation scenario. Dishwasher detergent.
Components manufacture BASE-CASE SCENARIO
ECO-INNOVATION SCENARIO
Sodium citrate dihydrate 30.0% 25.0%
Maleic acid/acrylic acid copolymer sodium salt 6.0% 3.0%
Sodium percarbonate 7.0% 15.0%
TAED (92 % active) 2.0% 3.0%
Sodium silicate 10.0% 4.0%
Linear fatty alcohol ethoxylate 2.0% 0.75%
Fatty alcohol alkoxylate - 0.75%
Protease savinase 0.0% 0.01%
Amylase termamyl 0.5% 0.01%
Sodium carbonate 43.5% 43.48%
GLDA ((N,N-Dicarboxymethyl glutamic acid tetrasodium salt))
- 5%
Transport of raw materials (from base-case scenario):
500km (lorry) for road transport, and 15000km (transoceanic ship) for sea transport.
The formulation has been defined considering different EU Ecolabel products currently in
the market. Moreover, values of CDV and biodegradability have been analysed in both
formulations in order to verify that the EU Ecolabelled formulation is compliant with the EU
Ecolabel criteria and that all changes on formulation allow for a better performance on
these criteria.
Table 48. Score for Criteria 2 and 3 of EU Ecolabel for detergents.
CDV ANBO (surf)
aANBO (surf)
ANBO (org)
aANBO (org)
EU criteria thresholds 22500 0 0 1 3
Base-case formulation 29818 0 1.20 1.20 0.00
EU Ecolabel formulation 9073.00 0 0 0.57 0.71
Base-case formulation is not compliant with current EU Ecolabel criteria on ANBO (Organic
substances not readily biodegradable) since the value is higher than the EU Ecolabel
threshold. The formulated product is able to comply with requirements included in Criteria
2 and 3. The new formulation proposed is compliant with all three criteria.
The production of the DD is not covered in the EU Ecolabel scope. Despite there are
different legislations affecting the efficiency of manufacturing process, they are usually
voluntary and some differences may exist between EU countries. A sensitivity analysis has
been conducted to estimate the improvement potential of including good environmental
actions during the production phase. Details and results are provided in section 8.13.
Logistics phase is not directly affected by EU Ecolabel. However, the reduction of the
dosage used in the use stage according to Criterion 1 (Dosage requirements) is affecting
the relative impact of transporting one product. Notwithstanding that the difference is
minor, it has been included in the analysis of the logistics phase. On the other hand, a
sensitivity analysis has been performed assuming the use of vehicles with a lower emission
profile during the transport of the product. Details and results are provided in section 8.13.

101
EU Ecolabel includes a criterion of packaging (criterion 6.a.), where the following
requirements are included:
— Weight/utility ratio (WUR)22: it establishes the ratio between the weight of the primary
packaging and the weight of the number of doses contained in the packaging. Only
considering the primary packaging, the WUR for dishwasher detergents shall not exceed
2.4 g/wash. However, those primary packaging which are made of more than 80% of
recycled materials is exempted of the requirement.
— Design for recycling: the packaging shall be designed to facilitate its recycling. Different
materials and components excluded from packaging elements are listed in the criterion.
According to these requirements, an eco-innovation scenario has been defined for DD
packaging. The base-case scenario includes a flow rap film of PP as primary packaging. For
the eco-innovation scenario this film has been substituted by a water soluble film. The
polyvinyl alcohol (PVA) film is commonly used for packaging due to its characteristics: it is
a water soluble biodegradable film (WaterSol, 2016). Contrarily to the base-case where a
removable packaging is considered, in this case a water soluble film in direct contact with
the tablet as a thin skin is considered. A weight reduction of 30% has been assumed. For
the eco-innovation scenario the weight of the box has been maintained, however 100% of
cardboard recycled has been assumed (Table 49).
Table 49. Eco-innovation scenario for packaging stage.
Packaging BASE-CASE SCENARIO
ECO-INNOVATION SCENARIO
Primary packaging Flow rap film 0.35 g/wash Substituted by a water soluble
plastic (PVA)
Secondary packaging Cardboard box 3 g/wash 100% from recycled material
Shrinkwrap (LDPE) 0.18 g/wash No changes
End of life of packaging is affected by these changes included in the packaging design. The
flow rap film, considering it as water soluble, is not a waste in the eco-innovation scenario.
A sensitivity analysis was performed to assess potential improvements due to increasing
the recycling ratio of the packaging. Details and results are provided in section 8.13.
Regarding the use phase, the EU Ecolabel includes the Criterion 8 on User Information,
where different advices are presented:
— Dosing instructions: the recommended dosage for a standard load shall be included in
the package.
— Environmental information: an advice about using the correct dosage and the lowest
recommended temperature in order to minimise energy and water consumption shall
appear on the packaging.
Moreover, a Criterion about fitness for use of the DD is included in EU Ecolabel: the product
shall have a satisfactory cleaning performance at the lowest temperature and dosage
recommended by the manufacturer.
Dishwashers usually have a large number of programmes. The cleaning result is dependent
on time or programme duration, temperature, and detergent used. Programs included in a
dishwasher vary the duration and the temperature to achieve a good cleaning performance.
For the eco-innovation scenario, the lowest cleaning temperature has been considered,
since the dishwasher detergent should be tested to have a satisfactory cleaning
22 WUR is calculated as follows: WUR = Σ ((Wi + Ui)/(Di * Ri)) Where: Wi: weight (g) of the primary packaging
(i); Ui: weight (g) of non-post-consumer recycled packaging in the primary packaging (i).; Di: number of reference doses contained in the primary packaging (i); Ri: refill index. Ri = 1 (packaging is not reused for the same purpose) or Ri = 2 (if the applicant can document that the packaging component can be reused for the same purpose and they sell refills).

102
performance at the lowest temperature and dosage recommended (Michel et al., 2017).
This assumption leads to reduced use of electricity and water (Table 50).
Table 50. Eco-innovation scenario defined for use phase of dishwashing detergent.
Use BASE-CASE SCENARIO
ECO-INNOVATION SCENARIO
units
Dosage 20 19 g
Electricity 1.42 0.90 kWh
Water 18.5 10 L
There are no Criteria referring to end of life of DD. However, EU Ecolabel includes
requirements that affect the end of life of the product: the restrictions included in the use
phase have an impact reduction in the end of life phase. The water consumed during the
use phase is reduced, and subsequently the wastewater treated is lower.
Parameters modified in the model:
Table 51 reports a summary of the parameters that have been changed in the base-case
model, following the justifications exposed in the rationale.
Table 51. Parameters modified in the eco-innovation scenario for dishwasher detergent.
Dishwasher detergent
Components manufacture
Formulation according to Criteria requirements included in EU Ecolabel (Table 47)
Packaging Substitution of PP film with water soluble film, a weight reduction of 30% has been assumed. For secondary packaging, 100% of cardboard from recycled material
Use phase Reduction of dosage: from 20 to 19 grams of product; electricity: from 1.42 to 0.90 kWh; and water: from 18.5 to 10 litres of water consumed.
End of life The reduction of dosage and water used during use affects the end of life of the product.
Results:
Scenario results were analysed for the single product (Figure 24) and for the overall BoP
(Figure 25). The comparison between both scenarios for dishwasher detergents is
presented in this section (Figure 24). The unit of comparison is one washing cycle.
Therefore, the base-case scenario has been analysed per 20g of product used during one
washing cycle and the results for the eco-innovation scenario are presented per 19g of
product used during one washing cycle.
Most of the impact is related to the use phase, due to the energy consumed during the
washing. The reduction of the resources (water and energy) consumed during this phase
when using an environmentally-friendly program generates an improvement of the
environmental profile of DD. Between 32% and 38% of impact reduction is achieved for all
the impact categories. Moreover, the reduction of water used during the wash cycle has an
environmental benefit in the disposal phase because a lower amount of waste water is
treated (45% of impact reduction on average). This reduction is more evident for those
impact categories where the end of life phase has a higher contribution: human toxicity,
freshwater eutrophication, marine eutrophication, and freshwater ecotoxicity (Figure 24).
Environmental improvements can be found also in the other life cycle stages: Ingredients
also present improvements (7% of reduction on average), together with packaging (45%)

103
although this last life cycle stage has lower contribution to the overall impact. The
distribution stage also shows improvements of around 5% caused by the reduction of dose.
Figure 24. Individual analysis of dishwasher detergent products - Comparative assessment of baseline and eco-innovation scenarios of dishwasher detergent. “Imports” include the transport of
the imported finished products.
(For the abbreviations of the names of impact categories see note to Figure 9)
The average EU consumption considered in the BoP has been adjusted considering the
reduced amount per washing cycle, according to the eco-innovation scenario proposed:
2.31kg of DD consumed for an EU citizen per year.
Dishwasher detergents contribute to 5.8% of the normalized environmental impact of the
BoP household goods in the baseline scenario. Due to the relevance of DD products, the
eco-innovation scenario for DD products allows a significant improvement within the
Detergents category, with reductions of the impact going from 9.4% (FETP) to 15.1%
(IRP). When the overall effect on the BoP is analysed, the most affected impact categories
are: Ionizing radiation, Freshwater eutrophication, and Water resource depletion, with a
reduction of 5.5%, 4.0%, and 3.9% respectively (Figure 25).

104
When the eco-innovation scenario is analysed considering the life cycle stages, it can be
seen that the life cycle stages with higher environmental savings are the use (8.7% of
reduction on average), followed by packaging (0.9% of reduction), and EoL (0.8%).
Components have also small savings (0.1%) (Figure 25).
Figure 25. Scenario 7 in comparison with the baseline scenario (with total from the baseline set as 100%) – split into the contributions of (a) the various product groups and (b) the life cycle stages.
(For the abbreviations of the names of impact categories see note to Figure 9)

105
8.10. Scenario 8 – EU Ecolabel scenario on laundry detergent
Description and aim:
The aim of this scenario is to examine the potential environmental benefits coming from
the use of an EU Ecolabelled product, compared to base-case laundry detergent (LD)
products modelled in the baseline scenario.
Area of intervention:
— Hotspot addressed: impacts from the whole life cycle of laundry detergent.
— Product group: detergents.
— Life cycle stage: components manufacture (formulation of the product) and use
(dosage).
Policy relevance: Commission Decision (EU) 2017/1218 of 23 June 2017 establishing the
EU Ecolabel criteria for laundry detergents.
Background information:
The environmental profile of LD is similar to the one of DD: both include use phases which
are very energy consuming. The life cycle stage with the largest contribution to the overall
environmental impact is the use phase. The energy used for heating the washing water
during the use stage has an important contribution to impact categories as fossil fuel
depletion or global warming potential.
The potential environmental impact of the use stage could be reduced adjusting the
temperature of the washing programme. According to the EU Ecolabel background report
for LD (Arendorf et al., 2014b), a reduction of 10ºC of wash temperature could represent
a reduction of the potential environmental impact of 10% on average across impact
categories.
Other variables influencing the use phase are the energy sources used for heating the
water and the dosage of product used. Using lower dosage in a washing cycle reduces the
environmental impacts in a percentage between 6 to 16%, depending on the impact
category analysed.
Ingredients used in the formulation have an important relevance to different impact
categories: terrestrial ecotoxicity, land transformation, freshwater ecotoxicity, and marine
ecotoxicity. The impact generated depends on the ingredients used: specific ingredients
have a large contribution to some impact categories. The selection of the most
environmentally friendly ingredients could have an important reduction of the total
environmental impact of the scenario, mainly in categories related with toxicity impacts:
human, terrestrial, freshwater and marine ecotoxicity. Moreover, the surfactant origin can
contribute to natural land transformation.
Other life cycle stages that influence the total environmental impact of LD are end of life
and packaging. The wastewater treatment and the non-recycled content of the cardboard
part of the packaging contribute to eutrophication and agricultural land occupation,
respectively. Impact in the end of life could be reduced if the formulation of the product is
adjusted with better environmental friendly ingredients.
Rationale for building the scenario:
Eco-innovation actions included for this product group are defined in this section. For
phases not covered by EU Ecolabel criteria, a sensitivity analysis has been assessed.
Regarding the components manufacture, an improved formulation has been defined to
reduce the environmental impact of LD. EU Ecolabel includes different criteria about
substances used as detergent ingredients. They are Criterion 2: Toxicity to aquatic
organisms, Criterion 3: Biodegradability, Criterion 4: Sustainable sourcing of palm oil, palm
kernel oil and their derivatives, and Criterion 5: Excluded and restricted substances.

106
The proposed formulation for the eco-innovation scenario is presented in Table 52. On the
other hand, the assumptions considered for the transport have been maintained as they
were in the baseline scenario.
Table 52. Components formulation for eco-innovation scenario. Laundry detergent.
Components manufacture BASE-CASE SCENARIO
ECO-INNOVATION
SCENARIO
Water 70.22% 61.69%
Citric acid (builders) 1.61% -
Salts of citric acid and other salts (builders) 0.67% 2.5%
Sodium phosphonate (sequestrants) 0.41% -
Enzymes- Amylase 0.58% 0.1%
Enzymes- Protease - 0.1%
Enzymes- Cellullase - 0.1%
Dye 0.03% -
Fragrances 0.71% 0.2%
Optical brighteners 0.03% -
Optical brighteners 0.03% -
Sodium alkyl ether sulphates (mix of oleo- and petro-based) 3.55% 9.0%
LAS Alkylbenzene sulfonate (petro) 6.83% -
Soap 2.41% 3.0%
Ethoxylates oleochemicals + petrochemical) & other non-ionic surfactants
5.91% 7.0%
Sodium Hydroxide (Alkalinity sources) 1.16% 1.5%
Triethanolamine (Alkalinity sources) 1.16% -
Glycerine (solvents) 1.43% 2.5%
Propylene glycol (solvents) 1.43% 2.5%
Preservatives (other ingredients) 0.46% -
Polymers (other ingredients) 0.46% 0.5%
Sodium chloride (other ingredients) 0.46% 1.8%
Others (other ingredients) 0.46% -
Benzisothiazolinone - 0.1%
Methylisothiazolinone - 0.1%
Glucoside - 7.0%
Phosphonate - 0.3%
Antifoam agent (Polydimethylsiloxane) - 0.01%
Transport of raw materials (from base-case scenario): 500km (lorry) for road transport, and 15,000km (transoceanic ship) for sea transport.
The values of CDV and biodegradability have been analysed in both formulations in order
to verify that the EU Ecolabelled formulation is compliant with the EU Ecolabel criteria and
that all changes on formulation allow a better performance on these criteria (Table 53).
Table 53. Score for Criteria 2 and 3 of EU Ecolabel for detergents.
CDV ANBO
(surf)
aANBO
(surf)
ANBO
(org)
aANBO
(org)
EU criteria thresholds 31,500 0 0 0.45 0.55
Base-case formulation 37,803.00 0 0 0.43 2.02
EU Ecolabel formulation 19,535.00 0 0 0.19 0.19
Base-case formulation is not compliant with EU Ecolabel criteria: it fails to comply with the
score on CDV and biodegradability for organic substances. Some of the organic substances

107
with higher impact, due to their biodegradability have been eliminated in the new
formulation (e.g. Alkylbenzene sulfonate); or their concentration has been reduced in the
formulation: fragrances or sodium alkyl ether sulphates.
As for the other product groups, the production of the LD is not covered in the EU Ecolabel
scope. Similarly to what was done in the other scenarios, a sensitivity analysis has been
conducted to estimate the improvement potential of including good environmental actions
during the production phase. Details and results are provided in section 8.13.
Logistics phase is not covered by EU Ecolabel criteria. A sensitivity analysis has been
performed assuming that vehicles with a better emission profile are used during the
transport of the product. Details and results are provided in section 8.13. Nevertheless, an
improvement in this phase is achieved due to the reduction of the dosage used in the use
phase.
As for Dishwasher Detergents, EU Ecolabel criteria include a criterion of packaging, where
the following requirements are included:
— Weight/utility ratio (WUR): the WUR for primary packaging of laundry detergents shall
not exceed 1.4g of liquid or gel detergent per kg of laundry. However, those primary
packaging made of more than 80% of recycled materials are exempted of the
requirement.
— Design for recycling: the packaging shall be designed to facilitate its recycling. Different
materials and components excluded from packaging elements are listed in the criterion.
Base-case scenario considers a 650mL bottle of HDPE, a cap of PP, and a paper label.
Considering a reference load of 4.5kg, base-case packaging is not compliant with
weight/utility ratio defined in EU Ecolabel. For the eco-innovation scenario, the packaging
capacity has been changed according to the most used liquid laundry packaging: 1,500 mL
of capacity (Table 54).
Table 54. Market share of packaging capacities for Laundry detergents.
Capacity (mL)
Percentage of products (liquid laundry detergent) (%)
1,500 46.15
1,000 23.08
3,000 7.69
960 7.69
2,700 7.69
2,000 7.69
Source: Mintel Database. European Market, 2017.
An estimation of the packaging weight has been defined in order to comply with the
requirements defined in the Criterion 6 of EU Ecolabel:
— HDPE bottle: there are different weights in the market, varying from 40g to 70g
approximately. In order to comply with the WUR requirement, the weight has been
defined as 55g.
— PE cap: standard cap of 7g has been assumed.
— Label: the same weight for the label has been considered in the eco-innovation
scenario, 1g.
Table 55 shows a summary of WUR calculation. End of life of packaging is affected by these
changes included in the packaging design. On the other hand, a sensitivity analysis is
considered increasing the recycling ratio of the packaging. Details and results are provided
in section 8.13.

108
Table 55. WUR calculation. Laundry detergent.
Dosages
per packaging
Packaging weight per
wash
kg of laundry
per wash
Packaging weight per kg of laundry
WUR
Base case
scenario 8.67 4.60 4.5 1.02 2.04
Eco-innovation scenario
21.43 2.94 4.5 0.65 1.30
Regarding the use phase, the EU Ecolabel includes the Criterion 8 on User Information
where different advices are presented: dosing instructions and environmental information
to minimise energy and water consumptions and to reduce water pollution. Moreover, a
Criterion about fitness for use of the LD is included in EU Ecolabel: the product shall have
a satisfactory cleaning performance at the lowest temperature and dosage recommended
by the manufacturer.
Two aspects have been tested in this phase:
— Dosage used during a washing program. The reference dosage defined in Criterion 1 of
EU Ecolabel is 16g/kg of laundry. Considering a load of 4.5 kg for the calculation of the
dosage recommended, the base-case scenario is not compliant with the dosage
requirements. For this reason the dosage has been reduced to 71.4g in the eco-
innovation scenario (changing from 75 to 70mL: 70mL x 1.02g/mL = 71.4 grams)
— Temperature used in the washing program. The base-case scenario considers a
temperature wash of 40ºC, reducing the temperature to the lowest recommended
temperature using eco programs of the washing machine the energy consumed during
the laundry is reduced (TopTen EU).
The eco-innovation scenario has been modelled accordingly (Table 56).
Table 56. Improved scenario defined for use phase of laundry detergent.
Use BASE-CASE SCENARIO
IMPROVED SCENARIO
Units
Dosage 76.5 71.4 g
Electricity 0.638 0.488 kWh
Water 50 50 kg
The restrictions included in the use phase have an impact reduction in the end of life
phase: reduction of dosage used per washing cycle.
Parameters modified in the model:
Table 57 reports a summary of the parameters that have been changed in the base-case
model, following the justifications exposed in the rationale.
Table 57. Parameters modified in the eco-innovation scenario for laundry detergents.
Laundry detergents
Components manufacture
Formulation according to Criteria requirements included in EU Ecolabel (Table 52).
Packaging Increase of packaging capacity (1500 mL) and reduction of material to comply with packaging requirements.
Use phase Reduction of dosage: from 75 mL to 70 mL of product; electricity: from 0.638 to 0.488 kWh
Results:
Scenario results were analysed for the single product (Figure 26) and for the overall BoP
(Figure 27). The eco-innovation profile of this product includes a reduction of the dosage

109
used, in order to comply with Criterion 1 of dosage requirements. The comparison has been
done considering the different reference dosage defined in each scenario: 75mL for the
base case scenario and 70mL for the improved scenario.
The most impacting phases are the use stage and the disposal of the product (wastewater
treatment) (Figure 26). The reduction of the energy used during the washing machine cycle
affects the impact on the use stage, decreasing the environmental impact of the product
between 15% and 23%, depending on the impact category considered. The eco-innovation
scenario does not include an improvement in the end of life phase, for this reason the
impact of this life cycle stage is the same as in the baseline scenario.
Figure 26. Individual analysis of laundry detergent products - Comparative assessment of baseline and eco-innovation scenarios of laundry detergent. “Imports” include the transport of the imported
finished products.
(For the abbreviations of the names of impact categories see note to Figure 9)
For the land use impact category, the eco-innovation scenario represents a higher impact
than the base-case due to the raw materials used in the formulation: the proposed
formulation includes glucoside, being the highest contributor to the impact (Figure 26).

110
Figure 27. Scenario 8 in comparison with the baseline scenario (with total from the baseline set as
100%) – split into the contributions of (a) the various product groups and (b) the life cycle stages.
(For the abbreviations of the names of impact categories see note to Figure 9)
Laundry detergent products represent 4.5% of the normalized environmental impact of the
BoP in the baseline scenario. When assessing a 100% replacement of LD products for EU
Ecolabelled LD products, the environmental impact of the whole BoP
Regarding the changes on the overall BoP environmental impact, the relative impact of the
introduction of EU Ecolabel LD product goes from 1.8% of reduction in ozone depletion to

111
0.22% in marine eutrophication. For the land use impact category, the environmental
impact considering the EU Ecolabel LD product increases by 0.3% (Figure 27).
The inclusion of Eco-innovation LD scenario allows an improvement of Detergents category,
with a reduction of its impact going from 1% (MEP) to 7% (ODP) for the impact of this
product group. On the contrary, the impact to land use increases by 4%.
When the reduction of impacts of BoP are analysed at the life cycle stage level, it can be
seen that the life cycle stage with the highest environmental savings take place in the use
phase (2.7% of reduction on average), followed by packaging (0.6% of reduction).
Components have also small savings of 0.2% on average (Figure 27).

112
8.11. Scenario 9 – EU Ecolabel scenario on upholstered seat
Description and aim:
The aim of this scenario is to examine the potential environmental benefits coming from
the use of an EU Ecolabelled product, compared to base-case upholstered seat (sofa)
modelled in the baseline scenario.
Area of intervention:
— Hotspot addressed: impacts from the whole life cycle of upholstered seats.
— Product group: furniture.
— Life cycle stage: components manufacture (choice of materials, design for disassembly)
and EoL (recycling of materials).
Policy relevance: Commission Decision (EU) 2016/1332 of 28 July 2016 establishing the
ecological criteria for the award of the EU Ecolabel for furniture.
Background information:
It is worth to note that the LCA results of the baseline scenario show that furniture is one
of the product groups included in the BoP with higher contribution to the overall impact
compared to other product groups (also due to the weight of the representative products
and the amount of materials used to produce them).
The main environmental impacts along the upholstered seat’s life cycle stages are mainly
due to:
— Energy used to extract and transport the raw materials
— Use of Coal in the production of the electricity needed to produce the flame retardants
(contribution to particulate matter).
Rationale for building the scenario:
This section summarizes the eco-innovation actions included in the upholstered seat eco-
innovation scenario and the rationale for all the assumptions taken.
Regarding the components manufacture, eco-innovation measures selecting more
sustainable materials (such as organic cotton, wood, and other tree-based products with
chain of custody certification FSC, etc.) could be performed to improve the upholstered
seat. However, the effects of some of the measures (such as the environmental benefits
related to sustainable management of forest, see Table 24) cannot be fully analysed
through the LCA. Therefore, the type of components included in the EU Ecolabelled sofa is
assumed to be similar to the ones in the base-case.
Regarding the flame retardants, nitrogen- and phosphorus-based flame retardants have
been maintained since they are classified as non-hazardous thereby complying with
Criterion 2 of the EU Ecolabel for furniture.
The eco-innovation introduced in the scenario is the use of only one type of textile instead
of two. Polyester textile is employed in the eco-innovation scenario instead of the mixed
cotton and polyester textile of the base-case scenario. The fact of using only one textile
within the production process of the upholstered seat will benefit the recycling process at
the end of life of the product. Therefore, as it is shown in Table 58 the final amount of
textile in the eco-innovation scenario is 7.2 kg of polyester.

113
Table 58. Materials used in the manufacturing of upholstered seat.
Components
BASE-CASE SCENARIO ECO-INNOVATION SCENARIO
Formulation (%)
Quantity (kg)
Formulation
(%)
Quantity (kg)
Medium density particleboard (MDP)
61.76 37.8 61.76 37.8
Solid timber 7.84 4.8 7.84 4.8
Steel 7.84 4.8 7.84 4.8
Textile, cotton 7.84 4.8 0 0
Textile, polyester 3.92 2.4 12 7.2
Polyurethane foam 8.82 5.4 8.82 5.4
Phosphorus (used in flame retardants)
0.98 0.6 0.98 0.6
Melamine (flame retardant) 0.98 0.6 0.98 0.6
Since the production process of the upholstered seat is not covered by the EU Ecolabel,
it has not been considered for the eco-innovation scenario. However, different EU
environmental policies referring to the manufacturing process such as the Environmental
Management and Audit Scheme EMAS (EMAS webpage) and the international standard ISO
14001 are well implemented along EU industry with significant environmental benefits
demonstrated. A sensitivity analysis has been done to estimate the effect of energy
efficiency measures applied at the manufacturing stage on the environmental profile of the
final product. Details and results are provided in section 8.13.
The logistics stage of the upholstered seat is not covered by the EU Ecolabel, therefore
no improvements are considered for the eco-innovation scenario.
An additional sensitivity analysis has been performed considering road vehicles with a
better emission profile that can improve the environmental profile of the final product.
Details and results are provided in section 8.13.
Since the EU Ecolabel does not settle any specific requirement regarding the packaging,
the eco-innovation scenario does not consider any improvements at this stage.
A sensitivity analysis has been performed based on the selection of sustainable materials
as well as the percentage of the recycled content. Details and results are provided in section
8.13.
The use phase has been maintained the same as the base-case scenario since no EU
Ecolabel criteria is related to the use phase.
According to EU Ecolabel criteria, the upholstered seat should be recyclable at the end of
life; its design should therefore have considered disassembly as a feasible option, fulfilling
the EU Ecolabel Criterion 9 Requirement for final product. The new eco-innovation scenario
takes into account higher recycling rates than the base-case due to the improvements of
the selected components in the design phase and the manufacturing for disassembly.
The scenarios have been modelled based on existing initiatives and publications that have
demonstrated the feasibility of reusing and recycling upholstered seat products, therefore
the base-case assumption of 100% of end of life products going to landfill and incineration
will be reduced with the incorporation of a recycling pathway.
The European Environmental Bureau (EEB) has commissioned a study in 2017 to foster
the transition to a circular economy furniture sector at EU level where the baseline scenario
tackles a 10% recycling of upholstered seats (Forrest et al., 2017). The same study
mention the example of the French Expanded Product Responsibility law, which sets a re-
use and recycling target of 45% for household furniture waste by 2017 in France.

114
Therefore, the eco-innovation scenario has been modelled with 10% of recycling (wood,
metal, and plastic streams) and the rest going to landfill (50%) and incineration (40%)
(Table 59).
Table 59. End of life for upholstered seat in the eco-innovation scenario.
Recycling rates BASE-CASE SCENARIO
ECO-INNOVATION SCENARIO
Recycling Wood, Metal and
Plastic: 0% Wood, Metal and
Plastic: 10%
Landfill 55 % 50 %
Incineration 45 % 40 %
Parameters modified in the model:
Table 60 reports a summary of the parameters that have been changed in the base-case
model, following the justifications exposed in the rationale.
Table 60. Parameters modified in the eco-innovation scenario for upholstered seat.
Upholstered Seat
Components manufacture
Design according to EU Ecolabel restrictions (details in Table 58)
End of life Recycling rates improvement according to good disassembly design, considering
10% recycling of wood, metal and plastic: 50% landfill and 40% incineration.
Results:
Scenario results were analysed for the single product (Figure 28) and for the overall BoP
(Figure 29). All the above assumptions have been modelled, and the environmental
performance of one piece of furniture (sofa, 60 kg) based on eco-innovation measures has
been calculated.
The comparison of the base-case and the eco-innovation scenarios illustrates that the new
scenario has a lower environmental impact. The impact categories that show a higher
environmental improvement are Freshwater ecotoxicity (51.4%), Land use (46.1%),
Human toxicity, cancer effects (34.8%), and Water resource depletion (34.6%) (Figure
28).
When life cycle stages of upholstered seat products are examined, most of them have the
same environmental impact in both scenarios (base-case and eco-innovation). The main
advantages on the environmental profile of the new scenario of upholstered seat are in the
end of life phase due to the recycling rate of the components when the product becomes
a waste. Another improvement can be seen in the materials contribution to the overall
impact.

115
Figure 28. Individual analysis of upholstered seat products - Comparative assessment of baseline
and eco-innovation scenarios of upholstered seat. “Imports” include the transport of the imported finished products.
(For the abbreviations of the names of impact categories see note to Figure 9)
Upholstered seat products contribute to 3.1% of the normalized impact of the overall BoP
household goods. When the whole BoP is analysed with the new upholstered seat scenario,
changes on the environmental profile of the whole BoP are generally low (below 2%), being
Freshwater ecotoxicity (-2.0%) and Land use (-1.7%) the ones showing the largest
decrease (Figure 29).
The eco-innovation scenario for upholstered seats allows a general improvement within the
furniture product group, with a reduction in Freshwater ecotoxicity (14.8%), Water
resource depletion (11.7%), Human toxicity, cancer effects (10.4%), and Land use (7.3%).
When the comparison of the two scenarios is analysed by life cycle stage, the main
environmental savings are found in the life cycle stages of components manufacture (1.2%
of reduction of impacts) and EoL (1.9% of reduction) (Figure 29).

116
Figure 29. Scenario 9 in comparison with the baseline scenario (with total from the baseline set as
100%) – split into the contributions of the various product groups.
(For the abbreviations of the names of impact categories see note to Figure 9)

117
8.12. Scenario 10 - Overall potential from the analysed EU Ecolabel
scenarios
In order to analyse the combined potential effect of the five eco-innovation scenarios
testing the EU Ecolabel for single product types, they have been assessed in a combined
scenario, including all the modifications illustrated before. In this scenario, it is firstly
assumed that 100% of the products in the market belonging to the product types affected
by modifications (liquid soap, shampoo, dishwashing detergent, laundry detergent, and
upholstered seat) would implement the innovations presented, i.e. would respect EU
Ecolabel criteria for each specific product group. The assumption of 100% uptake is quite
unrealistic, but it is used to assess the maximum improvement potential related to the eco-
innovations tested.
A more realistic assumption has been tested as well, as second option. In this case, 20%
uptake by the product on the market is assumed, with reference to the aimed strictness of
the EU Ecolabel criteria, which should correspond to the best 10-20% of the products
available on the Community market in terms of environmental performance, according to
the EU Ecolabel regulation.
In this section the comparative results for the eco-innovation BoP including the five eco-
innovation scenarios are represented. The categories modified in the eco-innovation BoP
are Personal care (shampoos and liquid soaps), Detergents (dishwasher and laundry
detergents), and Furniture (upholstered seats).
Results are shown by type of product and by life cycle stage for the case of 100% market
uptake (Figure 30). The overall relative reduction of the BoP Scenario in comparison with
the base-case by impact category indicates that all values are reduced for all impact
categories. The highest reduction is obtained for ionising radiation (7.5%), followed by
water depletion (6.3%), ozone depletion (5.5%), and freshwater eutrophication (5.4%),
whereas the lowest reduction is observed for resource depletion (1.8%) (Figure 30). The
product category with the highest improvements is detergents, followed by furniture.
Personal care has limited effect to the overall reduction of impacts of the eco-innovation
scenario, because of their relatively limited contribution to the overall impact of the BoP in
the baseline scenario.
When the comparison of the baseline and eco-innovation BoP is done by life cycle stage, it
can be observed that higher savings are found in the use stage (between 5% and 17% of
reduction, depending on the impact category). The packaging phase shows reductions up
to 12% in Land use, although an increase in particulate matter. End of life stage also has
relevant reductions in most of the impact categories (up to 59% in ozone depletion),
although trade-offs take place in ionizing radiation and land use. Production and logistics
life cycle stages are the ones contributing the least to the reductions in the environmental
impact (<0.5%) (Figure 30).
The relative reduction in percentage per impact category and product is detailed in Table
61, for both assumptions on uptake (100% and 20%).

118
Figure 30. Scenario 10 in comparison with the baseline scenario (with total from the baseline set
as 100%) – split into the contributions of the various product groups.
(For the abbreviations of the names of impact categories see note to Figure 9)

119
Table 61. Relative reductions of environmental impacts for Eco-innovation scenarios. Reductions are above 5% (green), between 1.5% and 4.99%
(yellow) and below 1.49% (red).
Considering 100% of uptake of Eco-innovation scenarios (%)
Considering 20% of uptake of Eco-innovation scenarios (Goal of market share of EU Ecolabel) (%)
TOTAL
BoP
Liquid
soap Shampoo LD DD
Uphols.
seat
TOTAL
BoP
Liquid
soap Shampoo LD DD
Uphols.
seat
GWP -3.60 -0.03 -0.04 -0.66 -2.42 -0.40 -0.72 -0.01 -0.01 -0.13 -0.48 -0.08 ODP -5.45 0.00 0.11 -1.82 -3.37 -0.31 -1.09 0.00 0.02 -0.36 -0.67 -0.06
HTC nc -3.21 -0.01 -0.01 -0.40 -2.30 -0.48 -0.64 < -0.01 < -0.01 -0.08 -0.46 -0.10 HTC c -2.26 -0.01 -0.01 -0.24 -0.89 -1.11 -0.45 < -0.01 < -0.01 -0.05 -0.18 -0.22 PMFP -2.34 -0.02 -0.03 -0.34 -1.26 -0.67 -0.47 < -0.01 -0.01 -0.07 -0.25 -0.13 IRP -7.55 -0.01 -0.02 -1.64 -5.49 -0.37 -1.51 < -0.01 < -0.01 -0.33 -1.10 -0.07
POFP -2.81 -0.01 -0.02 -0.48 -1.75 -0.41 -0.56 < -0.01 < -0.01 -0.10 -0.35 -0.08 AP -3.90 -0.03 -0.03 -0.73 -2.43 -0.66 -0.78 -0.01 -0.01 -0.15 -0.49 -0.13 TEP -3.10 -0.02 -0.03 -0.45 -1.65 -0.94 -0.62 < -0.01 -0.01 -0.09 -0.33 -0.19 FEP -5.39 -0.01 -0.01 -0.65 -4.01 -0.69 -1.08 < -0.01 < -0.01 -0.13 -0.80 -0.14 MEP -2.99 -0.01 -0.02 -0.22 -2.03 0.00 -0.60 < -0.01 < -0.01 -0.04 -0.41 0.00 FETP -3.15 -0.01 <0.01 -0.28 -0.85 -1.99 -0.63 < 0.01 < -0.01 -0.06 -0.17 -0.40 LU -2.31 0.01 -0.01 0.31 -0.85 -1.73 -0.46 < -0.01 < -0.01 0.06 -0.17 -0.35
WRD -6.32 -0.01 -0.03 -1.01 -3.91 -1.36 -1.26 < -0.01 -0.01 -0.20 -0.78 -0.27 RD -1.81 -0.01 -0.01 -0.41 -1.20 -0.17 -0.36 < -0.01 < -0.01 -0.08 -0.24 -0.03

120
8.13. Sensitivity analyses on EU Ecolabel scenarios
The results for the different analysis performed are presented in this section, in relation to
those improvement actions, which are not included in the scenarios since they are not
directly covered by EU Ecolabel, but they have been identified as being feasible and having
a potential relevant improvement potential on the overall products impact.
As illustrated in Table 26, the improvement options analysed are: the reduction of
electricity use during the production phase of all the products considered (5%, 10%, and
20% reduction compared to the baseline scenario); the use of Euro 6 lorries instead of
Euro 4 ones for distribution of goods; and an improvement of the recycling rates for
packaging materials at their EoL (60% or 100% recycling of plastic and 90% or 100%
recycling of cardboard). In addition, two sensitivity analyses were focused specifically on
soaps and shampoos, acting on consumers’ behaviour, assuming that citizens that buy EU
Ecolabelled products would be more environmentally friendly and would reduce the amount
of water used per washing (by 5% or 10%). This change would have an impact also on the
amount of wastewater to be treated, so this effect is analysed too.
The reasoning followed to define the assumptions for the sensitivity analyses presented
before is reported in the paragraphs below.
Reduction of industrial processing energy
Public sustainability reports including energy consumptions from key companies in the
market have been gathered to determine a percentage of reduction of energy in
comparison to base-case scenario.
Good practices identified to reduce the energy consumption are:
— Optimisation of manufacturing procedures with the aim of using less washing water
and/or reducing its temperature.
— Insulation measures for buildings (walls, windows) to reduce energy consumption for
heating and air conditioning; same for hot water piping;
— Optimisation of production planning (sequence of batches produced using same
equipment);
— Replacement of old equipment by new, energy efficient electrical devices (e.g. pumps,
extruders).
— Energy recovery from hot wastewater or air.
Some goals and reductions from reference industries are detailed as example from their
sustainability reports, for instance:
— P&G: reduction of 15% from 2010 to 2015; goal of reduction of 20% from 2010 to
2020. (P&G. 2015)
— Henkel: goal of reduction of 15% from 2010 to 2015. (Henkel, 2014)
Improvement of road transport vehicles for distribution
In the baseline scenario transport is modelled assuming the use of lorries with an emission
profile compliant with Euro 4 standard. For the sensitivity analyses a more advanced
emission profile, i.e. Euro 6, has been assumed.
Increasing recycling ratio of packaging End of Life (EoL)
The following considerations were taken into account to define the sensitivity analysis on
packaging EoL:
— The packaging is 100% recyclable, according to EU Ecolabel criteria, which require
packaging designed for recycling without incompatible materials.

121
— The product will be empty at their end of life, thank to dosage design and according to
EU Ecolabel.
— The consumer profile buying EU Ecolabelled products is proved to have a higher
environmental awareness, so that it is assumed that they dispose correctly the
packaging waste for their recycling.
Reduction of water use during use and EoL
During the last years a reduction of the domestic water consumption in many EU Member
States could be observed as a result of various factors (Eurostat, 2017), including the
reduction of water losses through improved maintenance of the networks, the introduction
of water-saving household appliances and an increasing level of awareness concerning of
consumers.
According to a Eurobarometer survey (2017), the majority of EU citizens think that
protecting the environment is very important to them personally. Findings have remained
broadly consistent over the last ten years, although since the last survey there has been a
slight increase in the proportion saying it is ‘very important’: 56% compared with 53% in
2014. When asked about environmental activities they have undertaken in the past six
months, 27% of respondents stated that in the last six months they had cut down their
water consumption, among other actions such as separating most of their waste for
recycling (65%), buying local products (43%), cut down their energy consumption (35%)
or buying products marked with an environmental label (19%).
For this reason, a sensitivity analysis has been done reducing the quantity of water use in
a 5% and a 10%, in order to see how this measure would affect the overall environmental
impact of the products.
Results:
The improvement actions that show higher potential for reducing the impacts are the
reduction of water use at the use phase of products and the improvement of recycling rates
for packaging materials.
The reduction of water use (and of wastewater treated) could contribute to improve the
environmental profile of liquid soap and of shampoo, because these two stages are the
most impacting ones considering the life cycle of those products. For both products, the
impact on human toxicity (cancer and non-cancer effects), freshwater eutrophication,
marine eutrophication and water depletion is reduced by 10%, whereas a 5% reduction is
observed for climate change, particulate matter, ionising radiation and acidification.
Improving the recycling rates of packaging materials at the EoL of packaging has a mixed
effect on the environmental profile of liquid soap and shampoo. In the case of 100%
recycling, the impact on climate change and photochemical ozone formation is reduced by
10% compared to the baseline scenario. However, a slight increase is observed for other
impact categories (such as ionising radiation, freshwater eutrophication and water
depletion, probably because of the use of electricity in the treatment of materials before
recycling. A similar pattern, but with more limited effects (3% reduction of the impact on
climate change) is observed for the laundry detergent, whereas the action has negligible
effect on the profile of dishwasher detergent and upholstered seat.
The use of Euro 6 lorries for the distribution of products has some effect only on the profile
of liquid soap (5% reduction of the impact on terrestrial eutrophication and 4.6% reduction
of the impact on photochemical ozone formation) and on laundry detergent (2% reduction
on the same impact categories mentioned for the soap). For the other products, the effect
of this action can be considered negligible.
The improvement of energy efficiency of the production phase, which implies a reduction
in the amount of energy used, seems to be a less relevant option for all the products
considered. The highest reduction (3%) is obtained for ozone depletion in the profile of the
shampoo, whereas the effect is generally below 1% for the other products and even lower
(below 0.1%) for the detergents.

122
8.14. Summary of results from scenario analysis
Table 62 represents a summary of the results of the scenarios assessed for the BoP household goods, as variation (%) of impact compared
to the baseline scenario. Results that show an increase compared to the baseline are highlighted in red, whereas results that show a
reduction are highlighted in green.
Table 62. Summary of results of the scenarios analysed. Results are expressed as variation (%) compared to the baseline BoP household goods.
(1) Abbreviations: GWP (Climate change), ODP (Ozone depletion), HTP nc (Human toxicity, non-cancer effects), HTP c (Human toxicity, cancer effects), PMFP (Particulate
matter), IRP (Ionizing Radiation HH), POFP (Photochemical ozone formation), AP (Acidification), TEP (Terrestrial eutrophication), FEP (Freshwater eutrophication), MEP (Marine eutrophication), FETP (Freshwater ecotoxicity), LU (Land use), WRD (Water resource depletion), RD (Mineral, fossil & renewable resource depletion).
CC ODP HTP-nc HTP-c PM IR POF AP TEU FEU MEU ECOTOX LU WU FRD MRD
SC.1: Larger use of TCF pulp -0.3% -0.2% -0.1% -0.7% 3.7% -0.2% -0.5% -0.2% -0.6% -0.1% -0.4% -0.3% 1.0% 0.4% -0.3% -0.1%
SC.2a: EU electricity mix for textile production -6.1% 2.9% -1.9% 0.0% -13.1% 8.9% -6.5% -7.6% -6.3% -0.1% -4.2% -0.1% 0.9% -0.1% -2.1% 1.4%
SC.2b: 2030 EU electricity mix for textile production -8.0% 2.6% -3.9% -0.8% -14.0% 2.6% -8.7% -11.8% -8.2% -2.9% -5.4% -0.4% 1.8% -0.5% -4.1% 2.0%
SC.3a: Improving reuse (25% reuse) -4.0% -2.4% -2.9% -1.6% -4.5% -2.4% -3.9% -4.1% -3.9% -2.4% -2.9% -4.2% -5.8% -3.5% -3.4% -3.8%
SC.3b: Improving reuse (100% reuse) -16.0% -9.4% -11.4% -6.3% -18.2% -9.6% -15.4% -16.4% -15.6% -9.7% -11.5% -17.0% -23.0% -13.8% -13.7% -15.2%
SC.4: Textiles with recycled input materials -0.7% -0.2% -0.4% -0.4% -0.7% -0.1% -0.7% -0.6% -0.5% -0.4% -0.3% -0.3% -0.1% -0.7% -1.4% -0.8%
SC.5: Ecolabel scenario on liquid soap 0.0% 0.0% 0.0% 0.0% 0.0% 0.0% 0.0% 0.0% 0.0% 0.0% 0.0% 0.0% 0.0% 0.0% -0.1% 0.0%
SC.6: Ecolabel scenario on shampoo 0.0% 0.1% 0.0% 0.0% 0.0% 0.0% 0.0% 0.0% 0.0% 0.0% 0.0% 0.0% 0.0% 0.0% -0.1% 0.1%
SC.7: Ecolabel scenario on dishwasher detergent -2.2% -2.3% -2.3% -0.9% -0.8% -5.3% -1.6% -2.3% -1.6% -4.0% -1.9% -0.8% -0.7% -1.4% -3.3% -1.3%
SC.8: Ecolabel scenario on laundry detergent -0.6% -1.4% -0.7% -0.2% -0.2% -1.6% -0.4% -0.7% -0.4% -0.6% -0.2% -0.2% 0.0% 0.0% -1.0% -1.1%
SC.9: Ecolabel scenario on upholstered seat -0.4% -0.3% -0.6% -1.1% -0.6% -0.4% -0.4% -0.6% -0.9% -0.7% -0.7% -1.7% -1.7% -2.8% -0.2% -0.2%
SC.10: Overall potential form Ecolabel scenarios -3.4% -3.9% -3.6% -2.2% -1.7% -7.2% -2.6% -3.8% -2.9% -5.4% -2.9% -2.8% -2.4% -4.2% -4.7% -2.5%

123
The scenario analysis done on the BoP household goods helped to identify some potential
trade-offs that may occur when applying some of the actions that were tested as potential
improvements for the sector. Some of them are related to the use of a different electricity
mix (as in scenario 2a and scenario 2b), which reduces the impact on some impact
categories (such as climate change) but generates also additional impacts on other impact
categories (e.g. ionising radiation, due to the higher share of nuclear energy compared to
the energy mix used in the baseline).
Another issue that may generate additional impacts along with reduction of impacts for
some categories is the change of raw materials. In the scenarios analysed, this happened
for the EU Ecolabel formulation of the shampoo (+0.1% impact on ODP) and of the laundry
detergent (+0.3% on LU, due to the choice of natural-based surfactants). However, in
these cases the additional impact generated is limited (below 0.5%).
Similarly, a larger use of TCF pulp (tested in scenario 1) proved to be useful for reducing
the impact on freshwater ecotoxicity (which is the main aim of chlorine-free bleaching),
but could generate additional impacts on PMFP (with an increase that is larger than the
reduction obtained for FEP) and HTP-nc. Therefore, results of scenario 1 confirm the choice
of not including the use of TCF pulp as a mandatory EU Ecolabel criterion.
Apart from the use of a less impacting energy mix, also reuse of products seems to have
high potential for reducing the impact associated with purchase and use of household
goods. The expected reduction is obviously proportional to the share of products that are
reused. In scenario 3b it is assumed that the share of EU citizens that declared to be willing
to reuse products would do it for 100% of the furniture pieces and clothes that they own.
This means that the potential effect of this kind of action could be even larger, if a larger
share of population would engage in reuse and if reuse would be extended to other types
of household goods (e.g. footwear).
Regarding the EU Ecolabel scenarios, results obtained from the assessment of each
individual product by functional unit has shown that significant environmental
improvements can be obtained at product level. For these individual assessment, it can be
observed that the inclusion of eco-innovation actions have significant environmental
savings for some products and impact categories, going from 1% to 41% of impact savings
depending on the product and impact category. Regarding the rinse-off cosmetic products,
the improvements by product are quite limited since the life cycle stages with higher
contributions (use and EoL) have not been modelled in the eco-innovation scenarios.
Improvements in liquid soap and shampoos products span from 12% to 0.1%; liquid soap
has the higher improvement 12% (GWP or POFP); 10% (GWP) for shampoos. Among the
detergent products considered, the dishwasher detergent shows the highest reduction in
all the impact categories, compared to the laundry detergent. This is partially due to the
reduction in water use that is assumed for the dishwasher detergent. The highest reduction
of impact for dishwasher is on HTP nc (38%), followed by FEP, MEP and WRD (36%). For the laundry detergent, the highest reduction is on ODP (26%) and IRP (20%). Finally, the EU
Ecolabel version of upholstered seats shows relevant improvements by functional unit,
mainly on LU (41%) and FETP (37%).
The effect of choosing EU Ecolabel products is assessed on the whole BoP by considering
two hypotheses: 100% of uptake of eco-innovation products and considering the market
share goal of EU Ecolabel products (20%).
For the comparative results of BoPs, the influence of each product group has been
evaluated individually, showing limited improvement potential, due to the relative weight
of each product in the composition of the BoP. Those product groups with a lower influence
on the overall BoP improvement are liquid soaps and shampoos, whereas laundry detergent
has the highest influence on the environmental impact of the whole BoP household goods.
The comparison between the baseline scenario and scenario 10 with the overall effect of
choosing EU Ecolabel products (with the five product categories modified) shows significant
improvements, with reduction in all impact categories going from 1.78% (as RD) to 7.26%

124
(IRP). The highest environmental savings are found in the following life cycle stages: EoL
(average of 13.4% of reduction) use stage (average of 11.4% of reduction), followed by
packaging (2.2%) and components (1%).
From the results of the study, the following main conclusion can be drawn:
— All EU Ecolabel scenarios, based on EU Ecolabel criteria, improved the environmental
profile of the products, with significant variations by functional unit. This proves that
EU Ecolabel is a good tool to promote more sustainable products within the market,
contributing to a more sustainable system of production and consumption.
— Regarding the results obtained in the sensitivity analyses performed, it can be
concluded that the measures tested (e.g. energy efficiency in manufacturing) have a
very limited effect on the environmental impacts related to the production and EoL
stages. This fact confirms that the EU Ecolabel criteria already cover the aspects that
are more relevant for the environmental profile of the products considered (since
sensitivity analyses have only been run on issues for which no EU Ecolabel criteria is
defined)
— The improvement of the whole BoP when the five EU Ecolabel scenarios are considered
in comparison with the base case is quite limited, although all impact categories
decrease their values. It can be stated that the use of EU Ecolabel products for the
selected products is not sufficient to reduce significantly the impact of consumption
associated to household goods. Environmental savings have only limited significance if
a 100% market composition by EU Ecolabel products is assumed. If 20% of EU
Ecolabelled products are considered, variations on the results are not relevant in
comparison with the base-case scenarios. These results obtained can be explained by
different factors, including some limitations of the study, which are discussed below.
The most important limitation to these results is that only a small portion of products of
the whole BoP of Household goods have been modified (5 out of 30 products), in only three
out of the eight product groups (personal care, detergents and furniture). Some of the
product groups and products that were not modified in the EU Ecolabel scenarios (e.g.
clothes, footwear, sanitary products, and bed mattresses) are currently covered by EU
Ecolabel criteria, but they were not modified compared to the baseline scenario. For this
reason, it would be recommendable to extend the analysis to other products and product
categories in order to be able to assess the effect of an eco-innovation scenario covering
as many products as possible in order to have a more representative sample of EU
Ecolabelled products in the overall EU Ecolabel scenario. This also suggests that having the
possibility to award the EU Ecolabel to more product groups on the market could provide
significant environmental benefits.

125
9. Conclusions
The Basket of Products (BoP) household goods has been built to assess the impact
associated to the purchase and use of household goods in the EU. The baseline model
includes a selection of product groups and it is built with a bottom-up approach, using life
cycle inventories of representative products for each product group.
In total, 30 representative products were modelled23, covering the following product
groups: detergents, personal care (rinse-off cosmetics), absorbent hygiene products,
furniture, bed mattresses, footwear, clothes (textile products) and paper products. The
amount of representative products in the functional unit of analysis (i.e. consumption by
an average EU citizen in one year) was relatively low (in some cases, below 50% of the
entire consumption in the respective product group). Therefore, it was decided to upscale
the apparent consumption of each product (i.e. the amount included in the basket) so to
represent the 100% of the apparent consumption of the product groups selected. However,
it has to be considered that the product groups selected for the BoP do not represent all
the household goods that EU citizens purchase and use in their everyday life. There is a
multiplicity of household good which are consumed and not modelled so far. The impact
generated by those product groups could be considered in the future, by enlarging the list
of representative products considered or by complementing the bottom-up approach
followed for the BoP with information coming from top-down analysis (such as input-output
assessment of household consumption). In general, the use of representative products
may reduce the representativeness of the model, because it implies the exclusion of
products that are less relevant in terms of the amount consumed but that potentially may
be associated with high impact intensity. However, the use of a bottom-up approach, with
process-based inventories allows for having more detailed life cycle inventories, and it is
more useful when modelling scenarios. Moreover, the bottom-up approach allows for
periodical updates of the BoP: the amount and structure of consumption could be updated
to more recent reference years using data on apparent consumption (i.e. BoP composition
and relative relevance of representative products) taken from Eurostat (Prodcom).
The baseline model of the BoP household goods (representing the annual purchase and
use of household goods by EU citizens for the reference year 2010) was assessed using
ILCD impact assessment method and also using the LCIA method adopted in the context
of the EU Environmental Footprint (called here “EF 3.0”), where some impact categories
were updated with a selection of recent impact assessment models and factors.
According to the results of the hotspot analysis, the life cycle stage that contribute the
most to the overall impact is the manufacture of components (namely due to the
environmental impacts of the extraction, manufacturing and the supply-chain of each
individual raw materials, ingredients or intermediate products) that are used to produce
the final products. Among the product groups included in the BoP, the ones that contribute
the most to the overall impact are detergents, furniture, paper products and clothes. This
contribution is the result of two combined factors: i) the environmental profiles (covering
around 15 midpoint categories) of the representative products analysed, and ii) the amount
of products included in the functional unit (i.e. amount of products purchased by an
average citizen in one year). Each product group has different hotspots in terms of the
type of impact and the life cycle stage in which the impact is generated.
Regarding the relevance of impact categories, the most relevant impacts of the BoP
household goods occur in abiotic resource depletion, water depletion, and human toxicity,
23 Detergents (all-purpose cleaners and sanitary cleaners, detergents for dishwashers, detergents for hand
dishwashing, liquid laundry detergents, and powder laundry detergents), sanitary products (absorbent hygiene products: baby diapers, sanitary pads, tampons, and breast pads), personal care (rinse-off cosmetic products) (bar soaps, liquid soaps, shampoos, and hair conditioner), furniture (bedroom wooden furniture, kitchen furniture, upholstered seats, non-upholstered seats, wooden tables), bed mattresses, footwear (work and waterproof (WW), sport, leisure, and fashion footwear), clothes (textile products) (t-shirt, blouse, trousers, and jeans), paper products (newspapers, books, and toilet paper).

126
cancer effects. The relative share of these categories varies according to the set of
normalisation factors used (EU-27 or global references). However, when applying the EF
3.0 impact method, freshwater eco-toxicity becomes the most relevant category, followed
by ionising radiation and fossil resources used (applying global normalization factors).
Between 2010 and 2015 most of the reference products showed an increase in the amount
consumed per EU citizen. This fact resulted in an increasing trend of the environmental
impact of the production and consumption of household goods in the EU, due to a larger
consumption. The baseline for the year 2010 was used to test ten scenarios: four scenarios
of eco-innovation (larger use of TCF pulp, reduced impact of electricity in the textile sector,
improved re-use, and employing textiles with recycled input material for clothes
manufacturing) and six EU Ecolabel scenarios (liquid soap, shampoo, dishwasher
detergent, laundry detergent, upholstered seat, and a combined scenario with all these
products). Among the scenarios assessed, the options that allow for a higher reduction of
impacts are the ones related to the use of less impacting electricity mixes (Scenario 2 for
clothes) and to the reuse of products (Scenario 3 for textile products and furniture). Results
of the hotspot analysis for the baseline scenario and results of scenario 2a and scenario 2b
show that for products that are largely imported from outside the EU (textile products),
impacts due to the use of electricity in the production phase, which happens in countries
that have an electricity mix with lower share of renewable sources compared to the EU, is
more relevant than the impact associated to the transport from overseas. Results of
scenario 3b, where 100% reuse is assumed for furniture and clothes (textile products),
show a reduction of impact that is generally higher than 10% for all the impact categories.
Furthermore, the potential of this action could be even higher if other product categories
could be considered (e.g. footwear).
Results of the scenario analysis conducted on the BoP household goods unveiled some
recommendations, ranked by effectivity (according to the scenarios):
— The reuse of products can be an effective way to improve the environmental profile of
household consumption in the EU, as shown by the two scenarios on reuse of furniture
pieces and clothes. The market for second-hand products in the EU is still limited, but
could be enlarged in the future, in terms of product groups involved and number of
people engaged. More generally, users' behaviour could have a relevant effect on the
environmental impact of household goods consumption and should be taken into
account when defining policies for sustainable consumption in the EU.
— The transition towards relying on an electricity mix with less impact intensity per kWh
can reduce the environmental impact of the production of household goods, as
observed in the scenarios evaluated. Beyond clothes (textile products), the
improvement of the impact intensity of electricity can positively affect the production
and consumption of other products (e.g. detergents during the use phase).
— The use of recycled materials (such as polyester in textiles) can reduce the
environmental impact of household goods products. This eco-innovation action
positively affects all the impact categories. However, its implementation can sometimes
be limited by the technological development.
— Some eco-innovation actions (e.g. the use of totally chlorine free pulp for paper
products) can reduce the environmental impact in some categories but generate trade-
offs in other impact categories. The implementation of these actions needs to be
evaluated towards addressing potential trade-offs and their causes.
Regarding the scenarios on single EU Ecolabel products (liquid soap, shampoo, dishwasher
detergent, laundry detergent, upholstered seat) and the scenario considering together
those five EU Ecolabel products (Scenario 10), the results show that:
— The environmental profile of EU Ecolabel products is generally better than the one of
the average products in the market, despite that all life cycle stages are not
systematically covered by the EU Ecolabel, in contrast to the BoP household goods
where all life cycle stages are covered.

127
— The effect that the choice of EU Ecolabel products can have on the overall impact
coming from purchase and use of household goods resulted to be relatively limited
mainly due to the rather low share of the products -for which scenarios were tested-
over the entire environmental impacts of the BoP (from 0.4% to 7.0% of the normalized
impact for the baseline BoP). Moreover, the scenarios were assuming a 100%
replacement of the products on the market with an EU Ecolabel option. This means that
under more realistic market shares, the contribution to impact reduction is even lower.
— When considering the effect of EU Ecolabel on the five products altogether (Scenario
10), the decrease in the environmental impact was up to 7%. However, the scope of
this analysis did not cover the overall effect of the EU Ecolabel scheme on the
consumption of household goods and some of the product groups and products that
are currently covered by EU Ecolabel criteria were not modified in the Ecolabel scenarios
(e.g. clothes, footwear, sanitary products, and bed mattresses). For this reason, it
would be recommendable to extend the analysis to other products and product
categories in order to be able to assess the effect of an eco-innovation scenario covering
as many products as possible in order to have a more representative sample of EU
Ecolabelled products in the overall Ecolabel scenario.
— For certain products, such as detergents and personal care products, a relevant share
of the improvement potential is related to a proper use by consumers (e.g. by saving
water and energy and avoiding over dosing during the use phase). For this reason,
promoting purchase of more sustainable products may be not sufficient, but it has to
be accompanied with awareness campaigns promoting a more responsible consumption
behaviour towards improving the environmental impacts related to the use (e.g.
dosage, energy use) and end of life cycle stages (e.g. reuse of products).
— The BoP household good may help prioritise both the products for which criteria might
be needed as well as investigate the need of criteria covering different life cycle stages.
In fact, the majority of the impacts of the tested products were coming from component
manufacturing which is usually not covered by EU Ecolabel criteria.
Additionally, there are EU Ecolabel criteria that currently the LCA impact assessment
methods cannot quantify and, thus, observe their effect in the environmental impacts. In
general, LCA cannot include qualitative criteria neither cover 100% of the substances and
flows included in the life cycle of products or related to EU Ecolabel criteria, due to:
— The availability of data in commercial LCA databases (ecoinvent in this case). Some
specific substances are not found in databases and generic substances are used
instead, for this reason some differences among formulations are not reflected in the
LCA model. (i.e. soap ingredients or flame retardants used in textiles for upholstered
seats).
— Another limitation is related to impact methods, since some emissions to air or water
do not have characterization factor available in current method. This is relevant mostly
for the categories related to toxicity.
— Some criteria in relation to e.g. biodegradability, coatings, etc. cannot be modelled so
far in LCA. This is especially relevant for products where manufacturing emissions are
relevant such as in the case of furniture.
— Some EU Ecolabel criteria make reference to aspects such as material traceability of
sources, sustainable production origin (organic raw materials, certified wood, etc.), for
which an improvement in LCA modelling would be needed.
As general conclusion, the results of this study confirm that EU Ecolabel can potentially
effectively contribute to minimise the environmental impacts of household goods
consumption in the EU.
EU Ecolabel can help reducing the environmental impact of consumption and production,
by promoting products with reduced environmental impacts and fostering continuous
improvements in their environmental performances. Nevertheless, the current limited

128
market penetration of EU Ecolabel products is a constraint for the effectiveness of this
scheme and the real market might generate a lower decrease of the environmental impacts
compared to the modelled scenarios which assumed a 100%-uptake of the products in the
market. In this sense, the higher the uptake, the larger the effectiveness of the scheme in
reducing the environmental impact.
Along the same lines, adding product categories to the EU Ecolabel scheme would widen
the effect of the scheme in the environmental impacts of household consumption, by
promoting environmentally-friendly criteria in the life cycle of more consumed products.
As stated in the “Study on the Evaluation of the Implementation of the EU Ecolabel
Regulation” (European Commission, 2017), it is necessary to develop a more strategic
approach for the EU Ecolabel to ensure bigger cumulative benefits.

129
References
A.I.S.E (2017) ‘I prefer 30° campaign’. www.Iprefer30.eu/en (Accessed September 2017)
ADEME (2006). An Environmental Product Declaration of Jeans. Available at:
http://www.avnir.org/documentation/bdd/ademe/EPD_en_jeans_v2.pdf (Accessed May
2017)
Agnhage, T. (2017). Eco-designed functionalization of polyester fabric. Doctoral
dissertation, Högskolan i Borås. Available at: http://www.diva-
portal.org/smash/record.jsf?pid=diva2%3A1128277&dswid=-2555 (Accessed September
2017)
AISE & Cefic (2017). Cleanright initiative. http://uk.cleanright.eu/ (Accessed September
2017)
AkzoNobel, (2017). ECF versus TCF bleaching. Available at:
https://eka.akzonobel.com/knowledge-center/other/ (Accessed November 2017)
Alkaya, E., & Demirer, G. N. (2014). Sustainable textile production: a case study from a
woven fabric manufacturing mill in Turkey. Journal of Cleaner Production, 65, 595-603.
Arena, U., Ardolino, F., & Di Gregorio, F. (2016). Technological, environmental and social
aspects of a recycling process of post-consumer absorbent hygiene products. Journal of
Cleaner Production, 127, 289-301.
Arena, U., Mastellone, M. L., & Perugini, F. (2003). Life cycle assessment of a plastic
packaging recycling system. The international journal of life cycle assessment, 8(2), 92.
Arendorf, J., Bojczuk, K., Sims, E., Menkveld, R., Golsteijn, L., Gaasbeek, A., Boyano, A.,
Medyna, G., & Kaps, R. (2014b). Preliminary report for the revision of ecological criteria
for detergents for dishwasher: domestic and industrial and institutional. European
Commission, JRC technical report,
http://susproc.jrc.ec.europa.eu/detergents/docs/DD%20Preliminary%20Report.pdf
(accessed May 2017)
Arendorf, J., Bojczuk, K., Sims, E., Menkveld, R., Golsteijn, L., Gaasbeek, A., Boyano, A.,
Medyna, G., & Kaps, R. (2014d). Preliminary report for the revision of ecological criteria
for laundry detergents: domestic and industrial and institutional. European Commission,
JRC technical report,
http://susproc.jrc.ec.europa.eu/detergents/docs/LD%20Preliminary%20Report.pdf
(accessed May 2017)
Arendorf, J., Bojczuk, K., Skinner, D., Golsteijn, L., Gaasbeek, A., Boyano, A., Medyna, G.,
& Kaps, R. (2014a). Preliminary report for the revision of ecological criteria for all-purpose
cleaners and sanitary cleaners. European Commission, JRC technical report,
http://susproc.jrc.ec.europa.eu/detergents/docs/APC%20Preliminary%20Report.pdf
(accessed May 2017)
Arendorf, J., Bojczuk, K., Skinner, D., Golsteijn, L., Gaasbeek, A., Boyano, A., Medyna, G.,
& Kaps, R. (2014c). Preliminary report for the revision of ecological criteria for hand
dishwashing detergents. European Commission, JRC technical report,
http://susproc.jrc.ec.europa.eu/detergents/docs/HDD%20Preliminary%20Report.pdf
(accessed May 2017)
ARIEL (2017). Ariel Webpage. Sustainability section. Available at:
https://www.arielarabia.com/en/about-ariel/sustainability/our-commitment-
manufacturing) (Accessed December 2017)
Armstrong, C. M., Niinimäki, K., Kujala, S., Karell, E., & Lang, C. (2015). Sustainable
product-service systems for clothing: exploring consumer perceptions of consumption
alternatives in Finland. Journal of Cleaner Production, 97, 30-39.

130
Aziz, M.T. (2018). Recovery Potential of Cotton Fibers from the Textile Products Using
Circular Economy Strategies in Sweden. MSc thesis. Chalmers University of Technology.
Bajpai, P. (2004). Biological bleaching of chemical pulps. Critical reviews in biotechnology,
24(1), 1-58.
Barbosa, M. O., Moreira, N. F., Ribeiro, A. R., Pereira, M. F., & Silva, A. M. (2016).
Occurrence and removal of organic micropollutants: an overview of the watch list of EU
Decision 2015/495. Water research, 94, 257-279.
Barve, K., & Dighe, A. (2016). Hair Shampoo. In The Chemistry and Applications of
Sustainable Natural Hair Products (pp. 25-35). Springer International Publishing.
Benini, L., Mancini, L., Sala, S., Manfredi, S., Schau, E.M., & Pant, R. (2014). Normalisation
method and data for Environmental Footprints, Luxembourg: Publications Office of the
European Union, ISBN: 978-92-79-40847-2.
Björquist, S. (2017). Separation for regeneration - Chemical recycling of cotton and
polyester textiles. Thesis for the Degree of Master in Science with a major in Textile
Engineering. The Swedish School of Textiles, Report no. 2017.14.04. Available at:
http://publications.lib.chalmers.se/records/fulltext/249870/249870.pdf (Accessed
January 2018).
Boulay A.M., Pfister S., Motoshita M., Schneker U., Benini L., Shabbir H. Gweewala, Brito
de Figueredo M.C., & Harding K. (2016). Water use related impacts: water scarcity and
human health. In: Frischknecht, R., Jolliet, O. (Eds.), Global Guidance for Life Cycle Impact
Assessment Indicators: Volume 1. UNEP/SETAC Life Cycle Initiative, Paris, pp. 100-124
(Available at: www.lifecycleinitiative.org/applying-lca/lcia-cf/, accessed January 2017).
Brausch, J. M., & Rand, G. M. (2011). A review of personal care products in the aquatic
environment: environmental concentrations and toxicity. Chemosphere, 82(11), 1518-
1532.
Büchs, M., & Schnepf, S. V. (2013). Who emits most? Associations between socio-economic
factors and UK households' home energy, transport, indirect and total CO2 emissions.
Ecological Economics, 90, 114-123.
Castellani, V., Sala, S. & Mirabella, N. (2015). Beyond the throwaway society: A life cycle‐based assessment of the environmental benefit of reuse. Integrated environmental
assessment and management, 11(3), 373-382.
Castellani, V., Beylot, A., & Sala, S. (2019). Environmental impacts of household
consumption in Europe: Comparing process-based LCA and environmentally extended
input-output analysis. Journal of Cleaner Production, 240, 117966.
Cordella, M., Bauer, I., Lehmann, A., Schulz, M., & Wolf, O. (2015). Evolution of disposable
baby diapers in Europe: life cycle assessment of environmental impacts and identification
of key areas of improvement. Journal of Cleaner Production, 95, 322-331.
Cosmetics Europe (2012). Good Sustainability Practice (GSP) for the Cosmetics Industry,
2012. Available at:
https://www.cosmeticseurope.eu/files/4214/6521/4452/GSP_Brochure.pdf (Accessed
January 2018)
Crenna, E., Secchi, M., Benini, L., & Sala, S. (2019). Global environmental impacts: data
sources and methodological choices for calculating normalisation factors for LCA. The
international Journal of Life Cycle Assessment, 24(10), 1851–1877.
Deb Group (2018). How much hand soap should you use? Available at:
http://info.debgroup.com/blog/how-much-hand-soap-should-you-use (Accessed January
2018)

131
DEFRA (2008). An up-dated lifecycle assessment study for disposable and reusable
nappies. Science Report SC010018/SR2. Environment Agency, Almondsbury, Bristol, UK,
2008. Available at:
http://www.gov.uk/government/uploads/system/uploads/attachment_data/file/291130/s
cho0808boir-e-e.pdf (Accessed February 2018).
Dieterich, U., & Auld, G. (2015). Moving beyond commitments: creating durable change
through the implementation of Asia Pulp and Paper's forest conservation policy. Journal of
Cleaner Production, 107, 54-63.
Dodson, R. E., Nishioka, M., Standley, L. J., Perovich, L. J., Brody, J. G., & Rudel, R. A.
(2012). Endocrine disruptors and asthma-associated chemicals in consumer products.
Environmental health perspectives, 120(7), 935.
Dreja, M., Vockenroth, I., Plath, N., Schneider, C., & Martinez, E. (2014). Formulation,
Performance and Sustainability Aspects of Liquid Laundry Detergents: This paper is based
on a presentation given at the CESIO 2013–9th World Surfactant Congress and Business
Convention in Barcelona, Spain, 10–12 June 2013. Tenside Surfactants Detergents, 51(2),
108-112.
Druckman, A., & Jackson, T. (2016). Understanding Households as Drivers of Carbon
Emissions. In Taking Stock of Industrial Ecology (pp. 181-203). Springer International
Publishing.
Duarte, R., Mainar, A., & Sánchez-Chóliz, J. (2010). The impact of household consumption
patterns on emissions in Spain. Energy Economics, 32(1), 176-185.
Duarte, R., Mainar, A., & Sánchez-Chóliz, J. (2012). Social groups and CO2 emissions in
Spanish households. Energy policy, 44, 441-450.
EC (2000). Directive establishing a framework for the Community action in the field of
water policy. 2000/60/EC.
EC (2007). Preparatory studies for eco-design requirements of EuPs: Domestic Washing
machines and dishwashers. Available at:
www.ebpg.bam.de/de/ebpg_medien/014_studyf_08-12_part6-7.pdf (Accessed
September 2017)
EC (2011) Roadmap to a resource efficient Europe. Communication from the Commission
COM (2011) 571.
EC (2012) Directive 2012/27/EU of the European Parliament and of the Council of 25
October 2012 on energy efficiency
EC (2013). Building the Single Market for Green Products, COM(2013)196.
EC (2015). Closing the loop - An EU action plan for the Circular Economy. Communication
from the Commission COM(2015) 614.
EC (2016). EU Reference Scenario 2016. Energy, transport and GHG emissions Trends to
2050, Luxembourg, Publications Office of the European Union, ISBN: 978-92-79-52374-8.
EC (2017a). PEFCR Guidance document - Guidance for the development of Product
Environmental Footprint Category Rules (PEFCRs), version 6.3, December 2017. Available
at http://ec.europa.eu/environment/eussd/smgp/pdf/PEFCR_guidance_v6.3.pdf
(Accessed July 2018)
EC (2017b). Report on the review of implementation of Regulation (EC) No 122/2009 of
the European Parliament and of the Council on 25 November 2009 on the voluntary
participation by organisations in a Community eco-management and audit scheme (EMAS)
and the Regulation (EC) No66/2010 of the parliament and of the Council of 25 November
2009 on the EU Ecolabel Brussels. COM(2017) 355
EC-JRC (2011). Recommendations based on existing environmental impact assessment
models and factors for life cycle assessment in European context, Luxemburg: Publications
http://www.gov.uk/government/uploads/system/uploads/attachment_data/file/291130/scho0808boir-e-e.pdf

132
Office of the European Union, ISBN: 978-92-79- 17451-3. Available at
https://eplca.jrc.ec.europa.eu/uploads/ILCD-Recommendation-of-methods-for-LCIA-
def.pdf
EC-JRC (2012a), Life cycle indicators framework: development of life cycle based macro-
level monitoring indicators for resources, products and waste for the EU-27, Luxemburg:
Publications Office of the European Union. ISBN: 978-92-79-25937-1. Available at
http://publications.jrc.ec.europa.eu/repository/bitstream/111111111/31346/1/lbna2546
6enn.pdf
EC-JRC (2012b). Life cycle indicators basket-of-products: development of life cycle based
macro-level monitoring indicators for resources, products and waste for the EU-27,
Luxemburg: Publications Office of the European Union. ISBN: 978-92-79-26424-5.
Available at http://eplca.jrc.ec.europa.eu/uploads/LC-indicators-Basket-of-products.pdf
EC-JRC (2013a). Development of EU Ecolabel Criteria for Absorbent Hygiene Products.
Preliminary report – draft v.5.
http://susproc.jrc.ec.europa.eu/Absorbenthygieneproducts/docs/Prelim%20Report_v5.3_
CLEAN.pdf (Accessed May 2017)
EC-JRC (2013b). Draft background report and proposal for criteria revision - Updated
Working Document for the revision of the EU Ecolabel criteria for bed mattresses, Version
4. http://susproc.jrc.ec.europa.eu/mattresses/docs/Preliminary_Report_BM_v4.2.pdf
(Accessed May 2017)
EC-JRC (2015). Best Available Techniques (BAT) Reference Document for the Production
of Pulp, Paper and Board, Luxembourg: Publications Office of the European Union, ISBN:
978-92-79-25937-1.
Ecoinvent v.3 (2014). Converted ecoinvent 3.01 data as unit processes, with links to other
processes. Compiled October 2013 and revised February 2014.
Edana (2015). Sustainability report 2015. Available at: www.edana.org/docs/default-
source/default-document-library/edana-sustainability-report_2014-2015.pdf?sfvrsn=6
(Accessed February 2018).
EEA (2012). Consumption and the environment – 2012 update. EEA, Copenhagen, 2012.
Available at: http://www.eea.europa.eu/publications/consumption-and-the-environment-
2012 (Accessed July 2017)
EEA (2015). The European environment, state and outlook 2015 (SOER). EEA technical
report.
Elander, M., & Ljungkvist, H. (2016). Critical aspects in design for fiber-to-fiber recycling
of textiles. (No. Mistra Future Fashion report number: 2016:1). Available at:
http://mistrafuturefashion.com/wp-content/uploads/2016/06/MFF-report-2016-1-Critical-
aspects.pdf (Accessed January 2018).
Ellebæk Larsen, S., Hansen, J., Knudsen, H., Wenzel, H., Larsen, H.F., Møller Kristensen,
F. (2007). EDIPTEX – Environmental assessment of textiles. Danish Ministry of the
Environment, Environmental Protection Agency. (Working Report; No. 24).
EMAS (2018). Environmental and Management Audit Scheme webpage. Available at:
www.emas.cat (Accessed January 2018)
EPD (2016). Environmental Product Declaration for Tork®, Purex® and Sorbent® Toilet
Tissue. Available at:
https://www.asaleocare.com/globalassets/downloads/sustainability/epd-toilet-paper-
v14-final-v1.3-as-published.pdf (Accessed May 2017)
Escamilla M., Ferrer A., Fuentes N., Hidalgo C., Kaps R., Kougoulis J. (2012). Revision of
European Ecolabel Criteria for Soaps, Shampoos and Hair Conditioners – Preliminary
results from the technical analysis, JRC technical report,

133
http://susproc.jrc.ec.europa.eu/soaps_and_shampoos/docs/Technical%20analysis%20re
port_2.pdf (Accessed May 2017)
Eurobarometer (2014). Attitudes of Europeans towards waste management and resource
efficiency. Flash Eurobarometer 388.
Eurobarometer (2017). Public opinion in the European Union. Standard Eurobarometer 87.
Eurostat (2015). Statistics on International trade detailed data (EU trade since 1995 by
HS6 - DS-016893). Available at http://ec.europa.eu/eurostat/data/database (accessed
May 2017).
Eurostat (2017). Water Statistics 2017. Available at:
http://ec.europa.eu/eurostat/statistics-explained/index.php/Water_statistics (Accessed
January 2018)
Ferreira, A. R., Couto, N., Guedes, P. R., Mateus, E. P., & Ribeiro, A. B. (2016). Removal
of Pharmaceutical and Personal Care Products in Aquatic Plant-Based Systems. In
Electrokinetics Across Disciplines and Continents (pp. 351-372). Springer, Cham.
Fillat, Ú., Martín‐Sampedro, R., Ibarra, D., Macaya, D., Martín, J. A., & Eugenio, M. E.
(2017). Potential of the new endophytic fungus Hormonema sp. CECT‐13092 for improving
processes in lignocellulosic biorefineries: biofuel production and cellulosic pulp
manufacture. Journal of Chemical Technology and Biotechnology, 92(5), 997-1005.
Fisher, K. Keith James, K., & Maddox, P. (2011). Benefits of reuse Case Study: Domestic
Furniture. WRAP, United Kingdom.
Font Vivanco, D., Sala, S., & McDowall, W. (2018). Roadmap to rebound: how to address
rebound effects from resource efficiency policy. Sustainability, 10(6), 2009.
Forrest, A., Hilton, M., Ballinger, A., & Whittaker, D. (2017). Circular economy
opportunities in the furniture sector. Report produced for the European Environment
Bureau (EEB) by Eunomia Research & Consulting Ltd, 2017.
Frischknecht, R., Steiner, R. & Jungbluth, N. (2009). The Ecological Scarcity Method – Eco-
Factors 2006. A method for impact assessment in LCA. Environmental studies no. 0906.
Federal Office for the Environment (FOEN), Bern: 188 pp. retrieved from:
www.bafu.admin.ch/publikationen/publikation/01031/index.html?lang=en (Accessed
January 2017).
Fu, G. Z., Chan, A., & Minns, D. (2005). Preliminary Assessment of the Environmental
Benefits of Enzyme Bleaching for Pulp and Paper Making (7 pp). The International Journal
of Life Cycle Assessment, 10(2), 136-142.
García-Arca, J., Garrido, T. G. P., & Prado-Prado, J. C. (2017). Implementing “Sustainable
Packaging Logistics”. An analysis in liquid detergents. Dirección y Organización, (60), 47-
56.
Ghose, A., & Chinga-Carrasco, G. (2013). Environmental aspects of Norwegian production
of pulp fibres and printing paper. Journal of cleaner production, 57, 293-301.
González-García, S., Gasol, C. M., Lozano, R. G., Moreira, M. T., Gabarrell, X., Rieradevall
i Pons, J., & Feijoo, G. (2011). Assessing the global warming potential of wooden products
from the furniture sector to improve their ecodesign. Science of the Total Environment,
410, 16-25.
González-García, S., Hospido, A., Moreira, M. T., Romero, J., & Feijoo, G. (2009).
Environmental impact assessment of total chlorine free pulp from Eucalyptus globulus in
Spain. Journal of Cleaner Production, 17(11), 1010-1016.
Grbavčić, S., Marković, D., Rajilić-Stojanović, M., Antov, M., Šćiban, M., Karadžić, I., &
Knežević-Jugović, Z. (2015). Development of an environmentally acceptable detergent
formulation for fatty soils based on the lipase from the indigenous extremophile
Pseudomonas aeruginosa strain. Journal of Surfactants and Detergents, 18(3), 383-395.

134
Gulich, B. (2006). Development of products made of reclaimed fibres. Recycling in textiles,
50, 117.
Harris, B. (2012) Market potential and demand for product re-use: Furniture. Collaborative
Waste, Resources and Sustainable Consumption Evidence Programme, Resource Futures.
Defra.
Hawley, J. M. (2006). Textile recycling: A systems perspective. In: Recycling in textiles.
Woodhead Publishing Limited, UK, 248 pp.
Henkel (2014), Sustainability Report, 2014. Available at: www.henkel.com/press-and-
media/press-releases-and-kits/2014-11-21-enhancing-energy-efficiency/281702)
(Accessed January 2018)
Henkel (2016), Sustainability Report, 2016. Available at:
https://www.henkel.com/blob/739776/3e48b2a4f265f0a1518f3f150cc7afbc/data/2016-
sustainability-report.pdf (Accessed January 2018)
Henriksson, G. & Lindström, M. (2013). Regeneration of cellulose. Patent
WO/2013/124265.
Hill, P., Taylor, M., Goswami, P., & Blackburn, R. S. (2016). The route to fluorine-free
repellent coatings in outdoor apparel: Consumer use, maintenance and physiological
comfort. Available at: http://eprints.whiterose.ac.uk/115398/2/GCE%2035%20-
%20Blackburn.pdf (Accessed September 2017)
Honisch, M., Brands, B., Weide, M., Speckmann, H. D., Stamminger, R., & Bockmühl, D.
P. (2016). Antimicrobial Efficacy of Laundry Detergents with Regard to Time and
Temperature in Domestic Washing Machines. Tenside Surfactants Detergents, 53(6), 547-
552.
Iritani, D. R., Silva, D. L., Saavedra, Y. M. B., Grael, P. F. F., & Ometto, A. R. (2015).
Sustainable strategies analysis through Life Cycle Assessment: a case study in a furniture
industry. Journal of Cleaner Production, 96, 308-318.
Ivanova, D., Stadler, K., Steen‐Olsen, K., Wood, R., Vita, G., Tukker, A., & Hertwich, E. G.
(2016). Environmental impact assessment of household consumption. Journal of Industrial
Ecology, 20(3), 526-536.
Juliano, C., & Magrini G.A. (2017), Cosmetic Ingredients as Emerging Pollutants of
Environmental and Health Concern. A Mini-Review. Cosmetics, 4, 11;
doi:10.3390/cosmetics4020011
Kabir, E. R., Rahman, M. S., & Rahman, I. (2015). A review on endocrine disruptors and
their possible impacts on human health. Environmental Toxicology and Pharmacology,
40(1), 241-258.
Kalbar, P. P., Birkved, M., Kabins, S., & Nygaard, S. E. (2016). Personal Metabolism (PM)
coupled with Life Cycle Assessment (LCA) model: Danish Case Study. Environment
International, 91, 168-179.
Kant, R. (2012). Textile dyeing industry an environmental hazard. Natural Science, 4(1),
22-26.
Keshwani, A., Malhotra, B., & Kharkwal, H. (2015). Natural polymer based detergents for
stain removal. World Journal of Pharmacy and Pharmaceutical Sciences, 4(4), 490-508.
Khan, M. M. R., Mondal, M. I. H., & Uddin, M. Z. (2013). Sustainable washing for denim
garments by enzymatic treatment. Journal of Chemical Engineering, 27(1), 27-31.
Koehler, A., & Wildbolz, C. (2009). Comparing the environmental footprints of home-care
and personal-hygiene products: the relevance of different life-cycle phases. Environmental
Science and Technology, 43(22), 8643-8651.

135
Krishnamoorthy, G., Sadulla, S., Sehgal, P. K., & Mandal, A. B. (2013). Greener approach
to leather tanning process: d-Lysine aldehyde as novel tanning agent for chrome-free
tanning. Journal of Cleaner Production, 42, 277-286.
Laitala, K., & Boks, C. (2012). Sustainable clothing design: use matters. Journal of Design
Research 14, 10(1-2), 121-139.
Lei, H., Xiong, M., Xiao, J., Zheng, L., Zhu, Y., Li, X., Zhuang, Q. & Han, Z. (2017). Fluorine-
free low surface energy organic coating for anti-stain applications. Progress in Organic
Coatings, 103, 182-192.
Leonas, K. K. (2017). The Use of Recycled Fibers in Fashion and Home Products. In Textiles
and Clothing Sustainability, (pp. 55-77). Springer: Singapore.
Luiken, A., & Bouwhuis, G. (2015). Recovery and recycling of denim waste. In Denim -
Manufacture, Finishing and Applications, (pp. 527-540). Woodhead Publishing.
Luo, Y., Guo, W., Ngo, H. H., Nghiem, L. D., Hai, F. I., Zhang, J., Liang, S. & Wang, X. C.
(2014). A review on the occurrence of micropollutants in the aquatic environment and their
fate and removal during wastewater treatment. Science of the Total Environment, 473,
619-641.
Marks & Spencer plc (2002). Streamlined Life Cycle Assessment of Two Marks & Spencer
plc Apparel Products. Available at:
http://researchingsustainability.files.wordpress.com/2012/01/streamlined-lca-of-2-
marks-spencer-pls-apparel-products.pdf (Accessed May 2017)
Martinez, S., Bessou, C., Hure, L., Guilbot, J., & Helias, A. (2017). The impact of palm oil
feedstock within the LCA of a bio-sourced cosmetic cream. Journal of cleaner production,
145, 348-360.
Michel A., Bush E., & Jürg N., (2017) Dishwashers: Testing the energy variability related
to different uses Final report. Topten International. Available at:
www.topten.eu/uploads/File/Topten_Dishwashers_May17.pdf (Accessed May 2017)
Mintel database. Available at: www.mintel.com (Accessed February 2018)
Mirabella, N., Castellani, V., & Sala, S. (2013). Life cycle assessment of bio-based
products: A disposable diaper case study. The International Journal of Life Cycle
Assessment, 18(5), 1036-1047.
Monje, P. G., González-García, S., Moldes, D., Vidal, T., Romero, J., Moreira, M. T., &
Feijoo, G. (2010). Biodegradability of kraft mill TCF biobleaching effluents: application of
enzymatic laccase-mediator system. Water Research, 44(7), 2211-2220.
Mutlu, M.M., Crudu, M., Maier, S.S., Deselnicu, D., Albu, L., Gulumser, G., Bitlisli, B.O.,
Basaran, B., Tosun, C.C., & Adiguzel Zengin, A.C. (2014). Eco-leather: Properties of
Chromium-free Leathers Produced with Titanium tanning Materials obtained from the
Wastes of the metal Industry. Ekoloji, 23(91), 83-90.
Nessi, S., Rigamonti, L., & Grosso, M. (2014). Waste prevention in liquid detergent
distribution: a comparison based on life cycle assessment. Science of the Total
Environment, 499, 373-383.
Niinimäki, K., & Hassi, L. (2011). Emerging design strategies in sustainable production and
consumption of textiles and clothing. Journal of Cleaner Production, 19(16), 1876-1883.
O’Brien, K., Olive, R., Hsu, Y. C., Morris, L., Bell, R., & Kendall, N. (2009). Life cycle
assessment: Reusable and disposable nappies in Australia. ALCAS–Australian Life Cycle
Assessment Society. Available at:
http://pdfs.semanticscholar.org/b062/e7ae6289cdb4ea8998f6fe5276a6a8c96928.pdf
(Accessed February 2018).
OCU, Altroconsumo, Deco Proteste, Test Achats/Test Ankoop, Euroconsumers,
Cibersomosaguas (Universidad Complutense) & Ouishare (2016). Collaboration or

136
Business? From value for users to a society with values. Available at:
https://www.slideshare.net/AmayaApestegua/collaboration-or-business-collaborative-
consumption-from-value-for-users-to-a-society-with-values-ocu (Accessed January
2018).
Ozturk, E., Koseoglu, H., Karaboyaci, M., Yigit, N. O., Yetis, U., & Kitis, M. (2016).
Sustainable textile production: cleaner production assessment/eco-efficiency analysis
study in a textile mill. Journal of Cleaner Production, 138, 248-263.
P&G (2015). Sustainability Report, 2015. Available at: https://us.pg.com/sustainability/at-
a-glance/sustainability-reports (Accessed February 2018)
Palme, A., Peterson, A., de la Motte, H., Theliander, H., & Brelid, H. (2017). Development
of an efficient route for combined recycling of PET and cotton from mixed fabrics. Textiles
and Clothing Sustainability, 3(1), 4.
Patagonia (2011). Patagonia´s common treads garment recycling program: a detailed
Analysis. Available at: www.patagonia.com/pdf/en_US/common_threads_whitepaper.pdf
(Accessed January 2018)
Pèlach Serra, M. À., Delgado Aguilar, M., Alcalà Vilavella, M., Puig Serramitja, J., Blanco,
A., & Mutjé Pujol, P. (2016). New strategy for the production of packaging from recycled
fibers. © Cellulose Chemistry and Technology, 3-4, 449-454.
Peterson, A., (2015). Towards Recycling of Textile Fibers Separation and Characterization
of Textile Fibers and Blends. Master’s thesis in Materials Chemistry and Nanotechnology,
Department of Chemistry and Chemical Engineering, Chalmers University of Technology,
Gothenburg, Sweden, 2015. Available at:
http://publications.lib.chalmers.se/records/fulltext/218483/218483.pdf (Accessed
January 2018).
Philippe, M., Didillon, B., & Gilbert, L. (2012). Industrial commitment to green and
sustainable chemistry: using renewable materials & developing eco-friendly processes and
ingredients in cosmetics. Green Chemistry, 14(4), 952-956.
Phillips, K., Yau, A.Y., Favela, K.A., Isaacs, K.K., McEachran, A., Grulke, C.M., Richard,
A.M., Williams, A., Sobus, J.R., Thomas, R.S. & Wambaugh, J. F. (2018). Suspect screening
analysis of chemicals in consumer products. Environmental Science & Technology, 52(5),
3125-3135.
Popp, D., Hafner, T., & Johnstone, N. (2011). Environmental policy vs. public pressure:
Innovation and diffusion of alternative bleaching technologies in the pulp industry.
Research Policy, 40(9), 1253-1268.
Pourzahedi, L., Vance, M., & Eckelman, M. J. (2017). Life cycle assessment and release
studies for 15 nanosilver-enabled consumer products: Investigating hotspots and patterns
of contribution. Environmental Science & Technology, 51(12), 7148-7158.
Rabnawaz, M., Liu, G., & Hu, H. (2015). Fluorine‐Free Anti‐Smudge Polyurethane Coatings.
Angewandte Chemie, 127(43), 12913-12918.
Rafenberg, C., & Eric, M., (1998). Life cycle analysis of the newspaper Le Monde. The
International Journal of Life Cycle Assessment, 3(3), 131-144.
Ramli, N. S. (2017). Green marketing: a new prospect in the cosmetics industry. In
Sustainable entrepreneurship and investments in the green economy (pp. 200-230). IGI
Global.
Reale, F., Castellani, V., Hischier, R., Corrado, S., & Sala, S. (2019). Consumer Footprint
- Basket of Products indicator on Household appliances, Luxembourg: Publications Office
of the European Union, ISBN 978-92-76-05003-2.
Rieple, A., & Singh, R. (2010). A value chain analysis of the organic cotton industry: The
case of UK retailers and Indian suppliers. Ecological Economics, 69(11), 2292-2302.

137
Rudel, R. A., Camann, D. E., Spengler, J. D., Korn, L. R., & Brody, J. G. (2003). Phthalates,
alkylphenols, pesticides, polybrominated diphenyl ethers, and other endocrine-disrupting
compounds in indoor air and dust. Environmental Science & Technology, 37(20), 4543-
4553.
Sahota, A. (2014). Greening the cosmetics industry: natural, organic & environmental.
South African Pharmaceutical and Cosmetic Review, 41(10), 31-34.
Sala, S., Beylot, A., Corrado, S., Crenna, E., Sanyé-Mengual, E, & Secchi, M. (2019)
Indicators and Assessment of the environmental impact of EU consumption. Consumption
and Consumer Footprint for assessing and monitoring EU policies with Life Cycle
Assessment, Luxembourg: Publications Office of the European Union, ISBN 978-92-79-
99672-6.
Sala, S., Benini, L., Mancini, L., & Pant, R. (2015). Integrated assessment of environmental
impact of Europe in 2010: data sources and extrapolation strategies for calculating
normalisation factors. The International Journal of Life Cycle Assessment, 20(11), 1568-
1585.
Sala, S., Benini, L., Crenna, E., & Secchi, M., (2016). Global environmental impacts and
planetary boundaries in LCA, Luxembourg: Publications Office of the European Union,
ISBN: 978-92-79-64667-6.
Sala, S., Cerutti, A.K., & Pant, R., (2018) Development of a weighting approach for the
Environmental Footprint, Publications Office of the European Union, Luxembourg, ISBN
978-92-79- 68042-7.
Sankauskaité, A., Stygiené, L., Tumeniene, M. D., Krauledas, S., Jovaišiene, L., &
Puožiuniene, R. (2014). Investigation of cotton component destruction in cotton/polyester
blended textile waste materials. Materials Science, 20(2), 189-192.
Saouter, E., van Hoof, G., Feijtel, T. C., & Owens, J. W. (2002). The effect of compact
formulations on the environmental profile of Northern European granular laundry
detergents Part II: Life Cycle assessment. The International Journal of Life Cycle
Assessment, 7(1), 27-38.
Saouter EG, Aschberger K, Bopp S Fantke P, Hauschild MZ, Kienzler A, Paini A, Pant R,
Radovnikovic A, Secchi M, & Sala S. (2017a). Improving Substance Information in
USEtox®, Part 1: Discussion on data and approaches for estimating freshwater ecotoxicity
effect factors. Environmental Toxicology and Chemistry, 36(12), 3450–3462,
doi:10.1002/etc.3889.
Saouter, E., Aschberger, K., Fantke, P., Hauschild, M.Z., Kienzler, A., Paini, A., Pant, R.,
Radovnikovic, A., Secchi, M. & Sala, S. (2017b). Improving substance information in
usetox®, part 2: Data for estimating fate and ecosystem exposure factors. Environmental
Toxicology and Chemistry, 36(12), 3463–3470, doi:10.1002/etc.3903.
Saouter, E., Biganzoli, F., Ceriani, L., Versteeg, D., Crenna, E., Zampori, L., Sala, S., &
Pant, R. (2018). Environmental Footprint: Update of Life Cycle Impact Assessment Methods
– Ecotoxicity freshwater, human toxicity cancer, and non-cancer, Luxembourg:
Publications Office of the European Union, ISBN: 978-92-79-98183-8.
Screening report of the PEF pilot on Footwear, available at:
http://webgate.ec.europa.eu/fpfis/wikis/spaces/viewspace.action?key=EUENVFP
(Accessed on December 2016)
Screening report of the PEF pilot on Household Heavy Duty Liquid, available at:
http://webgate.ec.europa.eu/fpfis/wikis/spaces/viewspace.action?key=EUENVFP
(Accessed on December 2016)
Screening report of the PEF pilot on T-shirts, available at:
http://webgate.ec.europa.eu/fpfis/wikis/spaces/viewspace.action?key=EUENVFP
(Accessed on December 2016)

138
Secchi, M., Castellani, V., Collina, E., Mirabella, N., & Sala, S. (2016). Assessing eco-
innovations in green chemistry: Life Cycle Assessment (LCA) of a cosmetic product with a
bio-based ingredient. Journal of Cleaner Production, 129, 269-281.
Shen, L., Nieuwlaar, E., Worrell, E., & Patel, M. K. (2011). Life cycle energy and GHG
emissions of PET recycling: change-oriented effects. The International Journal of Life Cycle
Assessment, 16(6), 522-536.
Shen, L., Worrell, E., & Patel, M. K. (2010). Open-loop recycling: A LCA case study of PET
bottle-to-fibre recycling. Resources, conservation and recycling, 55(1), 34-52.
Sikkema, R., Dallemand, J. F., Matos, C. T., van der Velde, M., & San-Miguel-Ayanz, J.
(2016). How can the ambitious goals for the EU’s future bioeconomy be supported by
sustainable and efficient wood sourcing practices? Scandinavian Journal of Forest
Research, 32(7), 551-558.
Singh, G., Kaur, K., Puri, S., & Sharma, P. (2015). Critical factors affecting laccase-
mediated biobleaching of pulp in paper industry. Applied microbiology and biotechnology,
99(1), 155-164.
Siwayanan, P., Aziz, R., Bakar, N. A., Ya, H., Jokiman, R., & Chelliapan, S. (2014).
Characterization of phosphate-free detergent powders incorporated with palm C16 methyl
ester sulfonate (C16MES) and linear alkyl benzene sulfonic acid (LABSA). Journal of
Surfactants and Detergents, 17(5), 871-880.
Stamminger R., Rummler B., Elschenbroich A. & Broil G., (2007). Dishwashing under
various consumer-relevant conditions. Hauswirtschaft und Wissenschaft, 2, 81–88.
TEAM7 (2015), Sustainability Report Environmental Statement 2015. Available at:
https://cdn.team7.at/fileadmin/user_upload/PDF_Download/Umweltbericht/Environment
al-report-en.pdf (Accessed January 2018)
Teijin (2017). Eco Circle Fibers. Available at: http://www2.teijin-
frontier.com/english/sozai/specifics/eco-circle.html (Accessed January 2018)
Ternes, T. A., Joss, A., & Siegrist, H. (2004). Scrutinizing pharmaceuticals and personal
care products in wastewater treatment. Environmental Science & Technology, 38(20),
392A-399A.
TopTen EU (2018). Best products of Europe. Available at:
http://www.topten.eu/english/household/washing-machines/8kg-2.html (Accessed
January 2018)
Torrijos, M., Sousbie, P., Rouez, M., Lemunier, M., Lessard, Y., Galtier, L., Simao, A. &
Steyer, J. P. (2014). Treatment of the biodegradable fraction of used disposable diapers
by co-digestion with waste activated sludge. Waste management, 34(3), 669-675.
Treyer, K. & Bauer, C. (2016). Life cycle inventories of electricity generation and power
supply in version 3 of the ecoinvent database—part II: electricity markets. International
Journal for Life Cycle Assessment, 21(9), 1255-1268.
Trujillo-Cayado, L. A., Santos, J., Ramírez, P., Alfaro, M. C., & Muñoz, J. (2018). Strategy
for the development and characterization of environmental friendly emulsions by
microfluidization technique. Journal of Cleaner Production, 178, 723-730.
Tukker, A., Cohen, M. J., Hubacek, K., & Mont, O. (2010). The impacts of household
consumption and options for change. Journal of Industrial Ecology, 14(1), 13-30.
Vadicherla, T., & Saravanan, D. (2014). Textiles and apparel development using recycled
and reclaimed fibers. In Roadmap to sustainable textiles and clothing (pp. 139-160).
Springer, Singapore.
van der Velden, N. M., Patel, M. K., & Vogtländer, J. G. (2014). LCA benchmarking study
on textiles made of cotton, polyester, nylon, acryl, or elastane. The International Journal
of Life Cycle Assessment, 19(2), 331-356.

139
Vanderheyden, G., & Aerts, J. (2014). Comparative LCA assessment of Fontinet filtered
tap water vs. natural sourced water in a PET bottle. Available at:
https://myfontinet.com/xx_website_sale/static/src/pdf/MyFontinet_Footprint_LCA_report
_milieu16.pdf (Accessed May 2017)
Vita, N.A., Brohem, C. A., Canavez, A. D. P. M., Oliveira, C. F. S., Kruger, O., Lorencini,
M., & Carvalho, C. M. (2018). Parameters for assessing the aquatic environmental impact
of cosmetic products. Toxicology letters, 287, 70-82.
Vojta, Š., Bečanová, J., Melymuk, L., Komprdová, K., Kohoutek, J., Kukučka, P., & Klánová,
J. (2017). Screening for halogenated flame retardants in European consumer products,
building materials and wastes. Chemosphere, 168, 457-466.
von der Leyen, U (2019) ‘A Union that strives for more: My agenda for Europe’, Political
Guidelines for the Next European Commission 2019-2024. Available at
https://ec.europa.eu/commission/sites/ beta-political/fi les/political-guidelines-next-
commission_en.pdf
VTT (2017). Fabric made from VTT's recycled fibre feels half way between cotton and
viscose. Available at: http://www.vttresearch.com/media/news/fabric-made-from-vtts-
recycled-fibre-feels-half-way-between-cotton-and-viscose (Accessed April 2018)
WaterSol (2016). Watersol webpage. Available at:
http://www.watersolublefilm.com/packaging_film.html#8 (Accessed January 2018)
Wood, R., Moran, D., Stadler, K., Ivanova, D., Steen‐Olsen, K., Tisserant, A., & Hertwich,
E. G. (2017). Prioritizing Consumption‐Based Carbon Policy Based on the Evaluation of
Mitigation Potential Using Input‐Output Methods. Journal of Industrial Ecology, 22(3), 540-
552, doi:10.1111/jiec.12702.
WRAP (2011). A methodology for quantifying the environmental and economic impacts of
reuse. Available at:
http://www.wrap.org.uk/sites/files/wrap/Final%20Reuse%20Method.pdf (Accessed
January 2018)
Zampori L., Saouter E., Schau E., Cristóbal Garcia J., Castellani V., & Sala S. (2016). Guide
for interpreting life cycle assessment result, Luxembourg: Publications Office of the
European Union, ISBN: 978-92-79-64114-5.
Zhang, D., Gersberg, R. M., Ng, W. J., & Tan, S. K. (2014). Removal of pharmaceuticals
and personal care products in aquatic plant-based systems: a review. Environmental
Pollution, 184, 620-639.
Zhang, Y., Liu, X., Xiao, R., & Yuan, Z. (2015). Life cycle assessment of cotton T-shirts in
China. The International Journal of Life Cycle Assessment, 20(7), 994-1004.
Zhu, Q., Peng, X., & Wu, K. (2012). Calculation and decomposition of indirect carbon
emissions from residential consumption in China based on the input–output model. Energy
Policy, 48, 618-626.
Zuriaga-Agustí, E., Galiana-Aleixandre, M. V., Bes-Piá, A., Mendoza-Roca, J. A., Risueño-
Puchades, V., & Segarra, V. (2015). Pollution reduction in an eco-friendly chrome-free
tanning and evaluation of the biodegradation by composting of the tanned leather wastes.
Journal of Cleaner Production, 87, 874-881.

140
List of abbreviations and definitions
aANBO Anaerobically non-biodegradable
ANBO Aerobically non-biodegradable
AOX Adsorbable Organic Halogens (or halogenated organic compounds)
APC All-Purposes Cleaners
BoM Bill of Materials
BoP Basket of Products
COD Chemical Oxygen Demand
CTUe Comparative Toxic Unit for ecosystems
CTUh Comparative Toxic Unit for human
CDV Critical Dilution Volume
DD Dishwasher Detergent
ECF Elemental chlorine free
EEB European Environmental Bureau
EF Environmental Footprint
EMAS Eco-Management and Audit Scheme
EoL End of life
EPD Environmental Product Declaration
FRN Furniture Reuse Network
FSC Forest Stewardship Council
FU Functional Unit
GPP Green Public Procurement
HDPE High-density Polyethylene
ILCD International Life Cycle Data System
ISO International Organization for Standardization
LCA Life Cycle Assessment
LCI Life Cycle Inventory
LCIA Life Cycle Impact Assessment
LD Laundry Detergent
LDPE Low-density polyethylene
MDP Medium density particleboard
PEF Product Environmental Footprint
PEFCRs Product Environmental Footprint Category Rules
PET Polyethylene terephthalate
PIR Packaging index ratio
PVA Polyvinyl alcohol
SAP Superabsorbent Polymer
TCF Totally chlorine free

141
VOC Volatile Organic Compounds
WUR Weight Utility Ratio
WW Work and Waterproof (footwear)
Abbreviations of impact categories used in the study
AP Acidification potential (impact category)
FEP Freshwater eutrophication (impact category)
FETP Freshwater ecotoxicity (impact category)
FRD Fossil resource depletion (impact category)
GWP Global Warming Potential (impact category)
HTP c Human toxicity, cancer effects (impact category)
HTP nc Human toxicity, non-cancer effects (impact category)
IRP Ionizing radiation effects, human health (impact category)
LUC Land use changes (impact category)
MEP Marine eutrophication (impact category)
MRD Mineral resource depletion (impact category)
ODP Ozone depletion (impact category)
PMFP Particulate matter (impact category)
POFP Photochemical ozone formation (impact category)
RD Resource depletion (impact category)
TEP Terrestrial eutrophication (impact category)

142
List of boxes
Box 1 Overview of the link between SDGs, the assessment of the environmental impact
of consumption and the impact quantification with Life Cycle Assessment (Environmental
Footprint method). ................................................................................................ 4
Box 2 Overview of the two life cycle-based indicators for assessing the environmental
impact of EU consumption. ..................................................................................... 6
Box 3. Packaging Impact Ratio (PIR). .....................................................................86
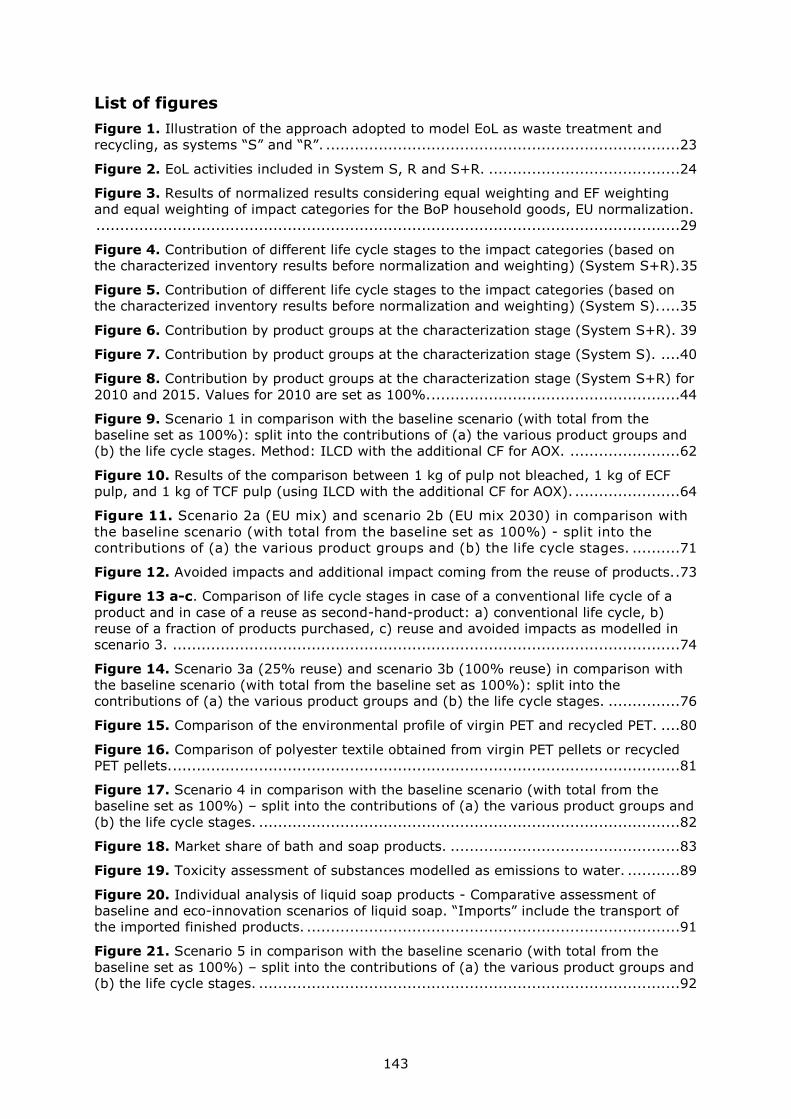
143
List of figures
Figure 1. Illustration of the approach adopted to model EoL as waste treatment and
recycling, as systems “S” and “R”. ..........................................................................23
Figure 2. EoL activities included in System S, R and S+R. ........................................24
Figure 3. Results of normalized results considering equal weighting and EF weighting
and equal weighting of impact categories for the BoP household goods, EU normalization.
..........................................................................................................................29
Figure 4. Contribution of different life cycle stages to the impact categories (based on
the characterized inventory results before normalization and weighting) (System S+R).35
Figure 5. Contribution of different life cycle stages to the impact categories (based on
the characterized inventory results before normalization and weighting) (System S). ....35
Figure 6. Contribution by product groups at the characterization stage (System S+R). 39
Figure 7. Contribution by product groups at the characterization stage (System S). ....40
Figure 8. Contribution by product groups at the characterization stage (System S+R) for
2010 and 2015. Values for 2010 are set as 100%. ....................................................44
Figure 9. Scenario 1 in comparison with the baseline scenario (with total from the
baseline set as 100%): split into the contributions of (a) the various product groups and
(b) the life cycle stages. Method: ILCD with the additional CF for AOX. .......................62
Figure 10. Results of the comparison between 1 kg of pulp not bleached, 1 kg of ECF
pulp, and 1 kg of TCF pulp (using ILCD with the additional CF for AOX). ......................64
Figure 11. Scenario 2a (EU mix) and scenario 2b (EU mix 2030) in comparison with
the baseline scenario (with total from the baseline set as 100%) - split into the
contributions of (a) the various product groups and (b) the life cycle stages. ..........71
Figure 12. Avoided impacts and additional impact coming from the reuse of products. .73
Figure 13 a-c. Comparison of life cycle stages in case of a conventional life cycle of a
product and in case of a reuse as second-hand-product: a) conventional life cycle, b)
reuse of a fraction of products purchased, c) reuse and avoided impacts as modelled in
scenario 3. ..........................................................................................................74
Figure 14. Scenario 3a (25% reuse) and scenario 3b (100% reuse) in comparison with
the baseline scenario (with total from the baseline set as 100%): split into the
contributions of (a) the various product groups and (b) the life cycle stages. ...............76
Figure 15. Comparison of the environmental profile of virgin PET and recycled PET. ....80
Figure 16. Comparison of polyester textile obtained from virgin PET pellets or recycled
PET pellets. ..........................................................................................................81
Figure 17. Scenario 4 in comparison with the baseline scenario (with total from the
baseline set as 100%) – split into the contributions of (a) the various product groups and
(b) the life cycle stages. ........................................................................................82
Figure 18. Market share of bath and soap products. ................................................83
Figure 19. Toxicity assessment of substances modelled as emissions to water. ...........89
Figure 20. Individual analysis of liquid soap products - Comparative assessment of
baseline and eco-innovation scenarios of liquid soap. “Imports” include the transport of
the imported finished products. ..............................................................................91
Figure 21. Scenario 5 in comparison with the baseline scenario (with total from the
baseline set as 100%) – split into the contributions of (a) the various product groups and
(b) the life cycle stages. ........................................................................................92

144
Figure 22. Individual analysis of shampoo products - Comparative assessment of
baseline and eco-innovation scenarios of shampoo. “Imports” include the transport of the
imported finished products. ...................................................................................97
Figure 23. Scenario 6 in comparison with the baseline scenario (with total from the
baseline set as 100%) – split into the contributions of the various product groups. .......98
Figure 24. Individual analysis of dishwasher detergent products - Comparative
assessment of baseline and eco-innovation scenarios of dishwasher detergent. “Imports”
include the transport of the imported finished products. .......................................... 103
Figure 25. Scenario 7 in comparison with the baseline scenario (with total from the
baseline set as 100%) – split into the contributions of (a) the various product groups and
(b) the life cycle stages. ...................................................................................... 104
Figure 26. Individual analysis of laundry detergent products - Comparative assessment
of baseline and eco-innovation scenarios of laundry detergent. “Imports” include the
transport of the imported finished products. .......................................................... 109
Figure 27. Scenario 8 in comparison with the baseline scenario (with total from the
baseline set as 100%) – split into the contributions of (a) the various product groups and
(b) the life cycle stages. ...................................................................................... 110
Figure 28. Individual analysis of upholstered seat products - Comparative assessment of
baseline and eco-innovation scenarios of upholstered seat. “Imports” include the
transport of the imported finished products. .......................................................... 115
Figure 29. Scenario 9 in comparison with the baseline scenario (with total from the
baseline set as 100%) – split into the contributions of the various product groups. ..... 116
Figure 30. Scenario 10 in comparison with the baseline scenario (with total from the
baseline set as 100%) – split into the contributions of the various product groups. ..... 118

145
List of tables
Table 1. Composition of the BoP household goods in terms of product groups,
representative products and related quantities (referred to the reference flow, i.e.
household goods consumption of an average EU-27 citizen in the reference year 2010)
(Source: Eurostat, 2015). ......................................................................................11
Table 2. Coverage of the quantity and value of the product groups by the representative
products modelled in the BoP. The % highlighted in green were used to upscale the
quantity of the apparent consumption used in the functional unit (F.U.) of the BoP
household goods. .................................................................................................12
Table 3. Summary of life cycle stages and related activities included in the BoP household
goods. .................................................................................................................13
Table 4. Overview of LCI data sources used to model the representative products. .......13
Table 5. Electricity mixes used to model the share of production that occurs outside the
EU (based on the ratio of finished products that are imported to EU-27 and on the ratio
of countries from which they are imported – source: Eurostat, 2015). .........................17
Table 6. Electricity mixes used to model the production phases of clothes (spinning,
texturizing of synthetic yarns, knitting and dyeing, and cutting and sewing of the final
product). .............................................................................................................18
Table 7. Modelling of packaging for the products in the BoP. ......................................19
Table 8. Summary of the share of imported goods, the sea transport distance, and the
road transport distance for each representative product. ...........................................21
Table 9. Inventory data for the use of product at home. ............................................22
Table 10. Summary of assumption on EoL scenario for the products in the BoP household
goods. .................................................................................................................24
Table 11. Characterized results (ILCD) for the whole BoP household goods baseline
(overall impacts of household goods consumption in EU in 2010). ..............................26
Table 12. Characterized results (ILCD) for the F.U. of the BoP household goods baseline
(impacts of household goods consumption by an average EU citizen in 2010). .............27
Table 13. Normalized results (ILCD EU-27) for the BoP household goods per capita
baseline. Relevance of impacts after normalization with equal and EF weighting of impact
categories. Country-specific normalization factors (NFs) considers the calculation of water
resource depletion at the country level with specific water scarcity values. ..................28
Table 14. Normalized results (ILCD Global) for the BoP household goods per capita
baseline. Relevance of impacts after normalization with equal and EF weighting of impact
categories............................................................................................................29
Table 15. Impact categories, models and units of EF 3.0 impact assessment method.
Differences with ILCD (EC-JRC, 2011) are highlighted in green. .................................30
Table 16. Characterized and normalized results for the whole BoP household goods
baseline (impacts of consumption of household goods in EU in 2010) with EF 3.0 method,
applied to the system S+R. Global normalization and equal and EF weighting. .............31
Table 17. Characterized and normalized results for the F.U. of the BoP household goods
baseline (impacts of consumption by an average EU citizen in 2010) with EF 3.0 method,
applied to the system S+R. Global normalization and equal weighting. ........................32
Table 18. Contribution of different life cycle stages to the impact categories (based on
the characterized inventory results of System S+R before normalization and weighting).
..........................................................................................................................33
Table 19. Contribution of elementary flows to each impact category of the ILCD method.
..........................................................................................................................36

146
Table 20. Most relevant elementary flows for resource depletion, water scarcity, land use
and particulate matter, when applying EF 3.0 method. ..............................................38
Table 21. Contribution of each representative product to the characterized results of the
BoP household goods (system S+R). A colour scale is applied, from red (highest
contributor) to green (lowest contributor), for each impact category. ..........................41
Table 22. Composition of the BoP household goods in terms of product groups,
representative products, upscaled consumption of an average EU-27 citizen in years
2010 and 2015, and variation between the two assessed years (Source: Eurostat, 2015).
..........................................................................................................................43
Table 23. Overview of eco-innovation options relevant for the BoP household goods. ....47
Table 24. Summary of EU Ecolabel and GPP criteria for the product groups included in the
BoP, with specification of products and life cycle stage to which the different criteria could
be applied as well as the feasibility of implementation in the BoP model. The scenarios
where the area of improvement has been applied are reported. .................................51
Table 25. Potential innovation actions for the product groups considered. ....................55
Table 26. Summary of scenarios and sensitivity analyses performed on the BoP
household goods. .................................................................................................57
Table 27. Comparison between the baseline scenario (consumption and use of household
goods in the baseline year 2010 by an average EU citizen) and the scenario TCF. .........60
Table 28. Input data used for the calculation of a freshwater ecotoxicity CF for AOX
emissions to water from pulp and paper production. .................................................60
Table 29. Results of the comparison between the baseline and the scenario TCF assessed
using ILCD with the additional CF for AOX. ..............................................................61
Table 30. Results of the comparison between 1 baby diaper as it is in the baseline and 1
baby diaper in the scenario TCF (using ILCD with the additional CF for AOX). ...............63
Table 31. Results of the comparison between 1 newspaper as it is in the baseline and 1
newspaper in the scenario TCF (using ILCD with the additional CF for AOX). ................63
Table 32. Electricity mix of the European electricity market dataset and the expected
2030 EU electricity mix based on the EU Reference Scenario 2016 (EC, 2016). ............68
Table 33. Results of the comparison between the baseline and scenarios 2a and 2b. .....69
Table 34. EoL scenario for textiles and furniture, as assumed in the baseline of the BoP
household goods. .................................................................................................72
Table 35. Score for Criteria 1 and 2 of EU Ecolabel for soaps. .....................................85
Table 36. Components formulation for eco-innovation scenario. Liquid soap. ................85
Table 37. Inventory values for transport of component. Liquid soap. ...........................86
Table 38. Market share of packaging capacities for Liquid soap products (Escamilla et al.,
2012)..................................................................................................................87
Table 39. Dosage values for Use stage. Liquid soap. .................................................88
Table 40. Availability of characterisation factors for substances that are emitted to water
at the EoL of liquid soap. .......................................................................................89
Table 41. Parameters modified in the eco-innovative scenario for liquid soap. ..............90
Table 42. Components formulation for eco-innovation scenario. Shampoo. ..................94
Table 43. Inventory values for transport of components. Shampoo. ............................94
Table 44. Score for Criteria 1 and 2 of EU Ecolabel for shampoo. ................................95
Table 45. Dosage values for Use stage. Shampoo. ....................................................96

147
Table 46. Parameters modified in the eco-innovation scenario for shampoo. ................96
Table 47. Components formulation for eco-innovation scenario. Dishwasher detergent.
........................................................................................................................ 100
Table 48. Score for Criteria 2 and 3 of EU Ecolabel for detergents. ............................ 100
Table 49. Eco-innovation scenario for packaging stage. ........................................... 101
Table 50. Eco-innovation scenario defined for use phase of dishwashing detergent. .... 102
Table 51. Parameters modified in the eco-innovation scenario for dishwasher detergent.
........................................................................................................................ 102
Table 52. Components formulation for eco-innovation scenario. Laundry detergent..... 106
Table 53. Score for Criteria 2 and 3 of EU Ecolabel for detergents. ............................ 106
Table 54. Market share of packaging capacities for Laundry detergents. .................... 107
Table 55. WUR calculation. Laundry detergent. ...................................................... 108
Table 56. Improved scenario defined for use phase of laundry detergent. .................. 108
Table 57. Parameters modified in the eco-innovation scenario for laundry detergents. 108
Table 58. Materials used in the manufacturing of upholstered seat............................ 113
Table 59. End of life for upholstered seat in the eco-innovation scenario. ................... 114
Table 60. Parameters modified in the eco-innovation scenario for upholstered seat. .... 114
Table 61. Relative reductions of environmental impacts for Eco-innovation scenarios.
Reductions are above 5% (green), between 1.5% and 4.99% (yellow) and below 1.49%
(red). ................................................................................................................ 119
Table 62. Summary of results of the scenarios analysed. Results are expressed as
variation (%) compared to the baseline BoP household goods. ................................. 122
Table 63. BoM of all-purpose cleaner..................................................................... 148
Table 64. BoM of dishwashing detergent. ............................................................... 148
Table 65. BoM of hand dishwashing detergent. ....................................................... 149
Table 66. BoM of laundry (liquid) detergent. .......................................................... 150
Table 67. BoM of absorbent hygiene products. ....................................................... 151
Table 68. BoM of bed mattresses. ......................................................................... 152
Table 69. BoM of liquid soap. ............................................................................... 152
Table 70. BoM of solid soap. ................................................................................ 153
Table 71. BoM of shampoo. .................................................................................. 153
Table 72. BoM of hair conditioner. ........................................................................ 154
Table 73. BoM of footwear ................................................................................... 154
Table 74. BoM of furniture pieces. ........................................................................ 157
Table 75. BoM of paper products. ......................................................................... 158
Table 76. BoM of clothes. .................................................................................... 159

148
Annexes
Annex 1. Bill of materials of the representative products in the BoP
The following tables report the bill of materials for each of the representative products included in the BoP household goods.
Table 63. BoM of all-purpose cleaner.
All-purpose cleaner formulation
Assumption on
concentration (wt %)
Ecoinvent dataset
Alkylphenol ethoxylate 10% Ethoxylated alcohols {GLO} (1/3 AE11, 1/3AE3, 1/3 AE7)
Ethylene glycol butyl ether 3% Ethylene glycol diethyl ether {GLO}
Sodium carbonate 3% Soda ash, dense {GLO}| modified Solvay process, Hou's process
Sodium hydroxide 3% Sodium hydroxide, without water, in 50% solution state {GLO}
Water 81% Water, deionised, from tap water, at user {RoW}
Volume of final product 500mL (1 bottle)
Table 64. BoM of dishwashing detergent.
Dishwashing product formulation
Assumption on concentration
(wt %) Ecoinvent dataset
Sodium citrate dihydrate 30% Citric acid {GLO}
Maleic acid/acrylic acid
copolymer sodium salt 6% SAP Sodium Polyacrylate (dataset created)
Sodium percarbonate 7% Sodium percarbonate, powder {GLO}
TAED (92 % active) 2% EDTA, ethylenediaminetetraacetic acid {GLO}
Sodium silicate 10% Layered sodium silicate, SKS-6, powder {GLO}
Linear fatty alcohol ethoxylate
2% Ethoxylated alcohols {GLO} (1/3 AE11, 1/3AE3, 1/3 AE7)
Protease savinase 1% Empty process
Amylase termamyl 0.50% Empty process
Sodium carbonate 43.50% Soda ash, dense {GLO}| modified Solvay process, Hou's process
Weight of final product 20g (1 tab)

149
Table 65. BoM of hand dishwashing detergent.
Hand dishwashing product formulation
Assumption on concentration
(wt %)
Ecoinvent dataset
Softened Water 84% Water, completely softened, from decarbonised water, at user {RER}
Ethanol denaturated 0% Ethanol, without water, in 99.7% solution state, from ethylene {GLO}
Phenoxyethanol 1% Ethylene glycol {GLO}
Propylene Glycol 0% Propylene glycol, liquid {GLO}
Surfactant system (anionic – non-ionic)*
14% 1/4 Ethoxylated alcohol (AE3) {GLO}; 1/4 Ethoxylated alcohol (AE7) {GLO}, 1/2 Fatty alcohol sulfate {RER}
NaOH 0.1% Sodium hydroxide, without water, in 50% solution state {GLO}
NaCl 0.1% Sodium chloride, powder {GLO}
Perfume 0.25% Empty process
Dye (2 types) 0.05% Empty process
Preservatives 0% Empty process
Volume of final product 1 L (1 bottle)

150
Table 66. BoM of laundry (liquid) detergent.
Laundry (liquid) product formulation Assumption on
concentration (wt
%)
Ecoinvent dataset
Water 70.22% Water, deionised, from tap water, at user {RoW}
Citric acid (builders) 1.61% Citric acid {GLO}
Salts of citric acid and other salts (builders) 0.67% Citric acid {GLO}
Sodium phosphonate (sequestrants) 0.41% Sodium phosphate {GLO}
Enzymes 0.58% Empty process
Dye 0.03% Cyanuric chloride {GLO}
Fragrances 0.71% Empty process
Optical brighteners 0.03% Fluorescent whitening agent, distyrylbiphenyl type {GLO}
Optical brighteners 0.03% Fluorescent whitening agent, DAS1, triazinylaminostilben type
{GLO}
Sodium alkyl ether sulfates (mix of oleo- and petro-based)
3.55% Fatty alcohol sulfate {RER}| market for
LAS Alkylbenzene sulfonate (petro) 6.83% Alkylbenzene sulfonate, linear, petrochemical {GLO}
Soap 2.41% Soap {RER}
Ethoxylates oleochemicals + petrochemical) & other non-ionic surfactants
5.91%
Ethoxylated alcohol (AE3) {GLO}
Ethoxylated alcohol (AE7) {GLO}
Ethoxylated alcohol (AE11) {GLO}
Sodium Hydroxide (Alkalinity sources) 1.16% Sodium hydroxide, in 50% sol. state {GLO}
Triethanolamine (Alkalinity sources) 1.16% Triethanolamine {GLO}
Glycerine (solvents) 1.43% Glycerine {GLO}
Propylene glycol (solvents) 1.43% Propylene glycol, liquid {GLO}
Preservatives (other ingredients) 0.46% Benzo[thia]diazole-compound {GLO}
Polymers (other ingredients) 0.46% Polycarboxylates, 40% active substance {GLO}
Sodium chloride (other ingredients) 0.46% Sodium chloride, powder {GLO}
Others (other ingredients) 0.46% Chemical, organic {GLO}
Volume of final product 650 mL (1 bottle)

151
Table 67. BoM of absorbent hygiene products.
Materials in Absorbent
Hygiene Products
Weight per baby diaper
[g]
Weight per sanitary pad [g]
Weight per
tampon [g]
Weight per
breast pad [g]
Ecoinvent dataset
Fluff pulp 13.18 5.31 - 3.12 Sulfate pulp {GLO}
Superabsorber (SAP) 11.05 0.24 - 0.76 SAP Sodium Polyacrylate (as modelled in Mirabella et al. (2013))
Polyethylene, low density
(LDPE) 2.23 0.59 - - Packaging film, low density polyethylene {RER}
Polypropylene (PP) 5.76 0.59 0.16 0.04 Textile, polypropilene {GLO}
Polyethylene-terephtalate (PET)
- 0.59 - - Polyurethane, flexible foam {RER}
Adhesive 1.01 0.38 - - Empty process
Elastics 0.14 - - - Polyurethane, flexible foam {RER}
Other materials: tape, elastic back ear, frontal tape, various synthetic polymers
2.63 - - - Polypropylene, granulate {RER}
Release paper - 0.29 - - Linerboard {RER}
Primary material (cotton or viscose)
- - 2.25 - Cotton fibre {GLO}
Cotton yarn - - 0.1 - Yarn production, cotton fibres/GLO
Polypropylene applicator - - 2 - Polypropylene, granulate {RER}
Paper 0.08 Linerboard {RER}
Weight of final product 36 g 8 g 4.5 g 4 g
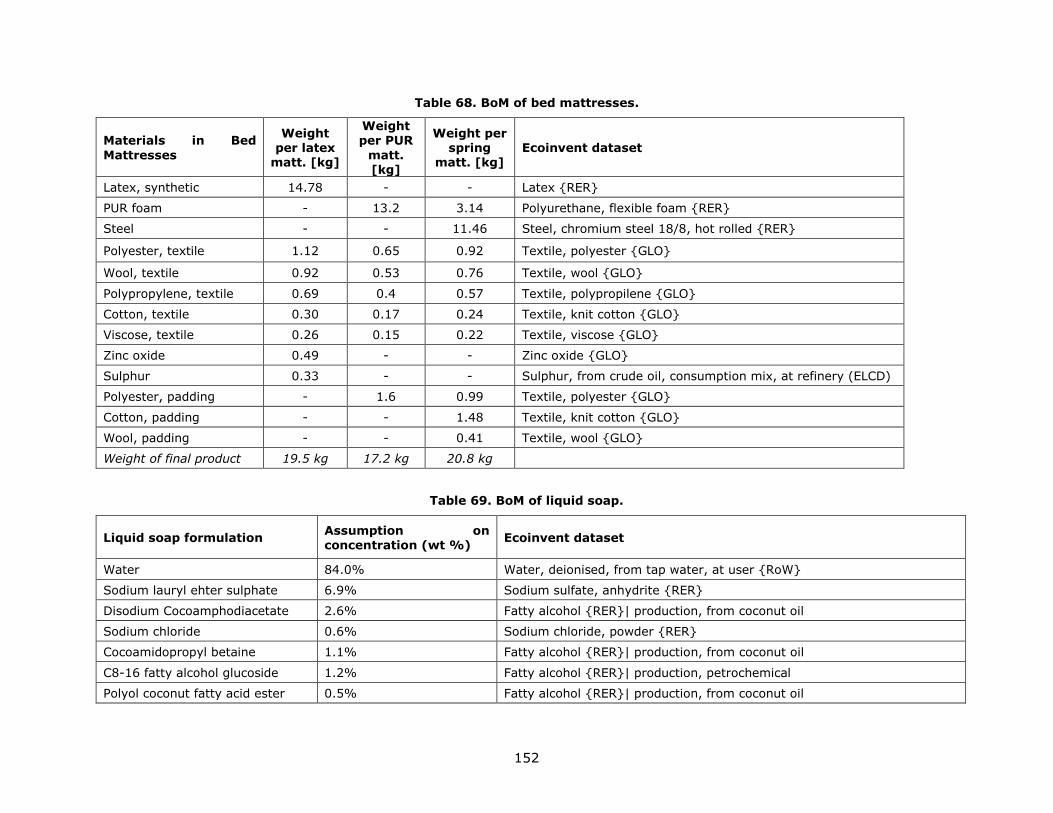
152
Table 68. BoM of bed mattresses.
Materials in Bed
Mattresses
Weight per latex
matt. [kg]
Weight per PUR
matt. [kg]
Weight per spring
matt. [kg] Ecoinvent dataset
Latex, synthetic 14.78 - - Latex {RER}
PUR foam - 13.2 3.14 Polyurethane, flexible foam {RER}
Steel - - 11.46 Steel, chromium steel 18/8, hot rolled {RER}
Polyester, textile 1.12 0.65 0.92 Textile, polyester {GLO}
Wool, textile 0.92 0.53 0.76 Textile, wool {GLO}
Polypropylene, textile 0.69 0.4 0.57 Textile, polypropilene {GLO}
Cotton, textile 0.30 0.17 0.24 Textile, knit cotton {GLO}
Viscose, textile 0.26 0.15 0.22 Textile, viscose {GLO}
Zinc oxide 0.49 - - Zinc oxide {GLO}
Sulphur 0.33 - - Sulphur, from crude oil, consumption mix, at refinery (ELCD)
Polyester, padding - 1.6 0.99 Textile, polyester {GLO}
Cotton, padding - - 1.48 Textile, knit cotton {GLO}
Wool, padding - - 0.41 Textile, wool {GLO}
Weight of final product 19.5 kg 17.2 kg 20.8 kg
Table 69. BoM of liquid soap.
Liquid soap formulation Assumption on concentration (wt %)
Ecoinvent dataset
Water 84.0% Water, deionised, from tap water, at user {RoW}
Sodium lauryl ehter sulphate 6.9% Sodium sulfate, anhydrite {RER}
Disodium Cocoamphodiacetate 2.6% Fatty alcohol {RER}| production, from coconut oil
Sodium chloride 0.6% Sodium chloride, powder {RER}
Cocoamidopropyl betaine 1.1% Fatty alcohol {RER}| production, from coconut oil
C8-16 fatty alcohol glucoside 1.2% Fatty alcohol {RER}| production, petrochemical
Polyol coconut fatty acid ester 0.5% Fatty alcohol {RER}| production, from coconut oil

153
Liquid soap formulation Assumption on concentration (wt %)
Ecoinvent dataset
Citric acid monohydrated 0.5% Polycarboxylates, 40% active substance {RER}
Benzyl alcohol 0.2% Benzyl alcohol {RER}
Sodium benzoate 0.2% Benzoic-compound {RER}
Potassium sorbate 3.0% Potassium hydroxide {RER}
Sodium chloride 2.0% Sodium chloride, powder {RER}
Volume of final product 255 mL (1 bottle)
Table 70. BoM of solid soap.
Solid soap composition Assumption on concentration (wt %)
Ecoinvent dataset
Saponified oils - tallow 57.0% Esterquat {RER}| treatment of tallow to
Saponified oils - coconut oil fatty acids 14.0% Fatty acid {GLO}
Saponified oils - stearic acid 14.0% Fatty acid {RER}| production, from vegetable oil
Glycerine 5.5% Glycerine {Europe without CH}| esterification of rape oil
Perfume 1.4% Empty process
Colorants 0.1% Empty process
EDTA 0.2% EDTA, ethylenediaminetetraacetic acid {RER}
Titanium dioxide 0.1% Titanium dioxide {RER}
Water 8.0% Water, deionised, from tap water, at user {RoW}
Weight of final product 100 g
Table 71. BoM of shampoo.
Shampoo formulation Assumption on concentration (wt %)
Ecoinvent dataset
Sodium laureth sulphate 7.0% Sodium sulfate, anhydrite {RER}
Cocoamidopropyl betaine 2.5% Fatty alcohol {RER}| production, from coconut oil
Fatty alkanolamides 0.5% Fatty acid {RER}| production, from vegetable oil
Propylene glycol 1.5% Propylene glycol, liquid {RER}

154
Sodium benzoate 0.1% Benzoic-compound {RER}
Benzyl alcohol 0.1% Benzyl alcohol {RER}
Lactic acid 0.1% Lactic acid {RER}| production | Alloc Def, U
Water 88.3% Water, deionised, from tap water, at user {RoW}
Volume of final product 255 mL (1 bottle)
Table 72. BoM of hair conditioner.
Hair conditioner formulation Assumption on
concentration (wt %) Ecoinvent dataset
Cetyl stearyl alcohol 3.3% Fatty alcohol {GLO}
2‐octyldocecaine 0.3% Fatty acid {RER}
Lanoline 0.3% Slack wax {US}
Provit B5 0.4% Empty process
Nutrilan keratine 0.0% Empty process
Dioactadecyl dimethyl ammonium chloride 1.0% Ammonium chloride {GLO}
Cetyl trimethyl ammonium chloride 0.8% Ammonium chloride {GLO}
Propylene glycol 2.0% Propylene glycol, liquid {RER}
Methyl hydroxypropyl cellulose 0.6% Carboxymethyl cellulose, powder {RER}
Polyvinyl 0.1% Empty process
Perfume 0.2% Empty process
Parabens 0.2% Benzoic-compound {RER}
Water 90.8% Water, deionised, from tap water, at user {RoW}
Volume of final product 255 mL (1 bottle)
Table 73. BoM of footwear
Materials in the shoes
Weight per
Sport
shoes [kg]
Weight per
Leisure
shoes [kg]
Weight per
Fashion
shoes [kg]
Weight per
WW
shoes [kg]
Ecoinvent dataset
Acetone 0.00 0.00 0.00 - Acetone, liquid {GLO}
Acrylic - - 0.00 - Polymethyl methacrylate, beads {GLO}
Aluminum - 0.01 0.01 0.02 Aluminium, cast alloy {GLO}

155
Materials in the shoes
Weight per Sport
shoes [kg]
Weight per Leisure
shoes [kg]
Weight per Fashion
shoes [kg]
Weight per WW
shoes [kg]
Ecoinvent dataset
Azodicarb propellant 0.01 - - 0.00 Empty process
Ba Zn stearate - 0.01 - - Empty process
Biological waste - - - 0.07 Empty process
Carbon black 0.00 - 0.00 - Carbon black {GLO}
Cardboard 0.00 - 0.07 - Core board {GLO}
Cellulose - - - 0.01 Cellulose fibre, inclusive blowing in {RoW}
Copper - - - 0.03 Copper {GLO}
Cotton fiber 0.00 0.25 0.03 0.01 Cotton fibre {GLO}
Cyclohexane 0.00 0.00 0.00 - Cyclohexane {GLO}
Ethanol 0.00 0.00 0.00 - Ethanol, without water, in 95% solution state, from
fermentation {GLO}
Ethyl acetate 0.01 0.00 0.00 - Ethyl acetate {GLO}
EVA 0.17 0.08 0.00 0.13 Ethylvinylacetate, foil {GLO}
Fiberglass - - - 0.04 Glass fibre {GLO}
Hardener chemical (ethylene)
0.00 - - - Ethene (ethylene), from steam cracking, production mix, at plant, gaseous EU-27 S (from ELCD)
Jute - 0.09 - - Jute fibre {GLO}| market for | Alloc Def, U_no transport
Leather - - 0.05 0.14 Chrome-tanned finished leather (own elaboration)
Limestone flour 0.02 0.04 0.02 0.02 Limestone, unprocessed {GLO}
MEK 0.01 0.00 0.00 - Methyl ethyl ketone {GLO}
Mg carbonate 0.00 - - 0.00 Magnesium {GLO}
Natural rubber 0.00 0.06 0.01 0.00 Empty process
Nitrile rubber 0.00 0.01 0.00 0.00 Acrylonitrile-butadiene-styrene copolymer {GLO}
Nylon 6 fiber 0.01 - 0.01 0.05 Nylon 6 {GLO}
Nylon 6 granulate 0.02 0.00 0.00 0.03 Nylon 6, glass-filled {GLO}

156
Materials in the shoes
Weight per Sport
shoes [kg]
Weight per Leisure
shoes [kg]
Weight per Fashion
shoes [kg]
Weight per WW
shoes [kg]
Ecoinvent dataset
Nylon 6.6 fiber 0.05 - - - Nylon 6-6 {GLO}
Nylon 6.6 granulate - - 0.00 - Nylon 6-6, glass-filled {GLO}
Polycarbonate granulate 0.00 - 0.00 - Polycarbonate {GLO}
Pentane 0.00 - - - Pentane {GLO}
PET fabric 0.09 0.14 0.08 0.12 Textile, polyester {GLO}
PET fiber 0.10 0.03 0.01 0.03 Textile, polyester {GLO}
PET granulate 0.03 - 0.02 0.01 Polyethylene terephthalate, granulate, amorphous {GLO}
Polybutadiene 0.03 0.07 0.03 0.02 Polybutadiene {GLO}
PP fiber 0.00 - - - Polypropylene, granulate {GLO}
PP gran 0.03 - - 0.01 Polypropylene, granulate {GLO}
PU film 0.04 0.09 0.04 0.01 Polyurethane, flexible foam {GLO}
PU flex foam 0.08 - 0.07 0.33 Polyurethane, flexible foam {GLO}
Recy PET - - - 0.01 Empty process
Recy rubber - 0.03 - 0.00 Empty process
SBR 0.05 0.02 - 0.11 Styrene-acrylonitrile copolymer {GLO}
Silica sand - - - 0.00 Silica sand {GLO}
Spandex 0.00 0.00 0.00 0.00 Synthetic rubber {RER}
TDI - - - - Toluene diisocyanate {GLO}
TiO2 0.00 - - 0.00 Titanium dioxide {RER}
TPU 0.07 0.09 0.11 0.01 Synthetic rubber {RER}
Wax / parrafins - - - - Paraffin {GLO}
Wood pulp 0.00 - - - Thermo-mechanical pulp {GLO}
Zinc oxide 0.00 0.01 0.00 0.01 Zinc oxide {GLO}
Weight of final product 0.59 kg 0.90 kg 0.55 kg 0.97 kg Referred to 1 pair of shoes

157
Table 74. BoM of furniture pieces.
Materials in furniture pieces
Amount per wardrobe [kg]
Amount per
kitchen cabinet [kg]
Amount per
wooden table [kg]
Amount per
wooden seat [kg]
Amount
per sofa [kg]
Ecoinvent dataset
Medium density particleboard (MDP)
235 2.1 - - 37.8 Particle board, for indoor use {GLO}
Solid timber - 0.02 8.02 5.57 4.8 Sawnwood, hardwood, dried (u=20%), planed {RER}
Multilayered board - 28.40 11.04 5.04 Glued laminated timber, for indoor use {GLO}
Aluminium - 5.90 - - Aluminium, cast alloy {GLO}
Steel 15.70 5.90 0.25 0.28 4.8 Steel, unalloyed {GLO}
Glues and adhesives 0.72 0.72 - - - Urea formaldehyde resin {GLO}
Paints and varnishes 4.82 0.72 1.70 1.00 - Alkyd paint, white, without solvent, in
60% solution state {GLO}
Polypropylene 9.14 0.55 - - - Polypropylene, granulate {GLO}
Textile, cotton - - - - 4.8 Textile, woven cotton {GLO}
Textile, polyester - - - - 2.4 Textile, polyester {GLO}
Polyurethane foam - - - - 5.4 Polyurethane, flexible foam {GLO}
Phosphorous (used in flame retardants)
- - - - 0.6 Phosphorus, white, liquid {GLO}
Melamine - - - - 0.6 Melamine {GLO}
Weight of final product 257 kg 39 kg 13.5 kg 7.5 kg 60 kg

158
Table 75. BoM of paper products.
Materials in paper products Amount per newspaper
[g]
Amount per book [g]
Amount per toilet paper
[g]
Ecoinvent dataset
Thermo-mechanical pulp 22.62 86.13 - Thermo-mechanical pulp production (EU)
Mechanical pulp 9.16 34.89 - Stone groundwood pulp production (EU)
Chemical pulp 51.79 197.15 469.48 Sulfate pulp production (EU), elementary chlorine free bleached
De-inked (recycled) pulp 30.42 115.83 156.52
De-inked pulp (dataset compiled according to
data in the screening study of the PEF pilot on Intermediate paper products
Urea (in wet strength agent) 0.02 0.09 - Urea, as N {RER}
Fatty alcohols 0.05 0.26 - Ethoxylated alcohol (AE3) {RER}, petrochemical
Biocides 0.06 0.29 - Biocides, for paper production, unspecified, at plant/RER
Acrilic binder 0.07 0.35 - Acrylic binder, without water, in 34% solution state {RER}
Retention aids 0.09 0.49 - Retention aids, in paper production, at plant/RER
AKD sizer 0.10 0.51 - AKD sizer, in paper production, at plant/RER
Pitch despergents 0.25 1.32 - Pitch despergents, in paper production {RER}
Aluminium sulfate 0.41 2.13 - Aluminium sulfate, powder {RER}
Latex 0.58 3.05 - Latex {RER}
Potato starch 0.02 0.10 - Potato starch {DE}
Maize starch 0.02 0.10 - Maize starch {DE}
Starch 1.12 5.84 - Polyester-complexed starch biopolymer {RER}
Kaolin (filler) 31.03 162.48 - Kaolin {RER}
Weight of final product 0.115 kg 0.600 kg 0.626 kg24
24 1 pack wiht four rolls

159
Table 76. BoM of clothes.
Materials in clothes
Amount
per T-shirt [g]
Amount per Blouse [g]
Amount per pair of Jeans [g]
Amount per pair
of Trousers [g]
Ecoinvent dataset
Textile, viscose 3.5 158.0 - - Viscose fibre {GLO}
Textile, polyamide 3.3 56.0 - - Nylon 6-6 {GLO}
Elastane 0.4 11.0 - - Synthetic rubber {RER}
Textile, cotton 153.8 - 684.3 - Cotton fibre {GLO}
Polyester linings 29.4 - 43.3 - Polyester resin, unsaturated {GLO}
Textile, polyester 0.6 - 0.6 458.0 Textile, polyester {GLO}
Aluminium (rivets, buttons or zips)
0.3 - 8.7 5.8 Aluminium, cast alloy {GLO}
Plastic (buttons) 0.0 - - 0.4 Polyethylene, high density, granulate {GLO}
Wood (buttons) 0.0 - - - Sawnwood, softwood, raw {GLO}
Textile, polypropylene 2.4 - - - Polypropylene fibres (PP), crude oil based, production mix, at plant, PP granulate
without additives EU-27 (from ELCD)
Acrylic 1.8 - - - Polymethyl methacrylate, beads {GLO}
Wool 1.1 - - - Wool, sheep, at farm/US
Chlorofibre 0.4 - - - Polyvinylchloride, bulk polymerised {GLO}
Flax 0.1 - - - Jute fibre {GLO}
Hemp 0.1 - - - Kenaf fibre {GLO}
Weight of final product 150 g 200 g 650 g 408 g

160
Annex 2. Datasets used to model packaging production and end of life
Production of materials and waste treatment (incineration and landfilling) are included in system S, whereas burdens and benefits
from recycling are included in System R.
Production of material Waste treatment (System S) Recycling (System R)
Material Ecoinvent process Ecoinvent process (waste
treatment)
% to
landf
ill
% to
incin
erati
on
% to
recyc
ling
Ecoinvent process (burdens)
Ecoinvent
process
Avoided
products
(benefits)
Aluminium
Sheet rolling, aluminium {GLO}| market for | Alloc
Def, U + Aluminium removed by milling, average
{GLO}| market for | Alloc Def, U
Scrap aluminium {RoW}|
treatment of, municipal
incineration | Alloc Def, U +
Waste aluminium {RoW}|
treatment of, sanitary landfill |
Alloc Def, U
20.1 10.7 69.2
Aluminium, wrought alloy {RoW}|
treatment of aluminium scrap, post-
consumer, prepared for recycling, at
remelter | Alloc Def, U
Aluminium,
primary, ingot
{IAI Area, EU27
& EFTA}| market
for | Alloc Def, U
Aluminium removed by milling, average {GLO}|
market for | Alloc Def, U
Cardboard
Corrugated board box {GLO}| market for
corrugated board box | Alloc Def, U
Waste paperboard {RoW}|
treatment of, municipal
incineration | Alloc Def, U +
Waste paperboard {RoW}|
treatment of, sanitary landfill |
Alloc Def, U
11 0.58 83.2
Waste paperboard, sorted {GLO}|
market for | Alloc Def, U
Sulfate pulp
{GLO}| market
for | Alloc Def, U
Core board {GLO}| market for | Alloc Def, S
11 0.58 83.2
Glass
Packaging glass, brown {GLO}| market for | Alloc
Def, U Waste glass {CH}| treatment of,
municipal incineration with fly ash
extraction | Alloc Def, U
+
Waste glass {CH}| treatment of,
inert material landfill | Alloc Def,
U
21.2 11.2 67.6
Glass cullet, sorted {GLO}| market for |
Alloc Def, U
Packaging
glass, brown
{GLO}|
packaging glass
production,
brown, without
cullet and
melting | Alloc
Def, U
Packaging glass, white {GLO}| market for | Alloc
Def, S
21.2 11.2 67.6
PE
Polyethylene, high density, granulate {GLO}|
market for | Alloc Def, U
Waste polyethylene {CH}|
treatment of, municipal
incineration with fly ash
extraction | Alloc Def, U
+
Waste polyethylene {CH}|
treatment of, sanitary landfill |
Alloc Def, U
44.5 23.6 31.9 Electricity, medium voltage {RoW}|
market for | Alloc Def, U
Polyethylene,
high density,
granulate {RER}|
production |
Alloc Def, U
Polyethylene, low density, granulate {GLO}|
market for | Alloc Def, U

161
Production of material Waste treatment (System S) Recycling (System R)
Material Ecoinvent process Ecoinvent process (waste
treatment)
% to
landf
ill
% to
incin
erati
on
% to
recyc
ling
Ecoinvent process (burdens)
Ecoinvent
process
Avoided
products
(benefits)
PET
Polyethylene terephthalate, granulate, bottle
grade {GLO}| market for | Alloc Def, U copia basket
+ Blow moulding {GLO}| market for | Alloc Def, U
copia basket + Plastic processing factory {RER}|
construction | Alloc Def, S
Waste polyethylene terephtalate
{CH}| treatment of, municipal
incineration with fly ash
extraction | Alloc Def, U
+
Waste polyethylene terephtalate
{CH}| treatment of, sanitary
landfill | Alloc Def, U
44.5 23.6 31.9 Electricity, medium voltage {RoW}|
market for | Alloc Def, U
Polyethylene
terephthalate,
granulate,
bottle grade
{RER}|
production |
Alloc Def, U
PP Polypropylene, granulate {GLO}| market for | Alloc
Def, U
Waste polypropylene {CH}|
treatment of, municipal
incineration with fly ash
extraction | Alloc Def, U
+
Waste polypropylene {CH}|
treatment of, sanitary landfill |
Alloc Def, U
44.5 23.6 31.9 Electricity, medium voltage {RoW}|
market for | Alloc Def, U
Polypropylene,
granulate {RER}|
production |
Alloc Def, U
PS
Polystyrene, general purpose {GLO}| market for |
Alloc Def, U
Waste polystyrene {CH}|
treatment of, municipal
incineration with fly ash
extraction | Alloc Def, U
+
Waste polystyrene {CH}|
treatment of, sanitary landfill |
Alloc Def, U
44.5 23.6 31.9 Electricity, medium voltage {RoW}|
market for | Alloc Def, U
Polystyrene,
general purpose
{RER}|
production |
Alloc Def, U

162
Annex 3. Global normalization factors for the Environmental Footprint method
(EF 3.0)
This annex reports the updated global normalization factors by impact category for the
Environmental Footprint method version employed in this report (EF 3.0). The update
includes modifications of specific inventory flows from Crenna et al. (2019).
Impact category Per person Global NFs
Climate change 8.10E+03 5.58E+13
Ozone depletion 5.36E-02 3.70E+08
Particulate matter 5.95E-04 4.11E+06
Ionising radiation 4.22E+03 2.91E+13
Photochemical ozone formation 4.06E+01 2.80E+11
Acidification 5.56E+01 3.83E+11
Terrestrial eutrophication 1.77E+02 1.22E+12
Freshwater eutrophication 1.61E+00 1.11E+10
Marine Eutrophication 1.95E+01 1.35E+11
Water use 1.14E+04 7.89E+13
Land use 1.04E+06 7.19E+15
Resource depletion, fossils 6.50E+04 4.48E+14
Resource depletion, minerals and metals 6.36E-02 4.39E+08
Human toxicity, cancer 1.69E-05 1.17E+05
Human toxicity, non-cancer 2.30E-04 1.58E+06
Ecotoxicity freshwater 4.27E+04 2.94E+14

163
Annex 4. Network graphs of the inventory of most contributing elementary
flows
The inventory networks of the most important flow(s) (most contributing to impact
categories, considering ILCD methods) (Table 19) are reported below. The larger the depth
of the red arrow going from one process to the related one(s), the larger the contribution
of that process to the total amount of the analysed flow in the inventory (e.g., which are
the activities that entail higher emissions of carbon dioxide to air).
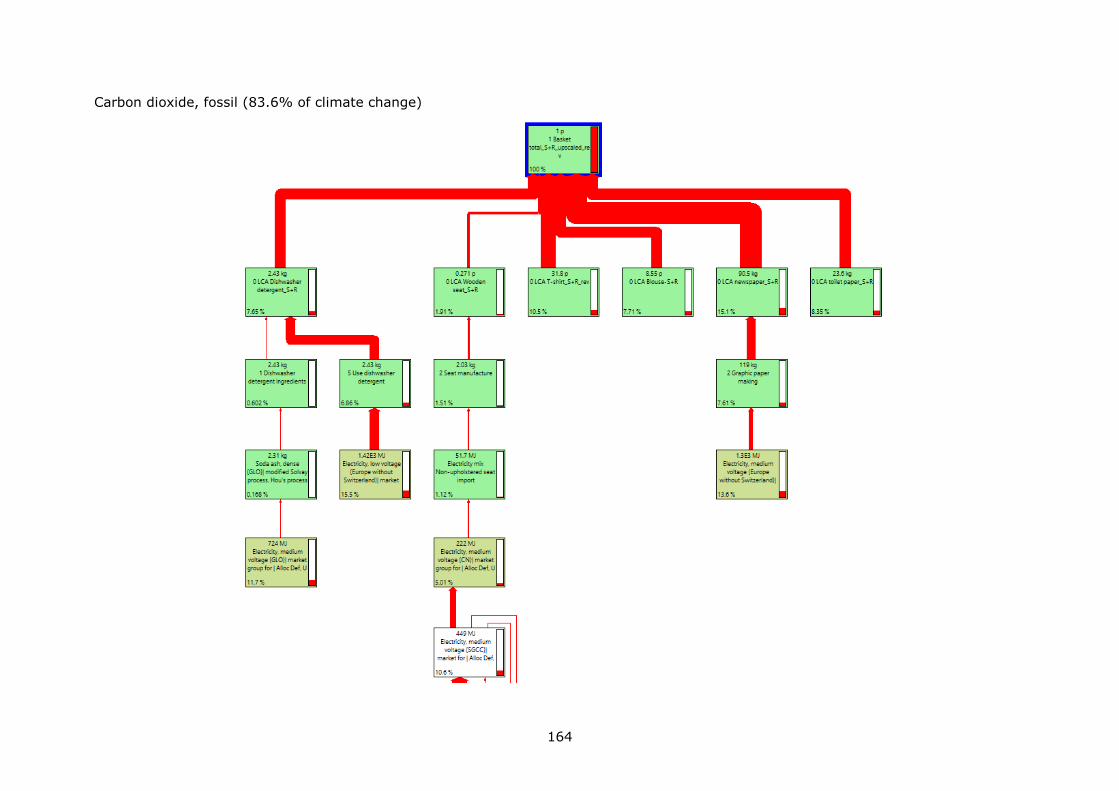
164
Carbon dioxide, fossil (83.6% of climate change)

165
Zinc to soil (32.2% of human toxicity, non-cancer)

166
Particulates ≤ 2.5 (74.9% of particulate matter)

167
Methane, bromotrifluoro-, Halon 1301 (52.7% of ozone depletion)
(…)

168
Chromium to water (54.3% of human toxicity, cancer and 17.6% of freshwater
ecotoxicity)

169
Carbon-14 to air (94.4% of ionising radiation HH)

170
Nitrogen oxides (73.8% of photochemical ozone formation, 79.9% of terrestrial eutrophication and 52.1% of marine eutrophication)

171
Sulphur dioxide (63.4% of acidification)

172
Phosphate to water (91.0% of freshwater eutrophication)

173
Indium (75.2% of resource depletion)

174
Occupation, forest, intensive (39.8% of land use occupation)

175
Transformation, to mineral extraction site (32.2% of land use transformation)
(…)

176
Water, cooling, DE (11.1% of water resource depletion)

177
Chromium to water (14.9% of freshwater ecotoxicity)


GETTING IN TOUCH WITH THE EU
In person
All over the European Union there are hundreds of Europe Direct information centres. You can find the address of the centre nearest you at: http://europea.eu/contact
On the phone or by email
Europe Direct is a service that answers your questions about the European Union. You can contact this service:
- by freephone: 00 800 6 7 8 9 10 11 (certain operators may charge for these calls),
- at the following standard number: +32 22999696, or
- by electronic mail via: http://europa.eu/contact
FINDING INFORMATION ABOUT THE EU
Online
Information about the European Union in all the official languages of the EU is available on the Europa website at: http://europa.eu
EU publications
You can download or order free and priced EU publications from EU Bookshop at:
http://bookshop.europa.eu. Multiple copies of free publications may be obtained by contacting Europe
Direct or your local information centre (see http://europa.eu/contact).

KJ-N
A-2
9710-E
N-N
doi:10.2760/462368
ISBN 978-92-76-01614-4