Infrastructure Footprint Reduction Program - Fort Benning
328
Infrastructure Footprint Reduction Program Environmental Assessment Fort Benning, Georgia June 2018 Directorate of Public Works Environmental Management Division Fort Benning, Georgia
-
Upload
khangminh22 -
Category
Documents
-
view
1 -
download
0
Transcript of Infrastructure Footprint Reduction Program - Fort Benning

Infrastructure Footprint Reduction Program
Environmental Assessment Fort Benning, Georgia
June 2018
Directorate of Public Works Environmental Management Division Fort Benning, Georgia


Infrastructure Footprint Reduction Program June 2018 Environmental Assessment
S-1
SUMMARY
1 Introduction Fort Benning has prepared this Environmental Assessment (EA) to examine the potential environmental consequences of implementing the Fiscal Year (FY) 19-23 Facility Reduction Program (FRP) in accordance with the National Environmental Policy Act (NEPA) of 1969 (42 US Code [USC] 4321 et seq.), the Council on Environmental Quality (CEQ) Regulations Implementing the Procedural Provisions of NEPA (40 Code of Federal Regulations [CFR] Part 1500-1508), and the Army NEPA Regulation (Environmental Analysis of Army Actions; 32 CFR Part 651. As a public document, the EA is used to determine and evaluate the potential environmental effects of the Proposed Action, identify possible/potential mitigation measures to lessen or eliminate adverse effects, and examine reasonable alternatives for the Proposed Action. The intended audience of the EA is Army decision-makers, interested government agencies, federally recognized Native American Tribes, and non-governmental organizations, and members of the public. The effects analyses in this EA are based on a variety of sources and the best available information at the time of preparation. The information contained in this EA will be reviewed and considered by the Army prior to the final decision on how to implement the Proposed Action, if at all.
2 Background A US Army Training and Doctrine Command (TRADOC) memorandum dated 1 November 1996, directed Army installations to support the "Winning the Infrastructure War" initiative via implementation of the IFRP (Infrastructure Footprint Reduction Program) (Fort Benning, 1997). Rather than incur the expense of maintaining outdated or unusable buildings and other structures (i.e., concrete pads and former building foundations, antiquated training equipment, etc.), infrastructure would be demolished and their various functions relocated. The IFRP continues to be implemented on the Installation through the development of the FRP. The FRP is a dynamic Fort Benning initiative with infrastructure being added to or removed from the proposed demolition inventory on the basis of evolving mission demands, utilization priorities, and available funding. Appendix A contains a listing of infrastructure currently proposed for demolition and commonly referred to as the FRP list. An initial EA and Finding of No Significant Impact (FNSI) for the IFRP on Fort Benning were completed in 1997. The EA analyzed the No Action (Status Quo) Alternative plus two Action Alternatives. Alternative 2 involved the construction and utilization of an on-Post facility for the disposal of demolition wastes. The Preferred Alternative (Alternative 3) involved the transport of demolition wastes to an off-Post commercial facility. The EA’s Preferred Alternative offered the most flexibility in disposal methods for wastes generated by demolition and was the alternative selected as outlined in the FNSI. As a result of infrastructure being demolished or being removed from the program’s demolition inventory due to reuse and other infrastructure being added, Supplemental EAs were prepared in

Infrastructure Footprint Reduction Program June 2018 Environmental Assessment
S-2
2002 and again in 2008. Both determined that the demolition of infrastructure on the FRP lists would not result in significant adverse effects; instead, all adverse effects were considered minor and further minimized through mitigation and/or monitoring activities. All total, Fort Benning has demolished an estimated 1.4 million square feet of buildings and structures over the last 15 years through the FRP and under a variety of other improvement projects (Miller, S. personal communication, 2018). More recent comprehensive and collaborative planning efforts by the Army have directed installations to continue optimizing land use and the management of existing facilities through site specific area development planning. Area Development Plans (ADPs) are developed from workshop style events guiding installation planning personnel and Army stakeholders through exercises which promotes short and long-term planning (Fort Benning, 2018). Key components of the ADPs include the repurposing of existing facilities for optimal use, demolition of excess infrastructure and unneeded facilities, and providing area specific plans from which the Real Property Master Plan can be updated (Fort Benning, 2016). An installation’s Real Property Master Plan provides broad planning direction at the land use level for sustainable installation development that supports mission and environmental requirements. Fort Benning is currently in the process of updating its 2011 Real Property Master Plan.
3 Proposed Action The Proposed Action is to implement the FY19-23 FRP at Fort Benning, Georgia. Implementation of the FRP could demolish, dispose, and remove from Real Property inventories approximately 150 buildings and structures equaling more than two million square feet. This tentative goal would occur over the next five years at various locations across Fort Benning’s cantonment areas for an estimated cost of $18 million (Figure 2-1). Ancillary structures would also be removed as part of the Proposed Action. Relocation of personnel, supplies, and/or equipment may include renovations and/or adaptive reuse of existing structures. Details of relocation and renovation are uncertain at this time, and those types of future actions will be subject to appropriate NEPA documentation as required.
4 Proposed Action Alternatives
Fort Benning developed a screening criteria to measure which alternatives are reasonable for further analysis. Any alternatives that failed to meet the criteria were eliminated from full consideration within this EA. Alternatives proposed must:
• Comply with the Army TRADOC’s IFRP and Army directives instructing optimized facility management through footprint reduction efforts (DoD, 2016a and b);
• Be economically feasible (e.g., facility conversion or extensive renovation and reuse of buildings and structures on the FRP list would be less cost effective than new construction/replacement or use of other facility); and
• Be consistent with Installation master planning and support mission requirements.

Infrastructure Footprint Reduction Program June 2018 Environmental Assessment
S-3
Alternatives carried forward for analysis in this EA include: No Action Alternative
Under the No Action Alternative, Fort Benning would continue to utilize approximately 150 building and structures considered cost prohibitive to sustain, in excess of Army utilization needs, and in some cases may contain potential human health and safety concerns associated with older and ageing infrastructure (e.g., lead based paints (LBPs), asbestos containing materials (ACMs), and/or structural deterioration). Occupied buildings would continue to incur excessive maintenance costs until new replacement facilities can be afforded to relocate current occupying activities and personnel. Currently under-utilized and unoccupied or abandoned buildings or structures would be demolished only as new projects requiring their removal are scheduled in the future. Note that the No Action Alternative does not meet the purpose and need for the Proposed Action but provides a baseline for comparison of other alternatives.
Alternative 1: Full Demolition
Under Alternative 1, Fort Benning would implement the FY19-23 FRP by demolishing all of the structures identified in the FRP’s proposed demolition list (Appendix A). Full demolition would preclude the expenditure of excessive maintenance and/or adaptive reuse/renovation costs associated with the utilization of older facilities. Personnel and activities currently occupying facilities to be demolished would relocate to available facilities. Demolished buildings and structures would become open space and in most circumstances the area would be available to be utilized in future projects.
Alternative 2: Selective Demolition
Alternative 2 is similar to Alternative 1; however, Fort Benning would retain the 17 historic buildings identified on the FRP’s proposed demolition list. Those 17 buildings are historic properties that are eligible for listing on the National Register of Historic Places per the National Historic Preservation Act. Fort Benning would implement the FY19-23 FRP by demolishing approximately 133 buildings and other structures and continue utilizing the historic structures as best as possible. As outlined in Appendix B, a considerable expenditure of funds to utilize and maintain the historic buildings would continue and many of these facilities would need adaptive reuse and other substantial renovations to sustain adequate and safe working conditions as they continue to age.
5 Environmental Consequences
The analysis contained in this EA indicates that the Proposed Action could have long-term, minor adverse impacts to Cultural Resources, under Alternative 1, and short-term, minor adverse impacts under Alternative 2. Other short-term, minor adverse impacts resulting from demolition activities would occur to Hazardous Materials and Waste, Soils, Water Resources, and Air Quality. Both Air Quality and Utilities would result in long-term, minor adverse impacts as a result of the No Action Alternative. VECs with negligible effects under the Action Alternatives includes Biological Resources, Land Use, and Noise. Additionally, long-term, beneficial impacts to Air Quality and Utilities would result from implementing the Action Alternatives due to

Infrastructure Footprint Reduction Program June 2018 Environmental Assessment
S-4
reductions in emissions and energy demands. Environmental consequences of the VECs fully analyzed are summarized in Table ES-1 below. As discussed in Section 4, these negligible effects to minor adverse direct/indirect impacts do not result in significant adverse cumulative effects when considering other past, present, and reasonably foreseeable future activities at Fort Benning. Adherence to Federal and State laws and regulations, as well as Installation management plans, and Army Regulations would minimize impacts of demolition and disposal activities to Air Quality, Cultural Resources, Hazardous Materials and Waste, Soils, and Water Resources.
6 Conclusions
Implementation of either Action Alternative or the No Action Alternative would have no significant impact on the quality of human life or the natural environment. Alternative 1 is, however, more desirable in comparison due to its proficiency to further comply with the US Army TRADOC’s IFRP and more recent Army efforts to optimize facility management through reductions to buildings and structures. A FNSI is warranted for this Proposed Action and does not require the preparation of an EIS.

Infrastructure Footprint Reduction Program June 2018 Environmental Assessment
S-5
Table ES.1: Summary of Direct and Indirect Environmental Consequences for Alternatives
VEC No Action Alternative 1: Full Demolition
Alternative 2: Selective Demolition
Air Quality
Long-term, minor adverse impacts as a
result of existing emission levels and use
of existing emission sources.
Long-term, beneficial impacts due to the
reduction of air emissions
equipment/Title V Permit. Short-term,
minor adverse impacts from fugitive dust emissions during
demolition.
Same as Alternative 1.
Biological Resources No impacts
Negligible effects as a result of potential soil disturbances, removal
of vegetation and possible habitat, vehicle
traffic, etc.
Same as Alternative 1.
Cultural Resources No impacts Long-term, minor
resulting from altering the historic landscapes.
Short-term, minor adverse impacts
resulting from temporally altering the
historic viewsheds.
Hazardous Materials and Waste No impacts
Short-term, minor adverse impacts from
an increase in hazardous materials
and disposal of waste.
Same as Alternative 1.
Land Use No impacts Negligible effects from
changes in land utilization.
Same as Alternative 1.
Noise No impacts Negligible effects as a
result temporary demolition activity.
Same as Alternative 1.
Soils No impacts
Short-term, minor adverse impacts as a
result of ground disturbances.
Same as Alternative 1.
Utilities
Long-term, minor adverse impacts as a result of energy usage
by facilities on the FY19-23 FRP list.
Long-term, beneficial impacts from
reductions to Fort Benning’s total energy
demand.
Same as Alternative 1.
Water Resources No impacts
Short-term, minor adverse impacts as a
result of ground disturbances or
accidental spills.
Same as Alternative 1.

Infrastructure Footprint Reduction Program June 2018 Environmental Assessment
i
Table of Contents 1 PURPOSE, NEED, AND SCOPE ........................................................................................ 1-1
1.1 Introduction ................................................................................................................... 1-1 1.2 Study Location .............................................................................................................. 1-1 1.3 Background ................................................................................................................... 1-2 1.4 Purpose and Need .......................................................................................................... 1-3 1.5 Decision to Be Made ..................................................................................................... 1-3 1.6 Scope of the EA ............................................................................................................ 1-3 1.7 Public Involvement ....................................................................................................... 1-4
2 DESCRIPTION OF THE PROPOSED ACTION AND ALTERNATIVES ....................... 2-1 2.1 Introduction ................................................................................................................... 2-1 2.2 Proposed Action ............................................................................................................ 2-1 2.3 Alternatives Screening Criteria ..................................................................................... 2-2 2.4 Alternatives Proposed ................................................................................................... 2-2
2.4.1 No Action Alternative ............................................................................................ 2-3
2.4.2 Alternative 1: Full Demolition ............................................................................... 2-3
2.4.3 Alternative 2: Selective Demolition ...................................................................... 2-3 2.5 Alternatives Considered but Eliminated from Full Study ............................................. 2-3
2.5.1 Renovation and Reuse of Historic Buildings on the FRP List .............................. 2-4
2.5.2 Conversion of Historic Buildings on the FRP List ................................................ 2-4
2.5.3 Mothballing of Historic Buildings for Future Use ................................................. 2-4 2.5.4 Sale and Relocation of Buildings or Structures Off-Post ...................................... 2-4
3 AFFECTED ENVIRONMENT AND ENVIRONMENTAL CONSEQUENCES .............. 3-1
3.1 Introduction ................................................................................................................... 3-1 3.2 VECs ............................................................................................................................. 3-2
3.2.1 VECs Not Carried Forward for Analysis ............................................................... 3-2
3.3 Air Quality .................................................................................................................... 3-3 3.3.1 Affected Environment ............................................................................................ 3-4 3.3.2 Environmental Consequences ................................................................................ 3-6
3.3.3 Mitigation ............................................................................................................... 3-7
3.4 Biological Resources ..................................................................................................... 3-7 3.4.1 Affected Environment ............................................................................................ 3-7 3.4.2 Environmental Consequences .............................................................................. 3-12

Infrastructure Footprint Reduction Program June 2018 Environmental Assessment
ii
3.4.3 Mitigation ............................................................................................................. 3-13
3.5 Cultural Resources ...................................................................................................... 3-14 3.5.1 Affected Environment .......................................................................................... 3-14
3.5.2 Environmental Consequences .............................................................................. 3-17
3.5.3 Mitigation ............................................................................................................. 3-20 3.6 Hazardous Materials and Waste .................................................................................. 3-20
3.6.1 Affected Environment .......................................................................................... 3-21
3.6.2 Environmental Consequences .............................................................................. 3-26
3.6.3 Mitigation ............................................................................................................. 3-27 3.7 Land Use ..................................................................................................................... 3-27
3.7.1 Affected Environment .......................................................................................... 3-27
3.7.2 Environmental Consequences .............................................................................. 3-28
3.7.3 Mitigation ............................................................................................................. 3-28 3.8 Noise ........................................................................................................................... 3-28
3.8.1 Affected Environment .......................................................................................... 3-29
3.8.2 Environmental Consequences .............................................................................. 3-30
3.8.3 Mitigation ............................................................................................................. 3-32 3.9 Soils ............................................................................................................................. 3-32
3.9.1 Affected Environment .......................................................................................... 3-33
3.9.2 Environmental Consequences .............................................................................. 3-33 3.9.3 Mitigation ............................................................................................................. 3-34
3.10 Utilities ........................................................................................................................ 3-37 3.10.1 Affected Environment .......................................................................................... 3-37
3.10.2 Environmental Consequences .............................................................................. 3-37 3.10.3 Mitigation ............................................................................................................. 3-37
3.11 Water Resources .......................................................................................................... 3-38 3.11.1 Affected Environment .......................................................................................... 3-38
3.11.2 Environmental Consequences .............................................................................. 3-41 3.11.3 Mitigation ............................................................................................................. 3-41
3.12 Environmental Impact Summary ................................................................................ 3-42 4 CUMULATIVE IMPACTS ................................................................................................. 4-1
4.1 Introduction ................................................................................................................... 4-1 4.1.1 Identifying Cumulative Impacts ............................................................................ 4-1

Infrastructure Footprint Reduction Program June 2018 Environmental Assessment
iii
4.1.2 Past, Present and Reasonably Foreseeable Actions ............................................... 4-1
4.2 Cumulative Impacts by Resource .................................................................................. 4-3 4.2.1 Air Quality ............................................................................................................. 4-5
4.2.2 Cultural Resources ................................................................................................. 4-5
4.2.3 Hazardous Materials and Waste ............................................................................ 4-5 4.2.4 Soils ....................................................................................................................... 4-6
4.2.5 Utilities ................................................................................................................... 4-6
4.2.6 Water Resources .................................................................................................... 4-6
5 CONCLUSIONS .................................................................................................................. 5-1 6 REFERENCES ..................................................................................................................... 6-1
7 ACRONYMS AND ABBREVIATIONS ............................................................................. 7-1
8 LIST OF PREPARERS ........................................................................................................ 8-1
9 DISTRIBUTON LIST .......................................................................................................... 8-1
FIGURES Figure 1-1: Army Installation Fort Benning ................................................................................ 1-6
Figure 2-1: FY19-23 FRP ............................................................................................................ 2-6
Figure 3-1: Main Post and Lawson Army Airfield Historic Districts ....................................... 3-19
Figure 3-2: FY19-23 FRP Noise Contours ................................................................................ 3-31 Figure 3-3: Main Post and Sand Hill Cantonment Soils ............................................................ 3-35
Figure 3-4: Kelley Hill and Harmony Church Cantonment Soils.............................................. 3-36
Figure 3-5: Surface Water and Floodplains ............................................................................... 3-39
Figure 4-1: Cumulative Project Locations ................................................................................... 4-4
TABLES Table 3.1: Comparative Noise Levels ........................................................................................ 3-29
Table 3.2: Summary of Direct and Indirect Environmental Consequences ............................... 3-43
APPENDICIES APPENDIX A: Fort Benning Facilities Reduction Program Demolition List
APPENDIX B: Fort Benning Facilities Reduction Program Economic Analysis
APPENDIX C: Fort Benning Facilities Reduction Program Draft Finding of No Significant Impact

Infrastructure Footprint Reduction Program June 2018 Environmental Assessment
1-1
1 PURPOSE, NEED, AND SCOPE
1.1 Introduction Fort Benning has prepared this Environmental Assessment (EA) to examine the potential environmental consequences of implementing the Fiscal Year (FY) 19-23 Facility Reduction Program (FRP) in accordance with the National Environmental Policy Act (NEPA) of 1969 (42 US Code [USC] 4321 et seq.), the Council on Environmental Quality (CEQ) Regulations Implementing the Procedural Provisions of NEPA (40 Code of Federal Regulations [CFR] Part 1500-1508), and the Army NEPA Regulation (Environmental Analysis of Army Actions; 32 CFR Part 651). The EA is used to determine and evaluate the potential environmental effects of the Proposed Action, identify possible/potential mitigation measures to lessen or eliminate adverse effects, and examine reasonable alternatives for the Proposed Action. The intended audience of the EA is Army decision-makers, interested government agencies, federally recognized Native American Tribes, and non-governmental organizations, and members of the public. The effects analyses in this EA are based on a variety of sources and the best available information at the time of preparation. The information contained in this EA will be reviewed and considered by the Army prior to the final decision on how to implement the Proposed Action, if at all.
1.2 Study Location Initially founded in 1918 as Camp Benning, Fort Benning is an Army Installation located near Columbus, Georgia (GA) and serves as serves as the home to numerous deployable Army units and other tenants. The Installation supports more than 120,000 Active Duty Military, Family Members, Reserve Component Soldiers, Retirees, and Army Civilian Employees on a daily basis (Figure 1-1). The Installation is located on approximately 182,000 acres in southwest GA’s Chattahoochee and Muscogee Counties and east Alabama’s Russell County and contains four cantonment areas: Main Post, Kelley Hill, Sand Hill, and Harmony Church. Within these cantonment areas, Fort Benning has its own offices, schools, shopping malls, medical facilities, housing, and churches. Multiple training facilities, firing ranges, and maneuver training areas exist across the Installation. The cantonment areas on-Post provide a centralized location for community facilities and support services for Soldiers and their Families. Fort Benning plays a pivotal role in supporting the Army’s overarching mission by providing the institutional training of Infantry and Armor Soldiers and leaders, basic and advanced individual training of new enlistees, and functional training in special skills needed to support the operating forces. Fort Benning became the home of the Maneuver Center of Excellence (MCoE) following the 2005 Base Closure and Realignment Commission’s recommendations to consolidate the Armor and Infantry Centers and Schools. This transformation in force structure was completed in 2011 and sustained Fort Benning’s role as an invaluable military readiness training platform that develops the capabilities of the maneuver force and individual Soldier. In 2016, Fort Benning’s force structure was once again transformed with the deactivation of the 3rd Heavy Brigade

Infrastructure Footprint Reduction Program June 2018 Environmental Assessment
1-2
Combat Team (3rd HBCT) of the 3rd Infantry Division (3ID) and activation of the 1st Battalion, 28th Infantry Regiment Task Force (1-28th IBFT). To support the Army’s mission, Fort Benning must continue to possess the infrastructure and facilities necessary to support the military training occurring there and support the quality of life of the Soldiers and their Families.
1.3 Background A US Army Training and Doctrine Command (TRADOC) memorandum dated 1 November 1996, directed Army installations to support the "Winning the Infrastructure War" initiative via implementation of the Infrastructure Footprint Reduction Program (IFRP) (Fort Benning, 1997). Rather than incur the expense of maintaining outdated or unusable buildings and other structures (i.e., concrete pads and former building foundations, antiquated training equipment, etc.), infrastructure would be demolished and their various functions relocated. The IFRP continues to be implemented on the Installation through the development of the FRP. The FRP is a dynamic Fort Benning initiative with infrastructure being added to or removed from the proposed demolition inventory on the basis of evolving mission demands, utilization priorities, and available funding. Appendix A contains a listing of infrastructure currently proposed for demolition and commonly referred to as the FRP list. An initial EA and Finding of No Significant Impact (FNSI) for the IFRP on Fort Benning were completed in 1997. The EA analyzed the No Action (Status Quo) Alternative plus two Action Alternatives. Alternative 2 involved the construction and utilization of an on-Post facility for the disposal of demolition wastes. The Preferred Alternative (Alternative 3) involved the transport of demolition wastes to an off-Post commercial facility. The EA’s Preferred Alternative offered the most flexibility in disposal methods for wastes generated by demolition and was the alternative selected as outlined in the FNSI. As a result of infrastructure being demolished or being removed from the program’s demolition inventory due to reuse and other infrastructure being added, Supplemental EAs were prepared in 2002 and again in 2008. Both determined that the demolition of infrastructure on the FRP lists would not result in significant adverse effects; instead, all adverse effects were considered minor and further minimized through mitigation and/or monitoring activities. All total, Fort Benning has demolished an estimated 1.4 million square feet of buildings and structures over the last 15 years through the FRP and under a variety of other improvement projects (Miller, S. personal communication, 2018). More recent comprehensive and collaborative planning efforts by the Army have directed installations to continue optimizing land use and the management of existing facilities through site specific area development planning. Area Development Plans (ADPs) are developed from workshop style events guiding installation planning personnel and Army stakeholders through exercises which promotes short and long-term planning (Fort Benning, 2018). Key components of the ADPs include the repurposing of existing facilities for optimal use, demolition of excess infrastructure and unneeded facilities, and providing area specific plans from which the Real Property Master Plan can be updated (Fort Benning, 2016). An installation’s Real Property Master Plan provides broad planning direction at the land use level for sustainable installation

Infrastructure Footprint Reduction Program June 2018 Environmental Assessment
1-3
development that supports mission and environmental requirements. Fort Benning is currently in the process of updating its 2011 Real Property Master Plan.
1.4 Purpose and Need
The purpose of the Proposed Action is to optimize facility management through reducing buildings and structures. As a result of ongoing Army force structure transformations and modernization efforts at Fort Benning (Section 1.2), facility utilization priorities have again changed requiring an up-to-date FRP list to define which facilities are identified for demolition for FY19-23. The Proposed Action is necessary to continue the Installation’s ongoing FRP and support compliance with the US Army TRADOC’s IFRP and more recent Army strategies (DoA, 2016a and b). Implementing the Proposed Action would facilitate the identification/selection, demolition, and disposal of infrastructure considered obsolete/outdated, cost prohibitive to sustain, in excess of Army utilization needs, and in some cases contain potential human health and safety concerns. Other benefits include decreasing fixed facility costs (i.e., utilities and saving energy, reducing risks from structural deterioration, and making idle areas of an installation available for productive reuse. Upon completion of the FY19-23 FRP, Fort Benning will have eliminated more than two million square feet of space and made available millions of dollars in operations and maintenance funds for use in other areas annually.
1.5 Decision to Be Made The Army decision to be made, supported by information contained in this EA, is whether to, and if so, how to implement the FY19-23 FRP at Fort Benning, GA or choose another alternative. The Action Alternatives entail the identification/selection, demolition, and disposal of buildings and other structures. This EA studies two Action Alternatives in detail, as described in Chapter 2, along with the No Action Alternative. The final decision of which Alternative to implement will be documented in either a FNSI, if no significant environmental impacts are expected, or a Notice of Intent (NOI) to prepare an EIS, if significant environmental impacts are expected to occur. A FNSI will identify the Army’s Preferred Alternative and mitigation measures that are essential to the reduction of identified impacts.
1.6 Scope of the EA The National Environmental Policy Act (NEPA) of 1969, as amended, requires federal agencies to consider environmental consequences in the decision-making process. This EA identifies, documents, and evaluates the potential environmental effects of the proposed implementation of the FY19-23 FRP at Fort Benning, GA in accordance with NEPA regulations issued by the President’s CEQ (40 CFR Parts 1500-1508) and the Army’s Environmental Analysis of Army Actions (32 CFR Part 651). These federal regulations establish the content, administrative process, and substantive scope of the environmental analysis to ensure that decision-makers have a proper understanding of the potential environmental consequences of a Proposed Action and reasonable alternative options along with associated mitigation. At its essence, the EA’s analysis is an evaluation (qualitatively) and/or measurement (quantitatively) of the environmental and socioeconomic effects anticipated resulting from the decision to be made. Under NEPA, this analysis of environmental and socioeconomic conditions only addresses those geographic

Infrastructure Footprint Reduction Program June 2018 Environmental Assessment
1-4
locations, or region of influence (ROI), and environmental resources with the potential to be affected by the Proposed Action. Environmental resources and locations beyond the possibility of being affected by the Proposed Action are not analyzed. Consequently, the ROI, which includes all areas and lands with the potential to be affected, may vary between environmental resources. The Army’s NEPA regulation (32 CFR 651) warrants that the environmental analysis presented is proportionate to the nature and scope of the action, the complexity and level of anticipated effects on environmental resources, and the capacity of Army decisions to influence those effects in a productive, meaningful way from the standpoint of environmental quality. This EA analyzes both a) infrastructure previously analyzed within preceding Fort Benning IFRP EAs and/or RECs and b) infrastructure more recently added to the FRP list and not analyzed in previous NEPA documents. Although the EA incorporates, wherein possible, by reference the analysis of the previous Fort Benning IFRP EAs (Section 1.2), time and changing environmental conditions merit that infrastructure previously analyzed, but yet to be demolished, is re-analyzed herein. Furthermore, infrastructure previously analyzed within preceding Fort Benning IFRP EAs but absent from the current FY19-23 FRP list (Appendix A) would require being evaluated on a case-by-case basis prior to demolition to determine if the prior NEPA analysis remains appropriate or if additional NEPA documentation is required. Project footprints, demolition activities, and timeframes for each of the Alternatives have been identified to the fullest extent possible at this time. As mentioned, the FRP is dynamic in nature with infrastructure being added to or removed from the proposed demolition list and ensuing demolition executed on the basis of evolving mission demands, utilization priorities, and available funding. Relocation of personnel, supplies, and/or equipment may include renovations and/or adaptive reuse of existing structures. Details of involving relocation and renovation are uncertain at this time; therefore, those type of future actions will be subject to separate NEPA documentation as required. In the absence of specific information, the EA’s analysis conservatively estimates the environmental effects of the Proposed Action and addresses potential broad-level environmental impacts. This EA serves as a foundation for the NEPA process for each facility identified in the FRP list (Appendix A). Unless unforeseen changes occur to the environmental conditions, pertaining to the buildings and structures described by this EA, a Record of Environmental Consideration could be tiered from this EA to complete the NEPA documentation. If a facility has circumstances not covered by this EA, those circumstance would be handled in accordance with applicable regulations and policy before the facility would be demolished.
1.7 Public Involvement Fort Benning invites public participation in their Federal decision-making through the NEPA process as required by CEQ and Army NEPA Regulations. Consideration of the views and information of all interested persons promotes open communication, provides additional information and public concerns to decision-makers, and enables better decision making. The Notice of Availability (NOA) was posted in the Columbus Ledger-Enquirer, The Journal, and Benning News (online) in accordance with the Army NEPA Regulation. The EA and Draft FNSI

Infrastructure Footprint Reduction Program June 2018 Environmental Assessment
1-5
(Appendix C) were distributed to individuals and organizations on the distribution list in Chapter 8.0 for a 30-day public comment period from June 21 – July 23, 2018. These documents are also available at several local libraries and are posted on the Fort Benning website (http://www.benning.army.mil/Garrison/DPW/EMD/Legal.html).Written comments must be received by July 24, 2018 to ensure consideration prior to reaching any decision.
Written comments should be forwarded to:
Fort Benning Environmental Management Division Attn.: NEPA Program Manager 6650 Meloy Drive Building 6, Room 309 Fort Benning, GA 31905-5122 Electronic comments should be submitted to the NEPA Program Manager: Mr. John Brown ([email protected]).
The CEQ and Army NEPA regulations also require that an EA provides evidence through analysis to determine whether the Proposed Action might have significant adverse effects on the environment. Based on evidence and analyses presented within this EA and with consideration given to public and agency comments, the Army will make a determination as to whether implementation of the Proposed Action or Alternatives would have significant effects on the environment. If it is determined that the Proposed Action or Alternatives would have significant, adverse effects, a NOI to prepare an EIS may be issued. If it is determined that the Proposed Action would not have significant adverse effects, the Army may select an Alternative for implementation.

Infrastructure Footprint Reduction Program June 2018 Environmental Assessment
1-6

Infrastructure Footprint Reduction Program June 2018 Environmental Assessment
2-1
2 DESCRIPTION OF THE PROPOSED ACTION AND ALTERNATIVES
2.1 Introduction This section describes the Proposed Action, the Alternatives Screening Criteria, and proposed Alternatives used in the development of the EA. The No Action Alternative, as required by NEPA (40 CFR 1502.14[d]), is described to provide a benchmark for comparison of the environmental impacts of other alternatives.
2.2 Proposed Action The Proposed Action is to implement the FY19-23 FRP at Fort Benning, GA. Implementation of the FRP could demolish, dispose, and remove from Real Property inventories approximately 150 buildings and structures equaling more than two million square feet. This tentative goal would occur over the next five years at various locations across Fort Benning’s cantonment areas for an estimated cost of $18 million (Figure 2-1). Ancillary structures such as boiler room equipment, storage tanks, foundations, and the piping and infrastructure that serve buildings and structures would also be removed as part of the Proposed Action. The demolition actions would be accomplished primarily by contract and include the demolition and disposal of hazardous and nonhazardous material from the Installation. Relocation of personnel, supplies, and/or equipment may include renovations and/or adaptive reuse of existing structures. Details of relocation and renovation are uncertain at this time, and those types of future actions will be subject to appropriate NEPA documentation as required. The types of facilities that would be demolished vary generally categorized as either maintenance, administrative/operational, training, and other facilities. Funding for the demolition and disposal of buildings and structures identified in this EA is anticipated to be made available over the next five years; FY19 to FY23. Fort Benning will prioritize the order in which the buildings and structures are demolished based on varying factors that may include but are not limited to utilization and occupancy, structural condition, completion of historic building mitigation, hazardous material abatement, etc. Coordination among Fort Benning’s Directorates would occur to curtail any potential nuisances concerning traffic flow and/or road infrastructure. The demolition and removal of buildings and structures identified would return the sites to open space or a more natural green space where possible. Appendix A provides an inventory of facilities affected by this proposal and reflects planning and decision making status as of March 2018. This information is subject to change based on funding and operational requirements.
The Army has traditionally removed buildings and structures from its real property inventory through conventional demolition and landfilling of the disposal debris; with little if any salvageable material reused or recycled. Installations often face diminishing landfill capacities and the landfilling of recyclable building materials represents a costly waste of natural resources. Consequently, deconstruction and the diversion of landfill debris has become an option the Army continues to explore. Deconstruction is the disassembly of building components specifically for re-use, repurposing, recycling, and waste stream reduction. Although it’s the Army’s intent to

Infrastructure Footprint Reduction Program June 2018 Environmental Assessment
2-2
manage waste with the goal of Net Zero waste disposal in landfills, DoD Issuance (DoDI) 4715.23 and the DoD Strategic Sustainability Performance Plan has a goal to divert a minimum of 60 percent of construction and demolition debris from the waste stream (US Army, 2014a). Therefore, the Proposed Action includes the deconstruction and salvage, where possible, rather than focusing only on conventional demolition.
As noted in the USACE’s Engineer Construction Bulletin 2015-19, not every building or structure slated for demolition is suited for deconstruction. This could be due to its disrepair or condition, construction type and materials, the presence of contamination, and/or the efforts to recover the materials may greatly exceed its market or reuse value. Since deconstructed infrastructure seldom yields 100 percent reusable components or recyclable materials, this EA generally assumes for analysis purposes that every building and structure on the FPR list will generate some reusable components, recyclable materials, and also require some disposal of waste. Under the FY19-23 FRP, each individual project’s unique design will determine the extent of potential deconstruction efforts with the goal to divert a minimum of 60 percent of debris from the waste stream. How Fort Benning accomplishes the deconstruction activity may vary but options include:
• Fort Benning contracting the deconstruction work and retaining ownership of the salvaged materials;
• The contractor receiving salvaged materials as in-kind payment in exchange for a reduced contract cost;
• The deconstruction contractor retaining all salvaged material and charged a price based on the revenues to be received from resale of the materials; or
• A nonprofit contractor performing the deconstruction and Fort Benning, in effect, donating the salvaged material to the nonprofit organization.
2.3 Alternatives Screening Criteria Fort Benning developed a screening criteria to measure which alternatives are reasonable for further analysis. Any alternatives that failed to meet the criteria were eliminated from full consideration within this EA. Alternatives proposed must:
• Comply with the Army TRADOC’s IFRP and Army directives instructing optimized facility management through footprint reduction efforts (DoD, 2016a and b);
• Be economically feasible (e.g., facility conversion or extensive renovation and reuse of buildings and structures on the FRP list would be less cost effective than new construction/replacement or use of other facility); and
• Be consistent with Installation master planning and support mission requirements.
2.4 Alternatives Proposed This section describes the three alternatives carried forward for analysis in this EA. Alternatives proposed include the No Action Alternative and two Action Alternatives.

Infrastructure Footprint Reduction Program June 2018 Environmental Assessment
2-3
2.4.1 No Action Alternative
Under the No Action Alternative, Fort Benning would continue to utilize or maintain approximately 150 building and structures considered cost prohibitive to sustain, in excess of Army utilization needs, and in some cases may contain potential human health and safety concerns associated with older and ageing infrastructure (e.g., lead based paints (LBPs), asbestos containing materials (ACMs), and/or structural deterioration). Occupied buildings would continue to incur excessive maintenance costs until new replacement facilities can be afforded to relocate current occupying activities and personnel. Currently utilized and unoccupied or abandoned buildings or structures would be demolished only as new projects requiring their removal are scheduled in the future. Note that the No Action Alternative does not meet the purpose and need for the Proposed Action but provides a baseline for comparison of other alternatives.
2.4.2 Alternative 1: Full Demolition Under Alternative 1, Fort Benning would continue its implementation of the FY19-23 FRP by demolishing all of the structures identified in the FRP’s proposed demolition list (Appendix A). Full demolition would preclude the expenditure of excessive maintenance and adaptive reuse/renovation costs associated with the utilization of older facilities. Personnel and activities currently occupying facilities to be demolished would relocate to available facilities. Demolished buildings and structures would become open space and in most circumstances the area would be available to be utilized in future projects.
2.4.3 Alternative 2: Selective Demolition Alternative 2 is similar to Alternative 1; however, Fort Benning would retain the 17 historic buildings identified on the FRP’s proposed demolition list. The 17 historic structures either are eligible or considered eligible for listing on the National Register of Historic Places per the National Historic Preservation Act; therefore reuse must be considered prior to demolition. Fort Benning would implement the FY19-23 FRP by demolishing approximately 133 buildings and other structures and continue utilizing the historic structures as best as possible. As outlined in Appendix B, a considerable expenditure of funds to utilize and maintain the historic buildings would continue and many of these facilities would need adaptive reuse and other substantial renovations to sustain adequate and safe working conditions as they continue to age.
2.5 Alternatives Considered but Eliminated from Full Study The following alternatives were considered but eliminated from further analysis during the development of this EA since none comply with the US Army TRADOC’s IFRP and Army directives to optimize facility management through footprint reduction efforts nor are considered practicable economically. Other limitations of the alternatives eliminated from full study include their inability to apply to many facilities on the FRP list. For example, renovation, reuse, or conversion would not be applicable to some structures such as remaining concrete foundations and other components of former training equipment.

Infrastructure Footprint Reduction Program June 2018 Environmental Assessment
2-4
2.5.1 Renovation and Reuse of Historic Buildings on the FRP List Renovation and reuse of only historic buildings on the FRP list was not carried forward for analysis as it would not comply with the US Army TRADOC’s IFRP and more recent Army directives instructing optimized facility management through footprint reduction efforts. As well, renovation and reuse of the historic buildings identified in the FRP would entail an immense number of upgrades to meet current facility standards of each building’s present use. Upgrade considerations would include the probable need for new mechanical, electrical, heating, air conditioning, life safety systems and the inclusion of other systems that are needed to support the selected reuse of the facility. When compared to the cost of demolition, renovation is not economically practical. Appendix B provides an economic analysis report containing cost estimates on renovation and reuse for each historic building listed the FRP. Consequently, this was not considered to be a reasonable alternative.
2.5.2 Conversion of Historic Buildings on the FRP List As defined by Army Real Property regulations, Installation facilities are assigned Category Codes based on the functional use (Army Regulation 405-45). The conversion of Army buildings for an alternate use would require a change from an existing facility code to a different facility code that reflects the newly assigned functional use. Prior to the conversion of a facility for an alternate use, the building would require renovation and upgrades to meet the facility standards. As mentioned, renovation/reuse considerations include the probable need for new mechanical, electrical, heating, air conditioning, life safety systems, etc. Only after renovation was completed would the facility be converted to meet its new functional use. Similar to the renovation and reuse of buildings, conversion of a buildings use would not be economically practical and also was not considered to be an alternative that warrants further study. See Appendix B for economic analysis and estimated conversion costs.
2.5.3 Mothballing of Historic Buildings for Future Use The Alternative would include the mothballing or placing in caretaker status the historic buildings listed within the FRP. Mothballing refers to the process and non-operating condition associated with both securing and preserving real property and its features for “de-activation” and potential future renovation and reuse. Renovation and reuse of historic buildings are previously described in Section 2.5.1 and does not include the additional costs of ongoing utility services and maintenance associated with the mothballing period until future reuse decisions are made. Based on the costs of de-activation, utility and maintenance costs, and economic impracticability for indefinite reuse of facilities (Appendix B); this action was not considered a reasonable alternative that warrants further study.
2.5.4 Sale and Relocation of Buildings or Structures Off-Post
An additional Alternative eliminated from further analysis includes the sale of an entire building or structure for its relocation and potential reassembly off-Post. Once common practice among installations, the coordination and time required to sale and transfer whole buildings and structures is often an involved and lengthy process; from market to sale. Other common challenges and delays involve the buyer’s expertise to safely salvage an entire facility and the
Infrastructure Footprint Reduction Program June 2018 Environmental Assessment
2-5
preparation of building components for transportation to avoid obstacles along the transportation routes. Accordingly, deconstruction (described in Section 2.2) provides many of the same benefits as sale and relocation off-Post but with a more streamlined process utilizing the experience and expertise of qualified contractors.

Infrastructure Footprint Reduction Program June 2018 Environmental Assessment
2-6

Infrastructure Footprint Reduction Program June 2018 Environmental Assessment
3-1
3 AFFECTED ENVIRONMENT AND ENVIRONMENTAL CONSEQUENCES
3.1 Introduction Chapter 3 describes the affected environment and the potential environmental consequences as a result of implementing the Proposed Action. The affected environment portrays the current environmental setting at Fort Benning and forms a reference for analyzing and understanding the intensity of potential environmental impacts for each alternative. Environmental consequences are characterized by their duration (i.e., short-term or long-term) and by the nature of their effects as being direct, indirect, and/or cumulative. The CEQ defines direct effects as those that are caused by the Proposed Action and occur at the same time and place; indirect effects are caused later in time or farther removed in distance but still reasonably foreseeable; cumulative effects are incremental impacts of the Alternatives when added to other past, present, and reasonably foreseeable future actions (40 CFR Part 1508.7-8). The affected environment and environmental consequences are described in each section as it applies to valued environmental components (VECs). VECs are fundamental elements of the physical, biological, or economic environment, and include air, water, soil, terrain, vegetation, wildlife, fish, birds and land use that may be affected by a proposed project. Each VEC also has a defined ROI to describe the geographic extent or area that potential impacts could occur as a result of the Proposed Action. Based on the results of the environmental analyses, this EA identifies whether a particular potential effect would be adverse or beneficial and to what extent. The following terms are used throughout this EA as a convention to indicate the relative degree of severity of potential impacts:
• Beneficial. A positive environmental impact. • Adverse. A negative environmental impact. • Negligible. An environmental impact that could occur but the effects would be less than
minor and possibly imperceptible. • Minor. An environmental impact that clearly would not be significant. • Moderate. An environmental impact that is not significant but is readily apparent.
Instances include actions where the potential consequences of the Proposed Action requires additional precautionary measures in following standard procedures to minimize adverse effects.
• Significant. An environmental impact which violates or exceeds regulatory or policy standards or exceeds the identified threshold. A significant impact may; however, be mitigated to less than significant.
A significance threshold is the stated level at which an impact is determined to become significant. Quantitative and qualitative analyses have been used in determining whether a threshold would be exceeded. Significance thresholds are also described for each VEC in the

Infrastructure Footprint Reduction Program June 2018 Environmental Assessment
3-2
discussions regarding environmental consequences. Thresholds have been developed in consideration of CEQ’s guidance for determining significance (40 CFR Part 1508.27).
3.2 VECs Army Environmental Command’s NEPA Analysis Guidance Manual provides information on identifying VECs, which are those environmental resources that are considered to be important by society and potentially at risk from human activities or natural hazards. After consideration of the anticipated impacts associated with the proposed alternatives and information gathered during the EA’s development, the following VECs were selected to be carried forward for detailed analysis in this EA:
• Air Quality • Biological Resources • Cultural Resources • Hazardous Materials and Waste • Land Use • Noise • Soils • Utilities • Water Resources
3.2.1 VECs Not Carried Forward for Analysis In an effort to focus on relevant environmental analysis and issues, the CEQ encourages concentrating on relevant environmental analysis in EA. Similarly, CFR 200-1 §651.14 promotes minimizing unnecessary analysis and discussion of minor issues that have little or no measurable environmental effect. Of the VECs considered, three were dismissed from full analysis as there is no potential for the Proposed Action or Alternatives to have impacts to them. These include Airspace, Socioeconomics and Environmental Justice, and Traffic and Transportation. Airspace
There would be no effects to Airspace under the Proposed Action. Demolition activities would not affect the current Airspace designations and all flights and associated activities would occur on other parts of the Installation. Therefore, no further discussion of Airspace is warranted in this EA.
Socioeconomics and Environmental Justice
The Proposed Action would have limited beneficial effect on the local economy but only short-term during demolition. This includes the potential for additional jobs and subsequent increased local spending by the workforce. None of the Action Alternatives would induce long-term population growth within the Installation or the surrounding communities, nor have an adverse effect on housing. The effects on socioeconomics from this proposed action would be negligible. Therefore, socioeconomics have been eliminated from further discussion in this EA.

Infrastructure Footprint Reduction Program June 2018 Environmental Assessment
3-3
Executive Order (EO) 12898, Federal Actions to Address Environmental Justice in Minority Populations and Low Income Populations, directs each federal agency to “make achieving environmental justice part of its mission by identifying and addressing, as appropriate, disproportionately high and adverse human health or environmental effects of its programs, policies, and activities on minority populations and low income populations.” As the Proposed Action is limited to Fort Benning, there would be no effects to minority or low-income populations. Therefore, there are no effects to environmental justice issues and are not further discussed in this EA. Children may suffer disproportionately, more so than adults, due to physiological and behavioral differences from environmental health risks and safety risks. EO 13045, Protection of Children from Environmental Health Risks and Safety Risks, requires Federal agencies to identify disproportionately high and adverse impacts to children. The intent of EO 13045 was to prioritize the identification and assessment of environmental health and safety risks that may affect children, and to ensure that federal agencies’ policies, programs, activities, and standards address these environmental and safety risks to children. The potential of the Proposed Action to cause environmental and safety risks to children is negligible. All demolition activities areas would be carefully monitored and controlled for only authorized access, (e.g., construction workers, project managers, mitigation monitors, etc.); therefore, no effects to children would occur.
Traffic and Transportation
Only the Main Post Cantonment Area routinely experiences some minor traffic congestion, which is limited to peak traffic periods. No road closures are anticipated as a result of the Proposed Action. Although a slight increase in traffic flow could occur nearby facilities and structures to be demolished as a result of transporting equipment and vehicles, the overall level of Installation-wide traffic would still remain similar to current levels. Demolition design and coordination with Fort Benning’s Directorate of Public Safety would assist in identifying problematic areas and further minimize issues involving traffic flow and/or road infrastructure. Overall, the Proposed Action’s impact on Traffic and Transportation would result only in negligible effects. Therefore, no further discussion regarding the potential effects to traffic and transportation is warranted in this EA.
3.3 Air Quality The quality of air in a given location is generally described by the concentrations of various pollutants in the atmosphere. The Clean Air Act (CAA) (42 USC 7401–7671q), as amended, gives the US Environmental Protection Agency (EPA) the responsibility to establish acceptable Air Quality standards to protect public health and welfare, including the National Ambient Air Quality Standards (NAAQS) that determine acceptable concentration levels for six criteria pollutants. These pollutants include: carbon monoxide (CO), sulfur dioxide (SO₂), particulate matter (PM₁₀ or PM₂․₅), ozone (O₃), nitrogen dioxide (NO₂) and lead (Pb). A region with Air Quality better than the NAAQS is designated as being in attainment; areas with substandard Air Quality are classified as nonattainment areas. A nonattainment designation generally is given to a region if the primary NAAQS for any criteria pollutant are exceeded at any point in the region for more than three days during a three year period.

Infrastructure Footprint Reduction Program June 2018 Environmental Assessment
3-4
3.3.1 Affected Environment The ROI for Air Quality encompasses Fort Benning and the multi-county region including Muscogee, Chattahoochee, Harris, Talbot, and Marion Counties of GA and Russell and Lee Counties of Alabama (AL). The buildings and structures identified with the FY19-23 FRP exist inside the Installation’s cantonment areas as part of the ROI and within the State of GA. The EPA Region 4, the AL Department of Environmental Management, and the GA Department of Natural Resources regulate Air Quality within this airshed and on Fort Benning. This region has been classified by the EPA as an attainment area for all criteria pollutants; therefore, general conformity Air Quality regulations do not apply to federal actions within this region and is not discussed further in this EA.
3.3.1.1 Title V Permit Fort Benning is designated as a major stationary source of air pollutants and operates under a CAA Title V Operating Permit (No. 9711-215-0021-V-03-0). The latest Title V permit was issued in March 2014 and is in effect for five years. The permit includes a list of emission sources, applicable regulations, emissions limits, and monitoring and record-keeping requirements. The permit is modified on a routine basis to account for the addition or removal of stationary and area pollutant sources. Fort Benning currently has 11 boilers firing natural gas or liquefied petroleum gas that are greater than 10 million British thermal units per hour (MMBtu/Hr), and hundreds of smaller boilers or heaters. Three substantial air emission boilers, H008 (36 MMBtu/Hr), H010 (16.8 MMBtu/Hr), and H011 (16.8 MMBtu/Hr), and two 1035 kilowatt diesel generators are associated with the former Martin Army Hospital (Buildings 9200 and 9202), which is on the FRP’s proposed demolition list. Also, 19 boilers, each less than five MMBtu/Hr, five generators, and an estimated 36 refrigerant (difluoromonochloromethane or R-22) containing units accompany other buildings proposed for demolition. Since the Proposed Action does not involve the construction of new facilities or addition of new generators or boilers, no new emission sources would be added to the Title V Operating Permit.
3.3.1.2 Fugitive Dust Fugitive dust refers to particulate matter suspended in the air from any source other than a stack, vent, or chimney. Common sources capable of generating fugitive dust include earth-moving activities, construction/demolition activities, disturbed surface areas, and vehicular movement. The State of GA requires compliance with its Fugitive Dust Rule (Rule 391-3-1-.02[n]), which stipulates the use of reasonable precautions (e.g., application of water, paving roads, covering truck beds transporting dusty materials, etc.) to prevent fugitive dust from becoming airborne and that fugitive dust opacity remain below 20 percent.
3.3.1.3 Prescribed Fire Fort Benning also generates emissions from prescribed fire activities as part of its ongoing ecosystem management program, as the area is historically a fire-based ecosystem. Prescribed burning is the largest single source of criteria pollutant emissions on the Installation (US Army,

Infrastructure Footprint Reduction Program June 2018 Environmental Assessment
3-5
2013). It is also a critical management tool for fire-dependent natural communities, Red-cockaded Woodpecker (RCW) habitat, and training area management. The GA and AL Forestry Commissions administer each state’s Smoke Management Plan, which details the basic framework of procedures and requirements for managing smoke from prescribed fires. The goal of each Smoke Management Plan is to minimize the public health and environmental impacts of smoke intrusion into populated areas from fires, avoid significant deterioration of Air Quality and potential CAA violations, and avoid visibility impacts in Class I prevention of significant deterioration (PSD) areas (US Army, 2013). The closest PSD Class I areas are the Sipsey Wilderness Area, AL, as well as Cohotta, Wolf Island, and Okefenokee Wilderness Areas, GA. All of these Class I areas are located more than 200 miles away, and unlikely to be affected by emissions generated at Fort Benning. Therefore, PSD is not further considered in this EA.
3.3.1.4 Greenhouse Gases Routine societal and developmental activities such as fuel combustion, deforestation, and other changes in land use, have the potential to result in the accumulation of trace greenhouse gases (GHGs), in the atmosphere. GHGs include water vapor, CO₂, methane, nitrous oxide, O₃, and several hydrocarbons and chlorofluorocarbons. An increase in GHG emissions is said to result in an increase in the earth’s average surface temperature, which is commonly referred to as global warming. Global warming is expected, in turn, to affect weather patterns, the average sea level, ocean acidification, chemical reaction rates, and precipitation rates, all of which is commonly referred to as climate change. Each GHG has an estimated global warming potential, which is a function of its atmospheric lifetime and its ability to absorb and radiate infrared energy emitted from the earth’s surface. A gas’s global warming potential provides a relative basis for calculating its carbon dioxide equivalent (CO₂e), which is a metric measure used to compare the emissions from various GHGs based on their global warming potential. CO₂ has a global warming potential of 1 and is therefore the standard to which all other GHGs are measured. Water vapor is a naturally occurring GHG and accounts for the largest percentage of the greenhouse effect. Next to water vapor, CO₂ is the second-most abundant GHG. Uncontrolled CO₂ emissions from power plants, heating sources, and mobile sources are a function of the power rating of each source, the feedstock (fuel) consumed, and the source’s net efficiency at converting the energy in the feedstock into other useful forms of energy (e.g., electricity, heat, etc.). Because CO₂ and the other GHGs are relatively stable and essentially uniformly mixed throughout atmosphere, the climatic impact of these emissions does not depend on the source location on the earth (i.e., regional climatic impacts/changes will be a function of global emissions). Overall, federal agencies address emissions of GHGs by reporting and meeting reductions mandated in laws, EOs, and policies. The more recent include EO 13514, Federal Leadership in Environmental, Energy, and Economic Performance, of October 2009 and EO 13423, Strengthening Federal Environmental, Energy, and Transportation Management, January 2007,

Infrastructure Footprint Reduction Program June 2018 Environmental Assessment
3-6
which introduced GHG emissions management and improvements that address waste reduction and efficiency for the federal government. These executive orders were revoked in March 2015 with the publication of EO 13693, Planning for Federal Sustainability in the Next Decade, which retained the goal to maintain federal leadership in sustainability and GHG emissions. EO 13783 of March 2017, Promoting Energy Independence and Economic Growth ordered the rescission of the August 2016 CEQ directive; Guidance for Federal Departments and Agencies on Consideration of Greenhouse Gas Emissions and the Effects of Climate Change in National Environmental Policy Act Reviews. As a result, the requirement for analyzing the effects of GHGs resulting from a proposed action was eliminated. Nevertheless, EO 13783 did not remove the requirement for assessing a proposed action’s potential impact to Air Quality; which includes GHGs as required under NEPA. Therefore, the effects of climate change are to be included and addressed to; furthermore, document an informed decision-making process was followed. GHG emission sources at Fort Benning include vehicle use, boilers, chillers, water heaters, and emergency generators. The Proposed Action would reduce GHG emissions through demolition of older inefficient facilities and associated emission emitting infrastructure. Since there would not be an increase of GHG, this will not be evaluated further in this EA.
3.3.2 Environmental Consequences Impacts to Air Quality would be considered significant if emission would increase ambient air pollution concentrations above the NAAQS.
3.3.2.1 No Action Alternative Under the No Action Alternative, demolition and disposal of buildings and other facilities on the FRP list and as directed by the Army would not occur. There would be no reduction in facilities deemed inefficient and cost prohibitive to sustain, and no reduction in stationary emission sources identified within Fort Benning's CAA Title V Operating Permit. Existing emission levels would remain unchanged and the No Action Alternative would have a long term, minor impact on Air Quality.
3.3.2.2 Alternative 1: Full Demolition The Proposed Action would result in increases in air emissions during demolition activities from work and vehicles onsite. All applicable federal and state Air Quality protection requirements would be implemented to mitigate any generation of fugitive dust due to minor earth disturbances. An increase in emissions and fugitive dust during demolition would be short-term, and would not result in an increase of criteria pollutants at Fort Benning or its surrounding area in the long-term. Fort Benning would reassess the estimated annual emissions from all stationary sources (e.g., boilers, heating, ventilation, and air conditioning [HVAC], etc.), in the Installation’s Title V permit following the demolition and disposal of each building and structure. As applicable, stationary source emissions estimated for each demolished facility would be removed from the

Infrastructure Footprint Reduction Program June 2018 Environmental Assessment
3-7
Title V permit and contribute to long-term beneficial effects to the existing emissions levels and the local and regional Air Quality. Upon completion of this Alternative, three substantial boilers (greater than 10 MMBtu/Hr) and 19 lesser boilers (less than five MMBtu/Hr), along with two 1035 kilowatt diesel generators, five generators of varying size, and 36 refrigerant (difluoromonochloromethane or R-22) containing units captured under the Title VI of the Clean Air Act would be removed.. During demolition activities, potential effects under Alternative 1 to Air Quality may include short-term, minor adverse impacts due to an increase in air emissions and fugitive dust. Also, long-term, beneficial impacts are anticipated for Air Quality resulting from a reduction of stationary source emissions and to the Installation’s Title V Permit.
3.3.2.3 Alternative 2: Selective Demolition Under Alternative 2, the Proposed Action would demolish 17 fewer buildings than Alternative 1. These historic buildings would be retained and adapted as necessary for use. Short-term, minor adverse impacts resulting from an increase in air emissions could occur onsite during demolition activities, but no increase of criteria pollutants at Fort Benning or its surrounding area are expected as a result of following federal and state Air Quality protection requirements. Stationary emission sources supporting each demolished facility would also be demolished and removed from the Title V Permit. Alternative 2 would result in a reduction to units captured under Title IV of the CAA by removing the same boilers, generators and refrigerant containing units as in Alternative 1. Overall, long-term beneficial impacts are also anticipated for Air Quality as a result of Alternative 2; although less advantageous than Alternative 1.
3.3.3 Mitigation No mitigation measures other than following applicable laws and regulations are warranted for Air Quality.
3.4 Biological Resources Biological Resources include native or naturalized plants and animals and the habitats in which they occur. The dominant plant species make up plant communities, which in turn define the vegetation of an area. Habitat is known as the area or environment where resources and conditions are present that allow a plant or animal to survive.
3.4.1 Affected Environment The ROI for Biological Resources is the area contained within the boundaries of Fort Benning. Fort Benning manages and conserves its Biological Resources through its Integrated Natural Resources Management Plan (INRMP). All proposed actions on the Installation are considered for their potential effects through the NEPA process, and in accordance with various EOs, US Fish and Wildlife Service (USFWS) Biological Opinions, Memorandums of Understanding, and State and Federal Endangered Species Acts. Biological Resources discussed in this EA include Vegetation, Fish and Wildlife, Migratory Birds, and Threatened and Endangered Species, which

Infrastructure Footprint Reduction Program June 2018 Environmental Assessment
3-8
could potentially be affected by demolition, disposal, or operational activities associated with the Alternatives.
3.4.1.1 Vegetation According to Fort Benning’s INRMP, there are more than 1,275 species of plants on Fort Benning located within approximately 29,000 acres of unforested areas and 150,000 acres of woodland. Loblolly and longleaf pine are the predominant conifers within the Installation, comprising approximately 80,000 acres of the woodland; the remaining 70,000 acres of woodland consist of approximately 15,000 acres of forested restricted access areas and 55,000 acres of hardwood forest (Fort Benning, 2015). Fort Benning is located within the Longleaf Pine Ecosystem with vegetative cover distributed along two broadly defined ecological units or subsections; the Sand Hills and Upper Loam Hills. The northern portion of the Installation is part of the Sand Hills subsection characterized by well-drained soils and Longleaf pines (Pinus palustris). The Upper Loam Hills cover most of the southwestern area of Fort Benning and is characterized by heavier soils containing higher amounts of organic matter and increased water holding capacities. Natural vegetation is characterized as an Oak-hickory forest (e.g., Post Oak [Quercus stellate], White Oak [Quercus alba], Pignut Hickory [Carya glabra], Mockernut Hickory [Carya tomentosa]) (Fort Benning, 2015). The undeveloped areas of Fort Benning generally consists of hardwood and pine trees, and are heavily wooded. The more developed cantonment areas consists primarily of hardwood tree species, decorative shrubs around buildings, and open grassed areas for green space and training facilities. The cantonment areas contain mature sycamore, oak, and other tree species lining many of the Installation’s main streets and historic districts. The developed areas generally do not provide good habitat for wildlife. Development and human activity have forced native animal populations to less disturbed and less active areas of the Installation, such as training areas.
3.4.1.2 Wildlife Fort Benning is inhabited by more than 350 species of fish and wildlife, including 154 species of birds, 47 species of mammals, 48 species of reptiles, 25 species of amphibians, 67 species of fish, and nine species of mussels, as well as numerous insect and other invertebrate species (Fort Benning, 2015). Commonly encountered animals include American alligators, turtles, water snakes, wading birds, migratory waterfowl, American beaver, white-tailed deer (Odocoileus virginiana), feral swine (Sus scrofa), eastern wild turkey (Meleagris gallopavo), eastern gray squirrel (Sciurus carolinensis), raccoon (Procyon lotor), rabbits (Sylvilagus spp.), other small mammals, and a wide variety of songbirds. Reptiles and amphibians found on the Installation includes eastern coachwhip (Masticophis flagellum flagellum), eastern diamondback rattlesnake (Crotalus adamanteus) Florida pinesnake (Pituophis melanoleucus mugitus), southern hognose snake (Heterodon simus), eastern tiger salamander (Ambystoma tigrinum), and other species of the Longleaf Pine Ecosystem (Fort Benning, 2015).
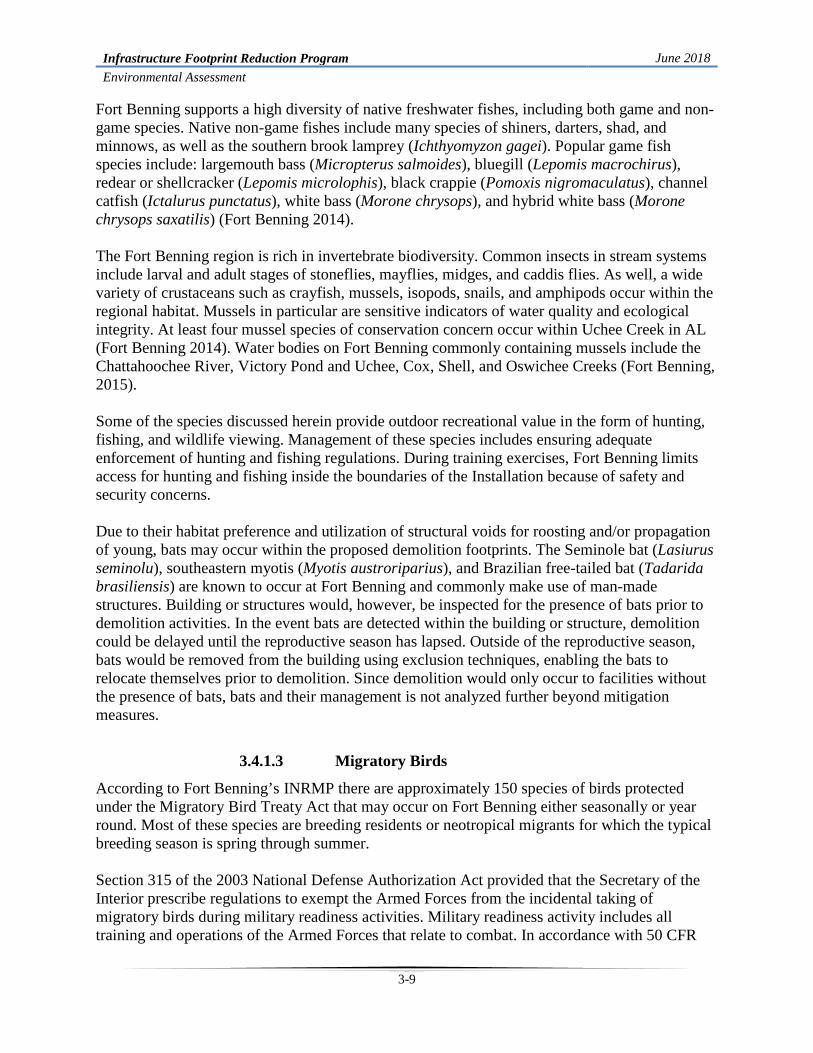
Infrastructure Footprint Reduction Program June 2018 Environmental Assessment
3-9
Fort Benning supports a high diversity of native freshwater fishes, including both game and non-game species. Native non-game fishes include many species of shiners, darters, shad, and minnows, as well as the southern brook lamprey (Ichthyomyzon gagei). Popular game fish species include: largemouth bass (Micropterus salmoides), bluegill (Lepomis macrochirus), redear or shellcracker (Lepomis microlophis), black crappie (Pomoxis nigromaculatus), channel catfish (Ictalurus punctatus), white bass (Morone chrysops), and hybrid white bass (Morone chrysops saxatilis) (Fort Benning 2014). The Fort Benning region is rich in invertebrate biodiversity. Common insects in stream systems include larval and adult stages of stoneflies, mayflies, midges, and caddis flies. As well, a wide variety of crustaceans such as crayfish, mussels, isopods, snails, and amphipods occur within the regional habitat. Mussels in particular are sensitive indicators of water quality and ecological integrity. At least four mussel species of conservation concern occur within Uchee Creek in AL (Fort Benning 2014). Water bodies on Fort Benning commonly containing mussels include the Chattahoochee River, Victory Pond and Uchee, Cox, Shell, and Oswichee Creeks (Fort Benning, 2015). Some of the species discussed herein provide outdoor recreational value in the form of hunting, fishing, and wildlife viewing. Management of these species includes ensuring adequate enforcement of hunting and fishing regulations. During training exercises, Fort Benning limits access for hunting and fishing inside the boundaries of the Installation because of safety and security concerns. Due to their habitat preference and utilization of structural voids for roosting and/or propagation of young, bats may occur within the proposed demolition footprints. The Seminole bat (Lasiurus seminolu), southeastern myotis (Myotis austroriparius), and Brazilian free-tailed bat (Tadarida brasiliensis) are known to occur at Fort Benning and commonly make use of man-made structures. Building or structures would, however, be inspected for the presence of bats prior to demolition activities. In the event bats are detected within the building or structure, demolition could be delayed until the reproductive season has lapsed. Outside of the reproductive season, bats would be removed from the building using exclusion techniques, enabling the bats to relocate themselves prior to demolition. Since demolition would only occur to facilities without the presence of bats, bats and their management is not analyzed further beyond mitigation measures.
3.4.1.3 Migratory Birds According to Fort Benning’s INRMP there are approximately 150 species of birds protected under the Migratory Bird Treaty Act that may occur on Fort Benning either seasonally or year round. Most of these species are breeding residents or neotropical migrants for which the typical breeding season is spring through summer. Section 315 of the 2003 National Defense Authorization Act provided that the Secretary of the Interior prescribe regulations to exempt the Armed Forces from the incidental taking of migratory birds during military readiness activities. Military readiness activity includes all training and operations of the Armed Forces that relate to combat. In accordance with 50 CFR

Infrastructure Footprint Reduction Program June 2018 Environmental Assessment
3-10
21.15 (Authorization Of Take Incidental To Military Readiness Activities), the regulation does not allow an installation to take migratory birds indiscriminately during readiness activities but requires that installations consider the protection of migratory birds when planning and executing military readiness activities. In addition, Fort Benning manages and conserves migratory bird species through its INRMP and considers effects to migratory birds in any proposed action via the NEPA process. The Migratory Bird Treaty Act grants the Secretary of the Interior the authority to establish hunting seasons for species the USFWS has determined that hunting is appropriate; species for which there is a long tradition of hunting; and species for which hunting is consistent with their population status and long-term conservation. Two species of resident game birds at Fort Benning include the northern bobwhite quail (Colinus virginianus) and eastern wild turkey. Nineteen species of migratory game birds (at least 16 of which are waterfowl) include the mourning dove, common snipe (Gallinago gallinago), American woodcock (Scolopax minor), Canada goose (Branta canadensis), mallard duck (Anas platyrhynchos), wood duck (Aix sponsa), ring-necked duck (Aythya collaris), gadwall (Anas strepaera), American wigeon (Anas americana), northern pintail (Anas acuta), American black duck (Anas rubripes), green-winged teal (Anas crecca), blue-winged teal (Anas discors), canvasback (Aythya valisineria), redhead (Aythya americana), bufflehead (Bucephala albeola), hooded merganser (Lophodytes cucullatus), northern shoveler (Anas clypeata), and lesser scaup (Aythya affinins) (Fort Benning, 2015).
3.4.1.4 Invasive Species In 1999, EO 13112 began requiring federal agencies to prevent the introduction of invasive species; to provide for their control; and to minimize the economic, ecological, and human health impacts that invasive species cause. Common invasive plant species identified on Fort Benning include the tree species of Chinese Tallowtree (Triadica sebifera) and Mimosa (Albizia julibrissin), and shrubs such as Chinese Privet (Ligustrum sinense) and Multiflora Rose (Rosa multiflora). Invasive vine species include Kudzu (Pueraria montana var. lobata) and English Ivy (Hedera helix). Invasive grasses include Cogongrass (Imperata cylindrical) and Japanese Knotweed (Fallopia japonica) (Fort Benning, 2015). All are extremely aggressive invaders with the capability of forming dense assemblages and/or extensive root systems that displaces native vegetation. Fort Benning utilizes an integrated pest management approach to control invasive plant species. Integrated pest management involves using targeted, sustainable control methods that can include a variety of measures, such as habitat modification, biological control, mechanical control, physical control and the judicious use of pesticides. Specific procedures related to the control of invasive plant species are outlined in Fort Benning’s Integrated Pest Management Plan (Fort Benning, 2013). The Proposed Action would occur within areas routinely maintained (e.g., mowed, sodded/seeded, weeded, pruned, etc.). The means used for the maintenance of the cantonment areas are largely effective in managing invasive species as well. Accordingly, invasive plants will not be discussed further in this EA.

Infrastructure Footprint Reduction Program June 2018 Environmental Assessment
3-11
Feral swine are widespread across the Installation and considered a pest species for many reasons. The primary concern is the extensive damage to vegetation and soil surfaces that occurs due to their characteristic “rooting” habits, which jeopardizes the establishment of ground cover and native vegetation. Other impacts of feral swine include direct mortality of pine and hardwood trees, competition with native wildlife species, habitat disturbance, and direct mortality of threatened and endangered species. Additionally, feral swine can also uproot and damage cables, wiring, targetry, bivouac sites, and other military assets. Fort Benning’s management of this species focuses on controlling the population by establishing liberal hunting regulations such as no bag limits and expanded season lengths. In addition, trapping is conducted at specific locations to minimize damage to military assets and sensitive plants (USACE, 2009). Specific procedures related to the control of feral swine are outlined in Fort Benning’s Integrated Pest Management Plan (Fort Benning, 2013). The presence of urban areas, communities, and control methods for feral swine are effective in maintaining and managing populations within Fort Benning’s cantonment areas. The Proposed Action and Alternatives would only occur in developed areas and would not have an effect on feral swine. Therefore, feral swine will not be discussed further in this EA.
3.4.1.5 Endangered, Threatened, and Rare Species As described in the INRMP, there are 96 species (four amphibians, eight birds, seven fishes, four mammals, four mussels, nine reptiles, and 60 plants) of conservation concern found on Fort Benning. Plant and animal species listed as threatened, endangered, or proposed as such by the USFWS, the State of GA or the State of AL are recognized as special-status species. The Endangered Species Act (ESA) only protects federally listed species. State listed species are protected in the State of GA by the GA Wildflower Preservation Act or GA’s Endangered Wildlife Act. The State of AL likewise protects a number of species through the Nongame Species Regulation (AL Administrative Code 220-2-.92). Although state listed species are not protected by the ESA, they may be considered for federal listing in the future and may be afforded special management attention by Fort Benning. Army Regulation (AR) 200-1 (Environmental Protection and Enhancement) guides Army compliance with the ESA. The regulation requires ESMCs for listed and proposed species and critical habitat, a 100 percent inventory of suitable habitat for listed and proposed species that may occur on the Installation, and an initial thorough inventory of plants, fish, wildlife, and habitats on the Installation lands. Five federally listed or candidate species occur on Fort Benning. These are the Red-cockaded Woodpecker (Picoides borealis) (Endangered), American Alligator (Alligator mississippiensis) (Threatened for similarity in appearance), Wood Stork (Mycterian Americana) (Endangered), Relict Trillium (Trillium reliquum) (Endangered), Georgia Rockcress (Arabis Georgiana) (Candidate), and Gopher Tortoise (Gopherus polyphemus) (Candidate). Accordingly, the Bald Eagle (Haliaeetus leucocephalus) has been delisted but remains protected under the Bald and Golden Eagle Protection Act (Fort Benning, 2014).

Infrastructure Footprint Reduction Program June 2018 Environmental Assessment
3-12
3.4.1.6 Unique Ecological Areas (UEAs) Fort Benning has identified several areas that have unique or rare ecological characteristics or that represent the best example of a particular habitat or plant community type. UEAs were chosen based on characteristics of their soil type, topography, slope, aspect, elevation, hydrology, flora, fauna, and other biotic and abiotic features. Many areas apparently contain remnant native plant communities that have experienced minimal disturbance relative to other similar communities. To conserve the ecological integrity of these areas, Fort Benning will use their designation as UEAs to ensure that current and future land-use planning and training activities take into consideration their presence and their preservation. The Proposed Action and Alternatives would not occur within or have any effects on UEAs. Therefore, UEAs are not discussed further in this EA.
3.4.1.7 Habitat Conservation and Enhancement The Sikes Act authorizes the Department of Defense (DoD) to partner with non-federal governments or private organizations to establish buffers around military installations. The Army implements this authority through the Army Compatible Use Buffer (ACUB) program, which provides funding for the Army to work with state and local governments, non-governmental organizations, and willing land owners to help prevent encroachment of training areas and promote regional conservation efforts. Through Fort Benning’s partnership with The Nature Conservancy, off-Post conservation measures both buffer the Installation boundary from land uses incompatible with military training and promotes land management to protect and restore habitat for listed, imperiled, or at-risk species that impact Fort Benning’s mission. Properties enlisted under the ACUB program are either placed into conservation easements or purchased fee simple later those properties may be sold to conservation buyers and encumbered with permanent conservation easements. ACUB lands are not federally owned; the Army holds only a contingency right to ensure that training buffer and conservation purposes are met. As of 2018, the ACUB program at Fort Benning encompasses over 20,000 acres around Fort Benning with a goal of protecting up to 40,000 acres by 2020 (Fort Benning, 2015). The Proposed Action would not occur within or have any effects on Fort Benning’s ACUB Plan. Therefore, these areas are not discussed further in this EA.
3.4.2 Environmental Consequences Impacts would be considered significant if one of more of the following conditions would result:
• Substantial loss or degradation of habitat or ecosystem functions (natural features and processes) essential to the persistence of native plant and animal populations;
• Substantial loss or degradation of a sensitive habitat, including surface waters and UEAs that support high concentrations of special status species or migratory birds;
• Disruption of a federally listed species, its normal behavior patterns, or its habitat that substantially impedes the Installation’s ability to either avoid jeopardy or conserve and recover the species; or
• Substantial loss of population or habitat for a state-protected species increasing the likelihood of federal listing action to protect the species in the future.

Infrastructure Footprint Reduction Program June 2018 Environmental Assessment
3-13
3.4.2.1 No Action Alternative
Under this alternative, no demolition and disposal of facilities and structures would occur. As well, no impacts to Biological Resources would be expected as a result of the No Action Alternative.
3.4.2.2 Alternative 1: Full Demolition The Proposed Action has the potential to affect terrestrial wildlife through nominal displacement as a result of soil disturbance, removal of vegetation and possible habitat, vehicle traffic, and incidental human activity. Demolition activities would; however, be limited to individual project areas and adhere to applicable federal and state laws, regulations, and permit requirements. Following demolition, areas previously occupied by facilities and structures would be returned to open/green spaces. No adverse effects to any federal or state-listed species, their habitat, or migratory birds are expected. Although vegetation removal is anticipated from demolition activity, these disturbances would occur within the project areas and be temporary resulting in negligible effects. Construction/demolition activities are the norm within and around cantonment areas. Demolition under the IFRP would occur over the next five year and would not occur within a concerted area. Demolition would be dispersed among developed cantonment areas, which generally do not contain exceptional habitat for most wildlife. Overall, GA National Pollutant Discharge Elimination System (NPDES) and Air Quality Rules for construction would preclude potential adverse effects to Biological Resources. Therefore, impacts to Biological Resources as a result of this Alternative are anticipated to be negligible.
3.4.2.3 Alternative 2: Selective Demolition Alternative 2 would retain the 17 historic buildings identified on the FRP’s proposed demolition list (Appendix A). Potential adverse impacts to Biological Resources resulting from the implementation of Alternative 2 would be the same as those described under Alternative 1. Therefore, impacts to Biological Resources as a result of this Alternative are anticipated to be negligible.
3.4.3 Mitigation Mitigation measures for Biological Resources would include compliance with Federal and State erosion control measures and NPDES permitting requirements as further discussed in Section 3.8 (Soils). Additional mitigation would include inspecting buildings or structures for bats, as applicable, and excluded them prior to demolition activities. Other sound project practices to incorporate where possible include:
• Limiting disturbed areas through design as feasible; • Site rehabilitation through the planting of native trees and sowing of other vegetation to
more quickly establish green spaces, especially around storm water management structures;
• Employing tree protection devices at the sites of demolition.

Infrastructure Footprint Reduction Program June 2018 Environmental Assessment
3-14
3.5 Cultural Resources Cultural Resources include archaeological sites, buildings, structures, objects, historic landscapes and districts, sacred sites, and properties of traditional religious and cultural importance. A historic property, as defined on the National Historic Preservation Act of 1966 (NHPA), is a Cultural Resource that is included or eligible for inclusion in the National Register of Historic Places (NRHP). Under Section 106 of the NHPA and its implementing regulations in Protection of Historic and Cultural Properties (36 CFR Part 800), federal agencies must take into account the effects of their undertakings on historic properties. These regulations require that federal agencies consult with the State Historic Preservation Office (SHPO) on their undertakings and that they afford the Advisory Council on Historic Preservation the opportunity to comment on their undertakings. Section 110 of the NHPA further requires federal agencies to assume responsibility for the identification and preservation of historic properties on land owned or controlled by the agency. Consultation with federally recognized Native American Tribes is required. Other laws and regulations also apply to Cultural Resources, such as the Native American Graves and Protection and Repatriation Act and the Archaeological Resource Protection Act.
3.5.1 Affected Environment The ROI for Cultural Resources is the area within the Installation’s boundary. Fort Benning’s Cultural Resources include: archaeological sites, buildings, historic districts, and Native American resources.
3.5.1.1 History The earliest settlers of the area were the Paleoindians who arrived between 14,000 and 11,500 years ago. By the 1790s, settlement by European and African descent began. For almost 80 years the area was intensively farmed under plantations and farmsteads until 1918 when Camp Benning was purchased for the establishment of a temporary 50-acre tent encampment. Camp Benning was selected as the new home for the US Army Infantry School of Arms; later renamed the US Army Infantry School. On 9 January 1922, Congress issued War Department General Order Number 1, authorizing the retention of Camp Benning as a permanent military post, and re-designating it as Fort Benning. Construction of Family housing, Soldiers’ quarters, a hospital, athletic fields, and mess facilities occurred during the 1920s. By 1930, aviation activities had begun at Fort Benning and the Works Project Administration programs, created during the Great Depression, provided the impetus for construction of the first runways and hangars at Lawson Army Airfield, the first airstrip at Fort Benning. The 1940s witnessed significant changes to Fort Benning as a result of World War II, the birth of the airborne infantry concept, and establishment of the Parachute School in 1942. As well, mobilization facilities were constructed over much of Fort Benning including two new cantonment areas known as Sand Hill and Harmony Church. Kelley Hill was added in the 1950s along with the establishment of several new units. The escalation of the Vietnam Conflict transformed the US Army Infantry School’s focus towards combined-arms training. The cessation of the military’s involvement in Vietnam was

Infrastructure Footprint Reduction Program June 2018 Environmental Assessment
3-15
followed by the re-direction of the American military to an all-volunteer army. At Kelley Hill, the Modern Volunteer Army Program was initiated in 1973 with the 197th Infantry Brigade becoming the Army’s first all-volunteer unit and first combined-arms team under the Strategic Army Forces concept. This was soon followed by the Army’s announcement of Advanced Individual Training for infantry personnel, the addition of a major training complex on Sand Hill, and modernization of on-Post living facilities. In 2005, Fort Benning was selected by the Base Realignment and Closure Commission (BRAC) to be the home of the new MCoE. The realignment consisted of a billions in renovation and construction to unify the Infantry School and Armor School, formerly located at Fort Knox, Kentucky, at a single location. This transformation was completed September 2011. Today, Fort Benning continues to train all Infantry, Armor, and Scout Soldiers in basic and advanced combat maneuver skills and remains a critical training venue that plays a pivotal role in supporting the Army’s evolving mission.
3.5.1.2 Resource Management and Consultation Management of Cultural Resources on Fort Benning is accomplished through the Installation’s Integrated Cultural Resources Management Plan (ICRMP). Additionally, Fort Benning has adopted the Army Alternate Procedures (AAP) for implementing Section 106 NHPA consultation to improve efficiency in the Installation’s Cultural Resources management. The Historic Properties Component (HPC) of the ICRMP: 1) provides Standard Operating Procedures (SOPs) for assessing the Proposed Action and the potential effects on the Installation’s historic properties; 2) replaces the NHPA Section 106 procedures (Fort Benning, 2015); and 3) uses NEPA documentation to satisfy most consultation requirements with the Tribes and State Historical Preservation Offices. Thirteen federally recognized Tribes are affiliated with the Fort Benning area. Consultations with the Tribes also follow AAP for compliance with Section 106 of the NHPA, and the consultation procedures prescribed within the HPC of the ICRMP. Under these procedures, Fort Benning holds consultation meetings with the federally recognized Tribes on a biannual, face-to-face basis; provides Tribes with copies of relevant documentation concerning existing and proposed actions (e.g., this EA); and solicits Tribal input into the Garrison Commander of Fort Benning's decision making. As part of an on-going process and dialogue, concerns expressed by the Tribes will be incorporated into the Federal decision-making process. In the event mitigation is required as a result of an action, consultation with the appropriate SHPO and Tribes (i.e., stakeholders), as needed, will be conducted through the process required by NEPA. At this stage, all stakeholders can formally submit comments, and Fort Benning must take into account such comments prior to deciding how to proceed. It should be noted that Memoranda of Agreement between Fort Benning and other stakeholders are no longer used to document consultation and mitigation, instead NEPA documentation and the HPC process is used. Thus, a time-consuming effort normally found under NHPA regulations (36 CFR 800) has been streamlined, while appropriate coordination with stakeholders occurs. Only NHPA Section 106 is covered by the AAP. Other legal requirements such as the NAGPRA, Archaeological Resources Protection Act, NHPA Section 110, and other mandates are unaffected by the AAP.

Infrastructure Footprint Reduction Program June 2018 Environmental Assessment
3-16
Fort Benning’s ICRMP will address compliance with these requirements. Informal contacts between Installation Cultural Resource Managers, SHPO staff, and Tribal representatives are maintained to ensure appropriate alternatives are explored and considered early in the process to achieve the highest level of historic preservation commensurate with mission requirements.
3.5.1.3 Site-specific Resources The impact analysis for Cultural Resources focuses on the properties that are listed on or considered eligible for the NRHP, and properties that are considered to be contributing resources to a historic district. Under the NHPA, only Cultural Resources included in or eligible for inclusion on the NRHP, defined as ‘historic properties’, warrant consideration with regard to adverse impacts from a Proposed Action. Historic properties generally must be more than 50 years old to be considered for protection under the NHPA. To be considered eligible for the NRHP, Cultural Resources must meet one or more criteria as defined in 36 CFR 60.4. These criteria include association with an important event, association with a famous person, embodiment of the characteristics of an important period in history, or the ability to contribute to scientific research. Historic properties may be buildings, structures, historic districts, sites, or objects. Fort Benning has two primary NRHP-eligible historic districts: Main Post and Lawson Army Airfield. These districts include more than 575 historic properties that are contributing to the districts, of which 15 buildings are individually eligible for listing. Riverside (Quarters 1) has been individually listed in the NRHP. Open spaces are a significant part of the Main Post Historic District and historically have set Fort Benning apart from other installations of this age and type. Of approximately 150 building and structures identified for demolition on the FRP list, 17 are considered historic buildings (Figure 3-1). All but four of the historic buildings exist within the Main Post Historic District. Buildings 328 and 330 are located nearby the Main Post Historic District. Building 328 is considered independently eligible and Building 330 is a contributor to the Main Post Historic District’s viewshed. Additionally, Building 319 is located within the Lawson Army Airfield District. Only Building 3716, located within the Sand Hill Cantonment Area, is not contained by or neighboring a historic district. Since 2003, all of Fort Benning has been inventoried for archaeological Cultural Resources per section 110 of the National Historic Preservation Act (NHPA), with the exception of permanent dud areas (15,591 acres), inundated areas (683 acres) and areas where survey could not be completed due to live fire training schedules (2,469 acres). As a result of these surveys, 3,555 archaeological sites and 68 historic cemeteries have been recorded. 214 of these sites have been determined eligible for the National Register of Historic Places (NRHP) including Yuchi Town (1RU63) which is also designated as a National Historic Landmark. The NRHP eligibility status of 534 sites could not be determined at the Phase I survey level and will require Phase II testing as funding allows, or as required for an undertaking per section 106 of the NHPA. The remaining 2807 sites have been determined "not eligible" for inclusion in the NRHP. An additional 359 isolated artifact finds were previously given state site numbers, but do not qualify as archaeological sites under current standards (Ecks, M. personal communication, 2018).

Infrastructure Footprint Reduction Program June 2018 Environmental Assessment
3-17
There are no known archaeological sites or cemeteries located within or adjoining facilities or structures identified for demolition, and no Tribe has identified a property of traditional religious or cultural importance on Fort Benning managed lands. As there will be no effects to archaeological sites, cemeteries, or Tribal religious or Cultural Resources as a result of the Proposed Action or Alternatives. Therefore, these topics are not discussed further in this EA.
3.5.2 Environmental Consequences Impacts to Cultural Resources would be considered significant if they meet one or more of the following criteria:
• The activity would cause irretrievable or irreversible damage to historic property and measures mitigating the adverse effect of the resource are not available and cannot be implemented;
• The activity would restrict access to a cultural resource of significance to the Tribes associated with the Fort Benning area without resolution through consultation.
Direct effects generally involve physical damage or destruction to all or part of a resource through ground-disturbing activities or deterioration or destruction of a resource brought about through neglect. Indirect effects generally result from alterations to the characteristics of the surrounding environment or setting that contribute to a resource’s significance, and increased use of or access to an area containing historic properties.
3.5.2.1 No Action Alternative Under the No Action Alternative, demolition and disposal of buildings and other structures on the FRP list as directed by the US Army would not occur. To avoid noncompliance with the NHPA and demolition by neglect, historic structures would continue to be repaired and maintained as a contributing element of the Fort Benning Historical Districts. In some instances, structural deterioration would continue to take place involving unoccupied or underutilized non-historic facilities or structures. Nonetheless, the No Action Alternative is not expected to result in impacts to Cultural Resources.
3.5.2.2 Alternative 1: Full Demolition Under Alternative 1, Fort Benning would demolish and dispose of approximately 150 buildings and other structures including the demolition of 17 historic buildings that exists within or adjacent to one of Fort Benning’s historic districts (Figure 3-1). The demolition of historic buildings has the potential to result in adverse impacts to Cultural Resources. As well, the demolition and removal of buildings and structures, both historic and non-historic, within and near the boundary of Fort Benning’s historic districts have the potential to adversely affect the viewshed of the Main Post and Lawson Army Airfield. Under Alternative 1, short-term, minor adverse impacts to the historic visual setting would be expected during demolition activities as a result of personnel, equipment, and partially demolished infrastructure within the project areas.

Infrastructure Footprint Reduction Program June 2018 Environmental Assessment
3-18
Following demolition and disposal, the removal of buildings and structures that are inconsistent with a historic district may enrich that district, whereas removal of contributing historic buildings or properties from a historic district may detract from that district. Similarly, removal may change the character of historical landscapes by disrupting or enhancing spatial relationships between other features (e.g., buildings, streetscapes, etc.). This, however, would not occur to the extent of changing the Main Post or Lawson Army Airfield’s historic setting. Although returning demolition to open/green space could, in some instances, complement the surrounding historic landscapes, the overall adverse impact to Cultural Resources under this alternative could be significant without adequate mitigation. Implementing the required mitigation measures listed in section 3.6.2.4 will offset the adverse effect to the historic districts to a negligible level. Earth-moving activities and the use of heavy equipment could potentially encounter previously undiscovered historic properties and prehistoric artifacts. The potential to discover artifacts is low as the project areas for demolition have previously been subjected to disturbance. Therefore, the Proposed Action would have negligible effects on undiscovered Cultural Resources. Nevertheless, if Cultural Resources are unexpectedly encountered during demolition, operations would cease in the immediate area of the discovery until the site is investigated by Fort Benning and necessary remedial actions are completed.

Infrastructure Footprint Reduction Program June 2018 Environmental Assessment
3-19

Infrastructure Footprint Reduction Program June 2018 Environmental Assessment
3-20
3.5.2.3 Alternative 2: Selective Demolition Under Alternative 2, Fort Benning would demolish and dispose of approximately 133 buildings and other structures but continue to maintain and, where possible, utilize the 17 historic structures identified within the FRP list. The demolition of building and structures would result in the temporary presence of personnel, equipment, and partially demolished infrastructure within the project areas. Some buildings and their project areas exist within or adjacent to Fort Benning’s historic districts and have the potential to adversely affect the viewshed of the Main Post and Lawson Army Airfield Historic Districts. Removal of buildings, utilities, asphalt, and other items associated with the buildings and structures in a few instances could reduce intrusions and complement the surrounding historic landscapes as the properties would be returned to open/green space. As a result, the Proposed Action would not be expected to change the character of the physical features that contribute to its historic setting. Therefore, only short-term, minor adverse impacts to Cultural Resources would be expected during demolition activities. Similar to what was described under Alternative 1, the Proposed Action has a low probability to discover artifacts as the project areas for demolition have previously been subjected to disturbance. Nevertheless, in the event cultural materials are unexpectedly encountered, operations would cease in the immediate area of the discovery until the site is investigated by Fort Benning and necessary remedial actions are completed.
3.5.3 Mitigation Mitigation would include adhering to the HPC in place at Fort Benning. Through the HPC, this EA will be used for consultation between Fort Benning, the Tribes and the SHPO. Fort Benning would prepare a Historic American Building Survey (HABS) for each historic property, or other suitable mitigation, prior to its demolition and disposal. Adverse impacts to historic districts would be mitigated prior to demolition activities.
3.6 Hazardous Materials and Waste Hazardous materials are comprised of any material or agent (biological, chemical, physical) that has the potential to cause harm to humans, animals, or the environment, either on its own or through interaction with other factors. Hazardous substances are defined and regulated in the US primarily by laws and regulations administered by the US Occupational Safety and Health Administration (OSHA), EPA, and the US Department of Transportation. Various state laws also regulate the management and disposal of Hazardous Materials and Waste. Army policy is to ensure that use, handling, and management of Hazardous Materials and Waste is in compliance with all applicable federal, state, or local laws and/or regulations. This section evaluates the use, handling and storage, transport, and disposal of Hazardous Materials and Waste at Fort Benning as a result of the Proposed Action.

Infrastructure Footprint Reduction Program June 2018 Environmental Assessment
3-21
3.6.1 Affected Environment The ROI for Hazardous Materials and Waste includes the entirety of Fort Benning. Programs have been established at Fort Benning to:
• Control the entry of hazardous substances to the Installation; • Safely manage hazardous waste and material handling and transportation within the
Installation; • Inform military and civilian employees of Hazardous Materials and Waste dangers; • Minimize the risk of human exposure and release into the environment associated with
these substances; • Dispose of these substances in an environmentally sound manner when they are no longer
useful.
3.6.1.1 Hazardous Materials Use, Handling, and Storage Army Regulation 200-1 requires Army installations to minimize the use of hazardous materials, as well as establish management procedures to ensure proper handling throughout their life cycle including procurement, storage, use, and disposal. In addition, installations are required to implement a Hazardous Waste Management Plan to ensure that hazardous waste is managed in compliance with applicable laws and regulations. AR 200-1 also includes requirements for the management of toxic substances in a manner that minimizes human exposure and environmental risk. Routine operations on Fort Benning require the use of a variety of hazardous materials, including petroleum products, solvents, cleaning agents, paints, adhesives, and other products necessary to perform vehicle and equipment maintenance, military training activities, and training area upkeep. Batteries, petroleum, oil, and lubricants (POL) are used to power both military and civilian equipment and vehicles, and pesticides are used to control plant and animal pests throughout the Installation. When not in use, these materials are generally stored at maintenance facilities in a cantonment area.
3.6.1.2 Solid Waste Management Solid waste (that is not hazardous or toxic) at the Installation includes waste generated from Family housing, administrative areas, troop units, and contractors. Two separate solid waste haulers operate under contract on Fort Benning. All of Fort Benning’s solid waste goes to a transfer station and then to permitted sanitary landfills located in Phenix City or Tallassee, AL. Both landfills have projected current and future capacity of more than 30 years (Fort Benning, 2017, Advanced Disposal, 2018) Fort Benning’s policy on recycling is governed by the October 2007, Policy Memorandum #200-1-8, entitled “Qualified Recycling Program.” Under this policy, Army personnel and contractors are required to actively participate in the recycling program, and all of the proceeds from the program are retained by the Installation. One recycling center processes recyclable items from industrial work areas, barracks, and Family housing areas. Recyclable items include paper (approximately 420 tpy), cardboard (approximately 1,500 tpy), aluminum and scrap metal

Infrastructure Footprint Reduction Program June 2018 Environmental Assessment
3-22
(approximately 3,000 tpy), glass (approximately 200 tpy), and plastic (approximately 100 tpy). Also, about 91 tons of tires, 92 tons of oil, and 300 tons of ammunition-related recycling (i.e., brass, links, shells, fuzeheads) are processed annually (Fort Benning, 2017). Family housing waste is collected curb-side from housing units located on the Installation and generally consists of food wastes, metal, plastics, paper, glass, etc. Fort Benning has a recycling program in place as outlined in its Integrated Solid Waste Program. Administration area waste is collected from various sized storage containers located on the Installation. Administration area waste generally consists of office paper products, food wastes (from mess halls and restaurants), and cardboard and cans from receiving, mess halls, motor pools, etc. Cardboard dumpsters for recycling are located near many offices, mess-halls, and motor pools. Recyclable material is collected from the recycling trailers, administration areas, and the cardboard dumpsters delivered to the Fort Benning Material Recovery Facility to be packaged and sold. Yard waste material consists of leaves, limbs, grass clippings, etc., and it is composted, mulched, and recycled as much as possible. Contractors and other users do not have permission to dispose of waste on Fort Benning. All construction and demolition wastes are taken off-Post by the contractor to a permitted recycling or disposal facility (Fort Benning, 2017).
3.6.1.3 Toxic Substances Management Toxic substances that commonly occur on Army installations include asbestos-containing materials (ACM), lead-based paint (LBP), polychlorinated biphenyls (PCBs), and radon. Asbestos Once a common ingredient in construction materials, asbestos is a group of naturally occurring fibrous minerals that has been linked to a variety of diseases. Asbestos is generally not harmful when encapsulated within building materials. ACM materials fall into two broad categories; friable and non-friable. Friable refers to ACM that can be rendered airborne by hand. Although non-friable ACM are not easily released into the air, they can become friable by disturbance (i.e., sanded, sawed, drilled, torn, etc.) and/or resulting from demolition or renovation activities (EPA, 2018). Routinely, all Fort Benning facilities scheduled for maintenance, renovation, remodeling, and demolition are inspected for presence of ACM. When required by law (40 CFR 61.145) or as a precautionary measure, ACM is removed by licensed, specialized firms. Once removed, ACM is transported off the Installation by licensed transporters and disposed in appropriately permitted landfill facilities in accordance with applicable federal, state, local, and DoD regulations (USACE, 2009). Employer requirements for limiting employee exposure to asbestos, found in OSHA’s standard for asbestos in construction (29 CFR 1926.1101), also apply to demolition where an employee may be occupationally exposed to asbestos through the disturbance of previously-installed construction materials.

Infrastructure Footprint Reduction Program June 2018 Environmental Assessment
3-23
Lead-based Paint The likelihood for buildings constructed prior to 1978 to contain LBP/coatings is high. Several buildings and structures are known or suspected to contain LBP on the Installation, and the LBP in these areas is generally managed in-place in accordance with industry guidelines and practices (e.g., National Institute for Building Sciences) to minimize the potential for creation of respirable dust, direct contact with the LBP surfaces, and contamination of the surrounding environment. Surfaces painted after the Consumer Product Safety Commission LBP ban (16 CFR 1303) went into effect may nonetheless contain traces of Pb at levels below the threshold defined by the ban and disturbance of such paint may potentially expose workers to Pb. Accordingly, all construction work, including demolition, where an employee may be occupationally exposed to any level of Pb through the disturbance of existing painted surfaces must comply with the OSHA Standard for Lead in Construction (29 CFR 1926.62).Fort Benning’s LBP Management Plan addresses LBP risk assessment and disposal procedures for LBP, coatings, and LBP-contaminated soils. All construction contractors are required to follow plan procedures. The Proposed Action involves buildings and structures constructed prior to 1978 that are presumed to contain LBP/coatings (USACE, 2009). Pesticides US Army installations have managed pests for decades using pesticides. The Federal Insecticide, Fungicide, and Rodenticide Act (FIFRA) mandates that the EPA regulates the use and sale of pesticides. Some of these chemicals historically used were banned under the FIFRA in the 1970s and 1980s; however, pesticide compounds often still endure within the environment today. Some of the most long-lasting and frequently used pesticides in the US that are now banned include organochlorinated insecticides more commonly known or branded as DDT (dichloro-diphenyl-trichloroethane), heptachlor, endosulfan, chlordane, aldrin, dieldrin, and endrin. Since many of the buildings and structures proposed for demolition were constructed and maintained before such pesticides were banned, the pesticides could have been applied or stored within the facilities. Polychlorinated Biphenyls PCBs are highly stable organic chemical compounds with a low flammability (i.e., they do not readily burn), high-heat capacity, and low electrical conductivity. In the past, PCBs were extensively used as a component of many materials, most notably as heat insulating materials (e.g., hydraulic fluid in vehicles, lifts, elevators) and as dielectric fluids in electrical transformers and capacitors. Under the authority of the Toxic Substances Control Act (TSCA), the EPA banned the continued manufacture of PCBs after 1978. In addition, the EPA imposed controls related to existing PCB-containing electrical equipment that remain in use or that are removed from service for reuse or disposal. In 1998, Fort Benning developed a PCB Inventory Report, which indicated that of the 2,157 transformers surveyed on the Installation, 1,166 were assumed to be PCB transformers (i.e., they contained equal to or greater than 500 parts-per-million PCBs). Also in 1998, Fort Benning developed a PCB Management Plan to formally establish the program for compliance with TSCA and other relevant regulatory requirements. Since the utilities privatization initiative was implemented in 1999, the ownership of the electrical distribution system, including most of the

Infrastructure Footprint Reduction Program June 2018 Environmental Assessment
3-24
PCB-containing electrical equipment on Fort Benning has been transferred to Flint Electric. One exception is the electrical system at Lawson Army Airfield, which continues to be government owned and managed by a contractor (USACE, 2009). The non-federal owners of the electric system on the Installation are responsible for management of those systems, including any PCB spills (Fort Benning, 2004). The Proposed Action is anticipated to have no facility changes that would affect PCBs or their management; therefore, PCBs are not studied further. Radon Radon is a naturally occurring, colorless, odorless, radioactive gas produced by the decay of uranium in rock and soil. Radon is a known carcinogen, capable of causing direct damage to lung tissues and increasing the risk of lung cancer when inhaled. If present, radon gas will typically concentrate in airtight buildings and particularly in basements. Although no federal regulations define an acceptable level of radon exposure, the EPA recommends the voluntary, consensus-based mitigation of radon based on the standard developed and issued by the American Society for Testing and Materials (ASTM) International, Standard Practice for Installing Radon Mitigation Systems in Existing Low-Rise Residential Buildings, ASTM E-2121. The Army and EPA recommend an action level of 4 picocuries per liter (EPA, 2013). The Army Policy for Radon as outlined in Army Regulation 200-1, Radon Policy Reduction Program, requires measurement of radon in newly constructed Army facilities and use of US Army Corps of Engineers (USACE) design criteria for radon reduction in new construction. Radon information provided by EPA, Region IV, and statistics maintained by the GA Environmental Protection Division suggest that radon is not an issue of concern in the region (USACE, 2009). The Proposed Action is anticipated to have no facility changes that would affect radon or its management; therefore, radon is not studied further.
3.6.1.4 Hazardous Waste Generation, Storage, and Disposal A variety of operations across Fort Benning produce hazardous wastes. Common waste generated include various solvents; paints; antifreeze; aerosols; contaminated filters, rags and absorbents; weapon cleaning patches and sludges; and some items managed as universal wastes, such as used batteries and fluorescent light tubes. The Fort Benning Environmental Management Division oversees the management of hazardous waste by assisting military units and activities that generate the waste. The Centralized Accumulation Areas and Satellite Accumulation Areas are maintained in various locations across the Installation to facilitate the collection of hazardous wastes and to ensure that the wastes are transported off of the Installation in accordance with applicable federal, state, and DoD regulations. Hazardous wastes generated by Installation and tenant activities are collected and transferred to a central accumulation area where they may be accumulate for no longer than 90 days before being transported offsite for treatment or disposal since Fort Benning is classified as a Resource Conservation and Recovery Act (RCRA) Large Quantity Generator of Hazardous Waste. Fort

Infrastructure Footprint Reduction Program June 2018 Environmental Assessment
3-25
Benning arranges for the transport and disposal of its hazardous waste by appropriately licensed waste management and transportation companies through a Defense Logistics Agency contract. Fort Benning trains workers, inspects approximately 200 waste accumulation areas annually, and provides program oversight for the disposal of approximately 200,000 pounds of hazardous and toxic waste generated each year (Fort Benning, 2006). Fort Benning currently operates under Corrective Action Permit Number HW-021(CA) and Facility I.D. No. GA3210020084. Also, Fort Benning manages compliance with the relevant regulations through its Hazardous Waste Management Plan.
3.6.1.5 Existing Contaminated Sites Past resource and waste management practices at DoD facilities have resulted in the presence of toxic and hazardous waste contamination at some installations, including Fort Benning. In response, Fort Benning has undertaken mitigation and cleanup activities under its Installation Restoration Program to manage these sites, which are referred to as Solid Waste Management Units (SWMUs) (Fort Benning 2005a and b). The Fort Benning Environmental Management Division actively manages programs for addressing contaminated sites in compliance with RCRA and the National Oil and Hazardous Substances Pollution Contingency Plan. These sites are designated either as 1) Operation and Maintenance, Army-SWMUs, which are being managed under the 2005 Fort Benning Environmental Action Plan (EAP) or as 2) Environmental Restoration, which are Army-SWMUs managed under 2005 Fort Benning Installation Action Plan (IAP). The cleanup activities initiated under the EAP are directed at contamination primarily resulting from current operations, and the contaminants of concern include POLs; trichloroethylene (TCE); metals; volatile organic compounds; pesticides; and leachate. The IAP is specifically focused on contamination resulting from past activities, and the contaminants of concern include gasoline (including its constituents, benzene, toluene, ethylbenzene, and xylenes), paint, TCE, and leachate. Both the EAP and the IAP have been developed through consultation and coordination with USAEC, EPA, GA Environmental Protection Division, and the public. Two active contaminated sites include the Closed Landfill No. Six and former Above Ground Storage Tank (Pump House and Dispenser System) are located in the Fort Benning training areas. Neither of the contaminated sites is located within or nearby the Fort Benning cantonment areas. Consistent with DoD policy, it is Fort Benning’s policy to include a review process to identify any involvement of known or potentially contaminated sites that may be affected by proposed construction to prevent the spread of any contamination and to ensure that construction workers and personnel who use the project areas are not exposed to unsafe conditions. SMWUs that need corrective action have been identified, surveyed, and are reviewed by Fort Benning, prior to any proposed construction projects. Those sites requiring corrective action have recorded land use controls that allow the project planners and engineers to evaluate the nature of the contamination and take proper action to prevent the spread of contaminants to the environment or expose personnel as a result of proposed construction. The nature of exposure protection includes the potential for subsurface vapor intrusion below buildings. For locations where contamination has occurred in the past but a determination of No Further Action has been made, this determination

Infrastructure Footprint Reduction Program June 2018 Environmental Assessment
3-26
is based upon the documentation that all contaminant exposure avenues have been identified and that all exposure levels of any contaminants are below all EPA and GA Environmental Protection Division screening levels, and no protective measures or additional clean-up or land use controls are necessary.
3.6.2 Environmental Consequences Potential impacts of the No Action Alternative and the Action Alternatives have been assessed with regard to changes in the volume of Hazardous Materials and Waste managed by the Installation. An Alternative would be considered to have a significant adverse impact if:
• It resulted in noncompliance with applicable local, state, and federal regulations; • Increased the amount of hazardous waste generated or procured beyond the waste
management capacity of the Installation; • Contaminated sites are disturbed causing adverse effects on ecological and human health
by creating exposure pathways; or if • Established management policies, procedures, and handling capacities for fuel
management could not accommodate the activities associated with the Proposed Action.
3.6.2.1 No Action Alternative The No Action Alternative would not change the baseline conditions for management of hazardous materials, toxic substances, hazardous waste, or contaminated sites at Fort Benning. Fort Benning would continue to minimize any adverse impacts resulting from hazardous materials by following all applicable laws, regulations, and Fort Benning plans. Therefore, negligible impacts are anticipated.
3.6.2.2 Alternative 1: Full Demolition Prior to demolition and disposal activities, each structure would be assessed for the presence of hazardous materials or wastes prior to demolition and disposal activities. The assessment may include reviews of records related to the structure’s historic use and historic pesticide application, surveys for ACM and LBP, and targeted sampling of parts of the structure. Structures with environmental hazards would not be demolished until regulated hazardous substances or wastes are properly abated in accordance with the environmental statutes and regulations that govern hazardous substance and hazardous waste management activities at DoD installations. All abatement activities would be conducted in accordance with Army policies and procedures. Demolition activities would temporarily increase the amount of solid waste generated. This waste would include building materials such as concrete, insulation, nails, electrical wiring, and rebar, as well as potential yard waste originating from site preparation. There would also be a minor increase in the storage and use of hazardous materials such as POL, cleaning agents, paints, adhesives, herbicides and pesticides. Minor POL spills from engines and equipment operation could occur during demolition operations. Appropriate NPDES Best Management Practices (BMPs) that apply to construction and demolition (Section 3.8), including preparing

Infrastructure Footprint Reduction Program June 2018 Environmental Assessment
3-27
and adhering to a Spill Prevention, Control, and Countermeasure Plan, would be implemented during all demolitions to ensure that any leaks or spills would have only negligible environmental effects. Contractors would be responsible for handling all regulated materials in accordance with federal and state regulations. Over the long-term, demolition would reduce the quantities of hazardous materials that may be contained within the infrastructure composition, as well as those utilized in the operation; repair; and maintenance of these buildings and structures. In summary, Alternative 1 would ensue in short-term, minor adverse impacts from an increase in Hazardous Materials and Waste disposal due to demolition activities. Long-term beneficial impacts would be expected by 1) disposing of and reducing the presence of hazardous materials that may remain within the infrastructure’s composition, and 2) by reducing the quantity of Hazardous Materials and Waste required for ongoing operation, repair, and maintenance of those facilities.
3.6.2.3 Alternative 2: Selective Demolition Although fewer buildings and structures would be demolished and disposed of under Alternative 2, potential impacts involving Hazardous Materials and Waste would be similar to those occurring under Alternative 1. Therefore, short-term minor adverse effects would be expect from hazardous material disposal as a result of demolition activities, and long-term beneficial impacts as a result of reducing the presence and quantity of Hazardous Materials and Waste required for ongoing operation, repair, and maintenance. Both adverse and beneficial impacts involving Hazardous Materials and Waste would occur to a lesser degree under Alternative 2 as compared with Alternative 1.
3.6.3 Mitigation Adherence to applicable federal, state, Army laws and regulation, and Fort Benning plans mentioned in this section would minimize impacts due to demolition, construction, and maintenance operations activities. No additional mitigation measures are warranted.
3.7 Land Use Land Use involves the utilization or modification of land for agricultural, industrial, training, residential, recreational, or other purposes. Land uses are frequently regulated by management plans, policies, ordinances, and regulations that determine the types of uses that are allowable or to protect specially designated or environmentally sensitive uses.
3.7.1 Affected Environment The ROI for Land Use includes the land within Fort Benning’s cantonment areas and other adjacent cantonment or training lands that could potentially be affected due to changes in land utilization as a result of the Proposed Action. Fort Benning’s land is utilized primarily for support of cantonment functions (e.g., residential, recreational, commercial, administrative, etc.) or operational training. Land utilization and management within the cantonment areas are planned in accordance with the Real Property Master Plan and provide orderly development of

Infrastructure Footprint Reduction Program June 2018 Environmental Assessment
3-28
the Installation. Impacts to the Land Use and environment are minimized by using proper management plans to guide land utilization planning decisions.
3.7.2 Environmental Consequences Impacts to Land Use would be considered significant if the Proposed Action was:
• Incompatible with surrounding land uses; • Resulted in incompatible land uses that degraded mission-essential training or necessary
functions within the cantonment areas.
3.7.2.1 No Action Alternative Under the No Action Alternative, demolition and disposal of buildings and other structures on the FRP list as directed by the US Army would not occur. Therefore, no changes to land utilization would occur and no impacts to Land Use are anticipated.
3.7.2.2 Alternative 1: Full Demolition Under Alternative 1, no conflicts are anticipated to Land Use compatibility. Negligible changes to Land Use would occur during demolition activities but limited to the project’s demolition site. These effects would be temporary in nature and within areas accustomed to construction related activities. Following demolition, changes to Land Use from the absence or return to open/green space of buildings and other structures on the FRP list would not adversely affect the overall Land Use or management of the surrounding areas. As a result, no impacts are anticipated.
3.7.2.3 Alternative 2: Selective Demolition The potential impacts resulting from the implementation of Alternative 2 would be the same as those described under Alternative 1. Therefore, no impacts are expected to Land Use resulting from the implementation of Alternative 2.
3.7.3 Mitigation The Action Alternatives would result in no adverse effects to Land Use and no mitigation would be necessary.
3.8 Noise Noise is described as unwanted sound that interferes with normal activities or otherwise diminishes the quality of the environment. Noise levels are measured in decibels (dB), which represent the acoustical energy present. A point of reception or receptors have a wide diversity in responses that not only vary according to the type of noise and the characteristics of the sound source but also according to the sensitivity and expectations of the receptor, time of day, and distance between the noise source and the type of receptor (e.g., a person or animal).
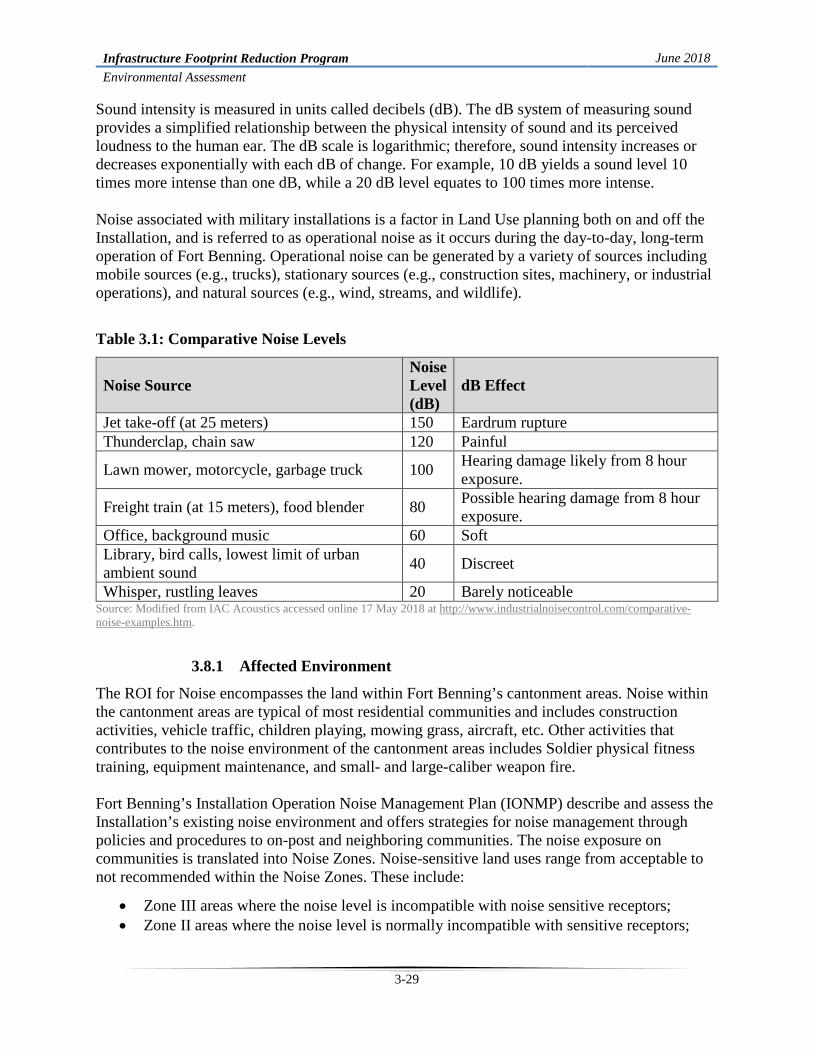
Infrastructure Footprint Reduction Program June 2018 Environmental Assessment
3-29
Sound intensity is measured in units called decibels (dB). The dB system of measuring sound provides a simplified relationship between the physical intensity of sound and its perceived loudness to the human ear. The dB scale is logarithmic; therefore, sound intensity increases or decreases exponentially with each dB of change. For example, 10 dB yields a sound level 10 times more intense than one dB, while a 20 dB level equates to 100 times more intense. Noise associated with military installations is a factor in Land Use planning both on and off the Installation, and is referred to as operational noise as it occurs during the day-to-day, long-term operation of Fort Benning. Operational noise can be generated by a variety of sources including mobile sources (e.g., trucks), stationary sources (e.g., construction sites, machinery, or industrial operations), and natural sources (e.g., wind, streams, and wildlife).
Table 3.1: Comparative Noise Levels
Noise Source Noise Level (dB)
dB Effect
Jet take-off (at 25 meters) 150 Eardrum rupture Thunderclap, chain saw 120 Painful
Lawn mower, motorcycle, garbage truck 100 Hearing damage likely from 8 hour exposure.
Freight train (at 15 meters), food blender 80 Possible hearing damage from 8 hour exposure.
Office, background music 60 Soft Library, bird calls, lowest limit of urban ambient sound 40 Discreet
Whisper, rustling leaves 20 Barely noticeable Source: Modified from IAC Acoustics accessed online 17 May 2018 at http://www.industrialnoisecontrol.com/comparative-noise-examples.htm.
3.8.1 Affected Environment The ROI for Noise encompasses the land within Fort Benning’s cantonment areas. Noise within the cantonment areas are typical of most residential communities and includes construction activities, vehicle traffic, children playing, mowing grass, aircraft, etc. Other activities that contributes to the noise environment of the cantonment areas includes Soldier physical fitness training, equipment maintenance, and small- and large-caliber weapon fire. Fort Benning’s Installation Operation Noise Management Plan (IONMP) describe and assess the Installation’s existing noise environment and offers strategies for noise management through policies and procedures to on-post and neighboring communities. The noise exposure on communities is translated into Noise Zones. Noise-sensitive land uses range from acceptable to not recommended within the Noise Zones. These include:
• Zone III areas where the noise level is incompatible with noise sensitive receptors; • Zone II areas where the noise level is normally incompatible with sensitive receptors;

Infrastructure Footprint Reduction Program June 2018 Environmental Assessment
3-30
• Zone I/Land Use Planning Zone (LUPZ) areas where the noise level is compatible with noise sensitive receptors (e.g. residential communities, schools, churches, etc.).
Note that LUPZ is a subdivision of Zone I. The LUPZ is five dB lower than the Zone II where most noise-sensitive land uses are still generally acceptable. This zone acts as a transition between the relatively unrestrictive Zone I and more restrictive Zone II. The LUPZ shows areas normally considered Zone I on an average basis may experience a level of annoyance during increased operations. Buildings and structures identified for demolition under the FY19-23 FRP exists within Zone I and Zone II. Figure 3-2 illustrates the noise contours as they apply to the FRP.
3.8.2 Environmental Consequences Impacts as a result of Noise would be considered significant if the Proposed Action was:
• Incompatible with surrounding land use; • Resulted in incompatible changes involving land use that degraded mission-essential
training or necessary functions within the cantonment areas.
3.8.2.1 No Action Alternative Under the No Action Alternative, demolition and disposal of buildings and other structures on the FRP list as directed by the US Army would not occur. Therefore, no changes to Land Use would to occur and no impacts due to increased noise levels are anticipated.

Infrastructure Footprint Reduction Program June 2018 Environmental Assessment
3-31

Infrastructure Footprint Reduction Program June 2018 Environmental Assessment
3-32
3.8.2.2 Alternative 1: Full Demolition
Noise resulting from the use of vehicles and equipment for the demolition of would be short-term and localized resulting in negligible effects. Demolition would occur over a brief time period and occur during normal business hours. Although there are sensitive noise receptors (e.g., residential areas) adjacent to the sites of demolition, no long-term effects would occur from these activities. Temporary increased levels of noise would terminate upon completion of construction and demolition, and the noise environment would return to pre-demolition conditions. Range training and aviation activities within the cantonment areas would continue in the similar manner as is found under existing conditions and will be accounted for in the Installation Operational Noise Management Plan. Noise producing activities from demolition would not permanently change or adversely affect the current noise environment.
3.8.2.3 Alternative 2: Selective Demolition The potential impacts resulting from the implementation of Alternative 2 would be the same as those described under Alternative 1. Therefore, no adverse impacts to the current noise environment are expected resulting from the implementation of Alternative 2.
3.8.3 Mitigation The Action Alternatives would result in no adverse effects due to increased noise levels and no mitigation would be necessary.
3.9 Soils Soils are most often described in terms of their type, slope, physical characteristics, and relative compatibility or limitations with regard to particular activities. Two basic soil provinces make up Fort Benning: the GA Sand Hills and the Southern Coastal Plains. Based on the US Department of Agriculture, Natural Resource Conservation Service's soil survey “K factor," most of the soils found at Fort Benning, with the exception of southern portions of the Installation, are identified as low to moderately erodible when undisturbed. The degree of erodibility is determined by physical factors such as drainage, permeability, texture, structure, and percent slope. The rate of erodibility is based on the amount of vegetative cover, climate, precipitation, proximity to water bodies, and Land Use. Soil disturbing activities accelerate the erosion process by exposing soils to precipitation and surface runoff. Activities that disturb or remove vegetation are likely to increase the erosion hazard, particularly on slopes. Prime farmland soils, protected under the Farmland Protection Policy Act (FPPA) (7 USC 4201; FPPA of 1981, as amended) are not discussed in this EA, as no lands within Fort Benning have been classified as prime farmland. Therefore, there is no further discussion of prime farmland in this EA. To prevent soil erosion during construction, consequent damage to endangered species habitat, or sedimentation of streams and wetland areas, the Army employs NPDES BMPs as defined by the GA Department Natural Resources (DNR), and GA Soil and Water Conservation Commission for all construction projects. (Note: In the context of stormwater permit requirements,

Infrastructure Footprint Reduction Program June 2018 Environmental Assessment
3-33
construction refers to ground-disturbing activities, including facility demolition.) Pursuant to that requirement, state and county regulations require construction projects involving one acre of land disturbance or more—including smaller sites that are part of a larger common plan of development that collectively disturbs one acre or more—to obtain an approved Erosion Sedimentation Pollution Control Plan (ESPCP), fee submittal for the disturbed acreage, and Notice of Intent (NOI) to meet the requirements of the federal NPDES construction permit program and GA Erosion and Sedimentation Control Act. The ESPCP prescribes activities to limit erosion and sedimentation from the site and includes a site description, list of BMPs to be used, BMP inspection procedures to be performed by qualified personnel, procedures for timely BMP maintenance, requirements for sampling of discharges or receiving streams for turbidity, and reporting requirements to the GA DNR Environmental Protection Division (EPD).
3.9.1 Affected Environment The ROI for Soils includes Fort Benning’s cantonment areas that could be directly and/or indirectly impacted by soil erosion and sedimentation from the Proposed Action. Common soil types found within the cantonment areas consists of the Nankin, Troup, Bibb, Lucy, Fuquay, Orangeburg, Uchee, Troup, Ruston, Norfolk, Udorthents, Lakeland, and the Cowarts-Ailey series. Generally, soils on Fort Benning are highly susceptible to erosion if vegetation is removed, especially on steep slopes. The establishment and maintenance of appropriate vegetation and proper drainage systems is the fundamental means of addressing and avoiding extensive erosion of soils. Figures 3-2 and 3-3 illustrate the soils associated with buildings and structures identified for demolition. Minor earth disturbances are expected from demolition activities. Demolition will include the removal of buildings, supporting facilities, site improvements (such as parking lots and walkways), and underground structures and utilities. The total amount of earth disturbance for the proposed demolition will be analyzed individually and determined prior to final site design and contingent upon topographical features, utility tie-ins, and the final architectural and engineering facility design for each project site.
3.9.2 Environmental Consequences Impacts would be considered significant if they would:
• Violate applicable federal or state laws and regulations, and/or fail to receive applicable state permits (e.g., NPDES construction permit) prior to initiating the Proposed Action;
• Substantially degrade soils, soil fertility, or soil productivity; • Have substantial, highly noticeable influences on the rate of soil erosion or the ability of
the soil to support vegetation expected to be present in the area; • Involve the loss of vegetation at a level that would substantially reduce the occurrence of
a plant species or degrade the habitat of a dependent animal species at a population level on the Installation.

Infrastructure Footprint Reduction Program June 2018 Environmental Assessment
3-34
3.9.2.1 No Action Alternative No effect on Soils would be expected under the No Action Alternative. Under the No Action Alternative, no facilities would be removed and no ground disturbance would occur, and therefore no soils would be disturbed or changed.
3.9.2.2 Alternative 1: Full Demolition Under Alternative 1, soil erosion and sedimentation controls will be put in place, per the Clean Water Act (CWA) and the GA Erosion and Sedimentation Control Act, and appropriate NPDES permits will be obtained in prior to any land disturbing activities. Short-term, minor adverse impacts to Soils within the ROI may occur during the demolition; however, no long-term effects would be anticipated as all ground disturbances at the proposed sites, would be re-vegetated and stabilized.
3.9.2.3 Alternative 2: Selective Demolition The potential impacts to resulting from the implementation of Alternative 2 would be the same as those described under Alternative 1. Short-term, minor adverse effects to Soils within the ROI could occur during demolition and disposal; however, no long-term effects would be anticipated.
3.9.3 Mitigation For either Action Alternative, mitigation measures would be implemented as part of federal and state permitting requirements to minimize the effects to soil resources during demolition and disposal activities. Application of federal and state erosion control measures and NPDES permitting requirements to include preparation of an Erosion, Sedimentation and Pollution Control Plan (ESPCP) detailing erosion and sedimentation control BMPs, and a minimum 25-foot surface water setback to minimize soil impacts during construction are required prior to land disturbing activities. Additionally, adherence to federal and state laws and regulations would minimize impacts due to operations and maintenance activities in the long-term. Therefore, no additional mitigation measures are warranted.

Infrastructure Footprint Reduction Program June 2018 Environmental Assessment
3-35

Infrastructure Footprint Reduction Program June 2018 Environmental Assessment
3-36

Infrastructure Footprint Reduction Program June 2018 Environmental Assessment
3-37
3.10 Utilities The term utility refers to a basic set of services (e.g., electricity, natural gas, water, sewage, communications, and transportation) provided by an organization who generates, distributes, and maintains the infrastructure necessary.
3.10.1 Affected Environment Utilities involved with the Proposed Action include electricity (energy/power), natural gas, water (potable), and wastewater (sewage). The ROI for Utilities is Fort Benning. All of Fort Benning’s utilities are privatized. Potable water and wastewater systems are privatized to Columbus Water Works (CWW), energy/electricity systems to Flint Energy, and gas to Liberty Utilities. Under the privatization of utilities agreements, each respective entity would manages the systems for Fort Benning’s needs. 3.10.2 Environmental Consequences Impacts to Utilities could be significant if the Proposed Action reduced the capacity of a utility system to the extent of becoming impractical for the privatized entities to continue providing the service.
3.10.2.1 No Action Alternative Under the No Action Alternative, demolition and disposal of buildings and other structures on the FRP list as directed by the US Army would not occur. There would be no reduction in facilities deemed inefficient and cost prohibitive to sustain. The use and demand for utilities would not change and service to these structures would remain unchanged. The No Action Alternative would have a long term, minor impact as related to energy usage and continuing efforts to reduce Fort Benning’s total energy demand.
3.10.2.2 Alternative 1: Full Demolition
Under Alternative 1, the Proposed Action would gradually reduce demands on energy and utilities. The demolition of infrastructure would contribute to efforts in reducing Fort Benning’s energy usage resulting in a long-term, beneficial impact to Fort Benning’s total energy demand.
3.10.2.3 Alternative 2: Selective Demolition
Under Alternative 2, the Proposed Action would demolish 17 fewer buildings than Alternative 1. These historic buildings would be retained and adapted as necessary for use. Overall, long-term beneficial impacts are also anticipated as a result of Alternative 2; although less advantageous than Alternative 1.
3.10.3 Mitigation Since the Action Alternatives would result only in beneficial impacts, no mitigation measures are warranted pertaining to Utilities.

Infrastructure Footprint Reduction Program June 2018 Environmental Assessment
3-38
3.11 Water Resources Water Resources include surface water and floodplains, groundwater and aquifers, and wetland resources. Activities that affects water quality, quantity, or rate of movement at one location within a watershed has the potential to affect the characteristics of the resource. The CWA of 1972 is the primary federal law that protects the nation’s waters. The CWA prohibits the discharge of any pollutant to waters of the US unless the discharge is authorized by a NPDES permit. The ROI for Water Resources includes the Fort Benning cantonment areas and associated drainage basins that could be directly and/or indirectly impacted by the Proposed Action. The primary water quality concerns at Fort Benning are sedimentation from highly erodible soils, fecal coliform bacteria, storm water runoff from impervious areas, and loss of wetlands (USACE, 2007).
3.11.1 Affected Environment
Surface water systems are typically defined in terms of watersheds. Watersheds are delineated into hydrologic units by the US Geological Survey using a nationwide system based on surface hydrologic features. Each hydrologic unit is identified by a unique hydrologic unit code (HUC).
3.11.1.1 Surface Water
The Chattahoochee River arises as a cold-water mountain stream in the Blue Ridge Province. Fort Benning is located within the Chattahoochee River basin (HUC 03130003), and the river flows adjacent and through approximately 15 miles of the Installation on its southwestern side, close to the cantonment areas. As illustrated in Figure 3-4, all surface waters within the ROI drain toward the Chattahoochee River, which includes 15 streams and their tributaries. Armory, Hamlet, Wortley, Daugherty, Castin, Heriot, Lumert, Opossum, Tiger, Steam Mill, and Ochillee Creek drain into Upatoi Creek before flowing into the Chattahoochee River. While McMurrin Branch, Mill, Harps, and Gilbert Creek drain into Oswichee Creek before flowing into the Chattahoochee River. Laundry Creek drains south directly into the Chattahoochee River.
3.11.1.2 Stormwater Stormwater on the Installation drains via culverts, ditches, swales, and natural seepage and overland flow. Many of the soils at Fort Benning are characterized as susceptible to erosion, and many of the water quality issues for the streams in and around Fort Benning are related to high levels of sedimentation, particularly after storm events.

Infrastructure Footprint Reduction Program June 2018 Environmental Assessment
3-39

Infrastructure Footprint Reduction Program June 2018 Environmental Assessment
3-40
3.11.1.3 Wetlands and Surface Waters Wetlands constitute approximately 17,000 acres of the Installation’s 182,000 acres (Fort Benning 2015). Wetlands are considered transitional areas between aquatic and terrestrial environments where the recurring presence of water, at or near the soil surface, drives the natural system; which includes the soils that form and wildlife communities that use these areas. Jurisdictional wetlands, which the USACE regulates, are defined under the CWA as areas that are saturated by surface or groundwater at a frequency and duration sufficient to support, and that under normal circumstances do support, a prevalence of vegetation typically adapted for life in saturated soil conditions. Wetlands generally include swamps, marshes, bogs, etc. (EPA, 2018). Wetlands within the ROI are almost exclusively riparian and associated with the stream systems. Preliminary site planning information, (i.e., the National Wetlands Inventory, previously delineated wetlands) did not identify any known wetlands or streams within 50 feet of proposed demolition sites. The Proposed Action would have no effect upon wetlands or surface waters; therefore, such resources are not discussed further in Section 3.9.2.
3.11.1.4 Groundwater Fort Benning is located within the Coastal Plain hydrogeologic province of GA and AL. The principal groundwater source for Fort Benning is the Cretaceous Aquifer System. The regional groundwater flow in the area is from north to south, and the aquifers in the Coastal Plain consist of porous sands and carbonates and include alternating units of sand, clay, sandstone, dolomite, and limestone that dip gently and thicken to the southeast. The Proposed Action would not affect groundwater; therefore, groundwater is not discussed further.
3.11.1.5 Floodplains A floodplain is an area of land adjacent to a stream or river that experiences flooding during periods of high water flows, usually a result of rain events. EO 11988, Floodplain Management, instructs federal agencies to consider the risks, danger, and potential impacts of locating projects within floodplains, and requires agencies to avoid, to the extent possible, the long- and short-term adverse impacts associated with the modification of floodplains whenever there is a practicable alternative. The Federal Emergency Management Agency (FEMA) is the federal agency having lead responsibility for flood hazard assessment and mitigation. FEMA has adopted the 100-year floodplain as the base flood standard for areas subject to a one percent or greater chance of flooding in any given year. The Chattahoochee River floodplain, and its associated black water and tupelo swamps, is located in the southwestern portion of the Installation, adjacent west of Fort Benning’s Main Post Cantonment Area as illustrated in Figure 3-4. As well, Figure 3-4 illustrates the 100-year floodplain associated with Upatoi, Ochillee, Harps, Mill, and Oswichee Creek (Federal Emergency Management Agency [FEMA] 2017, Fort Benning Geographic Information Systems [GIS], 2018). The building and structures proposed for demolition and associated with this Proposed Action are located beyond the flood zones and would have no effect upon areas considered to have a one percent or greater annual chance of flooding. Therefore, such resources are not discussed further.

Infrastructure Footprint Reduction Program June 2018 Environmental Assessment
3-41
3.11.2 Environmental Consequences A significant adverse impact would occur to Water Resources if implementation of the Proposed Action resulted in an unpermitted impacts to surface waters. Surface water within Fort Benning could be adversely impacted from contamination from fuel/oil spills, pesticide residue, fired munitions residue, and untreated sewage bypass. These potential contamination sources are controlled and minimized by the implementation of Fort Benning Spill, Prevention, Control, and Countermeasure Plan, Fort Benning Installation Spill Contingency Plan, Storage Tank Management Plan, Stormwater Pollution Prevention Plan, and the NPDES permit requirements to prevent sewage bypasses. Nonpoint sources, more specifically sedimentation are the primary pollutant sources of concern for surface water at Fort Benning. Consequently, much of the Installation’s water resource management is closely related to minimizing and repairing erosion caused primarily by ground disturbing activities.
3. 11.2.1 No Action Alternative Under the No Action Alternative, demolition and disposal of buildings and other structures on the FRP list as directed by the Army would not occur. Therefore, the No Action Alternative would have no effect on Water Resources and no adverse impact would be anticipated.
3.11.2.2 Alternative 1: Full Demolition Under Alternative 1, short-term, minor adverse effects to surface waters could occur during the demolition as a result of ground disturbances. No long-term effects to Water Resources would be anticipated as the sites would be re-vegetated, where possible, and stabilized upon completion of demolition activities. Potential impacts to Water Resources as a result of POL spills from vehicle and equipment failures would be precluded by compliance with applicable regulations to minimize the risks of minor spills occurring. In the event of an accidental POL spill, Fort Benning personnel will follow spill response procedures and an accident response team would be available immediately to minimize any adverse effects.
3.11.2.3 Alternative 2: Selective Demolition The potential impacts to Water Resources resulting from the implementation of Alternative 2 would be the same as those described under Alternative 1.
3.11.3 Mitigation Adherence to regulatory requirements by implementation of the Proposed Action would avoid or minimize adverse impacts to Water Resources. A GA NPDES Construction Permit would be required prior to construction that involves more than one acre of land disturbing activity. Furthermore, Fort Benning requires vegetative and structural BMPs for all construction associated land disturbances, and additionally an ESPCP for projects that disturb 0.1 acre or greater to ensure smaller land disturbances do not negatively impact Water Resources.

Infrastructure Footprint Reduction Program June 2018 Environmental Assessment
3-42
Adherence to federal and state requirements and NPDES permitting requirements to include preparation of an ESPCP detailing erosion and sedimentation control BMPs for implementation would minimize any potential effects to Water Resources. Consequently, no additional mitigation measures are warranted.
3.12 Environmental Impact Summary A summation of the direct and indirect impacts to the VECs carried forward for analysis are presented in Table 3.2.

Infrastructure Footprint Reduction Program June 2018 Environmental Assessment
3-43
Table 3.2: Summary of Direct and Indirect Environmental Consequences for Alternatives
VEC No Action Alternative 1: Full Demolition
Alternative 2: Selective Demolition
Air Quality
Long-term, minor adverse impacts as a
result of existing emission levels and use
of existing emission sources.
Long-term, beneficial impacts due to the
reduction of air emissions
equipment/Title V Permit. Short-term,
minor adverse impacts from fugitive dust emissions during
demolition.
Same as Alternative 1.
Biological Resources No impacts
Negligible effects as a result of potential soil disturbances, removal
of vegetation and possible habitat, vehicle
traffic, etc.
Same as Alternative 1.
Cultural Resources No impacts
Long-term, minor adverse impacts
resulting from altering the historic landscapes.
Short-term, minor adverse impacts
resulting from temporally altering the
historic viewsheds.
Hazardous Materials and Waste No impacts
Short-term, minor adverse impacts from
an increase in hazardous materials
and disposal of waste.
Same as Alternative 1.
Land Use No impacts Negligible effects from
changes in land utilization.
Same as Alternative 1.
Noise No impacts Negligible effects as a
result temporary demolition activity.
Same as Alternative 1.
Soils No impacts
Short-term, minor adverse impacts as a
result of ground disturbances.
Same as Alternative 1.
Utilities
Long-term, minor adverse impacts as a result of energy usage
by facilities on the FY19-23 FRP list.
Long-term, beneficial impacts from
reductions to Fort Benning’s total energy
demand.
Same as Alternative 1.
Water Resources No impacts
Short-term, minor adverse impacts as a
result of ground disturbances or
accidental spills.
Same as Alternative 1.

Infrastructure Footprint Reduction Program June 2018 Environmental Assessment
4-1
4 CUMULATIVE IMPACTS
4.1 Introduction In addition to identifying the direct and indirect environmental impacts of their actions, the CEQ’s NEPA regulations require federal agencies to address cumulative impacts related to their proposals. A cumulative impact is defined in the CEQ Cumulative Impact regulations as: “the impact on the environment which results from the incremental impact of the action when added to other past, present, and reasonably foreseeable future actions regardless of what agency (federal or non-federal) or person undertakes such other actions. Cumulative impacts can result from individually minor but collectively significant actions taking place over a period of time (40 CFR §1508.7).” This section describes the process used to identify potential cumulative impacts related to the Proposed Action at Fort Benning and discusses those impacts for each of the resources addressed in Chapter 3.
4.1.1 Identifying Cumulative Impacts Guidance for assessing cumulative impacts has been provided by CEQ in Considering Cumulative Effects under the National Environmental Policy Act (CEQ 1997b). The process involves identifying significant cumulative effects issues; establishing the relevant geographic and temporal extent (time frame) of the cumulative effects analysis; identifying other actions affecting the resources of concern; establishing the cause-and-effect relationship between the Proposed Action and the cumulative impacts; determining the magnitude and significance of the cumulative effects; and identifying ways in which the agency’s proposal might be modified to avoid, minimize, or mitigate adverse, cumulative impacts. CEQ regulations specify that cumulative impacts analyses encompass past, present, and reasonably foreseeable future actions. Past actions are generally included in the baseline described in the affected environment and No Action Alternative in Chapter 3; therefore, past actions that are part of the baseline are not included. Only in unique circumstances are past actions not included in the baseline and addressed in the cumulative impacts analysis. As appropriate and feasible, Chapter 3 notes past activities that may have contributed to the current affected environment and baseline conditions. An ROI was defined for each VEC in Chapter 3 under its Affected Environment. The ROI or geographic extent of the cumulative impacts analysis generally coincides with the ROI of each VEC and is described in Section 4.3. In addition, significance thresholds defined for each resource in Chapter 3 also apply to the assessment of cumulative impacts.
4.1.2 Past, Present and Reasonably Foreseeable Actions This section identifies past, present, and reasonably foreseeable future actions considered. The analysis considers present and reasonably foreseeable future actions as those actions that are currently under way, approved, and/or have identified funding. Actions beyond that become increasingly speculative and difficult to assess. The cumulative projects numbered below correspond with Figure 4-1 and illustrate their location on Fort Benning.

Infrastructure Footprint Reduction Program June 2018 Environmental Assessment
4-2
1) Army 2020 Force Structure Realignment (FY13 – FY2020): In 2013, the Army prepared a Programmatic EA to analyze the potential environmental and socioeconomic impacts associated with a proposed action consisting of a reduction in active Army end-strength from 562,000 to 490,000. Since the 2013 Programmatic EA was completed, DoD fiscal guidance has continued to change, and the future end-strength of the Army must be reduced even further than the 490,000 considered in the 2013 Programmatic EA. This came about primarily because the second part of the 2011 Budget Control Act, commonly referred to as sequestration, came into effect. Army Force Structure Realignment decision for Fort Benning included the inactivation of the 3rd Armored Brigade Combat Team (a loss of approximately 3,400 Soldiers), and the activation of the 1-28th Infantry Brigade Task Force that consists of approximately 1,080 Soldiers. Although a task force is usually considered a temporary organization, the Infantry Brigade Task Force proposed for conversion at Fort Benning is actually a permanent part of Army force structure. In 2016, a Record of Environmental Consideration was completed in consideration of the environmental effects and consequences of the realignment specific to Fort Benning. Accordingly, no significant environmental impacts were anticipated to occur. Note that Army 2020 Force Structure Realignment is not identified in Figure 4-1 due to its post-wide implications.
2) Artillery Firing Points Expansion and Maintenance of the Open Field Training
Environment (FY16–18): Improvements and long-term maintenance activities to existing training assets needed to support the missions of the Airborne and Ranger Training Brigade, 75th Rangers, and the Field Artillery units of the Infantry School and the 1-28th Infantry Battalion Task Force, as well as other tenant and/or visiting units’ training requirements. These assets include Drop Zones, Helicopter Landing Zones/Pick-up Zones, and Firing Points for Mortars and Howitzer guns, and are generally referred to as “open field training environments”. Fort Benning expects to complete an EA by summer of 2018.
3) Naval Operation Support Center (FY16–18): Construction on approximately six acres on
Main Post, south of Custer Road. The facility will consist of an administration building and a parking lot for up to 140 Navy drill Reservists and support staff.
4) Benning Technology Park and Custer Road Improvements (FY15–18): The GA
Department of Transportation is implementing road improvements project of US Route 27 (Victory Drive) and Custer Road in Muscogee County. Following completion, the project will improve the existing security checkpoint interchange system in the Sand Hill Cantonment Area by providing civilians access to a proposed commercial development off the Installation without having to pass through the Fort Benning security checkpoint. The commercial development, to be known as Benning Technology Park, borders Fort Benning directly west of the Patton Place military housing area. Benning Technology Park, a private/public joint venture between Columbus State University, Flournoy Development Company, and the Development Authority of Columbus, will include offices, retail services, and educational facilities.
5) Implementation of a 30-Megawatt (MW) Photovoltaic (PV) Solar Facility (FY15) and
Additional 15MW Capacity (FY18): In 2014, Fort Benning prepared an EA for the construction, operation, and maintenance of a 30-MW PV solar system on approximately 250
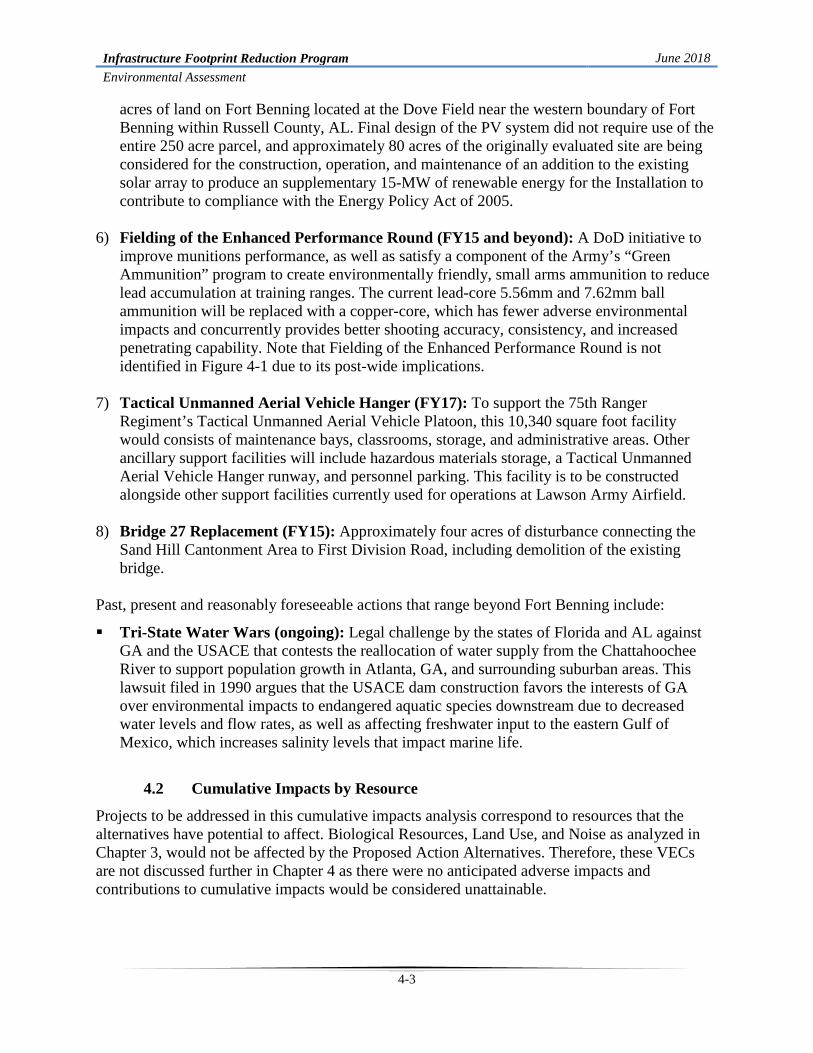
Infrastructure Footprint Reduction Program June 2018 Environmental Assessment
4-3
acres of land on Fort Benning located at the Dove Field near the western boundary of Fort Benning within Russell County, AL. Final design of the PV system did not require use of the entire 250 acre parcel, and approximately 80 acres of the originally evaluated site are being considered for the construction, operation, and maintenance of an addition to the existing solar array to produce an supplementary 15-MW of renewable energy for the Installation to contribute to compliance with the Energy Policy Act of 2005.
6) Fielding of the Enhanced Performance Round (FY15 and beyond): A DoD initiative to
improve munitions performance, as well as satisfy a component of the Army’s “Green Ammunition” program to create environmentally friendly, small arms ammunition to reduce lead accumulation at training ranges. The current lead-core 5.56mm and 7.62mm ball ammunition will be replaced with a copper-core, which has fewer adverse environmental impacts and concurrently provides better shooting accuracy, consistency, and increased penetrating capability. Note that Fielding of the Enhanced Performance Round is not identified in Figure 4-1 due to its post-wide implications.
7) Tactical Unmanned Aerial Vehicle Hanger (FY17): To support the 75th Ranger
Regiment’s Tactical Unmanned Aerial Vehicle Platoon, this 10,340 square foot facility would consists of maintenance bays, classrooms, storage, and administrative areas. Other ancillary support facilities will include hazardous materials storage, a Tactical Unmanned Aerial Vehicle Hanger runway, and personnel parking. This facility is to be constructed alongside other support facilities currently used for operations at Lawson Army Airfield.
8) Bridge 27 Replacement (FY15): Approximately four acres of disturbance connecting the Sand Hill Cantonment Area to First Division Road, including demolition of the existing bridge.
Past, present and reasonably foreseeable actions that range beyond Fort Benning include: Tri-State Water Wars (ongoing): Legal challenge by the states of Florida and AL against
GA and the USACE that contests the reallocation of water supply from the Chattahoochee River to support population growth in Atlanta, GA, and surrounding suburban areas. This lawsuit filed in 1990 argues that the USACE dam construction favors the interests of GA over environmental impacts to endangered aquatic species downstream due to decreased water levels and flow rates, as well as affecting freshwater input to the eastern Gulf of Mexico, which increases salinity levels that impact marine life.
4.2 Cumulative Impacts by Resource Projects to be addressed in this cumulative impacts analysis correspond to resources that the alternatives have potential to affect. Biological Resources, Land Use, and Noise as analyzed in Chapter 3, would not be affected by the Proposed Action Alternatives. Therefore, these VECs are not discussed further in Chapter 4 as there were no anticipated adverse impacts and contributions to cumulative impacts would be considered unattainable.

Infrastructure Footprint Reduction Program June 2018 Environmental Assessment
4-4

Infrastructure Footprint Reduction Program June 2018 Environmental Assessment
4-5
Table 3.2 provides a summary of direct and indirect environmental consequences for each Alternative as a result of the Proposed Action. As presented in the analysis below, the adverse impacts do not result in significant adverse cumulative effects when considering all other past, present, and reasonably foreseeable future construction and/or maintenance activities at Fort Benning.
4.2.1 Air Quality Present and reasonably foreseeable future cumulative projects that could affect Air Quality include each of those listed in Section 4.1.2. The addition of considerable stationary source emissions would be unlikely under any Alternative and under the Action Alternatives long-term, beneficial impacts are expected due to reduced emissions. The generation of fugitive dust due to minor earth disturbances is the primary concern when considering construction and demolition cumulative impacts to Air Quality. Accordingly, an increase of fugitive dust resulting from minor earth disturbances would be confined to small areas of the project sites and temporary; occurring only during project activities. All applicable federal and state Air Quality protection requirements would be implemented to mitigate any generation of fugitive dust due to minor earth disturbances and no significant cumulative impacts to Air Quality would be anticipated.
4.2.2 Cultural Resources Present and reasonably foreseeable actions that could adversely affect Cultural Resources include Custer Road Improvements and Tactical Unmanned Aerial Vehicle Hanger. The concern involves Fort Benning’s historic districts and is a potential cumulative effect to the viewshed within the Main Post, and Lawson Army Airfield Historic Districts (Figures 3-1 and 4-1). Under the Action Alternatives, potential demolition sites are located within the Main Post, and Lawson Army Airfield Historic Districts. The cumulative impacts, when considering all actions have the potential to affect the integrity of the historic districts; however, Fort Benning has been successful at implementing construction activities while keeping negative effects within the historic districts to a minimum (Fort Benning, 2011). The HPC would be followed, including coordination/consultation between Fort Benning, the Tribes, and the SHPO to ensure impacts to historic properties and districts are mitigated and no significant cumulative impacts to Cultural Resources occurs.
4.2.3 Hazardous Materials and Waste Present and reasonably foreseeable future cumulative projects that could adversely affect Hazardous Materials and Waste include those listed in Section 4.1.2 that will occur within the boundary of Fort Benning. Minor increases in the use, handling, and storage of Hazardous Materials and Waste are associated with construction, renovation, and demolition activities. There would be short-term, minor adverse impacts resulting from demolition and disposal activities associated with the Action Alternatives. This temporary increase in Hazardous Materials and Waste would not lead to a cumulative increase in hazardous waste generation beyond the capacity of local or regional disposal facilities, even in combination with other projects.

Infrastructure Footprint Reduction Program June 2018 Environmental Assessment
4-6
All future operations and maintenance, and construction and renovation projects would follow all applicable regulatory requirements for the use, storage, and handling of hazardous material and waste. Therefore, when considering the past, present, and reasonably foreseeable projects listed, short-term, minor cumulative effects could be anticipated due to an increase of Hazardous Materials and Waste generated.
4.2.4 Soils Cumulative projects that could adversely affect vegetation and soils include those listed in Section 4.1.2. These projects would affect Soils through disturbance, compaction, creation of impervious surfaces, and possible removal of impervious surfaces during the construction/demolition period. Under the Action Alternatives, training and other construction activities across the Installation would continue to affect Soils. Each of the buildings and structures proposed for demolition and disposal are located in previously disturbed or highly developed areas and when combined with appropriate mitigation measures would result in negligible to short-term, minor cumulative impacts to Soils. Since the Alternatives and cumulative projects listed on Fort Benning lands would be required to follow to existing Fort Benning management practices as well as applicable federal, state and local laws and regulations, including NPDES requirements that mitigate adverse impacts to Soils, only short-term, minor cumulative impacts would be anticipated.
4.2.5 Utilities
Present and reasonably foreseeable future cumulative projects that could affect Utilities include the Army 2020 Force Structure Realignment, Naval Operation Support Center, Benning Technology Park and Custer Road Improvements, Implementation of a 30MW PV Solar Facility and Additional 15MW Capacity, and Tactical Unmanned Aerial Vehicle Hanger. Although the 30MW PV Solar Facility and Additional 15MW projects would generate electricity (beneficial impact), an increase in utility demand would occur as a result the projects mentioned. Under the No Action Alternative, long-term, minor adverse impacts when considered with other projects mentioned would not result in significant cumulative impacts since privatized utility service capacities are anticipated to far handle increased demands (USACE, 2009). Furthermore, the Action Alternatives’ long-term, beneficial impacts are expected reduced Fort Benning’s total energy demands. Therefore the Action Alternatives would have no cumulative impacts on Utilities.
4.2.6 Water Resources Cumulative projects that could affect Water Resources include all the Fort Benning projects that occur within or nearby the cantonment areas. This would exclude the Artillery Firing Points Expansion and Maintenance of the Open Field Training Environment project and Tri-State Water Wars. The remaining projects have the potential to result in adverse effects on Water Resources (including water quality).

Infrastructure Footprint Reduction Program June 2018 Environmental Assessment
4-7
The Action Alternatives and cumulative projects listed would contribute to soil erosion, runoff, and surface contamination from pollutants such as hazardous materials and/or waste. Adverse impacts to water are most likely to occur during rain events on active construction/demolition sites. Proactive mitigation measures either already in place or incorporated through construction design would ensure cumulative impacts would be short-term, minor and no significant cumulative impacts to Air Quality would be anticipated.

Infrastructure Footprint Reduction Program June 2018 Environmental Assessment
5-1
5 CONCLUSIONS
The Action Alternatives would comply with Army TRADOC’s IFRP and Army directives instructing optimized facility management through footprint reduction efforts, minimize adverse environmental impacts, and facilitate the mission requirements of Fort Benning. The No Action Alternative would have no impacts to Biological Resources, Cultural Resources, Hazardous Materials and Waste, Land Use, Noise, Soils, and Water Resources. The No Action Alternative would result in long-term, minor adverse impacts to both Air Quality and Utilities as a result of continued use of existing emission sources and facilities on the FY19-23 FRP list. VECs with negligible effects under the Action Alternatives includes Biological Resources, Land Use, and Noise. Long-term, beneficial impacts would occur to Air Quality and Utilities from implementation of the Action Alternatives due to reductions in emissions and energy demands. Air Quality would also have short-term, minor adverse impacts from fugitive dust, but only during demolition activities. Other short-term, minor adverse impacts resulting from demolition activities would occur to Hazardous Materials and Waste, Soils, and Water Resources under the Action Alternatives and under Alternative 2 to Cultural Resources. The removal of historic buildings under Alternative 1 is expected to result in long-term, minor adverse impacts to Cultural Resources. As discussed in Section 4, these negligible effects to minor adverse impacts do not result in significant adverse cumulative effects when considering all other past, present, and reasonably foreseeable future activities. Adherence to Federal and State laws and regulations, as well as Installation management plans, and Army Regulations would minimize impacts of demolition and disposal activities to the VECs (i.e., Air Quality, Biological Resources, Cultural Resources, Utilities, Hazardous Materials and Waste, Land Use, Noise, Soils, and Water Resources). Implementation of either Action Alternative would have no significant impact on the quality of human life or the natural environment. Alternative 1, however, is more desirable in comparison due to its proficiency to further comply with the US Army TRADOC’s IFRP and more recent Army efforts to optimize facility management through reductions to buildings and structures. A FNSI is warranted for this Proposed Action and it does not require the preparation of an EIS.

Infrastructure Footprint Reduction Program June 2018 Environmental Assessment
6-1
6 REFERENCES
Advanced Disposal, 2018. Stone’s Throw Landfill Tallassee, AL, accessed on 10 April 2018 at http://www.advanceddisposal.com/al/tallassee/stones-throw-landfill. DOA, 2016a. Army Installations 2025. , accessed on 18 April 2018 at https://www.army.mil/e2/c/downloads/454188.pdf. July. DOA, 2016b. Installations, Energy and Environment Strategy 2025, accessed on 18 April 2018 at https://www.army.mil/e2/c/downloads/455381.pdf. October. DOD, 2016. DoD Issuance 4715.23, Integrated Recycling and Solid Waste Management. October. EPA, 2018. Asbestos: Protect Your Family, accessed on 12 May 2018 at https://www.epa.gov/asbestos/protect-your-family#whattodo. Ecks M. personal communication, 2018. Email from Michael Ecks, Cultural Resource Monitor, to Britt Horton, NEPA Analyst, Fort Benning, GA. 10 May 2018. FEMA, 2017. 100-Year Flood Zone Data. ESRI ArcGIS: ESRI, DigitalGlobe, GeoEye, Earthstar Geographics, GIS User Community, accessed 4 March 2018. Fort Benning GIS, 2018. GIS, Electronic Library. US Army Garrison, Fort Benning, GA. Fort Benning, 2018. Main Post District Area Development Plan. February. Fort Benning, 2017. Integrated Solid Waste Program. US Army Garrison, Fort Benning, GA Fort Benning, 2016. Hub and Housing Area Development Plan, Command Pre-Briefing. Fort Benning, GA. Fort Benning, 2015. Integrated Cultural Resources Management Plan. US Army, Fort Benning, GA. 4 May 2015. Fort Benning, 2014. Fort Benning Integrated Natural Resource Management Plan EA. Fort Benning, GA. Fort Benning, 2013. Fort Benning Integrated Pest Management Plan. Fort Benning, GA. Fort Benning. 2013. Fort Benning Installation Action Plan. US Army, Fort Benning, GA. Fort Benning, 2011. Environmental Assessment for the Proposed Army Lodge. September. Fort Benning, 2006. Hazardous Waste Program. US Army Infantry Homepage. Environmental

Infrastructure Footprint Reduction Program June 2018 Environmental Assessment
6-2
Management Division. Available at: https://www.benning.army.mil/Garrison/DPW/EMD/HazardousWaste.html Fort Benning, 2005a. Fort Benning Environmental Action Plan. US Army, Fort Benning, GA. Fort Benning, 2005b. Fort Benning Installation Action Plan. US Army, Fort Benning, GA. Fort Benning, 2004. Integrated Contingency Plan. US Army, Fort Benning, GA. Fort Benning, 2003. Integrated Natural Resources Management Plan. Fort Benning Army Installation. 2001–2005. US Army, Fort Benning, GA. Updated September. Fort Benning, 1998. Final Polychlorinated Biphenyl (PCB) Management Manual, Fort Benning, GA. Prepared by US Army Corps of Engineers, Savannah District. Prepared by Law Engineering and Environmental Services, Inc. July. Fort Benning, 1997. Environmental Assessment for the Infrastructure Footprint Reduction Program, Fort Benning, GA. May. Miller, S. personal communication, 2018. Email from Sherman Miller, Industrial Engineer, to Britt Horton, NEPA Analyst, Fort Benning, GA. 30 April 2018. USACE, 2009, Final Environmental Impact Statement Maneuver Center of Excellence Fort Benning, GA. Prepared for Garrison, US Army Infantry Center. June 2009. USACE, 2007. Final Environmental Impact Statement BRAC 2005 and Transformation Actions at Fort Benning, GA. October 2007. USAEC, 2007. NEPA Analysis Guidance Manual. Available at: http://aec.army.mil/usaec/nepa/nepa-agm.pdf, accessed 4 April 2014. May 2007. US Army, 2015. Draft Biological Assessment for Enhanced Training at Fort Benning, GA. 15 January 2015. Prepared for Garrison, US Army Infantry Center Fort Benning, GA. Prepared by US Army Corps of Engineers, Mobile District. US Army, 2014a. Army Directive 2014-02, Net Zero Installations Policy, January. US Army, 2014b. Supplemental Programmatic Environmental Assessment for Army 2020 Force Structure Realignment. June 2014. US Army Environmental Command. Available at: aec.army.mil/Portals/3/nepa/Army2020SPEA-FNSI.pdf. US Army, 2013. Programmatic Environmental Assessment for Army 2020 Force Structure Realignment. US Army Environmental Command. January 2013.

Infrastructure Footprint Reduction Program June 2018 Environmental Assessment
6-3
EPA, 2018. Section 404 of the Clean Water Act: How Wetlands are Defined and Identified webpage. Available at: https://www.epa.gov/cwa-404/section-404-clean-water-act-how-wetlands-are-defined-and-identified, accessed 12 March 2018. EPA, 2013. A Citizen’s Guide to Radon. Available at https://www.epa.gov/sites/production/files/2016-02/documents/2012_a_citizens_guide_to_radon.pdf, accessed 12 February 2018. USEPA, 2014. GA Nonattainment/Maintenance Status for Each County by Year all Criteria Pollutants. July 2, 2014. Available at: http://www.epa.gov/airquality/greenbook/anayo_ga.html. USEPA, 2012. Final Rule – Prevention of Significant Deterioration and Title V Operating Permit Greenhouse Gas (GHG) Tailoring Rule Step 3 and GHG Plant-wide Applicability Limits Fact Sheet.

Infrastructure Footprint Reduction Program June 2018 Environmental Assessment
7-1
7 ACRONYMS AND ABBREVIATIONS
AAP Army Alternate Procedures
ACUB Army Compatible Use Buffer
ACM Asbestos-containing Materials
ACUB Army Compatible Use Buffer
ADP Area Development Plan
AL Alabama
AR Army Regulation
ARC Army Reconnaissance Course
Army U.S. Department of the Army
ASTM American Society for Testing and Materials
BMP Best Management Practice
BRAC Base Realignment and Closure
CAA Clean Air Act
CEQ Council on Environmental Quality
CFR Code of Federal Regulations
CO Carbon Monoxide
CO₂e Carbon Dioxide Equivalent
CWA Clean Water Act
DoD Department of Defense
DODI Department of Defense Instruction
DPW Directorate of Public Works
EA Environmental Assessment

Infrastructure Footprint Reduction Program June 2018 Environmental Assessment
7-2
EAP Environmental Action Plan
EIS Environmental Impact Statement
EMD Environmental Management Division
EO Executive Order
EPA U.S. Environmental Protection Agency
ESA Endangered Species Act
FEMA Federal Emergency Management Agency
FIFRA Federal Insecticide, Fungicide, and Rodenticide Act
FNSI Finding of No Significant Impact
FRP Facility Reduction Program
FY Fiscal Year
GA Georgia
GHG Greenhouse Gas
HABS Historic American Building Survey
HPC Historical Properties Component
HVAC Heating, ventilation, and air conditioning
IAP Installation Action Plan
ICRMP Integrated Cultural Resources Management Plan
IFRP Infrastructure Footprint Reduction Program
INRMP Integrated Natural Resources Management Plan
LBP Lead-based Paint
LUPZ Land Use Planning Zone
MCoE Maneuver Center of Excellence

Infrastructure Footprint Reduction Program June 2018 Environmental Assessment
7-3
MMBtu/Hr Million British thermal units per hour
MRF Material Recycling Facility
MW Megawatt
NAAQS National Ambient Air Quality Standards
NAGPRA Native American Graves and Protection and Repatriation Act
NEPA National Environmental Policy Act
NHPA National Historic Preservation Act
NO₂ Nitrogen Dioxide
NOI Notice of Intent
NPDES National Pollutant Discharge Elimination System
NRHP National Register of Historic Places
O₃ Ozone
Pb Lead
PCB polychlorinated biphenyl
PM₂․₅ Particulate Matter with a Diameter Less Than or Equal to 2.5 Micrometers
PM₁₀ Particulate Matter with a Diameter Less Than or Equal to 10 Micrometers
POL Petroleum, oil, and lubricants
PSD Prevention of Significant Deterioration
PV Photovoltaic
RCRA Resource Conservation and Recovery Act
RCW Red-cockaded Woodpecker
ROI Region of Influence
SHPO State Historic Preservation Office

Infrastructure Footprint Reduction Program June 2018 Environmental Assessment
7-4
SO₂ Sulfur Dioxide
SOP Standard Operating Procedures
SWMU Solid Waste Management Unit
TCE Trichloroethylene
TRADOC Army Training and Doctrine Command
TSCA Toxic Substances Control Act
USC US Code
UEA Unique Ecological Area
US United States
USACE US Army Corps of Engineers
USAEC US Army Environmental Command
USFWS US Fish and Wildlife Service
VEC Valued Environmental Component

Infrastructure Footprint Reduction Program June 2018 Environmental Assessment
8-1
8 LIST OF PREPARERS
Name Title Organization
John E. Brown NEPA Program Manager Environmental Management Division, Fort Benning, GA
Tracy J. Ferring NEPA Environmental Planner
Environmental Management Division, Fort Benning, GA
Theresa Hamilton Solid Waste Program Manager
Environmental Management Division, Fort Benning, GA
Britt Horton NEPA Analyst Environmental Management Division, Fort Benning, GA
Edward Howard Historic Preservation Specialist,
Environmental Management Division, Fort Benning, GA
Bonnie McPherson Air/Noise Program Manager Environmental Management Division, Fort Benning, GA
Sherman Miller Project Manager Master Planning Division, Fort Benning, GA
Susanne Perry Architectural Historian Environmental Management Division, Fort Benning, GA
Ted Roever Asbestos/Pb/PCB Program Manager
Environmental Management Division, Fort Benning, GA
Linda Veenstra Environmental Attorney
Administrative and Civil Law Division, Office of the Staff Judge Advocate, Fort Benning, GA
Ted Williams Hazardous Waste/UST Program Manager
Environmental Management Division, Fort Benning, GA

Infrastructure Footprint Reduction Program June 2018 Environmental Assessment
9-1
9 DISTRIBUTON LIST
Elected and Appointed Government Officials Mayor's Office 100 10th Street, 6th Floor Government Center Tower Columbus, GA 31901
Cusseta-Chattahoochee County Government Manager P.O. Box 299 Cusseta, GA 31805-0299
Mayor's Office City Hall 601 12th Street Phenix City, AL 36867
Harris County County Manager P.O. Box 365 Hamilton, GA 31811
Talbot County Board of Commissioners P.O. Box 155 Talbotton, GA 31827
Webster County County Commissioner 6622 Cass Street Preston, GA 31824
Stewart County County Commissioner P.O. Box 157 Lumpkin, GA 31815-0157
Marion County County Commissioner P.O. Box 481 Buena Vista, GA 31803
Russell County Commission 1000 Broad Street Phenix City, AL 36867
Senator Johnny Isakson 131 Russell Senate Office Building Washington, DC 20510
Senator David Perdue 383 Russell Senate Office Building Washington, DC 20510
Rep. Sanford Bishop, Jr. 2407 Rayburn HOB Washington, DC 20515
Rep. Mike Rogers 324 Cannon HOB Washington, DC 20515
Office of the Governor 206 Washington Street 111 State Capitol Atlanta, GA 30334
Office of the Governor 600 Dexter Avenue Montgomery, AL 36130

Infrastructure Footprint Reduction Program June 2018 Environmental Assessment
9-2
Local and Regional Administrators, Federal Agencies, or Commissions with Regulatory Interest in Fort Benning U.S. Fish & Wildlife Service West Georgia Office P.O. Box 52560 Fort Benning, GA 31905
GSWCC, Region 5 4310 Lexington Rd Dawson, GA 39842
GA DNR, EPD Director’s Office 2 Martin Luther King Jr. Dr SE, Suite 1456, East Tower Atlanta, GA 30334
GA DNR Commissioner’s Office 2 Martin Luther King Jr. Dr, SE, Suite 1252, East Tower Atlanta, GA 30334
ADEM Office of the Director P.O. Box 301463 Montgomery, AL 36130
USDA NRCS State Office Water Resources 355 East Hancock Ave, Suite 13 Athens, GA 30601
USEPA Region IV Regional Administrator 61 Forsyth St SW Atlanta, GA 30303
The Georgia Conservancy 817 West Peachtree St, Suite 200 Atlanta, GA 30308
National Wildlife Federation Southeast Regional Center 730 Peachtree St NE, Suite 1000 Atlanta, GA 30308
The Nature Conservancy Chattahoochee Fall Line Office P.O. Box 52452 Columbus, GA 31905
Defenders of Wildlife National HQ 1130 17th St NW Washington, DC 20036
Southern Environmental Law Ctr. Director 127 Peachtree St, Suite 605 Atlanta, GA 30303
The Valley Partnership P.O. Box 1200 Columbus, GA 31902
Chamber of Commerce Phenix City-Russell County 1107 Broad St Phenix City, AL 36867
Georgia Wildlife Federation 11600 Hazelbrand Rd, NE Covington, GA 30014
Columbus Chamber of Commerce 1200 6th Ave Columbus, GA 31902
Federally Recognized Tribes that Consult with Fort Benning Mr. Bryant J. Celestine Tribal Historic Preservation Officer Alabama-Coushatta Tribe of Texas 571 State Park Rd 56 Livingston, TX 77351
Ms. Samantha Robinson Tribal Historic Preservation Officer Alabama-Quassarte Tribal Town P.O. Box 187 Wetumka, OK 74883
Ms. Karen Brunso Tribal Historic Preservation Officer Chickasaw Nation P.O. Box 1548 Ada, OK 74820

Infrastructure Footprint Reduction Program June 2018 Environmental Assessment
9-3
Mr. David Cook Tribal Historic Preservation Officer Kialegee Tribal Town P.O. Box 332 Wetumka, OK 74883
Mr. Kenneth H. Carleton Tribal Historic Preservation Officer Mississippi Band of Choctaw Indians P.O. Box 6010 Choctaw, MS 39350
Ms. Corain Lowe-Zepeda Tribal Historic Preservation Officer Muscogee (Creek) Nation P.O. Box 580 Okmulgee, OK 74447
Ms. Carolyn White Acting Tribal Historic Preservation Officer Poarch Band of Creek Indians 5811 Jack Springs Rd Atmore, AL 36502
Mr. Ted Isham Tribal Historic Preservation Officer Seminole Nation of Oklahoma P.O. Box 1498 Wewoka, OK 74884
Dr. Paul N. Backhouse Tribal Historic Preservation Officer Seminole Tribe of Florida 30290 Josie Billie Hwy, PMB 1004 Clewiston, FL 33440
Mr. Terry Clouthier Tribal Historic Preservation Officer Thlopthlocco Tribal Town P.O. Box 188 Okemah, OK 74859
Ms. Elizabeth Toombs Tribal Historic Preservation Officer Cherokee Nation P.O. Box 948 Tahlequah, OK 74464
Mr. Russell Townsend Tribal Historic Preservation Officer Eastern Band of the Cherokee Nation P.O. Box 455 Cherokee, NC 28719
Ms. Sheila Bird Tribal Historic Preservation Officer United Keetoowah Band of Cherokee Indians P.O. Box 746 Tahlequah, OK 74465
Fort Benning and Other Army Officials IMCOM Attn: Public Affairs Office 2405 Gun Shed Rd Ft Sam Houston, TX 78234
HQ US Army FORSCOM Attn: Public Affairs Building 8-1808 4700 Knox St Fort Bragg, NC 28310
HQ US Army TRADOC Attn: Ken Kimidy 661 Sheppard Pl Fort Eustis, VA 23604
Office of the Staff Judge Advocate 6450 Way St, Building 2839 Fort Benning, GA 31905
MCoE Commanding General 1 Karker St McGinnis-Wickam Hall, Suite 6300 Fort Benning, GA 31905
Garrison Commander 1 Karker St McGinnis-Wickam Hall, Suite 5900 Fort Benning, GA 31905
Infantry School Commandant 1 Karker St McGinnis-Wickam Hall, Suite 6301 Fort Benning, GA 31905
Armor School Commandant 1 Karker St McGinnis-Wickam Hall, Suite 6000 Fort Benning, GA 31905

Infrastructure Footprint Reduction Program June 2018 Environmental Assessment
9-4
Local Media and Libraries
Columbus Ledger-Enquirer 945 Broadway, Suite 102 Columbus, GA 31901
The Journal 71 Webb Lane Buena Vista, GA 31803
Benning News Fort Benning Public Affairs Office 1 Karker Street, McGinnis-Wickam Hall, Suite W-141 Fort Benning, GA 31905
Columbus Public Library 3000 Macon Rd Columbus, GA 31906
Phenix City-Russell County Library 1501 17th Ave Phenix City, AL 36867
Family and Morale Welfare and Recreation Library 7611 Sightseeing Rd, Building 2784 Fort Benning, GA 31905
Cusseta-Chattahoochee Public Library 262 Broad St Cusseta, GA 31805


Infrastructure Footprint Reduction Program June 2018 Environmental Assessment
Appendix A
APPENDIX A
FORT BENNING FACILITIES REDUCTION PROGRAM DEMOLITION LIST

65 1930 REQUIRED GEN PURP ADMIN 3610 Wold Ave 201977 1934 REQUIRED HEAT PL BLDG 998 Gillespie St 201992 1939 REQUIRED DET FIRE ST SPT 853 Vibbert Ave 2019
100 1941 NA COLD STR INST 32891 Upton Ave 2019221 1934 COMPLETED VEH STOR INST 12205 Wold Ave 2019222 1934 COMPLETED VEH STOR INST 7625 Wold Ave 2019229 1923 NA PVT/ORG CLUB 19793 Ingersoll St 2019233 1923 REQUIRED STORAGE GP INST 3840 Upton Ave 2019235 1921 NA ADMIN GEN PURP 4390 Gillespie St 2019239 1923 REQUIRED FAM LIFE CTR 2817 Wold Ave 2019249 1940 COMPLETED VEH STG INST 2750 Bill St 2019267 1935 COMPLETED VETERINARY FACILITY 1175 10th Div Ct 2019281 1991 NA STORAGE GP INST 192 Towne St 2019305 1929 Draft RECREATION CTR 4083 Ingersoll St 2019319 1941 REQUIRED STORAGE GP INST 919 Bradshaw Rd 2019328 1949 REQUIRED GEN PURP ADMIN 7495 Ingersoll St 2019330 1935 REQUIRED ENG/HOUSING MNT 2000 10th Div Rd 2019357 1935 NA PWR PLT BLDG 480 Ingersoll St 2019381 1926 REQUIRED HEAT PL BLDG 704 Ingersoll St 2019491 1976 NA ENG/HOUSING MNT 3720 Anderson St 2019960 1957 NA CO HQ BLDG 11110 Michael St 2019961 1957 NA ENLIST UPH, WTU 11110 Michael St 2019966 1957 NA ENLIST UPH, WTU 11110 Dixie Rd 2019973 1953 NA UOQ MILITARY 14240 Lincoln St 2019976 1953 NA UOQ MILITARY 13879 Lincoln St 2019977 1992 NA REF/A-C BLDG 784 Lincoln St 2019
1045 1958 COMPLETED DEPENDENT SCHOOL SF First Div Rd 20191049 1966 COMPLETED MNT SHP, GEN PURP 2198 First Div Rd 20191367 1967 NA PRINT PLANT BLDG 5519 Compton St 20191369 1967 NA GEN INST BLDG 5519 Compton St 2019
Building Description Square FeetProposed
Demolition FYLocation
Fort Benning Facilities Reduction Program List
Building No.Year
ConstructedHABS/HAER

1695 1974 NA DISPATCH BLDG 2400 Marchant St 20191705 1967 NA MNT STORAGE DOL 215 10th Div Ct 20191720 1967 NA STR SHED GP INS 2068 10th Div Ct 20201721 1967 NA STR SHED GP INS 1904 10th Div Ct 20201722 2006 NA STR SHED GP INS 1680 Gillespie St 20201725 1956 NA OIL STR BLD DOL 246 10th Div Ct 20201792 1942 NA STORAGE GP INST 10200 Upton Ave 20191835 2004 NA STORAGE GP INST 192 Mitchell Ave 20191836 1938 REQUIRED GEN PURP ADMIN 2998 Mitchell Ave 20192291 1985 NA GAS CHAMBER 1152 Alekno St 20192294 1967 NA ORG CLASSROOM 5614 Alekno St 2019
2296 1979 NA SEP TOIL/SHOWER 468Indianhead &
Alekno Rd 20192394 2005 NA BN HQ BLDG 8119 Goltra Ct 20192486 1964 NA AC MAINT HANGAR 25817 Jacelin St 20192580 1963 NA ORG STR BLDG 1943 Indianhead Rd 20192593 1941 NA ABN EQ/PARA REP 13644 Indianhead Rd 20192665 1951 NA GEN PURP ADMIN 2244 Custer Rd 20202666 1951 NA ORG STR BLDG 2886 Custer Rd 20202667 1951 NA GEN PURP ADMIN 8421 Custer Rd 20202668 1951 NA GEN PURP ADMIN 3824 Custer Rd 20202669 1951 NA GEN PURP ADMIN 5757 Custer Rd 20202670 1951 NA GEN PURP ADMIN 5844 Custer Rd 20202680 1947 NA ORG STR BLDG 302 Benning Blvd 20202746 1977 NA REF/A-C BLDG 2660 Benjamin St 20192759 1954 NA BN HQ BLDG 2578 Sightseeing Rd 20202767 1958 NA ORG CLASSROOM 3555 Riordon St 20202768 1958 NA BN HQ BLDG 3555 Burr St 20202769 1958 NA ORG CLASSROOM 3555 Burr St 20202773 1954 NA DISPATCH BLDG 192 Lavoie Ave 20192774 1954 NA FUEL/POL BLDG 192 Lavoie Ave 20192775 1954 NA VEH MAINT SHOP 5038 Indianhead Rd 2019
Building DescriptionHABS/HAERBuilding No.Year
ConstructedProposed
Demolition FYSquare Feet Location
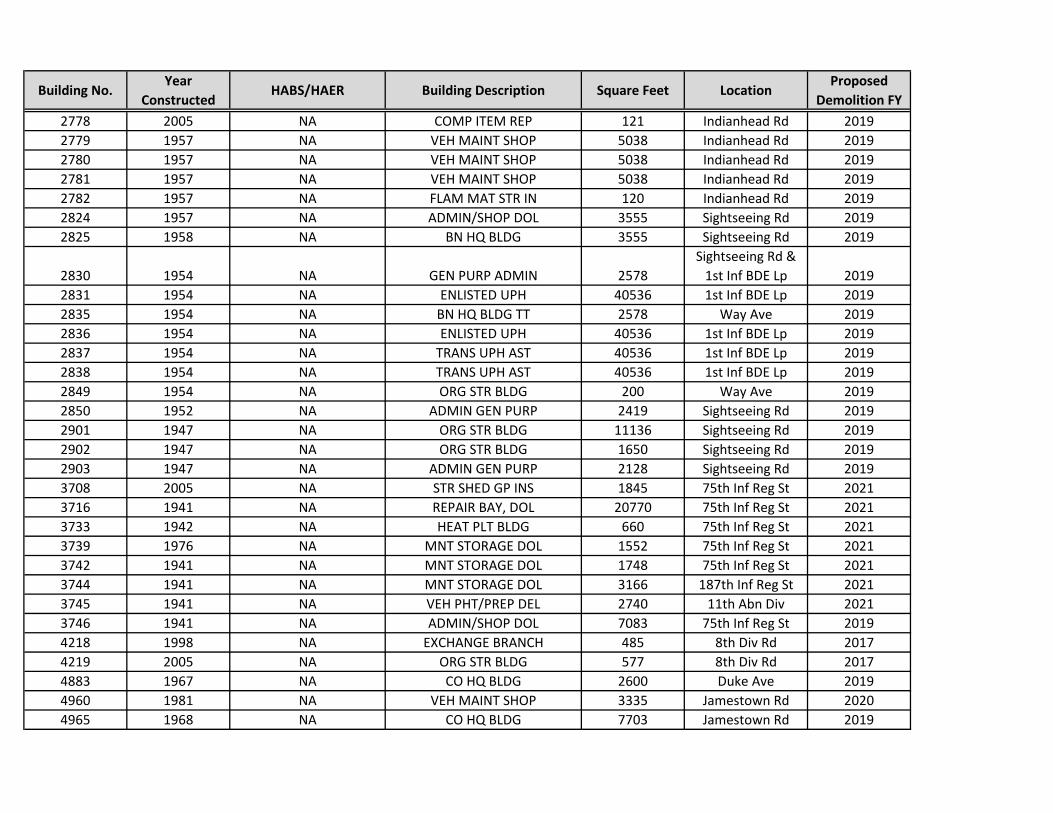
2778 2005 NA COMP ITEM REP 121 Indianhead Rd 20192779 1957 NA VEH MAINT SHOP 5038 Indianhead Rd 20192780 1957 NA VEH MAINT SHOP 5038 Indianhead Rd 20192781 1957 NA VEH MAINT SHOP 5038 Indianhead Rd 20192782 1957 NA FLAM MAT STR IN 120 Indianhead Rd 20192824 1957 NA ADMIN/SHOP DOL 3555 Sightseeing Rd 20192825 1958 NA BN HQ BLDG 3555 Sightseeing Rd 2019
2830 1954 NA GEN PURP ADMIN 2578Sightseeing Rd &
1st Inf BDE Lp 20192831 1954 NA ENLISTED UPH 40536 1st Inf BDE Lp 20192835 1954 NA BN HQ BLDG TT 2578 Way Ave 20192836 1954 NA ENLISTED UPH 40536 1st Inf BDE Lp 20192837 1954 NA TRANS UPH AST 40536 1st Inf BDE Lp 20192838 1954 NA TRANS UPH AST 40536 1st Inf BDE Lp 20192849 1954 NA ORG STR BLDG 200 Way Ave 20192850 1952 NA ADMIN GEN PURP 2419 Sightseeing Rd 20192901 1947 NA ORG STR BLDG 11136 Sightseeing Rd 20192902 1947 NA ORG STR BLDG 1650 Sightseeing Rd 20192903 1947 NA ADMIN GEN PURP 2128 Sightseeing Rd 20193708 2005 NA STR SHED GP INS 1845 75th Inf Reg St 20213716 1941 NA REPAIR BAY, DOL 20770 75th Inf Reg St 20213733 1942 NA HEAT PLT BLDG 660 75th Inf Reg St 20213739 1976 NA MNT STORAGE DOL 1552 75th Inf Reg St 20213742 1941 NA MNT STORAGE DOL 1748 75th Inf Reg St 20213744 1941 NA MNT STORAGE DOL 3166 187th Inf Reg St 20213745 1941 NA VEH PHT/PREP DEL 2740 11th Abn Div 20213746 1941 NA ADMIN/SHOP DOL 7083 75th Inf Reg St 20194218 1998 NA EXCHANGE BRANCH 485 8th Div Rd 20174219 2005 NA ORG STR BLDG 577 8th Div Rd 20174883 1967 NA CO HQ BLDG 2600 Duke Ave 20194960 1981 NA VEH MAINT SHOP 3335 Jamestown Rd 20204965 1968 NA CO HQ BLDG 7703 Jamestown Rd 2019
Building Description Square Feet LocationProposed
Demolition FYYear
ConstructedHABS/HAERBuilding No.

4977 1967 NA VEH MAINT SHOP 192 Crosbie Rd 20194978 2004 NA HAZ MAT STR INS 630 Crosbie Rd 20194979 1967 NA VEH MAINT SHOP 400 Crosbie Rd 20195500 1988 NA VEH MAINT INST 93559 Bradley Dr 20195879 1972 NA STR SHED GP INS 7488 Rykus Ave 20195967 1943 NA IGLOO STR INST 2421 1st Div Rd 20195968 1943 NA IGLOO STR INST 1813 1st Div Rd 20195969 1943 NA IGLOO STR INST 1813 1st Div Rd 20195971 1943 NA IGLOO STR INST 1813 1st Div Rd 20195974 1945 NA IGLOO STR INST 400 1st Div Rd 20205975 1945 NA IGLOO STR INST 400 1st Div Rd 20205976 1945 NA IGLOO STR INST 400 1st Div Rd 20205977 1945 NA IGLOO STR INST 400 1st Div Rd 20205993 1967 NA STORAGE GP INST 960 1st Div Rd- 20198552 2008 NA RNG OPNS BLDG 108 Hourglass Rd 20218593 1976 NA RANGE OPNS BLDG 800 Jamestown Rd 20198718 1980 NA SEP TOIL/SHOWER 192 Steam Mill Rd 2021
8730 1979 NA RANGE OPNS BLDG 8002nd Armored Div
Rd 20218780 1965 NA RANGE OPNS BLDG 1007 Orion Rd 20218782 1965 NA RANGE OPNS BLDG 1007 Orion Rd 20218787 1969 NA RANGE OPNS BLDG 1007 Orion Rd 20219003 1957 NA BN HQ BLDG 2578 Watkins Ave 20199030 1957 NA DISPATCH BLDG 192 Marne Rd 20199031 1957 NA FUEL/POL BLDG 192 Marne Rd 20199032 1959 NA VEH MAINT SHOP 5038 Marne Rd 20199033 1959 NA VEH MAINT SHOP 5038 Marne Rd 20199034 1957 NA VEH MAINT SHOP 5038 Marne Rd 20199035 1957 NA VEH MAINT SHOP 5038 Marne Rd 20199037 1957 NA OIL STR BLDG 120 Marne Rd 20199038 1959 NA OIL STR BLDG 120 Marne Rd 20199042 1964 NA DISPATCH BLDG 192 Marne Rd 2019
Square Feet LocationProposed
Demolition FYBuilding No.
Year Constructed
HABS/HAER Building Description

9064 1975 NA AUTO SKILL CTR 16556 Marne Rd 20209105 1976 NA ADMIN/SHOP CONT 3691 Ivy Rd 20199200 1939 NA MED CTR/HOSP 393077 Marne Rd 20199201 1958 NA REF/A-C BLDG 1721 Ireland Rd 20199202 1958 NA HEAT PLT BLDG 6590 Ireland Rd 20199208 2004 NA ADMIN GEN PURP 2442 Marne Rd 20199211 2005 NA ADMIN GEN PURP 8856 Bass Rd 20199223 1967 NA FLAM MAT STR IN 336 Bass Rd 2020
M6362 2010 NA STR SHED GP INS 1000 Spangler Plaza 2020M6644 2007 NA MISC SHED 113 Spangler Plaza 2020M6647 1976 NA STR SHED GP INS 2000 10th Div Rd 2019M6705 1977 NA COOLING TOWER 867 Benjamin St 2019M7085 2008 NA OVERHEAD GAS PUMP 1015 1st Div Rd 2019M9313 1957 NA GREASE RACK NA Marne Rd 2019M9314 1957 NA GREASE RACK NA Marne Rd 2019M9741 2010 NA UNDG STG TANK WASTE POL 2500 Marne Rd 2020M9742 2010 NA COVERED STG AREA 1050 Marne Rd 2020M9749 2014 NA WASH PLAT ORG NA Buena Vista Rd 2020P8044 c.1993 NA BATTLE LAB 800 1st Div Rd 2019M6172 1967 NA CONFIDENCE CSE NA Way Ave 2019PUMPS c.1993 NA GAS PUMPS NA Lovoie Ave 2019
SIREN 1978 NA SIREN NA8th Div &
Jamestown Rd 2019
LocationProposed
Demolition FYBuilding No.
Year Constructed
HABS/HAER Building Description Square Feet

Infrastructure Footprint Reduction Program June 2018 Environmental Assessment
Appendix B
APPENDIX B
FORT BENNING FACILITIES REDUCTION PROGRAM ECONOMIC ANALYSIS

Date Generated:
Time Generated:
Version:
12 June 2018
16.38.21
Building 65 Disposal
Economic Analysis
2018
Project Title
:
Type of Analysis
Discount Rate
Period of Analysis
Start Year
Base Year
Dollar Analysis
:
:
:
:
:
:
Facilities Reduction Program
Mission Requirement - Full
2.5%
2018
20 years
Current Dollars
Project Objective :
Executive Summary Report
To determine the most economical course of action for
Building 65
that meets the EXORD requirement to reduce excess square
footage.
Building 65 has been identified as a facility for disposal per HQDA EXORD 164-15.
HQDA EXORD 164-15, "Reduce the Installation Facility Footprint," published March 2015,holds commanders and planners accountable for making all reasonable efforts to maximizespace utilization, consolidate units into our best facilities, and dispose of excess assets.Although the Reduce the Footprint (RtF) acronym has taken hold, the EXORD is really aboutthe efficient management of our real property assets. Significant cost reductions can only beachieved with transformational changes that enable us to reduce our expenditures on facilitiesand services.
Background:
ECONPACK 4.0.32
Alternatives Considered for this Analysis:
Demolition - This alternative will demolish the building and restore the site
to a grassed area. This
alternative meets the requirements of the Executive Order Number 164-15 to
dispose of
excess facilities. Demolition cost is estimated to be $10/sf – 3,610*10 =
$36,100. This is a viable alternative. This is a viable alternative.
Renovation/Conversion - Conversion/Alternate Use - This alternative renovates
the facility for use for another
Category Code. The best option for conversion of building, based on its current
configuration, is to use it for something in the Category Code Group 214. To
be made practical, this building would require total renovation to include
repairing or replacing roofing, flooring, plumbing, electrical, communications,
and other systems. Estimated cost is $55/sf or 3,610*55 = $198,550. However,
there currently is an excess of space in most of these category codes and
converting into this category would violate the intent of the Exord. This is a
viable alternative This is a viable alternative.
Other DOD or Federal Agency - This alternative offers the building to another
DOD or federal agency. The agency would be responsible for the
renovation/conversion of the facility. Cost would be the same as the
renovation/conversion alternative - $55*3,610 = $198,550. Due to the location,
lack of parking, and the cost and time required for renovation, it’s unlikely
that another agency would select it. This alternative is viable. This is a
viable alternative.
1

Caretaker Status - This alternative maintains the facility in its current
condition to be used later in its
current category code or after conversion into a different category code. A
facility in
caretaker status is maintained to the point of preventing problems from
developing or to
keep existing problems from worsening. The cost is based on an annual, per
square foot expense of $0.33 or $0.33*3,610 = $1191/yr. This would be a
reoccurring annual expense until the facility is put back into use. With this
alternative, renovation/repair would still be required prior to re-use and
mostly likely at a much higher cost.
This is a viable alternative.
Email Address
706-545-3229Phone Number
Master Planning Division, DPW
Organization
Dean MillerAction Officer :
:
:
:
Economic Indicators:
Alternative NPV
Demolition $ 35,657
Renovation/Conversion $ 196,114
Other DOD or Federal Agency $ 196,114
Caretaker Status $ 145,367
1. This building cannot be used in its current state due to its condition.2. Renovation and/or conversion is necessary for the building to be reutilized in anotherCategory Code.
Assumptions of the Analysis:
Results and Recommendations:
Based on the results of this analysis, the most economical alternative that meets theintent of Exord 164-15 is demolition. Fort Benning does not have a need for the facilityin its current design use category code. Conversion to another category code for FortBenning use is undesired due to its size, layout, location and lack of interested units.No other Federal Agency has expressed interest in using the building, either in itscurrent configuration or converted into another category code. Therefore, demolition ofBuilding 65 is the most economical alternative for the Army.
2

Economic Analysis Graph
Net Present Value
Year
Dollars
3

Life Cycle Cost Report
DemolitionAlternative:
Year Demolition Total
Annual
Outlays
Middle
of Year
Discount
Factors
Present
Value
Cumulative
Net Present
Value
$35,6572018 $35,657$36,100$36,100 0.988
$35,6572019 $0$0$0 0.964
$35,6572020 $0$0$0 0.94
$35,6572021 $0$0$0 0.917
$35,6572022 $0$0$0 0.895
$35,6572023 $0$0$0 0.873
$35,6572024 $0$0$0 0.852
$35,6572025 $0$0$0 0.831
$35,6572026 $0$0$0 0.811
$35,6572027 $0$0$0 0.791
$35,6572028 $0$0$0 0.772
$35,6572029 $0$0$0 0.753
$35,6572030 $0$0$0 0.734
$35,6572031 $0$0$0 0.717
$35,6572032 $0$0$0 0.699
$35,6572033 $0$0$0 0.682
$35,6572034 $0$0$0 0.665
$35,6572035 $0$0$0 0.649
$35,6572036 $0$0$0 0.633
$35,6572037 $0$0$0 0.618
%NPV 100.00%
Discounting
Convention
Inflation
Schedule
Category /
Residual
Schedule
$35,657
M-O-Y
No Inflation
Non-Recurring
Costs
Discount Rate: 2.5%
Period of Analysis: 20 years
4
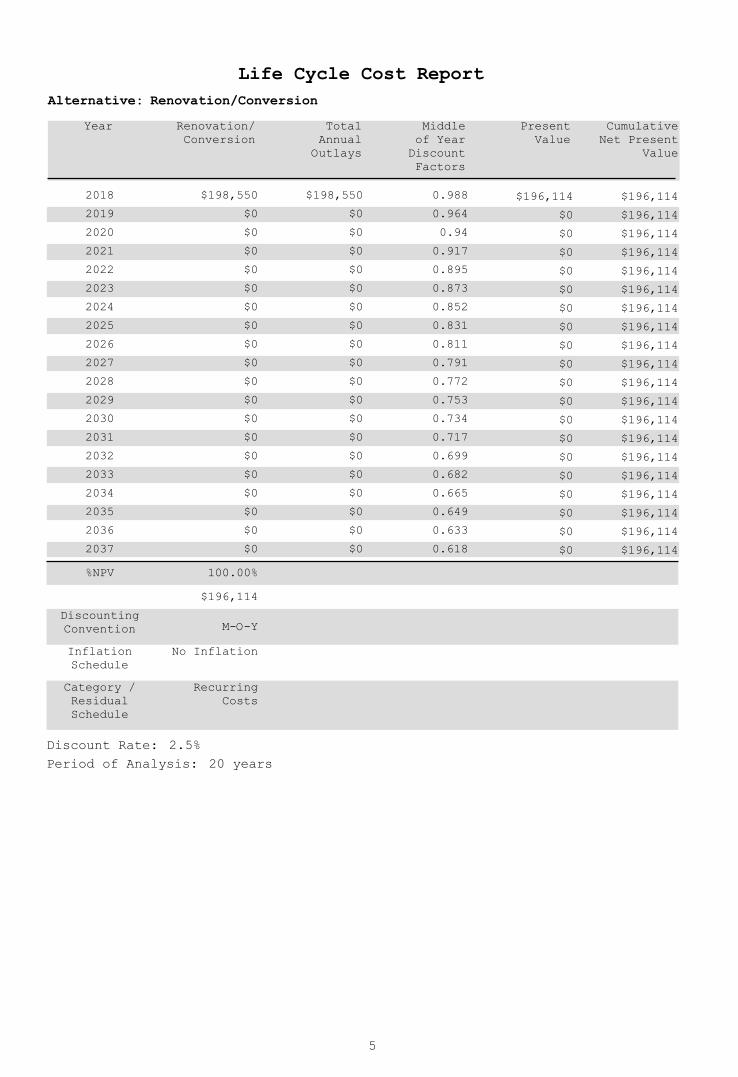
Life Cycle Cost Report
Renovation/ConversionAlternative:
Year Renovation/
Conversion
Total
Annual
Outlays
Middle
of Year
Discount
Factors
Present
Value
Cumulative
Net Present
Value
$196,1142018 $196,114$198,550$198,550 0.988
$196,1142019 $0$0$0 0.964
$196,1142020 $0$0$0 0.94
$196,1142021 $0$0$0 0.917
$196,1142022 $0$0$0 0.895
$196,1142023 $0$0$0 0.873
$196,1142024 $0$0$0 0.852
$196,1142025 $0$0$0 0.831
$196,1142026 $0$0$0 0.811
$196,1142027 $0$0$0 0.791
$196,1142028 $0$0$0 0.772
$196,1142029 $0$0$0 0.753
$196,1142030 $0$0$0 0.734
$196,1142031 $0$0$0 0.717
$196,1142032 $0$0$0 0.699
$196,1142033 $0$0$0 0.682
$196,1142034 $0$0$0 0.665
$196,1142035 $0$0$0 0.649
$196,1142036 $0$0$0 0.633
$196,1142037 $0$0$0 0.618
%NPV 100.00%
Discounting
Convention
Inflation
Schedule
Category /
Residual
Schedule
$196,114
M-O-Y
No Inflation
Recurring
Costs
Discount Rate: 2.5%
Period of Analysis: 20 years
5

Life Cycle Cost Report
Other DOD or Federal AgencyAlternative:
Year Other DOD or
Agency
Total
Annual
Outlays
Middle
of Year
Discount
Factors
Present
Value
Cumulative
Net Present
Value
$196,1142018 $196,114$198,550$198,550 0.988
$196,1142019 $0$0$0 0.964
$196,1142020 $0$0$0 0.94
$196,1142021 $0$0$0 0.917
$196,1142022 $0$0$0 0.895
$196,1142023 $0$0$0 0.873
$196,1142024 $0$0$0 0.852
$196,1142025 $0$0$0 0.831
$196,1142026 $0$0$0 0.811
$196,1142027 $0$0$0 0.791
$196,1142028 $0$0$0 0.772
$196,1142029 $0$0$0 0.753
$196,1142030 $0$0$0 0.734
$196,1142031 $0$0$0 0.717
$196,1142032 $0$0$0 0.699
$196,1142033 $0$0$0 0.682
$196,1142034 $0$0$0 0.665
$196,1142035 $0$0$0 0.649
$196,1142036 $0$0$0 0.633
$196,1142037 $0$0$0 0.618
%NPV 100.00%
Discounting
Convention
Inflation
Schedule
Category /
Residual
Schedule
$196,114
M-O-Y
No Inflation
Non-Recurring
Costs
Discount Rate: 2.5%
Period of Analysis: 20 years
6

Life Cycle Cost Report
Caretaker StatusAlternative:
Year Caretaker
Status
Renovation/Con
version
Total
Annual
Outlays
Middle
of Year
Discount
Factors
Present
Value
$1,1882018 0.988$0$1,203 $1,203
$1,1822019 0.964$0$1,227 $1,227
$1,1772020 0.94$0$1,251 $1,251
$1,1712021 0.917$0$1,276 $1,276
$1,1652022 0.895$0$1,302 $1,302
$1,1592023 0.873$0$1,328 $1,328
$1,1542024 0.852$0$1,355 $1,355
$1,1482025 0.831$0$1,382 $1,382
$1,1432026 0.811$0$1,409 $1,409
$1,1372027 0.791$0$1,438 $1,438
$1,1312028 0.772$0$1,466 $1,466
$1,1262029 0.753$0$1,496 $1,496
$1,1202030 0.734$0$1,526 $1,526
$1,1152031 0.717$0$1,556 $1,556
$1,1092032 0.699$0$1,587 $1,587
$1,1042033 0.682$0$1,619 $1,619
$1,0992034 0.665$0$1,651 $1,651
$1,0932035 0.649$0$1,684 $1,684
$1,0882036 0.633$0$1,718 $1,718
$123,7572037 0.618$198,550$1,752 $200,302
%NPV 15.61% 84.39%
Discounting
Convention
Inflation
Schedule
Category /
Residual
Schedule
$22,692
M-O-Y
2017 General
Recurring
Costs
$122,675
M-O-Y
No Inflation
Recurring
Costs
7
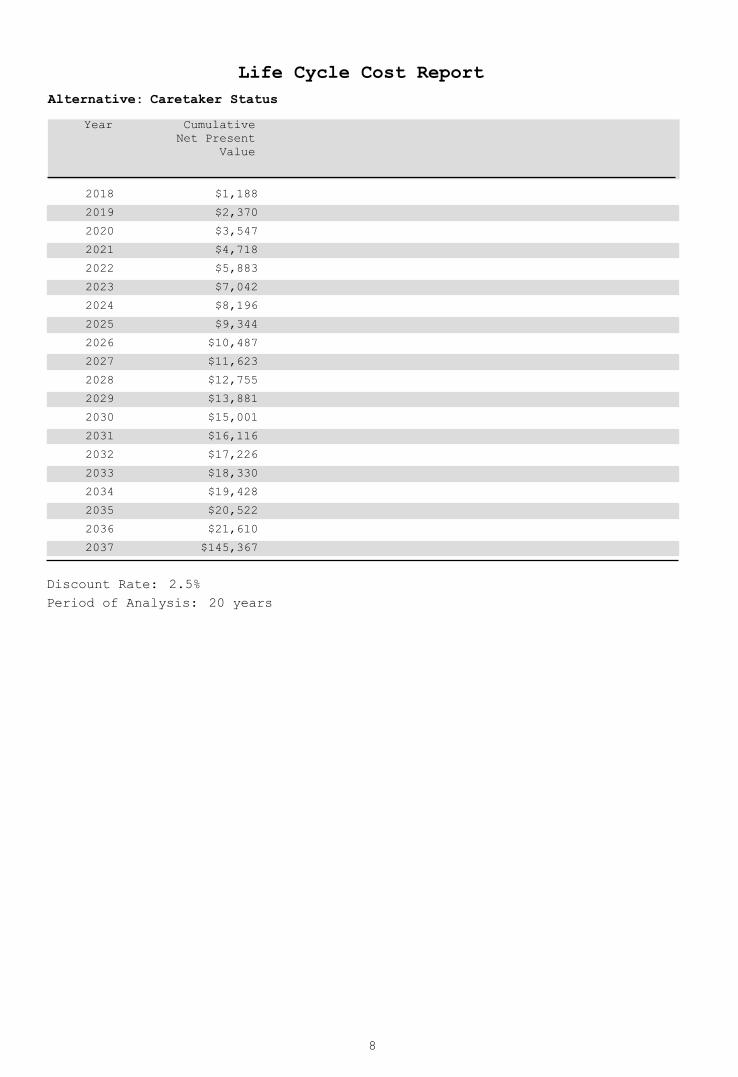
Life Cycle Cost Report
Caretaker StatusAlternative:
Year Cumulative
Net Present
Value
2018 $1,188
2019 $2,370
2020 $3,547
2021 $4,718
2022 $5,883
2023 $7,042
2024 $8,196
2025 $9,344
2026 $10,487
2027 $11,623
2028 $12,755
2029 $13,881
2030 $15,001
2031 $16,116
2032 $17,226
2033 $18,330
2034 $19,428
2035 $20,522
2036 $21,610
2037 $145,367
Discount Rate: 2.5%
Period of Analysis: 20 years
8

Life Cycle Cost Report
Sources and Derivations:
. Demolition
. Demolition
Estimated demolition cost is $10/sf.
$10*3610= $36,100
a
1
. Renovation/Conversion
. Renovation/ Conversion
To be made practical, this building would require total renovation to includerepairingor replacing roofing, flooring, plumbing, electrical, communications, and othersystems.Estimated cost is $55/sf or 55*3,610 = $198,550
a
2
. Other DOD or Federal Agency
. Other DOD or Agency
This alternative offers the building to another DOD or federal agency. Theagencywould be responsible for the renovation/conversion of the facility. Cost wouldbe thesame as the renovation/conversion alternative - $55*3,610 = $198,550.
Due to the relatively small size of this building (3,610 sf), location, lack ofparking, and the cost and time required for renovation, it’s unlikely that anotheragency would select it. This alternative is viable.
a
3
. Caretaker Status
. Caretaker Status
The current cost of maintaining a facility in a caretaker status is $0.33/sf. Thisalternative provides the minimum facility maintenance necessary to keep thebuilding from deteriorating from lack of use and to prevent existing conditionsfrom worsening. When the decision to bring the building back on line is made,the facility will still require major renovation to be made functional.
a
. Renovation/Conversion
The estimated renovation/conversion cost of this alternative is $55/sf. In thecaretaker status alternative, this cost (or the cost of demolition) would beincurredat the end of the caretaker status period. This cost will need to be adjusted forinflation based on the year that the facility is brought out of Caretaker Statusand renovated.
b
4
9

Discount Rate Sensitivity Analysis
Graph of Net Present Value vs. Discount Rate
Discount Rate (%)
Dollars
0.7 %NPV rankings change at the following discount rates:
10

Discount Rate Sensitivity Analysis
NPV rankings change at the following discount rates:
Table of Net Present Values for each Discount Rate
0.7 %
Discount Rate = -1.0%
Demolition $ 36,282
Other DOD or Federal Agency $ 199,550
Renovation/Conversion $ 199,550
Caretaker Status $ 274,121
Discount Rate = -0.8%
Demolition $ 36,245
Other DOD or Federal Agency $ 199,349
Renovation/Conversion $ 199,349
Caretaker Status $ 264,088
Discount Rate = -0.6%
Demolition $ 36,209
Other DOD or Federal Agency $ 199,148
Renovation/Conversion $ 199,148
Caretaker Status $ 254,453
Discount Rate = -0.4%
Demolition $ 36,172
Other DOD or Federal Agency $ 198,948
Renovation/Conversion $ 198,948
Caretaker Status $ 245,200
Discount Rate = -0.2%
Demolition $ 36,136
Other DOD or Federal Agency $ 198,749
Renovation/Conversion $ 198,749
Caretaker Status $ 236,313
Discount Rate = -0.0%
Demolition $ 36,100
Other DOD or Federal Agency $ 198,550
Renovation/Conversion $ 198,550
Caretaker Status $ 227,776
Discount Rate = 0.2%
Demolition $ 36,064
Other DOD or Federal Agency $ 198,352
Renovation/Conversion $ 198,352
Caretaker Status $ 219,575
Discount Rate = 0.4%
Demolition $ 36,028
Other DOD or Federal Agency $ 198,154
Renovation/Conversion $ 198,154
Caretaker Status $ 211,696
Discount Rate = 0.6%
Demolition $ 35,992
Other DOD or Federal Agency $ 197,957
Renovation/Conversion $ 197,957
Caretaker Status $ 204,126
Discount Rate = 0.8%
Demolition $ 35,956
Caretaker Status $ 196,852
Other DOD or Federal Agency $ 197,761
Renovation/Conversion $ 197,761
Discount Rate = 1.0%
Demolition $ 35,921
Caretaker Status $ 189,861
Other DOD or Federal Agency $ 197,565
Renovation/Conversion $ 197,565
Discount Rate = 1.2%
Demolition $ 35,885
Caretaker Status $ 183,142
Other DOD or Federal Agency $ 197,369
Renovation/Conversion $ 197,369
Discount Rate = 1.4%
Demolition $ 35,850
Caretaker Status $ 176,684
Other DOD or Federal Agency $ 197,175
Renovation/Conversion $ 197,175
Discount Rate = 1.6%
Demolition $ 35,815
Caretaker Status $ 170,475
Other DOD or Federal Agency $ 196,980
Renovation/Conversion $ 196,980
Discount Rate = 1.8%
Demolition $ 35,779
Caretaker Status $ 164,507
Other DOD or Federal Agency $ 196,787
Renovation/Conversion $ 196,787
Discount Rate = 2.0%
Demolition $ 35,744
Caretaker Status $ 158,768
Other DOD or Federal Agency $ 196,594
Renovation/Conversion $ 196,594
11

Discount Rate Sensitivity Analysis
NPV rankings change at the following discount rates:
Table of Net Present Values for each Discount Rate
0.7 %
Discount Rate = 2.2%
Demolition $ 35,709
Caretaker Status $ 153,250
Other DOD or Federal Agency $ 196,401
Renovation/Conversion $ 196,401
Discount Rate = 2.4%
Demolition $ 35,674
Caretaker Status $ 147,943
Other DOD or Federal Agency $ 196,209
Renovation/Conversion $ 196,209
Discount Rate = 2.6%
Demolition $ 35,640
Caretaker Status $ 142,840
Other DOD or Federal Agency $ 196,018
Renovation/Conversion $ 196,018
Discount Rate = 2.8%
Demolition $ 35,605
Caretaker Status $ 137,931
Other DOD or Federal Agency $ 195,827
Renovation/Conversion $ 195,827
Discount Rate = 3.0%
Demolition $ 35,570
Caretaker Status $ 133,209
Other DOD or Federal Agency $ 195,637
Renovation/Conversion $ 195,637
Discount Rate = 3.2%
Demolition $ 35,536
Caretaker Status $ 128,667
Other DOD or Federal Agency $ 195,447
Renovation/Conversion $ 195,447
Discount Rate = 3.4%
Demolition $ 35,502
Caretaker Status $ 124,296
Other DOD or Federal Agency $ 195,258
Renovation/Conversion $ 195,258
Discount Rate = 3.6%
Demolition $ 35,467
Caretaker Status $ 120,091
Other DOD or Federal Agency $ 195,070
Renovation/Conversion $ 195,070
Discount Rate = 3.8%
Demolition $ 35,433
Caretaker Status $ 116,044
Other DOD or Federal Agency $ 194,882
Renovation/Conversion $ 194,882
Discount Rate = 4.0%
Demolition $ 35,399
Caretaker Status $ 112,149
Other DOD or Federal Agency $ 194,694
Renovation/Conversion $ 194,694
Discount Rate = 4.2%
Demolition $ 35,365
Caretaker Status $ 108,401
Other DOD or Federal Agency $ 194,507
Renovation/Conversion $ 194,507
Discount Rate = 4.4%
Demolition $ 35,331
Caretaker Status $ 104,793
Other DOD or Federal Agency $ 194,321
Renovation/Conversion $ 194,321
Discount Rate = 4.6%
Demolition $ 35,297
Caretaker Status $ 101,319
Other DOD or Federal Agency $ 194,135
Renovation/Conversion $ 194,135
Discount Rate = 4.8%
Demolition $ 35,264
Caretaker Status $ 97,975
Other DOD or Federal Agency $ 193,950
Renovation/Conversion $ 193,950
Discount Rate = 5.0%
Demolition $ 35,230
Caretaker Status $ 94,755
Other DOD or Federal Agency $ 193,765
Renovation/Conversion $ 193,765
Discount Rate = 5.2%
Demolition $ 35,196
Caretaker Status $ 91,655
Other DOD or Federal Agency $ 193,581
Renovation/Conversion $ 193,581
12

Discount Rate Sensitivity Analysis
NPV rankings change at the following discount rates:
Table of Net Present Values for each Discount Rate
0.7 %
Discount Rate = 5.4%
Demolition $ 35,163
Caretaker Status $ 88,669
Other DOD or Federal Agency $ 193,397
Renovation/Conversion $ 193,397
Discount Rate = 5.6%
Demolition $ 35,130
Caretaker Status $ 85,793
Other DOD or Federal Agency $ 193,214
Renovation/Conversion $ 193,214
Discount Rate = 5.8%
Demolition $ 35,097
Caretaker Status $ 83,023
Other DOD or Federal Agency $ 193,031
Renovation/Conversion $ 193,031
Discount Rate = 6.0%
Demolition $ 35,063
Caretaker Status $ 80,355
Other DOD or Federal Agency $ 192,849
Renovation/Conversion $ 192,849
Discount Rate = 6.2%
Demolition $ 35,030
Caretaker Status $ 77,784
Other DOD or Federal Agency $ 192,667
Renovation/Conversion $ 192,667
Discount Rate = 6.4%
Demolition $ 34,997
Caretaker Status $ 75,307
Other DOD or Federal Agency $ 192,486
Renovation/Conversion $ 192,486
Discount Rate = 6.6%
Demolition $ 34,965
Caretaker Status $ 72,920
Other DOD or Federal Agency $ 192,305
Renovation/Conversion $ 192,305
Discount Rate = 6.8%
Demolition $ 34,932
Caretaker Status $ 70,620
Other DOD or Federal Agency $ 192,125
Renovation/Conversion $ 192,125
Discount Rate = 7.0%
Demolition $ 34,899
Caretaker Status $ 68,404
Other DOD or Federal Agency $ 191,946
Renovation/Conversion $ 191,946
Discount Rate = 7.2%
Demolition $ 34,867
Caretaker Status $ 66,267
Other DOD or Federal Agency $ 191,766
Renovation/Conversion $ 191,766
Discount Rate = 7.4%
Demolition $ 34,834
Caretaker Status $ 64,207
Other DOD or Federal Agency $ 191,588
Renovation/Conversion $ 191,588
Discount Rate = 7.6%
Demolition $ 34,802
Caretaker Status $ 62,222
Other DOD or Federal Agency $ 191,410
Renovation/Conversion $ 191,410
Discount Rate = 7.8%
Demolition $ 34,769
Caretaker Status $ 60,308
Other DOD or Federal Agency $ 191,232
Renovation/Conversion $ 191,232
Discount Rate = 8.0%
Demolition $ 34,737
Caretaker Status $ 58,462
Other DOD or Federal Agency $ 191,055
Renovation/Conversion $ 191,055
Discount Rate = 8.2%
Demolition $ 34,705
Caretaker Status $ 56,682
Other DOD or Federal Agency $ 190,878
Renovation/Conversion $ 190,878
Discount Rate = 8.4%
Demolition $ 34,673
Caretaker Status $ 54,965
Other DOD or Federal Agency $ 190,702
Renovation/Conversion $ 190,702
13

Discount Rate Sensitivity Analysis
NPV rankings change at the following discount rates:
Table of Net Present Values for each Discount Rate
0.7 %
Discount Rate = 8.6%
Demolition $ 34,641
Caretaker Status $ 53,309
Other DOD or Federal Agency $ 190,526
Renovation/Conversion $ 190,526
Discount Rate = 8.8%
Demolition $ 34,609
Caretaker Status $ 51,712
Other DOD or Federal Agency $ 190,351
Renovation/Conversion $ 190,351
Discount Rate = 9.0%
Demolition $ 34,578
Caretaker Status $ 50,171
Other DOD or Federal Agency $ 190,176
Renovation/Conversion $ 190,176
Discount Rate = 9.2%
Demolition $ 34,546
Caretaker Status $ 48,684
Other DOD or Federal Agency $ 190,002
Renovation/Conversion $ 190,002
Discount Rate = 9.4%
Demolition $ 34,514
Caretaker Status $ 47,250
Other DOD or Federal Agency $ 189,828
Renovation/Conversion $ 189,828
Discount Rate = 9.6%
Demolition $ 34,483
Caretaker Status $ 45,865
Other DOD or Federal Agency $ 189,655
Renovation/Conversion $ 189,655
Discount Rate = 9.8%
Demolition $ 34,451
Caretaker Status $ 44,530
Other DOD or Federal Agency $ 189,482
Renovation/Conversion $ 189,482
Discount Rate = 10.0%
Demolition $ 34,420
Caretaker Status $ 43,240
Other DOD or Federal Agency $ 189,310
Renovation/Conversion $ 189,310
14

Date Generated:
Time Generated:
Version:
13 June 2018
11.04.49
Building 77 Disposal
Economic Analysis
2018
Project Title
:
Type of Analysis
Discount Rate
Period of Analysis
Start Year
Base Year
Dollar Analysis
:
:
:
:
:
:
Facilities Reduction Program
Mission Requirement - Full
2.5%
2018
20 years
Current Dollars
Project Objective :
Executive Summary Report
To determine the most economical course of action for
Building 239
that meets the EXORD requirement to reduce excess square
footage.
Building 77 has been identified as a facility for disposal per HQDA EXORD 164-15.
HQDA EXORD 164-15, "Reduce the Installation Facility Footprint," published March 2015,holds commanders and planners accountable for making all reasonable efforts to maximizespace utilization, consolidate units into our best facilities, and dispose of excess assets.Although the Reduce the Footprint (RtF) acronym has taken hold, the EXORD is really aboutthe efficient management of our real property assets. Significant cost reductions can only beachieved with transformational changes that enable us to reduce our expenditures on facilitiesand services.
Background:
ECONPACK 4.0.32
Alternatives Considered for this Analysis:
Demolition - This alternative will demolish the building and restore the site
to a grassed area. This
alternative meets the requirements of the Executive Order Number 164-15 to
dispose of
excess facilities. Demolition cost is estimated to be $10/sf – 998*10=$9,980.
This is
a viable alternative. This is a viable alternative.
Renovation/Conversion - This alternative renovates the facility for use for
another Category Code. The best option for conversion of building, based on its
current configuration, is to use it for Category Code 44224, Organizational
Storage. To be made practical, this building would require total renovation to
include repairing or replacing roofing, flooring, plumbing, electrical,
communications, and other systems. Estimated cost is $55/sf or 998*55= $54,890.
However, there currently is an excess of space in this category code and
converting into this category would violate the intent of the Exord. This is a
viable alternative This is a viable alternative.
Other DOD or Federal Agency - This alternative offers the building to another
DOD or federal agency. The agency would be responsible for the
renovation/conversion of the facility. Cost would be the same as the
renovation/conversion alternative - $55*998 = $54,890. Due to the small size of
this building (998 sf), location, lack of parking, and the cost and time
required for renovation, it’s unlikely that another agency would select it.
This alternative is viable This is a viable alternative.
1

Caretaker Status - This alternative maintains the facility in its current
condition to be used later in its
current category code or after conversion into a different category code. A
facility in
caretaker status is maintained to the point of preventing problems from
developing or to
keep existing problems from worsening. The cost is based on an annual, per
square foot expense of $0.33 or $0.33*998 = $329/yr. This would be a
reoccurring annual expense until the facility is put back into use. With this
alternative, renovation/repair would still be required prior to re-use and
mostly likely at a much higher cost.
This is a viable alternative.
Email Address
706-545-3229Phone Number
Master Planning Division, DPW
Organization
Dean MillerAction Officer :
:
:
:
Economic Indicators:
Alternative NPV
Demolition $ 9,858
Renovation/Conversion $ 54,216
Other DOD or Federal Agency $ 54,216
Caretaker Status $ 40,182
1. This building cannot be used in its current state due to its condition.2. Renovation and/or conversion is necessary for the building to be reutilized in anotherCategory Code.
Assumptions of the Analysis:
Results and Recommendations:
Based on the results of this analysis, the most economical alternative that meets theintent of Exord 164-15 is demolition. Fort Benning does not have a need for the facilityin its current design use category code. Conversion to another category code for FortBenning use is undesired due to its size, layout, location and lack of interested units.No other Federal Agency has expressed interest in using the building, either in its currentconfiguration or converted into another category code. Therefore, demolition ofBuilding 77 is the most economical alternative for the Army.
2

Economic Analysis Graph
Net Present Value
Year
Dollars
3

Life Cycle Cost Report
DemolitionAlternative:
Year Demolition Total
Annual
Outlays
Middle
of Year
Discount
Factors
Present
Value
Cumulative
Net Present
Value
$9,8582018 $9,858$9,980$9,980 0.988
$9,8582019 $0$0$0 0.964
$9,8582020 $0$0$0 0.94
$9,8582021 $0$0$0 0.917
$9,8582022 $0$0$0 0.895
$9,8582023 $0$0$0 0.873
$9,8582024 $0$0$0 0.852
$9,8582025 $0$0$0 0.831
$9,8582026 $0$0$0 0.811
$9,8582027 $0$0$0 0.791
$9,8582028 $0$0$0 0.772
$9,8582029 $0$0$0 0.753
$9,8582030 $0$0$0 0.734
$9,8582031 $0$0$0 0.717
$9,8582032 $0$0$0 0.699
$9,8582033 $0$0$0 0.682
$9,8582034 $0$0$0 0.665
$9,8582035 $0$0$0 0.649
$9,8582036 $0$0$0 0.633
$9,8582037 $0$0$0 0.618
%NPV 100.00%
Discounting
Convention
Inflation
Schedule
Category /
Residual
Schedule
$9,858
M-O-Y
No Inflation
Non-Recurring
Costs
Discount Rate: 2.5%
Period of Analysis: 20 years
4

Life Cycle Cost Report
Renovation/ConversionAlternative:
Year Renovation/
Conversion
Total
Annual
Outlays
Middle
of Year
Discount
Factors
Present
Value
Cumulative
Net Present
Value
$54,2162018 $54,216$54,890$54,890 0.988
$54,2162019 $0$0$0 0.964
$54,2162020 $0$0$0 0.94
$54,2162021 $0$0$0 0.917
$54,2162022 $0$0$0 0.895
$54,2162023 $0$0$0 0.873
$54,2162024 $0$0$0 0.852
$54,2162025 $0$0$0 0.831
$54,2162026 $0$0$0 0.811
$54,2162027 $0$0$0 0.791
$54,2162028 $0$0$0 0.772
$54,2162029 $0$0$0 0.753
$54,2162030 $0$0$0 0.734
$54,2162031 $0$0$0 0.717
$54,2162032 $0$0$0 0.699
$54,2162033 $0$0$0 0.682
$54,2162034 $0$0$0 0.665
$54,2162035 $0$0$0 0.649
$54,2162036 $0$0$0 0.633
$54,2162037 $0$0$0 0.618
%NPV 100.00%
Discounting
Convention
Inflation
Schedule
Category /
Residual
Schedule
$54,216
M-O-Y
No Inflation
Non-Recurring
Costs
Discount Rate: 2.5%
Period of Analysis: 20 years
5

Life Cycle Cost Report
Other DOD or Federal AgencyAlternative:
Year Other DOD or
Agency
Total
Annual
Outlays
Middle
of Year
Discount
Factors
Present
Value
Cumulative
Net Present
Value
$54,2162018 $54,216$54,890$54,890 0.988
$54,2162019 $0$0$0 0.964
$54,2162020 $0$0$0 0.94
$54,2162021 $0$0$0 0.917
$54,2162022 $0$0$0 0.895
$54,2162023 $0$0$0 0.873
$54,2162024 $0$0$0 0.852
$54,2162025 $0$0$0 0.831
$54,2162026 $0$0$0 0.811
$54,2162027 $0$0$0 0.791
$54,2162028 $0$0$0 0.772
$54,2162029 $0$0$0 0.753
$54,2162030 $0$0$0 0.734
$54,2162031 $0$0$0 0.717
$54,2162032 $0$0$0 0.699
$54,2162033 $0$0$0 0.682
$54,2162034 $0$0$0 0.665
$54,2162035 $0$0$0 0.649
$54,2162036 $0$0$0 0.633
$54,2162037 $0$0$0 0.618
%NPV 100.00%
Discounting
Convention
Inflation
Schedule
Category /
Residual
Schedule
$54,216
M-O-Y
No Inflation
Recurring
Costs
Discount Rate: 2.5%
Period of Analysis: 20 years
6

Life Cycle Cost Report
Caretaker StatusAlternative:
Year Caretaker
Status
Maintenance
Renovation/Con
version
Total
Annual
Outlays
Middle
of Year
Discount
Factors
Present
Value
$3282018 0.988$0$332 $332
$3272019 0.964$0$339 $339
$3252020 0.94$0$346 $346
$3232021 0.917$0$353 $353
$3222022 0.895$0$360 $360
$3202023 0.873$0$367 $367
$3192024 0.852$0$374 $374
$3172025 0.831$0$382 $382
$3162026 0.811$0$389 $389
$3142027 0.791$0$397 $397
$3132028 0.772$0$405 $405
$3112029 0.753$0$413 $413
$3092030 0.734$0$421 $421
$3082031 0.717$0$430 $430
$3062032 0.699$0$438 $438
$3052033 0.682$0$447 $447
$3032034 0.665$0$456 $456
$3022035 0.649$0$465 $465
$3012036 0.633$0$475 $475
$34,2132037 0.618$54,890$484 $55,374
%NPV 15.60% 84.40%
Discounting
Convention
Inflation
Schedule
Category /
Residual
Schedule
$6,268
M-O-Y
2017 General
Recurring
Costs
$33,914
M-O-Y
No Inflation
Recurring
Costs
7

Life Cycle Cost Report
Caretaker StatusAlternative:
Year Cumulative
Net Present
Value
2018 $328
2019 $655
2020 $980
2021 $1,303
2022 $1,625
2023 $1,945
2024 $2,264
2025 $2,581
2026 $2,897
2027 $3,211
2028 $3,523
2029 $3,834
2030 $4,144
2031 $4,452
2032 $4,758
2033 $5,063
2034 $5,367
2035 $5,669
2036 $5,969
2037 $40,182
Discount Rate: 2.5%
Period of Analysis: 20 years
8
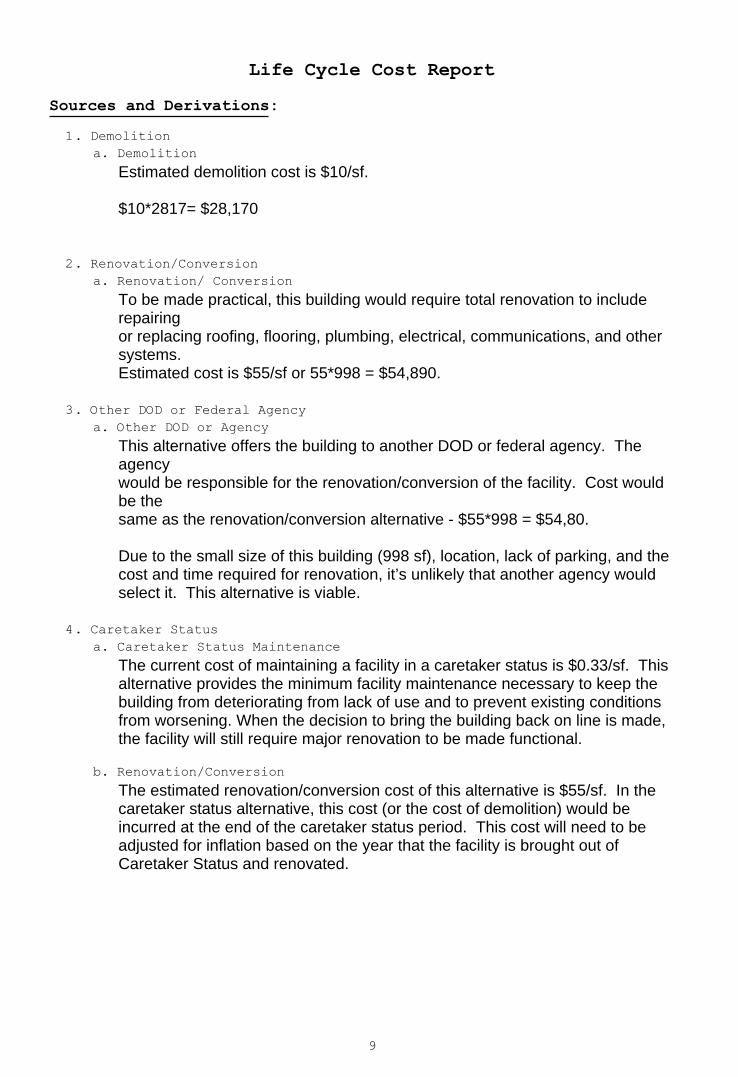
Life Cycle Cost Report
Sources and Derivations:
. Demolition
. Demolition
Estimated demolition cost is $10/sf.
$10*2817= $28,170
a
1
. Renovation/Conversion
. Renovation/ Conversion
To be made practical, this building would require total renovation to includerepairingor replacing roofing, flooring, plumbing, electrical, communications, and othersystems.Estimated cost is $55/sf or 55*998 = $54,890.
a
2
. Other DOD or Federal Agency
. Other DOD or Agency
This alternative offers the building to another DOD or federal agency. Theagencywould be responsible for the renovation/conversion of the facility. Cost wouldbe thesame as the renovation/conversion alternative - $55*998 = $54,80.
Due to the small size of this building (998 sf), location, lack of parking, and thecost and time required for renovation, it’s unlikely that another agency wouldselect it. This alternative is viable.
a
3
. Caretaker Status
. Caretaker Status Maintenance
The current cost of maintaining a facility in a caretaker status is $0.33/sf. Thisalternative provides the minimum facility maintenance necessary to keep thebuilding from deteriorating from lack of use and to prevent existing conditionsfrom worsening. When the decision to bring the building back on line is made,the facility will still require major renovation to be made functional.
a
. Renovation/Conversion
The estimated renovation/conversion cost of this alternative is $55/sf. In thecaretaker status alternative, this cost (or the cost of demolition) would beincurred at the end of the caretaker status period. This cost will need to beadjusted for inflation based on the year that the facility is brought out ofCaretaker Status and renovated.
b
4
9

Discount Rate Sensitivity Analysis
Graph of Net Present Value vs. Discount Rate
Discount Rate (%)
Dollars
0.7 %NPV rankings change at the following discount rates:
10

Discount Rate Sensitivity Analysis
NPV rankings change at the following discount rates:
Table of Net Present Values for each Discount Rate
0.7 %
Discount Rate = -1.0%
Demolition $ 10,030
Other DOD or Federal Agency $ 55,167
Renovation/Conversion $ 55,167
Caretaker Status $ 75,775
Discount Rate = -0.8%
Demolition $ 10,020
Other DOD or Federal Agency $ 55,111
Renovation/Conversion $ 55,111
Caretaker Status $ 73,001
Discount Rate = -0.6%
Demolition $ 10,010
Other DOD or Federal Agency $ 55,055
Renovation/Conversion $ 55,055
Caretaker Status $ 70,338
Discount Rate = -0.4%
Demolition $ 10,000
Other DOD or Federal Agency $ 55,000
Renovation/Conversion $ 55,000
Caretaker Status $ 67,780
Discount Rate = -0.2%
Demolition $ 9,990
Other DOD or Federal Agency $ 54,945
Renovation/Conversion $ 54,945
Caretaker Status $ 65,323
Discount Rate = -0.0%
Demolition $ 9,980
Other DOD or Federal Agency $ 54,890
Renovation/Conversion $ 54,890
Caretaker Status $ 62,963
Discount Rate = 0.2%
Demolition $ 9,970
Other DOD or Federal Agency $ 54,835
Renovation/Conversion $ 54,835
Caretaker Status $ 60,696
Discount Rate = 0.4%
Demolition $ 9,960
Other DOD or Federal Agency $ 54,781
Renovation/Conversion $ 54,781
Caretaker Status $ 58,518
Discount Rate = 0.6%
Demolition $ 9,950
Other DOD or Federal Agency $ 54,726
Renovation/Conversion $ 54,726
Caretaker Status $ 56,426
Discount Rate = 0.8%
Demolition $ 9,940
Caretaker Status $ 54,415
Other DOD or Federal Agency $ 54,672
Renovation/Conversion $ 54,672
Discount Rate = 1.0%
Demolition $ 9,930
Caretaker Status $ 52,482
Other DOD or Federal Agency $ 54,618
Renovation/Conversion $ 54,618
Discount Rate = 1.2%
Demolition $ 9,921
Caretaker Status $ 50,625
Other DOD or Federal Agency $ 54,564
Renovation/Conversion $ 54,564
Discount Rate = 1.4%
Demolition $ 9,911
Caretaker Status $ 48,839
Other DOD or Federal Agency $ 54,510
Renovation/Conversion $ 54,510
Discount Rate = 1.6%
Demolition $ 9,901
Caretaker Status $ 47,123
Other DOD or Federal Agency $ 54,456
Renovation/Conversion $ 54,456
Discount Rate = 1.8%
Demolition $ 9,891
Caretaker Status $ 45,473
Other DOD or Federal Agency $ 54,403
Renovation/Conversion $ 54,403
Discount Rate = 2.0%
Demolition $ 9,882
Caretaker Status $ 43,887
Other DOD or Federal Agency $ 54,349
Renovation/Conversion $ 54,349
11

Discount Rate Sensitivity Analysis
NPV rankings change at the following discount rates:
Table of Net Present Values for each Discount Rate
0.7 %
Discount Rate = 2.2%
Demolition $ 9,872
Caretaker Status $ 42,362
Other DOD or Federal Agency $ 54,296
Renovation/Conversion $ 54,296
Discount Rate = 2.4%
Demolition $ 9,862
Caretaker Status $ 40,895
Other DOD or Federal Agency $ 54,243
Renovation/Conversion $ 54,243
Discount Rate = 2.6%
Demolition $ 9,853
Caretaker Status $ 39,484
Other DOD or Federal Agency $ 54,190
Renovation/Conversion $ 54,190
Discount Rate = 2.8%
Demolition $ 9,843
Caretaker Status $ 38,127
Other DOD or Federal Agency $ 54,137
Renovation/Conversion $ 54,137
Discount Rate = 3.0%
Demolition $ 9,834
Caretaker Status $ 36,822
Other DOD or Federal Agency $ 54,085
Renovation/Conversion $ 54,085
Discount Rate = 3.2%
Demolition $ 9,824
Caretaker Status $ 35,566
Other DOD or Federal Agency $ 54,032
Renovation/Conversion $ 54,032
Discount Rate = 3.4%
Demolition $ 9,815
Caretaker Status $ 34,358
Other DOD or Federal Agency $ 53,980
Renovation/Conversion $ 53,980
Discount Rate = 3.6%
Demolition $ 9,805
Caretaker Status $ 33,195
Other DOD or Federal Agency $ 53,928
Renovation/Conversion $ 53,928
Discount Rate = 3.8%
Demolition $ 9,796
Caretaker Status $ 32,077
Other DOD or Federal Agency $ 53,876
Renovation/Conversion $ 53,876
Discount Rate = 4.0%
Demolition $ 9,786
Caretaker Status $ 31,000
Other DOD or Federal Agency $ 53,824
Renovation/Conversion $ 53,824
Discount Rate = 4.2%
Demolition $ 9,777
Caretaker Status $ 29,964
Other DOD or Federal Agency $ 53,772
Renovation/Conversion $ 53,772
Discount Rate = 4.4%
Demolition $ 9,767
Caretaker Status $ 28,966
Other DOD or Federal Agency $ 53,721
Renovation/Conversion $ 53,721
Discount Rate = 4.6%
Demolition $ 9,758
Caretaker Status $ 28,006
Other DOD or Federal Agency $ 53,669
Renovation/Conversion $ 53,669
Discount Rate = 4.8%
Demolition $ 9,749
Caretaker Status $ 27,082
Other DOD or Federal Agency $ 53,618
Renovation/Conversion $ 53,618
Discount Rate = 5.0%
Demolition $ 9,739
Caretaker Status $ 26,192
Other DOD or Federal Agency $ 53,567
Renovation/Conversion $ 53,567
Discount Rate = 5.2%
Demolition $ 9,730
Caretaker Status $ 25,335
Other DOD or Federal Agency $ 53,516
Renovation/Conversion $ 53,516
12

Discount Rate Sensitivity Analysis
NPV rankings change at the following discount rates:
Table of Net Present Values for each Discount Rate
0.7 %
Discount Rate = 5.4%
Demolition $ 9,721
Caretaker Status $ 24,509
Other DOD or Federal Agency $ 53,465
Renovation/Conversion $ 53,465
Discount Rate = 5.6%
Demolition $ 9,712
Caretaker Status $ 23,714
Other DOD or Federal Agency $ 53,415
Renovation/Conversion $ 53,415
Discount Rate = 5.8%
Demolition $ 9,703
Caretaker Status $ 22,948
Other DOD or Federal Agency $ 53,364
Renovation/Conversion $ 53,364
Discount Rate = 6.0%
Demolition $ 9,693
Caretaker Status $ 22,211
Other DOD or Federal Agency $ 53,314
Renovation/Conversion $ 53,314
Discount Rate = 6.2%
Demolition $ 9,684
Caretaker Status $ 21,500
Other DOD or Federal Agency $ 53,264
Renovation/Conversion $ 53,264
Discount Rate = 6.4%
Demolition $ 9,675
Caretaker Status $ 20,815
Other DOD or Federal Agency $ 53,214
Renovation/Conversion $ 53,214
Discount Rate = 6.6%
Demolition $ 9,666
Caretaker Status $ 20,156
Other DOD or Federal Agency $ 53,164
Renovation/Conversion $ 53,164
Discount Rate = 6.8%
Demolition $ 9,657
Caretaker Status $ 19,520
Other DOD or Federal Agency $ 53,114
Renovation/Conversion $ 53,114
Discount Rate = 7.0%
Demolition $ 9,648
Caretaker Status $ 18,907
Other DOD or Federal Agency $ 53,064
Renovation/Conversion $ 53,064
Discount Rate = 7.2%
Demolition $ 9,639
Caretaker Status $ 18,317
Other DOD or Federal Agency $ 53,015
Renovation/Conversion $ 53,015
Discount Rate = 7.4%
Demolition $ 9,630
Caretaker Status $ 17,747
Other DOD or Federal Agency $ 52,965
Renovation/Conversion $ 52,965
Discount Rate = 7.6%
Demolition $ 9,621
Caretaker Status $ 17,198
Other DOD or Federal Agency $ 52,916
Renovation/Conversion $ 52,916
Discount Rate = 7.8%
Demolition $ 9,612
Caretaker Status $ 16,669
Other DOD or Federal Agency $ 52,867
Renovation/Conversion $ 52,867
Discount Rate = 8.0%
Demolition $ 9,603
Caretaker Status $ 16,159
Other DOD or Federal Agency $ 52,818
Renovation/Conversion $ 52,818
Discount Rate = 8.2%
Demolition $ 9,594
Caretaker Status $ 15,667
Other DOD or Federal Agency $ 52,769
Renovation/Conversion $ 52,769
Discount Rate = 8.4%
Demolition $ 9,586
Caretaker Status $ 15,192
Other DOD or Federal Agency $ 52,720
Renovation/Conversion $ 52,720
13

Discount Rate Sensitivity Analysis
NPV rankings change at the following discount rates:
Table of Net Present Values for each Discount Rate
0.7 %
Discount Rate = 8.6%
Demolition $ 9,577
Caretaker Status $ 14,735
Other DOD or Federal Agency $ 52,672
Renovation/Conversion $ 52,672
Discount Rate = 8.8%
Demolition $ 9,568
Caretaker Status $ 14,293
Other DOD or Federal Agency $ 52,623
Renovation/Conversion $ 52,623
Discount Rate = 9.0%
Demolition $ 9,559
Caretaker Status $ 13,867
Other DOD or Federal Agency $ 52,575
Renovation/Conversion $ 52,575
Discount Rate = 9.2%
Demolition $ 9,550
Caretaker Status $ 13,456
Other DOD or Federal Agency $ 52,527
Renovation/Conversion $ 52,527
Discount Rate = 9.4%
Demolition $ 9,542
Caretaker Status $ 13,060
Other DOD or Federal Agency $ 52,479
Renovation/Conversion $ 52,479
Discount Rate = 9.6%
Demolition $ 9,533
Caretaker Status $ 12,677
Other DOD or Federal Agency $ 52,431
Renovation/Conversion $ 52,431
Discount Rate = 9.8%
Demolition $ 9,524
Caretaker Status $ 12,308
Other DOD or Federal Agency $ 52,383
Renovation/Conversion $ 52,383
Discount Rate = 10.0%
Demolition $ 9,516
Caretaker Status $ 11,951
Other DOD or Federal Agency $ 52,336
Renovation/Conversion $ 52,336
14

Date Generated:
Time Generated:
Version:
12 June 2018
16.39.08
Building 92 Demolition
Economic Analysis
2018
Project Title
:
Type of Analysis
Discount Rate
Period of Analysis
Start Year
Base Year
Dollar Analysis
:
:
:
:
:
:
Fort Benning Facilities Reduction Program
Mission Requirement - Full
2.5%
2018
20 years
Current Dollars
Project Objective :
Executive Summary Report
To determine the most economical course of action for
Building 92 that meets the EXORD requirement to reduce
excess square footage.
Building 92 has been identified as a facility for disposal per HQDA EXORD 164-15.
HQDA EXORD 164-15, "Reduce the Installation Facility Footprint," published March 2015,holds commanders and planners accountable for making all reasonable efforts to maximizespace utilization, consolidate units into our best facilities, and dispose of excess assets.Although the Reduce the Footprint (RtF) acronym has taken hold, the EXORD is really aboutthe efficient management of our real property assets. Significant cost reductions can only beachieved with transformational changes that enable us to reduce our expenditures on facilitiesand services.
Background:
ECONPACK 4.0.32
Alternatives Considered for this Analysis:
Status Quo (Current Operations) - This option retains Building 92 as a Detached
Fire Station Support Building (CC70311). This facility is currently
unoccupied and no longer needed for this purpose because the adjoining fire
station was closed when the new Dixie Rd fire station was opened in 2005.
Therefore, maintaining this facility in its current category code is not a
viable alternative. This alternative is nonviable.
Demolition - This alternative will demolish the building and restore the site
to a grassed area. This alternative meets the requirements of the Executive
Order NUMBER 164-15 to dispose of excess facilities. Demolition cost is
estimated to be $10/sf – 853*10=$8,530. This is a viable alternative. This is
a viable alternative.
Renovation/Conversion - Conversion/Alternate Use - This alternative renovates
the facility for use for another Category Code. The best option for conversion
of building, based on its current configuration, is to use it for Category Code
61050, General Administration Building. To be made practical, this building
would require total renovation to include repairing or replacing roofing,
flooring, plumbing, electrical, communications,
and other systems. Estimated cost is $55/sf or 853*55 = $46,915. However,
there currently is an excess of space in this category code and converting into
this category would violate the intent of the Exord. This is a viable
alternative. This is a viable alternative.
Other DOD or Federal Agency Facilities - This alternative offers the building
1

to another DOD or federal agency. The agency would be responsible for the
renovation/conversion of the facility. Cost would be the same as the
renovation/conversion alternative - $55*853 = $46,915. Due to the small size of
this building (853 sf) and the cost and time required for renovation, it’s
unlikely that another agency would select it. This alternative is viable.
This is a viable alternative.
Caretaker Status - This alternative maintains the facility in its current
condition to be used later in its current category code or after conversion
into a different category code. A facility in caretaker status is maintained
to the point of preventing problems from developing or to keep existing
problems from worsening. The cost is based on an annual, per square foot
expense of $0.33. This would be a reoccurring annual expense until the
facility is put back into use. With this alternative, renovation/repair would
still be required prior to re-use and mostly likely at a much higher cost.
This is a viable alternative.
Email Address
706-545-3229Phone Number
Master Planning Division, DPW
Organization
Dean MillerAction Officer :
:
:
:
Economic Indicators:
Alternative NPV
Demolition $ 8,425
Renovation/Conversion $ 45,209
Other DOD or Federal Agency Facilities $ 45,209
Caretaker Status $ 46,689
1.This building cannot be used in its current state due to its condition.2.Renovation and/or conversion is necessary for the building to be reutilized.
Assumptions of the Analysis:
Results and Recommendations:
Based on the results of this analysis, the most economical alternative is demolition. FortBenning does not have a practical use for this facility as is, or in a renovated condition.
2

Economic Analysis Graph
Net Present Value
Year
Dollars
3

Life Cycle Cost Report
DemolitionAlternative:
Year Demolition Total
Annual
Outlays
Middle
of Year
Discount
Factors
Present
Value
Cumulative
Net Present
Value
$8,4252018 $8,425$8,530$8,530 0.988
$8,4252019 $0$0$0 0.964
$8,4252020 $0$0$0 0.94
$8,4252021 $0$0$0 0.917
$8,4252022 $0$0$0 0.895
$8,4252023 $0$0$0 0.873
$8,4252024 $0$0$0 0.852
$8,4252025 $0$0$0 0.831
$8,4252026 $0$0$0 0.811
$8,4252027 $0$0$0 0.791
$8,4252028 $0$0$0 0.772
$8,4252029 $0$0$0 0.753
$8,4252030 $0$0$0 0.734
$8,4252031 $0$0$0 0.717
$8,4252032 $0$0$0 0.699
$8,4252033 $0$0$0 0.682
$8,4252034 $0$0$0 0.665
$8,4252035 $0$0$0 0.649
$8,4252036 $0$0$0 0.633
$8,4252037 $0$0$0 0.618
%NPV 100.00%
Discounting
Convention
Inflation
Schedule
Category /
Residual
Schedule
$8,425
M-O-Y
No Inflation
Non-Recurring
Costs
Discount Rate: 2.5%
Period of Analysis: 20 years
4

Life Cycle Cost Report
Renovation/ConversionAlternative:
Year Renovation Total
Annual
Outlays
Middle
of Year
Discount
Factors
Present
Value
Cumulative
Net Present
Value
$02018 $0$0$0 0.988
$45,2092019 $45,209$46,915$46,915 0.964
$45,2092020 $0$0$0 0.94
$45,2092021 $0$0$0 0.917
$45,2092022 $0$0$0 0.895
$45,2092023 $0$0$0 0.873
$45,2092024 $0$0$0 0.852
$45,2092025 $0$0$0 0.831
$45,2092026 $0$0$0 0.811
$45,2092027 $0$0$0 0.791
$45,2092028 $0$0$0 0.772
$45,2092029 $0$0$0 0.753
$45,2092030 $0$0$0 0.734
$45,2092031 $0$0$0 0.717
$45,2092032 $0$0$0 0.699
$45,2092033 $0$0$0 0.682
$45,2092034 $0$0$0 0.665
$45,2092035 $0$0$0 0.649
$45,2092036 $0$0$0 0.633
$45,2092037 $0$0$0 0.618
%NPV 100.00%
Discounting
Convention
Inflation
Schedule
Category /
Residual
Schedule
$45,209
M-O-Y
No Inflation
Recurring
Costs
Discount Rate: 2.5%
Period of Analysis: 20 years
5

Life Cycle Cost Report
Other DOD or Federal Agency FacilitiesAlternative:
Year Renovation Total
Annual
Outlays
Middle
of Year
Discount
Factors
Present
Value
Cumulative
Net Present
Value
$02018 $0$0$0 0.988
$45,2092019 $45,209$46,915$46,915 0.964
$45,2092020 $0$0$0 0.94
$45,2092021 $0$0$0 0.917
$45,2092022 $0$0$0 0.895
$45,2092023 $0$0$0 0.873
$45,2092024 $0$0$0 0.852
$45,2092025 $0$0$0 0.831
$45,2092026 $0$0$0 0.811
$45,2092027 $0$0$0 0.791
$45,2092028 $0$0$0 0.772
$45,2092029 $0$0$0 0.753
$45,2092030 $0$0$0 0.734
$45,2092031 $0$0$0 0.717
$45,2092032 $0$0$0 0.699
$45,2092033 $0$0$0 0.682
$45,2092034 $0$0$0 0.665
$45,2092035 $0$0$0 0.649
$45,2092036 $0$0$0 0.633
$45,2092037 $0$0$0 0.618
%NPV 100.00%
Discounting
Convention
Inflation
Schedule
Category /
Residual
Schedule
$45,209
M-O-Y
No Inflation
Recurring
Costs
Discount Rate: 2.5%
Period of Analysis: 20 years
6

Life Cycle Cost Report
Caretaker StatusAlternative:
Year Caretaker
Status
Renovation Total
Annual
Outlays
Middle
of Year
Discount
Factors
Present
Value
$2532018 0.988$0$256 $256
$2472019 0.964$0$256 $256
$2412020 0.94$0$256 $256
$2352021 0.917$0$256 $256
$2292022 0.895$0$256 $256
$2232023 0.873$0$256 $256
$2182024 0.852$0$256 $256
$2132025 0.831$0$256 $256
$2082026 0.811$0$256 $256
$2022027 0.791$0$256 $256
$1982028 0.772$0$256 $256
$1932029 0.753$0$256 $256
$1882030 0.734$0$256 $256
$1832031 0.717$0$256 $256
$1792032 0.699$0$256 $256
$1752033 0.682$0$256 $256
$1702034 0.665$0$256 $256
$1662035 0.649$0$256 $256
$1622036 0.633$0$256 $256
$42,8062037 0.618$69,026$256 $69,282
%NPV 8.65% 91.35%
Discounting
Convention
Inflation
Schedule
Category /
Residual
Schedule
$4,040
M-O-Y
No Inflation
Recurring
Costs
$42,648
M-O-Y
2017 General
Non-Recurring
Costs
7

Life Cycle Cost Report
Caretaker StatusAlternative:
Year Cumulative
Net Present
Value
2018 $253
2019 $500
2020 $740
2021 $975
2022 $1,204
2023 $1,428
2024 $1,646
2025 $1,858
2026 $2,066
2027 $2,268
2028 $2,466
2029 $2,659
2030 $2,847
2031 $3,030
2032 $3,209
2033 $3,384
2034 $3,554
2035 $3,720
2036 $3,882
2037 $46,689
Discount Rate: 2.5%
Period of Analysis: 20 years
8

Life Cycle Cost Report
Sources and Derivations:
. Demolition
. Demolition
Estimated demolition cost is $10/sf.
$10*853 = $8,530
a
1
. Renovation/Conversion
. Renovation
To be made practical, this building would require total renovation to includerepairing or replacing roofing, flooring, plumbing, electrical, communications,and other systems. Estimated cost is $55/sf or 55*853 = $46,915
a
2
. Other DOD or Federal Agency Facilities
. Renovation
Similar to renovation for use by the Army, to be made practical for use byanother government agency, this building would require total renovation toinclude repairing or replacing roofing, flooring, plumbing, electrical,communications, and other systems. Estimated cost is $55/sf or 55*853 =$46,915.
a
3
. Caretaker Status
. Caretaker Status
The current cost of maintaining a facility in a caretaker status is $0.33/sf.a
. Renovation
The estimated renovation/conversion cost of this alternative is $55/sf. In thecaretaker status alternative, this cost (or the cost of demolition) would beincurred at the end of the caretaker status period. This cost will need to beadjusted for inflation based on the year that the facility is brought out ofCaretaker Status and renovated.
b
4
9

Discount Rate Sensitivity Analysis
Graph of Net Present Value vs. Discount Rate
Discount Rate (%)
Dollars
2.6 %NPV rankings change at the following discount rates:
10

Discount Rate Sensitivity Analysis
NPV rankings change at the following discount rates:
Table of Net Present Values for each Discount Rate
2.6 %
Discount Rate = -1.0%
Demolition $ 8,573
Other DOD or Federal Agency $ 47,628
Renovation/Conversion $ 47,628
Caretaker Status $ 89,642
Discount Rate = -0.8%
Demolition $ 8,564
Other DOD or Federal Agency $ 47,484
Renovation/Conversion $ 47,484
Caretaker Status $ 86,285
Discount Rate = -0.6%
Demolition $ 8,556
Other DOD or Federal Agency $ 47,340
Renovation/Conversion $ 47,340
Caretaker Status $ 83,062
Discount Rate = -0.4%
Demolition $ 8,547
Other DOD or Federal Agency $ 47,198
Renovation/Conversion $ 47,198
Caretaker Status $ 79,968
Discount Rate = -0.2%
Demolition $ 8,539
Other DOD or Federal Agency $ 47,056
Renovation/Conversion $ 47,056
Caretaker Status $ 76,998
Discount Rate = -0.0%
Demolition $ 8,530
Other DOD or Federal Agency $ 46,915
Renovation/Conversion $ 46,915
Caretaker Status $ 74,146
Discount Rate = 0.2%
Demolition $ 8,521
Other DOD or Federal Agency $ 46,775
Renovation/Conversion $ 46,775
Caretaker Status $ 71,408
Discount Rate = 0.4%
Demolition $ 8,513
Other DOD or Federal Agency $ 46,635
Renovation/Conversion $ 46,635
Caretaker Status $ 68,778
Discount Rate = 0.6%
Demolition $ 8,505
Other DOD or Federal Agency $ 46,496
Renovation/Conversion $ 46,496
Caretaker Status $ 66,252
Discount Rate = 0.8%
Demolition $ 8,496
Other DOD or Federal Agency $ 46,358
Renovation/Conversion $ 46,358
Caretaker Status $ 63,826
Discount Rate = 1.0%
Demolition $ 8,488
Other DOD or Federal Agency $ 46,220
Renovation/Conversion $ 46,220
Caretaker Status $ 61,495
Discount Rate = 1.2%
Demolition $ 8,479
Other DOD or Federal Agency $ 46,083
Renovation/Conversion $ 46,083
Caretaker Status $ 59,256
Discount Rate = 1.4%
Demolition $ 8,471
Other DOD or Federal Agency $ 45,947
Renovation/Conversion $ 45,947
Caretaker Status $ 57,105
Discount Rate = 1.6%
Demolition $ 8,463
Other DOD or Federal Agency $ 45,811
Renovation/Conversion $ 45,811
Caretaker Status $ 55,038
Discount Rate = 1.8%
Demolition $ 8,454
Other DOD or Federal Agency $ 45,676
Renovation/Conversion $ 45,676
Caretaker Status $ 53,052
Discount Rate = 2.0%
Demolition $ 8,446
Other DOD or Federal Agency $ 45,542
Renovation/Conversion $ 45,542
Caretaker Status $ 51,143
11

Discount Rate Sensitivity Analysis
NPV rankings change at the following discount rates:
Table of Net Present Values for each Discount Rate
2.6 %
Discount Rate = 2.2%
Demolition $ 8,438
Other DOD or Federal Agency $ 45,408
Renovation/Conversion $ 45,408
Caretaker Status $ 49,308
Discount Rate = 2.4%
Demolition $ 8,429
Other DOD or Federal Agency $ 45,275
Renovation/Conversion $ 45,275
Caretaker Status $ 47,544
Discount Rate = 2.6%
Demolition $ 8,421
Other DOD or Federal Agency $ 45,143
Renovation/Conversion $ 45,143
Caretaker Status $ 45,849
Discount Rate = 2.8%
Demolition $ 8,413
Caretaker Status $ 44,220
Other DOD or Federal Agency $ 45,011
Renovation/Conversion $ 45,011
Discount Rate = 3.0%
Demolition $ 8,405
Caretaker Status $ 42,653
Other DOD or Federal Agency $ 44,880
Renovation/Conversion $ 44,880
Discount Rate = 3.2%
Demolition $ 8,397
Caretaker Status $ 41,146
Other DOD or Federal Agency $ 44,750
Renovation/Conversion $ 44,750
Discount Rate = 3.4%
Demolition $ 8,389
Caretaker Status $ 39,697
Other DOD or Federal Agency $ 44,620
Renovation/Conversion $ 44,620
Discount Rate = 3.6%
Demolition $ 8,380
Caretaker Status $ 38,304
Other DOD or Federal Agency $ 44,491
Renovation/Conversion $ 44,491
Discount Rate = 3.8%
Demolition $ 8,372
Caretaker Status $ 36,964
Other DOD or Federal Agency $ 44,362
Renovation/Conversion $ 44,362
Discount Rate = 4.0%
Demolition $ 8,364
Caretaker Status $ 35,675
Other DOD or Federal Agency $ 44,235
Renovation/Conversion $ 44,235
Discount Rate = 4.2%
Demolition $ 8,356
Caretaker Status $ 34,435
Other DOD or Federal Agency $ 44,107
Renovation/Conversion $ 44,107
Discount Rate = 4.4%
Demolition $ 8,348
Caretaker Status $ 33,242
Other DOD or Federal Agency $ 43,981
Renovation/Conversion $ 43,981
Discount Rate = 4.6%
Demolition $ 8,340
Caretaker Status $ 32,094
Other DOD or Federal Agency $ 43,855
Renovation/Conversion $ 43,855
Discount Rate = 4.8%
Demolition $ 8,332
Caretaker Status $ 30,990
Other DOD or Federal Agency $ 43,729
Renovation/Conversion $ 43,729
Discount Rate = 5.0%
Demolition $ 8,324
Caretaker Status $ 29,927
Other DOD or Federal Agency $ 43,604
Renovation/Conversion $ 43,604
Discount Rate = 5.2%
Demolition $ 8,317
Caretaker Status $ 28,904
Other DOD or Federal Agency $ 43,480
Renovation/Conversion $ 43,480
12

Discount Rate Sensitivity Analysis
NPV rankings change at the following discount rates:
Table of Net Present Values for each Discount Rate
2.6 %
Discount Rate = 5.4%
Demolition $ 8,309
Caretaker Status $ 27,920
Other DOD or Federal Agency $ 43,356
Renovation/Conversion $ 43,356
Discount Rate = 5.6%
Demolition $ 8,301
Caretaker Status $ 26,972
Other DOD or Federal Agency $ 43,233
Renovation/Conversion $ 43,233
Discount Rate = 5.8%
Demolition $ 8,293
Caretaker Status $ 26,060
Other DOD or Federal Agency $ 43,111
Renovation/Conversion $ 43,111
Discount Rate = 6.0%
Demolition $ 8,285
Caretaker Status $ 25,182
Other DOD or Federal Agency $ 42,989
Renovation/Conversion $ 42,989
Discount Rate = 6.2%
Demolition $ 8,277
Caretaker Status $ 24,337
Other DOD or Federal Agency $ 42,867
Renovation/Conversion $ 42,867
Discount Rate = 6.4%
Demolition $ 8,269
Caretaker Status $ 23,523
Other DOD or Federal Agency $ 42,746
Renovation/Conversion $ 42,746
Discount Rate = 6.6%
Demolition $ 8,262
Caretaker Status $ 22,739
Other DOD or Federal Agency $ 42,626
Renovation/Conversion $ 42,626
Discount Rate = 6.8%
Demolition $ 8,254
Caretaker Status $ 21,984
Other DOD or Federal Agency $ 42,506
Renovation/Conversion $ 42,506
Discount Rate = 7.0%
Demolition $ 8,246
Caretaker Status $ 21,257
Other DOD or Federal Agency $ 42,387
Renovation/Conversion $ 42,387
Discount Rate = 7.2%
Demolition $ 8,239
Caretaker Status $ 20,557
Other DOD or Federal Agency $ 42,269
Renovation/Conversion $ 42,269
Discount Rate = 7.4%
Demolition $ 8,231
Caretaker Status $ 19,882
Other DOD or Federal Agency $ 42,151
Renovation/Conversion $ 42,151
Discount Rate = 7.6%
Demolition $ 8,223
Caretaker Status $ 19,232
Other DOD or Federal Agency $ 42,033
Renovation/Conversion $ 42,033
Discount Rate = 7.8%
Demolition $ 8,216
Caretaker Status $ 18,606
Other DOD or Federal Agency $ 41,916
Renovation/Conversion $ 41,916
Discount Rate = 8.0%
Demolition $ 8,208
Caretaker Status $ 18,003
Other DOD or Federal Agency $ 41,800
Renovation/Conversion $ 41,800
Discount Rate = 8.2%
Demolition $ 8,200
Caretaker Status $ 17,421
Other DOD or Federal Agency $ 41,684
Renovation/Conversion $ 41,684
Discount Rate = 8.4%
Demolition $ 8,193
Caretaker Status $ 16,861
Other DOD or Federal Agency $ 41,569
Renovation/Conversion $ 41,569
13

Discount Rate Sensitivity Analysis
NPV rankings change at the following discount rates:
Table of Net Present Values for each Discount Rate
2.6 %
Discount Rate = 8.6%
Demolition $ 8,185
Caretaker Status $ 16,321
Other DOD or Federal Agency $ 41,454
Renovation/Conversion $ 41,454
Discount Rate = 8.8%
Demolition $ 8,178
Caretaker Status $ 15,800
Other DOD or Federal Agency $ 41,340
Renovation/Conversion $ 41,340
Discount Rate = 9.0%
Demolition $ 8,170
Caretaker Status $ 15,299
Other DOD or Federal Agency $ 41,226
Renovation/Conversion $ 41,226
Discount Rate = 9.2%
Demolition $ 8,163
Caretaker Status $ 14,815
Other DOD or Federal Agency $ 41,113
Renovation/Conversion $ 41,113
Discount Rate = 9.4%
Demolition $ 8,155
Caretaker Status $ 14,348
Other DOD or Federal Agency $ 41,000
Renovation/Conversion $ 41,000
Discount Rate = 9.6%
Demolition $ 8,148
Caretaker Status $ 13,899
Other DOD or Federal Agency $ 40,888
Renovation/Conversion $ 40,888
Discount Rate = 9.8%
Demolition $ 8,140
Caretaker Status $ 13,465
Other DOD or Federal Agency $ 40,776
Renovation/Conversion $ 40,776
Discount Rate = 10.0%
Demolition $ 8,133
Caretaker Status $ 13,047
Other DOD or Federal Agency $ 40,665
Renovation/Conversion $ 40,665
14
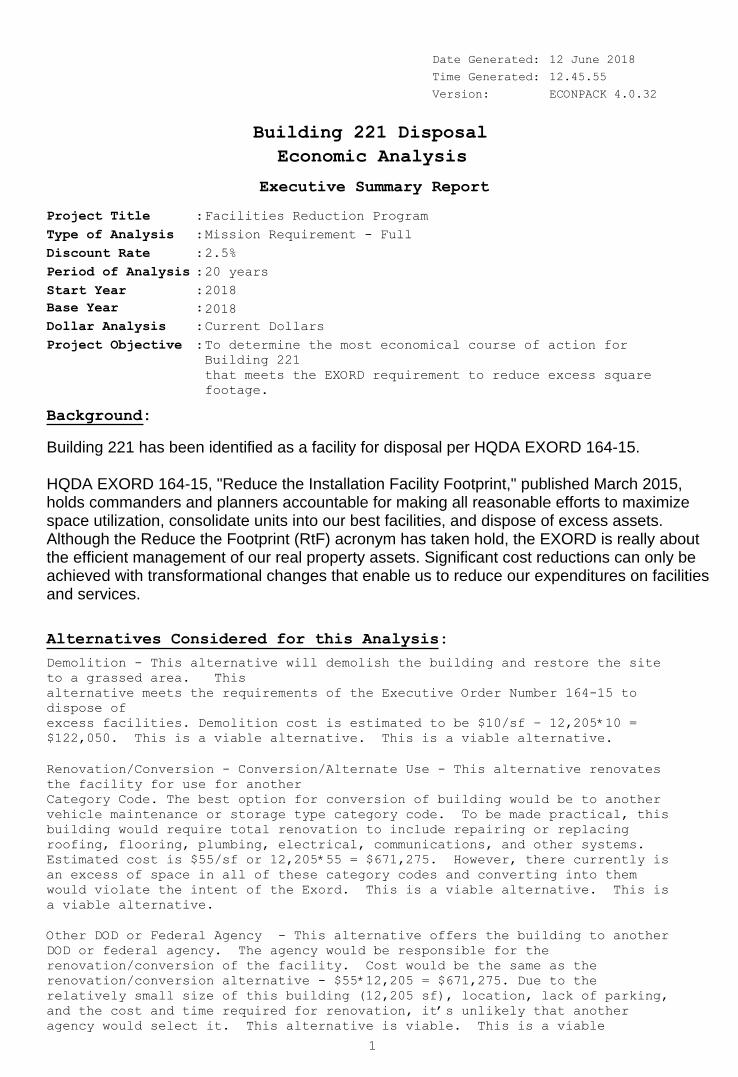
Date Generated:
Time Generated:
Version:
12 June 2018
12.45.55
Building 221 Disposal
Economic Analysis
2018
Project Title
:
Type of Analysis
Discount Rate
Period of Analysis
Start Year
Base Year
Dollar Analysis
:
:
:
:
:
:
Facilities Reduction Program
Mission Requirement - Full
2.5%
2018
20 years
Current Dollars
Project Objective :
Executive Summary Report
To determine the most economical course of action for
Building 221
that meets the EXORD requirement to reduce excess square
footage.
Building 221 has been identified as a facility for disposal per HQDA EXORD 164-15.
HQDA EXORD 164-15, "Reduce the Installation Facility Footprint," published March 2015,holds commanders and planners accountable for making all reasonable efforts to maximizespace utilization, consolidate units into our best facilities, and dispose of excess assets.Although the Reduce the Footprint (RtF) acronym has taken hold, the EXORD is really aboutthe efficient management of our real property assets. Significant cost reductions can only beachieved with transformational changes that enable us to reduce our expenditures on facilitiesand services.
Background:
ECONPACK 4.0.32
Alternatives Considered for this Analysis:
Demolition - This alternative will demolish the building and restore the site
to a grassed area. This
alternative meets the requirements of the Executive Order Number 164-15 to
dispose of
excess facilities. Demolition cost is estimated to be $10/sf – 12,205*10 =
$122,050. This is a viable alternative. This is a viable alternative.
Renovation/Conversion - Conversion/Alternate Use - This alternative renovates
the facility for use for another
Category Code. The best option for conversion of building would be to another
vehicle maintenance or storage type category code. To be made practical, this
building would require total renovation to include repairing or replacing
roofing, flooring, plumbing, electrical, communications, and other systems.
Estimated cost is $55/sf or 12,205*55 = $671,275. However, there currently is
an excess of space in all of these category codes and converting into them
would violate the intent of the Exord. This is a viable alternative. This is
a viable alternative.
Other DOD or Federal Agency - This alternative offers the building to another
DOD or federal agency. The agency would be responsible for the
renovation/conversion of the facility. Cost would be the same as the
renovation/conversion alternative - $55*12,205 = $671,275. Due to the
relatively small size of this building (12,205 sf), location, lack of parking,
and the cost and time required for renovation, it’s unlikely that another
agency would select it. This alternative is viable. This is a viable
1

alternative.
Caretaker Status - This alternative maintains the facility in its current
condition to be used later in its
current category code or after conversion into a different category code. A
facility in
caretaker status is maintained to the point of preventing problems from
developing or to
keep existing problems from worsening. The cost is based on an annual, per
square foot expense of $0.33 or $0.33*12,205 = $4028/yr. This would be a
reoccurring annual expense until the facility is put back into use. With this
alternative, renovation/repair would still be required prior to re-use and
mostly likely at a much higher cost. This is a viable alternative.
Email Address
706-545-3229Phone Number
Master Planning Division, DPW
Organization
Dean MillerAction Officer :
:
:
:
Economic Indicators:
Alternative NPV
Demolition $ 120,552
Renovation/Conversion $ 663,038
Other DOD or Federal Agency $ 663,038
Caretaker Status $ 418,767
1. This building cannot be used in its current state due to its condition.2. Renovation and/or conversion is necessary for the building to be reutilized in anotherCategory Code.
Assumptions of the Analysis:
Results and Recommendations:
Based on the results of this analysis, the most economical alternative that meets theintent of Exord 164-15 is demolition. Fort Benning does not have a need for the facilityin its current design use category code. Conversion to another category code for FortBenning use is undesired due to its size, layout, location and lack of interested units.No other Federal Agency has expressed interest in using the building, either in itscurrent configuration or converted into another category code. Therefore, demolition ofBuilding 221 is the most economical alternative for the Army.
2

Economic Analysis Graph
Net Present Value
Year
Dollars
3

Life Cycle Cost Report
DemolitionAlternative:
Year Demolition Total
Annual
Outlays
Middle
of Year
Discount
Factors
Present
Value
Cumulative
Net Present
Value
$120,5522018 $120,552$122,050$122,050 0.988
$120,5522019 $0$0$0 0.964
$120,5522020 $0$0$0 0.94
$120,5522021 $0$0$0 0.917
$120,5522022 $0$0$0 0.895
$120,5522023 $0$0$0 0.873
$120,5522024 $0$0$0 0.852
$120,5522025 $0$0$0 0.831
$120,5522026 $0$0$0 0.811
$120,5522027 $0$0$0 0.791
$120,5522028 $0$0$0 0.772
$120,5522029 $0$0$0 0.753
$120,5522030 $0$0$0 0.734
$120,5522031 $0$0$0 0.717
$120,5522032 $0$0$0 0.699
$120,5522033 $0$0$0 0.682
$120,5522034 $0$0$0 0.665
$120,5522035 $0$0$0 0.649
$120,5522036 $0$0$0 0.633
$120,5522037 $0$0$0 0.618
%NPV 100.00%
Discounting
Convention
Inflation
Schedule
Category /
Residual
Schedule
$120,552
M-O-Y
No Inflation
Non-Recurring
Costs
Discount Rate: 2.5%
Period of Analysis: 20 years
4

Life Cycle Cost Report
Renovation/ConversionAlternative:
Year Renovation/
Conversion
Total
Annual
Outlays
Middle
of Year
Discount
Factors
Present
Value
Cumulative
Net Present
Value
$663,0382018 $663,038$671,275$671,275 0.988
$663,0382019 $0$0$0 0.964
$663,0382020 $0$0$0 0.94
$663,0382021 $0$0$0 0.917
$663,0382022 $0$0$0 0.895
$663,0382023 $0$0$0 0.873
$663,0382024 $0$0$0 0.852
$663,0382025 $0$0$0 0.831
$663,0382026 $0$0$0 0.811
$663,0382027 $0$0$0 0.791
$663,0382028 $0$0$0 0.772
$663,0382029 $0$0$0 0.753
$663,0382030 $0$0$0 0.734
$663,0382031 $0$0$0 0.717
$663,0382032 $0$0$0 0.699
$663,0382033 $0$0$0 0.682
$663,0382034 $0$0$0 0.665
$663,0382035 $0$0$0 0.649
$663,0382036 $0$0$0 0.633
$663,0382037 $0$0$0 0.618
%NPV 100.00%
Discounting
Convention
Inflation
Schedule
Category /
Residual
Schedule
$663,038
M-O-Y
No Inflation
Recurring
Costs
Discount Rate: 2.5%
Period of Analysis: 20 years
5

Life Cycle Cost Report
Other DOD or Federal AgencyAlternative:
Year Other DOD or
Agency
Total
Annual
Outlays
Middle
of Year
Discount
Factors
Present
Value
Cumulative
Net Present
Value
$663,0382018 $663,038$671,275$671,275 0.988
$663,0382019 $0$0$0 0.964
$663,0382020 $0$0$0 0.94
$663,0382021 $0$0$0 0.917
$663,0382022 $0$0$0 0.895
$663,0382023 $0$0$0 0.873
$663,0382024 $0$0$0 0.852
$663,0382025 $0$0$0 0.831
$663,0382026 $0$0$0 0.811
$663,0382027 $0$0$0 0.791
$663,0382028 $0$0$0 0.772
$663,0382029 $0$0$0 0.753
$663,0382030 $0$0$0 0.734
$663,0382031 $0$0$0 0.717
$663,0382032 $0$0$0 0.699
$663,0382033 $0$0$0 0.682
$663,0382034 $0$0$0 0.665
$663,0382035 $0$0$0 0.649
$663,0382036 $0$0$0 0.633
$663,0382037 $0$0$0 0.618
%NPV 100.00%
Discounting
Convention
Inflation
Schedule
Category /
Residual
Schedule
$663,038
M-O-Y
No Inflation
Recurring
Costs
Discount Rate: 2.5%
Period of Analysis: 20 years
6

Life Cycle Cost Report
Caretaker StatusAlternative:
Year Caretakeer
Status
Maintenance
Renovation/Con
struction
Total
Annual
Outlays
Middle
of Year
Discount
Factors
Present
Value
$4,0182018 0.988$0$4,068 $4,068
$02019 0.964$0$0 $0
$02020 0.94$0$0 $0
$02021 0.917$0$0 $0
$02022 0.895$0$0 $0
$02023 0.873$0$0 $0
$02024 0.852$0$0 $0
$02025 0.831$0$0 $0
$02026 0.811$0$0 $0
$02027 0.791$0$0 $0
$02028 0.772$0$0 $0
$02029 0.753$0$0 $0
$02030 0.734$0$0 $0
$02031 0.717$0$0 $0
$02032 0.699$0$0 $0
$02033 0.682$0$0 $0
$02034 0.665$0$0 $0
$02035 0.649$0$0 $0
$02036 0.633$0$0 $0
$414,7492037 0.618$671,275$0 $671,275
%NPV 0.96% 99.04%
Discounting
Convention
Inflation
Schedule
Category /
Residual
Schedule
$4,018
M-O-Y
2017 General
Recurring
Costs
$414,749
M-O-Y
No Inflation
Non-Recurring
Costs
7

Life Cycle Cost Report
Caretaker StatusAlternative:
Year Cumulative
Net Present
Value
2018 $4,018
2019 $4,018
2020 $4,018
2021 $4,018
2022 $4,018
2023 $4,018
2024 $4,018
2025 $4,018
2026 $4,018
2027 $4,018
2028 $4,018
2029 $4,018
2030 $4,018
2031 $4,018
2032 $4,018
2033 $4,018
2034 $4,018
2035 $4,018
2036 $4,018
2037 $418,767
Discount Rate: 2.5%
Period of Analysis: 20 years
8

Life Cycle Cost Report
Sources and Derivations:
. Demolition
. Demolition
Estimated demolition cost is $10/sf.$10*12,205 = $122,050
a
1
. Renovation/Conversion
. Renovation/ Conversion
To be made practical, this building would require total renovation to includerepairingor replacing roofing, flooring, plumbing, electrical, communications, and othersystems.Estimated cost is $55/sf or 55*12,205 = $671,275.
a
2
. Other DOD or Federal Agency
. Other DOD or Agency
This alternative offers the building to another DOD or federal agency. Theagencywould be responsible for the renovation/conversion of the facility. Cost wouldbe thesame as the renovation/conversion alternative - $55*12,205 = $671,275.
Due to the relatively small size of this building (12,205 sf), location, lack ofparking, and the cost and time required for renovation, it’s unlikely that anotheragency would select it. This alternative is viable.
a
3
. Caretaker Status
. Caretakeer Status Maintenance
The current cost of maintaining a facility in a caretaker status is $0.33/sf. Thisalternative provides the minimum facility maintenance necessary to keep thebuilding from deteriorating from lack of use and to prevent existing conditionsfrom worsening. When the decision to bring the building back on line is made,the facility will still require major renovation to be made functional.
a
. Renovation/Construction
The estimated renovation/conversion cost of this alternative is $55/sf. In thecaretaker status alternative, this cost (or the cost of demolition) would beincurredat the end of the caretaker status period. This cost will need to be adjusted forinflation based on the year that the facility is brought out of Caretaker Statusand renovated.
b
4
9

Discount Rate Sensitivity Analysis
Graph of Net Present Value vs. Discount Rate
Discount Rate (%)
Dollars
9.5, 0.0 %NPV rankings change at the following discount rates:
10

Discount Rate Sensitivity Analysis
NPV rankings change at the following discount rates:
Table of Net Present Values for each Discount Rate
9.5, 0.0 %
Discount Rate = -1.0%
Demolition $ 122,665
Other DOD or Federal Agency $ 674,657
Renovation/Conversion $ 674,657
Caretaker Status $ 820,698
Discount Rate = -0.8%
Demolition $ 122,541
Other DOD or Federal Agency $ 673,976
Renovation/Conversion $ 673,976
Caretaker Status $ 789,181
Discount Rate = -0.6%
Demolition $ 122,418
Other DOD or Federal Agency $ 673,298
Renovation/Conversion $ 673,298
Caretaker Status $ 758,940
Discount Rate = -0.4%
Demolition $ 122,295
Other DOD or Federal Agency $ 672,622
Renovation/Conversion $ 672,622
Caretaker Status $ 729,920
Discount Rate = -0.2%
Demolition $ 122,172
Other DOD or Federal Agency $ 671,947
Renovation/Conversion $ 671,947
Caretaker Status $ 702,071
Discount Rate = -0.0%
Demolition $ 122,050
Other DOD or Federal Agency $ 671,275
Renovation/Conversion $ 671,275
Caretaker Status $ 675,343
Discount Rate = 0.2%
Demolition $ 121,928
Caretaker Status $ 649,688
Other DOD or Federal Agency $ 670,605
Renovation/Conversion $ 670,605
Discount Rate = 0.4%
Demolition $ 121,807
Caretaker Status $ 625,062
Other DOD or Federal Agency $ 669,936
Renovation/Conversion $ 669,936
Discount Rate = 0.6%
Demolition $ 121,685
Caretaker Status $ 601,421
Other DOD or Federal Agency $ 669,270
Renovation/Conversion $ 669,270
Discount Rate = 0.8%
Demolition $ 121,565
Caretaker Status $ 578,724
Other DOD or Federal Agency $ 668,606
Renovation/Conversion $ 668,606
Discount Rate = 1.0%
Demolition $ 121,444
Caretaker Status $ 556,931
Other DOD or Federal Agency $ 667,944
Renovation/Conversion $ 667,944
Discount Rate = 1.2%
Demolition $ 121,324
Caretaker Status $ 536,006
Other DOD or Federal Agency $ 667,283
Renovation/Conversion $ 667,283
Discount Rate = 1.4%
Demolition $ 121,205
Caretaker Status $ 515,911
Other DOD or Federal Agency $ 666,625
Renovation/Conversion $ 666,625
Discount Rate = 1.6%
Demolition $ 121,085
Caretaker Status $ 496,612
Other DOD or Federal Agency $ 665,968
Renovation/Conversion $ 665,968
Discount Rate = 1.8%
Demolition $ 120,966
Caretaker Status $ 478,076
Other DOD or Federal Agency $ 665,314
Renovation/Conversion $ 665,314
Discount Rate = 2.0%
Demolition $ 120,848
Caretaker Status $ 460,272
Other DOD or Federal Agency $ 664,661
Renovation/Conversion $ 664,661
11

Discount Rate Sensitivity Analysis
NPV rankings change at the following discount rates:
Table of Net Present Values for each Discount Rate
9.5, 0.0 %
Discount Rate = 2.2%
Demolition $ 120,729
Caretaker Status $ 443,169
Other DOD or Federal Agency $ 664,011
Renovation/Conversion $ 664,011
Discount Rate = 2.4%
Demolition $ 120,611
Caretaker Status $ 426,739
Other DOD or Federal Agency $ 663,362
Renovation/Conversion $ 663,362
Discount Rate = 2.6%
Demolition $ 120,494
Caretaker Status $ 410,953
Other DOD or Federal Agency $ 662,715
Renovation/Conversion $ 662,715
Discount Rate = 2.8%
Demolition $ 120,376
Caretaker Status $ 395,786
Other DOD or Federal Agency $ 662,070
Renovation/Conversion $ 662,070
Discount Rate = 3.0%
Demolition $ 120,259
Caretaker Status $ 381,211
Other DOD or Federal Agency $ 661,427
Renovation/Conversion $ 661,427
Discount Rate = 3.2%
Demolition $ 120,143
Caretaker Status $ 367,205
Other DOD or Federal Agency $ 660,786
Renovation/Conversion $ 660,786
Discount Rate = 3.4%
Demolition $ 120,027
Caretaker Status $ 353,744
Other DOD or Federal Agency $ 660,146
Renovation/Conversion $ 660,146
Discount Rate = 3.6%
Demolition $ 119,911
Caretaker Status $ 340,807
Other DOD or Federal Agency $ 659,509
Renovation/Conversion $ 659,509
Discount Rate = 3.8%
Demolition $ 119,795
Caretaker Status $ 328,371
Other DOD or Federal Agency $ 658,873
Renovation/Conversion $ 658,873
Discount Rate = 4.0%
Demolition $ 119,680
Caretaker Status $ 316,417
Other DOD or Federal Agency $ 658,239
Renovation/Conversion $ 658,239
Discount Rate = 4.2%
Demolition $ 119,565
Caretaker Status $ 304,925
Other DOD or Federal Agency $ 657,607
Renovation/Conversion $ 657,607
Discount Rate = 4.4%
Demolition $ 119,450
Caretaker Status $ 293,876
Other DOD or Federal Agency $ 656,977
Renovation/Conversion $ 656,977
Discount Rate = 4.6%
Demolition $ 119,336
Caretaker Status $ 283,253
Other DOD or Federal Agency $ 656,349
Renovation/Conversion $ 656,349
Discount Rate = 4.8%
Demolition $ 119,222
Caretaker Status $ 273,038
Other DOD or Federal Agency $ 655,722
Renovation/Conversion $ 655,722
Discount Rate = 5.0%
Demolition $ 119,109
Caretaker Status $ 263,214
Other DOD or Federal Agency $ 655,097
Renovation/Conversion $ 655,097
Discount Rate = 5.2%
Demolition $ 118,995
Caretaker Status $ 253,767
Other DOD or Federal Agency $ 654,474
Renovation/Conversion $ 654,474
12

Discount Rate Sensitivity Analysis
NPV rankings change at the following discount rates:
Table of Net Present Values for each Discount Rate
9.5, 0.0 %
Discount Rate = 5.4%
Demolition $ 118,882
Caretaker Status $ 244,680
Other DOD or Federal Agency $ 653,853
Renovation/Conversion $ 653,853
Discount Rate = 5.6%
Demolition $ 118,770
Caretaker Status $ 235,941
Other DOD or Federal Agency $ 653,234
Renovation/Conversion $ 653,234
Discount Rate = 5.8%
Demolition $ 118,657
Caretaker Status $ 227,533
Other DOD or Federal Agency $ 652,616
Renovation/Conversion $ 652,616
Discount Rate = 6.0%
Demolition $ 118,545
Caretaker Status $ 219,446
Other DOD or Federal Agency $ 652,000
Renovation/Conversion $ 652,000
Discount Rate = 6.2%
Demolition $ 118,434
Caretaker Status $ 211,665
Other DOD or Federal Agency $ 651,386
Renovation/Conversion $ 651,386
Discount Rate = 6.4%
Demolition $ 118,322
Caretaker Status $ 204,178
Other DOD or Federal Agency $ 650,773
Renovation/Conversion $ 650,773
Discount Rate = 6.6%
Demolition $ 118,211
Caretaker Status $ 196,975
Other DOD or Federal Agency $ 650,162
Renovation/Conversion $ 650,162
Discount Rate = 6.8%
Demolition $ 118,101
Caretaker Status $ 190,043
Other DOD or Federal Agency $ 649,553
Renovation/Conversion $ 649,553
Discount Rate = 7.0%
Demolition $ 117,990
Caretaker Status $ 183,372
Other DOD or Federal Agency $ 648,946
Renovation/Conversion $ 648,946
Discount Rate = 7.2%
Demolition $ 117,880
Caretaker Status $ 176,951
Other DOD or Federal Agency $ 648,340
Renovation/Conversion $ 648,340
Discount Rate = 7.4%
Demolition $ 117,770
Caretaker Status $ 170,772
Other DOD or Federal Agency $ 647,736
Renovation/Conversion $ 647,736
Discount Rate = 7.6%
Demolition $ 117,661
Caretaker Status $ 164,824
Other DOD or Federal Agency $ 647,134
Renovation/Conversion $ 647,134
Discount Rate = 7.8%
Demolition $ 117,552
Caretaker Status $ 159,098
Other DOD or Federal Agency $ 646,534
Renovation/Conversion $ 646,534
Discount Rate = 8.0%
Demolition $ 117,443
Caretaker Status $ 153,585
Other DOD or Federal Agency $ 645,935
Renovation/Conversion $ 645,935
Discount Rate = 8.2%
Demolition $ 117,334
Caretaker Status $ 148,278
Other DOD or Federal Agency $ 645,337
Renovation/Conversion $ 645,337
Discount Rate = 8.4%
Demolition $ 117,226
Caretaker Status $ 143,168
Other DOD or Federal Agency $ 644,742
Renovation/Conversion $ 644,742
13

Discount Rate Sensitivity Analysis
NPV rankings change at the following discount rates:
Table of Net Present Values for each Discount Rate
9.5, 0.0 %
Discount Rate = 8.6%
Demolition $ 117,118
Caretaker Status $ 138,248
Other DOD or Federal Agency $ 644,148
Renovation/Conversion $ 644,148
Discount Rate = 8.8%
Demolition $ 117,010
Caretaker Status $ 133,510
Other DOD or Federal Agency $ 643,556
Renovation/Conversion $ 643,556
Discount Rate = 9.0%
Demolition $ 116,903
Caretaker Status $ 128,947
Other DOD or Federal Agency $ 642,965
Renovation/Conversion $ 642,965
Discount Rate = 9.2%
Demolition $ 116,796
Caretaker Status $ 124,552
Other DOD or Federal Agency $ 642,376
Renovation/Conversion $ 642,376
Discount Rate = 9.4%
Demolition $ 116,689
Caretaker Status $ 120,319
Other DOD or Federal Agency $ 641,788
Renovation/Conversion $ 641,788
Discount Rate = 9.6%
Caretaker Status $ 116,241
Demolition $ 116,582
Other DOD or Federal Agency $ 641,202
Renovation/Conversion $ 641,202
Discount Rate = 9.8%
Caretaker Status $ 112,314
Demolition $ 116,476
Other DOD or Federal Agency $ 640,618
Renovation/Conversion $ 640,618
Discount Rate = 10.0%
Caretaker Status $ 108,530
Demolition $ 116,370
Other DOD or Federal Agency $ 640,036
Renovation/Conversion $ 640,036
14

Date Generated:
Time Generated:
Version:
12 June 2018
12.47.17
Building 222 Disposal
Economic Analysis
2018
Project Title
:
Type of Analysis
Discount Rate
Period of Analysis
Start Year
Base Year
Dollar Analysis
:
:
:
:
:
:
Faciities
Mission Requirement - Full
2.5%
2018
20 years
Current Dollars
Project Objective :
Executive Summary Report
To determine the most economical course of action for
Building 222
that meets the EXORD requirement to reduce excess square
footage.
Building 222 has been identified as a facility for disposal per HQDA EXORD 164-15.1
HQDA EXORD 164-15, "Reduce the Installation Facility Footprint," published March 2015,holds commanders and planners accountable for making all reasonable efforts to maximizespace utilization, consolidate units into our best facilities, and dispose of excess assets.Although the Reduce the Footprint (RtF) acronym has taken hold, the EXORD is really aboutthe efficient management of our real property assets. Significant cost reductions can only beachieved with transformational changes that enable us to reduce our expenditures on facilitiesand services.
Background:
ECONPACK 4.0.32
Alternatives Considered for this Analysis:
Demolition - This alternative will demolish the building and restore the site
to a grassed area. This
alternative meets the requirements of the Executive Order Number 164-15 to
dispose of
excess facilities. Demolition cost is estimated to be $10/sf – 7,625*10 =
$76,250. This is a viable alternative. This is a viable alternative.
Renovation/Conversion - Conversion/Alternate Use - This alternative renovates
the facility for use for another
Category Code. The best option for conversion of building, based on its current
configuration, is to use it for Category Code 44224, Organizational Storage.
To be made practical, this building would require total renovation to include
repairing or replacing roofing, flooring, plumbing, electrical, communications,
and other systems. Estimated cost is $55/sf or 7,625*55 = $419,375. However,
there currently is an excess of space in this category code and converting into
this category would violate the intent of the Exord. This is a viable
alternative. This is a viable alternative.
Other DOD or Federal Agency - This alternative offers the building to another
DOD or federal agency. The agency would be responsible for the
renovation/conversion of the facility. Cost would be the same as the
renovation/conversion alternative - $55*7,625 = $419,375. Due to the location
within the TMP motor pool, lack of parking, and the cost and time required for
renovation, it’s unlikely that another agency would select it. This
alternative is viable. This is a viable alternative.
1

Caretaker Status - This alternative maintains the facility in its current
condition to be used later in its
current category code or after conversion into a different category code. A
facility in
caretaker status is maintained to the point of preventing problems from
developing or to
keep existing problems from worsening. The cost is based on an annual, per
square foot expense of $0.33 or $0.33*7,625 = $2,516/yr. This would be a
reoccurring annual expense until the facility is put back into use. With this
alternative, renovation/repair would still be required prior to re-use and
mostly likely at a much higher cost.
This is a viable alternative.
Email Address
706-545-3229Phone Number
Master Planning Division, DPW
Organization
Dean MillerAction Officer :
:
:
:
Economic Indicators:
Alternative NPV
Demolition $ 75,314
Renovation/Conversion $ 414,229
Other DOD or Federal Agency $ 414,229
Caretaker Status $ 307,049
1. This building cannot be used in its current state due to its condition.2. Renovation and/or conversion is necessary for the building to be reutilized in anotherCategory Code.
Assumptions of the Analysis:
Results and Recommendations:
Based on the results of this analysis, the most economical alternative that meets theintent of Exord 164-15 is demolition. Fort Benning does not have a need for the facilityin its current design use category code. Conversion to another category code for FortBenning use is undesired due to its size, layout, location and lack of interested units.No other Federal Agency has expressed interest in using the building, either in itscurrent configuration or converted into another category code. Therefore, demolition ofBuilding 222 is the most economical alternative for the Army.
2

Economic Analysis Graph
Net Present Value
Year
Dollars
3

Life Cycle Cost Report
DemolitionAlternative:
Year Demolition Total
Annual
Outlays
Middle
of Year
Discount
Factors
Present
Value
Cumulative
Net Present
Value
$75,3142018 $75,314$76,250$76,250 0.988
$75,3142019 $0$0$0 0.964
$75,3142020 $0$0$0 0.94
$75,3142021 $0$0$0 0.917
$75,3142022 $0$0$0 0.895
$75,3142023 $0$0$0 0.873
$75,3142024 $0$0$0 0.852
$75,3142025 $0$0$0 0.831
$75,3142026 $0$0$0 0.811
$75,3142027 $0$0$0 0.791
$75,3142028 $0$0$0 0.772
$75,3142029 $0$0$0 0.753
$75,3142030 $0$0$0 0.734
$75,3142031 $0$0$0 0.717
$75,3142032 $0$0$0 0.699
$75,3142033 $0$0$0 0.682
$75,3142034 $0$0$0 0.665
$75,3142035 $0$0$0 0.649
$75,3142036 $0$0$0 0.633
$75,3142037 $0$0$0 0.618
%NPV 100.00%
Discounting
Convention
Inflation
Schedule
Category /
Residual
Schedule
$75,314
M-O-Y
No Inflation
Non-Recurring
Costs
Discount Rate: 2.5%
Period of Analysis: 20 years
4

Life Cycle Cost Report
Renovation/ConversionAlternative:
Year Renovation/
Conversion
Total
Annual
Outlays
Middle
of Year
Discount
Factors
Present
Value
Cumulative
Net Present
Value
$414,2292018 $414,229$419,375$419,375 0.988
$414,2292019 $0$0$0 0.964
$414,2292020 $0$0$0 0.94
$414,2292021 $0$0$0 0.917
$414,2292022 $0$0$0 0.895
$414,2292023 $0$0$0 0.873
$414,2292024 $0$0$0 0.852
$414,2292025 $0$0$0 0.831
$414,2292026 $0$0$0 0.811
$414,2292027 $0$0$0 0.791
$414,2292028 $0$0$0 0.772
$414,2292029 $0$0$0 0.753
$414,2292030 $0$0$0 0.734
$414,2292031 $0$0$0 0.717
$414,2292032 $0$0$0 0.699
$414,2292033 $0$0$0 0.682
$414,2292034 $0$0$0 0.665
$414,2292035 $0$0$0 0.649
$414,2292036 $0$0$0 0.633
$414,2292037 $0$0$0 0.618
%NPV 100.00%
Discounting
Convention
Inflation
Schedule
Category /
Residual
Schedule
$414,229
M-O-Y
No Inflation
Non-Recurring
Costs
Discount Rate: 2.5%
Period of Analysis: 20 years
5

Life Cycle Cost Report
Other DOD or Federal AgencyAlternative:
Year Other DOD or
Agency
Total
Annual
Outlays
Middle
of Year
Discount
Factors
Present
Value
Cumulative
Net Present
Value
$414,2292018 $414,229$419,375$419,375 0.988
$414,2292019 $0$0$0 0.964
$414,2292020 $0$0$0 0.94
$414,2292021 $0$0$0 0.917
$414,2292022 $0$0$0 0.895
$414,2292023 $0$0$0 0.873
$414,2292024 $0$0$0 0.852
$414,2292025 $0$0$0 0.831
$414,2292026 $0$0$0 0.811
$414,2292027 $0$0$0 0.791
$414,2292028 $0$0$0 0.772
$414,2292029 $0$0$0 0.753
$414,2292030 $0$0$0 0.734
$414,2292031 $0$0$0 0.717
$414,2292032 $0$0$0 0.699
$414,2292033 $0$0$0 0.682
$414,2292034 $0$0$0 0.665
$414,2292035 $0$0$0 0.649
$414,2292036 $0$0$0 0.633
$414,2292037 $0$0$0 0.618
%NPV 100.00%
Discounting
Convention
Inflation
Schedule
Category /
Residual
Schedule
$414,229
M-O-Y
No Inflation
Non-Recurring
Costs
Discount Rate: 2.5%
Period of Analysis: 20 years
6

Life Cycle Cost Report
Caretaker StatusAlternative:
Year Caretaker
Status
Maintenance
Renovation/
Conversion
Total
Annual
Outlays
Middle
of Year
Discount
Factors
Present
Value
$2,5102018 0.988$0$2,541 $2,541
$2,4982019 0.964$0$2,592 $2,592
$2,4852020 0.94$0$2,644 $2,644
$2,4732021 0.917$0$2,697 $2,697
$2,4612022 0.895$0$2,750 $2,750
$2,4492023 0.873$0$2,806 $2,806
$2,4372024 0.852$0$2,862 $2,862
$2,4252025 0.831$0$2,919 $2,919
$2,4142026 0.811$0$2,977 $2,977
$2,4022027 0.791$0$3,037 $3,037
$2,3902028 0.772$0$3,098 $3,098
$2,3782029 0.753$0$3,159 $3,159
$2,3672030 0.734$0$3,223 $3,223
$2,3552031 0.717$0$3,287 $3,287
$2,3442032 0.699$0$3,353 $3,353
$2,3322033 0.682$0$3,420 $3,420
$2,3212034 0.665$0$3,488 $3,488
$2,3102035 0.649$0$3,558 $3,558
$2,2982036 0.633$0$3,629 $3,629
$261,3992037 0.618$419,375$3,702 $423,077
%NPV 15.61% 84.39%
Discounting
Convention
Inflation
Schedule
Category /
Residual
Schedule
$47,938
M-O-Y
2017 General
Recurring
Costs
$259,112
M-O-Y
No Inflation
Recurring
Costs
7

Life Cycle Cost Report
Caretaker StatusAlternative:
Year Cumulative
Net Present
Value
2018 $2,510
2019 $5,007
2020 $7,493
2021 $9,966
2022 $12,427
2023 $14,877
2024 $17,314
2025 $19,739
2026 $22,153
2027 $24,555
2028 $26,945
2029 $29,323
2030 $31,690
2031 $34,045
2032 $36,389
2033 $38,721
2034 $41,042
2035 $43,352
2036 $45,650
2037 $307,049
Discount Rate: 2.5%
Period of Analysis: 20 years
8
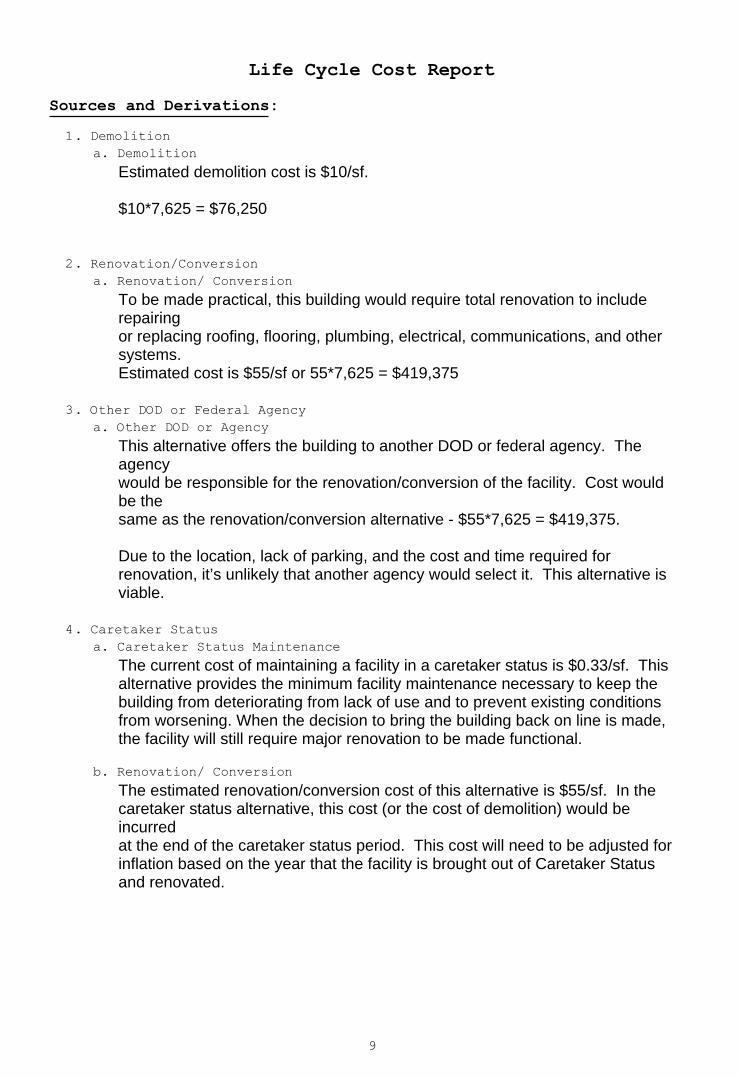
Life Cycle Cost Report
Sources and Derivations:
. Demolition
. Demolition
Estimated demolition cost is $10/sf.
$10*7,625 = $76,250
a
1
. Renovation/Conversion
. Renovation/ Conversion
To be made practical, this building would require total renovation to includerepairingor replacing roofing, flooring, plumbing, electrical, communications, and othersystems.Estimated cost is $55/sf or 55*7,625 = $419,375
a
2
. Other DOD or Federal Agency
. Other DOD or Agency
This alternative offers the building to another DOD or federal agency. Theagencywould be responsible for the renovation/conversion of the facility. Cost wouldbe thesame as the renovation/conversion alternative - $55*7,625 = $419,375.
Due to the location, lack of parking, and the cost and time required forrenovation, it’s unlikely that another agency would select it. This alternative isviable.
a
3
. Caretaker Status
. Caretaker Status Maintenance
The current cost of maintaining a facility in a caretaker status is $0.33/sf. Thisalternative provides the minimum facility maintenance necessary to keep thebuilding from deteriorating from lack of use and to prevent existing conditionsfrom worsening. When the decision to bring the building back on line is made,the facility will still require major renovation to be made functional.
a
. Renovation/ Conversion
The estimated renovation/conversion cost of this alternative is $55/sf. In thecaretaker status alternative, this cost (or the cost of demolition) would beincurredat the end of the caretaker status period. This cost will need to be adjusted forinflation based on the year that the facility is brought out of Caretaker Statusand renovated.
b
4
9

Discount Rate Sensitivity Analysis
Graph of Net Present Value vs. Discount Rate
Discount Rate (%)
Dollars
0.7 %NPV rankings change at the following discount rates:
10
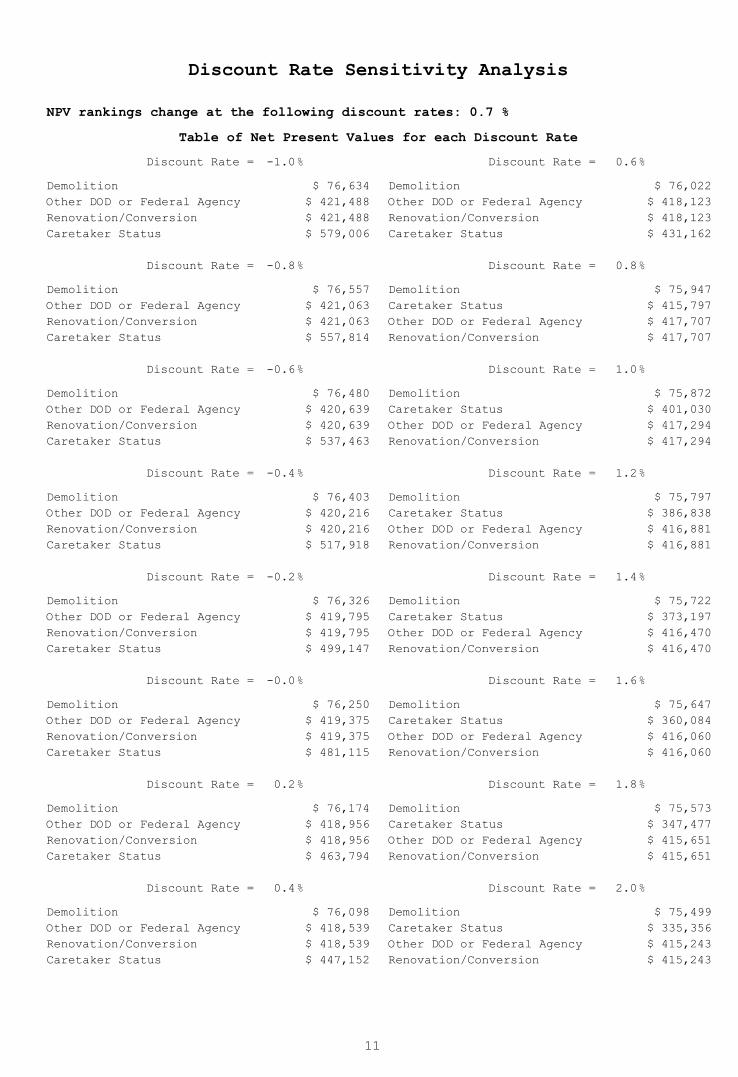
Discount Rate Sensitivity Analysis
NPV rankings change at the following discount rates:
Table of Net Present Values for each Discount Rate
0.7 %
Discount Rate = -1.0%
Demolition $ 76,634
Other DOD or Federal Agency $ 421,488
Renovation/Conversion $ 421,488
Caretaker Status $ 579,006
Discount Rate = -0.8%
Demolition $ 76,557
Other DOD or Federal Agency $ 421,063
Renovation/Conversion $ 421,063
Caretaker Status $ 557,814
Discount Rate = -0.6%
Demolition $ 76,480
Other DOD or Federal Agency $ 420,639
Renovation/Conversion $ 420,639
Caretaker Status $ 537,463
Discount Rate = -0.4%
Demolition $ 76,403
Other DOD or Federal Agency $ 420,216
Renovation/Conversion $ 420,216
Caretaker Status $ 517,918
Discount Rate = -0.2%
Demolition $ 76,326
Other DOD or Federal Agency $ 419,795
Renovation/Conversion $ 419,795
Caretaker Status $ 499,147
Discount Rate = -0.0%
Demolition $ 76,250
Other DOD or Federal Agency $ 419,375
Renovation/Conversion $ 419,375
Caretaker Status $ 481,115
Discount Rate = 0.2%
Demolition $ 76,174
Other DOD or Federal Agency $ 418,956
Renovation/Conversion $ 418,956
Caretaker Status $ 463,794
Discount Rate = 0.4%
Demolition $ 76,098
Other DOD or Federal Agency $ 418,539
Renovation/Conversion $ 418,539
Caretaker Status $ 447,152
Discount Rate = 0.6%
Demolition $ 76,022
Other DOD or Federal Agency $ 418,123
Renovation/Conversion $ 418,123
Caretaker Status $ 431,162
Discount Rate = 0.8%
Demolition $ 75,947
Caretaker Status $ 415,797
Other DOD or Federal Agency $ 417,707
Renovation/Conversion $ 417,707
Discount Rate = 1.0%
Demolition $ 75,872
Caretaker Status $ 401,030
Other DOD or Federal Agency $ 417,294
Renovation/Conversion $ 417,294
Discount Rate = 1.2%
Demolition $ 75,797
Caretaker Status $ 386,838
Other DOD or Federal Agency $ 416,881
Renovation/Conversion $ 416,881
Discount Rate = 1.4%
Demolition $ 75,722
Caretaker Status $ 373,197
Other DOD or Federal Agency $ 416,470
Renovation/Conversion $ 416,470
Discount Rate = 1.6%
Demolition $ 75,647
Caretaker Status $ 360,084
Other DOD or Federal Agency $ 416,060
Renovation/Conversion $ 416,060
Discount Rate = 1.8%
Demolition $ 75,573
Caretaker Status $ 347,477
Other DOD or Federal Agency $ 415,651
Renovation/Conversion $ 415,651
Discount Rate = 2.0%
Demolition $ 75,499
Caretaker Status $ 335,356
Other DOD or Federal Agency $ 415,243
Renovation/Conversion $ 415,243
11

Discount Rate Sensitivity Analysis
NPV rankings change at the following discount rates:
Table of Net Present Values for each Discount Rate
0.7 %
Discount Rate = 2.2%
Demolition $ 75,425
Caretaker Status $ 323,700
Other DOD or Federal Agency $ 414,837
Renovation/Conversion $ 414,837
Discount Rate = 2.4%
Demolition $ 75,351
Caretaker Status $ 312,492
Other DOD or Federal Agency $ 414,431
Renovation/Conversion $ 414,431
Discount Rate = 2.6%
Demolition $ 75,278
Caretaker Status $ 301,712
Other DOD or Federal Agency $ 414,027
Renovation/Conversion $ 414,027
Discount Rate = 2.8%
Demolition $ 75,204
Caretaker Status $ 291,344
Other DOD or Federal Agency $ 413,624
Renovation/Conversion $ 413,624
Discount Rate = 3.0%
Demolition $ 75,131
Caretaker Status $ 281,370
Other DOD or Federal Agency $ 413,222
Renovation/Conversion $ 413,222
Discount Rate = 3.2%
Demolition $ 75,059
Caretaker Status $ 271,775
Other DOD or Federal Agency $ 412,822
Renovation/Conversion $ 412,822
Discount Rate = 3.4%
Demolition $ 74,986
Caretaker Status $ 262,543
Other DOD or Federal Agency $ 412,422
Renovation/Conversion $ 412,422
Discount Rate = 3.6%
Demolition $ 74,913
Caretaker Status $ 253,661
Other DOD or Federal Agency $ 412,024
Renovation/Conversion $ 412,024
Discount Rate = 3.8%
Demolition $ 74,841
Caretaker Status $ 245,113
Other DOD or Federal Agency $ 411,627
Renovation/Conversion $ 411,627
Discount Rate = 4.0%
Demolition $ 74,769
Caretaker Status $ 236,887
Other DOD or Federal Agency $ 411,231
Renovation/Conversion $ 411,231
Discount Rate = 4.2%
Demolition $ 74,697
Caretaker Status $ 228,969
Other DOD or Federal Agency $ 410,836
Renovation/Conversion $ 410,836
Discount Rate = 4.4%
Demolition $ 74,626
Caretaker Status $ 221,348
Other DOD or Federal Agency $ 410,442
Renovation/Conversion $ 410,442
Discount Rate = 4.6%
Demolition $ 74,555
Caretaker Status $ 214,011
Other DOD or Federal Agency $ 410,050
Renovation/Conversion $ 410,050
Discount Rate = 4.8%
Demolition $ 74,483
Caretaker Status $ 206,948
Other DOD or Federal Agency $ 409,658
Renovation/Conversion $ 409,658
Discount Rate = 5.0%
Demolition $ 74,412
Caretaker Status $ 200,147
Other DOD or Federal Agency $ 409,268
Renovation/Conversion $ 409,268
Discount Rate = 5.2%
Demolition $ 74,342
Caretaker Status $ 193,598
Other DOD or Federal Agency $ 408,879
Renovation/Conversion $ 408,879
12
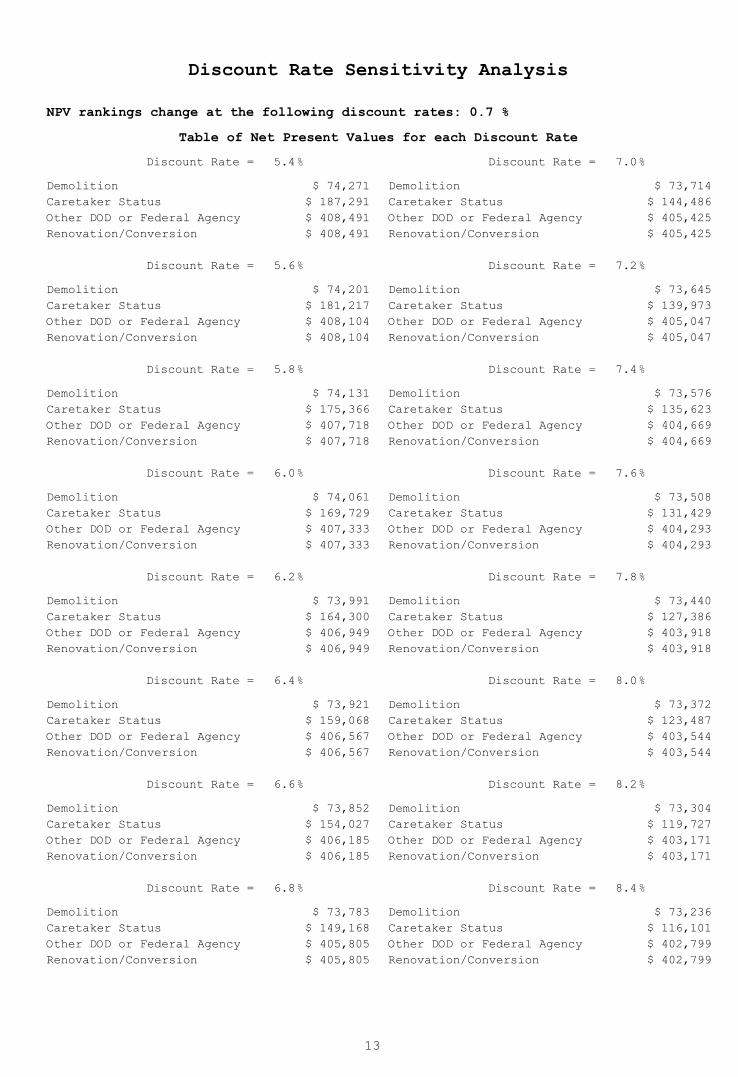
Discount Rate Sensitivity Analysis
NPV rankings change at the following discount rates:
Table of Net Present Values for each Discount Rate
0.7 %
Discount Rate = 5.4%
Demolition $ 74,271
Caretaker Status $ 187,291
Other DOD or Federal Agency $ 408,491
Renovation/Conversion $ 408,491
Discount Rate = 5.6%
Demolition $ 74,201
Caretaker Status $ 181,217
Other DOD or Federal Agency $ 408,104
Renovation/Conversion $ 408,104
Discount Rate = 5.8%
Demolition $ 74,131
Caretaker Status $ 175,366
Other DOD or Federal Agency $ 407,718
Renovation/Conversion $ 407,718
Discount Rate = 6.0%
Demolition $ 74,061
Caretaker Status $ 169,729
Other DOD or Federal Agency $ 407,333
Renovation/Conversion $ 407,333
Discount Rate = 6.2%
Demolition $ 73,991
Caretaker Status $ 164,300
Other DOD or Federal Agency $ 406,949
Renovation/Conversion $ 406,949
Discount Rate = 6.4%
Demolition $ 73,921
Caretaker Status $ 159,068
Other DOD or Federal Agency $ 406,567
Renovation/Conversion $ 406,567
Discount Rate = 6.6%
Demolition $ 73,852
Caretaker Status $ 154,027
Other DOD or Federal Agency $ 406,185
Renovation/Conversion $ 406,185
Discount Rate = 6.8%
Demolition $ 73,783
Caretaker Status $ 149,168
Other DOD or Federal Agency $ 405,805
Renovation/Conversion $ 405,805
Discount Rate = 7.0%
Demolition $ 73,714
Caretaker Status $ 144,486
Other DOD or Federal Agency $ 405,425
Renovation/Conversion $ 405,425
Discount Rate = 7.2%
Demolition $ 73,645
Caretaker Status $ 139,973
Other DOD or Federal Agency $ 405,047
Renovation/Conversion $ 405,047
Discount Rate = 7.4%
Demolition $ 73,576
Caretaker Status $ 135,623
Other DOD or Federal Agency $ 404,669
Renovation/Conversion $ 404,669
Discount Rate = 7.6%
Demolition $ 73,508
Caretaker Status $ 131,429
Other DOD or Federal Agency $ 404,293
Renovation/Conversion $ 404,293
Discount Rate = 7.8%
Demolition $ 73,440
Caretaker Status $ 127,386
Other DOD or Federal Agency $ 403,918
Renovation/Conversion $ 403,918
Discount Rate = 8.0%
Demolition $ 73,372
Caretaker Status $ 123,487
Other DOD or Federal Agency $ 403,544
Renovation/Conversion $ 403,544
Discount Rate = 8.2%
Demolition $ 73,304
Caretaker Status $ 119,727
Other DOD or Federal Agency $ 403,171
Renovation/Conversion $ 403,171
Discount Rate = 8.4%
Demolition $ 73,236
Caretaker Status $ 116,101
Other DOD or Federal Agency $ 402,799
Renovation/Conversion $ 402,799
13

Discount Rate Sensitivity Analysis
NPV rankings change at the following discount rates:
Table of Net Present Values for each Discount Rate
0.7 %
Discount Rate = 8.6%
Demolition $ 73,169
Caretaker Status $ 112,603
Other DOD or Federal Agency $ 402,427
Renovation/Conversion $ 402,427
Discount Rate = 8.8%
Demolition $ 73,101
Caretaker Status $ 109,229
Other DOD or Federal Agency $ 402,057
Renovation/Conversion $ 402,057
Discount Rate = 9.0%
Demolition $ 73,034
Caretaker Status $ 105,975
Other DOD or Federal Agency $ 401,688
Renovation/Conversion $ 401,688
Discount Rate = 9.2%
Demolition $ 72,967
Caretaker Status $ 102,834
Other DOD or Federal Agency $ 401,320
Renovation/Conversion $ 401,320
Discount Rate = 9.4%
Demolition $ 72,901
Caretaker Status $ 99,805
Other DOD or Federal Agency $ 400,953
Renovation/Conversion $ 400,953
Discount Rate = 9.6%
Demolition $ 72,834
Caretaker Status $ 96,881
Other DOD or Federal Agency $ 400,587
Renovation/Conversion $ 400,587
Discount Rate = 9.8%
Demolition $ 72,768
Caretaker Status $ 94,059
Other DOD or Federal Agency $ 400,222
Renovation/Conversion $ 400,222
Discount Rate = 10.0%
Demolition $ 72,702
Caretaker Status $ 91,335
Other DOD or Federal Agency $ 399,858
Renovation/Conversion $ 399,858
14

Date Generated:
Time Generated:
Version:
12 June 2018
12.48.09
Building 233 Disposal
Economic Analysis
2018
Project Title
:
Type of Analysis
Discount Rate
Period of Analysis
Start Year
Base Year
Dollar Analysis
:
:
:
:
:
:
Fort Benning Facilities Reduction Program
Mission Requirement - Full
2.5%
2018
20 years
Current Dollars
Project Objective :
Executive Summary Report
To determine the most economical course of action for
Building 233 that meets the EXORD requirement to reduce
excess square footage.
Building 233 has been identified as a facility for disposal per HQDA EXORD 164-15.
HQDA EXORD 164-15, "Reduce the Installation Facility Footprint," published March 2015,holds commanders and planners accountable for making all reasonable efforts to maximizespace utilization, consolidate units into our best facilities, and dispose of excess assets.Although the Reduce the Footprint (RtF) acronym has taken hold, the EXORD is really aboutthe efficient management of our real property assets. Significant cost reductions can only beachieved with transformational changes that enable us to reduce our expenditures on facilitiesand services.
Background:
ECONPACK 4.0.32
Alternatives Considered for this Analysis:
Demolition - This alternative will demolish the building and restore the site
to a grassed area. This alternative meets the requirements of the Executive
Order Number 164-15 to dispose of excess facilities. Demolition cost is
estimated to be $10/sf – 3,840*10 = $38,400. This is a viable alternative.
This is a viable alternative.
Renovation/Conversion - Conversion/Alternate Use - This alternative renovates
the facility for use for another Category Code. The best option for conversion
of building, based on its current configuration, is to use it for Category Code
44224, Organizational Storage. To be made practical, this building would
require total renovation to include repairing or replacing roofing, flooring,
plumbing, electrical, communications, and other systems. Estimated cost is
$55/sf or 3,840*55 = $211,200. However, there currently is an excess of space
in this category code and converting into this category would violate the
intent of the Exord. This is a viable alternative. This is a viable
alternative.
Other DOD or Federal Agency - This alternative offers the building to another
DOD or federal agency. The agency would be responsible for the
renovation/conversion of the facility. Cost would be the same as the
renovation/conversion alternative - $55*3,840 = $211,200. Due to the relatively
small size of this building (3,840 sf), location, lack of parking, and the cost
and time required for renovation, it’s unlikely that another agency would
select it. This alternative is viable. This is a viable alternative.
Caretaker Status - This alternative maintains the facility in its current
1

condition to be used later in its current category code or after conversion
into a different category code. A facility in caretaker status is maintained
to the point of preventing problems from developing or to keep existing
problems from worsening. The cost is based on an annual, per square foot
expense of $0.33. This would be a reoccurring annual expense until the
facility is put back into use. With this alternative, renovation/repair would
still be required prior to re-use and mostly likely at a much higher cost.
This is a viable alternative.
Email Address
706-545-3229Phone Number
Master Planning Division, DPW
Organization
Dean MillerAction Officer :
:
:
:
Economic Indicators:
Alternative NPV
Demolition $ 37,929
Renovation/Conversion $ 208,608
Other DOD or Federal Agency $ 208,608
Caretaker Status $ 154,631
1.This building cannot be used in its current state due to its condition.2.Renovation and/or conversion is necessary for the building to be reutilized in anotherCategory Code.
Assumptions of the Analysis:
Results and Recommendations:
Based on the results of this analysis, the most economical alternative that meets the intentof Exord 164-15 is demolition. Fort Benning does not have a need for the facility in itscurrent design use category code. Conversion to another category code for Fort Benninguse is undesired due to its size, layout, location and lack of interested units.No other Federal Agency has expressed interest in using the building, either in its currentconfiguration or converted into another category code. Therefore, demolition of Building233 is the most economical alternative for the Army.
2

Economic Analysis Graph
Net Present Value
Year
Dollars
3

Life Cycle Cost Report
DemolitionAlternative:
Year Demolition Total
Annual
Outlays
Middle
of Year
Discount
Factors
Present
Value
Cumulative
Net Present
Value
$37,9292018 $37,929$38,400$38,400 0.988
$37,9292019 $0$0$0 0.964
$37,9292020 $0$0$0 0.94
$37,9292021 $0$0$0 0.917
$37,9292022 $0$0$0 0.895
$37,9292023 $0$0$0 0.873
$37,9292024 $0$0$0 0.852
$37,9292025 $0$0$0 0.831
$37,9292026 $0$0$0 0.811
$37,9292027 $0$0$0 0.791
$37,9292028 $0$0$0 0.772
$37,9292029 $0$0$0 0.753
$37,9292030 $0$0$0 0.734
$37,9292031 $0$0$0 0.717
$37,9292032 $0$0$0 0.699
$37,9292033 $0$0$0 0.682
$37,9292034 $0$0$0 0.665
$37,9292035 $0$0$0 0.649
$37,9292036 $0$0$0 0.633
$37,9292037 $0$0$0 0.618
%NPV 100.00%
Discounting
Convention
Inflation
Schedule
Category /
Residual
Schedule
$37,929
M-O-Y
No Inflation
Non-Recurring
Costs
Discount Rate: 2.5%
Period of Analysis: 20 years
4

Life Cycle Cost Report
Renovation/ConversionAlternative:
Year Renovation/
Conversion
Total
Annual
Outlays
Middle
of Year
Discount
Factors
Present
Value
Cumulative
Net Present
Value
$208,6082018 $208,608$211,200$211,200 0.988
$208,6082019 $0$0$0 0.964
$208,6082020 $0$0$0 0.94
$208,6082021 $0$0$0 0.917
$208,6082022 $0$0$0 0.895
$208,6082023 $0$0$0 0.873
$208,6082024 $0$0$0 0.852
$208,6082025 $0$0$0 0.831
$208,6082026 $0$0$0 0.811
$208,6082027 $0$0$0 0.791
$208,6082028 $0$0$0 0.772
$208,6082029 $0$0$0 0.753
$208,6082030 $0$0$0 0.734
$208,6082031 $0$0$0 0.717
$208,6082032 $0$0$0 0.699
$208,6082033 $0$0$0 0.682
$208,6082034 $0$0$0 0.665
$208,6082035 $0$0$0 0.649
$208,6082036 $0$0$0 0.633
$208,6082037 $0$0$0 0.618
%NPV 100.00%
Discounting
Convention
Inflation
Schedule
Category /
Residual
Schedule
$208,608
M-O-Y
No Inflation
Non-Recurring
Costs
Discount Rate: 2.5%
Period of Analysis: 20 years
5

Life Cycle Cost Report
Other DOD or Federal AgencyAlternative:
Year Renovation/
Conversion
Total
Annual
Outlays
Middle
of Year
Discount
Factors
Present
Value
Cumulative
Net Present
Value
$208,6082018 $208,608$211,200$211,200 0.988
$208,6082019 $0$0$0 0.964
$208,6082020 $0$0$0 0.94
$208,6082021 $0$0$0 0.917
$208,6082022 $0$0$0 0.895
$208,6082023 $0$0$0 0.873
$208,6082024 $0$0$0 0.852
$208,6082025 $0$0$0 0.831
$208,6082026 $0$0$0 0.811
$208,6082027 $0$0$0 0.791
$208,6082028 $0$0$0 0.772
$208,6082029 $0$0$0 0.753
$208,6082030 $0$0$0 0.734
$208,6082031 $0$0$0 0.717
$208,6082032 $0$0$0 0.699
$208,6082033 $0$0$0 0.682
$208,6082034 $0$0$0 0.665
$208,6082035 $0$0$0 0.649
$208,6082036 $0$0$0 0.633
$208,6082037 $0$0$0 0.618
%NPV 100.00%
Discounting
Convention
Inflation
Schedule
Category /
Residual
Schedule
$208,608
M-O-Y
No Inflation
Non-Recurring
Costs
Discount Rate: 2.5%
Period of Analysis: 20 years
6

Life Cycle Cost Report
Caretaker StatusAlternative:
Year Caretaker
Status
Renovation Total
Annual
Outlays
Middle
of Year
Discount
Factors
Present
Value
$1,2642018 0.988$0$1,280 $1,280
$1,2582019 0.964$0$1,305 $1,305
$1,2522020 0.94$0$1,331 $1,331
$1,2452021 0.917$0$1,358 $1,358
$1,2392022 0.895$0$1,385 $1,385
$1,2332023 0.873$0$1,413 $1,413
$1,2272024 0.852$0$1,441 $1,441
$1,2212025 0.831$0$1,470 $1,470
$1,2152026 0.811$0$1,499 $1,499
$1,2092027 0.791$0$1,529 $1,529
$1,2042028 0.772$0$1,560 $1,560
$1,1982029 0.753$0$1,591 $1,591
$1,1922030 0.734$0$1,623 $1,623
$1,1862031 0.717$0$1,655 $1,655
$1,1802032 0.699$0$1,688 $1,688
$1,1752033 0.682$0$1,722 $1,722
$1,1692034 0.665$0$1,757 $1,757
$1,1632035 0.649$0$1,792 $1,792
$1,1572036 0.633$0$1,828 $1,828
$131,6422037 0.618$211,200$1,864 $213,064
%NPV 15.61% 84.39%
Discounting
Convention
Inflation
Schedule
Category /
Residual
Schedule
$24,140
M-O-Y
2017 General
Recurring
Costs
$130,490
M-O-Y
No Inflation
Recurring
Costs
7

Life Cycle Cost Report
Caretaker StatusAlternative:
Year Cumulative
Net Present
Value
2018 $1,264
2019 $2,522
2020 $3,773
2021 $5,019
2022 $6,258
2023 $7,492
2024 $8,719
2025 $9,940
2026 $11,156
2027 $12,365
2028 $13,569
2029 $14,767
2030 $15,958
2031 $17,144
2032 $18,325
2033 $19,499
2034 $20,668
2035 $21,831
2036 $22,989
2037 $154,631
Discount Rate: 2.5%
Period of Analysis: 20 years
8

Life Cycle Cost Report
Sources and Derivations:
. Demolition
. Demolition
Estimated demolition cost is $10/sf.
$10*3840 = $38,400
a
1
. Renovation/Conversion
. Renovation/ Conversion
To be made practical, this building would require total renovation to includerepairingor replacing roofing, flooring, plumbing, electrical, communications, and othersystems.Estimated cost is $55/sf or 55*3,840 = $211,200.
a
2
. Other DOD or Federal Agency
. Renovation/ Conversion
This alternative offers the building to another DOD or federal agency. Theagencywould be responsible for the renovation/conversion of the facility. Cost wouldbe thesame as the renovation/conversion alternative - $55*3,840 = $211,200.
Due to the relatively small size of this building (3,840 sf), location, lack ofparking, and the cost and time required for renovation, it’s unlikely that anotheragency would select it. This alternative is viable.
a
3
. Caretaker Status
. Caretaker Status
The current cost of maintaining a facility in a caretaker status is $0.33/sf.a
. Renovation
The estimated renovation/conversion cost of this alternative is $55/sf. In thecaretaker status alternative, this cost (or the cost of demolition) would beincurred at the end of the caretaker status period. This cost will need to beadjusted for inflation based on the year that the facility is brought out ofCaretaker Status and renovated.
b
4
9

Discount Rate Sensitivity Analysis
Graph of Net Present Value vs. Discount Rate
Discount Rate (%)
Dollars
0.7 %NPV rankings change at the following discount rates:
10

Discount Rate Sensitivity Analysis
NPV rankings change at the following discount rates:
Table of Net Present Values for each Discount Rate
0.7 %
Discount Rate = -1.0%
Demolition $ 38,593
Other DOD or Federal Agency $ 212,264
Renovation/Conversion $ 212,264
Caretaker Status $ 291,589
Discount Rate = -0.8%
Demolition $ 38,555
Other DOD or Federal Agency $ 212,050
Renovation/Conversion $ 212,050
Caretaker Status $ 280,917
Discount Rate = -0.6%
Demolition $ 38,516
Other DOD or Federal Agency $ 211,836
Renovation/Conversion $ 211,836
Caretaker Status $ 270,668
Discount Rate = -0.4%
Demolition $ 38,477
Other DOD or Federal Agency $ 211,624
Renovation/Conversion $ 211,624
Caretaker Status $ 260,825
Discount Rate = -0.2%
Demolition $ 38,438
Other DOD or Federal Agency $ 211,412
Renovation/Conversion $ 211,412
Caretaker Status $ 251,372
Discount Rate = -0.0%
Demolition $ 38,400
Other DOD or Federal Agency $ 211,200
Renovation/Conversion $ 211,200
Caretaker Status $ 242,291
Discount Rate = 0.2%
Demolition $ 38,362
Other DOD or Federal Agency $ 210,989
Renovation/Conversion $ 210,989
Caretaker Status $ 233,568
Discount Rate = 0.4%
Demolition $ 38,323
Other DOD or Federal Agency $ 210,779
Renovation/Conversion $ 210,779
Caretaker Status $ 225,187
Discount Rate = 0.6%
Demolition $ 38,285
Other DOD or Federal Agency $ 210,569
Renovation/Conversion $ 210,569
Caretaker Status $ 217,134
Discount Rate = 0.8%
Demolition $ 38,247
Caretaker Status $ 209,396
Other DOD or Federal Agency $ 210,360
Renovation/Conversion $ 210,360
Discount Rate = 1.0%
Demolition $ 38,209
Caretaker Status $ 201,960
Other DOD or Federal Agency $ 210,152
Renovation/Conversion $ 210,152
Discount Rate = 1.2%
Demolition $ 38,172
Caretaker Status $ 194,813
Other DOD or Federal Agency $ 209,944
Renovation/Conversion $ 209,944
Discount Rate = 1.4%
Demolition $ 38,134
Caretaker Status $ 187,943
Other DOD or Federal Agency $ 209,737
Renovation/Conversion $ 209,737
Discount Rate = 1.6%
Demolition $ 38,096
Caretaker Status $ 181,339
Other DOD or Federal Agency $ 209,530
Renovation/Conversion $ 209,530
Discount Rate = 1.8%
Demolition $ 38,059
Caretaker Status $ 174,990
Other DOD or Federal Agency $ 209,324
Renovation/Conversion $ 209,324
Discount Rate = 2.0%
Demolition $ 38,022
Caretaker Status $ 168,886
Other DOD or Federal Agency $ 209,119
Renovation/Conversion $ 209,119
11

Discount Rate Sensitivity Analysis
NPV rankings change at the following discount rates:
Table of Net Present Values for each Discount Rate
0.7 %
Discount Rate = 2.2%
Demolition $ 37,984
Caretaker Status $ 163,016
Other DOD or Federal Agency $ 208,914
Renovation/Conversion $ 208,914
Discount Rate = 2.4%
Demolition $ 37,947
Caretaker Status $ 157,371
Other DOD or Federal Agency $ 208,710
Renovation/Conversion $ 208,710
Discount Rate = 2.6%
Demolition $ 37,910
Caretaker Status $ 151,943
Other DOD or Federal Agency $ 208,507
Renovation/Conversion $ 208,507
Discount Rate = 2.8%
Demolition $ 37,873
Caretaker Status $ 146,721
Other DOD or Federal Agency $ 208,304
Renovation/Conversion $ 208,304
Discount Rate = 3.0%
Demolition $ 37,837
Caretaker Status $ 141,698
Other DOD or Federal Agency $ 208,102
Renovation/Conversion $ 208,102
Discount Rate = 3.2%
Demolition $ 37,800
Caretaker Status $ 136,866
Other DOD or Federal Agency $ 207,900
Renovation/Conversion $ 207,900
Discount Rate = 3.4%
Demolition $ 37,763
Caretaker Status $ 132,217
Other DOD or Federal Agency $ 207,699
Renovation/Conversion $ 207,699
Discount Rate = 3.6%
Demolition $ 37,727
Caretaker Status $ 127,744
Other DOD or Federal Agency $ 207,498
Renovation/Conversion $ 207,498
Discount Rate = 3.8%
Demolition $ 37,691
Caretaker Status $ 123,439
Other DOD or Federal Agency $ 207,298
Renovation/Conversion $ 207,298
Discount Rate = 4.0%
Demolition $ 37,654
Caretaker Status $ 119,297
Other DOD or Federal Agency $ 207,099
Renovation/Conversion $ 207,099
Discount Rate = 4.2%
Demolition $ 37,618
Caretaker Status $ 115,309
Other DOD or Federal Agency $ 206,900
Renovation/Conversion $ 206,900
Discount Rate = 4.4%
Demolition $ 37,582
Caretaker Status $ 111,471
Other DOD or Federal Agency $ 206,702
Renovation/Conversion $ 206,702
Discount Rate = 4.6%
Demolition $ 37,546
Caretaker Status $ 107,776
Other DOD or Federal Agency $ 206,504
Renovation/Conversion $ 206,504
Discount Rate = 4.8%
Demolition $ 37,510
Caretaker Status $ 104,219
Other DOD or Federal Agency $ 206,307
Renovation/Conversion $ 206,307
Discount Rate = 5.0%
Demolition $ 37,475
Caretaker Status $ 100,794
Other DOD or Federal Agency $ 206,110
Renovation/Conversion $ 206,110
Discount Rate = 5.2%
Demolition $ 37,439
Caretaker Status $ 97,496
Other DOD or Federal Agency $ 205,914
Renovation/Conversion $ 205,914
12

Discount Rate Sensitivity Analysis
NPV rankings change at the following discount rates:
Table of Net Present Values for each Discount Rate
0.7 %
Discount Rate = 5.4%
Demolition $ 37,403
Caretaker Status $ 94,320
Other DOD or Federal Agency $ 205,719
Renovation/Conversion $ 205,719
Discount Rate = 5.6%
Demolition $ 37,368
Caretaker Status $ 91,261
Other DOD or Federal Agency $ 205,524
Renovation/Conversion $ 205,524
Discount Rate = 5.8%
Demolition $ 37,333
Caretaker Status $ 88,314
Other DOD or Federal Agency $ 205,329
Renovation/Conversion $ 205,329
Discount Rate = 6.0%
Demolition $ 37,297
Caretaker Status $ 85,476
Other DOD or Federal Agency $ 205,136
Renovation/Conversion $ 205,136
Discount Rate = 6.2%
Demolition $ 37,262
Caretaker Status $ 82,741
Other DOD or Federal Agency $ 204,942
Renovation/Conversion $ 204,942
Discount Rate = 6.4%
Demolition $ 37,227
Caretaker Status $ 80,107
Other DOD or Federal Agency $ 204,750
Renovation/Conversion $ 204,750
Discount Rate = 6.6%
Demolition $ 37,192
Caretaker Status $ 77,568
Other DOD or Federal Agency $ 204,557
Renovation/Conversion $ 204,557
Discount Rate = 6.8%
Demolition $ 37,157
Caretaker Status $ 75,121
Other DOD or Federal Agency $ 204,366
Renovation/Conversion $ 204,366
Discount Rate = 7.0%
Demolition $ 37,123
Caretaker Status $ 72,763
Other DOD or Federal Agency $ 204,175
Renovation/Conversion $ 204,175
Discount Rate = 7.2%
Demolition $ 37,088
Caretaker Status $ 70,491
Other DOD or Federal Agency $ 203,984
Renovation/Conversion $ 203,984
Discount Rate = 7.4%
Demolition $ 37,053
Caretaker Status $ 68,300
Other DOD or Federal Agency $ 203,794
Renovation/Conversion $ 203,794
Discount Rate = 7.6%
Demolition $ 37,019
Caretaker Status $ 66,188
Other DOD or Federal Agency $ 203,605
Renovation/Conversion $ 203,605
Discount Rate = 7.8%
Demolition $ 36,985
Caretaker Status $ 64,151
Other DOD or Federal Agency $ 203,416
Renovation/Conversion $ 203,416
Discount Rate = 8.0%
Demolition $ 36,950
Caretaker Status $ 62,188
Other DOD or Federal Agency $ 203,227
Renovation/Conversion $ 203,227
Discount Rate = 8.2%
Demolition $ 36,916
Caretaker Status $ 60,294
Other DOD or Federal Agency $ 203,039
Renovation/Conversion $ 203,039
Discount Rate = 8.4%
Demolition $ 36,882
Caretaker Status $ 58,468
Other DOD or Federal Agency $ 202,852
Renovation/Conversion $ 202,852
13

Discount Rate Sensitivity Analysis
NPV rankings change at the following discount rates:
Table of Net Present Values for each Discount Rate
0.7 %
Discount Rate = 8.6%
Demolition $ 36,848
Caretaker Status $ 56,707
Other DOD or Federal Agency $ 202,665
Renovation/Conversion $ 202,665
Discount Rate = 8.8%
Demolition $ 36,814
Caretaker Status $ 55,008
Other DOD or Federal Agency $ 202,479
Renovation/Conversion $ 202,479
Discount Rate = 9.0%
Demolition $ 36,781
Caretaker Status $ 53,369
Other DOD or Federal Agency $ 202,293
Renovation/Conversion $ 202,293
Discount Rate = 9.2%
Demolition $ 36,747
Caretaker Status $ 51,787
Other DOD or Federal Agency $ 202,108
Renovation/Conversion $ 202,108
Discount Rate = 9.4%
Demolition $ 36,713
Caretaker Status $ 50,261
Other DOD or Federal Agency $ 201,923
Renovation/Conversion $ 201,923
Discount Rate = 9.6%
Demolition $ 36,680
Caretaker Status $ 48,789
Other DOD or Federal Agency $ 201,738
Renovation/Conversion $ 201,738
Discount Rate = 9.8%
Demolition $ 36,646
Caretaker Status $ 47,368
Other DOD or Federal Agency $ 201,555
Renovation/Conversion $ 201,555
Discount Rate = 10.0%
Demolition $ 36,613
Caretaker Status $ 45,996
Other DOD or Federal Agency $ 201,371
Renovation/Conversion $ 201,371
14

Date Generated:
Time Generated:
Version:
12 June 2018
12.48.49
Building 239 Disposal
Economic Analysis
2018
Project Title
:
Type of Analysis
Discount Rate
Period of Analysis
Start Year
Base Year
Dollar Analysis
:
:
:
:
:
:
Facilities Reduction Program
Mission Requirement - Full
2.5%
2018
20 years
Current Dollars
Project Objective :
Executive Summary Report
To determine the most economical course of action for
Building 239 that meets the EXORD requirement to reduce
excess square footage.
Building 239 has been identified as a facility for disposal per HQDA EXORD 164-15.
HQDA EXORD 164-15, "Reduce the Installation Facility Footprint," published March 2015,holds commanders and planners accountable for making all reasonable efforts to maximizespace utilization, consolidate units into our best facilities, and dispose of excess assets.Although the Reduce the Footprint (RtF) acronym has taken hold, the EXORD is really aboutthe efficient management of our real property assets. Significant cost reductions can only beachieved with transformational changes that enable us to reduce our expenditures on facilitiesand services.
Background:
ECONPACK 4.0.32
Alternatives Considered for this Analysis:
Demolition - This alternative will demolish the building and restore the site
to a grassed area. This alternative meets the requirements of the Executive
Order Number 164-15 to dispose of excess facilities. Demolition cost is
estimated to be $10/sf – 2,817*10 = $28,170. This is a viable alternative.
This is a viable alternative.
Renovation/Conversion - Conversion/Alternate Use - This alternative renovates
the facility for use for another Category Code. The best option for conversion
of building, based on its current configuration, is to use it for Category Code
44224, Organizational Storage. To be made practical, this building would
require total renovation to include repairing or replacing roofing, flooring,
plumbing, electrical, communications, and other systems. Estimated cost is
$55/sf or 2,817*55= $154,935. However, there currently is an excess of space
in this category code and converting into this category would violate the
intent of the Exord. This is a viable alternative
This is a viable alternative.
Other DOD or Federal Agency Facilities - This alternative offers the building
to another DOD or federal agency. The agency would be responsible for the
renovation/conversion of the facility. Cost would be the same as the
renovation/conversion alternative - $55*2,817 = $154,935. Due to the relatively
small size of this building (2,817 sf), location, lack of parking, and the cost
and time required for renovation, it’s unlikely that another agency would
select it. This alternative is viable.
1

This is a viable alternative.
Caretaker Status - This alternative maintains the facility in its current
condition to be used later in its current category code or after conversion
into a different category code. A facility in caretaker status is maintained
to the point of preventing problems from developing or to keep existing
problems from worsening. The cost is based on an annual, per square foot
expense of $0.33 or $0.33*2817 = $929.61/yr. This would be a reoccurring
annual expense until the facility is put back into use. With this alternative,
renovation/repair would still be required prior to re-use and mostly likely at
a much higher cost.
This is a viable alternative.
Email Address
706-545-3229Phone Number
Master Planning Division, DPW
Organization
Dean MillerAction Officer :
:
:
:
Economic Indicators:
Alternative NPV
Demolition $ 27,824
Renovation/Conversion $ 153,034
Other DOD or Federal Agency Facilities $ 144,144
Caretaker Status $ 110,405
1.This building cannot be used in its current state due to its condition.2.Renovation and/or conversion is necessary for the building to be reutilized in anotherCategory Code.
Assumptions of the Analysis:
Results and Recommendations:
Based on the results of this analysis, the most economical alternative that meets the intentof Exord 164-15 is demolition. Fort Benning does not have a need for the facility in itscurrent design use category code. Conversion to another category code for Fort Benninguse is undesired due to its size, layout, location and lack of interested units.No other Federal Agency has expressed interest in using the building, either in its currentconfiguration or converted into another category code. Therefore, demolition of Building239 is the most economical alternative for the Army.
2

Economic Analysis Graph
Net Present Value
Year
Dollars
3

Life Cycle Cost Report
DemolitionAlternative:
Year Demolition Total
Annual
Outlays
Middle
of Year
Discount
Factors
Present
Value
Cumulative
Net Present
Value
$27,8242018 $27,824$28,170$28,170 0.988
$27,8242019 $0$0$0 0.964
$27,8242020 $0$0$0 0.94
$27,8242021 $0$0$0 0.917
$27,8242022 $0$0$0 0.895
$27,8242023 $0$0$0 0.873
$27,8242024 $0$0$0 0.852
$27,8242025 $0$0$0 0.831
$27,8242026 $0$0$0 0.811
$27,8242027 $0$0$0 0.791
$27,8242028 $0$0$0 0.772
$27,8242029 $0$0$0 0.753
$27,8242030 $0$0$0 0.734
$27,8242031 $0$0$0 0.717
$27,8242032 $0$0$0 0.699
$27,8242033 $0$0$0 0.682
$27,8242034 $0$0$0 0.665
$27,8242035 $0$0$0 0.649
$27,8242036 $0$0$0 0.633
$27,8242037 $0$0$0 0.618
%NPV 100.00%
Discounting
Convention
Inflation
Schedule
Category /
Residual
Schedule
$27,824
M-O-Y
No Inflation
Non-Recurring
Costs
Discount Rate: 2.5%
Period of Analysis: 20 years
4

Life Cycle Cost Report
Renovation/ConversionAlternative:
Year Renovation/
Conversion
Total
Annual
Outlays
Middle
of Year
Discount
Factors
Present
Value
Cumulative
Net Present
Value
$153,0342018 $153,034$154,935$154,935 0.988
$153,0342019 $0$0$0 0.964
$153,0342020 $0$0$0 0.94
$153,0342021 $0$0$0 0.917
$153,0342022 $0$0$0 0.895
$153,0342023 $0$0$0 0.873
$153,0342024 $0$0$0 0.852
$153,0342025 $0$0$0 0.831
$153,0342026 $0$0$0 0.811
$153,0342027 $0$0$0 0.791
$153,0342028 $0$0$0 0.772
$153,0342029 $0$0$0 0.753
$153,0342030 $0$0$0 0.734
$153,0342031 $0$0$0 0.717
$153,0342032 $0$0$0 0.699
$153,0342033 $0$0$0 0.682
$153,0342034 $0$0$0 0.665
$153,0342035 $0$0$0 0.649
$153,0342036 $0$0$0 0.633
$153,0342037 $0$0$0 0.618
%NPV 100.00%
Discounting
Convention
Inflation
Schedule
Category /
Residual
Schedule
$153,034
M-O-Y
No Inflation
Non-Recurring
Costs
Discount Rate: 2.5%
Period of Analysis: 20 years
5

Life Cycle Cost Report
Other DOD or Federal Agency FacilitiesAlternative:
Year Other DOD
Agency
Total
Annual
Outlays
Middle
of Year
Discount
Factors
Present
Value
Cumulative
Net Present
Value
$144,1442018 $144,144$145,935$145,935 0.988
$144,1442019 $0$0$0 0.964
$144,1442020 $0$0$0 0.94
$144,1442021 $0$0$0 0.917
$144,1442022 $0$0$0 0.895
$144,1442023 $0$0$0 0.873
$144,1442024 $0$0$0 0.852
$144,1442025 $0$0$0 0.831
$144,1442026 $0$0$0 0.811
$144,1442027 $0$0$0 0.791
$144,1442028 $0$0$0 0.772
$144,1442029 $0$0$0 0.753
$144,1442030 $0$0$0 0.734
$144,1442031 $0$0$0 0.717
$144,1442032 $0$0$0 0.699
$144,1442033 $0$0$0 0.682
$144,1442034 $0$0$0 0.665
$144,1442035 $0$0$0 0.649
$144,1442036 $0$0$0 0.633
$144,1442037 $0$0$0 0.618
%NPV 100.00%
Discounting
Convention
Inflation
Schedule
Category /
Residual
Schedule
$144,144
M-O-Y
No Inflation
Non-Recurring
Costs
Discount Rate: 2.5%
Period of Analysis: 20 years
6

Life Cycle Cost Report
Caretaker StatusAlternative:
Year Caretaker
Status
Maintenance
Renovation/
Conversion
Total
Annual
Outlays
Middle
of Year
Discount
Factors
Present
Value
$9192018 0.988$0$930 $930
$8962019 0.964$0$930 $930
$8742020 0.94$0$930 $930
$8532021 0.917$0$930 $930
$8322022 0.895$0$930 $930
$8122023 0.873$0$930 $930
$7922024 0.852$0$930 $930
$7732025 0.831$0$930 $930
$7542026 0.811$0$930 $930
$7362027 0.791$0$930 $930
$7182028 0.772$0$930 $930
$7002029 0.753$0$930 $930
$6832030 0.734$0$930 $930
$6662031 0.717$0$930 $930
$6502032 0.699$0$930 $930
$6342033 0.682$0$930 $930
$6192034 0.665$0$930 $930
$6042035 0.649$0$930 $930
$5892036 0.633$0$930 $930
$96,3022037 0.618$154,935$930 $155,865
%NPV 13.29% 86.71%
Discounting
Convention
Inflation
Schedule
Category /
Residual
Schedule
$14,678
M-O-Y
No Inflation
Recurring
Costs
$95,727
M-O-Y
No Inflation
Recurring
Costs
7

Life Cycle Cost Report
Caretaker StatusAlternative:
Year Cumulative
Net Present
Value
2018 $919
2019 $1,815
2020 $2,689
2021 $3,542
2022 $4,374
2023 $5,186
2024 $5,978
2025 $6,751
2026 $7,505
2027 $8,241
2028 $8,958
2029 $9,658
2030 $10,341
2031 $11,008
2032 $11,658
2033 $12,292
2034 $12,911
2035 $13,514
2036 $14,103
2037 $110,405
Discount Rate: 2.5%
Period of Analysis: 20 years
8

Life Cycle Cost Report
Sources and Derivations:
. Demolition
. Demolition
Estimated demolition cost is $10/sf.
$10*2817= $28,170
a
1
. Renovation/Conversion
. Renovation/ Conversion
To be made practical, this building would require total renovation to includerepairing or replacing roofing, flooring, plumbing, electrical, communications,and other systems. Estimated cost is $55/sf or 55*2,817 = $154,935
a
2
. Other DOD or Federal Agency Facilities
. Other DOD Agency
Similar to renovation for use by the Army, to be made practical for use byanother government agency, this building would require total renovation toinclude repairing or replacing roofing, flooring, plumbing, electrical,communications, and other systems. Estimated cost is $55/sf or 55*2,817 =$154,9135.
a
3
. Caretaker Status
. Caretaker Status Maintenance
The current cost of maintaining a facility in a caretaker status is $0.33/sf. Thisalternative provides the minimum facility maintenance necessary to keep thebuilding from deteriorating from lack of use and to prevent existing conditionsfrom worsening. When the decision to bring the building back on line is made,the facility will still require major renovation to be made functional.
a
. Renovation/ Conversion
The estimated renovation/conversion cost of this alternative is $55/sf. In thecaretaker status alternative, this cost (or the cost of demolition) would beincurred at the end of the caretaker status period. This cost will need to beadjusted for inflation based on the year that the facility is brought out ofCaretaker Status and renovated.
b
4
9

Discount Rate Sensitivity Analysis
Graph of Net Present Value vs. Discount Rate
Discount Rate (%)
Dollars
0.9, 0.6 %NPV rankings change at the following discount rates:
10

Discount Rate Sensitivity Analysis
NPV rankings change at the following discount rates:
Table of Net Present Values for each Discount Rate
0.9, 0.6 %
Discount Rate = -1.0%
Demolition $ 28,312
Other DOD or Federal Agency $ 146,670
Renovation/Conversion $ 155,716
Caretaker Status $ 209,080
Discount Rate = -0.8%
Demolition $ 28,283
Other DOD or Federal Agency $ 146,522
Renovation/Conversion $ 155,558
Caretaker Status $ 201,383
Discount Rate = -0.6%
Demolition $ 28,255
Other DOD or Federal Agency $ 146,375
Renovation/Conversion $ 155,402
Caretaker Status $ 193,992
Discount Rate = -0.4%
Demolition $ 28,227
Other DOD or Federal Agency $ 146,228
Renovation/Conversion $ 155,246
Caretaker Status $ 186,896
Discount Rate = -0.2%
Demolition $ 28,198
Other DOD or Federal Agency $ 146,081
Renovation/Conversion $ 155,090
Caretaker Status $ 180,081
Discount Rate = -0.0%
Demolition $ 28,170
Other DOD or Federal Agency $ 145,935
Renovation/Conversion $ 154,935
Caretaker Status $ 173,535
Discount Rate = 0.2%
Demolition $ 28,142
Other DOD or Federal Agency $ 145,789
Renovation/Conversion $ 154,780
Caretaker Status $ 167,248
Discount Rate = 0.4%
Demolition $ 28,114
Other DOD or Federal Agency $ 145,644
Renovation/Conversion $ 154,626
Caretaker Status $ 161,209
Discount Rate = 0.6%
Demolition $ 28,086
Other DOD or Federal Agency $ 145,499
Renovation/Conversion $ 154,472
Caretaker Status $ 155,406
Discount Rate = 0.8%
Demolition $ 28,058
Other DOD or Federal Agency $ 145,355
Caretaker Status $ 149,832
Renovation/Conversion $ 154,319
Discount Rate = 1.0%
Demolition $ 28,030
Caretaker Status $ 144,475
Other DOD or Federal Agency $ 145,211
Renovation/Conversion $ 154,166
Discount Rate = 1.2%
Demolition $ 28,002
Caretaker Status $ 139,328
Other DOD or Federal Agency $ 145,067
Renovation/Conversion $ 154,014
Discount Rate = 1.4%
Demolition $ 27,975
Caretaker Status $ 134,381
Other DOD or Federal Agency $ 144,924
Renovation/Conversion $ 153,862
Discount Rate = 1.6%
Demolition $ 27,947
Caretaker Status $ 129,627
Other DOD or Federal Agency $ 144,781
Renovation/Conversion $ 153,710
Discount Rate = 1.8%
Demolition $ 27,920
Caretaker Status $ 125,056
Other DOD or Federal Agency $ 144,639
Renovation/Conversion $ 153,559
Discount Rate = 2.0%
Demolition $ 27,892
Caretaker Status $ 120,662
Other DOD or Federal Agency $ 144,497
Renovation/Conversion $ 153,409
11
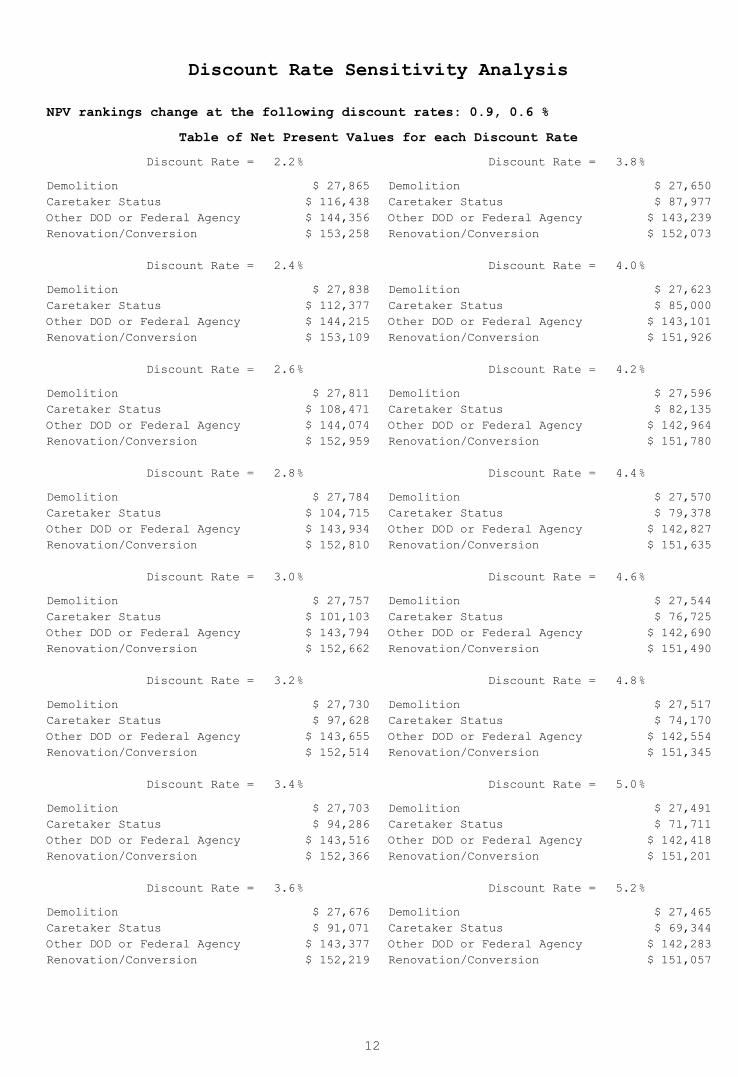
Discount Rate Sensitivity Analysis
NPV rankings change at the following discount rates:
Table of Net Present Values for each Discount Rate
0.9, 0.6 %
Discount Rate = 2.2%
Demolition $ 27,865
Caretaker Status $ 116,438
Other DOD or Federal Agency $ 144,356
Renovation/Conversion $ 153,258
Discount Rate = 2.4%
Demolition $ 27,838
Caretaker Status $ 112,377
Other DOD or Federal Agency $ 144,215
Renovation/Conversion $ 153,109
Discount Rate = 2.6%
Demolition $ 27,811
Caretaker Status $ 108,471
Other DOD or Federal Agency $ 144,074
Renovation/Conversion $ 152,959
Discount Rate = 2.8%
Demolition $ 27,784
Caretaker Status $ 104,715
Other DOD or Federal Agency $ 143,934
Renovation/Conversion $ 152,810
Discount Rate = 3.0%
Demolition $ 27,757
Caretaker Status $ 101,103
Other DOD or Federal Agency $ 143,794
Renovation/Conversion $ 152,662
Discount Rate = 3.2%
Demolition $ 27,730
Caretaker Status $ 97,628
Other DOD or Federal Agency $ 143,655
Renovation/Conversion $ 152,514
Discount Rate = 3.4%
Demolition $ 27,703
Caretaker Status $ 94,286
Other DOD or Federal Agency $ 143,516
Renovation/Conversion $ 152,366
Discount Rate = 3.6%
Demolition $ 27,676
Caretaker Status $ 91,071
Other DOD or Federal Agency $ 143,377
Renovation/Conversion $ 152,219
Discount Rate = 3.8%
Demolition $ 27,650
Caretaker Status $ 87,977
Other DOD or Federal Agency $ 143,239
Renovation/Conversion $ 152,073
Discount Rate = 4.0%
Demolition $ 27,623
Caretaker Status $ 85,000
Other DOD or Federal Agency $ 143,101
Renovation/Conversion $ 151,926
Discount Rate = 4.2%
Demolition $ 27,596
Caretaker Status $ 82,135
Other DOD or Federal Agency $ 142,964
Renovation/Conversion $ 151,780
Discount Rate = 4.4%
Demolition $ 27,570
Caretaker Status $ 79,378
Other DOD or Federal Agency $ 142,827
Renovation/Conversion $ 151,635
Discount Rate = 4.6%
Demolition $ 27,544
Caretaker Status $ 76,725
Other DOD or Federal Agency $ 142,690
Renovation/Conversion $ 151,490
Discount Rate = 4.8%
Demolition $ 27,517
Caretaker Status $ 74,170
Other DOD or Federal Agency $ 142,554
Renovation/Conversion $ 151,345
Discount Rate = 5.0%
Demolition $ 27,491
Caretaker Status $ 71,711
Other DOD or Federal Agency $ 142,418
Renovation/Conversion $ 151,201
Discount Rate = 5.2%
Demolition $ 27,465
Caretaker Status $ 69,344
Other DOD or Federal Agency $ 142,283
Renovation/Conversion $ 151,057
12

Discount Rate Sensitivity Analysis
NPV rankings change at the following discount rates:
Table of Net Present Values for each Discount Rate
0.9, 0.6 %
Discount Rate = 5.4%
Demolition $ 27,439
Caretaker Status $ 67,065
Other DOD or Federal Agency $ 142,147
Renovation/Conversion $ 150,914
Discount Rate = 5.6%
Demolition $ 27,413
Caretaker Status $ 64,870
Other DOD or Federal Agency $ 142,013
Renovation/Conversion $ 150,771
Discount Rate = 5.8%
Demolition $ 27,387
Caretaker Status $ 62,756
Other DOD or Federal Agency $ 141,879
Renovation/Conversion $ 150,628
Discount Rate = 6.0%
Demolition $ 27,361
Caretaker Status $ 60,720
Other DOD or Federal Agency $ 141,745
Renovation/Conversion $ 150,486
Discount Rate = 6.2%
Demolition $ 27,335
Caretaker Status $ 58,759
Other DOD or Federal Agency $ 141,611
Renovation/Conversion $ 150,344
Discount Rate = 6.4%
Demolition $ 27,310
Caretaker Status $ 56,870
Other DOD or Federal Agency $ 141,478
Renovation/Conversion $ 150,203
Discount Rate = 6.6%
Demolition $ 27,284
Caretaker Status $ 55,050
Other DOD or Federal Agency $ 141,345
Renovation/Conversion $ 150,062
Discount Rate = 6.8%
Demolition $ 27,258
Caretaker Status $ 53,297
Other DOD or Federal Agency $ 141,213
Renovation/Conversion $ 149,921
Discount Rate = 7.0%
Demolition $ 27,233
Caretaker Status $ 51,607
Other DOD or Federal Agency $ 141,081
Renovation/Conversion $ 149,781
Discount Rate = 7.2%
Demolition $ 27,208
Caretaker Status $ 49,979
Other DOD or Federal Agency $ 140,949
Renovation/Conversion $ 149,642
Discount Rate = 7.4%
Demolition $ 27,182
Caretaker Status $ 48,410
Other DOD or Federal Agency $ 140,818
Renovation/Conversion $ 149,502
Discount Rate = 7.6%
Demolition $ 27,157
Caretaker Status $ 46,897
Other DOD or Federal Agency $ 140,687
Renovation/Conversion $ 149,363
Discount Rate = 7.8%
Demolition $ 27,132
Caretaker Status $ 45,440
Other DOD or Federal Agency $ 140,556
Renovation/Conversion $ 149,225
Discount Rate = 8.0%
Demolition $ 27,107
Caretaker Status $ 44,034
Other DOD or Federal Agency $ 140,426
Renovation/Conversion $ 149,086
Discount Rate = 8.2%
Demolition $ 27,082
Caretaker Status $ 42,679
Other DOD or Federal Agency $ 140,296
Renovation/Conversion $ 148,948
Discount Rate = 8.4%
Demolition $ 27,057
Caretaker Status $ 41,373
Other DOD or Federal Agency $ 140,167
Renovation/Conversion $ 148,811
13

Discount Rate Sensitivity Analysis
NPV rankings change at the following discount rates:
Table of Net Present Values for each Discount Rate
0.9, 0.6 %
Discount Rate = 8.6%
Demolition $ 27,032
Caretaker Status $ 40,113
Other DOD or Federal Agency $ 140,038
Renovation/Conversion $ 148,674
Discount Rate = 8.8%
Demolition $ 27,007
Caretaker Status $ 38,898
Other DOD or Federal Agency $ 139,909
Renovation/Conversion $ 148,537
Discount Rate = 9.0%
Demolition $ 26,982
Caretaker Status $ 37,726
Other DOD or Federal Agency $ 139,780
Renovation/Conversion $ 148,401
Discount Rate = 9.2%
Demolition $ 26,957
Caretaker Status $ 36,595
Other DOD or Federal Agency $ 139,652
Renovation/Conversion $ 148,265
Discount Rate = 9.4%
Demolition $ 26,933
Caretaker Status $ 35,505
Other DOD or Federal Agency $ 139,525
Renovation/Conversion $ 148,129
Discount Rate = 9.6%
Demolition $ 26,908
Caretaker Status $ 34,453
Other DOD or Federal Agency $ 139,397
Renovation/Conversion $ 147,994
Discount Rate = 9.8%
Demolition $ 26,883
Caretaker Status $ 33,438
Other DOD or Federal Agency $ 139,270
Renovation/Conversion $ 147,859
Discount Rate = 10.0%
Demolition $ 26,859
Caretaker Status $ 32,458
Other DOD or Federal Agency $ 139,144
Renovation/Conversion $ 147,725
14

Date Generated:
Time Generated:
Version:
12 June 2018
12.49.27
Building 249 Disposal
Economic Analysis
2018
Project Title
:
Type of Analysis
Discount Rate
Period of Analysis
Start Year
Base Year
Dollar Analysis
:
:
:
:
:
:
Facilities Reduction Program
Mission Requirement - Full
2.5%
2018
20 years
Current Dollars
Project Objective :
Executive Summary Report
To determine the most economical course of action for
Building 249
that meets the EXORD requirement to reduce excess square
footage.
Building 249 has been identified as a facility for disposal per HQDA EXORD 164-15.
HQDA EXORD 164-15, "Reduce the Installation Facility Footprint," published March 2015,holds commanders and planners accountable for making all reasonable efforts to maximizespace utilization, consolidate units into our best facilities, and dispose of excess assets.Although the Reduce the Footprint (RtF) acronym has taken hold, the EXORD is really aboutthe efficient management of our real property assets. Significant cost reductions can only beachieved with transformational changes that enable us to reduce our expenditures on facilitiesand services.
Background:
ECONPACK 4.0.32
Alternatives Considered for this Analysis:
Demolition - This alternative will demolish the building and restore the site
to a grassed area. This alternative meets the requirements of the Executive
Order Number 164-15 to dispose of excess facilities. Demolition cost is
estimated to be $10/sf – 2,750*10 = $27,500. This is a viable alternative.
This is a viable alternative.
Renovation/Conversion - Conversion/Alternate Use - This alternative renovates
the facility for use for another
Category Code. The best option for conversion of building, based on its current
configuration, is to use it for Category Code 44224, Organizational Storage.
To be made practical, this building would require total renovation to include
repairing or replacing roofing, flooring, plumbing, electrical, communications,
and other systems. Estimated cost is $55/sf or 2,750*55 = $151,250. However,
there currently is an excess of space in this category code and converting into
this category would violate the intent of the Exord. This is a viable
alternative. This is a viable alternative.
Other DOD or Federal Agency Facilities - This alternative offers the building
to another DOD or federal agency. The agency would be responsible for the
renovation/conversion of the facility. Cost would be the same as the
renovation/conversion alternative - $55*2,750 = $151,250. Due to the
relatively small size and odd shape of this building (2,750 sf), location – in
the Western Hemisphere Institute for Security Cooperation (WHINSEC) complex,
lack of access, and the cost and time required for renovation, it’s unlikely
that another agency would select it. This alternative is viable. This is a
1

viable alternative.
Caretaker Status - This alternative maintains the facility in its current
condition to be used later in its
current category code or after conversion into a different category code. A
facility in
caretaker status is maintained to the point of preventing problems from
developing or to
keep existing problems from worsening. The cost is based on an annual, per
square foot expense of $0.33 or $0.33*2,750 = $907.50/yr. This would be a
reoccurring annual expense until the facility is put back into use. With this
alternative, renovation/repair would still be required prior to re-use and
mostly likely at a much higher cost. This is a viable alternative.
Email Address
706-545-3229Phone Number
Master Planning Division, DPW
Organization
Dean MillerAction Officer :
:
:
:
Economic Indicators:
Alternative NPV
Demolition $ 27,163
Renovation/Conversion $ 149,394
Other DOD or Federal Agency Facilities $ 149,394
Caretaker Status $ 110,750
1. This building cannot be used in its current state due to its condition.2. Renovation and/or conversion is necessary for the building to be reutilized in anotherCategory Code.
Assumptions of the Analysis:
Results and Recommendations:
Based on the results of this analysis, the most economical alternative that meets theintent of Exord 164-15 is demolition. Fort Benning does not have a need for the facilityin its current design use category code. Conversion to another category code for FortBenning use is undesired due to its size, layout, location and lack of interested units.No other Federal Agency has expressed interest in using the building, either in itscurrent configuration or converted into another category code. Therefore, demolition ofBuilding 249 is the most economical alternative for the Army.
2

Economic Analysis Graph
Net Present Value
Year
Dollars
3

Life Cycle Cost Report
DemolitionAlternative:
Year Demolition Total
Annual
Outlays
Middle
of Year
Discount
Factors
Present
Value
Cumulative
Net Present
Value
$27,1632018 $27,163$27,500$27,500 0.988
$27,1632019 $0$0$0 0.964
$27,1632020 $0$0$0 0.94
$27,1632021 $0$0$0 0.917
$27,1632022 $0$0$0 0.895
$27,1632023 $0$0$0 0.873
$27,1632024 $0$0$0 0.852
$27,1632025 $0$0$0 0.831
$27,1632026 $0$0$0 0.811
$27,1632027 $0$0$0 0.791
$27,1632028 $0$0$0 0.772
$27,1632029 $0$0$0 0.753
$27,1632030 $0$0$0 0.734
$27,1632031 $0$0$0 0.717
$27,1632032 $0$0$0 0.699
$27,1632033 $0$0$0 0.682
$27,1632034 $0$0$0 0.665
$27,1632035 $0$0$0 0.649
$27,1632036 $0$0$0 0.633
$27,1632037 $0$0$0 0.618
%NPV 100.00%
Discounting
Convention
Inflation
Schedule
Category /
Residual
Schedule
$27,163
M-O-Y
No Inflation
Non-Recurring
Costs
Discount Rate: 2.5%
Period of Analysis: 20 years
4

Life Cycle Cost Report
Renovation/ConversionAlternative:
Year Renovation/Con
version
Total
Annual
Outlays
Middle
of Year
Discount
Factors
Present
Value
Cumulative
Net Present
Value
$149,3942018 $149,394$151,250$151,250 0.988
$149,3942019 $0$0$0 0.964
$149,3942020 $0$0$0 0.94
$149,3942021 $0$0$0 0.917
$149,3942022 $0$0$0 0.895
$149,3942023 $0$0$0 0.873
$149,3942024 $0$0$0 0.852
$149,3942025 $0$0$0 0.831
$149,3942026 $0$0$0 0.811
$149,3942027 $0$0$0 0.791
$149,3942028 $0$0$0 0.772
$149,3942029 $0$0$0 0.753
$149,3942030 $0$0$0 0.734
$149,3942031 $0$0$0 0.717
$149,3942032 $0$0$0 0.699
$149,3942033 $0$0$0 0.682
$149,3942034 $0$0$0 0.665
$149,3942035 $0$0$0 0.649
$149,3942036 $0$0$0 0.633
$149,3942037 $0$0$0 0.618
%NPV 100.00%
Discounting
Convention
Inflation
Schedule
Category /
Residual
Schedule
$149,394
M-O-Y
No Inflation
Non-Recurring
Costs
Discount Rate: 2.5%
Period of Analysis: 20 years
5

Life Cycle Cost Report
Other DOD or Federal Agency FacilitiesAlternative:
Year Renovation for
DOD or Other
Agency
Total
Annual
Outlays
Middle
of Year
Discount
Factors
Present
Value
Cumulative
Net Present
Value
$149,3942018 $149,394$151,250$151,250 0.988
$149,3942019 $0$0$0 0.964
$149,3942020 $0$0$0 0.94
$149,3942021 $0$0$0 0.917
$149,3942022 $0$0$0 0.895
$149,3942023 $0$0$0 0.873
$149,3942024 $0$0$0 0.852
$149,3942025 $0$0$0 0.831
$149,3942026 $0$0$0 0.811
$149,3942027 $0$0$0 0.791
$149,3942028 $0$0$0 0.772
$149,3942029 $0$0$0 0.753
$149,3942030 $0$0$0 0.734
$149,3942031 $0$0$0 0.717
$149,3942032 $0$0$0 0.699
$149,3942033 $0$0$0 0.682
$149,3942034 $0$0$0 0.665
$149,3942035 $0$0$0 0.649
$149,3942036 $0$0$0 0.633
$149,3942037 $0$0$0 0.618
%NPV 100.00%
Discounting
Convention
Inflation
Schedule
Category /
Residual
Schedule
$149,394
M-O-Y
No Inflation
Non-Recurring
Costs
Discount Rate: 2.5%
Period of Analysis: 20 years
6

Life Cycle Cost Report
Caretaker StatusAlternative:
Year Caretaker
Maintenance
Renovation/
Construction
Total
Annual
Outlays
Middle
of Year
Discount
Factors
Present
Value
$9062018 0.988$0$917 $917
$9012019 0.964$0$935 $935
$8972020 0.94$0$954 $954
$8932021 0.917$0$973 $973
$8882022 0.895$0$993 $993
$8842023 0.873$0$1,012 $1,012
$8802024 0.852$0$1,033 $1,033
$8752025 0.831$0$1,053 $1,053
$8712026 0.811$0$1,074 $1,074
$8672027 0.791$0$1,096 $1,096
$8632028 0.772$0$1,118 $1,118
$8582029 0.753$0$1,140 $1,140
$8542030 0.734$0$1,163 $1,163
$8502031 0.717$0$1,186 $1,186
$8462032 0.699$0$1,210 $1,210
$8422033 0.682$0$1,234 $1,234
$8382034 0.665$0$1,259 $1,259
$8342035 0.649$0$1,284 $1,284
$8292036 0.633$0$1,310 $1,310
$94,2762037 0.618$151,250$1,336 $152,586
%NPV 15.62% 84.38%
Discounting
Convention
Inflation
Schedule
Category /
Residual
Schedule
$17,300
M-O-Y
2017 General
Recurring
Costs
$93,450
M-O-Y
No Inflation
Recurring
Costs
7

Life Cycle Cost Report
Caretaker StatusAlternative:
Year Cumulative
Net Present
Value
2018 $906
2019 $1,807
2020 $2,704
2021 $3,597
2022 $4,485
2023 $5,369
2024 $6,248
2025 $7,124
2026 $7,995
2027 $8,862
2028 $9,724
2029 $10,582
2030 $11,437
2031 $12,287
2032 $13,132
2033 $13,974
2034 $14,812
2035 $15,645
2036 $16,475
2037 $110,750
Discount Rate: 2.5%
Period of Analysis: 20 years
8

Life Cycle Cost Report
Sources and Derivations:
. Demolition
. Demolition
Estimated demolition cost is $10/sf.
$10*2750= $27,750
a
1
. Renovation/Conversion
. Renovation/Conversion
To be made practical for conversion, this building would require totalrenovation to include repairing or replacing roofing, flooring, plumbing,electrical, communications, and other systems. Estimated cost is $55/sf or55*2,750 = $151,250.
a
2
. Other DOD or Federal Agency Facilities
. Renovation for DOD or Other Agency
This alternative offers the building to another DOD or federal agency. Theagencywould be responsible for the renovation/conversion of the facility. Cost wouldbe thesame as the renovation/conversion alternative - $55*2,750 = $151,250.
Due to the relatively small size of this building (2,750 sf), location, lack ofparking/ access, and the cost and time required for renovation, it’s unlikely thatanother agency would select it. This alternative is viable.
a
3
. Caretaker Status
. Caretaker Maintenance
The current cost of maintaining a facility in a caretaker status is $0.33/sf. Thisalternative provides the minimum facility maintenance necessary to keep thebuilding from deteriorating from lack of use and to prevent existing conditionsfrom worsening. When the decision to bring the building back on line is made,the facility will still require major renovation to be made functional.
a
. Renovation/ Construction
The estimated renovation/conversion cost of this alternative is $55/sf. In thecaretaker status alternative, this cost (or the cost of demolition) would beincurredat the end of the caretaker status period. This cost will need to be adjusted forinflation based on the year that the facility is brought out of Caretaker Statusand renovated.
b
4
9

Discount Rate Sensitivity Analysis
Graph of Net Present Value vs. Discount Rate
Discount Rate (%)
Dollars
0.7 %NPV rankings change at the following discount rates:
10
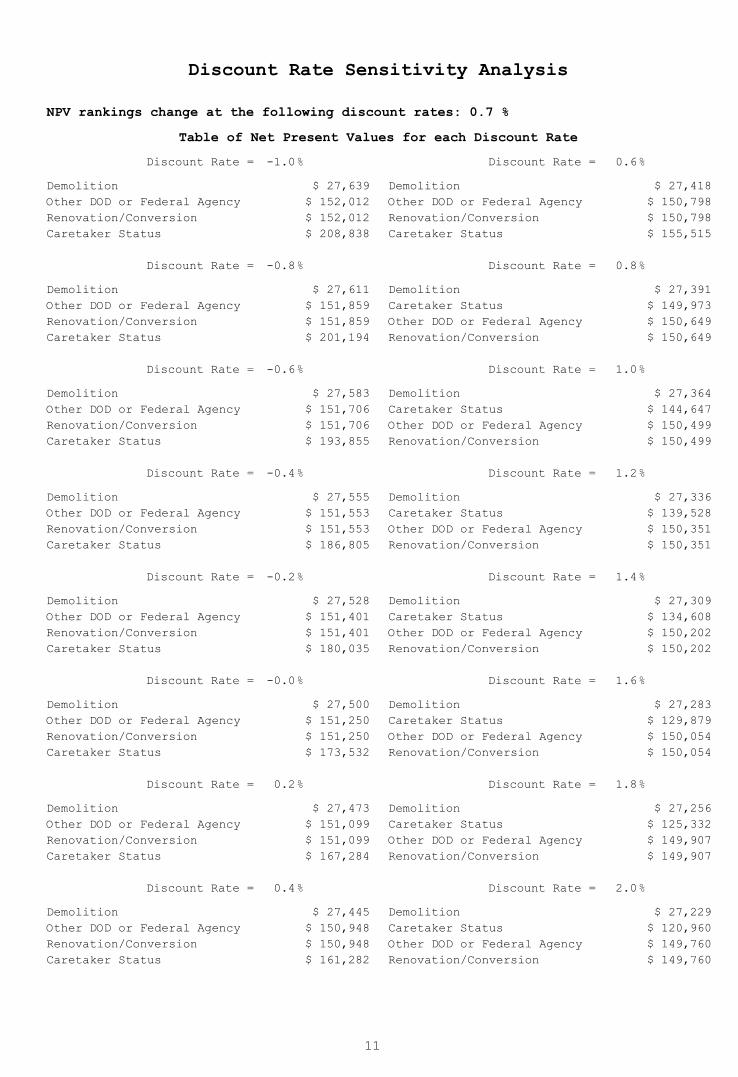
Discount Rate Sensitivity Analysis
NPV rankings change at the following discount rates:
Table of Net Present Values for each Discount Rate
0.7 %
Discount Rate = -1.0%
Demolition $ 27,639
Other DOD or Federal Agency $ 152,012
Renovation/Conversion $ 152,012
Caretaker Status $ 208,838
Discount Rate = -0.8%
Demolition $ 27,611
Other DOD or Federal Agency $ 151,859
Renovation/Conversion $ 151,859
Caretaker Status $ 201,194
Discount Rate = -0.6%
Demolition $ 27,583
Other DOD or Federal Agency $ 151,706
Renovation/Conversion $ 151,706
Caretaker Status $ 193,855
Discount Rate = -0.4%
Demolition $ 27,555
Other DOD or Federal Agency $ 151,553
Renovation/Conversion $ 151,553
Caretaker Status $ 186,805
Discount Rate = -0.2%
Demolition $ 27,528
Other DOD or Federal Agency $ 151,401
Renovation/Conversion $ 151,401
Caretaker Status $ 180,035
Discount Rate = -0.0%
Demolition $ 27,500
Other DOD or Federal Agency $ 151,250
Renovation/Conversion $ 151,250
Caretaker Status $ 173,532
Discount Rate = 0.2%
Demolition $ 27,473
Other DOD or Federal Agency $ 151,099
Renovation/Conversion $ 151,099
Caretaker Status $ 167,284
Discount Rate = 0.4%
Demolition $ 27,445
Other DOD or Federal Agency $ 150,948
Renovation/Conversion $ 150,948
Caretaker Status $ 161,282
Discount Rate = 0.6%
Demolition $ 27,418
Other DOD or Federal Agency $ 150,798
Renovation/Conversion $ 150,798
Caretaker Status $ 155,515
Discount Rate = 0.8%
Demolition $ 27,391
Caretaker Status $ 149,973
Other DOD or Federal Agency $ 150,649
Renovation/Conversion $ 150,649
Discount Rate = 1.0%
Demolition $ 27,364
Caretaker Status $ 144,647
Other DOD or Federal Agency $ 150,499
Renovation/Conversion $ 150,499
Discount Rate = 1.2%
Demolition $ 27,336
Caretaker Status $ 139,528
Other DOD or Federal Agency $ 150,351
Renovation/Conversion $ 150,351
Discount Rate = 1.4%
Demolition $ 27,309
Caretaker Status $ 134,608
Other DOD or Federal Agency $ 150,202
Renovation/Conversion $ 150,202
Discount Rate = 1.6%
Demolition $ 27,283
Caretaker Status $ 129,879
Other DOD or Federal Agency $ 150,054
Renovation/Conversion $ 150,054
Discount Rate = 1.8%
Demolition $ 27,256
Caretaker Status $ 125,332
Other DOD or Federal Agency $ 149,907
Renovation/Conversion $ 149,907
Discount Rate = 2.0%
Demolition $ 27,229
Caretaker Status $ 120,960
Other DOD or Federal Agency $ 149,760
Renovation/Conversion $ 149,760
11

Discount Rate Sensitivity Analysis
NPV rankings change at the following discount rates:
Table of Net Present Values for each Discount Rate
0.7 %
Discount Rate = 2.2%
Demolition $ 27,202
Caretaker Status $ 116,756
Other DOD or Federal Agency $ 149,613
Renovation/Conversion $ 149,613
Discount Rate = 2.4%
Demolition $ 27,176
Caretaker Status $ 112,713
Other DOD or Federal Agency $ 149,467
Renovation/Conversion $ 149,467
Discount Rate = 2.6%
Demolition $ 27,149
Caretaker Status $ 108,825
Other DOD or Federal Agency $ 149,321
Renovation/Conversion $ 149,321
Discount Rate = 2.8%
Demolition $ 27,123
Caretaker Status $ 105,086
Other DOD or Federal Agency $ 149,176
Renovation/Conversion $ 149,176
Discount Rate = 3.0%
Demolition $ 27,097
Caretaker Status $ 101,488
Other DOD or Federal Agency $ 149,031
Renovation/Conversion $ 149,031
Discount Rate = 3.2%
Demolition $ 27,070
Caretaker Status $ 98,028
Other DOD or Federal Agency $ 148,887
Renovation/Conversion $ 148,887
Discount Rate = 3.4%
Demolition $ 27,044
Caretaker Status $ 94,698
Other DOD or Federal Agency $ 148,743
Renovation/Conversion $ 148,743
Discount Rate = 3.6%
Demolition $ 27,018
Caretaker Status $ 91,494
Other DOD or Federal Agency $ 148,599
Renovation/Conversion $ 148,599
Discount Rate = 3.8%
Demolition $ 26,992
Caretaker Status $ 88,411
Other DOD or Federal Agency $ 148,456
Renovation/Conversion $ 148,456
Discount Rate = 4.0%
Demolition $ 26,966
Caretaker Status $ 85,444
Other DOD or Federal Agency $ 148,313
Renovation/Conversion $ 148,313
Discount Rate = 4.2%
Demolition $ 26,940
Caretaker Status $ 82,589
Other DOD or Federal Agency $ 148,170
Renovation/Conversion $ 148,170
Discount Rate = 4.4%
Demolition $ 26,914
Caretaker Status $ 79,840
Other DOD or Federal Agency $ 148,028
Renovation/Conversion $ 148,028
Discount Rate = 4.6%
Demolition $ 26,889
Caretaker Status $ 77,194
Other DOD or Federal Agency $ 147,887
Renovation/Conversion $ 147,887
Discount Rate = 4.8%
Demolition $ 26,863
Caretaker Status $ 74,646
Other DOD or Federal Agency $ 147,746
Renovation/Conversion $ 147,746
Discount Rate = 5.0%
Demolition $ 26,837
Caretaker Status $ 72,193
Other DOD or Federal Agency $ 147,605
Renovation/Conversion $ 147,605
Discount Rate = 5.2%
Demolition $ 26,812
Caretaker Status $ 69,831
Other DOD or Federal Agency $ 147,465
Renovation/Conversion $ 147,465
12

Discount Rate Sensitivity Analysis
NPV rankings change at the following discount rates:
Table of Net Present Values for each Discount Rate
0.7 %
Discount Rate = 5.4%
Demolition $ 26,786
Caretaker Status $ 67,556
Other DOD or Federal Agency $ 147,325
Renovation/Conversion $ 147,325
Discount Rate = 5.6%
Demolition $ 26,761
Caretaker Status $ 65,365
Other DOD or Federal Agency $ 147,185
Renovation/Conversion $ 147,185
Discount Rate = 5.8%
Demolition $ 26,736
Caretaker Status $ 63,255
Other DOD or Federal Agency $ 147,046
Renovation/Conversion $ 147,046
Discount Rate = 6.0%
Demolition $ 26,710
Caretaker Status $ 61,222
Other DOD or Federal Agency $ 146,907
Renovation/Conversion $ 146,907
Discount Rate = 6.2%
Demolition $ 26,685
Caretaker Status $ 59,264
Other DOD or Federal Agency $ 146,769
Renovation/Conversion $ 146,769
Discount Rate = 6.4%
Demolition $ 26,660
Caretaker Status $ 57,377
Other DOD or Federal Agency $ 146,631
Renovation/Conversion $ 146,631
Discount Rate = 6.6%
Demolition $ 26,635
Caretaker Status $ 55,558
Other DOD or Federal Agency $ 146,493
Renovation/Conversion $ 146,493
Discount Rate = 6.8%
Demolition $ 26,610
Caretaker Status $ 53,806
Other DOD or Federal Agency $ 146,356
Renovation/Conversion $ 146,356
Discount Rate = 7.0%
Demolition $ 26,585
Caretaker Status $ 52,117
Other DOD or Federal Agency $ 146,219
Renovation/Conversion $ 146,219
Discount Rate = 7.2%
Demolition $ 26,560
Caretaker Status $ 50,490
Other DOD or Federal Agency $ 146,082
Renovation/Conversion $ 146,082
Discount Rate = 7.4%
Demolition $ 26,536
Caretaker Status $ 48,921
Other DOD or Federal Agency $ 145,946
Renovation/Conversion $ 145,946
Discount Rate = 7.6%
Demolition $ 26,511
Caretaker Status $ 47,408
Other DOD or Federal Agency $ 145,811
Renovation/Conversion $ 145,811
Discount Rate = 7.8%
Demolition $ 26,486
Caretaker Status $ 45,949
Other DOD or Federal Agency $ 145,675
Renovation/Conversion $ 145,675
Discount Rate = 8.0%
Demolition $ 26,462
Caretaker Status $ 44,543
Other DOD or Federal Agency $ 145,540
Renovation/Conversion $ 145,540
Discount Rate = 8.2%
Demolition $ 26,437
Caretaker Status $ 43,187
Other DOD or Federal Agency $ 145,406
Renovation/Conversion $ 145,406
Discount Rate = 8.4%
Demolition $ 26,413
Caretaker Status $ 41,879
Other DOD or Federal Agency $ 145,272
Renovation/Conversion $ 145,272
13

Discount Rate Sensitivity Analysis
NPV rankings change at the following discount rates:
Table of Net Present Values for each Discount Rate
0.7 %
Discount Rate = 8.6%
Demolition $ 26,389
Caretaker Status $ 40,618
Other DOD or Federal Agency $ 145,138
Renovation/Conversion $ 145,138
Discount Rate = 8.8%
Demolition $ 26,364
Caretaker Status $ 39,401
Other DOD or Federal Agency $ 145,004
Renovation/Conversion $ 145,004
Discount Rate = 9.0%
Demolition $ 26,340
Caretaker Status $ 38,227
Other DOD or Federal Agency $ 144,871
Renovation/Conversion $ 144,871
Discount Rate = 9.2%
Demolition $ 26,316
Caretaker Status $ 37,094
Other DOD or Federal Agency $ 144,738
Renovation/Conversion $ 144,738
Discount Rate = 9.4%
Demolition $ 26,292
Caretaker Status $ 36,001
Other DOD or Federal Agency $ 144,606
Renovation/Conversion $ 144,606
Discount Rate = 9.6%
Demolition $ 26,268
Caretaker Status $ 34,947
Other DOD or Federal Agency $ 144,474
Renovation/Conversion $ 144,474
Discount Rate = 9.8%
Demolition $ 26,244
Caretaker Status $ 33,929
Other DOD or Federal Agency $ 144,342
Renovation/Conversion $ 144,342
Discount Rate = 10.0%
Demolition $ 26,220
Caretaker Status $ 32,947
Other DOD or Federal Agency $ 144,211
Renovation/Conversion $ 144,211
14

Date Generated:
Time Generated:
Version:
12 June 2018
16.34.30
Building 267 Disposal
Economic Analysis
2018
Project Title
:
Type of Analysis
Discount Rate
Period of Analysis
Start Year
Base Year
Dollar Analysis
:
:
:
:
:
:
Facilities Reduction Program
Mission Requirement - Full
2.5%
2018
20 years
Current Dollars
Project Objective :
Executive Summary Report
To determine the most economical course of action for
Building 267
that meets the EXORD requirement to reduce excess square
footage.
Building 267 has been identified as a facility for disposal per HQDA EXORD 164-15.
HQDA EXORD 164-15, "Reduce the Installation Facility Footprint," published March 2015,holds commanders and planners accountable for making all reasonable efforts to maximizespace utilization, consolidate units into our best facilities, and dispose of excess assets.Although the Reduce the Footprint (RtF) acronym has taken hold, the EXORD is really aboutthe efficient management of our real property assets. Significant cost reductions can only beachieved with transformational changes that enable us to reduce our expenditures on facilitiesand services.
Background:
ECONPACK 4.0.32
Alternatives Considered for this Analysis:
Demolition - This alternative will demolish the building and restore the site
to a grassed area. This
alternative meets the requirements of the Executive Order Number 164-15 to
dispose of
excess facilities. Demolition cost is estimated to be $10/sf – 1,175*10 =
$11,750. This is a viable alternative. This is a viable alternative.
Renovation/Conversion - Conversion/Alternate Use - This alternative renovates
the facility for use for another
Category Code. The best option for conversion of building, based on its current
configuration, is to use it for Category Code 44224, Organizational Storage.
To be made practical, this building would require total renovation to include
repairing or replacing roofing, flooring, plumbing, electrical, communications,
and other systems. Estimated cost is $55/sf or 1,175*55 = $64,625. However,
there currently is an excess of space in this category code and converting into
this category would violate the intent of the Exord. This is a viable
alternative This is a viable alternative.
Other DOD or Federal Agency Facilities - This alternative offers the building
to another DOD or federal agency. The agency would be responsible for the
renovation/conversion of the facility. Cost would be the same as the
renovation/conversion alternative - $55*1,175 = $64,625. Due to the relatively
small size of this building (1,175 sf), location, lack of parking, and the cost
and time required for renovation, it’s unlikely that another agency would
select it. This alternative is viable.
1

This is a viable alternative.
Caretaker Status - This alternative maintains the facility in its current
condition to be used later in its
current category code or after conversion into a different category code. A
facility in
caretaker status is maintained to the point of preventing problems from
developing or to
keep existing problems from worsening. The cost is based on an annual, per
square foot expense of $0.33 or $0.33*1,175 = $388/yr. This would be a
reoccurring annual expense until the facility is put back into use. With this
alternative, renovation/repair would still be required prior to re-use and
mostly likely at a much higher cost. This is a viable alternative.
Email Address
706-545-3229Phone Number
Master Planning Division, DPW
Organization
Dean MillerAction Officer :
:
:
:
Economic Indicators:
Alternative NPV
Demolition $ 11,606
Renovation/Conversion $ 63,832
Other DOD or Federal Agency Facilities $ 63,832
Caretaker Status $ 47,321
1. This building cannot be used in its current state due to its condition.2. Renovation and/or conversion is necessary for the building to be reutilized in anotherCategory Code.
Assumptions of the Analysis:
Results and Recommendations:
Based on the results of this analysis, the most economical alternative that meets theintent of Exord 164-15 is demolition. Fort Benning does not have a need for the facilityin its current design use category code. Conversion to another category code for FortBenning use is undesired due to its size, layout, location and lack of interested units.No other Federal Agency has expressed interest in using the building, either in itscurrent configuration or converted into another category code. Therefore, demolition ofBuilding 267 is the most economical alternative for the Army.
2
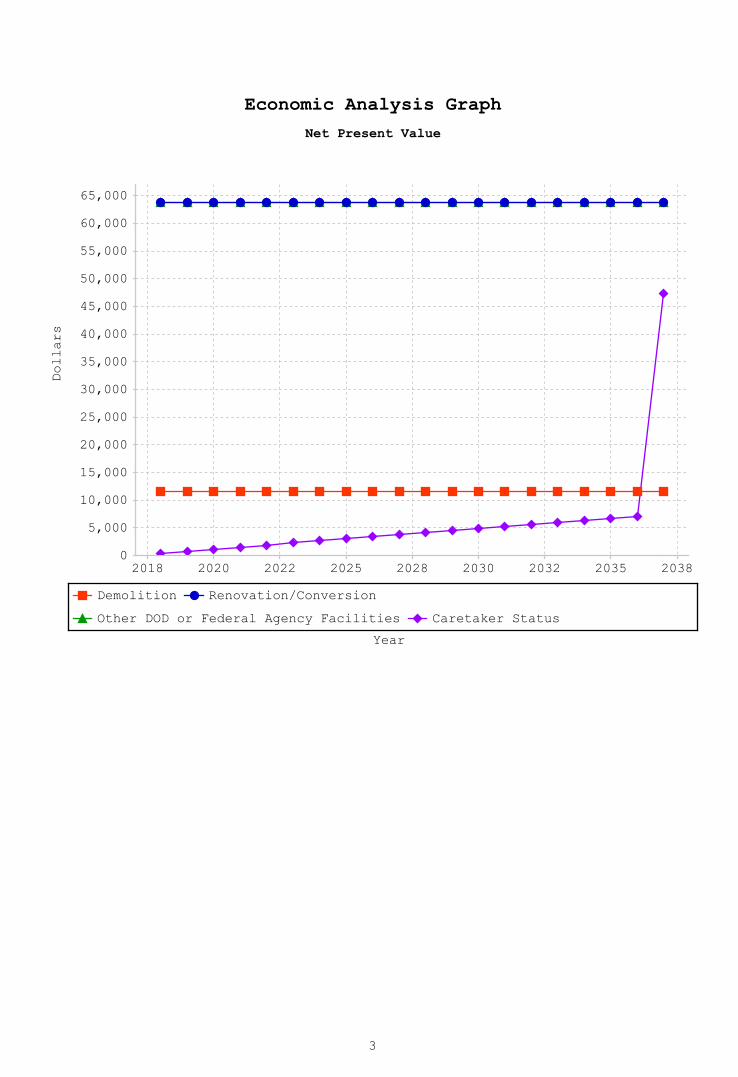
Economic Analysis Graph
Net Present Value
Year
Dollars
3

Life Cycle Cost Report
DemolitionAlternative:
Year Demolition Total
Annual
Outlays
Middle
of Year
Discount
Factors
Present
Value
Cumulative
Net Present
Value
$11,6062018 $11,606$11,750$11,750 0.988
$11,6062019 $0$0$0 0.964
$11,6062020 $0$0$0 0.94
$11,6062021 $0$0$0 0.917
$11,6062022 $0$0$0 0.895
$11,6062023 $0$0$0 0.873
$11,6062024 $0$0$0 0.852
$11,6062025 $0$0$0 0.831
$11,6062026 $0$0$0 0.811
$11,6062027 $0$0$0 0.791
$11,6062028 $0$0$0 0.772
$11,6062029 $0$0$0 0.753
$11,6062030 $0$0$0 0.734
$11,6062031 $0$0$0 0.717
$11,6062032 $0$0$0 0.699
$11,6062033 $0$0$0 0.682
$11,6062034 $0$0$0 0.665
$11,6062035 $0$0$0 0.649
$11,6062036 $0$0$0 0.633
$11,6062037 $0$0$0 0.618
%NPV 100.00%
Discounting
Convention
Inflation
Schedule
Category /
Residual
Schedule
$11,606
M-O-Y
No Inflation
Recurring
Costs
Discount Rate: 2.5%
Period of Analysis: 20 years
4

Life Cycle Cost Report
Renovation/ConversionAlternative:
Year Renovation/Con
version
Total
Annual
Outlays
Middle
of Year
Discount
Factors
Present
Value
Cumulative
Net Present
Value
$63,8322018 $63,832$64,625$64,625 0.988
$63,8322019 $0$0$0 0.964
$63,8322020 $0$0$0 0.94
$63,8322021 $0$0$0 0.917
$63,8322022 $0$0$0 0.895
$63,8322023 $0$0$0 0.873
$63,8322024 $0$0$0 0.852
$63,8322025 $0$0$0 0.831
$63,8322026 $0$0$0 0.811
$63,8322027 $0$0$0 0.791
$63,8322028 $0$0$0 0.772
$63,8322029 $0$0$0 0.753
$63,8322030 $0$0$0 0.734
$63,8322031 $0$0$0 0.717
$63,8322032 $0$0$0 0.699
$63,8322033 $0$0$0 0.682
$63,8322034 $0$0$0 0.665
$63,8322035 $0$0$0 0.649
$63,8322036 $0$0$0 0.633
$63,8322037 $0$0$0 0.618
%NPV 100.00%
Discounting
Convention
Inflation
Schedule
Category /
Residual
Schedule
$63,832
M-O-Y
No Inflation
Non-Recurring
Costs
Discount Rate: 2.5%
Period of Analysis: 20 years
5
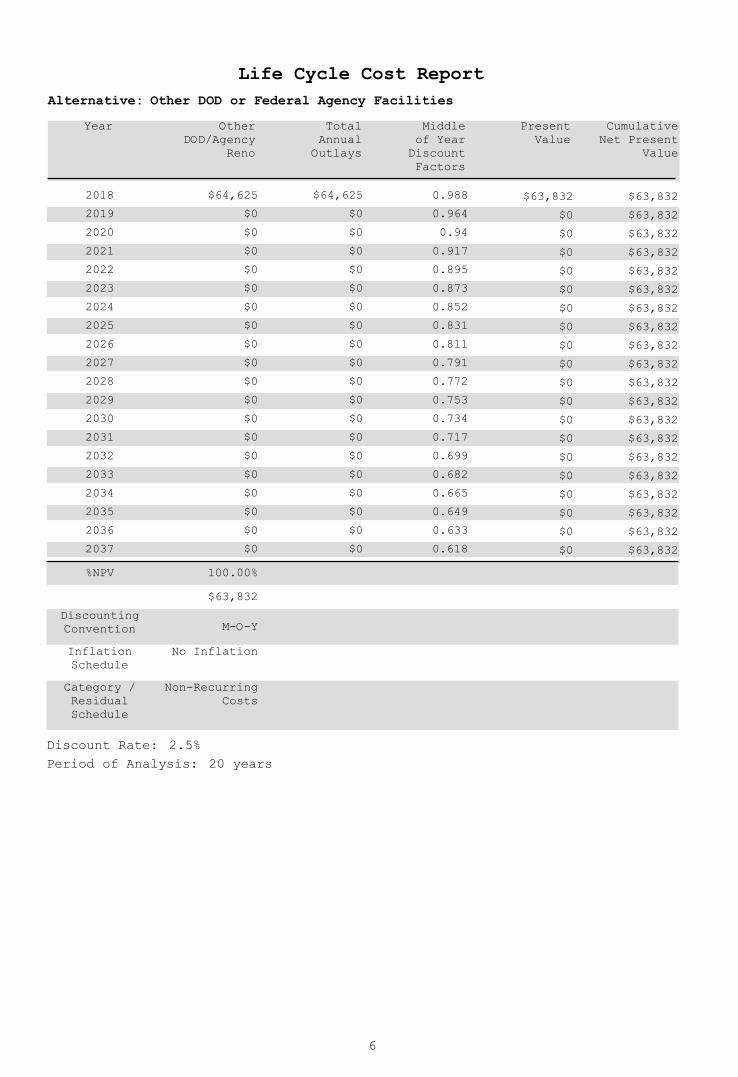
Life Cycle Cost Report
Other DOD or Federal Agency FacilitiesAlternative:
Year Other
DOD/Agency
Reno
Total
Annual
Outlays
Middle
of Year
Discount
Factors
Present
Value
Cumulative
Net Present
Value
$63,8322018 $63,832$64,625$64,625 0.988
$63,8322019 $0$0$0 0.964
$63,8322020 $0$0$0 0.94
$63,8322021 $0$0$0 0.917
$63,8322022 $0$0$0 0.895
$63,8322023 $0$0$0 0.873
$63,8322024 $0$0$0 0.852
$63,8322025 $0$0$0 0.831
$63,8322026 $0$0$0 0.811
$63,8322027 $0$0$0 0.791
$63,8322028 $0$0$0 0.772
$63,8322029 $0$0$0 0.753
$63,8322030 $0$0$0 0.734
$63,8322031 $0$0$0 0.717
$63,8322032 $0$0$0 0.699
$63,8322033 $0$0$0 0.682
$63,8322034 $0$0$0 0.665
$63,8322035 $0$0$0 0.649
$63,8322036 $0$0$0 0.633
$63,8322037 $0$0$0 0.618
%NPV 100.00%
Discounting
Convention
Inflation
Schedule
Category /
Residual
Schedule
$63,832
M-O-Y
No Inflation
Non-Recurring
Costs
Discount Rate: 2.5%
Period of Analysis: 20 years
6

Life Cycle Cost Report
Caretaker StatusAlternative:
Year Caretaker
Status
Maintenance
Renovation
after
Caretaker
Total
Annual
Outlays
Middle
of Year
Discount
Factors
Present
Value
$3872018 0.988$0$392 $392
$3852019 0.964$0$400 $400
$3832020 0.94$0$408 $408
$3812021 0.917$0$416 $416
$3802022 0.895$0$424 $424
$3782023 0.873$0$433 $433
$3762024 0.852$0$441 $441
$3742025 0.831$0$450 $450
$3722026 0.811$0$459 $459
$3702027 0.791$0$468 $468
$3692028 0.772$0$478 $478
$3672029 0.753$0$487 $487
$3652030 0.734$0$497 $497
$3632031 0.717$0$507 $507
$3612032 0.699$0$517 $517
$3602033 0.682$0$527 $527
$3582034 0.665$0$538 $538
$3562035 0.649$0$549 $549
$3542036 0.633$0$560 $560
$40,2812037 0.618$64,625$571 $65,196
%NPV 15.62% 84.38%
Discounting
Convention
Inflation
Schedule
Category /
Residual
Schedule
$7,393
M-O-Y
2017 General
Recurring
Costs
$39,929
M-O-Y
No Inflation
Recurring
Costs
7

Life Cycle Cost Report
Caretaker StatusAlternative:
Year Cumulative
Net Present
Value
2018 $387
2019 $772
2020 $1,156
2021 $1,537
2022 $1,916
2023 $2,294
2024 $2,670
2025 $3,044
2026 $3,416
2027 $3,787
2028 $4,155
2029 $4,522
2030 $4,887
2031 $5,250
2032 $5,612
2033 $5,971
2034 $6,329
2035 $6,685
2036 $7,040
2037 $47,321
Discount Rate: 2.5%
Period of Analysis: 20 years
8

Life Cycle Cost Report
Sources and Derivations:
. Demolition
. Demolition
Estimated demolition cost is $10/sf.
$10*1175= $11,750
a
1
. Renovation/Conversion
. Renovation/Conversion
To be made practical, this building would require total renovation to includerepairingor replacing roofing, flooring, plumbing, electrical, communications, and othersystems.
Estimated cost is $55/sf or 55*1,175 = $64,625.
a
2
. Other DOD or Federal Agency Facilities
. Other DOD/Agency Reno
This alternative offers the building to another DOD or federal agency. Theagencywould be responsible for the renovation/conversion of the facility. Cost wouldbe thesame as the renovation/conversion alternative - $55*1,175 = $64,625.
Due to the relatively small size of this building (1,175 sf), location, lack ofparking, and the cost and time required for renovation, it’s unlikely that anotheragency would select it. This alternative is viable.
a
3
. Caretaker Status
. Caretaker Status Maintenance
The current cost of maintaining a facility in a caretaker status is $0.33/sf. Thisalternative provides the minimum facility maintenance necessary to keep thebuilding from deteriorating from lack of use and to prevent existing conditionsfrom worsening. When the decision to bring the building back on line is made,the facility will still require major renovation to be made functional.
a
. Renovation after Caretaker
The estimated renovation/conversion cost of this alternative is $55/sf. In thecaretaker status alternative, this cost (or the cost of demolition) would beincurredat the end of the caretaker status period. This cost will need to be adjusted forinflation based on the year that the facility is brought out of Caretaker Statusand renovated.
b
4
9

Discount Rate Sensitivity Analysis
Graph of Net Present Value vs. Discount Rate
Discount Rate (%)
Dollars
0.7 %NPV rankings change at the following discount rates:
10

Discount Rate Sensitivity Analysis
NPV rankings change at the following discount rates:
Table of Net Present Values for each Discount Rate
0.7 %
Discount Rate = -1.0%
Demolition $ 11,809
Other DOD or Federal Agency $ 64,951
Renovation/Conversion $ 64,951
Caretaker Status $ 89,232
Discount Rate = -0.8%
Demolition $ 11,797
Other DOD or Federal Agency $ 64,885
Renovation/Conversion $ 64,885
Caretaker Status $ 85,966
Discount Rate = -0.6%
Demolition $ 11,785
Other DOD or Federal Agency $ 64,820
Renovation/Conversion $ 64,820
Caretaker Status $ 82,830
Discount Rate = -0.4%
Demolition $ 11,774
Other DOD or Federal Agency $ 64,755
Renovation/Conversion $ 64,755
Caretaker Status $ 79,818
Discount Rate = -0.2%
Demolition $ 11,762
Other DOD or Federal Agency $ 64,690
Renovation/Conversion $ 64,690
Caretaker Status $ 76,925
Discount Rate = -0.0%
Demolition $ 11,750
Other DOD or Federal Agency $ 64,625
Renovation/Conversion $ 64,625
Caretaker Status $ 74,146
Discount Rate = 0.2%
Demolition $ 11,738
Other DOD or Federal Agency $ 64,560
Renovation/Conversion $ 64,560
Caretaker Status $ 71,477
Discount Rate = 0.4%
Demolition $ 11,727
Other DOD or Federal Agency $ 64,496
Renovation/Conversion $ 64,496
Caretaker Status $ 68,912
Discount Rate = 0.6%
Demolition $ 11,715
Other DOD or Federal Agency $ 64,432
Renovation/Conversion $ 64,432
Caretaker Status $ 66,448
Discount Rate = 0.8%
Demolition $ 11,703
Caretaker Status $ 64,080
Other DOD or Federal Agency $ 64,368
Renovation/Conversion $ 64,368
Discount Rate = 1.0%
Demolition $ 11,692
Caretaker Status $ 61,805
Other DOD or Federal Agency $ 64,304
Renovation/Conversion $ 64,304
Discount Rate = 1.2%
Demolition $ 11,680
Caretaker Status $ 59,617
Other DOD or Federal Agency $ 64,241
Renovation/Conversion $ 64,241
Discount Rate = 1.4%
Demolition $ 11,669
Caretaker Status $ 57,515
Other DOD or Federal Agency $ 64,177
Renovation/Conversion $ 64,177
Discount Rate = 1.6%
Demolition $ 11,657
Caretaker Status $ 55,494
Other DOD or Federal Agency $ 64,114
Renovation/Conversion $ 64,114
Discount Rate = 1.8%
Demolition $ 11,646
Caretaker Status $ 53,552
Other DOD or Federal Agency $ 64,051
Renovation/Conversion $ 64,051
Discount Rate = 2.0%
Demolition $ 11,634
Caretaker Status $ 51,684
Other DOD or Federal Agency $ 63,988
Renovation/Conversion $ 63,988
11
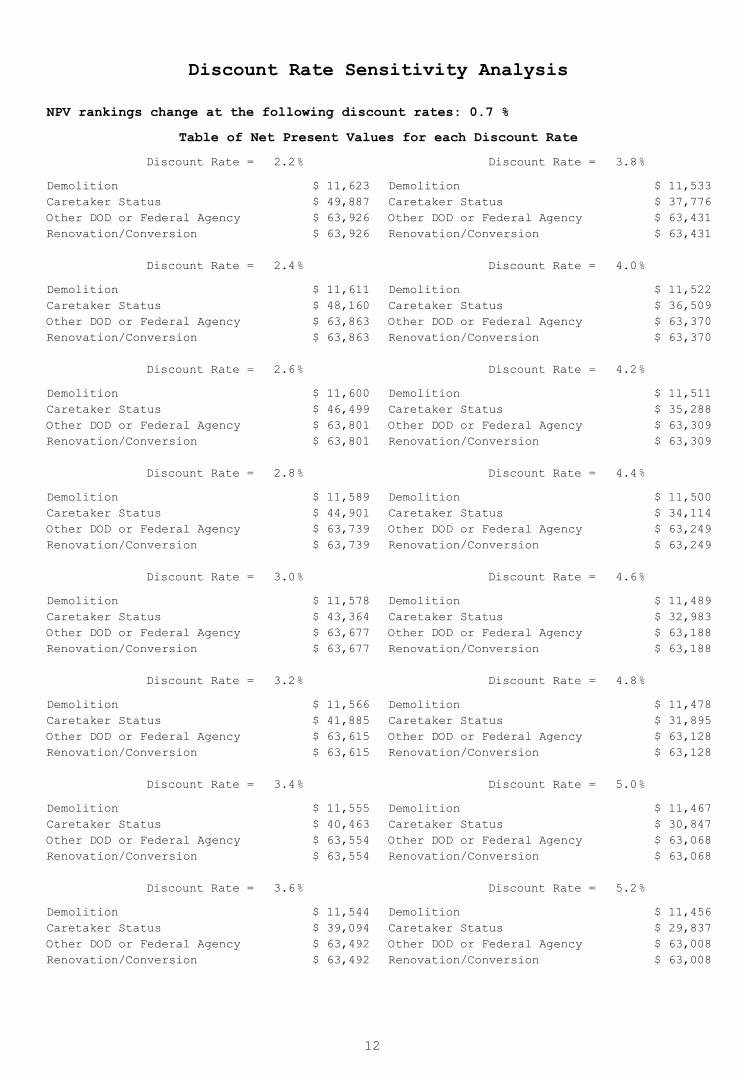
Discount Rate Sensitivity Analysis
NPV rankings change at the following discount rates:
Table of Net Present Values for each Discount Rate
0.7 %
Discount Rate = 2.2%
Demolition $ 11,623
Caretaker Status $ 49,887
Other DOD or Federal Agency $ 63,926
Renovation/Conversion $ 63,926
Discount Rate = 2.4%
Demolition $ 11,611
Caretaker Status $ 48,160
Other DOD or Federal Agency $ 63,863
Renovation/Conversion $ 63,863
Discount Rate = 2.6%
Demolition $ 11,600
Caretaker Status $ 46,499
Other DOD or Federal Agency $ 63,801
Renovation/Conversion $ 63,801
Discount Rate = 2.8%
Demolition $ 11,589
Caretaker Status $ 44,901
Other DOD or Federal Agency $ 63,739
Renovation/Conversion $ 63,739
Discount Rate = 3.0%
Demolition $ 11,578
Caretaker Status $ 43,364
Other DOD or Federal Agency $ 63,677
Renovation/Conversion $ 63,677
Discount Rate = 3.2%
Demolition $ 11,566
Caretaker Status $ 41,885
Other DOD or Federal Agency $ 63,615
Renovation/Conversion $ 63,615
Discount Rate = 3.4%
Demolition $ 11,555
Caretaker Status $ 40,463
Other DOD or Federal Agency $ 63,554
Renovation/Conversion $ 63,554
Discount Rate = 3.6%
Demolition $ 11,544
Caretaker Status $ 39,094
Other DOD or Federal Agency $ 63,492
Renovation/Conversion $ 63,492
Discount Rate = 3.8%
Demolition $ 11,533
Caretaker Status $ 37,776
Other DOD or Federal Agency $ 63,431
Renovation/Conversion $ 63,431
Discount Rate = 4.0%
Demolition $ 11,522
Caretaker Status $ 36,509
Other DOD or Federal Agency $ 63,370
Renovation/Conversion $ 63,370
Discount Rate = 4.2%
Demolition $ 11,511
Caretaker Status $ 35,288
Other DOD or Federal Agency $ 63,309
Renovation/Conversion $ 63,309
Discount Rate = 4.4%
Demolition $ 11,500
Caretaker Status $ 34,114
Other DOD or Federal Agency $ 63,249
Renovation/Conversion $ 63,249
Discount Rate = 4.6%
Demolition $ 11,489
Caretaker Status $ 32,983
Other DOD or Federal Agency $ 63,188
Renovation/Conversion $ 63,188
Discount Rate = 4.8%
Demolition $ 11,478
Caretaker Status $ 31,895
Other DOD or Federal Agency $ 63,128
Renovation/Conversion $ 63,128
Discount Rate = 5.0%
Demolition $ 11,467
Caretaker Status $ 30,847
Other DOD or Federal Agency $ 63,068
Renovation/Conversion $ 63,068
Discount Rate = 5.2%
Demolition $ 11,456
Caretaker Status $ 29,837
Other DOD or Federal Agency $ 63,008
Renovation/Conversion $ 63,008
12

Discount Rate Sensitivity Analysis
NPV rankings change at the following discount rates:
Table of Net Present Values for each Discount Rate
0.7 %
Discount Rate = 5.4%
Demolition $ 11,445
Caretaker Status $ 28,865
Other DOD or Federal Agency $ 62,948
Renovation/Conversion $ 62,948
Discount Rate = 5.6%
Demolition $ 11,434
Caretaker Status $ 27,929
Other DOD or Federal Agency $ 62,888
Renovation/Conversion $ 62,888
Discount Rate = 5.8%
Demolition $ 11,423
Caretaker Status $ 27,028
Other DOD or Federal Agency $ 62,829
Renovation/Conversion $ 62,829
Discount Rate = 6.0%
Demolition $ 11,413
Caretaker Status $ 26,159
Other DOD or Federal Agency $ 62,769
Renovation/Conversion $ 62,769
Discount Rate = 6.2%
Demolition $ 11,402
Caretaker Status $ 25,322
Other DOD or Federal Agency $ 62,710
Renovation/Conversion $ 62,710
Discount Rate = 6.4%
Demolition $ 11,391
Caretaker Status $ 24,516
Other DOD or Federal Agency $ 62,651
Renovation/Conversion $ 62,651
Discount Rate = 6.6%
Demolition $ 11,380
Caretaker Status $ 23,739
Other DOD or Federal Agency $ 62,592
Renovation/Conversion $ 62,592
Discount Rate = 6.8%
Demolition $ 11,370
Caretaker Status $ 22,990
Other DOD or Federal Agency $ 62,534
Renovation/Conversion $ 62,534
Discount Rate = 7.0%
Demolition $ 11,359
Caretaker Status $ 22,269
Other DOD or Federal Agency $ 62,475
Renovation/Conversion $ 62,475
Discount Rate = 7.2%
Demolition $ 11,349
Caretaker Status $ 21,573
Other DOD or Federal Agency $ 62,417
Renovation/Conversion $ 62,417
Discount Rate = 7.4%
Demolition $ 11,338
Caretaker Status $ 20,903
Other DOD or Federal Agency $ 62,359
Renovation/Conversion $ 62,359
Discount Rate = 7.6%
Demolition $ 11,327
Caretaker Status $ 20,257
Other DOD or Federal Agency $ 62,301
Renovation/Conversion $ 62,301
Discount Rate = 7.8%
Demolition $ 11,317
Caretaker Status $ 19,633
Other DOD or Federal Agency $ 62,243
Renovation/Conversion $ 62,243
Discount Rate = 8.0%
Demolition $ 11,306
Caretaker Status $ 19,033
Other DOD or Federal Agency $ 62,185
Renovation/Conversion $ 62,185
Discount Rate = 8.2%
Demolition $ 11,296
Caretaker Status $ 18,453
Other DOD or Federal Agency $ 62,128
Renovation/Conversion $ 62,128
Discount Rate = 8.4%
Demolition $ 11,286
Caretaker Status $ 17,894
Other DOD or Federal Agency $ 62,071
Renovation/Conversion $ 62,071
13

Discount Rate Sensitivity Analysis
NPV rankings change at the following discount rates:
Table of Net Present Values for each Discount Rate
0.7 %
Discount Rate = 8.6%
Demolition $ 11,275
Caretaker Status $ 17,355
Other DOD or Federal Agency $ 62,013
Renovation/Conversion $ 62,013
Discount Rate = 8.8%
Demolition $ 11,265
Caretaker Status $ 16,835
Other DOD or Federal Agency $ 61,956
Renovation/Conversion $ 61,956
Discount Rate = 9.0%
Demolition $ 11,254
Caretaker Status $ 16,334
Other DOD or Federal Agency $ 61,900
Renovation/Conversion $ 61,900
Discount Rate = 9.2%
Demolition $ 11,244
Caretaker Status $ 15,850
Other DOD or Federal Agency $ 61,843
Renovation/Conversion $ 61,843
Discount Rate = 9.4%
Demolition $ 11,234
Caretaker Status $ 15,383
Other DOD or Federal Agency $ 61,786
Renovation/Conversion $ 61,786
Discount Rate = 9.6%
Demolition $ 11,224
Caretaker Status $ 14,932
Other DOD or Federal Agency $ 61,730
Renovation/Conversion $ 61,730
Discount Rate = 9.8%
Demolition $ 11,213
Caretaker Status $ 14,497
Other DOD or Federal Agency $ 61,674
Renovation/Conversion $ 61,674
Discount Rate = 10.0%
Demolition $ 11,203
Caretaker Status $ 14,078
Other DOD or Federal Agency $ 61,618
Renovation/Conversion $ 61,618
14

Date Generated:
Time Generated:
Version:
12 June 2018
16.35.24
Building 319 Disposal
Economic Analysis
2018
Project Title
:
Type of Analysis
Discount Rate
Period of Analysis
Start Year
Base Year
Dollar Analysis
:
:
:
:
:
:
Facilities Reduction Program
Mission Requirement - Full
2.5%
2018
20 years
Current Dollars
Project Objective :
Executive Summary Report
To determine the most economical course of action for
Building 319
that meets the EXORD requirement to reduce excess square
footage.
Building 319 has been identified as a facility for disposal per HQDA EXORD 164-15.
HQDA EXORD 164-15, "Reduce the Installation Facility Footprint," published March 2015,holds commanders and planners accountable for making all reasonable efforts to maximizespace utilization, consolidate units into our best facilities, and dispose of excess assets.Although the Reduce the Footprint (RtF) acronym has taken hold, the EXORD is really aboutthe efficient management of our real property assets. Significant cost reductions can only beachieved with transformational changes that enable us to reduce our expenditures on facilitiesand services.
Background:
ECONPACK 4.0.32
Alternatives Considered for this Analysis:
Demolition - This alternative will demolish the building and restore the site
to a grassed area. This
alternative meets the requirements of the Executive Order Number 164-15 to
dispose of
excess facilities. Demolition cost is estimated to be $10/sf – 919*10 =
$9,190. This is
a viable alternative. This is a viable alternative.
Renovation/Conversion - Conversion/Alternate Use - This alternative renovates
the facility for use for another
Category Code. The best option for conversion of building, based on its current
configuration, is to use it for Category Code 44224, Organizational Storage.
To be made practical, this building would require total renovation to include
repairing or replacing roofing, flooring, plumbing, electrical, communications,
and other systems. Estimated cost is $55/sf or 919*55 = $50,545. However,
there currently is an excess of space in this category code and converting into
this category would violate the intent of the Exord. This is a viable
alternative This is a viable alternative.
DOD or Federal Agency - This alternative offers the building to another DOD or
federal agency. The agency would be responsible for the renovation/conversion
of the facility. Cost would be the same as the renovation/conversion
alternative - $55*919 = $50,545. Due to the small size of this building (919
sf), location – inside the Lawson Army Airfield (LAAF) fence line, and the cost
and time required for renovation, it’s unlikely that another agency would
1
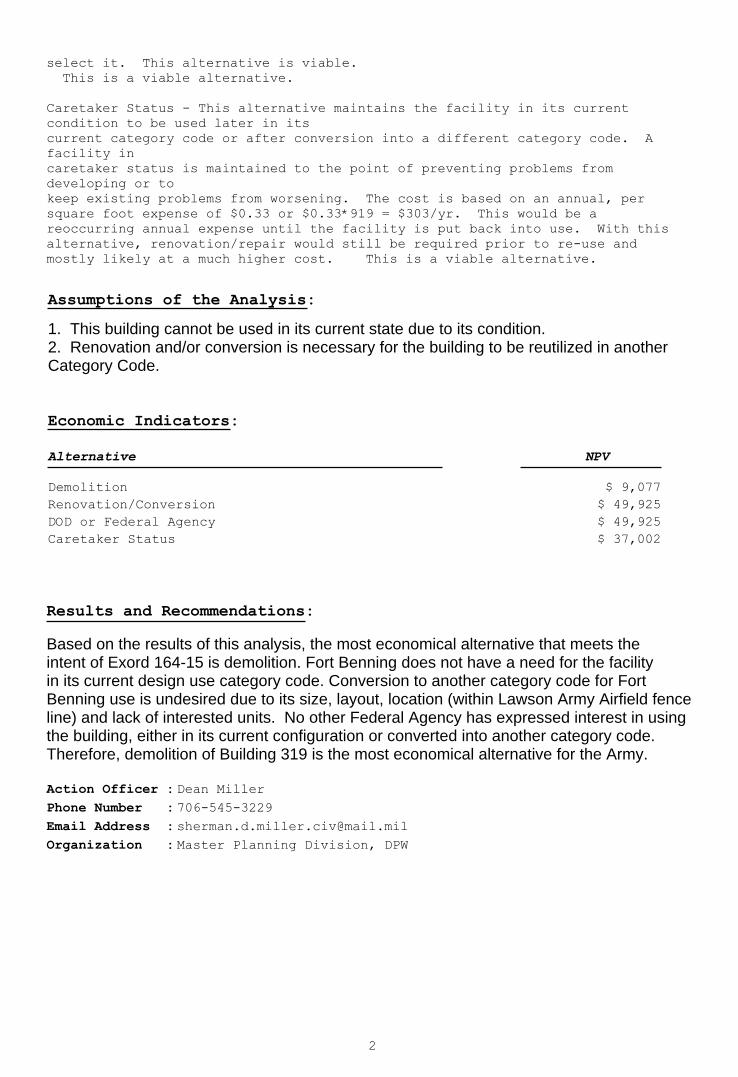
select it. This alternative is viable.
This is a viable alternative.
Caretaker Status - This alternative maintains the facility in its current
condition to be used later in its
current category code or after conversion into a different category code. A
facility in
caretaker status is maintained to the point of preventing problems from
developing or to
keep existing problems from worsening. The cost is based on an annual, per
square foot expense of $0.33 or $0.33*919 = $303/yr. This would be a
reoccurring annual expense until the facility is put back into use. With this
alternative, renovation/repair would still be required prior to re-use and
mostly likely at a much higher cost. This is a viable alternative.
Email Address
706-545-3229Phone Number
Master Planning Division, DPW
Organization
Dean MillerAction Officer :
:
:
:
Economic Indicators:
Alternative NPV
Demolition $ 9,077
Renovation/Conversion $ 49,925
DOD or Federal Agency $ 49,925
Caretaker Status $ 37,002
1. This building cannot be used in its current state due to its condition.2. Renovation and/or conversion is necessary for the building to be reutilized in anotherCategory Code.
Assumptions of the Analysis:
Results and Recommendations:
Based on the results of this analysis, the most economical alternative that meets theintent of Exord 164-15 is demolition. Fort Benning does not have a need for the facilityin its current design use category code. Conversion to another category code for FortBenning use is undesired due to its size, layout, location (within Lawson Army Airfield fenceline) and lack of interested units. No other Federal Agency has expressed interest in usingthe building, either in its current configuration or converted into another category code.Therefore, demolition of Building 319 is the most economical alternative for the Army.
2

Economic Analysis Graph
Net Present Value
Year
Dollars
3

Life Cycle Cost Report
DemolitionAlternative:
Year Demolition Total
Annual
Outlays
Middle
of Year
Discount
Factors
Present
Value
Cumulative
Net Present
Value
$9,0772018 $9,077$9,190$9,190 0.988
$9,0772019 $0$0$0 0.964
$9,0772020 $0$0$0 0.94
$9,0772021 $0$0$0 0.917
$9,0772022 $0$0$0 0.895
$9,0772023 $0$0$0 0.873
$9,0772024 $0$0$0 0.852
$9,0772025 $0$0$0 0.831
$9,0772026 $0$0$0 0.811
$9,0772027 $0$0$0 0.791
$9,0772028 $0$0$0 0.772
$9,0772029 $0$0$0 0.753
$9,0772030 $0$0$0 0.734
$9,0772031 $0$0$0 0.717
$9,0772032 $0$0$0 0.699
$9,0772033 $0$0$0 0.682
$9,0772034 $0$0$0 0.665
$9,0772035 $0$0$0 0.649
$9,0772036 $0$0$0 0.633
$9,0772037 $0$0$0 0.618
%NPV 100.00%
Discounting
Convention
Inflation
Schedule
Category /
Residual
Schedule
$9,077
M-O-Y
No Inflation
Non-Recurring
Costs
Discount Rate: 2.5%
Period of Analysis: 20 years
4

Life Cycle Cost Report
Renovation/ConversionAlternative:
Year Renovation/Con
version
Total
Annual
Outlays
Middle
of Year
Discount
Factors
Present
Value
Cumulative
Net Present
Value
$49,9252018 $49,925$50,545$50,545 0.988
$49,9252019 $0$0$0 0.964
$49,9252020 $0$0$0 0.94
$49,9252021 $0$0$0 0.917
$49,9252022 $0$0$0 0.895
$49,9252023 $0$0$0 0.873
$49,9252024 $0$0$0 0.852
$49,9252025 $0$0$0 0.831
$49,9252026 $0$0$0 0.811
$49,9252027 $0$0$0 0.791
$49,9252028 $0$0$0 0.772
$49,9252029 $0$0$0 0.753
$49,9252030 $0$0$0 0.734
$49,9252031 $0$0$0 0.717
$49,9252032 $0$0$0 0.699
$49,9252033 $0$0$0 0.682
$49,9252034 $0$0$0 0.665
$49,9252035 $0$0$0 0.649
$49,9252036 $0$0$0 0.633
$49,9252037 $0$0$0 0.618
%NPV 100.00%
Discounting
Convention
Inflation
Schedule
Category /
Residual
Schedule
$49,925
M-O-Y
No Inflation
Non-Recurring
Costs
Discount Rate: 2.5%
Period of Analysis: 20 years
5

Life Cycle Cost Report
DOD or Federal AgencyAlternative:
Year Renovation for
Other DOD or
Agency
Total
Annual
Outlays
Middle
of Year
Discount
Factors
Present
Value
Cumulative
Net Present
Value
$49,9252018 $49,925$50,545$50,545 0.988
$49,9252019 $0$0$0 0.964
$49,9252020 $0$0$0 0.94
$49,9252021 $0$0$0 0.917
$49,9252022 $0$0$0 0.895
$49,9252023 $0$0$0 0.873
$49,9252024 $0$0$0 0.852
$49,9252025 $0$0$0 0.831
$49,9252026 $0$0$0 0.811
$49,9252027 $0$0$0 0.791
$49,9252028 $0$0$0 0.772
$49,9252029 $0$0$0 0.753
$49,9252030 $0$0$0 0.734
$49,9252031 $0$0$0 0.717
$49,9252032 $0$0$0 0.699
$49,9252033 $0$0$0 0.682
$49,9252034 $0$0$0 0.665
$49,9252035 $0$0$0 0.649
$49,9252036 $0$0$0 0.633
$49,9252037 $0$0$0 0.618
%NPV 100.00%
Discounting
Convention
Inflation
Schedule
Category /
Residual
Schedule
$49,925
M-O-Y
No Inflation
Non-Recurring
Costs
Discount Rate: 2.5%
Period of Analysis: 20 years
6

Life Cycle Cost Report
Caretaker StatusAlternative:
Year Caretaker
Status
Renovation Total
Annual
Outlays
Middle
of Year
Discount
Factors
Present
Value
$3022018 0.988$0$306 $306
$3012019 0.964$0$312 $312
$2992020 0.94$0$318 $318
$2982021 0.917$0$325 $325
$2962022 0.895$0$331 $331
$2952023 0.873$0$338 $338
$2942024 0.852$0$345 $345
$2922025 0.831$0$352 $352
$2912026 0.811$0$359 $359
$2892027 0.791$0$366 $366
$2882028 0.772$0$373 $373
$2862029 0.753$0$380 $380
$2852030 0.734$0$388 $388
$2842031 0.717$0$396 $396
$2822032 0.699$0$404 $404
$2812033 0.682$0$412 $412
$2802034 0.665$0$420 $420
$2782035 0.649$0$428 $428
$2772036 0.633$0$437 $437
$31,5052037 0.618$50,545$446 $50,991
%NPV 15.60% 84.40%
Discounting
Convention
Inflation
Schedule
Category /
Residual
Schedule
$5,773
M-O-Y
2017 General
Recurring
Costs
$31,229
M-O-Y
No Inflation
Non-Recurring
Costs
7

Life Cycle Cost Report
Caretaker StatusAlternative:
Year Cumulative
Net Present
Value
2018 $302
2019 $603
2020 $902
2021 $1,200
2022 $1,497
2023 $1,792
2024 $2,085
2025 $2,377
2026 $2,668
2027 $2,957
2028 $3,245
2029 $3,531
2030 $3,816
2031 $4,100
2032 $4,382
2033 $4,663
2034 $4,943
2035 $5,221
2036 $5,498
2037 $37,002
Discount Rate: 2.5%
Period of Analysis: 20 years
8

Life Cycle Cost Report
Sources and Derivations:
. Demolition
. Demolition
Estimated demolition cost is $10/sf.
$10*919= $9,190
a
1
. Renovation/Conversion
. Renovation/Conversion
To be made practical, this building would require total renovation to includerepairing or replacing roofing, flooring, plumbing, electrical, communications,and other systems. Estimated cost is $55/sf or 55*919 = $50,545
a
2
. DOD or Federal Agency
. Renovation for Other DOD or Agency
This alternative offers the building to another DOD or federal agency. Theagencywould be responsible for the renovation/conversion of the facility. Cost wouldbe thesame as the renovation/conversion alternative - $55*919 = $50,545.
Due to the relatively small size of this building (919 sf), location, lack ofparking, and the cost and time required for renovation, it’s unlikely that anotheragency would select it. This alternative is viable.
a
3
. Caretaker Status
. Caretaker Status
The current cost of maintaining a facility in a caretaker status is $0.33/sf. Thisalternative provides the minimum facility maintenance necessary to keep thebuilding from deteriorating from lack of use and to prevent existing conditionsfrom worsening. When the decision to bring the building back on line is made,the facility will still require major renovation to be made functional.
a
. Renovation
The estimated renovation/conversion cost of this alternative is $55/sf. In thecaretaker status alternative, this cost (or the cost of demolition) would beincurredat the end of the caretaker status period. This cost will need to be adjusted forinflation based on the year that the facility is brought out of Caretaker Statusand renovated.
b
4
9

Discount Rate Sensitivity Analysis
Graph of Net Present Value vs. Discount Rate
Discount Rate (%)
Dollars
0.7 %NPV rankings change at the following discount rates:
10

Discount Rate Sensitivity Analysis
NPV rankings change at the following discount rates:
Table of Net Present Values for each Discount Rate
0.7 %
Discount Rate = -1.0%
Demolition $ 9,236
DOD or Federal Agency $ 50,800
Renovation/Conversion $ 50,800
Caretaker Status $ 69,778
Discount Rate = -0.8%
Demolition $ 9,227
DOD or Federal Agency $ 50,748
Renovation/Conversion $ 50,748
Caretaker Status $ 67,224
Discount Rate = -0.6%
Demolition $ 9,218
DOD or Federal Agency $ 50,697
Renovation/Conversion $ 50,697
Caretaker Status $ 64,771
Discount Rate = -0.4%
Demolition $ 9,208
DOD or Federal Agency $ 50,646
Renovation/Conversion $ 50,646
Caretaker Status $ 62,416
Discount Rate = -0.2%
Demolition $ 9,199
DOD or Federal Agency $ 50,596
Renovation/Conversion $ 50,596
Caretaker Status $ 60,153
Discount Rate = -0.0%
Demolition $ 9,190
DOD or Federal Agency $ 50,545
Renovation/Conversion $ 50,545
Caretaker Status $ 57,980
Discount Rate = 0.2%
Demolition $ 9,181
DOD or Federal Agency $ 50,495
Renovation/Conversion $ 50,495
Caretaker Status $ 55,893
Discount Rate = 0.4%
Demolition $ 9,172
DOD or Federal Agency $ 50,444
Renovation/Conversion $ 50,444
Caretaker Status $ 53,887
Discount Rate = 0.6%
Demolition $ 9,163
DOD or Federal Agency $ 50,394
Renovation/Conversion $ 50,394
Caretaker Status $ 51,960
Discount Rate = 0.8%
Demolition $ 9,153
Caretaker Status $ 50,108
DOD or Federal Agency $ 50,344
Renovation/Conversion $ 50,344
Discount Rate = 1.0%
Demolition $ 9,144
Caretaker Status $ 48,329
DOD or Federal Agency $ 50,294
Renovation/Conversion $ 50,294
Discount Rate = 1.2%
Demolition $ 9,135
Caretaker Status $ 46,618
DOD or Federal Agency $ 50,244
Renovation/Conversion $ 50,244
Discount Rate = 1.4%
Demolition $ 9,126
Caretaker Status $ 44,974
DOD or Federal Agency $ 50,195
Renovation/Conversion $ 50,195
Discount Rate = 1.6%
Demolition $ 9,117
Caretaker Status $ 43,394
DOD or Federal Agency $ 50,145
Renovation/Conversion $ 50,145
Discount Rate = 1.8%
Demolition $ 9,108
Caretaker Status $ 41,875
DOD or Federal Agency $ 50,096
Renovation/Conversion $ 50,096
Discount Rate = 2.0%
Demolition $ 9,099
Caretaker Status $ 40,414
DOD or Federal Agency $ 50,047
Renovation/Conversion $ 50,047
11

Discount Rate Sensitivity Analysis
NPV rankings change at the following discount rates:
Table of Net Present Values for each Discount Rate
0.7 %
Discount Rate = 2.2%
Demolition $ 9,091
Caretaker Status $ 39,009
DOD or Federal Agency $ 49,998
Renovation/Conversion $ 49,998
Discount Rate = 2.4%
Demolition $ 9,082
Caretaker Status $ 37,658
DOD or Federal Agency $ 49,949
Renovation/Conversion $ 49,949
Discount Rate = 2.6%
Demolition $ 9,073
Caretaker Status $ 36,359
DOD or Federal Agency $ 49,900
Renovation/Conversion $ 49,900
Discount Rate = 2.8%
Demolition $ 9,064
Caretaker Status $ 35,110
DOD or Federal Agency $ 49,852
Renovation/Conversion $ 49,852
Discount Rate = 3.0%
Demolition $ 9,055
Caretaker Status $ 33,908
DOD or Federal Agency $ 49,803
Renovation/Conversion $ 49,803
Discount Rate = 3.2%
Demolition $ 9,046
Caretaker Status $ 32,751
DOD or Federal Agency $ 49,755
Renovation/Conversion $ 49,755
Discount Rate = 3.4%
Demolition $ 9,038
Caretaker Status $ 31,639
DOD or Federal Agency $ 49,707
Renovation/Conversion $ 49,707
Discount Rate = 3.6%
Demolition $ 9,029
Caretaker Status $ 30,568
DOD or Federal Agency $ 49,659
Renovation/Conversion $ 49,659
Discount Rate = 3.8%
Demolition $ 9,020
Caretaker Status $ 29,538
DOD or Federal Agency $ 49,611
Renovation/Conversion $ 49,611
Discount Rate = 4.0%
Demolition $ 9,012
Caretaker Status $ 28,547
DOD or Federal Agency $ 49,563
Renovation/Conversion $ 49,563
Discount Rate = 4.2%
Demolition $ 9,003
Caretaker Status $ 27,593
DOD or Federal Agency $ 49,516
Renovation/Conversion $ 49,516
Discount Rate = 4.4%
Demolition $ 8,994
Caretaker Status $ 26,674
DOD or Federal Agency $ 49,468
Renovation/Conversion $ 49,468
Discount Rate = 4.6%
Demolition $ 8,986
Caretaker Status $ 25,790
DOD or Federal Agency $ 49,421
Renovation/Conversion $ 49,421
Discount Rate = 4.8%
Demolition $ 8,977
Caretaker Status $ 24,939
DOD or Federal Agency $ 49,374
Renovation/Conversion $ 49,374
Discount Rate = 5.0%
Demolition $ 8,969
Caretaker Status $ 24,119
DOD or Federal Agency $ 49,327
Renovation/Conversion $ 49,327
Discount Rate = 5.2%
Demolition $ 8,960
Caretaker Status $ 23,330
DOD or Federal Agency $ 49,280
Renovation/Conversion $ 49,280
12

Discount Rate Sensitivity Analysis
NPV rankings change at the following discount rates:
Table of Net Present Values for each Discount Rate
0.7 %
Discount Rate = 5.4%
Demolition $ 8,951
Caretaker Status $ 22,570
DOD or Federal Agency $ 49,233
Renovation/Conversion $ 49,233
Discount Rate = 5.6%
Demolition $ 8,943
Caretaker Status $ 21,838
DOD or Federal Agency $ 49,187
Renovation/Conversion $ 49,187
Discount Rate = 5.8%
Demolition $ 8,935
Caretaker Status $ 21,132
DOD or Federal Agency $ 49,140
Renovation/Conversion $ 49,140
Discount Rate = 6.0%
Demolition $ 8,926
Caretaker Status $ 20,453
DOD or Federal Agency $ 49,094
Renovation/Conversion $ 49,094
Discount Rate = 6.2%
Demolition $ 8,918
Caretaker Status $ 19,799
DOD or Federal Agency $ 49,047
Renovation/Conversion $ 49,047
Discount Rate = 6.4%
Demolition $ 8,909
Caretaker Status $ 19,168
DOD or Federal Agency $ 49,001
Renovation/Conversion $ 49,001
Discount Rate = 6.6%
Demolition $ 8,901
Caretaker Status $ 18,561
DOD or Federal Agency $ 48,955
Renovation/Conversion $ 48,955
Discount Rate = 6.8%
Demolition $ 8,893
Caretaker Status $ 17,975
DOD or Federal Agency $ 48,909
Renovation/Conversion $ 48,909
Discount Rate = 7.0%
Demolition $ 8,884
Caretaker Status $ 17,411
DOD or Federal Agency $ 48,864
Renovation/Conversion $ 48,864
Discount Rate = 7.2%
Demolition $ 8,876
Caretaker Status $ 16,867
DOD or Federal Agency $ 48,818
Renovation/Conversion $ 48,818
Discount Rate = 7.4%
Demolition $ 8,868
Caretaker Status $ 16,343
DOD or Federal Agency $ 48,773
Renovation/Conversion $ 48,773
Discount Rate = 7.6%
Demolition $ 8,860
Caretaker Status $ 15,837
DOD or Federal Agency $ 48,727
Renovation/Conversion $ 48,727
Discount Rate = 7.8%
Demolition $ 8,851
Caretaker Status $ 15,350
DOD or Federal Agency $ 48,682
Renovation/Conversion $ 48,682
Discount Rate = 8.0%
Demolition $ 8,843
Caretaker Status $ 14,880
DOD or Federal Agency $ 48,637
Renovation/Conversion $ 48,637
Discount Rate = 8.2%
Demolition $ 8,835
Caretaker Status $ 14,427
DOD or Federal Agency $ 48,592
Renovation/Conversion $ 48,592
Discount Rate = 8.4%
Demolition $ 8,827
Caretaker Status $ 13,990
DOD or Federal Agency $ 48,547
Renovation/Conversion $ 48,547
13

Discount Rate Sensitivity Analysis
NPV rankings change at the following discount rates:
Table of Net Present Values for each Discount Rate
0.7 %
Discount Rate = 8.6%
Demolition $ 8,819
Caretaker Status $ 13,569
DOD or Federal Agency $ 48,502
Renovation/Conversion $ 48,502
Discount Rate = 8.8%
Demolition $ 8,811
Caretaker Status $ 13,162
DOD or Federal Agency $ 48,458
Renovation/Conversion $ 48,458
Discount Rate = 9.0%
Demolition $ 8,802
Caretaker Status $ 12,770
DOD or Federal Agency $ 48,413
Renovation/Conversion $ 48,413
Discount Rate = 9.2%
Demolition $ 8,794
Caretaker Status $ 12,391
DOD or Federal Agency $ 48,369
Renovation/Conversion $ 48,369
Discount Rate = 9.4%
Demolition $ 8,786
Caretaker Status $ 12,026
DOD or Federal Agency $ 48,325
Renovation/Conversion $ 48,325
Discount Rate = 9.6%
Demolition $ 8,778
Caretaker Status $ 11,674
DOD or Federal Agency $ 48,281
Renovation/Conversion $ 48,281
Discount Rate = 9.8%
Demolition $ 8,770
Caretaker Status $ 11,334
DOD or Federal Agency $ 48,237
Renovation/Conversion $ 48,237
Discount Rate = 10.0%
Demolition $ 8,762
Caretaker Status $ 11,006
DOD or Federal Agency $ 48,193
Renovation/Conversion $ 48,193
14

Date Generated:
Time Generated:
Version:
12 June 2018
16.36.04
Building 328
Economic Analysis
2018
Project Title
:
Type of Analysis
Discount Rate
Period of Analysis
Start Year
Base Year
Dollar Analysis
:
:
:
:
:
:
Facilities Reduction Program
Mission Requirement - Full
2.5%
2018
20 years
Current Dollars
Project Objective :
Executive Summary Report
To determine the most economical course of action for
Building 328
that meets the EXORD requirement to reduce excess square
footage.
Building 328 has been identified as a facility for disposal per HQDA EXORD 164-15.
HQDA EXORD 164-15, "Reduce the Installation Facility Footprint," published March 2015,holds commanders and planners accountable for making all reasonable efforts to maximizespace utilization, consolidate units into our best facilities, and dispose of excess assets.Although the Reduce the Footprint (RtF) acronym has taken hold, the EXORD is really aboutthe efficient management of our real property assets. Significant cost reductions can only beachieved with transformational changes that enable us to reduce our expenditures on facilitiesand services.
Background:
ECONPACK 4.0.32
Alternatives Considered for this Analysis:
Demolition - This alternative will demolish the building and restore the site
to a grassed area. This alternative meets the requirements of the Executive
Order Number 164-15 to dispose of excess facilities. Demolition cost is
estimated to be $10/sf – 7,495*10 = $74,950. This is a viable alternative.
This is a viable alternative.
Renovation/Conversion - Conversion/Alternate Use - This alternative renovates
the facility for use for another
Category Code. The best option for conversion of building, based on its current
configuration, is to use it for Category Code 17120, General Instruction
Building. To be made practical, this building would require total renovation
to include repairing or replacing roofing, flooring, plumbing, electrical,
communications, and other systems. Estimated cost is $55/sf or 7,495*55 =
$415,225. However, there currently is an extreme excess of space in this
category code and converting into this category would violate the intent of the
Exord. This is a viable alternative This is a viable alternative.
Other DOD or Federal Agency - This alternative offers the building to another
DOD or federal agency. The agency would be responsible for the
renovation/conversion of the facility. Cost would be the same as the
renovation/conversion alternative - $55*7,495 = $412,225. Due to the unique
design of this building – a sloped and terraced floor, lack of parking, and the
cost and time required for renovation, it’s unlikely that another agency would
select it. This alternative is viable.
This is a viable alternative.
1

Caretaker Status - This alternative maintains the facility in its current
condition to be used later in its
current category code or after conversion into a different category code. A
facility in
caretaker status is maintained to the point of preventing problems from
developing or to
keep existing problems from worsening. The cost is based on an annual, per
square foot expense of $0.33 or $0.33*7,495 = $2,473/yr. This would be a
reoccurring annual expense until the facility is put back into use. With this
alternative, renovation/repair would still be required prior to re-use and
mostly likely at a much higher cost.
This is a viable alternative.
Email Address
706-545-3229Phone Number
Master Planning Division, DPW
Organization
Dean MillerAction Officer :
:
:
:
Economic Indicators:
Alternative NPV
Demolition $ 74,030
Renovation/Conversion $ 407,167
Other DOD or Federal Agency $ 407,167
Caretaker Status $ 301,812
1. This building cannot be used in its current state due to its condition.2. Renovation and/or conversion is necessary for the building to be reutilized in anotherCategory Code.
Assumptions of the Analysis:
Results and Recommendations:
Based on the results of this analysis, the most economical alternative that meets theintent of Exord 164-15 is demolition. Fort Benning does not have a need for the facilityin its current design use category code. Conversion to another category code for FortBenning use is undesired due to its size, layout, location and lack of interested units.No other Federal Agency has expressed interest in using the building, either in itsCurrent configuration or converted into another category code. Therefore, demolition ofBuilding 328 is the most economical alternative for the Army.
2

Economic Analysis Graph
Net Present Value
Year
Dollars
3

Life Cycle Cost Report
DemolitionAlternative:
Year Demolition Total
Annual
Outlays
Middle
of Year
Discount
Factors
Present
Value
Cumulative
Net Present
Value
$74,0302018 $74,030$74,950$74,950 0.988
$74,0302019 $0$0$0 0.964
$74,0302020 $0$0$0 0.94
$74,0302021 $0$0$0 0.917
$74,0302022 $0$0$0 0.895
$74,0302023 $0$0$0 0.873
$74,0302024 $0$0$0 0.852
$74,0302025 $0$0$0 0.831
$74,0302026 $0$0$0 0.811
$74,0302027 $0$0$0 0.791
$74,0302028 $0$0$0 0.772
$74,0302029 $0$0$0 0.753
$74,0302030 $0$0$0 0.734
$74,0302031 $0$0$0 0.717
$74,0302032 $0$0$0 0.699
$74,0302033 $0$0$0 0.682
$74,0302034 $0$0$0 0.665
$74,0302035 $0$0$0 0.649
$74,0302036 $0$0$0 0.633
$74,0302037 $0$0$0 0.618
%NPV 100.00%
Discounting
Convention
Inflation
Schedule
Category /
Residual
Schedule
$74,030
M-O-Y
No Inflation
Non-Recurring
Costs
Discount Rate: 2.5%
Period of Analysis: 20 years
4

Life Cycle Cost Report
Renovation/ConversionAlternative:
Year Renovation/Con
version
Total
Annual
Outlays
Middle
of Year
Discount
Factors
Present
Value
Cumulative
Net Present
Value
$407,1672018 $407,167$412,225$412,225 0.988
$407,1672019 $0$0$0 0.964
$407,1672020 $0$0$0 0.94
$407,1672021 $0$0$0 0.917
$407,1672022 $0$0$0 0.895
$407,1672023 $0$0$0 0.873
$407,1672024 $0$0$0 0.852
$407,1672025 $0$0$0 0.831
$407,1672026 $0$0$0 0.811
$407,1672027 $0$0$0 0.791
$407,1672028 $0$0$0 0.772
$407,1672029 $0$0$0 0.753
$407,1672030 $0$0$0 0.734
$407,1672031 $0$0$0 0.717
$407,1672032 $0$0$0 0.699
$407,1672033 $0$0$0 0.682
$407,1672034 $0$0$0 0.665
$407,1672035 $0$0$0 0.649
$407,1672036 $0$0$0 0.633
$407,1672037 $0$0$0 0.618
%NPV 100.00%
Discounting
Convention
Inflation
Schedule
Category /
Residual
Schedule
$407,167
M-O-Y
No Inflation
Recurring
Costs
Discount Rate: 2.5%
Period of Analysis: 20 years
5

Life Cycle Cost Report
Other DOD or Federal AgencyAlternative:
Year Renovation for
other DOD or
Agency
Total
Annual
Outlays
Middle
of Year
Discount
Factors
Present
Value
Cumulative
Net Present
Value
$407,1672018 $407,167$412,225$412,225 0.988
$407,1672019 $0$0$0 0.964
$407,1672020 $0$0$0 0.94
$407,1672021 $0$0$0 0.917
$407,1672022 $0$0$0 0.895
$407,1672023 $0$0$0 0.873
$407,1672024 $0$0$0 0.852
$407,1672025 $0$0$0 0.831
$407,1672026 $0$0$0 0.811
$407,1672027 $0$0$0 0.791
$407,1672028 $0$0$0 0.772
$407,1672029 $0$0$0 0.753
$407,1672030 $0$0$0 0.734
$407,1672031 $0$0$0 0.717
$407,1672032 $0$0$0 0.699
$407,1672033 $0$0$0 0.682
$407,1672034 $0$0$0 0.665
$407,1672035 $0$0$0 0.649
$407,1672036 $0$0$0 0.633
$407,1672037 $0$0$0 0.618
%NPV 100.00%
Discounting
Convention
Inflation
Schedule
Category /
Residual
Schedule
$407,167
M-O-Y
No Inflation
Non-Recurring
Costs
Discount Rate: 2.5%
Period of Analysis: 20 years
6

Life Cycle Cost Report
Caretaker StatusAlternative:
Year Caretaker
Status
Maintenance
Construction Total
Annual
Outlays
Middle
of Year
Discount
Factors
Present
Value
$2,4672018 0.988$0$2,498 $2,498
$2,4552019 0.964$0$2,548 $2,548
$2,4432020 0.94$0$2,599 $2,599
$2,4312021 0.917$0$2,650 $2,650
$2,4192022 0.895$0$2,703 $2,703
$2,4072023 0.873$0$2,758 $2,758
$2,3962024 0.852$0$2,813 $2,813
$2,3842025 0.831$0$2,869 $2,869
$2,3722026 0.811$0$2,926 $2,926
$2,3612027 0.791$0$2,985 $2,985
$2,3492028 0.772$0$3,045 $3,045
$2,3382029 0.753$0$3,105 $3,105
$2,3262030 0.734$0$3,168 $3,168
$2,3152031 0.717$0$3,231 $3,231
$2,3042032 0.699$0$3,296 $3,296
$2,2922033 0.682$0$3,361 $3,361
$2,2812034 0.665$0$3,429 $3,429
$2,2702035 0.649$0$3,497 $3,497
$2,2592036 0.633$0$3,567 $3,567
$256,9422037 0.618$412,225$3,639 $415,864
%NPV 15.61% 84.39%
Discounting
Convention
Inflation
Schedule
Category /
Residual
Schedule
$47,118
M-O-Y
2017 General
Recurring
Costs
$254,694
M-O-Y
No Inflation
Non-Recurring
Costs
7

Life Cycle Cost Report
Caretaker StatusAlternative:
Year Cumulative
Net Present
Value
2018 $2,467
2019 $4,922
2020 $7,365
2021 $9,796
2022 $12,215
2023 $14,622
2024 $17,018
2025 $19,402
2026 $21,774
2027 $24,135
2028 $26,484
2029 $28,822
2030 $31,148
2031 $33,463
2032 $35,767
2033 $38,060
2034 $40,341
2035 $42,611
2036 $44,870
2037 $301,812
Discount Rate: 2.5%
Period of Analysis: 20 years
8

Life Cycle Cost Report
Sources and Derivations:
. Demolition
. Demolition
Estimated demolition cost is $10/sf.
$10*7495= $74,950
a
1
. Renovation/Conversion
. Renovation/Conversion
To be made practical, this building would require total renovation to includerepairingor replacing roofing, flooring, plumbing, electrical, communications, and othersystems.Estimated cost is $55/sf or 55*7,495 = $412,225.
a
2
. Other DOD or Federal Agency
. Renovation for other DOD or Agency
This alternative offers the building to another DOD or federal agency. Theagencywould be responsible for the renovation/conversion of the facility. Cost wouldbe thesame as the renovation/conversion alternative - $55*7,495 = $412,225.
Due to the unique design of this building – a sloped and terraced floor, lack ofparking, and the cost and time required for renovation, it’s unlikely that anotheragency would select it. This alternative is viable.
a
3
. Caretaker Status
. Caretaker Status Maintenance
The current cost of maintaining a facility in a caretaker status is $0.33/sf. Thisalternative provides the minimum facility maintenance necessary to keep thebuilding from deteriorating from lack of use and to prevent existing conditionsfrom worsening. When the decision to bring the building back on line is made,the facility will still require major renovation to be made functional.
a
. Construction
This alternative maintains the facility in its current condition to be used later initscurrent category code or after conversion into a different category code. Afacility incaretaker status is maintained to the point of preventing problems fromdeveloping or tokeep existing problems from worsening. The cost is based on an annual, persquare foot expense of $0.33 or $0.33*7495 = $2473/yr. This would be areoccurring annual expense until the facility is put back into use. With thisalternative, renovation/repair would still be required prior to re-use and mostly
b
4
9

Life Cycle Cost Report
likely at a much higher cost.
10

Discount Rate Sensitivity Analysis
Graph of Net Present Value vs. Discount Rate
Discount Rate (%)
Dollars
0.7 %NPV rankings change at the following discount rates:
11

Discount Rate Sensitivity Analysis
NPV rankings change at the following discount rates:
Table of Net Present Values for each Discount Rate
0.7 %
Discount Rate = -1.0%
Demolition $ 75,328
Other DOD or Federal Agency $ 414,302
Renovation/Conversion $ 414,302
Caretaker Status $ 569,132
Discount Rate = -0.8%
Demolition $ 75,252
Other DOD or Federal Agency $ 413,884
Renovation/Conversion $ 413,884
Caretaker Status $ 548,301
Discount Rate = -0.6%
Demolition $ 75,176
Other DOD or Federal Agency $ 413,467
Renovation/Conversion $ 413,467
Caretaker Status $ 528,297
Discount Rate = -0.4%
Demolition $ 75,100
Other DOD or Federal Agency $ 413,052
Renovation/Conversion $ 413,052
Caretaker Status $ 509,086
Discount Rate = -0.2%
Demolition $ 75,025
Other DOD or Federal Agency $ 412,638
Renovation/Conversion $ 412,638
Caretaker Status $ 490,634
Discount Rate = -0.0%
Demolition $ 74,950
Other DOD or Federal Agency $ 412,225
Renovation/Conversion $ 412,225
Caretaker Status $ 472,910
Discount Rate = 0.2%
Demolition $ 74,875
Other DOD or Federal Agency $ 411,813
Renovation/Conversion $ 411,813
Caretaker Status $ 455,884
Discount Rate = 0.4%
Demolition $ 74,801
Other DOD or Federal Agency $ 411,403
Renovation/Conversion $ 411,403
Caretaker Status $ 439,526
Discount Rate = 0.6%
Demolition $ 74,726
Other DOD or Federal Agency $ 410,994
Renovation/Conversion $ 410,994
Caretaker Status $ 423,809
Discount Rate = 0.8%
Demolition $ 74,652
Caretaker Status $ 408,705
Other DOD or Federal Agency $ 410,586
Renovation/Conversion $ 410,586
Discount Rate = 1.0%
Demolition $ 74,578
Caretaker Status $ 394,191
Other DOD or Federal Agency $ 410,179
Renovation/Conversion $ 410,179
Discount Rate = 1.2%
Demolition $ 74,504
Caretaker Status $ 380,241
Other DOD or Federal Agency $ 409,774
Renovation/Conversion $ 409,774
Discount Rate = 1.4%
Demolition $ 74,431
Caretaker Status $ 366,832
Other DOD or Federal Agency $ 409,369
Renovation/Conversion $ 409,369
Discount Rate = 1.6%
Demolition $ 74,358
Caretaker Status $ 353,943
Other DOD or Federal Agency $ 408,966
Renovation/Conversion $ 408,966
Discount Rate = 1.8%
Demolition $ 74,284
Caretaker Status $ 341,551
Other DOD or Federal Agency $ 408,564
Renovation/Conversion $ 408,564
Discount Rate = 2.0%
Demolition $ 74,212
Caretaker Status $ 329,636
Other DOD or Federal Agency $ 408,164
Renovation/Conversion $ 408,164
12

Discount Rate Sensitivity Analysis
NPV rankings change at the following discount rates:
Table of Net Present Values for each Discount Rate
0.7 %
Discount Rate = 2.2%
Demolition $ 74,139
Caretaker Status $ 318,179
Other DOD or Federal Agency $ 407,764
Renovation/Conversion $ 407,764
Discount Rate = 2.4%
Demolition $ 74,066
Caretaker Status $ 307,162
Other DOD or Federal Agency $ 407,366
Renovation/Conversion $ 407,366
Discount Rate = 2.6%
Demolition $ 73,994
Caretaker Status $ 296,566
Other DOD or Federal Agency $ 406,968
Renovation/Conversion $ 406,968
Discount Rate = 2.8%
Demolition $ 73,922
Caretaker Status $ 286,374
Other DOD or Federal Agency $ 406,572
Renovation/Conversion $ 406,572
Discount Rate = 3.0%
Demolition $ 73,850
Caretaker Status $ 276,571
Other DOD or Federal Agency $ 406,177
Renovation/Conversion $ 406,177
Discount Rate = 3.2%
Demolition $ 73,779
Caretaker Status $ 267,139
Other DOD or Federal Agency $ 405,784
Renovation/Conversion $ 405,784
Discount Rate = 3.4%
Demolition $ 73,707
Caretaker Status $ 258,065
Other DOD or Federal Agency $ 405,391
Renovation/Conversion $ 405,391
Discount Rate = 3.6%
Demolition $ 73,636
Caretaker Status $ 249,334
Other DOD or Federal Agency $ 404,999
Renovation/Conversion $ 404,999
Discount Rate = 3.8%
Demolition $ 73,565
Caretaker Status $ 240,932
Other DOD or Federal Agency $ 404,609
Renovation/Conversion $ 404,609
Discount Rate = 4.0%
Demolition $ 73,495
Caretaker Status $ 232,846
Other DOD or Federal Agency $ 404,220
Renovation/Conversion $ 404,220
Discount Rate = 4.2%
Demolition $ 73,424
Caretaker Status $ 225,064
Other DOD or Federal Agency $ 403,832
Renovation/Conversion $ 403,832
Discount Rate = 4.4%
Demolition $ 73,354
Caretaker Status $ 217,573
Other DOD or Federal Agency $ 403,445
Renovation/Conversion $ 403,445
Discount Rate = 4.6%
Demolition $ 73,283
Caretaker Status $ 210,361
Other DOD or Federal Agency $ 403,059
Renovation/Conversion $ 403,059
Discount Rate = 4.8%
Demolition $ 73,213
Caretaker Status $ 203,418
Other DOD or Federal Agency $ 402,674
Renovation/Conversion $ 402,674
Discount Rate = 5.0%
Demolition $ 73,144
Caretaker Status $ 196,733
Other DOD or Federal Agency $ 402,290
Renovation/Conversion $ 402,290
Discount Rate = 5.2%
Demolition $ 73,074
Caretaker Status $ 190,296
Other DOD or Federal Agency $ 401,908
Renovation/Conversion $ 401,908
13

Discount Rate Sensitivity Analysis
NPV rankings change at the following discount rates:
Table of Net Present Values for each Discount Rate
0.7 %
Discount Rate = 5.4%
Demolition $ 73,005
Caretaker Status $ 184,096
Other DOD or Federal Agency $ 401,526
Renovation/Conversion $ 401,526
Discount Rate = 5.6%
Demolition $ 72,936
Caretaker Status $ 178,126
Other DOD or Federal Agency $ 401,146
Renovation/Conversion $ 401,146
Discount Rate = 5.8%
Demolition $ 72,867
Caretaker Status $ 172,374
Other DOD or Federal Agency $ 400,767
Renovation/Conversion $ 400,767
Discount Rate = 6.0%
Demolition $ 72,798
Caretaker Status $ 166,834
Other DOD or Federal Agency $ 400,388
Renovation/Conversion $ 400,388
Discount Rate = 6.2%
Demolition $ 72,729
Caretaker Status $ 161,497
Other DOD or Federal Agency $ 400,011
Renovation/Conversion $ 400,011
Discount Rate = 6.4%
Demolition $ 72,661
Caretaker Status $ 156,354
Other DOD or Federal Agency $ 399,635
Renovation/Conversion $ 399,635
Discount Rate = 6.6%
Demolition $ 72,593
Caretaker Status $ 151,399
Other DOD or Federal Agency $ 399,260
Renovation/Conversion $ 399,260
Discount Rate = 6.8%
Demolition $ 72,525
Caretaker Status $ 146,624
Other DOD or Federal Agency $ 398,886
Renovation/Conversion $ 398,886
Discount Rate = 7.0%
Demolition $ 72,457
Caretaker Status $ 142,022
Other DOD or Federal Agency $ 398,513
Renovation/Conversion $ 398,513
Discount Rate = 7.2%
Demolition $ 72,389
Caretaker Status $ 137,586
Other DOD or Federal Agency $ 398,141
Renovation/Conversion $ 398,141
Discount Rate = 7.4%
Demolition $ 72,322
Caretaker Status $ 133,309
Other DOD or Federal Agency $ 397,770
Renovation/Conversion $ 397,770
Discount Rate = 7.6%
Demolition $ 72,255
Caretaker Status $ 129,187
Other DOD or Federal Agency $ 397,400
Renovation/Conversion $ 397,400
Discount Rate = 7.8%
Demolition $ 72,188
Caretaker Status $ 125,213
Other DOD or Federal Agency $ 397,031
Renovation/Conversion $ 397,031
Discount Rate = 8.0%
Demolition $ 72,121
Caretaker Status $ 121,380
Other DOD or Federal Agency $ 396,664
Renovation/Conversion $ 396,664
Discount Rate = 8.2%
Demolition $ 72,054
Caretaker Status $ 117,684
Other DOD or Federal Agency $ 396,297
Renovation/Conversion $ 396,297
Discount Rate = 8.4%
Demolition $ 71,987
Caretaker Status $ 114,120
Other DOD or Federal Agency $ 395,931
Renovation/Conversion $ 395,931
14

Discount Rate Sensitivity Analysis
NPV rankings change at the following discount rates:
Table of Net Present Values for each Discount Rate
0.7 %
Discount Rate = 8.6%
Demolition $ 71,921
Caretaker Status $ 110,682
Other DOD or Federal Agency $ 395,566
Renovation/Conversion $ 395,566
Discount Rate = 8.8%
Demolition $ 71,855
Caretaker Status $ 107,366
Other DOD or Federal Agency $ 395,203
Renovation/Conversion $ 395,203
Discount Rate = 9.0%
Demolition $ 71,789
Caretaker Status $ 104,167
Other DOD or Federal Agency $ 394,840
Renovation/Conversion $ 394,840
Discount Rate = 9.2%
Demolition $ 71,723
Caretaker Status $ 101,080
Other DOD or Federal Agency $ 394,478
Renovation/Conversion $ 394,478
Discount Rate = 9.4%
Demolition $ 71,658
Caretaker Status $ 98,102
Other DOD or Federal Agency $ 394,117
Renovation/Conversion $ 394,117
Discount Rate = 9.6%
Demolition $ 71,592
Caretaker Status $ 95,228
Other DOD or Federal Agency $ 393,758
Renovation/Conversion $ 393,758
Discount Rate = 9.8%
Demolition $ 71,527
Caretaker Status $ 92,454
Other DOD or Federal Agency $ 393,399
Renovation/Conversion $ 393,399
Discount Rate = 10.0%
Demolition $ 71,462
Caretaker Status $ 89,777
Other DOD or Federal Agency $ 393,041
Renovation/Conversion $ 393,041
15

Date Generated:
Time Generated:
Version:
12 June 2018
16.36.46
Building 330
Economic Analysis
2018
Project Title
:
Type of Analysis
Discount Rate
Period of Analysis
Start Year
Base Year
Dollar Analysis
:
:
:
:
:
:
Facilities Reduction Program
Mission Requirement - Full
2.5%
2018
20 years
Current Dollars
Project Objective :
Executive Summary Report
To determine the most economical course of action for
Building 330
that meets the EXORD requirement to reduce excess square
footage.
Building 330 has been identified as a facility for disposal per HQDA EXORD 164-15.HQDA EXORD 164-15, "Reduce the Installation Facility Footprint," published March 2015,holds commanders and planners accountable for making all reasonable efforts to maximizespace utilization, consolidate units into our best facilities, and dispose of excess assets.Although the Reduce the Footprint (RtF) acronym has taken hold, the EXORD is really aboutthe efficient management of our real property assets. Significant cost reductions can only beachieved with transformational changes that enable us to reduce our expenditures on facilitiesand services.
Background:
ECONPACK 4.0.32
Alternatives Considered for this Analysis:
Demolition - This alternative will demolish the building and restore the site
to a grassed area. This
alternative meets the requirements of the Executive Order Number 164-15 to
dispose of
excess facilities. Demolition cost is estimated to be $10/sf – 2,000*10 =
$20,000. This is a viable alternative. This is a viable alternative.
Renovation/Conversion - Conversion/Alternate Use - This alternative renovates
the facility for use for another
Category Code. The best option for conversion of building, based on its current
configuration, is to use it for Category Code 21925, Engineering Maintenance
Facility. To be made practical, this building would require extensive and
total repair and renovation to include repairing or replacing roofing,
flooring, plumbing, electrical, communications, and other systems. Estimated
cost is $75/sf or 2,000*55 = $150,00. However, there currently is not an
RPLANS allowance for this category code and converting into this category would
violate the intent of the Exord. This is a viable alternative This is a
viable alternative.
Other DOD or Federal Agency - This alternative offers the building to another
DOD or federal agency. The agency would be responsible for the
renovation/conversion of the facility. Cost would be the same as the
renovation/conversion alternative - $75*2,000 = $150,000. Due to the relatively
small size of this building (2,000 sf), location – inside the DPW Maintenance
fence line, lack of parking, and the extensive cost and time required for
renovation, it’s unlikely that another agency would select it. This
1

alternative is viable. This is a viable alternative.
Caretaker Status - This alternative maintains the facility in its current
condition to be used later in its
current category code or after conversion into a different category code. A
facility in
caretaker status is maintained to the point of preventing problems from
developing or to
keep existing problems from worsening. The cost is based on an annual, per
square foot expense of $0.33 or $0.33*2,000 = $660/yr. This would be a
reoccurring annual expense until the facility is put back into use. With this
alternative, renovation/repair would still be required prior to re-use and
mostly likely at a much higher cost.
This is a viable alternative.
Email Address
706-545-3229Phone Number
Master Planning Division, DPW
Organization
Dean MillerAction Officer :
:
:
:
Economic Indicators:
Alternative NPV
Demolition $ 19,755
Renovation/Conversion $ 148,159
Other DOD or Federal Agency $ 148,159
Caretaker Status $ 103,094
1. This building cannot be used in its current state due to its condition.2. Renovation and/or conversion is necessary for the building to be reutilized in anotherCategory Code.
Assumptions of the Analysis:
Results and Recommendations:
Based on the results of this analysis, the most economical alternative that meets theintent of Exord 164-15 is demolition. Fort Benning does not have a need for the facilityin its current design use category code. Conversion to another category code for FortBenning use is undesired due to its size, layout, location and lack of interested units.No other Federal Agency has expressed interest in using the building, either in itscurrent configuration or converted into another category code. Therefore, demolition ofBuilding 330 is the most economical alternative for the Army.
2

Economic Analysis Graph
Net Present Value
Year
Dollars
3

Life Cycle Cost Report
DemolitionAlternative:
Year Demolition Total
Annual
Outlays
Middle
of Year
Discount
Factors
Present
Value
Cumulative
Net Present
Value
$19,7552018 $19,755$20,000$20,000 0.988
$19,7552019 $0$0$0 0.964
$19,7552020 $0$0$0 0.94
$19,7552021 $0$0$0 0.917
$19,7552022 $0$0$0 0.895
$19,7552023 $0$0$0 0.873
$19,7552024 $0$0$0 0.852
$19,7552025 $0$0$0 0.831
$19,7552026 $0$0$0 0.811
$19,7552027 $0$0$0 0.791
$19,7552028 $0$0$0 0.772
$19,7552029 $0$0$0 0.753
$19,7552030 $0$0$0 0.734
$19,7552031 $0$0$0 0.717
$19,7552032 $0$0$0 0.699
$19,7552033 $0$0$0 0.682
$19,7552034 $0$0$0 0.665
$19,7552035 $0$0$0 0.649
$19,7552036 $0$0$0 0.633
$19,7552037 $0$0$0 0.618
%NPV 100.00%
Discounting
Convention
Inflation
Schedule
Category /
Residual
Schedule
$19,755
M-O-Y
No Inflation
Non-Recurring
Costs
Discount Rate: 2.5%
Period of Analysis: 20 years
4

Life Cycle Cost Report
Renovation/ConversionAlternative:
Year Renovation/
Conversion
Total
Annual
Outlays
Middle
of Year
Discount
Factors
Present
Value
Cumulative
Net Present
Value
$148,1592018 $148,159$150,000$150,000 0.988
$148,1592019 $0$0$0 0.964
$148,1592020 $0$0$0 0.94
$148,1592021 $0$0$0 0.917
$148,1592022 $0$0$0 0.895
$148,1592023 $0$0$0 0.873
$148,1592024 $0$0$0 0.852
$148,1592025 $0$0$0 0.831
$148,1592026 $0$0$0 0.811
$148,1592027 $0$0$0 0.791
$148,1592028 $0$0$0 0.772
$148,1592029 $0$0$0 0.753
$148,1592030 $0$0$0 0.734
$148,1592031 $0$0$0 0.717
$148,1592032 $0$0$0 0.699
$148,1592033 $0$0$0 0.682
$148,1592034 $0$0$0 0.665
$148,1592035 $0$0$0 0.649
$148,1592036 $0$0$0 0.633
$148,1592037 $0$0$0 0.618
%NPV 100.00%
Discounting
Convention
Inflation
Schedule
Category /
Residual
Schedule
$148,159
M-O-Y
No Inflation
Non-Recurring
Costs
Discount Rate: 2.5%
Period of Analysis: 20 years
5

Life Cycle Cost Report
Other DOD or Federal AgencyAlternative:
Year Other DOD or
Agency
Total
Annual
Outlays
Middle
of Year
Discount
Factors
Present
Value
Cumulative
Net Present
Value
$148,1592018 $148,159$150,000$150,000 0.988
$148,1592019 $0$0$0 0.964
$148,1592020 $0$0$0 0.94
$148,1592021 $0$0$0 0.917
$148,1592022 $0$0$0 0.895
$148,1592023 $0$0$0 0.873
$148,1592024 $0$0$0 0.852
$148,1592025 $0$0$0 0.831
$148,1592026 $0$0$0 0.811
$148,1592027 $0$0$0 0.791
$148,1592028 $0$0$0 0.772
$148,1592029 $0$0$0 0.753
$148,1592030 $0$0$0 0.734
$148,1592031 $0$0$0 0.717
$148,1592032 $0$0$0 0.699
$148,1592033 $0$0$0 0.682
$148,1592034 $0$0$0 0.665
$148,1592035 $0$0$0 0.649
$148,1592036 $0$0$0 0.633
$148,1592037 $0$0$0 0.618
%NPV 100.00%
Discounting
Convention
Inflation
Schedule
Category /
Residual
Schedule
$148,159
M-O-Y
No Inflation
Non-Recurring
Costs
Discount Rate: 2.5%
Period of Analysis: 20 years
6

Life Cycle Cost Report
Caretaker StatusAlternative:
Year Caretaker
Status
Maintenance
Renovation/Con
version
Total
Annual
Outlays
Middle
of Year
Discount
Factors
Present
Value
$6522018 0.988$0$660 $660
$6362019 0.964$0$660 $660
$6202020 0.94$0$660 $660
$6052021 0.917$0$660 $660
$5912022 0.895$0$660 $660
$5762023 0.873$0$660 $660
$5622024 0.852$0$660 $660
$5482025 0.831$0$660 $660
$5352026 0.811$0$660 $660
$5222027 0.791$0$660 $660
$5092028 0.772$0$660 $660
$4972029 0.753$0$660 $660
$4852030 0.734$0$660 $660
$4732031 0.717$0$660 $660
$4612032 0.699$0$660 $660
$4502033 0.682$0$660 $660
$4392034 0.665$0$660 $660
$4282035 0.649$0$660 $660
$4182036 0.633$0$660 $660
$93,0862037 0.618$150,000$660 $150,660
%NPV 10.10% 89.90%
Discounting
Convention
Inflation
Schedule
Category /
Residual
Schedule
$10,417
M-O-Y
No Inflation
Recurring
Costs
$92,678
M-O-Y
No Inflation
Recurring
Costs
7

Life Cycle Cost Report
Caretaker StatusAlternative:
Year Cumulative
Net Present
Value
2018 $652
2019 $1,288
2020 $1,908
2021 $2,514
2022 $3,104
2023 $3,681
2024 $4,243
2025 $4,791
2026 $5,326
2027 $5,848
2028 $6,357
2029 $6,854
2030 $7,339
2031 $7,812
2032 $8,273
2033 $8,723
2034 $9,162
2035 $9,591
2036 $10,009
2037 $103,094
Discount Rate: 2.5%
Period of Analysis: 20 years
8

Life Cycle Cost Report
Sources and Derivations:
. Demolition
. Demolition
Estimated demolition cost is $10/sf.
$10*2000= $20,000
a
1
. Renovation/Conversion
. Renovation/ Conversion
To be made practical, this building would require total and extensiverenovation to include repairing or replacing roofing, flooring, plumbing,electrical, communications, and other systems.
Estimated cost is $55/sf or 55*2,817 = $150,000
a
2
. Other DOD or Federal Agency
. Other DOD or Agency
This alternative offers the building to another DOD or federal agency. Theagencywould be responsible for the renovation/conversion of the facility. Cost wouldbe thesame as the renovation/conversion alternative - $75*2,000 = $150,000.
Due to the relatively small size of this building (2,000 sf), location, lack ofparking, and the cost and time required for renovation, it’s unlikely that anotheragency would select it. This alternative is viable.
a
3
. Caretaker Status
. Caretaker Status Maintenance
The current cost of maintaining a facility in a caretaker status is $0.33/sf. Thisalternative provides the minimum facility maintenance necessary to keep thebuilding from deteriorating from lack of use and to prevent existing conditionsfrom worsening. When the decision to bring the building back on line is made,the facility will still require major renovation to be made functional.
a
. Renovation/Conversion
The estimated renovation/conversion cost of this alternative is $75/sf. In thecaretaker status alternative, this cost (or the cost of demolition) would beincurredat the end of the caretaker status period. This cost will need to be adjusted forinflation based on the year that the facility is brought out of Caretaker Statusand renovated.
b
4
9

Discount Rate Sensitivity Analysis
Graph of Net Present Value vs. Discount Rate
Discount Rate (%)
Dollars
0.4 %NPV rankings change at the following discount rates:
10

Discount Rate Sensitivity Analysis
NPV rankings change at the following discount rates:
Table of Net Present Values for each Discount Rate
0.4 %
Discount Rate = -1.0%
Demolition $ 20,101
Other DOD or Federal Agency $ 150,756
Renovation/Conversion $ 150,756
Caretaker Status $ 197,096
Discount Rate = -0.8%
Demolition $ 20,080
Other DOD or Federal Agency $ 150,604
Renovation/Conversion $ 150,604
Caretaker Status $ 189,753
Discount Rate = -0.6%
Demolition $ 20,060
Other DOD or Federal Agency $ 150,452
Renovation/Conversion $ 150,452
Caretaker Status $ 182,705
Discount Rate = -0.4%
Demolition $ 20,040
Other DOD or Federal Agency $ 150,301
Renovation/Conversion $ 150,301
Caretaker Status $ 175,937
Discount Rate = -0.2%
Demolition $ 20,020
Other DOD or Federal Agency $ 150,150
Renovation/Conversion $ 150,150
Caretaker Status $ 169,439
Discount Rate = -0.0%
Demolition $ 20,000
Other DOD or Federal Agency $ 150,000
Renovation/Conversion $ 150,000
Caretaker Status $ 163,200
Discount Rate = 0.2%
Demolition $ 19,980
Other DOD or Federal Agency $ 149,850
Renovation/Conversion $ 149,850
Caretaker Status $ 157,208
Discount Rate = 0.4%
Demolition $ 19,960
Other DOD or Federal Agency $ 149,701
Renovation/Conversion $ 149,701
Caretaker Status $ 151,453
Discount Rate = 0.6%
Demolition $ 19,940
Caretaker Status $ 145,925
Other DOD or Federal Agency $ 149,552
Renovation/Conversion $ 149,552
Discount Rate = 0.8%
Demolition $ 19,920
Caretaker Status $ 140,615
Other DOD or Federal Agency $ 149,404
Renovation/Conversion $ 149,404
Discount Rate = 1.0%
Demolition $ 19,901
Caretaker Status $ 135,514
Other DOD or Federal Agency $ 149,256
Renovation/Conversion $ 149,256
Discount Rate = 1.2%
Demolition $ 19,881
Caretaker Status $ 130,613
Other DOD or Federal Agency $ 149,108
Renovation/Conversion $ 149,108
Discount Rate = 1.4%
Demolition $ 19,861
Caretaker Status $ 125,904
Other DOD or Federal Agency $ 148,961
Renovation/Conversion $ 148,961
Discount Rate = 1.6%
Demolition $ 19,842
Caretaker Status $ 121,379
Other DOD or Federal Agency $ 148,814
Renovation/Conversion $ 148,814
Discount Rate = 1.8%
Demolition $ 19,822
Caretaker Status $ 117,029
Other DOD or Federal Agency $ 148,668
Renovation/Conversion $ 148,668
Discount Rate = 2.0%
Demolition $ 19,803
Caretaker Status $ 112,849
Other DOD or Federal Agency $ 148,522
Renovation/Conversion $ 148,522
11

Discount Rate Sensitivity Analysis
NPV rankings change at the following discount rates:
Table of Net Present Values for each Discount Rate
0.4 %
Discount Rate = 2.2%
Demolition $ 19,784
Caretaker Status $ 108,832
Other DOD or Federal Agency $ 148,377
Renovation/Conversion $ 148,377
Discount Rate = 2.4%
Demolition $ 19,764
Caretaker Status $ 104,969
Other DOD or Federal Agency $ 148,232
Renovation/Conversion $ 148,232
Discount Rate = 2.6%
Demolition $ 19,745
Caretaker Status $ 101,256
Other DOD or Federal Agency $ 148,087
Renovation/Conversion $ 148,087
Discount Rate = 2.8%
Demolition $ 19,726
Caretaker Status $ 97,686
Other DOD or Federal Agency $ 147,943
Renovation/Conversion $ 147,943
Discount Rate = 3.0%
Demolition $ 19,707
Caretaker Status $ 94,253
Other DOD or Federal Agency $ 147,799
Renovation/Conversion $ 147,799
Discount Rate = 3.2%
Demolition $ 19,687
Caretaker Status $ 90,952
Other DOD or Federal Agency $ 147,656
Renovation/Conversion $ 147,656
Discount Rate = 3.4%
Demolition $ 19,668
Caretaker Status $ 87,777
Other DOD or Federal Agency $ 147,513
Renovation/Conversion $ 147,513
Discount Rate = 3.6%
Demolition $ 19,649
Caretaker Status $ 84,724
Other DOD or Federal Agency $ 147,371
Renovation/Conversion $ 147,371
Discount Rate = 3.8%
Demolition $ 19,630
Caretaker Status $ 81,787
Other DOD or Federal Agency $ 147,229
Renovation/Conversion $ 147,229
Discount Rate = 4.0%
Demolition $ 19,612
Caretaker Status $ 78,961
Other DOD or Federal Agency $ 147,087
Renovation/Conversion $ 147,087
Discount Rate = 4.2%
Demolition $ 19,593
Caretaker Status $ 76,243
Other DOD or Federal Agency $ 146,946
Renovation/Conversion $ 146,946
Discount Rate = 4.4%
Demolition $ 19,574
Caretaker Status $ 73,627
Other DOD or Federal Agency $ 146,805
Renovation/Conversion $ 146,805
Discount Rate = 4.6%
Demolition $ 19,555
Caretaker Status $ 71,110
Other DOD or Federal Agency $ 146,665
Renovation/Conversion $ 146,665
Discount Rate = 4.8%
Demolition $ 19,537
Caretaker Status $ 68,689
Other DOD or Federal Agency $ 146,525
Renovation/Conversion $ 146,525
Discount Rate = 5.0%
Demolition $ 19,518
Caretaker Status $ 66,358
Other DOD or Federal Agency $ 146,385
Renovation/Conversion $ 146,385
Discount Rate = 5.2%
Demolition $ 19,499
Caretaker Status $ 64,114
Other DOD or Federal Agency $ 146,246
Renovation/Conversion $ 146,246
12

Discount Rate Sensitivity Analysis
NPV rankings change at the following discount rates:
Table of Net Present Values for each Discount Rate
0.4 %
Discount Rate = 5.4%
Demolition $ 19,481
Caretaker Status $ 61,955
Other DOD or Federal Agency $ 146,107
Renovation/Conversion $ 146,107
Discount Rate = 5.6%
Demolition $ 19,462
Caretaker Status $ 59,876
Other DOD or Federal Agency $ 145,969
Renovation/Conversion $ 145,969
Discount Rate = 5.8%
Demolition $ 19,444
Caretaker Status $ 57,874
Other DOD or Federal Agency $ 145,831
Renovation/Conversion $ 145,831
Discount Rate = 6.0%
Demolition $ 19,426
Caretaker Status $ 55,947
Other DOD or Federal Agency $ 145,693
Renovation/Conversion $ 145,693
Discount Rate = 6.2%
Demolition $ 19,407
Caretaker Status $ 54,092
Other DOD or Federal Agency $ 145,556
Renovation/Conversion $ 145,556
Discount Rate = 6.4%
Demolition $ 19,389
Caretaker Status $ 52,305
Other DOD or Federal Agency $ 145,419
Renovation/Conversion $ 145,419
Discount Rate = 6.6%
Demolition $ 19,371
Caretaker Status $ 50,584
Other DOD or Federal Agency $ 145,282
Renovation/Conversion $ 145,282
Discount Rate = 6.8%
Demolition $ 19,353
Caretaker Status $ 48,926
Other DOD or Federal Agency $ 145,146
Renovation/Conversion $ 145,146
Discount Rate = 7.0%
Demolition $ 19,335
Caretaker Status $ 47,329
Other DOD or Federal Agency $ 145,010
Renovation/Conversion $ 145,010
Discount Rate = 7.2%
Demolition $ 19,317
Caretaker Status $ 45,791
Other DOD or Federal Agency $ 144,875
Renovation/Conversion $ 144,875
Discount Rate = 7.4%
Demolition $ 19,299
Caretaker Status $ 44,309
Other DOD or Federal Agency $ 144,740
Renovation/Conversion $ 144,740
Discount Rate = 7.6%
Demolition $ 19,281
Caretaker Status $ 42,881
Other DOD or Federal Agency $ 144,606
Renovation/Conversion $ 144,606
Discount Rate = 7.8%
Demolition $ 19,263
Caretaker Status $ 41,505
Other DOD or Federal Agency $ 144,471
Renovation/Conversion $ 144,471
Discount Rate = 8.0%
Demolition $ 19,245
Caretaker Status $ 40,179
Other DOD or Federal Agency $ 144,338
Renovation/Conversion $ 144,338
Discount Rate = 8.2%
Demolition $ 19,227
Caretaker Status $ 38,901
Other DOD or Federal Agency $ 144,204
Renovation/Conversion $ 144,204
Discount Rate = 8.4%
Demolition $ 19,209
Caretaker Status $ 37,669
Other DOD or Federal Agency $ 144,071
Renovation/Conversion $ 144,071
13

Discount Rate Sensitivity Analysis
NPV rankings change at the following discount rates:
Table of Net Present Values for each Discount Rate
0.4 %
Discount Rate = 8.6%
Demolition $ 19,192
Caretaker Status $ 36,482
Other DOD or Federal Agency $ 143,938
Renovation/Conversion $ 143,938
Discount Rate = 8.8%
Demolition $ 19,174
Caretaker Status $ 35,337
Other DOD or Federal Agency $ 143,806
Renovation/Conversion $ 143,806
Discount Rate = 9.0%
Demolition $ 19,157
Caretaker Status $ 34,233
Other DOD or Federal Agency $ 143,674
Renovation/Conversion $ 143,674
Discount Rate = 9.2%
Demolition $ 19,139
Caretaker Status $ 33,169
Other DOD or Federal Agency $ 143,542
Renovation/Conversion $ 143,542
Discount Rate = 9.4%
Demolition $ 19,121
Caretaker Status $ 32,143
Other DOD or Federal Agency $ 143,411
Renovation/Conversion $ 143,411
Discount Rate = 9.6%
Demolition $ 19,104
Caretaker Status $ 31,153
Other DOD or Federal Agency $ 143,280
Renovation/Conversion $ 143,280
Discount Rate = 9.8%
Demolition $ 19,087
Caretaker Status $ 30,199
Other DOD or Federal Agency $ 143,150
Renovation/Conversion $ 143,150
Discount Rate = 10.0%
Demolition $ 19,069
Caretaker Status $ 29,278
Other DOD or Federal Agency $ 143,019
Renovation/Conversion $ 143,019
14

Date Generated:
Time Generated:
Version:
12 June 2018
16.37.34
Building 381 Disposal
Economic Analysis
2018
Project Title
:
Type of Analysis
Discount Rate
Period of Analysis
Start Year
Base Year
Dollar Analysis
:
:
:
:
:
:
Facilities Reduction Program
Mission Requirement - Full
2.5%
2018
20 years
Current Dollars
Project Objective :
Executive Summary Report
To determine the most economical course of action for
Building 381
that meets the EXORD requirement to reduce excess square
footage.
Building 381 has been identified as a facility for disposal per HQDA EXORD 164-15.
HQDA EXORD 164-15, "Reduce the Installation Facility Footprint," published March 2015,holds commanders and planners accountable for making all reasonable efforts to maximizespace utilization, consolidate units into our best facilities, and dispose of excess assets.Although the Reduce the Footprint (RtF) acronym has taken hold, the EXORD is really aboutthe efficient management of our real property assets. Significant cost reductions can only beachieved with transformational changes that enable us to reduce our expenditures on facilitiesand services.
Background:
ECONPACK 4.0.32
Alternatives Considered for this Analysis:
Demolition - This alternative will demolish the building and restore the site
to a grassed area. This
alternative meets the requirements of the Executive Order Number 164-15 to
dispose of
excess facilities. Demolition cost is estimated to be $10/sf – 704*10 = $7,040.
This is
a viable alternative. This is a viable alternative.
Renovation/Conversion - Conversion/Alternate Use - This alternative renovates
the facility for use for another
Category Code. The best option for conversion of building, based on its current
configuration, is to use it for Category Code 44224, Organizational Storage.
To be made practical, this building would require total renovation to include
repairing or replacing roofing, flooring, plumbing, electrical, communications,
and other systems. Estimated cost is $55/sf or 704*55 = $38,720. However,
there currently is an excess of space in this category code and converting into
this category would violate the intent of the Exord. This is a viable
alternative This is a viable alternative.
Other DOD or Federal Agency - This alternative offers the building to another
DOD or federal agency. The agency would be responsible for the
renovation/conversion of the facility. Cost would be the same as the
renovation/conversion alternative - $55*704 = $38,720. Due to the relatively
small size of this building (704 sf), location, lack of parking, and the cost
and time required for renovation, it’s unlikely that another agency would
1

select it. This alternative is viable This is a viable alternative.
Caretaker Status - This alternative maintains the facility in its current
condition to be used later in its
current category code or after conversion into a different category code. A
facility in
caretaker status is maintained to the point of preventing problems from
developing or to
keep existing problems from worsening. The cost is based on an annual, per
square foot expense of $0.33 or $0.33*704 = $232.32/yr. This would be a
reoccurring annual expense until the facility is put back into use. With this
alternative, renovation/repair would still be required prior to re-use and
mostly likely at a much higher cost. This is a viable alternative.
Email Address
706-545-3229Phone Number
Master Planning Division, DPW
Organization
Dean MillerAction Officer :
:
:
:
Economic Indicators:
Alternative NPV
Demolition $ 6,954
Renovation/Conversion $ 38,245
Other DOD or Federal Agency $ 38,245
Caretaker Status $ 28,344
1. This building cannot be used in its current state due to its condition.2. Renovation and/or conversion is necessary for the building to be reutilized in anotherCategory Code.
Assumptions of the Analysis:
Results and Recommendations:
Based on the results of this analysis, the most economical alternative that meets theintent of Exord 164-15 is demolition. Fort Benning does not have a need for the facilityin its current design use category code. Conversion to another category code for FortBenning use is undesired due to its size, layout, location and lack of interested units.No other Federal Agency has expressed interest in using the building, either in itscurrent configuration or converted into another category code. Therefore, demolition ofBuilding 381 is the most economical alternative for the Army.
2

Economic Analysis Graph
Net Present Value
Year
Dollars
3

Life Cycle Cost Report
DemolitionAlternative:
Year Demolition Total
Annual
Outlays
Middle
of Year
Discount
Factors
Present
Value
Cumulative
Net Present
Value
$6,9542018 $6,954$7,040$7,040 0.988
$6,9542019 $0$0$0 0.964
$6,9542020 $0$0$0 0.94
$6,9542021 $0$0$0 0.917
$6,9542022 $0$0$0 0.895
$6,9542023 $0$0$0 0.873
$6,9542024 $0$0$0 0.852
$6,9542025 $0$0$0 0.831
$6,9542026 $0$0$0 0.811
$6,9542027 $0$0$0 0.791
$6,9542028 $0$0$0 0.772
$6,9542029 $0$0$0 0.753
$6,9542030 $0$0$0 0.734
$6,9542031 $0$0$0 0.717
$6,9542032 $0$0$0 0.699
$6,9542033 $0$0$0 0.682
$6,9542034 $0$0$0 0.665
$6,9542035 $0$0$0 0.649
$6,9542036 $0$0$0 0.633
$6,9542037 $0$0$0 0.618
%NPV 100.00%
Discounting
Convention
Inflation
Schedule
Category /
Residual
Schedule
$6,954
M-O-Y
No Inflation
Non-Recurring
Costs
Discount Rate: 2.5%
Period of Analysis: 20 years
4

Life Cycle Cost Report
Renovation/ConversionAlternative:
Year Renovation/
Conversion
Total
Annual
Outlays
Middle
of Year
Discount
Factors
Present
Value
Cumulative
Net Present
Value
$38,2452018 $38,245$38,720$38,720 0.988
$38,2452019 $0$0$0 0.964
$38,2452020 $0$0$0 0.94
$38,2452021 $0$0$0 0.917
$38,2452022 $0$0$0 0.895
$38,2452023 $0$0$0 0.873
$38,2452024 $0$0$0 0.852
$38,2452025 $0$0$0 0.831
$38,2452026 $0$0$0 0.811
$38,2452027 $0$0$0 0.791
$38,2452028 $0$0$0 0.772
$38,2452029 $0$0$0 0.753
$38,2452030 $0$0$0 0.734
$38,2452031 $0$0$0 0.717
$38,2452032 $0$0$0 0.699
$38,2452033 $0$0$0 0.682
$38,2452034 $0$0$0 0.665
$38,2452035 $0$0$0 0.649
$38,2452036 $0$0$0 0.633
$38,2452037 $0$0$0 0.618
%NPV 100.00%
Discounting
Convention
Inflation
Schedule
Category /
Residual
Schedule
$38,245
M-O-Y
No Inflation
Non-Recurring
Costs
Discount Rate: 2.5%
Period of Analysis: 20 years
5

Life Cycle Cost Report
Other DOD or Federal AgencyAlternative:
Year Other DOD or
Agency
Total
Annual
Outlays
Middle
of Year
Discount
Factors
Present
Value
Cumulative
Net Present
Value
$38,2452018 $38,245$38,720$38,720 0.988
$38,2452019 $0$0$0 0.964
$38,2452020 $0$0$0 0.94
$38,2452021 $0$0$0 0.917
$38,2452022 $0$0$0 0.895
$38,2452023 $0$0$0 0.873
$38,2452024 $0$0$0 0.852
$38,2452025 $0$0$0 0.831
$38,2452026 $0$0$0 0.811
$38,2452027 $0$0$0 0.791
$38,2452028 $0$0$0 0.772
$38,2452029 $0$0$0 0.753
$38,2452030 $0$0$0 0.734
$38,2452031 $0$0$0 0.717
$38,2452032 $0$0$0 0.699
$38,2452033 $0$0$0 0.682
$38,2452034 $0$0$0 0.665
$38,2452035 $0$0$0 0.649
$38,2452036 $0$0$0 0.633
$38,2452037 $0$0$0 0.618
%NPV 100.00%
Discounting
Convention
Inflation
Schedule
Category /
Residual
Schedule
$38,245
M-O-Y
No Inflation
Recurring
Costs
Discount Rate: 2.5%
Period of Analysis: 20 years
6

Life Cycle Cost Report
Caretaker StatusAlternative:
Year Caretaker
Status
Renovation/Con
struction
Total
Annual
Outlays
Middle
of Year
Discount
Factors
Present
Value
$2312018 0.988$0$234 $234
$2302019 0.964$0$239 $239
$2292020 0.94$0$244 $244
$2282021 0.917$0$249 $249
$2272022 0.895$0$254 $254
$2262023 0.873$0$259 $259
$2252024 0.852$0$264 $264
$2242025 0.831$0$269 $269
$2232026 0.811$0$275 $275
$2212027 0.791$0$280 $280
$2202028 0.772$0$286 $286
$2192029 0.753$0$291 $291
$2182030 0.734$0$297 $297
$2172031 0.717$0$303 $303
$2162032 0.699$0$309 $309
$2152033 0.682$0$315 $315
$2142034 0.665$0$322 $322
$2132035 0.649$0$328 $328
$2122036 0.633$0$335 $335
$24,1342037 0.618$38,720$341 $39,061
%NPV 15.60% 84.40%
Discounting
Convention
Inflation
Schedule
Category /
Residual
Schedule
$4,420
M-O-Y
2017 General
Recurring
Costs
$23,923
M-O-Y
No Inflation
Recurring
Costs
7

Life Cycle Cost Report
Caretaker StatusAlternative:
Year Cumulative
Net Present
Value
2018 $231
2019 $462
2020 $691
2021 $919
2022 $1,146
2023 $1,372
2024 $1,597
2025 $1,820
2026 $2,043
2027 $2,264
2028 $2,485
2029 $2,704
2030 $2,922
2031 $3,139
2032 $3,355
2033 $3,570
2034 $3,785
2035 $3,997
2036 $4,209
2037 $28,344
Discount Rate: 2.5%
Period of Analysis: 20 years
8

Life Cycle Cost Report
Sources and Derivations:
. Demolition
. Demolition
Estimated demolition cost is $10/sf.
$10*704 = $7,040
a
1
. Renovation/Conversion
. Renovation/ Conversion
To be made practical, this building would require total renovation to includerepairingor replacing roofing, flooring, plumbing, electrical, communications, and othersystems.Estimated cost is $55/sf or 55*704 = $38,720.
a
2
. Other DOD or Federal Agency
. Other DOD or Agency
This alternative offers the building to another DOD or federal agency. Theagencywould be responsible for the renovation/conversion of the facility. Cost wouldbe thesame as the renovation/conversion alternative - $55*704=$38,720.
Due to the relatively small size of this building (704 sf), location, lack ofparking, and the cost and time required for renovation, it’s unlikely that anotheragency would select it. This alternative is viable.
a
3
. Caretaker Status
. Caretaker Status
The current cost of maintaining a facility in a caretaker status is $0.33/sf. Thisalternative provides the minimum facility maintenance necessary to keep thebuilding from deteriorating from lack of use and to prevent existing conditionsfrom worsening. When the decision to bring the building back on line is made,the facility will still require major renovation to be made functional.
a
. Renovation/Construction
The estimated renovation/conversion cost of this alternative is $55/sf. In thecaretaker status alternative, this cost (or the cost of demolition) would beincurredat the end of the caretaker status period. This cost will need to be adjusted forinflation based on the year that the facility is brought out of Caretaker Statusand renovated.
b
4
9

Discount Rate Sensitivity Analysis
Graph of Net Present Value vs. Discount Rate
Discount Rate (%)
Dollars
0.7 %NPV rankings change at the following discount rates:
10

Discount Rate Sensitivity Analysis
NPV rankings change at the following discount rates:
Table of Net Present Values for each Discount Rate
0.7 %
Discount Rate = -1.0%
Demolition $ 7,075
Other DOD or Federal Agency $ 38,915
Renovation/Conversion $ 38,915
Caretaker Status $ 53,450
Discount Rate = -0.8%
Demolition $ 7,068
Other DOD or Federal Agency $ 38,876
Renovation/Conversion $ 38,876
Caretaker Status $ 51,494
Discount Rate = -0.6%
Demolition $ 7,061
Other DOD or Federal Agency $ 38,837
Renovation/Conversion $ 38,837
Caretaker Status $ 49,615
Discount Rate = -0.4%
Demolition $ 7,054
Other DOD or Federal Agency $ 38,798
Renovation/Conversion $ 38,798
Caretaker Status $ 47,811
Discount Rate = -0.2%
Demolition $ 7,047
Other DOD or Federal Agency $ 38,759
Renovation/Conversion $ 38,759
Caretaker Status $ 46,078
Discount Rate = -0.0%
Demolition $ 7,040
Other DOD or Federal Agency $ 38,720
Renovation/Conversion $ 38,720
Caretaker Status $ 44,413
Discount Rate = 0.2%
Demolition $ 7,033
Other DOD or Federal Agency $ 38,681
Renovation/Conversion $ 38,681
Caretaker Status $ 42,814
Discount Rate = 0.4%
Demolition $ 7,026
Other DOD or Federal Agency $ 38,643
Renovation/Conversion $ 38,643
Caretaker Status $ 41,278
Discount Rate = 0.6%
Demolition $ 7,019
Other DOD or Federal Agency $ 38,604
Renovation/Conversion $ 38,604
Caretaker Status $ 39,801
Discount Rate = 0.8%
Demolition $ 7,012
Caretaker Status $ 38,383
Other DOD or Federal Agency $ 38,566
Renovation/Conversion $ 38,566
Discount Rate = 1.0%
Demolition $ 7,005
Caretaker Status $ 37,020
Other DOD or Federal Agency $ 38,528
Renovation/Conversion $ 38,528
Discount Rate = 1.2%
Demolition $ 6,998
Caretaker Status $ 35,710
Other DOD or Federal Agency $ 38,490
Renovation/Conversion $ 38,490
Discount Rate = 1.4%
Demolition $ 6,991
Caretaker Status $ 34,450
Other DOD or Federal Agency $ 38,452
Renovation/Conversion $ 38,452
Discount Rate = 1.6%
Demolition $ 6,984
Caretaker Status $ 33,240
Other DOD or Federal Agency $ 38,414
Renovation/Conversion $ 38,414
Discount Rate = 1.8%
Demolition $ 6,977
Caretaker Status $ 32,076
Other DOD or Federal Agency $ 38,376
Renovation/Conversion $ 38,376
Discount Rate = 2.0%
Demolition $ 6,971
Caretaker Status $ 30,957
Other DOD or Federal Agency $ 38,339
Renovation/Conversion $ 38,339
11
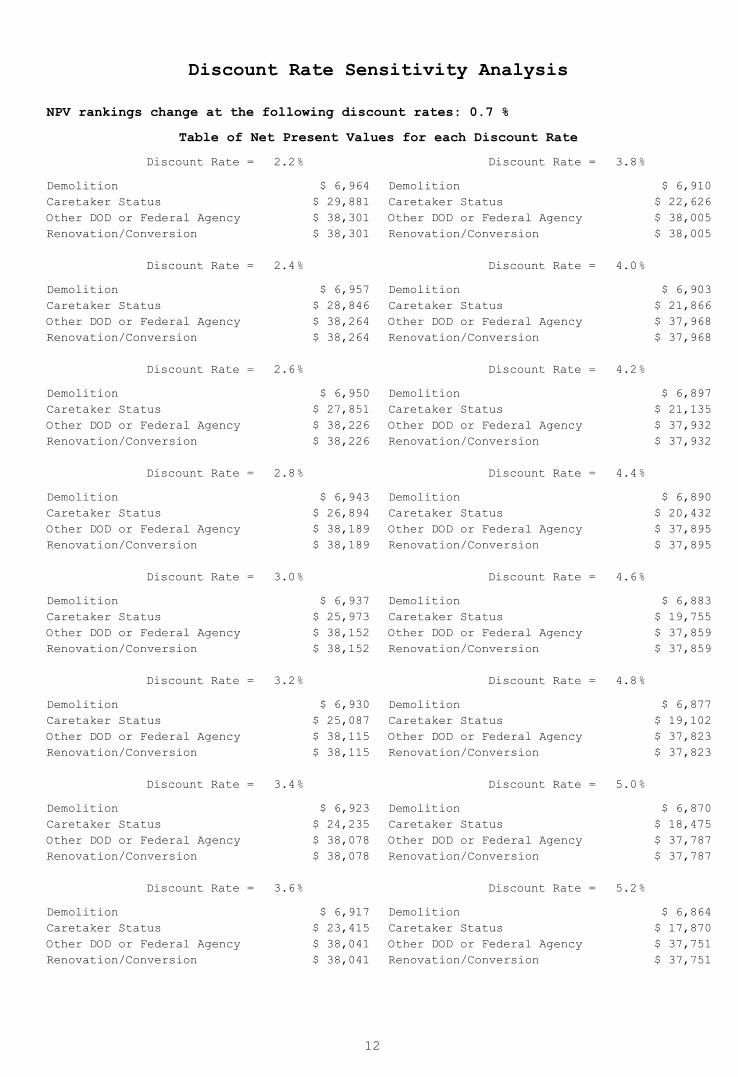
Discount Rate Sensitivity Analysis
NPV rankings change at the following discount rates:
Table of Net Present Values for each Discount Rate
0.7 %
Discount Rate = 2.2%
Demolition $ 6,964
Caretaker Status $ 29,881
Other DOD or Federal Agency $ 38,301
Renovation/Conversion $ 38,301
Discount Rate = 2.4%
Demolition $ 6,957
Caretaker Status $ 28,846
Other DOD or Federal Agency $ 38,264
Renovation/Conversion $ 38,264
Discount Rate = 2.6%
Demolition $ 6,950
Caretaker Status $ 27,851
Other DOD or Federal Agency $ 38,226
Renovation/Conversion $ 38,226
Discount Rate = 2.8%
Demolition $ 6,943
Caretaker Status $ 26,894
Other DOD or Federal Agency $ 38,189
Renovation/Conversion $ 38,189
Discount Rate = 3.0%
Demolition $ 6,937
Caretaker Status $ 25,973
Other DOD or Federal Agency $ 38,152
Renovation/Conversion $ 38,152
Discount Rate = 3.2%
Demolition $ 6,930
Caretaker Status $ 25,087
Other DOD or Federal Agency $ 38,115
Renovation/Conversion $ 38,115
Discount Rate = 3.4%
Demolition $ 6,923
Caretaker Status $ 24,235
Other DOD or Federal Agency $ 38,078
Renovation/Conversion $ 38,078
Discount Rate = 3.6%
Demolition $ 6,917
Caretaker Status $ 23,415
Other DOD or Federal Agency $ 38,041
Renovation/Conversion $ 38,041
Discount Rate = 3.8%
Demolition $ 6,910
Caretaker Status $ 22,626
Other DOD or Federal Agency $ 38,005
Renovation/Conversion $ 38,005
Discount Rate = 4.0%
Demolition $ 6,903
Caretaker Status $ 21,866
Other DOD or Federal Agency $ 37,968
Renovation/Conversion $ 37,968
Discount Rate = 4.2%
Demolition $ 6,897
Caretaker Status $ 21,135
Other DOD or Federal Agency $ 37,932
Renovation/Conversion $ 37,932
Discount Rate = 4.4%
Demolition $ 6,890
Caretaker Status $ 20,432
Other DOD or Federal Agency $ 37,895
Renovation/Conversion $ 37,895
Discount Rate = 4.6%
Demolition $ 6,883
Caretaker Status $ 19,755
Other DOD or Federal Agency $ 37,859
Renovation/Conversion $ 37,859
Discount Rate = 4.8%
Demolition $ 6,877
Caretaker Status $ 19,102
Other DOD or Federal Agency $ 37,823
Renovation/Conversion $ 37,823
Discount Rate = 5.0%
Demolition $ 6,870
Caretaker Status $ 18,475
Other DOD or Federal Agency $ 37,787
Renovation/Conversion $ 37,787
Discount Rate = 5.2%
Demolition $ 6,864
Caretaker Status $ 17,870
Other DOD or Federal Agency $ 37,751
Renovation/Conversion $ 37,751
12

Discount Rate Sensitivity Analysis
NPV rankings change at the following discount rates:
Table of Net Present Values for each Discount Rate
0.7 %
Discount Rate = 5.4%
Demolition $ 6,857
Caretaker Status $ 17,288
Other DOD or Federal Agency $ 37,715
Renovation/Conversion $ 37,715
Discount Rate = 5.6%
Demolition $ 6,851
Caretaker Status $ 16,727
Other DOD or Federal Agency $ 37,679
Renovation/Conversion $ 37,679
Discount Rate = 5.8%
Demolition $ 6,844
Caretaker Status $ 16,187
Other DOD or Federal Agency $ 37,644
Renovation/Conversion $ 37,644
Discount Rate = 6.0%
Demolition $ 6,838
Caretaker Status $ 15,667
Other DOD or Federal Agency $ 37,608
Renovation/Conversion $ 37,608
Discount Rate = 6.2%
Demolition $ 6,831
Caretaker Status $ 15,165
Other DOD or Federal Agency $ 37,573
Renovation/Conversion $ 37,573
Discount Rate = 6.4%
Demolition $ 6,825
Caretaker Status $ 14,682
Other DOD or Federal Agency $ 37,537
Renovation/Conversion $ 37,537
Discount Rate = 6.6%
Demolition $ 6,819
Caretaker Status $ 14,217
Other DOD or Federal Agency $ 37,502
Renovation/Conversion $ 37,502
Discount Rate = 6.8%
Demolition $ 6,812
Caretaker Status $ 13,769
Other DOD or Federal Agency $ 37,467
Renovation/Conversion $ 37,467
Discount Rate = 7.0%
Demolition $ 6,806
Caretaker Status $ 13,336
Other DOD or Federal Agency $ 37,432
Renovation/Conversion $ 37,432
Discount Rate = 7.2%
Demolition $ 6,799
Caretaker Status $ 12,920
Other DOD or Federal Agency $ 37,397
Renovation/Conversion $ 37,397
Discount Rate = 7.4%
Demolition $ 6,793
Caretaker Status $ 12,518
Other DOD or Federal Agency $ 37,362
Renovation/Conversion $ 37,362
Discount Rate = 7.6%
Demolition $ 6,787
Caretaker Status $ 12,131
Other DOD or Federal Agency $ 37,328
Renovation/Conversion $ 37,328
Discount Rate = 7.8%
Demolition $ 6,781
Caretaker Status $ 11,758
Other DOD or Federal Agency $ 37,293
Renovation/Conversion $ 37,293
Discount Rate = 8.0%
Demolition $ 6,774
Caretaker Status $ 11,398
Other DOD or Federal Agency $ 37,258
Renovation/Conversion $ 37,258
Discount Rate = 8.2%
Demolition $ 6,768
Caretaker Status $ 11,051
Other DOD or Federal Agency $ 37,224
Renovation/Conversion $ 37,224
Discount Rate = 8.4%
Demolition $ 6,762
Caretaker Status $ 10,716
Other DOD or Federal Agency $ 37,190
Renovation/Conversion $ 37,190
13

Discount Rate Sensitivity Analysis
NPV rankings change at the following discount rates:
Table of Net Present Values for each Discount Rate
0.7 %
Discount Rate = 8.6%
Demolition $ 6,756
Caretaker Status $ 10,393
Other DOD or Federal Agency $ 37,155
Renovation/Conversion $ 37,155
Discount Rate = 8.8%
Demolition $ 6,749
Caretaker Status $ 10,082
Other DOD or Federal Agency $ 37,121
Renovation/Conversion $ 37,121
Discount Rate = 9.0%
Demolition $ 6,743
Caretaker Status $ 9,781
Other DOD or Federal Agency $ 37,087
Renovation/Conversion $ 37,087
Discount Rate = 9.2%
Demolition $ 6,737
Caretaker Status $ 9,491
Other DOD or Federal Agency $ 37,053
Renovation/Conversion $ 37,053
Discount Rate = 9.4%
Demolition $ 6,731
Caretaker Status $ 9,212
Other DOD or Federal Agency $ 37,019
Renovation/Conversion $ 37,019
Discount Rate = 9.6%
Demolition $ 6,725
Caretaker Status $ 8,942
Other DOD or Federal Agency $ 36,985
Renovation/Conversion $ 36,985
Discount Rate = 9.8%
Demolition $ 6,718
Caretaker Status $ 8,681
Other DOD or Federal Agency $ 36,952
Renovation/Conversion $ 36,952
Discount Rate = 10.0%
Demolition $ 6,712
Caretaker Status $ 8,430
Other DOD or Federal Agency $ 36,918
Renovation/Conversion $ 36,918
14

Date Generated:
Time Generated:
Version:
12 June 2018
12.43.50
Building 1045 Disposal
Economic Analysis
2018
Project Title
:
Type of Analysis
Discount Rate
Period of Analysis
Start Year
Base Year
Dollar Analysis
:
:
:
:
:
:
Facilities Reduction Program
Mission Requirement - Full
2.5%
2018
20 years
Current Dollars
Project Objective :
Executive Summary Report
To determine the most economical course of action for
Building 1045
that meets the EXORD requirement to reduce excess square
footage.
Building 1045 has been identified as a facility for disposal per HQDA EXORD 164-15.
HQDA EXORD 164-15, "Reduce the Installation Facility Footprint," published March 2015,holds commanders and planners accountable for making all reasonable efforts to maximizespace utilization, consolidate units into our best facilities, and dispose of excess assets.Although the Reduce the Footprint (RtF) acronym has taken hold, the EXORD is really aboutthe efficient management of our real property assets. Significant cost reductions can only beachieved with transformational changes that enable us to reduce our expenditures on facilitiesand services.
Background:
ECONPACK 4.0.32
Alternatives Considered for this Analysis:
Demolition - This alternative will demolish the building and restore the site
to a grassed area. This
alternative meets the requirements of the Executive Order Number 164-15 to
dispose of
excess facilities. Demolition cost is estimated to be $10/sf – 8,156*10 =
$81,560. This is a viable alternative. This is a viable alternative.
Renovation/Conversion - Conversion/Alternate Use - This alternative renovates
the facility for use for another
Category Code. The best option for conversion of building, based on its current
configuration, is to use it for Category Code 17120, General Instruction
Building. To be made practical, this building would require total renovation
to include repairing or replacing roofing, flooring, plumbing, electrical,
communications, and other systems. Estimated cost is $55/sf or 8,156*55 =
$448,580. However, there currently is an excess of space in this category code
and converting into this category would violate the intent of the Exord. This
is a viable alternative This is a viable alternative.
Other DOD or Federal Agency - This alternative offers the building to another
DOD or federal agency. The agency would be responsible for the
renovation/conversion of the facility. Cost would be the same as the
renovation/conversion alternative - $55*8,156 = $448,580. Due to the location,
lack of parking, and the cost and time required for renovation, it’s unlikely
that another agency would select it. This alternative is viable This is a
1

viable alternative.
Caretaker Status - This alternative maintains the facility in its current
condition to be used later in its
current category code or after conversion into a different category code. A
facility in
caretaker status is maintained to the point of preventing problems from
developing or to
keep existing problems from worsening. The cost is based on an annual, per
square foot expense of $0.33 or $0.33*8,156 = $2,691/yr. This would be a
reoccurring annual expense until the facility is put back into use. With this
alternative, renovation/repair would still be required prior to re-use and
mostly likely at a much higher cost.
This is a viable alternative.
Email Address
706-545-3229Phone Number
Master Planning Division, DPW
Organization
Dean MillerAction Officer :
:
:
:
Economic Indicators:
Alternative NPV
Demolition $ 80,559
Renovation/Conversion $ 443,076
Other DOD or Federal Agency $ 443,076
Caretaker Status $ 42,472
1.This building cannot be used in its current state due to its condition.2.Renovation and/or conversion is necessary for the building to be reutilized in anotherCategory Code.
Assumptions of the Analysis:
Results and Recommendations:
Based on the results of this analysis, the most economical alternative that meets theintent of Exord 164-15 is demolition. Fort Benning does not have a need for the facilityIn its current design use category code. Conversion to another category code for FortBenning use is undesired due to its size, layout, location and lack of interested units.No other Federal Agency has expressed interest in using the building, either in itscurrent configuration or converted into another category code. Therefore, demolition ofBuilding 1045 is the most economical alternative for the Army.
2

Economic Analysis Graph
Net Present Value
Year
Dollars
3

Life Cycle Cost Report
DemolitionAlternative:
Year Demolition Total
Annual
Outlays
Middle
of Year
Discount
Factors
Present
Value
Cumulative
Net Present
Value
$80,5592018 $80,559$81,560$81,560 0.988
$80,5592019 $0$0$0 0.964
$80,5592020 $0$0$0 0.94
$80,5592021 $0$0$0 0.917
$80,5592022 $0$0$0 0.895
$80,5592023 $0$0$0 0.873
$80,5592024 $0$0$0 0.852
$80,5592025 $0$0$0 0.831
$80,5592026 $0$0$0 0.811
$80,5592027 $0$0$0 0.791
$80,5592028 $0$0$0 0.772
$80,5592029 $0$0$0 0.753
$80,5592030 $0$0$0 0.734
$80,5592031 $0$0$0 0.717
$80,5592032 $0$0$0 0.699
$80,5592033 $0$0$0 0.682
$80,5592034 $0$0$0 0.665
$80,5592035 $0$0$0 0.649
$80,5592036 $0$0$0 0.633
$80,5592037 $0$0$0 0.618
%NPV 100.00%
Discounting
Convention
Inflation
Schedule
Category /
Residual
Schedule
$80,559
M-O-Y
No Inflation
Non-Recurring
Costs
Discount Rate: 2.5%
Period of Analysis: 20 years
4

Life Cycle Cost Report
Renovation/ConversionAlternative:
Year Renovation/
Conversion
Total
Annual
Outlays
Middle
of Year
Discount
Factors
Present
Value
Cumulative
Net Present
Value
$443,0762018 $443,076$448,580$448,580 0.988
$443,0762019 $0$0$0 0.964
$443,0762020 $0$0$0 0.94
$443,0762021 $0$0$0 0.917
$443,0762022 $0$0$0 0.895
$443,0762023 $0$0$0 0.873
$443,0762024 $0$0$0 0.852
$443,0762025 $0$0$0 0.831
$443,0762026 $0$0$0 0.811
$443,0762027 $0$0$0 0.791
$443,0762028 $0$0$0 0.772
$443,0762029 $0$0$0 0.753
$443,0762030 $0$0$0 0.734
$443,0762031 $0$0$0 0.717
$443,0762032 $0$0$0 0.699
$443,0762033 $0$0$0 0.682
$443,0762034 $0$0$0 0.665
$443,0762035 $0$0$0 0.649
$443,0762036 $0$0$0 0.633
$443,0762037 $0$0$0 0.618
%NPV 100.00%
Discounting
Convention
Inflation
Schedule
Category /
Residual
Schedule
$443,076
M-O-Y
No Inflation
Non-Recurring
Costs
Discount Rate: 2.5%
Period of Analysis: 20 years
5

Life Cycle Cost Report
Other DOD or Federal AgencyAlternative:
Year Other DOD or
Agency
Total
Annual
Outlays
Middle
of Year
Discount
Factors
Present
Value
Cumulative
Net Present
Value
$443,0762018 $443,076$448,580$448,580 0.988
$443,0762019 $0$0$0 0.964
$443,0762020 $0$0$0 0.94
$443,0762021 $0$0$0 0.917
$443,0762022 $0$0$0 0.895
$443,0762023 $0$0$0 0.873
$443,0762024 $0$0$0 0.852
$443,0762025 $0$0$0 0.831
$443,0762026 $0$0$0 0.811
$443,0762027 $0$0$0 0.791
$443,0762028 $0$0$0 0.772
$443,0762029 $0$0$0 0.753
$443,0762030 $0$0$0 0.734
$443,0762031 $0$0$0 0.717
$443,0762032 $0$0$0 0.699
$443,0762033 $0$0$0 0.682
$443,0762034 $0$0$0 0.665
$443,0762035 $0$0$0 0.649
$443,0762036 $0$0$0 0.633
$443,0762037 $0$0$0 0.618
%NPV 100.00%
Discounting
Convention
Inflation
Schedule
Category /
Residual
Schedule
$443,076
M-O-Y
No Inflation
Non-Recurring
Costs
Discount Rate: 2.5%
Period of Analysis: 20 years
6

Life Cycle Cost Report
Caretaker StatusAlternative:
Year Caretaker
Status
Renovation/
Conversion
Total
Annual
Outlays
Middle
of Year
Discount
Factors
Present
Value
$2,6582018 0.988$0$2,691 $2,691
$2,5932019 0.964$0$2,691 $2,691
$2,5302020 0.94$0$2,691 $2,691
$2,4682021 0.917$0$2,691 $2,691
$2,4082022 0.895$0$2,691 $2,691
$2,3492023 0.873$0$2,691 $2,691
$2,2922024 0.852$0$2,691 $2,691
$2,2362025 0.831$0$2,691 $2,691
$2,1822026 0.811$0$2,691 $2,691
$2,1282027 0.791$0$2,691 $2,691
$2,0762028 0.772$0$2,691 $2,691
$2,0262029 0.753$0$2,691 $2,691
$1,9762030 0.734$0$2,691 $2,691
$1,9282031 0.717$0$2,691 $2,691
$1,8812032 0.699$0$2,691 $2,691
$1,8352033 0.682$0$2,691 $2,691
$1,7902034 0.665$0$2,691 $2,691
$1,7472035 0.649$0$2,691 $2,691
$1,7042036 0.633$0$2,691 $2,691
$1,6632037 0.618$0$2,691 $2,691
%NPV 100.00% 0.00%
Discounting
Convention
Inflation
Schedule
Category /
Residual
Schedule
$42,472
M-O-Y
No Inflation
Recurring
Costs
$0
M-O-Y
No Inflation
Recurring
Costs
7

Life Cycle Cost Report
Caretaker StatusAlternative:
Year Cumulative
Net Present
Value
2018 $2,658
2019 $5,251
2020 $7,781
2021 $10,249
2022 $12,657
2023 $15,007
2024 $17,298
2025 $19,535
2026 $21,716
2027 $23,844
2028 $25,921
2029 $27,947
2030 $29,923
2031 $31,851
2032 $33,732
2033 $35,567
2034 $37,358
2035 $39,105
2036 $40,809
2037 $42,472
Discount Rate: 2.5%
Period of Analysis: 20 years
8

Life Cycle Cost Report
Sources and Derivations:
. Demolition
. Demolition
Estimated demolition cost is $10/sf.
$10*8,156 = $81,560
a
1
. Renovation/Conversion
. Renovation/ Conversion
To be made practical, this building would require total renovation to includerepairingor replacing roofing, flooring, plumbing, electrical, communications, and othersystems.Estimated cost is $55/sf or 55*8,156 = $448,580.
a
2
. Other DOD or Federal Agency
. Other DOD or Agency
This alternative offers the building to another DOD or federal agency. Theagencywould be responsible for the renovation/conversion of the facility. Cost wouldbe thesame as the renovation/conversion alternative - $55*8,156 = $448,580.
Due to the location, lack of parking, and the cost and time required forrenovation, it’s unlikely that another agency would select it. This alternative isviable.
a
3
. Caretaker Status
. Caretaker Status
The current cost of maintaining a facility in a caretaker status is $0.33/sf.This alternative provides the minimum facility maintenance necessary to keepthebuilding from deteriorating from lack of use and to prevent existing conditionsfrom worsening. When the decision to bring the building back on line is made,thefacility will still require major renovation to be made functional.
a
. Renovation/ Conversion
The estimated renovation/conversion cost of this alternative is $55/sf. In thecaretaker status alternative, this cost (or the cost of demolition) would beincurredat the end of the caretaker status period. This cost will need to be adjusted forinflation based on the year that the facility is brought out of Caretaker Statusand renovated.
b
4
9

Discount Rate Sensitivity Analysis
Graph of Net Present Value vs. Discount Rate
Discount Rate (%)
Dollars
No changesNPV rankings change at the following discount rates:
10

Discount Rate Sensitivity Analysis
NPV rankings change at the following discount rates:
Table of Net Present Values for each Discount Rate
No changes
Discount Rate = -1.0%
Caretaker Status $ 59,610
Demolition $ 81,971
Other DOD or Federal Agency $ 450,840
Renovation/Conversion $ 450,840
Discount Rate = -0.8%
Caretaker Status $ 58,384
Demolition $ 81,888
Other DOD or Federal Agency $ 450,385
Renovation/Conversion $ 450,385
Discount Rate = -0.6%
Caretaker Status $ 57,193
Demolition $ 81,806
Other DOD or Federal Agency $ 449,932
Renovation/Conversion $ 449,932
Discount Rate = -0.4%
Caretaker Status $ 56,036
Demolition $ 81,724
Other DOD or Federal Agency $ 449,480
Renovation/Conversion $ 449,480
Discount Rate = -0.2%
Caretaker Status $ 54,912
Demolition $ 81,642
Other DOD or Federal Agency $ 449,029
Renovation/Conversion $ 449,029
Discount Rate = -0.0%
Caretaker Status $ 53,820
Demolition $ 81,560
Other DOD or Federal Agency $ 448,580
Renovation/Conversion $ 448,580
Discount Rate = 0.2%
Caretaker Status $ 52,759
Demolition $ 81,479
Other DOD or Federal Agency $ 448,132
Renovation/Conversion $ 448,132
Discount Rate = 0.4%
Caretaker Status $ 51,728
Demolition $ 81,397
Other DOD or Federal Agency $ 447,686
Renovation/Conversion $ 447,686
Discount Rate = 0.6%
Caretaker Status $ 50,725
Demolition $ 81,316
Other DOD or Federal Agency $ 447,240
Renovation/Conversion $ 447,240
Discount Rate = 0.8%
Caretaker Status $ 49,750
Demolition $ 81,236
Other DOD or Federal Agency $ 446,796
Renovation/Conversion $ 446,796
Discount Rate = 1.0%
Caretaker Status $ 48,803
Demolition $ 81,155
Other DOD or Federal Agency $ 446,354
Renovation/Conversion $ 446,354
Discount Rate = 1.2%
Caretaker Status $ 47,881
Demolition $ 81,075
Other DOD or Federal Agency $ 445,913
Renovation/Conversion $ 445,913
Discount Rate = 1.4%
Caretaker Status $ 46,985
Demolition $ 80,995
Other DOD or Federal Agency $ 445,473
Renovation/Conversion $ 445,473
Discount Rate = 1.6%
Caretaker Status $ 46,113
Demolition $ 80,915
Other DOD or Federal Agency $ 445,034
Renovation/Conversion $ 445,034
Discount Rate = 1.8%
Caretaker Status $ 45,265
Demolition $ 80,836
Other DOD or Federal Agency $ 444,596
Renovation/Conversion $ 444,596
Discount Rate = 2.0%
Caretaker Status $ 44,440
Demolition $ 80,756
Other DOD or Federal Agency $ 444,160
Renovation/Conversion $ 444,160
11

Discount Rate Sensitivity Analysis
NPV rankings change at the following discount rates:
Table of Net Present Values for each Discount Rate
No changes
Discount Rate = 2.2%
Caretaker Status $ 43,636
Demolition $ 80,677
Other DOD or Federal Agency $ 443,726
Renovation/Conversion $ 443,726
Discount Rate = 2.4%
Caretaker Status $ 42,855
Demolition $ 80,599
Other DOD or Federal Agency $ 443,292
Renovation/Conversion $ 443,292
Discount Rate = 2.6%
Caretaker Status $ 42,094
Demolition $ 80,520
Other DOD or Federal Agency $ 442,860
Renovation/Conversion $ 442,860
Discount Rate = 2.8%
Caretaker Status $ 41,353
Demolition $ 80,442
Other DOD or Federal Agency $ 442,429
Renovation/Conversion $ 442,429
Discount Rate = 3.0%
Caretaker Status $ 40,631
Demolition $ 80,363
Other DOD or Federal Agency $ 441,999
Renovation/Conversion $ 441,999
Discount Rate = 3.2%
Caretaker Status $ 39,929
Demolition $ 80,286
Other DOD or Federal Agency $ 441,571
Renovation/Conversion $ 441,571
Discount Rate = 3.4%
Caretaker Status $ 39,245
Demolition $ 80,208
Other DOD or Federal Agency $ 441,143
Renovation/Conversion $ 441,143
Discount Rate = 3.6%
Caretaker Status $ 38,578
Demolition $ 80,130
Other DOD or Federal Agency $ 440,717
Renovation/Conversion $ 440,717
Discount Rate = 3.8%
Caretaker Status $ 37,929
Demolition $ 80,053
Other DOD or Federal Agency $ 440,292
Renovation/Conversion $ 440,292
Discount Rate = 4.0%
Caretaker Status $ 37,296
Demolition $ 79,976
Other DOD or Federal Agency $ 439,869
Renovation/Conversion $ 439,869
Discount Rate = 4.2%
Caretaker Status $ 36,679
Demolition $ 79,899
Other DOD or Federal Agency $ 439,447
Renovation/Conversion $ 439,447
Discount Rate = 4.4%
Caretaker Status $ 36,078
Demolition $ 79,823
Other DOD or Federal Agency $ 439,025
Renovation/Conversion $ 439,025
Discount Rate = 4.6%
Caretaker Status $ 35,492
Demolition $ 79,746
Other DOD or Federal Agency $ 438,605
Renovation/Conversion $ 438,605
Discount Rate = 4.8%
Caretaker Status $ 34,921
Demolition $ 79,670
Other DOD or Federal Agency $ 438,187
Renovation/Conversion $ 438,187
Discount Rate = 5.0%
Caretaker Status $ 34,364
Demolition $ 79,594
Other DOD or Federal Agency $ 437,769
Renovation/Conversion $ 437,769
Discount Rate = 5.2%
Caretaker Status $ 33,821
Demolition $ 79,519
Other DOD or Federal Agency $ 437,353
Renovation/Conversion $ 437,353
12

Discount Rate Sensitivity Analysis
NPV rankings change at the following discount rates:
Table of Net Present Values for each Discount Rate
No changes
Discount Rate = 5.4%
Caretaker Status $ 33,291
Demolition $ 79,443
Other DOD or Federal Agency $ 436,938
Renovation/Conversion $ 436,938
Discount Rate = 5.6%
Caretaker Status $ 32,774
Demolition $ 79,368
Other DOD or Federal Agency $ 436,524
Renovation/Conversion $ 436,524
Discount Rate = 5.8%
Caretaker Status $ 32,270
Demolition $ 79,293
Other DOD or Federal Agency $ 436,111
Renovation/Conversion $ 436,111
Discount Rate = 6.0%
Caretaker Status $ 31,778
Demolition $ 79,218
Other DOD or Federal Agency $ 435,699
Renovation/Conversion $ 435,699
Discount Rate = 6.2%
Caretaker Status $ 31,298
Demolition $ 79,143
Other DOD or Federal Agency $ 435,289
Renovation/Conversion $ 435,289
Discount Rate = 6.4%
Caretaker Status $ 30,829
Demolition $ 79,069
Other DOD or Federal Agency $ 434,880
Renovation/Conversion $ 434,880
Discount Rate = 6.6%
Caretaker Status $ 30,372
Demolition $ 78,995
Other DOD or Federal Agency $ 434,472
Renovation/Conversion $ 434,472
Discount Rate = 6.8%
Caretaker Status $ 29,925
Demolition $ 78,921
Other DOD or Federal Agency $ 434,065
Renovation/Conversion $ 434,065
Discount Rate = 7.0%
Caretaker Status $ 29,489
Demolition $ 78,847
Other DOD or Federal Agency $ 433,659
Renovation/Conversion $ 433,659
Discount Rate = 7.2%
Caretaker Status $ 29,064
Demolition $ 78,773
Other DOD or Federal Agency $ 433,254
Renovation/Conversion $ 433,254
Discount Rate = 7.4%
Caretaker Status $ 28,648
Demolition $ 78,700
Other DOD or Federal Agency $ 432,850
Renovation/Conversion $ 432,850
Discount Rate = 7.6%
Caretaker Status $ 28,242
Demolition $ 78,627
Other DOD or Federal Agency $ 432,448
Renovation/Conversion $ 432,448
Discount Rate = 7.8%
Caretaker Status $ 27,845
Demolition $ 78,554
Other DOD or Federal Agency $ 432,047
Renovation/Conversion $ 432,047
Discount Rate = 8.0%
Caretaker Status $ 27,457
Demolition $ 78,481
Other DOD or Federal Agency $ 431,646
Renovation/Conversion $ 431,646
Discount Rate = 8.2%
Caretaker Status $ 27,078
Demolition $ 78,409
Other DOD or Federal Agency $ 431,247
Renovation/Conversion $ 431,247
Discount Rate = 8.4%
Caretaker Status $ 26,708
Demolition $ 78,336
Other DOD or Federal Agency $ 430,849
Renovation/Conversion $ 430,849
13

Discount Rate Sensitivity Analysis
NPV rankings change at the following discount rates:
Table of Net Present Values for each Discount Rate
No changes
Discount Rate = 8.6%
Caretaker Status $ 26,346
Demolition $ 78,264
Other DOD or Federal Agency $ 430,452
Renovation/Conversion $ 430,452
Discount Rate = 8.8%
Caretaker Status $ 25,992
Demolition $ 78,192
Other DOD or Federal Agency $ 430,056
Renovation/Conversion $ 430,056
Discount Rate = 9.0%
Caretaker Status $ 25,647
Demolition $ 78,120
Other DOD or Federal Agency $ 429,662
Renovation/Conversion $ 429,662
Discount Rate = 9.2%
Caretaker Status $ 25,308
Demolition $ 78,049
Other DOD or Federal Agency $ 429,268
Renovation/Conversion $ 429,268
Discount Rate = 9.4%
Caretaker Status $ 24,978
Demolition $ 77,977
Other DOD or Federal Agency $ 428,876
Renovation/Conversion $ 428,876
Discount Rate = 9.6%
Caretaker Status $ 24,654
Demolition $ 77,906
Other DOD or Federal Agency $ 428,484
Renovation/Conversion $ 428,484
Discount Rate = 9.8%
Caretaker Status $ 24,338
Demolition $ 77,835
Other DOD or Federal Agency $ 428,094
Renovation/Conversion $ 428,094
Discount Rate = 10.0%
Caretaker Status $ 24,028
Demolition $ 77,764
Other DOD or Federal Agency $ 427,704
Renovation/Conversion $ 427,704
14

Date Generated:
Time Generated:
Version:
12 June 2018
12.45.10
Building 1836
Economic Analysis
2018
Project Title
:
Type of Analysis
Discount Rate
Period of Analysis
Start Year
Base Year
Dollar Analysis
:
:
:
:
:
:
Facilities Reduction Program
Mission Requirement - Full
2.5%
2018
20 years
Current Dollars
Project Objective :
Executive Summary Report
To determine the most economical course of action for
Building 1836 that meets the EXORD requirement to reduce
excess installation square footage.
HQDA EXORD 164-15, "Reduce the Installation Facility Footprint," published March 2015,holds commanders and planners accountable for making all reasonable efforts to maximizespace utilization, consolidate units into our best facilities, and dispose of excess assets.Although the Reduce the Footprint (RtF) acronym has taken hold, the EXORD is really aboutthe efficient management of our real property assets. Significant cost reductions can only beachieved with transformational changes that enable us to reduce our expenditures on facilitiesand services.
Building 1836 has been identified as a facility for disposal per HQDA EXORD 164-15. Thisbuilding is 2,998 square feet and the current Design Category Code is 61050, GeneralAdministration Facility. For the installation, there is currently an excess of 500K sf for this catcode.
Background:
ECONPACK 4.0.32
Alternatives Considered for this Analysis:
Status Quo (Current Operations) - This option retains Building 1836 as a
General Admin building (CC6150). This facility is currently unoccupied and no
longer needed for this purpose because of the excess in general admin space.
Maintaining this facility in its current category code does not meet the intent
of EXORD 164-15 and therefore is not a viable alternative.
This alternative is nonviable.
Demolition - This alternative will demolish the building and restore the site
to a grassed area. This alternative meets the requirements of the Executive
Order Number 164-15 to dispose of excess facilities. Demolition cost is
estimated to be $10/sf – 2,998*10=$29,880. This is a viable alternative.
This is a viable alternative.
Renovation/Conversion - Conversion/Alternate Use - This alternative renovates
the facility for use for another Category Code. The best option for conversion
of building, based on its current configuration, is to use it for Category Code
17120, General Instruction Building. To be made practical, this building would
require renovation/ conversion to include repairing or replacing roofing,
flooring, plumbing, electrical, communications, and/or other systems.
Estimated cost for the alternative is $55/sf or 2,998*55 = $164,890. Conversion
of this facility into CC 17120 would meet the intent of the Exord since there
is currently is a deficit in the General Instruction Building category code.
This is a viable alternative.
1

This is a viable alternative.
Other DOD or Federal Agency Use - This alternative offers the building to
another DOD or federal agency. With this alternative the building can remain
in its current configuration as a general purpose admin facility or be
converted for another use. This alternative would meet the intent of the Exord
by removing the building from Fort Benning’s inventory. However, it will still
require renovation/repair to systems such as roofing, flooring, plumbing,
electrical, communications, and/or other systems. The agency taking control of
the building would be responsible for the renovation/conversion of the
facility. Cost would be the same as the renovation/conversion alternative for
use by the army - $55*853=$164,890. This alternative is viable.
This is a viable alternative.
Care Taker Status - This alternative maintains the facility in its current
condition to be used later in its current category code or after conversion
into a different category code. A facility in caretaker status is maintained
to the point of preventing problems from developing or to keep existing
problems from worsening. The cost is based on an annual, per square foot
expense of $0.33 This would be a reoccurring annual expense until the facility
is put back into use. With this alternative, renovation/repair would still be
required prior to re-use and mostly likely at a much higher cost.
This is a viable alternative.
Economic Indicators:
Alternative NPV
Demolition $ 29,612
Renovation/Conversion $ 162,867
Other DOD or Federal Agency Use $ 162,867
Care Taker Status $ 116,066
1.This building cannot be used in its current state due to its condition.2.Renovation and/or conversion is necessary for the building to be reutilized in anotherCategory Code.
Assumptions of the Analysis:
Results and Recommendations:
Based on the results of this analysis, the most economical alternative that meets the intentof Exord 164-15 is demolition. Fort Benning does not have a need for the facility in itscurrent design use category code. Conversion to another category code for Fort Benninguse is undesired due to its size, layout, location and lack of interested units.
However, another Federal Agency has expressed interest in using the building for trainingand/or admin purposes. This alternative is viable and is being pursued. This course ofaction will be implemented if details such as lease terms and renovation requirements canbe agreed upon. Otherwise, since there are no other DOD or federal agencies interestedin the facility, demolition will be the most economical alternative.
2

Email Address
706-545-3229Phone Number
Master Planning Division, DPW
Organization
Dean MillerAction Officer :
:
:
:
3

Economic Analysis Graph
Net Present Value
Year
Dollars
4

Life Cycle Cost Report
DemolitionAlternative:
Year Demolition Total
Annual
Outlays
Middle
of Year
Discount
Factors
Present
Value
Cumulative
Net Present
Value
$29,6122018 $29,612$29,980$29,980 0.988
$29,6122019 $0$0$0 0.964
$29,6122020 $0$0$0 0.94
$29,6122021 $0$0$0 0.917
$29,6122022 $0$0$0 0.895
$29,6122023 $0$0$0 0.873
$29,6122024 $0$0$0 0.852
$29,6122025 $0$0$0 0.831
$29,6122026 $0$0$0 0.811
$29,6122027 $0$0$0 0.791
$29,6122028 $0$0$0 0.772
$29,6122029 $0$0$0 0.753
$29,6122030 $0$0$0 0.734
$29,6122031 $0$0$0 0.717
$29,6122032 $0$0$0 0.699
$29,6122033 $0$0$0 0.682
$29,6122034 $0$0$0 0.665
$29,6122035 $0$0$0 0.649
$29,6122036 $0$0$0 0.633
$29,6122037 $0$0$0 0.618
%NPV 100.00%
Discounting
Convention
Inflation
Schedule
Category /
Residual
Schedule
$29,612
M-O-Y
No Inflation
Non-Recurring
Costs
Discount Rate: 2.5%
Period of Analysis: 20 years
5

Life Cycle Cost Report
Renovation/ConversionAlternative:
Year Renovation/
Conversion
Total
Annual
Outlays
Middle
of Year
Discount
Factors
Present
Value
Cumulative
Net Present
Value
$162,8672018 $162,867$164,890$164,890 0.988
$162,8672019 $0$0$0 0.964
$162,8672020 $0$0$0 0.94
$162,8672021 $0$0$0 0.917
$162,8672022 $0$0$0 0.895
$162,8672023 $0$0$0 0.873
$162,8672024 $0$0$0 0.852
$162,8672025 $0$0$0 0.831
$162,8672026 $0$0$0 0.811
$162,8672027 $0$0$0 0.791
$162,8672028 $0$0$0 0.772
$162,8672029 $0$0$0 0.753
$162,8672030 $0$0$0 0.734
$162,8672031 $0$0$0 0.717
$162,8672032 $0$0$0 0.699
$162,8672033 $0$0$0 0.682
$162,8672034 $0$0$0 0.665
$162,8672035 $0$0$0 0.649
$162,8672036 $0$0$0 0.633
$162,8672037 $0$0$0 0.618
%NPV 100.00%
Discounting
Convention
Inflation
Schedule
Category /
Residual
Schedule
$162,867
M-O-Y
No Inflation
Recurring
Costs
Discount Rate: 2.5%
Period of Analysis: 20 years
6

Life Cycle Cost Report
Other DOD or Federal Agency UseAlternative:
Year Renovation for
another DOD or
Federal Agency
Total
Annual
Outlays
Middle
of Year
Discount
Factors
Present
Value
Cumulative
Net Present
Value
$162,8672018 $162,867$164,890$164,890 0.988
$162,8672019 $0$0$0 0.964
$162,8672020 $0$0$0 0.94
$162,8672021 $0$0$0 0.917
$162,8672022 $0$0$0 0.895
$162,8672023 $0$0$0 0.873
$162,8672024 $0$0$0 0.852
$162,8672025 $0$0$0 0.831
$162,8672026 $0$0$0 0.811
$162,8672027 $0$0$0 0.791
$162,8672028 $0$0$0 0.772
$162,8672029 $0$0$0 0.753
$162,8672030 $0$0$0 0.734
$162,8672031 $0$0$0 0.717
$162,8672032 $0$0$0 0.699
$162,8672033 $0$0$0 0.682
$162,8672034 $0$0$0 0.665
$162,8672035 $0$0$0 0.649
$162,8672036 $0$0$0 0.633
$162,8672037 $0$0$0 0.618
%NPV 100.00%
Discounting
Convention
Inflation
Schedule
Category /
Residual
Schedule
$162,867
M-O-Y
No Inflation
Recurring
Costs
Discount Rate: 2.5%
Period of Analysis: 20 years
7

Life Cycle Cost Report
Care Taker StatusAlternative:
Year Caretaker
Status
Renovation Total
Annual
Outlays
Middle
of Year
Discount
Factors
Present
Value
$8882018 0.988$0$899 $899
$8662019 0.964$0$899 $899
$8452020 0.94$0$899 $899
$8252021 0.917$0$899 $899
$8042022 0.895$0$899 $899
$7852023 0.873$0$899 $899
$7662024 0.852$0$899 $899
$7472025 0.831$0$899 $899
$7292026 0.811$0$899 $899
$7112027 0.791$0$899 $899
$6942028 0.772$0$899 $899
$6772029 0.753$0$899 $899
$6602030 0.734$0$899 $899
$6442031 0.717$0$899 $899
$6282032 0.699$0$899 $899
$6132033 0.682$0$899 $899
$5982034 0.665$0$899 $899
$5842035 0.649$0$899 $899
$5692036 0.633$0$899 $899
$102,4332037 0.618$164,890$899 $165,789
%NPV 12.22% 87.78%
Discounting
Convention
Inflation
Schedule
Category /
Residual
Schedule
$14,189
M-O-Y
No Inflation
Recurring
Costs
$101,878
M-O-Y
No Inflation
Non-Recurring
Costs
8

Life Cycle Cost Report
Care Taker StatusAlternative:
Year Cumulative
Net Present
Value
2018 $888
2019 $1,754
2020 $2,599
2021 $3,424
2022 $4,228
2023 $5,013
2024 $5,779
2025 $6,526
2026 $7,255
2027 $7,966
2028 $8,660
2029 $9,336
2030 $9,997
2031 $10,641
2032 $11,269
2033 $11,882
2034 $12,480
2035 $13,064
2036 $13,633
2037 $116,066
Discount Rate: 2.5%
Period of Analysis: 20 years
9

Life Cycle Cost Report
Sources and Derivations:
. Demolition
. Demolition
Estimated demolition cost is $10/sf.
2,998*10 = $29,980
a
1
. Renovation/Conversion
. Renovation/ Conversion
The estimated renovation/conversion cost of this alternative is $55/sf.a
2
. Other DOD or Federal Agency Use
. Renovation for another DOD or Federal Agency
The estimated renovation/conversion cost of this alternative is $55/sf.a
3
. Care Taker Status
. Caretaker Status
The current cost of maintaining a facility in a caretaker status is $0.33/sf.a
. Renovation
The estimated renovation/conversion cost of this alternative is $55/sf. In thecaretaker status alternative, this cost (or the cost of demolition) would beincurred at the end of the caretaker status period.
b
4
10

Discount Rate Sensitivity Analysis
Graph of Net Present Value vs. Discount Rate
Discount Rate (%)
Dollars
0.5 %NPV rankings change at the following discount rates:
11
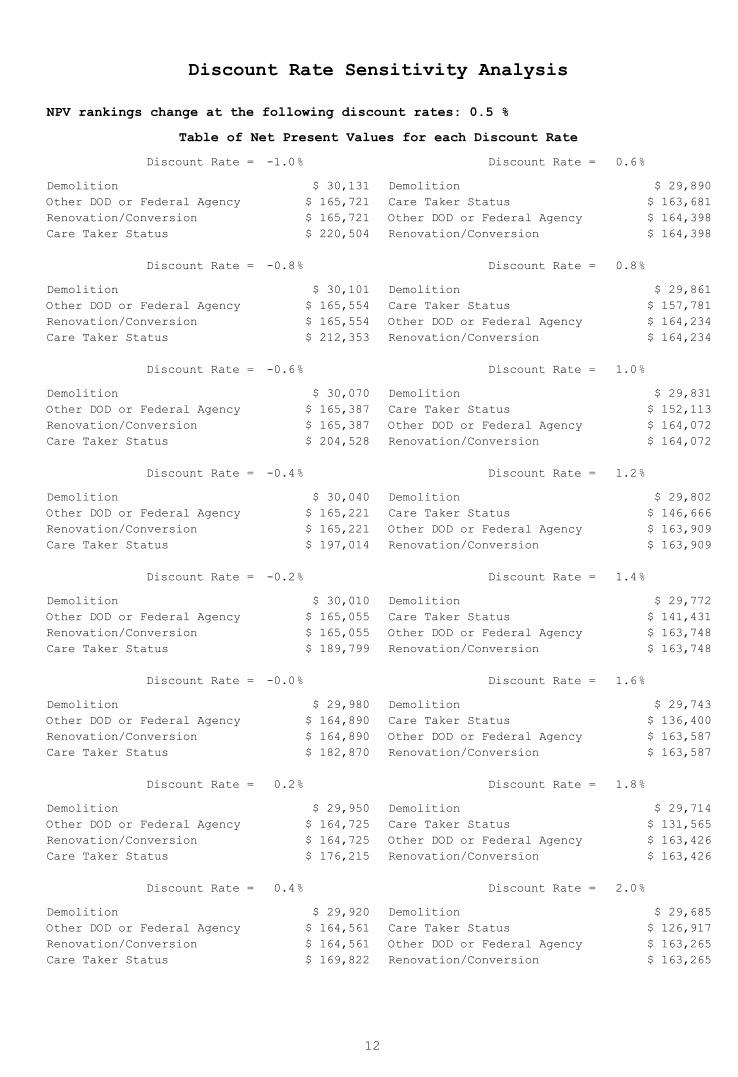
Discount Rate Sensitivity Analysis
NPV rankings change at the following discount rates:
Table of Net Present Values for each Discount Rate
0.5 %
Discount Rate = -1.0%
Demolition $ 30,131
Other DOD or Federal Agency $ 165,721
Renovation/Conversion $ 165,721
Care Taker Status $ 220,504
Discount Rate = -0.8%
Demolition $ 30,101
Other DOD or Federal Agency $ 165,554
Renovation/Conversion $ 165,554
Care Taker Status $ 212,353
Discount Rate = -0.6%
Demolition $ 30,070
Other DOD or Federal Agency $ 165,387
Renovation/Conversion $ 165,387
Care Taker Status $ 204,528
Discount Rate = -0.4%
Demolition $ 30,040
Other DOD or Federal Agency $ 165,221
Renovation/Conversion $ 165,221
Care Taker Status $ 197,014
Discount Rate = -0.2%
Demolition $ 30,010
Other DOD or Federal Agency $ 165,055
Renovation/Conversion $ 165,055
Care Taker Status $ 189,799
Discount Rate = -0.0%
Demolition $ 29,980
Other DOD or Federal Agency $ 164,890
Renovation/Conversion $ 164,890
Care Taker Status $ 182,870
Discount Rate = 0.2%
Demolition $ 29,950
Other DOD or Federal Agency $ 164,725
Renovation/Conversion $ 164,725
Care Taker Status $ 176,215
Discount Rate = 0.4%
Demolition $ 29,920
Other DOD or Federal Agency $ 164,561
Renovation/Conversion $ 164,561
Care Taker Status $ 169,822
Discount Rate = 0.6%
Demolition $ 29,890
Care Taker Status $ 163,681
Other DOD or Federal Agency $ 164,398
Renovation/Conversion $ 164,398
Discount Rate = 0.8%
Demolition $ 29,861
Care Taker Status $ 157,781
Other DOD or Federal Agency $ 164,234
Renovation/Conversion $ 164,234
Discount Rate = 1.0%
Demolition $ 29,831
Care Taker Status $ 152,113
Other DOD or Federal Agency $ 164,072
Renovation/Conversion $ 164,072
Discount Rate = 1.2%
Demolition $ 29,802
Care Taker Status $ 146,666
Other DOD or Federal Agency $ 163,909
Renovation/Conversion $ 163,909
Discount Rate = 1.4%
Demolition $ 29,772
Care Taker Status $ 141,431
Other DOD or Federal Agency $ 163,748
Renovation/Conversion $ 163,748
Discount Rate = 1.6%
Demolition $ 29,743
Care Taker Status $ 136,400
Other DOD or Federal Agency $ 163,587
Renovation/Conversion $ 163,587
Discount Rate = 1.8%
Demolition $ 29,714
Care Taker Status $ 131,565
Other DOD or Federal Agency $ 163,426
Renovation/Conversion $ 163,426
Discount Rate = 2.0%
Demolition $ 29,685
Care Taker Status $ 126,917
Other DOD or Federal Agency $ 163,265
Renovation/Conversion $ 163,265
12

Discount Rate Sensitivity Analysis
NPV rankings change at the following discount rates:
Table of Net Present Values for each Discount Rate
0.5 %
Discount Rate = 2.2%
Demolition $ 29,656
Care Taker Status $ 122,448
Other DOD or Federal Agency $ 163,106
Renovation/Conversion $ 163,106
Discount Rate = 2.4%
Demolition $ 29,627
Care Taker Status $ 118,152
Other DOD or Federal Agency $ 162,946
Renovation/Conversion $ 162,946
Discount Rate = 2.6%
Demolition $ 29,598
Care Taker Status $ 114,021
Other DOD or Federal Agency $ 162,787
Renovation/Conversion $ 162,787
Discount Rate = 2.8%
Demolition $ 29,569
Care Taker Status $ 110,049
Other DOD or Federal Agency $ 162,629
Renovation/Conversion $ 162,629
Discount Rate = 3.0%
Demolition $ 29,540
Care Taker Status $ 106,229
Other DOD or Federal Agency $ 162,471
Renovation/Conversion $ 162,471
Discount Rate = 3.2%
Demolition $ 29,512
Care Taker Status $ 102,555
Other DOD or Federal Agency $ 162,313
Renovation/Conversion $ 162,313
Discount Rate = 3.4%
Demolition $ 29,483
Care Taker Status $ 99,021
Other DOD or Federal Agency $ 162,156
Renovation/Conversion $ 162,156
Discount Rate = 3.6%
Demolition $ 29,455
Care Taker Status $ 95,621
Other DOD or Federal Agency $ 162,000
Renovation/Conversion $ 162,000
Discount Rate = 3.8%
Demolition $ 29,426
Care Taker Status $ 92,350
Other DOD or Federal Agency $ 161,844
Renovation/Conversion $ 161,844
Discount Rate = 4.0%
Demolition $ 29,398
Care Taker Status $ 89,204
Other DOD or Federal Agency $ 161,688
Renovation/Conversion $ 161,688
Discount Rate = 4.2%
Demolition $ 29,370
Care Taker Status $ 86,176
Other DOD or Federal Agency $ 161,533
Renovation/Conversion $ 161,533
Discount Rate = 4.4%
Demolition $ 29,341
Care Taker Status $ 83,262
Other DOD or Federal Agency $ 161,378
Renovation/Conversion $ 161,378
Discount Rate = 4.6%
Demolition $ 29,313
Care Taker Status $ 80,457
Other DOD or Federal Agency $ 161,224
Renovation/Conversion $ 161,224
Discount Rate = 4.8%
Demolition $ 29,285
Care Taker Status $ 77,758
Other DOD or Federal Agency $ 161,070
Renovation/Conversion $ 161,070
Discount Rate = 5.0%
Demolition $ 29,257
Care Taker Status $ 75,160
Other DOD or Federal Agency $ 160,916
Renovation/Conversion $ 160,916
Discount Rate = 5.2%
Demolition $ 29,230
Care Taker Status $ 72,659
Other DOD or Federal Agency $ 160,763
Renovation/Conversion $ 160,763
13

Discount Rate Sensitivity Analysis
NPV rankings change at the following discount rates:
Table of Net Present Values for each Discount Rate
0.5 %
Discount Rate = 5.4%
Demolition $ 29,202
Care Taker Status $ 70,251
Other DOD or Federal Agency $ 160,611
Renovation/Conversion $ 160,611
Discount Rate = 5.6%
Demolition $ 29,174
Care Taker Status $ 67,932
Other DOD or Federal Agency $ 160,458
Renovation/Conversion $ 160,458
Discount Rate = 5.8%
Demolition $ 29,147
Care Taker Status $ 65,700
Other DOD or Federal Agency $ 160,307
Renovation/Conversion $ 160,307
Discount Rate = 6.0%
Demolition $ 29,119
Care Taker Status $ 63,550
Other DOD or Federal Agency $ 160,155
Renovation/Conversion $ 160,155
Discount Rate = 6.2%
Demolition $ 29,092
Care Taker Status $ 61,479
Other DOD or Federal Agency $ 160,004
Renovation/Conversion $ 160,004
Discount Rate = 6.4%
Demolition $ 29,064
Care Taker Status $ 59,484
Other DOD or Federal Agency $ 159,854
Renovation/Conversion $ 159,854
Discount Rate = 6.6%
Demolition $ 29,037
Care Taker Status $ 57,563
Other DOD or Federal Agency $ 159,704
Renovation/Conversion $ 159,704
Discount Rate = 6.8%
Demolition $ 29,010
Care Taker Status $ 55,712
Other DOD or Federal Agency $ 159,554
Renovation/Conversion $ 159,554
Discount Rate = 7.0%
Demolition $ 28,983
Care Taker Status $ 53,929
Other DOD or Federal Agency $ 159,405
Renovation/Conversion $ 159,405
Discount Rate = 7.2%
Demolition $ 28,956
Care Taker Status $ 52,210
Other DOD or Federal Agency $ 159,256
Renovation/Conversion $ 159,256
Discount Rate = 7.4%
Demolition $ 28,929
Care Taker Status $ 50,554
Other DOD or Federal Agency $ 159,108
Renovation/Conversion $ 159,108
Discount Rate = 7.6%
Demolition $ 28,902
Care Taker Status $ 48,958
Other DOD or Federal Agency $ 158,960
Renovation/Conversion $ 158,960
Discount Rate = 7.8%
Demolition $ 28,875
Care Taker Status $ 47,420
Other DOD or Federal Agency $ 158,813
Renovation/Conversion $ 158,813
Discount Rate = 8.0%
Demolition $ 28,848
Care Taker Status $ 45,937
Other DOD or Federal Agency $ 158,665
Renovation/Conversion $ 158,665
Discount Rate = 8.2%
Demolition $ 28,822
Care Taker Status $ 44,508
Other DOD or Federal Agency $ 158,519
Renovation/Conversion $ 158,519
Discount Rate = 8.4%
Demolition $ 28,795
Care Taker Status $ 43,130
Other DOD or Federal Agency $ 158,372
Renovation/Conversion $ 158,372
14

Discount Rate Sensitivity Analysis
NPV rankings change at the following discount rates:
Table of Net Present Values for each Discount Rate
0.5 %
Discount Rate = 8.6%
Demolition $ 28,768
Care Taker Status $ 41,802
Other DOD or Federal Agency $ 158,227
Renovation/Conversion $ 158,227
Discount Rate = 8.8%
Demolition $ 28,742
Care Taker Status $ 40,520
Other DOD or Federal Agency $ 158,081
Renovation/Conversion $ 158,081
Discount Rate = 9.0%
Demolition $ 28,716
Care Taker Status $ 39,285
Other DOD or Federal Agency $ 157,936
Renovation/Conversion $ 157,936
Discount Rate = 9.2%
Demolition $ 28,689
Care Taker Status $ 38,093
Other DOD or Federal Agency $ 157,791
Renovation/Conversion $ 157,791
Discount Rate = 9.4%
Demolition $ 28,663
Care Taker Status $ 36,944
Other DOD or Federal Agency $ 157,647
Renovation/Conversion $ 157,647
Discount Rate = 9.6%
Demolition $ 28,637
Care Taker Status $ 35,835
Other DOD or Federal Agency $ 157,503
Renovation/Conversion $ 157,503
Discount Rate = 9.8%
Demolition $ 28,611
Care Taker Status $ 34,765
Other DOD or Federal Agency $ 157,360
Renovation/Conversion $ 157,360
Discount Rate = 10.0%
Demolition $ 28,585
Care Taker Status $ 33,733
Other DOD or Federal Agency $ 157,216
Renovation/Conversion $ 157,216
15

Date Generated:
Time Generated:
Version:
13 June 2018
11.06.19
Building 3716
Economic Analysis
2018
Project Title
:
Type of Analysis
Discount Rate
Period of Analysis
Start Year
Base Year
Dollar Analysis
:
:
:
:
:
:
Facilities Reduction Program
Mission Requirement - Full
2.5%
2018
20 years
Current Dollars
Project Objective :
Executive Summary Report
To determine the most economical course of action for
Building 3716
that meets the EXORD requirement to reduce excess square
footage.
Building 3716 has been identified as a facility for disposal per HQDA EXORD 164-15.
HQDA EXORD 164-15, "Reduce the Installation Facility Footprint," published March 2015,holds commanders and planners accountable for making all reasonable efforts to maximizespace utilization, consolidate units into our best facilities, and dispose of excess assets.Although the Reduce the Footprint (RtF) acronym has taken hold, the EXORD is really aboutthe efficient management of our real property assets. Significant cost reductions can only beachieved with transformational changes that enable us to reduce our expenditures on facilitiesand services.
Background:
ECONPACK 4.0.32
Alternatives Considered for this Analysis:
Demolition - This alternative will demolish the building and restore the site
to a grassed area. This
alternative meets the requirements of the Executive Order Number 164-15 to
dispose of
excess facilities. Demolition cost is estimated to be $10/sf – 20,770*10 =
$207,700. This is a viable alternative. This is a viable alternative.
Renovation/Conversion - Conversion/Alternate Use - This alternative renovates
the facility for use for another
Category Code. The best option for conversion of building, based on its current
configuration, is to use it for Category Code 21410, Vehicle Maintenance Shop.
To be made practical, this building would require total renovation to include
repairing or replacing roofing, flooring, plumbing, electrical, communications,
and other systems. Estimated cost is $55/sf or 20,770*55 = $1,142,350.
However, there currently is an excess of space in this category code and
converting into this category would violate the intent of the Exord. This is a
viable alternative This is a viable alternative.
Other DOD or Federal Agency - This alternative offers the building to another
DOD or federal agency. The agency would be responsible for the
renovation/conversion of the facility. Cost would be the same as the
renovation/conversion alternative - $55*20,770 =$1,142,350. Due to the cost
and time required for renovation, it’s unlikely that another agency would
select it. This alternative is viable This is a viable alternative.
1

Caretaker Status - This alternative maintains the facility in its current
condition to be used later in its
current category code or after conversion into a different category code. A
facility in
caretaker status is maintained to the point of preventing problems from
developing or to
keep existing problems from worsening. The cost is based on an annual, per
square foot expense of $0.33 or $0.33*20,770 = $6854/yr. This would be a
reoccurring annual expense until the facility is put back into use. With this
alternative, renovation/repair would still be required prior to re-use and
mostly likely at a much higher cost. This is a viable alternative.
Email Address
706-545-3229Phone Number
Master Planning Division, DPW
Organization
Dean MillerAction Officer :
:
:
:
Economic Indicators:
Alternative NPV
Demolition $ 205,151
Renovation/Conversion $ 1,128,333
Other DOD or Federal Agency $ 1,128,333
Caretaker Status $ 813,979
1. This building cannot be used in its current state due to its condition.2. Renovation and/or conversion is necessary for the building to be reutilized in anotherCategory Code.
Assumptions of the Analysis:
Results and Recommendations:
Based on the results of this analysis, the most economical alternative that meets theintent of Exord 164-15 is demolition. Fort Benning does not have a need for the facilityin its current design use category code. Conversion to another category code for FortBenning use is undesired due to its size, layout, location and lack of interested units.No other Federal Agency has expressed interest in using the building, either in its currentconfiguration or converted into another category code. Therefore, demolition of Building3716 is the most economical alternative for the Army.
2

Economic Analysis Graph
Net Present Value
Year
Dollars
3

Life Cycle Cost Report
DemolitionAlternative:
Year Demolition Total
Annual
Outlays
Middle
of Year
Discount
Factors
Present
Value
Cumulative
Net Present
Value
$205,1512018 $205,151$207,700$207,700 0.988
$205,1512019 $0$0$0 0.964
$205,1512020 $0$0$0 0.94
$205,1512021 $0$0$0 0.917
$205,1512022 $0$0$0 0.895
$205,1512023 $0$0$0 0.873
$205,1512024 $0$0$0 0.852
$205,1512025 $0$0$0 0.831
$205,1512026 $0$0$0 0.811
$205,1512027 $0$0$0 0.791
$205,1512028 $0$0$0 0.772
$205,1512029 $0$0$0 0.753
$205,1512030 $0$0$0 0.734
$205,1512031 $0$0$0 0.717
$205,1512032 $0$0$0 0.699
$205,1512033 $0$0$0 0.682
$205,1512034 $0$0$0 0.665
$205,1512035 $0$0$0 0.649
$205,1512036 $0$0$0 0.633
$205,1512037 $0$0$0 0.618
%NPV 100.00%
Discounting
Convention
Inflation
Schedule
Category /
Residual
Schedule
$205,151
M-O-Y
No Inflation
Non-Recurring
Costs
Discount Rate: 2.5%
Period of Analysis: 20 years
4

Life Cycle Cost Report
Renovation/ConversionAlternative:
Year Renovation/
Conversion
Total
Annual
Outlays
Middle
of Year
Discount
Factors
Present
Value
Cumulative
Net Present
Value
$1,128,3332018 $1,128,333$1,142,350$1,142,350 0.988
$1,128,3332019 $0$0$0 0.964
$1,128,3332020 $0$0$0 0.94
$1,128,3332021 $0$0$0 0.917
$1,128,3332022 $0$0$0 0.895
$1,128,3332023 $0$0$0 0.873
$1,128,3332024 $0$0$0 0.852
$1,128,3332025 $0$0$0 0.831
$1,128,3332026 $0$0$0 0.811
$1,128,3332027 $0$0$0 0.791
$1,128,3332028 $0$0$0 0.772
$1,128,3332029 $0$0$0 0.753
$1,128,3332030 $0$0$0 0.734
$1,128,3332031 $0$0$0 0.717
$1,128,3332032 $0$0$0 0.699
$1,128,3332033 $0$0$0 0.682
$1,128,3332034 $0$0$0 0.665
$1,128,3332035 $0$0$0 0.649
$1,128,3332036 $0$0$0 0.633
$1,128,3332037 $0$0$0 0.618
%NPV 100.00%
Discounting
Convention
Inflation
Schedule
Category /
Residual
Schedule
$1,128,333
M-O-Y
No Inflation
Non-Recurring
Costs
Discount Rate: 2.5%
Period of Analysis: 20 years
5

Life Cycle Cost Report
Other DOD or Federal AgencyAlternative:
Year Other DOD or
Agency
Total
Annual
Outlays
Middle
of Year
Discount
Factors
Present
Value
Cumulative
Net Present
Value
$1,128,3332018 $1,128,333$1,142,350$1,142,350 0.988
$1,128,3332019 $0$0$0 0.964
$1,128,3332020 $0$0$0 0.94
$1,128,3332021 $0$0$0 0.917
$1,128,3332022 $0$0$0 0.895
$1,128,3332023 $0$0$0 0.873
$1,128,3332024 $0$0$0 0.852
$1,128,3332025 $0$0$0 0.831
$1,128,3332026 $0$0$0 0.811
$1,128,3332027 $0$0$0 0.791
$1,128,3332028 $0$0$0 0.772
$1,128,3332029 $0$0$0 0.753
$1,128,3332030 $0$0$0 0.734
$1,128,3332031 $0$0$0 0.717
$1,128,3332032 $0$0$0 0.699
$1,128,3332033 $0$0$0 0.682
$1,128,3332034 $0$0$0 0.665
$1,128,3332035 $0$0$0 0.649
$1,128,3332036 $0$0$0 0.633
$1,128,3332037 $0$0$0 0.618
%NPV 100.00%
Discounting
Convention
Inflation
Schedule
Category /
Residual
Schedule
$1,128,333
M-O-Y
No Inflation
Non-Recurring
Costs
Discount Rate: 2.5%
Period of Analysis: 20 years
6

Life Cycle Cost Report
Caretaker StatusAlternative:
Year Caretaker
Status
Renovation/
Construction
Total
Annual
Outlays
Middle
of Year
Discount
Factors
Present
Value
$6,7702018 0.988$0$6,854 $6,854
$6,6052019 0.964$0$6,854 $6,854
$6,4442020 0.94$0$6,854 $6,854
$6,2872021 0.917$0$6,854 $6,854
$6,1332022 0.895$0$6,854 $6,854
$5,9842023 0.873$0$6,854 $6,854
$5,8382024 0.852$0$6,854 $6,854
$5,6952025 0.831$0$6,854 $6,854
$5,5562026 0.811$0$6,854 $6,854
$5,4212027 0.791$0$6,854 $6,854
$5,2892028 0.772$0$6,854 $6,854
$5,1602029 0.753$0$6,854 $6,854
$5,0342030 0.734$0$6,854 $6,854
$4,9112031 0.717$0$6,854 $6,854
$4,7912032 0.699$0$6,854 $6,854
$4,6742033 0.682$0$6,854 $6,854
$4,5602034 0.665$0$6,854 $6,854
$4,4492035 0.649$0$6,854 $6,854
$4,3412036 0.633$0$6,854 $6,854
$710,0382037 0.618$1,142,350$6,854 $1,149,204
%NPV 13.29% 86.71%
Discounting
Convention
Inflation
Schedule
Category /
Residual
Schedule
$108,175
M-O-Y
No Inflation
Recurring
Costs
$705,803
M-O-Y
No Inflation
Recurring
Costs
7

Life Cycle Cost Report
Caretaker StatusAlternative:
Year Cumulative
Net Present
Value
2018 $6,770
2019 $13,375
2020 $19,818
2021 $26,105
2022 $32,238
2023 $38,222
2024 $44,059
2025 $49,755
2026 $55,311
2027 $60,732
2028 $66,020
2029 $71,180
2030 $76,214
2031 $81,125
2032 $85,916
2033 $90,591
2034 $95,151
2035 $99,600
2036 $103,941
2037 $813,979
Discount Rate: 2.5%
Period of Analysis: 20 years
8

Life Cycle Cost Report
Sources and Derivations:
. Demolition
. Demolition
Estimated demolition cost is $10/sf.
$10*20,770 = $207,700.
a
1
. Renovation/Conversion
. Renovation/ Conversion
To be made practical, this building would require total renovation to include repairing orreplacing roofing, flooring, plumbing, electrical, communications, and other systems.
Estimated cost is $55/sf or 55*20,770 = $1,142,350
a
2
. Other DOD or Federal Agency
. Other DOD or Agency
This alternative offers the building to another DOD or federal agency. Theagencywould be responsible for the renovation/conversion of the facility. Cost wouldbe thesame as the renovation/conversion alternative - $55*20,770 = $1,142,350.
Due to the cost and time required for renovation, it’s unlikely that anotheragency would select it. This alternative is viable.
a
3
. Caretaker Status
. Caretaker Status
The current cost of maintaining a facility in a caretaker status is $0.33/sf. Thisalternative provides the minimum facility maintenance necessary to keep thebuilding from deteriorating from lack of use and to prevent existing conditionsfrom worsening. When the decision to bring the building back on line is made,the facility will still require major renovation to be made functional.
a
. Renovation/ Construction
The estimated renovation/conversion cost of this alternative is $55/sf. In thecaretaker status alternative, this cost (or the cost of demolition) would beincurred at the end of the caretaker status period. This cost will need to beadjusted for inflation based on the year that the facility is brought out ofCaretaker Status and renovated.
b
4
9
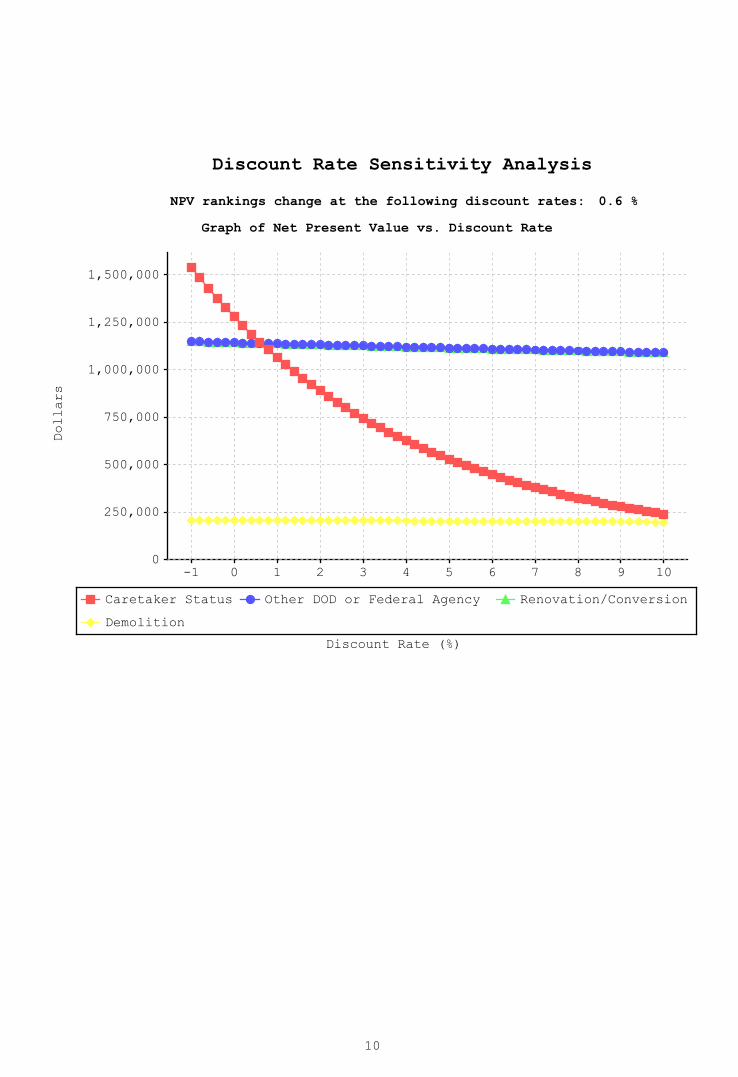
Discount Rate Sensitivity Analysis
Graph of Net Present Value vs. Discount Rate
Discount Rate (%)
Dollars
0.6 %NPV rankings change at the following discount rates:
10

Discount Rate Sensitivity Analysis
NPV rankings change at the following discount rates:
Table of Net Present Values for each Discount Rate
0.6 %
Discount Rate = -1.0%
Demolition $ 208,746
Other DOD or Federal Agency $ 1,148,105
Renovation/Conversion $ 1,148,105
Caretaker Status $ 1,541,502
Discount Rate = -0.8%
Demolition $ 208,536
Other DOD or Federal Agency $ 1,146,947
Renovation/Conversion $ 1,146,947
Caretaker Status $ 1,484,751
Discount Rate = -0.6%
Demolition $ 208,326
Other DOD or Federal Agency $ 1,145,793
Renovation/Conversion $ 1,145,793
Caretaker Status $ 1,430,261
Discount Rate = -0.4%
Demolition $ 208,117
Other DOD or Federal Agency $ 1,144,642
Renovation/Conversion $ 1,144,642
Caretaker Status $ 1,377,938
Discount Rate = -0.2%
Demolition $ 207,908
Other DOD or Federal Agency $ 1,143,494
Renovation/Conversion $ 1,143,494
Caretaker Status $ 1,327,690
Discount Rate = -0.0%
Demolition $ 207,700
Other DOD or Federal Agency $ 1,142,350
Renovation/Conversion $ 1,142,350
Caretaker Status $ 1,279,430
Discount Rate = 0.2%
Demolition $ 207,493
Other DOD or Federal Agency $ 1,141,209
Renovation/Conversion $ 1,141,209
Caretaker Status $ 1,233,076
Discount Rate = 0.4%
Demolition $ 207,286
Other DOD or Federal Agency $ 1,140,072
Renovation/Conversion $ 1,140,072
Caretaker Status $ 1,188,548
Discount Rate = 0.6%
Demolition $ 207,080
Other DOD or Federal Agency $ 1,138,938
Renovation/Conversion $ 1,138,938
Caretaker Status $ 1,145,770
Discount Rate = 0.8%
Demolition $ 206,874
Caretaker Status $ 1,104,670
Other DOD or Federal Agency $ 1,137,808
Renovation/Conversion $ 1,137,808
Discount Rate = 1.0%
Demolition $ 206,669
Caretaker Status $ 1,065,177
Other DOD or Federal Agency $ 1,136,681
Renovation/Conversion $ 1,136,681
Discount Rate = 1.2%
Demolition $ 206,465
Caretaker Status $ 1,027,226
Other DOD or Federal Agency $ 1,135,557
Renovation/Conversion $ 1,135,557
Discount Rate = 1.4%
Demolition $ 206,261
Caretaker Status $ 990,753
Other DOD or Federal Agency $ 1,134,437
Renovation/Conversion $ 1,134,437
Discount Rate = 1.6%
Demolition $ 206,058
Caretaker Status $ 955,697
Other DOD or Federal Agency $ 1,133,319
Renovation/Conversion $ 1,133,319
Discount Rate = 1.8%
Demolition $ 205,856
Caretaker Status $ 922,000
Other DOD or Federal Agency $ 1,132,206
Renovation/Conversion $ 1,132,206
Discount Rate = 2.0%
Demolition $ 205,654
Caretaker Status $ 889,606
Other DOD or Federal Agency $ 1,131,095
Renovation/Conversion $ 1,131,095
11

Discount Rate Sensitivity Analysis
NPV rankings change at the following discount rates:
Table of Net Present Values for each Discount Rate
0.6 %
Discount Rate = 2.2%
Demolition $ 205,452
Caretaker Status $ 858,462
Other DOD or Federal Agency $ 1,129,988
Renovation/Conversion $ 1,129,988
Discount Rate = 2.4%
Demolition $ 205,252
Caretaker Status $ 828,517
Other DOD or Federal Agency $ 1,128,884
Renovation/Conversion $ 1,128,884
Discount Rate = 2.6%
Demolition $ 205,051
Caretaker Status $ 799,722
Other DOD or Federal Agency $ 1,127,783
Renovation/Conversion $ 1,127,783
Discount Rate = 2.8%
Demolition $ 204,852
Caretaker Status $ 772,030
Other DOD or Federal Agency $ 1,126,685
Renovation/Conversion $ 1,126,685
Discount Rate = 3.0%
Demolition $ 204,653
Caretaker Status $ 745,397
Other DOD or Federal Agency $ 1,125,591
Renovation/Conversion $ 1,125,591
Discount Rate = 3.2%
Demolition $ 204,454
Caretaker Status $ 719,780
Other DOD or Federal Agency $ 1,124,500
Renovation/Conversion $ 1,124,500
Discount Rate = 3.4%
Demolition $ 204,257
Caretaker Status $ 695,137
Other DOD or Federal Agency $ 1,123,412
Renovation/Conversion $ 1,123,412
Discount Rate = 3.6%
Demolition $ 204,059
Caretaker Status $ 671,429
Other DOD or Federal Agency $ 1,122,327
Renovation/Conversion $ 1,122,327
Discount Rate = 3.8%
Demolition $ 203,863
Caretaker Status $ 648,619
Other DOD or Federal Agency $ 1,121,245
Renovation/Conversion $ 1,121,245
Discount Rate = 4.0%
Demolition $ 203,667
Caretaker Status $ 626,671
Other DOD or Federal Agency $ 1,120,166
Renovation/Conversion $ 1,120,166
Discount Rate = 4.2%
Demolition $ 203,471
Caretaker Status $ 605,550
Other DOD or Federal Agency $ 1,119,091
Renovation/Conversion $ 1,119,091
Discount Rate = 4.4%
Demolition $ 203,276
Caretaker Status $ 585,223
Other DOD or Federal Agency $ 1,118,018
Renovation/Conversion $ 1,118,018
Discount Rate = 4.6%
Demolition $ 203,082
Caretaker Status $ 565,659
Other DOD or Federal Agency $ 1,116,949
Renovation/Conversion $ 1,116,949
Discount Rate = 4.8%
Demolition $ 202,888
Caretaker Status $ 546,827
Other DOD or Federal Agency $ 1,115,883
Renovation/Conversion $ 1,115,883
Discount Rate = 5.0%
Demolition $ 202,694
Caretaker Status $ 528,697
Other DOD or Federal Agency $ 1,114,819
Renovation/Conversion $ 1,114,819
Discount Rate = 5.2%
Demolition $ 202,502
Caretaker Status $ 511,243
Other DOD or Federal Agency $ 1,113,759
Renovation/Conversion $ 1,113,759
12

Discount Rate Sensitivity Analysis
NPV rankings change at the following discount rates:
Table of Net Present Values for each Discount Rate
0.6 %
Discount Rate = 5.4%
Demolition $ 202,309
Caretaker Status $ 494,437
Other DOD or Federal Agency $ 1,112,702
Renovation/Conversion $ 1,112,702
Discount Rate = 5.6%
Demolition $ 202,118
Caretaker Status $ 478,254
Other DOD or Federal Agency $ 1,111,648
Renovation/Conversion $ 1,111,648
Discount Rate = 5.8%
Demolition $ 201,927
Caretaker Status $ 462,669
Other DOD or Federal Agency $ 1,110,597
Renovation/Conversion $ 1,110,597
Discount Rate = 6.0%
Demolition $ 201,736
Caretaker Status $ 447,659
Other DOD or Federal Agency $ 1,109,548
Renovation/Conversion $ 1,109,548
Discount Rate = 6.2%
Demolition $ 201,546
Caretaker Status $ 433,201
Other DOD or Federal Agency $ 1,108,503
Renovation/Conversion $ 1,108,503
Discount Rate = 6.4%
Demolition $ 201,357
Caretaker Status $ 419,274
Other DOD or Federal Agency $ 1,107,461
Renovation/Conversion $ 1,107,461
Discount Rate = 6.6%
Demolition $ 201,168
Caretaker Status $ 405,856
Other DOD or Federal Agency $ 1,106,421
Renovation/Conversion $ 1,106,421
Discount Rate = 6.8%
Demolition $ 200,979
Caretaker Status $ 392,929
Other DOD or Federal Agency $ 1,105,385
Renovation/Conversion $ 1,105,385
Discount Rate = 7.0%
Demolition $ 200,791
Caretaker Status $ 380,472
Other DOD or Federal Agency $ 1,104,351
Renovation/Conversion $ 1,104,351
Discount Rate = 7.2%
Demolition $ 200,604
Caretaker Status $ 368,468
Other DOD or Federal Agency $ 1,103,321
Renovation/Conversion $ 1,103,321
Discount Rate = 7.4%
Demolition $ 200,417
Caretaker Status $ 356,899
Other DOD or Federal Agency $ 1,102,293
Renovation/Conversion $ 1,102,293
Discount Rate = 7.6%
Demolition $ 200,231
Caretaker Status $ 345,748
Other DOD or Federal Agency $ 1,101,268
Renovation/Conversion $ 1,101,268
Discount Rate = 7.8%
Demolition $ 200,045
Caretaker Status $ 335,000
Other DOD or Federal Agency $ 1,100,246
Renovation/Conversion $ 1,100,246
Discount Rate = 8.0%
Demolition $ 199,859
Caretaker Status $ 324,638
Other DOD or Federal Agency $ 1,099,227
Renovation/Conversion $ 1,099,227
Discount Rate = 8.2%
Demolition $ 199,675
Caretaker Status $ 314,647
Other DOD or Federal Agency $ 1,098,210
Renovation/Conversion $ 1,098,210
Discount Rate = 8.4%
Demolition $ 199,490
Caretaker Status $ 305,015
Other DOD or Federal Agency $ 1,097,197
Renovation/Conversion $ 1,097,197
13

Discount Rate Sensitivity Analysis
NPV rankings change at the following discount rates:
Table of Net Present Values for each Discount Rate
0.6 %
Discount Rate = 8.6%
Demolition $ 199,307
Caretaker Status $ 295,726
Other DOD or Federal Agency $ 1,096,186
Renovation/Conversion $ 1,096,186
Discount Rate = 8.8%
Demolition $ 199,123
Caretaker Status $ 286,767
Other DOD or Federal Agency $ 1,095,178
Renovation/Conversion $ 1,095,178
Discount Rate = 9.0%
Demolition $ 198,941
Caretaker Status $ 278,127
Other DOD or Federal Agency $ 1,094,173
Renovation/Conversion $ 1,094,173
Discount Rate = 9.2%
Demolition $ 198,758
Caretaker Status $ 269,793
Other DOD or Federal Agency $ 1,093,170
Renovation/Conversion $ 1,093,170
Discount Rate = 9.4%
Demolition $ 198,576
Caretaker Status $ 261,753
Other DOD or Federal Agency $ 1,092,171
Renovation/Conversion $ 1,092,171
Discount Rate = 9.6%
Demolition $ 198,395
Caretaker Status $ 253,997
Other DOD or Federal Agency $ 1,091,174
Renovation/Conversion $ 1,091,174
Discount Rate = 9.8%
Demolition $ 198,214
Caretaker Status $ 246,513
Other DOD or Federal Agency $ 1,090,180
Renovation/Conversion $ 1,090,180
Discount Rate = 10.0%
Demolition $ 198,034
Caretaker Status $ 239,291
Other DOD or Federal Agency $ 1,089,188
Renovation/Conversion $ 1,089,188
14


Infrastructure Footprint Reduction Program June 2018 Environmental Assessment
Appendix C
APPENDIX C
FORT BENNING FACILITIES REDUCTION PROGRAM DRAFT FINDING OF NO SIGNIFICANT IMPACT

Infrastructure Footprint Reduction Program June 2018 Draft Finding of No Significant Impact
1
DRAFT FINDING OF NO SIGNIFICANT IMPACT
1 Introduction Fort Benning has prepared this Environmental Assessment (EA) to examine the potential environmental consequences of implementing the Fiscal Year (FY) 19-23 Facility Reduction Program (FRP) in accordance with the National Environmental Policy Act (NEPA) of 1969 (42 US Code [USC] 4321 et seq.), the Council on Environmental Quality (CEQ) Regulations Implementing the Procedural Provisions of NEPA (40 Code of Federal Regulations [CFR] Part 1500-1508), and the Army NEPA Regulation (Environmental Analysis of Army Actions; 32 CFR Part 651. The EA is used to determine and evaluate the potential environmental effects of the Proposed Action, identify possible/potential mitigation measures to lessen or eliminate adverse effects, and examine reasonable alternatives for the Proposed Action. The intended audience of the EA is Army decision-makers, interested government agencies, federally recognized Native American Tribes, and non-governmental organizations, and members of the public. The effects analyses in this EA are based on a variety of sources and the best available information at the time of preparation. The information contained in this EA will be reviewed and considered by the Army prior to the final decision on how to implement the Proposed Action, if at all.
2 Background A US Army Training and Doctrine Command (TRADOC) memorandum dated 1 November 1996, directed Army installations to support the "Winning the Infrastructure War" initiative via implementation of the IFRP (Infrastructure Footprint Reduction Program). Rather than incur the expense of maintaining outdated or unusable buildings and other structures (i.e., concrete pads and former building foundations, antiquated training equipment, etc.), infrastructure would be demolished and their various functions relocated. The IFRP continues to be implemented on the Installation through the development of the FRP. The FRP is a dynamic Fort Benning initiative with infrastructure being added to or removed from the proposed demolition inventory on the basis of evolving mission demands, utilization priorities, and available funding. Appendix A contains a listing of infrastructure currently proposed for demolition and commonly referred to as the FRP list. An initial EA and Finding of No Significant Impact (FNSI) for the IFRP on Fort Benning were completed in 1997. The EA analyzed the No Action (Status Quo) Alternative plus two Action Alternatives. Alternative 2 involved the construction and utilization of an on-Post facility for the disposal of demolition wastes. The Preferred Alternative (Alternative 3) involved the transport of demolition wastes to an off-Post commercial facility. The EA’s Preferred Alternative offered the most flexibility in disposal methods for wastes generated by demolition and was the alternative selected as outlined in the FNSI. As a result of infrastructure being demolished or being removed from the program’s demolition inventory due to reuse and other infrastructure being added, Supplemental EAs were prepared in 2002 and again in 2008. Both determined that the demolition of infrastructure on the FRP lists

Infrastructure Footprint Reduction Program June 2018 Draft Finding of No Significant Impact
2
would not result in significant adverse effects; instead, all adverse effects were considered minor and further minimized through mitigation and/or monitoring activities. All total, Fort Benning has demolished an estimated 1.4 million square feet of buildings and structures over the last 15 years through the FRP and under a variety of other improvement projects. More recent comprehensive and collaborative planning efforts by the Army have directed installations to continue optimizing land use and the management of existing facilities through site specific area development planning. Area Development Plans (ADPs) are developed from workshop style events guiding installation planning personnel and Army stakeholders through exercises which promotes short and long-term planning. Key components of the ADPs include the repurposing of existing facilities for optimal use, demolition of excess infrastructure and unneeded facilities, and providing area specific plans from which the Real Property Master Plan can be updated. An installation’s Real Property Master Plan provides broad planning direction at the land use level for sustainable installation development that supports mission and environmental requirements. Fort Benning is currently in the process of updating its 2011 Real Property Master Plan.
3 Purpose and Need The purpose of the Proposed Action is to optimize facility management through reducing buildings and structures. As a result of ongoing Army force structure transformations and modernization efforts at Fort Benning (Section 1.2), facility utilization priorities have again changed requiring an up-to-date FRP list to define which facilities are identified for demolition for FY19-23. The Proposed Action is necessary to continue the Installation’s ongoing FRP and support compliance with the US Army TRADOC’s IFRP and more recent Army strategies (DoA, 2016a and b). Implementing the Proposed Action would facilitate the identification/selection, demolition, and disposal of infrastructure considered obsolete/outdated, cost prohibitive to sustain, in excess of Army utilization needs, and in some cases contain potential human health and safety concerns. Other benefits include decreasing fixed facility costs (i.e., utilities and saving energy, reducing risks from structural deterioration, and making idle areas of an installation available for productive reuse. Upon completion of the FY19-23 FRP, Fort Benning will have eliminated more than two million square feet of space and made available millions of dollars in operations and maintenance funds for use in other areas annually.
4 Description of the Proposed Action The Proposed Action is to implement the FY19-23 FRP at Fort Benning, GA. Implementation of the FRP could demolish, dispose, and remove from Real Property inventories approximately 150 buildings and structures equaling more than two million square feet. This tentative goal would occur over the next five years at various locations across Fort Benning’s cantonment areas for an estimated cost of $18 million. Ancillary structures would also be removed as part of the Proposed Action. Relocation of personnel, supplies, and/or equipment may include renovations and/or adaptive reuse of existing structures. Details of relocation and renovation are uncertain at this time, and those types of future actions will be subject to appropriate NEPA documentation as required.

Infrastructure Footprint Reduction Program June 2018 Draft Finding of No Significant Impact
3
5 Description of the Alternatives
Fort Benning developed a screening criteria to measure which alternatives are reasonable for further analysis. Any alternatives that failed to meet the criteria were eliminated from full consideration within this EA. Alternatives proposed must:
• Comply with the Army TRADOC’s IFRP and Army directives instructing optimized facility management through footprint reduction efforts;
• Be economically feasible (e.g., facility conversion or extensive renovation and reuse of buildings and structures on the FRP list would be less cost effective than new construction/replacement.
Alternatives carried forward for analysis in this EA include: No Action Alternative
Under the No Action Alternative, Fort Benning would continue to utilize approximately 150 building and structures considered cost prohibitive to sustain, in excess of Army utilization needs, and in some cases may contain potential human health and safety concerns associated with older and ageing infrastructure (e.g., lead based paints (LBPs), asbestos containing materials (ACMs), and/or structural deterioration). Occupied buildings would continue to incur excessive maintenance costs until new replacement facilities can be afforded to relocate current occupying activities and personnel. Currently utilized and unoccupied or abandoned buildings or structures would be demolished only as new projects requiring their removal are scheduled in the future. Note that the No Action Alternative does not meet the purpose and need for the Proposed Action but provides a baseline for comparison of other alternatives.
Alternative 1: Full Demolition
Under Alternative 1, Fort Benning would implement the FY19-23 FRP by demolishing all of the structures identified in the FRP’s proposed demolition list. Full demolition would preclude the expenditure of excessive maintenance and/or adaptive reuse/renovation costs associated with the utilization of older facilities. Personnel and activities currently occupying facilities to be demolished would relocate to available facilities. Demolished buildings and structures would become open space and in most circumstances the area would be available to be utilized in future projects.
Alternative 2: Selective Demolition
Alternative 2 is similar to Alternative 1; however, Fort Benning would retain the 17 historic buildings identified on the FRP’s proposed demolition list. Those 17 buildings are historic properties that are eligible for listing on the National Register of Historic Places per the National Historic Preservation Act. Fort Benning would implement the FY19-23 FRP by demolishing approximately 133 buildings and other structures and continue utilizing the historic structures as best as possible. As outlined in Appendix B, a considerable expenditure of funds to utilize and maintain the historic buildings would continue and many of these facilities would need adaptive reuse and other substantial renovations to sustain adequate and safe working conditions as they continue to age.

Infrastructure Footprint Reduction Program June 2018 Draft Finding of No Significant Impact
4
6 Anticipated Environmental Effects
The analysis contained in this EA indicates that the Proposed Action could have long-term, minor adverse impacts to Cultural Resources, under Alternative 1, and short-term, minor adverse impacts under Alternative 2. Other short-term, minor adverse impacts resulting from demolition activities would occur to Hazardous Materials and Waste, Soils, Water Resources, and Air Quality. Both Air Quality and Utilities would result in long-term, minor adverse impacts as a result of the No Action Alternative. VECs with negligible effects under the Action Alternatives includes Biological Resources, Land Use, and Noise. Additionally, long-term, beneficial impacts to Air Quality and Utilities would result from implementing the Action Alternatives due to reductions in emissions and energy demands. As discussed in Section 4, these negligible effects to minor adverse direct/indirect impacts do not result in significant adverse cumulative effects when considering other past, present, and reasonably foreseeable future activities at Fort Benning. Adherence to Federal and State laws and regulations, as well as Installation management plans, and Army Regulations would minimize impacts of demolition and disposal activities to Air Quality, Cultural Resources, Hazardous Materials and Waste, Soils, and Water Resources.
7 Mitigation Measures No mitigation measures, beyond compliance with applicable laws and regulations and indicated Fort Benning Plans, are required to avoid significant impacts under any of the Proposed Action alternatives. Additional mitigations identified within the EA are recommended to mitigate minor adverse impacts.
8 Public Availability The Final EA and Draft FNSI were made available to the public for a 30-day public comment period from June 21 – July 23, 2018. An announcement that these documents are available was published via a Notice of Availability (NOA) in The Columbus Ledger-Enquirer, The Journal, and Benning News (online) in accordance with the Army NEPA Regulation. These documents are also available at several local libraries and are posted on the Fort Benning website at http://www.benning.army.mil/garrison/dpw/emd/Legal.html. The NOA of the Final EA and Draft FNSI has been mailed to all agencies, individuals, and organizations on the Fort Benning NEPA distribution (mailing) list for the Proposed Action. As part of Fort Benning’s on-going, established process and dialogue with the Federally recognized Native American Tribes affiliated with the Fort Benning area, the Army has provided each Tribe with a copy of these documents for consultation via review and comment.